User login
Practicing surgery and having a life
For those who have chosen the surgeon’s path, finding a sustainable work/life balance is challenging. For surgeons with young families and spousal responsibilities, achieving that balance may seem like an unattainable goal. As a rural surgeon with a spouse and children, I am here to say that rural practice has many benefits to those who love their work and also want a balanced life. I recommend that young surgeons, women in particular, consider this path for both the professional and personal advantages it offers.
I always tell the medical students that rotate with me, “When it is 4 o’clock in the morning and you forgot to go home ... be that.” That is to say, whatever rotation they are on when they have that feeling, that is the specialty they should choose. That was us when it came to surgery. When we were students going through surgical rotations we could not get enough. We wanted to see everything, do everything, and we didn’t want to miss anything. Many of our colleagues recommended against choosing surgery. We were told, “You’ll never have a life or a family;” “Your life will be horrible,” etc.
Now, many years later, I still love what I do as a surgeon. But I also love the other half of my life. I chose to practice rural surgery because I sensed that a balanced life would be possible in the rural setting. So I offer the following 10 tips for young surgeons who might be considering a rural practice:
1. Pick a good small town
Sit down and write out a list of all the things you want in a small town. My list, of course, will be different from your list but most importantly, make the list! It is no use taking a job in rural Colorado if you hate to hunt and fish. Consider the town and the job equally. For women surgeons, you may want to look for a place where there are women in upper administrative roles and other female physicians on staff. All small towns are definitely not alike and if you pick one for the hospital or the job without considering your surroundings, you will not likely be happy.
2. Don’t commute
Some people take a job in a small town or a rural setting but choose to live 30 miles away in the next larger town. I suggest living in the town you practice in. If at all possible, live close to the hospital. Every minute that you spend on the road is a minute away from your family. Living far away makes that 2 a.m. call from the ER that much more painful. You also miss out on the opportunity to become a real part of your community.
3. Choose the right partner
Small town physicians are tough to keep. Rural practice turnover is high. One of the most common reasons I hear for why a physician has left the area is because his or her spouse wasn’t happy. No matter how appealing the job seems, no matter how much bonus money they offer, no matter how great the hospital appears, if your spouse doesn’t like it there, you’ll be leaving. You may love your job and back country camping every weekend, but if your spouse pines for Whole Foods and the opera, you will be moving on eventually.
A large part of rural life revolves around events in the school system, and even if you have no young children of your own, it is helpful to make an effort to attend some of these events, if only to support your neighbor’s kids. It goes a long way to establish you as someone who is involved in the community and who cares. Remember, it is the mothers young and old who make many of the health care decisions for their families. Volunteer for events or get involved in the science program at the high school. You may find that you are a unique role model for teenagers in your community.
4. Choose the right partners
Rural general surgery is challenging enough without having to compete with those around you. Surgery in the small town setting becomes infinitely more pleasant when you have good partners. Is the practice set up to help and support each partner, or are you pitted against one another, competing for RVUs? Would your partners tolerate covering your call for 3 months of maternity leave or would this cause resentment? Look for a practice where the surgeons work together and cover for each other, and your small town life will be greatly enhanced.
5. Live within your means
A small town surgical practice can make for a very comfortable life. The cost of living is less, which means that your money goes further, with more left over for expenses such as saving for your kids’ college education. In addition, when you live in rural America, you won’t likely feel pressured to join the super expensive country club, send your kids to an expensive school, or drive a six-figure car. Although we may not make quite as much as the big city folk, when you account for the cost of living, rural surgeons do quite well.
6. Hire help
My husband is a firefighter, and at one point early in our marriage he was working night shift. With me on call and small children at home, that presented somewhat of a problem. But we solved it with a live-in nanny. Some people say, “I don’t want someone else raising my children,” and then they spend all their free time washing baby’s laundry and cleaning house instead of playing with the baby and having family meals and other family time together. How you utilize a nanny or any other help you hire is determined by you. But the idea is to hire help to do the mundane things so that you can do the fun things.
7. Learn to charm a rock
Small towns can be tough. Make one mistake, make one person angry, and before you eat your breakfast the next morning, the whole town knows about it. A very wise mentor of mine once said, “You catch more flies with honey.” Of course, he was absolutely right. When we work in bigger places, we tend to become numb to our own behavior because outbursts and conflicts are so common that our own little outbursts get lost in the mix. Such is not the case in a small town.
In rural America, people stop their cars to let you pull out. This can be very shocking when you come from New York and your first thought is …am I being carjacked? In a rural town, if you walk around with a Band-Aid on your face, every single person you pass on the street will ask if you are ok. It teaches you to treat other people well, even if you are having an absolutely terrible day. You can’t get away with taking your mood out on other people in a small town.
One very nice thing about working in a rural community is that people are grateful and have a very long memory for whatever you’ve done for them. Whether you’ve cured their colon cancer or removed a lipoma, they will stop you on the street to thank you or tell their friends for years afterward about how wonderful you were.
8. Get a hobby
Although life as a small town general surgeon can seem like a 24/7 occupation, careful time management and household support can create space for a hobby. And you need one. No matter how much we all love surgery, it is essential that we cultivate the ability to leave it be for a time here and there. A hobby (preferably one that helps alleviate stress) can help stave off burnout.
9. Don’t forget to sleep
This much-neglected survival tip is so important. We all have to be on call, some more than others. But most of us also have nights where we are not on call. These should not be the nights where we stay up until 3 a.m. watching every episode of the latest Netflix series. You must resist that temptation. The older you get, the harder it is to recover from a night out operating.
10. Never forget the 4 a.m. feeling
So you may learn to adjust to the small town and then to love it fiercely and protectively. You may even buy your own cow once a year or join a shooting range. You may learn to discuss the fall elk hunt, ice fishing, ranching, and the best place to buy ammunition with your patients. You walk through the hospital and you know every single person you pass in the hallway as well as their kids.
Let us never forget why we chose to be surgeons. Most of us would weather any challenge to continue to do what we love. And choosing a rural practice is one way to practice surgery and also achieve a satisfying work/life balance.
Dr. Long is an ACS Fellow and a general surgeon in rural West Virginia. She is the mother of five and an ironman triathlete. She is currently preparing for her 18th surgical mission trip to Central America in April. Dr. Justine Gavagan and Dr. Catherine O’Connor contributed to this article.

Only as good as the prep
In the realm of screening routinely offered to our patients in primary care, colon cancer screening stands with cervical cancer screening with a grade A recommendation from the U.S. Preventive Services Task Force. As such, our systems have been set up to gently remind us of colon cancer screening when it is due. If your practice is like mine, it has been almost exclusively colonoscopy. As such, I hear a lot of patient complaints about the colonoscopy prep.
Recently, one of our patients had uncontrolled vomiting with one of the commonly used polyethylene glycol (PEG) 3350 preparations. Many of us may have been aware of the Miralax and Gatorade (M-G) colon prep, and I considered recommending it to my patient. But is it just as good?
Dr. Sameer Siddique of the University of Missouri, Columbia, and colleagues published a systematic review evaluating the comparability of the M-G prep (238-255 g in 1.9 L) to PEG (3.8-4 L) (Am. J. Gastroenterol. 2014;109:1566-74).
The investigators identified five articles and observed that the M-G prep was associated with significantly fewer satisfactory bowel preparations, compared with PEG (odds ratio, 0.65; 95% confidence interval, 0.43-0.98; P = .04). In a subgroup analysis, split-dose M-G was inferior to split-dose PEG in the number of satisfactory preparations.
Patients, however, had a greater willingness to repeat the preparation (OR, 7.32; 95% CI, 4.88-10.98; P <.01). No significant differences were observed with polyp detection or in side effects such as nausea, cramping, or bloating.
The study authors point out that the dose of Miralax in the M-G prep is not FDA approved (because it is 15 times higher than the dose for constipation), and that the solution is hypotonic and can potentially cause hyponatremia. Furthermore, the cost of a colonoscopy ranges from $600 to more than $5,400. At those prices, patient agreeableness to repeat the test does not mean the health care system can bear a deluge of re-do’s.
Remember that split-dose PEG (one half the day before and one half the day of) has been shown to be superior to the night-before preparation, and it can increase tolerability. If a patient has time to get the job done the day of the colonoscopy, maybe this is the way to go.
Dr. Ebbert is professor of medicine, a general internist at the Mayo Clinic in Rochester, Minn., and a diplomate of the American Board of Addiction Medicine. The opinions expressed are those of the author and do not necessarily represent the views and opinions of the Mayo Clinic. The opinions expressed in this article should not be used to diagnose or treat any medical condition, nor should they be used as a substitute for medical advice from a qualified, board-certified practicing clinician.
Novel anticoagulant system no better than existing drug

SAN DIEGO—In a now-terminated phase 3 trial, a novel anticoagulant system proved about as effective as an established drug in patients undergoing percutaneous coronary intervention (PCI).
The system also conferred higher rates of bleeding and prompted more allergic reactions.
The trial, known as REGULATE-PCI, was designed to compare the Revolixys Kit (also known as the REG-1 Anticoagulation System) to bivalirudin (Angiomax).
The study was officially halted in August due to an excess of severe allergic reactions associated with the Revolixys Kit. Given the early termination, investigators said the data should be considered exploratory.
Roxana Mehran, MD, of Mount Sinai Hospital in New York, New York, presented the study’s results at the American College of Cardiology’s 64th Annual Scientific Session (abstract 402-12).
The goal of the REGULATE-PCI trial was to compare the reversible thrombin inhibitor bivalirudin to the Revolixys Kit—a 2-component system consisting of pegnivacogin, an anticoagulant aptamer targeting coagulation factor IXa, and its complementary oligonucleotide active control agent, anivamersen—in patients undergoing PCI.
Before the trial was stopped, 3232 patients were enrolled. They underwent PCI at 225 hospitals in 17 countries. Patients were equally randomized to the bivalirudin or Revolixys arms, and investigators collected data at 3 days and 30 days.
Efficacy and safety results
There were no differences between the treatment arms in terms of the study’s primary efficacy endpoint—a composite of all-cause death, heart attack, stroke, or urgent revascularization.
The endpoint occurred in 6.7% of patients in the Revolixys arm and 6.4% of patients receiving bivalirudin 3 days after PCI (P=0.72). Efficacy was still comparable at 30 days.
In addition, the Revolixys system failed to show a benefit over bivalirudin with regard to the primary safety endpoint of bleeding.
The rate of BARC 3 or 5 bleeding was 0.4% in the Revolixys arm and 0.1% in the bivalirudin arm (P=0.09). And the rates of BARC 2, 3, or 5 bleeding were 6.5% and 4.1%, respectively (P=0.002).
Serious allergic reactions occurred in 10 of 1605 patients in the Revolixys arm. One of these reactions was fatal, and the others were anaphylactic reactions. Only one patient in the bivalirudin group had a serious allergic event.
“This anticoagulant system is associated with infrequent but an unacceptably high rate of severe allergic reactions,” Dr Mehran said.
Research is ongoing to determine the exact cause of the allergic reactions, and Dr Mehran said she hopes this does not deter the search for novel anticoagulants for use in this patient population.
More about REGULATE-PCI
Investigators started recruiting patients to the trial in September 2013. In April, because there were a handful of allergic reactions seen in the earlier phase 2 trial, a data safety and monitoring board reviewed all of the safety endpoints for the first 1000 patients enrolled in REGULATE-PCI.
In June, both the executive committee and the sponsor decided to suspend the trial, and the US Food and Drug Administration announced a clinical hold in July. The trial was permanently halted in August.
This study was funded by Regado Biosciences Inc., the company developing the Revolixys kit. Dr Mehran has served on the scientific advisory board for Regado Biosciences. ![]()
Group reprograms B-ALL cells into macrophage-like cells

pseudopodia to engulf particles
Investigators have reported methods for reprogramming leukemia cells into non-leukemic, macrophage-like cells.
The team reprogrammed cells derived from patients with BCR-ABL1+ precursor B-cell acute lymphoblastic leukemia (B-ALL) by exposing the cells to myeloid differentiation-promoting cytokines or by transient expression of certain transcription factors.
The group described this work in Proceedings of the National Academy of Sciences.
The research began when the investigators were trying to keep patient-derived leukemia cells alive in culture.
“We were throwing everything at them to help them survive,” said Ravindra Majeti, MD, PhD, of Stanford University School of Medicine in California.
Then, James Scott McClellan, MD, PhD, also of Stanford University School of Medicine, mentioned that some of the cells were changing shape and size, morphing into what looked like macrophages.
Dr Majeti concurred with that observation, but the reasons for the changed cells were a mystery. That is, until he remembered an old research paper, which showed that early B-cell mouse progenitor cells could be forced to become macrophages when exposed to certain transcription factors.
So he and his colleagues set out to confirm that they could transform leukemic cells into macrophage-like cells.
The team isolated CD19+CD34+ blasts from 12 adults with BCR-ABL1+ B-ALL and cultured the blasts in the presence of myeloid-differentiation-promoting cytokines. This resulted in CD14high/CD19low cells that expressed the surface markers and had the functional properties typical of normal macrophages.
The investigators also cultured B-ALL cells with the myeloid transcription factor C/EBPα or the myeloid/lymphoid transcription factor PU.1. Both factors were able to reprogram blasts into macrophage-like cells.
Experiments in mice revealed that reprogramming the blasts into macrophage-like cells eliminated their leukemogenicity.
And the investigators’ final experiments suggested that myeloid reprogramming occurs, to some degree, in humans. In samples from patients with BCR-ABL1+ B-ALL, the team found primary CD14+ monocytes/macrophages that had the BCR-ABL1+ translocation and clonally recombined VDJ regions.
Dr Majeti and his colleagues said they have reason to hope that, when the leukemic cells become macrophage-like cells, they are not only neutralized but may actually assist in fighting the leukemia.
“Because the macrophage cells came from the cancer cells, they will already carry with them the chemical signals that will identify the cancer cells, making an immune attack against the cancer more likely,” Dr Majeti said. ![]()
Lowering the cost of cancer drugs in the US

Photo by Petr Kratochvil
Increasingly high prices for cancer drugs are affecting patient care and the overall healthcare system in the US, according to authors of an article in Mayo Clinic Proceedings.
The authors noted that the average price of cancer drugs for about a year of therapy increased from $5000 to $10,000 before 2000, and to more than $100,000 by 2012.
Over nearly the same period, the average household income in the US decreased by about 8%.
“Americans with cancer pay 50% to 100% more for the same patented drug than patients in other countries,” said author S. Vincent Rajkumar, MD, of the Mayo Clinic in Rochester, Minnesota.
“As oncologists, we have a moral obligation to advocate for affordable cancer drugs for our patients.”
Dr Rajkumar and co-author Hagop Kantarjian, MD, of MD Anderson Cancer Center in Houston, Texas, rebutted the major arguments the pharmaceutical industry uses to justify the high price of cancer drugs; namely, the expense of conducting research and drug development, the comparative benefits to patients, that market forces will settle prices to reasonable levels, and that price controls on cancer drugs will stifle innovation.
“One of the facts that people do not realize is that cancer drugs, for the most part, are not operating under a free market economy,” Dr Rajkumar said. “The fact that there are 5 approved drugs to treat an incurable cancer does not mean there is competition.”
“Typically, the standard of care is that each drug is used sequentially or in combination, so that each new drug represents a monopoly with exclusivity granted by patent protection for many years.”
Drs Rajkumar and Kantarjian said other reasons for the high cost of cancer drugs include legislation that prevents Medicare from being able to negotiate drug prices and a lack of value-based pricing, which ties the cost of a drug to its relative effectiveness compared to other drugs.
The authors recommended a set of potential solutions to help control and reduce the high cost of cancer drugs in the US. Some of their recommendations are already in practice in other developed countries. Their recommendations include:
- Allow Medicare to negotiate drug prices
- Develop cancer treatment pathways/guidelines that incorporate the cost and benefit of cancer drugs
- Allow the Food and Drug Administration or physician panels to recommend target prices based on a drug’s magnitude of benefit (value-based pricing)
- Eliminate “pay-for-delay” strategies in which a pharmaceutical company with a brand name drug shares profits on that drug with a generic drug manufacturer for the remainder of a patent period, effectively eliminating a patent challenge and competition
- Allow the importation of drugs from abroad for personal use
- Allow the Patient-Centered Outcomes Research Institute and other cancer advocacy groups to consider cost in their recommendations
- Create patient-driven grassroots movements and organizations to advocate effectively for the interests of patients with cancer to balance advocacy efforts of pharmaceutical companies, insurance companies, pharmacy outlets, and hospitals.
Dr Kantarjian has organized a petition, which is available on change.org, asking the federal government to implement these changes. ![]()
EMA grants vaccine orphan status for MM
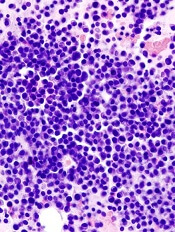
showing MM
The European Medicines Agency (EMA) has given a novel vaccine orphan designation as a treatment for multiple myeloma (MM).
The vaccine, known as ImMucin, targets the signal peptide domain of the MUC1 tumor antigen.
ImMucin works by “teaching” the immune system to identify and destroy cells that display a short, specific, 21-mer portion from MUC1, which appears on 90% of all cancer cells but not in patients’ blood.
Results of a phase 1/2 trial suggested that ImMucin was safe and active in MM patients. The trial included 15 MUC1-positive patients who had residual or biochemically progressive disease after autologous stem cell transplant.
The patients received 6 or 12 bi-weekly intradermal doses of ImMucin co-administered with human granulocyte-macrophage colony-stimulating factor.
The researchers said the vaccine was well-tolerated, as all adverse events were temporary, grade 1-2 in nature, and resolved spontaneously.
There was a significant decrease in soluble MUC1 levels in 9 patients, and 11 patients had stable disease or clinical improvement that persisted for 17.5 months to more than 41.3 months.
A follow-on study (which is ongoing) in patients who responded to ImMucin has shown that some patients can go more than 4 years without requiring any further treatment for their disease.
ImMucin is also being evaluated in a phase 1/2 study to treat patients with metastatic breast cancer who are receiving first-line hormone therapy.
ImMucin is under development by Vaxil Biotherapeutics Ltd.
About orphan designation
The EMA grants orphan designation to promote the clinical development of drugs that treat rare, life-threatening, or debilitating conditions and are expected to provide significant therapeutic advantage over existing treatments.
Orphan designation provides the company developing a drug with significant benefits, including 10 years of market exclusivity following approval, reductions in the fees and costs of the regulatory process, and scientific assistance from the EMA in clinical development. ![]()
New approvals, genetic testing, maintenance therapy, and DFS in ovarian cancer
Recent study findings have indicated that women with ovarian cancer may have BRCA1 or BRCA2 mutations despite a negative family history, and current NCCN (National Comprehensive Cancer Network) guidelines endorse genetic testing for all women with epithelial cancer of the ovary. Despite this, recent reports indicate that most women with ovarian cancer are not being tested, particularly those who are elderly or without a family history. In this paper by Daniels and colleagues, the investigators examined targeted versus universal genetic testing to see if the use of a well-regarded risk model (BRCAPRO) based on personal and family history could discriminate among patients with high-grade serous ovarian cancer. Targeted genetic testing in this group might help lower costs and encourage testing for those women who actually have a significant chance of carrying a deleterious gene mutation.
Click on the PDF icon at the top of this introduction to read the full article.
Pelvic pleomorphic rhabdomyosarcoma presenting as oliguria in a 61-year-old woman
Click on the PDF icon at the top of this introduction to read the full article.
Click on the PDF icon at the top of this introduction to read the full article.
Click on the PDF icon at the top of this introduction to read the full article.
Guideline recommends combination therapy for smoking cessation in cancer patients
The National Comprehensive Cancer Network has published a new guideline on smoking cessation for cancer patients that recommends combining pharmacologic therapy with counseling as the most effective approach, along with rigorous review and close follow-ups to prevent relapses.
“Although the medical community recognizes the importance of smoking cessation, supporting patients in ceasing to smoke is generally not done well. Our hope is that by addressing smoking cessation in a cancer patient population, we can make it easier for oncologists to effectively support their patients in achieving their smoking cessation goals,” Dr. Peter Shields, deputy director of the Ohio State University Comprehensive Cancer Center, said in a written statement. Of the estimated 590,000 cancer deaths in 2015, about 170,000, or nearly 30%, will be caused by tobacco smoking. Quitting tobacco improves cancer treatment effectiveness and reduces cancer recurrence, according to the NCCN.
Read the full statement on the NCCN website.
Stem cells from sickle cell disease patients used to generate gene-corrected cells
Cells from patients with sickle cell disease have been used to generate mature red blood cells without the genetic mutation that causes the disease, investigators at Johns Hopkins University reported.
This advance may lead to improved treatment of sickle cell disease patients, who frequently need blood transfusions from healthy donors but often reject foreign blood.

The corrected cells were created through genome editing of human induced pluripotent stem cells (iPSCs), which can make any cell in the body and grow indefinitely in the laboratory.
“Our results represent a significant step towards the clinical applications of genome editing using patient-derived iPSCs to generate disease-free cells for cell and gene therapy,” according to the study’s lead researcher, Xiaosong Huang, and his associates.
The edited iPSCs, which were derived from the patients’ blood cells, produced blood cells as “efficiently” as stem cells that had not been edited, according to a written statement from Johns Hopkins. Still, “to become medically useful, the technique … will have to be made even more efficient and scaled up significantly,” study investigator Linzhao Cheng, Ph.D., noted in the statement.
Find the full study in Stem Cells (2015 Feb. 20 [doi:10.1002/stem.1969]).
Cells from patients with sickle cell disease have been used to generate mature red blood cells without the genetic mutation that causes the disease, investigators at Johns Hopkins University reported.
This advance may lead to improved treatment of sickle cell disease patients, who frequently need blood transfusions from healthy donors but often reject foreign blood.
The corrected cells were created through genome editing of human induced pluripotent stem cells (iPSCs), which can make any cell in the body and grow indefinitely in the laboratory.
“Our results represent a significant step towards the clinical applications of genome editing using patient-derived iPSCs to generate disease-free cells for cell and gene therapy,” according to the study’s lead researcher, Xiaosong Huang, and his associates.
The edited iPSCs, which were derived from the patients’ blood cells, produced blood cells as “efficiently” as stem cells that had not been edited, according to a written statement from Johns Hopkins. Still, “to become medically useful, the technique … will have to be made even more efficient and scaled up significantly,” study investigator Linzhao Cheng, Ph.D., noted in the statement.
Find the full study in Stem Cells (2015 Feb. 20 [doi:10.1002/stem.1969]).