User login
Drug incompatible with certain devices, FDA warns

The US Food and Drug Administration (FDA) is warning healthcare professionals not to use Treanda (bendamustine hydrochloride) solution with closed-system transfer devices (CSTD), adapters, and syringes containing polycarbonate or acrylonitrile-butadiene-styrene (ABS).
Most marketed CSTDs contain either polycarbonate or ABS. And these materials dissolve when they come into contact with N, N-dimethylacetamide (DMA), an ingredient in Treanda solution.
This can lead to device failure, possible product contamination, and potential serious adverse health consequences, including skin reactions in healthcare professionals preparing and administering this product and the risk of small blood vessel blockage in patients.
Discovering the incompatibility
Treanda, which is manufactured by Teva, is used to treat patients with chronic lymphocytic leukemia and indolent B-cell non-Hodgkin lymphoma that has progressed during or within 6 months of treatment with rituximab or a rituximab-containing regimen.
Treanda is available as a solution—Treanda Injection (45 mg/0.5 mL or 180 mg/2 mL solution)—and a lyophilized powder—Treanda for Injection (25mg/vial or 100 mg/vial lyophilized powder).
The incompatibility of DMA with polycarbonate and ABS is only an issue with Treanda solution—not the lyophilized powder.
Since December 2014, Teva has received 40 complaints of the incompatibility issue, which was recently brought to the FDA’s attention. The agency also received a notification of device incompatibility with Treanda solution from a pharmacist.
These incompatibility issues included leaking of the CSTD, breaking or operational failure of the CSTD components, and a cloudy appearance or presence of particulate matter in the intravenous bag after dilution. To date, no adverse events have been reported related to the incompatibility.
FDA recommendations
The FDA has required label changes for both the solution and the powder formulations of Treanda to reflect the following safe preparation information.
The agency is recommending that healthcare professionals use Treanda solution only with polypropylene syringes containing a metal needle and a polypropylene hub. Polypropylene syringes are translucent in appearance.
Treanda solution should be inspected visually for particulate matter and discoloration prior to administration whenever the solution and container permit. The solution must be withdrawn and transferred for dilution in a biosafety cabinet or containment isolator.
If they aim to use a CSTD with Treanda solution, healthcare professionals should verify with the CSTD manufacturer or Teva US Medical Information (1-800-896-5855) that the CSTD is compatible with Treanda solution before preparing the drug.
Alternatively, healthcare professionals can use Treanda lyophilized powder with a CSTD. The solution and lyophilized powder formulations of Treanda should not be mixed.
For additional details on safe preparation of Treanda solution and lyophilized powder, see Teva’s Dear Health Care Provider letter.
Adverse events or quality problems associated with the use of Treanda products can be reported to the FDA’s MedWatch Adverse Event Reporting Program. ![]()
Clinical trial mandate not being followed

Photo by Esther Dyson
A study published in NEJM suggests that results from most trials on ClinicalTrials.gov are not posted on the site within a year of trial completion or termination, even though this violates the Food and Drug Administration Amendments Act (FDAAA) mandate.
Among all the trials analyzed, those funded by industry were the most likely to be publicly disclosed in a timely fashion, researchers found.
Even so, industry compliance with the FDAAA mandate was poor.
And compliance was worse for research funded by the National Institutes of Health (NIH) and other government and academic institutions.
Study authors said this lack of transparency has created a critical information gap about investigational drugs, devices, and biologic therapies that hampers progress and violates obligations to patients.
“Patients who participate in clinical research have the expectation that the risk of participation will be offset by the creation of generalizable knowledge and the advancement of science, and that is achieved through the availability of clinical trial results,” said study author Monique Anderson, MD, of the Duke Clinical Research Institute in Durham, North Carolina.
“Sponsors who lead clinical trials have an ethical and legal obligation to publically report their findings, whether the results are positive or negative.”
In 2000, the US Congress authorized the creation of the ClinicalTrials.gov registry to provide information about clinical trials. Seven years later, the FDAAA mandated that sponsors of most trials begin registering and reporting basic summary results on the registry so the American public could have access to the resulting data.
The requirement covers non-phase-1 trials of drugs, medical devices, or biologics that had at least 1 US research site. Trial results are to be reported by the sponsor within a year of completing data collection.
To gauge compliance with this mandate, Dr Anderson and her colleagues searched trials posted on ClinicalTrials.gov. They identified 13,327 trials that were likely to be subject to FDAAA provisions and were terminated or completed from January 1, 2008, through August 31, 2012.
Most trials were industry-funded (65.6%), 14.2% were funded by the NIH, and the remaining 20.2% were funded by other government or academic institutions.
In all, 13.4% of trials had results posted on ClinicalTrials.gov within 12 months of trial completion/termination, and 6.1% of trials did not have results reported but had a legally acceptable delay because of a certification or an exemption request.
A higher percentage of trials—38.3%—had results posted on ClinicalTrials.gov at any time during the 5-year study period.
By September 27, 2013, sponsors for 15.8% of all the trials analyzed had submitted a certification or extension request to delay reporting to ClinicalTrials.gov. Of these, 23.0% had results reported during the study period.
At 12 months, 17% of industry-funded trials had results posted on ClinicalTrials.gov, as did 8.1% of trials funded by the NIH, and 5.7% of trials funded by other government or academic institutions. At 5 years, those percentages had increased to 41.5%, 38.9%, and 27.7%, respectively.
“The law requiring public disclosure was enacted amid concerns that sponsors and investigators were selectively publishing trials that favored sponsors’ interests,” Dr Anderson said. “Industry sponsors in particular were criticized for selective reporting.”
“Since the law’s enactment, many companies have developed disclosure policies and have actively pursued expanded public disclosure of data, but there may be a lack of knowledge about the law in academia, or a lack of resources to ensure timely reporting.”
Dr Anderson said penalties for failing to submit data within the 1-year reporting period could be as high as $10,000 a day and/or the loss of NIH funding, but enforcement has not occurred, pending a rule approval. ![]()
Suicide prevention app for primary care providers expected to improve suicide screening
WASHINGTON – Primary care providers are being urged by a federal agency to heighten their sensitivities to patients at risk for suicide.
Citing data that nearly half of all persons who died by suicide had seen a primary care provider within the month prior to their death, Pamela S. Hyde, J.D., administrator of the Substance Abuse and Mental Health Services Administration, overseen by the U.S. Department of Health & Human Services, today announced the launch of the Suicide Safe app, a free risk-assessment tool for providers to screen patients at risk for suicide.
According to Ms. Hyde, who spoke during a SAMHSA news briefing, suicide is the leading cause of death in the United States among those aged 15-29 years, with one person dying of suicide every 13 minutes. Ms. Hyde also noted that suicide was seen to trend upward between the years 1999 and 2010 when the age-adjusted suicide rate for people aged 35-64 years increased 28%.

“Our offices are the key access points where we can start to identify these patients,” said Dr. Fabian Sandoval, a Washington-based researcher and clinical protocols consultant who spoke at the news briefing. “But we are not the experts, we are not the psychiatrists, so what are we going to do?”
Dr. Sandoval said the tool would support the generations of primary care providers, including advance practice nurses and physician assistants, who did not receive any formal mental or behavioral health care training, which he said was most of the “old guard” in medicine.
Based on the SAFE-T (Suicide Assessment Five-Step Evaluation and Triage) protocols developed by Dr. Douglas Jacobs of the department of psychiatry at Harvard Medical School, Boston, and the chair of the American Psychiatric Association Practice Guidelines on Suicide, the app helps identify at-risk patients and find local facilities where patients can be referred for emergent or other treatment.
“If I am a primary care provider who doesn’t feel adequately prepared to deal with a patient in the middle of a suicidal crisis, I can use the treatment locator to find a specialized behavioral health provider within a certain radius and immediately link to that person right off the app and get that patient in for an appointment or an emergency visit,” Robert Carrol, an advanced practice registered nurse and a member of the app’s research and development team, said in an interview.
“It’s a tool that can bridge that gap of fear that often prevents providers from even opening the conversation. That’s always the first challenge, providers not wanting to ‘go there’ because they don’t want to answer a question that they won’t know how to answer or respond to.”
Starting the conversation in an open-ended way is crucial to getting a patient to speak honestly about his or her condition, Dr. Mitra Ahadpour, a primary care physician from Germantown, Md., and a clinical communications consultant with SAMHSA, said in an interview. “The open-ended question prompts in the app are very important. We have research that shows closed-ended questions turn the patient off, questions such as ‘You’re not thinking of killing yourself, are you?’ Instead, keep it very simple. Ask, ‘How are you doing today? Then take a second to see what they say.”

Even if primary care physicians are willing to ask and respond to their patients in acute danger of suicide, there is still the need to ensure that even if patients are referred to the appropriate facility, that there is enough room to accommodate them, according to Dr. Sandoval. “We’ll be able to identify more patients who are in suicidal situations than before, but now what? What do we do with this patient? That is a question we have to [address] as well.”
Incorporating the app into clinical practice should not be difficult and could even help encourage a physician to treat the patient him- or herself if the risk for suicide is found to be low, according to Dr. Ahadpour. “There are many points in the system where the app can be integrated. The PHQ-9 (patient health questionnaire that screens for depression) is included in the app, and you can have your patients fill that out ahead of time,” Dr. Ahadpour, who was not on the news briefing panel, said in an interview. “That way the clinician will already know if there is a need to take things to the second step or [assess] for a suicidal risk. If the provider feels comfortable that there is no risk for suicide, then they can treat the patient for depression, for example.” If they do not feel comfortable treating the patient, then “at least they have assessed the patient,” she added. Validated evaluation tools for other mental health conditions, including one for general anxiety disorder are also included in the app, Dr. Ahadpour said. Depression and anxiety are two major risk factors for suicidal ideation.
When asked by a reporter about how primary care physicians should bill their time for using the app, Mr. Carroll said the app included IDC-9 and ICD-10 codes.
For more information about the app, visit SAMHSA’s website.
Dr. Jacobs said the app is freely available at any smart phone app store.
On Twitter @whitneymcknight
WASHINGTON – Primary care providers are being urged by a federal agency to heighten their sensitivities to patients at risk for suicide.
Citing data that nearly half of all persons who died by suicide had seen a primary care provider within the month prior to their death, Pamela S. Hyde, J.D., administrator of the Substance Abuse and Mental Health Services Administration, overseen by the U.S. Department of Health & Human Services, today announced the launch of the Suicide Safe app, a free risk-assessment tool for providers to screen patients at risk for suicide.
According to Ms. Hyde, who spoke during a SAMHSA news briefing, suicide is the leading cause of death in the United States among those aged 15-29 years, with one person dying of suicide every 13 minutes. Ms. Hyde also noted that suicide was seen to trend upward between the years 1999 and 2010 when the age-adjusted suicide rate for people aged 35-64 years increased 28%.
“Our offices are the key access points where we can start to identify these patients,” said Dr. Fabian Sandoval, a Washington-based researcher and clinical protocols consultant who spoke at the news briefing. “But we are not the experts, we are not the psychiatrists, so what are we going to do?”
Dr. Sandoval said the tool would support the generations of primary care providers, including advance practice nurses and physician assistants, who did not receive any formal mental or behavioral health care training, which he said was most of the “old guard” in medicine.
Based on the SAFE-T (Suicide Assessment Five-Step Evaluation and Triage) protocols developed by Dr. Douglas Jacobs of the department of psychiatry at Harvard Medical School, Boston, and the chair of the American Psychiatric Association Practice Guidelines on Suicide, the app helps identify at-risk patients and find local facilities where patients can be referred for emergent or other treatment.
“If I am a primary care provider who doesn’t feel adequately prepared to deal with a patient in the middle of a suicidal crisis, I can use the treatment locator to find a specialized behavioral health provider within a certain radius and immediately link to that person right off the app and get that patient in for an appointment or an emergency visit,” Robert Carrol, an advanced practice registered nurse and a member of the app’s research and development team, said in an interview.
“It’s a tool that can bridge that gap of fear that often prevents providers from even opening the conversation. That’s always the first challenge, providers not wanting to ‘go there’ because they don’t want to answer a question that they won’t know how to answer or respond to.”
Starting the conversation in an open-ended way is crucial to getting a patient to speak honestly about his or her condition, Dr. Mitra Ahadpour, a primary care physician from Germantown, Md., and a clinical communications consultant with SAMHSA, said in an interview. “The open-ended question prompts in the app are very important. We have research that shows closed-ended questions turn the patient off, questions such as ‘You’re not thinking of killing yourself, are you?’ Instead, keep it very simple. Ask, ‘How are you doing today? Then take a second to see what they say.”
Even if primary care physicians are willing to ask and respond to their patients in acute danger of suicide, there is still the need to ensure that even if patients are referred to the appropriate facility, that there is enough room to accommodate them, according to Dr. Sandoval. “We’ll be able to identify more patients who are in suicidal situations than before, but now what? What do we do with this patient? That is a question we have to [address] as well.”
Incorporating the app into clinical practice should not be difficult and could even help encourage a physician to treat the patient him- or herself if the risk for suicide is found to be low, according to Dr. Ahadpour. “There are many points in the system where the app can be integrated. The PHQ-9 (patient health questionnaire that screens for depression) is included in the app, and you can have your patients fill that out ahead of time,” Dr. Ahadpour, who was not on the news briefing panel, said in an interview. “That way the clinician will already know if there is a need to take things to the second step or [assess] for a suicidal risk. If the provider feels comfortable that there is no risk for suicide, then they can treat the patient for depression, for example.” If they do not feel comfortable treating the patient, then “at least they have assessed the patient,” she added. Validated evaluation tools for other mental health conditions, including one for general anxiety disorder are also included in the app, Dr. Ahadpour said. Depression and anxiety are two major risk factors for suicidal ideation.
When asked by a reporter about how primary care physicians should bill their time for using the app, Mr. Carroll said the app included IDC-9 and ICD-10 codes.
For more information about the app, visit SAMHSA’s website.
Dr. Jacobs said the app is freely available at any smart phone app store.
On Twitter @whitneymcknight

Dark circles under the eyes
How many times a week are we asked by our patients about “dark circles” under the eyes? The term “dark circles” is a catch-all term that refers to problems that have a vast range of genetic, environmental, and skin causes. However, it is a common frustrating problem with little structure in its definition and few foolproof treatments.
We propose a classification system for the definition of dark circles, and offer some clinical pearls in their treatment. Most patients, however, have dark circles with multifactorial causes that need to be addressed.
I. Infraorbital fat pad protrusion (“bags under my eyes”)
Blepharoplasty is the best solution and for now, the only solution for fat pad prominence. The fat may be removed in lower lid blepharoplasty or repositioned. Referral to a board certified plastic surgeon, oculoplastic surgeon, or dermatologic surgeon is recommended. If there is also significant tear trough deformity, fillers may be placed in the tear trough to help “camouflage” the appearance of the fat pad protrusion but it does not rid the patient of the fat pads.
II. Infraorbital edema (“puffiness”)
The infraorbital skin is very thin and highly sensitive to fluid compartmentalization. Seasonal allergies, sinus infections, crying, or water retention from high blood pressure or consumption of high sodium foods are some of the reasons the loose, thin epidermis becomes edematous. Recommendations for patients:
• Treat seasonal allergies with over-the-counter allergy medications, or see your doctor for prescription medications for resistant allergies or possible sinus infections.
• Switch your sleep position. Sleep position can be contributing to under-eye bags through gravity. Sleeping on your side or stomach can encourage fluids to collect under your eyes. If you’re a side sleeper, you may notice a heavier bag on the side you sleep on. Patients who wake up with puffy eyes can sleep on their backs and add an extra pillow under the head.
• Avoid rubbing eyes frequently, going to bed with makeup on, and harsh cleansers. Anything that irritates the eyes can cause fluids to pool. Sleeping in eye makeup can irritate eyes, causing undereye edema.
• Eye bags might be a sign of an underlying medical condition, if they appear suddenly and none of the above conditions apply. Thyroid, cardiovascular, or kidney problems can cause under-eye fluid retention and the patients need to see their primary care doctors for further evaluation.
• Place an ice pack, slices of cucumbers, chilled tea bags, or even a package of frozen peas on eyes. This can constrict leaky blood vessels and lessen the periorbital edema.
• A few topical eye creams have been developed, such as Neotensil, that temporarily reduce the appearance of lower eyelid puffiness. The product is a blend of polymers that provide compression, smoothing, and hydrating benefits to the skin. In addition, a makeup is often applied over it to reduce the appearance further.
III: Periorbital hyperpigmentation (“dark circles”)
Pigmentation of the periorbital skin is very common in skin of color because of the increased melanin content. Genetics, rubbing, and inflammatory skin diseases such as eczema may play a role in exacerbating the pigmentation of the thin under-eye skin. Recommendations for patients:
• Remind them to avoid rubbing the area – chronic rubbing and the development of lichen simplex chronicus can lead to dark, thickened under-eye skin.
• Retinoic acid creams can help slough the dark pigmented skin. However, it should be used in very small amounts with increasing use over several weeks to avoid severe irritation.
• Skin lightening creams with azaleic acid, kojic acid, and glycolic acid, can be found in varying strengths in dermatologist office preparations, over-the-counter creams, or prescriptions. Hydroquinone creams have demonstrated success in lightening under-eye hyperpigmentation. Strengths in over-the-counter preparations start at 1%-2% and in prescription strength can be compounded to higher than 4%.
• Chemical peels: Light chemical peels such as glycolic acid and Jessner’s peels will assist in lightening dark under-eye pigmentation. Dermatologists also can use peels with hydroquinone or retinoic acid for an added lightening benefit.
• Intense pulsed light (IPL) can help minimize under eye pigmentation, particularly UV-induced pigmentation.
IV: Infraorbital tear trough depression
Most often, dark circles aren’t about changes in the color of the skin at all. Instead, they’re created by a loss of volume in the area around the eye. This exposes the underlying blue veins and orbital bone, creating a hollow trough that shows up as a dark circle. These changes are often caused by genetics; however, significant weight loss and aging with resorption or displacement of the infraorbital fat pads can also expose under-eye tear trough depressions.
The best way to treat this problem is with a small amount of a hyaluronic acid filler placed by a dermatologist in the trough. Very small aliquots are needed in even the deepest trough but can give outstanding results. Caution however, must be taken as this is a highly specialized technique and injector dependent procedure. There are crucial vascular structures around the eye that need to be avoided, and overfilled troughs will give patients a puffy appearance that may pose a worse and more difficult problem to fix. Hyaluronic acid fillers are not approved by the Food and Drug Administration for treatment of under-eye depressions, so patients should be educated about the risks and benefits prior to undergoing these procedures.
V: Periorbital vascular prominence
With age, the skin around the eye becomes thinner, exposing the small capillaries and venules just below the thin epidermal layer. Vascular prominence can leave a bluish undertone to the infraorbital skin which can cast dark shadows and make the area appear dark or sallow.
• Eye creams that contain caffeine can constrict the underlying blood vessels and temporarily diminish small vessel prominence.
• For large blue veins, vascular lasers such as a long pulse Nd:Yag lasers can be recommended. But in darker skin types these lasers can cause hyperpigmented scars if not used with adequate skin cooling techniques. Proper eye protection should also be used.
VI: Periorbital static and dynamic rhytids
• Botulinum toxin placed in small aliquots around the orbital rim will reduce the dynamic rhytids in this area. Treatments spaced 3 months apart will ensure long-lasting benefits as botulinum toxin often wears off.
• Laser resurfacing with CO2, fractionated CO2, or erbium lasers may also be used to treat periorbital rhytides.
Additional tips for your patients:
• For most of the types of infraorbital issues, makeup can help conceal some skin imperfections. Patients should choose a concealer that matches or is slightly lighter than their skin tone. If the patient has mild discoloration, choose a liquid formula. For more prominent imperfections, a cream full-coverage concealer works best.
• Recommend that patients avoid smoking, which dehydrates the skin and causes premature aging and collagen degradation.
• Remind patients to apply a sunscreen around the eye area. Hyperpigmentation and tear troughs can accentuate with UV-induced skin pigmentation. Physical blocking sunscreens may be less irritating than chemical blockers for those with sensitive eyelid skin.
• Remind patients to apply a moisturizer to the eye area nightly to keep the skin from becoming dry, irritated, and dehydrated.
• Advise patients not to break the bank with over-the-counter creams that promise cures for under-eye circles. Most over-the-counter preparations provide temporary, mild benefits at most, and often do not provide any lasting benefit.
Dr. Talakoub and Dr. Wesley are co-contributors to a monthly Aesthetic Dermatology column in Dermatology News. Dr. Talakoub is in private practice in McLean, Va. Dr. Wesley practices dermatology in Beverly Hills, Calif. This month’s column is an update by Dr. Wesley of a previous column by Dr. Talakoub.

Patented knowledge
The other day I had a chat with a chiropractor I’ll call Stan. Stan was excited about a new technique he has used to build his practice, whose clients now number several celebrities (some of whom I’d even heard of). “I specialize in muscular work and performance enhancement,” he said. “Performers with strenuous routines and a lot of stress need to sustain peak performance.”
A colleague out West whom Stan described as “very brilliant” had developed this technique. “It’s patented,” he said.
Stan went on to describe how this method has given him a whole new sense of the body. “I can actually feel the small transverse muscles of the vertebrae respond under my fingers,” he said. “The results are amazing.”
“How did you learn this technique?” I asked him.
“I took courses with the inventor,” he said. “His courses are patented, and can only be taught by accredited instructors. That ensures that the method is being done right. There are nine levels of certification.”
“Nine?”
“Yes, you have to keep taking more courses, learning new things. It’s very exciting.”
“By the way,” I asked, “how do you know that this method works better than the older ones you learned when you went to school?”
“Oh, you can feel and see the difference,” he said. “If you’re asking if there are studies or things like that, I guess there aren’t. But there’s no question that it’s better.”
“Do they teach this technique in chiropractic school?”
“No. As I said, it’s patented.”
“In that case,” I said, “it seems your professional schools are teaching inferior treatment methods.”
That gave Stan some pause. While he was thinking, I continued.
“It’s interesting,” I said. “In my profession, if someone came up with a treatment that was better than what everyone else was doing, he would need to do studies that proved he was right. He would also feel ethically bound to let everyone else know about the method, so all patients could be treated that way.”
Stan’s blank look suggested that this line of analysis had not occurred to him.
“But you must have some special techniques you use in your practice,” he said.
“No,” I said, “actually I don’t. I just practice conventional dermatology. Nothing special or unique about what I do.”
“What about the teaching hospitals in Boston,” he went on. “Don’t they do things no one else does?”
“Possibly,” I said. “But if they come up with a new technique, they have to convince others in the profession – and insurance companies – that their innovation is better in some measurable way.”
I’d gone as far as I wanted to. “It’s exciting that your patients do so well,” I said. “By the way,” I said, “what are celebrities really like up close and personal?”
“Most of them are very nice people,” he said. “They work hard to be good at what they do.”
“Do they ever complain that your treatment didn’t work, didn’t give their performance the boost they were expecting?”
“No,” he said. “Not one. They’re all happy.”
“That is really amazing,” I said. Stan nodded in agreement, though I don’t think he knew what I found so remarkable about it.
Stan is no cynic. He truly believes that what he does is valid, and that it helps his patients more than other treatments do. His patients believe it too.
Nor is our own profession as selfless and sharing as I made it sound. Hospitals love to trumpet their cyberknife technology or state-of-the-art orthopedic techniques or comprehensive cancer care, implying that they do whatever they do better than anyone else can.
Patients love to read this. They want to believe they’re seeing the “top” doctor, the one with the best results. Boston magazine (and the equivalent in every other city) publishes a list of “Top Doctors” this time of year.
Patients sometimes say, “I came to you because you did such a great job clearing up my sister’s acne,” or “You cleared my older son’s wart when nobody else could – one freeze, and it was gone. You’re a miracle worker!”
Oh sure I am. Nobody sprays liquid nitrogen the way I do.
I didn’t patent it, though. Teddy Roosevelt banned patent medicines in this country in 1906. But I guess in some quarters, patented never has gone away.
Dr. Rockoff practices dermatology in Brookline, Mass., and is a longtime contributor to Dermatology News. He serves on the clinical faculty at Tufts University, Boston, and has taught senior medical students and other trainees for 30 years.
Heroin overdoses up dramatically since 2010
Drug-poisoning deaths involving heroin have soared since 2000, and most of the increase occurred since 2010, according to a report from the National Center for Health Statistics.
From 2010 to 2013, the rate of heroin overdose deaths increased 163% for men, from a rate of 1.6/100,000 population in 2010 to 4.2 in 2013. For women, the death rate increased by 200%, from 0.4/100,000 in 2010 to 1.2/100,000 in 2013. From 2000 to 2010, however, the rate of increase was much slower, with the death rate increasing from 1.1 to 1.6 for men and from 0.2 to 0.4 for women.

The overall rate for heroin overdose from 2000 to 2013 increased from 0.7 to 2.7/100,000. Most of this increase occurred from 2010 to 2013: From 2000 to 2010, the death rate increased to only 1/100,000, a growth rate of 6%, but after 2010, the rate grew by 37% per year, the NCHS reported.
In 2013, non-Hispanic whites aged 18-44 years had the highest heroin poisoning death rate among measured racial/ethnic groups at 7/100,000. In 2000, older, non-Hispanic blacks aged 45-64 years had the highest death rate among the reported racial/ethnic groups at 2/100,000. The death rate for whites aged 18-44 in 2000 was 1.2/100,000, meaning that the death rate increased by 483% from 2000 to 2013. For non-Hispanic blacks aged 45-64, the death rate in 2013 was 4.9, an increase of 145%.
The number of heroin-related overdose deaths climbed in every region of the country from 2000 through 2013. The largest change in heroin overdose by region occurred in the Midwest, where the death rate rose from 0.4/100,000 in 2000 to 4.3 in 2013, an increase of 975%, said the NCHS report, which used data collected by the National Vital Statistics System.
Drug-poisoning deaths involving heroin have soared since 2000, and most of the increase occurred since 2010, according to a report from the National Center for Health Statistics.
From 2010 to 2013, the rate of heroin overdose deaths increased 163% for men, from a rate of 1.6/100,000 population in 2010 to 4.2 in 2013. For women, the death rate increased by 200%, from 0.4/100,000 in 2010 to 1.2/100,000 in 2013. From 2000 to 2010, however, the rate of increase was much slower, with the death rate increasing from 1.1 to 1.6 for men and from 0.2 to 0.4 for women.
The overall rate for heroin overdose from 2000 to 2013 increased from 0.7 to 2.7/100,000. Most of this increase occurred from 2010 to 2013: From 2000 to 2010, the death rate increased to only 1/100,000, a growth rate of 6%, but after 2010, the rate grew by 37% per year, the NCHS reported.
In 2013, non-Hispanic whites aged 18-44 years had the highest heroin poisoning death rate among measured racial/ethnic groups at 7/100,000. In 2000, older, non-Hispanic blacks aged 45-64 years had the highest death rate among the reported racial/ethnic groups at 2/100,000. The death rate for whites aged 18-44 in 2000 was 1.2/100,000, meaning that the death rate increased by 483% from 2000 to 2013. For non-Hispanic blacks aged 45-64, the death rate in 2013 was 4.9, an increase of 145%.
The number of heroin-related overdose deaths climbed in every region of the country from 2000 through 2013. The largest change in heroin overdose by region occurred in the Midwest, where the death rate rose from 0.4/100,000 in 2000 to 4.3 in 2013, an increase of 975%, said the NCHS report, which used data collected by the National Vital Statistics System.
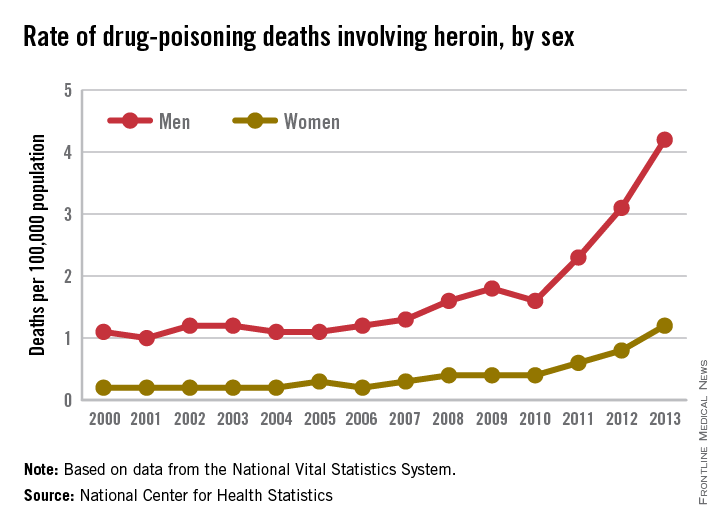
ACOG President John Jennings comments on the risks of home birth
Responses from both sides of the home-birth controversy are parried in an Opinion Page debate titled “Is Home Birth Ever a Safe Choice?” published on February 24, 2015, in the New York Times.
Debaters include John Jennings, MD, President of the American Congress of Obstetricians and Gynecologists (ACOG); Tekoa King, a certified nurse midwife (CNM) and Deputy Editor of the Journal of Midwifery & Women’s Health; Amos Grunebaum, MD, Director of Obstetrics, and Frank Chervenak, MD, Obstetrician and Gynecologist-in-chief at New York-Presbyterian Hospital, Weill Medical College of Cornell University; Marinah Valenzuela Farrell, a certified professional midwife (CPM) and president of the Midwives Alliance of North America; Aaron Caughey, MD, Chair of the Department of Obstetrics and Gynecology and Associate Dean for Women’s Health Research and Policy at Oregon Health and Science University’s School of Medicine; and Aja Graydon, a musician who experienced home birth.
To read the New York Times article, click here.
Addressing the shortage of psychiatrists: What keeps us from seeing more patients?
Recently I was contacted by a reporter who wanted to speak to me about why it’s so difficult for patients to find a psychiatrist. She’d found me by Googling “Why psychiatrists don’t take insurance” and already had read an article I’d written with that title. That day, it had snowed hard enough that most of my patients had canceled; the grocery store had closed; and I had plenty of time to chat with a reporter. The other thing I noted – perhaps because other psychiatrists had unexpected free time because of the snow – was that Maryland Psychiatric Society’s listserv was getting a lot of posts. The posts focused on issues to do with maintenance of certification (MOC) or with the fact that every physician in the state was now going to be required to have a CME credit on opioid prescribing for licensure renewal, and there would be a requirement for physicians to take a course on substance abuse to renew their CDS registration. The hope is that these courses will reduce deaths caused by narcotic overdose, and the courses would be required for all physicians without regard to whether they are relevant to their practice.
The reporter and I started with a discussion of why so many psychiatrists have chosen not to accept health insurance (myself included). She then told me about an insured man who had been diagnosed with schizophrenia and substance abuse who was unable to get an appointment with a psychiatrist. She asked me an interesting question: “Don’t psychiatrists want the challenge of treating the difficult cases?” The patient in question never did find a psychiatrist in time and he ended up committing a murder then dying by suicide – an awful tragedy that highlights access to care problems.
In addition to a private practice, I have worked in community mental health centers, and I discussed how that setting is often better suited for patients with serious psychiatric illnesses. More services are offered, and having a variety of mental health professionals in the same facility promotes better coordination of care between psychiatrists, therapists, and case managers, as well as with family, residential care providers, and day programs. The problem is that demand for treatment at outpatient clinics is high, and sometimes the waits for an initial appointment are long, or clinics even may stop accepting new patients at times when they get overloaded.
We talked about the logistics and trade-offs of working in a clinic vs. a private practice, and the reasons why working full time in a high-volume clinic might lead physicians to want a change after a few years. And then the reporter asked me another interesting question – with such long waits, why don’t the clinics hire more doctors? I explained that there was a shortage of psychiatrists and began to talk with her about demands on physician time that take time away from patient care. With the e-mails flying about MOC and new course requirements, it was a place to start, but the snow was still falling, and she heard a lot about the factors that drain physician time and money, both limiting how many patients a psychiatrist can see and driving up the cost of care.
By the time I got off the phone, I decided to tally all of the things that we are required to do to see patients. I was able to get some quick help on the listserv, from friends, and on Twitter.
Every time an agency or insurance company sets up a requirement for a physician, there is a small diversion of time. There is no limit on how many different requirements can be set or whether they need to be relevant to the physician’s work. While I realize there is little sympathy for physicians who, for the most part, are still blessed to earn a good living while doing meaningful work, these diversions add hours to a doctor’s day and cause them to burn out more quickly. So the insurance company that demands that a physician devote 20 minutes to get authorization to prescribe a medication that costs pennies a pill is actually harming society. And no one oversees the big picture.
That said, here was the list we came up with of factors that drain time and money in a clinical practice. Please note that some of these items – for example, uncompensated time returning calls to patients or keeping clinical records – are just part of being a doctor; they’re not something that should be eliminated. Similarly, issues related to having a space to work are part of having a business. I wanted the list to be complete to illustrate the demands on a psychiatrist, not to suggest that none of these things are important. Obviously, some doctors are faster or slower at certain tasks, and people vary greatly in how much time they devote to clinical practice vs. teaching, research, or writing articles for Clinical Psychiatry News. I obtained information in a very quick and casual manner; none of this should be construed as scientific.
Here is the list:
• Maintenance of certification requirements and testing. This is required every 10 years and one estimate was that the cost to register, take the test, and purchase review materials came to $2,800, with a time investment of about 50 hours. Some specialties are pushing back against MOC, and some physicians are forgoing board certification. Psychiatrists who subspecialize usually do MOC for general psychiatry and all their subspecialties.
• CME. Twenty to 50 hours per year depending on your state, and presumably physicians choose courses that enrich their ability to practice medicine. This can be expensive, depending on how the physician decides to get these credits, and many valuable learning events do not qualify for CME.
• Writing clinical notes. Again, this is part of routine medical care. Notes must justify the CPT codes on insurance claims, and very specific areas of inquiry and examination are needed to justify billing specific codes. Agency requirements may be different from what is clinically indicated for the care of the patient, and this uses some of the appointment time in a way that may not be helpful to medical care. Copying, faxing, or sending notes to other clinicians and time spent requesting records all add to the mix. One psychiatrist noted that the overall administrative responsibilities for seeing patients takes half an hour for every hour spent with a patient. Others estimated that anywhere from 30 minutes to 2 hours per day are devoted to writing notes, and some mentioned doing this in the evening at home. One child psychiatrist with a large high-volume practice noted that he is required to keep charts until a patient reaches adulthood, and that storing, locating, and shredding charts was a time drain.
• Billing the patient. One private practice psychiatrist estimated this takes approximately 8 hours a month, include record-keeping and rebilling patients who failed to pay. Some psychiatrists have a secretary or billing staff.
• Patient insurance. Time spent preauthorizing care, including time spent to preauthorize hospitalizations or to justify each day of inpatient treatment. (No time estimates were offered.)
• Filing claims. The psychiatrists I spoke with who participate with insurers all had support staff to do this.
• Preauthorizing medications. This was by far the biggest complaint by psychiatrists. One noted that it had taken her 2 hours the night before to get a medication authorized; another had spent an hour that day on it. Another rough figure I got was 20-60 minutes a week, and it was noted that preauthorization often is required for very inexpensive medications. Another psychiatrist said her office manager spends a couple of hours a week on preauthorizations and that she had to give her a raise to get her to agree to do it. Personally, I feel insurance companies should not be permitted to divert physician time away from care for inexpensive medications. Does it really make sense to have a physician spend 20 minutes of uncompensated time getting authorization for a medication that costs $10 a month?
• Paperwork related to being credentialed with insurance companies. This was estimated at 40 minutes every 3 months.
• Credentialing. Cost and paperwork for malpractice insurance varies by state and, some malpractice agencies require doctors to do specific forms of training. In addition, practicing requires renewal of a DEA number, CDS renewal (in Maryland), and state licensure.
• Electronic medical records (EMR). Medicare has provided financial incentives to doctors for the meaningful use of certified electronic health record (EHR) technology to improve patient care and now penalizes doctors who do not have this technology. One psychiatrist told me that she spent hundreds of hours working on this, but something went wrong so she is still penalized. Another said she spent 3 hours in a 3-month period attesting to her compliance with meaningful use. Everyone I spoke to said using an electronic record – related to Medicare’s meaningful use or not – increased the time it takes them to write notes. One psychiatrist reduced her clinical care to 1 day a week, and I left a community clinic when the effort of learning to use EPIC overwhelmed me.
• E-prescribing. One colleague in New York wrote, “E-prescribing takes up a lot of time, especially since I don’t do it during sessions. For a noncontrolled medication, it’s maybe 4-5 minutes per prescription. For controlled, it’s 3-4 minutes more, because I have to check I-STOP and use the token, and then record the I-STOP number. And for all prescriptions, I hand write an entry in the medication record, just for backup.” She noted it took several hours to set up the system. Most psychiatrists still spend significant time calling in prescriptions that patients have forgotten to request during appointments, and pharmacists often call to have refills authorized. This can be quite time consuming, and sometimes refills are requested automatically for medications the patients no longer take, and time spent on hold can be significant. My own experience was that e-prescribing took significantly longer than paper prescribing, and that handing a patient a prescription during a session is simply part of medical care and not a “drain,” per se.
• Secretarial. No one was able to give me an estimate of how many hours per week were spent directing, managing, and training support staff, or of how many hours this freed up to see patients. One psychiatrist in a large practice noted that they have 32 full- and part-time professions, including 3 psychiatrists; they participate with insurance, and this requires 18 full-time support staff.
• Office-related issues. Rent – this is both taste and geographically driven, and there are several ways to come by office space. Other factors are time related to restocking supplies, furnishings, technological hardware, phones, faxes, pagers, mobile lines, postage, technology support, cleaning, and assorted office-related issues. I have no time estimates on this; some people have support staff who do most of it, and again, this is part of the routine practice of having a business. It takes time, but it’s not irrelevant. Also, time is spent keeping an office both OSHA and HIPAA compliant.
• Hospital/agency-related requirements:
– Risk management seminars.
– CPR training.
– Health maintenance (required TB testing and flu shot).
• Required learning modules. When I worked 4 hours a week at a hospital clinic, there were many requirements. I watched modules on how to use elevators in buildings I never entered, how to place a central line, hand-washing and infection control, and how to store chemicals I never used. I believe that Maryland state employees may be required to have training in trauma-informed-care.
• Uncompensated time returning calls/communications to patients, families, other clinicians, and prospective patients who then decide not to come in, as well as filling out paperwork for disability claims, other agencies, and writing letters for patients. While this also is part of routine medical care, several people mentioned that other professionals can bill for this work and that insurers can force unnecessary care because only face-to-face treatment gets reimbursed, so issues that might be resolved on the phone or by telepsychiatry then require an office visit.
One colleague was kind enough to examine her own full-time practice and sum up her activities. She came up with an estimate that she devoted 40 hours per month to administrative issues that divert time from seeing patients. This did not include the time she recently devoted to MOC.
Obviously, I want to make the point that part of the psychiatrist shortage is related to the fact that there are administrative demands – many that don’t improve clinical care – that decrease the number of patients we can see and increase the cost of care. In addition to the weekly toll, many of these time drains are frustrating, and serve as disincentives to seeing patients with what time is available. The statistics prove that psychiatrists are less willing than other specialists to participate with insurance networks, and I suspect the litany of clinically irrelevant requirements may lead to earlier retirement by people who might otherwise be willing to practice for more years.
One might ask, at what point do we fight back against spending our time meeting the agendas of agencies and insurers when they aren’t relevant to the care that is needed to help patients?
With thanks to Dr. Mahmood Jarhomi, Dr. Patricia Sullivan, Dr. Sue Kim, Dr. Laura Gaffney, Dr. Maria Yang, Dr. Marsden McGuire, Dr. Annette Hanson, Dr. Robert Herman, Dr. Kimberly Hogan Pesaniello, Dr. Peter Kahn, Dr. Mark Komrad, Dr. Susan Molchan, Dr. Suzy Nashed, and Dr. Rebecca Twersky-Kengmana.
Dr. Miller is coauthor of “Shrink Rap: Three Psychiatrists Explain Their Work” (Baltimore: Johns Hopkins University Press, 2011).

Hormone therapy 10 years post menopause increases risks
Hormone therapy in postmenopausal women does not prevent heart disease but does increase the risk of stroke and blood clots, according to a recently updated Cochrane review.
“Our review findings provide strong evidence that treatment with hormone therapy in postmenopausal women for either primary or secondary prevention of cardiovascular disease events has little if any benefit overall, and causes an increase in the risk of stroke, or venous thromboembolic events,” reported Dr. Henry Boardman of the University of Oxford John Radcliffe Hospital, and his associates.
The researchers updated a review published in 2013 with data from an additional six randomized controlled trials. The total of 19 trials, involving 40,410 postmenopausal women, all compared orally-administered estrogen, with or without progestogen, to a placebo or no treatment for a minimum of 6 months (Cochrane Database Syst. Rev. 2015 March 10 [doi:10.1002/14651858.CD002229.pub4]).
The average age of the women in the studies, mostly from the United States, was older than 60 years, and the women received hormone therapy anywhere from 7 months to 10 years across the studies. The overall quality of the studies was “good” with a low risk of bias.
The sharp rise in cardiovascular disease rates in women after menopause had been hypothesized to be related to a decline in hormone levels that causes a higher androgen-to-estradiol ratio, and observational studies starting in the 1980s showed lower mortality rates and cardiovascular events in women receiving hormone therapy – previously called hormone replacement therapy – compared to those not receiving hormone therapy.
Two subsequent randomized controlled trials contradicted these observational findings, though, leading to further study. In this review, hormone therapy showed no risk reduction for all-cause mortality, cardiovascular death, nonfatal myocardial infarction, angina, or revascularization.
However, the overall risk of stroke for those receiving hormone therapy for both primary and secondary prevention was 24% higher than that of women receiving placebo treatment (relative risk 1.24), with an absolute risk of 6 additional strokes per 1,000 women.
Venous thromboembolic events occurred 92% more and pulmonary emboli occurred 81% more in the hormone treatment groups (RR 1.92 and 1.81, respectively), with increased absolute risks of 8 per 1,000 women and 4 per 1,000 women, respectively.
The researchers calculated the number needed to treat for an additional harm (NNTH) at 165 women for stroke, 118 for venous thromboembolism, and 242 for pulmonary embolism.
Further analysis revealed that the relative risks or protection hormone therapy conferred depended on how long after menopause women started treatment.
Mortality was reduced 30% and coronary heart disease was reduced 48% in women who began hormone therapy less than 10 years after menopause (RR 0.70 and RR 0.52, respectively); these women still faced a 74% increased risk of venous thromboembolism, but no increased risk of stroke.
Meanwhile, women who started hormone therapy more than 10 years after menopause had a 21% increased risk of stroke and a 96% increased risk of venous thromboembolism, but no reduced risk on overall death or coronary heart disease.
“It is worth noting that the benefit seen in survival and coronary heart disease for the group starting treatment less than 10 years after the menopause is from combining five trials all performed in primary prevention populations and all with quite long follow-up, ranging from 3.4 to 10.1 years,” the authors wrote.
These results may reflect the possibility of a time interaction, with coronary heart disease events occurring earlier in predisposed women, making it impossible to say whether short duration therapy is beneficial in this population or not, the researchers wrote .
Eighteen of the 19 trials included in the analysis reported the funding source. One study was exclusively funded by Wyeth-Ayerst. Two studies received partial funding from Novo-Nordisk Pharmaceutical, and one study was funded by the National Institutes of Health with support from Wyeth-Ayerst, Hoffman-LaRoche, Pharmacia, and Upjohn. Eight other studies used medication provided by various pharmaceutical companies.
FROM COCHRANE DATABASE OF SYSTEMATIC REVIEWS
Key clinical point: Hormone therapy in postmenopausal women increases stroke risk.
Major finding: Stroke increased by 24%, venous thromboembolism by 92%, and pulmonary embolism by 81% in postmenopausal women receiving hormone therapy.
Data source: A review and meta-analysis of 19 randomized controlled trials involving 40,140 postmenopausal women who received orally-administered hormone therapy, placebo, or no treatment for prevention of cardiovascular disease.
Disclosures: One study was funded by Wyeth-Ayerst. Two studies received partial funding from Novo-Nordisk Pharmaceutical, and one study was funded by the National Institutes of Health with support from Wyeth-Ayerst, Hoffman-LaRoche, Pharmacia, and Upjohn. Eight other studies used medication provided by various pharmaceutical companies.
VIDEO: Meet Frankie and Sophie, the thyroid cancer–sniffing dogs
SAN DIEGO – Researchers at the University of Arkansas for Medical Sciences in Little Rock are teaching dogs to detect thyroid cancer from urine samples.
The dogs become alert on samples if they detect cancer, but remain passive if they don’t. The first graduate of the program, a German shepherd mix named Frankie, got it right in 30 of 34 cases, matching final surgical pathology results with a sensitivity of 86.6% and a specificity of 89.5%.
With results like those, it might not be too long before Frankie and his colleagues are providing inexpensive adjunct diagnostic services when test results are uncertain, and helping underserved areas with limited diagnostic capacity, the researchers noted.
At the Endocrine Society meeting, investigator Dr. Andrew Hinson shared clips of Frankie and another recent graduate, a border collie mix named Sophie, and explained the project’s next steps.
Frankie was rescued by principal investigator Dr. Arny Ferrando. Sophie and other dogs in the program were also rescued from local animal shelters.
More information is available at www.thefrankiefoundation.org.
The video associated with this article is no longer available on this site. Please view all of our videos on the MDedge YouTube channel
AT ENDO 2015