User login
Microscopy advances net Nobel Prize

Credit: Max Planck Institute
for Biophysical Chemistry
Three scientists have received the 2014 Nobel Prize in Chemistry for aiding the development of super-resolved fluorescence microscopy.
For a long time, optical microscopy was held back by a presumed limitation: that it would never obtain a better resolution than half the wavelength
of light.
Working separately, this year’s Nobel Laureates in Chemistry circumvented this limitation and brought optical microscopy into the nanodimension.
Now, scientists can monitor the interplay between individual molecules inside cells, watch disease-related proteins aggregate, and track cell division at the nanolevel.
For enabling these advances, Eric Betzig, PhD, of the Howard Hughes Medical Institute in Ashburn, Virginia; Stefan W. Hell, PhD, of the Max Planck Institute for Biophysical Chemistry in Göttingen, Germany; and William E. Moerner, PhD, of Stanford University in California, received the prize. The prize amount was SEK 8 million, to be shared equally among the Laureates.
The work in brief
In 1873, the microscopist Ernst Abbe stipulated a physical limit for the maximum resolution of traditional optical microscopy—0.2 micrometers. Drs Moerner, Hell, and Betzig were able to bypass this limit.
Dr Hell developed stimulated emission depletion (STED) microscopy. This method employs 2 laser beams. One stimulates fluorescent molecules to glow, and another cancels out all fluorescence except for that in a nanometer-sized volume.
Scanning over the sample, nanometer for nanometer, yields an image with a resolution better than Abbe’s stipulated limit.
Drs Betzig and Moerner laid the foundation for another method, single-molecule microscopy. This method relies upon the possibility to turn the fluorescence of individual molecules on and off.
Scientists image the same area multiple times, letting just a few interspersed molecules glow each time. Superimposing these images yields a dense super-image resolved at the nanolevel. In 2006, Dr Betzig used this method for the first time.
For more details on the Nobel Laureates and their work, visit Nobelprize.org. ![]()
Price increases drive spending on cancer drugs

Credit: Steven Harbour
The recent surge in spending on oral anticancer drugs in the US exceeds the increase in use of these drugs, new research shows.
Average quarterly national spending on oral oncologics increased 37% during the period studied, from $940 million in the first quarter of 2006 to $1.4 billion in the third quarter of 2011.
But the average quarterly use of these drugs in the same time period increased by only 10%.
This suggests price increases are a significant driver of spending trends.
Rena M. Conti, PhD, of the University of Chicago in Illinois, and her colleagues examined recent trends in spending and use of oral oncologics and disclosed their findings in Health Affairs.
Of the 47 drugs analyzed, most were targeted agents (30%), hormonal agents (26%), and alkylating agents (19%).
The researchers observed a significant increase in national spending on oral oncologics from 2006 to 2011—an estimated average quarterly increase of $20 million.
This was driven by brand-name, patent-protected drugs, but the use of these drugs climbed a comparatively small amount. Average quarterly spending of patent-protected drugs increased 61%, and average quarterly use increased 30% between 2006 and the period from September 2010 to September 2011.
“This is an exciting time, an era of breakthrough cancer drugs,” Dr Conti said. “Some of these medications have extended the lives of many people with certain types of cancer. However, spending on these brand-name oral oncologics is outstripping national spending on all pharmaceuticals and all medical care spending generally.”
The researchers also discovered that when oncologics lose patent protection, spending takes a nosedive. The use of newly off-patent drugs increased by 16%, but average quarterly spending on those drugs fell by 65%.
Another finding was that US spending on targeted anticancer agents increased from 35% of all oral cancer drugs in 2006 to nearly 60% in 2011.
Meanwhile, spending on hormonal agents decreased from 42% of total spending to 19%, spending on antimetabolites increased from 11% to 12%, and spending on alkylating agents decreased from 10% to 8%. ![]()
Cosmetic Corner: Dermatologists Weigh in on OTC Pigment Control Products
To improve patient care and outcomes, leading dermatologists offered their recommendations on the top OTC pigment control products. Consideration must be given to:
- Even Better
Clinique Laboratories, LLC
“It also is useful as prevention and offers many different options.”—Antonella Tosti, MD, Miami, Florida
“These OTC products have good clinical data to support use for hyperpigmentation. Patients tell me that they feel good on their skin and aren’t irritating.”—Gary Goldenberg, MD, New York, New York
- Lumixyl Brightening System
Envy Medical, Inc
“A great option for patients who may be experiencing modest issues with pigmentation. Use of a retinoid with this product also may enhance its efficacy.”—Joel Schlessinger, MD, Omaha, Nebraska
- Lytera Skin Brightening Complex
SkinMedica
“With key ingredients such as hexylresorcinol, retinol, and niacinamide, it has been clinically shown to lighten dark patches in its trials as well as adding luminosity to the skin.”—Anthony Rossi, MD, New York, New York
Recommended by Elizabeth K. Hale, MD, New York, New York
- Pigmentclar Serum
La-Roche Posay Laboratoire Dermatologique
“It attacks pigment production at every stage.”—Whitney Bowe, MD, Brooklyn, New York
Cutis invites readers to send us their recommendations. Mineral makeup, eyelash enhancers, and facial scrubs will be featured in upcoming editions of Cosmetic Corner. Please e-mail your recommendation(s) to [email protected].
Disclaimer: Opinions expressed herein do not necessarily reflect those of Cutis or Frontline Medical Communications Inc and shall not be used for product endorsement purposes. Any reference made to a specific commercial product does not indicate or imply that Cutis or Frontline Medical Communications Inc endorses, recommends, or favors the product mentioned. No guarantee is given to the effects of recommended products.
COSMECEUTICAL CRITIQUE: Master formulators: The ‘Julia Childs’ of skin care
In the multibillion-dollar skin care industry, there are many well-recognized brands. However, we sometimes forget that behind these products were formulators who took their scientific ideas and turned them into recipes for cosmetically elegant active formulations.
I have spent the last 15 years researching the activity of cosmeceutical ingredients for my new textbook, “Cosmeceuticals and Cosmetic Ingredients” (McGraw Hill, 2014). Each ingredient has its own quirks, and they all do not “play well in the sandbox” together. Formulation knowledge (cosmetic chemistry) is required to take these ingredients and combine them in a way that enhances rather than hinders their activity, just as a chef combines ingredients and cooking techniques to enhance the flavor and presentation of food. When I discuss cosmeceutical products, I always stress the importance of the ingredients and understanding ingredient interactions, because they determine the end product – how effective it is and how elegant it feels. If a product works well but smells bad and feels unpleasant, consumers will not use it.

Whom are we trusting when it comes to this science? The formulators, also known as cosmetic chemists, who put their blood, sweat, and tears into years of work to develop products that yield efficacious results. They are often behind the scenes, and their contributions are not always recognized. I refer to them as the “Julia Childs” of skin care, because they remind me of how Julia Child combined her knowledge of ingredients and aesthetic sensibilities to change the world of cooking.
I’d like to shine the spotlight on several top skin care formulators that I have met. Their relentless desire to perfect skin care recipes has helped the industry boom and has improved skin health.
Richard Parker
Location: Melbourne
Richard Parker is the CEO/founder of the Australia-based company Rationale. When he was unable to find skin care products that worked with his skin type, he decided to study cosmetic chemistry and create his own skin care line. Today, Rationale can be found in dermatologists’ and plastic surgeons’ offices across Australia. Parker’s passion for cosmetic science is evident. Australia has a high incidence of melanoma, and sunscreens undergo greater scrutiny there compared with other countries. One of the things that Parker is most proud of is his creation of SPF products that are “as elegant as they are effective.” This is a difficult combination to achieve, because sunscreens tend to be too white or too greasy; formulating them properly requires a “master chef.”
In addition to formulating effective and elegant sun protection, he has developed Essential Six: a combination of six products that work in synergy, delivering the perfect combination of active ingredients at the correct concentration to be recognized and utilized by skin cells.
In order to succeed in the formulations industry, you must possess a desire to make it better; and Parker does just that. It’s his wish for the industry to have an increased awareness of a holistic approach to skin care that includes immune protection, antioxidants, sunscreens, gentle cleansing, alpha-hydroxy acids, and vitamin A.
If being at the forefront of this evolution isn’t enough, Parker is devoted to continue his mission for years to come, all the while helping younger chemists/formulators embrace the culture.
“For the past 25 years, I have had the privilege to work with Australia’s leading dermatologists to create the best possible products and procedures,” he said. “At this stage of my career, it is so gratifying to see the younger generation of skin specialists embrace medical skin care as a part of best clinical practice.”
Chuck Friedman
Location: Wendell, N.C.
Chuck Friedman is a man who prides himself on the use of natural products – not a small achievement for a man who has been in the industry for almost half a century. His work as a formulation chemist has spanned globally recognized companies such as Lanvin-Charles of the Ritz, Almay, Estée Lauder, Burt’s Bees, and Polysciences.
Friedman prides himself on his natural products. His product list includes hypoallergenic and natural versions of cleansers; toners; exfoliators; moisturizers and masks; shampoos; conditioners; dandruff treatments and hair sprays; antiperspirants and deodorants; lip balms; salves and cuticle treatments; shaving creams and aftershaves; over-the-counter analgesics; acne treatments and sunscreens; toothpastes; and liquid soap.
Friedman has said that he is most proud of his Burt’s Bees Orange Essence Cleansing Cream, which won Health Magazine’s Healthiest Cleanser of the Year in 1999. The product is an anhydrous, 100% natural, self-preserving translucent gel-emulsion of vegetable oil and vegetable glycerin stabilized by a proprietary protein.
During his tenure in the industry, Friedman has faced many hurdles in creating his natural formulations – achieving esthetics, efficacy, and physical stability at temperature extremes while maintaining microbiological integrity and using more green, renewable ingredients while formulating with fewer petrochemicals. His breakthrough natural formulations developed at Burt’s Bees are emulated and marketed widely today.
Sergio Nacht
Location: Las Vegas
Sergio Nacht is a biochemist, researcher, and product developer with 48 years of formulation experience. Currently, he is chief scientific officer/cofounder at resolutionMD and Riley-Nacht.
“A better understanding of the structure and function of the skin has resulted in the development of better functional products that deliver clinically demonstrable benefits and not only ‘hope in a jar,’ ” he has said.
Nacht has coauthored more than 50 scientific papers, and he holds 17 international and U.S. patents.
Possibly his most significant accomplishment followed the discovery of what he believes is one of the biggest challenges in skin care formulation. Microsponge Technology is the first – and still the only – U.S. Food and Drug Administration–approved controlled-release technology for topical products that maximizes efficacy while minimizing side effects and optimizing cosmetic attributes by allowing slow release of ingredients. The microsponge is used to provide various therapeutic solutions for antiaging, acne treatment, skin firming, skin lightening, and mattifying – most notably as the lead technology behind Retin-A Micro.
Byeong-Deog Park
Location: Seoul, South Korea
Byeong-Deog Park holds a Ph.D. in industrial chemicals from Seoul National University, among his other achievements. Dr. Park’s company, Neopharm, is located in Seoul. He is a true scientist who has been awarded many patents in the areas of ceramides for the treatment of dry skin and atopic dermatitis; PPAR (peroxisome proliferator-activated receptor)-alpha in the treatment of inflammatory disorders; and an antimicrobial peptide, Defensamide, which has been shown to prevent colonization of Staphylococcus aureus. His research led to the development of a proprietary MLE (multilamellar emulsion) technology in which lipids and ceramides form the identical Maltese cross structure that is seen in the natural lipid barrier of the skin, allowing effective skin barrier repair.
With MLE technology, the ceramides, fatty acids, and cholesterol required for an intact skin barrier are replaced in the proper ratio and three-dimensional structure needed to emulate the skin’s natural structure. This reforms the skin’s barrier and prevents water evaporation from the skin’s surface. Dr. Park has said that he is most proud of his patented MLE technology, found in the brands Atopalm and Zerafite. He also combined MLE technology and Defensamide in an atopic dermatitis treatment known as Zeroid.
Dr. Park never ceases to impress me with his scientific knowledge and dedication to the scientific method. In a field where many products are considered “hope in a jar,” his cosmetically elegant products stand out as “verified science in a jar.”
Gordon Dow
Location: Petaluma, Calif.
Gordon Dow started Dow Pharmaceutical Sciences in his garage. Today, Dow Pharmaceutical Sciences (recently acquired by Valeant Pharmaceuticals International) is a leading company in the formulation and manufacturing of dermatological products.
Over the past 25 years, Dow has commanded the company’s evolution by carefully balancing science and business. He previously served as vice president of research and development for Ingram Pharmaceuticals, where he developed seven commercially successful products, including four dermatologicals. He also served as the executive secretary of the research advisory panel for the State of California. A few of Dow’s best-known products include MetroGel, Ziana, and Acanya.
The passion for science and skin care of these individuals has shaped the dermatologic landscape for the best. They would probably agree with Julia Child, who once said, “Find something you’re passionate about and keep tremendously interested in it.”
Dr. Baumann is chief executive officer of the Baumann Cosmetic & Research Institute in Miami Beach. She founded the cosmetic dermatology center at the University of Miami in 1997. Dr. Baumann wrote the textbook “Cosmetic Dermatology: Principles and Practice” (McGraw-Hill, April 2002), and a book for consumers, “The Skin Type Solution” (Bantam, 2006). She has contributed to the Cosmeceutical Critique column in Skin & Allergy News since January 2001. Dr. Baumann has received funding for clinical grants from Allergan, Aveeno, Avon Products, Galderma, Mary Kay, Medicis Pharmaceuticals, Neutrogena, Philosophy, Stiefel, Topix Pharmaceuticals, and Unilever.
In the multibillion-dollar skin care industry, there are many well-recognized brands. However, we sometimes forget that behind these products were formulators who took their scientific ideas and turned them into recipes for cosmetically elegant active formulations.
I have spent the last 15 years researching the activity of cosmeceutical ingredients for my new textbook, “Cosmeceuticals and Cosmetic Ingredients” (McGraw Hill, 2014). Each ingredient has its own quirks, and they all do not “play well in the sandbox” together. Formulation knowledge (cosmetic chemistry) is required to take these ingredients and combine them in a way that enhances rather than hinders their activity, just as a chef combines ingredients and cooking techniques to enhance the flavor and presentation of food. When I discuss cosmeceutical products, I always stress the importance of the ingredients and understanding ingredient interactions, because they determine the end product – how effective it is and how elegant it feels. If a product works well but smells bad and feels unpleasant, consumers will not use it.
Whom are we trusting when it comes to this science? The formulators, also known as cosmetic chemists, who put their blood, sweat, and tears into years of work to develop products that yield efficacious results. They are often behind the scenes, and their contributions are not always recognized. I refer to them as the “Julia Childs” of skin care, because they remind me of how Julia Child combined her knowledge of ingredients and aesthetic sensibilities to change the world of cooking.
I’d like to shine the spotlight on several top skin care formulators that I have met. Their relentless desire to perfect skin care recipes has helped the industry boom and has improved skin health.
Richard Parker
Location: Melbourne
Richard Parker is the CEO/founder of the Australia-based company Rationale. When he was unable to find skin care products that worked with his skin type, he decided to study cosmetic chemistry and create his own skin care line. Today, Rationale can be found in dermatologists’ and plastic surgeons’ offices across Australia. Parker’s passion for cosmetic science is evident. Australia has a high incidence of melanoma, and sunscreens undergo greater scrutiny there compared with other countries. One of the things that Parker is most proud of is his creation of SPF products that are “as elegant as they are effective.” This is a difficult combination to achieve, because sunscreens tend to be too white or too greasy; formulating them properly requires a “master chef.”
In addition to formulating effective and elegant sun protection, he has developed Essential Six: a combination of six products that work in synergy, delivering the perfect combination of active ingredients at the correct concentration to be recognized and utilized by skin cells.
In order to succeed in the formulations industry, you must possess a desire to make it better; and Parker does just that. It’s his wish for the industry to have an increased awareness of a holistic approach to skin care that includes immune protection, antioxidants, sunscreens, gentle cleansing, alpha-hydroxy acids, and vitamin A.
If being at the forefront of this evolution isn’t enough, Parker is devoted to continue his mission for years to come, all the while helping younger chemists/formulators embrace the culture.
“For the past 25 years, I have had the privilege to work with Australia’s leading dermatologists to create the best possible products and procedures,” he said. “At this stage of my career, it is so gratifying to see the younger generation of skin specialists embrace medical skin care as a part of best clinical practice.”
Chuck Friedman
Location: Wendell, N.C.
Chuck Friedman is a man who prides himself on the use of natural products – not a small achievement for a man who has been in the industry for almost half a century. His work as a formulation chemist has spanned globally recognized companies such as Lanvin-Charles of the Ritz, Almay, Estée Lauder, Burt’s Bees, and Polysciences.
Friedman prides himself on his natural products. His product list includes hypoallergenic and natural versions of cleansers; toners; exfoliators; moisturizers and masks; shampoos; conditioners; dandruff treatments and hair sprays; antiperspirants and deodorants; lip balms; salves and cuticle treatments; shaving creams and aftershaves; over-the-counter analgesics; acne treatments and sunscreens; toothpastes; and liquid soap.
Friedman has said that he is most proud of his Burt’s Bees Orange Essence Cleansing Cream, which won Health Magazine’s Healthiest Cleanser of the Year in 1999. The product is an anhydrous, 100% natural, self-preserving translucent gel-emulsion of vegetable oil and vegetable glycerin stabilized by a proprietary protein.
During his tenure in the industry, Friedman has faced many hurdles in creating his natural formulations – achieving esthetics, efficacy, and physical stability at temperature extremes while maintaining microbiological integrity and using more green, renewable ingredients while formulating with fewer petrochemicals. His breakthrough natural formulations developed at Burt’s Bees are emulated and marketed widely today.
Sergio Nacht
Location: Las Vegas
Sergio Nacht is a biochemist, researcher, and product developer with 48 years of formulation experience. Currently, he is chief scientific officer/cofounder at resolutionMD and Riley-Nacht.
“A better understanding of the structure and function of the skin has resulted in the development of better functional products that deliver clinically demonstrable benefits and not only ‘hope in a jar,’ ” he has said.
Nacht has coauthored more than 50 scientific papers, and he holds 17 international and U.S. patents.
Possibly his most significant accomplishment followed the discovery of what he believes is one of the biggest challenges in skin care formulation. Microsponge Technology is the first – and still the only – U.S. Food and Drug Administration–approved controlled-release technology for topical products that maximizes efficacy while minimizing side effects and optimizing cosmetic attributes by allowing slow release of ingredients. The microsponge is used to provide various therapeutic solutions for antiaging, acne treatment, skin firming, skin lightening, and mattifying – most notably as the lead technology behind Retin-A Micro.
Byeong-Deog Park
Location: Seoul, South Korea
Byeong-Deog Park holds a Ph.D. in industrial chemicals from Seoul National University, among his other achievements. Dr. Park’s company, Neopharm, is located in Seoul. He is a true scientist who has been awarded many patents in the areas of ceramides for the treatment of dry skin and atopic dermatitis; PPAR (peroxisome proliferator-activated receptor)-alpha in the treatment of inflammatory disorders; and an antimicrobial peptide, Defensamide, which has been shown to prevent colonization of Staphylococcus aureus. His research led to the development of a proprietary MLE (multilamellar emulsion) technology in which lipids and ceramides form the identical Maltese cross structure that is seen in the natural lipid barrier of the skin, allowing effective skin barrier repair.
With MLE technology, the ceramides, fatty acids, and cholesterol required for an intact skin barrier are replaced in the proper ratio and three-dimensional structure needed to emulate the skin’s natural structure. This reforms the skin’s barrier and prevents water evaporation from the skin’s surface. Dr. Park has said that he is most proud of his patented MLE technology, found in the brands Atopalm and Zerafite. He also combined MLE technology and Defensamide in an atopic dermatitis treatment known as Zeroid.
Dr. Park never ceases to impress me with his scientific knowledge and dedication to the scientific method. In a field where many products are considered “hope in a jar,” his cosmetically elegant products stand out as “verified science in a jar.”
Gordon Dow
Location: Petaluma, Calif.
Gordon Dow started Dow Pharmaceutical Sciences in his garage. Today, Dow Pharmaceutical Sciences (recently acquired by Valeant Pharmaceuticals International) is a leading company in the formulation and manufacturing of dermatological products.
Over the past 25 years, Dow has commanded the company’s evolution by carefully balancing science and business. He previously served as vice president of research and development for Ingram Pharmaceuticals, where he developed seven commercially successful products, including four dermatologicals. He also served as the executive secretary of the research advisory panel for the State of California. A few of Dow’s best-known products include MetroGel, Ziana, and Acanya.
The passion for science and skin care of these individuals has shaped the dermatologic landscape for the best. They would probably agree with Julia Child, who once said, “Find something you’re passionate about and keep tremendously interested in it.”
Dr. Baumann is chief executive officer of the Baumann Cosmetic & Research Institute in Miami Beach. She founded the cosmetic dermatology center at the University of Miami in 1997. Dr. Baumann wrote the textbook “Cosmetic Dermatology: Principles and Practice” (McGraw-Hill, April 2002), and a book for consumers, “The Skin Type Solution” (Bantam, 2006). She has contributed to the Cosmeceutical Critique column in Skin & Allergy News since January 2001. Dr. Baumann has received funding for clinical grants from Allergan, Aveeno, Avon Products, Galderma, Mary Kay, Medicis Pharmaceuticals, Neutrogena, Philosophy, Stiefel, Topix Pharmaceuticals, and Unilever.

Risk-directed therapy improves survival in ALL

Credit: St Jude Biomedical
Communications
Risk-directed therapy can level the playing field for patients with BCR-ABL1-like acute lymphoblastic leukemia (ALL), new research suggests.
Using minimal residual disease (MRD) and other risk factors to guide treatment intensity allowed patients withBCR-ABL1-like ALL to have survival rates comparable to those of other B-ALL patients.
The research also revealed that not all BCR-ABL1-like ALL patients have high-risk disease.
Ching-Hon Pui, MD, of St Jude Children’s Research Hospital in Memphis, Tennessee, and his colleagues reported these results in the Journal of Clinical Oncology.
Patients with BCR-ABL1-like ALL tend to have poor outcomes, so Dr Pui and his colleagues evaluated the utility of risk-directed therapy in these and other B-ALL patients.
The team assessed patients enrolled in the Total Therapy XV study between 2000 and 2007. They were 1 to 18 years of age at diagnosis. There were 344 subjects with adequate samples for gene expression profiling.
Forty patients (11.6%) had BCR-ABL1-like ALL. They were significantly more likely than other study participants to be male, have Down syndrome, and have higher MRD levels on day 19 and at the end of induction.
The researchers monitored patients and adjusted their treatment intensity based on MRD at days 19 and 42. The treatment regimen was described in JAMA in 2009.
The MRD monitoring combined with conventional risk factors, such as patient age and white blood count at diagnosis, demonstrated that BCR-ABL1-like ALL is not a uniformly high-risk disease.
Forty percent of BCR-ABL1-like ALL patients were actually classified as having low-risk disease because they had other favorable clinical or biological features and no MRD at the end of remission induction.
The other 60% were classified as having standard-risk or high-risk disease. The group included 6 patients who underwent transplant.
There were no significant differences in event-free or overall survival in patients with BCR-ABL1-like ALL and the other ALL patients. At 5 years, event-free survival was 90.0% ± 4.7% and 88.4% ± 1.9%, respectively. And 5-year overall survival was 92.5% ± 4.2% and 95.1% ± 1.3%, respectively.
When available, more sophisticated genetic testing should be used to identify which of the B-ALL patients with high levels of MRD have the BCR-ABL1-like ALL subtype, Dr Pui said. Many of these patients have genetic alterations that make them responsive to tyrosine kinase inhibitors (TKIs) and possibly other targeted therapies.
For example, in this study, the researchers evaluated genetic abnormalities in 25 BCR-ABL1-like ALL patients. Eleven had a genomic rearrangement of CRLF2, 6 had fusion transcripts responsive to ABL TKIs or JAK inhibitors, and 7 had mutations involving the Ras signaling pathway.
“In the future, genetic testing will likely be used at diagnosis to identify [BCR-ABL1-like ALL] and direct patients to the best targeted therapy,” Dr Pui said, “possibly including some drugs that are currently experimental.” ![]()
Program for poor can boost hospital profits

Credit: Petr Kratochvil
A federal program designed to help the poor may actually be used to help US hospitals increase their profits, according to research published in Health Affairs.
Researchers examined enrollment in the 340B program, which provides deep discounts on outpatient drug purchases.
They found that hospitals and clinics that joined the program since 2004 currently serve more affluent and well-insured communities than those that qualified for the program in previous years.
This supports the idea that the program is changing from one that serves patients in need to one that enriches hospitals and their affiliated clinics, according to the researchers.
“This study provides the first nationally representative empirical evidence suggesting that the program’s original intent is being eroded by the actions of certain hospitals,” said study author Rena M. Conti, PhD, of the University of Chicago in Illinois.
This study follows work by Dr Conti and Peter B. Bach, MD, of Memorial Sloan-Kettering Cancer Center in New York, that was published in JAMA last year.
The JAMA study explained how 340B-qualified hospital-affiliated clinics can boost profits thanks to discounts on expensive anticancer drugs. The facilities receive the discounts under the expectation that the savings will be passed on to poor patients.
“Hospitals qualify for the program based on the poverty of their inpatient census only,” Dr Conti said. “The affiliated clinics are the only 340B institutions not required to pass the discounts off to patients or their insurers, nor do they have to report to the government exactly how these profits are used to serve the poor. Insurers’ and their patients’ payments for outpatient drug treatment don’t reflect the discounts the hospital receives.”
The 340B program, which began in 1992, was designed to help selected hospitals and their outpatient clinics serve low-income and uninsured patients by providing discounts of 30% to 50% on outpatient drugs.
About a decade ago, enrollment in 340B began to increase rapidly. Now, more than a third of the 4375 US non-federal hospitals are 340B-qualified. Recent Congressional and news reports suggest that, for selected hospitals, profits off the 340B program can be significant.
For their new study, Drs Conti and Bach examined the populations served by hospitals and clinics qualifying for 340B before and after the decade-long growth spurt. They matched data for all hospitals and clinics registered with the 340B program to socioeconomic data from the US Census Bureau.
The results showed that communities served by hospital-affiliated clinics joining the program in 2004 or later tended to have higher household incomes, much less unemployment, and higher rates of health insurance.
The researchers said their findings are consistent with recent complaints that, rather than serving vulnerable communities, the 340B program is being used to increase profits for hospitals and their affiliated clinics. ![]()
Mental health challenges fairly common in cancer patients
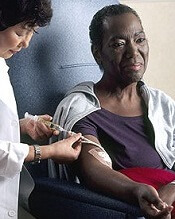
chemotherapy
Credit: Rhoda Baer
In a large German study, investigators found that nearly a third of cancer patients experienced some form of clinically relevant mental health
challenge.
Of the more than 2100 cancer patients interviewed, 32% had experienced a clinically meaningful level of mental or emotional distress in the previous 4 weeks.
This prevalence is higher than that observed in the general population, and the difference is primarily due to a higher rate of anxiety and adjustment disorders.
The incidence of mental health issues varied by cancer type. The highest was among patients with breast cancer (42%) and head and neck cancer (41%), followed by malignant melanoma (39%).
The lowest prevalence was seen among patients with prostate cancer (22%), stomach cancers (21%), and pancreatic cancer (20%).
These results appear in the Journal of Clinical Oncology.
“These findings reinforce that, as doctors, we need to be very aware of signs and symptoms of mental and emotional distress,” said lead study author Anja Mehnert, PhD, of the University of Leipzig in Germany.
“We must encourage patients to seek evaluation, support, and treatment if necessary, as there are long-term risks often associated with more severe, untreated mental health disorders. This research also sheds light on which patients we should watch more closely.”
Dr Mehnert and her colleagues conducted this study in 2141 cancer patients who were 18 to 75 years of age. The team conducted face-to-face interviews in hospitals, outpatient cancer care centers, and rehabilitation centers in Germany.
Interview answers were immediately entered into a computer based-diagnostic program. The test assessed various psychological symptoms over the previous 4-week period. Patients’ diagnoses were classified according to the Diagnostic and Statistical Manual of Mental Disorders, the standard classification used by mental health professionals.
The patients had a range of cancer types, with the most common being breast cancer (44%), prostate cancer (15%), and colorectal cancer (14%). The average time since cancer diagnosis was 13.5 months, and 51% of the participants were women.
The researchers found that 32% of patients experienced at least one clinically meaningful mental health issue (defined in the study as a mental health disorder). This is a higher prevalence than in the general population, in which 18% to 20% of people are estimated to have a clinically meaningful mental disorder.
In the 4-week period prior to the interview, 11.5% of patients experienced an anxiety disorder. Eleven percent met the criteria for an adjustment disorder, a predominantly mixed anxiety-depressive syndrome that persisted for at least 4 weeks in response to a significant life change. And 6.5% of patients had signs of a mood disorder such as major depression.
The 11.5% rate of anxiety disorders—such as phobia, panic, or generalized anxiety disorder—was slightly higher than in the general population (9%), while the prevalence of other mental health diagnoses was similar to rates in the general population.
It is likely that the prevalence of adjustment disorders (11%), which is rarely assessed in general population surveys, significantly contributed to the overall higher prevalence rate of mental disorders in this population of patients with cancer.
Dr Mehnert said it was surprising that patients with a more treatable malignancy, such as breast cancer, experienced more distress than people with cancers that are more challenging to treat, such as stomach and pancreatic cancers. So more research is needed to interpret these findings.
The investigators believe the study’s results may be useful for planning future support programs for cancer patients, and they can provide additional information to guide programs for people with specific cancer types.
The team also believes the findings can likely be generalized to patients in the US because the prevalence of mental health diagnoses is similar between the 2 countries. ![]()
FDA allows access to pathogen inactivation system
![]()
The US Food and Drug Administration (FDA) has authorized the use of a pathogen inactivation system in regions of the US and its territories affected by outbreaks of Chikungunya and dengue virus.
The INTERCEPT Blood System for platelets is used for the preparation and storage of whole blood-derived and apheresis platelets.
The system can inactivate a range of viruses, bacteria, and parasites to reduce the risk of transmission via platelet transfusion. It can also prevent transfusion-associated graft-vs-host disease and reduce the risk of other adverse effects due to transfusion of contaminating donor leukocytes.
The INTERCEPT Blood System for platelets has not been granted full FDA approval. The agency has approved use of the system via an investigational device exemption (IDE).
This allows for early access to a device not yet approved in the US when no satisfactory alternative is available to treat patients with serious or life-threatening conditions.
The INTERCEPT Blood System for platelets will initially be available to sites in Puerto Rico that agree to participate in a clinical study. Depending on the scope of participation there, the system may be made available to sites in other areas where cases of Chikungunya and dengue have been reported, such as Florida and Texas.
“We are pleased to provide US blood centers and hospitals early access to INTERCEPT for the treatment of platelet components in light of the escalating threat of Chikungunya and dengue transfusion-transmitted infections,” said Carol Moore, of Cerus Corporation, the company developing the INTERCEPT system.
“With this expeditious approval of our IDE, we hope to initiate our first study site before year-end.”
About the system
The INTERCEPT Blood System for platelets is based on the premise that platelets don’t require functional DNA or RNA, but pathogens and contaminating leukocytes do. The system deploys proprietary molecules that, when activated, bind to and block the replication of DNA and RNA in the blood.
The system uses amotosalen HCl (a photoactive compound) and long-wavelength ultraviolet illumination to photochemically treat platelet components, rendering susceptible pathogens incapable of replicating and causing disease.
Published studies have demonstrated INTERCEPT inactivation of >6.4 log of Chikungunya and >5.3 log of dengue infectious titers, both in excess of observed titers in asymptomatic donors.
The INTERCEPT platelet system has been approved in Europe since 2002 and is currently used at more than 100 blood centers in 20 countries. The system is under regulatory review in the US, Canada, Brazil, and China.
About dengue and Chikungunya
Dengue virus is endemic to the Caribbean region. Local transmission of Chikungunya virus was detected in the Caribbean for the first time in February 2014. Both viruses are spread by species of mosquitoes common in tropical climates and regions within the continental US.
As of September 30, 2014, the Centers for Disease Control and Prevention has reported 11 confirmed locally transmitted cases of Chikungunya in
Florida, 421 cases in Puerto Rico, and 45 cases in the US Virgin Islands. Local transmission of dengue has also been reported in Texas and Florida.
Chikungunya virus causes high fevers, joint pain and swelling, headaches, and a rash. Symptoms have been reported to persist for up to 2 years in chronic cases. Rarely, Chikungunya can be fatal.
Symptoms of dengue include high fever, headaches, joint and muscle pain, vomiting, and a rash. In some cases, dengue infection is life-threatening due to dengue hemorrhagic fever, which causes bleeding from the nose, gums, or under the skin. ![]()
Granulomatous Changes Associated With Pigmented Purpuric Dermatosis
Pigmented purpuric dermatoses (PPDs) are a group of common chronic disorders characterized by speckled, cayenne pepper–like petechiae and orange-brown discoloration of the skin resulting from capillaritis.1 Pigmented purpuric dermatoses typically occur in the absence of underlying vascular insufficiency or other hematologic dysfunction. The 5 well-known clinicopathologic variants of PPD include Schamberg disease; purpura annularis telangiectodes of Majocchi; pigmented purpuric lichenoid dermatitis of Gougerot and Blum; eczematoidlike purpura of Doucas and Kapetanakis; and lichen aureus.2 All PPDs share common characteristic clinical and histologic features. Clinically, patients generally present with symmetric petechiae and/or pigmented macules. All 5 PPD variants share similar histologic findings, including a vasculocentric lymphocytic infiltrate in the papillary dermis, swelling of the endothelial cells, erythrocyte extravasation, and often hemosiderin-laden macrophages.1 Despite these clinical and histopathologic similarities, each variant contains additional distinctive features, such as telangiectasia (purpura annularis telangiectodes of Majocchi), a lichenoid infiltrate (pigmented purpuric lichenoid dermatitis of Gougerot and Blum), eczematous changes (eczematoidlike purpura of Doucas and Kapetanakis), and marked hemosiderin deposition (lichen aureus).
Granulomatous pigmented purpuric dermatosis (GPPD) is a rare variant of PPD.3-7 Clinically, these lesions appear similar to other PPDs; however, in addition to the characteristic changes associated with conventional PPD, histologic examination of GPPD reveals a granulomatous inflammatory reaction pattern. Although the pathogenesis of GPPD is not well understood, its association with hyperlipidemia may suggest a granulomatous response to capillaritis mediated by lipid deposition in the microvasculature.6,7
We present 3 cases of GPPD and provide a review of the literature. In all of our patients, biopsy specimens were fixed in 10% buffered formalin and embedded in paraffin by standard methodologies, and all stains were performed on sections by standard methodologies. Based on a PubMed search of articles indexed for MEDLINE using the terms granulomatous pigmented purpuric dermatosis, sarcoidosis, pigmented purpuric dermatosis, granulomas, and pigmented purpuric dermatosis, we review 5 additional reports describing 10 total patients.3-7
Case Reports
Patient 1
A 9-year-old white boy presented with a 3-cm asymptomatic light brown patch with a nonblanching violaceous center on the right posterior thigh that was studded with pinpoint yellow papules (Figure, A). The lesion appeared 3 to 4 years prior to presentation but had become progressively darker and centrally indurated over the last 2 years. The patient and his mother denied any history of trauma to the area. His medical history was unremarkable, and his current medications included fish oil and multivitamin tablets.
Histologic examination of a punch biopsy specimen taken from the center of the lesion revealed a lichenoid lymphohistiocytic infiltrate with marked red blood cell (RBC) extravasation and associated hemosiderin-laden macrophages. The lymphocytes comprising this infiltrate lacked cytologic atypia and exhibited minimal epidermotropism (Figure, B). Additionally, there was a superficial and deep perivascular mononuclear inflammatory infiltrate intermixed with numerous small granulomas comprised ofepithelioid histiocytes in the mid and deep dermis (Figure, C). Periodic acid–Schiff, acid-fast bacilli (AFB), and Fite stains were negative for organisms. Polarization was negative for refractile foreign material. Due to the patient’s age, no treatment was performed, and the lesion remains unchanged 1 year after biopsy.
Patient 2
A 49-year-old white woman presented with a 2-cm yellow-brown patch with a faint, nonblanchable, violaceous center on the right lateral thigh of 4 months’ duration. The patch initially appeared as a small asymptomatic purple papule. The patient denied any history of trauma to the area. A purified protein derivative (tuberculin) skin test was negative at the time of examination. The patient’s medical history was remarkable for renal calculi. Her current medications included progesterone; estradiol; lansoprazole; prenatal vitamins; vitamins C and E; zinc; and calcium. The patient had no family history of sarcoidosis. Complete blood cell count, urinalysis, liver function tests, and angiotensin-converting enzyme levels were unremarkable. Pulmonary function tests were normal, and there was no evidence of sarcoidosis on chest radiography. Initial biopsy of the lesion revealed a perivascular and interstitial lymphohistiocytic infiltrate with abundant extravasated RBCs in the papillary dermis (Figure, D). Similar to patient 1, the infiltrate lacked cytologic atypia and did not involve the overlying epidermis. There was perivascular granulomatous inflammation in the mid dermis (Figure, E). Periodic acid–Schiff, Warthin-Starry, and AFB stains were negative for organisms. Polarization was negative for refractile foreign material.
The lesion was treated with clobetasol propionate ointment 0.05% twice daily for 6 weeks with transient improvement, but the lesion recurred upon treatment cessation. Subsequent treatment with intralesional triamcinolone resulted in slight improvement of the lesion. A therapeutic trial of targeted pulsed dye laser treatment was ineffective. The lesion gradually increased in size over the next year with no therapy, and a repeat biopsy revealed a lichenoid lymphohistiocytic infiltrate with abundant extravasated RBCs consistent with persistent PPD. A granulomatous infiltrate was not evident in the superficial shave biopsy specimen.
Patient 3
A 75-year-old white woman presented with scattered, speckled, cayenne pepper–like, red-brown macules on the legs. Two years prior to presentation, a few scattered symmetrical macules appeared on the dorsal aspects of the feet, which gradually increased in number to form larger confluent patches that spread to the lower legs. The patient denied itching or burning but reported that the patches became painful when scratched and were aggravated by sun exposure. Her medical history was remarkable for asthma, chronic renal insufficiency, coronary artery disease, Barrett esophagus, obstructive sleep apnea, hypothyroidism, renal calculi, type 2 diabetes mellitus, and hyperlipidemia. Her current medications included carvedilol, valsartan, levothyroxine, aspirin, clopidogrel, furosemide, nitrofurantoin, temazepam, insulin, ezetimibe-simvastatin, and lansoprazole. Computed tomography of the chest revealed no signs of sarcoidosis. Pulmonary function tests revealed moderate obstructive lung disease. An ophthalmology examination showed no evidence of sarcoidosis. Laboratory results revealed an elevated glucose, blood urea nitrogen, creatinine, and triglyceride levels, as well as low hematocrit and vitamin D levels. Urinalysis, thyroid-stimulating hormone (thyrotropin) test, liver function tests, angiotensin-converting enzyme test, hepatitis B surface antigen, and IFN-g release assay were normal.
Histologic examination of a punch biopsy specimen revealed an inflammatory infiltrate confined to the papillary dermis. This infiltrate was comprised of an admixture of lymphocytes and histiocytes in a perivascular distribution with associated RBC extravasation and intimately associated granulomas (Figure, F). Additional inflammation in the deeper aspects of the dermis was not identified. Periodic acid–Schiff, AFB, and Fite stains were negative for organisms. Polarization was negative for refractile foreign material.

| 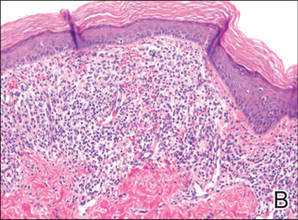
| 
| ||
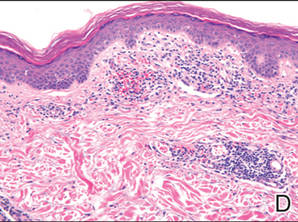
| 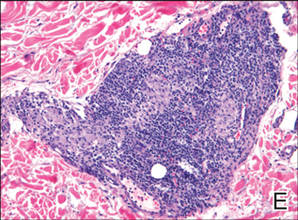
| 
| ||
| A 3-cm asymptomatic light brown patch with a nonblanching violaceous center on the right posterior thigh that was studded with pinpoint yellow papules (A). Lichenoid lymphohistiocytic infiltrate in the papillary dermis with marked red blood cell extravasation (B)(H&E, original magnification ×20). Superficial and deep perivascular mononuclear inflammatory infiltrate intermixed with numerous small granulomas comprised of epithelioid histiocytes in the mid and deep dermis (C)(H&E, original magnification ×20). Perivascular and interstitial lymphohistiocytic infiltrate with abundant extravasated red blood cells in the papillary dermis (D)(H&E, original magnification ×10). Perivascular lymphohistiocytic inflammation with epithelioid granulomas in the mid dermis (E)(H&E, original magnification ×20). Lymphohistiocytic inflammation in the papillary dermis comprised of an admixture of lymphocytes and histiocytes in a perivascular distribution with associated red blood cell extravasation and intimately associated granulomas (F)(H&E, original magnification ×20). | ||||
The patient was treated with topical steroids and minocycline 50 mg twice daily without improvement. The lesions improved after the patient underwent treatment with oral corticosteroids for pulmonary disease.
Comment
Pigmented purpuric dermatoses comprise a spectrum of clinical and pathologic conditions.1,2 Granulomatous PPD is a much less common variant, characterized by a granulomatous infiltrate admixed with PPD. We report 3 additional cases and review the literature on this rare and interesting variant of PPD.
We noted several unifying clinicopathologic features among our patients and those previously reported in the literature (Table).3-7 Including our cases, our review yielded 13 GPPD patients ranging in age from 9 to 75 years, with a mean age of 49.1 years. Two of our patients—patients 1 and 3—were the youngest and oldest patients, respectively, among the cases we reviewed. The majority of the cases we reviewed included patients of East Asian descent (6 Taiwanese; 2 Japanese; 1 Korean) as well as 4 white patients. No distinctive gender predilection was apparent, as our review included 8 females and 5 males.
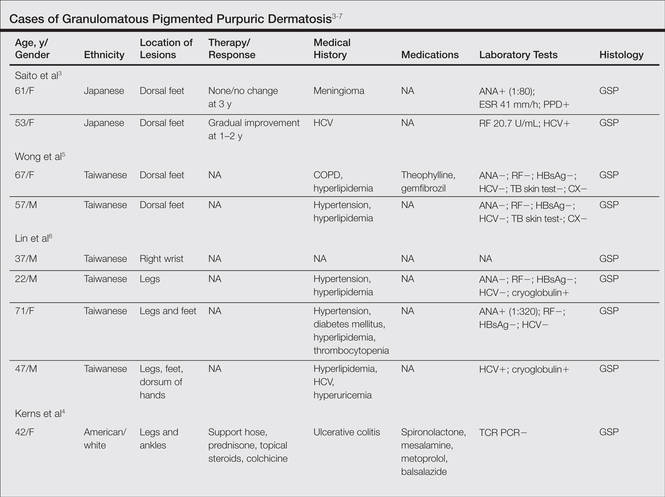
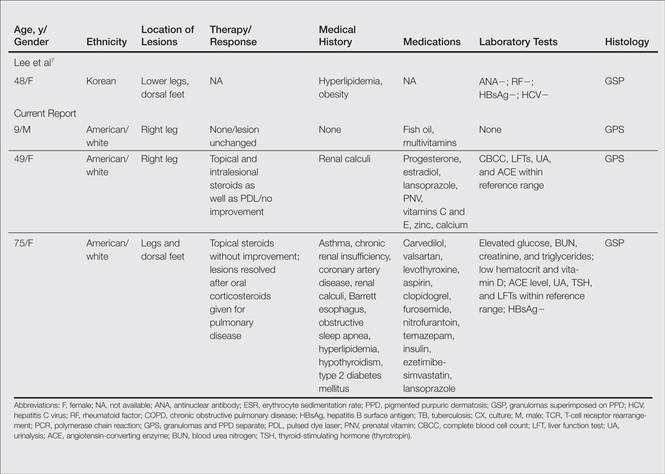
Our review revealed that GPPD lesions typically involve the lower extremities and usually are asymptomatic, with the exception of occasional pruritus. Additional lesions have been reported on the dorsal aspect of the hands, and 1 case noted exclusive involvement of the wrist.6 Lesions of GPPD can range in their clinical appearance. Three of 13 patients presented with purpuric papules and 2 had brown pigmentation with hemorrhagic papules3,4,6; the remaining 8 patients had erythematous or brown macules, papules, or plaques.5-7 The most commonly associated disease condition was hyperlipidemia, which was reported in 7 of 13 cases.5-7 Additional reported comorbidities included meningioma, renal calculi, obesity, hypertension, diabetes mellitus, chronic obstructive pulmonary disease, hepatitis C virus, ulcerative colitis, thrombocytopenia, and hyperuricemia. Reported serologic abnormalities included a rare positive antinuclear antibody, rheumatoid factor, and cryoglobulins.3,6 Therapeutic efficacy in the management of GPPD has not been well described; however, for the rare cases in which therapies were described, they were largely unsuccessful, with 1 patient exhibiting spontaneous improvement.3,4
Granulomatous PPD also appears to exhibit a range of histologic findings. All cases of GPPD shared fundamental components, such as a brisk perivascular infiltrate accompanied by RBC extravasation with variable hemosiderin-laden macrophages and a granulomatous infiltrate. All of the reports we reviewed described an intimate association between these components, with the granulomas being essentially superimposed on typical PPD. As for other types of PPD, obvious vasculitis characterized by a vasculocentric inflammatory infiltrate and evidence of vascular injury, such as fibrinoid necrosis of the vessel wall, has not been described in GPPD.3-7 Finally, histologic changes suggestive of a relationship with cutaneous T-cell lymphoma, cytologic atypia, and epidermotropism have been described for some forms of PPD but have not been described for GPPD.3-8
Our case reports expand the histologic spectrum of GPPD. Although patient 3 exhibited a relatively intimate association of granulomas and PPD, 2 of our cases (patients 1 and 2) demonstrated a granulomatous infiltrate in the mid to deep dermis, which is separate from the more superficially situated lichenoid lymphohistiocytic infiltrate, RBC extravasation, and hemosiderin-laden macrophages noted in the papillary dermis. Considered along with the absence of an obvious clinicopathologic explanation for the granulomatous infiltrates (eg, polarizable material, infectious organisms, systemic disease), these 2 cases (patients 1 and 2) suggest a composite form of PPD that combines the lichenoid pattern of PPD of Gougerot and Blum with a deep granulomatous component of GPPD. The importance of this distinction lies in the potential for physicians to overlook this potentially informative histologic pattern if only a superficial biopsy is performed. The clinical relevance is unclear; however, in our experience, it has been challenging to treat this relatively small subset of patients who have exhibited a limited response to treatment with topical steroids, intralesional steroids, pulsed dye laser, and vitamin supplementation.
The cause of the granulomatous infiltrate in GPPD is poorly understood. Seven of 13 cases included in our review occurred in patients with a history of hyperlipidemia.5-7 Some have postulated that the constellation of findings of GPPD in hyperlipidemic patients reflects an underlying vascular injury process induced by lipid deposition in the endothelial cells with subsequent RBC extravasation and a secondary granulomatous response to the lipid deposits.6,7 However, given the occurrence of GPPD in patients without hyperlipidemia, other mechanisms also must be considered in the pathogenesis of GPPD, including a reaction to medications, systemic diseases, and infectious etiologies (eg, hepatitis B virus).4,6 As additional cases are described in the literature, other unifying clinical etiologies for this histopathologic reaction pattern may emerge.
Conclusion
Granulomatous PPD may comprise an underrecognized variant of PPD in cases when only a superficial biopsy is evaluated. Clinicians and pathologists should be aware of this variant, and in refractory cases of PPD, deeper sampling may be warranted to identify granulomas.
1. Sardana K, Sarkar R, Sehgal VN. Pigmented purpuric dermatoses: an overview. Int J Dermatol. 2004;43:482-488.
2. Piette WW. Purpura: mechanisms and differential diagnosis. In: Bolognia JL, Jorizzo JL, Rapini RP, eds. Dermatology. 2nd ed. London, England: Mosby; 2008:321-330.
3. Saito R, Matsuoka Y. Granulomatous pigmented purpuric dermatosis. J Dermatol. 1996;23:551-555.
4. Kerns MJ, Mallatt BD, Shamma HN. Granulomatous pigmented purpura: an unusual histological variant. Am J Dermatopathol. 2009;31:77-80.
5. Wong WR, Kuo TT, Chen MJ, et al. Granulomatous variant of chronic pigmented purpuric dermatosis: report of two cases. Br J Dermatol. 2001;145:162-164.
6. Lin WL, Kou TT, Shih PY, et al. Granulomatous variant of chronic pigmented purpuric dermatoses: report of four new cases and an association with hyperlipidaemia [published online ahead of print May 29, 2007]. Clin Exp Dermatol. 2007;32:513-515.
7. Lee SH, Kwon JE, Lee KG, et al. Granulomatous variant of chronic pigmented purpuric dermatosis associated with hyperlipidemia. J Eur Acad Dermatol Venereol. 2010;24:1243-1245.
8. Toro JR, Sander CA, LeBoit PE. Persistent pigmented dermatoses and mycosis fungoides: simulant, precursor, or both? a study by light microscopy and molecular methods. Am J Dermatopathol. 1997;19:108-118.
Pigmented purpuric dermatoses (PPDs) are a group of common chronic disorders characterized by speckled, cayenne pepper–like petechiae and orange-brown discoloration of the skin resulting from capillaritis.1 Pigmented purpuric dermatoses typically occur in the absence of underlying vascular insufficiency or other hematologic dysfunction. The 5 well-known clinicopathologic variants of PPD include Schamberg disease; purpura annularis telangiectodes of Majocchi; pigmented purpuric lichenoid dermatitis of Gougerot and Blum; eczematoidlike purpura of Doucas and Kapetanakis; and lichen aureus.2 All PPDs share common characteristic clinical and histologic features. Clinically, patients generally present with symmetric petechiae and/or pigmented macules. All 5 PPD variants share similar histologic findings, including a vasculocentric lymphocytic infiltrate in the papillary dermis, swelling of the endothelial cells, erythrocyte extravasation, and often hemosiderin-laden macrophages.1 Despite these clinical and histopathologic similarities, each variant contains additional distinctive features, such as telangiectasia (purpura annularis telangiectodes of Majocchi), a lichenoid infiltrate (pigmented purpuric lichenoid dermatitis of Gougerot and Blum), eczematous changes (eczematoidlike purpura of Doucas and Kapetanakis), and marked hemosiderin deposition (lichen aureus).
Granulomatous pigmented purpuric dermatosis (GPPD) is a rare variant of PPD.3-7 Clinically, these lesions appear similar to other PPDs; however, in addition to the characteristic changes associated with conventional PPD, histologic examination of GPPD reveals a granulomatous inflammatory reaction pattern. Although the pathogenesis of GPPD is not well understood, its association with hyperlipidemia may suggest a granulomatous response to capillaritis mediated by lipid deposition in the microvasculature.6,7
We present 3 cases of GPPD and provide a review of the literature. In all of our patients, biopsy specimens were fixed in 10% buffered formalin and embedded in paraffin by standard methodologies, and all stains were performed on sections by standard methodologies. Based on a PubMed search of articles indexed for MEDLINE using the terms granulomatous pigmented purpuric dermatosis, sarcoidosis, pigmented purpuric dermatosis, granulomas, and pigmented purpuric dermatosis, we review 5 additional reports describing 10 total patients.3-7
Case Reports
Patient 1
A 9-year-old white boy presented with a 3-cm asymptomatic light brown patch with a nonblanching violaceous center on the right posterior thigh that was studded with pinpoint yellow papules (Figure, A). The lesion appeared 3 to 4 years prior to presentation but had become progressively darker and centrally indurated over the last 2 years. The patient and his mother denied any history of trauma to the area. His medical history was unremarkable, and his current medications included fish oil and multivitamin tablets.
Histologic examination of a punch biopsy specimen taken from the center of the lesion revealed a lichenoid lymphohistiocytic infiltrate with marked red blood cell (RBC) extravasation and associated hemosiderin-laden macrophages. The lymphocytes comprising this infiltrate lacked cytologic atypia and exhibited minimal epidermotropism (Figure, B). Additionally, there was a superficial and deep perivascular mononuclear inflammatory infiltrate intermixed with numerous small granulomas comprised ofepithelioid histiocytes in the mid and deep dermis (Figure, C). Periodic acid–Schiff, acid-fast bacilli (AFB), and Fite stains were negative for organisms. Polarization was negative for refractile foreign material. Due to the patient’s age, no treatment was performed, and the lesion remains unchanged 1 year after biopsy.
Patient 2
A 49-year-old white woman presented with a 2-cm yellow-brown patch with a faint, nonblanchable, violaceous center on the right lateral thigh of 4 months’ duration. The patch initially appeared as a small asymptomatic purple papule. The patient denied any history of trauma to the area. A purified protein derivative (tuberculin) skin test was negative at the time of examination. The patient’s medical history was remarkable for renal calculi. Her current medications included progesterone; estradiol; lansoprazole; prenatal vitamins; vitamins C and E; zinc; and calcium. The patient had no family history of sarcoidosis. Complete blood cell count, urinalysis, liver function tests, and angiotensin-converting enzyme levels were unremarkable. Pulmonary function tests were normal, and there was no evidence of sarcoidosis on chest radiography. Initial biopsy of the lesion revealed a perivascular and interstitial lymphohistiocytic infiltrate with abundant extravasated RBCs in the papillary dermis (Figure, D). Similar to patient 1, the infiltrate lacked cytologic atypia and did not involve the overlying epidermis. There was perivascular granulomatous inflammation in the mid dermis (Figure, E). Periodic acid–Schiff, Warthin-Starry, and AFB stains were negative for organisms. Polarization was negative for refractile foreign material.
The lesion was treated with clobetasol propionate ointment 0.05% twice daily for 6 weeks with transient improvement, but the lesion recurred upon treatment cessation. Subsequent treatment with intralesional triamcinolone resulted in slight improvement of the lesion. A therapeutic trial of targeted pulsed dye laser treatment was ineffective. The lesion gradually increased in size over the next year with no therapy, and a repeat biopsy revealed a lichenoid lymphohistiocytic infiltrate with abundant extravasated RBCs consistent with persistent PPD. A granulomatous infiltrate was not evident in the superficial shave biopsy specimen.
Patient 3
A 75-year-old white woman presented with scattered, speckled, cayenne pepper–like, red-brown macules on the legs. Two years prior to presentation, a few scattered symmetrical macules appeared on the dorsal aspects of the feet, which gradually increased in number to form larger confluent patches that spread to the lower legs. The patient denied itching or burning but reported that the patches became painful when scratched and were aggravated by sun exposure. Her medical history was remarkable for asthma, chronic renal insufficiency, coronary artery disease, Barrett esophagus, obstructive sleep apnea, hypothyroidism, renal calculi, type 2 diabetes mellitus, and hyperlipidemia. Her current medications included carvedilol, valsartan, levothyroxine, aspirin, clopidogrel, furosemide, nitrofurantoin, temazepam, insulin, ezetimibe-simvastatin, and lansoprazole. Computed tomography of the chest revealed no signs of sarcoidosis. Pulmonary function tests revealed moderate obstructive lung disease. An ophthalmology examination showed no evidence of sarcoidosis. Laboratory results revealed an elevated glucose, blood urea nitrogen, creatinine, and triglyceride levels, as well as low hematocrit and vitamin D levels. Urinalysis, thyroid-stimulating hormone (thyrotropin) test, liver function tests, angiotensin-converting enzyme test, hepatitis B surface antigen, and IFN-g release assay were normal.
Histologic examination of a punch biopsy specimen revealed an inflammatory infiltrate confined to the papillary dermis. This infiltrate was comprised of an admixture of lymphocytes and histiocytes in a perivascular distribution with associated RBC extravasation and intimately associated granulomas (Figure, F). Additional inflammation in the deeper aspects of the dermis was not identified. Periodic acid–Schiff, AFB, and Fite stains were negative for organisms. Polarization was negative for refractile foreign material.
|
|
|
| ||
|
|
|
| ||
| A 3-cm asymptomatic light brown patch with a nonblanching violaceous center on the right posterior thigh that was studded with pinpoint yellow papules (A). Lichenoid lymphohistiocytic infiltrate in the papillary dermis with marked red blood cell extravasation (B)(H&E, original magnification ×20). Superficial and deep perivascular mononuclear inflammatory infiltrate intermixed with numerous small granulomas comprised of epithelioid histiocytes in the mid and deep dermis (C)(H&E, original magnification ×20). Perivascular and interstitial lymphohistiocytic infiltrate with abundant extravasated red blood cells in the papillary dermis (D)(H&E, original magnification ×10). Perivascular lymphohistiocytic inflammation with epithelioid granulomas in the mid dermis (E)(H&E, original magnification ×20). Lymphohistiocytic inflammation in the papillary dermis comprised of an admixture of lymphocytes and histiocytes in a perivascular distribution with associated red blood cell extravasation and intimately associated granulomas (F)(H&E, original magnification ×20). | ||||
The patient was treated with topical steroids and minocycline 50 mg twice daily without improvement. The lesions improved after the patient underwent treatment with oral corticosteroids for pulmonary disease.
Comment
Pigmented purpuric dermatoses comprise a spectrum of clinical and pathologic conditions.1,2 Granulomatous PPD is a much less common variant, characterized by a granulomatous infiltrate admixed with PPD. We report 3 additional cases and review the literature on this rare and interesting variant of PPD.
We noted several unifying clinicopathologic features among our patients and those previously reported in the literature (Table).3-7 Including our cases, our review yielded 13 GPPD patients ranging in age from 9 to 75 years, with a mean age of 49.1 years. Two of our patients—patients 1 and 3—were the youngest and oldest patients, respectively, among the cases we reviewed. The majority of the cases we reviewed included patients of East Asian descent (6 Taiwanese; 2 Japanese; 1 Korean) as well as 4 white patients. No distinctive gender predilection was apparent, as our review included 8 females and 5 males.
Our review revealed that GPPD lesions typically involve the lower extremities and usually are asymptomatic, with the exception of occasional pruritus. Additional lesions have been reported on the dorsal aspect of the hands, and 1 case noted exclusive involvement of the wrist.6 Lesions of GPPD can range in their clinical appearance. Three of 13 patients presented with purpuric papules and 2 had brown pigmentation with hemorrhagic papules3,4,6; the remaining 8 patients had erythematous or brown macules, papules, or plaques.5-7 The most commonly associated disease condition was hyperlipidemia, which was reported in 7 of 13 cases.5-7 Additional reported comorbidities included meningioma, renal calculi, obesity, hypertension, diabetes mellitus, chronic obstructive pulmonary disease, hepatitis C virus, ulcerative colitis, thrombocytopenia, and hyperuricemia. Reported serologic abnormalities included a rare positive antinuclear antibody, rheumatoid factor, and cryoglobulins.3,6 Therapeutic efficacy in the management of GPPD has not been well described; however, for the rare cases in which therapies were described, they were largely unsuccessful, with 1 patient exhibiting spontaneous improvement.3,4
Granulomatous PPD also appears to exhibit a range of histologic findings. All cases of GPPD shared fundamental components, such as a brisk perivascular infiltrate accompanied by RBC extravasation with variable hemosiderin-laden macrophages and a granulomatous infiltrate. All of the reports we reviewed described an intimate association between these components, with the granulomas being essentially superimposed on typical PPD. As for other types of PPD, obvious vasculitis characterized by a vasculocentric inflammatory infiltrate and evidence of vascular injury, such as fibrinoid necrosis of the vessel wall, has not been described in GPPD.3-7 Finally, histologic changes suggestive of a relationship with cutaneous T-cell lymphoma, cytologic atypia, and epidermotropism have been described for some forms of PPD but have not been described for GPPD.3-8
Our case reports expand the histologic spectrum of GPPD. Although patient 3 exhibited a relatively intimate association of granulomas and PPD, 2 of our cases (patients 1 and 2) demonstrated a granulomatous infiltrate in the mid to deep dermis, which is separate from the more superficially situated lichenoid lymphohistiocytic infiltrate, RBC extravasation, and hemosiderin-laden macrophages noted in the papillary dermis. Considered along with the absence of an obvious clinicopathologic explanation for the granulomatous infiltrates (eg, polarizable material, infectious organisms, systemic disease), these 2 cases (patients 1 and 2) suggest a composite form of PPD that combines the lichenoid pattern of PPD of Gougerot and Blum with a deep granulomatous component of GPPD. The importance of this distinction lies in the potential for physicians to overlook this potentially informative histologic pattern if only a superficial biopsy is performed. The clinical relevance is unclear; however, in our experience, it has been challenging to treat this relatively small subset of patients who have exhibited a limited response to treatment with topical steroids, intralesional steroids, pulsed dye laser, and vitamin supplementation.
The cause of the granulomatous infiltrate in GPPD is poorly understood. Seven of 13 cases included in our review occurred in patients with a history of hyperlipidemia.5-7 Some have postulated that the constellation of findings of GPPD in hyperlipidemic patients reflects an underlying vascular injury process induced by lipid deposition in the endothelial cells with subsequent RBC extravasation and a secondary granulomatous response to the lipid deposits.6,7 However, given the occurrence of GPPD in patients without hyperlipidemia, other mechanisms also must be considered in the pathogenesis of GPPD, including a reaction to medications, systemic diseases, and infectious etiologies (eg, hepatitis B virus).4,6 As additional cases are described in the literature, other unifying clinical etiologies for this histopathologic reaction pattern may emerge.
Conclusion
Granulomatous PPD may comprise an underrecognized variant of PPD in cases when only a superficial biopsy is evaluated. Clinicians and pathologists should be aware of this variant, and in refractory cases of PPD, deeper sampling may be warranted to identify granulomas.
1. Sardana K, Sarkar R, Sehgal VN. Pigmented purpuric dermatoses: an overview. Int J Dermatol. 2004;43:482-488.
2. Piette WW. Purpura: mechanisms and differential diagnosis. In: Bolognia JL, Jorizzo JL, Rapini RP, eds. Dermatology. 2nd ed. London, England: Mosby; 2008:321-330.
3. Saito R, Matsuoka Y. Granulomatous pigmented purpuric dermatosis. J Dermatol. 1996;23:551-555.
4. Kerns MJ, Mallatt BD, Shamma HN. Granulomatous pigmented purpura: an unusual histological variant. Am J Dermatopathol. 2009;31:77-80.
5. Wong WR, Kuo TT, Chen MJ, et al. Granulomatous variant of chronic pigmented purpuric dermatosis: report of two cases. Br J Dermatol. 2001;145:162-164.
6. Lin WL, Kou TT, Shih PY, et al. Granulomatous variant of chronic pigmented purpuric dermatoses: report of four new cases and an association with hyperlipidaemia [published online ahead of print May 29, 2007]. Clin Exp Dermatol. 2007;32:513-515.
7. Lee SH, Kwon JE, Lee KG, et al. Granulomatous variant of chronic pigmented purpuric dermatosis associated with hyperlipidemia. J Eur Acad Dermatol Venereol. 2010;24:1243-1245.
8. Toro JR, Sander CA, LeBoit PE. Persistent pigmented dermatoses and mycosis fungoides: simulant, precursor, or both? a study by light microscopy and molecular methods. Am J Dermatopathol. 1997;19:108-118.
Practice Points
- Consider a punch biopsy when sampling suspected inflammatory dermatoses, such as pigmented purpuric dermatosis, to allow deeper sampling.
- Provide all clinical details to the dermatopathologist to assist with clinicopathologic correlation and diagnostic accuracy.
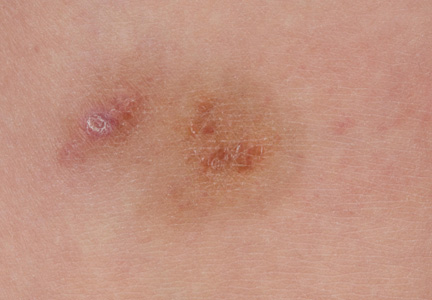
Should LCZ696 receive a level I indication?
LAS VEGAS – Additional findings from the landmark PARADIGM-HF trial presented at the annual meeting of the Heart Failure Society of America provided what many observers deemed a persuasive case for the novel angiotensin receptor neprilysin inhibitor known for now as LCZ696 as deserving of a level I indication in the next update of the major heart failure management guidelines.

At a special session added late to the meeting program in the wake of the spectacularly positive top-line results of PARADIGM-HF presented just a few weeks earlier at the European Society of Cardiology meeting in Barcelona, an international panel of heart failure heavyweights tackled questions about the study’s implications, including whether the results need replication in a second randomized controlled trial before LCZ696 can win regulatory approval. And once approved, should guidelines committees give it a level I, must-use indication? How applicable are the PARADIGM-HF results to the broader population of heart failure patients, and in particular black patients and older individuals with class III/IV heart failure? And what about patients with heart failure with preserved ejection fraction (HFpEF) ?
In other words, does PARADIGM-HF, with more than 8,400 randomized subjects, represent a true paradigm shift in heart failure management?
For coprincipal investigator Dr. Milton Packer, the answer is a resounding yes.
“For the past 25 years, the magnitude of the effect of ACE inhibitors on cardiovascular mortality – about an 18% reduction – has created an ethical mandate for their use in all patients with chronic heart failure who could tolerate treatment with these drugs. The finding that LCZ696 has a 20% greater effect on cardiovascular mortality than ACE inhibitors strongly supports the conclusion that LCZ696 should replace the current use of ACE inhibitors and angiotensin receptor blockers in the management of chronic heart failure,” said Dr. Packer, professor and chair of the department of clinical sciences at University of Texas Southwestern Medical Center, Dallas.

His coprincipal investigator, Dr. John J.V. McMurray, cited the statistical strength of the PARADIGM-HF results for the primary composite outcome of cardiovascular death or heart failure hospitalization, which had an extraordinary P value of .0000004, in making the case that the trial findings are sufficient to win regulatory approval without a confirmatory study.
He noted that the regulatory standard in the United States and Europe is that a positive clinical trial having a P value of less than .05 requires replication in a second study that also yields outcomes with a P value of less than .05.
“If, however, you have a large single trial, you can win approval by meeting a standard of P less than .00125. The strength of the result of PARADIGM-HF, with a P of .0000004, is equivalent to between four and five single trials replicated at P less than .05. And for the endpoint of cardiovascular mortality, where the PARADIGM-HF result was significant at a P of .00008, that’s equivalent to between two and three trials replicated at P less than .05. So in my view PARADIGM-HF easily meets the criteria for a level IA indication,” said Dr. McMurray, professor of cardiology at the University of Glasgow.
He presented for the first time a new analysis with a major wow factor. This was an imputed placebo analysis providing the answer to a question many cardiologists have asked him since the presentation of the top-line PARADIGM-HF results in Barcelona: namely, how would LCZ696 have stacked up in a placebo-controlled trial?
Such a study wouldn’t be ethical now, of course, but it’s possible to make inferences by comparing LCZ696’s superiority to enalapril at 10 mg b.i.d. in PARADIGM-HF to enalapril’s performance at the same dose relative to placebo in the earlier 2,569-patient SOLVD-Treatment trial, which featured the same composite primary endpoint (N. Engl. J. Med. 1991;325:293-302).
In SOLVD-Treatment, enalapril resulted in a 28% relative risk reduction in the composite endpoint, compared with placebo. Through indirect comparison, LCZ696 would have an imputed 43% relative risk reduction, compared with placebo. For the endpoint of cardiovascular mortality, enalapril showed a 17% risk reduction relative to placebo; when the PARADIGM-HF results are factored in, this translates to an inferred 34% relative risk reduction for LCZ696 versus placebo.
Similarly, in the CHARM-Alternative trial (Lancet 2003;362:772-6), which featured 2,028 patients on more contemporary guideline–recommended background therapy than in SOLVD-Treatment, patients on the angiotensin receptor blocker candesartan showed a 23% relative risk reduction in the composite endpoint, compared with placebo, along with a 15% reduction in cardiovascular mortality. In the imputed placebo analysis, this translated to relative risk reductions of 49% and 34%, respectively, for LCZ696 versus placebo.
“We see a doubling in the reduction in cardiovascular mortality with this new therapy over and above that obtained with an ACE inhibitor or ARB [angiotensin receptor blocker],” Dr. McMurray emphasized.
Panelist Dr. Lynne W. Stevenson wasn’t convinced.
“I don’t believe it is time to replace ACE inhibitors and ARBs. I don’t think LCZ696 is ready for a level I [treatment should be performed] indication; that is a higher bar. ... I think we could see a level IIa [treatment is reasonable to perform] indication based on the strong results that we’ve seen,” said Dr. Stevenson, director of the heart failure and cardiomyopathy program at Brigham and Women’s Hospital and professor of medicine at Harvard Medical School, Boston.
She estimated that fewer than 10% of U.S. heart failure patients fit the description of PARADIGM-HF participants, with mild to moderate heart failure with reduced ejection fraction. Importantly, the run-in process employed in the study ensured that only patients with a demonstrated ability to tolerate enalapril in therapeutic doses were enrolled. And even in that filtered population, there was a substantial dropout rate in the LCZ696 arm due to hypotension during follow-up.
“I certainly don’t think we have any information about patients newly diagnosed with heart failure. I don’t think if you put new heart failure patients on LCZ696, they’d necessarily be able to stand up, and if they could stand up I’m not sure we could get them on the appropriate dose of beta blockers,” Dr. Stevenson added.
Noting that only 5% of PARADIGM-HF participants were black, she said that “clearly this is something we will need to watch as we get more experience with this drug, but there was no signal of concern.”
Dr. Marvin A. Konstam, professor of medicine at Tufts University, Boston, shared one of Dr. Stevenson’s concerns: “How do we know what will happen with ACE inhibitor virgins in the real world where you don’t get a run-in period?”
Panelist Dr. John G.F. Cleland said, “I don’t want to second-guess the guideline committees, but surely this must be a IA [data derived from multiple clinical trials or meta-analyses] indication. What intrigues me is what will the indication for ACE inhibitors look like in future guidelines? Is it also going to be IA in the same group of patients? That’s something the guidelines committees are going to have to sort out.”
“A lot of these questions and people’s concerns will either be increased or reduced once we start to get the medicine into clinical practice. What I find quite distressing is that we might be sitting here at this time next year and still not be in a position to prescribe this agent because it may still be going through the regulatory process,” said Dr. Cleland, professor of cardiology at the University of Hull (England).
LAS VEGAS – Additional findings from the landmark PARADIGM-HF trial presented at the annual meeting of the Heart Failure Society of America provided what many observers deemed a persuasive case for the novel angiotensin receptor neprilysin inhibitor known for now as LCZ696 as deserving of a level I indication in the next update of the major heart failure management guidelines.
At a special session added late to the meeting program in the wake of the spectacularly positive top-line results of PARADIGM-HF presented just a few weeks earlier at the European Society of Cardiology meeting in Barcelona, an international panel of heart failure heavyweights tackled questions about the study’s implications, including whether the results need replication in a second randomized controlled trial before LCZ696 can win regulatory approval. And once approved, should guidelines committees give it a level I, must-use indication? How applicable are the PARADIGM-HF results to the broader population of heart failure patients, and in particular black patients and older individuals with class III/IV heart failure? And what about patients with heart failure with preserved ejection fraction (HFpEF) ?
In other words, does PARADIGM-HF, with more than 8,400 randomized subjects, represent a true paradigm shift in heart failure management?
For coprincipal investigator Dr. Milton Packer, the answer is a resounding yes.
“For the past 25 years, the magnitude of the effect of ACE inhibitors on cardiovascular mortality – about an 18% reduction – has created an ethical mandate for their use in all patients with chronic heart failure who could tolerate treatment with these drugs. The finding that LCZ696 has a 20% greater effect on cardiovascular mortality than ACE inhibitors strongly supports the conclusion that LCZ696 should replace the current use of ACE inhibitors and angiotensin receptor blockers in the management of chronic heart failure,” said Dr. Packer, professor and chair of the department of clinical sciences at University of Texas Southwestern Medical Center, Dallas.
His coprincipal investigator, Dr. John J.V. McMurray, cited the statistical strength of the PARADIGM-HF results for the primary composite outcome of cardiovascular death or heart failure hospitalization, which had an extraordinary P value of .0000004, in making the case that the trial findings are sufficient to win regulatory approval without a confirmatory study.
He noted that the regulatory standard in the United States and Europe is that a positive clinical trial having a P value of less than .05 requires replication in a second study that also yields outcomes with a P value of less than .05.
“If, however, you have a large single trial, you can win approval by meeting a standard of P less than .00125. The strength of the result of PARADIGM-HF, with a P of .0000004, is equivalent to between four and five single trials replicated at P less than .05. And for the endpoint of cardiovascular mortality, where the PARADIGM-HF result was significant at a P of .00008, that’s equivalent to between two and three trials replicated at P less than .05. So in my view PARADIGM-HF easily meets the criteria for a level IA indication,” said Dr. McMurray, professor of cardiology at the University of Glasgow.
He presented for the first time a new analysis with a major wow factor. This was an imputed placebo analysis providing the answer to a question many cardiologists have asked him since the presentation of the top-line PARADIGM-HF results in Barcelona: namely, how would LCZ696 have stacked up in a placebo-controlled trial?
Such a study wouldn’t be ethical now, of course, but it’s possible to make inferences by comparing LCZ696’s superiority to enalapril at 10 mg b.i.d. in PARADIGM-HF to enalapril’s performance at the same dose relative to placebo in the earlier 2,569-patient SOLVD-Treatment trial, which featured the same composite primary endpoint (N. Engl. J. Med. 1991;325:293-302).
In SOLVD-Treatment, enalapril resulted in a 28% relative risk reduction in the composite endpoint, compared with placebo. Through indirect comparison, LCZ696 would have an imputed 43% relative risk reduction, compared with placebo. For the endpoint of cardiovascular mortality, enalapril showed a 17% risk reduction relative to placebo; when the PARADIGM-HF results are factored in, this translates to an inferred 34% relative risk reduction for LCZ696 versus placebo.
Similarly, in the CHARM-Alternative trial (Lancet 2003;362:772-6), which featured 2,028 patients on more contemporary guideline–recommended background therapy than in SOLVD-Treatment, patients on the angiotensin receptor blocker candesartan showed a 23% relative risk reduction in the composite endpoint, compared with placebo, along with a 15% reduction in cardiovascular mortality. In the imputed placebo analysis, this translated to relative risk reductions of 49% and 34%, respectively, for LCZ696 versus placebo.
“We see a doubling in the reduction in cardiovascular mortality with this new therapy over and above that obtained with an ACE inhibitor or ARB [angiotensin receptor blocker],” Dr. McMurray emphasized.
Panelist Dr. Lynne W. Stevenson wasn’t convinced.
“I don’t believe it is time to replace ACE inhibitors and ARBs. I don’t think LCZ696 is ready for a level I [treatment should be performed] indication; that is a higher bar. ... I think we could see a level IIa [treatment is reasonable to perform] indication based on the strong results that we’ve seen,” said Dr. Stevenson, director of the heart failure and cardiomyopathy program at Brigham and Women’s Hospital and professor of medicine at Harvard Medical School, Boston.
She estimated that fewer than 10% of U.S. heart failure patients fit the description of PARADIGM-HF participants, with mild to moderate heart failure with reduced ejection fraction. Importantly, the run-in process employed in the study ensured that only patients with a demonstrated ability to tolerate enalapril in therapeutic doses were enrolled. And even in that filtered population, there was a substantial dropout rate in the LCZ696 arm due to hypotension during follow-up.
“I certainly don’t think we have any information about patients newly diagnosed with heart failure. I don’t think if you put new heart failure patients on LCZ696, they’d necessarily be able to stand up, and if they could stand up I’m not sure we could get them on the appropriate dose of beta blockers,” Dr. Stevenson added.
Noting that only 5% of PARADIGM-HF participants were black, she said that “clearly this is something we will need to watch as we get more experience with this drug, but there was no signal of concern.”
Dr. Marvin A. Konstam, professor of medicine at Tufts University, Boston, shared one of Dr. Stevenson’s concerns: “How do we know what will happen with ACE inhibitor virgins in the real world where you don’t get a run-in period?”
Panelist Dr. John G.F. Cleland said, “I don’t want to second-guess the guideline committees, but surely this must be a IA [data derived from multiple clinical trials or meta-analyses] indication. What intrigues me is what will the indication for ACE inhibitors look like in future guidelines? Is it also going to be IA in the same group of patients? That’s something the guidelines committees are going to have to sort out.”
“A lot of these questions and people’s concerns will either be increased or reduced once we start to get the medicine into clinical practice. What I find quite distressing is that we might be sitting here at this time next year and still not be in a position to prescribe this agent because it may still be going through the regulatory process,” said Dr. Cleland, professor of cardiology at the University of Hull (England).
EXPERT OPINION FROM THE HFSA ANNUAL SCIENTIFIC MEETING
