User login
Apixaban gets European approval for DVT, PE

Credit: Kevin MacKenzie
The European Commission has approved apixaban (Eliquis) to treat and prevent deep vein thrombosis (DVT) and pulmonary embolism (PE).
The approval applies to all European Union (EU) member states, as well as Iceland and Norway.
Apixaban was already approved in the EU to prevent venous thromboembolism (VTE) in adults who have undergone total hip or knee replacement surgery, and to prevent stroke and systemic embolism in adults with nonvalvular atrial fibrillation.
The new marketing authorization for apixaban follows the positive opinion issued by the European Medicines Agency’s Committee for Medicinal Products for Human Use in June and is supported by results of 2 phase 3 clinical trials, AMPLIFY and AMPLIFY-EXT.
Results of AMPLIFY
The AMPLIFY trial included 5395 patients with confirmed, symptomatic DVT or PE requiring treatment for 6 months. They had a mean age of 56.9 years, and 89.8% of randomized patients had unprovoked VTE.
About half of patients (n=2691) were randomized to receive apixaban at 10 mg twice daily for 7 days, followed by 5 mg twice daily for 6 months.
The other half (n=2704) were randomized to the standard of care, which was enoxaparin at 1 mg/kg twice daily for at least 5 days until INR ≥ 2 and warfarin (target INR range 2.0-3.0) for 6 months.
Apixaban proved noninferior to standard therapy in the combined primary endpoint of adjudicated recurrent symptomatic VTE (nonfatal DVT or PE) or VTE-related death.
This outcome occurred in 2.3% of patients in the apixaban arm and 2.7% of patients in the standard-therapy arm (P<0.0001 for noninferiority).
Apixaban also proved superior to standard therapy with regard to bleeding. The composite endpoint of major bleeding and clinically relevant, nonmajor bleeding occurred in 4.3% of patients in the apixaban arm and 9.7% of patients in the standard-therapy arm (P<0.001).
Results of AMPLIFY-EXT
The AMPLIFY-EXT trial included 2486 patients who had completed 6 to 12 months of anticoagulation treatment for DVT or PE. The mean age was 56.7 years, and 91.7% of randomized patients had unprovoked VTE.
Patients were randomized to receive apixaban at 2.5 mg (n=842), apixaban at 5 mg (n=815), or placebo (n=829).
Both apixaban doses were significantly superior to placebo (P<0.001) with regard to the primary efficacy endpoint, which was recurrent VTE or all-cause death.
During the 12-month active study period, these events occurred in 3.8% of patients in the 2.5-mg arm, 4.2% of patients in the 5-mg arm, and 11.6% of patients in the placebo arm.
The primary safety endpoint was the incidence of major bleeding, and there was no significant difference among the treatment arms. Major bleeding occurred in 0.2% of patients in the 2.5-mg arm, 0.1% of patients in the 5-mg arm, and 0.5% of patients in the placebo arm.
About apixaban
Apixaban is approved to reduce the risk of stroke and systemic embolism in adult patients with nonvalvular atrial fibrillation in the US, EU, Japan, and a number of other countries around the world.
The drug is approved to prevent VTE in adult patients who have undergone elective hip or knee replacement surgery in the US, EU, and a number of other countries.
And now, apixaban is approved for the treatment of DVT/PE and the prevention of recurrent DVT/PE in the EU. The drug is not approved for this indication in the US.
Apixaban is under joint development by Pfizer and Bristol-Myers Squibb. ![]()
Obinutuzumab approved for CLL in Europe
The European Commission has approved the anti-CD20 monoclonal antibody obinutuzumab for use in the European Union (EU).
Obinutuzumab can now be used in combination with chlorambucil to treat patients with previously untreated chronic lymphocytic leukemia (CLL) who have comorbidities that make them ineligible to receive fludarabine-based therapy.
Obinutuzumab is already approved for this indication in the US.
Obinutuzumab is marketed as Gazyvaro in the EU and Switzerland but as Gazyva in the US and the rest of the world.
The European Commission’s approval follows a positive opinion granted by The European Medicine Agency’s Committee for Medicinal Products for Human Use in May.
The approval is based on results of the phase 3 CLL11 study, which showed that obinutuzumab plus chlorambucil improved progression-free survival (PFS), when compared to chlorambucil alone or in combination with rituximab.
This 2-stage study included 781 previously untreated CLL patients with comorbidities. In stage 1 (n=589), researchers compared obinutuzumab plus chlorambucil to chlorambucil alone and rituximab plus chlorambucil to chlorambucil alone.
Stage 2 (n=663) was a direct comparison of obinutuzumab plus chlorambucil and rituximab plus chlorambucil.
Stage 1 results were presented at ASCO 2013, stage 2 results were presented at ASH 2013, and the complete results were published in NEJM last March.
Obinutuzumab plus chlorambucil improved PFS when compared to chlorambucil alone. The median PFS was 26.7 months and 11.1 months, respectively (P<0.001).
Obinutuzumab plus chlorambucil also improved PFS when compared to rituximab plus chlorambucil. The median PFS was 26.7 months and 16.3 months, respectively (P<0.001).
Infusion-related reactions and neutropenia were more common in the obinutuzumab arm than in the rituximab arm. But obinutuzumab-treated patients did not have an increased risk of infection.
Obinutuzumab is being developed by Roche. The company said it expects to begin launching the drug in a number of European countries this year. ![]()
Is the United States a proving ground or quagmire for mobile health?
The use of mobile or wireless devices in health care continues to challenge the regulatory landscape. States increasingly are playing a role in either advancing or retracing steps previously taken at the federal level. In the spirit of Ferris Bueller, "isms" have provided a number of opportunities for discussion surrounding mobile health technologies. Federalism remains a key criterion upon which our country creates health care policy – which could serve as a double-edged sword.
On the one hand, it might encourage innovation and provide policy that satisfies the needs of specific constituents. On the other hand, it may create more complexity or even contradict previous policy. The result is often a legal quagmire of wasted time, energy, and money. While policy will never keep pace with technology and innovation, a number of stakeholders are working to bridge the gap.
HIMSS – the Health Information Management System Society – has provided an overview of contemporary issues focused on the state level to advance the use of mobile and wireless devices in health care. Their paper titled "Mobile Health IT in the States: A Policy Perspective"sheds light on a number of potential redundancies in the regulatory system and offers some guidance on other issues.
One major issue gaining plenty of interest among physicians and lawmakers is the ability for mobile devices to facilitate the delivery of health care in a more meaningful, cost effective way. However, whenever disruptive technology begins to upset vested interests, one can expect a robust discussion.
The licensure of physicians and other providers and establishing telehealth standards of care remain substantial obstacles to overcome in the regulatory space. Federal licensure would permit physicians to care for patients across state lines via telehealth delivery systems. Some medical boards of states bordering large metropolitan areas such as Washington, D.C., have entered into reciprocal provider licensing agreements to allow for telehealth encounters.
Reimbursement represents another major obstacle to widespread adoption by providers. Telehealth is primarily a technology approved in certain rural areas under Medicaid. Enter a new age of consumerism in health care, and for a small fee, providers can engage in consultations using your mobile device.
A number of studies have examined the desire for patients to receive care on a mobile device, and not surprisingly, convenience wins out. However, a number of discordant state polices increasingly prohibit the ability to scale many of these innovative and cost-saving approaches to care delivery. The HIMSS paper encourages states to consider health IT, electronic health record (EHR) adoption, telehealth, and mobile health (mHealth) when resourcing and determining coverage for publicly funded health programs such as Medicaid, public health initiatives, and state employee health benefits programs.
Unfortunately, reimbursement for telehealth services for Medicare patients as well is also limited to rural settings defined as "originating sites."
"An originating site is the location of an eligible Medicare beneficiary at the time the service being furnished via a telecommunications system occurs. Medicare beneficiaries are eligible for telehealth services only if they are presented from an originating site located in a rural Health Professional Shortage Area, either located outside of a Metropolitan Statistical Area (MSA) or in a rural census tract, as determined by the Office of Rural Health Policy within the Health Resources and Services Administration (HRSA) or [from] a county outside of an MSA."
Telehealth reimbursement only covers certain specialties and services. Telehealth has been in existence for decades and has been the focus of many outcomes-based studies.
Extending this to mobile technologies such as medical apps remains a challenge due to the lack of evidence. However, I foresee the critical need for such applications, the rapid development of state-of-the-art sensor technologies, and the emergence of analytics to converge and make the success of mobile health technologies a welcome and accepted reality.
Dr. Scher is an electrophysiologist with the Heart Group of Lancaster (Pa.) General Health. He is also director of DLS Healthcare Consulting, Harrisburg, Pa., and clinical associate professor of medicine at the Pennsylvania State University, Hershey.

Access to a Behavioral Weight Loss Website With or Without Group Sessions Increased Weight Loss in Statewide Campaign
Study Overview
Objective. To determine the efficacy and cost-effectiveness of adding an evidence-based internet behavioral weight loss intervention alone or combined with optional group sessions to ShapeUp Rhode Island 2011 (SURI), a 3-month statewide wellness campaign.
Design. 3-arm randomized clinical trial.
Setting and participants. Study participants were recruited from the Rhode Island community via employers, media, and mass mailings at the time of SURI 2011 registration. Of the 3806 participants that joined the weight loss division, 1139 were willing to be contacted for research, and the first 431 were screened for study eligibility. Exclusion criteria were minimal: age < 18 years or > 70 years, body mass index (BMI) < 25 kg/m2, pregnant, nursing, or plans to become pregnant, a serious medical condition (eg, cancer), unreliable internet access, non-English speaking, current or previous participation in our weight loss studies, and planned relocation. Those who reported a medical condition that could interfere with safe participation (eg, diabetes) obtained doctor’s consent to participate. Of those screened, 230 met inclusion criteria, completed orientation procedures, and were randomized using a 1:2:2 randomization scheme to the standard SURI program (S; n = 46); SURI plus internet behavioral weight loss intervention (SI; n = 90); or SURI plus internet behavioral weight loss intervention plus optional group sessions (SIG; n = 94). To avoid contamination, individuals on the same SURI team (see below) were randomized to the same intervention.
Intervention. Participants in the standard SURI program did not receive any behavioral weight loss treatment. SURI is a self-sustaining, annual community campaign designed to help Rhode Islanders lose weight and increase their physical activity through an online, team-based competition. Participants join in teams, enter the weight loss or physical activity division or both, and compete with other teams. Throughout the 3-month program, participants have access to a reporting SURI website where they submit their weekly weight and activity data and view their personal and team progress. They also receive paper logs to record weight and activity, a pedometer, access to newsletters and community workshops, and recognition for meeting goals.
Participants in the SI arm received the 3-month SURI program plus a 3-month internet behavioral weight loss intervention. Before SURI began, SI participants attended a 1-hour group meeting during which they received their weight loss goal (lose 1 to 2 pounds per week), calorie and fat gram goal (starting weight < 250 lbs: 1200–1500 kcal/day, 40–50 g of fat; starting weight ≥ 250 lbs: 1500–1800 kcal/day, 50–60 g of fat), and activity goal (gradually increase to 200 minutes of aerobic activity per week). During this session, participants were also taught self-monitoring skills and oriented to an internet behavioral weight loss intervention website developed by the authors. The intervention website included 12 weekly, 10- to 15-minute multimedia lessons based on the Diabetes Prevention Program and a self-monitoring platform where participants tracked their daily weight, calorie, and activity information. Participants received weekly automated feedback on their progress. The intervention website also included information on meal plans, prepackaged meals, and meal replacements.
Participants in the SIG arm received everything in SI and were additionally given the option to attend weekly group meetings at Miriam Hospital’s Weight Control and Diabetes Research Center during the 3 months. The 12 weekly, optional group sessions were led by masters-level staff with extensive training in behavioral weight loss. Sessions involved private weigh-ins and covered topics that supplemented the internet intervention (eg, recipe modification, portion control).
Main outcomes measures. The main outcome was weight loss at the end of the 3-month program. Participants completed measures (ie, weight, BMI) in person at baseline and 3 months (post-treatment), and at 6- and 12-month follow-up visits. Adherence measures included reported weight and physical activity on the SURI website (S, SI, and SIG), log ins, viewed lessons, and self-monitoring entries on the intervention website (SI, SIG), and number of groups meetings attended (SIG). To measure weight loss behaviors, the authors used the Weight Control Practices questionnaire to assess engagement in core weight loss strategies targeted in treatment, and the Paffenbarger questionnaire to assess weekly kcal expended in moderate to vigorous activity. The authors also assessed costs from the payer (labor, rent, intervention materials), participant (SURI registration fee, transportation, time spent on intervention), and societal perspective (sum of payer and participant costs) in order to calculate the cost per kg of weight lost in each study arm.
Results. Participants were predominantly female, non-Hispanic white, and had a mean BMI of 34.4 kg/m2 (SE = 0.05). Groups differed only on education (P = 0.02), and attendance at post-treatment and 6- and 12-month follow-up were high (93%, 91%, and 86% respectively). The authors found that weight loss did not differ by educational attainment (P s > 0.57).
Overall, there was a significant group-by-time interaction for weight loss (P < 0.001). Percentage weight loss at 3 months differed among the 3 groups—S: 1.1% ± 0.9%; SI: 4.2% ± 0.6%; SIG: 6.1% ± 0.6% (P s ≤ 0.04). There was also an overall group effect for percentage of individuals achieving 5% weight loss (P < 0.001). SI and SIG had higher percentages of participants who achieved a 5% weight loss than the control (SI: 42%; SIG: 54%; S: 7%; P s < 0.001) but did not differ from one another (P = 0.01). Initial weight losses and percentage of participants who achieved a 5% weight loss were largely maintained through the no-treatment follow-up phase at 6-months, but the 3 groups no longer differed from one another at 12 months (S: 1.2% [SE =0.9]; SI: 2.2% [SE = 0.6]; SIG: 3.3% [SE = 0.6]; P s > 0.05).
All groups reported significant increases in physical activity over time (p < 0.001). More reporting of weight and physical activity data on the SURI website was associated with greater percentage weight loss (r = 0.25; P < 0.001). Number of log ins and lessons viewed on the intervention website were positively associated with percentage weight loss (r = 0.45; P ≤ 0.001; and r = 0.34; P ≤ 0.001 respectively). Greater attendance to group sessions was associated with better weight outcomes (r = 0.61; P ≤ 0.001). Younger age was associated with poorer adherence, including less reporting on the SURI website, viewing of lessons, and logging in to the weight loss website.
There was a significant group-by-time effect interaction for the use of behavioral weight loss strategies (P < 0.001), and increased use of these strategies was associated with greater percentage weight loss in all 3 groups post-treatment. At 12 months, however, there were no differences between groups in the use of these strategies (P s ≤ 0.07).
Cost per kg of weight loss was similar for S ($39) and SI ($35), but both were lower than SIG ($114).
Conclusion. Both intervention arms (SI and SIG) achieved more weight loss at 6 months than SURI alone. Although mean weight loss was greatest with optional group sessions (SIG), the addition of the behavioral intervention website alone (SI) was the most cost-effective method to enhance weight loss. Thus, adding a novel internet behavioral weight loss intervention to a statewide community health initiative may be a cost-effective approach to improving obesity treatment outcomes.
Commentary
Weight loss treatment is recommended for adults with a BMI of > 30 kg/m2, as well as those with BMI < 25 kg/m2 with weight-related comorbidities [1]. Intensive behavioral treatment should be the first line of intervention for overweight and obese individuals and can lead to 8% to 10% weight loss [2], particularly in initial months of treatment [3]. However, behavioral treatment is inherently challenging and time-consuming, and readily available to only a fraction of the intended population. Although weight losses achieved from intensive lifestyle interventions such as the Diabetes Prevention Program (DPP) [4] may be higher, innovative community weight loss programs that use a variety of weight loss strategies can provide opportunities to a wider population of overweight and obese individuals and at a lower cost [3].
This study built upon the authors’ previous work [5], which showed that SURI participants with behavioral weight loss strategies via email significantly improved 3-month weight losses. In this current study, they compared SURI alone to SURI with additional access to an internet behavioral weight loss website with or without optional group sessions. Since significant weight loss was not maintained at 12 months, this suggests that perhaps access to the behavioral weight loss website should have continued for longer and/or included a maintenance phase after the 3-month intervention. Weight loss often reaches its peak around 6 months, and weight regain occurs without effective maintenance therapy [6].
General strengths of the study included the use of a randomized, intention-to-treat design, dissemination of evidence-based weight loss strategies, objective outcomes measurement, adherence metrics, and strong retention of participants with clear accounting of all enrolled patients from recruitment through analysis. This study demonstrated significant weight loss in an intervention with minimal/optional health professional interaction. This intervention also placed responsibility on participants to self-monitor their diet and physical activity, participate in online lessons, and attend optional group sessions. The success of this community-based intervention suggests feasibility and scalability within a real-world setting. The authors also conducted cost-effectiveness analyses demonstrating that the SI program was more cost-effective than SIG.
However, there are weaknesses as well. In setting the sample size for each arm of this study, no justification was described for choosing a 1:2:2 randomization scheme. In randomized control trials, the allocation of participants into the different study arms is often balanced to equal numbers which maximizes statistical power [7]. However, the use of unequal randomization ratios among study arms can be beneficial and even necessary for various reasons including cost, availability of the intervention, overcoming intervention/treatment learning curves, and if a higher drop-out rate is anticipated. Providing a justification for unbalanced sample sizes would be helpful to future researchers looking to replicate the study. Additionally, participants were mostly non-Hispanic white and female, thus limiting generalizability. While representative of the broader Rhode Island population, findings based on this population this may not be applicable to vulnerable (ie, low literacy, resource-poor) or underrepresented populations (ie, minorities) [8].
Applications for Clinical Practice
An internet-based behavioral weight loss intervention, when added to a community weight management initiative, is cost-effective and can lead to short-term weight loss. Given that clinicians often lack time, training, and resources to adequately address obesity in the office [9,10], encouraging patients to enroll in similar programs may be an effective strategy to address such barriers. The study also highlights the need for maintenance interventions to help keep weight off. Findings should be replicated in more diverse communities.
—Katrina F. Mateo, MPH, and Melanie Jay, MD, MS
1. Clinical guidelines on the identification, evaluation, and treatment of overweight and obesity in adults. National Heart, Lung, and Blood Institute; 1998.
2. Wadden TA, Butryn ML, Wilson C. Lifestyle modification for the management of obesity. Gastroenterology 2007;132:2226–38.
3. Butryn ML, Webb V, Wadden TA. Behavioral treatment of obesity. Psych Clin North Am 2011;34:841–59.
4. The Diabetes Prevention Program Research Group. The Diabetes Prevention Program (DPP): Description of lifestyle intervention. Diabetes Care 2002;25:2165–71.
5. Wing RR, Crane MM, Thomas JG, et al. Improving weight loss outcomes of community interventions by incorporating behavioral strategies. Am J Public Health 2010;100:2513–9.
6. Wing RR, Tate DF, Gorin A, et al. A self-regulation program for maintenance of weight loss. N Engl J Med 2006;355:1563–71.
7. Dumville JC, Hahn S, Miles JN V, Torgerson DJ. The use of unequal randomisation ratios in clinical trials: a review. Contemp Clin Trials 2006;27:1–12.
8. Marshall PL. Ethical challenges in study design and informed consent for health research in resource-poor settings. World Health Organization; 2007.
9. Jay M, Gillespie C, Ark T, et al. Do internists, pediatricians, and psychiatrists feel competent in obesity care? Using a needs assessment to drive curriculum design. J Gen Intern Med 2008;23:1066–70.
10. Loureiro ML, Nayga RM. Obesity, weight loss, and physician’s advice. Soc Sci Med 2006;62:2458–68.
Study Overview
Objective. To determine the efficacy and cost-effectiveness of adding an evidence-based internet behavioral weight loss intervention alone or combined with optional group sessions to ShapeUp Rhode Island 2011 (SURI), a 3-month statewide wellness campaign.
Design. 3-arm randomized clinical trial.
Setting and participants. Study participants were recruited from the Rhode Island community via employers, media, and mass mailings at the time of SURI 2011 registration. Of the 3806 participants that joined the weight loss division, 1139 were willing to be contacted for research, and the first 431 were screened for study eligibility. Exclusion criteria were minimal: age < 18 years or > 70 years, body mass index (BMI) < 25 kg/m2, pregnant, nursing, or plans to become pregnant, a serious medical condition (eg, cancer), unreliable internet access, non-English speaking, current or previous participation in our weight loss studies, and planned relocation. Those who reported a medical condition that could interfere with safe participation (eg, diabetes) obtained doctor’s consent to participate. Of those screened, 230 met inclusion criteria, completed orientation procedures, and were randomized using a 1:2:2 randomization scheme to the standard SURI program (S; n = 46); SURI plus internet behavioral weight loss intervention (SI; n = 90); or SURI plus internet behavioral weight loss intervention plus optional group sessions (SIG; n = 94). To avoid contamination, individuals on the same SURI team (see below) were randomized to the same intervention.
Intervention. Participants in the standard SURI program did not receive any behavioral weight loss treatment. SURI is a self-sustaining, annual community campaign designed to help Rhode Islanders lose weight and increase their physical activity through an online, team-based competition. Participants join in teams, enter the weight loss or physical activity division or both, and compete with other teams. Throughout the 3-month program, participants have access to a reporting SURI website where they submit their weekly weight and activity data and view their personal and team progress. They also receive paper logs to record weight and activity, a pedometer, access to newsletters and community workshops, and recognition for meeting goals.
Participants in the SI arm received the 3-month SURI program plus a 3-month internet behavioral weight loss intervention. Before SURI began, SI participants attended a 1-hour group meeting during which they received their weight loss goal (lose 1 to 2 pounds per week), calorie and fat gram goal (starting weight < 250 lbs: 1200–1500 kcal/day, 40–50 g of fat; starting weight ≥ 250 lbs: 1500–1800 kcal/day, 50–60 g of fat), and activity goal (gradually increase to 200 minutes of aerobic activity per week). During this session, participants were also taught self-monitoring skills and oriented to an internet behavioral weight loss intervention website developed by the authors. The intervention website included 12 weekly, 10- to 15-minute multimedia lessons based on the Diabetes Prevention Program and a self-monitoring platform where participants tracked their daily weight, calorie, and activity information. Participants received weekly automated feedback on their progress. The intervention website also included information on meal plans, prepackaged meals, and meal replacements.
Participants in the SIG arm received everything in SI and were additionally given the option to attend weekly group meetings at Miriam Hospital’s Weight Control and Diabetes Research Center during the 3 months. The 12 weekly, optional group sessions were led by masters-level staff with extensive training in behavioral weight loss. Sessions involved private weigh-ins and covered topics that supplemented the internet intervention (eg, recipe modification, portion control).
Main outcomes measures. The main outcome was weight loss at the end of the 3-month program. Participants completed measures (ie, weight, BMI) in person at baseline and 3 months (post-treatment), and at 6- and 12-month follow-up visits. Adherence measures included reported weight and physical activity on the SURI website (S, SI, and SIG), log ins, viewed lessons, and self-monitoring entries on the intervention website (SI, SIG), and number of groups meetings attended (SIG). To measure weight loss behaviors, the authors used the Weight Control Practices questionnaire to assess engagement in core weight loss strategies targeted in treatment, and the Paffenbarger questionnaire to assess weekly kcal expended in moderate to vigorous activity. The authors also assessed costs from the payer (labor, rent, intervention materials), participant (SURI registration fee, transportation, time spent on intervention), and societal perspective (sum of payer and participant costs) in order to calculate the cost per kg of weight lost in each study arm.
Results. Participants were predominantly female, non-Hispanic white, and had a mean BMI of 34.4 kg/m2 (SE = 0.05). Groups differed only on education (P = 0.02), and attendance at post-treatment and 6- and 12-month follow-up were high (93%, 91%, and 86% respectively). The authors found that weight loss did not differ by educational attainment (P s > 0.57).
Overall, there was a significant group-by-time interaction for weight loss (P < 0.001). Percentage weight loss at 3 months differed among the 3 groups—S: 1.1% ± 0.9%; SI: 4.2% ± 0.6%; SIG: 6.1% ± 0.6% (P s ≤ 0.04). There was also an overall group effect for percentage of individuals achieving 5% weight loss (P < 0.001). SI and SIG had higher percentages of participants who achieved a 5% weight loss than the control (SI: 42%; SIG: 54%; S: 7%; P s < 0.001) but did not differ from one another (P = 0.01). Initial weight losses and percentage of participants who achieved a 5% weight loss were largely maintained through the no-treatment follow-up phase at 6-months, but the 3 groups no longer differed from one another at 12 months (S: 1.2% [SE =0.9]; SI: 2.2% [SE = 0.6]; SIG: 3.3% [SE = 0.6]; P s > 0.05).
All groups reported significant increases in physical activity over time (p < 0.001). More reporting of weight and physical activity data on the SURI website was associated with greater percentage weight loss (r = 0.25; P < 0.001). Number of log ins and lessons viewed on the intervention website were positively associated with percentage weight loss (r = 0.45; P ≤ 0.001; and r = 0.34; P ≤ 0.001 respectively). Greater attendance to group sessions was associated with better weight outcomes (r = 0.61; P ≤ 0.001). Younger age was associated with poorer adherence, including less reporting on the SURI website, viewing of lessons, and logging in to the weight loss website.
There was a significant group-by-time effect interaction for the use of behavioral weight loss strategies (P < 0.001), and increased use of these strategies was associated with greater percentage weight loss in all 3 groups post-treatment. At 12 months, however, there were no differences between groups in the use of these strategies (P s ≤ 0.07).
Cost per kg of weight loss was similar for S ($39) and SI ($35), but both were lower than SIG ($114).
Conclusion. Both intervention arms (SI and SIG) achieved more weight loss at 6 months than SURI alone. Although mean weight loss was greatest with optional group sessions (SIG), the addition of the behavioral intervention website alone (SI) was the most cost-effective method to enhance weight loss. Thus, adding a novel internet behavioral weight loss intervention to a statewide community health initiative may be a cost-effective approach to improving obesity treatment outcomes.
Commentary
Weight loss treatment is recommended for adults with a BMI of > 30 kg/m2, as well as those with BMI < 25 kg/m2 with weight-related comorbidities [1]. Intensive behavioral treatment should be the first line of intervention for overweight and obese individuals and can lead to 8% to 10% weight loss [2], particularly in initial months of treatment [3]. However, behavioral treatment is inherently challenging and time-consuming, and readily available to only a fraction of the intended population. Although weight losses achieved from intensive lifestyle interventions such as the Diabetes Prevention Program (DPP) [4] may be higher, innovative community weight loss programs that use a variety of weight loss strategies can provide opportunities to a wider population of overweight and obese individuals and at a lower cost [3].
This study built upon the authors’ previous work [5], which showed that SURI participants with behavioral weight loss strategies via email significantly improved 3-month weight losses. In this current study, they compared SURI alone to SURI with additional access to an internet behavioral weight loss website with or without optional group sessions. Since significant weight loss was not maintained at 12 months, this suggests that perhaps access to the behavioral weight loss website should have continued for longer and/or included a maintenance phase after the 3-month intervention. Weight loss often reaches its peak around 6 months, and weight regain occurs without effective maintenance therapy [6].
General strengths of the study included the use of a randomized, intention-to-treat design, dissemination of evidence-based weight loss strategies, objective outcomes measurement, adherence metrics, and strong retention of participants with clear accounting of all enrolled patients from recruitment through analysis. This study demonstrated significant weight loss in an intervention with minimal/optional health professional interaction. This intervention also placed responsibility on participants to self-monitor their diet and physical activity, participate in online lessons, and attend optional group sessions. The success of this community-based intervention suggests feasibility and scalability within a real-world setting. The authors also conducted cost-effectiveness analyses demonstrating that the SI program was more cost-effective than SIG.
However, there are weaknesses as well. In setting the sample size for each arm of this study, no justification was described for choosing a 1:2:2 randomization scheme. In randomized control trials, the allocation of participants into the different study arms is often balanced to equal numbers which maximizes statistical power [7]. However, the use of unequal randomization ratios among study arms can be beneficial and even necessary for various reasons including cost, availability of the intervention, overcoming intervention/treatment learning curves, and if a higher drop-out rate is anticipated. Providing a justification for unbalanced sample sizes would be helpful to future researchers looking to replicate the study. Additionally, participants were mostly non-Hispanic white and female, thus limiting generalizability. While representative of the broader Rhode Island population, findings based on this population this may not be applicable to vulnerable (ie, low literacy, resource-poor) or underrepresented populations (ie, minorities) [8].
Applications for Clinical Practice
An internet-based behavioral weight loss intervention, when added to a community weight management initiative, is cost-effective and can lead to short-term weight loss. Given that clinicians often lack time, training, and resources to adequately address obesity in the office [9,10], encouraging patients to enroll in similar programs may be an effective strategy to address such barriers. The study also highlights the need for maintenance interventions to help keep weight off. Findings should be replicated in more diverse communities.
—Katrina F. Mateo, MPH, and Melanie Jay, MD, MS
1. Clinical guidelines on the identification, evaluation, and treatment of overweight and obesity in adults. National Heart, Lung, and Blood Institute; 1998.
2. Wadden TA, Butryn ML, Wilson C. Lifestyle modification for the management of obesity. Gastroenterology 2007;132:2226–38.
3. Butryn ML, Webb V, Wadden TA. Behavioral treatment of obesity. Psych Clin North Am 2011;34:841–59.
4. The Diabetes Prevention Program Research Group. The Diabetes Prevention Program (DPP): Description of lifestyle intervention. Diabetes Care 2002;25:2165–71.
5. Wing RR, Crane MM, Thomas JG, et al. Improving weight loss outcomes of community interventions by incorporating behavioral strategies. Am J Public Health 2010;100:2513–9.
6. Wing RR, Tate DF, Gorin A, et al. A self-regulation program for maintenance of weight loss. N Engl J Med 2006;355:1563–71.
7. Dumville JC, Hahn S, Miles JN V, Torgerson DJ. The use of unequal randomisation ratios in clinical trials: a review. Contemp Clin Trials 2006;27:1–12.
8. Marshall PL. Ethical challenges in study design and informed consent for health research in resource-poor settings. World Health Organization; 2007.
9. Jay M, Gillespie C, Ark T, et al. Do internists, pediatricians, and psychiatrists feel competent in obesity care? Using a needs assessment to drive curriculum design. J Gen Intern Med 2008;23:1066–70.
10. Loureiro ML, Nayga RM. Obesity, weight loss, and physician’s advice. Soc Sci Med 2006;62:2458–68.
Epidural Steroid Injections for Spinal Stenosis Back Pain Simply Don’t Work
Study Overview
Objective. To determine the effectiveness of epidural injections of glucocorticoids plus anesthetic compared with injections of anesthetic alone in patients with lumbar spinal stenosis.
Design. The LESS (Lumbar Epidural Steroid Injection for Spinal Stenosis) trial—a double-blind, multisite, randomized controlled trial.
Setting and participants. The study was conducted at 16 sites in the United States and enrolled 400 patients between April 2011 and June 2013. Patients at least 50 years of age with spinal stenosis as evidenced by magnetic resonance imaging (MRI) or computed tomography (CT) were invited to participate. Additional eligibility criteria included an average pain rating of more than 4 on a scale of 0 to 10 (0 being the lowest score) for back, buttock, or leg pain. Patients were excluded if they did not have stenosis of the central canal, had spondylolisthesis requiring surgery, or had received epidural glucocorticoid injections within the previous 6 months. Patients were randomly assigned to receive a standard epidural injection of glucocorticoids plus lidocaine or lidocaine alone. At the 3-week follow-up they could choose to receive a repeat injection. At the 6-week assessment they were allowed to cross over to the other treatment group. Patients were blinded throughout the study. The treating physicians were also blinded through the use of 2 opaque prefilled syringes provided by the study staff—one marked “inject” and one marked “discard.”
Main outcome measures. The 2 outcomes, measured at 6 weeks, were the Roland-Morris Disability Questionnaire (RMDQ) score (range, 0 to 24, with higher scores indicating greater physical disability) and the patient’s rating of average buttock, hip, or leg pain in the previous week (scale of 0 to 10 with 0 indicating no pain and 10 indicating “pain as bad as you can imagine”).
Eight secondary patient-oriented outcomes were also measured: (1) at least minimal clinically meaningful improvement (≥ 30%), (2) substantial clinically meaningful improvement (≥ 50%), (3) average back pain in the previous week, and scores on the (4) Brief Pain Inventory (BPI) interference scale, (5) 8-question Patient Health Questionnaire (PHQ-8), (6) Generalized Anxiety Disorder 7 scale (GAD-7), (7) EQ-5D (a health status measure) and (8) Swiss Spinal Stenosis Questionnaire (SSSQ).
Main results. The 2 groups were similar with respect to baseline characteristics, except that the duration of pain was shorter in the lidocaine-alone group. At 6 weeks, both groups had improved RMDQ scores (glucocorticoid –4.2 points vs. no glucocorticoid –3.1 points, respectively). However, the difference in RMDQ score between the 2 groups was not statistically significant (–1.0 points [95% CI, –2.1 to 0.1]; P = 0.07). In addition, there was no difference in treatment effect at 6 weeks as measured by patient’s reported leg pain (–0.2 points [95% CI, –0.8 to 0.4]; P = 0.48). Furthermore, there were no significant differences in the secondary outcomes of clinically meaningful improvement, BPI, SSSQ symptoms and physical function, EQ-5D, and GAD-7 scales at 6 weeks. Among the secondary outcomes, only symptoms of depression and patient satisfaction showed a statistically significant improvement in the glucocorticoid plus lidocaine group. Of note, though not statistically significant, there were more adverse events in the glucocorticoid plus lidocaine group compared to the lidocaine alone group (21.5% vs. 15.5%, respectively). Finally, the glucocorticoid plus lidocaine group also had a significantly higher proportion of patients with cortisol serum suppression compared to the lidocaine alone group.
Conclusion. The authors concluded that there was no difference in pain-related functional disability (as measured by the RMDQ score) and pain intensity between patients receiving fluoroscopically guided epidural injections with glucocorticoids plus lidocaine compared with lidocaine alone for lumbar spinal stenosis. The injection of glucocorticoid should be avoided due to its potentially systemic effects, including suppression of the hypothalamic-pituitary axis and reduction in bone mineral density, which may increase the risk of fracture.
Commentary
Lumbar spinal stenosis is one of the most common causes of spine-related back and leg pain; it disproportionally affects older adults due to degenerative changes resulting in narrowing of the spinal canal and nerve-root. Epidural glucocorticoid injections containing a glucocorticoid and an anesthetic are commonly used to relieve symptoms of lumbar stenosis. While this treatment approach is controversial, more than 2.2 million lumbar epidural glucocorticoid injections are performed in the Medicare population each year [1,2]. Previous uncontrolled studies suggest that epidural glucocorticoid injections provide short-term pain relief for some patients with spinal stenosis [3]. While complications from the procedure are rare, a multistate outbreak of fungal meningitis due to contaminated glucocorticoid injections affected at least 751 patients with 64 deaths in 2012 [4].
The purpose of the current study by Friedly et al was to determine whether adding a glucocorticoid to an anesthetic in epidural spinal injections is superior to anesthetic alone for symptom relief and functional improvement in patients with lumbar spinal stenosis. In contrast to previous studies, the authors defined short-term results as 3 weeks after injection, and long-term results as 6 weeks after injection. Despite the shorter follow-up period, results were similar to previous studies, in that adding glucocorticoid to anesthetic in epidural spinal injection reduced pain and improved patient’s functionality short-term, but improvements were not sustained long-term. Based on these results, the authors concluded that there is no benefit in adding glucocorticoid epidural injections for back pain arising from lumbar spinal stenosis.
One major limitation of this study is the lack of a placebo arm. Because of the lack of a placebo arm, it cannot be ascertained whether epidural injection with lidocaine alone conferred a benefit. However, this study provides robust evidence that epidural steroid injections are not beneficial for treatment of back and leg pain associated with lumbar spinal stenosis.
Applications for Clinical Practice
Epidural steroid injection is long accepted in medical communities as a safe and effective treatment for lumbar spinal stenosis symptoms. In light of the potential dangers of epidural steroid injections, including meningitis, coupled with the increasing cost of the procedure, other potential side effects, and demonstrated ineffectiveness of the treatment, providers should stop recommending epidural steroid injections for lumbar spinal stenosis.
—Ka Ming Gordon Ngai, MD, MPH
1. Manchikanti L, Pampati V, Boswell MV, et al. Analysis of the growth of epidural injections and costs in the Medicare population: a comparative evaluation of 1997, 2002, and 2006 data. Pain Physician 2010;13:199–212.
2. Manchikanti L, Pampati V, Falco FJ, et al. Assessment of the growth of epidural injections in the medicare population from 2000 to 2011. Pain Physician 2013;16:E349–364.
3. Shamliyan TA, Staal JB, Goldmann D, et al. Epidural steroid injections for radicular lumbosacral pain: a systematic review. Phys Med Rehabil Clin North Am 2014;25:471–89.
4. CDC. Multistate outbreak of fungal meningitis and other infections. 23 Oct 2013. Accessed 9 Jul 2014 at www.cdc.gov/hai/outbreaks/meningitis.html.
Study Overview
Objective. To determine the effectiveness of epidural injections of glucocorticoids plus anesthetic compared with injections of anesthetic alone in patients with lumbar spinal stenosis.
Design. The LESS (Lumbar Epidural Steroid Injection for Spinal Stenosis) trial—a double-blind, multisite, randomized controlled trial.
Setting and participants. The study was conducted at 16 sites in the United States and enrolled 400 patients between April 2011 and June 2013. Patients at least 50 years of age with spinal stenosis as evidenced by magnetic resonance imaging (MRI) or computed tomography (CT) were invited to participate. Additional eligibility criteria included an average pain rating of more than 4 on a scale of 0 to 10 (0 being the lowest score) for back, buttock, or leg pain. Patients were excluded if they did not have stenosis of the central canal, had spondylolisthesis requiring surgery, or had received epidural glucocorticoid injections within the previous 6 months. Patients were randomly assigned to receive a standard epidural injection of glucocorticoids plus lidocaine or lidocaine alone. At the 3-week follow-up they could choose to receive a repeat injection. At the 6-week assessment they were allowed to cross over to the other treatment group. Patients were blinded throughout the study. The treating physicians were also blinded through the use of 2 opaque prefilled syringes provided by the study staff—one marked “inject” and one marked “discard.”
Main outcome measures. The 2 outcomes, measured at 6 weeks, were the Roland-Morris Disability Questionnaire (RMDQ) score (range, 0 to 24, with higher scores indicating greater physical disability) and the patient’s rating of average buttock, hip, or leg pain in the previous week (scale of 0 to 10 with 0 indicating no pain and 10 indicating “pain as bad as you can imagine”).
Eight secondary patient-oriented outcomes were also measured: (1) at least minimal clinically meaningful improvement (≥ 30%), (2) substantial clinically meaningful improvement (≥ 50%), (3) average back pain in the previous week, and scores on the (4) Brief Pain Inventory (BPI) interference scale, (5) 8-question Patient Health Questionnaire (PHQ-8), (6) Generalized Anxiety Disorder 7 scale (GAD-7), (7) EQ-5D (a health status measure) and (8) Swiss Spinal Stenosis Questionnaire (SSSQ).
Main results. The 2 groups were similar with respect to baseline characteristics, except that the duration of pain was shorter in the lidocaine-alone group. At 6 weeks, both groups had improved RMDQ scores (glucocorticoid –4.2 points vs. no glucocorticoid –3.1 points, respectively). However, the difference in RMDQ score between the 2 groups was not statistically significant (–1.0 points [95% CI, –2.1 to 0.1]; P = 0.07). In addition, there was no difference in treatment effect at 6 weeks as measured by patient’s reported leg pain (–0.2 points [95% CI, –0.8 to 0.4]; P = 0.48). Furthermore, there were no significant differences in the secondary outcomes of clinically meaningful improvement, BPI, SSSQ symptoms and physical function, EQ-5D, and GAD-7 scales at 6 weeks. Among the secondary outcomes, only symptoms of depression and patient satisfaction showed a statistically significant improvement in the glucocorticoid plus lidocaine group. Of note, though not statistically significant, there were more adverse events in the glucocorticoid plus lidocaine group compared to the lidocaine alone group (21.5% vs. 15.5%, respectively). Finally, the glucocorticoid plus lidocaine group also had a significantly higher proportion of patients with cortisol serum suppression compared to the lidocaine alone group.
Conclusion. The authors concluded that there was no difference in pain-related functional disability (as measured by the RMDQ score) and pain intensity between patients receiving fluoroscopically guided epidural injections with glucocorticoids plus lidocaine compared with lidocaine alone for lumbar spinal stenosis. The injection of glucocorticoid should be avoided due to its potentially systemic effects, including suppression of the hypothalamic-pituitary axis and reduction in bone mineral density, which may increase the risk of fracture.
Commentary
Lumbar spinal stenosis is one of the most common causes of spine-related back and leg pain; it disproportionally affects older adults due to degenerative changes resulting in narrowing of the spinal canal and nerve-root. Epidural glucocorticoid injections containing a glucocorticoid and an anesthetic are commonly used to relieve symptoms of lumbar stenosis. While this treatment approach is controversial, more than 2.2 million lumbar epidural glucocorticoid injections are performed in the Medicare population each year [1,2]. Previous uncontrolled studies suggest that epidural glucocorticoid injections provide short-term pain relief for some patients with spinal stenosis [3]. While complications from the procedure are rare, a multistate outbreak of fungal meningitis due to contaminated glucocorticoid injections affected at least 751 patients with 64 deaths in 2012 [4].
The purpose of the current study by Friedly et al was to determine whether adding a glucocorticoid to an anesthetic in epidural spinal injections is superior to anesthetic alone for symptom relief and functional improvement in patients with lumbar spinal stenosis. In contrast to previous studies, the authors defined short-term results as 3 weeks after injection, and long-term results as 6 weeks after injection. Despite the shorter follow-up period, results were similar to previous studies, in that adding glucocorticoid to anesthetic in epidural spinal injection reduced pain and improved patient’s functionality short-term, but improvements were not sustained long-term. Based on these results, the authors concluded that there is no benefit in adding glucocorticoid epidural injections for back pain arising from lumbar spinal stenosis.
One major limitation of this study is the lack of a placebo arm. Because of the lack of a placebo arm, it cannot be ascertained whether epidural injection with lidocaine alone conferred a benefit. However, this study provides robust evidence that epidural steroid injections are not beneficial for treatment of back and leg pain associated with lumbar spinal stenosis.
Applications for Clinical Practice
Epidural steroid injection is long accepted in medical communities as a safe and effective treatment for lumbar spinal stenosis symptoms. In light of the potential dangers of epidural steroid injections, including meningitis, coupled with the increasing cost of the procedure, other potential side effects, and demonstrated ineffectiveness of the treatment, providers should stop recommending epidural steroid injections for lumbar spinal stenosis.
—Ka Ming Gordon Ngai, MD, MPH
1. Manchikanti L, Pampati V, Boswell MV, et al. Analysis of the growth of epidural injections and costs in the Medicare population: a comparative evaluation of 1997, 2002, and 2006 data. Pain Physician 2010;13:199–212.
2. Manchikanti L, Pampati V, Falco FJ, et al. Assessment of the growth of epidural injections in the medicare population from 2000 to 2011. Pain Physician 2013;16:E349–364.
3. Shamliyan TA, Staal JB, Goldmann D, et al. Epidural steroid injections for radicular lumbosacral pain: a systematic review. Phys Med Rehabil Clin North Am 2014;25:471–89.
4. CDC. Multistate outbreak of fungal meningitis and other infections. 23 Oct 2013. Accessed 9 Jul 2014 at www.cdc.gov/hai/outbreaks/meningitis.html.
Supporting Primary Care Patient-Centered Medical Homes with Community Care Teams: Findings from a Pilot Study
From the Lehigh Valley Health Network, Allentown, PA.
Abstract
- Objective: With the growing recognition that team-based care might help meet the country’s primary care needs, this study’s objective was to evaluate the preliminary effectiveness of multidisciplinary community care teams (CCTs) deployed to primary care practices transforming into patient-centered medical homes (PCMHs).
- Methods: A nonrandomized longitudinal study design was used contrasting the CCT practices/patients with non-CCT comparison groups. Outcomes included utilization (ED/hospital use), quality indicators (QIs), practice joy, and patient satisfaction. Two CCTs (consisting of nurse care manager, behavioral health specialist, social worker, and pharmacist) were deployed to 6 primary care practices and provided services to 406 patients. Practice level analyses compared patients from the 6 CCT practices not receiving team services (29,881 patients) to 3 non-CCT practices (22,350 patients) that were also transforming toward PCMH. The comparison group for the patient level analyses (patients who received CCT services) was patients from the same CCT practice who did not receive CCT services.
- Results: At the practice level, there were significant improvements in QIs for practices both with and without CCTs. However, reductions in the probability of an admission and readmission occurred only for high-risk patients in CCT practices. At the patient level, the probability of an unplanned admission was reduced for CCT and non-CCT patients, but the probability of a readmission was only reduced in CCT patients receiving hospital discharge reconciliation calls from CCT staff.
- Conclusion: Preliminary results suggest possible added benefit of CCTs over PCMHs alone for reducing hospitalization.
As health care organizations move from a fee-for-service model to a value-based model in an accountable care environment, the transformation of primary care to patient-centered medical homes (PCMHs) is one of the fundamental strategies for achieving higher quality care at lower cost [1–3]. The core tenets of the PCMH are a commitment to high quality and safe care that is accessible, comprehensive, and coordinated across the health continuum, as well as patient-centered [4,5]. Newer to the PCMH model has been shifting the paradigm of care from individual encounters to using elements of population health management to proactively manage a panel of patients [1,3,6]. Given the array of patients seen in a primary care setting and the complexity of care required by many patients in a panel, particularly those with chronic conditions, a team approach to care capitalizes on multidisciplinary skills to collectively take responsibility for the ongoing care of the patients to improve health outcomes [7].
Multidisciplinary team-based care is considered a crucial strategy for meeting our society’s health care needs [8], especially in light of the expected shortage of primary care physicians coupled with the anticipated growth of the patient population due to the Affordable Care Act. Several different types of team-based care have been pursued. In 2003, for example, the State of Vermont pioneered health care reform through Vermont’s Blueprint for Health using principles of the PCMH that included team-based care [9]. The goal of the program was to deliver comprehensive and coordinated care to improve health outcomes for state residents. Vermont community health teams worked with primary care providers to manage short-term care for high-needs patients with an emphasis on better self-management, care coordination, chronic care management, and social and behavioral support services. An analysis of the first pilot program found significant decreases in hospital admissions and emergency department (ED) visits, and a per-person per-month reduction in costs [9].
The Lehigh Valley Health Network adapted the Vermont health improvement model to meet the unique needs of its practices that were transforming into PCMHs. When asked by leadership what would be most helpful in this transformational process, the practices cited additional staff resources to manage their high-risk patients. In response, the network enhanced support to the practices by implementing multidisciplinary teams called community care teams (CCTs), which were deployed to the practices to help manage their high-risk patients. The purpose of this study is to evaluate the effectiveness of CCTs within the PCMH model by examining key utilization, quality, and process measures. The CCTs were expected to increase the overall practice effectiveness and efficiency (practice level outcomes) by offsetting some of the workload regarding the management of high-risk patients and improving the outcomes of patients directly managed by the CCT (patient level outcomes).
Methods
Setting
Serving 5 counties, the Lehigh Valley Health Network is a large health care delivery system in southeastern PA that currently operates in a fee-for-service environment but is moving towards becoming an accountable care organization. The concept of using CCTs to support practices’ PCMH development originated with network leadership. Leadership approached 7 primary care practices with the most extensive PCMH involvement to pilot the CCT initiative (1 practice declined participation). More specifically, the practices were selected based upon their prior 3-year experience with practice transformation as a result of participating in the South Central PA Chronic Care Initiative [10] and having achieved National Committee for Quality Assurance level 3 PCMH recognition. Practice selection was also based on the results of a network-wide comprehensive practice assessment which included TransforMed’s MHIQ survey [11] of PCMH capabilities and in-house surveys to capture practice characteristics and readiness for change.
Program Design
The CCTs were designed to support 3 to 4 primary care practices in the short-term management of high-risk patients with chronic disease. Much like the Vermont community health team model, each team consisted of a RN care manager who functioned as the team lead, a behavioral health specialist, and a social worker. A clinical pharmacist was added to the CCT program shortly after implementing the project and was shared between 2 teams. The team engaged in population health management for patients identified as high-risk for poor outcomes by supporting the further development of disease self-management and goal setting skills, addressing behavioral health, social, and economic problems, and connecting the patient to other Network and community resources as needed. Furthermore, given the growing evidence demonstrating the positive impact of coordinated and continuity of care post hospital discharge on patient outcomes [12,13], the CCT also played a vital role in supporting the PCMH transition care program for high-risk patients, which involved contacting patients via the telephone within 48 business hours of discharge from the hospital to reconcile medications, assess and identify issues for follow-up, answer patient questions and coordinate appropriate appointments.
As a pilot program, 2 CCTs were deployed to 6 primary care practices (3 family medicine, 2 internal medicine, and 1 pediatric) in July 2012. Prior to engaging the practice and patients, each team member participated in an extensive orientation, which presented essential evidence-based knowledge on the CCT and PCMH models and provided application training and support in information systems, network resources, and care management.
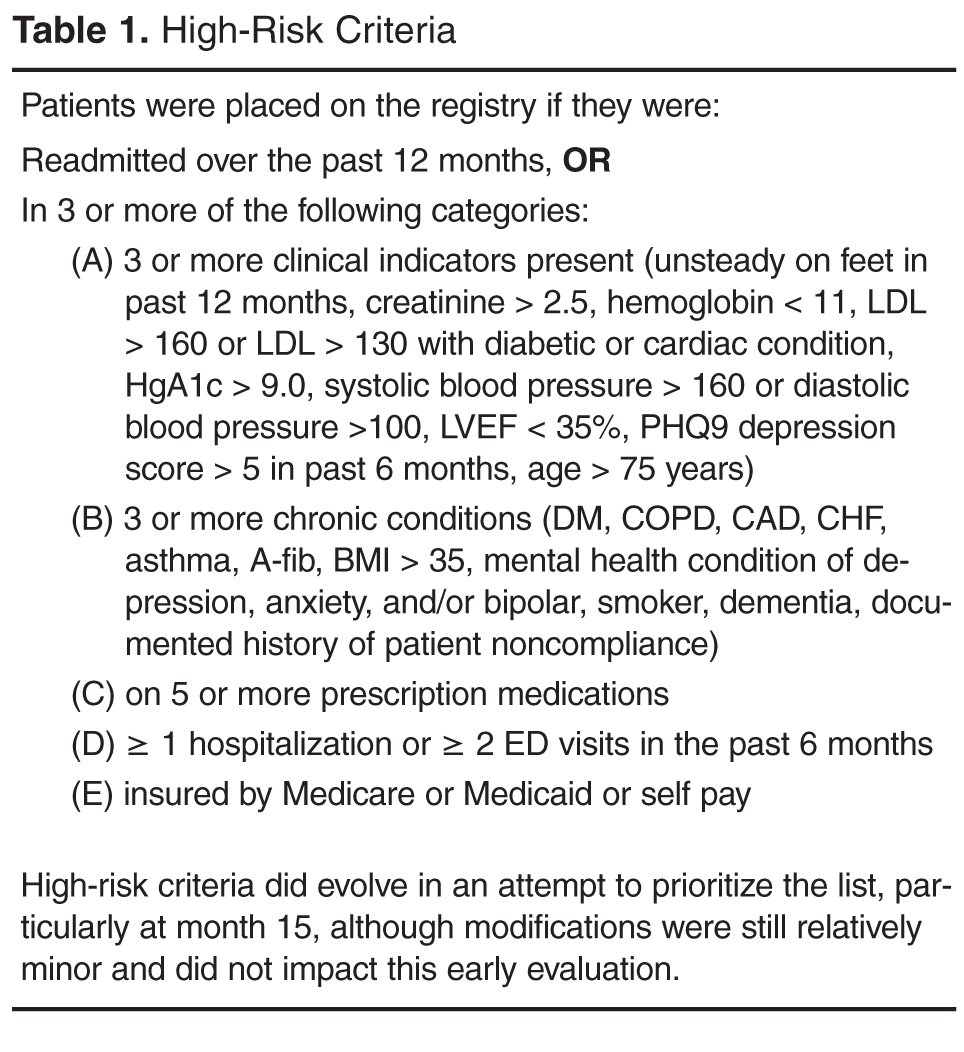
Initially the CCT care managers forwarded the high-risk registry to each provider to review and identify the top patients for proactive care management outreach. CCT care managers then called the identified patients and/or coordinated outreach with patients through office appointments scheduled in the near future. At the same time as the registry outreach began, on-site clinician referrals to the CCT and hospital discharge reconciliation calls to patients by the CCT care manager commenced. Clinician referrals did not have to meet any formal criteria in order for that patient to receive CCT services. Ideally, the program was designed to service high-risk patients on the registry; however, the majority of patient contacts for care management emerged through day-to-day clinician referrals (not necessarily high-risk) and discharge reconciliation calls to high-risk patients for months 2 through 8 of the pilot phase. Patients' care was managed with continued, ongoing services until either patient goals were met or the patient was transferred to another practice or nursing home, expired, or declined further care management assistance. The CCT behavioral health specialist addressed short-term issues or bridged the gap or need until long-term services could be coordinated, sometimes requiring 6 to 8 meetings with a patient. CCT social worker services were assigned on a case-by-case basis and occasionally provided longer-term or intermittent need management, such as medication assistance.
Study Design and Sample
A naturalistic longitudinal study design was used to evaluate the CCT’s preliminary effectiveness. The CCTs were evaluated at 2 levels. First, based on the assumption that the CCT would off-set some of the practice workload and allow the practices to proactively manage more of their patient population, the effectiveness of the CCTs was evaluated at the practice level, ie, patients who did not receive CCT services but belonged to practices with CCTs. Second, the effectiveness of the CCTs was evaluated at the patient level, ie, patients receiving CCT services. At both levels, the CCT groups were contrasted with “non-CCT” comparison groups of convenience.
![]()
Measures
Primary outcome measures were utilization: ED visits, all-cause unplanned admissions, and 30-day readmissions. Secondary outcome measures included 2 types of quality indicators(QIs, see Appendix for scoring): (a) gaps in care measures that captured whether providers were following standards of care for diabetes, ischemic vascular disease, and prevention; and (b) patient composites which reflected patient illness severity for diabetes and cardiac disease. Higher scores indicated more gaps in care or greater disease severity. Both types of QI measures required at least a 12-month window and thus could not be computed for patients engaged with the CCT who had only a 6-month follow-up period (as their scores could reflect their pre-CCT status). In addition, comprehensive care was denoted by the provision of depression screening on the PHQ-2 [14], and whether HgA1c was greater or equal to 9.0 in diabetics served as an additional patient outcome measure. Other secondary outcome measures included practice joy via the Well-Being in the Workplace Questionnaire (WWQ) [15] and patient satisfaction from CAHPS-CG 12-month survey with PCMH items [16].
Data Collection
Utilization and quality data were extracted from the network’s hospital and outpatient electronic medical records (EMR). Practice staff were emailed every 6 months and asked to anonymously complete the WWQ via Survey Monkey [17]. At baseline, patient satisfaction surveys were distributed in the practice, and patients had the option of anonymously completing them during their visit or returning them in a prepaid envelop. While not recommended for CAHPS, this procedure had been internally used with success previously. At 12 months, the same survey was mailed to a random sample of patients with a prepaid return envelope.
At the practice level, utilization and QI data were only available for patients from 4 of the 6 practices: data were not available for 1 non-EMR practice and there was negligible variation in utilization from the pediatric practice. For the patient level analyses, utilization was available for patients in all 6 practices.
Statistical Analyses
To test whether outcomes were improved relative to a comparison group following the introduction of CCTs into the practices (practice level analyses) or CCT engagement (patient level analyses), mixed models analyses of variance with repeated measures on Time (pre- vs. post-CCT) were conducted with SAS [18] PROC MIXED and PROC GENMOD for continuous and dichotomous outcomes, respectively. To determine whether there was greater improvement in the CCT groups, all models included the interaction between Time and Group (CCT versus no CCT) in addition to their main effects. At the practice level, high-risk and non-high-risk patients were analyzed separately. And, at the patient level, CCT-MNGT and CCT-DCREC patients were analyzed separately with results adjusted for patient’s age. Some variables were not normally distributed. The quality variables were able to be normalized with natural log transformations, but utilization variables had to be dichotomized into “any” versus “none” due to severe skewness, inflated 0s and larger-valued counts. Practice joy and patient satisfaction can only be reported at the practice level (responses were aggregated within each practice because anonymous responses do not permit linking specific respondents over time and different patients were sampled across measurement occasions) and non-parametric tests (Wilcoxon signed ranked tests and tests of dependent proportions) were used to test for change over time given the small sample size (n = 6).
Results
Patient Characteristics
Practice samples had slightly more women than men (55.2%), were largely white (95.0%) and 50 years of age on average (mean = 49.53, SD = 20.18). The prevalence of diabetes (10.2%) and cardiac disease (10.4%) was relatively low. The percentage of women (56.3%) and whites (96.4%) for the patient level analytic samples was similar to the practice samples, whereas the prevalence of diabetes (33.6% ) and cardiac disease (44.6%) was notable higher and patients were more than 10 years older on average (mean = 61.62, SD = 23.96).
Practice Level Outcomes
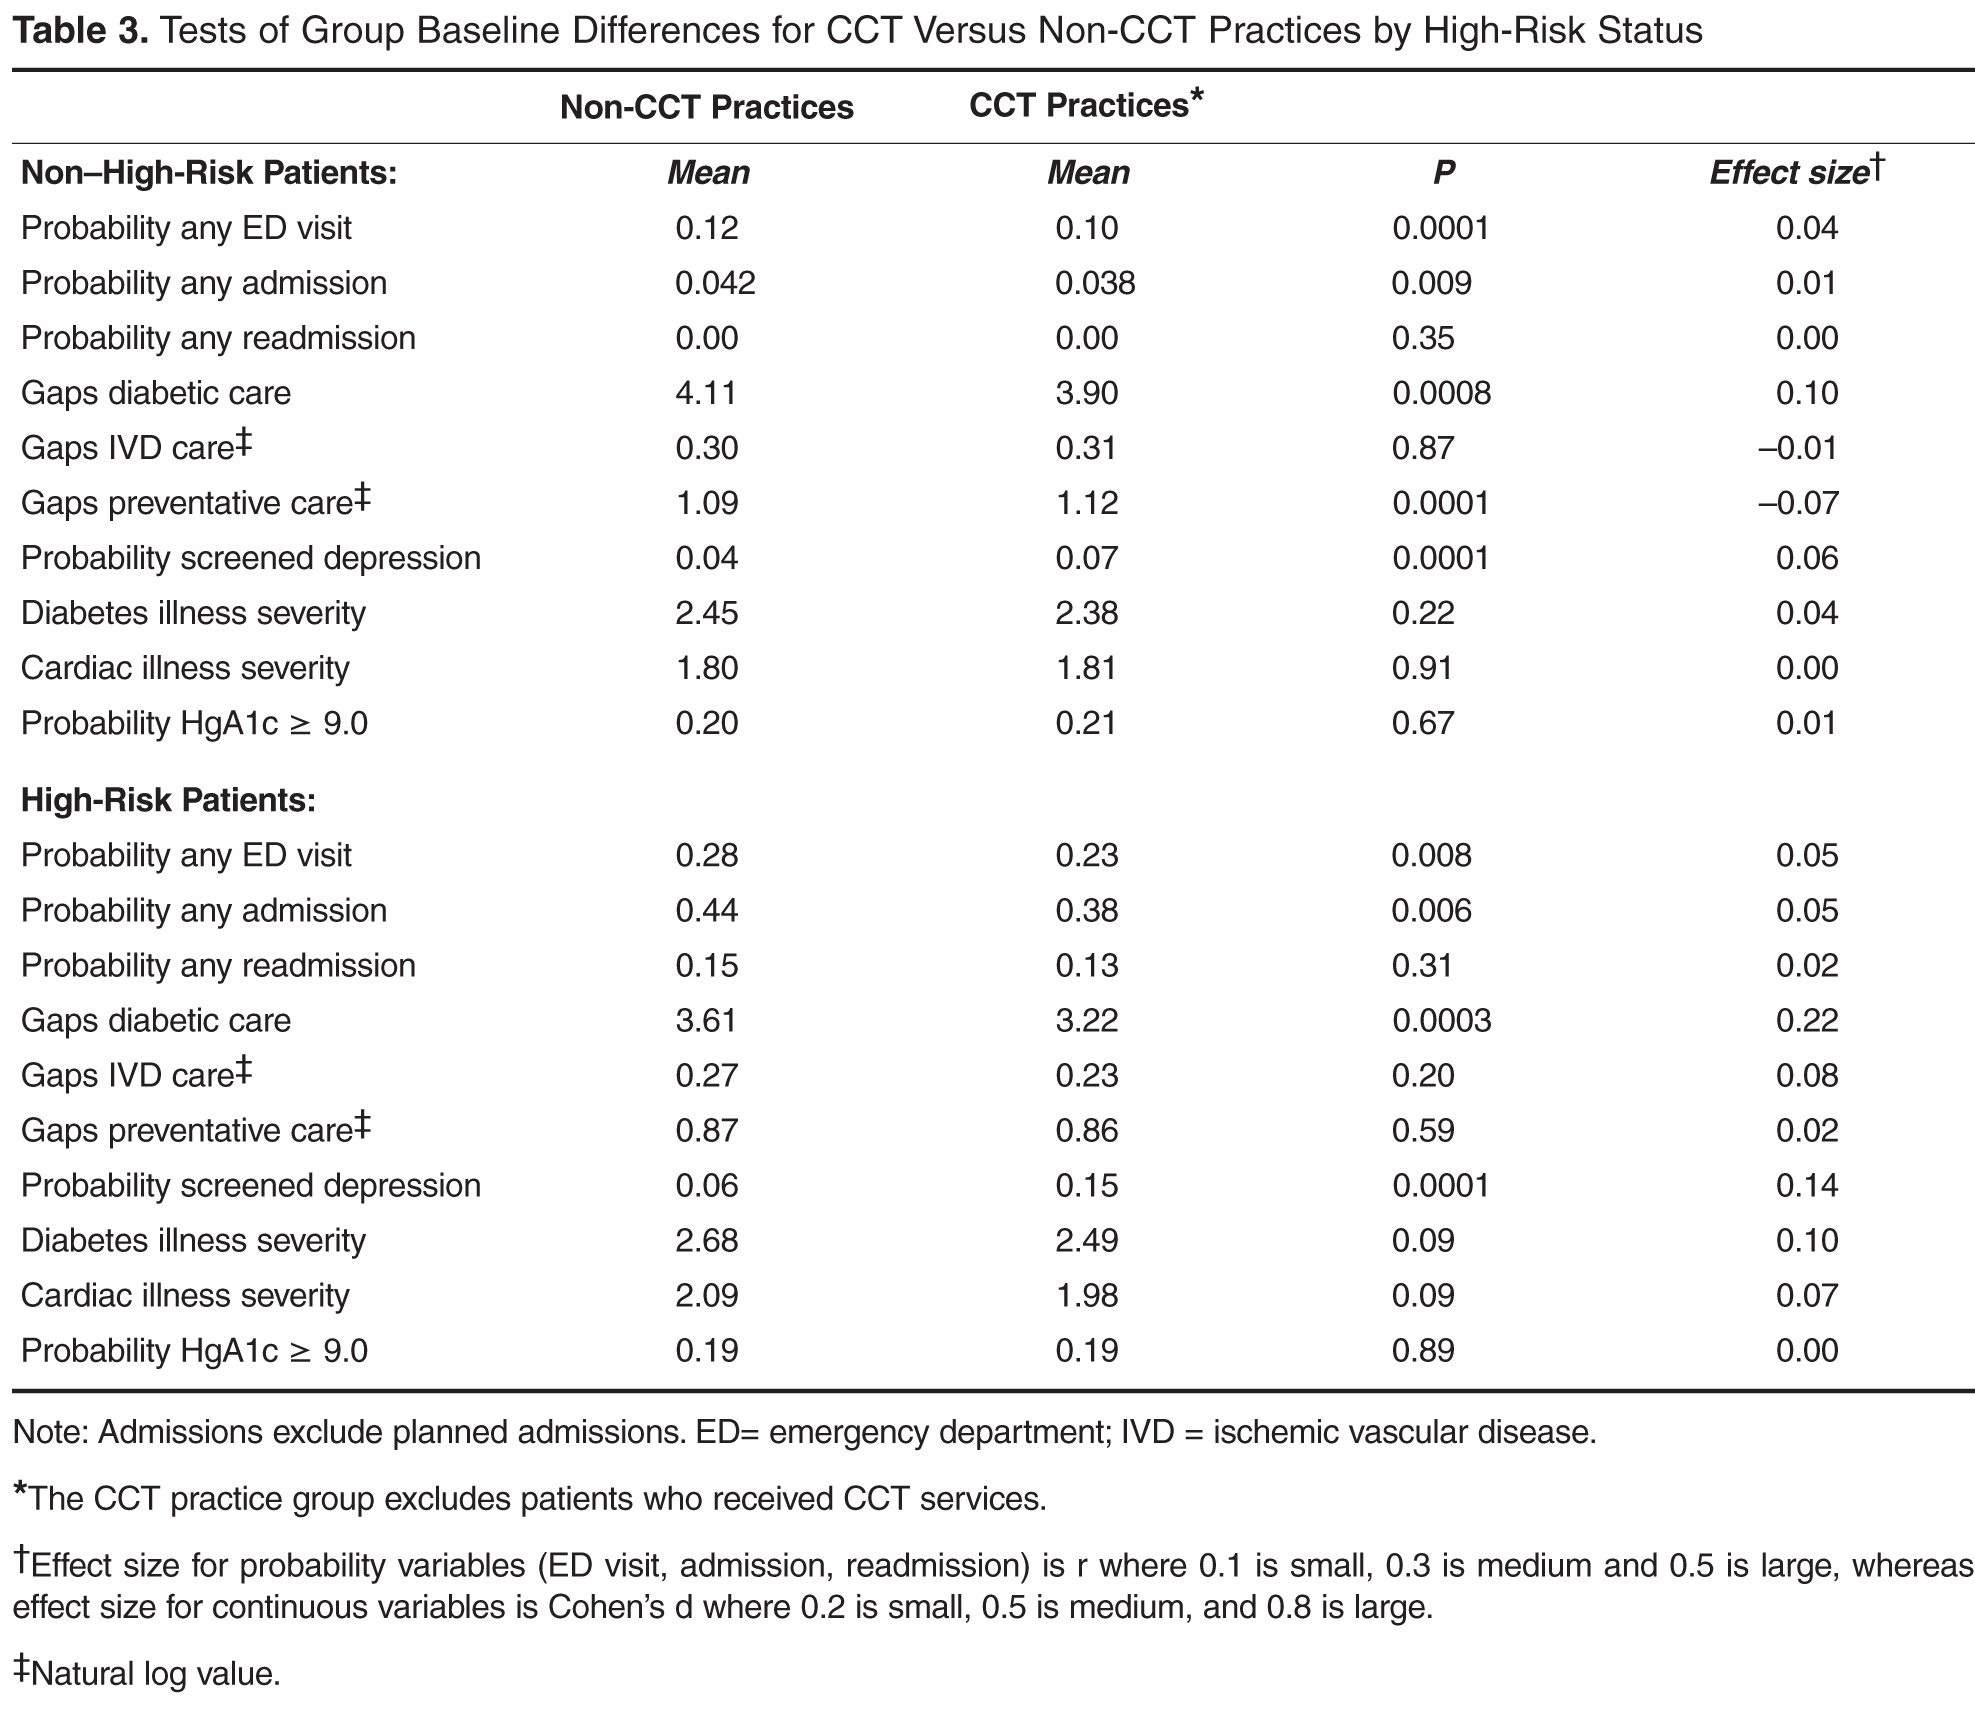
Given these group baseline differences and only one instance where the Time by Group interaction was significant where group baseline differences were absent (see below), simple pre-post analyses were conducted for each group separately (Table 4). The results for non-high-risk patients indicated that, in both CCT and non-CCT practices, there was no improvement in utilization, but there were significant reductions in gaps in diabetic and preventative care and cardiac illness severity and significant increases in depression screening, although effect sizes for the latter 2 outcomes were small to negligible. 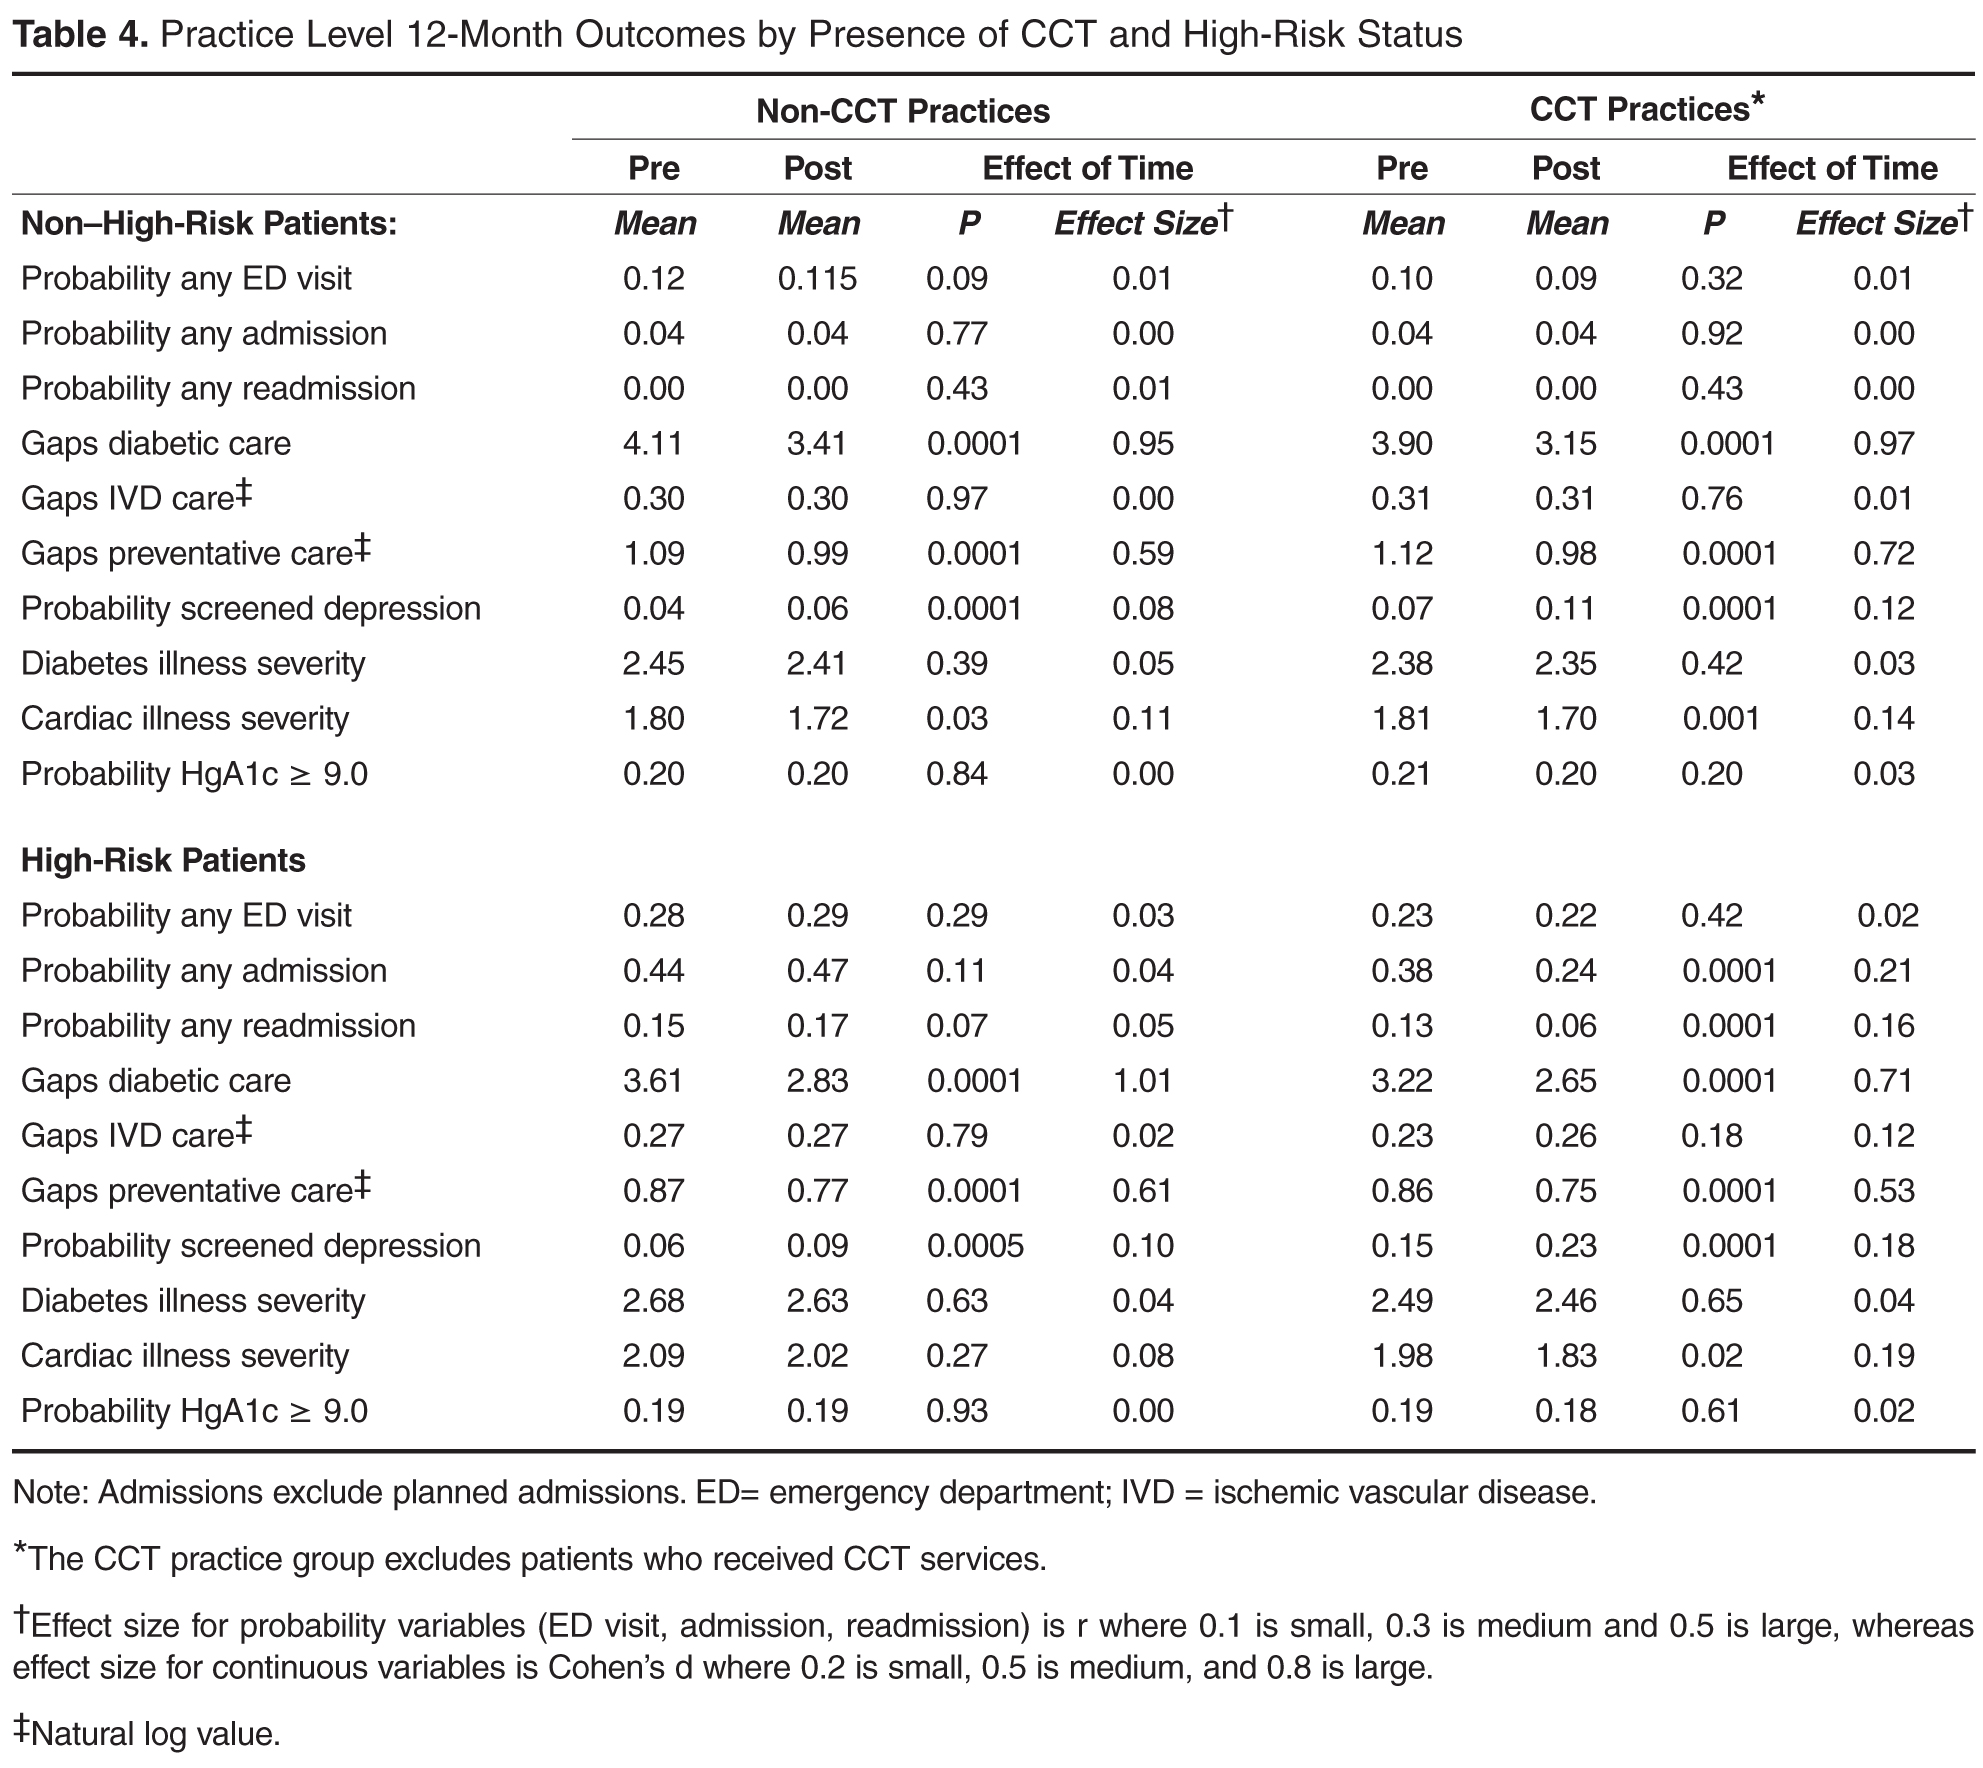
Practice joy fell in the medium range [19] at all time-points, with no notable change over time (see Appendix in the online version of this article). There was also no change in patient satisfaction (see Appendix, online), although after 12 months the “always” response for following up on lab tests was no longer higher than the national comparison and helpfulness of staff rated “never/sometimes” was below the national comparison.
Patient Level Outcomes
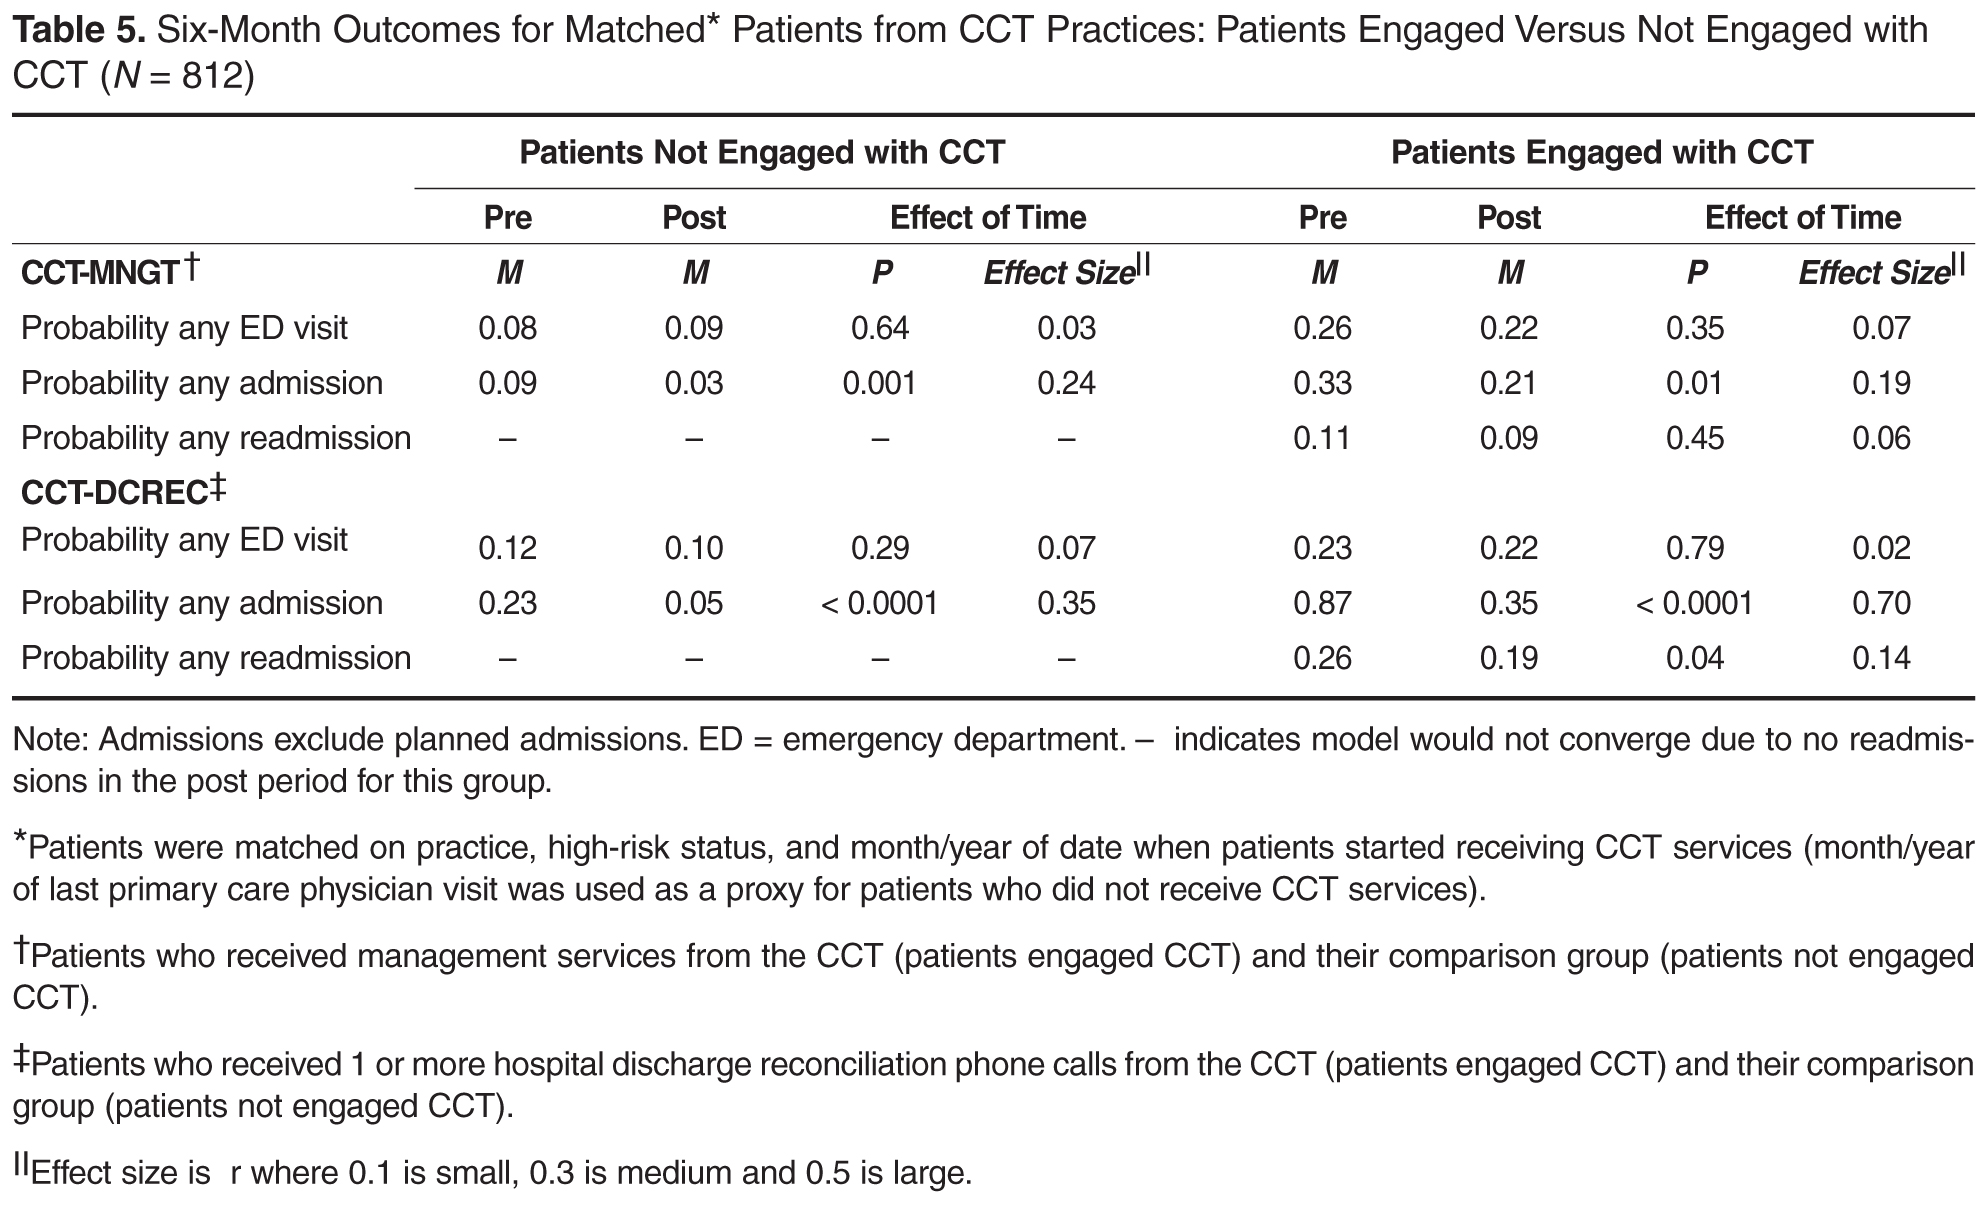
Discussion
The empirical literature indicates that PCMH practice transformation is a long, effortful process, the effects of which are not quick to manifest [20–22]. In this context, the results of the preliminary evaluation of the CCT pilot were encouraging: team-based care in the form of CCTs can be effectively used to support population health management. Overall, the results at the practice level suggest that PCMH transformation alone may be effective in creating improvements in patient care and cardiac disease (there were improvements in 3 out of 4 care gap measures and 1 disease measure for both CCT and non-CCT practices), but the presence of CCT appears necessary to reduce unplanned admissions and readmissions, at least among high-risk patients. Of course, this reduced utilization at the practice level could also be due to selection bias (practices with the longest PCMH involvement were selected for the CCT pilot) and it awaits to be seen if this finding holds as CCTs are deployed to more practices. Still, similar evidence for the CCT was found at the patient level. The probability of an unplanned admission was reduced for all groups of patients from CCT practices; however, this effect was notably large only for patients who received hospital discharge reconciliation calls from the CCT. Moreover, the only group that had a significant reduction in the probability of a 30-day readmission was also patients who received hospital discharge reconciliation calls from the CCT. Both results suggest an added benefit of CCT engagement. Although there was no change in the probability of an ED visit for any group, the CCT staff indicated that there was a substantial minority of CCT-engaged patients who were not accessing the ED when they should have been and it might be that increased appropriate use by this minority due to CCT coaching therefore cancelled out expected reductions in ED use among other CCT patients.
The intent of the current endeavor was to perform a formative evaluation [23,24] of the CCTs effectiveness. We recognized there would be analytic challenges and limits to such early-stage analyses. Nonetheless, we believed it was vital, especially given the cost of the CCTs and the growing financial pressure on health care networks more globally, to determine the preliminary effectiveness of the CCTs’, care management interventions and, if possible, suggest improvements to the intervention. As intended in formative evaluations, the evaluation is ongoing. Future analyses will bring more rigor to the evaluation and solve the data and analytic obstacles that affected the results of this first round of analyses.
A major learning of the early-stage analyses was the difficulty in developing comparison groups that are equivalent to the intervention groups at baseline. A number of matching schemes were attempted at the patient level in addition to the one presented here, but they were equally problematic. Avenues for creating more valid comparison groups in the future include the use of propensity score matching as well as drawing comparison groups from data from other networks. In addition, as time passes and more than 1 follow-up point is available for analysis, multilevel modeling can be employed which can specify different intercepts (baseline values) for groups. Still, it’s worth noting that constructing appropriate comparison groups is challenging even with those approaches: most health networks do not collect data on the most relevant matching variables (eg, health literacy, social economic status, social isolation/support) due to their cost and burden to both practices and patients.
Another major gap revealed by the early-stage analyses was the need to improve the strategy used for selecting patients for CCT intervention. In addition to many physician referrals, there was a large number of patients on the high-risk registry who required intervention relative to the small CCT staff. Various strategies to prioritize the list were attempted, including cost-related analyses. As plagued the formation of comparisons groups, it seemed the variables most critical to risk stratification were unavailable in administrative datasets. Appreciating that data collection is costly and patients and busy practices already have survey fatigue, the evaluation team examined the empirical literature for a single useful tool for ranking patients as well as constructing better matched comparison groups. This search indicated that a measure of patient activation [25–27] would be particularly helpful not only for selecting the riskiest and costliest patients for CCT intervention but also for tailoring CCT services to different types of patients. Since the implementation of the CCTs the network has also contracted with a predictive analytics company to provide risk scores for the patients.
The current formative evaluation was an important learning journey, laying important ground work for better evaluating the CCTs’ effectiveness specifically and eventually becoming an accountable care provider more generally. If the network is to provide health care more effectively and efficiently, it will need to bring greater rigor to evaluations of its various interventions and other ACO endeavors. The current formative evaluation was a valuable demonstration to non-scientists of the weakness of single group pre-post designs and how more rigorous evaluations, which include comparison groups and address confounding variables, can enhance the validity of the analytic results. This learning journey also highlighted the limitations of administrative databases and the necessity of both primary data collection and mixed methods. For example, it seems that some practices may require educational interventions to take full advantage of the CCT and qualitative assessments on practice readiness seem a necessary addition to the quantitative practice assessment to identify the specific characteristics that need strengthening. In addition, the evaluation team also recently added a qualitative sub-study on high-risk patients’ experience with the CCT to overcome locally low CAHPS response rates and capture themes broader than patient satisfaction. Upcoming rounds of analyses will also tackle other aspects of formative evaluations including the study of the CCT implementation as more practices receive CCTs and determining if process and fidelity measures of the PCMH pillars are linked to better outcomes. Furthermore, future analytic plans include identifying the active ingredients and optimal doses of the CCT intervention as well as determine the most effective matches between different types of patients and different CCT interventions (eg, behavioral, care management, social, pharmacy). While we appreciate that barriers still remain and require solutions, we hope the current evaluation highlights the utility of performing such formative evaluations.
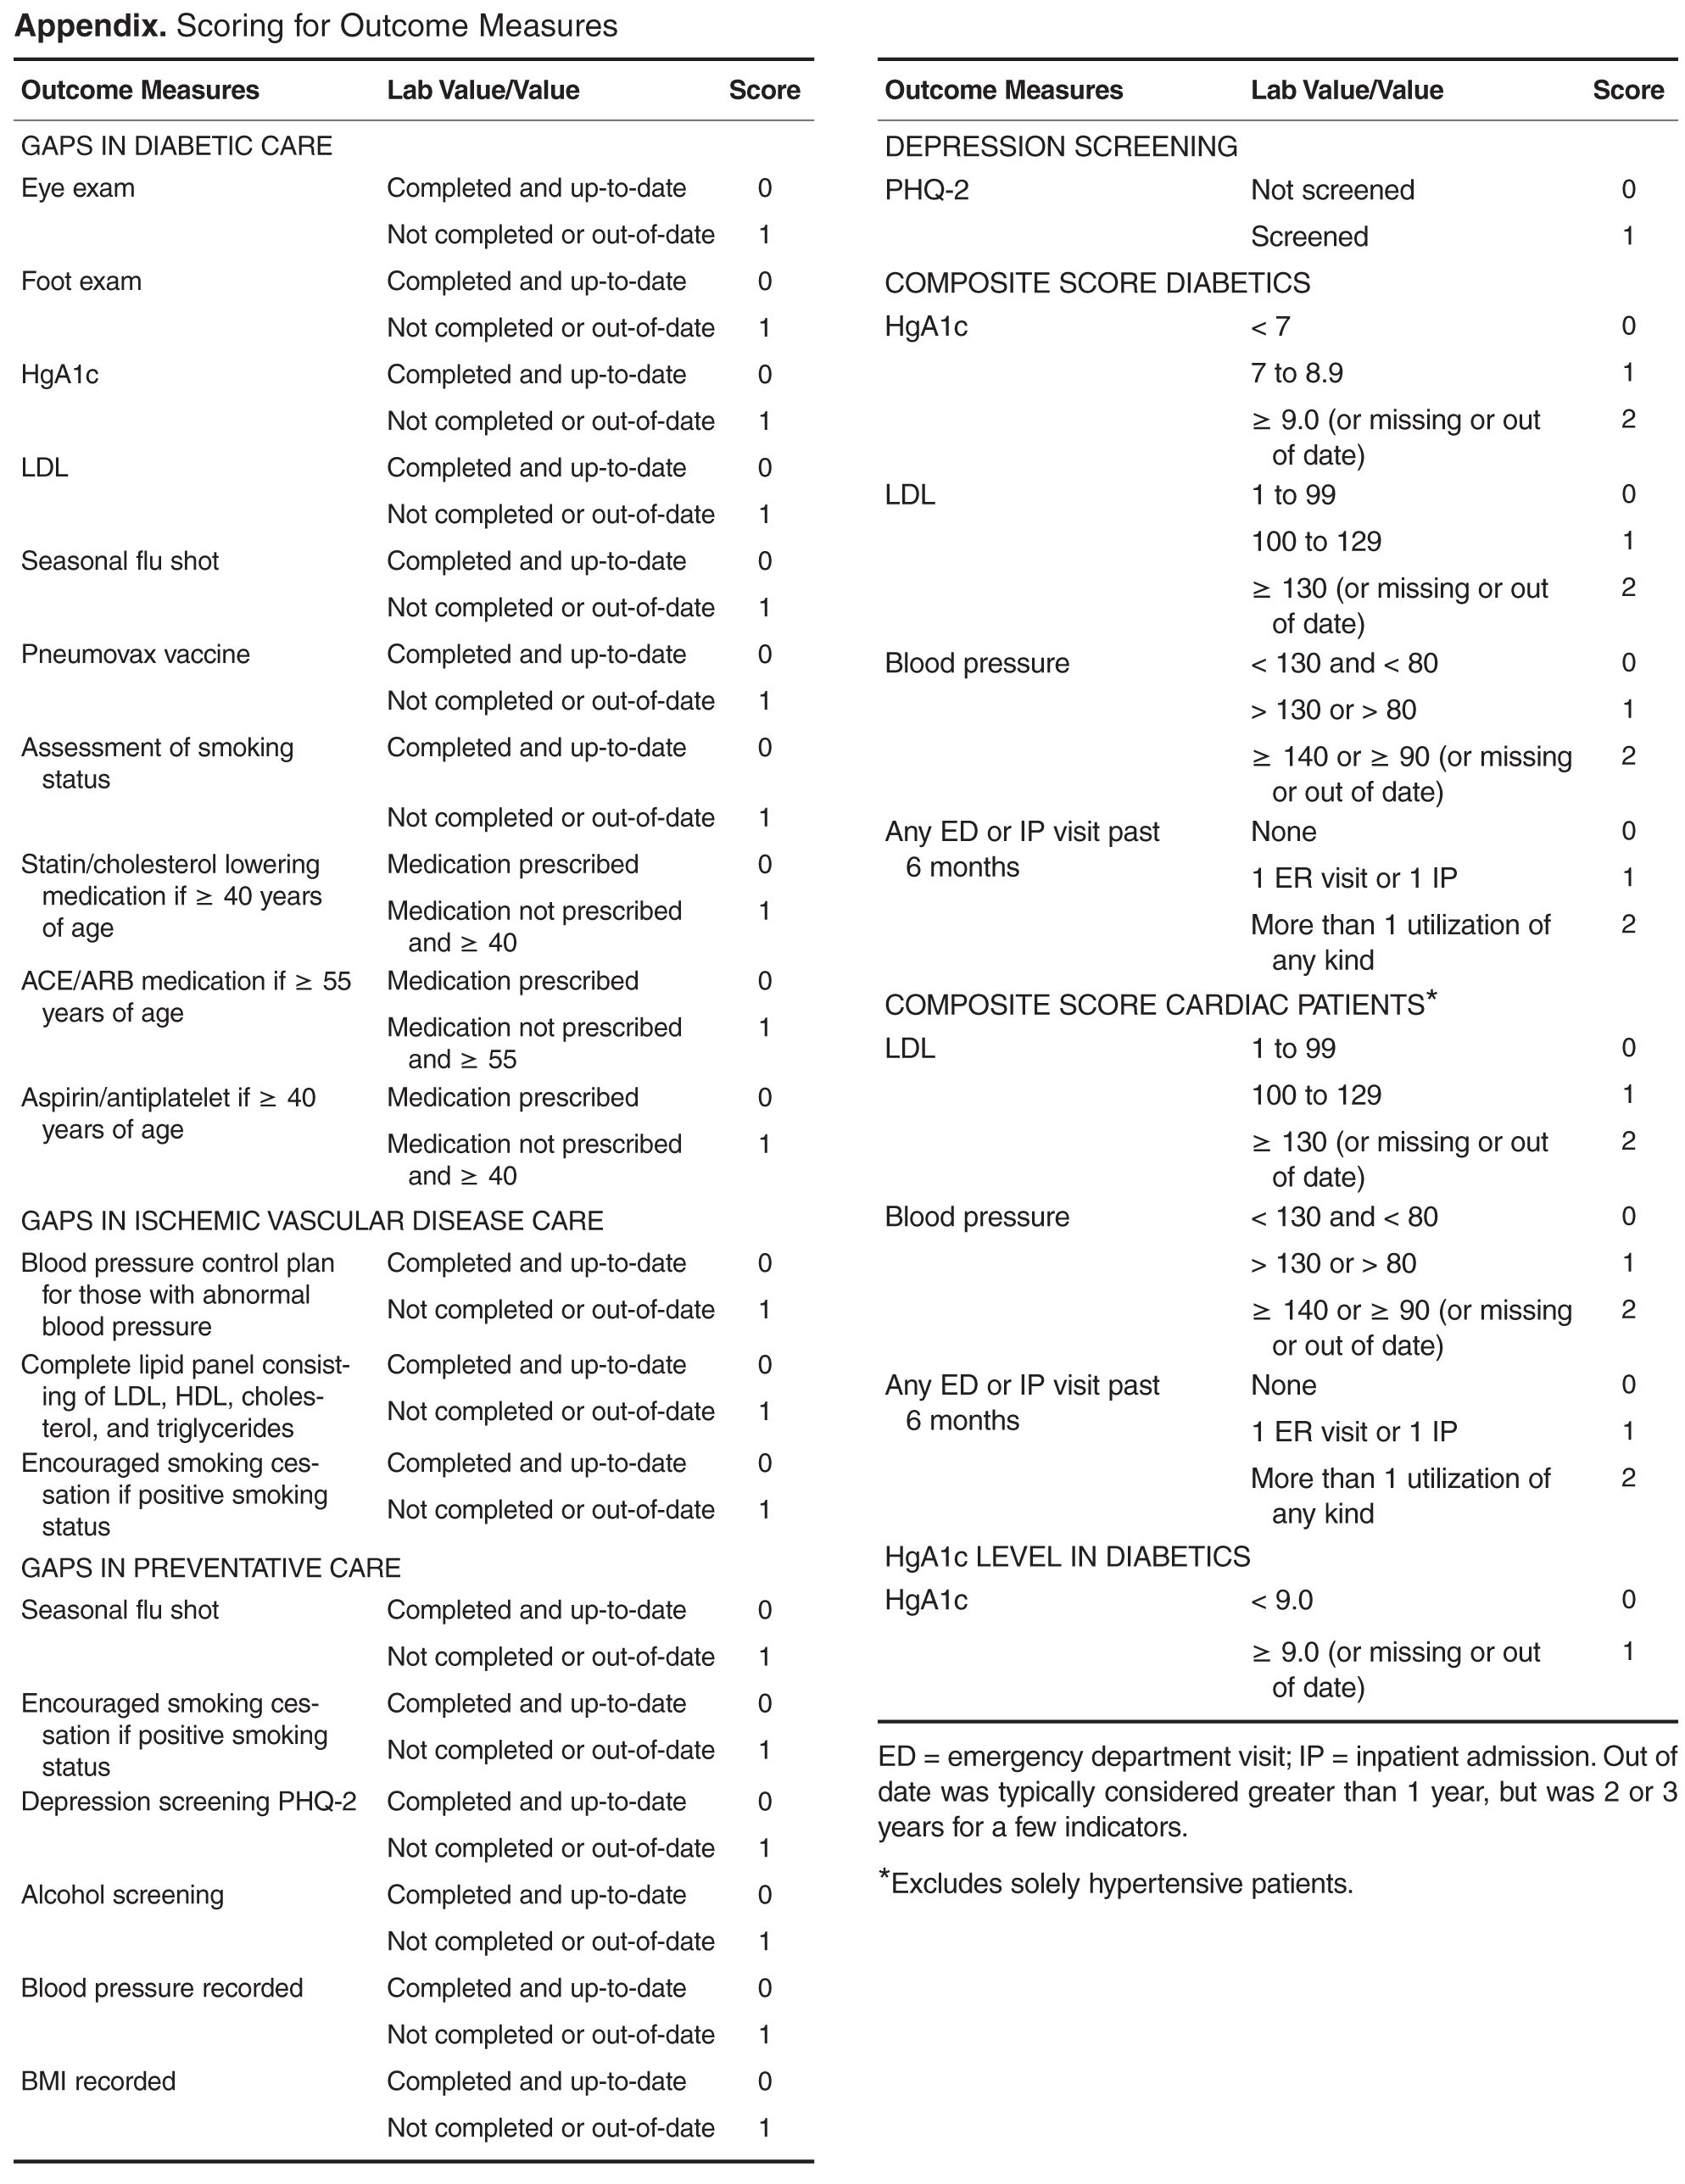
Corresponding author: Carol Foltz, PhD, Lehigh Valley Health Network, Allentown, PA, [email protected].
Funding/support: The evaluation was funded internally by Lehigh Valley Health Network and a close affiliate, the Lehigh Valley Physician Hospital Organization. The funding organizations had no role in any part of the study.
Financial disclosures: None.
1. Rittenhouse DR, Shortell SM, Fisher ES. Primary care and accountable care—two essential elements of delivery-system reform. N Engl J Med 2009;361:2301–3.
2. American Academy of Family Physicians. Primary care for the 21st century: Ensuring a quality, physician-led team for every patient. September 2012. Accessed at www.aafp.org/dam/AAFP/documents/about_us/initiatives/AAFP-PCMHWhitePaper.pdf.
3. Agency for Healthcare Research and Quality. The patient-centered medical home: Strategies to put patients at the center of primary care, February 2011. Accessed at http://pcmh.ahrq.gov/sites/default/files/attachments/Strategies%20to%20Put%20Patients%20at%20the%20Center%20of%20Primary%20Care.pdf.
4. Agency for Healthcare Research and Quality. Defining the PCMH. Accessed at http://pcmh.ahrq.gov/page/defining-pcmh.
5. Patient-Centered Primary Care Collaborative. Defining the medical home: A patient-centered philosophy that drives primary care excellence. Accessed at http://pcmh.ahrq.gov/page/defining-pcmh.
6. Margolius D, Bodenheimer T. Transforming primary care: From past practice to the practice of the future. Health Aff 2010;29:779–84.
7. Robert Graham Center. The patient centered medical home: History, seven core features, evidence and transformational change, 2007. Accessed at www.graham-center.org/online/etc/medialib/graham/documents/publications/mongraphs-books/2007/rgcmo-medical-home.Par.0001.File.tmp/rgcmo-medical-home.pdf.
8. Goldberg A. It matters how we define health care equity. Institute of Medicine. Accessed at www.iom.edu/~/media/Files/Perspectives-Files/2013/Commentaries/BPH-It-Matters-How-we-define-Health-Equity.pdf.
9. Bielaszka-DuVernay C. Vermont’s blueprint for medical homes, community health teams, and better health at lower cost. Health Aff 2011;30:383–6.
10. Bricker PL, Baron RJ, Scheirer JJ. Collaboration in Pennsylvania: rapidly spreading improved chronic care for patients to practices. J Cont Educ Health Prof 2010;30:114–25.
11.TransforMed. What does your medical home look like? A jumble of unconnected pieces or a coherent structure? Accessed at www.transformed.com/mhiq/welcome.cfm .
12. Health policy brief: care transitions. Health Aff 2012. Accessed at http://healthaffairs.org/healthpolicybriefs/brief_pdfs/healthpolicybrief_76.pdf.
13. Greenwald J, Denham C, Jack B. The hospital discharge: A review of a high-risk care transition with highlights of a reengineered discharge process. J Patient Saf 2007;3:97–106.
14. Kroenke K, Spitzer R, Williams W. The patient health questionnaire-2: validity of a two-item depression screener. Med Care 2003;41:1284–94.
15. Parker GB, Hyett MP. Measurement of well-being in the workplace: The development of the Work Well-Being Questionnaire. Nerv Ment Dis 2011;199:394-97.
16. Agency for Healthcare Research and Quality. Clinician & group expanded 12-month survey with CAHPS patient-centered medical home (PCMH) items. Accessed at https://cahps.ahrq.gov/surveys-guidance/cg/pcmh/index.html.
17. SurveyMonkey. Accessed at http://www.surveymonkey.com (last visited 06-23-2014). SurveyMonkey: Palo Alto, CA.
18. SAS [computer program]. Version 9.2. Cary, NC: SAS Institute; 2002-2008.
19. Black Dog Institute. Accessed at www.blackdoginstitute.org.au/docs/workplacewellbeingquestionnairepaperversion.pdf.
20. Jaén CR, Ferrer, RL, Miller WL, Palmer RF. Patient outcomes at 26 months in the patient-centered medical home national demonstration project. Ann Fam Med 2010;8(Suppl 1):s57–s67.
21. Solberg LI, Asche SE, Fontaine P, Flottemesch TJ. Trends in quality during medical home transformation. Ann Fam Med 2011;9:515–21.
22. Crabtree BF, Nutting PA, Miller WL, Stange KC. Summary of the national demonstration project and recommendations for the patient-centered medical home. Ann Fam Med 2010;8(Suppl 1):s80–s90.
23. Stetler CB, Legro MW, Wallace CM et al. The role of formative evaluation in implementation research and the QUERI experience. J Gen Intern Med 2006;21:S1–8.
24. Geonnotti K, Peikes D, Wang W, Smith J. Formative evaluation: fostering real-time adaptations and refinements to improve the effectiveness of patient-centered medical home models. Rockville, MD: Agency for Healthcare Research and Quality. February 2013. AHRQ Publication No. 13-0025-EF.
25. Insignia Health. Accessed at www.insigniahealth.com/solutions/patient-activation-measure.
26. Hibbard JH, Greene J, Overton V. Patients with lower activation associated with higher costs; delivery systems should know their patients’ ‘scores’. Health Aff 2013;32:216–22.
27. Hibbard JH, Greene J. What The evidence shows about patient activation: better health outcomes and care experiences fewer data on costs. Health Aff 2013;32:207–14.
From the Lehigh Valley Health Network, Allentown, PA.
Abstract
- Objective: With the growing recognition that team-based care might help meet the country’s primary care needs, this study’s objective was to evaluate the preliminary effectiveness of multidisciplinary community care teams (CCTs) deployed to primary care practices transforming into patient-centered medical homes (PCMHs).
- Methods: A nonrandomized longitudinal study design was used contrasting the CCT practices/patients with non-CCT comparison groups. Outcomes included utilization (ED/hospital use), quality indicators (QIs), practice joy, and patient satisfaction. Two CCTs (consisting of nurse care manager, behavioral health specialist, social worker, and pharmacist) were deployed to 6 primary care practices and provided services to 406 patients. Practice level analyses compared patients from the 6 CCT practices not receiving team services (29,881 patients) to 3 non-CCT practices (22,350 patients) that were also transforming toward PCMH. The comparison group for the patient level analyses (patients who received CCT services) was patients from the same CCT practice who did not receive CCT services.
- Results: At the practice level, there were significant improvements in QIs for practices both with and without CCTs. However, reductions in the probability of an admission and readmission occurred only for high-risk patients in CCT practices. At the patient level, the probability of an unplanned admission was reduced for CCT and non-CCT patients, but the probability of a readmission was only reduced in CCT patients receiving hospital discharge reconciliation calls from CCT staff.
- Conclusion: Preliminary results suggest possible added benefit of CCTs over PCMHs alone for reducing hospitalization.
As health care organizations move from a fee-for-service model to a value-based model in an accountable care environment, the transformation of primary care to patient-centered medical homes (PCMHs) is one of the fundamental strategies for achieving higher quality care at lower cost [1–3]. The core tenets of the PCMH are a commitment to high quality and safe care that is accessible, comprehensive, and coordinated across the health continuum, as well as patient-centered [4,5]. Newer to the PCMH model has been shifting the paradigm of care from individual encounters to using elements of population health management to proactively manage a panel of patients [1,3,6]. Given the array of patients seen in a primary care setting and the complexity of care required by many patients in a panel, particularly those with chronic conditions, a team approach to care capitalizes on multidisciplinary skills to collectively take responsibility for the ongoing care of the patients to improve health outcomes [7].
Multidisciplinary team-based care is considered a crucial strategy for meeting our society’s health care needs [8], especially in light of the expected shortage of primary care physicians coupled with the anticipated growth of the patient population due to the Affordable Care Act. Several different types of team-based care have been pursued. In 2003, for example, the State of Vermont pioneered health care reform through Vermont’s Blueprint for Health using principles of the PCMH that included team-based care [9]. The goal of the program was to deliver comprehensive and coordinated care to improve health outcomes for state residents. Vermont community health teams worked with primary care providers to manage short-term care for high-needs patients with an emphasis on better self-management, care coordination, chronic care management, and social and behavioral support services. An analysis of the first pilot program found significant decreases in hospital admissions and emergency department (ED) visits, and a per-person per-month reduction in costs [9].
The Lehigh Valley Health Network adapted the Vermont health improvement model to meet the unique needs of its practices that were transforming into PCMHs. When asked by leadership what would be most helpful in this transformational process, the practices cited additional staff resources to manage their high-risk patients. In response, the network enhanced support to the practices by implementing multidisciplinary teams called community care teams (CCTs), which were deployed to the practices to help manage their high-risk patients. The purpose of this study is to evaluate the effectiveness of CCTs within the PCMH model by examining key utilization, quality, and process measures. The CCTs were expected to increase the overall practice effectiveness and efficiency (practice level outcomes) by offsetting some of the workload regarding the management of high-risk patients and improving the outcomes of patients directly managed by the CCT (patient level outcomes).
Methods
Setting
Serving 5 counties, the Lehigh Valley Health Network is a large health care delivery system in southeastern PA that currently operates in a fee-for-service environment but is moving towards becoming an accountable care organization. The concept of using CCTs to support practices’ PCMH development originated with network leadership. Leadership approached 7 primary care practices with the most extensive PCMH involvement to pilot the CCT initiative (1 practice declined participation). More specifically, the practices were selected based upon their prior 3-year experience with practice transformation as a result of participating in the South Central PA Chronic Care Initiative [10] and having achieved National Committee for Quality Assurance level 3 PCMH recognition. Practice selection was also based on the results of a network-wide comprehensive practice assessment which included TransforMed’s MHIQ survey [11] of PCMH capabilities and in-house surveys to capture practice characteristics and readiness for change.
Program Design
The CCTs were designed to support 3 to 4 primary care practices in the short-term management of high-risk patients with chronic disease. Much like the Vermont community health team model, each team consisted of a RN care manager who functioned as the team lead, a behavioral health specialist, and a social worker. A clinical pharmacist was added to the CCT program shortly after implementing the project and was shared between 2 teams. The team engaged in population health management for patients identified as high-risk for poor outcomes by supporting the further development of disease self-management and goal setting skills, addressing behavioral health, social, and economic problems, and connecting the patient to other Network and community resources as needed. Furthermore, given the growing evidence demonstrating the positive impact of coordinated and continuity of care post hospital discharge on patient outcomes [12,13], the CCT also played a vital role in supporting the PCMH transition care program for high-risk patients, which involved contacting patients via the telephone within 48 business hours of discharge from the hospital to reconcile medications, assess and identify issues for follow-up, answer patient questions and coordinate appropriate appointments.
As a pilot program, 2 CCTs were deployed to 6 primary care practices (3 family medicine, 2 internal medicine, and 1 pediatric) in July 2012. Prior to engaging the practice and patients, each team member participated in an extensive orientation, which presented essential evidence-based knowledge on the CCT and PCMH models and provided application training and support in information systems, network resources, and care management.
Initially the CCT care managers forwarded the high-risk registry to each provider to review and identify the top patients for proactive care management outreach. CCT care managers then called the identified patients and/or coordinated outreach with patients through office appointments scheduled in the near future. At the same time as the registry outreach began, on-site clinician referrals to the CCT and hospital discharge reconciliation calls to patients by the CCT care manager commenced. Clinician referrals did not have to meet any formal criteria in order for that patient to receive CCT services. Ideally, the program was designed to service high-risk patients on the registry; however, the majority of patient contacts for care management emerged through day-to-day clinician referrals (not necessarily high-risk) and discharge reconciliation calls to high-risk patients for months 2 through 8 of the pilot phase. Patients' care was managed with continued, ongoing services until either patient goals were met or the patient was transferred to another practice or nursing home, expired, or declined further care management assistance. The CCT behavioral health specialist addressed short-term issues or bridged the gap or need until long-term services could be coordinated, sometimes requiring 6 to 8 meetings with a patient. CCT social worker services were assigned on a case-by-case basis and occasionally provided longer-term or intermittent need management, such as medication assistance.
Study Design and Sample
A naturalistic longitudinal study design was used to evaluate the CCT’s preliminary effectiveness. The CCTs were evaluated at 2 levels. First, based on the assumption that the CCT would off-set some of the practice workload and allow the practices to proactively manage more of their patient population, the effectiveness of the CCTs was evaluated at the practice level, ie, patients who did not receive CCT services but belonged to practices with CCTs. Second, the effectiveness of the CCTs was evaluated at the patient level, ie, patients receiving CCT services. At both levels, the CCT groups were contrasted with “non-CCT” comparison groups of convenience.
![]()
Measures
Primary outcome measures were utilization: ED visits, all-cause unplanned admissions, and 30-day readmissions. Secondary outcome measures included 2 types of quality indicators(QIs, see Appendix for scoring): (a) gaps in care measures that captured whether providers were following standards of care for diabetes, ischemic vascular disease, and prevention; and (b) patient composites which reflected patient illness severity for diabetes and cardiac disease. Higher scores indicated more gaps in care or greater disease severity. Both types of QI measures required at least a 12-month window and thus could not be computed for patients engaged with the CCT who had only a 6-month follow-up period (as their scores could reflect their pre-CCT status). In addition, comprehensive care was denoted by the provision of depression screening on the PHQ-2 [14], and whether HgA1c was greater or equal to 9.0 in diabetics served as an additional patient outcome measure. Other secondary outcome measures included practice joy via the Well-Being in the Workplace Questionnaire (WWQ) [15] and patient satisfaction from CAHPS-CG 12-month survey with PCMH items [16].
Data Collection
Utilization and quality data were extracted from the network’s hospital and outpatient electronic medical records (EMR). Practice staff were emailed every 6 months and asked to anonymously complete the WWQ via Survey Monkey [17]. At baseline, patient satisfaction surveys were distributed in the practice, and patients had the option of anonymously completing them during their visit or returning them in a prepaid envelop. While not recommended for CAHPS, this procedure had been internally used with success previously. At 12 months, the same survey was mailed to a random sample of patients with a prepaid return envelope.
At the practice level, utilization and QI data were only available for patients from 4 of the 6 practices: data were not available for 1 non-EMR practice and there was negligible variation in utilization from the pediatric practice. For the patient level analyses, utilization was available for patients in all 6 practices.
Statistical Analyses
To test whether outcomes were improved relative to a comparison group following the introduction of CCTs into the practices (practice level analyses) or CCT engagement (patient level analyses), mixed models analyses of variance with repeated measures on Time (pre- vs. post-CCT) were conducted with SAS [18] PROC MIXED and PROC GENMOD for continuous and dichotomous outcomes, respectively. To determine whether there was greater improvement in the CCT groups, all models included the interaction between Time and Group (CCT versus no CCT) in addition to their main effects. At the practice level, high-risk and non-high-risk patients were analyzed separately. And, at the patient level, CCT-MNGT and CCT-DCREC patients were analyzed separately with results adjusted for patient’s age. Some variables were not normally distributed. The quality variables were able to be normalized with natural log transformations, but utilization variables had to be dichotomized into “any” versus “none” due to severe skewness, inflated 0s and larger-valued counts. Practice joy and patient satisfaction can only be reported at the practice level (responses were aggregated within each practice because anonymous responses do not permit linking specific respondents over time and different patients were sampled across measurement occasions) and non-parametric tests (Wilcoxon signed ranked tests and tests of dependent proportions) were used to test for change over time given the small sample size (n = 6).
Results
Patient Characteristics
Practice samples had slightly more women than men (55.2%), were largely white (95.0%) and 50 years of age on average (mean = 49.53, SD = 20.18). The prevalence of diabetes (10.2%) and cardiac disease (10.4%) was relatively low. The percentage of women (56.3%) and whites (96.4%) for the patient level analytic samples was similar to the practice samples, whereas the prevalence of diabetes (33.6% ) and cardiac disease (44.6%) was notable higher and patients were more than 10 years older on average (mean = 61.62, SD = 23.96).
Practice Level Outcomes
Given these group baseline differences and only one instance where the Time by Group interaction was significant where group baseline differences were absent (see below), simple pre-post analyses were conducted for each group separately (Table 4). The results for non-high-risk patients indicated that, in both CCT and non-CCT practices, there was no improvement in utilization, but there were significant reductions in gaps in diabetic and preventative care and cardiac illness severity and significant increases in depression screening, although effect sizes for the latter 2 outcomes were small to negligible.
Practice joy fell in the medium range [19] at all time-points, with no notable change over time (see Appendix in the online version of this article). There was also no change in patient satisfaction (see Appendix, online), although after 12 months the “always” response for following up on lab tests was no longer higher than the national comparison and helpfulness of staff rated “never/sometimes” was below the national comparison.
Patient Level Outcomes
Discussion
The empirical literature indicates that PCMH practice transformation is a long, effortful process, the effects of which are not quick to manifest [20–22]. In this context, the results of the preliminary evaluation of the CCT pilot were encouraging: team-based care in the form of CCTs can be effectively used to support population health management. Overall, the results at the practice level suggest that PCMH transformation alone may be effective in creating improvements in patient care and cardiac disease (there were improvements in 3 out of 4 care gap measures and 1 disease measure for both CCT and non-CCT practices), but the presence of CCT appears necessary to reduce unplanned admissions and readmissions, at least among high-risk patients. Of course, this reduced utilization at the practice level could also be due to selection bias (practices with the longest PCMH involvement were selected for the CCT pilot) and it awaits to be seen if this finding holds as CCTs are deployed to more practices. Still, similar evidence for the CCT was found at the patient level. The probability of an unplanned admission was reduced for all groups of patients from CCT practices; however, this effect was notably large only for patients who received hospital discharge reconciliation calls from the CCT. Moreover, the only group that had a significant reduction in the probability of a 30-day readmission was also patients who received hospital discharge reconciliation calls from the CCT. Both results suggest an added benefit of CCT engagement. Although there was no change in the probability of an ED visit for any group, the CCT staff indicated that there was a substantial minority of CCT-engaged patients who were not accessing the ED when they should have been and it might be that increased appropriate use by this minority due to CCT coaching therefore cancelled out expected reductions in ED use among other CCT patients.
The intent of the current endeavor was to perform a formative evaluation [23,24] of the CCTs effectiveness. We recognized there would be analytic challenges and limits to such early-stage analyses. Nonetheless, we believed it was vital, especially given the cost of the CCTs and the growing financial pressure on health care networks more globally, to determine the preliminary effectiveness of the CCTs’, care management interventions and, if possible, suggest improvements to the intervention. As intended in formative evaluations, the evaluation is ongoing. Future analyses will bring more rigor to the evaluation and solve the data and analytic obstacles that affected the results of this first round of analyses.
A major learning of the early-stage analyses was the difficulty in developing comparison groups that are equivalent to the intervention groups at baseline. A number of matching schemes were attempted at the patient level in addition to the one presented here, but they were equally problematic. Avenues for creating more valid comparison groups in the future include the use of propensity score matching as well as drawing comparison groups from data from other networks. In addition, as time passes and more than 1 follow-up point is available for analysis, multilevel modeling can be employed which can specify different intercepts (baseline values) for groups. Still, it’s worth noting that constructing appropriate comparison groups is challenging even with those approaches: most health networks do not collect data on the most relevant matching variables (eg, health literacy, social economic status, social isolation/support) due to their cost and burden to both practices and patients.
Another major gap revealed by the early-stage analyses was the need to improve the strategy used for selecting patients for CCT intervention. In addition to many physician referrals, there was a large number of patients on the high-risk registry who required intervention relative to the small CCT staff. Various strategies to prioritize the list were attempted, including cost-related analyses. As plagued the formation of comparisons groups, it seemed the variables most critical to risk stratification were unavailable in administrative datasets. Appreciating that data collection is costly and patients and busy practices already have survey fatigue, the evaluation team examined the empirical literature for a single useful tool for ranking patients as well as constructing better matched comparison groups. This search indicated that a measure of patient activation [25–27] would be particularly helpful not only for selecting the riskiest and costliest patients for CCT intervention but also for tailoring CCT services to different types of patients. Since the implementation of the CCTs the network has also contracted with a predictive analytics company to provide risk scores for the patients.
The current formative evaluation was an important learning journey, laying important ground work for better evaluating the CCTs’ effectiveness specifically and eventually becoming an accountable care provider more generally. If the network is to provide health care more effectively and efficiently, it will need to bring greater rigor to evaluations of its various interventions and other ACO endeavors. The current formative evaluation was a valuable demonstration to non-scientists of the weakness of single group pre-post designs and how more rigorous evaluations, which include comparison groups and address confounding variables, can enhance the validity of the analytic results. This learning journey also highlighted the limitations of administrative databases and the necessity of both primary data collection and mixed methods. For example, it seems that some practices may require educational interventions to take full advantage of the CCT and qualitative assessments on practice readiness seem a necessary addition to the quantitative practice assessment to identify the specific characteristics that need strengthening. In addition, the evaluation team also recently added a qualitative sub-study on high-risk patients’ experience with the CCT to overcome locally low CAHPS response rates and capture themes broader than patient satisfaction. Upcoming rounds of analyses will also tackle other aspects of formative evaluations including the study of the CCT implementation as more practices receive CCTs and determining if process and fidelity measures of the PCMH pillars are linked to better outcomes. Furthermore, future analytic plans include identifying the active ingredients and optimal doses of the CCT intervention as well as determine the most effective matches between different types of patients and different CCT interventions (eg, behavioral, care management, social, pharmacy). While we appreciate that barriers still remain and require solutions, we hope the current evaluation highlights the utility of performing such formative evaluations.
Corresponding author: Carol Foltz, PhD, Lehigh Valley Health Network, Allentown, PA, [email protected].
Funding/support: The evaluation was funded internally by Lehigh Valley Health Network and a close affiliate, the Lehigh Valley Physician Hospital Organization. The funding organizations had no role in any part of the study.
Financial disclosures: None.
1. Rittenhouse DR, Shortell SM, Fisher ES. Primary care and accountable care—two essential elements of delivery-system reform. N Engl J Med 2009;361:2301–3.
2. American Academy of Family Physicians. Primary care for the 21st century: Ensuring a quality, physician-led team for every patient. September 2012. Accessed at www.aafp.org/dam/AAFP/documents/about_us/initiatives/AAFP-PCMHWhitePaper.pdf.
3. Agency for Healthcare Research and Quality. The patient-centered medical home: Strategies to put patients at the center of primary care, February 2011. Accessed at http://pcmh.ahrq.gov/sites/default/files/attachments/Strategies%20to%20Put%20Patients%20at%20the%20Center%20of%20Primary%20Care.pdf.
4. Agency for Healthcare Research and Quality. Defining the PCMH. Accessed at http://pcmh.ahrq.gov/page/defining-pcmh.
5. Patient-Centered Primary Care Collaborative. Defining the medical home: A patient-centered philosophy that drives primary care excellence. Accessed at http://pcmh.ahrq.gov/page/defining-pcmh.
6. Margolius D, Bodenheimer T. Transforming primary care: From past practice to the practice of the future. Health Aff 2010;29:779–84.
7. Robert Graham Center. The patient centered medical home: History, seven core features, evidence and transformational change, 2007. Accessed at www.graham-center.org/online/etc/medialib/graham/documents/publications/mongraphs-books/2007/rgcmo-medical-home.Par.0001.File.tmp/rgcmo-medical-home.pdf.
8. Goldberg A. It matters how we define health care equity. Institute of Medicine. Accessed at www.iom.edu/~/media/Files/Perspectives-Files/2013/Commentaries/BPH-It-Matters-How-we-define-Health-Equity.pdf.
9. Bielaszka-DuVernay C. Vermont’s blueprint for medical homes, community health teams, and better health at lower cost. Health Aff 2011;30:383–6.
10. Bricker PL, Baron RJ, Scheirer JJ. Collaboration in Pennsylvania: rapidly spreading improved chronic care for patients to practices. J Cont Educ Health Prof 2010;30:114–25.
11.TransforMed. What does your medical home look like? A jumble of unconnected pieces or a coherent structure? Accessed at www.transformed.com/mhiq/welcome.cfm .
12. Health policy brief: care transitions. Health Aff 2012. Accessed at http://healthaffairs.org/healthpolicybriefs/brief_pdfs/healthpolicybrief_76.pdf.
13. Greenwald J, Denham C, Jack B. The hospital discharge: A review of a high-risk care transition with highlights of a reengineered discharge process. J Patient Saf 2007;3:97–106.
14. Kroenke K, Spitzer R, Williams W. The patient health questionnaire-2: validity of a two-item depression screener. Med Care 2003;41:1284–94.
15. Parker GB, Hyett MP. Measurement of well-being in the workplace: The development of the Work Well-Being Questionnaire. Nerv Ment Dis 2011;199:394-97.
16. Agency for Healthcare Research and Quality. Clinician & group expanded 12-month survey with CAHPS patient-centered medical home (PCMH) items. Accessed at https://cahps.ahrq.gov/surveys-guidance/cg/pcmh/index.html.
17. SurveyMonkey. Accessed at http://www.surveymonkey.com (last visited 06-23-2014). SurveyMonkey: Palo Alto, CA.
18. SAS [computer program]. Version 9.2. Cary, NC: SAS Institute; 2002-2008.
19. Black Dog Institute. Accessed at www.blackdoginstitute.org.au/docs/workplacewellbeingquestionnairepaperversion.pdf.
20. Jaén CR, Ferrer, RL, Miller WL, Palmer RF. Patient outcomes at 26 months in the patient-centered medical home national demonstration project. Ann Fam Med 2010;8(Suppl 1):s57–s67.
21. Solberg LI, Asche SE, Fontaine P, Flottemesch TJ. Trends in quality during medical home transformation. Ann Fam Med 2011;9:515–21.
22. Crabtree BF, Nutting PA, Miller WL, Stange KC. Summary of the national demonstration project and recommendations for the patient-centered medical home. Ann Fam Med 2010;8(Suppl 1):s80–s90.
23. Stetler CB, Legro MW, Wallace CM et al. The role of formative evaluation in implementation research and the QUERI experience. J Gen Intern Med 2006;21:S1–8.
24. Geonnotti K, Peikes D, Wang W, Smith J. Formative evaluation: fostering real-time adaptations and refinements to improve the effectiveness of patient-centered medical home models. Rockville, MD: Agency for Healthcare Research and Quality. February 2013. AHRQ Publication No. 13-0025-EF.
25. Insignia Health. Accessed at www.insigniahealth.com/solutions/patient-activation-measure.
26. Hibbard JH, Greene J, Overton V. Patients with lower activation associated with higher costs; delivery systems should know their patients’ ‘scores’. Health Aff 2013;32:216–22.
27. Hibbard JH, Greene J. What The evidence shows about patient activation: better health outcomes and care experiences fewer data on costs. Health Aff 2013;32:207–14.
Understanding the spectrum of multiport and single-site robotics for hysterectomy
We present this video with the objective of demonstrating a hysterectomy performed using the robotic single-site approach in juxtaposition with a robotic multiport hysterectomy. In the video, and briefly here, we review the benefits, disadvantages, and challenges of robotic single-site hysterectomy.
The advantages of single-site robotic hysterectomy include:
- possible improved aesthetics for the patient
- allowance for surgeon independence while minimizing the need for a bedside assistant
- automatic reassignment of the robotic arm controls
- circumvention of certain limitations seen in laparoscopic single-site procedures.
The disadvantages of single-site robotic hysterectomy include:
- instrumentation is nonwristed and less robust than that of multiport instrumentation
- decreased degrees of freedom
- longer suturing time
- restricted assistant port use
- decreased applicability to a wide range of procedures as the surgical approach is limited to less complex and smaller pathology.
Related articles:
The robot is broadly accessible less than 10 years after its introduction to gynecologic surgery. Janelle Yates (News for your Practice; December 2013)
The robot is gaining ground in gynecologic surgery. Should you be using it? Arnold P. Advincula MD; Cheryl B. Iglesia MD; Rosanne M. Kho MD; Jamal Mourad, DO; Marie Fidela R. Paraiso, MD; Jason D. Wright, MD (Roundtable; April 2013)
Identify your learning curve for robotic hysterectomy. Joshua L Woelk, MD, MS, and John B. Gebhart, MD, MS (Guest Editorial; April 2013)
In general, each step of the single-port procedure has been found to be equivalent in time to a multiport approach to robotic-assisted hysterectomy—except for the step of vaginal cuff closure. Since the initial experience, aside from overcoming the learning curve of a new surgical approach, various techniques have been modified in order to surmount this challenge, such as closing the vaginal cuff vertically, using a cutting needle versus a tapered needle, addition of a “plus one” wristed multiport robotic arm, or replacing the single-site robotic needle driver with a multiport 5-mm needle driver.
Nevertheless, widespread adoption of single-site robotic gynecologic surgery still requires further technological improvements, and further research and experience is needed to determine its role, benefits, and applications in gynecologic surgery.
--Dr. Arnold Advincula, AAGL 2014 Scientific Program Chair
WE WANT TO HEAR FROM YOU!Share your thoughts on this article. Send your Letter to the Editor to: [email protected]

Accountable Care Organizations: Theory and Practice
Since early 2012, a growing number of independent physician groups, physician-hospital organizations, hospitals and their employed physicians, and fully integrated health systems have entered into contracts with both CMS and commercial insurers to become accountable care organizations (ACOs). It is estimated that the health care of close to 20 million patients is now being provided under such arrangements [1].
ACOs are one manifestation of payment reform intended to slow the unsustainable cost of health care in the United States. While the details of the payment models vary widely, with many combinations of fee-for-service, bundled, and capitated arrangements, the underlying goal is consistent: ACOs are held accountable for both the cost and quality of care for a specific population. While some ACO models offer the promise of shared savings alone, others offer potential savings but also entail associated risk [2]. That pre-specified quality targets have to be met before savings can be accessed is presented as a safeguard against the perceived excesses of the managed care experience of the 1990s.
To succeed as an ACO, health care organizations face sobering structural, fiscal, and—perhaps most daunting—cultural challenges. Coordinating care between providers [3,4] and across episodes and sites of care—not a traditional strength of many provider entities—will become increasingly important. Creating equitable systems to distribute whatever savings are garnered may disrupt traditional relationships between primary care and specialist providers. Convincing organizations to make the necessary investment in an “evolved” primary care infra-structure—a prerequisite for accomplishing the goals of decreasing unnecessary and expensive health resource utilization—will be problematic in an era of shrinking overall reimbursement [5]. Finally, convincing clinicians that this model means that they are quite literally “in it together” will challenge long-standing and proud departmental and divisional identities and silos [6].
Recognizing that this grand experiment is still very much in its formative stages, we nonetheless thought that this was an opportune time to examine ACOs from several perspectives. Over the next few issues and beginning with this issue [7], we will sequentially hear from an expert in health care policy analysis, a clinician-leader working in a high-functioning patient-centered medical home practice, and a team in a large health care system charged with the overall success of population health management. We are confident that you will find these observations timely, interesting, and informative. We welcome your feedback.
1. Muhlestein D. Accountable care growth in 2014: a look ahead. Health Affairs blog. 2014 Jan 29. Available at http://healthaffairs.org/blog/2014/01/29/accountable-care-growth-in-2014-a-look-ahead/.
2. Weissman JS, Bailit M, D’Andrea G, Rosenthal MB. The design and application of shared savings programs: lessons from early adopters. Health Affairs 2012;31:1959–68.
3. Greenberg JO, Barnett ML, Spinks MA, et al. The “medical neighborhood”: integrating primary and specialty care for ambulatory patients. JAMA Intern Med 2014;174:454–7.
4. Song Z, Sequist TD, Barnett ML. Patient referrals: a linchpin for increasing the value of care. JAMA. Published online July 03, 2014. Available at http://jama.jamanetwork.com/article.aspx?articleid=1886863.
5. Rittenhouse DR, Shortell SM, Fisher ES. Primary care and accountable care – two essential elements of delivery-system reform. N Engl J Med 2009;361:2301–3.
6. Song Z, Lee TH. The era of delivery system reform begins. JAMA 2013;309:35–6.
7. Song Z. Accountable care organizations: early results and future challenges. J Clin Outcomes Manag 2014;8:364–71
Since early 2012, a growing number of independent physician groups, physician-hospital organizations, hospitals and their employed physicians, and fully integrated health systems have entered into contracts with both CMS and commercial insurers to become accountable care organizations (ACOs). It is estimated that the health care of close to 20 million patients is now being provided under such arrangements [1].
ACOs are one manifestation of payment reform intended to slow the unsustainable cost of health care in the United States. While the details of the payment models vary widely, with many combinations of fee-for-service, bundled, and capitated arrangements, the underlying goal is consistent: ACOs are held accountable for both the cost and quality of care for a specific population. While some ACO models offer the promise of shared savings alone, others offer potential savings but also entail associated risk [2]. That pre-specified quality targets have to be met before savings can be accessed is presented as a safeguard against the perceived excesses of the managed care experience of the 1990s.
To succeed as an ACO, health care organizations face sobering structural, fiscal, and—perhaps most daunting—cultural challenges. Coordinating care between providers [3,4] and across episodes and sites of care—not a traditional strength of many provider entities—will become increasingly important. Creating equitable systems to distribute whatever savings are garnered may disrupt traditional relationships between primary care and specialist providers. Convincing organizations to make the necessary investment in an “evolved” primary care infra-structure—a prerequisite for accomplishing the goals of decreasing unnecessary and expensive health resource utilization—will be problematic in an era of shrinking overall reimbursement [5]. Finally, convincing clinicians that this model means that they are quite literally “in it together” will challenge long-standing and proud departmental and divisional identities and silos [6].
Recognizing that this grand experiment is still very much in its formative stages, we nonetheless thought that this was an opportune time to examine ACOs from several perspectives. Over the next few issues and beginning with this issue [7], we will sequentially hear from an expert in health care policy analysis, a clinician-leader working in a high-functioning patient-centered medical home practice, and a team in a large health care system charged with the overall success of population health management. We are confident that you will find these observations timely, interesting, and informative. We welcome your feedback.
1. Muhlestein D. Accountable care growth in 2014: a look ahead. Health Affairs blog. 2014 Jan 29. Available at http://healthaffairs.org/blog/2014/01/29/accountable-care-growth-in-2014-a-look-ahead/.
2. Weissman JS, Bailit M, D’Andrea G, Rosenthal MB. The design and application of shared savings programs: lessons from early adopters. Health Affairs 2012;31:1959–68.
3. Greenberg JO, Barnett ML, Spinks MA, et al. The “medical neighborhood”: integrating primary and specialty care for ambulatory patients. JAMA Intern Med 2014;174:454–7.
4. Song Z, Sequist TD, Barnett ML. Patient referrals: a linchpin for increasing the value of care. JAMA. Published online July 03, 2014. Available at http://jama.jamanetwork.com/article.aspx?articleid=1886863.
5. Rittenhouse DR, Shortell SM, Fisher ES. Primary care and accountable care – two essential elements of delivery-system reform. N Engl J Med 2009;361:2301–3.
6. Song Z, Lee TH. The era of delivery system reform begins. JAMA 2013;309:35–6.
7. Song Z. Accountable care organizations: early results and future challenges. J Clin Outcomes Manag 2014;8:364–71
An insider’s look at the 2014 atopic dermatitis guidelines
COEUR D’ALENE, IDAHO – The 2014 American Academy of Dermatology atopic dermatitis guidelines may already need an update, according to the cochair of the guidelines panel.
The guidelines were based upon studies published through 2012. Since then, new evidence has emerged that raises the level of uncertainty regarding several key questions the panel addressed, Dr. Robert Sidbury observed at the annual meeting of the Society for Pediatric Dermatology. Among these questions: To bathe or not to bathe? Will a child outgrow atopic dermatitis?

Serving as cochair of the guidelines committee was both a reassuring and daunting experience, according to Dr. Sidbury, chief of the division of dermatology at Seattle Children’s Hospital.
It was reassuring to note that the committee members, who included 17 atopic dermatitis experts from three countries, were free from financial conflicts as they sifted through the published data for evidence-based recommendations to inform practice. But it was daunting to learn how sketchy the supporting evidence is for some of the conventional wisdom regarding atopic dermatitis management, he explained.
By way of providing what he called "a peek behind the curtains" of the guidelines-development process, Dr. Sidbury highlighted the issue of daily bathing followed by application of emollients and moisturizers. This was among the topics the panel struggled with the most, which might come as a surprise to outsiders who consider this to be standard practice, he noted.
"It seems like a very straightforward thing. Almost everyone in this room, to a person, recommends a daily bath followed by moisturizers, yet when we examined the studies we realized that recommendation isn’t based upon much evidence," he said.
Thus, the panel concluded that bathing is "suggested" for atopic dermatitis patients, while adding that "there is no standard" for the duration or frequency of bathing. The panel rated the strength of their recommendation as C, and the level of evidence as III.
"That’s a fairly weak recommendation based upon fairly week evidence," Dr. Sidbury commented.
Moreover, since publication of the guidelines, two new studies have come forth that address the question of whether bathing plus moisturizers is beneficial in atopic dermatitis. The results conflict with each other, making recommendations even more difficult.
Data from a retrospective study of 75 patients with moderate or severe atopic dermatitis suggested that a daily 15- to 20-minute bath followed by a mid-potency topical steroid and moisturizer was indeed beneficial: 79% of subjects showed marked improvement based on Investigator’s Global Assessment at week 3, and 4% were clear (Dermatitis 2014;25:56-9).
By contrast, data from a prospective trial in which 28 children with atopic dermatitis were randomized to a daily vs. twice-weekly bath followed by appropriate care indicated that, while hydration with emollients was important, bathing frequency wasn’t (Clin. Pediatr. 2014;53:677-81).
"This paper makes me feel better about the guidelines not saying, ‘You should bathe every day,’ although that’s still my own recommendation to patients," Dr. Sidbury said.
This year also has brought two conflicting studies regarding the natural history of atopic dermatitis. A large national Taiwanese population-based cohort study of children diagnosed with atopic dermatitis within the first 2 years of life and followed from birth to age 10 years concluded that 70% of these early-onset patients eventually went into remission. A total of 19% of patients did so within the first year, and 49% in less than 4 years. The median disease duration was 4.2 years (Br. J. Dermatol. 2014;170:130-5).
On the other hand, a report from the 7,157-patient, cross-sectional, longitudinal Pediatric Eczema Elective Registry (PEER) found that by age 20, only 50% of the patients had experienced at least one symptom-free period lasting 6 months or more. The investigators concluded that atopic dermatitis is probably a lifelong disease (JAMA Dermatology 2014;150:593-600).
"That’s a provocative conclusion, and a tough thing to tell a parent," Dr. Sidbury observed. "I offer parents realistic but optimistic counsel. I tell them the tendency toward xerosis, irritancy, and infection will persist – the patient in front of you is never going to want to wear a wool sweater for the rest of their life. But the incessant itch, the need for treatment, the impact on quality of life – which is really the issue at hand – hopefully will not persist."

Since the release earlier this year of the first three of the four sections of the atopic dermatitis guidelines, Dr. Sidbury and the other panelists have received considerable feedback that the guidelines didn’t adequately address the topic of topical steroid addiction.
"Some say we missed the boat in not making coherent recommendations to parents about it. We got some very pointed comments," he conceded.
He noted that a systematic review presented at last year’s International Symposium on Atopic Dermatitis concluded that topical steroid withdrawal is a real phenomenon distinct from other topical steroid side effects. It comes in two rosacea-like variants: an erythroedematous form and a papulopustular form. An atopic dermatitis patient’s report of a burning sensation upon cessation of topical steroid therapy is a red flag.
Despite the occasional missed opportunity in drawing up the first AAD atopic guidelines in 10 years, the process was richly rewarding, Dr. Sidbury said. And although experts will continue to debate the unresolved controversies in atopic dermatitis, for him the most important lesson to emerge from the panel’s comprehensive review of the evidence was strikingly clear: "Time and time again, education trumps all. Education of patients and families leads to the best outcomes. I think that’s an important lesson to take home," he said.
Dr. Sidbury had no financial conflicts to disclose.
COEUR D’ALENE, IDAHO – The 2014 American Academy of Dermatology atopic dermatitis guidelines may already need an update, according to the cochair of the guidelines panel.
The guidelines were based upon studies published through 2012. Since then, new evidence has emerged that raises the level of uncertainty regarding several key questions the panel addressed, Dr. Robert Sidbury observed at the annual meeting of the Society for Pediatric Dermatology. Among these questions: To bathe or not to bathe? Will a child outgrow atopic dermatitis?
Serving as cochair of the guidelines committee was both a reassuring and daunting experience, according to Dr. Sidbury, chief of the division of dermatology at Seattle Children’s Hospital.
It was reassuring to note that the committee members, who included 17 atopic dermatitis experts from three countries, were free from financial conflicts as they sifted through the published data for evidence-based recommendations to inform practice. But it was daunting to learn how sketchy the supporting evidence is for some of the conventional wisdom regarding atopic dermatitis management, he explained.
By way of providing what he called "a peek behind the curtains" of the guidelines-development process, Dr. Sidbury highlighted the issue of daily bathing followed by application of emollients and moisturizers. This was among the topics the panel struggled with the most, which might come as a surprise to outsiders who consider this to be standard practice, he noted.
"It seems like a very straightforward thing. Almost everyone in this room, to a person, recommends a daily bath followed by moisturizers, yet when we examined the studies we realized that recommendation isn’t based upon much evidence," he said.
Thus, the panel concluded that bathing is "suggested" for atopic dermatitis patients, while adding that "there is no standard" for the duration or frequency of bathing. The panel rated the strength of their recommendation as C, and the level of evidence as III.
"That’s a fairly weak recommendation based upon fairly week evidence," Dr. Sidbury commented.
Moreover, since publication of the guidelines, two new studies have come forth that address the question of whether bathing plus moisturizers is beneficial in atopic dermatitis. The results conflict with each other, making recommendations even more difficult.
Data from a retrospective study of 75 patients with moderate or severe atopic dermatitis suggested that a daily 15- to 20-minute bath followed by a mid-potency topical steroid and moisturizer was indeed beneficial: 79% of subjects showed marked improvement based on Investigator’s Global Assessment at week 3, and 4% were clear (Dermatitis 2014;25:56-9).
By contrast, data from a prospective trial in which 28 children with atopic dermatitis were randomized to a daily vs. twice-weekly bath followed by appropriate care indicated that, while hydration with emollients was important, bathing frequency wasn’t (Clin. Pediatr. 2014;53:677-81).
"This paper makes me feel better about the guidelines not saying, ‘You should bathe every day,’ although that’s still my own recommendation to patients," Dr. Sidbury said.
This year also has brought two conflicting studies regarding the natural history of atopic dermatitis. A large national Taiwanese population-based cohort study of children diagnosed with atopic dermatitis within the first 2 years of life and followed from birth to age 10 years concluded that 70% of these early-onset patients eventually went into remission. A total of 19% of patients did so within the first year, and 49% in less than 4 years. The median disease duration was 4.2 years (Br. J. Dermatol. 2014;170:130-5).
On the other hand, a report from the 7,157-patient, cross-sectional, longitudinal Pediatric Eczema Elective Registry (PEER) found that by age 20, only 50% of the patients had experienced at least one symptom-free period lasting 6 months or more. The investigators concluded that atopic dermatitis is probably a lifelong disease (JAMA Dermatology 2014;150:593-600).
"That’s a provocative conclusion, and a tough thing to tell a parent," Dr. Sidbury observed. "I offer parents realistic but optimistic counsel. I tell them the tendency toward xerosis, irritancy, and infection will persist – the patient in front of you is never going to want to wear a wool sweater for the rest of their life. But the incessant itch, the need for treatment, the impact on quality of life – which is really the issue at hand – hopefully will not persist."
Since the release earlier this year of the first three of the four sections of the atopic dermatitis guidelines, Dr. Sidbury and the other panelists have received considerable feedback that the guidelines didn’t adequately address the topic of topical steroid addiction.
"Some say we missed the boat in not making coherent recommendations to parents about it. We got some very pointed comments," he conceded.
He noted that a systematic review presented at last year’s International Symposium on Atopic Dermatitis concluded that topical steroid withdrawal is a real phenomenon distinct from other topical steroid side effects. It comes in two rosacea-like variants: an erythroedematous form and a papulopustular form. An atopic dermatitis patient’s report of a burning sensation upon cessation of topical steroid therapy is a red flag.
Despite the occasional missed opportunity in drawing up the first AAD atopic guidelines in 10 years, the process was richly rewarding, Dr. Sidbury said. And although experts will continue to debate the unresolved controversies in atopic dermatitis, for him the most important lesson to emerge from the panel’s comprehensive review of the evidence was strikingly clear: "Time and time again, education trumps all. Education of patients and families leads to the best outcomes. I think that’s an important lesson to take home," he said.
Dr. Sidbury had no financial conflicts to disclose.
EXPERT OPINION FROM THE SPD ANNUAL MEETING

Accountable Care Organizations: Early Results and Future Challenges
From the Harvard Medical School and the Department of Medicine, Massachusetts General Hospital, Boston, MA.
In recent years, the growth of health care spending has climbed to the top of the domestic policy agenda. Medicare spending growth is now recognized as the biggest driver of the federal debt [1,2].Medicaid spending growth puts similar pressure on states. In the private sector, employee health care costs increasingly weigh on company balance sheets, affecting business operations and employee wages. All the while, individuals and families face insurance premium growth that far outpaces real income growth.
Out of this recent history emerged a broad recognition that health care spending growth is unsustainable at current rates. If Medicare spending continues to exceed gross domestic product (GDP) by 2.5 percentage points per year—the traditional gap over the past 4 decades—a greater than 160% increase in individual income taxes would be needed to pay for it [3].Even if the gap was 1 percentage point, the increase in income taxes needed would still be over 70%, with consequent contraction in GDP of 3% to 16% by 2015 [4,5].Other consequences, such as significant cuts in Medicare benefits or shifting of costs onto patients, are equally undesirable [6,7].
Policy options for slowing health care spending are varied. Some focus on changing the provider’s incentives, while others focus on changing the patient’s incentives. Some are based on federal solutions [8],while others are based on market solutions [9].In the current policy landscape, payment reform for physicians and hospitals has emerged as a leading candidate for addressing health care spending. Public and private payers are increasingly changing the way that providers are paid, moving away from fee-for-service towards bundled or global payments for populations of patients. Physicians and hospitals are in turn forming integrated provider organizations to take on these new payment systems. The pace of this change has been growing.
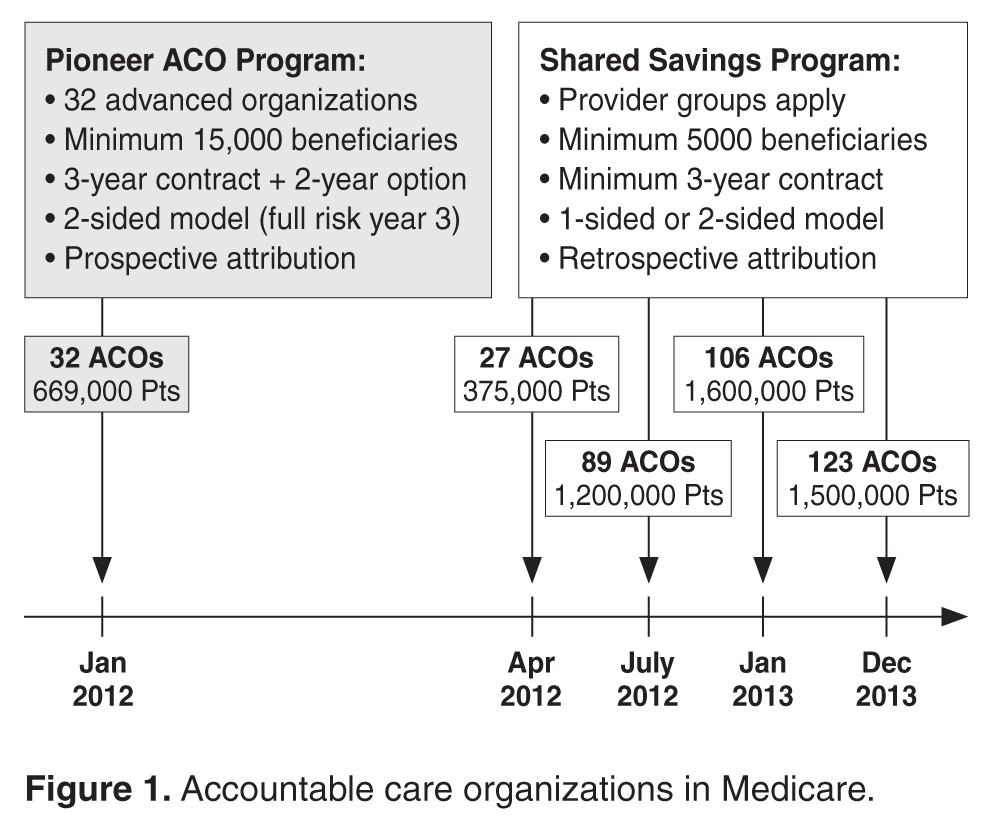
Key Features of the ACO Concept
An accountable care organization (ACO) is a group of providers—that can include both physicians and hospitals—that accepts joint responsibility for health care spending and quality for a defined population of patients. The ACO concept can be considered an extension of the staff-model health maintenance organization (HMO) [13,14].It also shares features with the patient-centered medical home (PCMH) model in its focus on a robust primary care nexus that serves to coordinate a patient’s care [15,16].Three key characteristics are embedded in this definition.
The first is joint accountability. In an ACO contract, incentives for providers are agreed upon at the organizational level. Physicians and hospitals bear the financial risks and rewards of the ACO contract together. Shared savings, quality bonuses, and other incentives are determined by how the organization performs as a whole rather than any individual physician, practice, or hospital. In this way, physicians across specialties and care settings are incentivized to approach patient care collectively and coordinate care more effectively.
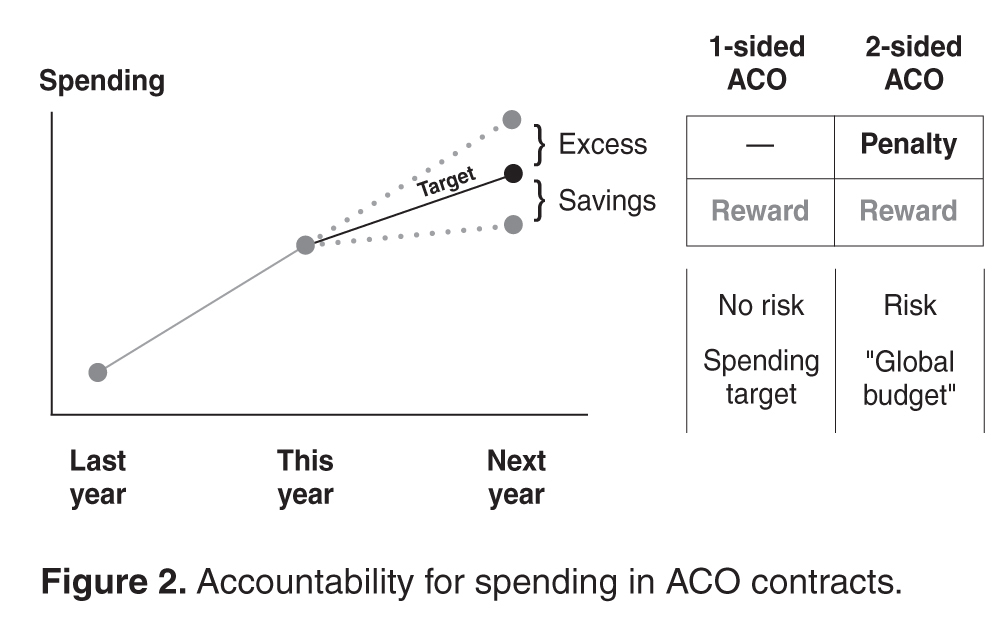
Third, an ACO is responsible for the care of a population of people. Each year, spending and quality are measured for the population attributed, or assigned, to the ACO. Attribution of patients to organizations can take place in two ways. It can be prospective, meaning that before the start of a contract year, the ACO knows exactly the patients whose spending and quality it is responsible for. This is typically more feasible in commercial ACO contracts, especially in the HMO population, where patients designate a primary care physician at the beginning of the year. Otherwise, attribution is typically retrospective, such as in the Medicare ACO programs, where beneficiaries are assigned to organizations at the end of a contract year based on the organization which accounted for the plurality of a patient’s medical spending or primary care spending.
Evidence to Date
While formal results from most ACOs today are not yet available, several notable ACO experiments have been evaluated. These include early results from the Medicare ACO programs, previous evaluations of the Medicare Physician Group Practice Demonstration (a predecessor of today’s ACO contracting model), and early results from commercial ACO contracts, such as the Blue Cross Blue Shield of Massachusetts global budget contract.
In interpreting lessons from these evaluations, several questions are worth keeping in mind. If a new payment system is correlated with changes in medical spending, is this explained by underlying changes in prices or in quantities? Since medical spending is the product of prices of services and quantities (volume) of services, an intervention that affects spending must affect either the prices or the volume of care. In the Medicare program, where prices are standardized, a global budget contract that works off of the underlying physician fee schedule would only affect spending through volume. In the private insurance sector, however, an ACO contract may affect spending through both volume and prices, since variations in prices across providers creates an opportunity for savings if care is obtained through a less expensive provider.
Separate from its relationship to medical spending, which is measured through the claims submitted by providers, what is the connection between a new payment system and total payouts from the insurer to the provider? An ACO contract contains a variety of incentives to providers that may generate additional payments from the insurer (most notably shared savings and quality bonuses). These non-claims payments may partially or entirely offset savings obtained through medical claims, making them an important dimension in the evaluation of the contract. Yet they are also different from medical claim dollars in a meaningful way. Changes in medical spending reflect underlying physician (or patient) behavior—what care is delivered and how much of it is delivered—whereas non-claims payments reflect the incentive structure of the contract.
On the quality dimension, it is worth noting whether a new payment system has similar effects on process and outcome measures. Process measures, which have been widely used by health plans, are operationally similar to additional items on a fee schedule, whereby the delivery of a service effectively generates a payment. Clinical outcome measures, such as blood pressure or cholesterol, and patient experience measures, on the other hand, cannot be fulfilled by simply checking off a box. Therefore, these measures may represent quality in a more meaningful way.
Early Results from Medicare ACOs
Thirty-two provider organizations entered the Pioneer ACO program in 2012, with about 669,000 Medicare beneficiaries attributed to these organizations. According to CMS, medical spending growth for ACO beneficiaries was 0.3% in the first year, compared to 0.8% for similar beneficiaries outside of these organizations [18].This generated a gross savings of $87.6 million in 2012, of which $33 million were returned to the Medicare trust fund. These savings were driven by 13 ACOs, with another 17 ACOs not reporting statistically significant changes in spending and 2 ACOs garnering losses with spending above the target of about $4 million total. Lower rates of admissions and readmissions largely explained the savings. A separate analysis comparing these ACOs to their local markets estimated a higher year 1 savings of $147 million dollars, driven by 8 ACOs whose savings ranged from $396 to $1224 per beneficiary per year [19].
Pioneer ACOs also earned over $76 million for quality. In the first year, quality bonuses were awarded for the reporting of quality measures rather than for performance, and all 32 ACOs successfully reported. According to CMS, Pioneer ACOs on average performed better than fee-for-service Medicare beneficiaries on 15 clinical quality measures for which comparison data were available, including blood pressure control and cholesterol control for diabetic patients. A complete analysis of quality performance is not yet available.
In the Medicare Shared Savings Program, interim results from CMS for the first 2 cohorts of ACOs showed that 29 of the 114 organizations lowered spending sufficiently enough to generate shared savings while 2 organizations had shared losses [20].This suggests that the great majority of ACOs spent close to their target. Final results on spending and quality are pending.
Results from the Medicare Physician Group Practice Demonstration
Ten provider organizations entered one-sided ACO-type contracts with Medicare in 2005 via the Physician Group Practice Demonstration. In this contract, organizations shared in savings provided that their spending was at least 2% below target and they achieved threshold performance on certain quality measures, most of which were process metrics.
In year 1, only one organization decreased spending enough to earn a shared savings, but after 3 years, five organizations had generated shared savings, although half of the savings were awarded to one organization [21].A recent analysis showed that 4 organizations sustained shared savings by the end of the program, with savings concentrated in acute care, readmissions, and beneficiaries who are dually eligible for Medicaid. Across the 10 organizations, financial performance ranged from average savings of $866 to increased spending of $749 per beneficiary per year [22].In total, about $78 million in savings were generated by this demonstration. Although a positive finding, this is a relatively small amount in the context of total Medicare expenditures [23,24].
On quality, all organizations met threshold performance on at least 29 of the 32 measures by the end of 5 years [21]. Most of these were process measures focused on coronary artery disease, diabetes, heart failure, hypertension, and preventive care [25].
Early Results from Commercial ACO Contracts
One of the early commercial ACO contracts to be evaluated was the Blue Cross Blue Shield of Massachusetts Alternative Quality Contract (AQC) [26].Initially implemented in 2009, the AQC is a multi-year contract that pays provider organizations a risk-adjusted global budget over the continuum of care. Seven organizations in Massachusetts entered the contract in the first year, and 4 more entered in 2010. Enrollees in HMO plans were prospectively attributed to their ACO by their designation of a primary care physician. The AQC is a two-sided contract that offered an additional 10% of an organization’s budget as a bonus for performance on 64 quality measures, half outpatient measures and half inpatient. Budget growth rates were tied to inflation and terms of its growth were negotiated with the organizations [27].
Over the first 2 years, the contract was associated with a decrease in medical spending of about $90 per enrollee per year, a –2.8% change (–1.9% in year 1 and –3.3% in year 2) [28].These savings were concentrated in procedures, imaging, and tests in the outpatient facility setting, and were largely explained by lower prices achieved by referring patients to less expensive providers. They were also concentrated in organizations that entered the AQC from fee-for-service, rather than prior risk contracts, and driven by enrollees with the highest expected spending. Over the second year, decreases in volume for certain services, such as percutaneous coronary interventions, began to contribute more to the savings [29].However, medical savings in the first 2 years were exceeded by non-claims payments, including shared savings and quality bonuses [27,28].The AQC was also associated with improvements in outpatient quality, including chronic care management measures (3.7 percentage points increase per year), adult preventive measures (0.4 percentage points per year), and pediatric quality measures (1.3 percentage points per year). Outcome measures such as hemoglobin A1c, LDL cholesterol, and blood pressure also showed an upward trend in the early years [28].Inpatient quality measures have yet to be examined.
Elsewhere in the country, Cigna’s Collaborative Accountable Care model was rolled out in 2009 with provider organizations in New Hampshire, Texas, and Arizona. A one-sided shared savings contract, it features a care coordination fee that is counted towards a practice’s medical spending, helping fund registered nurses who work as care coordinators. Interim results in 2012 suggested cost savings and quality improvements, but they were not statistically significant [30].A two-sided contract between Blue Shield of California and the California Public Employees’ Retirement System slowed medical costs by shortening admission and reducing readmissions [31].Most recently, an accountable care partnership between Anthem Blue Cross and HealthCare Partners physician group in California claimed $4.7 million in savings in the first half of 2013 for 55,000 patients in preferred provider organization (PPO) plans [32].These savings were driven by an 18% reduction in inpatient days, 4% reduction in overall admissions, and a 4% reduction in visits for radiology and lab tests, although specific price and volume contributions are yet unknown. Similar to the AQC, the Anthem contract is a 5-year agreement. Unlike the initial AQC contract, shared savings were tied to meeting a quality threshold and HealthCare Partners did not bear downside risk in year 1 [33].
Lessons Learned
Strengths of the ACO Model
Evidence to date points to both the potential of ACOs to slow spending and improve quality, but also the significant obstacles that they face. One of the encouraging lessons so far is that quality of care need not be threatened by a contract that rewards savings, provided that meaningful incentives for quality are in place. In both public and private two-sided contracts, process quality seemed to consistently improve. However, less is known about performance on outcome measures, which is ultimately a more meaningful metric for patients.
Broadly speaking, ACO contracts may be able to induce changes in physician behavior that could lead to medical savings. The low hanging fruit in Medicare seems to be admissions and readmissions, while that in commercial contracts may be lower prices obtained by changing referral patterns. While these medical savings reveal changes in clinical decision-making, it is still poorly understood whether clinical choices geared towards higher value can extend to areas of utilization where wasteful care may be concentrated. Little is also known about whether an ACO’s physicians and hospitals are in agreement over these changes in utilization or referral patterns, given their consequences for referral business and admissions. Moreover, there has yet to be evidence suggesting that medical savings can be larger than non-claims payments (rewards and bonuses to the ACOs) in a given year, generating net savings to the health care system. This may well take time to materialize given the initial investment costs and inducements for provider participation embedded in the early year incentives, but it is an important metric of success.
ACOs serve as a vehicle for payment reform and organizational reform among providers. They bring physicians across specialties and hospitals together under the same contractual roof, allowing the organization to determine how it allocates its resources under the spending target. Historically, policies aimed to slow health care spending have focused on either cutting prices (provider fees) or constraining volume (gatekeeping, prior authorization, and utilization review, etc.), but both types of strategies have been complicated by unintended consequences. Medicare fee cuts have traditionally been followed by compensatory increases in utilization or intensity of coding, offsetting the intended savings to a significant degree [34–37].Managed care techniques have met resistance from both physicians and patients [38,39].A spending target or budget takes an alternative approach; rather than controlling prices or quantities directly, it seeks to control total spending. Although the underlying fee schedule is retained for accounting, a spending target or especially a global budget pushes the organization to decide what care is high or low value.
A two-sided contract imposes stronger incentives on the ACO than a one-sided contract, which is both a strength and a weakness. While ACOs facing downside risk may respond earlier to the incentives, as some of the evidence thus far suggests, this risk may also propel ACOs to abandon this contracting model. In the Medicare Pioneer ACO program, for example, 9 of the 32 organizations exited the contract after year 1, which was allowed given the voluntary nature of participation. Seven organizations opted for the one-sided Medicare Shared Savings Program in year 2 and two left the ACO programs altogether. Downside risk was thought to be a principal concern for these organizations [40].Massachusetts providers in the AQC have thus far remained in the contract, but the AQC was a multi-year agreement to begin with.
Spillovers are another potential strength of the ACO model. Given that organizations care for patients across multiple payers, strong payment incentives in one payer population may affect care broadly. In the AQC, for example, recent evidence showed slowing of spending for Medicare beneficiaries associated with the contract in similar settings and categories of care as for the Blue Cross Blue Shield patients [41].
Weaknesses of the ACO Model
Still in its nascent stages, the ACO paradigm faces a number of challenges. Some relate to inherent weaknesses of the model, while others relate to the institutions and economics of the broader health care economy. At a contractual level, a key challenge is setting the target growth rate of the budget. If too low, providers may be overly constrained; if too high, providers may not have enough incentive to change practice. In an extreme case, if the target is set above what spending would have been under the old arrangement, an ACO contract can in fact be cost increasing on claims spending alone. Financial rewards such as shared savings and quality bonuses can help offset the risk, but they also make it more difficult for the ACO contract to generate net savings.
Achieving the right balance of risks and rewards is difficult. As noted above, a one-sided contract may not be strong enough to induce behavior change [42,43],but a two-sided contract may be too risky, driving providers who are unable to align incentives and coordinate care to exit the model [44].Although the percentage of shared risk borne by payer versus provider can be negotiated, putting financial risk on providers in a palatable way will be a key challenge. Financial risk can be more daunting if ACOs do not know in advance which patients they are responsible for, as in contracts with retrospective attribution rules and enrollees in unmanaged plans. A payer can help providers handle risk by sharing data on spending and identifying potential areas of overuse and low value care. Payers can help further by implementing risk corridors, providing reinsurance, or improving risk adjustment of the organization’s global budget. But with all that said, it remains to be seen whether providers around the country will be willing to bear substantive risk.
Within the ACO, a primary challenge is dividing up risks and rewards among constituent providers. How much shared savings are given to the hospital, to primary care physicians, or to specialists? What share should each specialty receive? What about shared losses, should spending exceed the target? In a two-sided ACO contract, these questions are particularly salient as global budgets change the business model for providers. Revenue centers under fee-for-service become cost centers. Organizations are confronted with difficult tradeoffs. The ability of providers across specialties to find common ground will be crucial, and leadership from providers will be key [45].Physicians have established themselves as leaders of the majority of ACOs today [46].It remains to be seen whether these organizations can keep providers together through the tradeoffs.
Patient trust in the ACO model has yet to be established. The managed care backlash of the 1990s suggests that patient buy-in will be crucial for the sustainability of ACOs. ACOs can have similarities to the HMO that traditionally produce negative associations, including downside risk, gatekeeping, or managed care techniques. To earn patients’ trust, ACOs will need to prove their value, such as through delivering better preventive care, less expensive care, more holistic care through stronger teams of providers, or smoother transitions of care across settings. The task of primary care medical homes to provide patient-centered care and coordinate across specialists effectively will be crucial. While today’s ACOs may be better positioned because of risk sharing, quality bonuses, risk adjustment, electronic medical records, or other innovations, the patient’s experience may ultimately be the arbiter.
Broader Challenges
While clinical integration is a central tenet of ACOs, consolidation between providers is simultaneously a chief concern for policymakers. Consolidation generally reduces competition and drives up prices, which is at odds with the goals of cost containment [47,48].Across the nation, physicians are consolidating with hospitals and health systems at an increasing rate, with recent surveys reporting that the proportion of independent physicians has steadily declined to below 50% [49–52].Increasing the number of covered lives is a dominant growth strategy under risk contracts, and more covered lives also increases an ACO’s bargaining power during acquisitions of specialist practices, whose referrals are better protected by inclusion in the provider network. As this trend continues, its effect on commercial prices will likely be scrutinized [53,54].
The ACO paradigm may also have significant effects on the physician labor market. Over the past 4 decades, the rate of physician specialization has grown dramatically [55].Fee-for-service incentives were aligned with specialization, but a rapid transition to alternative payment systems may disrupt the more gradually evolving physician labor market. Most medical school graduates today choose to specialize, as do most graduates of general medicine training programs [56,57],yet it is unclear to what degree the demand for specialists will continue to grow in the accountable care era. Specialty services tend to be of higher cost than generalist services. In some situations, high-cost services are more likely to be of lower value [58–60].Yet having specialists allows an organization to integrate services across the continuum of care, for which they are now financially responsible. As a new generation of specialists prepares to enter practice, whether the health care system will be able to support them and fulfill their expectations about their practice environment may be in question.
Looking into the Future
The landscape of payment and organization in health care will likely continue to migrate towards the ACO concept [61,62]. As the federal government, states, and individual payers move in similar directions, physicians and hospitals will face increasing pressures to change and adapt to new incentives surrounding cost and quality. Whether ACOs succeed in slowing spending while improving quality may have important ramifications for future stages of health care reform. For example, the growing debate in Washington, DC, over the future of Medicare financing may be informed, in part, by whether ACOs succeed within the traditional Medicare program. Market-based reforms, such as converting Medicare into a premium support program whereby private insurers compete to insure Medicare beneficiaries for a pre-defined contribution from the federal government, have been gaining momentum in recent years. Although not without concerns, such proposals would expect to gain consideration if the ACO model does not succeed.
Perhaps the most meaningful contribution of the ACO model is that it gives providers a reason to change the culture of medicine. It asks providers across specialties to work together and coordinate care in a way that was not rewarded under fee-for-service. It asks organizations to stitch the separate pieces of the patient’s care trajectory together through teamwork. In the long run, this may be the most intangible but substantive legacy that the ACO model provides. Under a single, collective contract at the organizational level, providers are quite literally in it together. If providers can break down silos, improve care coordination, and manage population health with a collective vision towards keeping patients healthy, the ACO paradigm would be able to claim a profound achievement. Such changes, however, will take time and they are not guaranteed.
Corresponding author: Zirui Song, MD, PhD, Department of Medicine, Massachusetts General Hospital, 55 Fruit St., Boston, MA 02114, [email protected].
Funding/support: Supported by a grant from the National Institute on Aging F30 AG039175.
Financial disclosures: None.
1. Orszag PR, Ellis P. The challenge of rising health care costs—a view from the Congressional Budget Office. N Engl J Med 2007;357:1793–5.
2. Chernew ME, Hirth RA, Cutler DM. Increased spending on health care: long- term implications for the nation. Health Aff (Millwood) 2009;28:1253–5.
3. Congressional Budget Office. Financing projected spending in the long run. Washington, DC: Congressional Budget Office; 2007 Jul 9.
4. Financing projected spending in the long run: letter from Peter R. Orszag, director, Congressional Budget Office, to Senator Judd Gregg, 9 Jul 2007.
5. Baicker K, Chernew ME. The economics of financing Medicare. N Engl J Med 2011;28;365:e7.
6. Chernew ME, Baicker K, Hsu J. The specter of financial armageddon—health care and federal debt in the United States. N Engl J Med 2010;362:1166–8.
7. Newhouse JP. Assessing health reform’s impact on four key groups of Americans. Health Aff (Millwood). 2010;29:1714–24.
8. Emanuel E, Tanden N, Altman S, et al. A systemic approach to containing health care spending. N Engl J Med 2012;367:949–54.
9. Antos JR, Pauly MV, Wilensky GR. Bending the cost curve through market-based incentives. N Engl J Med 2012;367:954–8.
10. Centers for Medicare and Medicaid Services. More partnerships between doctors and hospitals strengthen coordinated care for Medicare beneficiaries. 2013 Dec 23.
11. Fisher ES, McClellan MB, Safran DG. Building the path to accountable care. N Engl J Med 2011;365:2445–7.
12. Muhlestein D. Accountable care growth in 2014: a look ahead. Health Affairs Blog. 2014 Jan 29. Available at http://healthaffairs.org/blog/2014/01/29/accountable-care-growth-in-2014-a-look-ahead/.
13. Fisher ES, Shortell SM. Accountable care organizations: accountable for what, to whom, and how. JAMA 2010;304:1715–6.
14. Fisher ES, Staiger DO, Bynum JP, Gottlieb DJ. Creating accountable care organizations: the extended hospital medical staff. Health Aff (Millwood) 2007;26:w44–w57.
15. Rittenhouse DR, Shortell SM. The patient-centered medical home: will it stand the test of health reform? JAMA 2009;301:2038–40.
16. Bodenheimer T, Grumbach K, Berenson RA. A lifeline for primary care. N Engl J Med 2009;360:2693–6.
17. Centers for Medicare and Medicaid Services. Improving quality of care for Medicare patients: accountable care organizations. 2011 Oct 20.
18. Centers for Medicare and Medicaid Services. Press release: Pioneer accountable care organizations succeed in improving care, lowering costs. 2013 Jul 16. Available at www.cms.gov/Newsroom/MediaReleaseDatabase/Press-Releases/2013-Press-Releases-Items/2013-07-16.html.
19. L&M Policy Research. Effect of Pioneer ACOs on Medicare spending in the first year. 2013 Nov 3. Available at http://innovation.cms.gov/Files/reports/PioneerACOEvalReport1.pdf.
20. Centers for Medicare and Medicaid Services. Performance year 1 interim results for ACOs that started in April and July 2012. 2014 Jan 30. Available at www.cms.gov/Medicare/Medicare-Fee-for-Service-Payment/sharedsavingsprogram/Downloads/PY1-InterimResultsTable.pdf.
21. Wilensky GR. Lessons from the Physician Group Practice Demonstration — a sobering reflection. N Engl J Med 2011;365:1659–61.
22. Colla CH, Wennberg DE, Meara E, et al. Spending differences associated with the Medicare Physician Group Practice Demonstration. JAMA 2012;308:1015–23.
23. Berwick DM. Launching accountable care organizations—the proposed rule for the Medicare Shared Savings Program N Engl J Med 2011;364:e32.
24. Haywood TT, Kosel KC. The ACO model—a three-year financial loss? N Engl J Med 2011;364.
25. Iglehart JK. Assessing an ACO prototype—Medicare’s Physician Group Practice Demonstration. N Engl J Med 2011;364:198–200.
26. Chernew ME, Mechanic RE, Landon BE, Safran DG. Private-payer innovation in Massachusetts: the “Alternative Quality Contract.” Health Aff (Millwood). 2011;30:51–61.
27. Song Z, Safran DG, Landon BE, et al. Health care spending and quality in year 1 of the alternative quality contract. N Engl J Med 2011;365:909–18.
28. Song Z, Safran DG, Landon BE, et al. The ‘Alternative Quality Contract,’ based on a global budget, lowered medical spending and improved quality. Health Aff (Millwood). 2012;31:1885–94.
29. Song Z, Fendrick AM, Safran DG, et al. Global budgets and technology-intensive medical services. Healthcare (Amst) 2013;1:15–21.
30. Salmon RB, Sanderson MI, Walters BA, et al. A collaborative accountable care model in three practices showed promising early results on costs and quality of care. Health Aff (Millwood). 2012;31:2379–87.
31. Markovich P. A global budget pilot project among provider partners and Blue Shield of California led to savings in first two years. Health Aff (Millwood) 2012;31:1969–76.
32. Terhune C. Anthem, HealthCare Partners save $4.7 million by coordinating care. Los Angeles Times. 2014 Jun 6. Available at www.latimes.com/business/money/la-fi-anthem-healthcare-partners-20140605-story.html.
33. Gbemudu JN, Larson BK, Van Citters AD, et al. HealthCare Partners: building on a foundation of global risk management to achieve accountable care. Commonwealth Fund Pub. 1572, Vol 2. 2012 Jan.
34. Rice TH. The impact of changing Medicare reimbursement rates on physician- induced demand. Med Care 1983;21:803–15.
35. Nguyen NX, Derrick FW. Physician behavioral response to a Medicare price reduction. Health Serv Res 1997;32:283–98.
36. Yip WC. Physician response to Medicare fee reductions:changes in the volume of coronary artery bypass graft (CABG) surgeries in the Medicare and private sectors. J Health Econ 1998;17:675–99.
37. Song Z, Ayanian JZ, Wallace J, et al. Unintended consequences of eliminating medicare payments for consultations. JAMA Intern Med 2013;173:15–21.
38. Marquis MS, Rogowski JA, Escarce JJ. The managed care backlash: did consumers vote with their feet? Inquiry 2004-2005 Winter;41:376–90.
39. Cooper PF, Simon KI, Vistnes J. A closer look at the managed care backlash. Med Care 2006 May;44(5 Suppl):I4–11.
40. Song Z. Pioneer accountable care organizations: lessons from year 1. In: Curfman G, Morrissey S, Morse G, Prokesch S, editors. Insight Center: leading health care innovation. N Engl J Med/Harv Bus Rev. 2013 Oct 8. Available at http://images.nejm.org/editorial/supplementary/2013/hbr06-song.pdf.
41. McWilliams JM, Landon BE, Chernew ME. Changes in health care spending and quality for Medicare beneficiaries associated with a commercial ACO contract. JAMA 2013;310:829–36.
42. Berenson RA. Shared savings program for accountable care organizations: a bridge to nowhere? Am J Manag Care 2010;16:721–6.
43. Meyer H. Accountable care organization prototypes: winners and losers? Health Aff (Millwood) 2011;30:1227–31.
44. Burns LR, Pauly MV. Accountable care organizations may have difficulty avoiding the failures of integrated delivery networks of the 1990s. Health Aff (Millwood) 2012;31:2407–16.
45. Song Z, Lee TH. The era of delivery system reform begins. JAMA 2013;309:35–6.
46. Colla CH, Lewis VA, Shortell SM, Fisher ES. First national survey of ACOs finds that physicians are playing strong leadership and ownership roles. Health Aff (Millwood) 2014;33:964–71.
47. Baicker K, Levy H. Coordination versus competition in health care reform. N Engl J Med 2013;369:789–91.
48. Baker LC, Bundorf MK, Kessler DP. Vertical integration: hospital ownership of physician practices is associated with higher prices and spending. Health Aff (Millwood). 2014;33:756–63.
49. Isaacs SL, Jellinek PS, Ray WL. The independent physician--going, going.... N Engl J Med 2009;360:655–7.
50. Kocher R, Sahni NR. Hospitals’ race to employ physicians--the logic behind a money-losing proposition. N Engl J Med 2011;364:1790–3.
51. Gold J. Hospitals lure doctors away from private practice. Kaiser Health News, October 12, 2010.
52. Accenture. Clinical transformation: new business models for a new era in healthcare. 2012. Available at www.accenture.com/SiteCollectionDocuments/PDF/Accenture-Clinical-Transformation-New-Business-Models-for-a-New-Era-in-Healthcare.pdf.
53. Fraud and abuse: Leibenluft RF. ACOs and the enforcement of fraud, abuse, and antitrust laws. N Engl J Med 2011;364:99–101.
54. Kreindler SA, Larson BK, Wu FM, et al. Interpretations of integration in early accountable care organizations. Milbank Q 2012;90:457–83.
55. Cassel CK, Reuben DB. Specialization, subspecialization, and subsubspecialization in internal medicine. N Engl J Med 2011;364:1169–73.
56. West CP, Dupras DM. General medicine vs subspecialty career plans among internal medicine residents. JAMA 2012;308:2241–7.
57. Schwartz MD, Durning S, Linzer M, Hauer KE. Changes in medical students’ views of internal medicine careers from 1990 to 2007. Arch Intern Med 2011;171:744-749.
58. Schwartz AL, Landon BE, Elshaug AG, et al. Measuring low-value care in Medicare. JAMA Intern Med 2014 May 12. [Epub ahead of print]
59. American Board of Internal Medicine Foundation. Choosing wisely: lists of five things physicians and patients should question. Accessed 26 May 2013 at www.choosingwisely.org/doctor-patient-lists/.
60. Cassel CK, Guest JA. Choosing Wisely: helping physicians and patients make smart decisions about their care. JAMA 2012;307:1801–2.
61. Lewis VA, Colla CH, Carluzzo KL, et al. Accountable care organizations in the United States: market and demographic factors associated with formation. Health Serv Res 2013;48(6 Pt 1):1840–58.
62. Conrad D, Grembowski D, Gibbons C, et al. A report on eight early-stage state and regional projects testing value-based payment. Health Aff (Millwood) 2013;32:998–1006.
From the Harvard Medical School and the Department of Medicine, Massachusetts General Hospital, Boston, MA.
In recent years, the growth of health care spending has climbed to the top of the domestic policy agenda. Medicare spending growth is now recognized as the biggest driver of the federal debt [1,2].Medicaid spending growth puts similar pressure on states. In the private sector, employee health care costs increasingly weigh on company balance sheets, affecting business operations and employee wages. All the while, individuals and families face insurance premium growth that far outpaces real income growth.
Out of this recent history emerged a broad recognition that health care spending growth is unsustainable at current rates. If Medicare spending continues to exceed gross domestic product (GDP) by 2.5 percentage points per year—the traditional gap over the past 4 decades—a greater than 160% increase in individual income taxes would be needed to pay for it [3].Even if the gap was 1 percentage point, the increase in income taxes needed would still be over 70%, with consequent contraction in GDP of 3% to 16% by 2015 [4,5].Other consequences, such as significant cuts in Medicare benefits or shifting of costs onto patients, are equally undesirable [6,7].
Policy options for slowing health care spending are varied. Some focus on changing the provider’s incentives, while others focus on changing the patient’s incentives. Some are based on federal solutions [8],while others are based on market solutions [9].In the current policy landscape, payment reform for physicians and hospitals has emerged as a leading candidate for addressing health care spending. Public and private payers are increasingly changing the way that providers are paid, moving away from fee-for-service towards bundled or global payments for populations of patients. Physicians and hospitals are in turn forming integrated provider organizations to take on these new payment systems. The pace of this change has been growing.
Key Features of the ACO Concept
An accountable care organization (ACO) is a group of providers—that can include both physicians and hospitals—that accepts joint responsibility for health care spending and quality for a defined population of patients. The ACO concept can be considered an extension of the staff-model health maintenance organization (HMO) [13,14].It also shares features with the patient-centered medical home (PCMH) model in its focus on a robust primary care nexus that serves to coordinate a patient’s care [15,16].Three key characteristics are embedded in this definition.
The first is joint accountability. In an ACO contract, incentives for providers are agreed upon at the organizational level. Physicians and hospitals bear the financial risks and rewards of the ACO contract together. Shared savings, quality bonuses, and other incentives are determined by how the organization performs as a whole rather than any individual physician, practice, or hospital. In this way, physicians across specialties and care settings are incentivized to approach patient care collectively and coordinate care more effectively.
Third, an ACO is responsible for the care of a population of people. Each year, spending and quality are measured for the population attributed, or assigned, to the ACO. Attribution of patients to organizations can take place in two ways. It can be prospective, meaning that before the start of a contract year, the ACO knows exactly the patients whose spending and quality it is responsible for. This is typically more feasible in commercial ACO contracts, especially in the HMO population, where patients designate a primary care physician at the beginning of the year. Otherwise, attribution is typically retrospective, such as in the Medicare ACO programs, where beneficiaries are assigned to organizations at the end of a contract year based on the organization which accounted for the plurality of a patient’s medical spending or primary care spending.
Evidence to Date
While formal results from most ACOs today are not yet available, several notable ACO experiments have been evaluated. These include early results from the Medicare ACO programs, previous evaluations of the Medicare Physician Group Practice Demonstration (a predecessor of today’s ACO contracting model), and early results from commercial ACO contracts, such as the Blue Cross Blue Shield of Massachusetts global budget contract.
In interpreting lessons from these evaluations, several questions are worth keeping in mind. If a new payment system is correlated with changes in medical spending, is this explained by underlying changes in prices or in quantities? Since medical spending is the product of prices of services and quantities (volume) of services, an intervention that affects spending must affect either the prices or the volume of care. In the Medicare program, where prices are standardized, a global budget contract that works off of the underlying physician fee schedule would only affect spending through volume. In the private insurance sector, however, an ACO contract may affect spending through both volume and prices, since variations in prices across providers creates an opportunity for savings if care is obtained through a less expensive provider.
Separate from its relationship to medical spending, which is measured through the claims submitted by providers, what is the connection between a new payment system and total payouts from the insurer to the provider? An ACO contract contains a variety of incentives to providers that may generate additional payments from the insurer (most notably shared savings and quality bonuses). These non-claims payments may partially or entirely offset savings obtained through medical claims, making them an important dimension in the evaluation of the contract. Yet they are also different from medical claim dollars in a meaningful way. Changes in medical spending reflect underlying physician (or patient) behavior—what care is delivered and how much of it is delivered—whereas non-claims payments reflect the incentive structure of the contract.
On the quality dimension, it is worth noting whether a new payment system has similar effects on process and outcome measures. Process measures, which have been widely used by health plans, are operationally similar to additional items on a fee schedule, whereby the delivery of a service effectively generates a payment. Clinical outcome measures, such as blood pressure or cholesterol, and patient experience measures, on the other hand, cannot be fulfilled by simply checking off a box. Therefore, these measures may represent quality in a more meaningful way.
Early Results from Medicare ACOs
Thirty-two provider organizations entered the Pioneer ACO program in 2012, with about 669,000 Medicare beneficiaries attributed to these organizations. According to CMS, medical spending growth for ACO beneficiaries was 0.3% in the first year, compared to 0.8% for similar beneficiaries outside of these organizations [18].This generated a gross savings of $87.6 million in 2012, of which $33 million were returned to the Medicare trust fund. These savings were driven by 13 ACOs, with another 17 ACOs not reporting statistically significant changes in spending and 2 ACOs garnering losses with spending above the target of about $4 million total. Lower rates of admissions and readmissions largely explained the savings. A separate analysis comparing these ACOs to their local markets estimated a higher year 1 savings of $147 million dollars, driven by 8 ACOs whose savings ranged from $396 to $1224 per beneficiary per year [19].
Pioneer ACOs also earned over $76 million for quality. In the first year, quality bonuses were awarded for the reporting of quality measures rather than for performance, and all 32 ACOs successfully reported. According to CMS, Pioneer ACOs on average performed better than fee-for-service Medicare beneficiaries on 15 clinical quality measures for which comparison data were available, including blood pressure control and cholesterol control for diabetic patients. A complete analysis of quality performance is not yet available.
In the Medicare Shared Savings Program, interim results from CMS for the first 2 cohorts of ACOs showed that 29 of the 114 organizations lowered spending sufficiently enough to generate shared savings while 2 organizations had shared losses [20].This suggests that the great majority of ACOs spent close to their target. Final results on spending and quality are pending.
Results from the Medicare Physician Group Practice Demonstration
Ten provider organizations entered one-sided ACO-type contracts with Medicare in 2005 via the Physician Group Practice Demonstration. In this contract, organizations shared in savings provided that their spending was at least 2% below target and they achieved threshold performance on certain quality measures, most of which were process metrics.
In year 1, only one organization decreased spending enough to earn a shared savings, but after 3 years, five organizations had generated shared savings, although half of the savings were awarded to one organization [21].A recent analysis showed that 4 organizations sustained shared savings by the end of the program, with savings concentrated in acute care, readmissions, and beneficiaries who are dually eligible for Medicaid. Across the 10 organizations, financial performance ranged from average savings of $866 to increased spending of $749 per beneficiary per year [22].In total, about $78 million in savings were generated by this demonstration. Although a positive finding, this is a relatively small amount in the context of total Medicare expenditures [23,24].
On quality, all organizations met threshold performance on at least 29 of the 32 measures by the end of 5 years [21]. Most of these were process measures focused on coronary artery disease, diabetes, heart failure, hypertension, and preventive care [25].
Early Results from Commercial ACO Contracts
One of the early commercial ACO contracts to be evaluated was the Blue Cross Blue Shield of Massachusetts Alternative Quality Contract (AQC) [26].Initially implemented in 2009, the AQC is a multi-year contract that pays provider organizations a risk-adjusted global budget over the continuum of care. Seven organizations in Massachusetts entered the contract in the first year, and 4 more entered in 2010. Enrollees in HMO plans were prospectively attributed to their ACO by their designation of a primary care physician. The AQC is a two-sided contract that offered an additional 10% of an organization’s budget as a bonus for performance on 64 quality measures, half outpatient measures and half inpatient. Budget growth rates were tied to inflation and terms of its growth were negotiated with the organizations [27].
Over the first 2 years, the contract was associated with a decrease in medical spending of about $90 per enrollee per year, a –2.8% change (–1.9% in year 1 and –3.3% in year 2) [28].These savings were concentrated in procedures, imaging, and tests in the outpatient facility setting, and were largely explained by lower prices achieved by referring patients to less expensive providers. They were also concentrated in organizations that entered the AQC from fee-for-service, rather than prior risk contracts, and driven by enrollees with the highest expected spending. Over the second year, decreases in volume for certain services, such as percutaneous coronary interventions, began to contribute more to the savings [29].However, medical savings in the first 2 years were exceeded by non-claims payments, including shared savings and quality bonuses [27,28].The AQC was also associated with improvements in outpatient quality, including chronic care management measures (3.7 percentage points increase per year), adult preventive measures (0.4 percentage points per year), and pediatric quality measures (1.3 percentage points per year). Outcome measures such as hemoglobin A1c, LDL cholesterol, and blood pressure also showed an upward trend in the early years [28].Inpatient quality measures have yet to be examined.
Elsewhere in the country, Cigna’s Collaborative Accountable Care model was rolled out in 2009 with provider organizations in New Hampshire, Texas, and Arizona. A one-sided shared savings contract, it features a care coordination fee that is counted towards a practice’s medical spending, helping fund registered nurses who work as care coordinators. Interim results in 2012 suggested cost savings and quality improvements, but they were not statistically significant [30].A two-sided contract between Blue Shield of California and the California Public Employees’ Retirement System slowed medical costs by shortening admission and reducing readmissions [31].Most recently, an accountable care partnership between Anthem Blue Cross and HealthCare Partners physician group in California claimed $4.7 million in savings in the first half of 2013 for 55,000 patients in preferred provider organization (PPO) plans [32].These savings were driven by an 18% reduction in inpatient days, 4% reduction in overall admissions, and a 4% reduction in visits for radiology and lab tests, although specific price and volume contributions are yet unknown. Similar to the AQC, the Anthem contract is a 5-year agreement. Unlike the initial AQC contract, shared savings were tied to meeting a quality threshold and HealthCare Partners did not bear downside risk in year 1 [33].
Lessons Learned
Strengths of the ACO Model
Evidence to date points to both the potential of ACOs to slow spending and improve quality, but also the significant obstacles that they face. One of the encouraging lessons so far is that quality of care need not be threatened by a contract that rewards savings, provided that meaningful incentives for quality are in place. In both public and private two-sided contracts, process quality seemed to consistently improve. However, less is known about performance on outcome measures, which is ultimately a more meaningful metric for patients.
Broadly speaking, ACO contracts may be able to induce changes in physician behavior that could lead to medical savings. The low hanging fruit in Medicare seems to be admissions and readmissions, while that in commercial contracts may be lower prices obtained by changing referral patterns. While these medical savings reveal changes in clinical decision-making, it is still poorly understood whether clinical choices geared towards higher value can extend to areas of utilization where wasteful care may be concentrated. Little is also known about whether an ACO’s physicians and hospitals are in agreement over these changes in utilization or referral patterns, given their consequences for referral business and admissions. Moreover, there has yet to be evidence suggesting that medical savings can be larger than non-claims payments (rewards and bonuses to the ACOs) in a given year, generating net savings to the health care system. This may well take time to materialize given the initial investment costs and inducements for provider participation embedded in the early year incentives, but it is an important metric of success.
ACOs serve as a vehicle for payment reform and organizational reform among providers. They bring physicians across specialties and hospitals together under the same contractual roof, allowing the organization to determine how it allocates its resources under the spending target. Historically, policies aimed to slow health care spending have focused on either cutting prices (provider fees) or constraining volume (gatekeeping, prior authorization, and utilization review, etc.), but both types of strategies have been complicated by unintended consequences. Medicare fee cuts have traditionally been followed by compensatory increases in utilization or intensity of coding, offsetting the intended savings to a significant degree [34–37].Managed care techniques have met resistance from both physicians and patients [38,39].A spending target or budget takes an alternative approach; rather than controlling prices or quantities directly, it seeks to control total spending. Although the underlying fee schedule is retained for accounting, a spending target or especially a global budget pushes the organization to decide what care is high or low value.
A two-sided contract imposes stronger incentives on the ACO than a one-sided contract, which is both a strength and a weakness. While ACOs facing downside risk may respond earlier to the incentives, as some of the evidence thus far suggests, this risk may also propel ACOs to abandon this contracting model. In the Medicare Pioneer ACO program, for example, 9 of the 32 organizations exited the contract after year 1, which was allowed given the voluntary nature of participation. Seven organizations opted for the one-sided Medicare Shared Savings Program in year 2 and two left the ACO programs altogether. Downside risk was thought to be a principal concern for these organizations [40].Massachusetts providers in the AQC have thus far remained in the contract, but the AQC was a multi-year agreement to begin with.
Spillovers are another potential strength of the ACO model. Given that organizations care for patients across multiple payers, strong payment incentives in one payer population may affect care broadly. In the AQC, for example, recent evidence showed slowing of spending for Medicare beneficiaries associated with the contract in similar settings and categories of care as for the Blue Cross Blue Shield patients [41].
Weaknesses of the ACO Model
Still in its nascent stages, the ACO paradigm faces a number of challenges. Some relate to inherent weaknesses of the model, while others relate to the institutions and economics of the broader health care economy. At a contractual level, a key challenge is setting the target growth rate of the budget. If too low, providers may be overly constrained; if too high, providers may not have enough incentive to change practice. In an extreme case, if the target is set above what spending would have been under the old arrangement, an ACO contract can in fact be cost increasing on claims spending alone. Financial rewards such as shared savings and quality bonuses can help offset the risk, but they also make it more difficult for the ACO contract to generate net savings.
Achieving the right balance of risks and rewards is difficult. As noted above, a one-sided contract may not be strong enough to induce behavior change [42,43],but a two-sided contract may be too risky, driving providers who are unable to align incentives and coordinate care to exit the model [44].Although the percentage of shared risk borne by payer versus provider can be negotiated, putting financial risk on providers in a palatable way will be a key challenge. Financial risk can be more daunting if ACOs do not know in advance which patients they are responsible for, as in contracts with retrospective attribution rules and enrollees in unmanaged plans. A payer can help providers handle risk by sharing data on spending and identifying potential areas of overuse and low value care. Payers can help further by implementing risk corridors, providing reinsurance, or improving risk adjustment of the organization’s global budget. But with all that said, it remains to be seen whether providers around the country will be willing to bear substantive risk.
Within the ACO, a primary challenge is dividing up risks and rewards among constituent providers. How much shared savings are given to the hospital, to primary care physicians, or to specialists? What share should each specialty receive? What about shared losses, should spending exceed the target? In a two-sided ACO contract, these questions are particularly salient as global budgets change the business model for providers. Revenue centers under fee-for-service become cost centers. Organizations are confronted with difficult tradeoffs. The ability of providers across specialties to find common ground will be crucial, and leadership from providers will be key [45].Physicians have established themselves as leaders of the majority of ACOs today [46].It remains to be seen whether these organizations can keep providers together through the tradeoffs.
Patient trust in the ACO model has yet to be established. The managed care backlash of the 1990s suggests that patient buy-in will be crucial for the sustainability of ACOs. ACOs can have similarities to the HMO that traditionally produce negative associations, including downside risk, gatekeeping, or managed care techniques. To earn patients’ trust, ACOs will need to prove their value, such as through delivering better preventive care, less expensive care, more holistic care through stronger teams of providers, or smoother transitions of care across settings. The task of primary care medical homes to provide patient-centered care and coordinate across specialists effectively will be crucial. While today’s ACOs may be better positioned because of risk sharing, quality bonuses, risk adjustment, electronic medical records, or other innovations, the patient’s experience may ultimately be the arbiter.
Broader Challenges
While clinical integration is a central tenet of ACOs, consolidation between providers is simultaneously a chief concern for policymakers. Consolidation generally reduces competition and drives up prices, which is at odds with the goals of cost containment [47,48].Across the nation, physicians are consolidating with hospitals and health systems at an increasing rate, with recent surveys reporting that the proportion of independent physicians has steadily declined to below 50% [49–52].Increasing the number of covered lives is a dominant growth strategy under risk contracts, and more covered lives also increases an ACO’s bargaining power during acquisitions of specialist practices, whose referrals are better protected by inclusion in the provider network. As this trend continues, its effect on commercial prices will likely be scrutinized [53,54].
The ACO paradigm may also have significant effects on the physician labor market. Over the past 4 decades, the rate of physician specialization has grown dramatically [55].Fee-for-service incentives were aligned with specialization, but a rapid transition to alternative payment systems may disrupt the more gradually evolving physician labor market. Most medical school graduates today choose to specialize, as do most graduates of general medicine training programs [56,57],yet it is unclear to what degree the demand for specialists will continue to grow in the accountable care era. Specialty services tend to be of higher cost than generalist services. In some situations, high-cost services are more likely to be of lower value [58–60].Yet having specialists allows an organization to integrate services across the continuum of care, for which they are now financially responsible. As a new generation of specialists prepares to enter practice, whether the health care system will be able to support them and fulfill their expectations about their practice environment may be in question.
Looking into the Future
The landscape of payment and organization in health care will likely continue to migrate towards the ACO concept [61,62]. As the federal government, states, and individual payers move in similar directions, physicians and hospitals will face increasing pressures to change and adapt to new incentives surrounding cost and quality. Whether ACOs succeed in slowing spending while improving quality may have important ramifications for future stages of health care reform. For example, the growing debate in Washington, DC, over the future of Medicare financing may be informed, in part, by whether ACOs succeed within the traditional Medicare program. Market-based reforms, such as converting Medicare into a premium support program whereby private insurers compete to insure Medicare beneficiaries for a pre-defined contribution from the federal government, have been gaining momentum in recent years. Although not without concerns, such proposals would expect to gain consideration if the ACO model does not succeed.
Perhaps the most meaningful contribution of the ACO model is that it gives providers a reason to change the culture of medicine. It asks providers across specialties to work together and coordinate care in a way that was not rewarded under fee-for-service. It asks organizations to stitch the separate pieces of the patient’s care trajectory together through teamwork. In the long run, this may be the most intangible but substantive legacy that the ACO model provides. Under a single, collective contract at the organizational level, providers are quite literally in it together. If providers can break down silos, improve care coordination, and manage population health with a collective vision towards keeping patients healthy, the ACO paradigm would be able to claim a profound achievement. Such changes, however, will take time and they are not guaranteed.
Corresponding author: Zirui Song, MD, PhD, Department of Medicine, Massachusetts General Hospital, 55 Fruit St., Boston, MA 02114, [email protected].
Funding/support: Supported by a grant from the National Institute on Aging F30 AG039175.
Financial disclosures: None.
1. Orszag PR, Ellis P. The challenge of rising health care costs—a view from the Congressional Budget Office. N Engl J Med 2007;357:1793–5.
2. Chernew ME, Hirth RA, Cutler DM. Increased spending on health care: long- term implications for the nation. Health Aff (Millwood) 2009;28:1253–5.
3. Congressional Budget Office. Financing projected spending in the long run. Washington, DC: Congressional Budget Office; 2007 Jul 9.
4. Financing projected spending in the long run: letter from Peter R. Orszag, director, Congressional Budget Office, to Senator Judd Gregg, 9 Jul 2007.
5. Baicker K, Chernew ME. The economics of financing Medicare. N Engl J Med 2011;28;365:e7.
6. Chernew ME, Baicker K, Hsu J. The specter of financial armageddon—health care and federal debt in the United States. N Engl J Med 2010;362:1166–8.
7. Newhouse JP. Assessing health reform’s impact on four key groups of Americans. Health Aff (Millwood). 2010;29:1714–24.
8. Emanuel E, Tanden N, Altman S, et al. A systemic approach to containing health care spending. N Engl J Med 2012;367:949–54.
9. Antos JR, Pauly MV, Wilensky GR. Bending the cost curve through market-based incentives. N Engl J Med 2012;367:954–8.
10. Centers for Medicare and Medicaid Services. More partnerships between doctors and hospitals strengthen coordinated care for Medicare beneficiaries. 2013 Dec 23.
11. Fisher ES, McClellan MB, Safran DG. Building the path to accountable care. N Engl J Med 2011;365:2445–7.
12. Muhlestein D. Accountable care growth in 2014: a look ahead. Health Affairs Blog. 2014 Jan 29. Available at http://healthaffairs.org/blog/2014/01/29/accountable-care-growth-in-2014-a-look-ahead/.
13. Fisher ES, Shortell SM. Accountable care organizations: accountable for what, to whom, and how. JAMA 2010;304:1715–6.
14. Fisher ES, Staiger DO, Bynum JP, Gottlieb DJ. Creating accountable care organizations: the extended hospital medical staff. Health Aff (Millwood) 2007;26:w44–w57.
15. Rittenhouse DR, Shortell SM. The patient-centered medical home: will it stand the test of health reform? JAMA 2009;301:2038–40.
16. Bodenheimer T, Grumbach K, Berenson RA. A lifeline for primary care. N Engl J Med 2009;360:2693–6.
17. Centers for Medicare and Medicaid Services. Improving quality of care for Medicare patients: accountable care organizations. 2011 Oct 20.
18. Centers for Medicare and Medicaid Services. Press release: Pioneer accountable care organizations succeed in improving care, lowering costs. 2013 Jul 16. Available at www.cms.gov/Newsroom/MediaReleaseDatabase/Press-Releases/2013-Press-Releases-Items/2013-07-16.html.
19. L&M Policy Research. Effect of Pioneer ACOs on Medicare spending in the first year. 2013 Nov 3. Available at http://innovation.cms.gov/Files/reports/PioneerACOEvalReport1.pdf.
20. Centers for Medicare and Medicaid Services. Performance year 1 interim results for ACOs that started in April and July 2012. 2014 Jan 30. Available at www.cms.gov/Medicare/Medicare-Fee-for-Service-Payment/sharedsavingsprogram/Downloads/PY1-InterimResultsTable.pdf.
21. Wilensky GR. Lessons from the Physician Group Practice Demonstration — a sobering reflection. N Engl J Med 2011;365:1659–61.
22. Colla CH, Wennberg DE, Meara E, et al. Spending differences associated with the Medicare Physician Group Practice Demonstration. JAMA 2012;308:1015–23.
23. Berwick DM. Launching accountable care organizations—the proposed rule for the Medicare Shared Savings Program N Engl J Med 2011;364:e32.
24. Haywood TT, Kosel KC. The ACO model—a three-year financial loss? N Engl J Med 2011;364.
25. Iglehart JK. Assessing an ACO prototype—Medicare’s Physician Group Practice Demonstration. N Engl J Med 2011;364:198–200.
26. Chernew ME, Mechanic RE, Landon BE, Safran DG. Private-payer innovation in Massachusetts: the “Alternative Quality Contract.” Health Aff (Millwood). 2011;30:51–61.
27. Song Z, Safran DG, Landon BE, et al. Health care spending and quality in year 1 of the alternative quality contract. N Engl J Med 2011;365:909–18.
28. Song Z, Safran DG, Landon BE, et al. The ‘Alternative Quality Contract,’ based on a global budget, lowered medical spending and improved quality. Health Aff (Millwood). 2012;31:1885–94.
29. Song Z, Fendrick AM, Safran DG, et al. Global budgets and technology-intensive medical services. Healthcare (Amst) 2013;1:15–21.
30. Salmon RB, Sanderson MI, Walters BA, et al. A collaborative accountable care model in three practices showed promising early results on costs and quality of care. Health Aff (Millwood). 2012;31:2379–87.
31. Markovich P. A global budget pilot project among provider partners and Blue Shield of California led to savings in first two years. Health Aff (Millwood) 2012;31:1969–76.
32. Terhune C. Anthem, HealthCare Partners save $4.7 million by coordinating care. Los Angeles Times. 2014 Jun 6. Available at www.latimes.com/business/money/la-fi-anthem-healthcare-partners-20140605-story.html.
33. Gbemudu JN, Larson BK, Van Citters AD, et al. HealthCare Partners: building on a foundation of global risk management to achieve accountable care. Commonwealth Fund Pub. 1572, Vol 2. 2012 Jan.
34. Rice TH. The impact of changing Medicare reimbursement rates on physician- induced demand. Med Care 1983;21:803–15.
35. Nguyen NX, Derrick FW. Physician behavioral response to a Medicare price reduction. Health Serv Res 1997;32:283–98.
36. Yip WC. Physician response to Medicare fee reductions:changes in the volume of coronary artery bypass graft (CABG) surgeries in the Medicare and private sectors. J Health Econ 1998;17:675–99.
37. Song Z, Ayanian JZ, Wallace J, et al. Unintended consequences of eliminating medicare payments for consultations. JAMA Intern Med 2013;173:15–21.
38. Marquis MS, Rogowski JA, Escarce JJ. The managed care backlash: did consumers vote with their feet? Inquiry 2004-2005 Winter;41:376–90.
39. Cooper PF, Simon KI, Vistnes J. A closer look at the managed care backlash. Med Care 2006 May;44(5 Suppl):I4–11.
40. Song Z. Pioneer accountable care organizations: lessons from year 1. In: Curfman G, Morrissey S, Morse G, Prokesch S, editors. Insight Center: leading health care innovation. N Engl J Med/Harv Bus Rev. 2013 Oct 8. Available at http://images.nejm.org/editorial/supplementary/2013/hbr06-song.pdf.
41. McWilliams JM, Landon BE, Chernew ME. Changes in health care spending and quality for Medicare beneficiaries associated with a commercial ACO contract. JAMA 2013;310:829–36.
42. Berenson RA. Shared savings program for accountable care organizations: a bridge to nowhere? Am J Manag Care 2010;16:721–6.
43. Meyer H. Accountable care organization prototypes: winners and losers? Health Aff (Millwood) 2011;30:1227–31.
44. Burns LR, Pauly MV. Accountable care organizations may have difficulty avoiding the failures of integrated delivery networks of the 1990s. Health Aff (Millwood) 2012;31:2407–16.
45. Song Z, Lee TH. The era of delivery system reform begins. JAMA 2013;309:35–6.
46. Colla CH, Lewis VA, Shortell SM, Fisher ES. First national survey of ACOs finds that physicians are playing strong leadership and ownership roles. Health Aff (Millwood) 2014;33:964–71.
47. Baicker K, Levy H. Coordination versus competition in health care reform. N Engl J Med 2013;369:789–91.
48. Baker LC, Bundorf MK, Kessler DP. Vertical integration: hospital ownership of physician practices is associated with higher prices and spending. Health Aff (Millwood). 2014;33:756–63.
49. Isaacs SL, Jellinek PS, Ray WL. The independent physician--going, going.... N Engl J Med 2009;360:655–7.
50. Kocher R, Sahni NR. Hospitals’ race to employ physicians--the logic behind a money-losing proposition. N Engl J Med 2011;364:1790–3.
51. Gold J. Hospitals lure doctors away from private practice. Kaiser Health News, October 12, 2010.
52. Accenture. Clinical transformation: new business models for a new era in healthcare. 2012. Available at www.accenture.com/SiteCollectionDocuments/PDF/Accenture-Clinical-Transformation-New-Business-Models-for-a-New-Era-in-Healthcare.pdf.
53. Fraud and abuse: Leibenluft RF. ACOs and the enforcement of fraud, abuse, and antitrust laws. N Engl J Med 2011;364:99–101.
54. Kreindler SA, Larson BK, Wu FM, et al. Interpretations of integration in early accountable care organizations. Milbank Q 2012;90:457–83.
55. Cassel CK, Reuben DB. Specialization, subspecialization, and subsubspecialization in internal medicine. N Engl J Med 2011;364:1169–73.
56. West CP, Dupras DM. General medicine vs subspecialty career plans among internal medicine residents. JAMA 2012;308:2241–7.
57. Schwartz MD, Durning S, Linzer M, Hauer KE. Changes in medical students’ views of internal medicine careers from 1990 to 2007. Arch Intern Med 2011;171:744-749.
58. Schwartz AL, Landon BE, Elshaug AG, et al. Measuring low-value care in Medicare. JAMA Intern Med 2014 May 12. [Epub ahead of print]
59. American Board of Internal Medicine Foundation. Choosing wisely: lists of five things physicians and patients should question. Accessed 26 May 2013 at www.choosingwisely.org/doctor-patient-lists/.
60. Cassel CK, Guest JA. Choosing Wisely: helping physicians and patients make smart decisions about their care. JAMA 2012;307:1801–2.
61. Lewis VA, Colla CH, Carluzzo KL, et al. Accountable care organizations in the United States: market and demographic factors associated with formation. Health Serv Res 2013;48(6 Pt 1):1840–58.
62. Conrad D, Grembowski D, Gibbons C, et al. A report on eight early-stage state and regional projects testing value-based payment. Health Aff (Millwood) 2013;32:998–1006.