User login
Treating epilepsy in the elderly: More art than science
As Drs. ghosh and jehi discuss in this issue of the Journal,1 physicians face many challenges when caring for elderly patients who have epileptic seizures.
Owing to the graying of America and higher rates of incidence and prevalence of epilepsy in older patients than in younger ones, the number of patients with epilepsy will climb steeply in the coming years. Among patients in nursing homes, the numbers are much higher (an incidence of up to 16 per 1,000 per year and a prevalence of 60 per 1,000) than in community-dwelling elderly.2,3
DOES THE PATIENT HAVE EPILEPSY?
The first concern is to make the correct diagnosis. Epilepsy is defined as a condition of the central nervous system predisposing to seizures. Younger patients need to have two unprovoked seizures for epilepsy to be diagnosed. However, a recent modification in the definition allows epilepsy to be diagnosed after a single seizure in a person who has a condition of the central nervous system known to significantly increase the risk of additional seizures.4
CONSIDERATIONS IN TREATMENT
When treating any patient, one size does not fit all, and this is especially true with elderly patients, in whom treatment should be based on health status. Many elderly patients with epilepsy have age-related comorbidities, and one would treat epilepsy differently in patients who are otherwise healthy than in those who are frail or have multiple comorbidities.5 Elderly people who live in their own homes have different needs from those who reside in a nursing home.
These patients have social and psychological problems as well as medical ones. For example, the loss of driving privileges can be a major concern with epilepsy patients; it is often emotionally devastating, in addition to greatly limiting independence.
Comorbidities, seizures, and treatment share a complex and tangled relationship. To decide on the appropriate therapy, a physician needs to evaluate the effects that antiepileptic drugs and central nervous system disorders can have on mood, cognition, and neurologic function. In addition, it is imperative to consider the possible pharmacokinetic and pharmacodynamic interactions of antiepileptic drugs with the many drugs used to treat other conditions.
Should treatment be started?
Antiepileptic drugs can cause side effects, and an elderly person who has had a single seizure may never have another one. On the other hand, given that seizures can pose higher risks to the elderly and lead to injuries that can be more devastating than in the young, preventing recurrent seizures may be very appropriate. Lack of studies of this issue means that there is no evidence to support either decision.
Which antiepileptic drug should be used?
Things to consider when selecting an antiepileptic drug include efficacy, tolerability, pharmacokinetic properties, adverse effects, use of other drugs that interact with these drugs, and compliance.
Pharmacokinetics can be affected by age-related changes in the function of the gastrointestinal tract, kidneys, and liver and in protein binding. However, contrary to common perception, hepatic metabolism in healthy elderly people may not change significantly with advancing age. Ahn et al6 gave radiolabeled phenytoin (Dilantin) intravenously to patients with epilepsy and found that its clearance changed only slightly with age.
Antiepileptic drugs can interact with other drugs, herbal remedies, and food. Physicians need to know about the metabolic pathways of these drugs and other substances to make appropriate decisions about treatment. Interactions between antipsychotic and antiepileptic drugs are particularly worrisome because they involve both pharmacokinetic and pharmacodynamic mechanisms. Certain antiepileptic drugs can also induce (ie, increase) the hepatic metabolism of certain other drugs. Other drugs may lower the threshold for seizures.
Is the patient’s drug level stable?
We assume that if a drug is taken on a regular schedule at the same dose, its serum concentration will remain relatively stable (at a “steady state”). And in younger adults, antiepileptic drug concentrations vary relatively little over time, by about 20% in compliant patients.7 This was assumed to be true for elderly patients as well.
However, Birnbaum et al8 found that phenytoin levels fluctuated as much as two- to threefold in serial measurements in nursing home residents, even though the dose or formulation had not been changed and the patients were not taking any interfering medication. Yet some of the patients had very stable levels. The authors observed similar variations in levels of carbamazepine (Tegretol) and valproic acid (Depakote).9
The reasons for this variability are not known but may involve age-related changes in the gut.
RESEARCH NEEDED
Epilepsy is increasing in elderly people. Yet little basic or clinical research has been done to clarify the mechanisms or to determine the best treatment in terms of quality of life. Lacking appropriate animal models, basic research has been slow. For example, we do not know if the mechanisms leading to seizures after strokes differ from those leading to seizures in people with Alzheimer disease. Thus, it is not possible to choose an antiepileptic drug on the basis of its mechanism of action.
Many elderly patients who have epilepsy also have conditions that may alter the pharmacokinetic and pharmacodynamic properties of antiepileptic drugs, and data from younger people may be misleading.
Given the magnitude of the problem, we need to make a concerted effort to answer these questions with additional research.10 Meanwhile, the treatment of elderly patients with epilepsy is more of an art than a science.
- Ghosh S, Jehi LE. New-onset epilepsy in the elderly: challenges for the internist. Cleve Clin J Med 2014; 81:490–498.
- Garrard J, Cloyd J, Gross C, et al. Factors associated with antiepileptic drug use among elderly nursing home residents. J Gerontol A Biol Sci Med Sci 2000; 55:M384–M392.
- Garrard J, Harms S, Hardie N, et al. Antiepileptic drug use in nursing home admissions. Ann Neurol 2003; 54:75–85.
- Fisher RS, Leppik I. Debate: when does a seizure imply epilepsy? Epilepsia 2008; 49(suppl 9):7–12.
- Leppik IE. Introduction to the International Geriatric Epilepsy Symposium (IGES). Epilepsy Res 2006; 68(suppl 1):S1–S4.
- Ahn JE, Cloyd JC, Brundage RC, et al. Phenytoin half-life and clearance during maintenance therapy in adults and elderly patients with epilepsy. Neurology 2008; 71:38–43.
- Leppik IE, Cloyd JD, Sawchuk RJ, Pepin SM. Compliance and variability of plasma phenytoin levels in epileptic patients. Ther Drug Mon 1979; 1:475–483.
- Birnbaum A, Hardie NA, Leppik IE, et al. Variability of total phenytoin serum concentrations within elderly nursing home residents. Neurology 2003; 60:555–559.
- Birnbaum AK, Conway JM, Strege MA, Leppik IE. Variability of carbamazepine and valproate concentrations in elderly nursing home residents. Epilepsy Res 2012; 101:22–27.
- Leppik IE, Walczak TS, Birnbaum AK. Challenges of epilepsy in elderly people. Lancet 2012; 380:1128–1130.
As Drs. ghosh and jehi discuss in this issue of the Journal,1 physicians face many challenges when caring for elderly patients who have epileptic seizures.
Owing to the graying of America and higher rates of incidence and prevalence of epilepsy in older patients than in younger ones, the number of patients with epilepsy will climb steeply in the coming years. Among patients in nursing homes, the numbers are much higher (an incidence of up to 16 per 1,000 per year and a prevalence of 60 per 1,000) than in community-dwelling elderly.2,3
DOES THE PATIENT HAVE EPILEPSY?
The first concern is to make the correct diagnosis. Epilepsy is defined as a condition of the central nervous system predisposing to seizures. Younger patients need to have two unprovoked seizures for epilepsy to be diagnosed. However, a recent modification in the definition allows epilepsy to be diagnosed after a single seizure in a person who has a condition of the central nervous system known to significantly increase the risk of additional seizures.4
CONSIDERATIONS IN TREATMENT
When treating any patient, one size does not fit all, and this is especially true with elderly patients, in whom treatment should be based on health status. Many elderly patients with epilepsy have age-related comorbidities, and one would treat epilepsy differently in patients who are otherwise healthy than in those who are frail or have multiple comorbidities.5 Elderly people who live in their own homes have different needs from those who reside in a nursing home.
These patients have social and psychological problems as well as medical ones. For example, the loss of driving privileges can be a major concern with epilepsy patients; it is often emotionally devastating, in addition to greatly limiting independence.
Comorbidities, seizures, and treatment share a complex and tangled relationship. To decide on the appropriate therapy, a physician needs to evaluate the effects that antiepileptic drugs and central nervous system disorders can have on mood, cognition, and neurologic function. In addition, it is imperative to consider the possible pharmacokinetic and pharmacodynamic interactions of antiepileptic drugs with the many drugs used to treat other conditions.
Should treatment be started?
Antiepileptic drugs can cause side effects, and an elderly person who has had a single seizure may never have another one. On the other hand, given that seizures can pose higher risks to the elderly and lead to injuries that can be more devastating than in the young, preventing recurrent seizures may be very appropriate. Lack of studies of this issue means that there is no evidence to support either decision.
Which antiepileptic drug should be used?
Things to consider when selecting an antiepileptic drug include efficacy, tolerability, pharmacokinetic properties, adverse effects, use of other drugs that interact with these drugs, and compliance.
Pharmacokinetics can be affected by age-related changes in the function of the gastrointestinal tract, kidneys, and liver and in protein binding. However, contrary to common perception, hepatic metabolism in healthy elderly people may not change significantly with advancing age. Ahn et al6 gave radiolabeled phenytoin (Dilantin) intravenously to patients with epilepsy and found that its clearance changed only slightly with age.
Antiepileptic drugs can interact with other drugs, herbal remedies, and food. Physicians need to know about the metabolic pathways of these drugs and other substances to make appropriate decisions about treatment. Interactions between antipsychotic and antiepileptic drugs are particularly worrisome because they involve both pharmacokinetic and pharmacodynamic mechanisms. Certain antiepileptic drugs can also induce (ie, increase) the hepatic metabolism of certain other drugs. Other drugs may lower the threshold for seizures.
Is the patient’s drug level stable?
We assume that if a drug is taken on a regular schedule at the same dose, its serum concentration will remain relatively stable (at a “steady state”). And in younger adults, antiepileptic drug concentrations vary relatively little over time, by about 20% in compliant patients.7 This was assumed to be true for elderly patients as well.
However, Birnbaum et al8 found that phenytoin levels fluctuated as much as two- to threefold in serial measurements in nursing home residents, even though the dose or formulation had not been changed and the patients were not taking any interfering medication. Yet some of the patients had very stable levels. The authors observed similar variations in levels of carbamazepine (Tegretol) and valproic acid (Depakote).9
The reasons for this variability are not known but may involve age-related changes in the gut.
RESEARCH NEEDED
Epilepsy is increasing in elderly people. Yet little basic or clinical research has been done to clarify the mechanisms or to determine the best treatment in terms of quality of life. Lacking appropriate animal models, basic research has been slow. For example, we do not know if the mechanisms leading to seizures after strokes differ from those leading to seizures in people with Alzheimer disease. Thus, it is not possible to choose an antiepileptic drug on the basis of its mechanism of action.
Many elderly patients who have epilepsy also have conditions that may alter the pharmacokinetic and pharmacodynamic properties of antiepileptic drugs, and data from younger people may be misleading.
Given the magnitude of the problem, we need to make a concerted effort to answer these questions with additional research.10 Meanwhile, the treatment of elderly patients with epilepsy is more of an art than a science.
- Ghosh S, Jehi LE. New-onset epilepsy in the elderly: challenges for the internist. Cleve Clin J Med 2014; 81:490–498.
- Garrard J, Cloyd J, Gross C, et al. Factors associated with antiepileptic drug use among elderly nursing home residents. J Gerontol A Biol Sci Med Sci 2000; 55:M384–M392.
- Garrard J, Harms S, Hardie N, et al. Antiepileptic drug use in nursing home admissions. Ann Neurol 2003; 54:75–85.
- Fisher RS, Leppik I. Debate: when does a seizure imply epilepsy? Epilepsia 2008; 49(suppl 9):7–12.
- Leppik IE. Introduction to the International Geriatric Epilepsy Symposium (IGES). Epilepsy Res 2006; 68(suppl 1):S1–S4.
- Ahn JE, Cloyd JC, Brundage RC, et al. Phenytoin half-life and clearance during maintenance therapy in adults and elderly patients with epilepsy. Neurology 2008; 71:38–43.
- Leppik IE, Cloyd JD, Sawchuk RJ, Pepin SM. Compliance and variability of plasma phenytoin levels in epileptic patients. Ther Drug Mon 1979; 1:475–483.
- Birnbaum A, Hardie NA, Leppik IE, et al. Variability of total phenytoin serum concentrations within elderly nursing home residents. Neurology 2003; 60:555–559.
- Birnbaum AK, Conway JM, Strege MA, Leppik IE. Variability of carbamazepine and valproate concentrations in elderly nursing home residents. Epilepsy Res 2012; 101:22–27.
- Leppik IE, Walczak TS, Birnbaum AK. Challenges of epilepsy in elderly people. Lancet 2012; 380:1128–1130.
A 78-year-old smoker with an incidental pulmonary mass
When a 78-year-old man underwent magnetic resonance imaging of the lumbar spine because of back pain, the scan revealed a mass in the right lung. He had no respiratory symptoms but had a 40-pack-year smoking history. Physical examination and routine blood tests were unremarkable.
Radiography (Figure 1) showed a large rounded opacity in the right lower lobe. The patient’s age, smoking history, and imaging findings raised concern for lung cancer, so computed tomography (CT) was performed (Figure 2).
DIAGNOSIS: PULMONARY HAMARTOMA
The findings of a well-circumscribed solitary pulmonary nodule or mass containing areas of fat, either as focal islands or more generally distributed, and chondroid “popcorn” calcification are virtually pathognomonic for pulmonary hamartoma.1,2 Unfortunately, although this pattern of calcification is strongly diagnostic, it is present in only a minority of cases of hamartoma.
Pulmonary hamartoma is the most common benign tumor of the lung, accounting for approximately 75% of benign neoplasms and 6% to 8% of all focal lung parenchymal masses.3
Like hamartoma elsewhere in the body, pulmonary hamartoma consists of disorganized overgrowth and aberrant arrangement of normal tissues, including cartilage (which may calcify), smooth muscle, epithelium, and fibrostroma. Pulmonary hamartoma is twice as common in men as in women, and it has a peak incidence in the seventh decade of life.4
Although size ranged from 0.2 to 6 cm in a large case series,4 hamartomas are usually less than 2.5 cm in diameter. As noted in Figure 1, our patient’s lesion was 5 cm.
Pulmonary hamartomas grow slowly and are often asymptomatic, although up to 39% of patients may have symptoms such as cough, dyspnea, and chest tightness.5 The nonspecific nature of these symptoms makes it difficult to be certain that they are caused by the hamartoma; in many cases, they are likely to be coincidental. Lesions tend to occur in the periphery of the lobe and do not favor a particular lobe. Endobronchial lesions can occur but are uncommon.
The internal heterogeneous elements are difficult to see on radiography; CT is usually required to further characterize the lesion and to exclude more sinister differential diagnoses. In some cases the characteristic features of fat and calcification are absent, making a certain diagnosis difficult or impossible radiologically; in such cases, biopsy or resection may be required.
Hamartomas usually do not take up fluorodeoxyglucose avidly on positron-emission tomography CT. However, nuclear medicine studies such as this are superfluous if the classic features are present on CT.
FOLLOW-UP AND TREATMENT
Given the benign nature, slow growth, and usually incidental detection of pulmonary hamartoma in patients without symptoms, no follow-up imaging or treatment is usually required. In the few cases in which symptoms are attributable to the lesion, the lesion can be resected.5 Resection is also an option when the patient is very anxious about the mass, or when imaging studies do not provide a clear diagnosis and tissue needs to be obtained for study.
Because patients often present to different institutions during their lifetime, it is important to counsel them about the natural history of pulmonary hamartomas. Giving them a copy of their imaging may help avoid unnecessary repetition.
- Erasmus JJ, Connolly JE, McAdams HP, Roggli VL. Solitary pulmonary nodules: Part I. Morphologic evaluation for differentiation of benign and malignant lesions. Radiographics 2000; 20:43–58.
- Khan AN, Al-Jahdali HH, Allen CM, Irion KL, Al Ghanem S, Koteyar SS. The calcified lung nodule: what does it mean? Ann Thorac Med 2010; 5:67–79.
- Siegelman SS, Khouri NF, Scott WW, et al. Pulmonary hamartoma: CT findings. Radiology 1986; 160:313–317.
- Gjevre JA, Myers JL, Prakash UB. Pulmonary hamartomas. Mayo Clin Proc 1996; 71:14–20.
- Hansen CP, Holtveg H, Francis D, Rasch L, Bertelsen S. Pulmonary hamartoma. J Thorac Cardiovasc Surg 1992; 104:674–678.
When a 78-year-old man underwent magnetic resonance imaging of the lumbar spine because of back pain, the scan revealed a mass in the right lung. He had no respiratory symptoms but had a 40-pack-year smoking history. Physical examination and routine blood tests were unremarkable.
Radiography (Figure 1) showed a large rounded opacity in the right lower lobe. The patient’s age, smoking history, and imaging findings raised concern for lung cancer, so computed tomography (CT) was performed (Figure 2).
DIAGNOSIS: PULMONARY HAMARTOMA
The findings of a well-circumscribed solitary pulmonary nodule or mass containing areas of fat, either as focal islands or more generally distributed, and chondroid “popcorn” calcification are virtually pathognomonic for pulmonary hamartoma.1,2 Unfortunately, although this pattern of calcification is strongly diagnostic, it is present in only a minority of cases of hamartoma.
Pulmonary hamartoma is the most common benign tumor of the lung, accounting for approximately 75% of benign neoplasms and 6% to 8% of all focal lung parenchymal masses.3
Like hamartoma elsewhere in the body, pulmonary hamartoma consists of disorganized overgrowth and aberrant arrangement of normal tissues, including cartilage (which may calcify), smooth muscle, epithelium, and fibrostroma. Pulmonary hamartoma is twice as common in men as in women, and it has a peak incidence in the seventh decade of life.4
Although size ranged from 0.2 to 6 cm in a large case series,4 hamartomas are usually less than 2.5 cm in diameter. As noted in Figure 1, our patient’s lesion was 5 cm.
Pulmonary hamartomas grow slowly and are often asymptomatic, although up to 39% of patients may have symptoms such as cough, dyspnea, and chest tightness.5 The nonspecific nature of these symptoms makes it difficult to be certain that they are caused by the hamartoma; in many cases, they are likely to be coincidental. Lesions tend to occur in the periphery of the lobe and do not favor a particular lobe. Endobronchial lesions can occur but are uncommon.
The internal heterogeneous elements are difficult to see on radiography; CT is usually required to further characterize the lesion and to exclude more sinister differential diagnoses. In some cases the characteristic features of fat and calcification are absent, making a certain diagnosis difficult or impossible radiologically; in such cases, biopsy or resection may be required.
Hamartomas usually do not take up fluorodeoxyglucose avidly on positron-emission tomography CT. However, nuclear medicine studies such as this are superfluous if the classic features are present on CT.
FOLLOW-UP AND TREATMENT
Given the benign nature, slow growth, and usually incidental detection of pulmonary hamartoma in patients without symptoms, no follow-up imaging or treatment is usually required. In the few cases in which symptoms are attributable to the lesion, the lesion can be resected.5 Resection is also an option when the patient is very anxious about the mass, or when imaging studies do not provide a clear diagnosis and tissue needs to be obtained for study.
Because patients often present to different institutions during their lifetime, it is important to counsel them about the natural history of pulmonary hamartomas. Giving them a copy of their imaging may help avoid unnecessary repetition.
- Erasmus JJ, Connolly JE, McAdams HP, Roggli VL. Solitary pulmonary nodules: Part I. Morphologic evaluation for differentiation of benign and malignant lesions. Radiographics 2000; 20:43–58.
- Khan AN, Al-Jahdali HH, Allen CM, Irion KL, Al Ghanem S, Koteyar SS. The calcified lung nodule: what does it mean? Ann Thorac Med 2010; 5:67–79.
- Siegelman SS, Khouri NF, Scott WW, et al. Pulmonary hamartoma: CT findings. Radiology 1986; 160:313–317.
- Gjevre JA, Myers JL, Prakash UB. Pulmonary hamartomas. Mayo Clin Proc 1996; 71:14–20.
- Hansen CP, Holtveg H, Francis D, Rasch L, Bertelsen S. Pulmonary hamartoma. J Thorac Cardiovasc Surg 1992; 104:674–678.
Alveolar proteinosis: A slow drowning in mud
A 30-year-old man presented with progressive dyspnea and dry cough, which had developed over the last 6 months. His oxygen saturation was 88% on room air, and he had diffuse bilateral crackles on auscultation. Imaging showed a mixture of diffuse airspace and interstitial abnormalities (Figure 1).
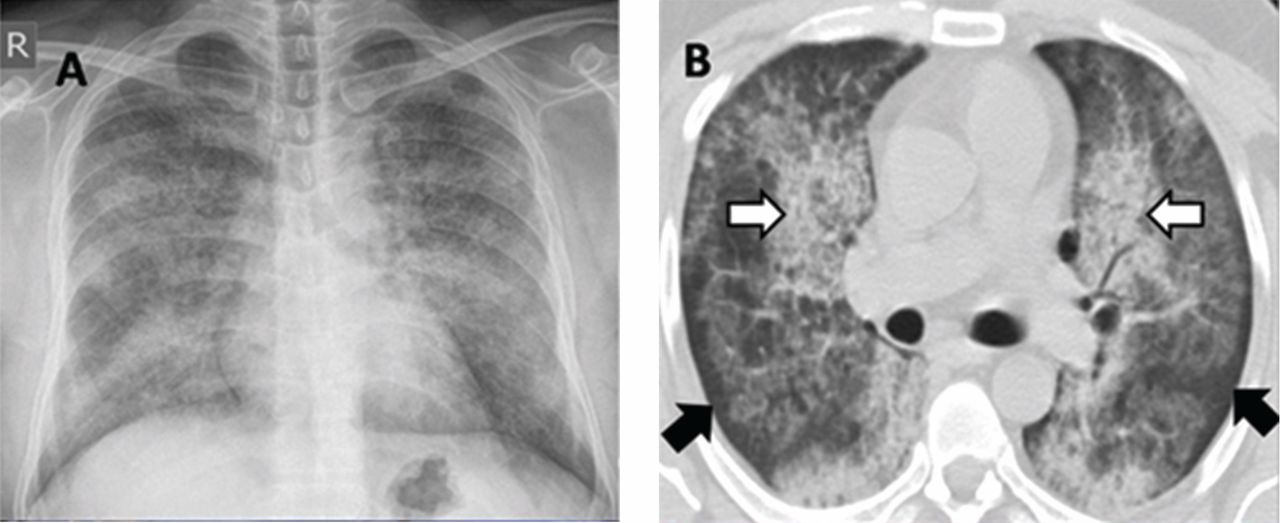
He underwent bronchoscopy. The bronchoalveolar lavage fluid had a turbid appearance that gradually cleared with successive aliquots. Transbronchial biopsy studies confirmed the diagnosis of pulmonary alveolar proteinosis (Figure 2). Sequential whole-lung lavage recovered significant amounts of thick, proteinaceous effluent that slowly cleared. After the procedure, the patient’s symptoms, oxygen saturation, and chest radiographic appearance (Figure 3) improved markedly, with no recurrence at 1 year of follow-up.

ALVEOLAR PROTEINOSIS
Pulmonary alveolar proteinosis is a rare disease characterized by the accumulation of lipoproteinaceous material in the alveolar space secondary to alveolar macrophage dysfunction. The condition can be congenital, secondary, or acquired. Patients typically present with progressive exertional dyspnea, nonproductive cough, variable restrictive ventilatory defects, and diffusion limitation on pulmonary function testing.
Plain chest radiographs usually resemble those seen in pulmonary edema but without features of heart failure, ie, cardiomegaly, Kerley B lines, and effusion.
A “crazy-paving” pattern on computed tomography—a combination of geographic ground-glass appearance and interseptal thickening—suggests alveolar proteinosis, but is not specific for it. Other differential diagnoses for the crazy-paving pattern include Pneumocystis jirovecii infection, invasive mucinous adenocarcinoma, cardiogenic pulmonary edema, alveolar hemorrhage, sarcoidosis, cryptogenic organizing pneumonia, exogenous lipoid pneumonia, drug-induced lung disease, acute radiation pneumonitis, and nonspecific interstitial pneumonia.1
Laboratory testing is not very helpful in the diagnosis, although the serum lactate dehydrogenase level may be mildly elevated. Circulating antibodies to granulocyte macrophage colony-stimulating factor may support the diagnosis, but they are only present in the acquired form. Communication with a research laboratory is usually needed to test for these antibodies.
The bronchoalveolar lavage fluid typically has an opaque, milky, or muddy appearance. The diagnosis is confirmed by demonstration of alveolar filling with material that is periodic acid-Schiff-positive and that is amorphous, eosinophilic, and granular.
Whole-lung lavage2 is the physical removal of surfactant by repeated flooding of the lungs with warmed saline, done under general anesthesia with single-lung ventilation. It remains the standard of care and is indicated in patients with the confirmed diagnosis and one of the following: severe dyspnea, resting hypoxemia (Pao2 < 60 mm Hg at sea level), alveolar-arterial gradient > 40 mm Hg, or a shunt fraction of more than 10%. Successful bronchoscopic lavage has also been reported.3
Other treatments include granulocyte-macrophage colony-stimulating factor, rituximab (Rituxan, an anti-CD20 monoclonal antibody), plasmapheresis, and lung transplantation. Systemic corticosteroids are usually ineffective unless indicated for secondary types of alveolar proteinosis.
Inhalation rather than subcutaneous administration of granulocyte-macrophage colony-stimulating factor seems preferred as it ensures a high concentration in the target organ, avoids systemic complications (injection-site edema, erythema, neutropenia, malaise, and shortness of breath) and achieves lower levels of autoantibodies in bronchoalveolar lavage fluid, which correlates with disease activity.
Data are sparse as to the recurrence of autoimmune pulmonary alveolar proteinosis after whole-lung lavage, yet about 40% of patients require a repeat procedure within 18 months. Recurrence has also been reported after double-lung transplantation.4
Adjuvant therapy with rituximab or, to a lesser extent, with inhaled granulocyte-macrophage colony-stimulating factor has recently been shown to diminish the need for repeated lavage.5 These treatments can also be used when whole-lung lavage cannot be performed or proves to be ineffective.5
Acknowledgment: I would like to thank Dr. Kamelia Velikova for providing the pathology image.
- Rossi SE, Erasmus JJ, Volpacchio M, Franquet T, Castiglioni T, McAdams HP. ‘Crazy-paving’ pattern at thin-section CT of the lungs: radiologic-pathologic overview. Radiographics 2003; 23:1509–1519.
- Michaud G, Reddy C, Ernst A. Whole-lung lavage for pulmonary alveolar proteinosis. Chest 2009; 136:1678–1681.
- Cheng SL, Chang HT, Lau HP, Lee LN, Yang PC. Pulmonary alveolar proteinosis: treatment by bronchofiberscopic lobar lavage. Chest 2002; 122:1480–1485.
- Parker LA, Novotny DB. Recurrent alveolar proteinosis following double lung transplantation. Chest 1997; 111:1457–1458.
- Leth S, Bendstrup E, Vestergaard H, Hilberg O. Autoimmune pulmonary alveolar proteinosis: treatment options in year 2013. Respirology 2013; 18:82–91.
SUGGESTED READING
Borie R, Danel C, Debray MP, et al. Pulmonary alveolar proteinosis.Eur Respir Rev 2011; 20:98–107.
Carey B, Trapnell BC. The molecular basis of pulmonary alveolarproteinosis. Clin Immunol 2010; 135:223–235.
Ioachimescu OC, Kavuru MS. Pulmonary alveolar proteinosis.Chron Respir Dis 2006; 3:149–159.
Luisetti M, Kadija Z, Mariani F, Rodi G, Campo I, Trapnell BC.Therapy options in pulmonary alveolar proteinosis. TherAdv Respir Dis 2010; 4:239–248.
A 30-year-old man presented with progressive dyspnea and dry cough, which had developed over the last 6 months. His oxygen saturation was 88% on room air, and he had diffuse bilateral crackles on auscultation. Imaging showed a mixture of diffuse airspace and interstitial abnormalities (Figure 1).
He underwent bronchoscopy. The bronchoalveolar lavage fluid had a turbid appearance that gradually cleared with successive aliquots. Transbronchial biopsy studies confirmed the diagnosis of pulmonary alveolar proteinosis (Figure 2). Sequential whole-lung lavage recovered significant amounts of thick, proteinaceous effluent that slowly cleared. After the procedure, the patient’s symptoms, oxygen saturation, and chest radiographic appearance (Figure 3) improved markedly, with no recurrence at 1 year of follow-up.
ALVEOLAR PROTEINOSIS
Pulmonary alveolar proteinosis is a rare disease characterized by the accumulation of lipoproteinaceous material in the alveolar space secondary to alveolar macrophage dysfunction. The condition can be congenital, secondary, or acquired. Patients typically present with progressive exertional dyspnea, nonproductive cough, variable restrictive ventilatory defects, and diffusion limitation on pulmonary function testing.
Plain chest radiographs usually resemble those seen in pulmonary edema but without features of heart failure, ie, cardiomegaly, Kerley B lines, and effusion.
A “crazy-paving” pattern on computed tomography—a combination of geographic ground-glass appearance and interseptal thickening—suggests alveolar proteinosis, but is not specific for it. Other differential diagnoses for the crazy-paving pattern include Pneumocystis jirovecii infection, invasive mucinous adenocarcinoma, cardiogenic pulmonary edema, alveolar hemorrhage, sarcoidosis, cryptogenic organizing pneumonia, exogenous lipoid pneumonia, drug-induced lung disease, acute radiation pneumonitis, and nonspecific interstitial pneumonia.1
Laboratory testing is not very helpful in the diagnosis, although the serum lactate dehydrogenase level may be mildly elevated. Circulating antibodies to granulocyte macrophage colony-stimulating factor may support the diagnosis, but they are only present in the acquired form. Communication with a research laboratory is usually needed to test for these antibodies.
The bronchoalveolar lavage fluid typically has an opaque, milky, or muddy appearance. The diagnosis is confirmed by demonstration of alveolar filling with material that is periodic acid-Schiff-positive and that is amorphous, eosinophilic, and granular.
Whole-lung lavage2 is the physical removal of surfactant by repeated flooding of the lungs with warmed saline, done under general anesthesia with single-lung ventilation. It remains the standard of care and is indicated in patients with the confirmed diagnosis and one of the following: severe dyspnea, resting hypoxemia (Pao2 < 60 mm Hg at sea level), alveolar-arterial gradient > 40 mm Hg, or a shunt fraction of more than 10%. Successful bronchoscopic lavage has also been reported.3
Other treatments include granulocyte-macrophage colony-stimulating factor, rituximab (Rituxan, an anti-CD20 monoclonal antibody), plasmapheresis, and lung transplantation. Systemic corticosteroids are usually ineffective unless indicated for secondary types of alveolar proteinosis.
Inhalation rather than subcutaneous administration of granulocyte-macrophage colony-stimulating factor seems preferred as it ensures a high concentration in the target organ, avoids systemic complications (injection-site edema, erythema, neutropenia, malaise, and shortness of breath) and achieves lower levels of autoantibodies in bronchoalveolar lavage fluid, which correlates with disease activity.
Data are sparse as to the recurrence of autoimmune pulmonary alveolar proteinosis after whole-lung lavage, yet about 40% of patients require a repeat procedure within 18 months. Recurrence has also been reported after double-lung transplantation.4
Adjuvant therapy with rituximab or, to a lesser extent, with inhaled granulocyte-macrophage colony-stimulating factor has recently been shown to diminish the need for repeated lavage.5 These treatments can also be used when whole-lung lavage cannot be performed or proves to be ineffective.5
Acknowledgment: I would like to thank Dr. Kamelia Velikova for providing the pathology image.
- Rossi SE, Erasmus JJ, Volpacchio M, Franquet T, Castiglioni T, McAdams HP. ‘Crazy-paving’ pattern at thin-section CT of the lungs: radiologic-pathologic overview. Radiographics 2003; 23:1509–1519.
- Michaud G, Reddy C, Ernst A. Whole-lung lavage for pulmonary alveolar proteinosis. Chest 2009; 136:1678–1681.
- Cheng SL, Chang HT, Lau HP, Lee LN, Yang PC. Pulmonary alveolar proteinosis: treatment by bronchofiberscopic lobar lavage. Chest 2002; 122:1480–1485.
- Parker LA, Novotny DB. Recurrent alveolar proteinosis following double lung transplantation. Chest 1997; 111:1457–1458.
- Leth S, Bendstrup E, Vestergaard H, Hilberg O. Autoimmune pulmonary alveolar proteinosis: treatment options in year 2013. Respirology 2013; 18:82–91.
SUGGESTED READING
Borie R, Danel C, Debray MP, et al. Pulmonary alveolar proteinosis.Eur Respir Rev 2011; 20:98–107.
Carey B, Trapnell BC. The molecular basis of pulmonary alveolarproteinosis. Clin Immunol 2010; 135:223–235.
Ioachimescu OC, Kavuru MS. Pulmonary alveolar proteinosis.Chron Respir Dis 2006; 3:149–159.
Luisetti M, Kadija Z, Mariani F, Rodi G, Campo I, Trapnell BC.Therapy options in pulmonary alveolar proteinosis. TherAdv Respir Dis 2010; 4:239–248.

Do imaging studies have value in a patient with acute, nonspecific low back pain?
A 38-year-old man is evaluated in an urgent care center for back pain. He is a high school mathematics teacher who reports the insidious onset of low back pain 3 weeks ago. Over the last week the pain has become constant, is worsened by movement, and does not respond to naproxen. He has no history of trauma, malignancy, fever, weight loss, or bladder or bowel symptoms. He does not use intravenous drugs. On examination, he appears uncomfortable and stiff, protecting his back against motion. He has intact sensation, strength, and reflexes. The straight-leg-raising maneuver reproduces his lower back pain but does not cause radicular pain. Should I now order an imaging study such as spinal radiography, computed tomography, or magnetic resonance imaging to direct therapy?
IMAGING STUDIES ARE UNLIKELY TO HELP
This man with acute, nonspecific low back pain does not need spinal imaging. Imaging—ie, spine radiography, computed tomography, or magnetic resonance imaging—is unlikely to be helpful in a patient with nonspecific low back pain and may expose him unnecessarily to radiation and the anxiety of findings that are clinically insignificant.
Imaging studies are often ordered inappropriately as part of the evaluation of back pain in patients such as this. In 2008, the total national cost of treating spine (neck and back) problems was estimated to be $86 billion, representing 9% of total health care costs, which is close to the estimated $89 billion per year spent on cancer care.1
Spine imaging should be considered only in patients who have a “red flag” such as advanced age, history of trauma, history of cancer, and prolonged corticosteroid use, all of which have been associated with an increased probability (from 9% to 33%) of either spinal fracture or malignancy.2 Other red flags include duration longer than 6 weeks, fever, weight loss, and progressive neurologic findings on examination. This patient has none of these.
GUIDELINES AND CHOOSING WISELY
High-quality guidelines from different groups recommend against spine imaging in patients with low back pain.3–6 These guidelines vary slightly in their patient populations and definitions of uncomplicated low back pain.
The American College of Radiology4 and the American College of Occupational and Environmental Medicine6 recommend against imaging for patients with both nonspecific and radicular low back pain in the first 6 weeks as long as no red flags are present.
The National Institute for Health and Clinical Excellence3 and, jointly, the American College of Physicians and American Pain Society (ACP/APS)5 recommend against imaging for patients with nonspecific low back pain in both the acute and chronic settings. Nonspecific low back pain is defined as pain without signs of a serious underlying condition (eg, cancer, infection, cauda equina syndrome), spinal stenosis or radiculopathy, or another specific spinal cause (eg, vertebral compression fracture, ankylosing spondylitis).
In addition, imaging in patients with nonspecific low back pain is one of the top five practices that should be questioned by physicians and patients, according to the American Board of Internal Medicine Foundation in its Choosing Wisely campaign (www.choosingwisely.org).
HARMS ASSOCIATED WITH SPINE IMAGING
Several guidelines cite radiation exposure as a potential harmful consequence of spinal imaging by plain radiography and computed tomography. The American College of Radiology guideline4 estimates that the radiation exposure of plain lumbar radiography or lumbar computed tomography ranges between 1 and 10 mSv (3 mSv is the annual amount of ambient radiation in the United States), placing both studies in the medium-range category for relative radiation exposure. The ACP/APS guideline5 states that radiation exposure from imaging is a reason to dissuade clinicians from routine use.
Although lumbar magnetic resonance imaging does not carry the risk of radiation exposure, it may result in harm by detecting clinically insignificant abnormalities in more than 30% of patients.7 These incidental findings increase with age and may lead to additional and possibly unnecessary testing and invasive treatments. The American College of Occupational and Environmental Medicine guideline6 also cites the high prevalence of abnormal findings on plain radiography, magnetic resonance imaging, and other diagnostic tests that are unrelated to symptoms.
CLINICAL BOTTOM LINE
On the basis of current data, the patient described at the beginning of this article should not undergo spine imaging; the results are unlikely to affect his medical management and improve his clinical outcome, and imaging carries a small risk of harm.
A practical approach would be to treat his pain with simple analgesia (a different nonsteroidal anti-inflammatory drug or acetaminophen), address his functional challenges, and reassure him that his chance of having a serious underlying cause of back pain is low (< 1%). He should be told to expect significant improvement in his symptoms within 30 days, be encouraged to stay active, and should be offered patient-focused self-help resources.
The recommendation to conservatively manage patients at low risk without imaging is consistent among all four guidelines. Imaging can be considered for a small subset of patients at high risk with red-flag indications. Potential harms associated with routine imaging of all patients with low back pain include radiation exposure and the high rate of clinically insignificant abnormalities that may lead to unnecessary and invasive interventions that increase expense, patient risk, and anxiety without improving outcomes.
- Martin BI, Deyo RA, Mirza SK, et al. Expenditures and health status among adults with back and neck problems. JAMA 2008; 299:656–664. Erratum in: JAMA 2008; 299:2630.
- Downie A, Williams CM, Henschke N, et al. Red flags to screen for malignancy and fracture in patients with low back pain: systematic review. BMJ 2013; 347:f7095.
- National Collaborating Centre for Primary Care. Low back pain. Early management of persistent nonspecific low back pain. London (UK): National Institute for Health and Clinical Excellence (NICE); 2009 May.25p. (Clinical guideline; no. 88) http://guidelines.gov/content.aspx?id=14699&search=low+back+pain. http://guidance.nice.org.uk/CG88. Accessed May 23, 2014
- Davis PC, Wippold FJ, Cornelius RS, et al; Expert Panel on Neurologic Imaging. ACR appropriateness criteria® low back pain. Reston, VA: American College of Radiology (ACR); 2011. www.guideline.gov/content.aspx?id=35145. Accessed May 23, 2014.
- Chou R, Qaseem A, Snow V, et al; Clinical Efficacy Assessment Subcommittee of the American College of Physicians; American College of Physicians; American Pain Society Low Back Pain Guidelines Panel. Diagnosis and treatment of low back pain: a joint clinical practice guideline from the American College of Physicians and the American Pain Society. Ann Intern Med 2007; 147:478–491. Erratum in: Ann Intern Med 2008; 148:247–248.
- Low back disorders. In:Hegmann KT, editor. Occupational Medicine Practice Guidelines. Evaluation and Management of Common Health Problems and Functional Recovery in Workers. 3rd ed. Elk Grove Village, IL: American College of Occupational and Environmental Medicine (ACOEM); 2011:333–796. www.guideline.gov/content.aspx?id=38438. Accessed May 23, 2014.
- Boden SD, Davis DO, Dina TS, Patronas NJ, Wiesel SW. Abnormal magnetic-resonance scans of the lumbar spine in asymptomatic subjects. A prospective investigation. J Bone Joint Surg Am 1990; 72:403–408.
A 38-year-old man is evaluated in an urgent care center for back pain. He is a high school mathematics teacher who reports the insidious onset of low back pain 3 weeks ago. Over the last week the pain has become constant, is worsened by movement, and does not respond to naproxen. He has no history of trauma, malignancy, fever, weight loss, or bladder or bowel symptoms. He does not use intravenous drugs. On examination, he appears uncomfortable and stiff, protecting his back against motion. He has intact sensation, strength, and reflexes. The straight-leg-raising maneuver reproduces his lower back pain but does not cause radicular pain. Should I now order an imaging study such as spinal radiography, computed tomography, or magnetic resonance imaging to direct therapy?
IMAGING STUDIES ARE UNLIKELY TO HELP
This man with acute, nonspecific low back pain does not need spinal imaging. Imaging—ie, spine radiography, computed tomography, or magnetic resonance imaging—is unlikely to be helpful in a patient with nonspecific low back pain and may expose him unnecessarily to radiation and the anxiety of findings that are clinically insignificant.
Imaging studies are often ordered inappropriately as part of the evaluation of back pain in patients such as this. In 2008, the total national cost of treating spine (neck and back) problems was estimated to be $86 billion, representing 9% of total health care costs, which is close to the estimated $89 billion per year spent on cancer care.1
Spine imaging should be considered only in patients who have a “red flag” such as advanced age, history of trauma, history of cancer, and prolonged corticosteroid use, all of which have been associated with an increased probability (from 9% to 33%) of either spinal fracture or malignancy.2 Other red flags include duration longer than 6 weeks, fever, weight loss, and progressive neurologic findings on examination. This patient has none of these.
GUIDELINES AND CHOOSING WISELY
High-quality guidelines from different groups recommend against spine imaging in patients with low back pain.3–6 These guidelines vary slightly in their patient populations and definitions of uncomplicated low back pain.
The American College of Radiology4 and the American College of Occupational and Environmental Medicine6 recommend against imaging for patients with both nonspecific and radicular low back pain in the first 6 weeks as long as no red flags are present.
The National Institute for Health and Clinical Excellence3 and, jointly, the American College of Physicians and American Pain Society (ACP/APS)5 recommend against imaging for patients with nonspecific low back pain in both the acute and chronic settings. Nonspecific low back pain is defined as pain without signs of a serious underlying condition (eg, cancer, infection, cauda equina syndrome), spinal stenosis or radiculopathy, or another specific spinal cause (eg, vertebral compression fracture, ankylosing spondylitis).
In addition, imaging in patients with nonspecific low back pain is one of the top five practices that should be questioned by physicians and patients, according to the American Board of Internal Medicine Foundation in its Choosing Wisely campaign (www.choosingwisely.org).
HARMS ASSOCIATED WITH SPINE IMAGING
Several guidelines cite radiation exposure as a potential harmful consequence of spinal imaging by plain radiography and computed tomography. The American College of Radiology guideline4 estimates that the radiation exposure of plain lumbar radiography or lumbar computed tomography ranges between 1 and 10 mSv (3 mSv is the annual amount of ambient radiation in the United States), placing both studies in the medium-range category for relative radiation exposure. The ACP/APS guideline5 states that radiation exposure from imaging is a reason to dissuade clinicians from routine use.
Although lumbar magnetic resonance imaging does not carry the risk of radiation exposure, it may result in harm by detecting clinically insignificant abnormalities in more than 30% of patients.7 These incidental findings increase with age and may lead to additional and possibly unnecessary testing and invasive treatments. The American College of Occupational and Environmental Medicine guideline6 also cites the high prevalence of abnormal findings on plain radiography, magnetic resonance imaging, and other diagnostic tests that are unrelated to symptoms.
CLINICAL BOTTOM LINE
On the basis of current data, the patient described at the beginning of this article should not undergo spine imaging; the results are unlikely to affect his medical management and improve his clinical outcome, and imaging carries a small risk of harm.
A practical approach would be to treat his pain with simple analgesia (a different nonsteroidal anti-inflammatory drug or acetaminophen), address his functional challenges, and reassure him that his chance of having a serious underlying cause of back pain is low (< 1%). He should be told to expect significant improvement in his symptoms within 30 days, be encouraged to stay active, and should be offered patient-focused self-help resources.
The recommendation to conservatively manage patients at low risk without imaging is consistent among all four guidelines. Imaging can be considered for a small subset of patients at high risk with red-flag indications. Potential harms associated with routine imaging of all patients with low back pain include radiation exposure and the high rate of clinically insignificant abnormalities that may lead to unnecessary and invasive interventions that increase expense, patient risk, and anxiety without improving outcomes.
- Martin BI, Deyo RA, Mirza SK, et al. Expenditures and health status among adults with back and neck problems. JAMA 2008; 299:656–664. Erratum in: JAMA 2008; 299:2630.
- Downie A, Williams CM, Henschke N, et al. Red flags to screen for malignancy and fracture in patients with low back pain: systematic review. BMJ 2013; 347:f7095.
- National Collaborating Centre for Primary Care. Low back pain. Early management of persistent nonspecific low back pain. London (UK): National Institute for Health and Clinical Excellence (NICE); 2009 May.25p. (Clinical guideline; no. 88) http://guidelines.gov/content.aspx?id=14699&search=low+back+pain. http://guidance.nice.org.uk/CG88. Accessed May 23, 2014
- Davis PC, Wippold FJ, Cornelius RS, et al; Expert Panel on Neurologic Imaging. ACR appropriateness criteria® low back pain. Reston, VA: American College of Radiology (ACR); 2011. www.guideline.gov/content.aspx?id=35145. Accessed May 23, 2014.
- Chou R, Qaseem A, Snow V, et al; Clinical Efficacy Assessment Subcommittee of the American College of Physicians; American College of Physicians; American Pain Society Low Back Pain Guidelines Panel. Diagnosis and treatment of low back pain: a joint clinical practice guideline from the American College of Physicians and the American Pain Society. Ann Intern Med 2007; 147:478–491. Erratum in: Ann Intern Med 2008; 148:247–248.
- Low back disorders. In:Hegmann KT, editor. Occupational Medicine Practice Guidelines. Evaluation and Management of Common Health Problems and Functional Recovery in Workers. 3rd ed. Elk Grove Village, IL: American College of Occupational and Environmental Medicine (ACOEM); 2011:333–796. www.guideline.gov/content.aspx?id=38438. Accessed May 23, 2014.
- Boden SD, Davis DO, Dina TS, Patronas NJ, Wiesel SW. Abnormal magnetic-resonance scans of the lumbar spine in asymptomatic subjects. A prospective investigation. J Bone Joint Surg Am 1990; 72:403–408.
Better care is the best defense: High-value clinical practice vs defensive medicine
"I view every patient as a potential lawsuit." This statement is jolting. Yet more than 69% of neurosurgeons in a recent study said they agreed or strongly agreed with this survey question.1 What are its implications for patients, for clinical practice, and for the US health care system?
There are many frustrations in the delivery of health care today, for patients as well as for physicians. For physicians, concern about medical liability is a large one, with secondary implications for both health care costs and quality. The Institute of Medicine has estimated that $765 billion—or 30 cents out of every dollar spent on health care—is wasted annually in the United States, adding to the financial burden of health care without benefiting patients.2 A significant portion of this waste, estimated at $210 billion, is related to unnecessary services that are under the control of physicians, including overuse and misuse of diagnostic testing and treatment. This type of care is not only wasteful, but also has the potential to harm.
Factors thought to be responsible for this inappropriate care include the expectations of patients, physician or patient discomfort with uncertainty, and unnecessary and costly consultations. But the factor that physicians cite most often is concern about malpractice suits, raised by 76% of physicians responding to a survey.3
THE DILEMMAS ILLUSTRATED
Here are two cases—to which we will return later—that illustrate the dilemmas faced by physicians deciding how aggressively to pursue a diagnosis:
Patient 1. A 32-year-old woman comes to your office for evaluation of intermittent headaches over the past year. After a detailed history and a normal physical examination, you believe that these are tension headaches. Should you order an imaging study of the brain, just to avoid the risk of a malpractice suit in the unlikely event that this could be the presenting symptom of a brain tumor?
Patient 2. A 60-year-old man presents to the emergency room with pleuritic chest pain. Calculation of pretest probability by modified Wells criteria indicates that pulmonary embolus is unlikely. Because missing the diagnosis can lead to a malpractice suit, should you still order computed tomographic (CT) pulmonary angiography to rule out an embolus?
JUST ONE MORE TEST CAN’T HURT…
Defensive medicine is the ordering or avoiding of tests or procedures primarily out of concern about malpractice liability.4 It increases health care costs, but by how much is unclear.5 It can harm the patient-physician relationship and trust and can also harm patients, especially if overtesting and treatment lead to false-positive results and more tests, which actually can result in liability. And it is not the highest-value care for patients.
Physicians have an ethical duty to do what is best for the individual patient; they also have a responsibility to society to practice effective health care that uses resources responsibly.6 And despite telling ourselves and our patients that one more test will give us confirmation of results and therefore comfort, a recent review found that tests performed based on symptoms with low risk of being caused by serious illness “do little to reassure patients, decrease their anxiety, or resolve their symptoms.”7
MALPRACTICE LIABILITY RISK: PERCEPTION AND REALITY
Physicians often overestimate their risk of liability. Only a small percentage (5%) of claims go to trial, and of those, 90% are won by the physician, according to a 2008 analysis by the Physician Insurers Association of America.8 A study of claims between 2002 and 2005 found that 4.5% of claims resulted in trial verdicts, of which 80% were in favor of the physician, with cases against internists and internal medicine-based subspecialists least likely to result in a trial verdict (2.7%).9
Even so, being sued is extremely stressful and is associated with distinct physical and emotional distress for most physicians.10,11 Charles has found that, “As a group, physicians are acutely sensitive to any suggestions that they have failed to meet the standard of care or are not ‘good’ doctors… This accusation of failure represents a personal assault.”11
Physician concerns about liability are not very different in states with tort reforms such as damage caps compared with those without.5 Some posit that physicians may overestimate the risk of liability as part of the human tendency to overestimate the risk of rare events that are difficult to experience and difficult to control.12
In the study of neurosurgeons cited previously, 72% of respondents said they ordered imaging, 67% did laboratory tests, and 66% referred patients for consults “solely” to “minimize the risk of a lawsuit.”1 The authors of the study maintain that, over time, this affects the standard of care. “While physicians in the past may have used a thorough history and physical to guide imaging, in this study, 72% of neurosurgeons surveyed stated that they order additional imaging studies solely to mitigate liability risk. This suggests that in reality, imaging is becoming a standard part of the initial workup.”1 Unfortunately, this new standard of care is based on false assumptions and is artificially and inappropriately changed. That perception of liability risk deeply influences practice.
DO THE RIGHT THING: AVOIDING UNNECESSARY TESTING
But physicians also acknowledge the need to follow practice guidelines and to avoid unnecessary testing. In one survey,13 79% strongly or moderately agreed with the statement that physicians “should adhere to clinical guidelines that discourage the use of interventions that have a small proven advantage over standard intervention but cost much more”; 89% strongly or moderately agreed that “doctors need to take a more prominent role in limiting use of unnecessary tests”; and 78% said they “should be solely devoted to individual patients’ best interests, even if that is expensive.”13
This may be summarized as, “Provide the clinically appropriate care to the patient based on the best evidence.” But of course, this is easier said than done.
THE ROLE OF EVIDENCE-BASED GUIDELINES
Evidence-based practice guidelines can help support the provision of clinically (and ethically) appropriate care. Medical custom—the care expected of reasonable clinicians under similar circumstances—is generally the legal standard in determining whether a clinician has met a duty of care to a patient in a lawsuit.14 But practice guidelines can provide strong evidence of what constitutes reasonable care and can, over time, help set the standard for quality of care.
Clinical practice guidelines have grown in recent years, especially after the Institute of Medicine embraced them as a means to address variation in practice patterns and quality of care. But guidelines can conflict. Their effective implementation relies on clinical judgment. If a guideline is not appropriate in a particular case, documentation of why the guideline was not followed may prove prudent. Guidelines are not a safe harbor and have and will be used both defensively and offensively. They are not the last word, but rather another type of expert evidence.15 However, they are an important one. At the end of the day, the best care is the best defense.
Guidelines not only educate physicians, they also should be used by physicians to educate patients. In addition to developing guidelines for physicians, professional societies should develop and disseminate public education materials that inform patients and their families and caregivers about clinically appropriate care and the problems resulting from overuse and misuse of care.
GETTING BACK TO BASICS
Kroenke noted that preliminary data suggest that the history typically accounts for 75% or more of the diagnostic yield when evaluating common symptoms, the physical examination 10% to 15%, and testing generally less than 10%.16 Yet health care reimbursement in the United States contains incentives in precisely the reverse order. So, not surprisingly, we keep on testing away. Kroenke says that countering the rush to test will be as challenging and slow as trying to reverse a generation of antibiotic overprescribing.16
Over time, our reliance on technology as a diagnostic tool has increased, with less emphasis on the history and particularly on the physical examination to solve diagnostic puzzles. Yet most diagnostic errors in a study of outpatient primary care visits were related to breakdowns in the clinical interaction, including the taking of the medical history, the performance of the physical examination, and the ordering of tests. Technologies such as the electronic health record, which can assist in the care of patients, are also a potential source of error and shortcuts in care, as when copying and pasting is used inappropriately.17 Recognizing the increasing use of technology in practice and team-based approaches to improving care, Singh et al have called for caution and for more “focus on basic clinical skills and related cognitive processes.”18
The erosion of physical examination skills, discomfort with diagnostic uncertainty, and fear of malpractice litigation have combined to create a perfect storm of technologic overuse and misuse. Unfortunately, this means that our modus operandi is all too frequently built around testing rather than touching.19
At the same time, it is well established that patients often sue because of dissatisfaction, especially with physician communication and interpersonal skills.14 Emphasizing the basic skills that include taking a carefully crafted history, performing a skillful physical examination, and communicating effectively and compassionately with patients at every encounter is probably the most successful strategy for simultaneously avoiding malpractice litigation, reducing overused and misused diagnostic testing, and conserving precious health care resources.
Another part of the strategy should include routinely considering a number of straightforward questions before ordering diagnostic tests, such as “Will the test result change my care of the patient?” and “How does ordering this test compare in value with other management strategies for the patient?”20,21
RETURNING TO THE CASES
Regarding patient 1, the 32-year-old woman with intermittent headaches, the American College of Radiology identified imaging for headache in its list of five areas submitted to the Choosing Wisely campaign in which care may be overused or misused. Specifically, the American College of Radiology says, “Don’t do imaging for uncomplicated headache” in the absence of specific risk factors for structural disease, noting that “incidental findings lead to additional medical procedures and expense that do not improve patient well-being.”22
For patient 2, the 60-year-old man with pleuritic chest pain, both the American College of Physicians and the American College of Radiology strongly recommend against CT pulmonary angiography for patients in whom calculation of pretest probability indicates a low pretest probability of pulmonary embolism.22,23 Patients such as these should undergo D-dimer testing rather than CT pulmonary angiography. In this setting, a negative D-dimer test effectively rules out pulmonary embolism and avoids both the radiation and cost associated with the unnecessary imaging study.
According to the Ethics Manual of the American College of Physicians,6 “physicians have an obligation to promote their patients’ welfare in an increasingly complex health care system. This entails forthrightly helping patients to understand clinical recommendations and make informed choices among all appropriate care options… It also includes stewardship of finite health care resources so that as many health care needs as possible can be met, whether in the physician’s office, in the hospital or long-term care facility, or at home.”6 The basic principles of beneficence and nonmaleficence are aligned with doing the right thing for our patients—ie, providing the appropriate care at the right time and avoiding too much care or too little care. Guided by scientific evidence as well as by guidelines and official recommendations based on such evidence, we are in the best position to provide optimal care for our patients while simultaneously minimizing the risk of malpractice litigation.
As is the case with overprescribing, we must look critically at the inappropriate use of tests and other care applied under the rationale of not wanting to “miss anything”—and the unspoken drivers of financial incentives, new or advanced tests and procedures, and defensive medicine. We know what needs to be done. And nothing short of evidence-based high-value care will do.
Acknowledgment: The authors would like to thank Kathy Wynkoop for editorial assistance.
- Nahed BV, Babu MA, Smith TR, Heary RF. Malpractice liability and defensive medicine: a national survey of neurosurgeons. PLoS One 2012; 7:e39237.
- Institute of Medicine. The Healthcare Imperative: Lowering Costs and Improving Outcomes: Workshop Series Summary. Washington, DC: The National Academies Press, 2010.
- Sirovich BE, Woloshin S, Schwartz LM. Too Little? Too Much? Primary care physicians’ views on US health care: a brief report. Arch Intern Med 2011; 171:1582–1585.
- US Congress Office of Technology Assessment. Defensive Medicine and Medical Malpractice, OTA-H–6O2. Washington, DC: US Government Printing Office, 1994.
- Carrier ER, Reschovsky JD, Katz DA, Mello MM. High physician concern about malpractice risk predicts more aggressive diagnostic testing in office-based practice. Health Aff (Millwood) 2013; 32:1383–1391.
- Snyder LAmerican College of Physicians Ethics, Professionalism, and Human Rights Committee. American College of Physicians Ethics Manual: sixth edition. Ann Intern Med 2012; 156:73–104.
- Rolfe A, Burton C. Reassurance after diagnostic testing with a low pretest probability of serious disease: systematic review and meta-analysis. JAMA Intern Med 2013; 173:407–416.
- Kane CK. Policy research perspectives: medical liability claim frequency: a 2007–2008 snapshot of physicians. American Medical Association, 2010. Available at www.ama-assn.org. Accessed July 2, 2014.
- Jena AB, Chandra A, Lakdawalla D, Seabury S. Outcomes of medical malpractice litigation against US physicians. Arch Intern Med 2012; 172:892–894.
- Charles SC, Pyskoty CE, Nelson A. Physicians on trial—self-reported reactions to malpractice trials. West J Med 1988; 148:358–360.
- Charles SC. Coping with a medical malpractice suit. West J Med 2001; 174:55–58.
- Carrier ER, Reschovsky JD, Mello MM, Mayrell RC, Katz D. Physicians’ fears of malpractice lawsuits are not assuaged by tort reforms. Health Aff (Millwood) 2010; 29:1585–1592.
- Tilburt JC, Wynia MK, Sheeler RD, et al. Views of US physicians about controlling health care costs. JAMA 2013; 310:380–388.
- Studdert DM, Mello MM, Brennan TA. Medical malpractice. N Engl J Med 2004; 350:283–292.
- Mehlman MJ. Medical practice guidelines as malpractice safe harbors: illusion or deceit? J Law Med Ethics 2012; 40:286–300.
- Kroenke K. Diagnostic testing and the illusory reassurance of normal results: comment on “Reassurance after diagnostic testing with a low pretest probability of serious disease.” JAMA Intern Med 2013; 173:416–417.
- Rattner S, Mathes M, Siegler E. Copy and pasted and misdiagnosed (or cloned notes and blind alleys). ACP Ethics Case Study CME program. Available at https://www.acponline.org/running_practice/ethics/case_studies/. Accessed July 2, 2014.
- Singh H, Giardina TD, Meyer AN, Forjuoh SN, Reis MD, Thomas EJ. Types and origins of diagnostic errors in primary care settings. JAMA Intern Med 2013; 173:418–425.
- Verghese A, Brady E, Kapur CC, Horwitz RI. The bedside evaluation: ritual and reason. Ann Intern Med 2011; 155:550–553.
- Laine C. High-value testing begins with a few simple questions. Ann Intern Med 2012; 156:162–163.
- Weinberger SE. Providing high-value, cost-conscious care: a critical seventh general competency for physicians. Ann Intern Med 2011; 155:386–388.
- American College of Radiology (ACR). Choosing Wisely. Five things physicians and patients should question. http://www.choosingwisely.org/doctor-patient-lists/american-college-of-radiology/. Accessed July 2, 2014.
- American College of Physicians (ACP). Choosing Wisely. Five things physicians and patients should question. http://www.choosingwisely.org/doctor-patient-lists/american-college-of-physicians/. Accessed July 2, 2014.
"I view every patient as a potential lawsuit." This statement is jolting. Yet more than 69% of neurosurgeons in a recent study said they agreed or strongly agreed with this survey question.1 What are its implications for patients, for clinical practice, and for the US health care system?
There are many frustrations in the delivery of health care today, for patients as well as for physicians. For physicians, concern about medical liability is a large one, with secondary implications for both health care costs and quality. The Institute of Medicine has estimated that $765 billion—or 30 cents out of every dollar spent on health care—is wasted annually in the United States, adding to the financial burden of health care without benefiting patients.2 A significant portion of this waste, estimated at $210 billion, is related to unnecessary services that are under the control of physicians, including overuse and misuse of diagnostic testing and treatment. This type of care is not only wasteful, but also has the potential to harm.
Factors thought to be responsible for this inappropriate care include the expectations of patients, physician or patient discomfort with uncertainty, and unnecessary and costly consultations. But the factor that physicians cite most often is concern about malpractice suits, raised by 76% of physicians responding to a survey.3
THE DILEMMAS ILLUSTRATED
Here are two cases—to which we will return later—that illustrate the dilemmas faced by physicians deciding how aggressively to pursue a diagnosis:
Patient 1. A 32-year-old woman comes to your office for evaluation of intermittent headaches over the past year. After a detailed history and a normal physical examination, you believe that these are tension headaches. Should you order an imaging study of the brain, just to avoid the risk of a malpractice suit in the unlikely event that this could be the presenting symptom of a brain tumor?
Patient 2. A 60-year-old man presents to the emergency room with pleuritic chest pain. Calculation of pretest probability by modified Wells criteria indicates that pulmonary embolus is unlikely. Because missing the diagnosis can lead to a malpractice suit, should you still order computed tomographic (CT) pulmonary angiography to rule out an embolus?
JUST ONE MORE TEST CAN’T HURT…
Defensive medicine is the ordering or avoiding of tests or procedures primarily out of concern about malpractice liability.4 It increases health care costs, but by how much is unclear.5 It can harm the patient-physician relationship and trust and can also harm patients, especially if overtesting and treatment lead to false-positive results and more tests, which actually can result in liability. And it is not the highest-value care for patients.
Physicians have an ethical duty to do what is best for the individual patient; they also have a responsibility to society to practice effective health care that uses resources responsibly.6 And despite telling ourselves and our patients that one more test will give us confirmation of results and therefore comfort, a recent review found that tests performed based on symptoms with low risk of being caused by serious illness “do little to reassure patients, decrease their anxiety, or resolve their symptoms.”7
MALPRACTICE LIABILITY RISK: PERCEPTION AND REALITY
Physicians often overestimate their risk of liability. Only a small percentage (5%) of claims go to trial, and of those, 90% are won by the physician, according to a 2008 analysis by the Physician Insurers Association of America.8 A study of claims between 2002 and 2005 found that 4.5% of claims resulted in trial verdicts, of which 80% were in favor of the physician, with cases against internists and internal medicine-based subspecialists least likely to result in a trial verdict (2.7%).9
Even so, being sued is extremely stressful and is associated with distinct physical and emotional distress for most physicians.10,11 Charles has found that, “As a group, physicians are acutely sensitive to any suggestions that they have failed to meet the standard of care or are not ‘good’ doctors… This accusation of failure represents a personal assault.”11
Physician concerns about liability are not very different in states with tort reforms such as damage caps compared with those without.5 Some posit that physicians may overestimate the risk of liability as part of the human tendency to overestimate the risk of rare events that are difficult to experience and difficult to control.12
In the study of neurosurgeons cited previously, 72% of respondents said they ordered imaging, 67% did laboratory tests, and 66% referred patients for consults “solely” to “minimize the risk of a lawsuit.”1 The authors of the study maintain that, over time, this affects the standard of care. “While physicians in the past may have used a thorough history and physical to guide imaging, in this study, 72% of neurosurgeons surveyed stated that they order additional imaging studies solely to mitigate liability risk. This suggests that in reality, imaging is becoming a standard part of the initial workup.”1 Unfortunately, this new standard of care is based on false assumptions and is artificially and inappropriately changed. That perception of liability risk deeply influences practice.
DO THE RIGHT THING: AVOIDING UNNECESSARY TESTING
But physicians also acknowledge the need to follow practice guidelines and to avoid unnecessary testing. In one survey,13 79% strongly or moderately agreed with the statement that physicians “should adhere to clinical guidelines that discourage the use of interventions that have a small proven advantage over standard intervention but cost much more”; 89% strongly or moderately agreed that “doctors need to take a more prominent role in limiting use of unnecessary tests”; and 78% said they “should be solely devoted to individual patients’ best interests, even if that is expensive.”13
This may be summarized as, “Provide the clinically appropriate care to the patient based on the best evidence.” But of course, this is easier said than done.
THE ROLE OF EVIDENCE-BASED GUIDELINES
Evidence-based practice guidelines can help support the provision of clinically (and ethically) appropriate care. Medical custom—the care expected of reasonable clinicians under similar circumstances—is generally the legal standard in determining whether a clinician has met a duty of care to a patient in a lawsuit.14 But practice guidelines can provide strong evidence of what constitutes reasonable care and can, over time, help set the standard for quality of care.
Clinical practice guidelines have grown in recent years, especially after the Institute of Medicine embraced them as a means to address variation in practice patterns and quality of care. But guidelines can conflict. Their effective implementation relies on clinical judgment. If a guideline is not appropriate in a particular case, documentation of why the guideline was not followed may prove prudent. Guidelines are not a safe harbor and have and will be used both defensively and offensively. They are not the last word, but rather another type of expert evidence.15 However, they are an important one. At the end of the day, the best care is the best defense.
Guidelines not only educate physicians, they also should be used by physicians to educate patients. In addition to developing guidelines for physicians, professional societies should develop and disseminate public education materials that inform patients and their families and caregivers about clinically appropriate care and the problems resulting from overuse and misuse of care.
GETTING BACK TO BASICS
Kroenke noted that preliminary data suggest that the history typically accounts for 75% or more of the diagnostic yield when evaluating common symptoms, the physical examination 10% to 15%, and testing generally less than 10%.16 Yet health care reimbursement in the United States contains incentives in precisely the reverse order. So, not surprisingly, we keep on testing away. Kroenke says that countering the rush to test will be as challenging and slow as trying to reverse a generation of antibiotic overprescribing.16
Over time, our reliance on technology as a diagnostic tool has increased, with less emphasis on the history and particularly on the physical examination to solve diagnostic puzzles. Yet most diagnostic errors in a study of outpatient primary care visits were related to breakdowns in the clinical interaction, including the taking of the medical history, the performance of the physical examination, and the ordering of tests. Technologies such as the electronic health record, which can assist in the care of patients, are also a potential source of error and shortcuts in care, as when copying and pasting is used inappropriately.17 Recognizing the increasing use of technology in practice and team-based approaches to improving care, Singh et al have called for caution and for more “focus on basic clinical skills and related cognitive processes.”18
The erosion of physical examination skills, discomfort with diagnostic uncertainty, and fear of malpractice litigation have combined to create a perfect storm of technologic overuse and misuse. Unfortunately, this means that our modus operandi is all too frequently built around testing rather than touching.19
At the same time, it is well established that patients often sue because of dissatisfaction, especially with physician communication and interpersonal skills.14 Emphasizing the basic skills that include taking a carefully crafted history, performing a skillful physical examination, and communicating effectively and compassionately with patients at every encounter is probably the most successful strategy for simultaneously avoiding malpractice litigation, reducing overused and misused diagnostic testing, and conserving precious health care resources.
Another part of the strategy should include routinely considering a number of straightforward questions before ordering diagnostic tests, such as “Will the test result change my care of the patient?” and “How does ordering this test compare in value with other management strategies for the patient?”20,21
RETURNING TO THE CASES
Regarding patient 1, the 32-year-old woman with intermittent headaches, the American College of Radiology identified imaging for headache in its list of five areas submitted to the Choosing Wisely campaign in which care may be overused or misused. Specifically, the American College of Radiology says, “Don’t do imaging for uncomplicated headache” in the absence of specific risk factors for structural disease, noting that “incidental findings lead to additional medical procedures and expense that do not improve patient well-being.”22
For patient 2, the 60-year-old man with pleuritic chest pain, both the American College of Physicians and the American College of Radiology strongly recommend against CT pulmonary angiography for patients in whom calculation of pretest probability indicates a low pretest probability of pulmonary embolism.22,23 Patients such as these should undergo D-dimer testing rather than CT pulmonary angiography. In this setting, a negative D-dimer test effectively rules out pulmonary embolism and avoids both the radiation and cost associated with the unnecessary imaging study.
According to the Ethics Manual of the American College of Physicians,6 “physicians have an obligation to promote their patients’ welfare in an increasingly complex health care system. This entails forthrightly helping patients to understand clinical recommendations and make informed choices among all appropriate care options… It also includes stewardship of finite health care resources so that as many health care needs as possible can be met, whether in the physician’s office, in the hospital or long-term care facility, or at home.”6 The basic principles of beneficence and nonmaleficence are aligned with doing the right thing for our patients—ie, providing the appropriate care at the right time and avoiding too much care or too little care. Guided by scientific evidence as well as by guidelines and official recommendations based on such evidence, we are in the best position to provide optimal care for our patients while simultaneously minimizing the risk of malpractice litigation.
As is the case with overprescribing, we must look critically at the inappropriate use of tests and other care applied under the rationale of not wanting to “miss anything”—and the unspoken drivers of financial incentives, new or advanced tests and procedures, and defensive medicine. We know what needs to be done. And nothing short of evidence-based high-value care will do.
Acknowledgment: The authors would like to thank Kathy Wynkoop for editorial assistance.
- Nahed BV, Babu MA, Smith TR, Heary RF. Malpractice liability and defensive medicine: a national survey of neurosurgeons. PLoS One 2012; 7:e39237.
- Institute of Medicine. The Healthcare Imperative: Lowering Costs and Improving Outcomes: Workshop Series Summary. Washington, DC: The National Academies Press, 2010.
- Sirovich BE, Woloshin S, Schwartz LM. Too Little? Too Much? Primary care physicians’ views on US health care: a brief report. Arch Intern Med 2011; 171:1582–1585.
- US Congress Office of Technology Assessment. Defensive Medicine and Medical Malpractice, OTA-H–6O2. Washington, DC: US Government Printing Office, 1994.
- Carrier ER, Reschovsky JD, Katz DA, Mello MM. High physician concern about malpractice risk predicts more aggressive diagnostic testing in office-based practice. Health Aff (Millwood) 2013; 32:1383–1391.
- Snyder LAmerican College of Physicians Ethics, Professionalism, and Human Rights Committee. American College of Physicians Ethics Manual: sixth edition. Ann Intern Med 2012; 156:73–104.
- Rolfe A, Burton C. Reassurance after diagnostic testing with a low pretest probability of serious disease: systematic review and meta-analysis. JAMA Intern Med 2013; 173:407–416.
- Kane CK. Policy research perspectives: medical liability claim frequency: a 2007–2008 snapshot of physicians. American Medical Association, 2010. Available at www.ama-assn.org. Accessed July 2, 2014.
- Jena AB, Chandra A, Lakdawalla D, Seabury S. Outcomes of medical malpractice litigation against US physicians. Arch Intern Med 2012; 172:892–894.
- Charles SC, Pyskoty CE, Nelson A. Physicians on trial—self-reported reactions to malpractice trials. West J Med 1988; 148:358–360.
- Charles SC. Coping with a medical malpractice suit. West J Med 2001; 174:55–58.
- Carrier ER, Reschovsky JD, Mello MM, Mayrell RC, Katz D. Physicians’ fears of malpractice lawsuits are not assuaged by tort reforms. Health Aff (Millwood) 2010; 29:1585–1592.
- Tilburt JC, Wynia MK, Sheeler RD, et al. Views of US physicians about controlling health care costs. JAMA 2013; 310:380–388.
- Studdert DM, Mello MM, Brennan TA. Medical malpractice. N Engl J Med 2004; 350:283–292.
- Mehlman MJ. Medical practice guidelines as malpractice safe harbors: illusion or deceit? J Law Med Ethics 2012; 40:286–300.
- Kroenke K. Diagnostic testing and the illusory reassurance of normal results: comment on “Reassurance after diagnostic testing with a low pretest probability of serious disease.” JAMA Intern Med 2013; 173:416–417.
- Rattner S, Mathes M, Siegler E. Copy and pasted and misdiagnosed (or cloned notes and blind alleys). ACP Ethics Case Study CME program. Available at https://www.acponline.org/running_practice/ethics/case_studies/. Accessed July 2, 2014.
- Singh H, Giardina TD, Meyer AN, Forjuoh SN, Reis MD, Thomas EJ. Types and origins of diagnostic errors in primary care settings. JAMA Intern Med 2013; 173:418–425.
- Verghese A, Brady E, Kapur CC, Horwitz RI. The bedside evaluation: ritual and reason. Ann Intern Med 2011; 155:550–553.
- Laine C. High-value testing begins with a few simple questions. Ann Intern Med 2012; 156:162–163.
- Weinberger SE. Providing high-value, cost-conscious care: a critical seventh general competency for physicians. Ann Intern Med 2011; 155:386–388.
- American College of Radiology (ACR). Choosing Wisely. Five things physicians and patients should question. http://www.choosingwisely.org/doctor-patient-lists/american-college-of-radiology/. Accessed July 2, 2014.
- American College of Physicians (ACP). Choosing Wisely. Five things physicians and patients should question. http://www.choosingwisely.org/doctor-patient-lists/american-college-of-physicians/. Accessed July 2, 2014.
When snoring is more than an annoyance

We have all seen cartoons of an unhappy wife awake in bed next to her loudly snoring husband. Casual conversations with friends, particularly female ones, indicate that this is an accurate representation of a common scenario. As I have started to probe more diligently for evidence of obstructive sleep apnea (OSA) in my patients, not just in those who complain of “fatigue” (more patients use this term with me than “sleepiness”), I see a lot of shaking of heads from the wives of men who deny that they snore or have disrupted sleep. I am not implying that this is solely a male disease. Far from it. But as in other medical scenarios, the Y chromosome seems somehow linked to denial or lack of awareness of symptoms. In any event, I was not a bit surprised to read in the review by Dr. Mehra in this issue of the Journal that 17% of adults may have OSA.
As awareness of OSA has grown and testing for it has become easier, multiple reports have documented associated comorbidities: hypertension, restless leg syndrome, gout, and neurocognitive deficits. Home devices to treat OSA have significantly improved. Technological advances have led to the development of small, quiet, smart pumps that provide continuous positive airway pressure (CPAP) via nasal or relatively comfortable full-face masks. Compliance and patient acceptance of CPAP have improved, although patient education and a bit of cajoling in the office are still necessary—less so if the bedroom partner is also present for this discussion.
Perhaps surprising is a growing pool of data showing that CPAP’s benefits extend to more than just reducing sleepiness. It can reduce nocturia, restless leg syndrome, arrhythmias including atrial fibrillation, gastric reflux, and fatal and nonfatal cardiovascular events. Snoring and thus probably sleep-partner satisfaction are also improved.
Several physiologic mechanisms may explain the benefits of CPAP, including reducing hypoxic episodes (explaining its effect on atrial fibrillation), altered atrial natriuretic factor levels (thus reducing nocturia), and changing intrathoracic pressure (thus reducing gastric reflux). It will be interesting to see if there are long-term effects of successfully applied CPAP on neurocognition and progression of neurodegenerative diseases.
While high-decibel snoring and snorting are not present in all patients with OSA, it is quite clear now that they represent far more than an annoyance. We should be vigilant about looking for OSA and strongly encourage a trial of CPAP in appropriately diagnosed patients.
Sleep apnea ABCs: Airway, breathing, circulation
Obstructive sleep apnea (OSA) is common and poorly recognized and, if untreated, leads to serious health consequences. This article discusses the epidemiology of OSA, describes common presenting signs and symptoms, and reviews diagnostic testing and treatment options. Adverse health effects related to untreated sleep apnea are also discussed.
COMMON, POORLY RECOGNIZED, AND COSTLY IF UNTREATED
OSA is very common in the general population and is associated with substantial morbidity and mortality. An estimated 17% of the general adult population has OSA, and the numbers are increasing with the obesity epidemic. Nearly 1 in 15 adults has at least moderate sleep apnea,1,2 and approximately 85% of cases are estimated to be undiagnosed.3 A 1999 study estimated that untreated OSA resulted in approximately $3.4 billion in additional medical costs per year in the United States,4 a figure that is likely to be higher now, given the rising prevalence of OSA. The prevalence of OSA in primary care and subspecialty clinics is even higher than in the community, as more than half of patients who have diabetes or hypertension and 30% to 40% of patients with coronary artery disease are estimated to have OSA.5–7
REPETITIVE UPPER-AIRWAY COLLAPSE
During sleep, parasympathetic activity is enhanced and the muscle tone of the upper airway is decreased, particularly in the pharyngeal dilator muscles. Still, even in the supine position, a healthy person maintains patency of the airway and adequate airflow during sleep.
OSA is characterized by repetitive complete or partial collapse of the upper airway during sleep, resulting in an apneic or hypopneic event, respectively, and often causing snoring from upper-airway tissue vibration.
People who are susceptible to OSA typically have a smaller, more collapsible airway that is often less distensible and has a higher critical closing pressure. Radiographic and physiologic data have shown that the airway dimensions of patients with OSA are smaller than in those without OSA. The shape of the airway of a patient with OSA is often elliptical, given the extrinsic compression of the lateral aspects of the airway by increased size of the parapharyngeal fat pads. OSA episodes are characterized by closure of the upper airway and by progressively increasing respiratory efforts driven by chemoreceptor and mechanoreceptor stimuli, culminating in an arousal from sleep and a reopening of the airway.
The disease-defining metric used for assessing OSA severity is the apnea-hypopnea index, ie, the number of apneas and hypopneas that occur per hour of sleep.8 An apneic or hypopneic event is identified during polysomnography by the complete cessation of airflow or by a reduction in airflow for 10 seconds or longer (Figure 1).
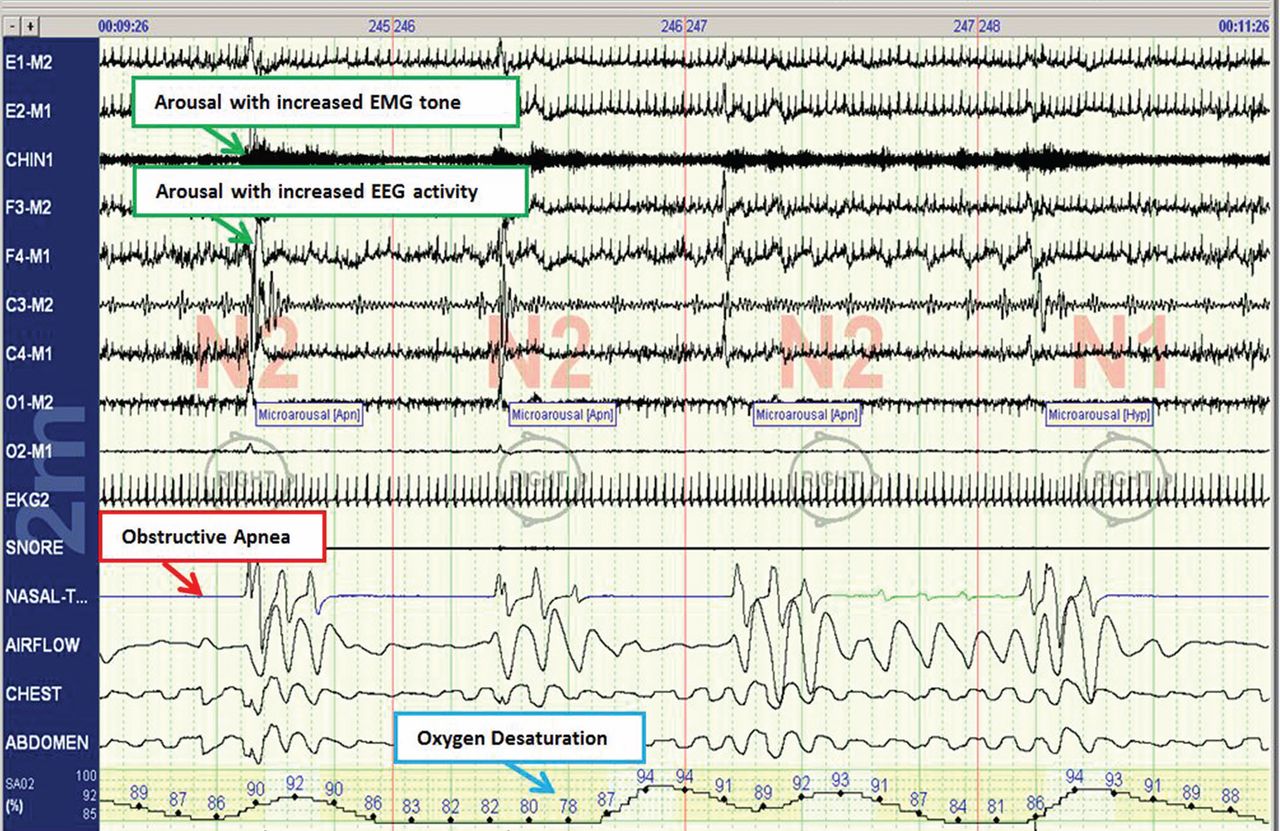
HEALTH CONSEQUENCES IF UNTREATED
Untreated sleep apnea causes numerous pathophysiologic perturbations, including chronic intermittent hypoxia, ventilatory overshoot hyperoxia, increased sympathetic nervous system activity, intrathoracic pressure swings, hypercapnea, sleep fragmentation, increased arousals, reduced sleep duration, and fragmentation of rapid-eye-movement sleep.
Intermittent hypoxia activates the sympathetic nervous system and causes pulmonary vasoconstriction, with increases in pulmonary arterial pressures and myocardial workload. Sympathetic activation, ascertained by peroneal microneurography, has been shown to be increased not only during sleep but also persisting during wakefulness in patients with untreated OSA vs those without OSA.9 Autonomic nervous system fluctuations accompany apneic episodes, resulting in enhanced parasympathetic tone and sympathetic activation associated with a rise in blood pressure and heart rate that occur after the respiratory event.
Intermediate pathways that link the negative pathophysiologic effects of OSA with adverse health outcomes include increased systemic inflammation, increased oxidative stress, metabolic dysfunction, insulin resistance, hypercoagulability, endothelial dysfunction, and autonomic dysfunction.
As a result, a variety of adverse clinical outcomes are associated with untreated OSA, including systemic hypertension, ischemic heart disease and atherosclerosis, diastolic dysfunction, congestive heart failure, cardiac arrhythmias, stroke, increased risk of death, and sudden death, as well as noncardiovascular outcomes such as gout, neurocognitive deficits, and mood disorders.10
Inflammatory and atherogenic effects
Increased levels of markers of systemic inflammation, prothrombosis, and oxidative stress have been observed in OSA and may be key pathophysiologic links between OSA and cardiovascular sequelae. OSA has been associated with up-regulation of a number of inflammatory mediators: interleukin (IL) 6, soluble IL-6 receptor, IL-8, tumor necrosis factor alpha, and C-reactive protein. Soluble IL-6 levels in particular are higher in people who have sleep-disordered breathing, as reflected by the apnea-hypopnea index independent of obesity, with relationships stronger in the morning than in the evening. This likely reflects the overnight OSA-related physiologic stress.11
Thrombotic potential is also enhanced, with higher levels of plasminogen activator inhibitor 1, fibrinogen, P-selectin, and vascular endothelial growth factor. Some of these factors normally have a diurnal cycle, with higher levels in the morning, but in OSA, increasing OSA severity is associated with increased prothrombotic potential in the morning hours. Of interest, levels of these substances showed a plateau effect, rising in people who had only mildly elevated apnea-hypopnea indices and then leveling off.12 Intermittent hypoxia followed by ventilatory overshoot hyperoxia, characteristic of sleep apnea, provides the ideal environment for augmentation of oxidative stress, with evidence of increased oxidation of serum proteins and lipids. Hypoxia and oxygen-derived free radicals may result in cardiac myocyte injury. Experimental data demonstrate that intermittent hypoxia combined with a high-fat diet results in synergistic acceleration of evidence of atherogenic lesions.
Patients with OSA also have evidence of endothelial dysfunction, insulin resistance, and dyslipidemia, all pathways that can facilitate the progression of atherosclerosis in OSA.13–15
Cardiac arrhythmias
In the Sleep Heart Health Study, a multicenter epidemiologic study designed to examine the relationships of OSA and cardiovascular outcomes, those who had moderate to severe OSA had a risk of ventricular and atrial arrhythmias two to four times higher than those without OSA, even after correction for the confounding influences of obesity and underlying cardiovascular risk.14 These findings were corroborated in subsequent work highlighting monotonic dose-response relationships with increasing OSA severity and increased odds of atrial and ventricular arrhythmia in a cohort of about 3,000 older men.11 Additional compelling evidence of a causal relationship is that the risk of discrete arrhythmic events is markedly increased after a respiratory disturbance in sleep.16
In patients who successfully underwent cardioversion for atrial fibrillation, those who had sleep apnea but were not treated with continuous positive airway pressure (CPAP) had a much higher rate of recurrence of atrial fibrillation during the subsequent year than those with CPAP-treated sleep apnea and than controls never diagnosed with sleep apnea. In the untreated patients with sleep apnea, the mean nocturnal fall in oxygen saturation was significantly greater in those who had recurrence of atrial fibrillation than in those who did not, suggesting hypoxia as an important mechanism contributing to atrial fibrillation.17
Since then, several other retrospective studies have shown similar findings after pulmonary vein antrum isolation and ablation in terms of reduction of atrial fibrillation recurrence with CPAP treatment in OSA.18
Walia et al19 described a patient with moderate sleep apnea who underwent a split-night study. During the baseline part of the study, the patient had about 18 ectopic beats per minute. During the second portion of the study while CPAP was applied, progressively fewer ectopic beats occurred as airway pressure was increased until a normal rhythm without ectopic beats was achieved at the goal treatment CPAP pressure setting.
Cardiovascular disease, stroke, and death
Marin et al20 followed about 1,500 men for 10 years, including some who had severe OSA, some with sleep apnea who were treated with CPAP, and controls. The risk of nonfatal and fatal cardiovascular disease events was nearly three times higher in those with severe disease than in healthy participants. Those treated with CPAP had a risk approximately the same as in the control group.
The Sleep Heart Study followed approximately 6,000 people with untreated sleep apnea for a median of nearly 9 years. It found a significant association between the apnea-hypopnea index and ischemic stroke, especially in men.21 Survival in patients with heart failure is also associated with the degree of OSA; patients with more severe disease (an apnea-hypopnea index ≥ 15) have a nearly three times greater risk of death than those with no disease or only mild disease (apnea-hypopnea index < 15).22
From the standpoint of health care utilization, findings that central sleep apnea predicts an increased risk of hospital readmission in heart failure are of particular interest.23
People with OSA are at increased risk of nocturnal sudden cardiac death.24 Sleep apnea is also associated with an increased overall death rate, and the higher the apnea-hypopnea index, the higher the death rate,25 even after adjusting for age, sex, body mass index, and underlying cardiovascular risk, with findings most pronounced in men under age 70.
Motor vehicle accidents
The need for caution during driving should be discussed with every patient, as motor vehicle accidents are an immediate danger to the patient and others. The association with motor vehicle accidents is independent of sleepiness, and drivers with sleep apnea often do not perceive performance impairment. Young et al26 found that men who snored were 3.4 times as likely to have an accident over a 5-year period, and that men and women with an apnea-hypopnea index greater than 15 were more than 7 times as likely to have multiple accidents over a 5-year period, highlighting the importance of discussing, documenting, and expeditiously diagnosing and treating OSA, particularly in those who report drowsiness while driving.
CLINICAL RISK FACTORS
Risk factors can be divided into nonmodifiable and modifiable ones.
Nonmodifiable factors
Age. Bimodal distributions in OSA prevalence have been observed; ie, that the pediatric population and people who are middle-aged have the highest prevalence of OSA. A linear relationship between sleep apnea prevalence and age until about age 65 was identified in data from the Sleep Heart Health Study.27 After that, the prevalence rates plateau; it is unclear if this is secondary to natural remission of the disease after a certain age or because patients with more severe disease have died by that age (ie, survivorship bias), blunting an increase in prevalence.
Sex. Men develop sleep apnea at a rate three to five times that of women. Several explanations have been proposed to account for this.28,29 Sex hormones are one factor; women with sleep apnea on hormone replacement therapy have a significantly less-severe sleep apnea burden than other postmenopausal women,30 suggesting a positive effect from estrogen. Sex-based differences in fat distribution, length and collapsibility of the upper airway, genioglossal activity, neurochemical control mechanisms, and arousal response may also contribute to prevalence differences between men and women.
As with coronary artery disease, the presentation of sleep apnea may be atypical in women, particularly around menopause. Sleep apnea should be considered in women who have snoring and daytime sleepiness.
Race. Whites, African Americans, and Asians have a similar prevalence of sleep apnea, but groups differ in obesity rates and craniofacial anatomy.31–34 Asians tend to have craniofacial skeletal restriction. African Americans are more likely to have upper-airway soft-tissue risk and to develop more severe OSA. Whites tend to have both craniofacial and soft-tissue risk. For those with craniofacial anatomy predisposing to OSA, even mild obesity can make it manifest.
Syndromes that predispose to OSA can include craniofacial structural abnormalities, connective tissue problems, or alterations in ventilatory control (eg, Marfan, Down, and Pierre Robin syndromes).
Modifiable risk factors
Obesity (body mass index ≥ 30 kg/m2) is a firmly established risk factor, but not all obese patients develop obstructive sleep apnea, and not all people with sleep apnea are obese.
Obesity increases risk by altering the geometry and function of the upper airway, increasing collapsibility. The changes are particularly pronounced in the lateral aspects of the pharynx.35
Obesity also affects respiratory drive, likely in part from leptin resistance. Load compensation is another contributing factor: the increased mass in the thorax and abdomen increases the work of breathing and reduces functional residual capacity, increasing oxygen demands and leading to atelectasis and ventilation-perfusion mismatch.
Although obesity is an important risk factor, it is important to recognize that obesity is not the only one to consider: most people with an apnea-hypopnea index of 5 or greater are not obese. The relationship between body mass index and sleep apnea is weaker in children and in the elderly, probably because other risk factors are more pronounced.36
Craniofacial structural abnormalities such as retrognathia (abnormal posterior position of the mandible) and micrognathia (undersized mandible) can increase the risk of OSA because of a resulting posteriorly displaced genioglossus muscle. Other conditions can alter chemosensitivity, affecting the pH and carbon dioxide level of the blood and therefore affecting ventilatory control mechanisms, making the person more prone to developing sleep apnea. Children and young adults may have tonsillar tissue that obstructs the airway.
The site of obstruction can be behind the palate (retropalatal), behind the tongue (retroglossal), or below the pharynx (hypopharyngeal). This helps explain why positive air way pressure—unlike surgery, which addresses a specific area—is often successful, as it serves to splint or treat all aspects of the airway.
FATIGUE, SLEEPINESS, SNORING, RESTLESS SLEEP
Sleep apnea can result in presentation of multiple signs and symptoms (Table 1).
Daytime sleepiness and fatigue are the most common symptoms. Although nonspecific, they are often quite pronounced. Two short questionnaires—the Epworth Sleepiness Scale37 and the Fatigue Severity Scale—can help distinguish between these two symptoms and assess their impact on a patient’s daily life. In the Epworth Sleepiness Scale, the patient rates his or her chance of dozing on a 4-point scale (0 = would never doze, to 3 = high chance of dozing) in eight situations:
- Sitting and reading
- Watching television
- Sitting inactive in a public place
- As a passenger in a car for an hour without a break
- Lying down to rest in the afternoon
- Sitting and talking to someone
- Sitting quietly after a lunch without alcohol
- In a car while stopped for a few minutes in traffic.
A score of 10 or more is consistent with significant subjective sleepiness.
The Fatigue Severity Scale assesses the impact of fatigue on daily living.
Snoring is a common and specific symptom of sleep apnea; however, not all patients who snore have OSA.
Restlessness during sleep is very common—patients may disturb their bed partner by moving around a lot during sleep or report that the sheets are “all over the place” by morning.
Nocturia can also be a sign of sleep apnea and can contribute to sleep fragmentation. A proposed mechanism of this symptom includes alterations of intrathoracic pressure resulting in atrial stretch, which release atrial natriuretic peptide, leading to nocturia. Treating with CPAP has been found to reduce levels of atrial natriuretic peptide, contributing to better sleep.38
Morning headache may occur and is likely related to increased CO2 levels, which appear to culminate in the morning hours. End-tidal or transcutaneous CO2 monitoring during polysomnography can help elucidate the presence of sleep-related hypoventilation.
Libido is often diminished and can actually be improved with CPAP. This is therefore an important point to discuss with patients, as improved libido can often serve as an incentive for adherence to OSA treatment.
Insomnia exists in about 15% of patients, primarily as a result of sleep apnea-related with treatment.
Sweating, particularly forehead sweating associated with sleep apnea, more commonly occurs in children.
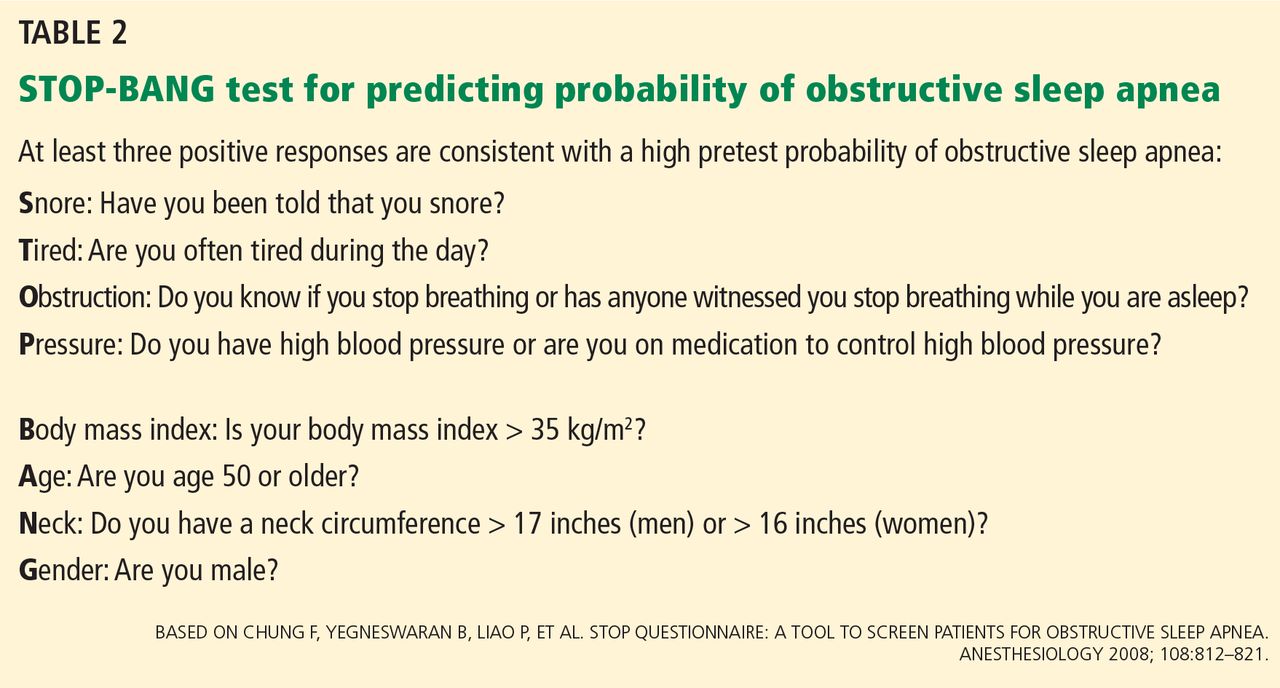
The STOP-BANG questionnaire (Table 2)39 was primarily validated in preoperative anesthesia testing. However, because of its ease of use and favorable performance characteristics, it is increasingly used to predict the likelihood of finding OSA before polysomnography. A score of 3 or more has a sensitivity of 93%.
PHYSICAL EXAMINATION PROVIDES CLUES
Although the physical examination may be normal, certain findings indicate risk (Table 3). Obesity alone is not an accepted indication for polysomnography unless there are concomitant worrisome signs or symptoms. Of note, those who are morbidly obese (BMI > 40 kg/m2) have a prevalence of sleep apnea greater than 70%.
The classification by Friedman et al40 provides an indicator of risk. The patient is examined with the mouth opened wide and the tongue in a neutral natural position. Grades:
- I—Entire uvula and tonsils are visible
- II—Entire uvula is visible, but tonsils are not
- III—Soft palate is visible, but uvula is not
- IV—Only the hard palate is visible.
Especially in children and young adults, enlarged tonsils (or “kissing tonsils”) and a boggy edematous uvula set the stage for obstructive sleep apnea.
DIAGNOSIS REQUIRES SLEEP TESTING
A sleep study is the primary means of diagnosing OSA. Polysomnography includes electrooculography to determine when rapid-eye-movement sleep occurs; electromyography to measure muscle activity in the chin to help determine onset of sleep, with peripheral leads in the leg to measure leg movements; electroencephalography (EEG) to measure neural activity; electrocardiography; pulse oximetry to measure oxygen saturation; measurement of oronasal flow; and measurements of chest wall effort and body position using thoracic and abdominal belts that expand and contract with breathing; and audio recording to detect snoring.
Attended polysomnography requires the constant presence of a trained sleep technologist to monitor for technical issues and patient adherence.
End-tidal CO2 monitoring is a reasonable method to detect sleep-related hypoventilation but is not routinely performed in the United States. Transcutaneous CO2 monitoring is a different way to monitor CO2 used in the setting of positive airway pressure.
Polysomnography in a normal patient shows a regular pattern of increasing and decreasing airflow with inspiration and expiration while stable oxygen saturation is maintained.
In contrast, polysomnography of a patient with sleep apnea shows repetitive periods of no airflow, oxygen desaturation, and often evidence of thoracoabdominal paradox, punctuated by arousals on EEG associated with sympathetic activation (Figure 1). When the patient falls asleep, upper-airway muscle tone is reduced, causing an apneic event with hypoxia and pleural pressure swings. These prompt arousals with sympathetic activation that reestablish upper-airway muscle tone, allowing ventilation and reoxygenation to resume with a return to sleep.
Apnea-hypopnea index indicates severity
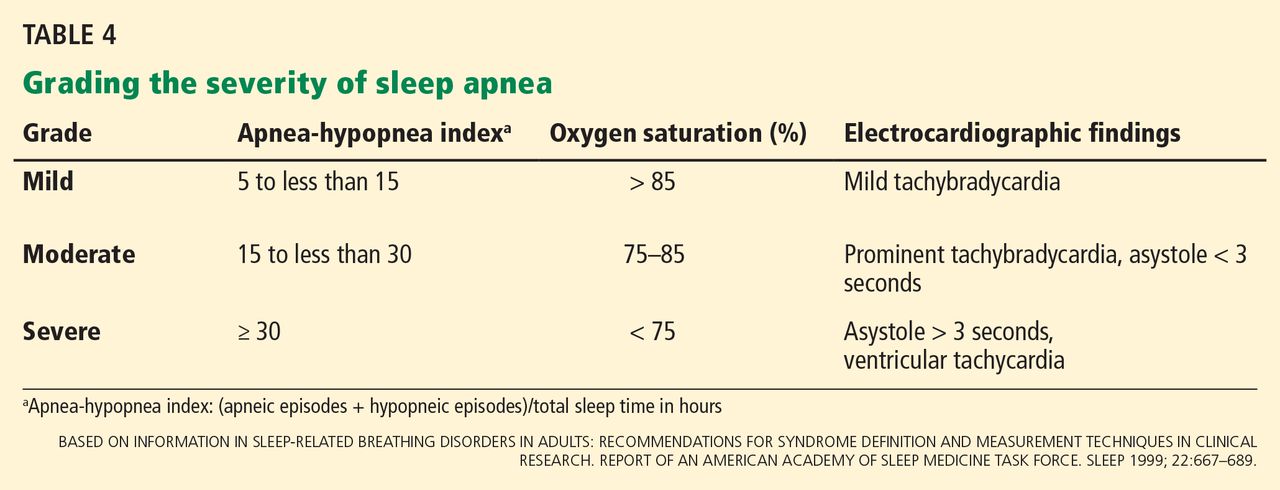
Sleep apnea severity is graded using the apnea-hypopnea index, ie, the number of apneic and hypopneic events per hour of sleep (Table 4).41 Events must last at least 10 seconds to be considered, ie, two consecutive missed breaths based on an average normal respiratory rate of about 12 breaths per minute for the typical adult.
The apnea-hypopnea index usually correlates with the severity of oxygen desaturation and with electrocardiographic abnormalities, including tachybradycardia and arrhythmias.
Although history, physical examination, and prediction tools are helpful in determining the likelihood that a patient has OSA, only polysomnography testing can establish the diagnosis. To diagnose OSA, 15 or more obstructive events per hour must be observed by polysomnography, or at least 5 events per hour with one of the following:
- Daytime sleepiness, sleep attacks, unrefreshing sleep, fatigue, or insomnia
- Waking with breath-holding, gasping, or choking
- Observer-reported loud snoring or breathing interruptions.41
Split-night study determines diagnosis and optimum treatment
The split-night study has two parts: the first is diagnostic polysomnography, followed by identification of the positive airway pressure that optimally treats the sleep apnea. The apnea-hypopnea index guides the need for the split-night study, with 40 being the established threshold according to the American Academy of Sleep Medicine.
A home sleep study is appropriate for some patients
Home sleep testing is typically more limited than standard polysomnography; it monitors airflow, effort, and oxygenation. The test is intended for adults with a high pretest probability of moderate to severe obstructive sleep apnea (STOP-BANG score ≥ 3). It is not intended for screening of asymptomatic patients or for those with coexisting sleep disorders (eg, central sleep apnea, sleep hypoventilation, periodic limb movements, insomnia, circadian rhythm disorders, parasomnias, narcolepsy) or medical disorders (eg, moderate to severe heart failure or other cardiac disease, symptomatic neurologic disease, moderate to severe pulmonary disease).42 Since March 2008, the Centers for Medicare and Medicaid Services has covered CPAP for obstructive sleep apnea based on diagnosis by home sleep study testing.43
TREATMENT OF SLEEP APNEA
Basic steps for reducing OSA are:
Weight loss. Even small weight changes can significantly affect the severity of sleep apnea, perhaps even leading to a reassessment of the degree of OSA and CPAP requirements. Longitudinal epidemiologic data demonstrate that a 10% weight loss correlates with a 26% reduction in the apnea-hypopnea index, and conversely, a 10% weight gain is associated with a 32% increase.44
Some studies have found that bariatric surgery cures OSA in 75% to 88% of cases, independent of approach.45,46 However, a trial in 60 obese patients with OSA who were randomized to either a low-calorie diet or bariatric surgery found no statistical difference in the apnea-hypopnea index between the two groups despite greater weight loss in the surgery group.47
Avoiding certain medications. Benzodiazepines, narcotics, and alcohol reduce upper airway muscle tone and should be avoided. No medications are associated with improvement of OSA, although acetazolamide may be used to treat central sleep apnea.
Positional therapy. Sleeping on the back exacerbates the problem. Supine-related OSA occurs as a result of several factors, including gravity, airway anatomy, airway critical closing pressures, and effects on upper-airway dilator muscle function.
Sleep hygiene. General recommendations to engage in behaviors to promote sleep are recommended, including keeping consistent sleep-wake times, not watching television in bed, and avoidance of caffeine intake, particularly within 4 to 6 hours of bedtime.
POSITIVE AIRWAY PRESSURE THERAPY
Nasal CPAP is the treatment of choice and is successful in 95% of patients when used consistently. It is not as costly as surgery, and results in improved long-term survival compared with uvulopalatopharyngoplasty. Another advantage is that the pressure can be retitrated as the patient’s condition changes, for example after a weight change or during pregnancy.
More than 15 randomized controlled trials have examined the effect of sleep apnea treatment with CPAP compared with either sham CPAP or another control. In a meta-analysis, CPAP was found to lead to an average systolic blood pressure reduction of about 2.5 mm Hg and a diastolic blood pressure reduction of 1.8 mm Hg. Although these reductions may seem negligible, benefits may be significant for cardiovascular outcomes.48,49
Challenges to treatment adherence
Adherence is the most commonly discussed problem with CPAP, but long-term adherence rates are comparable to medication compliance—about 60% to 70%. To optimize adherence, communication is important to ensure that problems are identified and addressed as they arise. Showing patients examples of apneic events and oxygen desaturation from their sleep study can enhance their understanding of OSA and its importance. Patients need to understand the serious nature of the disease and that CPAP therapy can significantly improve their quality of life and overall health, particularly from a cardiovascular perspective.
CPAP masks can be uncomfortable, posing a major barrier to compliance. But a number of mask designs are available, such as the nasal mask, the nasal pillow mask, and the oronasal mask. For patients with claustrophobia, the nasal pillow mask is an option, as it does not cover the face.
Some patients note symptoms of nasal congestion, although in many patients CPAP improves it. If congestion is a problem, the use of heated humidification with the machine, intranasal saline or gel, or nasal corticosteroids can help relieve it.
Pressure intolerance is a common problem. For those who feel that the pressure is too high, settings can be adjusted so that the pressure is gradually reduced between inspiration and expiration, ie, the use of expiratory pressure relief or consideration of the use of bilevel positive airway pressure.
Aerophagia (swallowing air) is a less common problem. It can also potentially be relieved with use of bilevel positive airway pressure.
Many patients develop skin irritation, which can be helped with moleskin, available at any pharmacy.
Social stigma can be a problem. Education regarding the importance of the treatment to health is essential.
Machine noise is less of a problem with the new machine models, but if it is a problem, a white-noise device or earplugs may help.
Other measures to improve compliance are keeping the regimen simple and ensuring that family support is adequate.
Medicare requires evidence of use and benefit
Medicare requires that clinical benefit be documented between the 31st and 91st day after initiating CPAP therapy. This requires face-to-face clinical reevaluation by the treating physician to document improved symptoms and objective evidence of adherence to use of the device. The devices can store usage patterns, and Medicare requires at least 4 hours per night on 70% of nights during a consecutive 30-day period in the first 3 months of use.
ALTERNATIVE THERAPIES
Alternative therapies may be options for some patients, in particular those who cannot use CPAP or who get no benefit from it. These include oral appliances for those with mild to moderate OSA50–53 and various surgical procedures, eg, uvulopalatopharyngoplasty,54,55 maxillomanibular advancement,56 tracheostomy (standard treatment before CPAP was identified as an effective treatment),57,58 and adenotonsillectomy (in children).59
Supplemental oxygen is not a first-line treatment for OSA and in general has not been found to be very effective, particularly in terms of intermediate cardiovascular outcomes,60–62 although a subset of patients with high loop gain may benefit from it.63 Loop gain is a measure of the tendency of the ventilatory control system to amplify respiration in response to a change, conferring less stable control of breathing.
Several novel alternative therapies are starting to be used. Although all of them have been shown to improve measures of OSA, none is as effective as CPAP in improving OSA severity. New therapies include the nasal expiratory positive airway pressure device,64 oral pressure therapy,65 and hypoglossal nerve stimulation.66
- Young T, Palta M, Dempsey J, Skatrud J, Weber S, Badr S. The occurrence of sleep-disordered breathing among middle-aged adults. N Engl J Med 1993; 328:1230–1235.
- Peppard PE, Young T, Barnet JH, Palta M, Hagen EW, Hla KM. Increased prevalence of sleep-disordered breathing in adults. Am J Epidemiol 2013; 177:1006–1014.
- Kapur VK, Redline S, Nieto FJ, Young TB, Newman AB, Henderson JA; Sleep Heart Health Research Group. The relationship between chronically disrupted sleep and healthcare use. Sleep 2002; 25:289–296.
- Kapur V, Blough DK, Sandblom RE, et al. The medical cost of undiagnosed sleep apnea. Sleep 1999; 22:749–755.
- Mooe T, Rabben T, Wiklund U, Franklin KA, Eriksson P. Sleep-disordered breathing in men with coronary artery disease. Chest 1996; 109:659–663.
- Schafer H, Koehler U, Ewig S, Hasper E, Tasci S, Luderitz B. Obstructive sleep apnea as a risk marker in coronary artery disease. Cardiology 1999; 92:79–84.
- Leung RS, Bradley TD. Sleep apnea and cardiovascular disease. Am J Respir Crit Care Med 2001; 164:2147–2165.
- American Academy of Sleep Medicine. International Classification of Sleep Disorders, Second Edition: Diagnostic and coding manual. Westchester, IL; American Academy of Sleep Medicine, 2005.
- Somers VK, Dyken ME, Clary MP, Abboud FM. Sympathetic neural mechanisms in obstructive sleep apnea. J Clin Invest 1995; 96:1897–1904.
- Mehra R. Sleep-disordered breathing and cardiovascular disease: exploring pathophysiology and existing data. Curr Resp Med Rev 2007; 3:258–269.
- Mehra R, Storfer-Isser A, Kirchner HL, et al. Soluble interleukin 6 receptor: a novel marker of moderate to severe sleep-related breathing disorder. Arch Intern Med 2006; 166:1725–1731.
- Mehra R, Xu F, Babineau DC, et al. Sleep-disordered breathing and prothrombotic biomarkers: cross-sectional results of the Cleveland Family Study. Am J Respir Crit Care Med 2010; 182:826–833.
- Mehra R, Storfer-Isser A, Tracy R, Jenny N, Redline S. Association of sleep disordered breathing and oxidized LDL [abstract]. Am J Respir Crit Care Med 2010; 181:A2474.
- Mehra R, Benjamin EJ, Shahar E, et al; Sleep Heart Health Study. Association of nocturnal arrhythmias with sleep-disordered breathing: the Sleep Heart Health Study. Am J Respir Crit Care Med 2006; 173:910–916.
- Mehra R, Xu F, Babineau DC, et al. Sleep-disordered breathing and prothrombotic biomarkers: cross-sectional results of the Cleveland Family Study. Am J Respir Crit Care Med 2010; 182:826–833.
- Monahan K, Storfer-Isser A, Mehra R, et al. Triggering of nocturnal arrhythmias by sleep-disordered breathing events. J Am Coll Cardiol 2009; 54:1797–1804.
- Kanagala R, Murali NS, Friedman PA, et al. Obstructive sleep apnea and the recurrence of atrial fibrillation. Circulation 2003; 107:2589–2594.
- Patel D, Mohanty P, Di Biase L, et al. Safety and efficacy of pulmonary vein antral isolation in patients with obstructive sleep apnea: the impact of continuous positive airway pressure. Circ Arrhythm Electrophysiol 2010; 3:445–451.
- Walia H, Strohl KP, Mehra R. Effect of continuous positive airway pressure on an atrial arrhythmia in a patient with mild obstructive sleep apnea. J Clin Sleep Med 2011; 7:397–398.
- Marin JM, Carrizo SJ, Vicente E, Agusti AG. Long-term cardiovascular outcomes in men with obstructive sleep apnoea-hypopnoea with or without treatment with continuous positive airway pressure: an observational study. Lancet 2005; 365:1046–1053.
- Redline S, Yenokyan G, Gottlieb DJ, et al. Obstructive sleep apnea-hypopnea and incident stroke: the sleep heart health study. Am J Respir Crit Care Med 2010; 182:269–277.
- Wang H, Parker JD, Newton GE, et al. Influence of obstructive sleep apnea on mortality in patients with heart failure. J Am Coll Cardiol 2007; 49:1625–1631.
- Khayat R, Abraham W, Patt B, et al. Central sleep apnea is a predictor of cardiac readmission in hospitalized patients with systolic heart failure. J Card Fail 2012; 18:534–540.
- Gami AS, Howard DE, Olson EJ, Somers VK. Day-night pattern of sudden death in obstructive sleep apnea. N Engl J Med 2005; 352:1206–1214.
- Punjabi NM, Caffo BS, Goodwin JL, et al. Sleep-disordered breathing and mortality: a prospective cohort study. PLoS Med 2009; 6( 8):e1000132. doi: 10.1371/journal.pmed.1000132.
- Young T, Blustein J, Finn L, Palta M. Sleep-disordered breathing and motor vehicle accidents in a population-based sample of employed adults. Sleep 1997; 20:608–613.
- Young T, Peppard PE, Gottlieb DJ. Epidemiology of obstructive sleep apnea: a population health perspective. Am J Respir Crit Care Med 2002; 165:1217–1239.
- Lin CM, Davidson TM, Ancoli-Israel S. Gender differences in obstructive sleep apnea and treatment implications. Sleep Med Rev 2008; 12:481–496.
- Shaher E, Redline S, Young T, et al. Hormone replacement therapy and sleep-disordered breathing. Am J Respir Crit Care Med 2003; 167:1186–1192.
- Young T, Finn L, Austin D, Peterson A. Menopausal status and sleep-disordered breathing in the Wisconsin Sleep Cohort Study. Am J Respir Crit Care Med 2003; 167:1181–1185.
- Ancoli-Israel S, Klauber MR, Stepnowsky C, Estline E, Chinn A, Fell R. Sleep-disordered breathing in African-American elderly. Am J Respir Crit Care Med 1995; 152:1946–1949.
- Young T, Shahar E, Nieto FJ, et al; Sleep Heart Health Study Research Group. Predictors of sleep-disordered breathing in community-dwelling adults: the Sleep Heart Health Study. Arch Intern Med 2002; 162:893–900.
- Redline S, Tishler PV, Hans MG, Tosteson TD, Strohl KP, Spry K. Racial differences in sleep-disordered breathing in African-Americans and Caucasians. Am J Respir Crit Care Med 1997; 155:186–192. Erratum in: Am J Respir Crit Care Med 1997; 155:1820.
- Sutherland K, Lee RWW, Cistulli PA. Obesity and craniofacial structure as risk factors for obstructive sleep apnoea: impact of ethnicity. Respirology 2012; 17:213–222.
- Schwab RJ, Gupta KB, Gefter WB, Metzger LJ, Hoffman EA, Pack AI. Upper airway and soft tissue anatomy in normal subjects and patients with sleep-disordered breathing. Significance of the lateral pharyngeal walls. Am J Respir Crit Care Med 1995; 152:1673–1689.
- Nieto FJ, Young TB, Lind BK, et al. Association of sleep-disordered breathing, sleep apnea, and hypertension in a large community-based study. Sleep Heart Health Study. JAMA 2000; 283:1829–1836.
- Johns MW. A new method for measuring daytime sleepiness: the Epworth sleepiness scale. Sleep 1991; 14:540–545.
- Krieger J, Imbs J-L, Schmidt M, Kurtz D. Renal function in patients with obstructive sleep apnea. Effects of nasal continuous positive airway pressure. Arch Intern Med 1988; 148:1337–1340.
- Chung F, Yegneswaran B, Liao P, et al. STOP questionnaire: a tool to screen patients for obstructive sleep apnea. Anesthesiology 2008; 108:812–821.
- Friedman M, Ibrahim H, Bass L. Clinical staging for sleep-disordered breathing. Otolaryngal Head Neck Surg 2002; 127:13–21.
- Sleep-related breathing disorders in adults: recommendations for syndrome definition and measurement techniques in clinical research. Report of an American Academy of Sleep Medicine Task Force. Sleep 1999; 22:667–689.
- Collop NA, Anderson WM, Boehlecke B, et al; Portable Monitoring Task Force of the American Academy of Sleep Medicine. Clinical guidelines for the use of unattended portable monitors in the diagnosis of obstructive sleep apnea in adult patients. Portable Monitoring Task Force of the American Academy of Sleep Medicine. J Clin Sleep Med 2007; 3:737–747.
- Centers for Medicare & Medicaid Services (CMS). Continuous positive airway pressure (CPAP) therapy for obstructive sleep apnea (OSA). MLN Matters 2008. www.cms.gov/Outreach-and-Education/Medicare-Learning-Network-MLN/MLNMattersArticles/downloads/MM6048.pdf. Accessed June 2, 2014.
- Peppard PE, Young T, Palta M, Dempsey J, Skatrud J. Longitudinal study of moderate weight change and sleep-disordered breathing. JAMA 2000; 284:3015–3021.
- Guardiano SA, Scott JA, Ware JC, Schechner SA. The long-term results of gastric bypass on indexes of sleep apnea. Chest 2003; 124:1615–1619.
- Crooks PF. Surgical treatment of morbid obesity. Annu Rev Med 2006; 57:243–264.
- Dixon JB, Schachter LM, O’Brien PE, et al. Surgical vs conventional therapy for weight loss treatment of obstructive sleep apnea: a randomized controlled trial. JAMA 2012; 308:1142–1149.
- Bazzano LA, Khan Z, Reynolds K, He J. Effect of nocturnal nasal continuous positive airway pressure on blood pressure in obstructive sleep apnea. Hypertension 2007; 50:417–423.
- Logan AG, Perlikowski SM, Mente A, et al. High prevalence of unrecognized sleep apnoea in drug-resistant hypertension. J Hypertens 2001; 19:2271–2277.
- Kushida CA, Morgenthaler TI, Littner MR, et al; American Academy of Sleep. Practice parameters for the treatment of snoring and obstructive sleep apnea with oral appliances: an update for 2005. Sleep 2006; 29:240–243.
- Otsuka R, Ribeiro de Almeida F, Lowe AA, Linden W, Ryan F. The effect of oral appliance therapy on blood pressure in patients with obstructive sleep apnea. Sleep Breath 2006; 10:29–36.
- Yoshida K. Effect on blood pressure of oral appliance therapy for sleep apnea syndrome. Int J Prosthodont 2006; 19:61–66.
- Inazawa T, Ayuse T, Kurata S, et al. Effect of mandibular position on upper airway collapsibility and resistance. J Dent Res 2005; 84:554–558.
- Fujita S, Conway W, Zorick F, Roth T. Surgical correction of anatomic abnormalities in obstructive sleep apnea syndrome: uvulopalatopharyngoplasty. Otolaryngol Head Neck Surg 1981; 89:923–934.
- Schwab RJ. Imaging for the snoring and sleep apnea patient. Dent Clin North Am 2001; 45:759–796.
- Prinsell JR. Maxillomandibular advancement surgery for obstructive sleep apnea syndrome. J Am Dent Assoc 2002; 133:1489–1497.
- Thatcher GW, Maisel RH. The long-term evaluation of tracheostomy in the management of severe obstructive sleep apnea. Laryngoscope 2003; 113:201–204.
- Conway WA, Victor LD, Magilligan DJ, Fujita S, Zorick FJ, Roth T. Adverse effects of tracheostomy for sleep apnea. JAMA 1981; 246:347–350.
- Marcus CL, Moore RH, Rosen CL, et al; Childhood Adenotonsillectomy Trial (CHAT). A randomized trial of adenotonsillectomy for childhood sleep apnea. N Engl J Med 2013; 368:2366–2376.
- Gottlieb DJ, Craig SE, Lorenzi-Filho G, et al. Sleep apnea cardiovascular clinical trials-current status and steps forward: The International Collaboration of Sleep Apnea Cardiovascular Trialists. Sleep 2013; 36:975–980.
- Loredo JS, Ancoli-Israel S, Kim EJ, Lim WJ, Dimsdale JE. Effect of continuous positive airway pressure versus supplemental oxygen on sleep quality in obstructive sleep apnea: a placebo-CPAP-controlled study. Sleep 2006; 29:564–571.
- Phillips BA, McConnell JW, Smith MD. The effects of hypoxemia on cardiac output. A dose-response curve. Chest 1988; 93:471–475.
- Wellman A, Malhotra A, Jordan AS, Stevenson KE, Gautam S, White DP. Effect of oxygen in obstructive sleep apnea: role of loop gain. Respire Physiol Neurobiol 2008; 162:144–151.
- Berry RB, Kryger MH, Massie CA. A novel nasal expiratory positive airway pressure (EPAP) device for the treatment of obstructive sleep apnea: a randomized controlled trial. Sleep 2011; 34:479–485.
- Colrain IM, Black J, Siegel LC, et al. A multicenter evaluation of oral pressure therapy for the treatment of obstructive sleep apnea. Sleep Med 2013; 14:830–837.
- Strollo PJ Jr, Soose RJ, Maurer JT, et al; STAR Trial Group. Upper-airway stimulation for obstructive sleep apnea. N Engl J Med 2014; 370:139–149.
Obstructive sleep apnea (OSA) is common and poorly recognized and, if untreated, leads to serious health consequences. This article discusses the epidemiology of OSA, describes common presenting signs and symptoms, and reviews diagnostic testing and treatment options. Adverse health effects related to untreated sleep apnea are also discussed.
COMMON, POORLY RECOGNIZED, AND COSTLY IF UNTREATED
OSA is very common in the general population and is associated with substantial morbidity and mortality. An estimated 17% of the general adult population has OSA, and the numbers are increasing with the obesity epidemic. Nearly 1 in 15 adults has at least moderate sleep apnea,1,2 and approximately 85% of cases are estimated to be undiagnosed.3 A 1999 study estimated that untreated OSA resulted in approximately $3.4 billion in additional medical costs per year in the United States,4 a figure that is likely to be higher now, given the rising prevalence of OSA. The prevalence of OSA in primary care and subspecialty clinics is even higher than in the community, as more than half of patients who have diabetes or hypertension and 30% to 40% of patients with coronary artery disease are estimated to have OSA.5–7
REPETITIVE UPPER-AIRWAY COLLAPSE
During sleep, parasympathetic activity is enhanced and the muscle tone of the upper airway is decreased, particularly in the pharyngeal dilator muscles. Still, even in the supine position, a healthy person maintains patency of the airway and adequate airflow during sleep.
OSA is characterized by repetitive complete or partial collapse of the upper airway during sleep, resulting in an apneic or hypopneic event, respectively, and often causing snoring from upper-airway tissue vibration.
People who are susceptible to OSA typically have a smaller, more collapsible airway that is often less distensible and has a higher critical closing pressure. Radiographic and physiologic data have shown that the airway dimensions of patients with OSA are smaller than in those without OSA. The shape of the airway of a patient with OSA is often elliptical, given the extrinsic compression of the lateral aspects of the airway by increased size of the parapharyngeal fat pads. OSA episodes are characterized by closure of the upper airway and by progressively increasing respiratory efforts driven by chemoreceptor and mechanoreceptor stimuli, culminating in an arousal from sleep and a reopening of the airway.
The disease-defining metric used for assessing OSA severity is the apnea-hypopnea index, ie, the number of apneas and hypopneas that occur per hour of sleep.8 An apneic or hypopneic event is identified during polysomnography by the complete cessation of airflow or by a reduction in airflow for 10 seconds or longer (Figure 1).
HEALTH CONSEQUENCES IF UNTREATED
Untreated sleep apnea causes numerous pathophysiologic perturbations, including chronic intermittent hypoxia, ventilatory overshoot hyperoxia, increased sympathetic nervous system activity, intrathoracic pressure swings, hypercapnea, sleep fragmentation, increased arousals, reduced sleep duration, and fragmentation of rapid-eye-movement sleep.
Intermittent hypoxia activates the sympathetic nervous system and causes pulmonary vasoconstriction, with increases in pulmonary arterial pressures and myocardial workload. Sympathetic activation, ascertained by peroneal microneurography, has been shown to be increased not only during sleep but also persisting during wakefulness in patients with untreated OSA vs those without OSA.9 Autonomic nervous system fluctuations accompany apneic episodes, resulting in enhanced parasympathetic tone and sympathetic activation associated with a rise in blood pressure and heart rate that occur after the respiratory event.
Intermediate pathways that link the negative pathophysiologic effects of OSA with adverse health outcomes include increased systemic inflammation, increased oxidative stress, metabolic dysfunction, insulin resistance, hypercoagulability, endothelial dysfunction, and autonomic dysfunction.
As a result, a variety of adverse clinical outcomes are associated with untreated OSA, including systemic hypertension, ischemic heart disease and atherosclerosis, diastolic dysfunction, congestive heart failure, cardiac arrhythmias, stroke, increased risk of death, and sudden death, as well as noncardiovascular outcomes such as gout, neurocognitive deficits, and mood disorders.10
Inflammatory and atherogenic effects
Increased levels of markers of systemic inflammation, prothrombosis, and oxidative stress have been observed in OSA and may be key pathophysiologic links between OSA and cardiovascular sequelae. OSA has been associated with up-regulation of a number of inflammatory mediators: interleukin (IL) 6, soluble IL-6 receptor, IL-8, tumor necrosis factor alpha, and C-reactive protein. Soluble IL-6 levels in particular are higher in people who have sleep-disordered breathing, as reflected by the apnea-hypopnea index independent of obesity, with relationships stronger in the morning than in the evening. This likely reflects the overnight OSA-related physiologic stress.11
Thrombotic potential is also enhanced, with higher levels of plasminogen activator inhibitor 1, fibrinogen, P-selectin, and vascular endothelial growth factor. Some of these factors normally have a diurnal cycle, with higher levels in the morning, but in OSA, increasing OSA severity is associated with increased prothrombotic potential in the morning hours. Of interest, levels of these substances showed a plateau effect, rising in people who had only mildly elevated apnea-hypopnea indices and then leveling off.12 Intermittent hypoxia followed by ventilatory overshoot hyperoxia, characteristic of sleep apnea, provides the ideal environment for augmentation of oxidative stress, with evidence of increased oxidation of serum proteins and lipids. Hypoxia and oxygen-derived free radicals may result in cardiac myocyte injury. Experimental data demonstrate that intermittent hypoxia combined with a high-fat diet results in synergistic acceleration of evidence of atherogenic lesions.
Patients with OSA also have evidence of endothelial dysfunction, insulin resistance, and dyslipidemia, all pathways that can facilitate the progression of atherosclerosis in OSA.13–15
Cardiac arrhythmias
In the Sleep Heart Health Study, a multicenter epidemiologic study designed to examine the relationships of OSA and cardiovascular outcomes, those who had moderate to severe OSA had a risk of ventricular and atrial arrhythmias two to four times higher than those without OSA, even after correction for the confounding influences of obesity and underlying cardiovascular risk.14 These findings were corroborated in subsequent work highlighting monotonic dose-response relationships with increasing OSA severity and increased odds of atrial and ventricular arrhythmia in a cohort of about 3,000 older men.11 Additional compelling evidence of a causal relationship is that the risk of discrete arrhythmic events is markedly increased after a respiratory disturbance in sleep.16
In patients who successfully underwent cardioversion for atrial fibrillation, those who had sleep apnea but were not treated with continuous positive airway pressure (CPAP) had a much higher rate of recurrence of atrial fibrillation during the subsequent year than those with CPAP-treated sleep apnea and than controls never diagnosed with sleep apnea. In the untreated patients with sleep apnea, the mean nocturnal fall in oxygen saturation was significantly greater in those who had recurrence of atrial fibrillation than in those who did not, suggesting hypoxia as an important mechanism contributing to atrial fibrillation.17
Since then, several other retrospective studies have shown similar findings after pulmonary vein antrum isolation and ablation in terms of reduction of atrial fibrillation recurrence with CPAP treatment in OSA.18
Walia et al19 described a patient with moderate sleep apnea who underwent a split-night study. During the baseline part of the study, the patient had about 18 ectopic beats per minute. During the second portion of the study while CPAP was applied, progressively fewer ectopic beats occurred as airway pressure was increased until a normal rhythm without ectopic beats was achieved at the goal treatment CPAP pressure setting.
Cardiovascular disease, stroke, and death
Marin et al20 followed about 1,500 men for 10 years, including some who had severe OSA, some with sleep apnea who were treated with CPAP, and controls. The risk of nonfatal and fatal cardiovascular disease events was nearly three times higher in those with severe disease than in healthy participants. Those treated with CPAP had a risk approximately the same as in the control group.
The Sleep Heart Study followed approximately 6,000 people with untreated sleep apnea for a median of nearly 9 years. It found a significant association between the apnea-hypopnea index and ischemic stroke, especially in men.21 Survival in patients with heart failure is also associated with the degree of OSA; patients with more severe disease (an apnea-hypopnea index ≥ 15) have a nearly three times greater risk of death than those with no disease or only mild disease (apnea-hypopnea index < 15).22
From the standpoint of health care utilization, findings that central sleep apnea predicts an increased risk of hospital readmission in heart failure are of particular interest.23
People with OSA are at increased risk of nocturnal sudden cardiac death.24 Sleep apnea is also associated with an increased overall death rate, and the higher the apnea-hypopnea index, the higher the death rate,25 even after adjusting for age, sex, body mass index, and underlying cardiovascular risk, with findings most pronounced in men under age 70.
Motor vehicle accidents
The need for caution during driving should be discussed with every patient, as motor vehicle accidents are an immediate danger to the patient and others. The association with motor vehicle accidents is independent of sleepiness, and drivers with sleep apnea often do not perceive performance impairment. Young et al26 found that men who snored were 3.4 times as likely to have an accident over a 5-year period, and that men and women with an apnea-hypopnea index greater than 15 were more than 7 times as likely to have multiple accidents over a 5-year period, highlighting the importance of discussing, documenting, and expeditiously diagnosing and treating OSA, particularly in those who report drowsiness while driving.
CLINICAL RISK FACTORS
Risk factors can be divided into nonmodifiable and modifiable ones.
Nonmodifiable factors
Age. Bimodal distributions in OSA prevalence have been observed; ie, that the pediatric population and people who are middle-aged have the highest prevalence of OSA. A linear relationship between sleep apnea prevalence and age until about age 65 was identified in data from the Sleep Heart Health Study.27 After that, the prevalence rates plateau; it is unclear if this is secondary to natural remission of the disease after a certain age or because patients with more severe disease have died by that age (ie, survivorship bias), blunting an increase in prevalence.
Sex. Men develop sleep apnea at a rate three to five times that of women. Several explanations have been proposed to account for this.28,29 Sex hormones are one factor; women with sleep apnea on hormone replacement therapy have a significantly less-severe sleep apnea burden than other postmenopausal women,30 suggesting a positive effect from estrogen. Sex-based differences in fat distribution, length and collapsibility of the upper airway, genioglossal activity, neurochemical control mechanisms, and arousal response may also contribute to prevalence differences between men and women.
As with coronary artery disease, the presentation of sleep apnea may be atypical in women, particularly around menopause. Sleep apnea should be considered in women who have snoring and daytime sleepiness.
Race. Whites, African Americans, and Asians have a similar prevalence of sleep apnea, but groups differ in obesity rates and craniofacial anatomy.31–34 Asians tend to have craniofacial skeletal restriction. African Americans are more likely to have upper-airway soft-tissue risk and to develop more severe OSA. Whites tend to have both craniofacial and soft-tissue risk. For those with craniofacial anatomy predisposing to OSA, even mild obesity can make it manifest.
Syndromes that predispose to OSA can include craniofacial structural abnormalities, connective tissue problems, or alterations in ventilatory control (eg, Marfan, Down, and Pierre Robin syndromes).
Modifiable risk factors
Obesity (body mass index ≥ 30 kg/m2) is a firmly established risk factor, but not all obese patients develop obstructive sleep apnea, and not all people with sleep apnea are obese.
Obesity increases risk by altering the geometry and function of the upper airway, increasing collapsibility. The changes are particularly pronounced in the lateral aspects of the pharynx.35
Obesity also affects respiratory drive, likely in part from leptin resistance. Load compensation is another contributing factor: the increased mass in the thorax and abdomen increases the work of breathing and reduces functional residual capacity, increasing oxygen demands and leading to atelectasis and ventilation-perfusion mismatch.
Although obesity is an important risk factor, it is important to recognize that obesity is not the only one to consider: most people with an apnea-hypopnea index of 5 or greater are not obese. The relationship between body mass index and sleep apnea is weaker in children and in the elderly, probably because other risk factors are more pronounced.36
Craniofacial structural abnormalities such as retrognathia (abnormal posterior position of the mandible) and micrognathia (undersized mandible) can increase the risk of OSA because of a resulting posteriorly displaced genioglossus muscle. Other conditions can alter chemosensitivity, affecting the pH and carbon dioxide level of the blood and therefore affecting ventilatory control mechanisms, making the person more prone to developing sleep apnea. Children and young adults may have tonsillar tissue that obstructs the airway.
The site of obstruction can be behind the palate (retropalatal), behind the tongue (retroglossal), or below the pharynx (hypopharyngeal). This helps explain why positive air way pressure—unlike surgery, which addresses a specific area—is often successful, as it serves to splint or treat all aspects of the airway.
FATIGUE, SLEEPINESS, SNORING, RESTLESS SLEEP
Sleep apnea can result in presentation of multiple signs and symptoms (Table 1).
Daytime sleepiness and fatigue are the most common symptoms. Although nonspecific, they are often quite pronounced. Two short questionnaires—the Epworth Sleepiness Scale37 and the Fatigue Severity Scale—can help distinguish between these two symptoms and assess their impact on a patient’s daily life. In the Epworth Sleepiness Scale, the patient rates his or her chance of dozing on a 4-point scale (0 = would never doze, to 3 = high chance of dozing) in eight situations:
- Sitting and reading
- Watching television
- Sitting inactive in a public place
- As a passenger in a car for an hour without a break
- Lying down to rest in the afternoon
- Sitting and talking to someone
- Sitting quietly after a lunch without alcohol
- In a car while stopped for a few minutes in traffic.
A score of 10 or more is consistent with significant subjective sleepiness.
The Fatigue Severity Scale assesses the impact of fatigue on daily living.
Snoring is a common and specific symptom of sleep apnea; however, not all patients who snore have OSA.
Restlessness during sleep is very common—patients may disturb their bed partner by moving around a lot during sleep or report that the sheets are “all over the place” by morning.
Nocturia can also be a sign of sleep apnea and can contribute to sleep fragmentation. A proposed mechanism of this symptom includes alterations of intrathoracic pressure resulting in atrial stretch, which release atrial natriuretic peptide, leading to nocturia. Treating with CPAP has been found to reduce levels of atrial natriuretic peptide, contributing to better sleep.38
Morning headache may occur and is likely related to increased CO2 levels, which appear to culminate in the morning hours. End-tidal or transcutaneous CO2 monitoring during polysomnography can help elucidate the presence of sleep-related hypoventilation.
Libido is often diminished and can actually be improved with CPAP. This is therefore an important point to discuss with patients, as improved libido can often serve as an incentive for adherence to OSA treatment.
Insomnia exists in about 15% of patients, primarily as a result of sleep apnea-related with treatment.
Sweating, particularly forehead sweating associated with sleep apnea, more commonly occurs in children.
The STOP-BANG questionnaire (Table 2)39 was primarily validated in preoperative anesthesia testing. However, because of its ease of use and favorable performance characteristics, it is increasingly used to predict the likelihood of finding OSA before polysomnography. A score of 3 or more has a sensitivity of 93%.
PHYSICAL EXAMINATION PROVIDES CLUES
Although the physical examination may be normal, certain findings indicate risk (Table 3). Obesity alone is not an accepted indication for polysomnography unless there are concomitant worrisome signs or symptoms. Of note, those who are morbidly obese (BMI > 40 kg/m2) have a prevalence of sleep apnea greater than 70%.
The classification by Friedman et al40 provides an indicator of risk. The patient is examined with the mouth opened wide and the tongue in a neutral natural position. Grades:
- I—Entire uvula and tonsils are visible
- II—Entire uvula is visible, but tonsils are not
- III—Soft palate is visible, but uvula is not
- IV—Only the hard palate is visible.
Especially in children and young adults, enlarged tonsils (or “kissing tonsils”) and a boggy edematous uvula set the stage for obstructive sleep apnea.
DIAGNOSIS REQUIRES SLEEP TESTING
A sleep study is the primary means of diagnosing OSA. Polysomnography includes electrooculography to determine when rapid-eye-movement sleep occurs; electromyography to measure muscle activity in the chin to help determine onset of sleep, with peripheral leads in the leg to measure leg movements; electroencephalography (EEG) to measure neural activity; electrocardiography; pulse oximetry to measure oxygen saturation; measurement of oronasal flow; and measurements of chest wall effort and body position using thoracic and abdominal belts that expand and contract with breathing; and audio recording to detect snoring.
Attended polysomnography requires the constant presence of a trained sleep technologist to monitor for technical issues and patient adherence.
End-tidal CO2 monitoring is a reasonable method to detect sleep-related hypoventilation but is not routinely performed in the United States. Transcutaneous CO2 monitoring is a different way to monitor CO2 used in the setting of positive airway pressure.
Polysomnography in a normal patient shows a regular pattern of increasing and decreasing airflow with inspiration and expiration while stable oxygen saturation is maintained.
In contrast, polysomnography of a patient with sleep apnea shows repetitive periods of no airflow, oxygen desaturation, and often evidence of thoracoabdominal paradox, punctuated by arousals on EEG associated with sympathetic activation (Figure 1). When the patient falls asleep, upper-airway muscle tone is reduced, causing an apneic event with hypoxia and pleural pressure swings. These prompt arousals with sympathetic activation that reestablish upper-airway muscle tone, allowing ventilation and reoxygenation to resume with a return to sleep.
Apnea-hypopnea index indicates severity
Sleep apnea severity is graded using the apnea-hypopnea index, ie, the number of apneic and hypopneic events per hour of sleep (Table 4).41 Events must last at least 10 seconds to be considered, ie, two consecutive missed breaths based on an average normal respiratory rate of about 12 breaths per minute for the typical adult.
The apnea-hypopnea index usually correlates with the severity of oxygen desaturation and with electrocardiographic abnormalities, including tachybradycardia and arrhythmias.
Although history, physical examination, and prediction tools are helpful in determining the likelihood that a patient has OSA, only polysomnography testing can establish the diagnosis. To diagnose OSA, 15 or more obstructive events per hour must be observed by polysomnography, or at least 5 events per hour with one of the following:
- Daytime sleepiness, sleep attacks, unrefreshing sleep, fatigue, or insomnia
- Waking with breath-holding, gasping, or choking
- Observer-reported loud snoring or breathing interruptions.41
Split-night study determines diagnosis and optimum treatment
The split-night study has two parts: the first is diagnostic polysomnography, followed by identification of the positive airway pressure that optimally treats the sleep apnea. The apnea-hypopnea index guides the need for the split-night study, with 40 being the established threshold according to the American Academy of Sleep Medicine.
A home sleep study is appropriate for some patients
Home sleep testing is typically more limited than standard polysomnography; it monitors airflow, effort, and oxygenation. The test is intended for adults with a high pretest probability of moderate to severe obstructive sleep apnea (STOP-BANG score ≥ 3). It is not intended for screening of asymptomatic patients or for those with coexisting sleep disorders (eg, central sleep apnea, sleep hypoventilation, periodic limb movements, insomnia, circadian rhythm disorders, parasomnias, narcolepsy) or medical disorders (eg, moderate to severe heart failure or other cardiac disease, symptomatic neurologic disease, moderate to severe pulmonary disease).42 Since March 2008, the Centers for Medicare and Medicaid Services has covered CPAP for obstructive sleep apnea based on diagnosis by home sleep study testing.43
TREATMENT OF SLEEP APNEA
Basic steps for reducing OSA are:
Weight loss. Even small weight changes can significantly affect the severity of sleep apnea, perhaps even leading to a reassessment of the degree of OSA and CPAP requirements. Longitudinal epidemiologic data demonstrate that a 10% weight loss correlates with a 26% reduction in the apnea-hypopnea index, and conversely, a 10% weight gain is associated with a 32% increase.44
Some studies have found that bariatric surgery cures OSA in 75% to 88% of cases, independent of approach.45,46 However, a trial in 60 obese patients with OSA who were randomized to either a low-calorie diet or bariatric surgery found no statistical difference in the apnea-hypopnea index between the two groups despite greater weight loss in the surgery group.47
Avoiding certain medications. Benzodiazepines, narcotics, and alcohol reduce upper airway muscle tone and should be avoided. No medications are associated with improvement of OSA, although acetazolamide may be used to treat central sleep apnea.
Positional therapy. Sleeping on the back exacerbates the problem. Supine-related OSA occurs as a result of several factors, including gravity, airway anatomy, airway critical closing pressures, and effects on upper-airway dilator muscle function.
Sleep hygiene. General recommendations to engage in behaviors to promote sleep are recommended, including keeping consistent sleep-wake times, not watching television in bed, and avoidance of caffeine intake, particularly within 4 to 6 hours of bedtime.
POSITIVE AIRWAY PRESSURE THERAPY
Nasal CPAP is the treatment of choice and is successful in 95% of patients when used consistently. It is not as costly as surgery, and results in improved long-term survival compared with uvulopalatopharyngoplasty. Another advantage is that the pressure can be retitrated as the patient’s condition changes, for example after a weight change or during pregnancy.
More than 15 randomized controlled trials have examined the effect of sleep apnea treatment with CPAP compared with either sham CPAP or another control. In a meta-analysis, CPAP was found to lead to an average systolic blood pressure reduction of about 2.5 mm Hg and a diastolic blood pressure reduction of 1.8 mm Hg. Although these reductions may seem negligible, benefits may be significant for cardiovascular outcomes.48,49
Challenges to treatment adherence
Adherence is the most commonly discussed problem with CPAP, but long-term adherence rates are comparable to medication compliance—about 60% to 70%. To optimize adherence, communication is important to ensure that problems are identified and addressed as they arise. Showing patients examples of apneic events and oxygen desaturation from their sleep study can enhance their understanding of OSA and its importance. Patients need to understand the serious nature of the disease and that CPAP therapy can significantly improve their quality of life and overall health, particularly from a cardiovascular perspective.
CPAP masks can be uncomfortable, posing a major barrier to compliance. But a number of mask designs are available, such as the nasal mask, the nasal pillow mask, and the oronasal mask. For patients with claustrophobia, the nasal pillow mask is an option, as it does not cover the face.
Some patients note symptoms of nasal congestion, although in many patients CPAP improves it. If congestion is a problem, the use of heated humidification with the machine, intranasal saline or gel, or nasal corticosteroids can help relieve it.
Pressure intolerance is a common problem. For those who feel that the pressure is too high, settings can be adjusted so that the pressure is gradually reduced between inspiration and expiration, ie, the use of expiratory pressure relief or consideration of the use of bilevel positive airway pressure.
Aerophagia (swallowing air) is a less common problem. It can also potentially be relieved with use of bilevel positive airway pressure.
Many patients develop skin irritation, which can be helped with moleskin, available at any pharmacy.
Social stigma can be a problem. Education regarding the importance of the treatment to health is essential.
Machine noise is less of a problem with the new machine models, but if it is a problem, a white-noise device or earplugs may help.
Other measures to improve compliance are keeping the regimen simple and ensuring that family support is adequate.
Medicare requires evidence of use and benefit
Medicare requires that clinical benefit be documented between the 31st and 91st day after initiating CPAP therapy. This requires face-to-face clinical reevaluation by the treating physician to document improved symptoms and objective evidence of adherence to use of the device. The devices can store usage patterns, and Medicare requires at least 4 hours per night on 70% of nights during a consecutive 30-day period in the first 3 months of use.
ALTERNATIVE THERAPIES
Alternative therapies may be options for some patients, in particular those who cannot use CPAP or who get no benefit from it. These include oral appliances for those with mild to moderate OSA50–53 and various surgical procedures, eg, uvulopalatopharyngoplasty,54,55 maxillomanibular advancement,56 tracheostomy (standard treatment before CPAP was identified as an effective treatment),57,58 and adenotonsillectomy (in children).59
Supplemental oxygen is not a first-line treatment for OSA and in general has not been found to be very effective, particularly in terms of intermediate cardiovascular outcomes,60–62 although a subset of patients with high loop gain may benefit from it.63 Loop gain is a measure of the tendency of the ventilatory control system to amplify respiration in response to a change, conferring less stable control of breathing.
Several novel alternative therapies are starting to be used. Although all of them have been shown to improve measures of OSA, none is as effective as CPAP in improving OSA severity. New therapies include the nasal expiratory positive airway pressure device,64 oral pressure therapy,65 and hypoglossal nerve stimulation.66
- Young T, Palta M, Dempsey J, Skatrud J, Weber S, Badr S. The occurrence of sleep-disordered breathing among middle-aged adults. N Engl J Med 1993; 328:1230–1235.
- Peppard PE, Young T, Barnet JH, Palta M, Hagen EW, Hla KM. Increased prevalence of sleep-disordered breathing in adults. Am J Epidemiol 2013; 177:1006–1014.
- Kapur VK, Redline S, Nieto FJ, Young TB, Newman AB, Henderson JA; Sleep Heart Health Research Group. The relationship between chronically disrupted sleep and healthcare use. Sleep 2002; 25:289–296.
- Kapur V, Blough DK, Sandblom RE, et al. The medical cost of undiagnosed sleep apnea. Sleep 1999; 22:749–755.
- Mooe T, Rabben T, Wiklund U, Franklin KA, Eriksson P. Sleep-disordered breathing in men with coronary artery disease. Chest 1996; 109:659–663.
- Schafer H, Koehler U, Ewig S, Hasper E, Tasci S, Luderitz B. Obstructive sleep apnea as a risk marker in coronary artery disease. Cardiology 1999; 92:79–84.
- Leung RS, Bradley TD. Sleep apnea and cardiovascular disease. Am J Respir Crit Care Med 2001; 164:2147–2165.
- American Academy of Sleep Medicine. International Classification of Sleep Disorders, Second Edition: Diagnostic and coding manual. Westchester, IL; American Academy of Sleep Medicine, 2005.
- Somers VK, Dyken ME, Clary MP, Abboud FM. Sympathetic neural mechanisms in obstructive sleep apnea. J Clin Invest 1995; 96:1897–1904.
- Mehra R. Sleep-disordered breathing and cardiovascular disease: exploring pathophysiology and existing data. Curr Resp Med Rev 2007; 3:258–269.
- Mehra R, Storfer-Isser A, Kirchner HL, et al. Soluble interleukin 6 receptor: a novel marker of moderate to severe sleep-related breathing disorder. Arch Intern Med 2006; 166:1725–1731.
- Mehra R, Xu F, Babineau DC, et al. Sleep-disordered breathing and prothrombotic biomarkers: cross-sectional results of the Cleveland Family Study. Am J Respir Crit Care Med 2010; 182:826–833.
- Mehra R, Storfer-Isser A, Tracy R, Jenny N, Redline S. Association of sleep disordered breathing and oxidized LDL [abstract]. Am J Respir Crit Care Med 2010; 181:A2474.
- Mehra R, Benjamin EJ, Shahar E, et al; Sleep Heart Health Study. Association of nocturnal arrhythmias with sleep-disordered breathing: the Sleep Heart Health Study. Am J Respir Crit Care Med 2006; 173:910–916.
- Mehra R, Xu F, Babineau DC, et al. Sleep-disordered breathing and prothrombotic biomarkers: cross-sectional results of the Cleveland Family Study. Am J Respir Crit Care Med 2010; 182:826–833.
- Monahan K, Storfer-Isser A, Mehra R, et al. Triggering of nocturnal arrhythmias by sleep-disordered breathing events. J Am Coll Cardiol 2009; 54:1797–1804.
- Kanagala R, Murali NS, Friedman PA, et al. Obstructive sleep apnea and the recurrence of atrial fibrillation. Circulation 2003; 107:2589–2594.
- Patel D, Mohanty P, Di Biase L, et al. Safety and efficacy of pulmonary vein antral isolation in patients with obstructive sleep apnea: the impact of continuous positive airway pressure. Circ Arrhythm Electrophysiol 2010; 3:445–451.
- Walia H, Strohl KP, Mehra R. Effect of continuous positive airway pressure on an atrial arrhythmia in a patient with mild obstructive sleep apnea. J Clin Sleep Med 2011; 7:397–398.
- Marin JM, Carrizo SJ, Vicente E, Agusti AG. Long-term cardiovascular outcomes in men with obstructive sleep apnoea-hypopnoea with or without treatment with continuous positive airway pressure: an observational study. Lancet 2005; 365:1046–1053.
- Redline S, Yenokyan G, Gottlieb DJ, et al. Obstructive sleep apnea-hypopnea and incident stroke: the sleep heart health study. Am J Respir Crit Care Med 2010; 182:269–277.
- Wang H, Parker JD, Newton GE, et al. Influence of obstructive sleep apnea on mortality in patients with heart failure. J Am Coll Cardiol 2007; 49:1625–1631.
- Khayat R, Abraham W, Patt B, et al. Central sleep apnea is a predictor of cardiac readmission in hospitalized patients with systolic heart failure. J Card Fail 2012; 18:534–540.
- Gami AS, Howard DE, Olson EJ, Somers VK. Day-night pattern of sudden death in obstructive sleep apnea. N Engl J Med 2005; 352:1206–1214.
- Punjabi NM, Caffo BS, Goodwin JL, et al. Sleep-disordered breathing and mortality: a prospective cohort study. PLoS Med 2009; 6( 8):e1000132. doi: 10.1371/journal.pmed.1000132.
- Young T, Blustein J, Finn L, Palta M. Sleep-disordered breathing and motor vehicle accidents in a population-based sample of employed adults. Sleep 1997; 20:608–613.
- Young T, Peppard PE, Gottlieb DJ. Epidemiology of obstructive sleep apnea: a population health perspective. Am J Respir Crit Care Med 2002; 165:1217–1239.
- Lin CM, Davidson TM, Ancoli-Israel S. Gender differences in obstructive sleep apnea and treatment implications. Sleep Med Rev 2008; 12:481–496.
- Shaher E, Redline S, Young T, et al. Hormone replacement therapy and sleep-disordered breathing. Am J Respir Crit Care Med 2003; 167:1186–1192.
- Young T, Finn L, Austin D, Peterson A. Menopausal status and sleep-disordered breathing in the Wisconsin Sleep Cohort Study. Am J Respir Crit Care Med 2003; 167:1181–1185.
- Ancoli-Israel S, Klauber MR, Stepnowsky C, Estline E, Chinn A, Fell R. Sleep-disordered breathing in African-American elderly. Am J Respir Crit Care Med 1995; 152:1946–1949.
- Young T, Shahar E, Nieto FJ, et al; Sleep Heart Health Study Research Group. Predictors of sleep-disordered breathing in community-dwelling adults: the Sleep Heart Health Study. Arch Intern Med 2002; 162:893–900.
- Redline S, Tishler PV, Hans MG, Tosteson TD, Strohl KP, Spry K. Racial differences in sleep-disordered breathing in African-Americans and Caucasians. Am J Respir Crit Care Med 1997; 155:186–192. Erratum in: Am J Respir Crit Care Med 1997; 155:1820.
- Sutherland K, Lee RWW, Cistulli PA. Obesity and craniofacial structure as risk factors for obstructive sleep apnoea: impact of ethnicity. Respirology 2012; 17:213–222.
- Schwab RJ, Gupta KB, Gefter WB, Metzger LJ, Hoffman EA, Pack AI. Upper airway and soft tissue anatomy in normal subjects and patients with sleep-disordered breathing. Significance of the lateral pharyngeal walls. Am J Respir Crit Care Med 1995; 152:1673–1689.
- Nieto FJ, Young TB, Lind BK, et al. Association of sleep-disordered breathing, sleep apnea, and hypertension in a large community-based study. Sleep Heart Health Study. JAMA 2000; 283:1829–1836.
- Johns MW. A new method for measuring daytime sleepiness: the Epworth sleepiness scale. Sleep 1991; 14:540–545.
- Krieger J, Imbs J-L, Schmidt M, Kurtz D. Renal function in patients with obstructive sleep apnea. Effects of nasal continuous positive airway pressure. Arch Intern Med 1988; 148:1337–1340.
- Chung F, Yegneswaran B, Liao P, et al. STOP questionnaire: a tool to screen patients for obstructive sleep apnea. Anesthesiology 2008; 108:812–821.
- Friedman M, Ibrahim H, Bass L. Clinical staging for sleep-disordered breathing. Otolaryngal Head Neck Surg 2002; 127:13–21.
- Sleep-related breathing disorders in adults: recommendations for syndrome definition and measurement techniques in clinical research. Report of an American Academy of Sleep Medicine Task Force. Sleep 1999; 22:667–689.
- Collop NA, Anderson WM, Boehlecke B, et al; Portable Monitoring Task Force of the American Academy of Sleep Medicine. Clinical guidelines for the use of unattended portable monitors in the diagnosis of obstructive sleep apnea in adult patients. Portable Monitoring Task Force of the American Academy of Sleep Medicine. J Clin Sleep Med 2007; 3:737–747.
- Centers for Medicare & Medicaid Services (CMS). Continuous positive airway pressure (CPAP) therapy for obstructive sleep apnea (OSA). MLN Matters 2008. www.cms.gov/Outreach-and-Education/Medicare-Learning-Network-MLN/MLNMattersArticles/downloads/MM6048.pdf. Accessed June 2, 2014.
- Peppard PE, Young T, Palta M, Dempsey J, Skatrud J. Longitudinal study of moderate weight change and sleep-disordered breathing. JAMA 2000; 284:3015–3021.
- Guardiano SA, Scott JA, Ware JC, Schechner SA. The long-term results of gastric bypass on indexes of sleep apnea. Chest 2003; 124:1615–1619.
- Crooks PF. Surgical treatment of morbid obesity. Annu Rev Med 2006; 57:243–264.
- Dixon JB, Schachter LM, O’Brien PE, et al. Surgical vs conventional therapy for weight loss treatment of obstructive sleep apnea: a randomized controlled trial. JAMA 2012; 308:1142–1149.
- Bazzano LA, Khan Z, Reynolds K, He J. Effect of nocturnal nasal continuous positive airway pressure on blood pressure in obstructive sleep apnea. Hypertension 2007; 50:417–423.
- Logan AG, Perlikowski SM, Mente A, et al. High prevalence of unrecognized sleep apnoea in drug-resistant hypertension. J Hypertens 2001; 19:2271–2277.
- Kushida CA, Morgenthaler TI, Littner MR, et al; American Academy of Sleep. Practice parameters for the treatment of snoring and obstructive sleep apnea with oral appliances: an update for 2005. Sleep 2006; 29:240–243.
- Otsuka R, Ribeiro de Almeida F, Lowe AA, Linden W, Ryan F. The effect of oral appliance therapy on blood pressure in patients with obstructive sleep apnea. Sleep Breath 2006; 10:29–36.
- Yoshida K. Effect on blood pressure of oral appliance therapy for sleep apnea syndrome. Int J Prosthodont 2006; 19:61–66.
- Inazawa T, Ayuse T, Kurata S, et al. Effect of mandibular position on upper airway collapsibility and resistance. J Dent Res 2005; 84:554–558.
- Fujita S, Conway W, Zorick F, Roth T. Surgical correction of anatomic abnormalities in obstructive sleep apnea syndrome: uvulopalatopharyngoplasty. Otolaryngol Head Neck Surg 1981; 89:923–934.
- Schwab RJ. Imaging for the snoring and sleep apnea patient. Dent Clin North Am 2001; 45:759–796.
- Prinsell JR. Maxillomandibular advancement surgery for obstructive sleep apnea syndrome. J Am Dent Assoc 2002; 133:1489–1497.
- Thatcher GW, Maisel RH. The long-term evaluation of tracheostomy in the management of severe obstructive sleep apnea. Laryngoscope 2003; 113:201–204.
- Conway WA, Victor LD, Magilligan DJ, Fujita S, Zorick FJ, Roth T. Adverse effects of tracheostomy for sleep apnea. JAMA 1981; 246:347–350.
- Marcus CL, Moore RH, Rosen CL, et al; Childhood Adenotonsillectomy Trial (CHAT). A randomized trial of adenotonsillectomy for childhood sleep apnea. N Engl J Med 2013; 368:2366–2376.
- Gottlieb DJ, Craig SE, Lorenzi-Filho G, et al. Sleep apnea cardiovascular clinical trials-current status and steps forward: The International Collaboration of Sleep Apnea Cardiovascular Trialists. Sleep 2013; 36:975–980.
- Loredo JS, Ancoli-Israel S, Kim EJ, Lim WJ, Dimsdale JE. Effect of continuous positive airway pressure versus supplemental oxygen on sleep quality in obstructive sleep apnea: a placebo-CPAP-controlled study. Sleep 2006; 29:564–571.
- Phillips BA, McConnell JW, Smith MD. The effects of hypoxemia on cardiac output. A dose-response curve. Chest 1988; 93:471–475.
- Wellman A, Malhotra A, Jordan AS, Stevenson KE, Gautam S, White DP. Effect of oxygen in obstructive sleep apnea: role of loop gain. Respire Physiol Neurobiol 2008; 162:144–151.
- Berry RB, Kryger MH, Massie CA. A novel nasal expiratory positive airway pressure (EPAP) device for the treatment of obstructive sleep apnea: a randomized controlled trial. Sleep 2011; 34:479–485.
- Colrain IM, Black J, Siegel LC, et al. A multicenter evaluation of oral pressure therapy for the treatment of obstructive sleep apnea. Sleep Med 2013; 14:830–837.
- Strollo PJ Jr, Soose RJ, Maurer JT, et al; STAR Trial Group. Upper-airway stimulation for obstructive sleep apnea. N Engl J Med 2014; 370:139–149.
KEY POINTS
- Although obesity and snoring are common features of OSA, they are not always present.
- Home sleep testing is appropriate for those highly likely to have sleep apnea and without other significant sleep or cardiovascular, respiratory, or neurologic disorders.
- Upper-airway surgery has a limited role—it is indicated primarily for those unable to tolerate CPAP.
- Risk of motor vehicle accidents is dramatically increased in untreated sleep apnea; patients should be counseled on the dangers of drowsy driving.
Perioperative beta-blockers in noncardiac surgery: The evidence continues to evolve
Prophylactic use of beta-blockers in the perioperative period is highly controversial. Initial studies in the 1990s were favorable, but evidence has been conflicting since then.
The pendulum swung away from routinely recommending beta-blockers after the publication of negative results from several studies, including the Perioperative Ischemic Evaluation (POISE) trial in 2008.1 Highlighting this change in practice, a Canadian study2 found that the use of perioperative beta-blockade increased between 1999 and 2005 but subsequently declined from 2005 to 2010. However, there was no appreciable change in this pattern after the POISE trial or after changes in the American College of Cardiology guidelines in 2002 and 2006.3
In 2008, Harte and Jaffer reviewed the perioperative use of beta-blockers in noncardiac surgery in this journal.4 Since then, a number of meta-analyses and retrospective observational studies have reported variable findings related to specific beta-blockers and specific complications.
In this paper, we review the rationale and recent evidence for and against the perioperative use of beta-blockers as guidance for internists and hospitalists.
POTENTIAL CARDIOPROTECTIVE EFFECTS OF BETA-BLOCKERS
Myocardial infarction and unstable angina are the leading cardiovascular causes of death after surgery.5 These events are multifactorial. Some are caused by the stress of surgery, which precipitates physiologic changes related to inflammatory mediators, sympathetic tone, and oxygen supply and demand; others are caused by acute plaque rupture, thrombosis, and occlusion.6 Most perioperative infarcts are non-Q-wave events7 and occur within the first 2 days after the procedure, when the effects of anesthetics, pain, fluid shifts, and physiologic changes are greatest. Because multiple causes may contribute to perioperative myocardial infarction, a single preventive strategy may not be sufficient.8,9
Beta-blockers do several things that may be beneficial in the perioperative setting. They reduce myocardial oxygen demand by decreasing the force of contraction and by slowing the heart rate, and slowing the heart rate increases diastolic perfusion time.10 They suppress arrhythmias; they limit leukocyte recruitment, the production of free radicals, metalloproteinase activity, monocyte activation, release of growth factors, and inflammatory cytokine response; and they stabilize plaque.11 Their long-term use may also alter intracellular signaling processes, thus improving cell survival by decreasing the expression of receptors for substances that induce apoptosis.12
INITIAL POSITIVE TRIALS
Mangano et al13 began the beta-blocker trend in 1996 with a study in 200 patients known to have coronary artery disease or risk factors for it who were undergoing noncardiac surgery. Patients were randomized to receive either atenolol orally and intravenously, titrated to control the heart rate, or placebo in the immediate perioperative period.
The atenolol group had less perioperative ischemia but no difference in short-term rates of myocardial infarction and death. However, the death rate was lower in the atenolol group at 6 months after discharge and at 2 years, although patients who died in the immediate postoperative period were excluded from the analysis.
Although this finding did not appear to make sense physiologically, we now know that patients may experience myocardial injury without infarction after noncardiac surgery, a phenomenon associated with an increased risk of death in the short term and the long term.14 Preventing these episodes may be the explanation for the improved outcome.
The DECREASE trial15 (Dutch Echocardiographic Cardiac Risk Evaluation Applying Stress Echocardiography) provided additional support for beta-blocker use. The patients were at high risk, had abnormal dobutamine stress echocardiograms, and were undergoing vascular surgery; 112 patients were randomized to receive either oral bisoprolol (started 1 month before surgery, titrated to control the heart rate, and continued for 1 month after surgery) or placebo.
The study was stopped early because the bisoprolol group reportedly had a 90% lower rate of myocardial infarction and cardiac death 1 month after surgery. However, the study was criticized because the total number of patients enrolled was small and the benefit was much greater than usual for any pharmacologic intervention, thus calling the results into question.
In a follow-up study,16 survivors continued to be followed while receiving bisoprolol or usual care. The incidence of myocardial infarction or cardiac death at 2 years was significantly lower in the group receiving bisoprolol (12% vs 32%, odds ratio [OR] 0.30, P = .025).
Boersma et al,17 in an observational study, analyzed data from all 1,351 patients scheduled for major vascular surgery being considered for enrollment in the DECREASE trial. The DECREASE protocol required patients to undergo dobutamine stress echocardiography if they had one or more risk factors (age 70 or older, angina, prior myocardial infarction, congestive heart failure, treatment for ventricular arrhythmia, treatment for diabetes mellitus, or limited exercise capacity) or if their physician requested it. Twenty-seven percent received beta-blockers.
In multivariate analysis, clinical predictors of adverse outcome were age 70 or older; current or prior history of angina; and prior myocardial infarction, heart failure, or cerebrovascular accident.
In patients who had fewer than three clinical risk factors, beta-blocker use was associated with a lower rate of complications (0.8% vs 2.3%). Dobutamine stress echocardiography had minimal predictive value in this lower-risk group, suggesting that stress testing may not be necessary in this group if beta-blockers are used appropriately. However, in patients who had three or more risk factors, this test did provide additional prognostic information; those without stress-induced ischemia had lower event rates than those with ischemia, and beta-blocker use further reduced those rates, except in patients with extensive ischemia (more than five left ventricular segments involved).
The Revised Cardiac Risk Index. Lee et al18 devised an index to assist in preoperative cardiac risk stratification that was subsequently incorporated into the 2007 American College of Cardiology/American Heart Association preoperative risk guidelines. (It does not, however, address the beta-blocker issue.) It consists of six independent risk-predictors of major cardiac complications derived from 4,315 patients over age 50 undergoing non-cardiac surgery. The risk factors, each of which is given 1 point, are:
- Congestive heart failure based on history or examination
- Renal insufficiency (serum creatinine level > 2 mg/dL)
- Myocardial infarction, symptomatic ischemic heart disease, or a positive stress test
- History of transient ischemic attack or stroke
- Diabetes requiring insulin
- High-risk surgery (defined as intrathoracic, intra-abdominal, or suprainguinal vascular surgery).
Patients with 3 or more points are considered to be at high risk, and those with 1 or 2 points are considered to be at intermediate risk. The American College of Cardiology/American Heart Association preoperative cardiac risk algorithm subsequently included five of these six risk factors (the type of surgery was considered separately) and made recommendations concerning noninvasive stress testing and heart rate control.
On the basis of these studies, specialty societies, guideline committees, and hospitals enthusiastically recommended the prophylactic use of beta-blockers to decrease postoperative cardiac complications.
THREE NEGATIVE TRIALS OF METOPROLOL
In 2005 and 2006, two studies in vascular surgery patients and another in patients with diabetes cast doubt on the role of beta-blockers when the results failed to show a benefit. The trials used metoprolol, started shortly before surgery, and with no titration to control the heart rate.
The MaVS study19 (Metoprolol After Vascular Surgery) randomized 496 patients to receive metoprolol or placebo 2 hours before surgery and until hospital discharge or a maximum of 5 days after surgery. The metoprolol dose varied by weight: patients weighing 75 kg or more got 100 mg, those weighing between 40 and 75 kg got 50 mg, and those weighing less than 40 kg got 25 mg. Overall effects at 6 months were not significantly different, but intraoperative bradycardia and hypotension requiring intervention were more frequent in the metoprolol group.
The POBBLE study20 (Perioperative Beta Blockade) randomized 103 patients who had no history of myocardial infarction to receive either metoprolol 50 mg twice daily or placebo from admission to 7 days after surgery. Myocardial ischemia was present in one-third of the patients after surgery. Metoprolol did not reduce the 30-day cardiac mortality rate, but it was associated with a shorter length of stay.
The DIPOM trial21 (Diabetic Postoperative Mortality and Morbidity) randomized 921 diabetic patients to receive long-acting metoprolol succinate controlled-release/extended release (CR/XL) or placebo. Patients in the metoprolol group received a test dose of 50 mg the evening before surgery, another dose 2 hours before surgery (100 mg if the heart rate was more than 65 bpm, or 50 mg if between 55 and 65 bpm), and daily thereafter until discharge or a maximum of 8 days. The dose was not titrated to heart-rate control.
Metoprolol had no statistically significant effect on the composite primary outcome measures of time to death from any cause, acute myocardial infarction, unstable angina, or congestive heart failure or on the secondary outcome measures of time to death from any cause, death from a cardiac cause, and nonfatal cardiac morbidity.
ADDITIONAL POSITIVE STUDIES
Lindenauer et al22 retrospectively evaluated the use of beta-blockers in the first 2 days after surgery in 782,969 patients undergoing non-cardiac surgery. Using propensity score matching and Revised Cardiac Risk Index scores, they found a lower rate of postoperative mortality in patients with three or more risk factors who received a beta-blocker. There was no significant difference in the group with two risk factors, but in the lowest-risk group (with a score of 0 to 1), beta-blockers were not beneficial and may have been associated with harm as evidenced by a higher odds ratio for death, although this was probably artifactual and reflecting database limitations.
Feringa et al,23 in an observational cohort study of 272 patients undergoing vascular surgery, reported that higher doses of beta-blockers and tight heart-rate control were associated with less perioperative myocardial ischemia, lower troponin T levels, and better long-term outcome.
THE POISE TRIAL: MIXED RESULTS
The randomized POISE trial,1 published in 2008, compared the effects of extended-release metoprolol succinate vs placebo on the 30-day risk of major cardiovascular events in 8,351 patients with or at risk of atherosclerotic disease who were undergoing noncardiac surgery. The metoprolol regimen was 100 mg 2 to 4 hours before surgery, another 100 mg by 6 hours after surgery, and then 200 mg 12 hours later and once daily for 30 days.
The incidence of the composite primary end point of cardiovascular death, nonfatal myocardial infarction, and nonfatal cardiac arrest at 30 days was lower in the metoprolol group than in the placebo group (5.8% vs 6.9%; P = .04), primarily because of fewer nonfatal myocardial infarctions. However, more patients in the metoprolol group died of any cause (3.1% vs 2.3% P = .03) or had a stroke (1.0% vs 0.5% P = .005) than in the placebo group.
The metoprolol group had a higher incidence of clinically significant hypotension, bradycardia, and stroke, which could account for much of the increase in the mortality rate. Sepsis was the major cause of death in this group; hypotension may have increased the risk of infection, and beta-blockers may have potentiated hypotension in patients who were already septic. Also, the bradycardic and negative inotropic effects of the beta-blocker could have masked the physiologic response to systemic infection, thereby delaying recognition and treatment or impeding the normal immune response.
One of the major criticisms of the POISE trial was its aggressive dosing regimen (200 to 400 mg within a 36-hour period) in patients who had not been on beta-blockers before then. Also, the drug was started only a few hours before surgery. In addition, these patients were at higher risk of death and stroke than those in other trials based on a high baseline rate of cerebrovascular disease, and inclusion of urgent and emergency surgical procedures.
STUDIES SINCE POISE
The POISE trial results1 prompted further questioning of the prophylactic perioperative use of beta-blockers. However, proponents of beta-blockers voiced serious criticisms of the trial, particularly the dosing regimen, and continued to believe that these drugs were beneficial if used appropriately.
The DECREASE IV trial. Dunkelgrun et al,24 in a study using bisoprolol started approximately 1 month before surgery and titrated to control the heart rate, reported beneficial results in intermediate-risk patients. In their randomized open-label study with a 2 × 2 factorial design, 1,066 patients at intermediate cardiac risk were assigned to receive bisoprolol, fluvastatin, combination treatment, or control therapy at least 34 days before surgery. Bisoprolol was started at 2.5 mg orally daily and slowly titrated up to a maximum dose of 10 mg to keep the heart rate between 50 and 70 beats per minute. The group of 533 patients randomized to receive bisoprolol had a lower incidence rate of cardiac death and nonfatal myocardial infarction than the control group (2.1% vs 6.0%, HR 0.34, P = .002). A potential limitation of this study was its open-label design, which might have led to treatment bias.
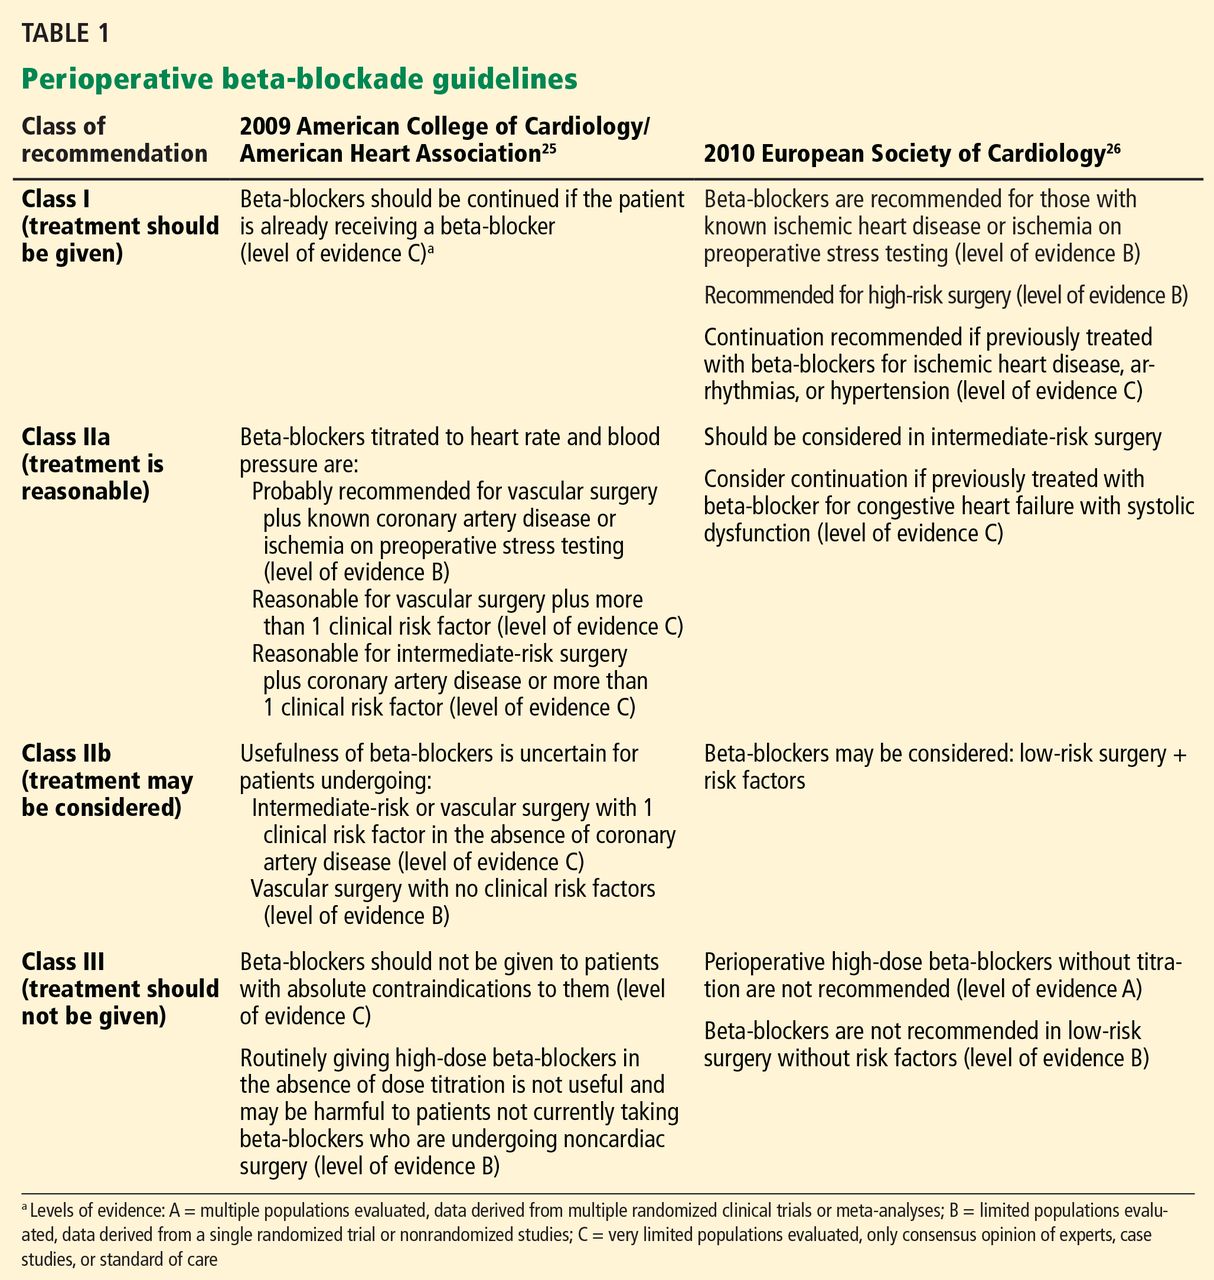
Updated guidelines. Based on the results from POISE and DECREASE IV, the American College of Cardiology Foundation/American Heart Association Task Force on Practice Guidelines25 published a focused update on beta-blockers in 2009 as an amendment to their 2007 guidelines on perioperative evaluation and care for noncardiac surgery. The European Society of Cardiology26 released similar but somewhat more liberal guidelines (Table 1).
London et al,27 in an observational study published in 2013, found a lower 30-day overall mortality rate with beta-blockers (relative risk [RR] 0.73, 95% confidence interval [CI] 0.65–0.83, P < .001, number needed to treat [NNT] 241), as well as a lower rate of cardiac morbidity (nonfatal myocardial infarction and cardiac death), but only in nonvascular surgery patients who were on beta-blockers within 7 days of scheduled surgery. Moreover, similar to the findings of Lindenauer et al,22 only patients with a Revised Cardiac Risk Index score of 2 or more benefited from beta-blocker use in terms of a lower risk of death, whereas the lower-risk patients did not:
- Risk score of 0 or 1—no association
- Score of 2—RR 0.63, 95% CI 0.50–0.80, P < .001, NNT 105
- Score of 3—RR 0.54, 95% CI 0.39–0.73, P < .001, NNT 41
- Score of 4 or more—RR 0.40, 95% CI 0.24–0.73, P < .001, NNT 18).
Beta-blocker exposure was associated with a significantly lower rate of cardiac complications (RR 0.67, 95% CI 0.57–0.79, P < .001, NNT 339), also limited to nonvascular surgery patients with a risk score of 2 or 3.
The Danish Nationwide Cohort Study28 examined the effect of beta-blockers on major adverse cardiac events (MACE, ie, myocardial infarction, cerebrovascular accident, and death) in 28,263 patients with ischemic heart disease undergoing noncardiac surgery; 7,990 with heart failure and 20,273 without. Beta-blockers were used in 53% of patients with heart failure and 36% of those without heart failure. Outcomes for all of the beta-blocker recipients:
- MACE—HR 0.90, 95% CI 0.79–1.02
- All-cause mortality—HR 0.95, 95% CI 0.85–1.06.
Outcomes for patients with heart failure if they received beta-blockers:
- MACE—HR 0.75, 95% CI 0.70–0.87
- All-cause mortality—HR 0.80, 95% CI 0.70–0.92.
There was no significant benefit from beta-blockers in patients without heart failure. Outcomes for those patients if they received beta-blockers:
- MACE—HR 1.11, 95% CI 0.92–1.33
- All-cause mortality—HR 1.15, 95% CI 0.98–1.35.
However, in patients without heart failure but with a history of myocardial infarction within the past 2 years, beta-blockers were associated with a lower risk of MACE and all-cause mortality. In patients with neither heart failure nor a recent myocardial infarction, beta-blockers were associated with an increased risk of MACE and all-cause mortality.
This difference in efficacy depending on the presence and timing of a prior myocardial infarction is consistent with the 2012 American College of Cardiology/American Heart Association guidelines for secondary prevention, in which beta-blockers are given a class I recommendation only for patients with a myocardial infarction within the past 3 years.
Meta-analyses and outcomes
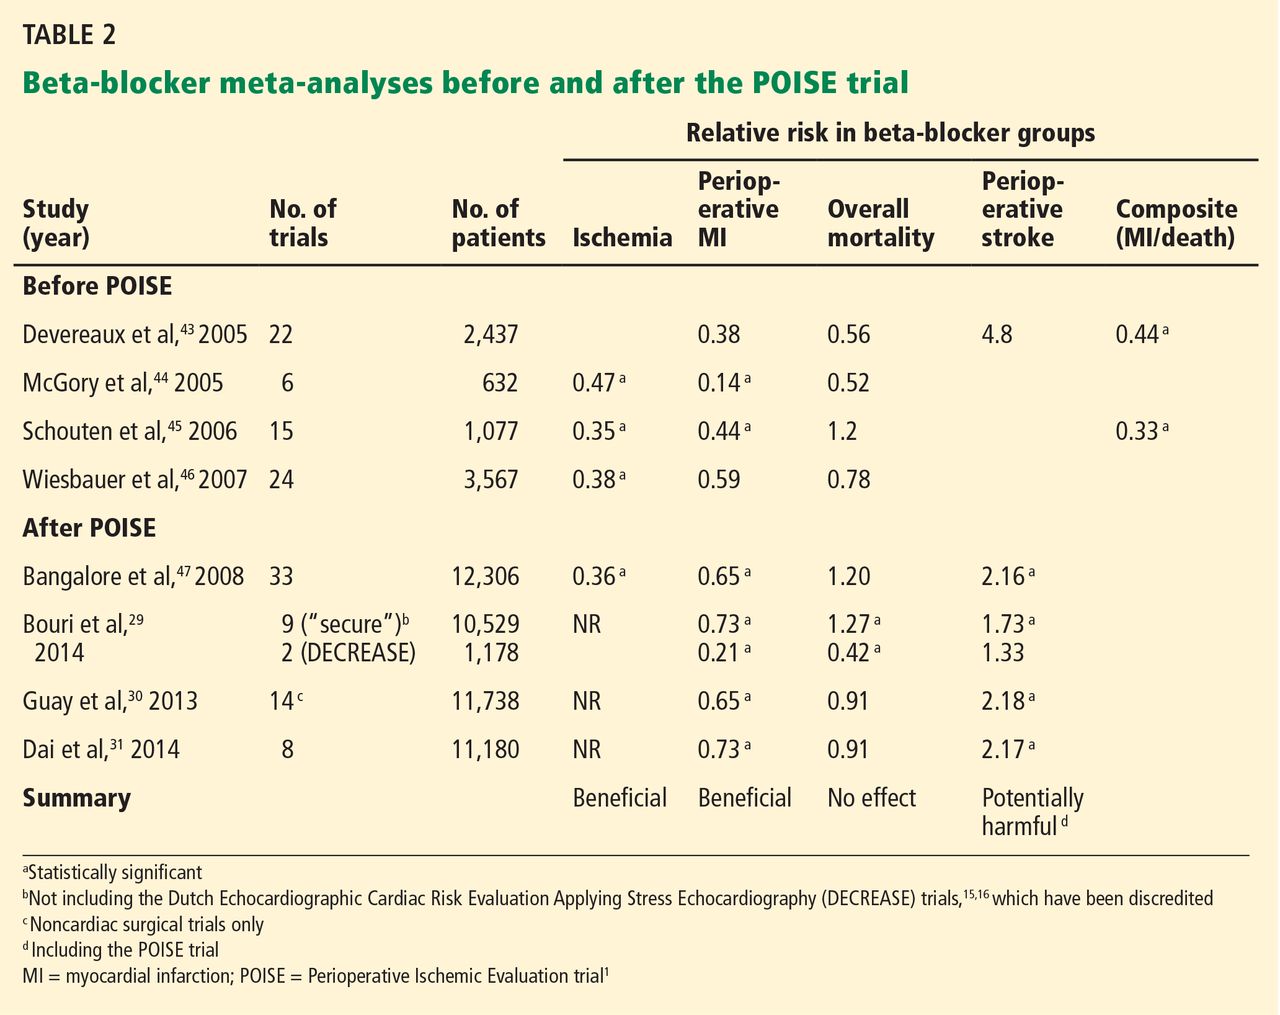
A number of meta-analyses have been published over the past 10 years, with conflicting results (Table 2). The divergent findings are primarily due to the different studies included in the analyses as well as the strong influence of the POISE trial.1 The studies varied in terms of the specific beta-blocker used, dose titration and heart rate control, time of initiation of beta-blocker use before surgery, type of surgery, patient characteristics, comorbidities, biomarkers and diagnosis of myocardial infarction, and clinical end points.
In general, these meta-analyses have found that prophylactic perioperative use of beta-blockers decreases ischemia and tends to reduce the risk of nonfatal myocardial infarction. They vary on whether the overall mortality risk is decreased. The meta-analyses that included POISE1 found an increased incidence of stroke, whereas those that excluded POISE found no significant difference, although there appeared to be slightly more strokes in the beta-blocker groups.
The beta-blocker controversy increased even further when Dr. Don Poldermans was fired by Erasmus Medical Center in November 2011 for violations of academic integrity involving his research, including the DECREASE trials. The most recent meta-analysis, by Bouri et al,29 included nine “secure trials” and excluded the DECREASE trials in view of the controversy about their authenticity. The analysis showed an increase in overall mortality as well as stroke, primarily because it was heavily influenced by POISE.1 In contrast, the DECREASE trials had reported a decreased risk of myocardial infarction and death, with no significant increase in stroke. The authors concluded that guideline bodies should “retract their recommendations based on the fictitious data without further delay.”29
Although the design of the DECREASE trials (in which beta-blockers were started well in advance of surgery and doses were titrated to achieve heart rate control) is physiologically more compelling than those of the negative trials, the results have been questioned in light of the integrity issue. However, to date, none of the published DECREASE trials have been retracted.
Two other meta-analyses,30,31 published in 2013, also found a decreased risk of myocardial infarction and increased risk of stroke but no significant difference in short-term all-cause mortality.
ARE ALL BETA-BLOCKERS EQUIVALENT?
In various studies evaluating specific beta-blockers, the more cardioselective agents bisoprolol and atenolol were associated with better outcomes than metoprolol. The affinity ratios for beta-1/beta-2 receptors range from 13.5 for bisoprolol to 4.7 for atenolol and 2.3 for metoprolol.32 Blocking beta-1 receptors blunts tachycardia, whereas blocking beta-2 receptors may block systemic or cerebral vasodilation.
In patients with anemia, beta-blockade in general may be harmful, but beta-2 blockade may be even worse. Beta-blockers were associated with an increased risk of MACE (6.5% vs 3.0%)33 in patients with acute surgical anemia if the hemoglobin concentration decreased to less than 35% of baseline, and increased risks of hospital death (OR 6.65) and multiorgan dysfunction syndrome (OR 4.18) with severe bleeding during aortic surgery.34
In addition, the pathway by which the beta-blocker is metabolized may also affect outcome, with less benefit from beta-blockers metabolized by the CYP2D6 isoenzyme of the cytochrome P450 system. Individual variations in CYP2D6 activity related to genetics or drug interactions may result in insufficient or excessive beta-blockade. Because metoprolol is the most dependent on this system, patients using it may be more susceptible to bradycardia.35
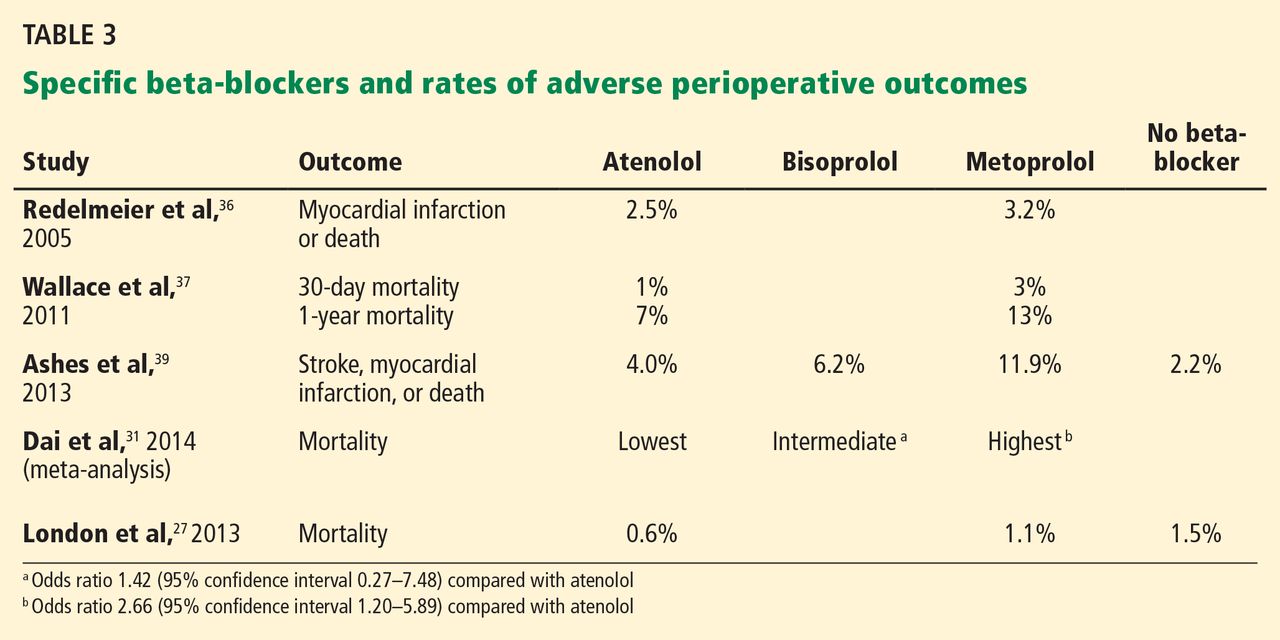
Studies comparing atenolol and metoprolol found that the atenolol groups had fewer myocardial infarctions and deaths36 and lower 30-day and 1-year mortality rates37 than the groups on metoprolol. Studies comparing the three beta-blockers found better outcomes with atenolol and bisoprolol than with metoprolol—fewer strokes,38,39 a lower mortality rate,31 and a better composite outcome39 (Table 3 and Table 4).
START THE BETA-BLOCKER EARLY, TITRATE TO CONTROL THE HEART RATE
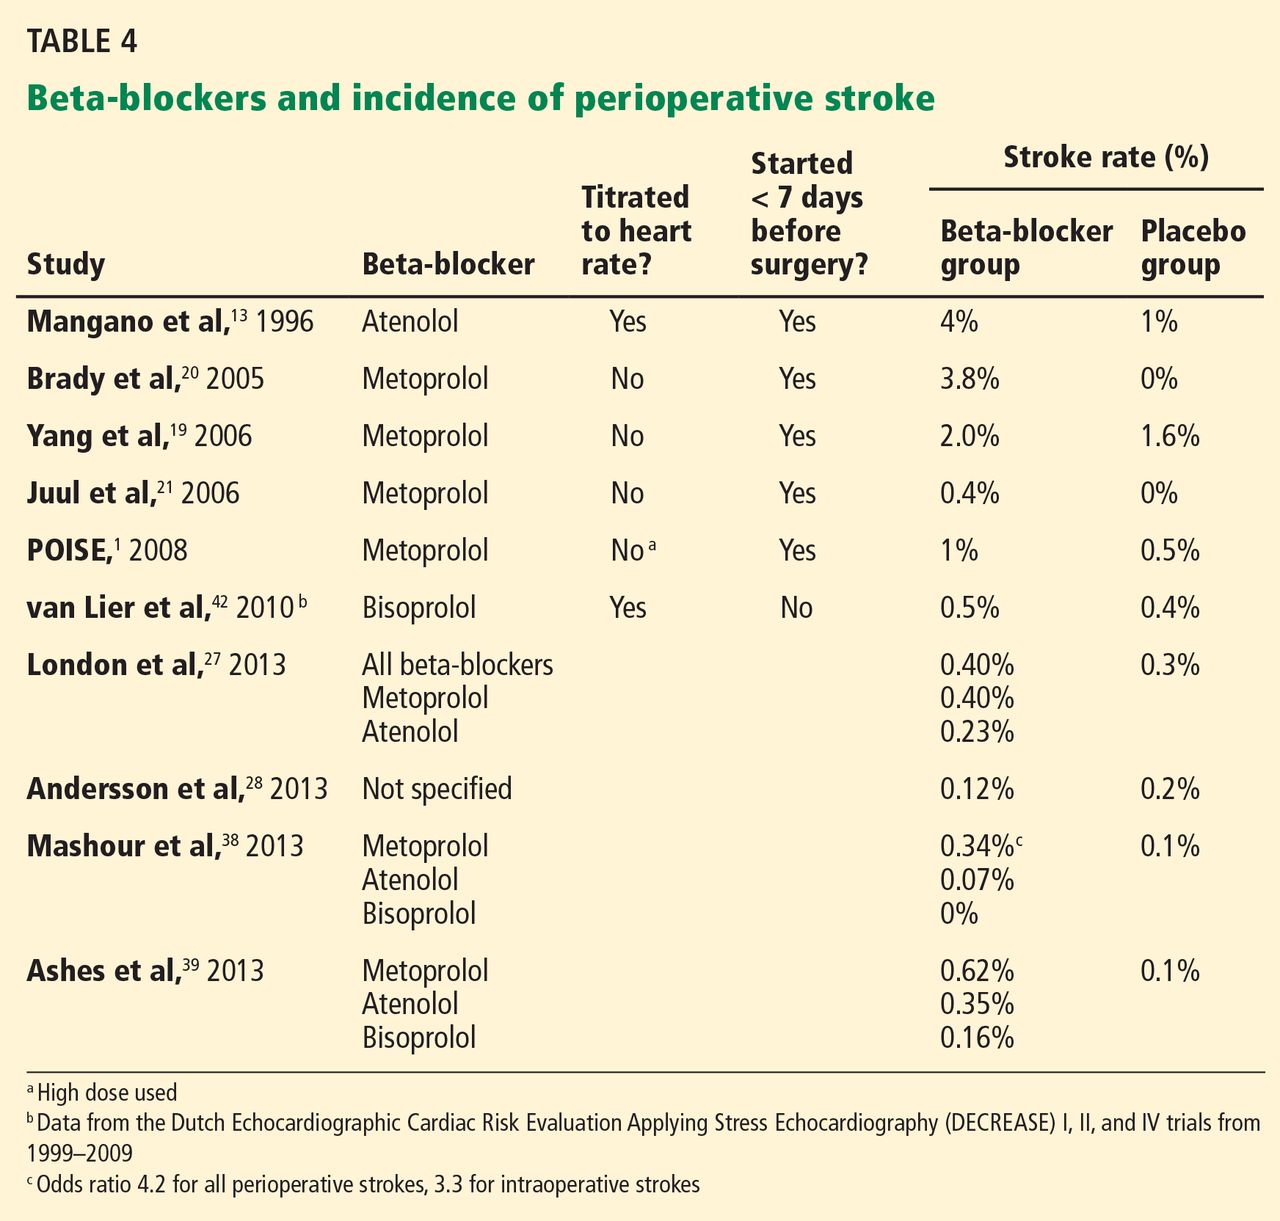
A number of studies suggest that how long the beta-blocker is given before surgery may influence the outcome (Table 5). The best results were achieved when beta-blockers were started approximately 1 month before surgery and titrated to control the heart rate.
Because this long lead-in time is not always practical, it is important to determine the shortest time before surgery in which starting beta-blockers may be beneficial and yet safe. Some evidence suggests that results are better when the beta-blocker is started more than 1 week preoperatively compared with less than 1 week, but it is unknown what the minimum or optimal time period should be.
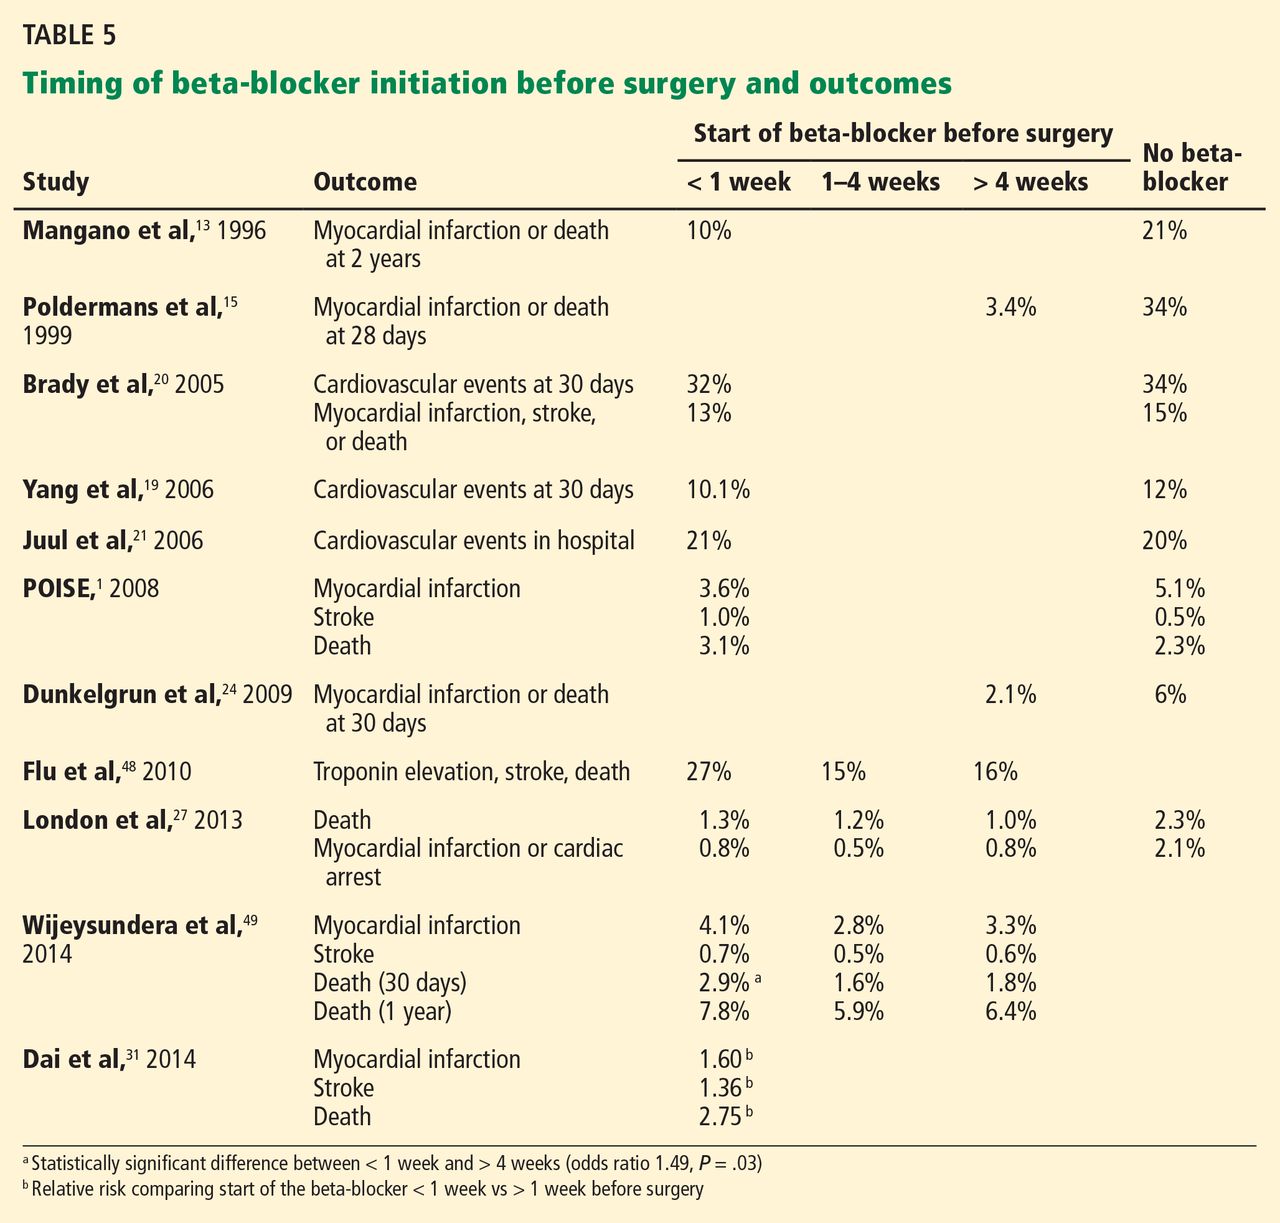
If a beta-blocker is started well in advance of the scheduled surgery, there is adequate time for dose titration and tighter heart rate control. Most of the studies demonstrating beneficial effects of perioperative beta-blockers used dose titration and achieved lower heart rates in the treatment group than in the control group. A criticism of the MaVs,19 POBBLE,20 and DIPOM21 trials was that the patients did not receive adequate beta-blockade. The POISE trial1 used a much higher dose of metoprolol in an attempt to assure beta-blockade without dose titration, and although the regimen decreased nonfatal myocardial infarctions, it increased strokes and the overall mortality rate, probably related to excess bradycardia and hypotension. The target heart rate should probably be between 55 and 70 beats per minute.
RISK OF STROKE
POISE1 was the first trial to note a clinically and statistically significant increase in strokes with perioperative beta-blocker use. Although no other study has shown a similar increased risk, almost all reported a higher number of strokes in the beta-blocker groups, although the absolute numbers and differences were small and not statistically significant. This risk may also vary from one beta-blocker to another (Table 4).
The usual incidence rate of postoperative stroke after noncardiac, noncarotid surgery is well under 1% in patients with no prior history of stroke but increases to approximately 3% in patients with a previous stroke.40 An observational study from the Dutch group reported a very low incidence of stroke overall (0.02%) in 186,779 patients undergoing noncardiac surgery with no significant difference in those on chronic beta-blocker therapy.41 The DECREASE trials, with a total of 3,884 patients, also found no statistically significant increase in stroke with beta-blocker use (0.46% overall vs 0.5% with a beta-blocker),42 which in this case was bisoprolol started well in advance of surgery and titrated to control the heart rate. Although the DECREASE data are under suspicion, they seem reasonable and consistent with those of observational studies.
Proposed mechanisms by which beta-blockers may increase stroke risk include the side effects of hypotension and bradycardia, particularly in the setting of anemia. They may also cause cerebral ischemia by blocking cerebral vasodilation. This effect on cerebral blood flow may be more pronounced with the less cardioselective beta-blockers, which may explain the apparent increased stroke risk associated with metoprolol.
WHAT SHOULD WE DO NOW?
The evidence for the safety and efficacy of beta-blockers in the perioperative setting continues to evolve, and new clinical trials are needed to clarify the ongoing controversy, particularly regarding the risk of stroke.
If patients have other indications for beta-blocker therapy, such as history of heart failure, myocardial infarction in the past 3 years, or atrial fibrillation for rate control, they should be receiving them if time permits.
If prophylactic beta-blockers are to be effective in minimizing perioperative complications, it appears that they may need to be more cardioselective, started at least 1 week before surgery, titrated to control heart rate, and used in high-risk patients (Revised Cardiac Risk Index score > 2 or 3) undergoing high-risk surgery.
Ideally, a large randomized controlled trial using a cardioselective beta-blocker started in advance of surgery in patients with a Revised Cardiac Risk Index score greater than 2, undergoing intermediate or high-risk procedures, is needed to fully answer the questions raised by the current data.
- POISE Study Group; Devereaux PJ, Yang H, Yusuf S, et al. Effects of extended-release metoprolol succinate in patients undergoing non-cardiac surgery (POISE trial): a randomised controlled trial. Lancet 2008; 371:1839–1847.
- Wijeysundera DN, Mamdani M, Laupacis A, et al. Clinical evidence, practice guidelines, and ß-blocker utilization before major noncardiac surgery. Circ Cardiovasc Qual Outcomes 2012; 5:558–565.
- American College of Cardiology; American Heart Association Task Force on Practice Guidelines (Writing Committee to Update the 2002 Guidelines on Perioperative Cardiovascular Evaluation for Noncardiac Surgery); American Society of Echocardiography; American Society of Nuclear Cardiology; Heart Rhythm Society; Society of Cardiovascular Anesthesiologists; Society for Cardiovascular Angiography and Interventions; Society for Vascular Medicine and Biology; Fleisher LA, Beckman JA, Brown KA, et al. ACC/AHA 2006 guideline update on perioperative cardiovascular evaluation for noncardiac surgery: focused update on perioperative beta-blocker therapy: a report of the American College of Cardiology/American Heart Association Task Force on Practice Guidelines (Writing Committee to Update the 2002 Guidelines on Perioperative Cardiovascular Evaluation for Noncardiac Surgery) developed in collaboration with the American Society of Echocardiography, American Society of Nuclear Cardiology, Heart Rhythm Society, Society of Cardiovascular Anesthesiologists, Society for Cardiovascular Angiography and Interventions, and Society for Vascular Medicine and Biology. J Am Coll Cardiol 2006; 47:2343–2355.
- Harte B, Jaffer AK. Perioperative beta-blockers in noncardiac surgery: evolution of the evidence. Cleve Clin J Med 2008; 75:513–519.
- Mangano DT. Perioperative cardiac morbidity. Anesthesiology 1990; 72:153–184.
- London MJ, Zaugg M, Schaub MC, Spahn DR. Perioperative beta-adrenergic receptor blockade: physiologic foundations and clinical controversies. Anesthesiology 2004; 100:170–175.
- Badner NH, Knill RL, Brown JE, Novick TV, Gelb AW. Myocardial infarction after noncardiac surgery. Anesthesiology 1998; 88:572–578.
- Priebe HJ. Triggers of perioperative myocardial ischaemia and infarction. Br J Anaesth 2004; 93:9–20.
- Zaugg M, Schaub MC, Foëx P. Myocardial injury and its prevention in the perioperative setting. Br J Anaesth 2004; 93:21–33.
- Zaugg M, Schaub MC, Pasch T, Spahn DR. Modulation of beta-adrenergic receptor subtype activities in perioperative medicine: mechanisms and sites of action. Br J Anaesth 2002; 88:101–123.
- Landesberg G. The pathophysiology of perioperative myocardial infarction: facts and perspectives. J Cardiothorac Vasc Anesth 2003; 17:90–100.
- Yeager MP, Fillinger MP, Hettleman BD, Hartman GS. Perioperative beta-blockade and late cardiac outcomes: a complementary hypothesis. J Cardiothorac Vasc Anesth 2005; 19:237–241.
- Mangano DT, Layug EL, Wallace A, Tateo I. Effect of atenolol on mortality and cardiovascular morbidity after noncardiac surgery. Multicenter Study of Perioperative Ischemia Research Group. N Engl J Med 1996; 335:1713–1720.
- Botto F, Alonso-Coello P, Chan MT, et al. Myocardial injury after noncardiac surgery: a large, international, prospective cohort study establishing diagnostic criteria, characteristics, predictors, and 30-day outcomes. Anesthesiology 2014; 120:564–578.
- Poldermans D, Boersma E, Bax JJ, et al. The effect of bisoprolol on perioperative mortality and myocardial infarction in high-risk patients undergoing vascular surgery. Dutch Echocardiographic Cardiac Risk Evaluation Applying Stress Echocardiography Study Group. N Engl J Med 1999; 341:1789–1794.
- Poldermans D, Boersma E, Bax JJ, et al; Dutch Echocardiographic Cardiac Risk Evaluation Applying Stress Echocardiography Study Group. Bisoprolol reduces cardiac death and myocardial infarction in high-risk patients as long as 2 years after successful major vascular surgery. Eur Heart J 2001; 22:1353–1358.
- Boersma E, Poldermans D, Bax JJ, et al; DECREASE Study Group (Dutch Echocardiographic Cardiac Risk Evaluation Applying Stress Echocardiogrpahy). Predictors of cardiac events after major vascular surgery: role of clinical characteristics, dobutamine echocardiography, and beta-blocker therapy. JAMA 2001; 285:1865–1873.
- Lee TH, Marcantonio ER, Mangione CM, et al. Derivation and prospective validation of a simple index for prediction of cardiac risk of major noncardiac surgery. Circulation 1999; 100:1043–1049.
- Yang H, Raymer K, Butler R, Parlow J, Roberts R. The effects of perioperative beta-blockade: results of the Metoprolol after Vascular Surgery (MaVS) study, a randomized controlled trial. Am Heart J 2006; 152:983–990.
- Brady AR, Gibbs JS, Greenhalgh RM, Powell JT, Sydes MR; POBBLE trial investigators. Perioperative beta-blockade (POBBLE) for patients undergoing infrarenal vascular surgery: results of a randomized double-blind controlled trial. J Vasc Surg 2005; 41:602–609.
- Juul AB, Wetterslev J, Gluud C, et al; DIPOM Trial Group. Effect of perioperative beta blockade in patients with diabetes undergoing major non-cardiac surgery: randomised placebo controlled, blinded multicentre trial. BMJ 2006; 332:1482.
- Lindenauer PK, Pekow P, Wang K, Mamidi DK, Gutierrez B, Benjamin EM. Perioperative beta-blocker therapy and mortality after major non-cardiac surgery. N Engl J Med 2005; 353:349–361.
- Feringa HH, Bax JJ, Boersma E, et al. High-dose beta-blockers and tight heart rate control reduce myocardial ischemia and troponin T release in vascular surgery patients. Circulation 2006; 114(suppl 1):1344–1349.
- Dunkelgrun M, Boersma E, Schouten O, et al; Dutch Echocardiographic Cardiac Risk Evaluation Applying Stress Echocardiography Study Group. Bisoprolol and fluvastatin for the reduction of perioperative cardiac mortality and myocardial infarction in intermediate-risk patients undergoing noncardiovascular surgery: a randomized controlled trial (DECREASE-IV). Ann Surg 2009; 249:921–926.
- American College of Cardiology Foundation/American Heart Association Task Force on Practice Guidelines; American Society of Echocardiography; American Society of Nuclear Cardiology; Heart Rhythm Society; Society of Cardiovascular Anesthesiologists; Society for Cardiovascular Angiography and Interventions; Society for Vascular Medicine; Society for Vascular Surgery; Fleisher LA, Beckman JA, Brown KA, et al. 2009 ACCF/AHA focused update on perioperative beta blockade incorporated into the ACC/AHA 2007 guidelines on perioperative cardiovascular evaluation and care for noncardiac surgery. J Am Coll Cardiol 2009; 54:e13–e118.
- Task Force for Preoperative Cardiac Risk Assessment and Perioperative Cardiac Management in Non-cardiac Surgery; European Society of Cardiology (ESC); Poldermans D, Bax JJ, Boersma E, et al. Guidelines for preoperative cardiac risk assessment and perioperative cardiac management in non-cardiac surgery. Eur Heart J 2009; 30:2769–2812.
- London MJ, Hur K, Schwartz GG, Henderson WG. Association of perioperative beta-blockade with mortality and cardiovascular morbidity following major noncardiac surgery. JAMA 2013; 309:1704–1713.
- Andersson C, Mérie C, Jørgensen M, et al. Association of beta-blocker therapy with risks of adverse cardiovascular events and deaths in patients with ischemic heart disease undergoing noncardiac surgery: a Danish nationwide cohort study. JAMA Intern Med 2014; 174:336–344.
- Bouri S, Shun-Shin MJ, Cole GD, Mayet J, Francis DP. Meta-analysis of secure randomised controlled trials of beta-blockade to prevent perioperative death in non-cardiac surgery. Heart 2014; 100:456–464.
- Guay J, Ochroch EA. Beta-blocking agents for surgery: influence on mortality and major outcomes. A meta-analysis. J Cardiothorac Vasc Anesth 2013; 27:834–844.
- Dai N, Xu D, Zhang J, et al. Different beta-blockers and initiation time in patients undergoing noncardiac surgery: a meta-analysis. Am J Med Sci 2014; 347:235–244.
- Baker JG. The selectivity of beta-adrenoceptor antagonists at the human beta1, beta2 and beta3 adrenoceptors. Br J Pharmacol 2005; 144:317–322.
- Beattie WS, Wijeysundera DN, Karkouti K, et al. Acute surgical anemia influences the cardioprotective effects of beta-blockade: a single-center, propensity-matched cohort study. Anesthesiology 2010; 112:25–33.
- Le Manach Y, Collins GS, Ibanez C, et al. Impact of perioperative bleeding on the protective effect of beta-blockers during infrarenal aortic reconstruction. Anesthesiology 2012; 117:1203–1211.
- Badgett RG, Lawrence VA, Cohn SL. Variations in pharmacology of beta-blockers may contribute to heterogeneous results in trials of perioperative beta-blockade. Anesthesiology 2010; 113:585–592.
- Redelmeier D, Scales D, Kopp A. Beta blockers for elective surgery in elderly patients: population based, retrospective cohort study. BMJ 2005; 331:932.
- Wallace AW, Au S, Cason BA. Perioperative beta-blockade: atenolol is associated with reduced mortality when compared to metoprolol. Anesthesiology 2011; 114:824–836.
- Mashour GA, Sharifpour M, Freundlich RE, et al. Perioperative metoprolol and risk of stroke after noncardiac surgery. Anesthesiology 2013; 119:1340–1346.
- Ashes C, Judelman S, Wijeysundera DN, et al. Selective beta1-antagonism with bisoprolol is associated with fewer postoperative strokes than atenolol or metoprolol: a single-center cohort study of 44,092 consecutive patients. Anesthesiology 2013; 119:777–787.
- Selim M. Perioperative stroke. N Engl J Med 2007; 356:706–713.
- van Lier F, Schouten O, van Domburg RT, et al. Effect of chronic beta-blocker use on stroke after noncardiac surgery. Am J Cardiol 2009; 104:429–433.
- van Lier F, Schouten O, Hoeks SE, et al. Impact of prophylactic beta-blocker therapy to prevent stroke after noncardiac surgery. Am J Cardiol 2010; 105:43–47.
- Devereaux PJ, Beattie WS, Choi PT, et al. How strong is the evidence for the use of perioperative beta blockers in non-cardiac surgery? Systematic review and meta-analysis of randomised controlled trials. BMJ 2005; 331:313–321.
- McGory ML, Maggard MA, Ko CY. A meta-analysis of perioperative beta blockade: what is the actual risk reduction? Surgery 2005; 138:171–179.
- Schouten O, Shaw LJ, Boersma E, et al. A meta-analysis of safety and effectiveness of perioperative beta-blocker use for the prevention of cardiac events in different types of noncardiac surgery. Coron Artery Dis 2006; 17:173–179.
- Wiesbauer F, Schlager O, Domanovits H, et al. Perioperative beta-blockers for preventing surgery-related mortality and morbidity: a systematic review and meta-analysis. Anesth Analg 2007; 104:27–41.
- Bangalore S, Wetterslev J, Pranesh S, Sawhney S, Gluud C, Messerli FH. Perioperative beta blockers in patients having non-cardiac surgery: a meta-analysis. Lancet 2008; 372:1962–1976.
- Flu WJ, van Kuijk JP, Chonchol M, et al. Timing of preoperative beta-blocker treatment in vascular surgery patients: influence on postoperative outcome. J Am Coll Cardiol 2010; 56:1922–1929.
- Wijeysundera DN, Beattie WS, Wijeysundera HC, Yun L, Austin PC, Ko DT. Duration of preoperative beta-blockade and outcomes after major elective noncardiac surgery. Can J Cardiol 2014; 30:217–223.
Prophylactic use of beta-blockers in the perioperative period is highly controversial. Initial studies in the 1990s were favorable, but evidence has been conflicting since then.
The pendulum swung away from routinely recommending beta-blockers after the publication of negative results from several studies, including the Perioperative Ischemic Evaluation (POISE) trial in 2008.1 Highlighting this change in practice, a Canadian study2 found that the use of perioperative beta-blockade increased between 1999 and 2005 but subsequently declined from 2005 to 2010. However, there was no appreciable change in this pattern after the POISE trial or after changes in the American College of Cardiology guidelines in 2002 and 2006.3
In 2008, Harte and Jaffer reviewed the perioperative use of beta-blockers in noncardiac surgery in this journal.4 Since then, a number of meta-analyses and retrospective observational studies have reported variable findings related to specific beta-blockers and specific complications.
In this paper, we review the rationale and recent evidence for and against the perioperative use of beta-blockers as guidance for internists and hospitalists.
POTENTIAL CARDIOPROTECTIVE EFFECTS OF BETA-BLOCKERS
Myocardial infarction and unstable angina are the leading cardiovascular causes of death after surgery.5 These events are multifactorial. Some are caused by the stress of surgery, which precipitates physiologic changes related to inflammatory mediators, sympathetic tone, and oxygen supply and demand; others are caused by acute plaque rupture, thrombosis, and occlusion.6 Most perioperative infarcts are non-Q-wave events7 and occur within the first 2 days after the procedure, when the effects of anesthetics, pain, fluid shifts, and physiologic changes are greatest. Because multiple causes may contribute to perioperative myocardial infarction, a single preventive strategy may not be sufficient.8,9
Beta-blockers do several things that may be beneficial in the perioperative setting. They reduce myocardial oxygen demand by decreasing the force of contraction and by slowing the heart rate, and slowing the heart rate increases diastolic perfusion time.10 They suppress arrhythmias; they limit leukocyte recruitment, the production of free radicals, metalloproteinase activity, monocyte activation, release of growth factors, and inflammatory cytokine response; and they stabilize plaque.11 Their long-term use may also alter intracellular signaling processes, thus improving cell survival by decreasing the expression of receptors for substances that induce apoptosis.12
INITIAL POSITIVE TRIALS
Mangano et al13 began the beta-blocker trend in 1996 with a study in 200 patients known to have coronary artery disease or risk factors for it who were undergoing noncardiac surgery. Patients were randomized to receive either atenolol orally and intravenously, titrated to control the heart rate, or placebo in the immediate perioperative period.
The atenolol group had less perioperative ischemia but no difference in short-term rates of myocardial infarction and death. However, the death rate was lower in the atenolol group at 6 months after discharge and at 2 years, although patients who died in the immediate postoperative period were excluded from the analysis.
Although this finding did not appear to make sense physiologically, we now know that patients may experience myocardial injury without infarction after noncardiac surgery, a phenomenon associated with an increased risk of death in the short term and the long term.14 Preventing these episodes may be the explanation for the improved outcome.
The DECREASE trial15 (Dutch Echocardiographic Cardiac Risk Evaluation Applying Stress Echocardiography) provided additional support for beta-blocker use. The patients were at high risk, had abnormal dobutamine stress echocardiograms, and were undergoing vascular surgery; 112 patients were randomized to receive either oral bisoprolol (started 1 month before surgery, titrated to control the heart rate, and continued for 1 month after surgery) or placebo.
The study was stopped early because the bisoprolol group reportedly had a 90% lower rate of myocardial infarction and cardiac death 1 month after surgery. However, the study was criticized because the total number of patients enrolled was small and the benefit was much greater than usual for any pharmacologic intervention, thus calling the results into question.
In a follow-up study,16 survivors continued to be followed while receiving bisoprolol or usual care. The incidence of myocardial infarction or cardiac death at 2 years was significantly lower in the group receiving bisoprolol (12% vs 32%, odds ratio [OR] 0.30, P = .025).
Boersma et al,17 in an observational study, analyzed data from all 1,351 patients scheduled for major vascular surgery being considered for enrollment in the DECREASE trial. The DECREASE protocol required patients to undergo dobutamine stress echocardiography if they had one or more risk factors (age 70 or older, angina, prior myocardial infarction, congestive heart failure, treatment for ventricular arrhythmia, treatment for diabetes mellitus, or limited exercise capacity) or if their physician requested it. Twenty-seven percent received beta-blockers.
In multivariate analysis, clinical predictors of adverse outcome were age 70 or older; current or prior history of angina; and prior myocardial infarction, heart failure, or cerebrovascular accident.
In patients who had fewer than three clinical risk factors, beta-blocker use was associated with a lower rate of complications (0.8% vs 2.3%). Dobutamine stress echocardiography had minimal predictive value in this lower-risk group, suggesting that stress testing may not be necessary in this group if beta-blockers are used appropriately. However, in patients who had three or more risk factors, this test did provide additional prognostic information; those without stress-induced ischemia had lower event rates than those with ischemia, and beta-blocker use further reduced those rates, except in patients with extensive ischemia (more than five left ventricular segments involved).
The Revised Cardiac Risk Index. Lee et al18 devised an index to assist in preoperative cardiac risk stratification that was subsequently incorporated into the 2007 American College of Cardiology/American Heart Association preoperative risk guidelines. (It does not, however, address the beta-blocker issue.) It consists of six independent risk-predictors of major cardiac complications derived from 4,315 patients over age 50 undergoing non-cardiac surgery. The risk factors, each of which is given 1 point, are:
- Congestive heart failure based on history or examination
- Renal insufficiency (serum creatinine level > 2 mg/dL)
- Myocardial infarction, symptomatic ischemic heart disease, or a positive stress test
- History of transient ischemic attack or stroke
- Diabetes requiring insulin
- High-risk surgery (defined as intrathoracic, intra-abdominal, or suprainguinal vascular surgery).
Patients with 3 or more points are considered to be at high risk, and those with 1 or 2 points are considered to be at intermediate risk. The American College of Cardiology/American Heart Association preoperative cardiac risk algorithm subsequently included five of these six risk factors (the type of surgery was considered separately) and made recommendations concerning noninvasive stress testing and heart rate control.
On the basis of these studies, specialty societies, guideline committees, and hospitals enthusiastically recommended the prophylactic use of beta-blockers to decrease postoperative cardiac complications.
THREE NEGATIVE TRIALS OF METOPROLOL
In 2005 and 2006, two studies in vascular surgery patients and another in patients with diabetes cast doubt on the role of beta-blockers when the results failed to show a benefit. The trials used metoprolol, started shortly before surgery, and with no titration to control the heart rate.
The MaVS study19 (Metoprolol After Vascular Surgery) randomized 496 patients to receive metoprolol or placebo 2 hours before surgery and until hospital discharge or a maximum of 5 days after surgery. The metoprolol dose varied by weight: patients weighing 75 kg or more got 100 mg, those weighing between 40 and 75 kg got 50 mg, and those weighing less than 40 kg got 25 mg. Overall effects at 6 months were not significantly different, but intraoperative bradycardia and hypotension requiring intervention were more frequent in the metoprolol group.
The POBBLE study20 (Perioperative Beta Blockade) randomized 103 patients who had no history of myocardial infarction to receive either metoprolol 50 mg twice daily or placebo from admission to 7 days after surgery. Myocardial ischemia was present in one-third of the patients after surgery. Metoprolol did not reduce the 30-day cardiac mortality rate, but it was associated with a shorter length of stay.
The DIPOM trial21 (Diabetic Postoperative Mortality and Morbidity) randomized 921 diabetic patients to receive long-acting metoprolol succinate controlled-release/extended release (CR/XL) or placebo. Patients in the metoprolol group received a test dose of 50 mg the evening before surgery, another dose 2 hours before surgery (100 mg if the heart rate was more than 65 bpm, or 50 mg if between 55 and 65 bpm), and daily thereafter until discharge or a maximum of 8 days. The dose was not titrated to heart-rate control.
Metoprolol had no statistically significant effect on the composite primary outcome measures of time to death from any cause, acute myocardial infarction, unstable angina, or congestive heart failure or on the secondary outcome measures of time to death from any cause, death from a cardiac cause, and nonfatal cardiac morbidity.
ADDITIONAL POSITIVE STUDIES
Lindenauer et al22 retrospectively evaluated the use of beta-blockers in the first 2 days after surgery in 782,969 patients undergoing non-cardiac surgery. Using propensity score matching and Revised Cardiac Risk Index scores, they found a lower rate of postoperative mortality in patients with three or more risk factors who received a beta-blocker. There was no significant difference in the group with two risk factors, but in the lowest-risk group (with a score of 0 to 1), beta-blockers were not beneficial and may have been associated with harm as evidenced by a higher odds ratio for death, although this was probably artifactual and reflecting database limitations.
Feringa et al,23 in an observational cohort study of 272 patients undergoing vascular surgery, reported that higher doses of beta-blockers and tight heart-rate control were associated with less perioperative myocardial ischemia, lower troponin T levels, and better long-term outcome.
THE POISE TRIAL: MIXED RESULTS
The randomized POISE trial,1 published in 2008, compared the effects of extended-release metoprolol succinate vs placebo on the 30-day risk of major cardiovascular events in 8,351 patients with or at risk of atherosclerotic disease who were undergoing noncardiac surgery. The metoprolol regimen was 100 mg 2 to 4 hours before surgery, another 100 mg by 6 hours after surgery, and then 200 mg 12 hours later and once daily for 30 days.
The incidence of the composite primary end point of cardiovascular death, nonfatal myocardial infarction, and nonfatal cardiac arrest at 30 days was lower in the metoprolol group than in the placebo group (5.8% vs 6.9%; P = .04), primarily because of fewer nonfatal myocardial infarctions. However, more patients in the metoprolol group died of any cause (3.1% vs 2.3% P = .03) or had a stroke (1.0% vs 0.5% P = .005) than in the placebo group.
The metoprolol group had a higher incidence of clinically significant hypotension, bradycardia, and stroke, which could account for much of the increase in the mortality rate. Sepsis was the major cause of death in this group; hypotension may have increased the risk of infection, and beta-blockers may have potentiated hypotension in patients who were already septic. Also, the bradycardic and negative inotropic effects of the beta-blocker could have masked the physiologic response to systemic infection, thereby delaying recognition and treatment or impeding the normal immune response.
One of the major criticisms of the POISE trial was its aggressive dosing regimen (200 to 400 mg within a 36-hour period) in patients who had not been on beta-blockers before then. Also, the drug was started only a few hours before surgery. In addition, these patients were at higher risk of death and stroke than those in other trials based on a high baseline rate of cerebrovascular disease, and inclusion of urgent and emergency surgical procedures.
STUDIES SINCE POISE
The POISE trial results1 prompted further questioning of the prophylactic perioperative use of beta-blockers. However, proponents of beta-blockers voiced serious criticisms of the trial, particularly the dosing regimen, and continued to believe that these drugs were beneficial if used appropriately.
The DECREASE IV trial. Dunkelgrun et al,24 in a study using bisoprolol started approximately 1 month before surgery and titrated to control the heart rate, reported beneficial results in intermediate-risk patients. In their randomized open-label study with a 2 × 2 factorial design, 1,066 patients at intermediate cardiac risk were assigned to receive bisoprolol, fluvastatin, combination treatment, or control therapy at least 34 days before surgery. Bisoprolol was started at 2.5 mg orally daily and slowly titrated up to a maximum dose of 10 mg to keep the heart rate between 50 and 70 beats per minute. The group of 533 patients randomized to receive bisoprolol had a lower incidence rate of cardiac death and nonfatal myocardial infarction than the control group (2.1% vs 6.0%, HR 0.34, P = .002). A potential limitation of this study was its open-label design, which might have led to treatment bias.
Updated guidelines. Based on the results from POISE and DECREASE IV, the American College of Cardiology Foundation/American Heart Association Task Force on Practice Guidelines25 published a focused update on beta-blockers in 2009 as an amendment to their 2007 guidelines on perioperative evaluation and care for noncardiac surgery. The European Society of Cardiology26 released similar but somewhat more liberal guidelines (Table 1).
London et al,27 in an observational study published in 2013, found a lower 30-day overall mortality rate with beta-blockers (relative risk [RR] 0.73, 95% confidence interval [CI] 0.65–0.83, P < .001, number needed to treat [NNT] 241), as well as a lower rate of cardiac morbidity (nonfatal myocardial infarction and cardiac death), but only in nonvascular surgery patients who were on beta-blockers within 7 days of scheduled surgery. Moreover, similar to the findings of Lindenauer et al,22 only patients with a Revised Cardiac Risk Index score of 2 or more benefited from beta-blocker use in terms of a lower risk of death, whereas the lower-risk patients did not:
- Risk score of 0 or 1—no association
- Score of 2—RR 0.63, 95% CI 0.50–0.80, P < .001, NNT 105
- Score of 3—RR 0.54, 95% CI 0.39–0.73, P < .001, NNT 41
- Score of 4 or more—RR 0.40, 95% CI 0.24–0.73, P < .001, NNT 18).
Beta-blocker exposure was associated with a significantly lower rate of cardiac complications (RR 0.67, 95% CI 0.57–0.79, P < .001, NNT 339), also limited to nonvascular surgery patients with a risk score of 2 or 3.
The Danish Nationwide Cohort Study28 examined the effect of beta-blockers on major adverse cardiac events (MACE, ie, myocardial infarction, cerebrovascular accident, and death) in 28,263 patients with ischemic heart disease undergoing noncardiac surgery; 7,990 with heart failure and 20,273 without. Beta-blockers were used in 53% of patients with heart failure and 36% of those without heart failure. Outcomes for all of the beta-blocker recipients:
- MACE—HR 0.90, 95% CI 0.79–1.02
- All-cause mortality—HR 0.95, 95% CI 0.85–1.06.
Outcomes for patients with heart failure if they received beta-blockers:
- MACE—HR 0.75, 95% CI 0.70–0.87
- All-cause mortality—HR 0.80, 95% CI 0.70–0.92.
There was no significant benefit from beta-blockers in patients without heart failure. Outcomes for those patients if they received beta-blockers:
- MACE—HR 1.11, 95% CI 0.92–1.33
- All-cause mortality—HR 1.15, 95% CI 0.98–1.35.
However, in patients without heart failure but with a history of myocardial infarction within the past 2 years, beta-blockers were associated with a lower risk of MACE and all-cause mortality. In patients with neither heart failure nor a recent myocardial infarction, beta-blockers were associated with an increased risk of MACE and all-cause mortality.
This difference in efficacy depending on the presence and timing of a prior myocardial infarction is consistent with the 2012 American College of Cardiology/American Heart Association guidelines for secondary prevention, in which beta-blockers are given a class I recommendation only for patients with a myocardial infarction within the past 3 years.
Meta-analyses and outcomes
A number of meta-analyses have been published over the past 10 years, with conflicting results (Table 2). The divergent findings are primarily due to the different studies included in the analyses as well as the strong influence of the POISE trial.1 The studies varied in terms of the specific beta-blocker used, dose titration and heart rate control, time of initiation of beta-blocker use before surgery, type of surgery, patient characteristics, comorbidities, biomarkers and diagnosis of myocardial infarction, and clinical end points.
In general, these meta-analyses have found that prophylactic perioperative use of beta-blockers decreases ischemia and tends to reduce the risk of nonfatal myocardial infarction. They vary on whether the overall mortality risk is decreased. The meta-analyses that included POISE1 found an increased incidence of stroke, whereas those that excluded POISE found no significant difference, although there appeared to be slightly more strokes in the beta-blocker groups.
The beta-blocker controversy increased even further when Dr. Don Poldermans was fired by Erasmus Medical Center in November 2011 for violations of academic integrity involving his research, including the DECREASE trials. The most recent meta-analysis, by Bouri et al,29 included nine “secure trials” and excluded the DECREASE trials in view of the controversy about their authenticity. The analysis showed an increase in overall mortality as well as stroke, primarily because it was heavily influenced by POISE.1 In contrast, the DECREASE trials had reported a decreased risk of myocardial infarction and death, with no significant increase in stroke. The authors concluded that guideline bodies should “retract their recommendations based on the fictitious data without further delay.”29
Although the design of the DECREASE trials (in which beta-blockers were started well in advance of surgery and doses were titrated to achieve heart rate control) is physiologically more compelling than those of the negative trials, the results have been questioned in light of the integrity issue. However, to date, none of the published DECREASE trials have been retracted.
Two other meta-analyses,30,31 published in 2013, also found a decreased risk of myocardial infarction and increased risk of stroke but no significant difference in short-term all-cause mortality.
ARE ALL BETA-BLOCKERS EQUIVALENT?
In various studies evaluating specific beta-blockers, the more cardioselective agents bisoprolol and atenolol were associated with better outcomes than metoprolol. The affinity ratios for beta-1/beta-2 receptors range from 13.5 for bisoprolol to 4.7 for atenolol and 2.3 for metoprolol.32 Blocking beta-1 receptors blunts tachycardia, whereas blocking beta-2 receptors may block systemic or cerebral vasodilation.
In patients with anemia, beta-blockade in general may be harmful, but beta-2 blockade may be even worse. Beta-blockers were associated with an increased risk of MACE (6.5% vs 3.0%)33 in patients with acute surgical anemia if the hemoglobin concentration decreased to less than 35% of baseline, and increased risks of hospital death (OR 6.65) and multiorgan dysfunction syndrome (OR 4.18) with severe bleeding during aortic surgery.34
In addition, the pathway by which the beta-blocker is metabolized may also affect outcome, with less benefit from beta-blockers metabolized by the CYP2D6 isoenzyme of the cytochrome P450 system. Individual variations in CYP2D6 activity related to genetics or drug interactions may result in insufficient or excessive beta-blockade. Because metoprolol is the most dependent on this system, patients using it may be more susceptible to bradycardia.35
Studies comparing atenolol and metoprolol found that the atenolol groups had fewer myocardial infarctions and deaths36 and lower 30-day and 1-year mortality rates37 than the groups on metoprolol. Studies comparing the three beta-blockers found better outcomes with atenolol and bisoprolol than with metoprolol—fewer strokes,38,39 a lower mortality rate,31 and a better composite outcome39 (Table 3 and Table 4).
START THE BETA-BLOCKER EARLY, TITRATE TO CONTROL THE HEART RATE
A number of studies suggest that how long the beta-blocker is given before surgery may influence the outcome (Table 5). The best results were achieved when beta-blockers were started approximately 1 month before surgery and titrated to control the heart rate.
Because this long lead-in time is not always practical, it is important to determine the shortest time before surgery in which starting beta-blockers may be beneficial and yet safe. Some evidence suggests that results are better when the beta-blocker is started more than 1 week preoperatively compared with less than 1 week, but it is unknown what the minimum or optimal time period should be.
If a beta-blocker is started well in advance of the scheduled surgery, there is adequate time for dose titration and tighter heart rate control. Most of the studies demonstrating beneficial effects of perioperative beta-blockers used dose titration and achieved lower heart rates in the treatment group than in the control group. A criticism of the MaVs,19 POBBLE,20 and DIPOM21 trials was that the patients did not receive adequate beta-blockade. The POISE trial1 used a much higher dose of metoprolol in an attempt to assure beta-blockade without dose titration, and although the regimen decreased nonfatal myocardial infarctions, it increased strokes and the overall mortality rate, probably related to excess bradycardia and hypotension. The target heart rate should probably be between 55 and 70 beats per minute.
RISK OF STROKE
POISE1 was the first trial to note a clinically and statistically significant increase in strokes with perioperative beta-blocker use. Although no other study has shown a similar increased risk, almost all reported a higher number of strokes in the beta-blocker groups, although the absolute numbers and differences were small and not statistically significant. This risk may also vary from one beta-blocker to another (Table 4).
The usual incidence rate of postoperative stroke after noncardiac, noncarotid surgery is well under 1% in patients with no prior history of stroke but increases to approximately 3% in patients with a previous stroke.40 An observational study from the Dutch group reported a very low incidence of stroke overall (0.02%) in 186,779 patients undergoing noncardiac surgery with no significant difference in those on chronic beta-blocker therapy.41 The DECREASE trials, with a total of 3,884 patients, also found no statistically significant increase in stroke with beta-blocker use (0.46% overall vs 0.5% with a beta-blocker),42 which in this case was bisoprolol started well in advance of surgery and titrated to control the heart rate. Although the DECREASE data are under suspicion, they seem reasonable and consistent with those of observational studies.
Proposed mechanisms by which beta-blockers may increase stroke risk include the side effects of hypotension and bradycardia, particularly in the setting of anemia. They may also cause cerebral ischemia by blocking cerebral vasodilation. This effect on cerebral blood flow may be more pronounced with the less cardioselective beta-blockers, which may explain the apparent increased stroke risk associated with metoprolol.
WHAT SHOULD WE DO NOW?
The evidence for the safety and efficacy of beta-blockers in the perioperative setting continues to evolve, and new clinical trials are needed to clarify the ongoing controversy, particularly regarding the risk of stroke.
If patients have other indications for beta-blocker therapy, such as history of heart failure, myocardial infarction in the past 3 years, or atrial fibrillation for rate control, they should be receiving them if time permits.
If prophylactic beta-blockers are to be effective in minimizing perioperative complications, it appears that they may need to be more cardioselective, started at least 1 week before surgery, titrated to control heart rate, and used in high-risk patients (Revised Cardiac Risk Index score > 2 or 3) undergoing high-risk surgery.
Ideally, a large randomized controlled trial using a cardioselective beta-blocker started in advance of surgery in patients with a Revised Cardiac Risk Index score greater than 2, undergoing intermediate or high-risk procedures, is needed to fully answer the questions raised by the current data.
- POISE Study Group; Devereaux PJ, Yang H, Yusuf S, et al. Effects of extended-release metoprolol succinate in patients undergoing non-cardiac surgery (POISE trial): a randomised controlled trial. Lancet 2008; 371:1839–1847.
- Wijeysundera DN, Mamdani M, Laupacis A, et al. Clinical evidence, practice guidelines, and ß-blocker utilization before major noncardiac surgery. Circ Cardiovasc Qual Outcomes 2012; 5:558–565.
- American College of Cardiology; American Heart Association Task Force on Practice Guidelines (Writing Committee to Update the 2002 Guidelines on Perioperative Cardiovascular Evaluation for Noncardiac Surgery); American Society of Echocardiography; American Society of Nuclear Cardiology; Heart Rhythm Society; Society of Cardiovascular Anesthesiologists; Society for Cardiovascular Angiography and Interventions; Society for Vascular Medicine and Biology; Fleisher LA, Beckman JA, Brown KA, et al. ACC/AHA 2006 guideline update on perioperative cardiovascular evaluation for noncardiac surgery: focused update on perioperative beta-blocker therapy: a report of the American College of Cardiology/American Heart Association Task Force on Practice Guidelines (Writing Committee to Update the 2002 Guidelines on Perioperative Cardiovascular Evaluation for Noncardiac Surgery) developed in collaboration with the American Society of Echocardiography, American Society of Nuclear Cardiology, Heart Rhythm Society, Society of Cardiovascular Anesthesiologists, Society for Cardiovascular Angiography and Interventions, and Society for Vascular Medicine and Biology. J Am Coll Cardiol 2006; 47:2343–2355.
- Harte B, Jaffer AK. Perioperative beta-blockers in noncardiac surgery: evolution of the evidence. Cleve Clin J Med 2008; 75:513–519.
- Mangano DT. Perioperative cardiac morbidity. Anesthesiology 1990; 72:153–184.
- London MJ, Zaugg M, Schaub MC, Spahn DR. Perioperative beta-adrenergic receptor blockade: physiologic foundations and clinical controversies. Anesthesiology 2004; 100:170–175.
- Badner NH, Knill RL, Brown JE, Novick TV, Gelb AW. Myocardial infarction after noncardiac surgery. Anesthesiology 1998; 88:572–578.
- Priebe HJ. Triggers of perioperative myocardial ischaemia and infarction. Br J Anaesth 2004; 93:9–20.
- Zaugg M, Schaub MC, Foëx P. Myocardial injury and its prevention in the perioperative setting. Br J Anaesth 2004; 93:21–33.
- Zaugg M, Schaub MC, Pasch T, Spahn DR. Modulation of beta-adrenergic receptor subtype activities in perioperative medicine: mechanisms and sites of action. Br J Anaesth 2002; 88:101–123.
- Landesberg G. The pathophysiology of perioperative myocardial infarction: facts and perspectives. J Cardiothorac Vasc Anesth 2003; 17:90–100.
- Yeager MP, Fillinger MP, Hettleman BD, Hartman GS. Perioperative beta-blockade and late cardiac outcomes: a complementary hypothesis. J Cardiothorac Vasc Anesth 2005; 19:237–241.
- Mangano DT, Layug EL, Wallace A, Tateo I. Effect of atenolol on mortality and cardiovascular morbidity after noncardiac surgery. Multicenter Study of Perioperative Ischemia Research Group. N Engl J Med 1996; 335:1713–1720.
- Botto F, Alonso-Coello P, Chan MT, et al. Myocardial injury after noncardiac surgery: a large, international, prospective cohort study establishing diagnostic criteria, characteristics, predictors, and 30-day outcomes. Anesthesiology 2014; 120:564–578.
- Poldermans D, Boersma E, Bax JJ, et al. The effect of bisoprolol on perioperative mortality and myocardial infarction in high-risk patients undergoing vascular surgery. Dutch Echocardiographic Cardiac Risk Evaluation Applying Stress Echocardiography Study Group. N Engl J Med 1999; 341:1789–1794.
- Poldermans D, Boersma E, Bax JJ, et al; Dutch Echocardiographic Cardiac Risk Evaluation Applying Stress Echocardiography Study Group. Bisoprolol reduces cardiac death and myocardial infarction in high-risk patients as long as 2 years after successful major vascular surgery. Eur Heart J 2001; 22:1353–1358.
- Boersma E, Poldermans D, Bax JJ, et al; DECREASE Study Group (Dutch Echocardiographic Cardiac Risk Evaluation Applying Stress Echocardiogrpahy). Predictors of cardiac events after major vascular surgery: role of clinical characteristics, dobutamine echocardiography, and beta-blocker therapy. JAMA 2001; 285:1865–1873.
- Lee TH, Marcantonio ER, Mangione CM, et al. Derivation and prospective validation of a simple index for prediction of cardiac risk of major noncardiac surgery. Circulation 1999; 100:1043–1049.
- Yang H, Raymer K, Butler R, Parlow J, Roberts R. The effects of perioperative beta-blockade: results of the Metoprolol after Vascular Surgery (MaVS) study, a randomized controlled trial. Am Heart J 2006; 152:983–990.
- Brady AR, Gibbs JS, Greenhalgh RM, Powell JT, Sydes MR; POBBLE trial investigators. Perioperative beta-blockade (POBBLE) for patients undergoing infrarenal vascular surgery: results of a randomized double-blind controlled trial. J Vasc Surg 2005; 41:602–609.
- Juul AB, Wetterslev J, Gluud C, et al; DIPOM Trial Group. Effect of perioperative beta blockade in patients with diabetes undergoing major non-cardiac surgery: randomised placebo controlled, blinded multicentre trial. BMJ 2006; 332:1482.
- Lindenauer PK, Pekow P, Wang K, Mamidi DK, Gutierrez B, Benjamin EM. Perioperative beta-blocker therapy and mortality after major non-cardiac surgery. N Engl J Med 2005; 353:349–361.
- Feringa HH, Bax JJ, Boersma E, et al. High-dose beta-blockers and tight heart rate control reduce myocardial ischemia and troponin T release in vascular surgery patients. Circulation 2006; 114(suppl 1):1344–1349.
- Dunkelgrun M, Boersma E, Schouten O, et al; Dutch Echocardiographic Cardiac Risk Evaluation Applying Stress Echocardiography Study Group. Bisoprolol and fluvastatin for the reduction of perioperative cardiac mortality and myocardial infarction in intermediate-risk patients undergoing noncardiovascular surgery: a randomized controlled trial (DECREASE-IV). Ann Surg 2009; 249:921–926.
- American College of Cardiology Foundation/American Heart Association Task Force on Practice Guidelines; American Society of Echocardiography; American Society of Nuclear Cardiology; Heart Rhythm Society; Society of Cardiovascular Anesthesiologists; Society for Cardiovascular Angiography and Interventions; Society for Vascular Medicine; Society for Vascular Surgery; Fleisher LA, Beckman JA, Brown KA, et al. 2009 ACCF/AHA focused update on perioperative beta blockade incorporated into the ACC/AHA 2007 guidelines on perioperative cardiovascular evaluation and care for noncardiac surgery. J Am Coll Cardiol 2009; 54:e13–e118.
- Task Force for Preoperative Cardiac Risk Assessment and Perioperative Cardiac Management in Non-cardiac Surgery; European Society of Cardiology (ESC); Poldermans D, Bax JJ, Boersma E, et al. Guidelines for preoperative cardiac risk assessment and perioperative cardiac management in non-cardiac surgery. Eur Heart J 2009; 30:2769–2812.
- London MJ, Hur K, Schwartz GG, Henderson WG. Association of perioperative beta-blockade with mortality and cardiovascular morbidity following major noncardiac surgery. JAMA 2013; 309:1704–1713.
- Andersson C, Mérie C, Jørgensen M, et al. Association of beta-blocker therapy with risks of adverse cardiovascular events and deaths in patients with ischemic heart disease undergoing noncardiac surgery: a Danish nationwide cohort study. JAMA Intern Med 2014; 174:336–344.
- Bouri S, Shun-Shin MJ, Cole GD, Mayet J, Francis DP. Meta-analysis of secure randomised controlled trials of beta-blockade to prevent perioperative death in non-cardiac surgery. Heart 2014; 100:456–464.
- Guay J, Ochroch EA. Beta-blocking agents for surgery: influence on mortality and major outcomes. A meta-analysis. J Cardiothorac Vasc Anesth 2013; 27:834–844.
- Dai N, Xu D, Zhang J, et al. Different beta-blockers and initiation time in patients undergoing noncardiac surgery: a meta-analysis. Am J Med Sci 2014; 347:235–244.
- Baker JG. The selectivity of beta-adrenoceptor antagonists at the human beta1, beta2 and beta3 adrenoceptors. Br J Pharmacol 2005; 144:317–322.
- Beattie WS, Wijeysundera DN, Karkouti K, et al. Acute surgical anemia influences the cardioprotective effects of beta-blockade: a single-center, propensity-matched cohort study. Anesthesiology 2010; 112:25–33.
- Le Manach Y, Collins GS, Ibanez C, et al. Impact of perioperative bleeding on the protective effect of beta-blockers during infrarenal aortic reconstruction. Anesthesiology 2012; 117:1203–1211.
- Badgett RG, Lawrence VA, Cohn SL. Variations in pharmacology of beta-blockers may contribute to heterogeneous results in trials of perioperative beta-blockade. Anesthesiology 2010; 113:585–592.
- Redelmeier D, Scales D, Kopp A. Beta blockers for elective surgery in elderly patients: population based, retrospective cohort study. BMJ 2005; 331:932.
- Wallace AW, Au S, Cason BA. Perioperative beta-blockade: atenolol is associated with reduced mortality when compared to metoprolol. Anesthesiology 2011; 114:824–836.
- Mashour GA, Sharifpour M, Freundlich RE, et al. Perioperative metoprolol and risk of stroke after noncardiac surgery. Anesthesiology 2013; 119:1340–1346.
- Ashes C, Judelman S, Wijeysundera DN, et al. Selective beta1-antagonism with bisoprolol is associated with fewer postoperative strokes than atenolol or metoprolol: a single-center cohort study of 44,092 consecutive patients. Anesthesiology 2013; 119:777–787.
- Selim M. Perioperative stroke. N Engl J Med 2007; 356:706–713.
- van Lier F, Schouten O, van Domburg RT, et al. Effect of chronic beta-blocker use on stroke after noncardiac surgery. Am J Cardiol 2009; 104:429–433.
- van Lier F, Schouten O, Hoeks SE, et al. Impact of prophylactic beta-blocker therapy to prevent stroke after noncardiac surgery. Am J Cardiol 2010; 105:43–47.
- Devereaux PJ, Beattie WS, Choi PT, et al. How strong is the evidence for the use of perioperative beta blockers in non-cardiac surgery? Systematic review and meta-analysis of randomised controlled trials. BMJ 2005; 331:313–321.
- McGory ML, Maggard MA, Ko CY. A meta-analysis of perioperative beta blockade: what is the actual risk reduction? Surgery 2005; 138:171–179.
- Schouten O, Shaw LJ, Boersma E, et al. A meta-analysis of safety and effectiveness of perioperative beta-blocker use for the prevention of cardiac events in different types of noncardiac surgery. Coron Artery Dis 2006; 17:173–179.
- Wiesbauer F, Schlager O, Domanovits H, et al. Perioperative beta-blockers for preventing surgery-related mortality and morbidity: a systematic review and meta-analysis. Anesth Analg 2007; 104:27–41.
- Bangalore S, Wetterslev J, Pranesh S, Sawhney S, Gluud C, Messerli FH. Perioperative beta blockers in patients having non-cardiac surgery: a meta-analysis. Lancet 2008; 372:1962–1976.
- Flu WJ, van Kuijk JP, Chonchol M, et al. Timing of preoperative beta-blocker treatment in vascular surgery patients: influence on postoperative outcome. J Am Coll Cardiol 2010; 56:1922–1929.
- Wijeysundera DN, Beattie WS, Wijeysundera HC, Yun L, Austin PC, Ko DT. Duration of preoperative beta-blockade and outcomes after major elective noncardiac surgery. Can J Cardiol 2014; 30:217–223.
KEY POINTS
- If patients have other indications for beta-blocker therapy, such as a history of heart failure, myocardial infarction in the past 3 years, or atrial fibrillation, they should be started on a beta-blocker before surgery if time permits.
- Of the various beta-blockers, the cardioselective ones appear to be preferable in the perioperative setting.
- Beta-blockers may need to be started at least 1 week before surgery, titrated to control the heart rate, and used only in patients at high risk (Revised Cardiac Risk Index score > 2 or 3) undergoing high-risk surgery.
- Further clinical trials are necessary to clarify the ongoing controversy, particularly regarding the risk of stroke, which was increased in the large Perioperative Ischemic Evaluation (POISE) trial.
LISTEN NOW: Clinical Decision-Making Live
This month’s podcast feature follows up a session at SHM’s annual meeting, HM14, on clinical decision making in which Dr. Gupreet Dhaliwal, professor of medicine at the University of California at San Francisco, diagnosed two complex patient cases presented by Dr. Daniel Brotman, director of the hospitalist program at Johns Hopkins Hospital. Dr. Dhaliwal says while rare and challenging cases are appealing, diagnosing common problems presented by many cases is a great way to demonstrate thinking through a diagnosis. He also discusses how cognitive bias can work in a doctor’s favor. Dr. Brotman explains why the teamwork on problem solving that happens at these live sessions is one of their best features.
For more features, visit The Hospitalist's podcast archive.
Woman With Blue-Gray Palate and Nail Beds
A 62-year-old African-American woman presented for evaluation of a bluish discoloration of the hard palate and nail beds, noticeable for several months. In addition, she had complaints of fatigue and arthralgia. She reported that she had been taking hydroxychloroquine 400 mg/d and quinacrine 100 mg/d for several years for the treatment of systemic lupus erythematosus (SLE). Her medical history was also significant for dry mouth syndrome treated with pilocarpine.
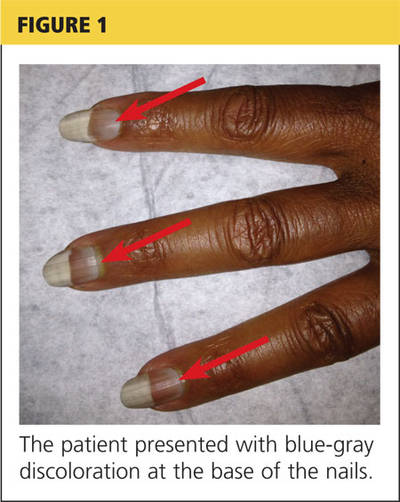
The patient’s vital signs included a temperature of 97°F;
respiratory rate, 15 breaths/min; pulse, 72 beats/min; and blood pressure, 130/80 mm Hg. Height was 62 in, weight was 189 lb, and BMI was 34.56. A bluish gray color was noted in the subungual areas of her nails (see Figure 1). There were several circumferential areas of skin hyperpigmentation resulting from healed lupus skin lesions on her arms. Nailfold capillaroscopy revealed several dilated blood vessels. The sclerae appeared dry, but no erythema or inflammation was noted.

Examination of the mouth revealed a bluish discoloration of the hard palate (see Figure 2) and decreased salivary pool. Respiratory, cardiovascular, and abdominal examination findings were normal. Musculoskeletal examination was unremarkable for acute joint tenderness or synovitis. Crepitation and bony changes were noted in the left knee, without effusion or decreased range of motion.
Laboratory studies were ordered, and the results are listed in the table.
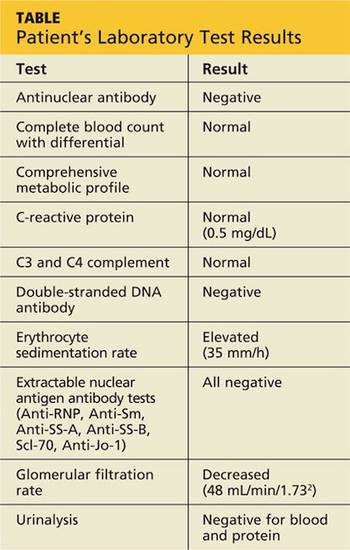
DISCUSSION
Hyperpigmentation of the oral mucosa can be associated with a number of conditions, including adrenal insufficiency, Peutz-Jeghers syndrome, hemochromatosis, polyostotic fibrous dysplasia, hyperparathyroidism, neurofibromatosis, and bronchogenic malignancy.1,2 Other causes of oral hyperpigmentation include physiologic pigmentary or postinflammatory changes, oral melanoacanthosis, blue nevus, and melanoma.2,3 While these diagnoses should be considered when encountering a mucosal lesion, they were unlikely in this patient because of the color changes in her nail beds.
Systemic skin and mucous membrane discoloration can also occur with the use of certain drugs and other substances, including chemotherapeutic agents, benzodiazepines, hormones, carotenoids, phenolphthalein, heavy metal salts, and several antimicrobial agents.1 In dark-skinned individuals, hyperpigmentation of the oral mucosa can be caused by a physiologic deposition of melanin.4
Pigmentary Changes
The use of antimalarial drugs, such as quinacrine, chloroquine, and hydroxychloroquine, has long been associated with pigmentary changes to the palatal mucosa and subungual areas.1,3 These drugs can stimulate melanin production and cause hemosiderin deposition, resulting in pigmentary changes.5 Skin discoloration is believed to be the result of the formation of a melanin-drug complex in areas with an elevated affinity for melanin.1 Besides malaria, these drugs are commonly used to treat SLE and discoid lupus erythematosus, rheumatoid arthritis, and other rheumatologic conditions.5
The diagnosis of drug-induced hyperpigmentation is generally clinical, supported by the patient’s history—which often includes the use of antimalarial drugs—and presentation.1 If a clear cause cannot be determined by clinical evaluation, then a biopsy to confirm a drug-induced cause may be necessary.2 A classic study by Tuffanelli et al reported that the onset of hyperpigmentation related to antimalarial drug therapy may not occur until 4 to 70 months after initiation of treatment.6 Once the offending drug is discontinued, pigmentation changes slowly fade but often do not completely resolve,7 and patients should be advised of this.
Ocular Retinopathy
While pigmentary changes associated with antimalarial drugs are benign,3 a rare but serious adverse effect of antimalarials is retinal toxicity. Ocular retinopathy related to chloroquine and hydroxychloroquine therapy has been well documented and may result in irreversible vision loss.8,9 The most recent recommendations from the American Academy of Ophthalmology suggest a baseline eye examination at initiation of antimalarial treatment and annual examinations starting after five years of therapy because the risk for toxicity relates to the cumulative dose.8 More frequent ophthalmologic evaluations are recommended for individuals at higher risk, such as those with preexisting retinal or macular disease.9
Outcome for the case patient >>
OUTCOME FOR THE CASE PATIENT
A biopsy of the roof of the patient’s mouth confirmed that the palatal hyperpigmentation was caused by her antimalarial medications. Since the patient displayed no evidence of active lupus skin lesions and laboratory results indicated that her SLE was inactive, one of the drugs, quinacrine, was discontinued.
The patient was referred for an ophthalmologic evaluation. No evidence of retinal toxicity was found.
Follow-up evaluations at two months and six months revealed no significant improvement in the discoloration of the patient’s oral mucosa or nail beds. At the six-month visit, her dosage of hydroxychloroquine was reevaluated.
The patient’s hydroxychloroquine dosage was determined based on 7.3 mg/kg/d. In the case of an overweight patient, especially one of shorter-than-average stature, hydroxychloroquine dosing should be based on ideal body weight to minimize the risk for overdosage; in general, a maximum dosage of 6.5 mg/kg/d is recommended.8,9 As a result, the patient’s dosage was decreased to 300 mg/d.
At her nine-month follow-up evaluation, the discoloration to the patient’s oral mucosa had faded but had not resolved completely (see Figure 3). No significant change was noted in the subungual discoloration. The patient had experienced no exacerbations of lupus-related symptoms since her medication adjustments.
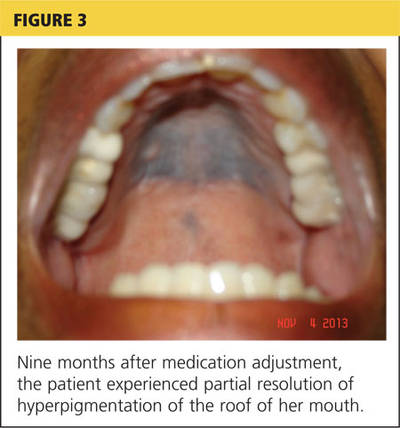
CONCLUSION
Although this patient’s hyperpigmentation was benign, staying alert to this potential adverse effect of antimalarial drugs is important in making a diagnosis. As with many skin lesions, if the clinical evaluation does not provide a clear cause, a biopsy may be needed. For anyone taking antimalarial drugs, regular ophthalmologic evaluations are recommended to facilitate early detection of the rare adverse effect of retinal toxicity. Nevertheless, with careful monitoring, antimalarial drugs are safe and effective for the treatment of inflammatory conditions such as SLE and rheumatoid arthritis.
REFERENCES
1. Kleinegger CL, Hammond HL, Finkelstein MW. Oral mucosal hyperpigmentation secondary to antimalarial drug therapy. Oral Surg Oral Med Oral Pathol Oral Radiol Endod. 2000;90(2):189-194.
2. Gondak R-O, da Silva-Jorge R, Jorge J, et al. Oral pigmented lesions: clinicopathologic features and review of the literature. Med Oral Pathol Oral Cir Bucal. 2012;17(6):e919-e924.
3. Lerman MA, Karimbux N, Guze KA, Woo SB. Pigmentation of the hard palate. Oral Surg Oral Med Oral Pathol Oral Radiol Endod. 2009;
107:8-12.
4. Kalampalikis A, Goetze S, Elsner P. Isolated hyperpigmentation of the oral mucosa due to hydroxychloroquine. J Dtsch Dermatol Ges. 2012; 10(12):921-922.
5. de Andrade BA, Fonseca FP, Pires FR, et al. Hard palate hyperpigmentation secondary to chronic chloroquine therapy: report of five cases.
J Cutan Pathol. 2013;40(9):833-838.
6. Tuffanelli D, Abraham RK, Dubois EI. Pigmentation from antimalarial therapy: its possible relationship to the ocular lesions. Arch Derm. 1963; 88:419-426.
7. Melikoglu MA, Melikoglu M, Gurbuz U, et al. Hydroxychloroquine-induced hyperpigmentation: a case report. J Clin Pharm Ther. 2008; 33(6):699-701.
8. Marmor MF, Kellner U, Lai YY, et al; American Academy of Ophthalmology. Revised recommendations on screening for chloroquine and hydroxychloroquine retinopathy. Ophthalmology. 2011;118(2):
415-422.
9. Screening for hydroxychloroquine retinopathy. Position statement, American College of Rheumatology. www.rheumatology.org/Practice/Clinical/Position/Position_Statements/. Accessed July 17, 2014.
A 62-year-old African-American woman presented for evaluation of a bluish discoloration of the hard palate and nail beds, noticeable for several months. In addition, she had complaints of fatigue and arthralgia. She reported that she had been taking hydroxychloroquine 400 mg/d and quinacrine 100 mg/d for several years for the treatment of systemic lupus erythematosus (SLE). Her medical history was also significant for dry mouth syndrome treated with pilocarpine.
The patient’s vital signs included a temperature of 97°F;
respiratory rate, 15 breaths/min; pulse, 72 beats/min; and blood pressure, 130/80 mm Hg. Height was 62 in, weight was 189 lb, and BMI was 34.56. A bluish gray color was noted in the subungual areas of her nails (see Figure 1). There were several circumferential areas of skin hyperpigmentation resulting from healed lupus skin lesions on her arms. Nailfold capillaroscopy revealed several dilated blood vessels. The sclerae appeared dry, but no erythema or inflammation was noted.
Examination of the mouth revealed a bluish discoloration of the hard palate (see Figure 2) and decreased salivary pool. Respiratory, cardiovascular, and abdominal examination findings were normal. Musculoskeletal examination was unremarkable for acute joint tenderness or synovitis. Crepitation and bony changes were noted in the left knee, without effusion or decreased range of motion.
Laboratory studies were ordered, and the results are listed in the table.
DISCUSSION
Hyperpigmentation of the oral mucosa can be associated with a number of conditions, including adrenal insufficiency, Peutz-Jeghers syndrome, hemochromatosis, polyostotic fibrous dysplasia, hyperparathyroidism, neurofibromatosis, and bronchogenic malignancy.1,2 Other causes of oral hyperpigmentation include physiologic pigmentary or postinflammatory changes, oral melanoacanthosis, blue nevus, and melanoma.2,3 While these diagnoses should be considered when encountering a mucosal lesion, they were unlikely in this patient because of the color changes in her nail beds.
Systemic skin and mucous membrane discoloration can also occur with the use of certain drugs and other substances, including chemotherapeutic agents, benzodiazepines, hormones, carotenoids, phenolphthalein, heavy metal salts, and several antimicrobial agents.1 In dark-skinned individuals, hyperpigmentation of the oral mucosa can be caused by a physiologic deposition of melanin.4
Pigmentary Changes
The use of antimalarial drugs, such as quinacrine, chloroquine, and hydroxychloroquine, has long been associated with pigmentary changes to the palatal mucosa and subungual areas.1,3 These drugs can stimulate melanin production and cause hemosiderin deposition, resulting in pigmentary changes.5 Skin discoloration is believed to be the result of the formation of a melanin-drug complex in areas with an elevated affinity for melanin.1 Besides malaria, these drugs are commonly used to treat SLE and discoid lupus erythematosus, rheumatoid arthritis, and other rheumatologic conditions.5
The diagnosis of drug-induced hyperpigmentation is generally clinical, supported by the patient’s history—which often includes the use of antimalarial drugs—and presentation.1 If a clear cause cannot be determined by clinical evaluation, then a biopsy to confirm a drug-induced cause may be necessary.2 A classic study by Tuffanelli et al reported that the onset of hyperpigmentation related to antimalarial drug therapy may not occur until 4 to 70 months after initiation of treatment.6 Once the offending drug is discontinued, pigmentation changes slowly fade but often do not completely resolve,7 and patients should be advised of this.
Ocular Retinopathy
While pigmentary changes associated with antimalarial drugs are benign,3 a rare but serious adverse effect of antimalarials is retinal toxicity. Ocular retinopathy related to chloroquine and hydroxychloroquine therapy has been well documented and may result in irreversible vision loss.8,9 The most recent recommendations from the American Academy of Ophthalmology suggest a baseline eye examination at initiation of antimalarial treatment and annual examinations starting after five years of therapy because the risk for toxicity relates to the cumulative dose.8 More frequent ophthalmologic evaluations are recommended for individuals at higher risk, such as those with preexisting retinal or macular disease.9
Outcome for the case patient >>
OUTCOME FOR THE CASE PATIENT
A biopsy of the roof of the patient’s mouth confirmed that the palatal hyperpigmentation was caused by her antimalarial medications. Since the patient displayed no evidence of active lupus skin lesions and laboratory results indicated that her SLE was inactive, one of the drugs, quinacrine, was discontinued.
The patient was referred for an ophthalmologic evaluation. No evidence of retinal toxicity was found.
Follow-up evaluations at two months and six months revealed no significant improvement in the discoloration of the patient’s oral mucosa or nail beds. At the six-month visit, her dosage of hydroxychloroquine was reevaluated.
The patient’s hydroxychloroquine dosage was determined based on 7.3 mg/kg/d. In the case of an overweight patient, especially one of shorter-than-average stature, hydroxychloroquine dosing should be based on ideal body weight to minimize the risk for overdosage; in general, a maximum dosage of 6.5 mg/kg/d is recommended.8,9 As a result, the patient’s dosage was decreased to 300 mg/d.
At her nine-month follow-up evaluation, the discoloration to the patient’s oral mucosa had faded but had not resolved completely (see Figure 3). No significant change was noted in the subungual discoloration. The patient had experienced no exacerbations of lupus-related symptoms since her medication adjustments.
CONCLUSION
Although this patient’s hyperpigmentation was benign, staying alert to this potential adverse effect of antimalarial drugs is important in making a diagnosis. As with many skin lesions, if the clinical evaluation does not provide a clear cause, a biopsy may be needed. For anyone taking antimalarial drugs, regular ophthalmologic evaluations are recommended to facilitate early detection of the rare adverse effect of retinal toxicity. Nevertheless, with careful monitoring, antimalarial drugs are safe and effective for the treatment of inflammatory conditions such as SLE and rheumatoid arthritis.
REFERENCES
1. Kleinegger CL, Hammond HL, Finkelstein MW. Oral mucosal hyperpigmentation secondary to antimalarial drug therapy. Oral Surg Oral Med Oral Pathol Oral Radiol Endod. 2000;90(2):189-194.
2. Gondak R-O, da Silva-Jorge R, Jorge J, et al. Oral pigmented lesions: clinicopathologic features and review of the literature. Med Oral Pathol Oral Cir Bucal. 2012;17(6):e919-e924.
3. Lerman MA, Karimbux N, Guze KA, Woo SB. Pigmentation of the hard palate. Oral Surg Oral Med Oral Pathol Oral Radiol Endod. 2009;
107:8-12.
4. Kalampalikis A, Goetze S, Elsner P. Isolated hyperpigmentation of the oral mucosa due to hydroxychloroquine. J Dtsch Dermatol Ges. 2012; 10(12):921-922.
5. de Andrade BA, Fonseca FP, Pires FR, et al. Hard palate hyperpigmentation secondary to chronic chloroquine therapy: report of five cases.
J Cutan Pathol. 2013;40(9):833-838.
6. Tuffanelli D, Abraham RK, Dubois EI. Pigmentation from antimalarial therapy: its possible relationship to the ocular lesions. Arch Derm. 1963; 88:419-426.
7. Melikoglu MA, Melikoglu M, Gurbuz U, et al. Hydroxychloroquine-induced hyperpigmentation: a case report. J Clin Pharm Ther. 2008; 33(6):699-701.
8. Marmor MF, Kellner U, Lai YY, et al; American Academy of Ophthalmology. Revised recommendations on screening for chloroquine and hydroxychloroquine retinopathy. Ophthalmology. 2011;118(2):
415-422.
9. Screening for hydroxychloroquine retinopathy. Position statement, American College of Rheumatology. www.rheumatology.org/Practice/Clinical/Position/Position_Statements/. Accessed July 17, 2014.