User login
Spontaneous Resorption of a Large Cervical Herniated Nucleus Pulposus
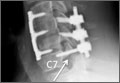
C7 Pars Fracture Subadjacent to C7 Pedicle Screw Instrumentation at the Caudal End of a Posterior Cervical Instrumentation Construct
The Effect of 3-Column Spinal Osteotomy on Anterior Pelvic Plane and Acetabulum Position
Spontaneous Septic Arthritis of the Lumbar Facet Caused by Methicillin-Resistant Staphylococcus aureus in an Otherwise Healthy Adolescent
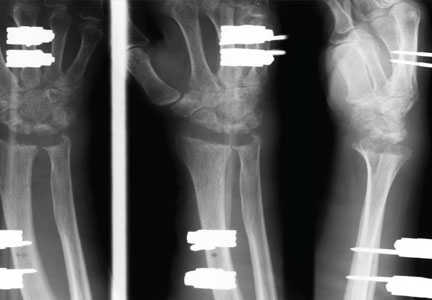
Palmar Shelf Arthroplasty for Rheumatoid Wrist Arthritis: Long-Term Follow-Up
A serious complication of a common stress test
To the Editor: We read with interest the article by Drs. Buitrago et al in the May 2014 issue of Cleveland Clinic Journal of Medicine, “Syncope during a pharmacologic nuclear stress test.”1 It highlights a known, serious interaction between adenosine and dipyridamole (the latter contained in the aspirin-dipyridamole combination Aggrenox) and associated asystole in patients undergoing pharmacologic cardiac stress testing. This interaction is known in the cardiology literature, as it was noted in the current guidelines for pharmacologic stress testing.2 However, I would like to discuss a few points with the authors for a better understanding of the case.
First, the underlying rhythm before the development of complete atrioventricular (AV) dissociation and asystole was significant for second-degree AV block (Mobitz type I, Wenckebach). Second- or third-degree AV block is considered a contraindication to adenosine because of the risk of exacerbating these conditions. This underlying AV nodal disease made dipyridamole not the only culprit. In addition, the patient had been on two agents (labetalol and clonidine) that have AV nodal-blocking properties. Electrolyte imbalances such as hypokalemia, hypomagnesemia, and hypocalcemia are another reason for delayed conduction and PR prolongation, and electrolyte levels should be checked and corrected properly before the stress test or coronary angiography. It would have been helpful if the authors had discussed these points for a better understanding of the drug-drug interaction.
Because of the increasing trend to admit patients with chest pain to observation units to rule out myocardial infarction, the case has a valuable teaching point, especially for hospitalists and emergency physicians in charge of patients admitted with chest pain.3 Since cardiologists rarely get involved in the care of these patients, careful review of medications before scheduling stress testing is of ultimate importance and should be emphasized in the discussion.
Lastly, the number of combined medications that are available commercially is increasing, which puts patients at higher risk of drug interactions. Hospitalists and internists taking care of patients, especially elderly patients, admitted from nursing homes and taking multiple medications should pay extra attention when reviewing medications with brand names.4,5 Furthermore, a 12-lead electrocardiogram should be reviewed, with special attention to the PR interval and QT segment. A pharmacy consultation could be valuable, especially in patients taking multiple drugs.6
- Buitrago I, Wolinsky D, Asher CR. Syncope during a pharmacologic nuclear stress test. Cleve Clin J Med 2014; 81:279–280.
- Henzlova MJ, Cerqueira MD, Mahmarian JJ, Yao SS; Quality Assurance Committee of the American Society of Nuclear Cardiology. Stress protocols and tracers. J Nucl Cardiol 2006; 13:e80–e90.
- Graff LG, Dallara J, Ross MA, et al. Impact on the care of the emergency department chest pain patient from the chest pain evaluation registry (CHEPER) study. Am J Cardiol 1997; 80:563–568.
- Samaras N, Chevalley T, Samaras D, Gold G. Older patients in the emergency department: a review. Ann Emerg Med 2010; 56:261–269.
- Steinman MA, Hanlon JT. Managing medications in clinically complex elders: “There’s got to be a happy medium.” JAMA 2010; 304:1592–1601.
- Scott IA, Gray LC, Martin JH, Mitchell CA. Minimizing inappropriate medications in older populations: a 10-step conceptual framework. Am J Med 2012; 125:529–537.
To the Editor: We read with interest the article by Drs. Buitrago et al in the May 2014 issue of Cleveland Clinic Journal of Medicine, “Syncope during a pharmacologic nuclear stress test.”1 It highlights a known, serious interaction between adenosine and dipyridamole (the latter contained in the aspirin-dipyridamole combination Aggrenox) and associated asystole in patients undergoing pharmacologic cardiac stress testing. This interaction is known in the cardiology literature, as it was noted in the current guidelines for pharmacologic stress testing.2 However, I would like to discuss a few points with the authors for a better understanding of the case.
First, the underlying rhythm before the development of complete atrioventricular (AV) dissociation and asystole was significant for second-degree AV block (Mobitz type I, Wenckebach). Second- or third-degree AV block is considered a contraindication to adenosine because of the risk of exacerbating these conditions. This underlying AV nodal disease made dipyridamole not the only culprit. In addition, the patient had been on two agents (labetalol and clonidine) that have AV nodal-blocking properties. Electrolyte imbalances such as hypokalemia, hypomagnesemia, and hypocalcemia are another reason for delayed conduction and PR prolongation, and electrolyte levels should be checked and corrected properly before the stress test or coronary angiography. It would have been helpful if the authors had discussed these points for a better understanding of the drug-drug interaction.
Because of the increasing trend to admit patients with chest pain to observation units to rule out myocardial infarction, the case has a valuable teaching point, especially for hospitalists and emergency physicians in charge of patients admitted with chest pain.3 Since cardiologists rarely get involved in the care of these patients, careful review of medications before scheduling stress testing is of ultimate importance and should be emphasized in the discussion.
Lastly, the number of combined medications that are available commercially is increasing, which puts patients at higher risk of drug interactions. Hospitalists and internists taking care of patients, especially elderly patients, admitted from nursing homes and taking multiple medications should pay extra attention when reviewing medications with brand names.4,5 Furthermore, a 12-lead electrocardiogram should be reviewed, with special attention to the PR interval and QT segment. A pharmacy consultation could be valuable, especially in patients taking multiple drugs.6
- Buitrago I, Wolinsky D, Asher CR. Syncope during a pharmacologic nuclear stress test. Cleve Clin J Med 2014; 81:279–280.
- Henzlova MJ, Cerqueira MD, Mahmarian JJ, Yao SS; Quality Assurance Committee of the American Society of Nuclear Cardiology. Stress protocols and tracers. J Nucl Cardiol 2006; 13:e80–e90.
- Graff LG, Dallara J, Ross MA, et al. Impact on the care of the emergency department chest pain patient from the chest pain evaluation registry (CHEPER) study. Am J Cardiol 1997; 80:563–568.
- Samaras N, Chevalley T, Samaras D, Gold G. Older patients in the emergency department: a review. Ann Emerg Med 2010; 56:261–269.
- Steinman MA, Hanlon JT. Managing medications in clinically complex elders: “There’s got to be a happy medium.” JAMA 2010; 304:1592–1601.
- Scott IA, Gray LC, Martin JH, Mitchell CA. Minimizing inappropriate medications in older populations: a 10-step conceptual framework. Am J Med 2012; 125:529–537.
In reply: A serious complication of a common stress test
In Reply: We appreciate the interest and comments of Dr. Alraies. We would like to clarify that the patient’s baseline electrocardiogram before the nuclear stress test was normal. Second-degree atrioventricular (AV) block (Mobitz type I) was evident only during adenosine infusion before ventricular asystole. The patient was on two AV nodal blockers (labetalol and clonidine) but had no underlying conduction disease. There is no contraindication to continuing these agents before pharmacologic stress testing. In addition, the patient’s electrolyte levels were within normal ranges before testing.
We agree that the valuable teaching point for clinicians is to appreciate the contraindication to and consequences of the use of dipyridamole-containing oral medications and either adenosine or regadenoson during pharmacologic stress testing. As Dr. Alraies points out, most cardiologists may be familiar with this interaction, but a large proportion of stress tests are ordered by emergency room physicians, internists, and hospitalists who are not. Still, the overall incidence of side effects with pharmacologic stress testing is very low and comparable to that with exercise testing, with safety enhanced by following the American Society of Nuclear Cardiology (ASNC) guidelines for performing stress myocardial perfusion imaging.1 Avoidance of this interaction may be enhanced through education, but also by using checklists and building notifications into the electronic medical record when ordering pharmacologic stress testing. Of note, according to the ASNC guidelines, the use of intravenous dipyridamole as a stress agent is a safe alternative for pharmacologic stress testing in patients taking oral dipyridamole-containing medications.
- Henzlova MJ, Cerqueira MD, Mahmarian JJ, Yao SS; Quality Assurance Committee of the American Society of Nuclear Cardiology. Stress protocols and tracers. J Nucl Cardiol 2006; 13:e80–e90.
In Reply: We appreciate the interest and comments of Dr. Alraies. We would like to clarify that the patient’s baseline electrocardiogram before the nuclear stress test was normal. Second-degree atrioventricular (AV) block (Mobitz type I) was evident only during adenosine infusion before ventricular asystole. The patient was on two AV nodal blockers (labetalol and clonidine) but had no underlying conduction disease. There is no contraindication to continuing these agents before pharmacologic stress testing. In addition, the patient’s electrolyte levels were within normal ranges before testing.
We agree that the valuable teaching point for clinicians is to appreciate the contraindication to and consequences of the use of dipyridamole-containing oral medications and either adenosine or regadenoson during pharmacologic stress testing. As Dr. Alraies points out, most cardiologists may be familiar with this interaction, but a large proportion of stress tests are ordered by emergency room physicians, internists, and hospitalists who are not. Still, the overall incidence of side effects with pharmacologic stress testing is very low and comparable to that with exercise testing, with safety enhanced by following the American Society of Nuclear Cardiology (ASNC) guidelines for performing stress myocardial perfusion imaging.1 Avoidance of this interaction may be enhanced through education, but also by using checklists and building notifications into the electronic medical record when ordering pharmacologic stress testing. Of note, according to the ASNC guidelines, the use of intravenous dipyridamole as a stress agent is a safe alternative for pharmacologic stress testing in patients taking oral dipyridamole-containing medications.
- Henzlova MJ, Cerqueira MD, Mahmarian JJ, Yao SS; Quality Assurance Committee of the American Society of Nuclear Cardiology. Stress protocols and tracers. J Nucl Cardiol 2006; 13:e80–e90.
- Henzlova MJ, Cerqueira MD, Mahmarian JJ, Yao SS; Quality Assurance Committee of the American Society of Nuclear Cardiology. Stress protocols and tracers. J Nucl Cardiol 2006; 13:e80–e90.
A way to reverse CAD?
ABSTRACT
Purpose Plant-based nutrition achieved coronary artery disease (CAD) arrest and reversal in a small study. However, there was skepticism that this approach could succeed in a larger group of patients. The purpose of our follow-up study was to define the degree of adherence and outcomes of 198 consecutive patient volunteers who received counseling to convert from a usual diet to plant-based nutrition.
Methods We followed 198 consecutive patients counseled in plant-based nutrition. These patients with established cardiovascular disease (CVD) were interested in transitioning to plant-based nutrition as an adjunct to usual cardiovascular care. We considered participants adherent if they eliminated dairy, fish, and meat, and added oil.
Results Of the 198 patients with CVD, 177 (89%) were adherent. Major cardiac events judged to be recurrent disease totaled one stroke in the adherent cardiovascular participants—a recurrent event rate of .6%, significantly less than reported by other studies of plant-based nutrition therapy. Thirteen of 21 (62%) nonadherent participants experienced adverse events.
Conclusion Most of the volunteer patients with CVD responded to intensive counseling, and those who sustained plant-based nutrition for a mean of 3.7 years experienced a low rate of subsequent cardiac events. This dietary approach to treatment deserves a wider test to see if adherence can be sustained in broader populations. Plant-based nutrition has the potential for a large effect on the CVD epidemic.
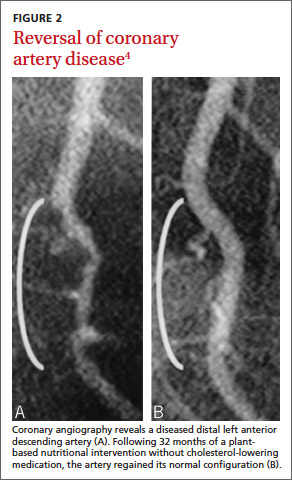
In a 1985 program initiated at the Cleveland Clinic, we examined whether plant-based nutrition could arrest or reverse advanced coronary artery disease (CAD) in 22 patients.1 One patient with restricted myocardial blood flow documented by positron emission tomography (PET) showed reperfusion on a repeat scan just 3 weeks after starting our nutritional intervention (FIGURE 1).2 Within 10 months of the start of treatment, another patient with severe right calf claudication and a quantifiably diminished pulse volume experienced total pain relief and exhibited a measurably increased pulse volume amplitude.2 Thus encouraged, we followed the small cohort of patients (adding cholesterol-lowering drugs in 1987) and reported results after 5 and 12 years of follow-up.1,3 Of the 22 patients, 17 were adherent to the protocol, and their disease progression halted. In 4 of the 12, we angiographically confirmed disease reversal,4 which can be striking (FIGURE 2).4
The significance of these findings. CAD remains the number one killer of women and men in western civilization despite 40 years of aggressive drug and surgical interventions.5 These approaches can be lifesaving in the midst of a heart attack. However, the elective use of percutaneous coronary intervention (PCI) shows little protection from future heart attacks or prolongation of life,6 perhaps because it does not treat the major cause of this disease. Such palliative treatments also carry significant risk of morbidity and mortality and lead to unsustainable expense.7

| 
|
Getting at the root cause of CAD requires a different approach. CAD begins with progressive endothelial injury,8 inflammatory oxidative stress, diminution of nitric oxide production, foam cell formation, and development of plaques that may rupture to cause a myocardial infarction (MI) or stroke.9 This cascade is set in motion in part by, and is exacerbated by, the western diet of added oils, dairy, meat, fowl, fish, sugary foods (sucrose, fructose, and drinks containing those, refined carbohydrates, fruit juices, syrups, and molasses) that injures or impairs endothelial function after each ingestion, making food choices a major, if not the major, cause of CAD.8,10-12
The study we report on here. In a continuation of the clinical strategy employing a plant-based nutrition intervention for CAD, we studied a separate cohort of 198 participants to determine if they could voluntarily adhere to the necessary dietary changes and to document their cardiovascular outcomes.
METHODS
Participants
This report reviews the outcomes of 198 consecutive nonsmoking patients with multiple comorbidities of hyperlipidemia (n=161), hypertension (n=60), and diabetes (n=23) who voluntarily asked for counseling in plantbased nutrition for disease treatment. These self-selected participants requested consultation after learning about the program through the Internet, the media, prior scientific publications, the senior author’s book (CBE Jr), other authors’ supportive comments, or word of mouth.2,13 A preliminary 25- to 30-minute telephone conversation established disease presentation and severity by eliciting reports of symptoms, history of MI, stress test and angiogram results, interventions undertaken, family history, lipid profile, and the presence of comorbid chronic conditions. In these calls, we outlined the program, established rapport, and documented the need for additional patient information. The Cleveland Clinic Institutional Review Board determined that these were acceptable outcome measurements to evaluate the nutrition program.
Intervention
We explained to each participant that plant-based nutrition typically succeeded in arresting—and sometimes reversing—CAD in our earlier study.
The core diet. Whole grains, legumes, lentils, other vegetables, and fruit comprised the major portion of the diet. We reassured patients that balanced and varied plant-based nutrition would cover their needs for amino acids, and we encouraged them to take a multivitamin and vitamin B12 supplement. We also advised the use of flax seed meal, which served as an additional source of omega-6 and omega-3 essential fatty acids.
Foods prohibited. Initially the intervention avoided all added oils and processed foods that contain oils, fish, meat, fowl, dairy products, avocado, nuts, and excess salt. Patients were also asked to avoid sugary foods (sucrose, fructose, and drinks containing them, refined carbohydrates, fruit juices, syrups, and molasses). Subsequently, we also excluded caffeine and fructose.
Exercise was encouraged but not required. The plan also did not require the practice of meditation, relaxation, yoga, or other psychosocial support approaches. Patients continued to use cardiac medications as prescribed, monitored by their (other) physicians.
Pre-intervention training. Each participant attended a single-day 5-hour counseling seminar (9 am-2 pm) with, at most, 11 other participants. Each participant was encouraged to invite a spouse or partner. The 5-hour program profiled plant-based cultures that have virtually no cardiovascular illness, in contrast to non-plant-based cultures where CAD is ubiquitous (confirmed by autopsy of young adults).14 We referenced the plummeting death rates from strokes and heart attacks in Norway during World War II when the German occupying forces confiscated their livestock, limiting Norwegians to plant-based nutrition.15
We emphasized the cellular components and mechanisms responsible for vascular health: the endothelial cell, endothelial progenitor cell, high-density lipoprotein cholesterol (HDL-C), and inhibition of dimethylarginine dimethylaminohydrolase that causes vasoconstriction. These were discussed in considerable detail, as were nutrition strategies to enhance endothelial health and to avoid endothelial dysfunction and injury. Participants viewed angiograms of CAD reversal from prior intervention participants.
An associate with several decades of experience with plant-based nutrition discussed plant food acquisition (including food label reading) and preparation. Participants learned how to alter common recipes to meet program standards. They received a 44-page plant-based recipe handout, 2 scientific articles confirming plant-based nutrition effectiveness,4,16 and, after 2007, a copy of Prevent and Reverse Heart Disease.2 The seminar concluded with a testimonial by a prior participant, a plant-based meal, and a question-and-answer session. We asked participants to complete and return a 3-week diet diary following the seminar. They were invited to communicate concerns via e-mail or phone, and to forward copies of subsequent lipid profiles, stress tests, cardiac events, angiograms, and interventions.
Study data acquisition
In 2011 and 2012 we contacted all participants by telephone to gather data. If a participant had died, we obtained follow-up medical and dietary information from the spouse, sibling, offspring, or responsible representative. Patients who avoided all meat, fish, dairy, and, knowingly, any added oils throughout the program were considered adherent. We inquired about weight change, lipid profiles, further stress tests or angiograms, major cardiac events, interventions, and any change in symptoms.
RESULTS
Characteristics of participants
Baseline characteristics of participants are shown in TABLE 1. (Two patients from the original group of 200 were lost to follow-up.) The remaining 198 participants for whom data were available had CVD, were mostly men (91%), averaged 62.9 years of age, and were followed for an average of 44.2 months (3.7 years).
Three patients had noncoronary vascular disease: 1 cerebral vascular disease, 1 carotid artery disease, and 1 peripheral arterial disease. In the remaining 195 patients, angiogram results confirmed the diagnosis of CAD in 180 (92%). With the other 15 participants, electrocardiography, failed stress tests, or a history of enzyme-documented MI confirmed the diagnosis of CAD. Of the 195-patient cohort, 44 (23%) had an MI prior to counseling.
Outcomes for nonadherent CVD participants
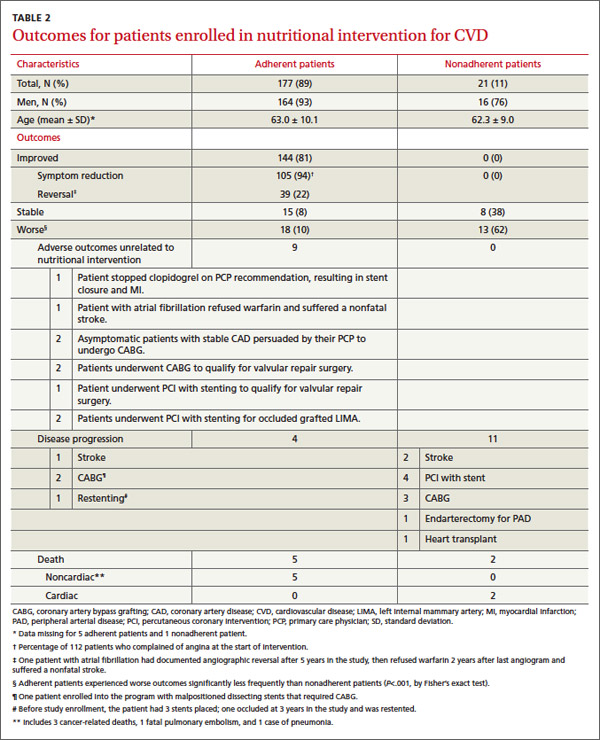
Twenty-one patients (11%) were nonadherent with dietary intervention. Thirteen of these patients experienced at least 1 adverse event each—2 sudden cardiac deaths, 1 heart transplant, 2 ischemic strokes, 4 PCIs with stent placement, 3 coronary artery bypass graftings (CABGs), and 1 endarterectomy for peripheral arterial disease—for a patient event rate of 62% (TABLE 2).
Outcomes of adherent CVD participants
In the group of 177 (89%) adherent patients, 112 reported angina at baseline and 104 (93%) experienced improvement or resolution of symptoms during the follow-up period. An additional patient with claudication also experienced symptom relief (TABLE 2). Of adherent patients with CAD, radiographic or stress testing results were available to document disease reversal in 39 (22%). Twenty-seven CAD participants were able to avoid PCI or CABG that was previously recommended. Adherent patients experienced worse outcomes significantly less frequently than nonadherent patients (P<.001, Fisher’s exact test). In addition, for 135 patients for whom body weight was available, the average weight loss was 18.7 lbs.
Among the 177 patients who reported adherence to the dietary intervention, there were 5 noncardiac deaths (3 cancers, 1 pulmonary embolus, and 1 case of pneumonia). Also, 9 CAD patients required vascular intervention: 1 CABG for disease progression, 1 CABG for malpositioned dissecting stents placed just prior to enrollment into the program, 1 stenting procedure and 2 CABGs before valve repair, 2 stenting procedures to correct grafted artery closing, and 2 CABGs for asymptomatic patients persuaded of the need by their primary caregivers. Two patients experienced a nonfatal stroke (one after refusing warfarin for atrial fibrillation, the second because of progression of CVD, and one had stent thrombosis with acute MI after discontinuing clopidogrel as advised by the primary care physician. One patient had 3 stents placed before entering our study; 1 occluded at 3 years into the study, necessitating restenting (TABLE 2).
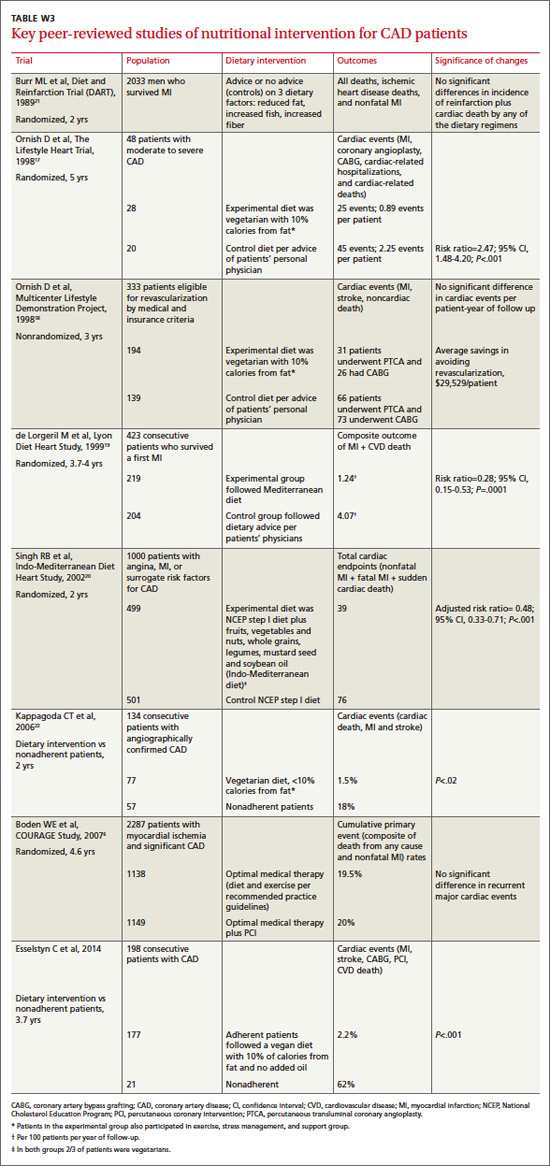
Thus, only 1 major cardiovascular event (stroke) was related to disease progression in patients adherent with the dietary intervention. This is a recurrent event rate of 0.6%. Thus, 99.4% of adherent patients avoided major cardiac events. This result clearly contrasts with that of other key peer-reviewed studies of nutrition interventions for patients with CAD6,17-22 (TABLE W3), although the disease burden and the presence of comorbid conditions may not be comparable. Even if all events had been attributable to diet, the 10% (18/177) event rate (“Worse” group in TABLE 2) over an average of 3.7 years is much below that reported in the literature23 and the 62% of the nonadherent group.

DISCUSSION
This program of treating the presumed cause of CAD has yielded significant findings and raised practice implications. First, and quite compelling, is that 89% of patients were willing to make a substantial lifestyle transition to plant-based nutrition and sustain it for an average of 3.7 years (for some patients up to 13 years). Most participants saw this as taking control of their disease (anecdotal reports).
Second, the results of this evaluation provide further evidence that plant-based nutrition may prevent, halt, and reverse CAD. This process of halting and reversing CAD has been validated with a high probability by epidemiologic studies, including those of wartime deprivation, our previous noncontrolled study, and both randomized and nonrandomized controlled studies where a similar plant-based diet was a part of a comprehensive lifestyle modification in conjunction with otherwise standard pharmaceutical medical therapy.3,15,17,18,24-26
Large cohort studies support nutritional intervention. In addition, 2 large prospective cohort studies have recently emphasized the importance of nutrition in decreasing the risk of recurrent CVD events in people with CVD or diabetes and decreasing the risk of developing CVD among healthy individuals. Dehghan and colleagues27 followed 31,546 participants with CVD or diabetes over 4.5 years and divided them into quintiles of nutritional quality. Reduction in CVD-related risk within the healthiest quintile was 35% for death, 14% for MI, and 19% for stroke. They found this protective association was maintained whether or not patients were receiving medications.
Crowe and colleagues28 followed 44,561 men and women enrolled in the European Prospective Investigation into Cancer and Nutrition. Thirty-four percent (15,151) were vegetarians, consuming neither meat nor fish. During an 11.6-year follow-up, they found vegetarians had a lower mean body mass index, lower non-HDL-C level, lower systolic blood pressure, and a 32% lower risk of developing ischemic heart disease.28 These combined studies of 76,107 individuals support an assertion of the power of nutrition for primary and secondary prevention of cardiovascular illness.
By way of contrast are findings associated with a typical western diet. Wilkins and colleagues29 assessed lifetime risk and years lived free of total CVD by reviewing data from 905,115 person-years from 1964 to 2008. They assessed risk factor presence and subsequent CVD. While lifetime risk estimates for total CVD for all individuals was >30%, the study found that even those men and women 55 years of age with optimal risk factors had a 40% and 30% likelihood of total CVD, respectively, by age 85. It would appear that even optimal risk factors are no guarantee that the typical western diet won’t eventually result in CVD.
Why are our results particularly favorable? While nutritional modification is beneficial, the question remains whether it has been optimized to its fullest potential in other studies. First, no other nutrition study has completely eliminated oils (including food products that may contain even small quantities of added oil of any kind), and all animal, fish, and dairy products, which would avoid foods known to injure endothelial cells, as well as exogenous cholesterol and saturated fat. In avoiding exposure to lecithin and carnitine contained in eggs, milk and dairy products, liver, red meat, poultry, shellfish and fish, participants in our study were unlikely to have intestinal flora capable of producing trimethylamine oxide (TMAO), a recently identified atherogenic compound produced by the intestinal flora unique to omnivores that ingest animal products.30-32 (Vegans do not possess the detrimental bacterial flora.)
A second reason for our favorable results is the intensive, single-day, 5-hour counseling seminar that conveyed the message of nutritional intervention with depth, clarity, power, and completeness through a PowerPoint presentation, recipe handouts, books, video, strategies for plant food acquisition and preparation, and testimonials by prior participants. Thus informed, participants grasped in detail the importance of the endothelial cell and its product, nitric oxide. They were educated to fully comprehend which foods injure endothelial cells and how transitioning to a whole-food, plant-based diet empowers them as the locus of control to halt and potentially reverse their disease. The preseminar phone consultation, the seminar itself, and follow-up psychological support resulted in an adherence of 89% during this 3.7-year-long follow-up.
We believe food may be the most important lifestyle factor in establishing the presence or absence of disease.15,24-26 The adverse event rate among nonadherent participants was 62%. For adherent participants (119 experienced intervention prior to counseling: 75 had PCI with stent placement, and 44 suffered MI), the adverse event rate was at most 10% (“Worse” group in TABLE 2). An additional 27 counseled participants did not require previously recommended interventions. These data on required interventions and interventions recommended but found to be unnecessary (146/177; 82%), testify to the severity of illness in this cohort and illustrate the remarkable comparative lack of subsequent cardiovascular events in the 89% who complied with plant-based nutrition.
Less need for stenting? The prompt improvement (within 3 weeks) confirmed by PET scan documentation of myocardial reperfusion (FIGURE 1), resolution of angina, and angiographic evidence of disease reversal (FIGURE 2) demonstrated in our earlier studies involving plant-based nutritional intervention argue against elective deployment of stents for reperfusion. Successful nutritional treatment of CVD, coupled with standard medical therapy, may extinguish major cardiac event progression in the vast majority of patients.
Enabling the body to correct harmful processes. Future discoveries may help to explain why plant-based nutrition is so effective, yet we can postulate likely mechanisms. When foods that injure or cause endothelium dysfunction are avoided, the body readily restores the capacity of endothelial tissue to produce nitric oxide. Such change reduces production of vasoconstricting endothelin and thromboxane by injured endothelial cells.
Our insistence on daily ingestion of generous portions of green leafy vegetables favors an improved population of endothelial progenitor cells.33 Moreover, reductions in lipid, homocysteine, and triglyceride levels and insulin resistance enhance dimethylarginine dimethylaminohydrolase to enzymatically reduce asymmetric dimethylarginine and optimize nitric oxide synthase availability in nitric oxide production. The blood level of HDL-C may decrease with this antiinflammatory, plant-based nutrition. Nevertheless, the efflux capacity of HDL-C may be unrelated to blood concentration and could be significantly enhanced by the intervention to enable disease arrest or reversal.34,35 Consumers of plant-based nutrition do not harbor the intestinal flora unique to omnivores that enables production of proatherogenic TMAO. The standard nutritional, pharmaceutical, and surgical interventions of present cardiovascular medicine may not sufficiently address these protective mechanisms.
This study had several limitations. First, it included self-selected, very determined patients. Without a control group, it is challenging to establish causality and assess how much of the observed changes are specifically due to the diet. Only some of the observed beneficial outcomes may have been due to the diet. This study was not prospectively randomized. Nevertheless, this fact does not detract from proof of concept that major cardiovascular events occurred in probably <1% (and certainly <10%) of the entire adherent cohort, compared with 62% of the nonadherent cohort (TABLE 2). These data convey a strong message of patients accepting empowerment to be the locus of control to arrest their disease and confirm that patients will adopt a significant lifestyle transition to plant-based nutrition to halt and regress what we believe is a largely foodborne illness.
The past several decades have witnessed a substantial and sustained reduction in CAD. Nevertheless, CAD remains the number one killer of women and men in this country. Thousands of stable patients having stents experience no reduction in major cardiac events.6 While drugs have some effects on disease initiation and progression, these interventions do not address disease causation. Not surprisingly, most patients experience disease progression, more drugs, more imaging, repeat interventions, progressive disability, and, too often, death from a disease of western malnutrition, the cause of which has been largely left untreated. We have in press several patient experiences that exemplify the repeated failure of present-day cardiac drugs and procedural interventions, and that confirm the capacity of whole-food plant-based nutrition to restore health in “there is nothing further we can do” situations.36
In summary, the present cardiovascular medicine approach tested beyond 40 years can neither cure the disease nor end the epidemic and is financially unsustainable. The safety, diminished expense, and prompt, powerful, and persistent results in treating the cause of vascular disease by whole-food plant-based nutrition offer a paradigm shift from existing practice. We think the time is right for a controlled trial. But in the meantime, the data are sound and strong enough that patients should be informed of this option.
Correspondence
Caldwell B. Esselstyn Jr MD, The Wellness Institute, The Cleveland Clinic, 1950 Richmond Road, TR2-341, Lyndhurst, OH 44124; [email protected]
Acknowledgements
We are grateful to all participants in the program, Jacqueline Frey, Ann Crile Esselstyn, and Jim Perko.
1. Esselstyn CB Jr, Ellis SG, Medendorp SV, et al. A strategy to arrest and reverse coronary artery disease: a 5-year longitudinal study of a single physician’s practice. J Fam Pract. 1995;41:560-568.
2. Esselstyn CB Jr. Prevent and Reverse Heart Disease. New York, New York: Penguin Group; 2007.
3. Esselstyn CB Jr. Updating a 12-year experience with arrest and reversal therapy for coronary heart disease (an overdue requiem for palliative cardiology). Am J Cardiol. 1999;84:339-341,A8.
4. Esselstyn CB Jr. Resolving the coronary artery disease epidemic through plant-based nutrition. Prev Cardiol. 2001;4:171-177.
5. Roger VL, Go AS, Lloyd-Jones DM, et al; American Heart Association Statistics Committee and Stroke Statistics Subcommittee. Executive summary: heart disease and stroke statistics—2012 update: a report from the American Heart Association. Circulation. 2012;125:188-197.
6. Boden WE, O’Rourke RA, Teo KK, et al; COURAGE Trial Research Group. Optimal medical therapy with or without PCI for stable coronary disease. N Engl J Med. 2007;356:1503-1516.
7. Trogdon JG, Finkelstein EA, Nwaise IA, et al. The economic burden of chronic cardiovascular disease for major insurers. Health Promot Pract. 2007;8:234-242.
8. Suwaidi JA, Hamasaki S, Higano ST, et al. Long-term follow-up of patients with mild coronary artery disease and endothelial dysfunction. Circulation. 2000;101:948-954.
9. Nabel EG, Braunwald E. A tale of coronary artery disease and myocardial infarction. N Engl J Med. 2012;366:54-63.
10. Vogel RA, Coretti MC, Plotnich GD. Effect of a single high-fat meal on endothelial function in healthy subjects. Am J Cardiol. 1997;79:350-354.
11. Marchesi S, Lupattelli G, Schillaci G, et al. Impaired flow-mediated vasoactivity during post-prandial phase in young healthy men. Atherosclerosis. 2000;153:397-402.
12. Bae JH, Bassenge E, Kim KB, et al. Postprandial hypertriglyceridemia impairs endothelial function by enhanced oxidant stress. Atherosclerosis. 2001;155:517-523.
13. Campbell TC, Campbell TM II. Broken hearts. In: Campbell TC, Campbell TM II. The China Study. Dallas, TX: BenBella Books; 2006:111-134.
14. Strong JP, Malcom GT, McMahan CA, et al. Prevalence and extent of atherosclerosis in adolescents and young adults: implications for prevention from the Pathobiological Determinants of Atherosclerosis in Youth Study. JAMA. 1999;281:727-735. 15. Strom A, Jensen RA. Mortality from circulatory disease in Norway 1940-1945. Lancet. 1951;1:126-129.
16. Esselstyn CB Jr. Is the present therapy for coronary artery disease the radical mastectomy of the twenty-first century? Am J Cardiol. 2010;106:902-904.
17. Ornish D, Scherwitz LW, Billings JH, et al. Intensive lifestyle changes for reversal of coronary heart disease. JAMA. 1998;280:2001-2007.
18. Ornish D. Avoiding revascularization with lifestyle changes: The Multicenter Lifestyle Demonstration Project. Am J Cardiol. 1998;82:72T-76T.
19. de Lorgeril M, Salen P, Martin JL, et al. Mediterranean diet, traditional risk factors, and the rate of cardiovascular complications after myocardial infarction: final report of the Lyon Diet Heart Study. Circulation. 1999;99:779-785.
20. Singh RB, Dubnov G, Niaz MA, et al. Effect of an Indo-Mediterranean diet on progression of coronary artery disease in high risk patients (Indo-Mediterranean Diet Heart Study): a randomised single-blind trial. Lancet. 2002;360:1455-1461.
21. Burr ML, Fehily AM, Gilbert JF, et al. Effects of changes in fat, fish, and fibre intakes on death and myocardial reinfarction: diet and reinfarction trial (DART). Lancet. 1989;2:757-761.
22. Kappagoda CT, Ma A, Cort DA, et al. Cardiac event rate in a lifestyle modification program for patients with chronic coronary artery disease. Clin Cardiol. 2006;29:317-321.
23. Stone GW, Maehara A, Lansky AJ, et al; PROSPECT Investigators. A prospective natural-history study of coronary atherosclerosis. N Engl J Med. 2011;364:226-235.
24. Campbell TC, Parpia B, Chen J. Diet, lifestyle, and the etiology of coronary artery disease: the Cornell China study. Am J Cardiol. 1998;82:18T-21T.
25. Sinnett PF, Whyte HM. Epidemiological studies in a total highland population, Tukisenta, New Guinea. Cardiovascular disease and relevant clinical, electrocardiographic, radiological and biochemical findings. J Chronic Dis. 1973;26:265-290.
26. Connor WE, Cerqueira MT, Connor RW, et al. The plasma lipids, lipoproteins, and diet of the Tarahumara indians of Mexico. Am J Clin Nutr. 1978;31:1131-1142.
27. Dehghan M, Mente A, Teo KK, et al; Ongoing Telmisartan Alone and in Combination With Ramipril Global End Point Trial (ONTARGET)/Telmisartan Randomized Assessment Study in ACEI Intolerant Subjects With Cardiovascular Disease (TRANSCEND) Trial Investigators. Relationship between healthy diet and risk of cardiovascular disease among patients on drug therapies for secondary prevention: a prospective cohort study of 31 546 high-risk individuals from 40 countries. Circulation. 2012;126:2705-2712.
28. Crowe FL, Appleby PN, Travis RC, et al. Risk of hospitalization or death from ischemic heart disease among British vegetarians and nonvegetarians: results from the EPIC-Oxford cohort study. Am J Clin Nutr. 2013;97:597-603.
29. Wilkins JT, Ning H, Berry J, et al. Lifetime risk and years lived free of total cardiovascular disease. JAMA. 2012;308:1795-1801.
30. Tang WH, Wang Z, Levison BS, et al. Intestinal microbial metabolism of phosphatidylcholine and cardiovascular risk. N Engl J Med. 2013;368:1575-1584.
31. Koeth RA, Wang Z, Levison BS, et al. Intestinal microbiota metabolism of L-carnitine, a nutrient in red meat, promotes atherosclerosis. Nat Med. 2013;19:576-585.
32. Wang Z, Klipfell E, Bennett BJ, et al. Gut flora metabolism of phosphatidylcholine promotes cardiovascular disease. Nature. 2011;472:57-63.
33. Mano R, Ishida A, Ohya Y, et al. Dietary intervention with Okinawan vegetables increased circulating endothelial progenitor cells in healthy young women. Atherosclerosis. 2009;204:544-548.
34. Khera AV, Cuchel M, de la Llera-Moya M, et al. Cholesterol efflux capacity, high-density lipoprotein function, and atherosclerosis. N Engl J Med. 2011;364:127-135.
35. Navab M, Reddy ST, Van Lenten BJ, et al. HDL and cardiovascular disease: atherogenic and atheroprotective mechanisms. Nat Rev Cardiol. 2011;8:222-232.
36. Esselstyn CB Jr, Golubic M. The nutritional reversal of cardiovascular disease–fact or fiction? J Exp Clin Cardiol. In press.
ABSTRACT
Purpose Plant-based nutrition achieved coronary artery disease (CAD) arrest and reversal in a small study. However, there was skepticism that this approach could succeed in a larger group of patients. The purpose of our follow-up study was to define the degree of adherence and outcomes of 198 consecutive patient volunteers who received counseling to convert from a usual diet to plant-based nutrition.
Methods We followed 198 consecutive patients counseled in plant-based nutrition. These patients with established cardiovascular disease (CVD) were interested in transitioning to plant-based nutrition as an adjunct to usual cardiovascular care. We considered participants adherent if they eliminated dairy, fish, and meat, and added oil.
Results Of the 198 patients with CVD, 177 (89%) were adherent. Major cardiac events judged to be recurrent disease totaled one stroke in the adherent cardiovascular participants—a recurrent event rate of .6%, significantly less than reported by other studies of plant-based nutrition therapy. Thirteen of 21 (62%) nonadherent participants experienced adverse events.
Conclusion Most of the volunteer patients with CVD responded to intensive counseling, and those who sustained plant-based nutrition for a mean of 3.7 years experienced a low rate of subsequent cardiac events. This dietary approach to treatment deserves a wider test to see if adherence can be sustained in broader populations. Plant-based nutrition has the potential for a large effect on the CVD epidemic.
In a 1985 program initiated at the Cleveland Clinic, we examined whether plant-based nutrition could arrest or reverse advanced coronary artery disease (CAD) in 22 patients.1 One patient with restricted myocardial blood flow documented by positron emission tomography (PET) showed reperfusion on a repeat scan just 3 weeks after starting our nutritional intervention (FIGURE 1).2 Within 10 months of the start of treatment, another patient with severe right calf claudication and a quantifiably diminished pulse volume experienced total pain relief and exhibited a measurably increased pulse volume amplitude.2 Thus encouraged, we followed the small cohort of patients (adding cholesterol-lowering drugs in 1987) and reported results after 5 and 12 years of follow-up.1,3 Of the 22 patients, 17 were adherent to the protocol, and their disease progression halted. In 4 of the 12, we angiographically confirmed disease reversal,4 which can be striking (FIGURE 2).4
The significance of these findings. CAD remains the number one killer of women and men in western civilization despite 40 years of aggressive drug and surgical interventions.5 These approaches can be lifesaving in the midst of a heart attack. However, the elective use of percutaneous coronary intervention (PCI) shows little protection from future heart attacks or prolongation of life,6 perhaps because it does not treat the major cause of this disease. Such palliative treatments also carry significant risk of morbidity and mortality and lead to unsustainable expense.7
|
|
|
Getting at the root cause of CAD requires a different approach. CAD begins with progressive endothelial injury,8 inflammatory oxidative stress, diminution of nitric oxide production, foam cell formation, and development of plaques that may rupture to cause a myocardial infarction (MI) or stroke.9 This cascade is set in motion in part by, and is exacerbated by, the western diet of added oils, dairy, meat, fowl, fish, sugary foods (sucrose, fructose, and drinks containing those, refined carbohydrates, fruit juices, syrups, and molasses) that injures or impairs endothelial function after each ingestion, making food choices a major, if not the major, cause of CAD.8,10-12
The study we report on here. In a continuation of the clinical strategy employing a plant-based nutrition intervention for CAD, we studied a separate cohort of 198 participants to determine if they could voluntarily adhere to the necessary dietary changes and to document their cardiovascular outcomes.
METHODS
Participants
This report reviews the outcomes of 198 consecutive nonsmoking patients with multiple comorbidities of hyperlipidemia (n=161), hypertension (n=60), and diabetes (n=23) who voluntarily asked for counseling in plantbased nutrition for disease treatment. These self-selected participants requested consultation after learning about the program through the Internet, the media, prior scientific publications, the senior author’s book (CBE Jr), other authors’ supportive comments, or word of mouth.2,13 A preliminary 25- to 30-minute telephone conversation established disease presentation and severity by eliciting reports of symptoms, history of MI, stress test and angiogram results, interventions undertaken, family history, lipid profile, and the presence of comorbid chronic conditions. In these calls, we outlined the program, established rapport, and documented the need for additional patient information. The Cleveland Clinic Institutional Review Board determined that these were acceptable outcome measurements to evaluate the nutrition program.
Intervention
We explained to each participant that plant-based nutrition typically succeeded in arresting—and sometimes reversing—CAD in our earlier study.
The core diet. Whole grains, legumes, lentils, other vegetables, and fruit comprised the major portion of the diet. We reassured patients that balanced and varied plant-based nutrition would cover their needs for amino acids, and we encouraged them to take a multivitamin and vitamin B12 supplement. We also advised the use of flax seed meal, which served as an additional source of omega-6 and omega-3 essential fatty acids.
Foods prohibited. Initially the intervention avoided all added oils and processed foods that contain oils, fish, meat, fowl, dairy products, avocado, nuts, and excess salt. Patients were also asked to avoid sugary foods (sucrose, fructose, and drinks containing them, refined carbohydrates, fruit juices, syrups, and molasses). Subsequently, we also excluded caffeine and fructose.
Exercise was encouraged but not required. The plan also did not require the practice of meditation, relaxation, yoga, or other psychosocial support approaches. Patients continued to use cardiac medications as prescribed, monitored by their (other) physicians.
Pre-intervention training. Each participant attended a single-day 5-hour counseling seminar (9 am-2 pm) with, at most, 11 other participants. Each participant was encouraged to invite a spouse or partner. The 5-hour program profiled plant-based cultures that have virtually no cardiovascular illness, in contrast to non-plant-based cultures where CAD is ubiquitous (confirmed by autopsy of young adults).14 We referenced the plummeting death rates from strokes and heart attacks in Norway during World War II when the German occupying forces confiscated their livestock, limiting Norwegians to plant-based nutrition.15
We emphasized the cellular components and mechanisms responsible for vascular health: the endothelial cell, endothelial progenitor cell, high-density lipoprotein cholesterol (HDL-C), and inhibition of dimethylarginine dimethylaminohydrolase that causes vasoconstriction. These were discussed in considerable detail, as were nutrition strategies to enhance endothelial health and to avoid endothelial dysfunction and injury. Participants viewed angiograms of CAD reversal from prior intervention participants.
An associate with several decades of experience with plant-based nutrition discussed plant food acquisition (including food label reading) and preparation. Participants learned how to alter common recipes to meet program standards. They received a 44-page plant-based recipe handout, 2 scientific articles confirming plant-based nutrition effectiveness,4,16 and, after 2007, a copy of Prevent and Reverse Heart Disease.2 The seminar concluded with a testimonial by a prior participant, a plant-based meal, and a question-and-answer session. We asked participants to complete and return a 3-week diet diary following the seminar. They were invited to communicate concerns via e-mail or phone, and to forward copies of subsequent lipid profiles, stress tests, cardiac events, angiograms, and interventions.
Study data acquisition
In 2011 and 2012 we contacted all participants by telephone to gather data. If a participant had died, we obtained follow-up medical and dietary information from the spouse, sibling, offspring, or responsible representative. Patients who avoided all meat, fish, dairy, and, knowingly, any added oils throughout the program were considered adherent. We inquired about weight change, lipid profiles, further stress tests or angiograms, major cardiac events, interventions, and any change in symptoms.
RESULTS
Characteristics of participants
Baseline characteristics of participants are shown in TABLE 1. (Two patients from the original group of 200 were lost to follow-up.) The remaining 198 participants for whom data were available had CVD, were mostly men (91%), averaged 62.9 years of age, and were followed for an average of 44.2 months (3.7 years).
Three patients had noncoronary vascular disease: 1 cerebral vascular disease, 1 carotid artery disease, and 1 peripheral arterial disease. In the remaining 195 patients, angiogram results confirmed the diagnosis of CAD in 180 (92%). With the other 15 participants, electrocardiography, failed stress tests, or a history of enzyme-documented MI confirmed the diagnosis of CAD. Of the 195-patient cohort, 44 (23%) had an MI prior to counseling.
Outcomes for nonadherent CVD participants
Twenty-one patients (11%) were nonadherent with dietary intervention. Thirteen of these patients experienced at least 1 adverse event each—2 sudden cardiac deaths, 1 heart transplant, 2 ischemic strokes, 4 PCIs with stent placement, 3 coronary artery bypass graftings (CABGs), and 1 endarterectomy for peripheral arterial disease—for a patient event rate of 62% (TABLE 2).
Outcomes of adherent CVD participants
In the group of 177 (89%) adherent patients, 112 reported angina at baseline and 104 (93%) experienced improvement or resolution of symptoms during the follow-up period. An additional patient with claudication also experienced symptom relief (TABLE 2). Of adherent patients with CAD, radiographic or stress testing results were available to document disease reversal in 39 (22%). Twenty-seven CAD participants were able to avoid PCI or CABG that was previously recommended. Adherent patients experienced worse outcomes significantly less frequently than nonadherent patients (P<.001, Fisher’s exact test). In addition, for 135 patients for whom body weight was available, the average weight loss was 18.7 lbs.
Among the 177 patients who reported adherence to the dietary intervention, there were 5 noncardiac deaths (3 cancers, 1 pulmonary embolus, and 1 case of pneumonia). Also, 9 CAD patients required vascular intervention: 1 CABG for disease progression, 1 CABG for malpositioned dissecting stents placed just prior to enrollment into the program, 1 stenting procedure and 2 CABGs before valve repair, 2 stenting procedures to correct grafted artery closing, and 2 CABGs for asymptomatic patients persuaded of the need by their primary caregivers. Two patients experienced a nonfatal stroke (one after refusing warfarin for atrial fibrillation, the second because of progression of CVD, and one had stent thrombosis with acute MI after discontinuing clopidogrel as advised by the primary care physician. One patient had 3 stents placed before entering our study; 1 occluded at 3 years into the study, necessitating restenting (TABLE 2).
Thus, only 1 major cardiovascular event (stroke) was related to disease progression in patients adherent with the dietary intervention. This is a recurrent event rate of 0.6%. Thus, 99.4% of adherent patients avoided major cardiac events. This result clearly contrasts with that of other key peer-reviewed studies of nutrition interventions for patients with CAD6,17-22 (TABLE W3), although the disease burden and the presence of comorbid conditions may not be comparable. Even if all events had been attributable to diet, the 10% (18/177) event rate (“Worse” group in TABLE 2) over an average of 3.7 years is much below that reported in the literature23 and the 62% of the nonadherent group.
DISCUSSION
This program of treating the presumed cause of CAD has yielded significant findings and raised practice implications. First, and quite compelling, is that 89% of patients were willing to make a substantial lifestyle transition to plant-based nutrition and sustain it for an average of 3.7 years (for some patients up to 13 years). Most participants saw this as taking control of their disease (anecdotal reports).
Second, the results of this evaluation provide further evidence that plant-based nutrition may prevent, halt, and reverse CAD. This process of halting and reversing CAD has been validated with a high probability by epidemiologic studies, including those of wartime deprivation, our previous noncontrolled study, and both randomized and nonrandomized controlled studies where a similar plant-based diet was a part of a comprehensive lifestyle modification in conjunction with otherwise standard pharmaceutical medical therapy.3,15,17,18,24-26
Large cohort studies support nutritional intervention. In addition, 2 large prospective cohort studies have recently emphasized the importance of nutrition in decreasing the risk of recurrent CVD events in people with CVD or diabetes and decreasing the risk of developing CVD among healthy individuals. Dehghan and colleagues27 followed 31,546 participants with CVD or diabetes over 4.5 years and divided them into quintiles of nutritional quality. Reduction in CVD-related risk within the healthiest quintile was 35% for death, 14% for MI, and 19% for stroke. They found this protective association was maintained whether or not patients were receiving medications.
Crowe and colleagues28 followed 44,561 men and women enrolled in the European Prospective Investigation into Cancer and Nutrition. Thirty-four percent (15,151) were vegetarians, consuming neither meat nor fish. During an 11.6-year follow-up, they found vegetarians had a lower mean body mass index, lower non-HDL-C level, lower systolic blood pressure, and a 32% lower risk of developing ischemic heart disease.28 These combined studies of 76,107 individuals support an assertion of the power of nutrition for primary and secondary prevention of cardiovascular illness.
By way of contrast are findings associated with a typical western diet. Wilkins and colleagues29 assessed lifetime risk and years lived free of total CVD by reviewing data from 905,115 person-years from 1964 to 2008. They assessed risk factor presence and subsequent CVD. While lifetime risk estimates for total CVD for all individuals was >30%, the study found that even those men and women 55 years of age with optimal risk factors had a 40% and 30% likelihood of total CVD, respectively, by age 85. It would appear that even optimal risk factors are no guarantee that the typical western diet won’t eventually result in CVD.
Why are our results particularly favorable? While nutritional modification is beneficial, the question remains whether it has been optimized to its fullest potential in other studies. First, no other nutrition study has completely eliminated oils (including food products that may contain even small quantities of added oil of any kind), and all animal, fish, and dairy products, which would avoid foods known to injure endothelial cells, as well as exogenous cholesterol and saturated fat. In avoiding exposure to lecithin and carnitine contained in eggs, milk and dairy products, liver, red meat, poultry, shellfish and fish, participants in our study were unlikely to have intestinal flora capable of producing trimethylamine oxide (TMAO), a recently identified atherogenic compound produced by the intestinal flora unique to omnivores that ingest animal products.30-32 (Vegans do not possess the detrimental bacterial flora.)
A second reason for our favorable results is the intensive, single-day, 5-hour counseling seminar that conveyed the message of nutritional intervention with depth, clarity, power, and completeness through a PowerPoint presentation, recipe handouts, books, video, strategies for plant food acquisition and preparation, and testimonials by prior participants. Thus informed, participants grasped in detail the importance of the endothelial cell and its product, nitric oxide. They were educated to fully comprehend which foods injure endothelial cells and how transitioning to a whole-food, plant-based diet empowers them as the locus of control to halt and potentially reverse their disease. The preseminar phone consultation, the seminar itself, and follow-up psychological support resulted in an adherence of 89% during this 3.7-year-long follow-up.
We believe food may be the most important lifestyle factor in establishing the presence or absence of disease.15,24-26 The adverse event rate among nonadherent participants was 62%. For adherent participants (119 experienced intervention prior to counseling: 75 had PCI with stent placement, and 44 suffered MI), the adverse event rate was at most 10% (“Worse” group in TABLE 2). An additional 27 counseled participants did not require previously recommended interventions. These data on required interventions and interventions recommended but found to be unnecessary (146/177; 82%), testify to the severity of illness in this cohort and illustrate the remarkable comparative lack of subsequent cardiovascular events in the 89% who complied with plant-based nutrition.
Less need for stenting? The prompt improvement (within 3 weeks) confirmed by PET scan documentation of myocardial reperfusion (FIGURE 1), resolution of angina, and angiographic evidence of disease reversal (FIGURE 2) demonstrated in our earlier studies involving plant-based nutritional intervention argue against elective deployment of stents for reperfusion. Successful nutritional treatment of CVD, coupled with standard medical therapy, may extinguish major cardiac event progression in the vast majority of patients.
Enabling the body to correct harmful processes. Future discoveries may help to explain why plant-based nutrition is so effective, yet we can postulate likely mechanisms. When foods that injure or cause endothelium dysfunction are avoided, the body readily restores the capacity of endothelial tissue to produce nitric oxide. Such change reduces production of vasoconstricting endothelin and thromboxane by injured endothelial cells.
Our insistence on daily ingestion of generous portions of green leafy vegetables favors an improved population of endothelial progenitor cells.33 Moreover, reductions in lipid, homocysteine, and triglyceride levels and insulin resistance enhance dimethylarginine dimethylaminohydrolase to enzymatically reduce asymmetric dimethylarginine and optimize nitric oxide synthase availability in nitric oxide production. The blood level of HDL-C may decrease with this antiinflammatory, plant-based nutrition. Nevertheless, the efflux capacity of HDL-C may be unrelated to blood concentration and could be significantly enhanced by the intervention to enable disease arrest or reversal.34,35 Consumers of plant-based nutrition do not harbor the intestinal flora unique to omnivores that enables production of proatherogenic TMAO. The standard nutritional, pharmaceutical, and surgical interventions of present cardiovascular medicine may not sufficiently address these protective mechanisms.
This study had several limitations. First, it included self-selected, very determined patients. Without a control group, it is challenging to establish causality and assess how much of the observed changes are specifically due to the diet. Only some of the observed beneficial outcomes may have been due to the diet. This study was not prospectively randomized. Nevertheless, this fact does not detract from proof of concept that major cardiovascular events occurred in probably <1% (and certainly <10%) of the entire adherent cohort, compared with 62% of the nonadherent cohort (TABLE 2). These data convey a strong message of patients accepting empowerment to be the locus of control to arrest their disease and confirm that patients will adopt a significant lifestyle transition to plant-based nutrition to halt and regress what we believe is a largely foodborne illness.
The past several decades have witnessed a substantial and sustained reduction in CAD. Nevertheless, CAD remains the number one killer of women and men in this country. Thousands of stable patients having stents experience no reduction in major cardiac events.6 While drugs have some effects on disease initiation and progression, these interventions do not address disease causation. Not surprisingly, most patients experience disease progression, more drugs, more imaging, repeat interventions, progressive disability, and, too often, death from a disease of western malnutrition, the cause of which has been largely left untreated. We have in press several patient experiences that exemplify the repeated failure of present-day cardiac drugs and procedural interventions, and that confirm the capacity of whole-food plant-based nutrition to restore health in “there is nothing further we can do” situations.36
In summary, the present cardiovascular medicine approach tested beyond 40 years can neither cure the disease nor end the epidemic and is financially unsustainable. The safety, diminished expense, and prompt, powerful, and persistent results in treating the cause of vascular disease by whole-food plant-based nutrition offer a paradigm shift from existing practice. We think the time is right for a controlled trial. But in the meantime, the data are sound and strong enough that patients should be informed of this option.
Correspondence
Caldwell B. Esselstyn Jr MD, The Wellness Institute, The Cleveland Clinic, 1950 Richmond Road, TR2-341, Lyndhurst, OH 44124; [email protected]
Acknowledgements
We are grateful to all participants in the program, Jacqueline Frey, Ann Crile Esselstyn, and Jim Perko.
1. Esselstyn CB Jr, Ellis SG, Medendorp SV, et al. A strategy to arrest and reverse coronary artery disease: a 5-year longitudinal study of a single physician’s practice. J Fam Pract. 1995;41:560-568.
2. Esselstyn CB Jr. Prevent and Reverse Heart Disease. New York, New York: Penguin Group; 2007.
3. Esselstyn CB Jr. Updating a 12-year experience with arrest and reversal therapy for coronary heart disease (an overdue requiem for palliative cardiology). Am J Cardiol. 1999;84:339-341,A8.
4. Esselstyn CB Jr. Resolving the coronary artery disease epidemic through plant-based nutrition. Prev Cardiol. 2001;4:171-177.
5. Roger VL, Go AS, Lloyd-Jones DM, et al; American Heart Association Statistics Committee and Stroke Statistics Subcommittee. Executive summary: heart disease and stroke statistics—2012 update: a report from the American Heart Association. Circulation. 2012;125:188-197.
6. Boden WE, O’Rourke RA, Teo KK, et al; COURAGE Trial Research Group. Optimal medical therapy with or without PCI for stable coronary disease. N Engl J Med. 2007;356:1503-1516.
7. Trogdon JG, Finkelstein EA, Nwaise IA, et al. The economic burden of chronic cardiovascular disease for major insurers. Health Promot Pract. 2007;8:234-242.
8. Suwaidi JA, Hamasaki S, Higano ST, et al. Long-term follow-up of patients with mild coronary artery disease and endothelial dysfunction. Circulation. 2000;101:948-954.
9. Nabel EG, Braunwald E. A tale of coronary artery disease and myocardial infarction. N Engl J Med. 2012;366:54-63.
10. Vogel RA, Coretti MC, Plotnich GD. Effect of a single high-fat meal on endothelial function in healthy subjects. Am J Cardiol. 1997;79:350-354.
11. Marchesi S, Lupattelli G, Schillaci G, et al. Impaired flow-mediated vasoactivity during post-prandial phase in young healthy men. Atherosclerosis. 2000;153:397-402.
12. Bae JH, Bassenge E, Kim KB, et al. Postprandial hypertriglyceridemia impairs endothelial function by enhanced oxidant stress. Atherosclerosis. 2001;155:517-523.
13. Campbell TC, Campbell TM II. Broken hearts. In: Campbell TC, Campbell TM II. The China Study. Dallas, TX: BenBella Books; 2006:111-134.
14. Strong JP, Malcom GT, McMahan CA, et al. Prevalence and extent of atherosclerosis in adolescents and young adults: implications for prevention from the Pathobiological Determinants of Atherosclerosis in Youth Study. JAMA. 1999;281:727-735. 15. Strom A, Jensen RA. Mortality from circulatory disease in Norway 1940-1945. Lancet. 1951;1:126-129.
16. Esselstyn CB Jr. Is the present therapy for coronary artery disease the radical mastectomy of the twenty-first century? Am J Cardiol. 2010;106:902-904.
17. Ornish D, Scherwitz LW, Billings JH, et al. Intensive lifestyle changes for reversal of coronary heart disease. JAMA. 1998;280:2001-2007.
18. Ornish D. Avoiding revascularization with lifestyle changes: The Multicenter Lifestyle Demonstration Project. Am J Cardiol. 1998;82:72T-76T.
19. de Lorgeril M, Salen P, Martin JL, et al. Mediterranean diet, traditional risk factors, and the rate of cardiovascular complications after myocardial infarction: final report of the Lyon Diet Heart Study. Circulation. 1999;99:779-785.
20. Singh RB, Dubnov G, Niaz MA, et al. Effect of an Indo-Mediterranean diet on progression of coronary artery disease in high risk patients (Indo-Mediterranean Diet Heart Study): a randomised single-blind trial. Lancet. 2002;360:1455-1461.
21. Burr ML, Fehily AM, Gilbert JF, et al. Effects of changes in fat, fish, and fibre intakes on death and myocardial reinfarction: diet and reinfarction trial (DART). Lancet. 1989;2:757-761.
22. Kappagoda CT, Ma A, Cort DA, et al. Cardiac event rate in a lifestyle modification program for patients with chronic coronary artery disease. Clin Cardiol. 2006;29:317-321.
23. Stone GW, Maehara A, Lansky AJ, et al; PROSPECT Investigators. A prospective natural-history study of coronary atherosclerosis. N Engl J Med. 2011;364:226-235.
24. Campbell TC, Parpia B, Chen J. Diet, lifestyle, and the etiology of coronary artery disease: the Cornell China study. Am J Cardiol. 1998;82:18T-21T.
25. Sinnett PF, Whyte HM. Epidemiological studies in a total highland population, Tukisenta, New Guinea. Cardiovascular disease and relevant clinical, electrocardiographic, radiological and biochemical findings. J Chronic Dis. 1973;26:265-290.
26. Connor WE, Cerqueira MT, Connor RW, et al. The plasma lipids, lipoproteins, and diet of the Tarahumara indians of Mexico. Am J Clin Nutr. 1978;31:1131-1142.
27. Dehghan M, Mente A, Teo KK, et al; Ongoing Telmisartan Alone and in Combination With Ramipril Global End Point Trial (ONTARGET)/Telmisartan Randomized Assessment Study in ACEI Intolerant Subjects With Cardiovascular Disease (TRANSCEND) Trial Investigators. Relationship between healthy diet and risk of cardiovascular disease among patients on drug therapies for secondary prevention: a prospective cohort study of 31 546 high-risk individuals from 40 countries. Circulation. 2012;126:2705-2712.
28. Crowe FL, Appleby PN, Travis RC, et al. Risk of hospitalization or death from ischemic heart disease among British vegetarians and nonvegetarians: results from the EPIC-Oxford cohort study. Am J Clin Nutr. 2013;97:597-603.
29. Wilkins JT, Ning H, Berry J, et al. Lifetime risk and years lived free of total cardiovascular disease. JAMA. 2012;308:1795-1801.
30. Tang WH, Wang Z, Levison BS, et al. Intestinal microbial metabolism of phosphatidylcholine and cardiovascular risk. N Engl J Med. 2013;368:1575-1584.
31. Koeth RA, Wang Z, Levison BS, et al. Intestinal microbiota metabolism of L-carnitine, a nutrient in red meat, promotes atherosclerosis. Nat Med. 2013;19:576-585.
32. Wang Z, Klipfell E, Bennett BJ, et al. Gut flora metabolism of phosphatidylcholine promotes cardiovascular disease. Nature. 2011;472:57-63.
33. Mano R, Ishida A, Ohya Y, et al. Dietary intervention with Okinawan vegetables increased circulating endothelial progenitor cells in healthy young women. Atherosclerosis. 2009;204:544-548.
34. Khera AV, Cuchel M, de la Llera-Moya M, et al. Cholesterol efflux capacity, high-density lipoprotein function, and atherosclerosis. N Engl J Med. 2011;364:127-135.
35. Navab M, Reddy ST, Van Lenten BJ, et al. HDL and cardiovascular disease: atherogenic and atheroprotective mechanisms. Nat Rev Cardiol. 2011;8:222-232.
36. Esselstyn CB Jr, Golubic M. The nutritional reversal of cardiovascular disease–fact or fiction? J Exp Clin Cardiol. In press.
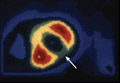
Hard cases
"Hard cases," say the lawyers, "make bad law." That means something like, "Legislation works better when it’s drafted in response to average circumstances, not extreme ones."
This adage applies to our profession, too. You can learn more about how to practice and teach medicine from average cases than from rare and strange ones. Hard cases can make any of us look foolish.

Peter e-mailed me the other day. I’d seen him 6 months ago for an eczematous rash on his back. Something funny about it, though: The distribution didn’t work, and it wasn’t scaly. No response to triamcinolone. Biopsy: Nonspecific inflammation. CBC: Elevated white cells at 15,600, mostly lymphs. Hmmm.
I referred him to an academic center. They presented him at Grand Rounds, and set him up for patch testing. He avoided what they asked him to, with little success.
"The oncologist says I have lymphoma," Peter’s e-mail to the patch test clinic read, copying me. He apologetically canceled his allergy clinic follow-up. "I hope for a good prognosis, although diagnosis has been delayed for several months. I hope my example will be of value for future patients."
Peter puts his regrets gently. How valuable will his lesson be? His case teaches that strange presentations of uncommon conditions can make even good and conscientious doctors look lame.
We all congratulate ourselves on "good pick-ups," the diagnostic coups that hit the nail on the head. Fair enough, but we understandably look away when we got it right by dumb luck or got it wrong.
That subcutaneous fullness we thought was fine, but which the patient insisted be removed (and turned out to be dermatofibrosarcoma protuberans). That dark spot that looked like all the others, only the patient was nervous because he was sure it had changed (melanoma). The funny rash that ended up being measles in an unimmunized child, and when was the last time you saw measles?
Often, we never even find out about the hard cases we missed, because the people who had them got fed up with us and went elsewhere. Sometimes, they send an angry letter or – more common these days – write a bad review. "I went to another doctor who finally figured out my problem and prescribed the right treatment." Once in a while, a lawsuit.
Viewed through the "retrospectoscope," knowing how the story turned out, our initial fumblings look pretty clumsy, if not downright actionable. "Oh, come on," a critic might say, "Surely that lump was too irregular for you to pass it off as a fibroma." Or: "Why the surprise? Didn’t he tell you the mole changed?" "The kid was sick and had a funny rash, didn’t she?" says a third. "Don’t you read the papers about all the parents who won’t vaccinate their children for fear of autism?"
I’m not suggesting that these are bad questions or that we shouldn’t ask them, so we can learn what we can. What I am saying is that, even if we do, no matter how careful and thoughtful we are, we are never going to catch everything we are unprepared for – the rare, the atypical, the unexpected.
This spring, the media reported details of an outbreak that occurred 5 years ago at New Orleans Children’s Hospital of what turned out to be mucormycosis; it proved fatal for several children. Looking back, mistakes were made. Diagnostic biopsies were only done when parents demanded them. Soiled laundry was mishandled. All this at a well-respected tertiary care center staffed by clinicians no doubt as fine as specialists anywhere.
The resulting investigation will no doubt find clinical and administrative gaps and address them. Consciousness will be raised, systems streamlined, oversight tightened. This loophole will be closed. Then others will open, no doubt the way they usually do, when people are looking at something else.
I knew there was something fishy about Peter’s case, but I didn’t know what it was. The experienced and thoughtful academic physicians I sent him to didn’t figure it out, either. It is nice of Peter to be philosophical about this. I would not begrudge him a less considerate reaction.
As for us, we ought to be vigilant, thorough, and humble. Should we get full of ourselves, there’s a hard case out there just waiting to deflate us.
Dr. Rockoff practices dermatology in Brookline, Mass. He is on the clinical faculty at Tufts University, Boston, and has taught senior medical students and other trainees for 30 years. Dr. Rockoff has contributed to the Under My Skin column in Skin & Allergy News since 1997.
"Hard cases," say the lawyers, "make bad law." That means something like, "Legislation works better when it’s drafted in response to average circumstances, not extreme ones."
This adage applies to our profession, too. You can learn more about how to practice and teach medicine from average cases than from rare and strange ones. Hard cases can make any of us look foolish.
Peter e-mailed me the other day. I’d seen him 6 months ago for an eczematous rash on his back. Something funny about it, though: The distribution didn’t work, and it wasn’t scaly. No response to triamcinolone. Biopsy: Nonspecific inflammation. CBC: Elevated white cells at 15,600, mostly lymphs. Hmmm.
I referred him to an academic center. They presented him at Grand Rounds, and set him up for patch testing. He avoided what they asked him to, with little success.
"The oncologist says I have lymphoma," Peter’s e-mail to the patch test clinic read, copying me. He apologetically canceled his allergy clinic follow-up. "I hope for a good prognosis, although diagnosis has been delayed for several months. I hope my example will be of value for future patients."
Peter puts his regrets gently. How valuable will his lesson be? His case teaches that strange presentations of uncommon conditions can make even good and conscientious doctors look lame.
We all congratulate ourselves on "good pick-ups," the diagnostic coups that hit the nail on the head. Fair enough, but we understandably look away when we got it right by dumb luck or got it wrong.
That subcutaneous fullness we thought was fine, but which the patient insisted be removed (and turned out to be dermatofibrosarcoma protuberans). That dark spot that looked like all the others, only the patient was nervous because he was sure it had changed (melanoma). The funny rash that ended up being measles in an unimmunized child, and when was the last time you saw measles?
Often, we never even find out about the hard cases we missed, because the people who had them got fed up with us and went elsewhere. Sometimes, they send an angry letter or – more common these days – write a bad review. "I went to another doctor who finally figured out my problem and prescribed the right treatment." Once in a while, a lawsuit.
Viewed through the "retrospectoscope," knowing how the story turned out, our initial fumblings look pretty clumsy, if not downright actionable. "Oh, come on," a critic might say, "Surely that lump was too irregular for you to pass it off as a fibroma." Or: "Why the surprise? Didn’t he tell you the mole changed?" "The kid was sick and had a funny rash, didn’t she?" says a third. "Don’t you read the papers about all the parents who won’t vaccinate their children for fear of autism?"
I’m not suggesting that these are bad questions or that we shouldn’t ask them, so we can learn what we can. What I am saying is that, even if we do, no matter how careful and thoughtful we are, we are never going to catch everything we are unprepared for – the rare, the atypical, the unexpected.
This spring, the media reported details of an outbreak that occurred 5 years ago at New Orleans Children’s Hospital of what turned out to be mucormycosis; it proved fatal for several children. Looking back, mistakes were made. Diagnostic biopsies were only done when parents demanded them. Soiled laundry was mishandled. All this at a well-respected tertiary care center staffed by clinicians no doubt as fine as specialists anywhere.
The resulting investigation will no doubt find clinical and administrative gaps and address them. Consciousness will be raised, systems streamlined, oversight tightened. This loophole will be closed. Then others will open, no doubt the way they usually do, when people are looking at something else.
I knew there was something fishy about Peter’s case, but I didn’t know what it was. The experienced and thoughtful academic physicians I sent him to didn’t figure it out, either. It is nice of Peter to be philosophical about this. I would not begrudge him a less considerate reaction.
As for us, we ought to be vigilant, thorough, and humble. Should we get full of ourselves, there’s a hard case out there just waiting to deflate us.
Dr. Rockoff practices dermatology in Brookline, Mass. He is on the clinical faculty at Tufts University, Boston, and has taught senior medical students and other trainees for 30 years. Dr. Rockoff has contributed to the Under My Skin column in Skin & Allergy News since 1997.

Artificial platelets increase survival in injured mice

Credit: Aaron Logan
New research suggests artificial platelets can aid natural platelets in the clotting process, thereby halting internal bleeding faster.
The artificial platelets, called hemostatic nanoparticles, dramatically increased survival rates in mouse models of blast trauma (hemorrhaging resulting from exposure to an explosion).
And the hemostatic nanoparticles did not appear to interfere with healing or cause any other complications for up to 3 weeks after injection.
Erin Lavik, ScD, of Case Western Reserve University in Cleveland, Ohio, and her colleagues recounted these results in Proceedings of the National Academy of Sciences.
Side effects and survival
The researchers developed a full-body-blast mouse model that replicates the injuries seen in people exposed to explosions. And they used these mice to compare the safety and efficacy of the hemostatic nanoparticles to no treatment, control nanoparticles, lactated Ringer’s solution, and rFVIIa.
The survival rate in mice treated with hemostatic nanoparticles increased to 95% at 1 hour post-trauma, compared to 60% for untreated mice. The odds ratio (OR) was 13.
When the researchers compared the hemostatic nanoparticles and lactated Ringer’s solution, the OR was 8.5. For hemostatic nanoparticles vs control nanoparticles, the OR was 7.1. And for hemostatic nanoparticles vs rFVIIa, the OR was 5.5.
Most mice were killed at the 1-hour time point, but the researchers maintained some mice in the nanoparticle groups so they could assess survival at 1 week and 3 weeks after the blast injury and examine the long-term effects of the nanoparticles.
The team said the vast majority of animals that survived at 1 hour lived to the end of the 3-week study. Differences in lethality at 1 week and 3 weeks were not statistically significant.
Furthermore, there were no unwanted side effects, such as accumulation of the nanoparticles, clot formation, or aberrant healing, during examinations at the 1-week and 3-week time points.
About the nanoparticles
The nanoparticles are made from short polymer chains already approved for other uses by the US Food and Drug Administration.
“They are incredibly simple . . . spheres with arms of peptides that react with activated blood platelets in damaged tissues to help clots form more quickly,” Dr Lavik said.
The dry particles remained viable after 2 weeks on a shelf. A medic in the field or an ambulance crew would add saline, shake and inject them, according to the researchers.
In earlier testing, rat models injected with the nanoparticles stopped bleeding faster than untreated models. Further research and testing are underway, and clinical trials are likely at least 5 years out, Dr Lavik said. ![]()