User login
Patent foramen ovale and the risk of cryptogenic stroke
The article by Roth and Alli in this issue describes in depth more than 10 years of research that addresses the question, Should we close a patent foramen ovale (PFO) to prevent recurrent cryptogenic stroke?
There is no longer any doubt that PFO can be the pathway for thrombus from the venous circulation to go from the right atrium to the left atrium, bypassing the pulmonary capillary filtration bed, and entering the arterial side to produce a stroke, myocardial infarction, or peripheral embolus. Two questions remain: What should we do to prevent another episode? And is percutaneous closure of a PFO with the current devices preferable to medical therapy?
How much do we know about the risks and benefits of closure of PFO? I maintain that we know a great deal about interatrial shunt and paradoxical embolism as a cause of cryptogenic stroke. Prospective randomized clinical trials now give us data with which we can provide appropriate direction to our patients. Percutaneous closure is no longer an “experimental procedure,” as insurance companies claim. The experiment has been done, and the only issue is how one interprets the data from the randomized clinical trials.
The review by Roth and Alli comprehensively describes the observational studies, as well as the three randomized clinical trials done to determine whether PFO closure is preferable to medical therapy to prevent recurrent stroke in patients who have already had one cryptogenic stroke. If we understand some of the subtleties and differences between the trials, we can reach an appropriate conclusion as to what to recommend to our patients.
A review of 10 reports of transcatheter closure of PFO vs six reports of medical therapy for cryptogenic stroke showed a range of rates of recurrent stroke at 1 year—between 0% and 4.9% for transcatheter closure, and between 3.8% and 12% for medical therapy.1
These numbers are important because they were used to estimate the number of patients that would be necessary to study in a randomized clinical trial to demonstrate a benefit of PFO closure vs medical therapy. Unlike most studies of new devices, the PFO closure trials were done in an environment in which patients could get their PFO closed with other devices that were already approved by the US Food and Drug Administration (FDA) for closure of an atrial septal defect. This ability of patients to obtain PFO closure outside of the trial with an off-label device meant that the patients who agreed to be randomized tended to have lower risk for recurrence than patients studied in the observational populations. From a practical standpoint, this meant that the event rate in the patients who participated in the randomized clinical trials (1.7% per year) was lower than predicted from the observational studies.2,3
Another way of saying this is that the randomized clinical trials were underpowered to answer the question. A common way of dealing with this problem is to combine the results of different studies in a meta-analysis. This makes sense if the studies are assessing the same thing. This is not the case with the PFO closure trials. Although the topic of percutaneous PFO closure vs medical therapy was the same, the devices used were different.
In the CLOSURE trial (Evaluation of the STARFlex Septal Closure System in Patients With a Stroke and/or Transient Ischemic Attack Due to Presumed Paradoxical Embolism Through a Patent Foramen Ovale),3 the device used was the STARFlex, which is no longer produced—and for good reasons. It is not as effective as the Amplatzer or Helex devices in completely closing the right-to-left shunt produced by a PFO. In addition, the CardioSEAL or STARFlex device increases the risk of atrial fibrillation, which was seen in 6% of the treated patients.3 This was the major cause of recurrent stroke in the CLOSURE trial. The CardioSEAL STARFlex device was also more thrombogenic.
In the RESPECT trial (Randomized Evaluation of Recurrent Stroke Comparing PFO Closure to Established Current Standard of Care Treatment),2 which used the Amplatzer PFO closure device, there was no increased incidence of atrial fibrillation in the device group compared with the control group. Therefore, it is not appropriate to combine the results of the CLOSURE trial with the results of the RESPECT trial and PC trial,4 both of which used the Amplatzer device.
Our patients want to know what the potential risks and benefits will be if they get their PFO closed with a specific device. They don’t want to know the average risk between two different devices.
However, if you do a meta-analysis of the RESPECT and PC trials, which used the same Amplatzer PFO occluder device, and combine the number of patients studied to increase the statistical power, then the benefit of PFO closure is significant even with an intention-to-treat analysis. By combining the two studies that assessed the same device, you reach a completely different interpretation than if you do a meta-analysis including the CLOSURE trial, which showed no benefit.
The medical community should not uncritically accept meta-analysis methodology. It is a marvelous case example of how scientific methods can be inappropriately used and two diametrically opposed conclusions reached if the meta-analysis combines two different types of devices vs a meta-analysis of just the Amplatzer device.
If we combine the numbers from the RESPECT and PC trials, there were 23 strokes in 691 patients (3.3%) in the medical groups and 10 strokes in 703 patients (1.4%) who underwent PFO closure. By chi square analysis of this intention-to-treat protocol, PFO closure provides a statistically significant reduction in preventing recurrent stroke (95% confidence interval 0.20–0.89, P = .02).
From the patient’s perspective, what is important is this: If I get my PFO closed with an Amplatzer PFO occluder device, what are the risks of the procedure, and what are the potential benefits compared with medical therapy? We can now answer that question definitively. I tell my patients, “The risks of the procedure are remarkably low (about 1%) in experienced hands, and the benefit is that your risk of recurrent stroke will be reduced 73%2 compared with medical therapy.” In the RESPECT Trial, the as-treated cohort consisted of 958 patients with 21 primary end-point events (5 in the closure group and 16 in the medical-therapy group). The rate of the primary end point was 0.39 events per 100 patient-years in the closure group vs 1.45 events per 100 patient-years in the medical-therapy group (hazard ratio 0.27; 95% confidence interval 0.10–0.75; P = .007).
Not all cryptogenic strokes in people who have a PFO are caused by paradoxical embolism. PFO may be an innocent bystander. In addition, not all people who have a paradoxical embolism will have a recurrent stroke. For example, if a young woman presents with a PFO and stroke, is it possible that she can prevent another stroke just by stopping her birth-control pills and not have her PFO closed? What is the risk of recurrent stroke if she were to become pregnant? We do not know the answers to these questions.
Your patients do not want to wait to find out if they are going to have another stroke. The meta-analysis of the randomized clinical trials for paradoxical embolism demonstrates that the closure devices are safe and effective. The FDA should approve the Amplatzer PFO occluder with an indication to prevent recurrent stroke in patients with PFO and an initial cryptogenic event.
- Khairy P, O’Donnell CP, Landzberg MJ. Transcatheter closure versus medical therapy of patent foramen ovale and presumed paradoxical thromboemboli: a systematic review. Ann Intern Med 2003; 139:753–760.
- Carroll JD, Saver JL, Thaler DE, et al; RESPECT Investigators. Closure of patent foramen ovale versus medical therapy after cryptogenic stroke. N Engl J Med 2013; 368:1092–1100.
- Furlan AJ, Reisman M, Massaro J, et al; CLOSURE Investigators. Closure or medical therapy for cryptogenic stroke with patent foramen ovale. N Engl J Med 2012; 366:991–999.
- Meier B, Kalesan B, Mattle HP, et al; PC Trial Investigators. Percutaneous closure of patent foramen ovale in cryptogenic embolism. N Engl J Med 2013; 368:1083–1091.
The article by Roth and Alli in this issue describes in depth more than 10 years of research that addresses the question, Should we close a patent foramen ovale (PFO) to prevent recurrent cryptogenic stroke?
There is no longer any doubt that PFO can be the pathway for thrombus from the venous circulation to go from the right atrium to the left atrium, bypassing the pulmonary capillary filtration bed, and entering the arterial side to produce a stroke, myocardial infarction, or peripheral embolus. Two questions remain: What should we do to prevent another episode? And is percutaneous closure of a PFO with the current devices preferable to medical therapy?
How much do we know about the risks and benefits of closure of PFO? I maintain that we know a great deal about interatrial shunt and paradoxical embolism as a cause of cryptogenic stroke. Prospective randomized clinical trials now give us data with which we can provide appropriate direction to our patients. Percutaneous closure is no longer an “experimental procedure,” as insurance companies claim. The experiment has been done, and the only issue is how one interprets the data from the randomized clinical trials.
The review by Roth and Alli comprehensively describes the observational studies, as well as the three randomized clinical trials done to determine whether PFO closure is preferable to medical therapy to prevent recurrent stroke in patients who have already had one cryptogenic stroke. If we understand some of the subtleties and differences between the trials, we can reach an appropriate conclusion as to what to recommend to our patients.
A review of 10 reports of transcatheter closure of PFO vs six reports of medical therapy for cryptogenic stroke showed a range of rates of recurrent stroke at 1 year—between 0% and 4.9% for transcatheter closure, and between 3.8% and 12% for medical therapy.1
These numbers are important because they were used to estimate the number of patients that would be necessary to study in a randomized clinical trial to demonstrate a benefit of PFO closure vs medical therapy. Unlike most studies of new devices, the PFO closure trials were done in an environment in which patients could get their PFO closed with other devices that were already approved by the US Food and Drug Administration (FDA) for closure of an atrial septal defect. This ability of patients to obtain PFO closure outside of the trial with an off-label device meant that the patients who agreed to be randomized tended to have lower risk for recurrence than patients studied in the observational populations. From a practical standpoint, this meant that the event rate in the patients who participated in the randomized clinical trials (1.7% per year) was lower than predicted from the observational studies.2,3
Another way of saying this is that the randomized clinical trials were underpowered to answer the question. A common way of dealing with this problem is to combine the results of different studies in a meta-analysis. This makes sense if the studies are assessing the same thing. This is not the case with the PFO closure trials. Although the topic of percutaneous PFO closure vs medical therapy was the same, the devices used were different.
In the CLOSURE trial (Evaluation of the STARFlex Septal Closure System in Patients With a Stroke and/or Transient Ischemic Attack Due to Presumed Paradoxical Embolism Through a Patent Foramen Ovale),3 the device used was the STARFlex, which is no longer produced—and for good reasons. It is not as effective as the Amplatzer or Helex devices in completely closing the right-to-left shunt produced by a PFO. In addition, the CardioSEAL or STARFlex device increases the risk of atrial fibrillation, which was seen in 6% of the treated patients.3 This was the major cause of recurrent stroke in the CLOSURE trial. The CardioSEAL STARFlex device was also more thrombogenic.
In the RESPECT trial (Randomized Evaluation of Recurrent Stroke Comparing PFO Closure to Established Current Standard of Care Treatment),2 which used the Amplatzer PFO closure device, there was no increased incidence of atrial fibrillation in the device group compared with the control group. Therefore, it is not appropriate to combine the results of the CLOSURE trial with the results of the RESPECT trial and PC trial,4 both of which used the Amplatzer device.
Our patients want to know what the potential risks and benefits will be if they get their PFO closed with a specific device. They don’t want to know the average risk between two different devices.
However, if you do a meta-analysis of the RESPECT and PC trials, which used the same Amplatzer PFO occluder device, and combine the number of patients studied to increase the statistical power, then the benefit of PFO closure is significant even with an intention-to-treat analysis. By combining the two studies that assessed the same device, you reach a completely different interpretation than if you do a meta-analysis including the CLOSURE trial, which showed no benefit.
The medical community should not uncritically accept meta-analysis methodology. It is a marvelous case example of how scientific methods can be inappropriately used and two diametrically opposed conclusions reached if the meta-analysis combines two different types of devices vs a meta-analysis of just the Amplatzer device.
If we combine the numbers from the RESPECT and PC trials, there were 23 strokes in 691 patients (3.3%) in the medical groups and 10 strokes in 703 patients (1.4%) who underwent PFO closure. By chi square analysis of this intention-to-treat protocol, PFO closure provides a statistically significant reduction in preventing recurrent stroke (95% confidence interval 0.20–0.89, P = .02).
From the patient’s perspective, what is important is this: If I get my PFO closed with an Amplatzer PFO occluder device, what are the risks of the procedure, and what are the potential benefits compared with medical therapy? We can now answer that question definitively. I tell my patients, “The risks of the procedure are remarkably low (about 1%) in experienced hands, and the benefit is that your risk of recurrent stroke will be reduced 73%2 compared with medical therapy.” In the RESPECT Trial, the as-treated cohort consisted of 958 patients with 21 primary end-point events (5 in the closure group and 16 in the medical-therapy group). The rate of the primary end point was 0.39 events per 100 patient-years in the closure group vs 1.45 events per 100 patient-years in the medical-therapy group (hazard ratio 0.27; 95% confidence interval 0.10–0.75; P = .007).
Not all cryptogenic strokes in people who have a PFO are caused by paradoxical embolism. PFO may be an innocent bystander. In addition, not all people who have a paradoxical embolism will have a recurrent stroke. For example, if a young woman presents with a PFO and stroke, is it possible that she can prevent another stroke just by stopping her birth-control pills and not have her PFO closed? What is the risk of recurrent stroke if she were to become pregnant? We do not know the answers to these questions.
Your patients do not want to wait to find out if they are going to have another stroke. The meta-analysis of the randomized clinical trials for paradoxical embolism demonstrates that the closure devices are safe and effective. The FDA should approve the Amplatzer PFO occluder with an indication to prevent recurrent stroke in patients with PFO and an initial cryptogenic event.
- Khairy P, O’Donnell CP, Landzberg MJ. Transcatheter closure versus medical therapy of patent foramen ovale and presumed paradoxical thromboemboli: a systematic review. Ann Intern Med 2003; 139:753–760.
- Carroll JD, Saver JL, Thaler DE, et al; RESPECT Investigators. Closure of patent foramen ovale versus medical therapy after cryptogenic stroke. N Engl J Med 2013; 368:1092–1100.
- Furlan AJ, Reisman M, Massaro J, et al; CLOSURE Investigators. Closure or medical therapy for cryptogenic stroke with patent foramen ovale. N Engl J Med 2012; 366:991–999.
- Meier B, Kalesan B, Mattle HP, et al; PC Trial Investigators. Percutaneous closure of patent foramen ovale in cryptogenic embolism. N Engl J Med 2013; 368:1083–1091.
Swelling and pain 2 weeks after a dog bite
A 48-year-old man with gout, multiple sclerosis, and previously treated methicillin-resistant Staphylococcus aureus (MRSA) infection presented to the emergency room with pain and significant swelling at the site of a dog bite on his left forearm. He had been bitten 2 weeks earlier by a friend’s dog, and the bite had punctured the skin. He also had red streaking on the skin of the left arm from the wrist to the elbow, and he reported feeling “feverish” and having night sweats.
At first, the bite had seemed to improve, then swelling and pain had developed and increased. He reported this to his primary care physician, along with the information that he had previously had an anaphylactic reaction to penicillin and a cephalosporin. His physician, considering a penicillin allergy, started him on ciprofloxacin (Cipro) plus clindamycin (Cleocin). The patient took this for 5 days, but without improvement. The appearance of the red streaking on his left forearm prompted his presentation to our emergency room.
ORGANISMS IN DOG BITES
1. Which is the most common cause of infected dog bite?
- Pasteurella canis
- Streptococci and S aureus
- Erysipelothrix rhusiopathiae
- Capnocytophaga canimorsus
- Eikenella corrodens
Streptococci (50%) and S aureus (20% to 40%) are the organisms most commonly responsible for infected dog bites, as they are for other skin and soft-tissue infections.1P canis is unique to dog bite infections but accounts for only 18%.2E rhusiopathiae is an unusual isolate from cat and dog bites and is more commonly isolated from the mouths of fish and aquatic mammals. C canimorsus is a normal inhabitant of the oral cavity of dogs and cats but an unusual cause of wound infection from a dog bite. It is notable for sepsis and central nervous system infections uniquely associated with veterinarians, dog owners, kennel workers, and mail carriers.3E corrodens infection is more common with human bites.4
THE EVALUATION BEGINS
On examination, the patient had marked edema of the left forearm and pain in the joints of the left hand. His temperature was 100.2°F (37.9°C). Because of the duration and severity of symptoms, the examining physician was concerned about septic arthritis of the wrist, and the patient was admitted to the hospital.
In the hospital, our patient was thermodynamically stable without documented fever or chills. There was no open wound to culture, and blood cultures were negative. Marked edema and joint involvement raised suspicion of erysipeloid. This “cousin” of erysipelas often involves the underlying joint, is associated with edema, and produces systemic manifestations of fever and arthralgia.
Radiography of the left forearm and hand demonstrated multiple foci of demineralization within the carpal bones and proximal radius, attributed to disuse. Magnetic resonance imaging (MRI) the next day showed multiple bone infarcts in the carpal bones and the distal radius, with synovitis and fluid in the carpal joints and without adjacent osteomyelitis. Fluid was also seen in the soft tissues in the ulnar aspect of the left wrist, and tenosynovitis involving the flexor carpi radialis tendon was noted.
Arthrocentesis of his left radiocarpal joint produced synovial fluid negative for crystals and negative on Gram stain; the fluid was also sent for culture. The patient’s tetanus immunization was current, and the dog was known to have been immunized against rabies.
ANTIBIOTICS FOR INFECTED DOG BITES
2. Which antibiotic regimen would you choose for this patient?
- Oral amoxicillin and clavulanate
- Meropenem
- Vancomycin, clindamycin, aztreonam
- Clindamycin and levofloxacin
- Clindamycin and trimethoprim-sulfamethoxazole
Oral amoxicillin and clavulanate (Augmentin) is a judicious choice for prophylactic treatment of deep bites in the early stages of infection. However, our patient’s wound was no longer in the early stages of infection, and he had a history of an adverse reaction to penicillin.
Meropenem (Merrem IV) cross-reacts minimally with penicillin allergy and is reported to be safe in patients with a history of anaphylactic reactions to penicillin,5 but overuse of carbapenems has led to the development of carbapenem-resistant strains of Klebsiella, Stenotrophomonas, and Acinetobacter organisms.
Given the rise of MRSA infections and the common involvement of staphylococci, streptococci, and anaerobic bacteria in complicated dog bites, the combination of vancomycin and clindamycin is a good choice, and aztreonam (Azactam) would add empiric coverage of gram-negative enteric organisms.
Levofloxacin (Levaquin) also covers gramnegative enteric organisms, but Fusobacterium canifelinum, a common anaerobe in the oral flora of dogs and cats, is intrinsically resistant to fluoroquinolones.
Clindamycin and levofloxacin would be a good step-down oral regimen. Pasteurella multocida has variable sensitivity to the commonly used agents dicloxacillin (Dynapen), cephalexin (Keflex), macrolides, and clindamycin, but it is a less likely pathogen at this late stage and could be covered with levofloxacin alone.
C canimorsus is resistant to trimethoprim-sulfamethoxazole (Bactrim) and cephalexin, but is well covered by clindamycin.6
CASE CONTINUED
Our patient was started on intravenous vancomycin, clindamycin, and aztreonam for coverage of dog-mouth flora. Blood cultures and cultures of synovial fluid of the left wrist were negative. Vancomycin was discontinued after 48 hours when blood cultures did not grow staphylococcal organisms, but clindamycin and aztreonam were continued for a total of 8 days to treat possible infection with anaerobic and gram-negative enteric pathogens.
To test for autonomic dysfunction, a plastic pen case drawn lightly across each forearm revealed a loss of tactile adherence (ie, areas where moist, sweaty skin impeded the movement of the pen case) on the affected forearm, a sign of underlying nerve injury. The affected forearm was sensitive to light touch, with pain out of proportion to the stimulus.
ARRIVING AT THE DIAGNOSIS
Based on the wide distribution of inflammation, autonomic dysfunction (shown by differences in temperature and sweating), radiographic evidence of demineralization, hyperesthesia, and lack of improvement in pain and swelling after two courses of antibiotics, the patient’s clinical course was determined to be consistent with complex regional pain syndrome type 1, previously referred to as reflex sympathetic dystrophy.
Symptoms of complex regional pain syndrome traditionally include pain, regional edema, joint stiffness, muscular atrophy, vasomotor disturbances (causing temperature variability and erythema), regional diaphoresis, and localized skeletal demineralization on radiography.
Complex regional pain syndrome type 1 occurs as regional pain and inflammation as an excessive sympathetic reaction to an often minor insult, without nerve injury. When the syndrome occurs in a patient with obvious partial nerve injury, it is categorized as type 2 (formerly known as causalgia). The two types are clinically indistinguishable and are not uncommon. About 10% of all patients with complex regional pain syndrome have obvious nerve injury (complex regional pain syndrome type 2). In a study of 109 patients with Colles fracture, 25% developed symptoms of complex regional pain syndrome.7
Complex regional pain syndrome is difficult to diagnose, as it resembles many other ailments, such as gout, infection, bone tumor, stress fracture, and arthritis. Its pathophysiology is poorly understood, but it is believed to result from a “short circuit” in the reflex arc between somatic afferent sensory fibers and autonomic sympathetic efferent fibers, and this is thought to explain the increased sympathetic stimulation.
Although the pathophysiology is likely the same in type 1 and type 2, electromyography with a nerve conduction study is a reliable way to detect nerve damage and thus distinguish between the two types of complex regional pain syndrome.8
Our understanding of this syndrome is evolving. A recent study using sensory testing showed that 33% of patients with type 1 had combinations of increased and decreased thresholds for the detection of thermal, vibratory, and mechanical stimuli in the distribution of discrete peripheral nerves, suggesting that the patients actually had type 2.9
CONFIRMING COMPLEX REGIONAL PAIN SYNDROME TYPE 1
3. Which of the following is the best way to confirm complex regional pain syndrome type 1?
- Erythrocyte sedimentation rate, C-reactive protein, and complete blood cell count
- Plain radiography of the hand and forearm
- Three-phase technetium bone scan
- The Budapest diagnostic criteria
- MRI
- Autonomic testing
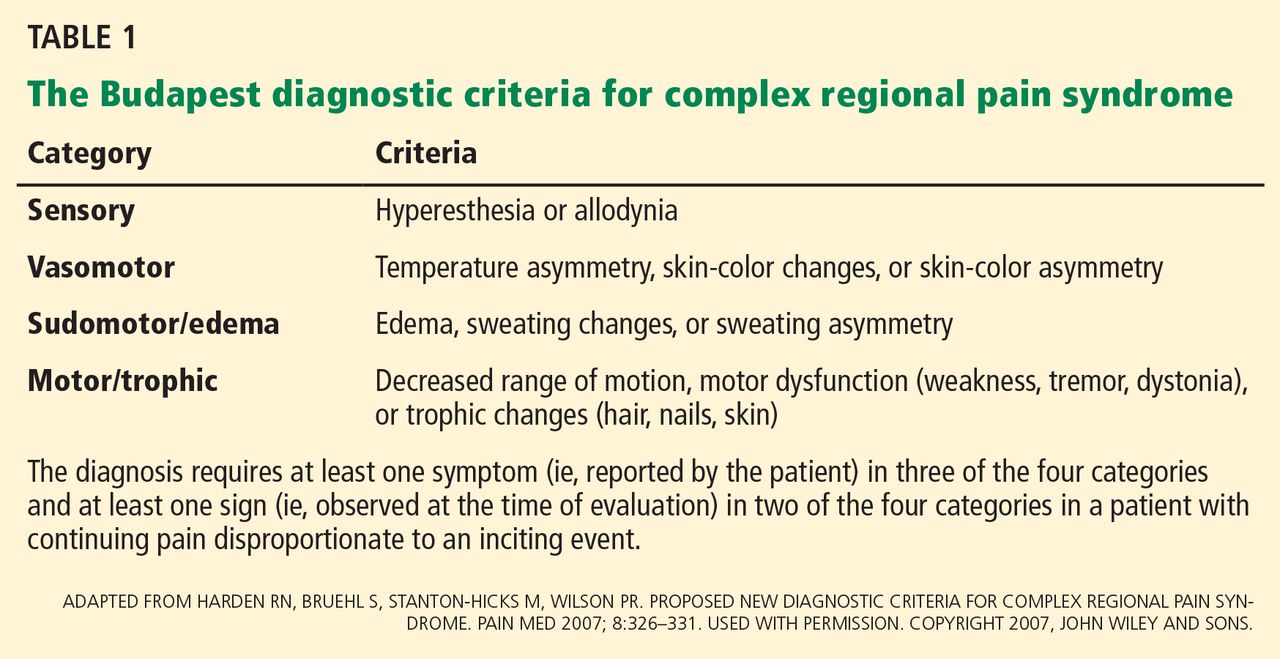
Complex regional pain syndrome type 1 is a clinical diagnosis. Diagnostic studies lack sensitivity and specificity but may confirm complex regional pain syndrome type 1 or rule out other diagnoses. The Budapest diagnostic criteria10 (Table 1) may be the best way to confirm this diagnosis. The criteria are as follows: continuing pain disproportionate to an inciting event, coupled with three of four symptoms plus at least one sign from sensory, vasomotor, sudomotor, and motor-trophic categories.
Laboratory tests are not helpful because acute-phase reactants and blood counts remain normal in these patients.
Plain radiography is not sensitive in early diagnosis, but at 2 weeks it may show patchy areas of osteopenia in adjacent bones throughout the region, as well as subsequent diffuse demineralization.
Three-phase bone scanning is more sensitive than plain radiography, with 75% of patients showing regional disparities in blood flow in early sequences and increased bone uptake in the later sequences.
MRI is a sensitive early test, as it better defines focal areas of bone loss and increased T2 bone signal in adjacent bone, as well as early soft-tissue changes. Computed tomography does not show early specific changes in muscle, tendon, or bone and so is not recommended.
THE EVALUATION CONTINUES
The admitting diagnosis was septic arthritis, and our patient underwent computed tomography, which showed focal demineralization that could have represented bone infarcts or infection, confounding the diagnosis of complex regional pain syndrome.
Autonomic nerve testing can help distinguish complex regional pain syndrome from other disorders. Complex regional pain syndrome is characterized by increased sympathetic activity and results in increased sweat output. Autonomic testing includes resting sweat output, resting skin temperature, and quantitative sudomotor axon reflex testing. In one study, an increase in resting sweat output used in conjunction with quantitative sudomotor axon reflex testing predicted the diagnosis of complex regional pain syndrome with a specificity of 98%.11 However, autonomic testing is limited to academic centers and is not readily available.
TREATING COMPLEX REGIONAL PAIN SYNDROME TYPE 1
4. Which is the best first-line therapy for complex regional pain syndrome type 1?
- Stellate ganglion nerve block
- Occupational therapy to splint the wrist and forearm
- Oral corticosteroids
- Physical therapy to prevent loss of joint motion
- Tricyclic antidepressant drugs (eg, amitriptyline), pregabalin, and bisphosphonates
Physical therapy should be started early in all patients, with range-of-motion exercises to prevent contracture and enhance mobility.
Stellate ganglion nerve block has been used to counter severe sympathetic hyperactivity, but it also may aggravate symptoms of complex regional pain syndrome and so remains a controversial treatment.
Immobilization and splinting should be avoided, as this will augment edema, pain, and contracture of joints.
Corticosteroids do not shorten the course or assuage symptoms and may increase edema.
Amitriptyline (Elavil) and pregabalin (Lyrica) have been used successfully to counter extended courses of allodynia and hyperalgesia. Bisphosphonates may decrease bone loss and pain and may be needed should the course be complicated by myositis ossificans, a form of dystrophic bone formation in juxtaposed tendon and muscle related to neuroactivation of fibroblasts and osteoblasts.
THE COURSE OF COMPLEX REGIONAL PAIN SYNDROME
Traditionally, type 1 was divided into three stages—an early inflammatory stage, a dystrophic stage, and a late atrophic stage.12 Although there is no evidence to support a consistent three-stage evolution, the severity of symptoms may help determine the best approach to management.13
Patients initially exhibit burning or throbbing pain, diffuse aching, sensitivity to touch or cold (allodynia), localized edema, and vasomotor disturbances of variable intensity that may produce altered color and temperature. Topical capsaicin cream; a tricyclic antidepressant; an anticonvulsant such as gabapentin (Neurontin), pregabalin, or lamotrigine (Lamictal); or a nonsteroidal anti-inflammatory drug should be tried first. Some of these treatments are poorly tolerated in elderly patients. If pain persists, nasal calcitonin may be added. Trigger-point injections with an anesthetic or glucocorticoid may be tried.
The management of early complex regional pain syndrome is sometimes supplemented with systemic corticosteroids, but reviews of randomized controlled trials have failed to show efficacy.14
Later in the course, patients may suffer persistent soft-tissue edema, accompanied by thickening of the skin and periarticular soft tissues, muscle wasting, and the skin changes of brawny edema. Regional blockade of sympathetic ganglions, epidural administration of clonidine, implantable peripheral nerve stimulators, and spinal cord stimulators have all been applied by experts in pain management and may provide benefit. Progression of the syndrome may include cyanosis, mottling, increased sweating, abnormal hair growth, and diffuse swelling in nonarticular tissue.
It is always acceptable to refer to an experienced pain management specialist, and a multidisciplinary approach is recommended at the outset.12
OUR PATIENT’S CARE CONTINUED
Our patient’s forearm and wrist were placed in a sling to keep his left arm elevated when active. This helped control sympathetic vascular edema and throbbing pain. Physical therapy with range-of-motion exercises prevented contracture.
He was discharged home on limited oxycodone as needed, with close follow-up by his primary care physician to monitor his pain symptoms. The pain and swelling slowly improved over the next 2 months, but he suffered a fall, twisting his left wrist. This minor injury was followed by more intense pain and swelling of the forearm, hand, and wrist.
COMORBIDITIES
5. Which of the following statements about conditions associated with complex regional pain syndrome most likely applies to our patient?
- Gout is likely following minor trauma
- Minor trauma or surgical bone biopsy may reactivate complex regional pain syndrome
- Septic hip arthritis due to MRSA may have reemerged and seeded the wrist
- Patients with multiple sclerosis have a propensity for complex regional pain syndrome
- Complex regional pain syndrome type 1 begets type 2
Gout does follow minor injury, but our patient’s uric acid was well controlled on allopurinol (Zyloprim), and gout is unlikely to be causing polyarticular swelling of the hand, wrist, and forearm.
Minor trauma, sometimes inconsequential enough to have been completely forgotten, may either initiate complex regional pain syndrome or, as seen here, reactivate it. Bone changes seen on MRI sometimes trigger surgical bone biopsy, only to reactivate the dysesthesia and sympathetic vascular reaction. Surgery should be avoided. Trauma and surgery are causative rather than associative comorbidities.
Sepsis due to MRSA after total hip arthroplasty may be reactivated, especially in the setting of immunosuppressive treatment. But the diffuse bone changes seen in multiple carpal, radial, and ulnar bones suggest generalized vascular and sympathetic disarray, most consistent with complex regional pain syndrome type 1.
AN ASSOCIATION WITH MULTIPLE SCLEROSIS?
Multiple sclerosis and other central neuropathic conditions such as stroke are associated with complex regional pain syndrome type 1.15,16
A hypothetical cause for the higher prevalence of complex regional pain syndrome in patients with multiple sclerosis may be demyelination resulting in aberrant signaling and overreaction to distal pain receptors. Demyelination of neurons within the autonomic or spinothalamic tracts potentially increases susceptibility to development of the pain syndrome.
Our patient had an apparent stimulus for the development of the syndrome, ie, the initial dog bite, and the wrist injury later may have caused peripheral nerve injury. Such injury may lead to release of vasodilatory neuropeptides including substance P from stimulated cutaneous nerves with cell bodies in the dorsal root ganglia. Excessive vasodilation and increased vascular permeability result in the affected limb becoming edematous and causing cutaneous nerves to be further activated. Stimulated cutaneous neurons normally have an inhibitory influence on sympathetic activity at the level of entry of the dorsal root ganglia in the cord. In complex regional pain syndrome, this inhibition is lost, resulting in a hyperactive somatosympathetic reflex.17 Underlying multiple sclerosis may have contributed to the loss of inhibition by the cutaneous nerves on the sympathetic system.
CASE CONCLUDED
We continued to closely follow this patient, who was on a self-directed program of physical therapy. One year after the original dog bite, the complex regional pain syndrome had completely resolved.
- Talan DA, Citron DM, Abrahamian FM, Moran GJ, Goldstein EJ. Bacteriologic analysis of infected dog and cat bites. Emergency Medicine Animal Bite Infection Study Group. N Engl J Med 1999; 340:85–92.
- Holst E, Rollof J, Larsson L, Nielsen JP. Characterization and distribution of Pasteurella species recovered from infected humans. J Clin Microbiol 1992; 30:2984–2987.
- Jolivet-Gougeon A, Sixou JL, Tamanai-Shacoori Z, Bonnaure-Mallet M. Antimicrobial treatment of Capnocytophaga infections. Int J Antimicrob Agents 2007; 29:367–373.
- Paul K, Patel SS. Eikenella corrodens infections in children and adolescents: case reports and review of the literature. Clin Infect Dis 2001; 33:54–61.
- Cunha BA, Hamid NS, Krol V, Eisenstein L. Safety of meropenem in patients reporting penicillin allergy: lack of allergic cross reactions. J Chemother 2008; 20:233–237.
- Verghese A, Hamati F, Berk S, Franzus B, Berk S, Smith JK. Susceptibility of dysgonic fermenter 2 to antimicrobial agents in vitro. Antimicrob Agents Chemother 1988; 32:78–80.
- Atkins RM, Duckworth T, Kanis JA. Algodystrophy following Colles’ fracture. J Hand Surg Br 1989; 14:161–164.
- Rommel O, Malin JP, Zenz M, Jänig W. Quantitative sensory testing, neurophysiological and psychological examination in patients with complex regional pain syndrome and hemisensory deficits. Pain 2001; 93:279–293.
- Sethna NF, Meier PM, Zurakowski D, Berde CB. Cutaneous sensory abnormalities in children and adolescents with complex regional pain syndromes. Pain 2007; 131:153–161.
- Harden RN, Bruehl S, Stanton-Hicks M, Wilson PR. Proposed new diagnostic criteria for complex regional pain syndrome. Pain Med 2007; 8:326–331.
- Chelimsky TC, Low PA, Naessens JM, Wilson PR, Amadio PC, O’Brien PC. Value of autonomic testing in reflex sympathetic dystrophy. Mayo Clin Proc 1995; 70:1029–1040.
- Stanton-Hicks MD, Burton AW, Bruehl SP, et al. An updated interdisciplinary clinical pathway for CRPS: report of an expert panel. Pain Pract 2002; 2:1–16.
- Brummett CM, Cohen SP, eds. Managing pain: essentials of diagnosis and treatment. New York; Oxford University Press; 2013.
- Dirckx M, Stronks DL, Groeneweg G, Huygen FJ. Effect of immunomodulating medications in complex regional pain syndrome: a systematic review. Clin J Pain 2012; 28:355–363.
- Schwartzman RJ, Gurusinghe C, Gracely E. Prevalence of complex regional pain syndrome in a cohort of multiple sclerosis patients. Pain Physician 2008; 11:133–136.
- Sandroni P, Benrud-Larson LM, McClelland RL, Low PA. Complex regional pain syndrome type I: incidence and prevalence in Olmsted county, a population-based study. Pain 2003; 103:199–207.
- Kurvers HA, Jacobs MJ, Beuk RJ, et al. Reflex sympathetic dystrophy: evolution of microcirculatory disturbances in time. Pain 1995; 60:333–340.
A 48-year-old man with gout, multiple sclerosis, and previously treated methicillin-resistant Staphylococcus aureus (MRSA) infection presented to the emergency room with pain and significant swelling at the site of a dog bite on his left forearm. He had been bitten 2 weeks earlier by a friend’s dog, and the bite had punctured the skin. He also had red streaking on the skin of the left arm from the wrist to the elbow, and he reported feeling “feverish” and having night sweats.
At first, the bite had seemed to improve, then swelling and pain had developed and increased. He reported this to his primary care physician, along with the information that he had previously had an anaphylactic reaction to penicillin and a cephalosporin. His physician, considering a penicillin allergy, started him on ciprofloxacin (Cipro) plus clindamycin (Cleocin). The patient took this for 5 days, but without improvement. The appearance of the red streaking on his left forearm prompted his presentation to our emergency room.
ORGANISMS IN DOG BITES
1. Which is the most common cause of infected dog bite?
- Pasteurella canis
- Streptococci and S aureus
- Erysipelothrix rhusiopathiae
- Capnocytophaga canimorsus
- Eikenella corrodens
Streptococci (50%) and S aureus (20% to 40%) are the organisms most commonly responsible for infected dog bites, as they are for other skin and soft-tissue infections.1P canis is unique to dog bite infections but accounts for only 18%.2E rhusiopathiae is an unusual isolate from cat and dog bites and is more commonly isolated from the mouths of fish and aquatic mammals. C canimorsus is a normal inhabitant of the oral cavity of dogs and cats but an unusual cause of wound infection from a dog bite. It is notable for sepsis and central nervous system infections uniquely associated with veterinarians, dog owners, kennel workers, and mail carriers.3E corrodens infection is more common with human bites.4
THE EVALUATION BEGINS
On examination, the patient had marked edema of the left forearm and pain in the joints of the left hand. His temperature was 100.2°F (37.9°C). Because of the duration and severity of symptoms, the examining physician was concerned about septic arthritis of the wrist, and the patient was admitted to the hospital.
In the hospital, our patient was thermodynamically stable without documented fever or chills. There was no open wound to culture, and blood cultures were negative. Marked edema and joint involvement raised suspicion of erysipeloid. This “cousin” of erysipelas often involves the underlying joint, is associated with edema, and produces systemic manifestations of fever and arthralgia.
Radiography of the left forearm and hand demonstrated multiple foci of demineralization within the carpal bones and proximal radius, attributed to disuse. Magnetic resonance imaging (MRI) the next day showed multiple bone infarcts in the carpal bones and the distal radius, with synovitis and fluid in the carpal joints and without adjacent osteomyelitis. Fluid was also seen in the soft tissues in the ulnar aspect of the left wrist, and tenosynovitis involving the flexor carpi radialis tendon was noted.
Arthrocentesis of his left radiocarpal joint produced synovial fluid negative for crystals and negative on Gram stain; the fluid was also sent for culture. The patient’s tetanus immunization was current, and the dog was known to have been immunized against rabies.
ANTIBIOTICS FOR INFECTED DOG BITES
2. Which antibiotic regimen would you choose for this patient?
- Oral amoxicillin and clavulanate
- Meropenem
- Vancomycin, clindamycin, aztreonam
- Clindamycin and levofloxacin
- Clindamycin and trimethoprim-sulfamethoxazole
Oral amoxicillin and clavulanate (Augmentin) is a judicious choice for prophylactic treatment of deep bites in the early stages of infection. However, our patient’s wound was no longer in the early stages of infection, and he had a history of an adverse reaction to penicillin.
Meropenem (Merrem IV) cross-reacts minimally with penicillin allergy and is reported to be safe in patients with a history of anaphylactic reactions to penicillin,5 but overuse of carbapenems has led to the development of carbapenem-resistant strains of Klebsiella, Stenotrophomonas, and Acinetobacter organisms.
Given the rise of MRSA infections and the common involvement of staphylococci, streptococci, and anaerobic bacteria in complicated dog bites, the combination of vancomycin and clindamycin is a good choice, and aztreonam (Azactam) would add empiric coverage of gram-negative enteric organisms.
Levofloxacin (Levaquin) also covers gramnegative enteric organisms, but Fusobacterium canifelinum, a common anaerobe in the oral flora of dogs and cats, is intrinsically resistant to fluoroquinolones.
Clindamycin and levofloxacin would be a good step-down oral regimen. Pasteurella multocida has variable sensitivity to the commonly used agents dicloxacillin (Dynapen), cephalexin (Keflex), macrolides, and clindamycin, but it is a less likely pathogen at this late stage and could be covered with levofloxacin alone.
C canimorsus is resistant to trimethoprim-sulfamethoxazole (Bactrim) and cephalexin, but is well covered by clindamycin.6
CASE CONTINUED
Our patient was started on intravenous vancomycin, clindamycin, and aztreonam for coverage of dog-mouth flora. Blood cultures and cultures of synovial fluid of the left wrist were negative. Vancomycin was discontinued after 48 hours when blood cultures did not grow staphylococcal organisms, but clindamycin and aztreonam were continued for a total of 8 days to treat possible infection with anaerobic and gram-negative enteric pathogens.
To test for autonomic dysfunction, a plastic pen case drawn lightly across each forearm revealed a loss of tactile adherence (ie, areas where moist, sweaty skin impeded the movement of the pen case) on the affected forearm, a sign of underlying nerve injury. The affected forearm was sensitive to light touch, with pain out of proportion to the stimulus.
ARRIVING AT THE DIAGNOSIS
Based on the wide distribution of inflammation, autonomic dysfunction (shown by differences in temperature and sweating), radiographic evidence of demineralization, hyperesthesia, and lack of improvement in pain and swelling after two courses of antibiotics, the patient’s clinical course was determined to be consistent with complex regional pain syndrome type 1, previously referred to as reflex sympathetic dystrophy.
Symptoms of complex regional pain syndrome traditionally include pain, regional edema, joint stiffness, muscular atrophy, vasomotor disturbances (causing temperature variability and erythema), regional diaphoresis, and localized skeletal demineralization on radiography.
Complex regional pain syndrome type 1 occurs as regional pain and inflammation as an excessive sympathetic reaction to an often minor insult, without nerve injury. When the syndrome occurs in a patient with obvious partial nerve injury, it is categorized as type 2 (formerly known as causalgia). The two types are clinically indistinguishable and are not uncommon. About 10% of all patients with complex regional pain syndrome have obvious nerve injury (complex regional pain syndrome type 2). In a study of 109 patients with Colles fracture, 25% developed symptoms of complex regional pain syndrome.7
Complex regional pain syndrome is difficult to diagnose, as it resembles many other ailments, such as gout, infection, bone tumor, stress fracture, and arthritis. Its pathophysiology is poorly understood, but it is believed to result from a “short circuit” in the reflex arc between somatic afferent sensory fibers and autonomic sympathetic efferent fibers, and this is thought to explain the increased sympathetic stimulation.
Although the pathophysiology is likely the same in type 1 and type 2, electromyography with a nerve conduction study is a reliable way to detect nerve damage and thus distinguish between the two types of complex regional pain syndrome.8
Our understanding of this syndrome is evolving. A recent study using sensory testing showed that 33% of patients with type 1 had combinations of increased and decreased thresholds for the detection of thermal, vibratory, and mechanical stimuli in the distribution of discrete peripheral nerves, suggesting that the patients actually had type 2.9
CONFIRMING COMPLEX REGIONAL PAIN SYNDROME TYPE 1
3. Which of the following is the best way to confirm complex regional pain syndrome type 1?
- Erythrocyte sedimentation rate, C-reactive protein, and complete blood cell count
- Plain radiography of the hand and forearm
- Three-phase technetium bone scan
- The Budapest diagnostic criteria
- MRI
- Autonomic testing
Complex regional pain syndrome type 1 is a clinical diagnosis. Diagnostic studies lack sensitivity and specificity but may confirm complex regional pain syndrome type 1 or rule out other diagnoses. The Budapest diagnostic criteria10 (Table 1) may be the best way to confirm this diagnosis. The criteria are as follows: continuing pain disproportionate to an inciting event, coupled with three of four symptoms plus at least one sign from sensory, vasomotor, sudomotor, and motor-trophic categories.
Laboratory tests are not helpful because acute-phase reactants and blood counts remain normal in these patients.
Plain radiography is not sensitive in early diagnosis, but at 2 weeks it may show patchy areas of osteopenia in adjacent bones throughout the region, as well as subsequent diffuse demineralization.
Three-phase bone scanning is more sensitive than plain radiography, with 75% of patients showing regional disparities in blood flow in early sequences and increased bone uptake in the later sequences.
MRI is a sensitive early test, as it better defines focal areas of bone loss and increased T2 bone signal in adjacent bone, as well as early soft-tissue changes. Computed tomography does not show early specific changes in muscle, tendon, or bone and so is not recommended.
THE EVALUATION CONTINUES
The admitting diagnosis was septic arthritis, and our patient underwent computed tomography, which showed focal demineralization that could have represented bone infarcts or infection, confounding the diagnosis of complex regional pain syndrome.
Autonomic nerve testing can help distinguish complex regional pain syndrome from other disorders. Complex regional pain syndrome is characterized by increased sympathetic activity and results in increased sweat output. Autonomic testing includes resting sweat output, resting skin temperature, and quantitative sudomotor axon reflex testing. In one study, an increase in resting sweat output used in conjunction with quantitative sudomotor axon reflex testing predicted the diagnosis of complex regional pain syndrome with a specificity of 98%.11 However, autonomic testing is limited to academic centers and is not readily available.
TREATING COMPLEX REGIONAL PAIN SYNDROME TYPE 1
4. Which is the best first-line therapy for complex regional pain syndrome type 1?
- Stellate ganglion nerve block
- Occupational therapy to splint the wrist and forearm
- Oral corticosteroids
- Physical therapy to prevent loss of joint motion
- Tricyclic antidepressant drugs (eg, amitriptyline), pregabalin, and bisphosphonates
Physical therapy should be started early in all patients, with range-of-motion exercises to prevent contracture and enhance mobility.
Stellate ganglion nerve block has been used to counter severe sympathetic hyperactivity, but it also may aggravate symptoms of complex regional pain syndrome and so remains a controversial treatment.
Immobilization and splinting should be avoided, as this will augment edema, pain, and contracture of joints.
Corticosteroids do not shorten the course or assuage symptoms and may increase edema.
Amitriptyline (Elavil) and pregabalin (Lyrica) have been used successfully to counter extended courses of allodynia and hyperalgesia. Bisphosphonates may decrease bone loss and pain and may be needed should the course be complicated by myositis ossificans, a form of dystrophic bone formation in juxtaposed tendon and muscle related to neuroactivation of fibroblasts and osteoblasts.
THE COURSE OF COMPLEX REGIONAL PAIN SYNDROME
Traditionally, type 1 was divided into three stages—an early inflammatory stage, a dystrophic stage, and a late atrophic stage.12 Although there is no evidence to support a consistent three-stage evolution, the severity of symptoms may help determine the best approach to management.13
Patients initially exhibit burning or throbbing pain, diffuse aching, sensitivity to touch or cold (allodynia), localized edema, and vasomotor disturbances of variable intensity that may produce altered color and temperature. Topical capsaicin cream; a tricyclic antidepressant; an anticonvulsant such as gabapentin (Neurontin), pregabalin, or lamotrigine (Lamictal); or a nonsteroidal anti-inflammatory drug should be tried first. Some of these treatments are poorly tolerated in elderly patients. If pain persists, nasal calcitonin may be added. Trigger-point injections with an anesthetic or glucocorticoid may be tried.
The management of early complex regional pain syndrome is sometimes supplemented with systemic corticosteroids, but reviews of randomized controlled trials have failed to show efficacy.14
Later in the course, patients may suffer persistent soft-tissue edema, accompanied by thickening of the skin and periarticular soft tissues, muscle wasting, and the skin changes of brawny edema. Regional blockade of sympathetic ganglions, epidural administration of clonidine, implantable peripheral nerve stimulators, and spinal cord stimulators have all been applied by experts in pain management and may provide benefit. Progression of the syndrome may include cyanosis, mottling, increased sweating, abnormal hair growth, and diffuse swelling in nonarticular tissue.
It is always acceptable to refer to an experienced pain management specialist, and a multidisciplinary approach is recommended at the outset.12
OUR PATIENT’S CARE CONTINUED
Our patient’s forearm and wrist were placed in a sling to keep his left arm elevated when active. This helped control sympathetic vascular edema and throbbing pain. Physical therapy with range-of-motion exercises prevented contracture.
He was discharged home on limited oxycodone as needed, with close follow-up by his primary care physician to monitor his pain symptoms. The pain and swelling slowly improved over the next 2 months, but he suffered a fall, twisting his left wrist. This minor injury was followed by more intense pain and swelling of the forearm, hand, and wrist.
COMORBIDITIES
5. Which of the following statements about conditions associated with complex regional pain syndrome most likely applies to our patient?
- Gout is likely following minor trauma
- Minor trauma or surgical bone biopsy may reactivate complex regional pain syndrome
- Septic hip arthritis due to MRSA may have reemerged and seeded the wrist
- Patients with multiple sclerosis have a propensity for complex regional pain syndrome
- Complex regional pain syndrome type 1 begets type 2
Gout does follow minor injury, but our patient’s uric acid was well controlled on allopurinol (Zyloprim), and gout is unlikely to be causing polyarticular swelling of the hand, wrist, and forearm.
Minor trauma, sometimes inconsequential enough to have been completely forgotten, may either initiate complex regional pain syndrome or, as seen here, reactivate it. Bone changes seen on MRI sometimes trigger surgical bone biopsy, only to reactivate the dysesthesia and sympathetic vascular reaction. Surgery should be avoided. Trauma and surgery are causative rather than associative comorbidities.
Sepsis due to MRSA after total hip arthroplasty may be reactivated, especially in the setting of immunosuppressive treatment. But the diffuse bone changes seen in multiple carpal, radial, and ulnar bones suggest generalized vascular and sympathetic disarray, most consistent with complex regional pain syndrome type 1.
AN ASSOCIATION WITH MULTIPLE SCLEROSIS?
Multiple sclerosis and other central neuropathic conditions such as stroke are associated with complex regional pain syndrome type 1.15,16
A hypothetical cause for the higher prevalence of complex regional pain syndrome in patients with multiple sclerosis may be demyelination resulting in aberrant signaling and overreaction to distal pain receptors. Demyelination of neurons within the autonomic or spinothalamic tracts potentially increases susceptibility to development of the pain syndrome.
Our patient had an apparent stimulus for the development of the syndrome, ie, the initial dog bite, and the wrist injury later may have caused peripheral nerve injury. Such injury may lead to release of vasodilatory neuropeptides including substance P from stimulated cutaneous nerves with cell bodies in the dorsal root ganglia. Excessive vasodilation and increased vascular permeability result in the affected limb becoming edematous and causing cutaneous nerves to be further activated. Stimulated cutaneous neurons normally have an inhibitory influence on sympathetic activity at the level of entry of the dorsal root ganglia in the cord. In complex regional pain syndrome, this inhibition is lost, resulting in a hyperactive somatosympathetic reflex.17 Underlying multiple sclerosis may have contributed to the loss of inhibition by the cutaneous nerves on the sympathetic system.
CASE CONCLUDED
We continued to closely follow this patient, who was on a self-directed program of physical therapy. One year after the original dog bite, the complex regional pain syndrome had completely resolved.
- Talan DA, Citron DM, Abrahamian FM, Moran GJ, Goldstein EJ. Bacteriologic analysis of infected dog and cat bites. Emergency Medicine Animal Bite Infection Study Group. N Engl J Med 1999; 340:85–92.
- Holst E, Rollof J, Larsson L, Nielsen JP. Characterization and distribution of Pasteurella species recovered from infected humans. J Clin Microbiol 1992; 30:2984–2987.
- Jolivet-Gougeon A, Sixou JL, Tamanai-Shacoori Z, Bonnaure-Mallet M. Antimicrobial treatment of Capnocytophaga infections. Int J Antimicrob Agents 2007; 29:367–373.
- Paul K, Patel SS. Eikenella corrodens infections in children and adolescents: case reports and review of the literature. Clin Infect Dis 2001; 33:54–61.
- Cunha BA, Hamid NS, Krol V, Eisenstein L. Safety of meropenem in patients reporting penicillin allergy: lack of allergic cross reactions. J Chemother 2008; 20:233–237.
- Verghese A, Hamati F, Berk S, Franzus B, Berk S, Smith JK. Susceptibility of dysgonic fermenter 2 to antimicrobial agents in vitro. Antimicrob Agents Chemother 1988; 32:78–80.
- Atkins RM, Duckworth T, Kanis JA. Algodystrophy following Colles’ fracture. J Hand Surg Br 1989; 14:161–164.
- Rommel O, Malin JP, Zenz M, Jänig W. Quantitative sensory testing, neurophysiological and psychological examination in patients with complex regional pain syndrome and hemisensory deficits. Pain 2001; 93:279–293.
- Sethna NF, Meier PM, Zurakowski D, Berde CB. Cutaneous sensory abnormalities in children and adolescents with complex regional pain syndromes. Pain 2007; 131:153–161.
- Harden RN, Bruehl S, Stanton-Hicks M, Wilson PR. Proposed new diagnostic criteria for complex regional pain syndrome. Pain Med 2007; 8:326–331.
- Chelimsky TC, Low PA, Naessens JM, Wilson PR, Amadio PC, O’Brien PC. Value of autonomic testing in reflex sympathetic dystrophy. Mayo Clin Proc 1995; 70:1029–1040.
- Stanton-Hicks MD, Burton AW, Bruehl SP, et al. An updated interdisciplinary clinical pathway for CRPS: report of an expert panel. Pain Pract 2002; 2:1–16.
- Brummett CM, Cohen SP, eds. Managing pain: essentials of diagnosis and treatment. New York; Oxford University Press; 2013.
- Dirckx M, Stronks DL, Groeneweg G, Huygen FJ. Effect of immunomodulating medications in complex regional pain syndrome: a systematic review. Clin J Pain 2012; 28:355–363.
- Schwartzman RJ, Gurusinghe C, Gracely E. Prevalence of complex regional pain syndrome in a cohort of multiple sclerosis patients. Pain Physician 2008; 11:133–136.
- Sandroni P, Benrud-Larson LM, McClelland RL, Low PA. Complex regional pain syndrome type I: incidence and prevalence in Olmsted county, a population-based study. Pain 2003; 103:199–207.
- Kurvers HA, Jacobs MJ, Beuk RJ, et al. Reflex sympathetic dystrophy: evolution of microcirculatory disturbances in time. Pain 1995; 60:333–340.
Double trouble: Simultaneous complications of therapeutic thoracentesis
A 51-year-old man with end-stage liver disease from alcohol abuse presented with worsening dyspnea on exertion. He had a history of ascites requiring diuretic therapy and intermittent paracentesis, as well as symptomatic hepatic hydrothorax requiring thoracentesis. Chest radiography showed a large right hydrothorax (Figure 1).
The patient underwent high-volume thoracentesis, and 3.2 L of clear fluid was removed. Chest radiography after the procedure revealed a right-sided pneumothorax (Figure 2, arrow). The patient was mildly short of breath and was treated with high-flow oxygen. Later the same day, his shortness of breath worsened, and repeat chest radiography showed an unchanged pneumothorax that was now complicated by reexpansion pulmonary edema after thoracentesis (Figure 3, star). The reexpansion pulmonary edema resolved by the following day, and the pneumothorax resolved after placement of a pig-tail catheter into the pleural space (Figure 4).
Iatrogenic pneumothorax after thoracentesis occurs in 6% of cases.1 Iatrogenic reexpansion pulmonary edema after thoracentesis occurs in fewer than 1% of cases.2,3 Simultaneous pneumothorax and reexpansion pulmonary edema arising from the same procedure appears to be extremely rare.
- Gordon CE, Feller-Kopman D, Balk EM, Smetana GW. Pneumothorax following thoracentesis: a systematic review and meta-analysis. Arch Intern Med 2010; 170:332–339.
- Ragozzino MW, Greene R. Bilateral reexpansion pulmonary edema following unilateral pleurocentesis. Chest 1991; 99:506–508.
- Dias OM, Teixeira LR, Vargas FS. Reexpansion pulmonary edema after therapeutic thoracentesis. Clinics (Sao Paulo) 2010; 65:1387–1389.
A 51-year-old man with end-stage liver disease from alcohol abuse presented with worsening dyspnea on exertion. He had a history of ascites requiring diuretic therapy and intermittent paracentesis, as well as symptomatic hepatic hydrothorax requiring thoracentesis. Chest radiography showed a large right hydrothorax (Figure 1).
The patient underwent high-volume thoracentesis, and 3.2 L of clear fluid was removed. Chest radiography after the procedure revealed a right-sided pneumothorax (Figure 2, arrow). The patient was mildly short of breath and was treated with high-flow oxygen. Later the same day, his shortness of breath worsened, and repeat chest radiography showed an unchanged pneumothorax that was now complicated by reexpansion pulmonary edema after thoracentesis (Figure 3, star). The reexpansion pulmonary edema resolved by the following day, and the pneumothorax resolved after placement of a pig-tail catheter into the pleural space (Figure 4).
Iatrogenic pneumothorax after thoracentesis occurs in 6% of cases.1 Iatrogenic reexpansion pulmonary edema after thoracentesis occurs in fewer than 1% of cases.2,3 Simultaneous pneumothorax and reexpansion pulmonary edema arising from the same procedure appears to be extremely rare.
- Gordon CE, Feller-Kopman D, Balk EM, Smetana GW. Pneumothorax following thoracentesis: a systematic review and meta-analysis. Arch Intern Med 2010; 170:332–339.
- Ragozzino MW, Greene R. Bilateral reexpansion pulmonary edema following unilateral pleurocentesis. Chest 1991; 99:506–508.
- Dias OM, Teixeira LR, Vargas FS. Reexpansion pulmonary edema after therapeutic thoracentesis. Clinics (Sao Paulo) 2010; 65:1387–1389.
Changes to practice may help avoid ‘double trouble’
Large-volume thoracentesis is defined as the drainage of more than 1 L of fluid. Inherent in this procedure is the removal of a large amount of fluid from a cavity with a rigid wall, which leads to changes in pleural pressure and to expansion of the lung. Two specific complications occur, pneumothorax and reexpansion pulmonary edema. The images submitted for the Clinical Picture article by Drs. Apter and Aronowitz in this issue of the Journal highlight these complications.
Retrospective studies have found an association between the amount of fluid drained and the incidence of pneumothorax.1,2 Although technical issues may account for it (eg, needle injury to the lung that leads to postprocedural pneumothorax), the available evidence suggests that it has more to do with the drainage of larger volumes than the lung can expand to fill.3,4 That is, the patient’s lung cannot expand,5 so drainage creates a vacuum, and air enters the pleural space3 through the lung parenchyma, or perhaps from around the drainage catheter.
In a series of patients who underwent therapeutic thoracentesis,3 23 (8.7%) of 265 patients had pneumothorax. Interestingly, some patients had only symptoms, some had only excessively negative pressures (< 25 cm H2O), some had both, and some had neither. Thus, there does not seem to be a reliable sign or symptom of an unexpanding lung, but pleural manometry may help increase its detection.6 This technique, however, is rarely used in clinical practice.
Another consequence of therapeutic thoracentesis is reexpansion pulmonary edema. This rare condition occurs only after large-volume thoracentesis or evacuation of a moderate to large pneumothorax.7 The pathophysiology behind this is controversial.8 As with pneumothorax, a large case series did not find a correlation between volume removed or pleural pressures and reexpansion pulmonary edema.7 Experimental data and analysis of case series8–10 suggest that the duration of lung collapse and the speed of drainage and negative pressure applied contribute to the development of edema. Vacuum bottles are often used to speed drainage and to contain the large amount of fluid drained. These bottles have an initial negative pressure of about −723 mm Hg (personal communication with Baxter Healthcare Product information line), which may lead to rapid changes in lung volume and perhaps to higher negative pleural pressures.
Given the risks discussed above, we believe it is appropriate to avoid vacuum bottles and instead to use the syringe and one-way valve supplied in most thoracentesis kits. Further, pleural manometry to detect changes in pressure that suggest an unexpandable lung may lead to the appropriate early termination of a planned large-volume thoracentesis.3 The complications reported by Drs. Apter and Aronowitz are relatively rare and, at this point, unpredictable; therefore, generating high-quality evidence for prediction or management will be difficult. In the meantime, understanding the physiologic changes in the lung and the pleural space when draining large effusions from the chest may help avoid double trouble.
- Josephson T, Nordenskjold CA, Larsson J, Rosenberg LU, Kaijser M. Amount drained at ultrasound-guided thoracentesis and risk of pneumothorax. Acta Radiol 2009; 50:42–47.
- Gordon CE, Feller-Kopman D, Balk EM, Smetana GW. Pneumothorax following thoracentesis: a systematic review and meta-analysis. Arch Intern Med 2010; 170:332–339.
- Heidecker J, Huggins JT, Sahn SA, Doelken P. Pathophysiology of pneumothorax following ultrasound-guided thoracentesis. Chest 2006; 130:1173–1184.
- Huggins JT, Sahn SA, Heidecker J, Ravenel JG, Doelken P. Characteristics of trapped lung: pleural fluid analysis, manometry, and air-contrast chest CT. Chest 2007; 131:206–213.
- Woodring JH, Baker MD, Stark P. Pneumothorax ex vacuo. Chest 1996; 110:1102–1105.
- Feller-Kopman D. Therapeutic thoracentesis: the role of ultrasound and pleural manometry. Curr Opin Pulmon Med 2007; 13:312–318.
- Feller-Kopman D, Berkowitz D, Boiselle P, Ernst A. Large-volume thoracentesis and the risk of reexpansion pulmonary edema. Ann Thorac Surg 2007; 84:1656–1661.
- Tarver RD, Broderick LS, Conces DJ, Jr. Reexpansion pulmonary edema. J Thorac Imag 1996; 11:198–209.
- Murphy K, Tomlanovich MC. Unilateral pulmonary edema after drainage of a spontaneous pneumothorax: case report and review of the world literature. J Emerg Med 1983; 1:29–36.
- Pavlin J, Cheney FW Unilateral pulmonary edema in rabbits after reexpansion of collapsed lung. J Appl Physiol Respir Environ Exerc Physiol 1979; 46:31–35.
Large-volume thoracentesis is defined as the drainage of more than 1 L of fluid. Inherent in this procedure is the removal of a large amount of fluid from a cavity with a rigid wall, which leads to changes in pleural pressure and to expansion of the lung. Two specific complications occur, pneumothorax and reexpansion pulmonary edema. The images submitted for the Clinical Picture article by Drs. Apter and Aronowitz in this issue of the Journal highlight these complications.
Retrospective studies have found an association between the amount of fluid drained and the incidence of pneumothorax.1,2 Although technical issues may account for it (eg, needle injury to the lung that leads to postprocedural pneumothorax), the available evidence suggests that it has more to do with the drainage of larger volumes than the lung can expand to fill.3,4 That is, the patient’s lung cannot expand,5 so drainage creates a vacuum, and air enters the pleural space3 through the lung parenchyma, or perhaps from around the drainage catheter.
In a series of patients who underwent therapeutic thoracentesis,3 23 (8.7%) of 265 patients had pneumothorax. Interestingly, some patients had only symptoms, some had only excessively negative pressures (< 25 cm H2O), some had both, and some had neither. Thus, there does not seem to be a reliable sign or symptom of an unexpanding lung, but pleural manometry may help increase its detection.6 This technique, however, is rarely used in clinical practice.
Another consequence of therapeutic thoracentesis is reexpansion pulmonary edema. This rare condition occurs only after large-volume thoracentesis or evacuation of a moderate to large pneumothorax.7 The pathophysiology behind this is controversial.8 As with pneumothorax, a large case series did not find a correlation between volume removed or pleural pressures and reexpansion pulmonary edema.7 Experimental data and analysis of case series8–10 suggest that the duration of lung collapse and the speed of drainage and negative pressure applied contribute to the development of edema. Vacuum bottles are often used to speed drainage and to contain the large amount of fluid drained. These bottles have an initial negative pressure of about −723 mm Hg (personal communication with Baxter Healthcare Product information line), which may lead to rapid changes in lung volume and perhaps to higher negative pleural pressures.
Given the risks discussed above, we believe it is appropriate to avoid vacuum bottles and instead to use the syringe and one-way valve supplied in most thoracentesis kits. Further, pleural manometry to detect changes in pressure that suggest an unexpandable lung may lead to the appropriate early termination of a planned large-volume thoracentesis.3 The complications reported by Drs. Apter and Aronowitz are relatively rare and, at this point, unpredictable; therefore, generating high-quality evidence for prediction or management will be difficult. In the meantime, understanding the physiologic changes in the lung and the pleural space when draining large effusions from the chest may help avoid double trouble.
- Josephson T, Nordenskjold CA, Larsson J, Rosenberg LU, Kaijser M. Amount drained at ultrasound-guided thoracentesis and risk of pneumothorax. Acta Radiol 2009; 50:42–47.
- Gordon CE, Feller-Kopman D, Balk EM, Smetana GW. Pneumothorax following thoracentesis: a systematic review and meta-analysis. Arch Intern Med 2010; 170:332–339.
- Heidecker J, Huggins JT, Sahn SA, Doelken P. Pathophysiology of pneumothorax following ultrasound-guided thoracentesis. Chest 2006; 130:1173–1184.
- Huggins JT, Sahn SA, Heidecker J, Ravenel JG, Doelken P. Characteristics of trapped lung: pleural fluid analysis, manometry, and air-contrast chest CT. Chest 2007; 131:206–213.
- Woodring JH, Baker MD, Stark P. Pneumothorax ex vacuo. Chest 1996; 110:1102–1105.
- Feller-Kopman D. Therapeutic thoracentesis: the role of ultrasound and pleural manometry. Curr Opin Pulmon Med 2007; 13:312–318.
- Feller-Kopman D, Berkowitz D, Boiselle P, Ernst A. Large-volume thoracentesis and the risk of reexpansion pulmonary edema. Ann Thorac Surg 2007; 84:1656–1661.
- Tarver RD, Broderick LS, Conces DJ, Jr. Reexpansion pulmonary edema. J Thorac Imag 1996; 11:198–209.
- Murphy K, Tomlanovich MC. Unilateral pulmonary edema after drainage of a spontaneous pneumothorax: case report and review of the world literature. J Emerg Med 1983; 1:29–36.
- Pavlin J, Cheney FW Unilateral pulmonary edema in rabbits after reexpansion of collapsed lung. J Appl Physiol Respir Environ Exerc Physiol 1979; 46:31–35.
Series Introduction: Doing the right thing to control health care costs
Health care costs in the United States are rising at an unsustainable rate, currently approaching 20% of the nation’s gross domestic product.1 The reasons for the rapidly increasing costs are many and complex and include new devices and drugs, greater intensity of care in the last years of life, and most perniciously, wasted care.
In its 2010 report The Healthcare Imperative: Lowering costs and Improving Outcomes, the Institute of Medicine estimated that we spend $765 billion annually on wasted care, defined as care that provides no value to the patient.2 Identified causes of wasted care include inefficiently delivered services, excessive pricing, and missed opportunities for prevention. Unnecessary services provided by physicians account for $210 billion annually, accounting for 30% of “wasted care.” Chief culprits are unnecessary imaging procedures and diagnostic tests. These two categories of physician-provided services have skyrocketed, with a cumulative increase of approximately 90% from 2000 to 2009.3
Despite our extensive use of diagnostic imaging and other testing, the US population does not benefit from better health or longer life than other industrialized nations. For example, US male life expectancy from birth is the lowest of 21 high-income countries despite greater use of health care resources, such as an 84% higher rate of magnetic resonance imaging testing per 1,000 population.4
These costs are generated directly by physicians. As aptly put by Walt Kelly’s cartoon character Pogo, “We have met the enemy, and he is us.”
COST AND VALUE
This economic crisis is not all about cost, but about value. The distinction between cost and value is important and provides a framework for physicians striving to be good shepherds of health care resources.
An expensive imaging procedure or diagnostic test may be a good value if its net benefit outweighs or at least justifies the cost. A computed tomographic angiogram provides good value for patients with an intermediate probability of pulmonary embolism in its ability to identify those who may benefit from potentially life-saving therapy.
Conversely, inexpensive tests may provide little value if they provide no patient benefit or even lead to downstream harm such as unnecessary additional testing or therapy. An example might be preoperative electrocardiography in a patient at low risk and without symptoms. Not uncommonly, unexpected electrocardiographic abnormalities are pursued with additional diagnostic tests, even though there is no evidence that patients without symptoms and at low risk benefit from this additional diagnostic scrutiny.
Because some high-cost interventions provide benefit and low-cost interventions may not, efforts to control cost should focus on value, not just cost.
REASONS FOR EXCESSIVE TESTING
Many reasons are offered for excessive testing, including assuaging concerns about diagnostic uncertainty, lack of confidence in diagnostic skills, meeting patient expectations, and lack of time to educate patients about the appropriate use of imaging and diagnostic testing.5 Both attending physicians and residents have knowledge gaps that contribute to overuse of testing.6 Physicians also report deliberate overtesting in a misguided attempt to prevent malpractice claims,5 an unproven defensive strategy that may be associated with more harm than benefit.
EDUCATIONAL INITIATIVES TO CONTROL COSTS
To meet this growing need for clinical guidance and education, regulatory agencies, professional societies, consumer groups, and foundations have prioritized high-value care as an important strategic objective. For example, cost-effective care has been incorporated into the training milestones reported to the Accreditation Council for Graduate Medical Education by internal medicine residency programs. The American College of Physicians (ACP) and the Alliance of Academic Internal Medicine have developed a curriculum to teach high-value care to internal medicine residents, and the ACP has released an interactive online curriculum for practicing physicians. The American Board of Internal Medicine Foundation launched its Choosing Wisely campaign, which asks professional societies to create lists of “things physicians and patients should question” to help make wise decisions about appropriate care. Consumer Reports has joined both the ACP and the American Board of Internal Medicine Foundation to promote high-value care to its consumer audience.
‘SMART TESTING’: THE JOURNAL’S CONTRIBUTION TO CONTROLLING COST
In this issue, Cleveland Clinic Journal of Medicine initiates its contribution to high-value care with a new series—“Smart Testing.”7 The series offers short, clinically engaging vignettes and discussions on the appropriate use of imaging procedures and other diagnostic tests. The vignettes depict common situations in clinical practice, and the discussions focus on identifying and incorporating evidence-based recommendations most likely to provide optimal patient outcome and value. This laudable goal of the Journal is reminiscent of the exhortation by Samuel Clemens (Mark Twain): “Always do right. This will gratify some people and astonish the rest.”
Physicians want to do the right thing, and with the help of the Journal, we can gratify ourselves and society with our efforts to deliver high-value care.
- Centers for Medicare & Medicaid Services, Office of the Actuary, National Health Statistics Group. www.cms.gov/Research-Statistics-Data-and-Systems/Statistics-Trends-and-Reports/NationalHealthEx-pendData/downloads/tables.pdf. Accessed June 2, 2014.
- Institute of Medicine (US) Roundtable on Evidence-Based Medicine; Yong PL, Saunders RS, Olsen LA, editors. The Healthcare Imperative: Lowering Costs and Improving Outcomes: Workshop Series Summary. Washington, DC: National Academies Press (US); 2010. www.ncbi.nlm.nih.gov/books/NBK53920/. Accessed June 2, 2014.
- Reinhardt UE. Fees, volume, and spending at Medicare. Economix. December 24, 2010. http://economix.blogs.nytimes.com/2010/12/24/fees-volume-and-spending-at-medicare/?_php=true&_type=blogs&_r=0. Accessed June 2, 2014.
- National Research Council (US); Institute of Medicine (US); Woolf SH, Aron L, eds. US Health in International Perspective: Shorter Lives, Poorer Health. Washington, DC: National Academies Press (US); 2013. www.ncbi.nlm.nih.gov/books/NBK115854/. Accessed June 2, 2014.
- Sirovich BE, Woloshin S, Schwartz LM. Too little? Too much? Primary care physicians’ views on US health care: a brief report. Arch Intern Med 2011; 171:1582–1585.
- Dine CJ, Miller J, Fuld A, Bellini LM, Iwashyna TJ. Educating physicians-in-training about resource utilization and their own outcomes of care in the inpatient setting. J Grad Med Educ 2010; 2:175–180.
- Smith CD, Alguire PC. Is cardiac stress testing appropriate in asymptomatic adults at low risk? Cleve Clin J Med 2014; 81:405–406.
Health care costs in the United States are rising at an unsustainable rate, currently approaching 20% of the nation’s gross domestic product.1 The reasons for the rapidly increasing costs are many and complex and include new devices and drugs, greater intensity of care in the last years of life, and most perniciously, wasted care.
In its 2010 report The Healthcare Imperative: Lowering costs and Improving Outcomes, the Institute of Medicine estimated that we spend $765 billion annually on wasted care, defined as care that provides no value to the patient.2 Identified causes of wasted care include inefficiently delivered services, excessive pricing, and missed opportunities for prevention. Unnecessary services provided by physicians account for $210 billion annually, accounting for 30% of “wasted care.” Chief culprits are unnecessary imaging procedures and diagnostic tests. These two categories of physician-provided services have skyrocketed, with a cumulative increase of approximately 90% from 2000 to 2009.3
Despite our extensive use of diagnostic imaging and other testing, the US population does not benefit from better health or longer life than other industrialized nations. For example, US male life expectancy from birth is the lowest of 21 high-income countries despite greater use of health care resources, such as an 84% higher rate of magnetic resonance imaging testing per 1,000 population.4
These costs are generated directly by physicians. As aptly put by Walt Kelly’s cartoon character Pogo, “We have met the enemy, and he is us.”
COST AND VALUE
This economic crisis is not all about cost, but about value. The distinction between cost and value is important and provides a framework for physicians striving to be good shepherds of health care resources.
An expensive imaging procedure or diagnostic test may be a good value if its net benefit outweighs or at least justifies the cost. A computed tomographic angiogram provides good value for patients with an intermediate probability of pulmonary embolism in its ability to identify those who may benefit from potentially life-saving therapy.
Conversely, inexpensive tests may provide little value if they provide no patient benefit or even lead to downstream harm such as unnecessary additional testing or therapy. An example might be preoperative electrocardiography in a patient at low risk and without symptoms. Not uncommonly, unexpected electrocardiographic abnormalities are pursued with additional diagnostic tests, even though there is no evidence that patients without symptoms and at low risk benefit from this additional diagnostic scrutiny.
Because some high-cost interventions provide benefit and low-cost interventions may not, efforts to control cost should focus on value, not just cost.
REASONS FOR EXCESSIVE TESTING
Many reasons are offered for excessive testing, including assuaging concerns about diagnostic uncertainty, lack of confidence in diagnostic skills, meeting patient expectations, and lack of time to educate patients about the appropriate use of imaging and diagnostic testing.5 Both attending physicians and residents have knowledge gaps that contribute to overuse of testing.6 Physicians also report deliberate overtesting in a misguided attempt to prevent malpractice claims,5 an unproven defensive strategy that may be associated with more harm than benefit.
EDUCATIONAL INITIATIVES TO CONTROL COSTS
To meet this growing need for clinical guidance and education, regulatory agencies, professional societies, consumer groups, and foundations have prioritized high-value care as an important strategic objective. For example, cost-effective care has been incorporated into the training milestones reported to the Accreditation Council for Graduate Medical Education by internal medicine residency programs. The American College of Physicians (ACP) and the Alliance of Academic Internal Medicine have developed a curriculum to teach high-value care to internal medicine residents, and the ACP has released an interactive online curriculum for practicing physicians. The American Board of Internal Medicine Foundation launched its Choosing Wisely campaign, which asks professional societies to create lists of “things physicians and patients should question” to help make wise decisions about appropriate care. Consumer Reports has joined both the ACP and the American Board of Internal Medicine Foundation to promote high-value care to its consumer audience.
‘SMART TESTING’: THE JOURNAL’S CONTRIBUTION TO CONTROLLING COST
In this issue, Cleveland Clinic Journal of Medicine initiates its contribution to high-value care with a new series—“Smart Testing.”7 The series offers short, clinically engaging vignettes and discussions on the appropriate use of imaging procedures and other diagnostic tests. The vignettes depict common situations in clinical practice, and the discussions focus on identifying and incorporating evidence-based recommendations most likely to provide optimal patient outcome and value. This laudable goal of the Journal is reminiscent of the exhortation by Samuel Clemens (Mark Twain): “Always do right. This will gratify some people and astonish the rest.”
Physicians want to do the right thing, and with the help of the Journal, we can gratify ourselves and society with our efforts to deliver high-value care.
- Centers for Medicare & Medicaid Services, Office of the Actuary, National Health Statistics Group. www.cms.gov/Research-Statistics-Data-and-Systems/Statistics-Trends-and-Reports/NationalHealthEx-pendData/downloads/tables.pdf. Accessed June 2, 2014.
- Institute of Medicine (US) Roundtable on Evidence-Based Medicine; Yong PL, Saunders RS, Olsen LA, editors. The Healthcare Imperative: Lowering Costs and Improving Outcomes: Workshop Series Summary. Washington, DC: National Academies Press (US); 2010. www.ncbi.nlm.nih.gov/books/NBK53920/. Accessed June 2, 2014.
- Reinhardt UE. Fees, volume, and spending at Medicare. Economix. December 24, 2010. http://economix.blogs.nytimes.com/2010/12/24/fees-volume-and-spending-at-medicare/?_php=true&_type=blogs&_r=0. Accessed June 2, 2014.
- National Research Council (US); Institute of Medicine (US); Woolf SH, Aron L, eds. US Health in International Perspective: Shorter Lives, Poorer Health. Washington, DC: National Academies Press (US); 2013. www.ncbi.nlm.nih.gov/books/NBK115854/. Accessed June 2, 2014.
- Sirovich BE, Woloshin S, Schwartz LM. Too little? Too much? Primary care physicians’ views on US health care: a brief report. Arch Intern Med 2011; 171:1582–1585.
- Dine CJ, Miller J, Fuld A, Bellini LM, Iwashyna TJ. Educating physicians-in-training about resource utilization and their own outcomes of care in the inpatient setting. J Grad Med Educ 2010; 2:175–180.
- Smith CD, Alguire PC. Is cardiac stress testing appropriate in asymptomatic adults at low risk? Cleve Clin J Med 2014; 81:405–406.
Is cardiac stress testing appropriate in asymptomatic adults at low risk?
A 48-year-old insurance executive is offered the option of several health insurance packages at the time of a promotion. He is healthy and a non-smoker; both his parents are alive and well; and he takes only vitamins and fish oil supplements on a regular basis. His levels of total cholesterol, low-density lipoprotein cholesterol, and high-density lipoprotein cholesterol are all in the normal range, as is his blood pressure. He plans to purchase the lowest price policy, but wants to know if he should also get a stress test to best guide his care.
GUIDELINES RECOMMEND AGAINST TESTING
Patients who are at low risk of disease and without symptoms should not undergo cardiac stress testing. The test is unlikely to be helpful in these patients and may expose them to harm unnecessarily. Cardiac stress testing such as exercise electrocardiography is most useful in patients who have chest pain and shortness of breath on exertion, to look for underlying cardiovascular disease. Despite this, the test is often used inappropriately as part of a routine health evaluation in low-risk, asymptomatic people, such as this patient.
Recent high-quality guidelines address exercise electrocardiography as a screening test for cardiovascular disease in asymptomatic, low-risk adults.
The US Preventive Services Task Force 2012 guideline1 recommends against screening with exercise electrocardiography for predicting coronary heart disease events in adults with no symptoms and at low risk of these events. A systematic review found no data from randomized controlled trials or prospective cohort studies of this test to screen asymptomatic adults compared with no screening.2
The American Academy of Family Physicians (AAFP) 2012 guideline3 recommends against routine screening with exercise electrocardiography either for the presence of severe coronary artery stenosis or for predicting coronary events in adults at low risk. The AAFP guideline notes that there is moderate or high certainty of no net benefit or that the harms outweigh the benefits of exercise electrocardiography in adults at low risk and without symptoms.
The 2010 joint guideline of the American College of Cardiology and the American Heart Association4 does not comment on the role of screening exercise electrocardiography in low-risk asymptomatic adults, but states that a physician may consider ordering exercise electrocardiography in asymptomatic adults at intermediate risk of coronary heart disease. The guideline recommends that the individual physician decide whether screening exercise electrocardiography is warranted in a patient at intermediate risk.
The Choosing Wisely initiative
As part of the Choosing Wisely initiative of the American Board of Internal Medicine Foundation, a number of medical specialty societies have published lists of recommendations and issues that physicians and patients should question and discuss. Cardiac stress testing in low-risk asymptomatic patients is on the list of a number of organizations, including the American College of Physicians, the American College of Cardiology, the AAFP, and the American Society of Nuclear Cardiology. These lists can be found at www.choosingwisely.org.
POSSIBLE HARM ASSOCIATED WITH CARDIAC STRESS TESTING
The overall risk of sudden cardiac death or an event that requires hospitalization during exercise electrocardiography is very small, estimated to be 1 per 10,000 tests, and the risk is probably even less in patients at low risk.5 But the risk of potential downstream harm from additional testing or interventions may be greater than direct harm. Still, no study has yet assessed harm associated with follow-up testing or interventions after screening with exercise electrocardiography.
On the basis of large, population-based registries that include symptomatic persons, the risk of any serious adverse event as a result of angiography is about 1.7%; this includes a 0.1% risk of death, a 0.05% risk of myocardial infarction, a 0.07% risk of stroke, and a 0.4% risk of arrhythmia.6 In addition, coronary angiography is associated with an average effective radiation dose of 7 mSv and myocardial perfusion imaging with a dose of 15.6 mSv.7 These are approximately two times and five times the amount of radiation an average person in the United States receives per year from exposure to ambient radiation (3 mSv).
Several studies that included symptomatic and asymptomatic patients who had undergone angiography reported that between 39% and 85% of patients had no coronary artery disease. This means that many patients were subjected to the risks of invasive testing and treatment without the possibility of benefit. Patients who receive lipid-lowering therapy or aspirin because of an abnormal exercise electrocardiogram are also exposed to the risks related to those interventions.
THE CLINICAL BOTTOM LINE
On the basis of current data, the insurance executive should not get a stress test because the results of the test are unlikely to have an impact on his medical management, are unlikely to improve his clinical outcome, and carry a small risk of harm. Low-risk, asymptomatic people with a positive stress test have the same mortality rate as those who have a negative stress test, and its usefulness beyond traditional risk-factor assessment in motivating patients and guiding therapy has not been established.8 In addition, the rate of false-positive results with exercise stress testing is as high as 71%.9 Although the risk of an adverse event from the initial stress test is low, ie, 1 serious event in 10,000 tests, the risk of subsequent cardiac catheterization after a positive test is significantly higher, ie, 170 serious events in 10,000 tests. For these reasons, the potential harm of exercise electrocardiography outweighs the benefits in this patient.
- Moyer VAUS Preventive Services Task Force. Screening for coronary heart disease with electrocardiography: US Preventive Services Task Force recommendation statement. Ann Intern Med 2012; 157:512–518.
- Chou R, Arora B, Dana T, Fu R, Walker M, Humphrey L. Screening asymptomatic adults with resting or exercise electrocardiography: a review of the evidence for the US Preventive Services Task Force. Ann Intern Med 2011; 155:375–385.
- Leawood KS; American Academy of Family Physicians (AAFP). Summary of recommendations for clinical preventive services. American Academy of Family Physicians (AAFP); 2012. http://www.guideline.gov/content.aspx?id=47554. Accessed May 12, 2014.
- Greenland P, Alpert JS, Beller GA, et al; American College of Cardiology Foundation; American Heart Association. 2010 ACCF/AHA guideline for assessment of cardiovascular risk in asymptomatic adults: a report of the American College of Cardiology Foundation/American Heart Association Task Force on Practice Guidelines. J Am Coll Cardiol 2010; 56:e50–e103.
- Myers J, Arena R, Franklin B, et al; American Heart Association Committee on Exercise, Cardiac Rehabilitation, and Prevention of the Council on Clinical Cardiology, the Council on Nutrition, Physical Activity, and Metabolism, and the Council on Cardiovascular Nursing. Recommendations for clinical exercise laboratories: a scientific statement from the American Heart Association. Circulation 2009; 119:3144–3161.
- Noto TJ, Johnson LW, Krone R, et al. Cardiac catheterization 1990: a report of the Registry of the Society for Cardiac Angiography and Interventions (SCA&I). Cathet Cardiovasc Diagn 1991; 24:75–83.
- Fazel R, Krumholz HM, Wang Y, et al. Exposure to low-dose ionizing radiation from medical imaging procedures. N Engl J Med 2009; 361:849–857.
- Pilote L, Pashkow F, Thomas JD, et al. Clinical yield and cost of exercise treadmill testing to screen for coronary artery disease in asymptomatic adults. Am J Cardiol 1998; 81:219–224.
- Hopkirk JA, Uhl GS, Hickman JR, Fischer J, Medina A. Discriminant value of clinical and exercise variables in detecting significant coronary artery disease in asymptomatic men. J Am Coll Cardiol 1984; 3:887–894.
A 48-year-old insurance executive is offered the option of several health insurance packages at the time of a promotion. He is healthy and a non-smoker; both his parents are alive and well; and he takes only vitamins and fish oil supplements on a regular basis. His levels of total cholesterol, low-density lipoprotein cholesterol, and high-density lipoprotein cholesterol are all in the normal range, as is his blood pressure. He plans to purchase the lowest price policy, but wants to know if he should also get a stress test to best guide his care.
GUIDELINES RECOMMEND AGAINST TESTING
Patients who are at low risk of disease and without symptoms should not undergo cardiac stress testing. The test is unlikely to be helpful in these patients and may expose them to harm unnecessarily. Cardiac stress testing such as exercise electrocardiography is most useful in patients who have chest pain and shortness of breath on exertion, to look for underlying cardiovascular disease. Despite this, the test is often used inappropriately as part of a routine health evaluation in low-risk, asymptomatic people, such as this patient.
Recent high-quality guidelines address exercise electrocardiography as a screening test for cardiovascular disease in asymptomatic, low-risk adults.
The US Preventive Services Task Force 2012 guideline1 recommends against screening with exercise electrocardiography for predicting coronary heart disease events in adults with no symptoms and at low risk of these events. A systematic review found no data from randomized controlled trials or prospective cohort studies of this test to screen asymptomatic adults compared with no screening.2
The American Academy of Family Physicians (AAFP) 2012 guideline3 recommends against routine screening with exercise electrocardiography either for the presence of severe coronary artery stenosis or for predicting coronary events in adults at low risk. The AAFP guideline notes that there is moderate or high certainty of no net benefit or that the harms outweigh the benefits of exercise electrocardiography in adults at low risk and without symptoms.
The 2010 joint guideline of the American College of Cardiology and the American Heart Association4 does not comment on the role of screening exercise electrocardiography in low-risk asymptomatic adults, but states that a physician may consider ordering exercise electrocardiography in asymptomatic adults at intermediate risk of coronary heart disease. The guideline recommends that the individual physician decide whether screening exercise electrocardiography is warranted in a patient at intermediate risk.
The Choosing Wisely initiative
As part of the Choosing Wisely initiative of the American Board of Internal Medicine Foundation, a number of medical specialty societies have published lists of recommendations and issues that physicians and patients should question and discuss. Cardiac stress testing in low-risk asymptomatic patients is on the list of a number of organizations, including the American College of Physicians, the American College of Cardiology, the AAFP, and the American Society of Nuclear Cardiology. These lists can be found at www.choosingwisely.org.
POSSIBLE HARM ASSOCIATED WITH CARDIAC STRESS TESTING
The overall risk of sudden cardiac death or an event that requires hospitalization during exercise electrocardiography is very small, estimated to be 1 per 10,000 tests, and the risk is probably even less in patients at low risk.5 But the risk of potential downstream harm from additional testing or interventions may be greater than direct harm. Still, no study has yet assessed harm associated with follow-up testing or interventions after screening with exercise electrocardiography.
On the basis of large, population-based registries that include symptomatic persons, the risk of any serious adverse event as a result of angiography is about 1.7%; this includes a 0.1% risk of death, a 0.05% risk of myocardial infarction, a 0.07% risk of stroke, and a 0.4% risk of arrhythmia.6 In addition, coronary angiography is associated with an average effective radiation dose of 7 mSv and myocardial perfusion imaging with a dose of 15.6 mSv.7 These are approximately two times and five times the amount of radiation an average person in the United States receives per year from exposure to ambient radiation (3 mSv).
Several studies that included symptomatic and asymptomatic patients who had undergone angiography reported that between 39% and 85% of patients had no coronary artery disease. This means that many patients were subjected to the risks of invasive testing and treatment without the possibility of benefit. Patients who receive lipid-lowering therapy or aspirin because of an abnormal exercise electrocardiogram are also exposed to the risks related to those interventions.
THE CLINICAL BOTTOM LINE
On the basis of current data, the insurance executive should not get a stress test because the results of the test are unlikely to have an impact on his medical management, are unlikely to improve his clinical outcome, and carry a small risk of harm. Low-risk, asymptomatic people with a positive stress test have the same mortality rate as those who have a negative stress test, and its usefulness beyond traditional risk-factor assessment in motivating patients and guiding therapy has not been established.8 In addition, the rate of false-positive results with exercise stress testing is as high as 71%.9 Although the risk of an adverse event from the initial stress test is low, ie, 1 serious event in 10,000 tests, the risk of subsequent cardiac catheterization after a positive test is significantly higher, ie, 170 serious events in 10,000 tests. For these reasons, the potential harm of exercise electrocardiography outweighs the benefits in this patient.
- Moyer VAUS Preventive Services Task Force. Screening for coronary heart disease with electrocardiography: US Preventive Services Task Force recommendation statement. Ann Intern Med 2012; 157:512–518.
- Chou R, Arora B, Dana T, Fu R, Walker M, Humphrey L. Screening asymptomatic adults with resting or exercise electrocardiography: a review of the evidence for the US Preventive Services Task Force. Ann Intern Med 2011; 155:375–385.
- Leawood KS; American Academy of Family Physicians (AAFP). Summary of recommendations for clinical preventive services. American Academy of Family Physicians (AAFP); 2012. http://www.guideline.gov/content.aspx?id=47554. Accessed May 12, 2014.
- Greenland P, Alpert JS, Beller GA, et al; American College of Cardiology Foundation; American Heart Association. 2010 ACCF/AHA guideline for assessment of cardiovascular risk in asymptomatic adults: a report of the American College of Cardiology Foundation/American Heart Association Task Force on Practice Guidelines. J Am Coll Cardiol 2010; 56:e50–e103.
- Myers J, Arena R, Franklin B, et al; American Heart Association Committee on Exercise, Cardiac Rehabilitation, and Prevention of the Council on Clinical Cardiology, the Council on Nutrition, Physical Activity, and Metabolism, and the Council on Cardiovascular Nursing. Recommendations for clinical exercise laboratories: a scientific statement from the American Heart Association. Circulation 2009; 119:3144–3161.
- Noto TJ, Johnson LW, Krone R, et al. Cardiac catheterization 1990: a report of the Registry of the Society for Cardiac Angiography and Interventions (SCA&I). Cathet Cardiovasc Diagn 1991; 24:75–83.
- Fazel R, Krumholz HM, Wang Y, et al. Exposure to low-dose ionizing radiation from medical imaging procedures. N Engl J Med 2009; 361:849–857.
- Pilote L, Pashkow F, Thomas JD, et al. Clinical yield and cost of exercise treadmill testing to screen for coronary artery disease in asymptomatic adults. Am J Cardiol 1998; 81:219–224.
- Hopkirk JA, Uhl GS, Hickman JR, Fischer J, Medina A. Discriminant value of clinical and exercise variables in detecting significant coronary artery disease in asymptomatic men. J Am Coll Cardiol 1984; 3:887–894.
Smart testing: An old idea, a new series

It’s simple. It’s obvious. None of us would like to be known as someone who orders diagnostic tests in a careless or stupid manner. And none of us order that way—just ask us! Yet, when critically evaluated, someone is ordering slews of unnecessary or inappropriate tests. In my own hospital we saved about $100,000 last year by putting “hard stops” on duplicated blood tests that were ordered too frequently to be of clinical value. This is an obvious and easily enacted intervention, but it is just the tip of the testing iceberg.
As technology advances, our testing practices must change. For example, the ventilation-perfusion nuclear scan is now seldom the test of choice when evaluating a patient with possible pulmonary embolism. However, it still has a role for experienced clinicians evaluating selected patients who have unexplained dyspnea or pulmonary hypertension. There is value in knowing the old as well as new testing modalities.
We like to think we practice evidence-based diagnostic testing. We talk about the gold-standard value of randomized controlled trials and using published data on pretest and posttest diagnostic likelihoods to assist us in choosing the appropriate test. However, the individual patient in front of us may have comorbidities that would have excluded her from the randomized trials. Who knows if my diagnostic acumen in determining the pretest likelihood of disease is better or worse than that of the clinicians who published the paper on the utility of that test? Sometimes choosing a test is not so simple.
Much of my clinical decision-making occurs in a gray zone of uncertainty. Rarely will a single test provide an indisputable diagnosis. So, I may bristle when someone, often for cost reasons, questions the necessity of a diagnostic test that I have ordered to help me understand a clinical problem in a specific patient.
Nevertheless, as Dr. Patrick Alguire points out in an editorial, the frequent use of sophisticated and expensive testing in the United States has not resulted in better clinical outcomes. And as Drs. Alraies and Buitrago et al discuss in letters to the editor, even relatively simple and minimally invasive tests can result in dire, unexpected outcomes. The choice of test matters to individual patients and to the health care system as a whole.
I do not minimize the financial impact of inappropriate testing, but in the clinic I am a doctor, not a businessman. I am far more swayed by clinical arguments than financial ones when making decisions for the patient on the examining table in front of me. Despite the general examples I provided above as to why regulated, cookbook approaches to test-ordering may lead to suboptimal care and physician and patient dissatisfaction (albeit while decreasing costs), sometimes ordering certain tests in certain circumstances just doesn’t make sense. Yet, there are many questionable test and scenario pairings that are ingrained in common practice. Some we learned during our training but have become less useful in light of new knowledge, some we may have adopted because of anecdotal experiences, and some are “demanded” by our patients. It is these that we hope to help expunge from routine clinical care.
In this issue of the Journal we are initiating a new series within our 1-Minute Consults, called Smart Testing. We are joining the efforts of the American College of Physicians (ACP) in educating physicians about reasons to avoid ordering frequently misused tests—tests that may add more harm, cost, or both than clinical utility to the care of our patients. The ACP also has an educational initiative called “High Value Care” that can be accessed (at no cost) at http://hvc.acponline.org/index.html. We at the Journal are very pleased to be working with physicians at the ACP to offer you this peer-reviewed series of patient vignettes that will focus, in an evidence-based and common-sense way, on the clinical value of selected tests in specific scenarios. Next month we will also be presenting a commentary on the impact that “defensive medicine” plays in test ordering and malpractice case decisions.
The tests and scenarios to be presented are chosen in clinician group discussions. Some of the tests have also been identified by specialty societies as providing limited value to patients. In selecting the topics, we pick common scenarios, realizing that there can often (always?) be some situational nuance that negates the accompanying discussion. We are not expecting to throw light on those nuanced zones of uncertainty, but we do hope to change test-ordering behaviors in situations in which there is a smart—and a not-so-smart—way to pursue a diagnosis.
Chronic pain and opioid use much higher among soldiers
Rates of chronic pain and opioid use are significantly higher among soldiers, compared with the general population, a survey of 2,597 Army infantry soldiers showed.
The survey, conducted in 2011 after the soldiers had been deployed from combat in Afghanistan or Iraq, found that 44% of the soldiers reported experiencing chronic pain and 15.1% declared that they had used opioids sometime in the past month.
The survey also found that among those reporting opioid use, 44.1%% said they had experienced only mild or no pain in the past month, while among those with chronic pain, only 23.2% had received opioids in the past month, according to a research letter published online June 30 (JAMA 2014 [doi:10.1001/jamainternmed.2014.2726]).
Those with chronic pain were more likely to be aged over 30 years, to be married or have been married, to be injured during combat, to be in higher-intensity combat, or to have experienced posttraumatic stress disorder or major depressive disorder. Use of opioids was associated with "sex, age 25 years or older, being married, rank, injury during combat, chronic pain, and pain severity," wrote Robin L. Toblin, Ph.D., and colleagues.
"These findings suggest a large unmet need for assessment, management, and treatment of chronic pain and related opioid use and misuse in military personnel after combat deployments," said Dr. Toblin of the center for military psychiatry and neuroscience at the Walter Reed Army Institute of Research in Silver Spring, Md.
An accompanying editorial contrasted the figures for chronic pain and opioid use in the military with those in the general population – 26% and 4%, respectively (JAMA 2014 June 30 [doi:10.1001/jamainternmed.2014.2114]).
"While chronic pain and opioid use have been a long-standing concern of the military leadership, this study is among the first to quantify the impact of recent wars on the prevalence of pain and narcotic use among soldiers," wrote Dr. Wayne B. Jonas of the Samueli Institute in Alexandria, Va., and the Uniformed Services University of the Health Sciences in Bethesda, Md., and Dr. Eric B. Schoomaker, also of the Samueli Institute.
No conflicts of interest were declared.
FROM JAMA
Key clinical point: Prescription practices should be analyzed to make sure that the use of opioids among military personnel "is consistent with standards of care and practice guidelines and nonopioid alternatives are considered whenever possible."
Major finding: A survey has found 44% of soldiers experience chronic pain and 15.1% have used opioids sometime in the past month. Among those reporting opioid use, 44.1% said they had had only mild or no pain in the past month, while among those with chronic pain, only 23.3% had received opioids in the past month.
Data source: A survey of 2,597 soldiers after combat deployment.
Disclosures: No conflicts of interest were declared.
Enhancing gene delivery to HSCs
![]()
Credit: Chad McNeeley
Scientists say they’ve overcome a major hurdle to developing gene therapies for blood disorders.
They found the drug rapamycin could help them bypass the natural defenses of hematopoietic stem cells (HSCs) and deliver therapeutic doses of disease-fighting genes, without compromising HSC function.
The team believes this discovery could lead to more effective and affordable long-term treatments for disorders such as leukemia and sickle cell anemia.
Bruce Torbett, PhD, of The Scripps Research Institute in La Jolla, California, and his colleagues reported their findings in Blood.
Past research showed that HIV vectors can deliver genes to HSCs. However, when scientists extract HSCs from the body for gene therapy, HIV vectors are usually able to deliver genes to about 30% to 40% of the cells.
For leukemia, leukodystrophy, or genetic diseases where treatment requires a reasonable number of healthy cells derived from stem cells, this number may be too low for therapeutic purposes.
This limitation prompted Dr Torbett and his colleagues to test whether rapamycin could improve delivery of a gene to HSCs. Rapamycin was selected based on its ability to control virus entry and slow cell growth.
The researchers began by isolating stem cells from cord blood samples. They exposed the HSCs to rapamycin and HIV vectors engineered to deliver a gene for a green florescent protein. This fluorescence provided a visual marker that helped the team track gene delivery.
They saw a big difference in both mouse and human stem cells treated with rapamycin, where therapeutic genes were inserted into up to 80% of cells. This property had never been connected to rapamycin before.
The researchers also found that rapamycin can keep HSCs from differentiating as quickly when taken out of the body for gene therapy.
“We wanted to make sure the conditions we will use preserve stem cells, so if we transplant them back into our animal models, they act just like the original stem cells,” Dr Torbett said. “We showed that, in 2 sets of animal models, stem cells remain and produce gene-modified cells.”
The scientists hope these methods could someday be useful in the clinic.
“Our methods could reduce costs and the amount of preparation that goes into modifying blood stem cells using viral vector gene therapy,” said Cathy Wang, also of The Scripps Research Institute. “It would make gene therapy accessible to a lot more patients.”
She said the team’s next steps are to carry out preclinical studies using rapamycin with stem cells in other animal models and then test the method in humans. The researchers are also working to delineate the dual pathways of rapamycin’s mechanism of action in HSCs. ![]()
Technology lowers stress among pediatric patients

Credit: Logan Tuttle
A new study suggests videoconferencing with family and friends can lower stress for pediatric patients who are hospitalized for an extended period.
UC Davis Children’s Hospital provides these patients with laptops, webcams, and secure Internet connections for videoconferencing.
And anecdotal accounts have suggested the service, called Family-Link, benefits patients. But researchers wanted more concrete evidence that Family-Link can reduce anxiety.
To that end, James Marcin, MD, and his colleagues studied 367 children who were hospitalized at UC Davis for at least 4 days.
Two hundred and thirty-two patients took advantage of the videoconferencing service, and 135 did not. The researchers used the Parent-Guardian Stress Survey to assess the children’s anxiety levels, both at admission and discharge.
The survey included 4 question groups centered on each child’s behavior and emotions, staff communication, sights and sounds, and the child’s appearance. Parents/guardians were asked whether the child exhibited a variety of behaviors, such as being demanding, frightened, angry, or confused.
The survey also included questions about the impact of monitoring equipment on stress levels and the staff’s ability to communicate important details about the child’s care.
Overall, children who used Family-Link experienced a greater reduction in stress than children who did not use the service.
The researchers were surprised to find this effect was even more pronounced for children who lived closer to the hospital and had shorter hospitalizations. This group experienced a 37% stress reduction when using Family-Link.
“This study shows that we have another tool to help children during their hospital stays,” said Nikki Yang, first author on the study. “The improvement in stress scores shows that Family-Link is really helping many children and might possibly be improving outcomes.”
Yang and her colleagues reported these findings in Pediatrics. ![]()