User login
How Hospitalists Can Improve Efficiency on Inpatient Wards

At some point in residency, we all learn that time management and multitasking are vital to ward efficiency; however, it is important to note that efficiency as a hospitalist is as much about providing high quality clinical care as it is about maximizing resources, reducing waste, and avoiding redundancy in the process.
This article examines the pre-rounding, rounding, and follow-up phases of a hospitalist’s typical workday and provides suggestions to help streamline your work—and enhance both personal and system efficiency.
Pre-Rounding
While most would agree that preparing for rounds is essential to making them effective, longer patient lists may lead to hours of pre-rounding. Often, by the time you get to the “rounding stage,” things change. To make this a more productive exercise, we recommend “focused pre-rounding,” which allows you to organize your efforts as follows:
- For overnight admissions, skim through such data as presenting complaint, relevant past medical history, exam, labs, and radiology, looking for any critical values or findings that may need immediate attention. As you prioritize your order of rounding, you are also familiarizing yourself with the cases, which will reassure your new patients.
- For patients who are already on service, do a quick review of any acute overnight events or important management needs. For example, you may have to follow up on a CT head for a patient who fell overnight or check fasting blood sugars to modify a diabetic ketoacidosis patient’s morning insulin dose. These are time-sensitive issues that may need your attention before you actually lay eyes on the patient.
- Prioritize visits and learn to manage patient expectations. Organize your patient visits based on the data gathered from pre-rounding. Seeing potential discharges first helps the hospital open up beds early and facilitates patient throughput. As appealing as early discharge is to any hospital administrator, those working in a teaching setting might argue that first priority should go to night float admissions that have not been “staffed” by an attending yet.
Barring urgent patient care issues, we would recommend that patients who are ready for discharge pending a face-to-face visit or a morning lab should be seen first. You can attend to the new admissions next. In contrast, there is no rush to see potential discharges undergoing a procedure such as an esophagogastroduodenoscopy or stress test. Furthermore, if your decision-making hinges on these test results, timing your visit so that it occurs after the procedure makes your rounding even more efficient. In these situations, informing the patient the evening prior to rounding that you will be visiting them late the next day is not only professionally courteous, but also goes a long way in managing their expectations and enhancing patient satisfaction.
Rounding (The Patient Encounter)
Be professional. Introduce yourself and, if necessary, explain your role as a hospitalist. Sit down when possible. Studies have shown that just the act of sitting makes patients feel that you are communicating better and spending more time with them. If you normally walk or talk quickly, try to slow down temporarily while in the room. The art is for you to be cognizant of the time while avoiding the appearance of impatience.
Engage the patient and/or family. Interact with patients in a way that makes them feel included in their care. For example, show patients X-rays or use diagrams to explain their disease pathophysiology or any upcoming procedures. We feel that even the less educated patient will have a better understanding of her illness when it’s less abstract and more visually defined.
Set reasonable expectations. The patient or family may have many questions during rounds. If time does not permit, especially when you are rounding with housestaff, it is more efficient to say, “We need to move on for now, but one of us will return later to discuss all of this in more depth.”
For particularly demanding patients and families, manage expectations by communicating honestly about your other patient care responsibilities, while still acknowledging their needs. In these situations, setting up a family meeting to discuss plans of care early in the hospital course can be very productive.
Integrate inter-professional care when possible: Rounding with a care coordinator or the patient’s nurse allows you to share clinical information and plans of care in real time. This can help minimize interruptions and pages later in the day, while enhancing patient safety by limiting communication failures.
Perform tasks “as you go.” Entering orders and calling urgent consults as you round not only provides timely medical care but, by limiting unfinished tasks, also reduces the chances of medical errors.
Post Rounds (Follow-Up Care and Planning)
Start discharge planning on day 1. As you gain experience, predicting patients’ hospital stays and anticipating their discharge needs becomes part of your hospitalist “sixth sense.” Obtaining timely therapy, social work, and case management consults is fundamental to your efficiency as a hospitalist. It is also prudent to keep patients and their families updated on discharge plans.
Delegate responsibilities when possible. Efficiency can be fueled by sharing your workload, especially non-clinical tasks such as obtaining occupational safety and health records, completing SNF forms, or scheduling follow-up appointments. Potential resources include ward secretaries, nurses, or, for more clinical tasks, housestaff, nurse practitioners, or physician assistants. The availability of this support varies substantially between institutions. Still, your goal should be to advocate for a collaborative work environment where support staff are expected to contribute to team efficiency and, by corollary, patient satisfaction.
Document succinctly and in a timely manner. Your notes should reflect the patient’s clinical progress and your thought process. You don’t need to import every detail that can be found elsewhere in the EHR, and you should refrain from long, cut and pasted notes that are often meaningless “note bloat.” Likewise, discharge summaries should be high quality informative documents that list key elements, including discharge diagnoses, discharge medications, follow-up appointments, procedures, and a brief hospital course. These are best done in real time or even the day before, when the case is fresh in your memory. Spending an extra 15 - 30 minutes on this important task is well worth it. Do not let records pile up!
“Run the list.” Among the million other things you’re doing all day, this quick end-of-the-day review of your patient list helps you prepare for the next day. It’s an opportunity to ready things for potential next day discharges, discontinue redundant lab testing, remove unnecessary Foley catheters and lines, and identify any medication order errors.
In Sum
Many personal habits can improve the quality and efficiency of patient care, and hospitalist efficiency is intimately related to system performance. As hospitalists, each one of us can enhance the system, whether we do so by facilitating patient throughput, improving communication, or utilizing resources in a cost-conscious manner. Volunteering to serve on information technology or quality assurance committees is also a “big picture” way of contributing. It is our hope that the tips in this article will have a qualitative impact on both your work habits and your organization’s performance, thereby improving patient care and, ultimately, your own career satisfaction.
Dr. Chandra is assistant professor of medicine at Case Western Reserve University and chief of the division of general internal medicine, University Hospitals Case Medical Center in Cleveland, Ohio. Dr. Donahue is assistant professor of medicine at the University of Massachusetts Medical School in Worcester. Dr. Smith is a hospitalist at Aurora Medical Center in Summit, Wis.
Listen Now! Ron Greeno Discusses Policy Issues Facing Hospitalists
Click here to listen to excerpts of our interview with SHM Public Policy Committee Chair Ron Greeno, MD, MHM
Click here to listen to excerpts of our interview with SHM Public Policy Committee Chair Ron Greeno, MD, MHM
Click here to listen to excerpts of our interview with SHM Public Policy Committee Chair Ron Greeno, MD, MHM
Society of Hospital Medicine’s HM14 Energizes Hospitalists, Sets Attendance Record

A record 3,600 hospitalists swarmed the Mandalay Bay Resort and Casino for four days of education and networking that wrapped with the “father of HM,” Bob Wachter, MD, MHM, dressed as Elton John, warbling a hospitalist-centric version of Sir Elton’s chart topper, “Your Song,” to a packed ballroom.
“[HM14] is just intoxicating,” said hospitalist Kevin Gilroy, MD, of Greenville (S.C.) Health System. “And it ends with our daddy getting up there and lighting it up as Elton John. What other conference does that?”
LAS VEGAS—In perhaps the most tweeted line from HM14, keynote speaker Ian Morrison, PhD, compared the addictiveness of crack cocaine with physicians’ dedication to the fee-for-service payment system.
“It’s really hard to get off of it,” the national healthcare expert deadpanned to a packed ballroom at the Mandalay Bay Resort and Casino.
The zinger was one of the highlights of the annual meeting’s three plenary addresses, which alternately gave the record 3,600 hospitalists in attendance doses of sobriety about the difficulty of healthcare reform and comedy bits from Dr. Morrison and HM dean Robert Wachter, MD, MHM.
The keynote titled “Obamacare Is Here: What Does It Mean for You and Your Hospital?” featured a panel discussion among Centers for Medicare & Medicaid Services (CMS) chief medical officer Patrick Conway, MD, MSc, MHM, FAAP; executive director and CEO of the Medical University of South Carolina in Charleston and former SHM president Patrick Cawley, MD, MBA, MHM, FACP, FACHE; veteran healthcare executive Patrick Courneya, MD; and American Enterprise Institute resident fellow Scott Gottlieb, MD. The quartet—dubbed the Patricks and Scott by several emcees—followed their hour-long plenary with a question-and-answer session.
“I think this is ultimately going to hurt the financial standing of the hospital industry,” said Dr. Gottlieb, a newcomer to SHM’s annual meeting. “A lot of these hospitals that are taking on these capitated contracts, taking on risk, consolidating physicians, I think they’re going to get themselves into financial trouble in the next five years. That’s going to put pressure on the hospitalists.”

–Dr. Gottlieb
Dr. Cawley said that just a few years ago, his institution subsidized five medical groups. Now it’s 25. He has a simple message for hospitalists not committed to providing better care at lower costs: “You’re not going to be on my good side.”
Dr. Wachter told medical students and residents that he sees no end in sight to the unrelenting pressure to provide that high-quality, low-cost care, while also making sure patient satisfaction rises. And he’s more than OK with that.

“It’s important to recognize that the goal we’re being asked to achieve—to deliver high-quality, satisfying, evidence-based care without undue variations, where we’re not harming people and doing it at a cost that doesn’t bankrupt society—is unambiguously right,” he said. “It’s such an obviously right goal that what is odd is that this was not our goal until recently. So the fact that our field has taken this on as our mantra is very satisfying and completely appropriate.”
The keynote addresses also highlighted another satisfying result: Immediate past SHM President Eric Howell, MD, SFHM, reached the goal he set at 2013’s annual meeting to double the society’s number of student and housestaff members from 500 to 1,000.
Newly minted SHM President Burke Kealey, MD, SFHM, has a goal that is a bit more abstract: He wants hospitalists to look at improving healthcare affordability, patient health, and the patient experience—as a single goal.
“We put the energy and the effort of the moment behind the squeaky wheel,” said Dr. Kealey, medical director of hospital specialties at HealthPartners Medical Group in St. Paul, Minn. “What I would like us to do is all start thinking about all three at the same time, and with equal weight at all times. To me, this is the next evolution of the hospitalist.”
Dr. Kealey’s tack for his one-year term is borrowed from the Institute of Healthcare Improvement, whose “triple aim” initiative has the same goals. But Dr. Kealey believes that focusing on any of the three areas while giving short shrift to the others misses the point of bettering the overall healthcare system.
“To improve health, but then people can’t afford that healthcare, is a nonstarter,” he said. “To make things finally affordable, but then people stay away because it’s a bad experience, makes no sense, either. We must do it all together.”

–Dr. Kealey
And hospitalists are in the perfect position to do it, said Dr. Morrison, a founding partner of Strategic Health Perspectives, a forecasting service for the healthcare industry that includes joint venture partners Harris Interactive and the Harvard School of Public Health’s department of health policy and management. He sees hospitalist leaders as change agents, as the rigmarole of healthcare reform shakes out over the next few years.
Dr. Morrison, a native of Scotland whose delivery was half stand-up comic, half policy wonk (he introduced himself as Dr. Wachter’s Scottish caddy), said that while politicians and pundits dicker over how a generational shift in policies will be implemented, hospitalists will be the ones balancing that change with patients’ needs.
“This is the work of the future,” he said, “and it is not policy wonk work; it is clinical work. It is about the transformation of the delivery system. That is the central challenge of the future.
“We’ve got to integrate across the continuum of care, using all the innovation that both public and private sectors can deliver. This is not going to be determined by CMS, in my view, but by the kind of innovation that America is always good at.”
A record 3,600 hospitalists swarmed the Mandalay Bay Resort and Casino for four days of education and networking that wrapped with the “father of HM,” Bob Wachter, MD, MHM, dressed as Elton John, warbling a hospitalist-centric version of Sir Elton’s chart topper, “Your Song,” to a packed ballroom.
“[HM14] is just intoxicating,” said hospitalist Kevin Gilroy, MD, of Greenville (S.C.) Health System. “And it ends with our daddy getting up there and lighting it up as Elton John. What other conference does that?”
LAS VEGAS—In perhaps the most tweeted line from HM14, keynote speaker Ian Morrison, PhD, compared the addictiveness of crack cocaine with physicians’ dedication to the fee-for-service payment system.
“It’s really hard to get off of it,” the national healthcare expert deadpanned to a packed ballroom at the Mandalay Bay Resort and Casino.
The zinger was one of the highlights of the annual meeting’s three plenary addresses, which alternately gave the record 3,600 hospitalists in attendance doses of sobriety about the difficulty of healthcare reform and comedy bits from Dr. Morrison and HM dean Robert Wachter, MD, MHM.
The keynote titled “Obamacare Is Here: What Does It Mean for You and Your Hospital?” featured a panel discussion among Centers for Medicare & Medicaid Services (CMS) chief medical officer Patrick Conway, MD, MSc, MHM, FAAP; executive director and CEO of the Medical University of South Carolina in Charleston and former SHM president Patrick Cawley, MD, MBA, MHM, FACP, FACHE; veteran healthcare executive Patrick Courneya, MD; and American Enterprise Institute resident fellow Scott Gottlieb, MD. The quartet—dubbed the Patricks and Scott by several emcees—followed their hour-long plenary with a question-and-answer session.
“I think this is ultimately going to hurt the financial standing of the hospital industry,” said Dr. Gottlieb, a newcomer to SHM’s annual meeting. “A lot of these hospitals that are taking on these capitated contracts, taking on risk, consolidating physicians, I think they’re going to get themselves into financial trouble in the next five years. That’s going to put pressure on the hospitalists.”
–Dr. Gottlieb
Dr. Cawley said that just a few years ago, his institution subsidized five medical groups. Now it’s 25. He has a simple message for hospitalists not committed to providing better care at lower costs: “You’re not going to be on my good side.”
Dr. Wachter told medical students and residents that he sees no end in sight to the unrelenting pressure to provide that high-quality, low-cost care, while also making sure patient satisfaction rises. And he’s more than OK with that.
“It’s important to recognize that the goal we’re being asked to achieve—to deliver high-quality, satisfying, evidence-based care without undue variations, where we’re not harming people and doing it at a cost that doesn’t bankrupt society—is unambiguously right,” he said. “It’s such an obviously right goal that what is odd is that this was not our goal until recently. So the fact that our field has taken this on as our mantra is very satisfying and completely appropriate.”
The keynote addresses also highlighted another satisfying result: Immediate past SHM President Eric Howell, MD, SFHM, reached the goal he set at 2013’s annual meeting to double the society’s number of student and housestaff members from 500 to 1,000.
Newly minted SHM President Burke Kealey, MD, SFHM, has a goal that is a bit more abstract: He wants hospitalists to look at improving healthcare affordability, patient health, and the patient experience—as a single goal.
“We put the energy and the effort of the moment behind the squeaky wheel,” said Dr. Kealey, medical director of hospital specialties at HealthPartners Medical Group in St. Paul, Minn. “What I would like us to do is all start thinking about all three at the same time, and with equal weight at all times. To me, this is the next evolution of the hospitalist.”
Dr. Kealey’s tack for his one-year term is borrowed from the Institute of Healthcare Improvement, whose “triple aim” initiative has the same goals. But Dr. Kealey believes that focusing on any of the three areas while giving short shrift to the others misses the point of bettering the overall healthcare system.
“To improve health, but then people can’t afford that healthcare, is a nonstarter,” he said. “To make things finally affordable, but then people stay away because it’s a bad experience, makes no sense, either. We must do it all together.”
–Dr. Kealey
And hospitalists are in the perfect position to do it, said Dr. Morrison, a founding partner of Strategic Health Perspectives, a forecasting service for the healthcare industry that includes joint venture partners Harris Interactive and the Harvard School of Public Health’s department of health policy and management. He sees hospitalist leaders as change agents, as the rigmarole of healthcare reform shakes out over the next few years.
Dr. Morrison, a native of Scotland whose delivery was half stand-up comic, half policy wonk (he introduced himself as Dr. Wachter’s Scottish caddy), said that while politicians and pundits dicker over how a generational shift in policies will be implemented, hospitalists will be the ones balancing that change with patients’ needs.
“This is the work of the future,” he said, “and it is not policy wonk work; it is clinical work. It is about the transformation of the delivery system. That is the central challenge of the future.
“We’ve got to integrate across the continuum of care, using all the innovation that both public and private sectors can deliver. This is not going to be determined by CMS, in my view, but by the kind of innovation that America is always good at.”
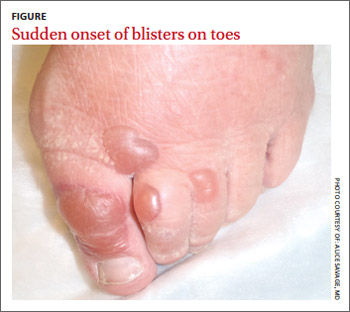
Blisters on an elderly woman’s toes
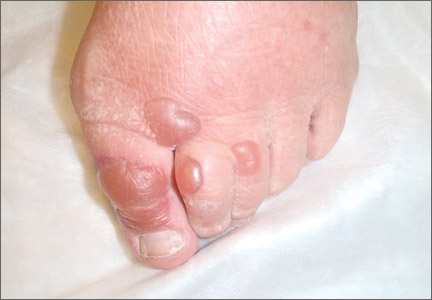
A 69-year-old woman with a history of hypertension, hyperlipidemia, diabetes, osteoarthritis, and depression presented to the emergency department (ED) with a 2-day history of blisters on the dorsal aspect of her toes on both feet. She had been wearing sandals so as not to disrupt them. The bullae appeared over the course of one day and progressively grew. The patient had no fever, chills, pain, or itching. She said she’d never had blisters like these before, and she had no history of cellulitis; she also denied trauma to her feet. There were no recent changes to any prescription or nonprescription medications. She also had not had any prolonged exposure to the sun or anything new that would suggest contact dermatitis.
The physical exam revealed an otherwise healthy woman with multiple, clear, fluid-filled bullae of varying sizes on her toes (FIGURE). There was no erythema, warmth, or tenderness. She could walk without difficulty. Her vital signs were normal. A white blood cell count and differential were normal, as well.
Our patient was admitted because of a mistaken concern for cellulitis, despite the absence of any systemic findings or surrounding erythema. She was discharged the next day with no change in status and without treatment. She returned to the ED several days later with the bullae still intact; a biopsy was performed and sent for immunofluorescence.
WHAT IS YOUR DIAGNOSIS?
HOW WOULD YOU TREAT THIS PATIENT?
Diagnosis: Bullosis diabeticorum
Direct immunofluorescence was negative. This, along with the patient’s history of diabetes, led us to diagnose bullosis diabeticorum in this patient. This condition, also known as bullous disease of diabetes, is characterized by abrupt development of noninflammatory bullae on acral areas in patients with diabetes. The skin appears normal except for the bullae.1 Bullosis diabeticorum occurs in just .5% of patients with diabetes.2 It is twice as common in men as in women.2
The etiology of bullosis diabeticorum is unknown. The acral location suggests that trauma may be a contributing factor. Although electron microscopy has suggested an abnormality in anchoring fibrils, this cellular change does not fully explain the development of multiple blisters at varying sites. Glycemic control is not thought to play a role.2
A large differential
The distribution of lesions and the presence—or absence—of systemic symptoms go a long way toward narrowing the differential of blistering diseases. The presence of generalized blistering and systemic symptoms would suggest conditions related to medication exposure, such as Stevens-Johnson syndrome or toxic epidermal necrolysis; infectious etiologies (eg, staphylococcal scalded skin syndrome); autoimmune causes; or underlying malignancy.3 Generalized blistering in the absence of systemic symptoms would support diagnoses such as bullous impetigo and pemphigoid.3
Lesion distribution provides important clues, too. Sun exposure-related causes typically leave lesions on the hands and forearms, not just the toes. A dermatomal distribution would suggest herpes zoster. A linear distribution of blisters argues for contact dermatitis. Mucous membrane involvement would suggest etiologies such as herpes simplex virus, erythema multiforme, pemphigus vulgaris, Stevens-Johnson syndrome, or toxic epidermal necrolysis.
Some conditions cannot be excluded from the differential diagnosis upon presentation. Hereditary epidermolysis bullosa (EB) represents a set of inherited diseases in which trauma causes blisters. Localized EB simplex, Weber-Cockayne subtype, can present in adulthood. Blisters can result from trauma on the hands or feet after excessive exercise.4 Although our patient did not give a history of excessive exercise, and this condition is rare, it and similar conditions must be ruled out.
Making the diagnosis
A diagnosis of bullosis diabeticorum can be made when biopsy with immunofluorescence excludes other histologically similar entities such as EB, noninflammatory bullous pemphigoid, and porphyria cutanea tarda. And while immunofluorescence findings are typically negative, elevated levels of immunoglobulin M and C3 have, on occasion, been reported.5,6 Cultures are warranted only if a secondary infection is suspected.
Treatment is usually unnecessary
The bullae of this condition spontaneously resolve over several weeks without treatment, but tend to recur. The lesions typically heal without significant scarring, although they may have a darker pigmentation after the first occurrence.4 Treatment may be warranted if a patient develops a secondary infection.
In our patient’s case…The bullae resolved within 2 weeks without treatment, although mild hyperpigmentation remained.
CORRESPONDENCE
Lisa Mims, MD, Department of Family Medicine, Medical University of South Carolina, 5 Charleston Center Drive, Suite 263, MSC 192, Charleston, SC 29425; [email protected]
1. Kramer DW. Early or warning signs of impending gangrene in diabetes. Med J Rec. 1930;132:338-342.
2. Poh-Fitzpatrick MB, Junkins-Hopkins JM. Bullous disease of diabetes. Available at: http://emedicine.medscape.com/article/1062235-overview. Accessed March 31, 2014.
3. Hull C, Zone JJ. Approach to the patient with cutaneous blisters. Available at: http://www.uptodate.com/contents/approach-to-the-patient-with-cutaneous-blisters. Accessed March 11, 2014.
4. Rocca FF, Pereyra E. Phlyctenar lesions in the feet of diabetic patients. Diabetes. 1963;12:220-222.
5. James WD, Odom RB, Goette DK. Bullous eruption of diabetes. A case with positive immunofluorescence microscopy findings. Arch Dermatol. 1980;116:1191-1192.
6. Basarab T, Munn SE, McGrath J, et al. Bullous diabeticorum. A case report and literature review. Clin Exp Dermatol. 1995;20:218-220.
A 69-year-old woman with a history of hypertension, hyperlipidemia, diabetes, osteoarthritis, and depression presented to the emergency department (ED) with a 2-day history of blisters on the dorsal aspect of her toes on both feet. She had been wearing sandals so as not to disrupt them. The bullae appeared over the course of one day and progressively grew. The patient had no fever, chills, pain, or itching. She said she’d never had blisters like these before, and she had no history of cellulitis; she also denied trauma to her feet. There were no recent changes to any prescription or nonprescription medications. She also had not had any prolonged exposure to the sun or anything new that would suggest contact dermatitis.
The physical exam revealed an otherwise healthy woman with multiple, clear, fluid-filled bullae of varying sizes on her toes (FIGURE). There was no erythema, warmth, or tenderness. She could walk without difficulty. Her vital signs were normal. A white blood cell count and differential were normal, as well.
Our patient was admitted because of a mistaken concern for cellulitis, despite the absence of any systemic findings or surrounding erythema. She was discharged the next day with no change in status and without treatment. She returned to the ED several days later with the bullae still intact; a biopsy was performed and sent for immunofluorescence.
WHAT IS YOUR DIAGNOSIS?
HOW WOULD YOU TREAT THIS PATIENT?
Diagnosis: Bullosis diabeticorum
Direct immunofluorescence was negative. This, along with the patient’s history of diabetes, led us to diagnose bullosis diabeticorum in this patient. This condition, also known as bullous disease of diabetes, is characterized by abrupt development of noninflammatory bullae on acral areas in patients with diabetes. The skin appears normal except for the bullae.1 Bullosis diabeticorum occurs in just .5% of patients with diabetes.2 It is twice as common in men as in women.2
The etiology of bullosis diabeticorum is unknown. The acral location suggests that trauma may be a contributing factor. Although electron microscopy has suggested an abnormality in anchoring fibrils, this cellular change does not fully explain the development of multiple blisters at varying sites. Glycemic control is not thought to play a role.2
A large differential
The distribution of lesions and the presence—or absence—of systemic symptoms go a long way toward narrowing the differential of blistering diseases. The presence of generalized blistering and systemic symptoms would suggest conditions related to medication exposure, such as Stevens-Johnson syndrome or toxic epidermal necrolysis; infectious etiologies (eg, staphylococcal scalded skin syndrome); autoimmune causes; or underlying malignancy.3 Generalized blistering in the absence of systemic symptoms would support diagnoses such as bullous impetigo and pemphigoid.3
Lesion distribution provides important clues, too. Sun exposure-related causes typically leave lesions on the hands and forearms, not just the toes. A dermatomal distribution would suggest herpes zoster. A linear distribution of blisters argues for contact dermatitis. Mucous membrane involvement would suggest etiologies such as herpes simplex virus, erythema multiforme, pemphigus vulgaris, Stevens-Johnson syndrome, or toxic epidermal necrolysis.
Some conditions cannot be excluded from the differential diagnosis upon presentation. Hereditary epidermolysis bullosa (EB) represents a set of inherited diseases in which trauma causes blisters. Localized EB simplex, Weber-Cockayne subtype, can present in adulthood. Blisters can result from trauma on the hands or feet after excessive exercise.4 Although our patient did not give a history of excessive exercise, and this condition is rare, it and similar conditions must be ruled out.
Making the diagnosis
A diagnosis of bullosis diabeticorum can be made when biopsy with immunofluorescence excludes other histologically similar entities such as EB, noninflammatory bullous pemphigoid, and porphyria cutanea tarda. And while immunofluorescence findings are typically negative, elevated levels of immunoglobulin M and C3 have, on occasion, been reported.5,6 Cultures are warranted only if a secondary infection is suspected.
Treatment is usually unnecessary
The bullae of this condition spontaneously resolve over several weeks without treatment, but tend to recur. The lesions typically heal without significant scarring, although they may have a darker pigmentation after the first occurrence.4 Treatment may be warranted if a patient develops a secondary infection.
In our patient’s case…The bullae resolved within 2 weeks without treatment, although mild hyperpigmentation remained.
CORRESPONDENCE
Lisa Mims, MD, Department of Family Medicine, Medical University of South Carolina, 5 Charleston Center Drive, Suite 263, MSC 192, Charleston, SC 29425; [email protected]
1. Kramer DW. Early or warning signs of impending gangrene in diabetes. Med J Rec. 1930;132:338-342.
2. Poh-Fitzpatrick MB, Junkins-Hopkins JM. Bullous disease of diabetes. Available at: http://emedicine.medscape.com/article/1062235-overview. Accessed March 31, 2014.
3. Hull C, Zone JJ. Approach to the patient with cutaneous blisters. Available at: http://www.uptodate.com/contents/approach-to-the-patient-with-cutaneous-blisters. Accessed March 11, 2014.
4. Rocca FF, Pereyra E. Phlyctenar lesions in the feet of diabetic patients. Diabetes. 1963;12:220-222.
5. James WD, Odom RB, Goette DK. Bullous eruption of diabetes. A case with positive immunofluorescence microscopy findings. Arch Dermatol. 1980;116:1191-1192.
6. Basarab T, Munn SE, McGrath J, et al. Bullous diabeticorum. A case report and literature review. Clin Exp Dermatol. 1995;20:218-220.
Erratum
An equation for calculating phenytoin levels in patients with low albumin levels in “Pitfalls & pearls for 8 common lab tests” (J Fam Pract. 2014;63:198-205) was incorrect. The equation, known as the Sheiner-Tozer equation, should have read: phenytoin concentration adjusted = concentration reported/([adjustment × serum albumin] + 0.1), where adjustment = 0.2 for creatinine clearance ≥20, or adjustment = 0.1 for creatinine clearance <20. This equation has been corrected in the online edition of the article.
An equation for calculating phenytoin levels in patients with low albumin levels in “Pitfalls & pearls for 8 common lab tests” (J Fam Pract. 2014;63:198-205) was incorrect. The equation, known as the Sheiner-Tozer equation, should have read: phenytoin concentration adjusted = concentration reported/([adjustment × serum albumin] + 0.1), where adjustment = 0.2 for creatinine clearance ≥20, or adjustment = 0.1 for creatinine clearance <20. This equation has been corrected in the online edition of the article.
An equation for calculating phenytoin levels in patients with low albumin levels in “Pitfalls & pearls for 8 common lab tests” (J Fam Pract. 2014;63:198-205) was incorrect. The equation, known as the Sheiner-Tozer equation, should have read: phenytoin concentration adjusted = concentration reported/([adjustment × serum albumin] + 0.1), where adjustment = 0.2 for creatinine clearance ≥20, or adjustment = 0.1 for creatinine clearance <20. This equation has been corrected in the online edition of the article.
Implantable Direct Current Spinal Fusion Stimulators Do Not Decrease Implant-Related Infections in a Rabbit Model

USPSTF: What’s recommended, what’s not
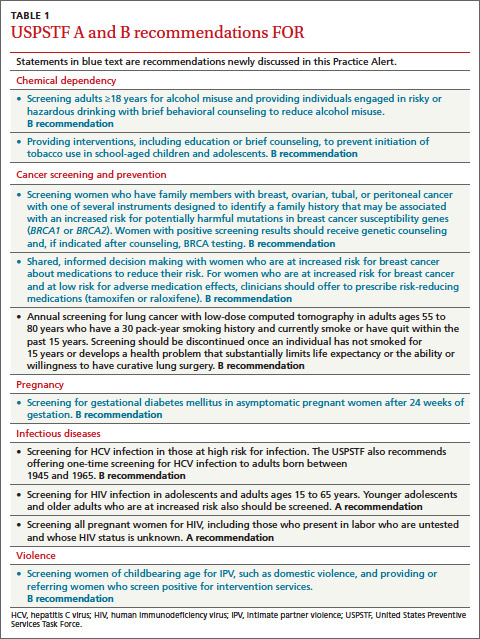
The United States Preventive Services Task Force (USPSTF) was busy in 2013, issuing 26 recommendations on 16 topics (TABLES 1-3). We have covered some of these topics previously in Practice Alerts or audiocasts—vitamin D for bone health and fall prevention,1 screening for lung cancer,2 human immunodeficiency virus infection,3 and the use of multivitamins to prevent cancer and cardiovascular disease (CVD).4 Another Practice Alert on chronic hepatitis C virus infection reviewed recommendations of the Centers for Disease Control and Prevention,5 which agree with those of the USPSTF. This Practice Alert discusses the remaining USPSTF recommendations.
Alcohol and tobacco
The Task Force (TF) reports that 30% of adults are affected by alcohol-related problems and that alcohol causes 85,000 deaths per year, making it the third leading cause of preventable death.6 The TF reviewed evidence on screening and counseling and now recommends screening adults ≥18 years for alcohol misuse and providing brief counseling to reduce alcohol use for those who engage in risky or hazardous drinking.6 The TF recommends any of 3 screening tools: using either the Alcohol Use Disorders Identification Test (AUDIT) or the abbreviated AUDIT-Consumption (AUDIT-C), or asking a single-question, such as “How many times in the past year have you had 5 (for men) or 4 (for women and all adults >65 years) or more drinks in a day?”6
Counseling for 5 to 15 minutes during the initial clinical encounter and then at subsequent visits is more effective than very brief (<5 minutes) or single-episode counseling. Counseling can include action plans, drinking diaries, stress management, or problem solving, and it can be done face-to-face or with written self-help materials, computer- or Web-based programs, or telephone support. Despite the importance of alcohol misuse as a health problem, the TF could find no evidence that screening and behavioral counseling is effective for adolescents.
For tobacco use, however, the TF now recommends providing prevention advice to school-age children and adolescents,7 presented in person or through written materials, videos, or other media. Over 8% of middle school children and close to 24% of high school students use tobacco.7 Tobacco is the leading cause of preventable deaths in the United States, and most smokers start before they are adults.7
Cancer screening and prevention
In addition to the recommendation for lung cancer screening, 2 other cancer screening/prevention recommendations were made in 2013. One is a modification of the previous recommendation on the use of BRCA gene testing to detect increased risk of breast and ovarian cancer. The recommendation now states that if a woman has a family member with breast, ovarian, tubal, or peritoneal cancer, her physician should use a screening tool to determine if her family history suggests high risk for having either BRCA1 or BRCA2. With a positive screening result, referral for genetic counseling is warranted. After counseling, the patient may choose to undergo BRCA testing. Screening tools reviewed by the TF are the Ontario Family History Assessment Tool, the Manchester Scoring System, the Referral Screening Tool, the Pedigree Assessment Tool, and the Family History Screening-7 instrument.8
The second recommendation is complex and concerns whether to prescribe tamoxifen or raloxifene to prevent breast cancer in women at high risk—ie, a 5-year risk ≥3%.9 One tool for estimating risk can be found at http://www.cancer.gov/bcrisktool/. It calculates risk based on age, race, genetic profile, age at menopause and menarche, family history of breast cancer, and personal history of breast cancer and biopsies. The TF recommends that physicians share decision making with women who are at high risk of breast cancer and offer medication to those at low risk of complications (those who have had a hysterectomy). Use of tamoxifen or raloxifene can reduce risk of the invasive cancer by 7 to 9 cases per 1000 women over 5 years. However, the risk of venous thromboembolism increases by 4 to 7 cases per 1000 over 5 years, and tamoxifen increases the risk of endometrial cancer by 4 in 1000. Both medications can cause hot flashes.9
Gestational diabetes
For a number of years the TF has assigned an “I” statement (insufficient evidence to assess benefits and harms) to screening for gestational diabetes. It recently changed that to a “B” recommendation for all pregnant women after the 24th week of pregnancy. Screening before 24 weeks is still listed as an I. Possible screening tools include a fasting blood glucose test, a 50-g oral glucose challenge test, or an assessment of risk factors. The TF did not find evidence of superiority with any of these methods. The TF found that diet modifications, glucose monitoring, and use of insulin can, in some cases, moderately reduce the incidence of preeclampsia, macrosomia, and shoulder dystocia.10
Intimate partner violence
Another change from a previous “I” statement pertains to intimate partner violence (IPV). The TF now recommends screening women of childbearing age for IPV and either providing intervention services for those who screen positive for IPV or referring for services. Reproductive age is defined as 14 to 46 years, although the TF admits that most studies have looked at women ≥18 years.11 Most of the benefits from screening and counseling have been demonstrated in pregnant women.
IPV can include physical, sexual, or psychological harm by a current or former partner or spouse, and it is not limited to opposite sex couples.11 Screening tools with the highest sensitivity and specificity include the Hurt, Insult, Threaten, and Scream (HITS) scale. Potential interventions include counseling, home visits, information cards, referrals to community services, and mentoring support.
While the TF acknowledges that both child abuse and elder abuse are prominent problems, there is not enough evidence to assess and recommend interventions.11,12
D recommendations
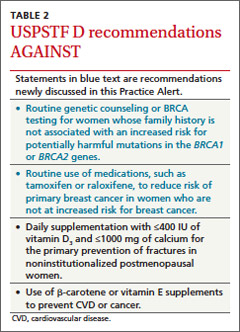
There were 4 “D” recommendations (recommend against) in 2013: testing for BRCA or using tamoxifen or raloxifene in women at low risk of breast cancer; using β-carotene or vitamin E to prevent CVD and cancer; and using low doses of vitamin D and calcium to prevent fractures in noninstitutionalized postmenopausal women (TABLE 2). In each instance the harms of the intervention were deemed to exceed potential benefits.
I statements
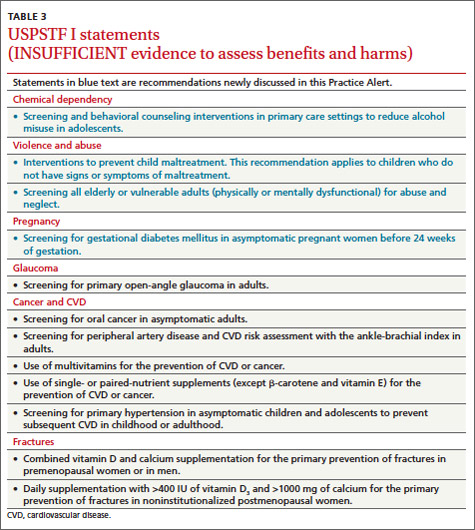
The TF still finds little evidence to support some common practices (TABLE 3). Physicians who use these interventions should realize that the TF, after thorough systematic reviews of the available evidence, does not find enough evidence to assess their relative benefits and harms. A description of the evidence on each condition can be found in the recommendations section of the USPSTF Web site (http://www.uspreventiveservicestaskforce.org/uspstopics.htm).
1. Campos-Outcalt D. Vitamin D: when it helps, when it harms. J Fam Pract. 2013;62:368-370.
2. Campos-Outcalt D. Lung cancer screening: USPSTF revises its recommendation. J Fam Pract. 2013;62:733-740.
3. Campos-Outcalt D. HIV screening: what the USPSTF says now. [Audiocast]. Parsippany, NJ; The Journal of Family Practice: 2013. Available at: http://www.jfponline.com/multimedia/audio/article/hiv-screening-what-the-uspstf-says-now/a1c4bc0fc9405f18820bb19fe971f743.html. Accessed March 14, 2014.
4. Campos-Outcalt D. Does your patient really need a supplement? [Audiocast]. Parsippany, NJ: The Journal of Family Practice; 2013. Available at: http://www.jfponline.com/index.php?id=21643&cHash=071010&tx_ttnews[tt_news]=226385. Accessed March 14, 2014.
5. Campos-Outcalt D. Hepatitis C: new CDC screening recommendations. J Fam Pract. 2012;61:744-746.
6. US Preventive Services Task Force Web site. Screening and behavioral counseling interventions in primary care to reduce alcohol misuse. Available at: http://www.uspreventiveservicestaskforce.org/uspstf/uspsdrin.htm. Accessed March 14, 2014.
7. US Preventive Services Task Force Web site. Primary care interventions to prevent tobacco use in children and adolescents. Available at: http://www.uspreventiveservicestaskforce.org/uspstf/uspstbac.htm. Accessed March 14, 2014.
8. US Preventive Services Task Force Web site. Risk assessment, genetic counseling, and genetic testing for BRCA-related cancer in women. Available at: http://www.uspreventiveservicestaskforce.org/uspstf/uspsbrgen.htm. Accessed March 14, 2014.
9. US Preventive Services Task Force Web site. Medication for risk reduction of primary breast cancer in women. Available at: http://www.uspreventiveservicestaskforce.org/uspstf/uspsbrpv.htm. Accessed March 14, 2014.
10. US Preventive Services Task Force Web site. Screening for gestational diabetes mellitius. Available at: http://www.uspreventiveservicestaskforce.org/uspstf/uspsgdm.htm. Accessed March 14, 2014.
11. US Preventive Services Task Force Web site. Screening for intimate partner violence and abuse of elderly and vulnerable adults. Available at: http://www.uspreventiveservicestaskforce.org/uspstf/uspsipv.htm. Accessed March 14, 2014.
12. US Preventive Services Task Force Web site. Primary interventions to prevent child maltreatment. Available at: http://www.uspreventiveservicestaskforce.org/uspstf/uspsfamv.htm. Accessed March 14, 2014.
The United States Preventive Services Task Force (USPSTF) was busy in 2013, issuing 26 recommendations on 16 topics (TABLES 1-3). We have covered some of these topics previously in Practice Alerts or audiocasts—vitamin D for bone health and fall prevention,1 screening for lung cancer,2 human immunodeficiency virus infection,3 and the use of multivitamins to prevent cancer and cardiovascular disease (CVD).4 Another Practice Alert on chronic hepatitis C virus infection reviewed recommendations of the Centers for Disease Control and Prevention,5 which agree with those of the USPSTF. This Practice Alert discusses the remaining USPSTF recommendations.
Alcohol and tobacco
The Task Force (TF) reports that 30% of adults are affected by alcohol-related problems and that alcohol causes 85,000 deaths per year, making it the third leading cause of preventable death.6 The TF reviewed evidence on screening and counseling and now recommends screening adults ≥18 years for alcohol misuse and providing brief counseling to reduce alcohol use for those who engage in risky or hazardous drinking.6 The TF recommends any of 3 screening tools: using either the Alcohol Use Disorders Identification Test (AUDIT) or the abbreviated AUDIT-Consumption (AUDIT-C), or asking a single-question, such as “How many times in the past year have you had 5 (for men) or 4 (for women and all adults >65 years) or more drinks in a day?”6
Counseling for 5 to 15 minutes during the initial clinical encounter and then at subsequent visits is more effective than very brief (<5 minutes) or single-episode counseling. Counseling can include action plans, drinking diaries, stress management, or problem solving, and it can be done face-to-face or with written self-help materials, computer- or Web-based programs, or telephone support. Despite the importance of alcohol misuse as a health problem, the TF could find no evidence that screening and behavioral counseling is effective for adolescents.
For tobacco use, however, the TF now recommends providing prevention advice to school-age children and adolescents,7 presented in person or through written materials, videos, or other media. Over 8% of middle school children and close to 24% of high school students use tobacco.7 Tobacco is the leading cause of preventable deaths in the United States, and most smokers start before they are adults.7
Cancer screening and prevention
In addition to the recommendation for lung cancer screening, 2 other cancer screening/prevention recommendations were made in 2013. One is a modification of the previous recommendation on the use of BRCA gene testing to detect increased risk of breast and ovarian cancer. The recommendation now states that if a woman has a family member with breast, ovarian, tubal, or peritoneal cancer, her physician should use a screening tool to determine if her family history suggests high risk for having either BRCA1 or BRCA2. With a positive screening result, referral for genetic counseling is warranted. After counseling, the patient may choose to undergo BRCA testing. Screening tools reviewed by the TF are the Ontario Family History Assessment Tool, the Manchester Scoring System, the Referral Screening Tool, the Pedigree Assessment Tool, and the Family History Screening-7 instrument.8
The second recommendation is complex and concerns whether to prescribe tamoxifen or raloxifene to prevent breast cancer in women at high risk—ie, a 5-year risk ≥3%.9 One tool for estimating risk can be found at http://www.cancer.gov/bcrisktool/. It calculates risk based on age, race, genetic profile, age at menopause and menarche, family history of breast cancer, and personal history of breast cancer and biopsies. The TF recommends that physicians share decision making with women who are at high risk of breast cancer and offer medication to those at low risk of complications (those who have had a hysterectomy). Use of tamoxifen or raloxifene can reduce risk of the invasive cancer by 7 to 9 cases per 1000 women over 5 years. However, the risk of venous thromboembolism increases by 4 to 7 cases per 1000 over 5 years, and tamoxifen increases the risk of endometrial cancer by 4 in 1000. Both medications can cause hot flashes.9
Gestational diabetes
For a number of years the TF has assigned an “I” statement (insufficient evidence to assess benefits and harms) to screening for gestational diabetes. It recently changed that to a “B” recommendation for all pregnant women after the 24th week of pregnancy. Screening before 24 weeks is still listed as an I. Possible screening tools include a fasting blood glucose test, a 50-g oral glucose challenge test, or an assessment of risk factors. The TF did not find evidence of superiority with any of these methods. The TF found that diet modifications, glucose monitoring, and use of insulin can, in some cases, moderately reduce the incidence of preeclampsia, macrosomia, and shoulder dystocia.10
Intimate partner violence
Another change from a previous “I” statement pertains to intimate partner violence (IPV). The TF now recommends screening women of childbearing age for IPV and either providing intervention services for those who screen positive for IPV or referring for services. Reproductive age is defined as 14 to 46 years, although the TF admits that most studies have looked at women ≥18 years.11 Most of the benefits from screening and counseling have been demonstrated in pregnant women.
IPV can include physical, sexual, or psychological harm by a current or former partner or spouse, and it is not limited to opposite sex couples.11 Screening tools with the highest sensitivity and specificity include the Hurt, Insult, Threaten, and Scream (HITS) scale. Potential interventions include counseling, home visits, information cards, referrals to community services, and mentoring support.
While the TF acknowledges that both child abuse and elder abuse are prominent problems, there is not enough evidence to assess and recommend interventions.11,12
D recommendations
There were 4 “D” recommendations (recommend against) in 2013: testing for BRCA or using tamoxifen or raloxifene in women at low risk of breast cancer; using β-carotene or vitamin E to prevent CVD and cancer; and using low doses of vitamin D and calcium to prevent fractures in noninstitutionalized postmenopausal women (TABLE 2). In each instance the harms of the intervention were deemed to exceed potential benefits.
I statements
The TF still finds little evidence to support some common practices (TABLE 3). Physicians who use these interventions should realize that the TF, after thorough systematic reviews of the available evidence, does not find enough evidence to assess their relative benefits and harms. A description of the evidence on each condition can be found in the recommendations section of the USPSTF Web site (http://www.uspreventiveservicestaskforce.org/uspstopics.htm).
1. Campos-Outcalt D. Vitamin D: when it helps, when it harms. J Fam Pract. 2013;62:368-370.
2. Campos-Outcalt D. Lung cancer screening: USPSTF revises its recommendation. J Fam Pract. 2013;62:733-740.
3. Campos-Outcalt D. HIV screening: what the USPSTF says now. [Audiocast]. Parsippany, NJ; The Journal of Family Practice: 2013. Available at: http://www.jfponline.com/multimedia/audio/article/hiv-screening-what-the-uspstf-says-now/a1c4bc0fc9405f18820bb19fe971f743.html. Accessed March 14, 2014.
4. Campos-Outcalt D. Does your patient really need a supplement? [Audiocast]. Parsippany, NJ: The Journal of Family Practice; 2013. Available at: http://www.jfponline.com/index.php?id=21643&cHash=071010&tx_ttnews[tt_news]=226385. Accessed March 14, 2014.
5. Campos-Outcalt D. Hepatitis C: new CDC screening recommendations. J Fam Pract. 2012;61:744-746.
6. US Preventive Services Task Force Web site. Screening and behavioral counseling interventions in primary care to reduce alcohol misuse. Available at: http://www.uspreventiveservicestaskforce.org/uspstf/uspsdrin.htm. Accessed March 14, 2014.
7. US Preventive Services Task Force Web site. Primary care interventions to prevent tobacco use in children and adolescents. Available at: http://www.uspreventiveservicestaskforce.org/uspstf/uspstbac.htm. Accessed March 14, 2014.
8. US Preventive Services Task Force Web site. Risk assessment, genetic counseling, and genetic testing for BRCA-related cancer in women. Available at: http://www.uspreventiveservicestaskforce.org/uspstf/uspsbrgen.htm. Accessed March 14, 2014.
9. US Preventive Services Task Force Web site. Medication for risk reduction of primary breast cancer in women. Available at: http://www.uspreventiveservicestaskforce.org/uspstf/uspsbrpv.htm. Accessed March 14, 2014.
10. US Preventive Services Task Force Web site. Screening for gestational diabetes mellitius. Available at: http://www.uspreventiveservicestaskforce.org/uspstf/uspsgdm.htm. Accessed March 14, 2014.
11. US Preventive Services Task Force Web site. Screening for intimate partner violence and abuse of elderly and vulnerable adults. Available at: http://www.uspreventiveservicestaskforce.org/uspstf/uspsipv.htm. Accessed March 14, 2014.
12. US Preventive Services Task Force Web site. Primary interventions to prevent child maltreatment. Available at: http://www.uspreventiveservicestaskforce.org/uspstf/uspsfamv.htm. Accessed March 14, 2014.
Studies hint at safety, efficacy of spinal muscular atrophy drug
PHILADELPHIA – The latest interim results from open-label studies of the investigational antisense oligonucleotide therapy ISIS-SMNRx for the treatment of patients with type 1, 2, or 3 spinal muscular atrophy support its safety and are starting to show its potential efficacy in treating the range of severity seen in the disease.
In two ongoing studies with up to 9 months of follow-up data, no safety or tolerability concerns arose with total doses of up to 18 mg in patients with type 2 or 3 spinal muscular atrophy (SMA) and in total doses of up to 48 mg in infants with type 1 SMA. Children aged 2-15 years with type 2 or 3 SMA had a dose- and time-dependent improvement in scores on the Hammersmith Functional Motor Scale-Expanded (HFMSE) that also correlated well with levels of SMN protein in cerebrospinal fluid. Infants with type 1 SMA achieved motor milestones on the Hammersmith Infant Neurological Exam that were consistent with increases in motor function test scores, according to investigators who presented the results at the annual meeting of the American Academy of Neurology.
"It’s very encouraging that we can do this safely and that the children tolerate the lumbar punctures, and there’s hope that the measures [used in the studies] are sensitive to change," said primary investigator Dr. Claudia Chiriboga, who presented the interim results of a study in patients with SMA types 2 or 3.
In that study, ISIS-SMNRx, an antisense oligonucleotide that promotes transcription of the full-length SMN protein from the SMN2 gene, was administered in an intrathecal bolus via lumbar puncture at points during a 3-month period; patients were then followed for 6 months. A total of eight patients received 3 mg at each dose (total dose, 9 mg); eight received 6 mg at each dose (total dose, 18 mg); and nine received 9 mg at each dose (18 mg total). Later, investigators added a 12-mg dose cohort that currently has eight patients enrolled, but results in that cohort are not yet available, said Dr. Chiriboga of the division of child neurology at Columbia University, New York.
The SMA type 2 and 3 patients included 10 patients with type 2 and 15 with type 3. They were medically stable and 2-15 years old, with a mean age of 7.5 years. Most (20) had three copies of the SMN2 gene; 4 had four copies and 1 had two copies. A majority of the patients (16) were nonambulatory.
None of the adverse events reported were considered related to the study drug, and most of the 143 adverse events were mild or moderate, the investigators found. Two severe adverse events were back pain and myalgia. Most of the adverse events were related to the lumbar punctures.
Scores on the HFMSE improved from baseline by a mean of 1.5 points in the 3-mg group, 2.3 points in the 6-mg group, and a statistically significant 3.7 points in the 9-mg group. SMN levels in cerebrospinal fluid at day 85 increased from baseline in all groups but were significantly increased in the 9-mg group only.
Additional secondary endpoints showed nonsignificant improvement of 22.7 m at 9 months on the 6-minute walk test in those who could walk, and an improvement of 2.3 points on an 18-point scale measuring upper limb function in weaker nonambulatory patients, but the open-label nature of the study and small numbers of patients make it difficult to interpret such findings, Dr. Chiriboga said.

"The feeling is that when there’s chronicity, like end-stage type of changes – severe scoliosis, for example – that those individuals don’t do as well. ... It’s not so much the age," Dr. Chiriboga said in an interview. Patients with type 3 disease also do better because they have more SMN2 to begin with, she said.
Similarly, in the ongoing open-label study of infants with type 1 SMA, ISIS-SMNRx was administered to 4 patients in 6-mg doses at days 1, 15, 85, and 253, and in 12-mg doses to 11 patients at the same time points. These infants were all aged 7 months or younger. Their mean age at symptom onset was 7 weeks, and they were enrolled in the study at a mean age of 18-21 weeks. All but one patient had two copies of the SMN2 gene, reported primary investigator Dr. Richard S. Finkel.
None of the adverse events in the infants were deemed to be related to ISIS-SMNRx. Of 14 severe adverse events, 11 were respiratory infections, and all were considered to be consistent with severe infant SMA, said Dr. Finkel, chief of the division of neurology at Nemours Children’s Hospital and professor of neurology at the University of Central Florida, both in Orlando.
One patient in the 6-mg group died accidentally, and another underwent permanent ventilation. Two of 11 patients in the 12-mg group died of pulmonary infection, and 1 required permanent ventilation (16 or more hours per day continuously for more than 2 weeks in the absence of an acute reversible illness), although 4 of the patients in this group have not yet received all their doses. At the last follow-up, or at the time of death or permanent ventilation, the median age was 14 months in the 6-mg group and 9.6 months in the 12-mg group (which has not been followed as long).
Scores on the Children’s Hospital of Philadelphia Infant Test of Neuromuscular Disorders (CHOP-INTEND) showed increases in 8 of 11 infants who had completed treatment and evaluation. The scores increased by a mean of 5.4 points overall and by 8.3 points in those in the 12-mg group. Incremental milestones on the Hammersmith Infant Neurological Exam were achieved by 9 of 11 infants, including 6 of 7 in the 12-mg group.
The median age at death or need for permanent ventilation is 10.5 months in infants with two SMN2 gene copies, and 85% reach this endpoint at 18 months. Scores on the CHOP-INTEND also declined by 1.27 points per year, according to a study of the natural history of type 1 SMA in 34 patients by Dr. Finkel and his colleagues that is under review for publication.
Compound muscle action potentials measured in the ulnar nerve–innervated abductor digiti minimi and peroneal nerve–innervated anterior tibialis were stable or increased in most infants, he said.
These encouraging results with ISIS-SMNRx have led Isis to begin plans for phase III trials in patients with SMA types 1-3, the investigators said.
The studies are funded by Isis Pharmaceuticals, the Department of Defense, and the National Institute of Neurological Disorders and Stroke. Neither Dr. Finkel nor Dr. Chiriboga had conflicts of interest. Some of the coauthors in each study were employees of Isis.
PHILADELPHIA – The latest interim results from open-label studies of the investigational antisense oligonucleotide therapy ISIS-SMNRx for the treatment of patients with type 1, 2, or 3 spinal muscular atrophy support its safety and are starting to show its potential efficacy in treating the range of severity seen in the disease.
In two ongoing studies with up to 9 months of follow-up data, no safety or tolerability concerns arose with total doses of up to 18 mg in patients with type 2 or 3 spinal muscular atrophy (SMA) and in total doses of up to 48 mg in infants with type 1 SMA. Children aged 2-15 years with type 2 or 3 SMA had a dose- and time-dependent improvement in scores on the Hammersmith Functional Motor Scale-Expanded (HFMSE) that also correlated well with levels of SMN protein in cerebrospinal fluid. Infants with type 1 SMA achieved motor milestones on the Hammersmith Infant Neurological Exam that were consistent with increases in motor function test scores, according to investigators who presented the results at the annual meeting of the American Academy of Neurology.
"It’s very encouraging that we can do this safely and that the children tolerate the lumbar punctures, and there’s hope that the measures [used in the studies] are sensitive to change," said primary investigator Dr. Claudia Chiriboga, who presented the interim results of a study in patients with SMA types 2 or 3.
In that study, ISIS-SMNRx, an antisense oligonucleotide that promotes transcription of the full-length SMN protein from the SMN2 gene, was administered in an intrathecal bolus via lumbar puncture at points during a 3-month period; patients were then followed for 6 months. A total of eight patients received 3 mg at each dose (total dose, 9 mg); eight received 6 mg at each dose (total dose, 18 mg); and nine received 9 mg at each dose (18 mg total). Later, investigators added a 12-mg dose cohort that currently has eight patients enrolled, but results in that cohort are not yet available, said Dr. Chiriboga of the division of child neurology at Columbia University, New York.
The SMA type 2 and 3 patients included 10 patients with type 2 and 15 with type 3. They were medically stable and 2-15 years old, with a mean age of 7.5 years. Most (20) had three copies of the SMN2 gene; 4 had four copies and 1 had two copies. A majority of the patients (16) were nonambulatory.
None of the adverse events reported were considered related to the study drug, and most of the 143 adverse events were mild or moderate, the investigators found. Two severe adverse events were back pain and myalgia. Most of the adverse events were related to the lumbar punctures.
Scores on the HFMSE improved from baseline by a mean of 1.5 points in the 3-mg group, 2.3 points in the 6-mg group, and a statistically significant 3.7 points in the 9-mg group. SMN levels in cerebrospinal fluid at day 85 increased from baseline in all groups but were significantly increased in the 9-mg group only.
Additional secondary endpoints showed nonsignificant improvement of 22.7 m at 9 months on the 6-minute walk test in those who could walk, and an improvement of 2.3 points on an 18-point scale measuring upper limb function in weaker nonambulatory patients, but the open-label nature of the study and small numbers of patients make it difficult to interpret such findings, Dr. Chiriboga said.
"The feeling is that when there’s chronicity, like end-stage type of changes – severe scoliosis, for example – that those individuals don’t do as well. ... It’s not so much the age," Dr. Chiriboga said in an interview. Patients with type 3 disease also do better because they have more SMN2 to begin with, she said.
Similarly, in the ongoing open-label study of infants with type 1 SMA, ISIS-SMNRx was administered to 4 patients in 6-mg doses at days 1, 15, 85, and 253, and in 12-mg doses to 11 patients at the same time points. These infants were all aged 7 months or younger. Their mean age at symptom onset was 7 weeks, and they were enrolled in the study at a mean age of 18-21 weeks. All but one patient had two copies of the SMN2 gene, reported primary investigator Dr. Richard S. Finkel.
None of the adverse events in the infants were deemed to be related to ISIS-SMNRx. Of 14 severe adverse events, 11 were respiratory infections, and all were considered to be consistent with severe infant SMA, said Dr. Finkel, chief of the division of neurology at Nemours Children’s Hospital and professor of neurology at the University of Central Florida, both in Orlando.
One patient in the 6-mg group died accidentally, and another underwent permanent ventilation. Two of 11 patients in the 12-mg group died of pulmonary infection, and 1 required permanent ventilation (16 or more hours per day continuously for more than 2 weeks in the absence of an acute reversible illness), although 4 of the patients in this group have not yet received all their doses. At the last follow-up, or at the time of death or permanent ventilation, the median age was 14 months in the 6-mg group and 9.6 months in the 12-mg group (which has not been followed as long).
Scores on the Children’s Hospital of Philadelphia Infant Test of Neuromuscular Disorders (CHOP-INTEND) showed increases in 8 of 11 infants who had completed treatment and evaluation. The scores increased by a mean of 5.4 points overall and by 8.3 points in those in the 12-mg group. Incremental milestones on the Hammersmith Infant Neurological Exam were achieved by 9 of 11 infants, including 6 of 7 in the 12-mg group.
The median age at death or need for permanent ventilation is 10.5 months in infants with two SMN2 gene copies, and 85% reach this endpoint at 18 months. Scores on the CHOP-INTEND also declined by 1.27 points per year, according to a study of the natural history of type 1 SMA in 34 patients by Dr. Finkel and his colleagues that is under review for publication.
Compound muscle action potentials measured in the ulnar nerve–innervated abductor digiti minimi and peroneal nerve–innervated anterior tibialis were stable or increased in most infants, he said.
These encouraging results with ISIS-SMNRx have led Isis to begin plans for phase III trials in patients with SMA types 1-3, the investigators said.
The studies are funded by Isis Pharmaceuticals, the Department of Defense, and the National Institute of Neurological Disorders and Stroke. Neither Dr. Finkel nor Dr. Chiriboga had conflicts of interest. Some of the coauthors in each study were employees of Isis.
AT THE AAN 2014 ANNUAL MEETING
Necrotizing Fasciitis of Lower Extremity Caused by Haemophilus influenzae in a Healthy Adult With a Closed Lisfranc Injury
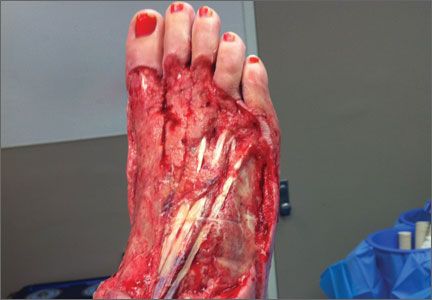
Hospitalists Share Strategies to Overcome Career-Related Struggles
LAS VEGAS—If she said it once, Patience Reich, MD, SFHM, said it a half-dozen times during SHM’s annual meeting: “Let it go.”
“You can’t be Martha Stewart and a perfect doctor. Just let it go,” said Dr. Reich, associate professor of internal medicine and associate faculty for the Office of Women in Medicine and Science at the Wake Forest School of Medicine in Winston-Salem, N.C., told about 75 female hospitalists during a two-hour workshop focused on women’s issues at the Mandalay Bay Resort and Casino. “Even in 2014, there are trade-offs to be made.
.jpg)
Dr. Reich and Rachel George, MD, MBA, CPE, SFHM, of Cogent Healthcare, have been moderating the workshop at SHM meetings for several years. They said the issues they encounter among hospitalists around the country, which are no different today than they were in years past, include gender bias, career advancement challenges, and the guilt some feel spending time away from their children or communicating with their stay-at-home husbands.
At HM14, workshop attendees searched for solutions to common struggles.
“Don’t pretend you can have it all,” Dr. George said. “It’s a myth ruining womankind. There’s nothing that says you have to be June Cleaver and Marcus Welby all rolled into one. We have to stop thinking that we have to do it.”
Dr. George told the workshop attendees that cooking and cleaning are so far down on her priority list that “they practically don’t exist.”
“It’s OK. My kids are happy and healthy,” she said. “It doesn’t matter if they come home to a dirty house or if they eat pizza. They’re going to survive. I think women put all that guilt on themselves. Some of it society does, but a lot of women put the guilt on themselves just because they don’t cook a three-course meal every night.”
Open Forum
The issues were much the same during a Special Interest Group attended by nearly 35 hospitalists and moderated by Melissa Mattison, MD, FACP, SFHM, of Beth Israel Deaconess Medical Center in Boston. Topics ranged from personal experiences with workplace discrimination to apprehension in pursuing leadership roles to “partner envy” and dealing with the “guilt” of being a working parent.
One hospitalist wondered how others dealt with harassment from patients. “I’m young, petite, and a minority,” she said. “I get ‘sweetie’ and ‘honey’ all the time from my patients.”
Another explained the difficulty of working full time while taking care of an elderly parent. Yet another admitted her desire for a role model, “as there are none in my area.”
“Men seem to have an innate drive to be the breadwinner,” one attendee said. “No matter how much help you have at home, it doesn’t take away the guilt I feel.”
Another said, “I think about all of these issues constantly.”
Dr. Mattison, a member of the annual meeting committee, left the 45-minute open forum with four action items:
- Increase the exposure of programming for issues related to work-life balance at annual meeting;
- Suggest keynote speakers who are not men;
- Create a toolkit for HM leaders and department of medicine leaders to help them understand work-life issues; and
- Create a community on the HMX portal to discuss work-life issues, “whether they are related to being a mother or father, juggling work and home, or whatever issues come up.”
The Key: Flex Schedules
Many physicians who choose a career in HM do it because of the work-life balance the specialty affords, and many of the challenges women hospitalists face at the local level revolve around the schedule. That’s how Zenobia JonesFoster, MD, MPH, a hospitalist at Wellstar Health in Atlanta, views it.
“I think it’s very facility-dependent. I think when we look for a job and decide where we want to go, we really need to understand the culture and how people advance within that culture,” said Dr. JonesFoster, who attended the women’s issues workshop. “The academic environment has a lot more deferred policy and bureaucracy versus a private institution, but you’re going to find that anywhere.”
A hospitalist for a little more than two years, Dr. JonesFoster has two young children, ages one and three, and works in a group with 30 full-time hospitalists and 10 nurse practitioners and physician assistants. Her husband is a businessman, so schedules and work-life balance are a major concern.
“If I was given a job opportunity Monday through Friday, regular work hours, there’s no way I would take it because of the flexibility of hospital medicine hours, with the seven-on seven-off schedule,” she said. “The time I have off, I get to just be a mom and not think about work. But when I’m at work, I love it.”
Dr. JonesFoster’s group has seen an increase in patient census recently and just went live with a new hospital-wide electronic health records system, which has opened up more shifts and moonlighting opportunities. Attending her first annual meeting, she was most interested in learning the pros and cons of leadership positions, because her health system “offers a lot of opportunity for advancement” and is “talking about adding a residency program.”
“Another thing I wanted to learn about was mentorship,” she said. “I wanted to meet women who have done this before, who have had children, who are working full-time trying to do a little bit of everything. I wanted to see how they did it and try and learn from their experiences.”
From all accounts, mission accomplished.
Richard Quinn is a freelance writer in New Jersey.
LAS VEGAS—If she said it once, Patience Reich, MD, SFHM, said it a half-dozen times during SHM’s annual meeting: “Let it go.”
“You can’t be Martha Stewart and a perfect doctor. Just let it go,” said Dr. Reich, associate professor of internal medicine and associate faculty for the Office of Women in Medicine and Science at the Wake Forest School of Medicine in Winston-Salem, N.C., told about 75 female hospitalists during a two-hour workshop focused on women’s issues at the Mandalay Bay Resort and Casino. “Even in 2014, there are trade-offs to be made.
Dr. Reich and Rachel George, MD, MBA, CPE, SFHM, of Cogent Healthcare, have been moderating the workshop at SHM meetings for several years. They said the issues they encounter among hospitalists around the country, which are no different today than they were in years past, include gender bias, career advancement challenges, and the guilt some feel spending time away from their children or communicating with their stay-at-home husbands.
At HM14, workshop attendees searched for solutions to common struggles.
“Don’t pretend you can have it all,” Dr. George said. “It’s a myth ruining womankind. There’s nothing that says you have to be June Cleaver and Marcus Welby all rolled into one. We have to stop thinking that we have to do it.”
Dr. George told the workshop attendees that cooking and cleaning are so far down on her priority list that “they practically don’t exist.”
“It’s OK. My kids are happy and healthy,” she said. “It doesn’t matter if they come home to a dirty house or if they eat pizza. They’re going to survive. I think women put all that guilt on themselves. Some of it society does, but a lot of women put the guilt on themselves just because they don’t cook a three-course meal every night.”
Open Forum
The issues were much the same during a Special Interest Group attended by nearly 35 hospitalists and moderated by Melissa Mattison, MD, FACP, SFHM, of Beth Israel Deaconess Medical Center in Boston. Topics ranged from personal experiences with workplace discrimination to apprehension in pursuing leadership roles to “partner envy” and dealing with the “guilt” of being a working parent.
One hospitalist wondered how others dealt with harassment from patients. “I’m young, petite, and a minority,” she said. “I get ‘sweetie’ and ‘honey’ all the time from my patients.”
Another explained the difficulty of working full time while taking care of an elderly parent. Yet another admitted her desire for a role model, “as there are none in my area.”
“Men seem to have an innate drive to be the breadwinner,” one attendee said. “No matter how much help you have at home, it doesn’t take away the guilt I feel.”
Another said, “I think about all of these issues constantly.”
Dr. Mattison, a member of the annual meeting committee, left the 45-minute open forum with four action items:
- Increase the exposure of programming for issues related to work-life balance at annual meeting;
- Suggest keynote speakers who are not men;
- Create a toolkit for HM leaders and department of medicine leaders to help them understand work-life issues; and
- Create a community on the HMX portal to discuss work-life issues, “whether they are related to being a mother or father, juggling work and home, or whatever issues come up.”
The Key: Flex Schedules
Many physicians who choose a career in HM do it because of the work-life balance the specialty affords, and many of the challenges women hospitalists face at the local level revolve around the schedule. That’s how Zenobia JonesFoster, MD, MPH, a hospitalist at Wellstar Health in Atlanta, views it.
“I think it’s very facility-dependent. I think when we look for a job and decide where we want to go, we really need to understand the culture and how people advance within that culture,” said Dr. JonesFoster, who attended the women’s issues workshop. “The academic environment has a lot more deferred policy and bureaucracy versus a private institution, but you’re going to find that anywhere.”
A hospitalist for a little more than two years, Dr. JonesFoster has two young children, ages one and three, and works in a group with 30 full-time hospitalists and 10 nurse practitioners and physician assistants. Her husband is a businessman, so schedules and work-life balance are a major concern.
“If I was given a job opportunity Monday through Friday, regular work hours, there’s no way I would take it because of the flexibility of hospital medicine hours, with the seven-on seven-off schedule,” she said. “The time I have off, I get to just be a mom and not think about work. But when I’m at work, I love it.”
Dr. JonesFoster’s group has seen an increase in patient census recently and just went live with a new hospital-wide electronic health records system, which has opened up more shifts and moonlighting opportunities. Attending her first annual meeting, she was most interested in learning the pros and cons of leadership positions, because her health system “offers a lot of opportunity for advancement” and is “talking about adding a residency program.”
“Another thing I wanted to learn about was mentorship,” she said. “I wanted to meet women who have done this before, who have had children, who are working full-time trying to do a little bit of everything. I wanted to see how they did it and try and learn from their experiences.”
From all accounts, mission accomplished.
Richard Quinn is a freelance writer in New Jersey.
