User login
HM14 Lineup Packed with Learning, Networking Opportunities
LAS VEGAS—Welcome to HM14! Now, let's get to work.
While most visitors that arrive at Mandalay Bay Resort and Casino are up for fun and frolicking, the nearly 3,000 hospitalists expected to attend this year’s HM confab are here for education and inspiration. And the meeting's slate of sessions, speakers, and mental stimulation is expected to provide both.
"What you're getting are those thought leaders, as well as the academics, as well as real-life business education, all in one area," says Darren Swenson MD, a regional medical advisor for IPC The Hospitalist Co. in Las Vegas and founder of the city's SHM chapter. "And when you're able to choose your tracks to identify those programs that are of interest to you at that point in your career, it makes it very attractive."
Here are five tips to get the most out of your meeting:
- Think ahead and design a daily itinerary to take advantage of courses applicable back home, but don't be a slave to a schedule. Be open to changing course when opportunities for a meeting or event arise.
- Don't skip the keynotes. Whether it's a new panel discussion on Obamacare, an address by health strategist Ian Morrison, PhD, or the annual crowd pleaser from hospital medicine dean and blogger Bob Wachter, MD, MHM, the plenary sessions feature industry leaders’ views on important and compelling topics.
- Step outside your comfort zone. Reinforcing knowledge is certainly important, but course directors always encourage attendees to seize the opportunity to learn new skills.
- Network, network, network. There is no larger gathering of your colleagues than the annual meeting, so take advantage.
- Don't forget the Town Hall. For those planning to attend the meeting’s final session, the Town Hall is a chance to talk directly to SHM’s top staff and its board of directors.
Visit our website for more on making the most of HM14.
Bright Lights, Big City: Las Vegas Is More Than the Strip
LAS VEGAS – Now that you're here, focus on the valuable opportunities that HM14 offers. Well, until dusk. Then get out of the hotel and focus on the opportunities that are Las Vegas.
The fun isn't just the famed Strip, says Zubin Damania, MD, founder of Turntable Health in Las Vegas, who might be better known for his comedic alter ego, ZDoggMD. It's the lesser-known side of Las Vegas, known locally as "downtown."
"When I have friends in town, I tell them not to go to the Strip and to come hang out with me downtown or in the suburbs of Vegas—where the real fun is to be had," says Dr. Damania, even though he realizes he can't tell that to 3,000 "rabid hospitalists looking to relive 'The Hangover 3.'"
His recommendations include:
- Chinatown. The district is along Spring Mountain Road, about four miles north of Mandalay Bay, and includes several enclosed shopping malls. Restaurants to try include Raku, which specializes in Japanese food, and Kabuto, which has "the best sushi" ZDoggMD's ever had.
- Red Rock Canyon National Conservation Area. Breathtaking views and hiking opportunities abound in natural Nevada.
- The Zappos factory. A tour of the firm’s downtown headquarters showcases the mindset of the millennial generation and potential lessons on workplace attitude that can be applied to HM.
- Turntable Health. Dr. Damania’s clinic is open to any hospitalists curious to visit. If you want to set up a tour, or want more personalized advice on what to do while in town, e-mail him at [email protected].
Visit our website for more of ZDoggMD's recommendations.
Health Canada approves therapy for hemophilia B

Health Canada has approved a recombinant factor IX Fc fusion protein (rFIXFc, Alprolix), for adults and children aged 12 and older with hemophilia B.
The product is intended to prevent or reduce the frequency of bleeding episodes via prophylactic infusions, starting at once weekly or once every 10 to 14 days.
This is the first regulatory approval of rFIXFc, which is under review by regulatory authorities in several other countries.
Health Canada’s approval of the product is based on results from the phase 3 B-LONG study, which was funded by Biogen Idec and Sobi, the companies developing rFIXFc.
Results of the B-LONG study
In this multicenter, open-label trial, researchers evaluated the efficacy, safety, and pharmacokinetics of rFIXFc in 123 males aged 12 years and older with hemophilia B.
Patients were assigned to 1 of 4 treatment arms: weekly prophylaxis, individualized-interval prophylaxis, on-demand treatment to control bleeding, and perioperative management.
The overall median annualized bleeding rates were 2.95 for the weekly prophylaxis arm, 1.38 for the individualized-interval prophylaxis arm, and 17.69 in the on-demand treatment arm.
The overall median dosing interval with individualized-interval prophylaxis was 12.5 days. During the last 6 months of the study, the median dosing interval was 13.8 days.
Of the patients who received rFIXFc for perioperative management, 85.7% required a single injection of the product to maintain hemostasis during their operation. The median dose was 90.9 IU/kg per injection.
Most patients required 1 to 2 injections of the product the day before and the day of surgery. And most required 2 to 3 injections from days 1 to 3 after surgery.
The most common adverse events associated with rFIXFc (incidence of ≥ 5% in a pooled analysis of treatment arms 1, 2, and 3) were nasopharyngitis, influenza, arthralgia, upper respiratory tract infection, hypertension, and headache.
Results of this study were released by Biogen Idec and Sobi in September 2012, presented at ISTH 2013, and published in NEJM in December 2013. ![]()
Abnormality increases risk of ALL subtype
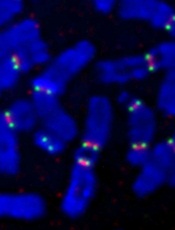
Credit: Beth A. Sullivan
Individuals with a rare chromosomal abnormality have a 2700-fold increased risk of developing a type of acute lymphoblastic leukemia (ALL), according to a study published in Nature.
Previous research showed that a small subset of ALL patients have recurrent amplification of megabase regions of chromosome 21.
In the current study, investigators decided to reconstruct the sequence of genetic events that lead to this type of leukemia, iAMP21 ALL.
They found that some patients with iAMP21 ALL had an abnormality in which chromosome 15 and chromosome 21 are fused together, known as a Robertsonian translocation.
And the joining of these 2 chromosomes increased a person’s risk of developing iAMP21 ALL 2700-fold, when compared to the general population.
“Although rare, people who carry this specific joining together of chromosomes 15 and 21 are specifically and massively predisposed to iAMP21 ALL,” said study author Christine Harrison, PhD, of Newcastle University in the UK.
“We have been able to map the roads the cells follow in their transition from a normal genome to a leukemia genome.”
To do this, the investigators sequenced 9 samples from patients with iAMP21 ALL, 4 with the rare Robertsonian translocation and 5 without it.
For the 4 patients with the translocation, their leukemia was initiated by chromothripsis. This event shatters a chromosome—in this case, the joined chromosomes 15 and 21—and then the DNA repair machinery pastes the chromosome back together in a highly flawed and inaccurate order.
In the 5 other patients, the cancer was initiated by 2 copies of chromosome 21 being fused together, head-to-head, usually followed by chromothripsis.
The investigators found a consistent sequence of genetic events across the patients studied. Although the events seem random and chaotic at first, the end result is a new chromosome 21 in which the numbers and arrangement of genes are optimized to drive leukemia.
“What is striking about our findings is that this type of leukemia could develop incredibly quickly—potentially in just a few rounds of cell division,” said study author Peter Campbell, PhD, of the Wellcome Trust Sanger Institute in Hinxton, UK.
“We now want to understand why the abnormally fused chromosomes are so susceptible to this catastrophic shattering.” ![]()
Using Video to Validate Handoff Quality
Over the last decade, there has been an unprecedented focus on physician handoffs in US hospitals. One major reason for this are the reductions in residency duty hours that have been mandated by the American Council for Graduate Medical Education (ACGME), first in 2003 and subsequently revised in 2011.[1, 2] As residents work fewer hours, experts believe that potential safety gains from reduced fatigue are countered by an increase in the number of handoffs, which represent a risk due to the potential miscommunication. Prior studies show that critical patient information is often lost or altered during this transfer of clinical information and professional responsibility, which can result in patient harm.[3, 4] As a result of these concerns, the ACGME now requires residency programs to ensure and monitor effective, structured hand‐over processes to facilitate both continuity of care and patient safety. Programs must ensure that residents are competent in communicating with team members in the hand‐over process.[2] Moreover, handoffs have also been a major improvement focus for organizations with broader scope than teaching hospitals, including the World Health Organization, Joint Commission, and the Society for Hospital Medicine (SHM).[5, 6, 7]
Despite this focus on handoffs, monitoring quality of handoffs has proven challenging due to lack of a reliable and validated tool to measure handoff quality. More recently, the Accreditation Council of Graduate Medical Education's introduction of the Next Accreditation System, with its focus on direct observation of clinical skills to achieve milestones, makes it crucial for residency educators to have valid tools to measure competence in handoffs. As a result, it is critical that instruments to measure handoff performance are not only created but also validated.[8]
To help fill this gap, we previously reported on the development of a 9‐item Handoff Clinical Examination Exercise (CEX) assessment tool. The Handoff CEX, designed for use by those participating in the handoff or by a third‐party observer, can be used to rate the quality of patient handoffs in domains such as professionalism and communication skills between the receiver and sender of patient information.[9, 10] Despite prior demonstration of feasibility of use, the initial tool was perceived as lengthy and redundant. In addition, although the tool has been shown to discriminate between performance of novice and expert nurses, the construct validity of this tool has not been established.[11] Establishing construct validity is important to ensuring that the tool can measure the construct in question, namely whether it detects those who are actually competent to perform handoffs safely and effectively. We present here the results of the development of a shorter Handoff Mini‐CEX, along with the formal establishment of its construct validity, namely its ability to distinguish between levels of performance in 3 domains of handoff quality.
METHODS
Adaption of the Handoff CEX and Development of the Abbreviated Tool
The 9‐item Handoff CEX is a paper‐based instrument that was created by the investigators (L.I.H., J.M.F., V.M.A.) to evaluate either the sender or the receiver of handoff communications and has been used in prior studies (see Supporting Information, Appendix 1, in the online version of this article).[9, 10] The evaluation may be conducted by either an observer or by a handoff participant. The instrument includes 6 domains: (1) setting, (2) organization and efficiency, (3) communication skills, (4) content, (5) clinical judgment, and (6) humanistic skills/professionalism. Each domain is graded on a 9‐point rating scale, modeled on the widely used Mini‐CEX (Clinical Evaluation Exercise) for real‐time observation of clinical history and exam skills in internal medicine clerkships and residencies (13=unsatisfactory, 46=marginal/satisfactory, 79=superior).[12] This familiar 9‐point scale is utilized in graduate medical education evaluation of the ACGME core competencies.
To standardize the evaluation, the instrument uses performance‐based anchors for evaluating both the sender and the receiver of the handoff information. The anchors are derived from functional evaluation of the roles of senders and receivers in our preliminary work at both the University of Chicago and Yale University, best practices in other high‐reliability industries, guidelines from the Joint Commission and the SHM, and prior studies of effective communication in clinical systems.[5, 6, 13]
After piloting the Handoff CEX with the University of Chicago's internal medicine residency program (n=280 handoff evaluations), a strong correlation was noted between the measures of content (medical knowledge), patient care, clinical judgment, organization/efficiency, and communication skills. Moreover, the Handoff CEX's Cronbach , or measurement of internal reliability and consistency, was very high (=0.95). Given the potential of redundant items, and to increase ease of use of the instrument, factor analysis was used to reduce the instrument to yield a shorter 3‐item tool, the Handoff Mini‐CEX, that assessed 3 of the initial items: setting, communication skills, and professionalism. Overall, performance on these 3 items were responsible for 82% of the variance of overall sign‐out quality (see Supporting Information, Appendix 2, in the online version of this article).
Establishing Construct Validity of the Handoff Mini‐CEX
To establish construct validity of the Handoff Mini‐CEX, we adapted a protocol used by Holmboe and colleagues to report the construct validity of the Handoff Mini‐CEX, which is based on the development and use of video scenarios depicting varying levels of clinical performance.[14] A clinical scenario script, based on prior observational work, was developed, which represented an internal medicine resident (the sender) signing out 3 different patients to colleagues (intern [postgraduate year 1] and resident). This scenario was developed to explicitly include observable components of professionalism, communication, and setting. Three levels of performancesuperior, satisfactory, and unsatisfactorywere defined and described for the 3 domains. These levels were defined, and separate scripts were written using this information, demonstrating varying levels of performance in each of the domains of interest, using the descriptive anchors of the Handoff Mini‐CEX.
After constructing the superior, or gold standard, script that showcases superior communication, professionalism, and setting, individual domains of performance were changed (eg, to satisfactory or unsatisfactory), while holding the other 2 constant at the superior level of performance. For example, superior communication requires that the sender provides anticipatory guidance and includes clinical rationale, whereas unsatisfactory communication includes vague language about overnight events and a disorganized presentation of patients. Superior professionalism requires no inappropriate comments by the sender about patients, family, and staff as well as a presentation focused on the most urgent patients. Unsatisfactory professionalism is shown by a hurried and inattentive sign‐out, with inappropriate comments about patients, family, and staff. Finally, a superior setting is one in which the receiver is listening attentively and discourages interruptions, whereas an unsatisfactory setting finds the sender or receiver answering pages during the handoff surrounded by background noise. We omitted the satisfactory level for setting due to the difficulties in creating subtleties in the environment.
Permutations of each of these domains resulted in 6 scripts depicting different levels of sender performance (see Supporting Information, Appendix 3, in the online version of this article). Only the performance level of the sender was changed, and the receivers of the handoff performance remained consistent, using best practices for receivers, such as attentive listening, asking questions, reading back, and taking notes during the handoff. The scripts were developed by 2 investigators (V.M.A., S.B.), then reviewed and edited independently by other investigators (J.M.F., P.S.) to achieve consensus. Actors were recruited to perform the video scenarios and were trained by the physician investigators (J.M.F., V.M.A.). The part of the sender was played by a study investigator (P.S.) with prior acting experience, and who had accrued over 40 hours of experience observing handoffs to depict varying levels of handoff performance. The digital video recordings ranged in length from 2.00 minutes to 4.08 minutes. All digital videos were recorded using a Sony XDCAM PMW‐EX3 HD camcorder (Sony Corp., Tokyo, Japan.
Participants
Faculty from the University of Chicago Medical Center and Yale University were included. At the University of Chicago, faculty were recruited to participate via email by the study investigators to the Research in Medical Education (RIME) listhost, which includes program directors, clerkship directors, and medical educators. Two sessions were offered and administered. Continuing medical education (CME) credit was provided for participation, as this workshop was given in conjunction with the RIME CME conference. Evaluations were deidentified using a unique identifier for each rater. At Yale University, the workshop on handoffs was offered as part of 2 seminars for program directors and chief residents from all specialties. During these seminars, program directors and chief residents used anonymous evaluation rating forms that did not capture rater identifiers. No other incentive was provided for participation. Although neither faculty at the University of Chicago nor Yale University received any formal training on handoff evaluation, they did receive a short introduction to the importance of handoffs and the goals of the workshop. The protocol was deemed exempt by the institutional review board at the University of Chicago.
Workshop Protocol
After a brief introduction, faculty viewed the tapes in random order on a projected screen. Participants were instructed to use the Handoff Mini‐CEX to rate whichever element(s) of handoff quality they believed they could suitably evaluate while watching the tapes. The videos were rated on the Handoff Mini‐CEX form, and participants anonymously completed the forms independently without any contact with other participants. The lead investigators proctored all sessions. At University of Chicago, participants viewed and rated all 6 videos over the course of an hour. At Yale University, due to time constraints in the program director and chief resident seminars, participants reviewed 1 of the videos in seminar 1 (unsatisfactory professionalism) and 2 in the other seminar (unsatisfactory communication, unsatisfactory professionalism) (Table 1).
| Unsatisfactory | Satisfactory | Superior | |
|---|---|---|---|
| |||
| Communication | Script 3 (n=36)a | Script 2 (n=13) | Script 1 (n=13) |
| Uses vague language about overnight events, missing critical patient information, disorganized. | Insufficient level of clinical detail, directions are not as thorough, handoff is generally on task and sufficient. | Anticipatory guidance provided, rationale explained; important information is included, highlights sick patients. | |
| Look in the record; I'm sure it's in there. And oh yeah, I need you to check enzymes and finish ruling her out. | So the only thing to do is to check labs; you know, check CBC and cardiac enzymes. | So for today, I need you to check post‐transfusion hemoglobin to make sure it's back to the baseline of 10. If it's under 10, then transfuse her 2 units, but hopefully it will be bumped up. Also continue to check cardiac enzymes; the next set is coming at 2 pm, and we need to continue the rule out. If her enzymes are positive or she has other ECG changes, definitely call the cardio fellow, since they'll want to take her to the CCU. | |
| Professionalism | Script 5 (n=39)a | Script 4 (n=22)a | Script 1 |
| Hurried, inattentive, rushing to leave, inappropriate comments (re: patients, family, staff). | Some tangential comments (re: patients, family, staff). | Appropriate comments (re: patients, family, staff), focused on task. | |
| [D]efinitely call the cards fellow, since they'll want to take her to the CCU. And let me tell you, if you don't call her, she'll rip you a new one. | Let's breeze through them quickly so I can get out of here, I've had a rough day. I'll start with the sickest first, and oh my God she's a train wreck! | ||
| Setting | Script 6 (n=13) | Script 1 | |
| Answering pages during handoff, interruptions (people entering room, phone ringing). | Attentive listening, no interruptions, pager silenced. | ||
Data Collection and Statistical Analysis
Using combined data from University of Chicago and Yale University, descriptive statistics were reported as raw scores on the Handoff Mini‐CEX. To assess internal consistency of the tool, Cronbach was used. To assess inter‐rater reliability of these attending physician ratings on the tool, we performed a Kendall coefficient of concordance analysis after collapsing the ratings into 3 categories (unsatisfactory, satisfactory, superior). In addition, we also calculated intraclass correlation coefficients for each item using the raw data and generalizability analysis to calculate the number of raters that would be needed to achieve a desired reliability of 0.95. To ascertain if faculty were able to detect varying levels of performance depicted in the video, an ordinal test of trend on the communication, professionalism, and setting scores was performed.
To assess for rater bias, we were able to use the identifiers on the University of Chicago data to perform a 2‐way analysis of variance (ANOVA) to assess if faculty scores were associated with performance level after controlling for faculty. The results of the faculty rater coefficients and P values in the 2‐way ANOVA were also examined for any evidence of rater bias. All calculations were performed in Stata 11.0 (StataCorp, College Station, TX) with statistical significance defined as P<0.05.
RESULTS
Forty‐seven faculty members (14=site 1; 33=site 2) participated in the validation workshops (2 at the University of Chicago, and 2 at Yale University), which were held in August 2011 and September 2011, providing a total of 172 observations of a possible 191 (90%).
The overall handoff quality ratings for the superior, gold standard video (superior communication, professionalism, and communication) ranged from 7 to 9 with a mean of 8.5 (standard deviation [SD] 0.7). The overall ratings for the video depicting satisfactory communication (satisfactory communication, superior professionalism and setting) ranged from 5 to 9 with a mean of 7.3 (SD 1.1). The overall ratings for the unsatisfactory communication (unsatisfactory communication, superior professionalism and setting) video ranged from 1 to 7 with a mean of 2.6 (SD 1.2). The overall ratings for the satisfactory professionalism video (satisfactory professionalism, superior communication and setting) ranged from 4 to 8 with a mean of 5.7 (SD 1.3). The overall ratings for the unsatisfactory professionalism (unsatisfactory professionalism, superior communication and setting) video ranged from 2 to 5 with a mean of 2.4 (SD 1.03). Finally, the overall ratings for the unsatisfactory setting (unsatisfactory setting, superior communication and professionalism) video ranged from 1 to 8 with a mean of 3.1 (SD 1.7).
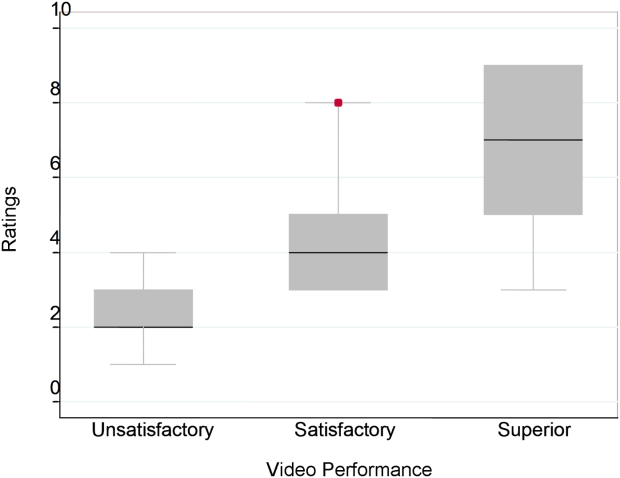
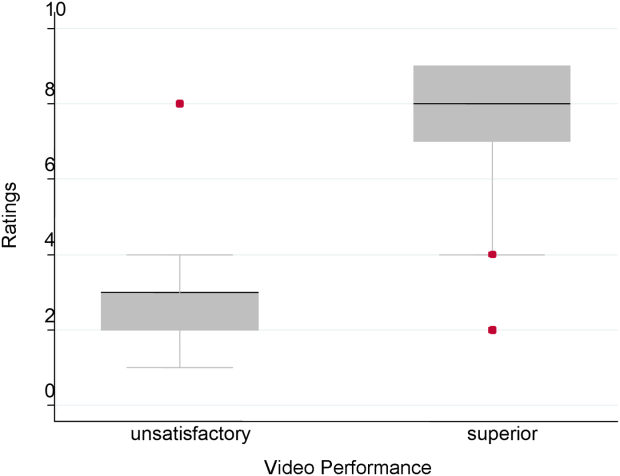
Figure 1 demonstrates that for the domain of communication, the raters were able to discern the unsatisfactory performance but had difficulty reliably distinguishing between superior and satisfactory performance. Figure 2 illustrates that for the domain of professionalism, raters were able to detect the videos' changing levels of performance at the extremes of behavior, with unsatisfactory and superior displays more readily identified. Figure 3 shows that for the domain of setting, the raters were able to discern the unsatisfactory versus superior level of the changing setting. Of note, we also found a moderate significant correlation between ratings of professionalism and communication (r=0.47, P<0.001).

The Cronbach , or measurement of internal reliability and consistency, for the Handoff Mini‐CEX (3 items plus overall) was 0.77, indicating high internal reliability and consistency. Using data from University of Chicago, where raters were labeled with a unique identifier, the Kendall coefficient of concordance was calculated to be 0.79, demonstrating high inter‐rater reliability of the faculty raters. High inter‐rater reliability was also seen using intraclass coefficients for each domain: communication (0.84), professionalism (0.68), setting (0.83), and overall (0.89). Using generalizability analysis, the average reliability was determined to be above 0.9 for all domains (0.99 for overall).
Last, the 2‐way ANOVA (n=75 observations from 13 raters) revealed no evidence of rater bias when examining the coefficient for attending rater (P=0.55 for professionalism, P=0.45 for communication, P=0.92 for setting). The range of scores for each video, however, was broad (Table 2).
| Unsatisfactory | Satisfactory | Superior | ||||||||
|---|---|---|---|---|---|---|---|---|---|---|
| Mean | Median | Range | Mean | Median | Range | Mean | Median | Range | Pb | |
| ||||||||||
| Professionalism | 2.3 | 2 | 14 | 4.4 | 4 | 38 | 7.0 | 7 | 39 | 0.026 |
| Communication | 2.8 | 3 | 16 | 7 | 8 | 59 | 6.6 | 7 | 19 | 0.005 |
| Setting | 3.1 | 3 | 18 | 7.5 | 8 | 29 | 0.005 | |||
DISCUSSION
This study demonstrates that valid conclusions on handoff performance can be drawn using the Handoff CEX as the instrument to rate handoff quality. Utilizing standardized videos depicting varying levels of performance communication, professionalism, and setting, the Handoff Mini‐CEX has demonstrated potential to discern between increasing levels of performance, providing evidence for the construct validity of the instrument.
We observed that faculty could reliably detect unsatisfactory professionalism with ease, and that there was a distinct correlation between faculty ratings and the internally set levels of performance displayed in the videos. This trend demonstrated that faculty were able to discern different levels of professionalism using the Handoff Mini‐CEX. It became more difficult, however, for faculty to detect superior professionalism when the domain of communication was permuted. If the sender of the handoff was professional but the information delivered was disorganized, inaccurate, and missing crucial pieces of information, the faculty perceived this ineffective communication as unprofessional. Prior literature on professionalism has found that communication is a necessary component of professional behavior, and consequently, being a competent communicator is necessary to fulfill ones duty as a professional physician.[15, 16]
This is of note because we did find a moderate significant correlation between ratings of professionalism and communication. It is possible that this distinction would be made clearer with formal rater training in the future prior to any evaluations. However, it is also possible that professionalism and communication, due to a synergistic role between the 2 domains, cannot be separated. If this is the case, it would be important to educate clinicians to present patients in a concise, clear, and accurate way with a professional demeanor. Acknowledging professional responsibility as an integral piece of patient care is also critical in effectively communicating patient information.[5]
We also noted that faculty could detect unsatisfactory communication consistently; however, they were unable to differentiate between satisfactory and superior communication reliably or consistently. Because the unsatisfactory professionalism, unsatisfactory setting, and satisfactory professionalism videos all demonstrated superior communication, we believe that the faculty penalized communication when distractions, in the form of interruptions and rude behavior by the resident giving the handoff, interrupted the flow of the handoff. Thus, the wide ranges in scores observed by some raters may be attributed to this interaction between the Handoff Mini‐CEX domains. In the future, definitions of the anchors, including at the middle spectrum of performance, and rater training may improve the ability of raters to distinguish performance between each domain.
The overall value of the Handoff Mini‐CEX is in its ease of use, in part due to its brevity, as well as evidence for its validity in distinguishing between varying levels of performance. Given the emphasis on monitoring handoff quality and performance, the Handoff Mini‐CEX provides a standard foundation from which baseline handoff performance can be easily measured and improved. Moreover, it can also be used to give individual feedback to a specific practicing clinician on their practices and an opportunity to improve. This is particularly important given current recommendations by the Joint Commission, that handoffs are standardized, and by the ACGME, that residents are competent in handoff skills. Moreover, given the creation of the SHM's handoff recommendations and handoffs as a core competency for hospitalists, the tool provides the ability for hospitalist programs to actually assess their handoff practices as baseline measurements for any quality improvement activities that may take place.
Faculty were able to discern the superior and unsatisfactory levels of setting with ease. After watching and rating the videos, participants said that the chaotic scene of the unsatisfactory setting video had significant authenticity, and that they were constantly interrupted during their own handoffs by pages, phone calls, and people entering the handoff space. System‐level fixes, such as protected time and dedicated space for handoffs, and discouraging pages to be sent during the designated handoff time, could mitigate the reality of unsatisfactory settings.[17, 18]
Our study has several limitations. First, although this study was held at 2 sites, it included a small number of faculty, which can impact the generalizability of our findings. Implementation varied at Yale University and the University of Chicago, preventing use of all data for all analyses. Furthermore, institutional culture may also impact faculty raters' perceptions, so future work aims at repeating our protocol at partner institutions, increasing both the number and diversity of participants. We were also unable to compare the new shorter Handoff Mini‐CEX to the larger 9‐item Handoff CEX in this study.
Despite these limitations, we believe that the Handoff Mini‐CEX, has future potential as an instrument with which to make valid and reliable conclusions about handoff quality, and could be used to both evaluate handoff quality and as an educational tool for trainees and faculty on effective handoff communication.
Disclosures
This work was supported by the National Institute on Aging Short‐Term Aging‐Related Research Program (5T35AG029795), Agency for Healthcare Research and Quality (1 R03HS018278‐01), and the University of Chicago Department of Medicine Excellence in Medical Education Award. Dr. Horwitz is supported by the National Institute on Aging (K08 AG038336) and by the American Federation for Aging Research through the Paul B. Beeson Career Development Award Program. Dr. Arora is funded by National Institute on Aging Career Development Award K23AG033763. Prior presentations of these data include the 2011 Association of American Medical Colleges meeting in Denver, Colorado, the 2012 Association of Program Directors of Internal Medicine meeting in Atlanta, Georgia, and the 2012 Society of General Internal Medicine Meeting in Orlando, Florida.
- , , . The new recommendations on duty hours from the ACGME task force. New Engl J Med. 2010;363(2):e3.
- ACGME common program requirements. Effective July 1, 2011. Available at: http://www.acgme.org/acgmeweb/Portals/0/PDFs/Common_Program_Requirements_07012011[2].pdf. Accessed February 8, 2014.
- , , , , . Consequences of inadequate sign‐out for patient care. Arch Intern Med. 2008;168(16):1755–1760.
- , , , , . Communication failures in patient sign‐out and suggestions for improvement: a critical incident analysis. Qual Saf Healthcare. 2005;14(6):401–407.
- , , , , , . Hospitalist handoffs: a systematic review and task force recommendations. J Hosp Med. 2009;4(7):433–440.
- , . A model for building a standardized hand‐off protocol. Jt Comm J Qual Patient Saf. 2006;32(11):646–655.
- World Health Organization Collaborating Centre for Patient Safety. Solutions on communication during patient hand‐overs. 2007; Volume 1, Solution 1. Available at: http://www.who.int/patientsafety/solutions/patientsafety/PS‐Solution3.pdf. Accessed February 8, 2014.
- , . Patient handoffs: standardized and reliable measurement tools remain elusive. Jt Comm J Qual Patient Saf. 2010;36(2):52–61.
- , , , et al. Development of a handoff evaluation tool for shift‐to‐shift physician handoffs: the handoff CEX. J Hosp Med. 2013;8(4):191–200.
- , , , et al. Hand‐off education and evaluation: piloting the observed simulated hand‐off experience (OSHE). J Gen Intern Med. 2010;25(2):129–134.
- , , , , , . Validation of a handoff tool: the Handoff CEX. J Clin Nurs. 2013;22(9‐10):1477–1486.
- , , , . The mini‐CEX: a method for assessing clinical skills. Ann Intern Med. 2003;138(6):476–481.
- , , , , . Handoff strategies in settings with high consequences for failure: lessons for health care operations. Int J Qual Health Care. 2004;16(2):125–132.
- , , , , . Construct validity of the miniclinical evaluation exercise (miniCEX). Acad Med. 2003;78(8):826–830.
- , , , et al. Third‐year medical students' participation in and perceptions of unprofessional behaviors. Acad Med. 2007;82(10 suppl):S35–S39.
- . Professionalism—the next wave. N Engl J Med. 2006;355(20):2151–2152.
- , , , , . Interns overestimate the effectiveness of their hand‐off communication. Pediatrics. 2010;125(3):491–496.
- , , , , . Characterising physician listening behaviour during hospitalist handoffs using the HEAR checklist. BMJ Qual Saf. 2013;22(3):203–209.
Over the last decade, there has been an unprecedented focus on physician handoffs in US hospitals. One major reason for this are the reductions in residency duty hours that have been mandated by the American Council for Graduate Medical Education (ACGME), first in 2003 and subsequently revised in 2011.[1, 2] As residents work fewer hours, experts believe that potential safety gains from reduced fatigue are countered by an increase in the number of handoffs, which represent a risk due to the potential miscommunication. Prior studies show that critical patient information is often lost or altered during this transfer of clinical information and professional responsibility, which can result in patient harm.[3, 4] As a result of these concerns, the ACGME now requires residency programs to ensure and monitor effective, structured hand‐over processes to facilitate both continuity of care and patient safety. Programs must ensure that residents are competent in communicating with team members in the hand‐over process.[2] Moreover, handoffs have also been a major improvement focus for organizations with broader scope than teaching hospitals, including the World Health Organization, Joint Commission, and the Society for Hospital Medicine (SHM).[5, 6, 7]
Despite this focus on handoffs, monitoring quality of handoffs has proven challenging due to lack of a reliable and validated tool to measure handoff quality. More recently, the Accreditation Council of Graduate Medical Education's introduction of the Next Accreditation System, with its focus on direct observation of clinical skills to achieve milestones, makes it crucial for residency educators to have valid tools to measure competence in handoffs. As a result, it is critical that instruments to measure handoff performance are not only created but also validated.[8]
To help fill this gap, we previously reported on the development of a 9‐item Handoff Clinical Examination Exercise (CEX) assessment tool. The Handoff CEX, designed for use by those participating in the handoff or by a third‐party observer, can be used to rate the quality of patient handoffs in domains such as professionalism and communication skills between the receiver and sender of patient information.[9, 10] Despite prior demonstration of feasibility of use, the initial tool was perceived as lengthy and redundant. In addition, although the tool has been shown to discriminate between performance of novice and expert nurses, the construct validity of this tool has not been established.[11] Establishing construct validity is important to ensuring that the tool can measure the construct in question, namely whether it detects those who are actually competent to perform handoffs safely and effectively. We present here the results of the development of a shorter Handoff Mini‐CEX, along with the formal establishment of its construct validity, namely its ability to distinguish between levels of performance in 3 domains of handoff quality.
METHODS
Adaption of the Handoff CEX and Development of the Abbreviated Tool
The 9‐item Handoff CEX is a paper‐based instrument that was created by the investigators (L.I.H., J.M.F., V.M.A.) to evaluate either the sender or the receiver of handoff communications and has been used in prior studies (see Supporting Information, Appendix 1, in the online version of this article).[9, 10] The evaluation may be conducted by either an observer or by a handoff participant. The instrument includes 6 domains: (1) setting, (2) organization and efficiency, (3) communication skills, (4) content, (5) clinical judgment, and (6) humanistic skills/professionalism. Each domain is graded on a 9‐point rating scale, modeled on the widely used Mini‐CEX (Clinical Evaluation Exercise) for real‐time observation of clinical history and exam skills in internal medicine clerkships and residencies (13=unsatisfactory, 46=marginal/satisfactory, 79=superior).[12] This familiar 9‐point scale is utilized in graduate medical education evaluation of the ACGME core competencies.
To standardize the evaluation, the instrument uses performance‐based anchors for evaluating both the sender and the receiver of the handoff information. The anchors are derived from functional evaluation of the roles of senders and receivers in our preliminary work at both the University of Chicago and Yale University, best practices in other high‐reliability industries, guidelines from the Joint Commission and the SHM, and prior studies of effective communication in clinical systems.[5, 6, 13]
After piloting the Handoff CEX with the University of Chicago's internal medicine residency program (n=280 handoff evaluations), a strong correlation was noted between the measures of content (medical knowledge), patient care, clinical judgment, organization/efficiency, and communication skills. Moreover, the Handoff CEX's Cronbach , or measurement of internal reliability and consistency, was very high (=0.95). Given the potential of redundant items, and to increase ease of use of the instrument, factor analysis was used to reduce the instrument to yield a shorter 3‐item tool, the Handoff Mini‐CEX, that assessed 3 of the initial items: setting, communication skills, and professionalism. Overall, performance on these 3 items were responsible for 82% of the variance of overall sign‐out quality (see Supporting Information, Appendix 2, in the online version of this article).
Establishing Construct Validity of the Handoff Mini‐CEX
To establish construct validity of the Handoff Mini‐CEX, we adapted a protocol used by Holmboe and colleagues to report the construct validity of the Handoff Mini‐CEX, which is based on the development and use of video scenarios depicting varying levels of clinical performance.[14] A clinical scenario script, based on prior observational work, was developed, which represented an internal medicine resident (the sender) signing out 3 different patients to colleagues (intern [postgraduate year 1] and resident). This scenario was developed to explicitly include observable components of professionalism, communication, and setting. Three levels of performancesuperior, satisfactory, and unsatisfactorywere defined and described for the 3 domains. These levels were defined, and separate scripts were written using this information, demonstrating varying levels of performance in each of the domains of interest, using the descriptive anchors of the Handoff Mini‐CEX.
After constructing the superior, or gold standard, script that showcases superior communication, professionalism, and setting, individual domains of performance were changed (eg, to satisfactory or unsatisfactory), while holding the other 2 constant at the superior level of performance. For example, superior communication requires that the sender provides anticipatory guidance and includes clinical rationale, whereas unsatisfactory communication includes vague language about overnight events and a disorganized presentation of patients. Superior professionalism requires no inappropriate comments by the sender about patients, family, and staff as well as a presentation focused on the most urgent patients. Unsatisfactory professionalism is shown by a hurried and inattentive sign‐out, with inappropriate comments about patients, family, and staff. Finally, a superior setting is one in which the receiver is listening attentively and discourages interruptions, whereas an unsatisfactory setting finds the sender or receiver answering pages during the handoff surrounded by background noise. We omitted the satisfactory level for setting due to the difficulties in creating subtleties in the environment.
Permutations of each of these domains resulted in 6 scripts depicting different levels of sender performance (see Supporting Information, Appendix 3, in the online version of this article). Only the performance level of the sender was changed, and the receivers of the handoff performance remained consistent, using best practices for receivers, such as attentive listening, asking questions, reading back, and taking notes during the handoff. The scripts were developed by 2 investigators (V.M.A., S.B.), then reviewed and edited independently by other investigators (J.M.F., P.S.) to achieve consensus. Actors were recruited to perform the video scenarios and were trained by the physician investigators (J.M.F., V.M.A.). The part of the sender was played by a study investigator (P.S.) with prior acting experience, and who had accrued over 40 hours of experience observing handoffs to depict varying levels of handoff performance. The digital video recordings ranged in length from 2.00 minutes to 4.08 minutes. All digital videos were recorded using a Sony XDCAM PMW‐EX3 HD camcorder (Sony Corp., Tokyo, Japan.
Participants
Faculty from the University of Chicago Medical Center and Yale University were included. At the University of Chicago, faculty were recruited to participate via email by the study investigators to the Research in Medical Education (RIME) listhost, which includes program directors, clerkship directors, and medical educators. Two sessions were offered and administered. Continuing medical education (CME) credit was provided for participation, as this workshop was given in conjunction with the RIME CME conference. Evaluations were deidentified using a unique identifier for each rater. At Yale University, the workshop on handoffs was offered as part of 2 seminars for program directors and chief residents from all specialties. During these seminars, program directors and chief residents used anonymous evaluation rating forms that did not capture rater identifiers. No other incentive was provided for participation. Although neither faculty at the University of Chicago nor Yale University received any formal training on handoff evaluation, they did receive a short introduction to the importance of handoffs and the goals of the workshop. The protocol was deemed exempt by the institutional review board at the University of Chicago.
Workshop Protocol
After a brief introduction, faculty viewed the tapes in random order on a projected screen. Participants were instructed to use the Handoff Mini‐CEX to rate whichever element(s) of handoff quality they believed they could suitably evaluate while watching the tapes. The videos were rated on the Handoff Mini‐CEX form, and participants anonymously completed the forms independently without any contact with other participants. The lead investigators proctored all sessions. At University of Chicago, participants viewed and rated all 6 videos over the course of an hour. At Yale University, due to time constraints in the program director and chief resident seminars, participants reviewed 1 of the videos in seminar 1 (unsatisfactory professionalism) and 2 in the other seminar (unsatisfactory communication, unsatisfactory professionalism) (Table 1).
| Unsatisfactory | Satisfactory | Superior | |
|---|---|---|---|
| |||
| Communication | Script 3 (n=36)a | Script 2 (n=13) | Script 1 (n=13) |
| Uses vague language about overnight events, missing critical patient information, disorganized. | Insufficient level of clinical detail, directions are not as thorough, handoff is generally on task and sufficient. | Anticipatory guidance provided, rationale explained; important information is included, highlights sick patients. | |
| Look in the record; I'm sure it's in there. And oh yeah, I need you to check enzymes and finish ruling her out. | So the only thing to do is to check labs; you know, check CBC and cardiac enzymes. | So for today, I need you to check post‐transfusion hemoglobin to make sure it's back to the baseline of 10. If it's under 10, then transfuse her 2 units, but hopefully it will be bumped up. Also continue to check cardiac enzymes; the next set is coming at 2 pm, and we need to continue the rule out. If her enzymes are positive or she has other ECG changes, definitely call the cardio fellow, since they'll want to take her to the CCU. | |
| Professionalism | Script 5 (n=39)a | Script 4 (n=22)a | Script 1 |
| Hurried, inattentive, rushing to leave, inappropriate comments (re: patients, family, staff). | Some tangential comments (re: patients, family, staff). | Appropriate comments (re: patients, family, staff), focused on task. | |
| [D]efinitely call the cards fellow, since they'll want to take her to the CCU. And let me tell you, if you don't call her, she'll rip you a new one. | Let's breeze through them quickly so I can get out of here, I've had a rough day. I'll start with the sickest first, and oh my God she's a train wreck! | ||
| Setting | Script 6 (n=13) | Script 1 | |
| Answering pages during handoff, interruptions (people entering room, phone ringing). | Attentive listening, no interruptions, pager silenced. | ||
Data Collection and Statistical Analysis
Using combined data from University of Chicago and Yale University, descriptive statistics were reported as raw scores on the Handoff Mini‐CEX. To assess internal consistency of the tool, Cronbach was used. To assess inter‐rater reliability of these attending physician ratings on the tool, we performed a Kendall coefficient of concordance analysis after collapsing the ratings into 3 categories (unsatisfactory, satisfactory, superior). In addition, we also calculated intraclass correlation coefficients for each item using the raw data and generalizability analysis to calculate the number of raters that would be needed to achieve a desired reliability of 0.95. To ascertain if faculty were able to detect varying levels of performance depicted in the video, an ordinal test of trend on the communication, professionalism, and setting scores was performed.
To assess for rater bias, we were able to use the identifiers on the University of Chicago data to perform a 2‐way analysis of variance (ANOVA) to assess if faculty scores were associated with performance level after controlling for faculty. The results of the faculty rater coefficients and P values in the 2‐way ANOVA were also examined for any evidence of rater bias. All calculations were performed in Stata 11.0 (StataCorp, College Station, TX) with statistical significance defined as P<0.05.
RESULTS
Forty‐seven faculty members (14=site 1; 33=site 2) participated in the validation workshops (2 at the University of Chicago, and 2 at Yale University), which were held in August 2011 and September 2011, providing a total of 172 observations of a possible 191 (90%).
The overall handoff quality ratings for the superior, gold standard video (superior communication, professionalism, and communication) ranged from 7 to 9 with a mean of 8.5 (standard deviation [SD] 0.7). The overall ratings for the video depicting satisfactory communication (satisfactory communication, superior professionalism and setting) ranged from 5 to 9 with a mean of 7.3 (SD 1.1). The overall ratings for the unsatisfactory communication (unsatisfactory communication, superior professionalism and setting) video ranged from 1 to 7 with a mean of 2.6 (SD 1.2). The overall ratings for the satisfactory professionalism video (satisfactory professionalism, superior communication and setting) ranged from 4 to 8 with a mean of 5.7 (SD 1.3). The overall ratings for the unsatisfactory professionalism (unsatisfactory professionalism, superior communication and setting) video ranged from 2 to 5 with a mean of 2.4 (SD 1.03). Finally, the overall ratings for the unsatisfactory setting (unsatisfactory setting, superior communication and professionalism) video ranged from 1 to 8 with a mean of 3.1 (SD 1.7).
Figure 1 demonstrates that for the domain of communication, the raters were able to discern the unsatisfactory performance but had difficulty reliably distinguishing between superior and satisfactory performance. Figure 2 illustrates that for the domain of professionalism, raters were able to detect the videos' changing levels of performance at the extremes of behavior, with unsatisfactory and superior displays more readily identified. Figure 3 shows that for the domain of setting, the raters were able to discern the unsatisfactory versus superior level of the changing setting. Of note, we also found a moderate significant correlation between ratings of professionalism and communication (r=0.47, P<0.001).
The Cronbach , or measurement of internal reliability and consistency, for the Handoff Mini‐CEX (3 items plus overall) was 0.77, indicating high internal reliability and consistency. Using data from University of Chicago, where raters were labeled with a unique identifier, the Kendall coefficient of concordance was calculated to be 0.79, demonstrating high inter‐rater reliability of the faculty raters. High inter‐rater reliability was also seen using intraclass coefficients for each domain: communication (0.84), professionalism (0.68), setting (0.83), and overall (0.89). Using generalizability analysis, the average reliability was determined to be above 0.9 for all domains (0.99 for overall).
Last, the 2‐way ANOVA (n=75 observations from 13 raters) revealed no evidence of rater bias when examining the coefficient for attending rater (P=0.55 for professionalism, P=0.45 for communication, P=0.92 for setting). The range of scores for each video, however, was broad (Table 2).
| Unsatisfactory | Satisfactory | Superior | ||||||||
|---|---|---|---|---|---|---|---|---|---|---|
| Mean | Median | Range | Mean | Median | Range | Mean | Median | Range | Pb | |
| ||||||||||
| Professionalism | 2.3 | 2 | 14 | 4.4 | 4 | 38 | 7.0 | 7 | 39 | 0.026 |
| Communication | 2.8 | 3 | 16 | 7 | 8 | 59 | 6.6 | 7 | 19 | 0.005 |
| Setting | 3.1 | 3 | 18 | 7.5 | 8 | 29 | 0.005 | |||
DISCUSSION
This study demonstrates that valid conclusions on handoff performance can be drawn using the Handoff CEX as the instrument to rate handoff quality. Utilizing standardized videos depicting varying levels of performance communication, professionalism, and setting, the Handoff Mini‐CEX has demonstrated potential to discern between increasing levels of performance, providing evidence for the construct validity of the instrument.
We observed that faculty could reliably detect unsatisfactory professionalism with ease, and that there was a distinct correlation between faculty ratings and the internally set levels of performance displayed in the videos. This trend demonstrated that faculty were able to discern different levels of professionalism using the Handoff Mini‐CEX. It became more difficult, however, for faculty to detect superior professionalism when the domain of communication was permuted. If the sender of the handoff was professional but the information delivered was disorganized, inaccurate, and missing crucial pieces of information, the faculty perceived this ineffective communication as unprofessional. Prior literature on professionalism has found that communication is a necessary component of professional behavior, and consequently, being a competent communicator is necessary to fulfill ones duty as a professional physician.[15, 16]
This is of note because we did find a moderate significant correlation between ratings of professionalism and communication. It is possible that this distinction would be made clearer with formal rater training in the future prior to any evaluations. However, it is also possible that professionalism and communication, due to a synergistic role between the 2 domains, cannot be separated. If this is the case, it would be important to educate clinicians to present patients in a concise, clear, and accurate way with a professional demeanor. Acknowledging professional responsibility as an integral piece of patient care is also critical in effectively communicating patient information.[5]
We also noted that faculty could detect unsatisfactory communication consistently; however, they were unable to differentiate between satisfactory and superior communication reliably or consistently. Because the unsatisfactory professionalism, unsatisfactory setting, and satisfactory professionalism videos all demonstrated superior communication, we believe that the faculty penalized communication when distractions, in the form of interruptions and rude behavior by the resident giving the handoff, interrupted the flow of the handoff. Thus, the wide ranges in scores observed by some raters may be attributed to this interaction between the Handoff Mini‐CEX domains. In the future, definitions of the anchors, including at the middle spectrum of performance, and rater training may improve the ability of raters to distinguish performance between each domain.
The overall value of the Handoff Mini‐CEX is in its ease of use, in part due to its brevity, as well as evidence for its validity in distinguishing between varying levels of performance. Given the emphasis on monitoring handoff quality and performance, the Handoff Mini‐CEX provides a standard foundation from which baseline handoff performance can be easily measured and improved. Moreover, it can also be used to give individual feedback to a specific practicing clinician on their practices and an opportunity to improve. This is particularly important given current recommendations by the Joint Commission, that handoffs are standardized, and by the ACGME, that residents are competent in handoff skills. Moreover, given the creation of the SHM's handoff recommendations and handoffs as a core competency for hospitalists, the tool provides the ability for hospitalist programs to actually assess their handoff practices as baseline measurements for any quality improvement activities that may take place.
Faculty were able to discern the superior and unsatisfactory levels of setting with ease. After watching and rating the videos, participants said that the chaotic scene of the unsatisfactory setting video had significant authenticity, and that they were constantly interrupted during their own handoffs by pages, phone calls, and people entering the handoff space. System‐level fixes, such as protected time and dedicated space for handoffs, and discouraging pages to be sent during the designated handoff time, could mitigate the reality of unsatisfactory settings.[17, 18]
Our study has several limitations. First, although this study was held at 2 sites, it included a small number of faculty, which can impact the generalizability of our findings. Implementation varied at Yale University and the University of Chicago, preventing use of all data for all analyses. Furthermore, institutional culture may also impact faculty raters' perceptions, so future work aims at repeating our protocol at partner institutions, increasing both the number and diversity of participants. We were also unable to compare the new shorter Handoff Mini‐CEX to the larger 9‐item Handoff CEX in this study.
Despite these limitations, we believe that the Handoff Mini‐CEX, has future potential as an instrument with which to make valid and reliable conclusions about handoff quality, and could be used to both evaluate handoff quality and as an educational tool for trainees and faculty on effective handoff communication.
Disclosures
This work was supported by the National Institute on Aging Short‐Term Aging‐Related Research Program (5T35AG029795), Agency for Healthcare Research and Quality (1 R03HS018278‐01), and the University of Chicago Department of Medicine Excellence in Medical Education Award. Dr. Horwitz is supported by the National Institute on Aging (K08 AG038336) and by the American Federation for Aging Research through the Paul B. Beeson Career Development Award Program. Dr. Arora is funded by National Institute on Aging Career Development Award K23AG033763. Prior presentations of these data include the 2011 Association of American Medical Colleges meeting in Denver, Colorado, the 2012 Association of Program Directors of Internal Medicine meeting in Atlanta, Georgia, and the 2012 Society of General Internal Medicine Meeting in Orlando, Florida.
- , , . The new recommendations on duty hours from the ACGME task force. New Engl J Med. 2010;363(2):e3.
- ACGME common program requirements. Effective July 1, 2011. Available at: http://www.acgme.org/acgmeweb/Portals/0/PDFs/Common_Program_Requirements_07012011[2].pdf. Accessed February 8, 2014.
- , , , , . Consequences of inadequate sign‐out for patient care. Arch Intern Med. 2008;168(16):1755–1760.
- , , , , . Communication failures in patient sign‐out and suggestions for improvement: a critical incident analysis. Qual Saf Healthcare. 2005;14(6):401–407.
- , , , , , . Hospitalist handoffs: a systematic review and task force recommendations. J Hosp Med. 2009;4(7):433–440.
- , . A model for building a standardized hand‐off protocol. Jt Comm J Qual Patient Saf. 2006;32(11):646–655.
- World Health Organization Collaborating Centre for Patient Safety. Solutions on communication during patient hand‐overs. 2007; Volume 1, Solution 1. Available at: http://www.who.int/patientsafety/solutions/patientsafety/PS‐Solution3.pdf. Accessed February 8, 2014.
- , . Patient handoffs: standardized and reliable measurement tools remain elusive. Jt Comm J Qual Patient Saf. 2010;36(2):52–61.
- , , , et al. Development of a handoff evaluation tool for shift‐to‐shift physician handoffs: the handoff CEX. J Hosp Med. 2013;8(4):191–200.
- , , , et al. Hand‐off education and evaluation: piloting the observed simulated hand‐off experience (OSHE). J Gen Intern Med. 2010;25(2):129–134.
- , , , , , . Validation of a handoff tool: the Handoff CEX. J Clin Nurs. 2013;22(9‐10):1477–1486.
- , , , . The mini‐CEX: a method for assessing clinical skills. Ann Intern Med. 2003;138(6):476–481.
- , , , , . Handoff strategies in settings with high consequences for failure: lessons for health care operations. Int J Qual Health Care. 2004;16(2):125–132.
- , , , , . Construct validity of the miniclinical evaluation exercise (miniCEX). Acad Med. 2003;78(8):826–830.
- , , , et al. Third‐year medical students' participation in and perceptions of unprofessional behaviors. Acad Med. 2007;82(10 suppl):S35–S39.
- . Professionalism—the next wave. N Engl J Med. 2006;355(20):2151–2152.
- , , , , . Interns overestimate the effectiveness of their hand‐off communication. Pediatrics. 2010;125(3):491–496.
- , , , , . Characterising physician listening behaviour during hospitalist handoffs using the HEAR checklist. BMJ Qual Saf. 2013;22(3):203–209.
© 2014 Society of Hospital Medicine
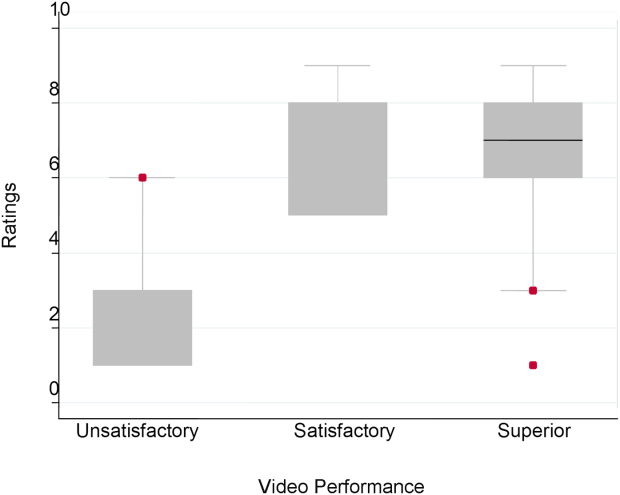
NICE recommends bortezomib for untreated MM

Credit: Bill Branson
In a new draft guidance, the UK’s National Institute for Health and Care Excellence (NICE) has recommended bortezomib (Velcade) for certain patients with newly diagnosed multiple myeloma (MM).
NICE is recommending the drug in combination with dexamethasone, or with dexamethasone and thalidomide, as induction treatment for adults with previously untreated MM who are eligible for high-dose chemotherapy with hematopoietic stem cell transplant (HSCT).
An appraisal committee said these regimens are clinically effective for this patient population. Trial data suggest the regimens confer a “clear advantage” over standard therapy with respect to induction response.
And it’s plausible that this may translate to improved survival, the committee said. (Standard treatment in the UK is a combination of cyclophosphamide, thalidomide, and dexamethasone.)
“Clinical specialists told the committee that induction treatment with bortezomib would enable a greater number of patients to proceed to [HSCT] and, consequently, prevent the disease from progressing for longer,” said Sir Andrew Dillon, NICE Chief Executive.
In addition, the committee said the bortezomib regimens are cost-effective for this patient population. The cost of bortezomib is £762.38 per 3.5 mg vial.
On average, a course of treatment with bortezomib given with dexamethasone costs £12,260.91. And a course of bortezomib given with dexamethasone and thalidomide costs £24,840.10.
The cost for bortezomib, thalidomide, and dexamethasone compared to thalidomide and dexamethasone is likely to be below £30,000 per quality-adjusted life-year gained.
The same is true when comparing bortezomib and dexamethasone to cyclophosphamide, thalidomide, and dexamethasone as well as vincristine, doxorubicin, and dexamethasone.
This draft guidance is now with consultees, who have the opportunity to appeal against it.
Other NICE recommendations for MM
NICE already recommends bortezomib monotherapy as a treatment option for MM patients at first relapse who have received one prior therapy and who have undergone, or are unsuitable for, HSCT.
Thalidomide in combination with an alkylating agent and a corticosteroid is recommended as a first-line treatment option in MM patients for whom high-dose chemotherapy with HSCT is considered inappropriate.
Bortezomib is also recommended under these circumstances, if the patient is unable to tolerate or has contraindications to thalidomide.
Lenalidomide in combination with dexamethasone is recommended as a treatment option for people with MM who have received 2 or more prior therapies. ![]()
How low levels of oxygen, nitric oxide worsen SCD

Medical College of Georgia
Low levels of oxygen and nitric oxide have an unfortunate synergy in sickle cell disease (SCD), according to preclinical research published in Blood.
The study indicates that these conditions dramatically increase red blood cells’ adhesion to endothelial cells and intensify the debilitating pain crises that can result.
The good news is that restoring normal levels of nitric oxide can substantially reduce red blood cell adhesion, said study author Tohru Ikuta, MD, PhD, of the Medical College of Georgia at Georgia Regents University in Augusta.
The study also points to a potential therapeutic target—the self-adhesion molecule P-selectin, which the researchers found played a central role in increased red blood cell adhesion. Low levels of oxygen and nitric oxide both increase expression of P-selectin.
To understand the relationship between hypoxia and nitric oxide, the researchers infused sickled red blood cells into mice incapable of producing nitric oxide.
The cells immediately began sticking to blood vessel walls, while normal mice were unaffected. In the face of low oxygen levels, cell adhesion increased significantly in the nitric oxide-deficient mice.
“It’s a synergy,” Dr Ikuta said. “This shows that hypoxia and low nitric oxide levels work together in a bad way for sickle cell patients.”
When the researchers restored normal nitric oxide levels by having mice breathe in the short-lived gas, cell adhesion did not increase when oxygen levels decreased.
And there was no additional benefit from increasing nitric oxide levels beyond normal. Rather, restoring normal nitric oxide levels appears the most efficient, effective way to reduce red blood cell adhesion, the researchers said.
They noted that clinical trials of nitric oxide therapy to ease pain in SCD patients have yielded conflicting results, with some patients reporting increased pain.
These new findings and the fact that SCD patients have significant variability in their nitric oxide levels—even during a pain crisis—likely explains why, Dr Ikuta said. Nitric oxide therapy likely would benefit only patients with intermittent or chronically low levels of nitric oxide.
“The answer is that some patients may not need this,” Dr Ikuta said. “And our studies indicate that there is no therapeutic benefit to increasing levels beyond physiologic levels.” ![]()
Nanotherapies make inroads in wound regeneration
DENVER – Move over, gauze, bandages, and moist wound-healing techniques. Nanomaterials are making significant inroads in wound regeneration.
Dr. Adam Friedman, director of dermatologic research at the Montefiore-Einstein College of Medicine, New York, highlighted four nanotherapies in the field of wound care.
• Antimicrobial nano-based dressings. The antibacterial properties of silver have been documented since 1000 B.C., said Dr. Friedman of the departments of dermatology and of physiology and biophysics at the medical school. Silver ions are believed to directly disrupt pathogen cell walls/membranes and suppress respiratory enzymes and electron transport components. Silver has been used commercially for decades, with demonstrated antimicrobial effects (Crede’s 1% silver nitrate eyedrops were used to prevent mother to child transmission of gonococcal eye infection); anti-inflammatory properties (silver nitrate is used in pleurodesis); and infection protection (silver nanoparticle–impregnated wound dressings prevent infection and enhance wound healing).
Silver nanoparticles have an "increased likelihood of directly interacting with the target bacteria or virus," Dr. Friedman said in an interview in advance of the annual meeting of the American Academy of Dermatology. "They bind to and/or disturb bacterial cell membrane activity as well as release silver ions much more readily then their bulk counterparts." Silver dressings currently on the market include Silvercel, Aquacel, and Acticoat.
Similarly to nanometals, the biological activity of curcumin (a water-insoluble polyphenolic compound derived from tumeric) can be used in the nanoform and has been shown to both effectively clear methicillin-resistant Staphylococcus aureus in burn wound infections and accelerate the healing of thermal burn wounds.
• Immunomodulating antimicrobial nanoparticles. One of the most promising immunomodulators in wound healing is the gaseous molecule nitric oxide (NO). This potential has yet to be realized, Dr. Friedman said, as NO is highly unstable and its site of action is often microns from its source of generation. Nanotechnology can allow for controlled and sustained release of this evasive biomolecule and make therapeutic translation a reality. "At Einstein, we are utilizing NO-generating nanoparticles to accelerate wound healing and eradicate multidrug resistant pathogens," he said. "But, because NO is integral to so many biological processes, it can do so much more. This technology is also being studied for the treatment of cardiovascular disease and even the topical treatment of erectile dysfunction."
• Gene modifying/silencing technologies. RNA interference is an endogenous mechanism to control gene expression in a variety of organisms. "We can take advantage of this process using siRNA (small interfering RNA) to manipulate limitless biological processes," Dr. Friedman explained. "While a hot area, translation to the bedside has been difficult as siRNA are very unstable and have a difficult time reaching their targets inside cells. Nanoparticles have been shown to overcome these limitations." Dr. Friedman noted how siRNA encapsulate nanoparticles targeting fidgetin-like 2 (an ATPase that cleaves microtubules), can knock down this gene in vivo, resulting in accelerated epithelial cell migration and hastened wound closure in both excisional and burn wound mouse models.
• Growth factor–releasing nanoparticles. Growth factors have been found to speed the healing of acute and chronic wounds in humans, including Regranex, a analogue of platelet-derived growth factor that is FDA-approved for treating leg and foot ulcers in diabetic patients, epidermal growth factor (donor-site wounds), fibroblast growth factor (burn wounds), and growth hormone (donor sites in burned children). "Nanomaterials offer many advantages here, from allowing for temporal release depending on the wound environment to delivering multiple factors at the same or different times, to even serving as a structural foundation for wound healing while releasing factors simultaneously," Dr. Friedman said. "The possibilities are limitless."
Dr. Friedman characterized nanomedicine as "a newborn branch of science. These promising and innovative tools should help us overcome limitations of traditional wound care, improve direct intervention on phases of wound healing, and provide better solutions for wound dressing that induce favorable wound healing environments. More work – and funding – is needed."
Dr. Friedman disclosed that he is a consultant and/or a member of the scientific advisory board for SanovaWorks, Prodigy, Oakstone Institute, Liquidia Technologies, L’Oréal, Amgen, Onset, Aveeno, GSK, MicroCures, and Nano Bio-Med. He is also a speaker for Onset and Amgen.
This article was updated March 24, 2014.
AT THE AAD ANNUAL MEETING
VIDEO: Vitiligo gene hunt could open door to eventual drug treatment
DENVER – Vitiligo has been known for thousands of years, but only in the past six decades have researchers begun to better understand it and uncover genes associated with the disorder.
Dr. Richard A. Spritz, one of the leaders in vitiligo research, says that scientists are very close to understanding the condition’s pathogenesis. He is embarking on another analysis of data from a large genetic study, which could double the number of known vitiligo genes, putting the disorder on par with other autoimmune diseases such as type 1 diabetes and rheumatoid arthritis.
At the Society of Pediatric Dermatology’s annual meeting, held immediately before the annual meeting of the American Academy of Dermatology, Dr. Spritz spoke about what is known so far about vitiligo and what the future holds. Dr. Spritz is professor and director of the Human Medical Genetics and Genomics Program at the University of Colorado, Aurora.
On Twitter @naseemsmiller
AT A MEETING OF THE SOCIETY OF PEDIATRIC DERMATOLOGY
Omitting RT can increase risk of relapse in HL

Credit: Sue Campbell
Interim results of a randomized trial suggest that omitting radiotherapy in Hodgkin lymphoma patients with an early negative PET scan can increase their risk of relapse.
Patients with stage I/II Hodgkin lymphoma who received involved-node radiotherapy after chemotherapy with ABVD (adriamycin, bleomycin, vinblastine, and dacarbazin) were less likely to relapse than patients who received ABVD alone, regardless of prognosis.
However, patients who received chemotherapy alone still had a high rate of progression-free survival (PFS), at about 95%.
John M.M. Raemaekers, MD, PhD, of the Radboud University Medical Center in Nijmegen, The Netherlands, and his colleagues reported these results in the Journal of Clinical Oncology.
“Striking the right balance between initial cure through combined-modality treatment and accepting a higher risk of late complications, and a higher recurrence rate after omitting radiotherapy in subsets of patients who will subsequently need intensive salvage treatment, is a matter of unsettled debate,” Dr Raemaekers said.
So he and his colleagues set out to evaluate whether involved-node radiotherapy could be omitted without compromising PFS in patients with stage I/II Hodgkin lymphoma who had an early negative PET scan after treatment with ABVD.
The interim analysis included 1137 patients with untreated clinical stage I/II Hodgkin lymphoma. Of these, 444 patients had favorable prognoses, and 693 had unfavorable prognoses.
Patients in each prognostic group were randomized to receive standard treatment—2 cycles of ABVD followed by radiotherapy (n=188)—or experimental treatment—ABVD alone (n=193).
For patients with a favorable prognosis and an early negative PET scan, 1 progression occurred in the standard arm, and 9 occurred in the experimental arm. At 1 year, PFS rates were 100% and 94.9%, respectively.
For patients with unfavorable prognosis and an early negative PET scan, 7 events occurred in the standard arm, and 16 occurred in the experimental arm.
One patient died from toxicity without signs of progression, but all of the remaining events were progressions. At 1 year, the PFS rates were 97.3% and 94.7%, respectively.
Although there were few events and the median follow-up time was short, an independent data monitoring committee said it was unlikely that the final results would show non-inferiority for the experimental treatment. They therefore advised that randomization be stopped for early PET-negative patients. ![]()