User login
Pessaries for vaginal prolapse: Critical factors to successful fit and continued use
CASE 1. EARLY-STAGE PELVIC ORGAN PROLAPSE
AC is a 64-year-old white woman with early stage III anterior and apical pelvic organ prolapse (POP). The prolapse is now affecting her ability to do some of the things that she enjoys, such as gardening and golfing.
She has hypertension controlled with medication and no other significant medical issues except mild arthritic changes in her hands and hips. She reports being sexually active with her husband on roughly a weekly basis.
On examination, the leading edge of her prolapse is the anterior vaginal wall, protruding 1 cm beyond the introitus, and the cervix is at the hymenal ring. There is no significant posterior wall prolapse.
After she is counseled about all possible treatment approaches for her early-stage POP, the patient elects to try the vaginal pessary. Now, it is your job to determine the optimal pessary based on the extent of her condition and to educate her about the potential side effects and best practices for its ongoing use.
The vaginal pessary is an important component of a gynecologist’s armamentarium. It is a low-risk, cost-effective, nonsurgical treatment option for the management of POP and genuine stress urinary incontinence (SUI).1,2 It is unfortunate that training in North America typically provides clinicians with only a cursory experience with pessary selection and care, minimizing the device’s importance as a viable tool in a practitioner’s ongoing practice. In fact, most clinicians tend to view the pessary with a mixture of reluctance and disregard.
This is regrettable, as a majority (89%) of patients can be successfully fitted with a pessary,3 regardless of their stage or site of prolapse.4 Although high-stage prolapse does not predict failure, ring pessaries are used most successfully with stage II (100%) and stage III (71%) prolapse, while Gellhorn pessaries are most successful with stage IV (64%) prolapse.5
In this article we review the several pessary options available to clinicians, as well as how to insert them and the best scenarios for their use. We also discuss the key requirements for patient assessment and in-office fitting (meant to optimize the fit and, thereby, the success of use), the possible side effects of pessary use that patients need to be aware of, and appropriate follow-up.
WHEN IS A PESSARY YOUR BEST MANAGEMENT APPROACH?
There are several indications for pessary use,6 namely when:
- the patient has significant comorbid risk factors for surgery
- the patient prefers a nonsurgical alternative
- a goal is to avoid reoperation
- POP or cervical insufficiency is present during pregnancy
- the patient desires future fertility
- surgery must be delayed due to treatment of vaginal ulcerations
- the pessary will be used as a postoperative adjunct to mesh-based repair.
Pessaries have very few contraindications (TABLE). However, factors that do negatively affect successful fitting include:
- prior pelvic surgery
- multiparity
- obesity
- SUI
- short vaginal length (<7 cm)
- wide vaginal introitus (>4 fingerbreadths)
- significant posterior vaginal wall defect.5,7-9
There are two main categories of vaginal pessaries: support and space-filling. All pessaries come in different sizes and shapes. Most are made of medical-grade silicone, rendering them durable and autoclavable as well as resistant to absorption of vaginal discharge and odors. The ring pessary with support is the most commonly used support pessary. The Gellhorn pessary is the most commonly used space-filling pessary. It is used as a second-line treatment for patients unable to retain the ring-with-support pessary.
Related Article: Pessary and pelvic floor exercises for incontinence—are two better than one? G. Willy Davila, MD (Examining the Evidence, May 2010)
SUPPORT PESSARY OPTIONS
The support pessaries are used to treat SUI and POP. These pessaries typically are the easiest types for patients to use because they are more comfortable and simpler to remove and insert than space-filling pessaries. For example, a ring pessary is two-dimensional and lies perpendicular to the long axis of the vagina, allowing patients to have intercourse with it in place. Support-type pessaries include the ring, Gehrung, Shaatz, and lever.
Ring
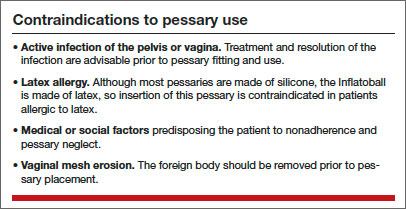
This is the most commonly used pessary because it fits most women. There are four types of ring pessaries: the ring (FIGURE 1A), ring with support (FIGURE 1B), incontinence ring, and incontinence ring with support. The ring pessary is appropriate for all stages of POP. The ring with support has a diaphragm that is useful in women who have uterine prolapse with or without cystocele. The incontinence ring has a knob that is placed beneath the urethra to increase urethral pressure and is useful in cases of SUI.
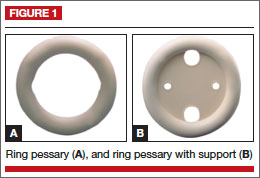
Insertion. Fold the pessary by bringing the two small holes together, and lubricate the leading edge. Insert it past the introitus with the folded edge facing down. Allow the pessary to reopen, and direct it behind the cervix into the posterior fornix (FIGURE 2). Give it a slight twist with your index finger to prevent expulsion.
To see insertion demonstrated, watch Vaginal pessaries: An instructional video
Gehrung
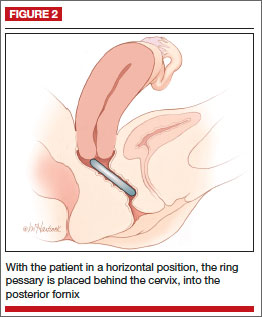
This pessary is designed with an arch-shaped malleable rim with wires incorporated into the arms (FIGURE 3). Use of the Gehrung pessary is rare; it is most often used in women with cystocele or rectocele.
Insertion. Fold the pessary to insert it into the vagina. Upon insertion, keep both heels of the pessary parallel to the posterior vagina with the back arch pushed over the cervix in the anterior fornix and the front arch resting behind the symphysis pubis. The concave surface and diaphragm support the anterior vagina. Place the convex portion of the curve beneath the bulge. The two bases rest on the posterior vagina against the lateral levator muscles.
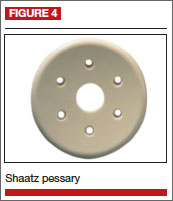
Shaatz
This support pessary has a circular base similar to the Gellhorn pessary but without the rigid stem (FIGURE 4).
Insertion. Because it is stiff, insert this pessary vertically and then turn it to a horizontal position once it is inside the vagina.
Lever
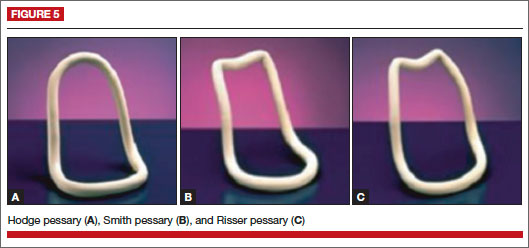
The Hodge, Smith, and Risser pessaries are collectively called the lever pessaries. They are used to manage uterine retroversion and POP. They are rarely used.
The Hodge pessary is beneficial to patients with a narrow vaginal introitus, mild cystocele, and cervical insufficiency. The anterior portion of a Hodge pessary is rectangular (FIGURE 5A).
The Smith pessary is useful for patients with well-defined pubic notches because the anterior portion is rounded (FIGURE 5B).
For patients with a very shallow pubic notch, the Risser pessary is useful. The Risser’s anterior portion is rectangular with indentation but wider than the Hodge pessary (FIGURE 5C).
Insertion. Fold the pessary and insert it into the vagina with the index finger on the posterior curved bar until the pessary rests behind the cervix and the anterior horizontal bar rests behind the symphysis pubis.
SPACE-OCCUPYING PESSARIES
The second pessary category is the space-filling pessary. These pessaries are used primarily to support severe POP, especially posthysterectomy vaginal vault prolapse. They have larger bases to support the vaginal apex or cervix; therefore, they are more difficult to insert and remove. When this pessary type is in place, sexual intercourse is not possible. Examples include the Gellhorn, donut, cube, and inflatable pessaries.
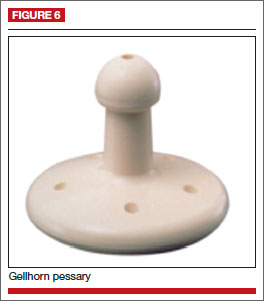
Gellhorn
The Gellhorn pessary is the most commonly used space-filling pessary. It has a broad base with a stem (FIGURE 6). The broad base supports the vaginal apex while the stem keeps the circular base from rotating and prevents pessary expulsion. The stem comes in long or short lengths. The concave base provides vaginal suction and keeps the pessary in place. The holes in the stem and base provide vaginal drainage. The Gellhorn pessary is useful for women with more advanced prolapse and less perineal support.
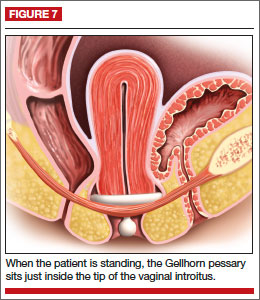
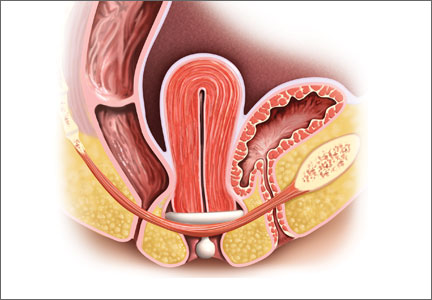
Insertion. Folding one side of the base to the stem, insert the Gellhorn pessary vertically inside the vagina. To facilitate insertion, separate the labia with the nondominant hand or depress the perineum with the index finger. Once the circular base is inside the vagina, push the pessary upward until the tip of the stem is just inside the vaginal introitus (FIGURE 7). Many medical illustrations inaccurately depict the Gellhorn pessary in a final placement that appears too high in the pelvis. This figure, which has the patient in a standing position, shows how low in the pelvis this space-filling pessary can sit in a patient with advanced prolapse.
Remove this pessary by gently pulling the stem while inserting the opposite hand beneath an edge of the pessary base to break the vaginal suction (Watch Vaginal pessaries: An instructional video).
Donut
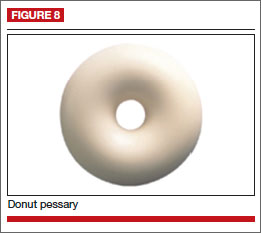
The donut pessary is used for advanced prolapse because it fills a larger space. It is difficult to insert and remove because it is large, thick, and hollow (FIGURE 8).
Insertion. Insert it vertically and, once it is placed inside the vagina, rotate it to a horizontal position. A Kelly clamp can be used to grasp the pessary and facilitate removal.
Cube
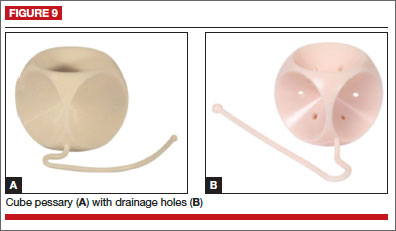
The cube pessary supports third-degree uterine prolapse by holding the vaginal wall with suction (FIGURE 9). Because of the risk of vaginal erosion and lack of drainage in some designs, the cube pessary requires nightly removal and cleaning.
Insertion. Squeezing the pessary with the thumb, index, and middle fingers, insert the cube pessary at the vaginal apex.
Removal requires breaking the suction by placing a fingertip between the vaginal mucosa and the pessary and compressing the cube between the thumb and forefinger to remove. Gently tugging on the string also helps with removal.
Inflatable
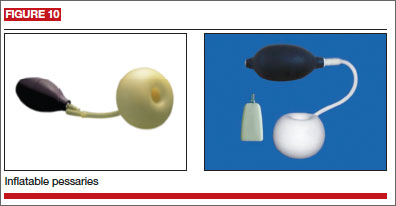
This space-filling pessary is an air-filled ball that is inflated via an attached stem that also enables insertion and removal. The older Inflatoball pessary is made of latex, so its use is contraindicated in patients with latex allergy. Newer inflatable pessaries are silicone-based and consist of an air-filled donut, a stem with a valve, and an air pump (FIGURE 10). Some models also include a deflation key. The inflatable pessary comes in small, medium, large, and extra-large sizes. This pessary type must be removed and cleaned daily.
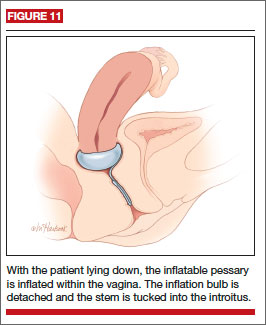
Insertion. Place the deflated pessary into the vagina. Move the ball-bearing valve within the stem (which controls the air flow) to a lateral projection on the side of the stem. To inflate, attach the inflation bulb. (Inflation typically requires 3 to 5 pumps of the bulb.) Move the ball bearing back into position to maintain the inflation, then detach the bulb. You can leave the stem outside the body or tuck it gently into the introitus (FIGURE 11).
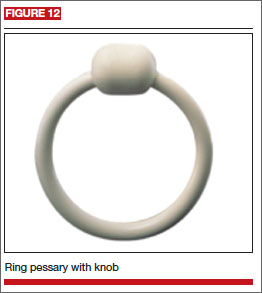
INCONTINENCE PESSARIES
These devices are used specifically for SUI. The incontinence ring (FIGURE 12) and incontinence dish pessaries compress the urethra against the pubic symphysis. The knob is placed beneath the urethra, increasing the urethral closure pressure and thereby preventing urinary incontinence.
Related Article: Update on Urinary Incontinence Karen L. Noblett, MD, MAS, and Stephanie A. Jacobs, MD (December 2011)
CASE 1 CONCLUDED
Given that AC has early-stage POP and is sexually active, a space-occupying pessary is not the optimal choice. Instead, a ring pessary with support is fitted for her trial.
What side effects might a patient anticipate with pessary use?
Vaginal discharge and slight odor are common. Pessary removal and cleaning are usually adequate to eliminate them. Temporary discontinuation of pessary use may be warranted until symptoms subside. If these maneuvers do not resolve the issue, then the patient should be examined to rule out other sources of infection.
Vaginal bleeding. Bleeding from vaginal abrasion and ulceration could be caused by trauma from pessary removal or vaginal impingement. Evaluation is warranted for any vaginal bleeding.
Changes in urinary function. Less commonly, women using a pessary may notice changes in their urinary function. Many women with anterior or apical prolapse will have altered urine streams with slow or trickling flow and possible hesitation upon initiation of voiding.
Alternatively, pessary placement may instigate stress-type incontinence akin to that seen after prolapse surgery. Changing pessary size may alleviate this condition. Otherwise, these side effects may reduce a patient’s willingness to continue pessary use.
How can a patient optimize her use of a pessary?
A patient can remove the pessary on a periodic basis or try to use it continuously. If she cannot or will not remove the pessary, then she will need to come back for scheduled visits, as described in the sidebar, “Essential components of a successfully fitted pessary.” If she is able to remove the pessary on her own, then she can use the device as needed or remove it for intercourse (though it is not necessary). She must remove it weekly, at a minimum, however, to both clean the pessary and give the vaginal walls a “rest,” which can minimize the potential for abrasions or erosions
ESSENTIAL COMPONENTS OF A SUCCESSFULLY FITTED PESSARY
Patient assessment
Accurate selection and placement of a pessary requires appropriate examination and fitting, beginning with determination of the patient’s stage of prolapse and introitus. Key steps include:
– Examine the patient with an empty bladder in the lithotomy position
– Perform bimanual pelvic and speculum examination using a Sims speculum (or bivalve speculum broken in half) with the patient in a supine position
– Administer the Pelvic Organ Prolapse Quantification (POP-Q) exam
– Perform digital examination
– Assess vaginal atrophy, vaginal introitus, and vaginal width and length
– Evaluate pelvic floor muscle strength (Kegel squeeze).
Next, gauge the correct pessary size by approximating the number of fingerbreadths accommodated across the vaginal width.
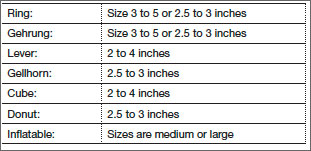
Another method of estimating pessary size is to insert two fingers inside the vagina and estimate the distance between the posterior fornix and the posterior pubic symphysis (Watch Vaginal pessaries: An instructional video). An easy reference is to start with a size 3 or 4 ring pessary if the vaginal introitus is 1 to 2 fingerbreadths in width and the prolapse is stage II to III. If the vagina accommodates 3 to 4 fingerbreadths, or there is stage IV prolapse, use a Gellhorn pessary.
Here are the different types of pessaries and the most common sizes available. (Pessary sizes change in quarter-inch increments.)
In-office trial
Insert the pessary into the vagina using the dominant hand. Using the nondominant hand, separate the introitus and depress the perineal body. Apply a small amount of lubricant to the leading edge of the pessary.
After insertion, ask the patient to strain and cough, ambulate in the office, and void. Reexamine the patient to ensure that the pessary is still in the correct position and that placement has not shifted. Perform the cough leak test with the patient in a standing position and the pessary in place. Re-examine the patient while she is in a standing position. Use the largest pessary that is comfortable for her. Advise her to bring the pessary back to the office if it gets expelled.
This is a trial-and-error process; advise the patient of this. It may require a trial of several styles and sizes to find the right pessary fit. Once you find the correct size, document the final pessary size.
Follow-up
Schedule a follow-up appointment 1 to 2 weeks after insertion. Ask the patient whether she has experienced any discomfort, malodorous discharge, or vaginal bleeding. Also inquire about any changes in urinary habits or bowel movements and related complaints.
Remove the pessary and clean it with mild soap and water. Examine the vagina for pressure points, abrasions, ulcerations, and erosions.
Teach the patient how to remove, clean, and reinsert the pessary, and advise her to perform these tasks on a weekly basis.
Schedule a follow-up visit in 1 to 2 months, and another visit 6 to 12 months after that.
CASE 2. ADVANCED-STAGE POP
BD is an 82-year-old widow (G5P4014) with stage IV vaginal prolapse. She has noticed some scant blood staining on her clothing. She frequently voids small amounts of urine but never feels complete relief. She defecates normally.
Her medical history is significant for coronary artery disease with prior myocardial infarction, with multiple stent placements over the years. She has hypertension, reduced ejection fraction, and diabetes. She is morbidly obese and suffers from degenerative joint disease. She had a vaginal hysterectomy several years ago for benign indications.
Upon examination, BD’s prolapse is large, with excoriations and hyperkeratosis of the skin over the prolapse. It is easily reduced in the office.
What is the best pessary for this patient, and how should she be followed and counseled regarding ongoing care?
Since the failure rate for pessary usage increases with advancing prolapse stage, a space-occupying pessary is most appropriate to try initially. A trial with a support pessary could be useful to allow the excoriations to heal and provide a healthier vaginal environment. A Gellhorn pessary is commonly used. An inflatable pessary could be an alternative if the Gellhorn fails to stay in place. The cube pessary, known to cause more abrasions and erosions than other pessaries, is a poor choice given the state of the patient’s vaginal tissues at baseline.
Space-occupying pessaries are more difficult to insert and remove and have a higher risk of pain or trauma. Start with shorter time intervals between visits, eventually spacing them out for the patient’s convenience. The usual interval for follow-up is 3 to 4 months; longer intervals could be offered if the patient is reliable, adherent, and reports no complaints with pessary use.
Related Article: Update on pelvic floor dysfunction: Focus on urinary incontinence Alexis A. Dieter, MD, and Cindy L. Amundsen, MD (November 2013)
OUTCOMES
Only short- and medium-term outcomes for pessary use have been described in the literature. Short-term (2 months) satisfaction and continued use, along with resolution of prolapse, occurred in 92% of patients.7 Previous hysterectomy or prolapse surgery may influence the short-term success of pessary use.10
More than half of sexually active women achieved long-term use (up to 2 years), regardless of prolapse severity. Brincat and colleagues found that long-term pessary use (1 to 2 years) approached 60% in 132 women with both urinary incontinence and prolapse. Women being treated for POP were more likely to continue pessary use than women being treated for SUI.11 Age, parity, estrogen use, and sexual activity were characteristics also studied in pessary fitting. Neither sexual activity nor stage of prolapse was a contraindication to use of a pessary; long-term use was found to be acceptable in sexually active women.11
Successful fitting of a vaginal pessary has been associated with improvement in voiding, urinary and fecal urgency, and incontinence. A vaginal pessary is a viable nonsurgical option for the management of POP and urinary incontinence and remains an optimal minimally invasive approach to such disorders.
CASE 2 CONCLUDED
The patient returns to the clinic 1 month after the original insertion. The pessary is removed, and the vagina is inspected, with no abrasions or ulcerations found. The vaginal cavity and pessary are cleaned with a mild soap-and-water mixture. The pessary is lubricated and reinserted. This process is repeated 2 months later, with subsequent follow-up intervals doubled (up to 6 months between visits) when the patient has no complaints of discharge or odor.
- Colmer, WM Jr. Use of the pessary. Am J Obstet Gynecol. 1953;65(1):170–174.
- Culligan PJ. Nonsurgical management to pelvic organ prolapse. Obstet Gynecol. 2012;119(4):852–860.
- Nygaard IE, Heit M. Stress urinary incontinence. Obstet Gynecol. 2004;104(3):607–620.
- ACOG Committee on Practice Bulletins—Gynecology. ACOG Practice Bulletin No. 85: Pelvic organ prolapse. Obstet Gynecol. 2007;110(3):717–729.
- Clemons JL, Aguilar VC, Tillinghast TA, Jackson ND, Myers DL. Risk factors associated with an unsuccessful pessary fitting trial in women with pelvic organ prolapse. Am J Obstet Gynecol. 2004;190(2):345–350.
- Clemons JL, Brubaker L, Falk SJ. Vaginal pessary treatment of prolapse and incontinence. UpToDate. http://www.uptodate.com/contents/vaginal-pessary-treatment-of-prolapse-and-incontinence. Updated February 8, 2013. Accessed November 7, 2013.
- Mutone MF, Terry C, Hale DS, Benson JT. Factors which influence the short-term success of pessary management of pelvic organ prolapse. Am J Obstet Gynecol. 2005;193(1):89–94.
- Fernando RJ, Thakar R, Sultan AH, Shah SM, Jones PW. Effect of vaginal pessaries on symptoms associated with pelvic organ prolapse. Obstet Gynecol. 2006;108(1):93–99.
- Weber AM, Richter HE. Pelvic organ prolapse. Obstet Gynecol. 2005;106(3):615–634.
- Donnelly MJ, Powell-Morgan S, Olsen AL, et al. Vaginal pessaries for the management of stress and mixed incontinence. Int Urogynecol J Pelvic Floor Dysfunct. 2004;15(5):302–307.
- Brincat C, Kenton K, Fitzgerald MP, et al. Sexual activity predicts continued pessary use. Am J Obstet Gynecol. 2004;191(1):198–200.
CASE 1. EARLY-STAGE PELVIC ORGAN PROLAPSE
AC is a 64-year-old white woman with early stage III anterior and apical pelvic organ prolapse (POP). The prolapse is now affecting her ability to do some of the things that she enjoys, such as gardening and golfing.
She has hypertension controlled with medication and no other significant medical issues except mild arthritic changes in her hands and hips. She reports being sexually active with her husband on roughly a weekly basis.
On examination, the leading edge of her prolapse is the anterior vaginal wall, protruding 1 cm beyond the introitus, and the cervix is at the hymenal ring. There is no significant posterior wall prolapse.
After she is counseled about all possible treatment approaches for her early-stage POP, the patient elects to try the vaginal pessary. Now, it is your job to determine the optimal pessary based on the extent of her condition and to educate her about the potential side effects and best practices for its ongoing use.
The vaginal pessary is an important component of a gynecologist’s armamentarium. It is a low-risk, cost-effective, nonsurgical treatment option for the management of POP and genuine stress urinary incontinence (SUI).1,2 It is unfortunate that training in North America typically provides clinicians with only a cursory experience with pessary selection and care, minimizing the device’s importance as a viable tool in a practitioner’s ongoing practice. In fact, most clinicians tend to view the pessary with a mixture of reluctance and disregard.
This is regrettable, as a majority (89%) of patients can be successfully fitted with a pessary,3 regardless of their stage or site of prolapse.4 Although high-stage prolapse does not predict failure, ring pessaries are used most successfully with stage II (100%) and stage III (71%) prolapse, while Gellhorn pessaries are most successful with stage IV (64%) prolapse.5
In this article we review the several pessary options available to clinicians, as well as how to insert them and the best scenarios for their use. We also discuss the key requirements for patient assessment and in-office fitting (meant to optimize the fit and, thereby, the success of use), the possible side effects of pessary use that patients need to be aware of, and appropriate follow-up.
WHEN IS A PESSARY YOUR BEST MANAGEMENT APPROACH?
There are several indications for pessary use,6 namely when:
- the patient has significant comorbid risk factors for surgery
- the patient prefers a nonsurgical alternative
- a goal is to avoid reoperation
- POP or cervical insufficiency is present during pregnancy
- the patient desires future fertility
- surgery must be delayed due to treatment of vaginal ulcerations
- the pessary will be used as a postoperative adjunct to mesh-based repair.
Pessaries have very few contraindications (TABLE). However, factors that do negatively affect successful fitting include:
- prior pelvic surgery
- multiparity
- obesity
- SUI
- short vaginal length (<7 cm)
- wide vaginal introitus (>4 fingerbreadths)
- significant posterior vaginal wall defect.5,7-9
There are two main categories of vaginal pessaries: support and space-filling. All pessaries come in different sizes and shapes. Most are made of medical-grade silicone, rendering them durable and autoclavable as well as resistant to absorption of vaginal discharge and odors. The ring pessary with support is the most commonly used support pessary. The Gellhorn pessary is the most commonly used space-filling pessary. It is used as a second-line treatment for patients unable to retain the ring-with-support pessary.
Related Article: Pessary and pelvic floor exercises for incontinence—are two better than one? G. Willy Davila, MD (Examining the Evidence, May 2010)
SUPPORT PESSARY OPTIONS
The support pessaries are used to treat SUI and POP. These pessaries typically are the easiest types for patients to use because they are more comfortable and simpler to remove and insert than space-filling pessaries. For example, a ring pessary is two-dimensional and lies perpendicular to the long axis of the vagina, allowing patients to have intercourse with it in place. Support-type pessaries include the ring, Gehrung, Shaatz, and lever.
Ring
This is the most commonly used pessary because it fits most women. There are four types of ring pessaries: the ring (FIGURE 1A), ring with support (FIGURE 1B), incontinence ring, and incontinence ring with support. The ring pessary is appropriate for all stages of POP. The ring with support has a diaphragm that is useful in women who have uterine prolapse with or without cystocele. The incontinence ring has a knob that is placed beneath the urethra to increase urethral pressure and is useful in cases of SUI.
Insertion. Fold the pessary by bringing the two small holes together, and lubricate the leading edge. Insert it past the introitus with the folded edge facing down. Allow the pessary to reopen, and direct it behind the cervix into the posterior fornix (FIGURE 2). Give it a slight twist with your index finger to prevent expulsion.
To see insertion demonstrated, watch Vaginal pessaries: An instructional video
Gehrung
This pessary is designed with an arch-shaped malleable rim with wires incorporated into the arms (FIGURE 3). Use of the Gehrung pessary is rare; it is most often used in women with cystocele or rectocele.
Insertion. Fold the pessary to insert it into the vagina. Upon insertion, keep both heels of the pessary parallel to the posterior vagina with the back arch pushed over the cervix in the anterior fornix and the front arch resting behind the symphysis pubis. The concave surface and diaphragm support the anterior vagina. Place the convex portion of the curve beneath the bulge. The two bases rest on the posterior vagina against the lateral levator muscles.
Shaatz
This support pessary has a circular base similar to the Gellhorn pessary but without the rigid stem (FIGURE 4).
Insertion. Because it is stiff, insert this pessary vertically and then turn it to a horizontal position once it is inside the vagina.
Lever
The Hodge, Smith, and Risser pessaries are collectively called the lever pessaries. They are used to manage uterine retroversion and POP. They are rarely used.
The Hodge pessary is beneficial to patients with a narrow vaginal introitus, mild cystocele, and cervical insufficiency. The anterior portion of a Hodge pessary is rectangular (FIGURE 5A).
The Smith pessary is useful for patients with well-defined pubic notches because the anterior portion is rounded (FIGURE 5B).
For patients with a very shallow pubic notch, the Risser pessary is useful. The Risser’s anterior portion is rectangular with indentation but wider than the Hodge pessary (FIGURE 5C).
Insertion. Fold the pessary and insert it into the vagina with the index finger on the posterior curved bar until the pessary rests behind the cervix and the anterior horizontal bar rests behind the symphysis pubis.
SPACE-OCCUPYING PESSARIES
The second pessary category is the space-filling pessary. These pessaries are used primarily to support severe POP, especially posthysterectomy vaginal vault prolapse. They have larger bases to support the vaginal apex or cervix; therefore, they are more difficult to insert and remove. When this pessary type is in place, sexual intercourse is not possible. Examples include the Gellhorn, donut, cube, and inflatable pessaries.
Gellhorn
The Gellhorn pessary is the most commonly used space-filling pessary. It has a broad base with a stem (FIGURE 6). The broad base supports the vaginal apex while the stem keeps the circular base from rotating and prevents pessary expulsion. The stem comes in long or short lengths. The concave base provides vaginal suction and keeps the pessary in place. The holes in the stem and base provide vaginal drainage. The Gellhorn pessary is useful for women with more advanced prolapse and less perineal support.
Insertion. Folding one side of the base to the stem, insert the Gellhorn pessary vertically inside the vagina. To facilitate insertion, separate the labia with the nondominant hand or depress the perineum with the index finger. Once the circular base is inside the vagina, push the pessary upward until the tip of the stem is just inside the vaginal introitus (FIGURE 7). Many medical illustrations inaccurately depict the Gellhorn pessary in a final placement that appears too high in the pelvis. This figure, which has the patient in a standing position, shows how low in the pelvis this space-filling pessary can sit in a patient with advanced prolapse.
Remove this pessary by gently pulling the stem while inserting the opposite hand beneath an edge of the pessary base to break the vaginal suction (Watch Vaginal pessaries: An instructional video).
Donut
The donut pessary is used for advanced prolapse because it fills a larger space. It is difficult to insert and remove because it is large, thick, and hollow (FIGURE 8).
Insertion. Insert it vertically and, once it is placed inside the vagina, rotate it to a horizontal position. A Kelly clamp can be used to grasp the pessary and facilitate removal.
Cube
The cube pessary supports third-degree uterine prolapse by holding the vaginal wall with suction (FIGURE 9). Because of the risk of vaginal erosion and lack of drainage in some designs, the cube pessary requires nightly removal and cleaning.
Insertion. Squeezing the pessary with the thumb, index, and middle fingers, insert the cube pessary at the vaginal apex.
Removal requires breaking the suction by placing a fingertip between the vaginal mucosa and the pessary and compressing the cube between the thumb and forefinger to remove. Gently tugging on the string also helps with removal.
Inflatable
This space-filling pessary is an air-filled ball that is inflated via an attached stem that also enables insertion and removal. The older Inflatoball pessary is made of latex, so its use is contraindicated in patients with latex allergy. Newer inflatable pessaries are silicone-based and consist of an air-filled donut, a stem with a valve, and an air pump (FIGURE 10). Some models also include a deflation key. The inflatable pessary comes in small, medium, large, and extra-large sizes. This pessary type must be removed and cleaned daily.
Insertion. Place the deflated pessary into the vagina. Move the ball-bearing valve within the stem (which controls the air flow) to a lateral projection on the side of the stem. To inflate, attach the inflation bulb. (Inflation typically requires 3 to 5 pumps of the bulb.) Move the ball bearing back into position to maintain the inflation, then detach the bulb. You can leave the stem outside the body or tuck it gently into the introitus (FIGURE 11).
INCONTINENCE PESSARIES
These devices are used specifically for SUI. The incontinence ring (FIGURE 12) and incontinence dish pessaries compress the urethra against the pubic symphysis. The knob is placed beneath the urethra, increasing the urethral closure pressure and thereby preventing urinary incontinence.
Related Article: Update on Urinary Incontinence Karen L. Noblett, MD, MAS, and Stephanie A. Jacobs, MD (December 2011)
CASE 1 CONCLUDED
Given that AC has early-stage POP and is sexually active, a space-occupying pessary is not the optimal choice. Instead, a ring pessary with support is fitted for her trial.
What side effects might a patient anticipate with pessary use?
Vaginal discharge and slight odor are common. Pessary removal and cleaning are usually adequate to eliminate them. Temporary discontinuation of pessary use may be warranted until symptoms subside. If these maneuvers do not resolve the issue, then the patient should be examined to rule out other sources of infection.
Vaginal bleeding. Bleeding from vaginal abrasion and ulceration could be caused by trauma from pessary removal or vaginal impingement. Evaluation is warranted for any vaginal bleeding.
Changes in urinary function. Less commonly, women using a pessary may notice changes in their urinary function. Many women with anterior or apical prolapse will have altered urine streams with slow or trickling flow and possible hesitation upon initiation of voiding.
Alternatively, pessary placement may instigate stress-type incontinence akin to that seen after prolapse surgery. Changing pessary size may alleviate this condition. Otherwise, these side effects may reduce a patient’s willingness to continue pessary use.
How can a patient optimize her use of a pessary?
A patient can remove the pessary on a periodic basis or try to use it continuously. If she cannot or will not remove the pessary, then she will need to come back for scheduled visits, as described in the sidebar, “Essential components of a successfully fitted pessary.” If she is able to remove the pessary on her own, then she can use the device as needed or remove it for intercourse (though it is not necessary). She must remove it weekly, at a minimum, however, to both clean the pessary and give the vaginal walls a “rest,” which can minimize the potential for abrasions or erosions
ESSENTIAL COMPONENTS OF A SUCCESSFULLY FITTED PESSARY
Patient assessment
Accurate selection and placement of a pessary requires appropriate examination and fitting, beginning with determination of the patient’s stage of prolapse and introitus. Key steps include:
– Examine the patient with an empty bladder in the lithotomy position
– Perform bimanual pelvic and speculum examination using a Sims speculum (or bivalve speculum broken in half) with the patient in a supine position
– Administer the Pelvic Organ Prolapse Quantification (POP-Q) exam
– Perform digital examination
– Assess vaginal atrophy, vaginal introitus, and vaginal width and length
– Evaluate pelvic floor muscle strength (Kegel squeeze).
Next, gauge the correct pessary size by approximating the number of fingerbreadths accommodated across the vaginal width.
Another method of estimating pessary size is to insert two fingers inside the vagina and estimate the distance between the posterior fornix and the posterior pubic symphysis (Watch Vaginal pessaries: An instructional video). An easy reference is to start with a size 3 or 4 ring pessary if the vaginal introitus is 1 to 2 fingerbreadths in width and the prolapse is stage II to III. If the vagina accommodates 3 to 4 fingerbreadths, or there is stage IV prolapse, use a Gellhorn pessary.
Here are the different types of pessaries and the most common sizes available. (Pessary sizes change in quarter-inch increments.)
In-office trial
Insert the pessary into the vagina using the dominant hand. Using the nondominant hand, separate the introitus and depress the perineal body. Apply a small amount of lubricant to the leading edge of the pessary.
After insertion, ask the patient to strain and cough, ambulate in the office, and void. Reexamine the patient to ensure that the pessary is still in the correct position and that placement has not shifted. Perform the cough leak test with the patient in a standing position and the pessary in place. Re-examine the patient while she is in a standing position. Use the largest pessary that is comfortable for her. Advise her to bring the pessary back to the office if it gets expelled.
This is a trial-and-error process; advise the patient of this. It may require a trial of several styles and sizes to find the right pessary fit. Once you find the correct size, document the final pessary size.
Follow-up
Schedule a follow-up appointment 1 to 2 weeks after insertion. Ask the patient whether she has experienced any discomfort, malodorous discharge, or vaginal bleeding. Also inquire about any changes in urinary habits or bowel movements and related complaints.
Remove the pessary and clean it with mild soap and water. Examine the vagina for pressure points, abrasions, ulcerations, and erosions.
Teach the patient how to remove, clean, and reinsert the pessary, and advise her to perform these tasks on a weekly basis.
Schedule a follow-up visit in 1 to 2 months, and another visit 6 to 12 months after that.
CASE 2. ADVANCED-STAGE POP
BD is an 82-year-old widow (G5P4014) with stage IV vaginal prolapse. She has noticed some scant blood staining on her clothing. She frequently voids small amounts of urine but never feels complete relief. She defecates normally.
Her medical history is significant for coronary artery disease with prior myocardial infarction, with multiple stent placements over the years. She has hypertension, reduced ejection fraction, and diabetes. She is morbidly obese and suffers from degenerative joint disease. She had a vaginal hysterectomy several years ago for benign indications.
Upon examination, BD’s prolapse is large, with excoriations and hyperkeratosis of the skin over the prolapse. It is easily reduced in the office.
What is the best pessary for this patient, and how should she be followed and counseled regarding ongoing care?
Since the failure rate for pessary usage increases with advancing prolapse stage, a space-occupying pessary is most appropriate to try initially. A trial with a support pessary could be useful to allow the excoriations to heal and provide a healthier vaginal environment. A Gellhorn pessary is commonly used. An inflatable pessary could be an alternative if the Gellhorn fails to stay in place. The cube pessary, known to cause more abrasions and erosions than other pessaries, is a poor choice given the state of the patient’s vaginal tissues at baseline.
Space-occupying pessaries are more difficult to insert and remove and have a higher risk of pain or trauma. Start with shorter time intervals between visits, eventually spacing them out for the patient’s convenience. The usual interval for follow-up is 3 to 4 months; longer intervals could be offered if the patient is reliable, adherent, and reports no complaints with pessary use.
Related Article: Update on pelvic floor dysfunction: Focus on urinary incontinence Alexis A. Dieter, MD, and Cindy L. Amundsen, MD (November 2013)
OUTCOMES
Only short- and medium-term outcomes for pessary use have been described in the literature. Short-term (2 months) satisfaction and continued use, along with resolution of prolapse, occurred in 92% of patients.7 Previous hysterectomy or prolapse surgery may influence the short-term success of pessary use.10
More than half of sexually active women achieved long-term use (up to 2 years), regardless of prolapse severity. Brincat and colleagues found that long-term pessary use (1 to 2 years) approached 60% in 132 women with both urinary incontinence and prolapse. Women being treated for POP were more likely to continue pessary use than women being treated for SUI.11 Age, parity, estrogen use, and sexual activity were characteristics also studied in pessary fitting. Neither sexual activity nor stage of prolapse was a contraindication to use of a pessary; long-term use was found to be acceptable in sexually active women.11
Successful fitting of a vaginal pessary has been associated with improvement in voiding, urinary and fecal urgency, and incontinence. A vaginal pessary is a viable nonsurgical option for the management of POP and urinary incontinence and remains an optimal minimally invasive approach to such disorders.
CASE 2 CONCLUDED
The patient returns to the clinic 1 month after the original insertion. The pessary is removed, and the vagina is inspected, with no abrasions or ulcerations found. The vaginal cavity and pessary are cleaned with a mild soap-and-water mixture. The pessary is lubricated and reinserted. This process is repeated 2 months later, with subsequent follow-up intervals doubled (up to 6 months between visits) when the patient has no complaints of discharge or odor.
- Colmer, WM Jr. Use of the pessary. Am J Obstet Gynecol. 1953;65(1):170–174.
- Culligan PJ. Nonsurgical management to pelvic organ prolapse. Obstet Gynecol. 2012;119(4):852–860.
- Nygaard IE, Heit M. Stress urinary incontinence. Obstet Gynecol. 2004;104(3):607–620.
- ACOG Committee on Practice Bulletins—Gynecology. ACOG Practice Bulletin No. 85: Pelvic organ prolapse. Obstet Gynecol. 2007;110(3):717–729.
- Clemons JL, Aguilar VC, Tillinghast TA, Jackson ND, Myers DL. Risk factors associated with an unsuccessful pessary fitting trial in women with pelvic organ prolapse. Am J Obstet Gynecol. 2004;190(2):345–350.
- Clemons JL, Brubaker L, Falk SJ. Vaginal pessary treatment of prolapse and incontinence. UpToDate. http://www.uptodate.com/contents/vaginal-pessary-treatment-of-prolapse-and-incontinence. Updated February 8, 2013. Accessed November 7, 2013.
- Mutone MF, Terry C, Hale DS, Benson JT. Factors which influence the short-term success of pessary management of pelvic organ prolapse. Am J Obstet Gynecol. 2005;193(1):89–94.
- Fernando RJ, Thakar R, Sultan AH, Shah SM, Jones PW. Effect of vaginal pessaries on symptoms associated with pelvic organ prolapse. Obstet Gynecol. 2006;108(1):93–99.
- Weber AM, Richter HE. Pelvic organ prolapse. Obstet Gynecol. 2005;106(3):615–634.
- Donnelly MJ, Powell-Morgan S, Olsen AL, et al. Vaginal pessaries for the management of stress and mixed incontinence. Int Urogynecol J Pelvic Floor Dysfunct. 2004;15(5):302–307.
- Brincat C, Kenton K, Fitzgerald MP, et al. Sexual activity predicts continued pessary use. Am J Obstet Gynecol. 2004;191(1):198–200.
![]()
Teresa Tam, MD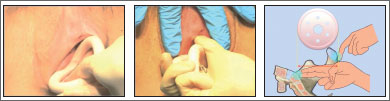
In this 15-minute video Dr. Tam demonstrates insertion and removal of the ring and Gellhorn pessaries and illustrates proper technique for estimating pessary size.
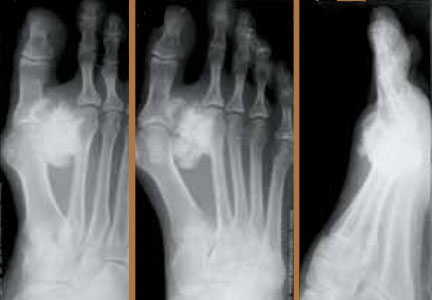
Parosteal Osteosarcoma of the 2nd Metatarsal
How well do you know your patients?

At a recent seminar for first-year medical students, I was struck by a statement made by a presenter—an attorney who advocates for health care for the underserved. “Know your patients,” she advised.
Know them well, she meant—where they live, who’s in their family and whom they live with, whether they have a job, and more. I was reminded that, while we family physicians pride ourselves on knowing our patients, in the bustle of daily practice there’s often no time for even a rudimentary social history.
Yet, recent research highlights just how important knowing our patients really is. Saul Weiner, MD, who has been studying what he calls “patient context” for years, has identified 10 domains that doctors should be aware of: access to care, social support, responsibilities, relationship with other health care providers, skills and abilities, emotional state, financial situation, cultural beliefs, spiritual beliefs, and attitude toward illness. Being truly patient-centered, he contends, means considering all 10 domains when we prescribe tests or treatments.
Weiner added to his body of research recently with a study in which he and his colleagues1 put hidden recorders in physician offices, and recorded doctor-patient conversations—more than 600 in all. In listening to the recordings, the researchers identified 548 red flags (eg, medication nonadherence, frequent ED visits, poor diabetes control) that the treating physician should have, but often failed to, follow up on.
Chart audits, conducted up to 9 months lat- er, highlight the importance of “patient context”: Among patients with red flags, 71% of those whose doctor directly addressed the problem showed improvement, vs 46% of those whose red flags went unacknowledged and unaddressed.
As we discussed these issues at the seminar I attended, a medical student with experience in the health care industry identified another important domain that doctors should be aware of: patients’ health insurance status. While some thought this might stigmatize patients with little or no coverage, others—including me—agreed that when ordering expensive tests and drugs, it is vital to know what the potential financial burden might be.
It’s yet another reminder of what FPs know, but often lose sight of: To be optimal healers, we must go beyond the medical problem at hand and get to know the patient in front of us.
REFERENCE
1. Weiner SJ, Schwartz A, Sharma G, et al. Patient-centered decision making and health care outcomes: an observational study. Ann Intern Med. 2013;158:573-579.
At a recent seminar for first-year medical students, I was struck by a statement made by a presenter—an attorney who advocates for health care for the underserved. “Know your patients,” she advised.
Know them well, she meant—where they live, who’s in their family and whom they live with, whether they have a job, and more. I was reminded that, while we family physicians pride ourselves on knowing our patients, in the bustle of daily practice there’s often no time for even a rudimentary social history.
Yet, recent research highlights just how important knowing our patients really is. Saul Weiner, MD, who has been studying what he calls “patient context” for years, has identified 10 domains that doctors should be aware of: access to care, social support, responsibilities, relationship with other health care providers, skills and abilities, emotional state, financial situation, cultural beliefs, spiritual beliefs, and attitude toward illness. Being truly patient-centered, he contends, means considering all 10 domains when we prescribe tests or treatments.
Weiner added to his body of research recently with a study in which he and his colleagues1 put hidden recorders in physician offices, and recorded doctor-patient conversations—more than 600 in all. In listening to the recordings, the researchers identified 548 red flags (eg, medication nonadherence, frequent ED visits, poor diabetes control) that the treating physician should have, but often failed to, follow up on.
Chart audits, conducted up to 9 months lat- er, highlight the importance of “patient context”: Among patients with red flags, 71% of those whose doctor directly addressed the problem showed improvement, vs 46% of those whose red flags went unacknowledged and unaddressed.
As we discussed these issues at the seminar I attended, a medical student with experience in the health care industry identified another important domain that doctors should be aware of: patients’ health insurance status. While some thought this might stigmatize patients with little or no coverage, others—including me—agreed that when ordering expensive tests and drugs, it is vital to know what the potential financial burden might be.
It’s yet another reminder of what FPs know, but often lose sight of: To be optimal healers, we must go beyond the medical problem at hand and get to know the patient in front of us.
REFERENCE
1. Weiner SJ, Schwartz A, Sharma G, et al. Patient-centered decision making and health care outcomes: an observational study. Ann Intern Med. 2013;158:573-579.
REFERENCE
1. Weiner SJ, Schwartz A, Sharma G, et al. Patient-centered decision making and health care outcomes: an observational study. Ann Intern Med. 2013;158:573-579.
Take family medicine in a new direction
Dr. Krebs’ letter, “Too little training in acute care” (J Fam Pract. 2013;62:598), left me wondering what skills family physicians would like to sharpen (but hadn’t been able to) in their residency programs. I realize that fam- ily medicine is so vast that no residency can be strong in every area of practice. But if FPs can deliver pediatric care, practice internal medicine, and provide obstetrical and gynecologic care on par with physicians trained in their respective specialties, why should our thirst for additional knowledge and training be curtailed?
The American Board of Family Medicine (ABFM) should initiate board-certified one- to 2-year fellowships in various fields, such as intensive care, infectious disease, ob-gyn, and endocrinology. It is time for the leaders of the ABFM to take family medicine in a new direction. Unfortunately, I do not see this happening.
Ajay Sodhi, MD
Columbus, Ohio
Abrupt onset of abdominal pain
Six days after being discharged from the hospital for treatment of acute pericarditis, a 49-year-old man came to our clinic for a follow-up appointment. The patient still had midsternal chest discomfort and dyspnea. He also reported new epigastric abdominal pain, which had begun 2 days earlier. The patient’s wife indicated that he’d had a low-grade fever since discharge, but the patient denied any chills, hematemesis, melanotic stools, diarrhea, or constipation. The patient’s medical history was significant for gastroesophageal reflux, hyperlipidemia, osteoarthritis, sleep apnea, and obesity. Along with newly prescribed indomethacin for the pericarditis (50 mg tid), he was also taking simvastatin. In addition, he occasionally took ibuprofen (800 mg/d) for osteoarthritis of his knee.
WHAT IS YOUR DIAGNOSIS?
HOW WOULD YOU TREAT THIS PATIENT?
Diagnosis: Duodenal perforation caused by indomethacin
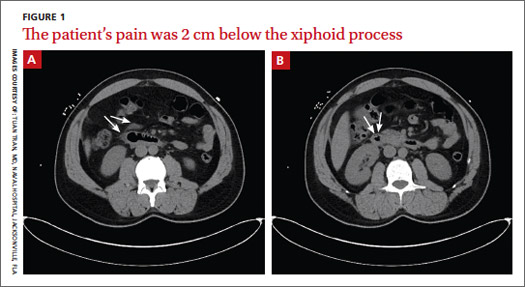
The CT scans revealed inflammation (arrows, FIGURE 1A) and thickening of the second and third portion of the duodenum and the pres- ence of extraluminal air at the site of the perforation (arrows, FIGURE 1B). There was also free fluid along the right paracolic gutter and into the pelvis. We diagnosed a small intestinal perforation in this patient, which was likely caused by a nonsteroidal anti-inflammatory drug (NSAID)-induced ulcer.
How NSAIDs affect the GI tract
NSAIDs inhibit cyclooxygenase (COX), the enzyme responsible for prostaglandin production. Specifically, the COX-1 enzyme is responsible for the production of prostaglandins in the gastrointestinal (GI) tract. Prostaglandins play an important role in protecting the GI mucosa. By inhibiting the synthesis of prostaglandins, the permeability of the GI tract is increased and the natural protective barrier of the mucosa is destroyed.1
Gastroduodenal damage is a well-known adverse effect of NSAIDs. Ulcers have been noted on upper endoscopy in regular NSAID users, and the risk of developing a symptomatic ulcer and complications increases with every year of regular NSAID use.2 Ulcers in the GI tract can be complicated by perforation.1
Patients will complain of sudden onset abdominal pain
Important clues in the patient history for a perforated GI tract include sudden onset of severe abdominal pain that may present initially as epigastric pain and progress to generalized abdominal pain that may radiate to one or both shoulders.3 Physical exam findings for a perforated GI tract may include abdominal tenderness and rigid abdomen; fever and tachycardia may also be present.3 Concern for possible abdominal perforation should be evaluated with a complete blood count, basic metabolic panel, and radiographic studies.3
The differential diagnosis of epigastric abdominal pain includes: pancreatitis, gastritis, gastric/duodenal ulcer, and obstruction. Elevated serum lipase levels or CT findings of pancreatic inflammation assist in the diagnosis of pancreatitis. Upper endoscopy is key to identifying cases of gastritis and ulcers in the GI tract. And an abdominal radiograph that shows dilated loops of bowel will confirm suspicions of obstruction.
Stabilize the patientAcute management of GI perforation begins with stabilizing the patient and determining the need for surgical intervention or medical management. Should a patient have a persistent air leak, surgery is the mainstay of treatment.3 If the perforation has healed, the patient should be medically managed.
Therapy may require placing a nasogastric tube and holding any oral intake until abdominal pain and perforation resolves. Medications in the acute treatment should include proton pump inhibitors (PPIs) and antibiotics. Antibiotics should cover for gram-negative enteric bacteria and anaerobes.
How to prevent NSAID-induced injury.
PPIs used with nonselective NSAIDs appear to reduce the likelihood of gastric ulceration.4 Similarly, H2-receptor antagonists (H2RA) also inhibit gastric acid secretion, and high doses of them significantly reduce the incidence of gastric ulcers.4 However, standard doses of HRAs have not been shown to be effective in reducing the risk of NSAID-induced gastric ulcers.4 Misoprostol, a synthetic prostaglandin E1 analogue that inhibits gastric secretion and protects the gastric mucosa is also an option; it has been used in combination with nonselective NSAIDs to counteract the increase in GI permeability.4
What about using COX-2 inhibitors instead? The COX-2 inhibitors have a lower risk of gastrointestinal tract injury.2 Gastric ulcers, GI bleeding, and complications from ulcers have been shown to be less common with COX-2 NSAIDs compared with nonselective NSAIDs.5 A review of the literature suggests that for patients with previous GI bleeding, COX-2 inhibitors are comparable to an NSAID paired with a PPI in preventing GI bleeding; pairing a COX-2 inhibitor with a PPI, however, appears to provide the greatest defense.2,4
Consider preventive steps. Patients at risk for complications are likely to benefit from the simultaneous use of prophylactic agents with NSAID therapy. Risk factors for NSAID-related GI complications include: a previous GI event; older age; simultaneous use of anticoagulants, corticosteroids, or other NSAIDs (including low-dose aspirin); high-dose NSAID therapy; and chronic debilitating disorders (especially cardiovascular disease).6
Our patient improved with medical management
Our patient was evaluated by general surgery during his hospital admission, but because he was stable—with a healing duodenal perforation—we opted to manage him medically. We started him on esomeprazole (40 mg bid) along with ciprofloxacin (500 mg bid) and metronidazole (500 mg tid) for the microperforation of the duodenum. The patient was also scheduled for an outpatient endoscopic evaluation.
1. Park SC, Chun HJ, Kang CD, et al. Prevention and management of non-steroidal anti-inflammatory drugs-induced small intestinal injury. World J Gastroenterol. 2011;17:4647-4653.
2. Ng SC, Chan F. NSAID-induced gastrointestinal and car- diovascular injury. Curr Opin Gastroenterol. 2010;26: 611-617.
3. Lawrence PF, Bell RM, TM, et al. Essentials of General Surgery. 4th ed. Baltimore, MD: Lipincott Williams & Wilkins; 2006. 4. Hooper, L, Brown TJ, Elliott R, et al. The effectiveness of five strategies for the prevention of gastrointestinal toxicity in-duced by non-steroidal anti-inflammatory drugs: systematic review. BMJ. 2004;329:948.
5. Rostom A, Muir K, Dube C, et al. Prevention of NSAID-related upper gastrointestinal toxicity: a meta-analysis of traditional NSAIDs with gastroprotection and COX-2-inhibitors. Drug Healthc Patient Saf. 2009;1:47-71.
6. Lanza FL, Chan FK, Quigley EM; Practice Parameters Committee of the American College of Gatroenterology. Guidelines for prevention of NSAID-related ulcer complications. Am J Gas- troenterol. 2009;104:728-738.
Six days after being discharged from the hospital for treatment of acute pericarditis, a 49-year-old man came to our clinic for a follow-up appointment. The patient still had midsternal chest discomfort and dyspnea. He also reported new epigastric abdominal pain, which had begun 2 days earlier. The patient’s wife indicated that he’d had a low-grade fever since discharge, but the patient denied any chills, hematemesis, melanotic stools, diarrhea, or constipation. The patient’s medical history was significant for gastroesophageal reflux, hyperlipidemia, osteoarthritis, sleep apnea, and obesity. Along with newly prescribed indomethacin for the pericarditis (50 mg tid), he was also taking simvastatin. In addition, he occasionally took ibuprofen (800 mg/d) for osteoarthritis of his knee.
WHAT IS YOUR DIAGNOSIS?
HOW WOULD YOU TREAT THIS PATIENT?
Diagnosis: Duodenal perforation caused by indomethacin
The CT scans revealed inflammation (arrows, FIGURE 1A) and thickening of the second and third portion of the duodenum and the pres- ence of extraluminal air at the site of the perforation (arrows, FIGURE 1B). There was also free fluid along the right paracolic gutter and into the pelvis. We diagnosed a small intestinal perforation in this patient, which was likely caused by a nonsteroidal anti-inflammatory drug (NSAID)-induced ulcer.
How NSAIDs affect the GI tract
NSAIDs inhibit cyclooxygenase (COX), the enzyme responsible for prostaglandin production. Specifically, the COX-1 enzyme is responsible for the production of prostaglandins in the gastrointestinal (GI) tract. Prostaglandins play an important role in protecting the GI mucosa. By inhibiting the synthesis of prostaglandins, the permeability of the GI tract is increased and the natural protective barrier of the mucosa is destroyed.1
Gastroduodenal damage is a well-known adverse effect of NSAIDs. Ulcers have been noted on upper endoscopy in regular NSAID users, and the risk of developing a symptomatic ulcer and complications increases with every year of regular NSAID use.2 Ulcers in the GI tract can be complicated by perforation.1
Patients will complain of sudden onset abdominal pain
Important clues in the patient history for a perforated GI tract include sudden onset of severe abdominal pain that may present initially as epigastric pain and progress to generalized abdominal pain that may radiate to one or both shoulders.3 Physical exam findings for a perforated GI tract may include abdominal tenderness and rigid abdomen; fever and tachycardia may also be present.3 Concern for possible abdominal perforation should be evaluated with a complete blood count, basic metabolic panel, and radiographic studies.3
The differential diagnosis of epigastric abdominal pain includes: pancreatitis, gastritis, gastric/duodenal ulcer, and obstruction. Elevated serum lipase levels or CT findings of pancreatic inflammation assist in the diagnosis of pancreatitis. Upper endoscopy is key to identifying cases of gastritis and ulcers in the GI tract. And an abdominal radiograph that shows dilated loops of bowel will confirm suspicions of obstruction.
Stabilize the patientAcute management of GI perforation begins with stabilizing the patient and determining the need for surgical intervention or medical management. Should a patient have a persistent air leak, surgery is the mainstay of treatment.3 If the perforation has healed, the patient should be medically managed.
Therapy may require placing a nasogastric tube and holding any oral intake until abdominal pain and perforation resolves. Medications in the acute treatment should include proton pump inhibitors (PPIs) and antibiotics. Antibiotics should cover for gram-negative enteric bacteria and anaerobes.
How to prevent NSAID-induced injury.
PPIs used with nonselective NSAIDs appear to reduce the likelihood of gastric ulceration.4 Similarly, H2-receptor antagonists (H2RA) also inhibit gastric acid secretion, and high doses of them significantly reduce the incidence of gastric ulcers.4 However, standard doses of HRAs have not been shown to be effective in reducing the risk of NSAID-induced gastric ulcers.4 Misoprostol, a synthetic prostaglandin E1 analogue that inhibits gastric secretion and protects the gastric mucosa is also an option; it has been used in combination with nonselective NSAIDs to counteract the increase in GI permeability.4
What about using COX-2 inhibitors instead? The COX-2 inhibitors have a lower risk of gastrointestinal tract injury.2 Gastric ulcers, GI bleeding, and complications from ulcers have been shown to be less common with COX-2 NSAIDs compared with nonselective NSAIDs.5 A review of the literature suggests that for patients with previous GI bleeding, COX-2 inhibitors are comparable to an NSAID paired with a PPI in preventing GI bleeding; pairing a COX-2 inhibitor with a PPI, however, appears to provide the greatest defense.2,4
Consider preventive steps. Patients at risk for complications are likely to benefit from the simultaneous use of prophylactic agents with NSAID therapy. Risk factors for NSAID-related GI complications include: a previous GI event; older age; simultaneous use of anticoagulants, corticosteroids, or other NSAIDs (including low-dose aspirin); high-dose NSAID therapy; and chronic debilitating disorders (especially cardiovascular disease).6
Our patient improved with medical management
Our patient was evaluated by general surgery during his hospital admission, but because he was stable—with a healing duodenal perforation—we opted to manage him medically. We started him on esomeprazole (40 mg bid) along with ciprofloxacin (500 mg bid) and metronidazole (500 mg tid) for the microperforation of the duodenum. The patient was also scheduled for an outpatient endoscopic evaluation.
1. Park SC, Chun HJ, Kang CD, et al. Prevention and management of non-steroidal anti-inflammatory drugs-induced small intestinal injury. World J Gastroenterol. 2011;17:4647-4653.
2. Ng SC, Chan F. NSAID-induced gastrointestinal and car- diovascular injury. Curr Opin Gastroenterol. 2010;26: 611-617.
3. Lawrence PF, Bell RM, TM, et al. Essentials of General Surgery. 4th ed. Baltimore, MD: Lipincott Williams & Wilkins; 2006. 4. Hooper, L, Brown TJ, Elliott R, et al. The effectiveness of five strategies for the prevention of gastrointestinal toxicity in-duced by non-steroidal anti-inflammatory drugs: systematic review. BMJ. 2004;329:948.
5. Rostom A, Muir K, Dube C, et al. Prevention of NSAID-related upper gastrointestinal toxicity: a meta-analysis of traditional NSAIDs with gastroprotection and COX-2-inhibitors. Drug Healthc Patient Saf. 2009;1:47-71.
6. Lanza FL, Chan FK, Quigley EM; Practice Parameters Committee of the American College of Gatroenterology. Guidelines for prevention of NSAID-related ulcer complications. Am J Gas- troenterol. 2009;104:728-738.
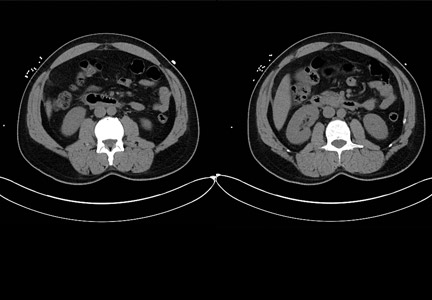
ONLINE EXCLUSIVE
Enter text here
Enter text here
Enter text here
Hospitalist Group Tackles Palliative Care; National Chain Explores Opportunities
At the Kaiser Permanente Medical Center in San Rafael, Calif., the 20 members of the hospitalist group were encouraged to study together in preparation for the October 2012 HPM boards. The group undertook weekly study sessions for the five months leading up to the exam. Sixteen hospitalists sat for the exam, along with oncologists, nephrologists, pulmonologists, and primary care physicians from the medical center.
All passed.
“For years, our hospitalist group has been doing actual rounding with the palliative care team on their own patients,” says Shideh Shadan, MD, the hospitalist group leader. “Everyone was on board with palliative care. It is now part of our daily care, and all we had to do was to sit down and study for the exam.”
Most of Kaiser’s HMO medical centers have designated interdisciplinary palliative care consultation teams. The one at San Rafael includes nurses, social workers, chaplains, and a part-time physician who is a hospitalist, Clay Angel, MD. Dr. Angel agrees that a cultural transformation has come about at Kaiser San Rafael through this collaboration. The two services are separate but closely connected.
“In hospital medicine, if you keep farming out what you do to specialists—if you’re not embracing palliative care as a hospitalist—you lose part of your practice,” he says.
Dr. Shadan says the study group “helped us to be more cohesive and more comfortable going to each other to ask for help. Palliative care is part of what we do—part of hospital medicine and of providing good care.”
Meanwhile, North Hollywood, Calif.-based IPC The Hospitalist Company, which is well-established in post-acute and long-term-care settings beyond the hospital walls, is now starting to explore palliative care approaches at the local level in a few of its 35 markets. Heather Zinzella-Cox, MD, who was part of a panel presentation on palliative care at HM13, is hospitalist practice group leader for IPC-Delaware. She also works part time as an associate medical director for a community hospice and helped to develop an inpatient palliative care team at a local community hospital.
“For me, as a post-acute hospitalist, every patient I see, I think about whether palliative care might benefit them,” says Dr. Zinzella-Cox, who is board certified in pain and in hospice and palliative medicine.
She says hospitalists need tools for identifying appropriate palliative care patients, along with training for how to communicate with them around goals of care, including simple language to help cue these conversations. She notes a “significant voltage drop” in information at the time of discharge, and the most careful discharge plans can fall apart in a hurry after the patient goes home.
IPC’s national practice group does not have a current policy or initiative for palliative care; however, there may be opportunities for further integrating palliative care with hospital medicine, says hospitalist Thomas Mathew, MD.
Larry Beresford is a freelance writer in San Francisco.
Two Major Studies Show Benefits of CAUTI Reduction Measures
Conscientious handling of urinary catheters is one of the main responsibilities hospitalists have in caring for patients with urological disorders—and, of course, anyone else with a urinary catheter.
Treatment of patients with urological disorders often involves special circumstances requiring physician discretion when deciding whether to remove a catheter or leave it in—removing it too soon could cause problems far worse than an infection. But two compelling studies, nationwide in scope, point to the benefits of systems that help ensure prompt removal of urinary catheters when appropriate.
One, published in 2010, was a review of interventional studies that used reminders to physicians or nurses that a urinary catheter was in use or stop orders to trigger catheter removal in hospitalized adults.
Researchers found that the rate of catheter-associated urinary tract infections, measured as episodes per 1,000 catheter-days, was reduced by 52% (P<0.001) with use of a reminder or stop order. The average duration of catheterization decreased by 37%. That amounted to 2.61 fewer days of catheterization per patient in the intervention compared to control groups.
In a 2013 study published in JAMA Internal Medicine, researchers surveyed infection prevention specialists at a sample of hospitals across the U.S.—and at all hospitals in Michigan, home to a statewide CAUTI-prevention initiative started in 2007. They asked about CAUTI prevention practices and standardized infection ratios on CAUTI.
Michigan hospitals, compared with those elsewhere in the U.S., more frequently participated in collaboratives to reduce healthcare-associated infection—94% to 67%. They also used bladder scanners to measure bladder volume more frequently (53% to 39%), along with catheter reminders or stop orders and/or nurse-initiated discontinuation (44% to 23%).
CAUTI rates in the state of Michigan saw a 25% reduction, significantly greater than the 6% decrease observed in the rest of the U.S.
Sanjay Saint, MD, MPH, a hospitalist and professor of internal medicine at the University of Michigan, says the study verifies how important it is for hospitalists to remove urinary catheters early.
"The data will set us free," he says. "It’s probably better to remove a few of these catheters prematurely and then have to reinsert them than keep all catheters in long past their due date." TH
Tom Collins is a freelance author in South Florida.
Geisinger Hospitalist, Chief Quality Officer Discusses Issues
Click here to listen to excerpts of our interview with John Bulger, DO, FACP, SFHM, hospitalist and chief quality officer at Geisinger Health System in Pennsylvania.
Click here to listen to excerpts of our interview with John Bulger, DO, FACP, SFHM, hospitalist and chief quality officer at Geisinger Health System in Pennsylvania.
Click here to listen to excerpts of our interview with John Bulger, DO, FACP, SFHM, hospitalist and chief quality officer at Geisinger Health System in Pennsylvania.
American Academy of Hospice and Palliative Medicine EVP Explains Hospitalists' Important Role in End-of-Life Planning
Click here for excerpts of our interview with Porter Storey, MD, executive vice president of the American Academy of Hospice and Palliative Medicine.
Click here for excerpts of our interview with Porter Storey, MD, executive vice president of the American Academy of Hospice and Palliative Medicine.
Click here for excerpts of our interview with Porter Storey, MD, executive vice president of the American Academy of Hospice and Palliative Medicine.