User login
Patient apps
Although many physicians would like to "prescribe" health apps to their patients, it can be a daunting endeavor. The exact number of medical and wellness apps currently available is unknown – I’ve seen numbers range from 40,000 to 97,000. Even the most astute physician will have difficulty navigating this ocean of options.
Fortunately, there are sites that do the legwork for us, including wellocracy.com, imedicalapps.com, medicalappjournal.com, medgadget.com, and mashable.com.
The Food and Drug Administration divides health apps into two categories: medical apps and health and wellness apps. Medical apps are those that turn your mobile device into a medical device; for example, allowing users to take a picture of a mole or to record their blood pressure and send it to their physician. By contrast, health and wellness apps help patients maintain healthy lifestyles and often employ self-tracking, such as tracking activity levels and calories consumed. The most popular of this latter type include weight loss and fitness apps.
As health care providers, we have a responsibility to encourage our patients to be actively engaged in their health. Recommending health and wellness apps that help patients track their activity can be powerful tools for patient engagement since tracking allows users see data that inspire them to set and reach goals.
Below are seven health and wellness apps that earn top scores from users and reviewers alike:
• WebMD: WebMD’s app receives high ratings for its simple, clean interface. Users choose among "lifestyle topics" that interest them, such as "fitness and exercise" or "parenting and family." Other key features include a symptom checker; first-aid tips; a list of local doctors, hospitals, and pharmacies; and a pill ID feature that lets users identify prescription drugs and OTC meds by shape, color, and imprint. Cost: Free.
• MyFitnessPal: This app consistently receives high scores from users striving to lose weight. With scores of cardio and strength training exercises and more than 2 million food entries including restaurant meals and packaged foods in its database, it makes both tracking one’s daily activity and calorie counting simple. Cost: Free.
• Fitocracy: What makes this fitness app so wildly popular among users? Its social gaming component. Not only do users track their activity levels, but they also connect with and compete against others. Similar to a video game, users earn points and badges that help them "level up" and reinforce their adherence to a healthy lifestyle. Cost: Free.
• MyQuit Coach: Consistently ranked one the top quit smoking apps, MyQuitCoach personalizes strategies to help users kick the habit. Users can commit to either quitting immediately or reducing smoking over time. Cost: Free.
• Sleep Cycle: By providing easy-to-read graphs, this app helps analyze the user’s sleep patterns and wakes them up during the lightest sleep phase, the natural way to wake up. Cost: $1.99
• MediSafe:Physicians know firsthand the difficulty of getting patients to adhere to taking their prescription medications. This easy-to-use app helps by providing reminders to patients when they need to take their medication and by sharing information with a "Med-Friend," which can be a family member or caretaker. The app also alerts users when it’s time for a refill. Cost: Free
• iTriage: This app uses location-based technology to help users find the nearest hospital or urgent care center. It is ideal for travelers, as well as people new to a neighborhood. Perhaps its best feature is its ability to provide an estimated wait time. Cost: Free
Wellness apps do not provide cures for illnesses, but they can help patients improve their overall health by encouraging them to make smarter, healthier lifestyle choices. And that’s something any physician can support.
Dr. Jeffrey Benabio is a practicing dermatologist and physician director of healthcare transformation at Kaiser Permanente in San Diego. Connect with him on Twitter @Dermdoc or drop him a line at [email protected].

Peppermint and menthol
Mentha piperita, better known as peppermint, is used worldwide in many ways. Its use for culinary and medical purposes dates back to the ancient Greek and Roman civilizations. Peppermint is used in numerous forms (i.e., oil, leaf, leaf extract, and leaf water), with the oil as the most versatile (Dermatitis 2010;21:327-9). Peppermint has long been known for its beneficial gastrointestinal effects, and it has a well-established record of antimicrobial, antifungal, and analgesic activity (Mills S., Bone K. Principles and Practice of Phytotherapy: Modern Herbal Medicine. [London: Churchill Livingstone, 2000, pp 507-13]; J. Environ. Biol. 2011;32:23-9).

Menthol (C10H20O) is a naturally occurring monocyclic terpene alcohol derived from Mentha piperita as well as other mint oils (Skin Therapy Lett. 2010;15:5-9), and has been associated with several health benefits. Recently, anticancer properties have been ascribed to menthol (Biochim. Biophys. Acta 2009;1792:33-8). This column will discuss recent findings regarding the actual or potential cutaneous benefits of peppermint and menthol.
Various Mentha species, including M. piperita, have exhibited significant antioxidant activity (Toxicol. Ind. Health. 2012;28:83-9; Nat. Prod. Commun. 2009;4:1107-12; Nat. Prod. Commun. 2009;4:535-42). In a 2010 study of the antioxidant activity of the essential oils of six popular herbs, including lavender (Lavendular angustifolia), peppermint (M. piperita), rosemary (Rosmarius officinalis), lemon (Citrus limon), grapefruit (C. paradise), and frankincense (Boswellia carteri), investigators found, in testing free radical-scavenging capacity and lipid peroxidation in the linoleic acid system, that peppermint essential oil exhibited the greatest radical-scavenging activity against the 2,2\'-azinobis-(3-ethylbenzothiazoline-6-sulfonic acid) ABTS radical (Nat. Prod. Res. 2010;24:140-51).
In 2010, Baliga and Rao showed that M. piperita and M. arvensis (wild mint) protected mice against gamma-radiation–induced morbidity and mortality. Specifically, M. piperita protected murine testes as well as gastrointestinal and hemopoietic systems (J. Cancer Res. Ther. 2010;6:255-62).
Anticancer activity
Investigations by Jain et al. into the molecular mechanisms supporting the anticarcinogenic potential of M. piperita leaf extracts on six human cancer cell lines (HeLa, MCF-7, Jurkat, T24, HT-29, MIAPaCa-2) in 2011 revealed that chloroform and ethyl acetate extracts dose- and time-dependently displayed anticarcinogenic activity leading to G1 cell cycle arrest and mitochondrial-mediated apoptosis among the cascade of effects. The investigators identified their findings as the first evidence of direct anticarcinogenic activity of Mentha leaf extracts and suggested that future work might focus on isolating active constituents as a foundation for mechanistic and translational studies leading to new anticancer drugs, alone or in combination, to prevent and treat human cancers (Int. J. Toxicol. 2011;30:225-36).
Topical benefits of menthol
In a recent examination of the antibacterial and antifungal properties, as well as speculated anti-inflammatory activity of menthol as a topical treatment for diaper dermatitis, investigators conducted a pilot clinical trial in a hospital setting. The study involved 84 neonates with diagnosed candidal diaper dermatitis who required no critical care or systemic antifungal and anti-inflammatory medications. The menthol group (n = 42) received topical clotrimazole and topically applied menthol drops and the control group (n = 42) received topical clotrimazole and a placebo. Thirty-five infants in each group completed the study. The researchers found that complete healing was shorter in the menthol group, with significant relief of erythema and pustules observed in this group. They concluded that topically-applied menthol may be an effective agent in the treatment of candidal diaper dermatitis (World J. Pediatr. 2011;7:167-70).
In 2011, Qiu et al. showed, through various assays, that menthol, in low concentrations, could significantly suppress the expression of alpha-hemolysin, enterotoxins A and B, and toxic shock syndrome toxin 1 in Staphylococcus aureus. The investigators concluded that menthol may warrant inclusion in the armamentarium against S. aureus when combined with beta-lactam antibiotics, which, at subinhibitory concentrations, can actually augment S. aureus toxin secretion. They added that menthol may also have possible uses in novel anti-virulence drugs (Appl. Microbiol. Biotechnol. 2011;90:705-12). It should be noted that menthol is considered safe and effective, with concentrations up to 16% approved in OTC external products by the Food and Drug Administration (J. Am. Acad. Dermatol. 2007;57:873-8).
Pruritus, TRPM8, and melanoma
Topically applied menthol, in concentrations of 1%-3%, is often used to treat pruritus, particularly in the elderly (Skin Therapy Lett. 2010;15:5-9). In addition, recent evidence suggests that the presence of menthol can facilitate penetration of other agents in topical products (Int. J. Toxicol. 2001;20 Suppl 3:61-73; J. Am. Acad. Dermatol. 2007;57:873-8). Patel and Yosipovitch suggest that elderly patients who report diminished pruritus with cooling may stand to benefit from menthol-containing topical therapies (J. Am. Acad. Dermatol. 2007;57:873-8; Skin Therapy Lett. 2010;15:5-9). Interestingly, menthol, via the transient receptor potential melastatin subfamily 8 (TRPM8) receptor, a member of a family of excitatory ion channels, engenders the same cooling sensation as low temperature, though menthol is not linked to a reduction in skin temperature (J. Am. Acad. Dermatol. 2007;57:873-8; Skin Therapy Lett. 2010;15:5-9).
Although the exact mechanism by which menthol exerts its antipruritic and analgesic effects has yet to be determined, the discovery that the TRPM8 is its underlying receptor is proving to be significant, particularly in understanding the cooling effect of the botanical (J. Am. Acad. Dermatol. 2007;57:873-8). There are also indications that menthol has therapeutic potential for melanoma. Specifically, melanoma expresses TRPM8 receptors, the activation of which inhibits melanoma viability. Menthol appears to mediate this response through an influx of extracellular calcium ions (Am. J. Physiol. Cell Physiol. 2008;295:C296-301; Am. J. Physiol. Cell Physiol. 2008;295:C293-5).
Peppermint oil
In 2003, Schuhmacher et al. investigated the virucidal effect of peppermint oil and found that it had a direct effect against herpes simplex virus type 1 (HSV-1) and herpes simplex virus type 2 (HSV-2) as well as an acyclovir-resistant HSV-1 strain. The investigators concluded, noting the lipophilic nature of peppermint oil, that it might be an appropriate topical treatment for recurrent herpes outbreaks (Phytomedicine 2003;10:504-10).
Because of its flavor, aroma, and cooling qualities, peppermint oil is used in a wide range of products, including cosmeceuticals, personal hygiene products (e.g., bath preparations, mouthwashes, toothpastes, and topical formulations), foods, pharmaceutical products, and aromatherapy. Topical indications include pruritus, irritation, and inflammation. Peppermint oil can act as a skin sensitizer, though, particularly in impaired and sensitive skin (Dermatitis 2010;21:327-9). Although peppermint oil has been reported to be a sensitizer in isolated cases, peppermint oil 8% was not found to be a sensitizer in a recent test using a maximization protocol and the various forms of peppermint (i.e., oil, extract, leaves, and water) are considered to be safe in cosmetic formulations. In rinse-off products, peppermint oil is used in concentrations up to 3% and up to 0.2% in leave-on formulations (Int. J. Toxicol. 2001;20 Suppl 3:61-73).
Conclusion
Peppermint and menthol, its naturally occurring monocyclic terpene alcohol derivative, have long been used for medical purposes. Contemporary practice and continuing research continue to support various uses of M. piperita in the medical armamentarium, with specific and additional uses continually being found in the dermatologic realm.
Dr. Baumann is chief executive officer of the Baumann Cosmetic & Research Institute in Miami Beach. She founded the cosmetic dermatology center at the University of Miami in 1997. Dr. Baumann wrote the textbook "Cosmetic Dermatology: Principles and Practice" (McGraw-Hill, April 2002), and a book for consumers, "The Skin Type Solution" (Bantam, 2006). She has contributed to the Cosmeceutical Critique column in Skin & Allergy News since January 2001 and joined the editorial advisory board in 2004. Dr. Baumann has received funding for clinical grants from Allergan, Aveeno, Avon Products, Galderma, Mary Kay, Medicis Pharmaceuticals, Neutrogena, Philosophy, Stiefel, Topix Pharmaceuticals, and Unilever.
Mentha piperita, better known as peppermint, is used worldwide in many ways. Its use for culinary and medical purposes dates back to the ancient Greek and Roman civilizations. Peppermint is used in numerous forms (i.e., oil, leaf, leaf extract, and leaf water), with the oil as the most versatile (Dermatitis 2010;21:327-9). Peppermint has long been known for its beneficial gastrointestinal effects, and it has a well-established record of antimicrobial, antifungal, and analgesic activity (Mills S., Bone K. Principles and Practice of Phytotherapy: Modern Herbal Medicine. [London: Churchill Livingstone, 2000, pp 507-13]; J. Environ. Biol. 2011;32:23-9).
Menthol (C10H20O) is a naturally occurring monocyclic terpene alcohol derived from Mentha piperita as well as other mint oils (Skin Therapy Lett. 2010;15:5-9), and has been associated with several health benefits. Recently, anticancer properties have been ascribed to menthol (Biochim. Biophys. Acta 2009;1792:33-8). This column will discuss recent findings regarding the actual or potential cutaneous benefits of peppermint and menthol.
Various Mentha species, including M. piperita, have exhibited significant antioxidant activity (Toxicol. Ind. Health. 2012;28:83-9; Nat. Prod. Commun. 2009;4:1107-12; Nat. Prod. Commun. 2009;4:535-42). In a 2010 study of the antioxidant activity of the essential oils of six popular herbs, including lavender (Lavendular angustifolia), peppermint (M. piperita), rosemary (Rosmarius officinalis), lemon (Citrus limon), grapefruit (C. paradise), and frankincense (Boswellia carteri), investigators found, in testing free radical-scavenging capacity and lipid peroxidation in the linoleic acid system, that peppermint essential oil exhibited the greatest radical-scavenging activity against the 2,2\'-azinobis-(3-ethylbenzothiazoline-6-sulfonic acid) ABTS radical (Nat. Prod. Res. 2010;24:140-51).
In 2010, Baliga and Rao showed that M. piperita and M. arvensis (wild mint) protected mice against gamma-radiation–induced morbidity and mortality. Specifically, M. piperita protected murine testes as well as gastrointestinal and hemopoietic systems (J. Cancer Res. Ther. 2010;6:255-62).
Anticancer activity
Investigations by Jain et al. into the molecular mechanisms supporting the anticarcinogenic potential of M. piperita leaf extracts on six human cancer cell lines (HeLa, MCF-7, Jurkat, T24, HT-29, MIAPaCa-2) in 2011 revealed that chloroform and ethyl acetate extracts dose- and time-dependently displayed anticarcinogenic activity leading to G1 cell cycle arrest and mitochondrial-mediated apoptosis among the cascade of effects. The investigators identified their findings as the first evidence of direct anticarcinogenic activity of Mentha leaf extracts and suggested that future work might focus on isolating active constituents as a foundation for mechanistic and translational studies leading to new anticancer drugs, alone or in combination, to prevent and treat human cancers (Int. J. Toxicol. 2011;30:225-36).
Topical benefits of menthol
In a recent examination of the antibacterial and antifungal properties, as well as speculated anti-inflammatory activity of menthol as a topical treatment for diaper dermatitis, investigators conducted a pilot clinical trial in a hospital setting. The study involved 84 neonates with diagnosed candidal diaper dermatitis who required no critical care or systemic antifungal and anti-inflammatory medications. The menthol group (n = 42) received topical clotrimazole and topically applied menthol drops and the control group (n = 42) received topical clotrimazole and a placebo. Thirty-five infants in each group completed the study. The researchers found that complete healing was shorter in the menthol group, with significant relief of erythema and pustules observed in this group. They concluded that topically-applied menthol may be an effective agent in the treatment of candidal diaper dermatitis (World J. Pediatr. 2011;7:167-70).
In 2011, Qiu et al. showed, through various assays, that menthol, in low concentrations, could significantly suppress the expression of alpha-hemolysin, enterotoxins A and B, and toxic shock syndrome toxin 1 in Staphylococcus aureus. The investigators concluded that menthol may warrant inclusion in the armamentarium against S. aureus when combined with beta-lactam antibiotics, which, at subinhibitory concentrations, can actually augment S. aureus toxin secretion. They added that menthol may also have possible uses in novel anti-virulence drugs (Appl. Microbiol. Biotechnol. 2011;90:705-12). It should be noted that menthol is considered safe and effective, with concentrations up to 16% approved in OTC external products by the Food and Drug Administration (J. Am. Acad. Dermatol. 2007;57:873-8).
Pruritus, TRPM8, and melanoma
Topically applied menthol, in concentrations of 1%-3%, is often used to treat pruritus, particularly in the elderly (Skin Therapy Lett. 2010;15:5-9). In addition, recent evidence suggests that the presence of menthol can facilitate penetration of other agents in topical products (Int. J. Toxicol. 2001;20 Suppl 3:61-73; J. Am. Acad. Dermatol. 2007;57:873-8). Patel and Yosipovitch suggest that elderly patients who report diminished pruritus with cooling may stand to benefit from menthol-containing topical therapies (J. Am. Acad. Dermatol. 2007;57:873-8; Skin Therapy Lett. 2010;15:5-9). Interestingly, menthol, via the transient receptor potential melastatin subfamily 8 (TRPM8) receptor, a member of a family of excitatory ion channels, engenders the same cooling sensation as low temperature, though menthol is not linked to a reduction in skin temperature (J. Am. Acad. Dermatol. 2007;57:873-8; Skin Therapy Lett. 2010;15:5-9).
Although the exact mechanism by which menthol exerts its antipruritic and analgesic effects has yet to be determined, the discovery that the TRPM8 is its underlying receptor is proving to be significant, particularly in understanding the cooling effect of the botanical (J. Am. Acad. Dermatol. 2007;57:873-8). There are also indications that menthol has therapeutic potential for melanoma. Specifically, melanoma expresses TRPM8 receptors, the activation of which inhibits melanoma viability. Menthol appears to mediate this response through an influx of extracellular calcium ions (Am. J. Physiol. Cell Physiol. 2008;295:C296-301; Am. J. Physiol. Cell Physiol. 2008;295:C293-5).
Peppermint oil
In 2003, Schuhmacher et al. investigated the virucidal effect of peppermint oil and found that it had a direct effect against herpes simplex virus type 1 (HSV-1) and herpes simplex virus type 2 (HSV-2) as well as an acyclovir-resistant HSV-1 strain. The investigators concluded, noting the lipophilic nature of peppermint oil, that it might be an appropriate topical treatment for recurrent herpes outbreaks (Phytomedicine 2003;10:504-10).
Because of its flavor, aroma, and cooling qualities, peppermint oil is used in a wide range of products, including cosmeceuticals, personal hygiene products (e.g., bath preparations, mouthwashes, toothpastes, and topical formulations), foods, pharmaceutical products, and aromatherapy. Topical indications include pruritus, irritation, and inflammation. Peppermint oil can act as a skin sensitizer, though, particularly in impaired and sensitive skin (Dermatitis 2010;21:327-9). Although peppermint oil has been reported to be a sensitizer in isolated cases, peppermint oil 8% was not found to be a sensitizer in a recent test using a maximization protocol and the various forms of peppermint (i.e., oil, extract, leaves, and water) are considered to be safe in cosmetic formulations. In rinse-off products, peppermint oil is used in concentrations up to 3% and up to 0.2% in leave-on formulations (Int. J. Toxicol. 2001;20 Suppl 3:61-73).
Conclusion
Peppermint and menthol, its naturally occurring monocyclic terpene alcohol derivative, have long been used for medical purposes. Contemporary practice and continuing research continue to support various uses of M. piperita in the medical armamentarium, with specific and additional uses continually being found in the dermatologic realm.
Dr. Baumann is chief executive officer of the Baumann Cosmetic & Research Institute in Miami Beach. She founded the cosmetic dermatology center at the University of Miami in 1997. Dr. Baumann wrote the textbook "Cosmetic Dermatology: Principles and Practice" (McGraw-Hill, April 2002), and a book for consumers, "The Skin Type Solution" (Bantam, 2006). She has contributed to the Cosmeceutical Critique column in Skin & Allergy News since January 2001 and joined the editorial advisory board in 2004. Dr. Baumann has received funding for clinical grants from Allergan, Aveeno, Avon Products, Galderma, Mary Kay, Medicis Pharmaceuticals, Neutrogena, Philosophy, Stiefel, Topix Pharmaceuticals, and Unilever.

ATX-101: ‘You’re gonna like your new chin’
ISTANBUL – Both clinicians and patients gave favorable marks to a novel injectable pharmacologic treatment for removal of unwanted submental fat – the unsightly double chin – in two phase III randomized trials presented at the annual congress of the European Academy of Dermatology and Venereology.
The investigational chin-fat buster, known as ATX-101, is a proprietary purified synthetic form of deoxycholic acid. Upon injection directly into the submental fat, ATX-101 lyses adipocytes by disrupting their cell membranes.
There is an unmet need for a rigorously studied prescription product for nonsurgical treatment of excess submental fat. Not everyone with a double chin is interested in or a good candidate for the established surgical procedures, observed Dr. Berthold Rzany, a dermatologist at Charité University Hospital, Berlin, who presented a 363-patient, randomized, placebo-controlled phase III trial at the meeting. Participants had to have a body mass index no higher than 30 kg/m2, dissatisfaction with the appearance of their submental area, and a physician rating of moderate to severe submental fat. Three-quarters of the subjects were women, with a mean age of 46 years and a mean BMI of 25.7 kg/m2.
One of the two primary efficacy endpoints required at least a 1-point improvement on the 0- to 4-point Clinician-Reported Submental Fat Rating Scale as assessed 12 weeks after the final treatment. This was achieved in 59% of patients randomized to ATX-101 at a dose of 1mg/cm2 and 65% at 2 mg/cm2, both significantly higher rates than the 23% in placebo-treated controls.
The other primary endpoint required a high level of patient satisfaction with the appearance of their face and chin after treatment as expressed in a Subject Self-Rating Scale score of 4 or more on the 0-6 scale. This endpoint was achieved in 53% of patients treated with ATX-101 at 1 mg/cm2, 66% who received the agent at 2 mg/cm2, and 29% of the placebo group.
ATX-101-treated patients were also significantly more likely to report perceived improvement in the visual and psychological impact of their submental fat. For example, 74% of patients who received ATX-101 at 1 mg/cm2 and 80% at 2 mg/cm2 reported improved definition between their chin and neck, compared with baseline and compared with 28% of placebo-treated controls. In addition, 32% of patients who received the lower dose of ATX-101 and 39% who got the higher dose characterized their submental fat as "a great deal better," compared with baseline, as did a mere 7% of controls.
Also, patients who received ATX-101 reported 12 weeks post treatment that they looked less overweight and were less bothered by and self-conscious about their submental fat, compared with controls.
Treatment-emergent induration, redness, bruising, numbness, and/or swelling variously occurred in one-third to two-thirds of ATX-101 recipients. All of these adverse events were more common than in placebo-treated controls. However, the events were transient and mostly mild or moderate in intensity. The exception was injection site pain, which occurred in roughly 80% of ATX-101-treated patients and was mostly moderate to severe, although it lasted a median of only 1 day, according to Dr. Rzany.
The ATX-101 treatment regimen entails up to 50 2-mL fixed-dose subcutaneous injections 1 cm apart per treatment session. Up to four treatment sessions were permitted, each separated by a minimum of 4 weeks.
In a separate presentation, Dr. Benjamin Ascher reported on 360 randomized patients who participated in the other phase III clinical trial. The two studies had the same design and endpoints.
An improvement of at least 1 point on the Clinician-Reported Submental Fat Rating Scale occurred in 58% of patients randomized to ATX-101 at the 1 mg/cm2 dose, 62% of those who received the higher dose, and 35% on placebo. Moreover, 68% of patients who got ATX-101 at 1 mg/cm2 were satisfied with their resultant appearance as reflected in a Subject Self-Rating Scale score of at least 4. So were 65% of those who received the higher dose and 29% of placebo-treated controls. As in the previously mentioned study, indices of self-image and psychological well being were also improved following the aesthetic therapy. Treatment-related adverse events were mostly transient and mild to moderate in intensity, according to Dr. Ascher, who is in the private practice of aesthetic surgery in Paris.
Both phase III studies were supported by Bayer HealthCare and KYTHERA Biopharmaceuticals. Dr. Rzany and Dr. Ascher serve as advisers to the companies.
AT THE EADV CONGRESS
Major finding: Patients with excess submental fat who received treatment using a novel subcutaneously injectable agent for the nonsurgical reduction of double chins were significantly more likely to be satisfied with their chin’s appearance afterward than were placebo-treated controls.
Data source: The two studies included a total of 723 patients with moderate to severe excess submental fat.
Disclosures: The studies were funded by Bayer HealthCare and KYTHERA Biopharmaceuticals. The presenters have received research grants from and serve as advisers to the companies.
Prepare for ICD-10!
As the date for implementing ICD-10 gets closer, consulting firms send daily offers to help us adapt to the new diagnostic regime. As a service to the profession, Under My Skin will provide periodic updates to save you consulting fees.
In an earlier column, you learned about new codes like injury from burning water skis. We also covered codes for envenomation by Gila monsters, both unintentional and intentional. You should know that these are already available under ICD-9. No need to wait till next year to use them!
ICD-9-CM E905.0: Venomous snakes and lizards causing poisoning and toxic reactions. These include the following: cobra, copperhead snake, coral snake, fer-de-lance snake, Gila monster, krait, mamba, viper, and several others. Do NOT use this code for bites by nonvenomous snakes and lizards. (That may come back to bite you ... Sorry!)
Anyone who can define a fer-de-lance or a krait is gets extra credit (but no extra payment). If you can either identify a mamba, or dance it, good for you!
ICD-10 naturally amplifies this inadequate taxonomy:
• T63.111 – Toxic effect of venom of Gila monster, accidental (unintentional)
• T63.112 – Toxic effect of venom of Gila monster, intentional (self-harm)
• T63.113 – Toxic effect of venom of Gila monster, assault
• T63.114 – Toxic effect of venom of Gila monster, undetermined
Questions: For the new "assault" code, was the Gila monster the assailant or was its owner? Does "undetermined" mean you don’t really know how you got bitten (come on, was that really an accident – weren’t you petting the Gila kind of roughly?) or that you didn’t determine whether it actually was a Gila monster (because it ran away so fast that that it could have been a marmoset).
There are other ICD-9 codes you can already use (right now!) I recently got a 6-page EMR from a referring clinic (you get those, don’t you?) listing one of the patient’s 14 diagnoses as E968.2: Assault by striking by blunt or thrown object.
This opened my eyes to:
• E968.5 – Assault by transport vehicle.
• E968.3 – Assault by hot liquid.
• E968.1 – Assault by pushing from a high place. (Questions: How high? How hot? Transporting what?)
While on the subject of injuries in high places, you might consider:
• E840.1 – Accident by powered aircraft at takeoff or landing.
Again, ICD-10 will be more comprehensive.
Looking at injury from burning water skis, we find:
• V91.07 – Burn due to water-skis on fire.
Within which are:
• V91.07XA ... initial encounter.
• V91.07XD ... subsequent encounter.
• V91.07XS ... sequela.
This is not all! V91.07 has many other subcategories:
• V91.0 – Burn due to watercraft on fire.
• V91.01 – Burn due to passenger ship on fire.
• V91.02 – Burn due to fishing boat on fire.
• V91.05 – Burn due to canoe or kayak on fire.
But wait! There is also V91.1 – Crushed between watercraft and other watercraft or other object due to collision. Within which are:
• V91.10 – Crushed between merchant ship and other watercraft or other object due to collision.
• V91.12 – Crushed between fishing boat and other watercraft or other object due to collision.
• V91.15 – Crushed between canoe or kayak and other watercraft or other object due to collision.
Each of these of course includes subcodes for: initial encounter, subsequent encounter, and sequela. (Conversion hysteria caused by paranoid fear of rampaging kayaks?)
The practical advantages to learning all this extend beyond the office. Suppose you’re fishing in a rowboat on a lazy Sunday afternoon when a kayaker waving a flaming blowtorch careens toward you full tilt and you leap overboard. When the Coast Guard pulls you out, you can shout, "V91.05! V91.15!"
In our next installment, we will take up other subsets of external causes of morbidity, including:
• W20 – struck by thrown, projected, or falling object such as:
• W20.0 – Falling object in cave (initial encounter, subsequent encounter, sequela).
• W20.1 – Struck by object due to collapse of building (ditto).
• W28 – Contact with powered lawn mower.
• W60 – Contact with nonvenomous plant thorns and spines and sharp leaves.
Master these. Future columns will cover injuries caused by forces of nature, injuries caused by supernatural means (such as witchcraft, exorcism), assassination (first episode, second episode, sequela), and acute psychosis caused by marauding ICD-10 consultants.
Dr. Rockoff practices dermatology in Brookline, Mass. He is on the clinical faculty at Tufts University School of Medicine, Boston, and has taught senior medical students and other trainees for 30 years. Dr. Rockoff has contributed to the Under My Skin column in Skin & Allergy News since January 2002.

BEST PRACTICES IN: The Use of XERESE® (acyclovir and hydrocortisone) Cream 5%/1% to Help Reduce the Likelihood of Progression to Ulcerative Cold Sores
Medical Education Library
A supplement to Skin & Allergy News. This supplement was sponsored by Medicis, a division of Valeant Pharmaceuticals.

- Herpes Simplex Virus-1: Prevalence and Diagnosis
- HSL Treatment
- XERESE® (acyclovir and hydrocortisone) Cream 5%/1%
- Summary and Conclusions
- INDICATION
- IMPORTANT SAFETY INFORMATION
Faculty/Faculty Disclosure
Joseph Fowler, MD
University of Louisville
Louisville, Kentucky
Dr. Fowler reported that he is a member of the speakers’ bureau for Valeant Pharmaceuticals and received compensation from Valeant for his assistance in developing the content of this article.
LINKS: Click Here for PDF.
Copyright © by Frontline Medical Communications Inc.
Medical Education Library
A supplement to Skin & Allergy News. This supplement was sponsored by Medicis, a division of Valeant Pharmaceuticals.
- Herpes Simplex Virus-1: Prevalence and Diagnosis
- HSL Treatment
- XERESE® (acyclovir and hydrocortisone) Cream 5%/1%
- Summary and Conclusions
- INDICATION
- IMPORTANT SAFETY INFORMATION
Faculty/Faculty Disclosure
Joseph Fowler, MD
University of Louisville
Louisville, Kentucky
Dr. Fowler reported that he is a member of the speakers’ bureau for Valeant Pharmaceuticals and received compensation from Valeant for his assistance in developing the content of this article.
LINKS: Click Here for PDF.
Copyright © by Frontline Medical Communications Inc.
Impact of Physician Facecards
The patient‐physician relationship is fundamental to safe and effective care. Hospital settings present unique challenges to this partnership, including the lack of a prior relationship for hospital‐based physicians, rapid pace of clinical care, and dynamic nature of inpatient medical teams. Prior studies document that a majority of hospitalized patients are unable to correctly identify their physicians or nurses, and patients in teaching hospitals have difficulty understanding their physicians' level of training.[1, 2, 3, 4] Acknowledging these deficits, professional societies and the Accreditation Council for Graduate Medical Education (ACMGE) have issued policies stating that patients and caregivers need to know who is responsible at every point during patient care.[5, 6] These policies do not, however, make recommendations on methods to achieve better understanding.
Simple interventions improve patients' ability to correctly identify the names and roles of their hospital physicians. Maniaci and colleagues found that patients were better able to identify attending physicians when their names were written on the dry‐erase board in the room.[7] Arora and colleagues asked hospital physicians to give facecards, which included their picture and a description of their role, to patients.[8] Patients were more likely to correctly identify 1 physicians, but, surprisingly, less likely to understand physicians' roles. In a similar study, Francis and colleagues placed photographs with names of the attending and resident physicians on the wall in patient rooms.[9] Patients who had photographs of their physicians on the wall were more likely to correctly identify physicians on their team compared with patients who had no photographs. Additionally, patients who were able to identify more physicians rated satisfaction with physicians higher in 2 of 6 survey questions used. However, the study was limited by the use of a nonvalidated instrument to assess patient satisfaction and the use of an intermediate outcome (ie, ability to identify physicians) as the independent variable rather than the intervention itself (ie, physician photographs).
Beyond satisfaction, lack of familiarity may negatively impact patients' trust and agreement with hospital physicians. Trust and agreement are important predictors of adherence to recommended treatment in outpatient settings[10, 11, 12, 13, 14, 15, 16, 17, 18] but have not been adequately evaluated in hospital settings. Therefore, we sought to pilot the use of physician facecards and assess their potential impact on patients' knowledge of physicians' names and roles as well as patient satisfaction, trust, and agreement with physicians.
METHODS
Setting and Study Design
We performed a cluster randomized controlled trial at Northwestern Memorial Hospital (NMH), an 897‐bed tertiary‐care teaching hospital in Chicago, Illinois. One of 2 similar hospitalist service units and 1 of 2 similar teaching‐service units were randomly selected to implement the use of physician facecards. General medical patients were admitted to the study units by NMH bed‐assignment personnel subject to unit bed availability. No other criteria (eg, diagnosis, severity of illness, or source of patient admission) were used in patient assignment. Each unit consisted of 30 beds, with the exception of 1 hospitalist unit, which had 23. As a result of a prior intervention, physicians were localized to care for patients on specific units.[19] Hospitalist units were each staffed by hospitalists who worked in 7‐day rotations without the assistance of residents or midlevel providers. Teaching units were staffed by physician teams consisting of 1 attending, 1 senior resident, 1 intern, and 1 or 2 third‐year medical students. No fourth‐year students (ie, acting interns) rotated on these services during the study period. Housestaff worked in 4‐week rotations, and attending physicians on the teaching service worked in 2‐week rotations.
Patient rooms included a whiteboard facing the patient with a template prompting insertion of physician name(s). Nurses had the primary responsibility for completing information on the whiteboards.
Physician Facecard
We created draft physician facecards featuring pictures of physicians and descriptions of their roles. We used Lexile analysis, a widely used measure of reading difficulty, to improve readability in an iterative fashion.[20, 21] We then sought feedback at hospitalist and resident meetings. Specifically, we asked for suggested revisions to content and recommendations on reliable methods to deliver facecards to patients. Teaching physicians felt strongly that each team member should be listed and shown on 1 card, which would fit easily into a lab‐coat pocket. We similarly engaged the NMH Patient and Family Advisory Council to seek recommended revisions to content and delivery of the facecards. The Council consists of 18 patient and caregiver members who meet regularly to provide input on hospital programs and proposals. Council members felt strongly that physicians should deliver the cards themselves during their initial introduction, rather than having patients receive cards by other means (eg, as part of unit orientation materials delivered by nonphysician staff members). We incorporated feedback from these stakeholder groups into a final version of the physician facecard and method for delivery (Figure 1).

We implemented the use of facecards from May to June 2012. Physicians on intervention units were informed of the study via email, and one of the co‐investigators (T.C.) distributed a supply of facecards to these physicians at the start of each rotation. This distribution was performed in person, and physicians were instructed to provide a facecard to each new patient during their first encounter. We also placed facecards in easily visible cardholders at the nurses' station on intervention units. Reminder emails were sent once each week to reinforce physician delivery of facecards.
Data Collection and Measures
Each weekday during the study period, we randomly selected patients for structured interviews in the afternoon of their second or third hospital day. We did not conduct interviews on the first day of physicians' rotations and excluded patients whose preferred language was not English and those disoreinted to person, place, or time.
Patients were asked to name the physician(s) primarily responsible for their hospital care and to state the role of each physician they identified. We documented receipt of facecards if one was viewed during the interview and by asking patients if they had received one. We also documented whether 1 correct physician names were written on the whiteboard in the patients' rooms. We used questions from the Hospital Consumer Assessment of Healthcare Providers and Systems (HCAHPS) survey to assess satisfaction with physician communication and overall hospital care. HCAHPS is a validated patient‐satisfaction survey developed by the Agency for Healthcare Research and Quality (AHRQ) to assess hospitalized patients' experiences with care. Physician‐communication questions used ordinal response options of never, sometimes, usually, and always. Overall hospital rating was assessed using a 010 scale with 0=worst hospital possible and 10=best hospital possible. Trust with physicians was assessed using the Wake Forest University Trust Scale.[22] Prior research using this instrument has shown an association between trust and self‐management behaviors.[23] This 10‐item scale uses a 5‐point Likert scale and generates scores ranging from 10 to 50. Agreement with physicians was assessed using 3 questions used in a prior study by Staiger and colleagues showing an association between levels of agreement and health outcomes among outpatients treated for back pain.[17] Specifically, we asked patients to rate their agreement with hospital physicians' (1) explanation for the cause of primary symptoms, (2) plan for diagnostic tests, and (3) suggested plan for treatment using a 5‐point Likert scale. The agreement scale generated scores ranging from 3 to 15.
Approval for the study was obtained from the institutional review board of Northwestern University.
Statistical Analysis
Patient demographic data were obtained from the electronic health record and complemented data from interviews. We used [2] and t tests to compare patient characteristics. We used [2] tests to compare the percentage of patients able to correctly identify 1 of their physicians and 1 of their physicians' roles. We used [2] tests to compare the percentage of patients giving top‐box ratings to all 3 physician‐communicationsatisfaction questions (ie, always) and giving an overall hospital rating of 9 or 10. We used top‐box comparisons, rather than comparison of mean or median scores, because patient‐satisfaction data are typically highly skewed toward favorable responses. This approach is consistent with prior HCAHPS research.[24, 25] We used Mann‐Whitney U tests to compare ratings of trust and agreement. Because delivery of facecards was imperfect, we performed analyses both by intention to treat (ie, intervention vs control units) and based on treatment received (ie, received a facecard vs did not receive a facecard). All analyses were conducted using Stata version 11.2 (StataCorp, College Station, TX).
RESULTS
Study Subjects and Facecard Receipt
Overall, 217 patients were approached for interview. Thirty‐six were excluded because of disorientation, 12 were excluded because their preferred language was not English, and 31 declined to participate in the study. Patient characteristics for the 138 study patients are shown in Table 1. There were no significant differences in patient age, sex, or race. There was no significant difference in the percentage of patients with 1 correct physicians listed on the whiteboard in the room. Delivery of facecards was incomplete, with only 68% of intervention‐unit patients confirmed as having received them. A higher percentage of patients on the hospitalist intervention unit received facecards (23 of 30; 76.7%) than on the teaching intervention unit (22 of 36; 61.1%), but the difference was not statistically significant (P=0.18). There were no significant differences in age, sex, or race between patients who received a facecard compared with those who did not.
| Characteristic | Control Group, N=72 | Intervention Group, N=66 | P Value |
|---|---|---|---|
| |||
| Mean age, years (SD) | 56.8 (18.0) | 55.2 (18.2) | 0.62 |
| Women, n (%) | 35 (48.6) | 28 (42.4) | 0.47 |
| Nonwhite race, n (%) | 35 (50.7) | 36 (57.1) | 0.46 |
| Teaching unit, n (%) | 34 (47.2) | 36 (54.6) | 0.39 |
| Correct physician name on whiteboard, n (%)a | 46 (76.7) | 37 (72.6) | 0.62 |
| Received a facecard, n (%) | 1 (1) | 45 (68.2) | <0.01 |
Patients' Knowledge of Physicians
As shown in Table 2, more patients in the intervention group were able to correctly identify 1 of their treating physicians compared with the control group, but the result was not statistically significant (69.7% vs 58.3%; P=0.17). A significantly larger percentage of patients in the intervention group were able to identify the role of their hospital physicians (51.5% vs 16.7%; P<0.01). When comparing those that received a facecard and those that did not, patients who were given a facecard were more likely to correctly identify their hospital physician (89.1% vs 51.1%; P<0.01). Similarly, patients who had received a facecard were more likely to correctly identify the role of their hospital physician than patients who had not received a facecard (67.4% vs 16.3%; P<0.01).
| Impact | Control Group, N=72, n (%) | Intervention Group, N=66, n (%) | P Value |
|---|---|---|---|
| Patient correctly named 1 hospital physician | 42 (58.3) | 46 (69.7) | 0.17 |
| Patient correctly named role of hospital physician | 12 (16.7) | 34 (51.5) | <0.01 |
| Did Not Receive Facecard, N=92 | Received Facecard, N=46 | P Value | |
| Patient correctly named 1 hospital physician | 47 (51.1) | 41 (89.1) | <0.01 |
| Patient correctly named role of hospital physician | 15 (16.3) | 31 (67.4) | <0.01 |
Levels of Satisfaction, Trust, and Agreement
Overall, patients had high levels of satisfaction, trust, and agreement with hospital physicians. The overall satisfaction with physician communication was 75.6% (mean of top‐box scores across all 3 items), and 81 of 138 (58.7%) patients gave top‐box ratings to all 3 physician‐communicationsatisfaction items. Ninety‐seven of 137 (70.8%) patients rated overall hospital care as 9 or 10. The mean trust score for all patients was 40.77.8 and the median was 41.5 (interquartile range, 3747). The mean agreement score for all patients was 12.42.4 and the median was 12 (interquartile range, 1115). As shown in Table 3, satisfaction, trust, and agreement were similar for patients in the intervention group compared with the control group. Patients who received a facecard rated satisfaction, trust, and agreement slightly higher compared with those who had not received a facecard, but the results were not statistically significant.
| Ratings | Control Group, N=72 | Intervention Group, N=66 | P Value |
|---|---|---|---|
| |||
| Satisfaction with physicians, n (%)a | 39 (54.2) | 42 (63.6) | 0.26 |
| Overall hospital satisfaction, n (%)b | 51 (70.8) | 46 (70.8) | 0.99 |
| Median trust (IQR)c | 42 (3747) | 41 (3746) | 0.81 |
| Median agreement (IQR)c | 12 (1115) | 12 (1215) | 0.72 |
| Did Not Receive Facecard, N=92 | Received Facecard, N=46 | P Value | |
| Satisfaction with physicians, n (%)a | 51 (55.4) | 30 (65.2) | 0.27 |
| Overall hospital satisfaction, n (%)b | 64 (69.6) | 33 (73.3) | 0.65 |
| Median trust (IQR)c | 41 (3547) | 42 (3847) | 0.32 |
| Median agreement (IQR)c | 12 (1114.5) | 12.5 (1215) | 0.37 |
DISCUSSION
We found that receipt of physician facecards significantly improved patients' knowledge of the names and roles of hospital physicians but had little to no impact on satisfaction, trust, or agreement with physicians. Our finding of improved knowledge of the names and roles of physician providers is consistent with prior studies using similar interventions.[7, 8, 9] Facecards may have prompted more effective introductions on the part of physicians and may have served as memory aids for patients to better retain information about their newly introduced hospital physicians.
Patient receipt of the facecard on intervention units was incomplete in our study. Despite engagement of physicians in designing cards that could easily fit into lab coats and a robust strategy to inform and motivate physician delivery of facecards, only 68% of intended patients received them. Although not explicitly reported, prior studies appear to have similarly struggled to deliver interventions consistently. Arora and colleagues reported that facecards were visible in only 59% of patients' rooms among those able to correctly identify 1 of their physicians.[8] A post hoc survey of physicians involved in our study revealed the biggest impediment to delivering facecards was simply forgetting to do so (data not shown). Technologic innovations may help by automating the identification of providers. For example, the University of Pittsburgh Medical Center has piloted smart rooms that use sensor technology to announce the name and role of providers as they enter patients' rooms.[26]
We hypothesized that facecards might improve other important aspects of the patient‐physicians relationship. Although levels of patient satisfaction were slightly higher in patients who had received facecards, the results were not statistically significant. Levels of trust and agreement were minimally higher in patients who received facecards, and the results were not statistically significant. Notably, baseline levels of trust and agreement were higher than we had expected. In fact, levels of trust were nearly identical to those seen in a prior study of outpatients who had been with the same physician for a median of 4 years.[22] Patients in our study may have had high levels of trust in the hospital and transferred this trust to their assigned physicians as representatives of the organization. The high level of agreement may relate to patients' tendency to prefer a more passive role as they encounter serious illness.[27, 28] Paradoxically, these findings may impede optimal patient care. The high levels of trust and agreement in the current study suggest that patients may not question their physicians to clarify plans and the rationale behind them. Prior research has shown that deficits in patients' comprehension of the care plan are often not apparent to patients or their physicians.[4, 29, 30]
Our study has several limitations. First, we assessed an intervention involving 4 units in a single hospital. Generalizability may be limited, as physician‐staffing models, hospitals, and the patients they serve vary. Second, as previously mentioned, patients in the intervention group did not receive physician facecards as consistently as intended. We conducted analyses based on treatment received in an effort to evaluate the impact of facecards if optimally delivered. Third, questions assessing satisfaction, trust, and agreement did not specifically ask patients to reflect on care provided by the primary physician team. It is possible that interactions with other physicians (ie, consultants) may have influenced these results. Fourth, we were underpowered to detect statistically significant improvements in satisfaction, trust, or agreement resulting from our intervention. Assuming the intervention might truly improve satisfaction with physicians from 54.2% to 63.6%, we would have needed 900 patients (ie, 450 each for the intervention and control groups) to have 80% power to detect a statistically significant difference. However, our results show that patients have high levels of trust and agreement with hospital physicians despite the relative lack of familiarity. Therefore, any existing deficits in hospitalized patients' comprehension of the care plan do not appear to be exacerbated by a lack of trust and/or agreement with treating physicians.
CONCLUSION
In summary, we found that physician facecards significantly improved patients' knowledge of the names and roles of hospital physicians but had little to no impact on satisfaction, trust, or agreement with physicians. Baseline levels of satisfaction, trust, and agreement were high, suggesting lack of familiarity with hospital physicians does not impede these important aspects of the patient‐physician relationship. Larger studies are needed to definitively assess the impact of facecards on satisfaction, trust, and agreement with physicians.
Acknowledgments
The authors express their gratitude to members of the NMH Patient and Family Advisory Council for providing input on the design of the physician facecard.
Disclosures: This study was supported by a grant from the Globe Foundation. The authors report no conflicts of interest.
- , , , , , . Ability of hospitalized patients to identify their in‐hospital physicians. Arch Intern Med. 2009;169(2):199–201.
- , . Does your patient know your name? An approach to enhancing patients' awareness of their caretaker's name. J Healthc Qual. 2005;27(4):53–56.
- , , Hospitalized patients' understanding of their plan of care. Mayo Clin Proc. 2010;85(1):47–52.
- , . Communication discrepancies between physicians and hospitalized patients. Arch Intern Med. 2010;170(15):1302–1307.
- Accreditation Council for Graduate Medical Education. Common program requirements. Available at: http://www.acgme.org/acgmeweb/Portals/0/PFAssets/ProgramRequirements/CPRs2013.pdf. Revised July 1, 2013.
- , , , et al. Transitions of Care Consensus policy statement: American College of Physicians, Society of General Internal Medicine, Society of Hospital Medicine, American Geriatrics Society, American College Of Emergency Physicians, and Society for Academic Emergency Medicine. J Hosp Med. 2009;4(6):364–370.
- , , . Increasing a patient's ability to identify his or her attending physician using a patient room display. Arch Intern Med. 2010;170(12):1084–1085.
- , , , et al. Improving inpatients' identification of their doctors: use of FACE cards. Jt Comm J Qual Patient Saf. 2009;35(12):613–619.
- , , . Patient satisfaction associated with correct identification of physician's photographs. Mayo Clin Proc. 2001;76(6):604–608.
- , , , , , . Physician‐patient relationship and medication compliance: a primary care investigation. Ann Fam Med. 2004;2(5):455–461.
- , , , , . Trust in the health care system and the use of preventive health services by older black and white adults. Am J Public Health. 2009;99(7):1293–1299.
- , , , . The role of patient‐physician trust in moderating medication nonadherence due to cost pressures. Arch Intern Med. 2005;165(15):1749–1755.
- , , . Trust and the acceptance of and adherence to antiretroviral therapy. J Acquir Immune Defic Syndr. 2001;28(1):47–58.
- , , , , , . Linking primary care performance to outcomes of care. J Fam Pract. 1998;47(3):213–220.
- , , , ; The Stanford Trust Study Physicians. Further validation and reliability testing of the Trust in Physician Scale. Med Care. 1999;37(5):510–517.
- , , , , , . The physician's actions and the outcome of illness in family practice. J Fam Pract. 1986;23(1):43–47.
- , , , , . Brief Report: Patient‐physician agreement as a predictor of outcomes in patients with back pain. J Gen Intern Med. 2005;20(10):935–937.
- , , , , , . The influence of patient‐practitioner agreement on outcome of care. Am J Public Health. 1981;71(2):127–131.
- , , , et al. Impact of localizing physicians to hospital units on nurse‐physician communication and agreement on the plan of care. J Gen Intern Med. 2009;24(11):1223–1227.
- , , , . The Lexile Framework. Durham, NC: Metametrics, Inc.; 1998.
- National Center for Education Statistics; , . Assessing the Lexile Framework: results of a panel meeting. NCES Working Paper Series, No. 2001‐08. Washington, DC: US Department of Education, Office of Educational Research and Improvement; 2001.
- , , , et al. Measuring patients' trust in their primary care providers. Med Care Res Rev. 2002;59(3):293–318.
- , , , , , . The association of patient trust and self‐care among patients with diabetes mellitus. BMC Fam Pract. 2004;5:26.
- , , , , . Development, implementation, and public reporting of the HCAHPS survey. Med Care Res Rev. 2010;67(1):27–37.
- , , , , . Measuring hospital care from the patients' perspective: an overview of the CAHPS Hospital Survey development process. Health Serv Res. 2005;40(6 pt 2):1977–1995.
- . Smart rooms, smart care delivery: UPMC clinician leaders leverage technology for greater effectiveness in patient care. Healthc Inform. 2011;28(9):36, 38–39, 42.
- , . Decision making during serious illness: what role do patients really want to play? J Clin Epidemiol. 1992;45(9):941–950.
- , , , , . The dynamics of change: cancer patients' preferences for information, involvement and support. Ann Oncol. 1997;8(9):857–863.
- , , , et al. Patient‐physician communication at hospital discharge and patients' understanding of the postdischarge treatment plan. Arch Intern Med. 1997;157(9):1026–1030.
- , , , , , . Patient comprehension of emergency department care and instructions: are patients aware of when they do not understand? Ann Emerg Med. 2009;53(4):454.e15–461.e15.
The patient‐physician relationship is fundamental to safe and effective care. Hospital settings present unique challenges to this partnership, including the lack of a prior relationship for hospital‐based physicians, rapid pace of clinical care, and dynamic nature of inpatient medical teams. Prior studies document that a majority of hospitalized patients are unable to correctly identify their physicians or nurses, and patients in teaching hospitals have difficulty understanding their physicians' level of training.[1, 2, 3, 4] Acknowledging these deficits, professional societies and the Accreditation Council for Graduate Medical Education (ACMGE) have issued policies stating that patients and caregivers need to know who is responsible at every point during patient care.[5, 6] These policies do not, however, make recommendations on methods to achieve better understanding.
Simple interventions improve patients' ability to correctly identify the names and roles of their hospital physicians. Maniaci and colleagues found that patients were better able to identify attending physicians when their names were written on the dry‐erase board in the room.[7] Arora and colleagues asked hospital physicians to give facecards, which included their picture and a description of their role, to patients.[8] Patients were more likely to correctly identify 1 physicians, but, surprisingly, less likely to understand physicians' roles. In a similar study, Francis and colleagues placed photographs with names of the attending and resident physicians on the wall in patient rooms.[9] Patients who had photographs of their physicians on the wall were more likely to correctly identify physicians on their team compared with patients who had no photographs. Additionally, patients who were able to identify more physicians rated satisfaction with physicians higher in 2 of 6 survey questions used. However, the study was limited by the use of a nonvalidated instrument to assess patient satisfaction and the use of an intermediate outcome (ie, ability to identify physicians) as the independent variable rather than the intervention itself (ie, physician photographs).
Beyond satisfaction, lack of familiarity may negatively impact patients' trust and agreement with hospital physicians. Trust and agreement are important predictors of adherence to recommended treatment in outpatient settings[10, 11, 12, 13, 14, 15, 16, 17, 18] but have not been adequately evaluated in hospital settings. Therefore, we sought to pilot the use of physician facecards and assess their potential impact on patients' knowledge of physicians' names and roles as well as patient satisfaction, trust, and agreement with physicians.
METHODS
Setting and Study Design
We performed a cluster randomized controlled trial at Northwestern Memorial Hospital (NMH), an 897‐bed tertiary‐care teaching hospital in Chicago, Illinois. One of 2 similar hospitalist service units and 1 of 2 similar teaching‐service units were randomly selected to implement the use of physician facecards. General medical patients were admitted to the study units by NMH bed‐assignment personnel subject to unit bed availability. No other criteria (eg, diagnosis, severity of illness, or source of patient admission) were used in patient assignment. Each unit consisted of 30 beds, with the exception of 1 hospitalist unit, which had 23. As a result of a prior intervention, physicians were localized to care for patients on specific units.[19] Hospitalist units were each staffed by hospitalists who worked in 7‐day rotations without the assistance of residents or midlevel providers. Teaching units were staffed by physician teams consisting of 1 attending, 1 senior resident, 1 intern, and 1 or 2 third‐year medical students. No fourth‐year students (ie, acting interns) rotated on these services during the study period. Housestaff worked in 4‐week rotations, and attending physicians on the teaching service worked in 2‐week rotations.
Patient rooms included a whiteboard facing the patient with a template prompting insertion of physician name(s). Nurses had the primary responsibility for completing information on the whiteboards.
Physician Facecard
We created draft physician facecards featuring pictures of physicians and descriptions of their roles. We used Lexile analysis, a widely used measure of reading difficulty, to improve readability in an iterative fashion.[20, 21] We then sought feedback at hospitalist and resident meetings. Specifically, we asked for suggested revisions to content and recommendations on reliable methods to deliver facecards to patients. Teaching physicians felt strongly that each team member should be listed and shown on 1 card, which would fit easily into a lab‐coat pocket. We similarly engaged the NMH Patient and Family Advisory Council to seek recommended revisions to content and delivery of the facecards. The Council consists of 18 patient and caregiver members who meet regularly to provide input on hospital programs and proposals. Council members felt strongly that physicians should deliver the cards themselves during their initial introduction, rather than having patients receive cards by other means (eg, as part of unit orientation materials delivered by nonphysician staff members). We incorporated feedback from these stakeholder groups into a final version of the physician facecard and method for delivery (Figure 1).
We implemented the use of facecards from May to June 2012. Physicians on intervention units were informed of the study via email, and one of the co‐investigators (T.C.) distributed a supply of facecards to these physicians at the start of each rotation. This distribution was performed in person, and physicians were instructed to provide a facecard to each new patient during their first encounter. We also placed facecards in easily visible cardholders at the nurses' station on intervention units. Reminder emails were sent once each week to reinforce physician delivery of facecards.
Data Collection and Measures
Each weekday during the study period, we randomly selected patients for structured interviews in the afternoon of their second or third hospital day. We did not conduct interviews on the first day of physicians' rotations and excluded patients whose preferred language was not English and those disoreinted to person, place, or time.
Patients were asked to name the physician(s) primarily responsible for their hospital care and to state the role of each physician they identified. We documented receipt of facecards if one was viewed during the interview and by asking patients if they had received one. We also documented whether 1 correct physician names were written on the whiteboard in the patients' rooms. We used questions from the Hospital Consumer Assessment of Healthcare Providers and Systems (HCAHPS) survey to assess satisfaction with physician communication and overall hospital care. HCAHPS is a validated patient‐satisfaction survey developed by the Agency for Healthcare Research and Quality (AHRQ) to assess hospitalized patients' experiences with care. Physician‐communication questions used ordinal response options of never, sometimes, usually, and always. Overall hospital rating was assessed using a 010 scale with 0=worst hospital possible and 10=best hospital possible. Trust with physicians was assessed using the Wake Forest University Trust Scale.[22] Prior research using this instrument has shown an association between trust and self‐management behaviors.[23] This 10‐item scale uses a 5‐point Likert scale and generates scores ranging from 10 to 50. Agreement with physicians was assessed using 3 questions used in a prior study by Staiger and colleagues showing an association between levels of agreement and health outcomes among outpatients treated for back pain.[17] Specifically, we asked patients to rate their agreement with hospital physicians' (1) explanation for the cause of primary symptoms, (2) plan for diagnostic tests, and (3) suggested plan for treatment using a 5‐point Likert scale. The agreement scale generated scores ranging from 3 to 15.
Approval for the study was obtained from the institutional review board of Northwestern University.
Statistical Analysis
Patient demographic data were obtained from the electronic health record and complemented data from interviews. We used [2] and t tests to compare patient characteristics. We used [2] tests to compare the percentage of patients able to correctly identify 1 of their physicians and 1 of their physicians' roles. We used [2] tests to compare the percentage of patients giving top‐box ratings to all 3 physician‐communicationsatisfaction questions (ie, always) and giving an overall hospital rating of 9 or 10. We used top‐box comparisons, rather than comparison of mean or median scores, because patient‐satisfaction data are typically highly skewed toward favorable responses. This approach is consistent with prior HCAHPS research.[24, 25] We used Mann‐Whitney U tests to compare ratings of trust and agreement. Because delivery of facecards was imperfect, we performed analyses both by intention to treat (ie, intervention vs control units) and based on treatment received (ie, received a facecard vs did not receive a facecard). All analyses were conducted using Stata version 11.2 (StataCorp, College Station, TX).
RESULTS
Study Subjects and Facecard Receipt
Overall, 217 patients were approached for interview. Thirty‐six were excluded because of disorientation, 12 were excluded because their preferred language was not English, and 31 declined to participate in the study. Patient characteristics for the 138 study patients are shown in Table 1. There were no significant differences in patient age, sex, or race. There was no significant difference in the percentage of patients with 1 correct physicians listed on the whiteboard in the room. Delivery of facecards was incomplete, with only 68% of intervention‐unit patients confirmed as having received them. A higher percentage of patients on the hospitalist intervention unit received facecards (23 of 30; 76.7%) than on the teaching intervention unit (22 of 36; 61.1%), but the difference was not statistically significant (P=0.18). There were no significant differences in age, sex, or race between patients who received a facecard compared with those who did not.
| Characteristic | Control Group, N=72 | Intervention Group, N=66 | P Value |
|---|---|---|---|
| |||
| Mean age, years (SD) | 56.8 (18.0) | 55.2 (18.2) | 0.62 |
| Women, n (%) | 35 (48.6) | 28 (42.4) | 0.47 |
| Nonwhite race, n (%) | 35 (50.7) | 36 (57.1) | 0.46 |
| Teaching unit, n (%) | 34 (47.2) | 36 (54.6) | 0.39 |
| Correct physician name on whiteboard, n (%)a | 46 (76.7) | 37 (72.6) | 0.62 |
| Received a facecard, n (%) | 1 (1) | 45 (68.2) | <0.01 |
Patients' Knowledge of Physicians
As shown in Table 2, more patients in the intervention group were able to correctly identify 1 of their treating physicians compared with the control group, but the result was not statistically significant (69.7% vs 58.3%; P=0.17). A significantly larger percentage of patients in the intervention group were able to identify the role of their hospital physicians (51.5% vs 16.7%; P<0.01). When comparing those that received a facecard and those that did not, patients who were given a facecard were more likely to correctly identify their hospital physician (89.1% vs 51.1%; P<0.01). Similarly, patients who had received a facecard were more likely to correctly identify the role of their hospital physician than patients who had not received a facecard (67.4% vs 16.3%; P<0.01).
| Impact | Control Group, N=72, n (%) | Intervention Group, N=66, n (%) | P Value |
|---|---|---|---|
| Patient correctly named 1 hospital physician | 42 (58.3) | 46 (69.7) | 0.17 |
| Patient correctly named role of hospital physician | 12 (16.7) | 34 (51.5) | <0.01 |
| Did Not Receive Facecard, N=92 | Received Facecard, N=46 | P Value | |
| Patient correctly named 1 hospital physician | 47 (51.1) | 41 (89.1) | <0.01 |
| Patient correctly named role of hospital physician | 15 (16.3) | 31 (67.4) | <0.01 |
Levels of Satisfaction, Trust, and Agreement
Overall, patients had high levels of satisfaction, trust, and agreement with hospital physicians. The overall satisfaction with physician communication was 75.6% (mean of top‐box scores across all 3 items), and 81 of 138 (58.7%) patients gave top‐box ratings to all 3 physician‐communicationsatisfaction items. Ninety‐seven of 137 (70.8%) patients rated overall hospital care as 9 or 10. The mean trust score for all patients was 40.77.8 and the median was 41.5 (interquartile range, 3747). The mean agreement score for all patients was 12.42.4 and the median was 12 (interquartile range, 1115). As shown in Table 3, satisfaction, trust, and agreement were similar for patients in the intervention group compared with the control group. Patients who received a facecard rated satisfaction, trust, and agreement slightly higher compared with those who had not received a facecard, but the results were not statistically significant.
| Ratings | Control Group, N=72 | Intervention Group, N=66 | P Value |
|---|---|---|---|
| |||
| Satisfaction with physicians, n (%)a | 39 (54.2) | 42 (63.6) | 0.26 |
| Overall hospital satisfaction, n (%)b | 51 (70.8) | 46 (70.8) | 0.99 |
| Median trust (IQR)c | 42 (3747) | 41 (3746) | 0.81 |
| Median agreement (IQR)c | 12 (1115) | 12 (1215) | 0.72 |
| Did Not Receive Facecard, N=92 | Received Facecard, N=46 | P Value | |
| Satisfaction with physicians, n (%)a | 51 (55.4) | 30 (65.2) | 0.27 |
| Overall hospital satisfaction, n (%)b | 64 (69.6) | 33 (73.3) | 0.65 |
| Median trust (IQR)c | 41 (3547) | 42 (3847) | 0.32 |
| Median agreement (IQR)c | 12 (1114.5) | 12.5 (1215) | 0.37 |
DISCUSSION
We found that receipt of physician facecards significantly improved patients' knowledge of the names and roles of hospital physicians but had little to no impact on satisfaction, trust, or agreement with physicians. Our finding of improved knowledge of the names and roles of physician providers is consistent with prior studies using similar interventions.[7, 8, 9] Facecards may have prompted more effective introductions on the part of physicians and may have served as memory aids for patients to better retain information about their newly introduced hospital physicians.
Patient receipt of the facecard on intervention units was incomplete in our study. Despite engagement of physicians in designing cards that could easily fit into lab coats and a robust strategy to inform and motivate physician delivery of facecards, only 68% of intended patients received them. Although not explicitly reported, prior studies appear to have similarly struggled to deliver interventions consistently. Arora and colleagues reported that facecards were visible in only 59% of patients' rooms among those able to correctly identify 1 of their physicians.[8] A post hoc survey of physicians involved in our study revealed the biggest impediment to delivering facecards was simply forgetting to do so (data not shown). Technologic innovations may help by automating the identification of providers. For example, the University of Pittsburgh Medical Center has piloted smart rooms that use sensor technology to announce the name and role of providers as they enter patients' rooms.[26]
We hypothesized that facecards might improve other important aspects of the patient‐physicians relationship. Although levels of patient satisfaction were slightly higher in patients who had received facecards, the results were not statistically significant. Levels of trust and agreement were minimally higher in patients who received facecards, and the results were not statistically significant. Notably, baseline levels of trust and agreement were higher than we had expected. In fact, levels of trust were nearly identical to those seen in a prior study of outpatients who had been with the same physician for a median of 4 years.[22] Patients in our study may have had high levels of trust in the hospital and transferred this trust to their assigned physicians as representatives of the organization. The high level of agreement may relate to patients' tendency to prefer a more passive role as they encounter serious illness.[27, 28] Paradoxically, these findings may impede optimal patient care. The high levels of trust and agreement in the current study suggest that patients may not question their physicians to clarify plans and the rationale behind them. Prior research has shown that deficits in patients' comprehension of the care plan are often not apparent to patients or their physicians.[4, 29, 30]
Our study has several limitations. First, we assessed an intervention involving 4 units in a single hospital. Generalizability may be limited, as physician‐staffing models, hospitals, and the patients they serve vary. Second, as previously mentioned, patients in the intervention group did not receive physician facecards as consistently as intended. We conducted analyses based on treatment received in an effort to evaluate the impact of facecards if optimally delivered. Third, questions assessing satisfaction, trust, and agreement did not specifically ask patients to reflect on care provided by the primary physician team. It is possible that interactions with other physicians (ie, consultants) may have influenced these results. Fourth, we were underpowered to detect statistically significant improvements in satisfaction, trust, or agreement resulting from our intervention. Assuming the intervention might truly improve satisfaction with physicians from 54.2% to 63.6%, we would have needed 900 patients (ie, 450 each for the intervention and control groups) to have 80% power to detect a statistically significant difference. However, our results show that patients have high levels of trust and agreement with hospital physicians despite the relative lack of familiarity. Therefore, any existing deficits in hospitalized patients' comprehension of the care plan do not appear to be exacerbated by a lack of trust and/or agreement with treating physicians.
CONCLUSION
In summary, we found that physician facecards significantly improved patients' knowledge of the names and roles of hospital physicians but had little to no impact on satisfaction, trust, or agreement with physicians. Baseline levels of satisfaction, trust, and agreement were high, suggesting lack of familiarity with hospital physicians does not impede these important aspects of the patient‐physician relationship. Larger studies are needed to definitively assess the impact of facecards on satisfaction, trust, and agreement with physicians.
Acknowledgments
The authors express their gratitude to members of the NMH Patient and Family Advisory Council for providing input on the design of the physician facecard.
Disclosures: This study was supported by a grant from the Globe Foundation. The authors report no conflicts of interest.
- , , , , , . Ability of hospitalized patients to identify their in‐hospital physicians. Arch Intern Med. 2009;169(2):199–201.
- , . Does your patient know your name? An approach to enhancing patients' awareness of their caretaker's name. J Healthc Qual. 2005;27(4):53–56.
- , , Hospitalized patients' understanding of their plan of care. Mayo Clin Proc. 2010;85(1):47–52.
- , . Communication discrepancies between physicians and hospitalized patients. Arch Intern Med. 2010;170(15):1302–1307.
- Accreditation Council for Graduate Medical Education. Common program requirements. Available at: http://www.acgme.org/acgmeweb/Portals/0/PFAssets/ProgramRequirements/CPRs2013.pdf. Revised July 1, 2013.
- , , , et al. Transitions of Care Consensus policy statement: American College of Physicians, Society of General Internal Medicine, Society of Hospital Medicine, American Geriatrics Society, American College Of Emergency Physicians, and Society for Academic Emergency Medicine. J Hosp Med. 2009;4(6):364–370.
- , , . Increasing a patient's ability to identify his or her attending physician using a patient room display. Arch Intern Med. 2010;170(12):1084–1085.
- , , , et al. Improving inpatients' identification of their doctors: use of FACE cards. Jt Comm J Qual Patient Saf. 2009;35(12):613–619.
- , , . Patient satisfaction associated with correct identification of physician's photographs. Mayo Clin Proc. 2001;76(6):604–608.
- , , , , , . Physician‐patient relationship and medication compliance: a primary care investigation. Ann Fam Med. 2004;2(5):455–461.
- , , , , . Trust in the health care system and the use of preventive health services by older black and white adults. Am J Public Health. 2009;99(7):1293–1299.
- , , , . The role of patient‐physician trust in moderating medication nonadherence due to cost pressures. Arch Intern Med. 2005;165(15):1749–1755.
- , , . Trust and the acceptance of and adherence to antiretroviral therapy. J Acquir Immune Defic Syndr. 2001;28(1):47–58.
- , , , , , . Linking primary care performance to outcomes of care. J Fam Pract. 1998;47(3):213–220.
- , , , ; The Stanford Trust Study Physicians. Further validation and reliability testing of the Trust in Physician Scale. Med Care. 1999;37(5):510–517.
- , , , , , . The physician's actions and the outcome of illness in family practice. J Fam Pract. 1986;23(1):43–47.
- , , , , . Brief Report: Patient‐physician agreement as a predictor of outcomes in patients with back pain. J Gen Intern Med. 2005;20(10):935–937.
- , , , , , . The influence of patient‐practitioner agreement on outcome of care. Am J Public Health. 1981;71(2):127–131.
- , , , et al. Impact of localizing physicians to hospital units on nurse‐physician communication and agreement on the plan of care. J Gen Intern Med. 2009;24(11):1223–1227.
- , , , . The Lexile Framework. Durham, NC: Metametrics, Inc.; 1998.
- National Center for Education Statistics; , . Assessing the Lexile Framework: results of a panel meeting. NCES Working Paper Series, No. 2001‐08. Washington, DC: US Department of Education, Office of Educational Research and Improvement; 2001.
- , , , et al. Measuring patients' trust in their primary care providers. Med Care Res Rev. 2002;59(3):293–318.
- , , , , , . The association of patient trust and self‐care among patients with diabetes mellitus. BMC Fam Pract. 2004;5:26.
- , , , , . Development, implementation, and public reporting of the HCAHPS survey. Med Care Res Rev. 2010;67(1):27–37.
- , , , , . Measuring hospital care from the patients' perspective: an overview of the CAHPS Hospital Survey development process. Health Serv Res. 2005;40(6 pt 2):1977–1995.
- . Smart rooms, smart care delivery: UPMC clinician leaders leverage technology for greater effectiveness in patient care. Healthc Inform. 2011;28(9):36, 38–39, 42.
- , . Decision making during serious illness: what role do patients really want to play? J Clin Epidemiol. 1992;45(9):941–950.
- , , , , . The dynamics of change: cancer patients' preferences for information, involvement and support. Ann Oncol. 1997;8(9):857–863.
- , , , et al. Patient‐physician communication at hospital discharge and patients' understanding of the postdischarge treatment plan. Arch Intern Med. 1997;157(9):1026–1030.
- , , , , , . Patient comprehension of emergency department care and instructions: are patients aware of when they do not understand? Ann Emerg Med. 2009;53(4):454.e15–461.e15.
© 2013 Society of Hospital Medicine
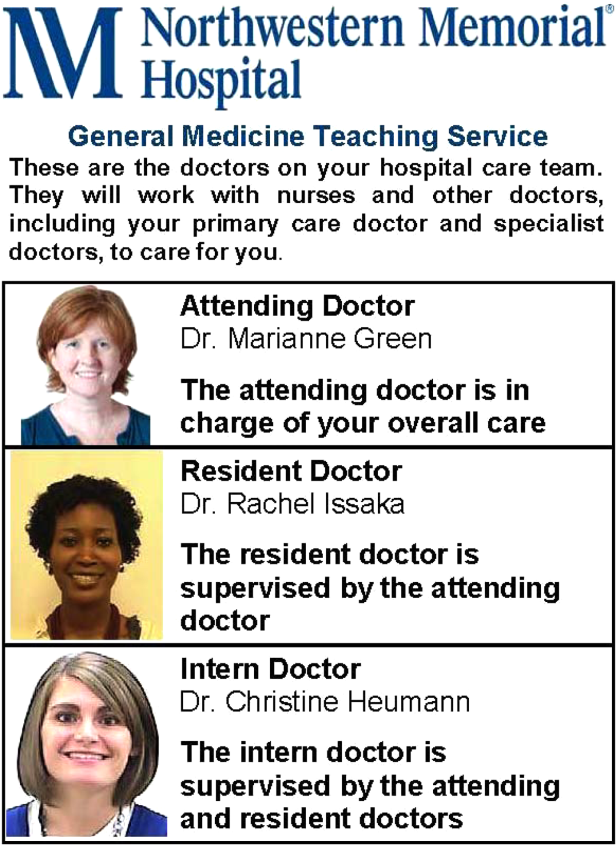
Update in Hospital Palliative Care
Seriously ill patients frequently receive care in hospitals,[1, 2, 3] and palliative care is a core competency for hospitalists.[4, 5] The goal of this update was to summarize and critique recently published research that has the highest potential to impact the clinical practice of palliative care in the hospital. We reviewed articles published between January 2012 and May 2013. To identify articles, we hand‐searched 22 leading journals (see Appendix) and the Cochrane Database of Systematic Reviews, and performed a PubMed keyword search using the terms hospice and palliative care. We evaluated identified articles based on scientific rigor and relevance to hospital practice. In this review, we summarize 9 articles that were collectively selected as having the highest impact on the clinical practice of hospital palliative care. We summarize each article and its findings and note cautions and implications for practice.
SYMPTOM MANAGEMENT
Indwelling Pleural Catheters and Talc Pleurodesis Provide Similar Dyspnea Relief in Patients With Malignant Pleural Effusions
Davies HE, Mishra EK, Kahan BC, et al. Effect of an indwelling pleural catheter vs chest tube and talc pleurodesis for relieving dyspnea in patients with malignant pleural effusion. JAMA. 2012;307:23832389.
Background
Expert guidelines recommend chest‐tube insertion and talc pleurodesis as a first‐line therapy for symptomatic malignant pleural effusions, but indwelling pleural catheters are gaining in popularity.[6] The optimal management is unknown.
Findings
A total of 106 patients with newly diagnosed symptomatic malignant pleural effusion were randomized to undergo talc pleurodesis or placement of an indwelling pleural catheter. Most patients had metastatic breast or lung cancer. Overall, there were no differences in relief of dyspnea at 42 days between patients who received indwelling catheters and pleurodesis; importantly, more than 75% of patients in both groups reported improved shortness of breath. The initial hospitalization was much shorter in the indwelling catheter group (0 days vs 4 days). There was no difference in quality of life, but in surviving patients, dyspnea at 6 months was better with the indwelling catheter. In the talc group, 22% of patients required further pleural procedures compared with 6% in the indwelling catheter group. Patients in the talc group had a higher frequency of adverse events than in the catheter group (40% vs 13%). In the catheter group, the most common adverse events were pleural infection, cellulitis, and catheter obstruction.
Cautions
The study was small and unblinded, and the primary outcome was subjective dyspnea. The study occurred at 7 hospitals, and the impact of institutional or provider experience was not taken into account. Last, overall costs of care, which could impact the choice of intervention, were not calculated.
Implications
This was a small but well‐done study showing that indwelling catheters and talc pleurodesis provide similar relief of dyspnea 42 days postintervention. Given these results, both interventions seem to be acceptable options. Clinicians and patients could select the best option based on local procedural expertise and patient factors such as preference, ability to manage a catheter, and life expectancy.
Most Dying Patients Do Not Experience Increased Respiratory Distress When Oxygen is Withdrawn
Campbell ML, Yarandi H, Dove‐Medows E. Oxygen is nonbeneficial for most patients who are near death. J Pain Symptom Manage. 2013;45(3):517523.
Background
Oxygen is frequently administered to patients at the end of life, yet there is limited evidence evaluating whether oxygen reduces respiratory distress in dying patients.
Findings
In this double‐blind, repeated‐measure study, patients served as their own controls as the investigators evaluated respiratory distress with and without oxygen therapy. The study included 32 patients who were enrolled in hospice or seen in palliative care consultation and had a diagnosis such as lung cancer or heart failure that might cause dyspnea. Medical air (nasal cannula with air flow), supplemental oxygen, and no flow were randomly alternated every 10 minutes for 1 hour. Blinded research assistants used a validated observation scale to compare respiratory distress under each condition. At baseline, 27 of 32 (84%) patients were on oxygen. Three patients, all of whom were conscious and on oxygen at baseline, experienced increased respiratory distress without oxygen; reapplication of supplemental oxygen relieved their distress. The other 29 patients had no change in respiratory distress under the oxygen, medical air, and no flow conditions.
Cautions
All patients in this study were near death as measured by the Palliative Performance Scale, which assesses prognosis based on functional status and level of consciousness. Patients were excluded if they were receiving high‐flow oxygen by face mask or were experiencing respiratory distress at the time of initial evaluation. Some patients experienced increased discomfort after withdrawal of oxygen. Close observation is needed to determine which patients will experience distress.
Implications
The majority of patients who were receiving oxygen at baseline experienced no change in respiratory comfort when oxygen was withdrawn, supporting previous evidence that oxygen provides little benefit in nonhypoxemic patients. Oxygen may be an unnecessary intervention near death and has the potential to add to discomfort through nasal dryness and decreased mobility.
Sennosides Performed Similarly to Docusate Plus Sennosides in Managing Opioid‐Induced Constipation in Seriously Ill Patients
Tarumi Y, Wilson MP, Szafran O, Spooner GR. Randomized, double‐blind, placebo‐controlled trial of oral docusate in the management of constipation in hospice patients. J Pain Symptom Manage. 2013;45:213.
Background
Seriously ill patients frequently suffer from constipation, often as a result of opioid analgesics. Hospital clinicians should seek to optimize bowel regimens to prevent opioid‐induced constipation. A combination of the stimulant laxative sennoside and the stool softener docusate is often recommended to treat and prevent constipation. Docusate may not have additional benefit to sennoside, and may have significant burdens, including disturbing the absorption of other medications, adding to patients' pill burden and increasing nurse workload.[7]
Findings
In this double‐blinded trial, 74 patients in 3 inpatient hospices in Canada were randomized to receive sennoside plus either docusate 100 mg, or placebo tablets twice daily, or sennoside plus placebo for 10 days. Most patients had cancer as a life‐limiting diagnosis and received opioids during the study period. All were able to tolerate pills and food or sips of fluid. There was no significant difference between the 2 groups in stool frequency, volume, consistency, or patients' perceptions of difficulty with defecation. The percentage of patients who had a bowel movement at least every 3 days was 71% in the docusate plus sennoside group and 81% in the sennoside only group (P=0.45). There was also no significant difference between the groups in sennoside dose (which ranged between 13, 8.6 mg tablets daily), mean morphine equivalent daily dosage, or other bowel interventions.
Cautions
The trial was small, though it was adequately powered to detect a clinically meaningful difference between the 2 groups of 0.5 in the average number of bowel movements per day. The consent rate was low (26%); the authors do not detail reasons patients were not randomized. Patients who did not participate might have had different responses.
Implications
Consistent with previous work,[7] these results indicate that docusate is probably not needed for routine management of opioid‐induced constipation in seriously ill patients.
Sublingual Atropine Performed Similarly to Placebo in Reducing Noise Associated With Respiratory Rattle Near Death
Heisler M, Hamilton G, Abbott A, et al. Randomized double‐blind trial of sublingual atropine vs. placebo for the management of death rattle. J Pain Symptom Manage. 2012;45(1):1422.
Background
Increased respiratory tract secretions in patients near death can cause noisy breathing, often referred to as a death rattle. Antimuscarinic medications, such as atropine, are frequently used to decrease audible respirations and family distress, though little evidence exists to support this practice.
Findings
In this double‐blind, placebo‐controlled, parallel group trial at 3 inpatient hospices, 177 terminally ill patients with audible respiratory secretions were randomized to 2 drops of sublingual atropine 1% solution or placebo drops. Bedside nurses rated patients' respiratory secretions at enrollment, and 2 and 4 hours after receiving atropine or placebo. There were no differences in noise score between subjects treated with atropine and placebo at 2 hours (37.8% vs. 41.3%, P=0.24) or at 4 hours (39.7% and 51.7%, P=0.21). There were no differences in the safety end point of change in heart rate (P=0.47).
Cautions
Previous studies comparing different anticholinergic medications and routes of administration to manage audible respiratory secretions had variable response rates but suggested a benefit to antimuscarinic medications. However, these trials had significant methodological limitations including lack of randomization and blinding. The improvement in death rattle over time in other studies may suggest a favorable natural course for respiratory secretions rather than a treatment effect.
Implications
Although generalizability to other antimuscarinic medications and routes of administration is limited, in a randomized, double‐blind, placebo‐controlled trial, sublingual atropine did not reduce the noise from respiratory secretions when compared to placebo.
PATIENT AND FAMILY OUTCOMES AFTER CARDIOPULMONARY RESUSCITATION
Over Half of Older Adult Survivors of In‐Hospital Cardiopulmonary Resuscitation Were Alive At 1 Year
Chan PS, Krumholz HM, Spertus JA, et al. Long‐term outcomes in elderly survivors of in‐hospital cardiac arrest. N Engl J Med. 2013;368:10191026.
Background
Studies of cardiopulmonary resuscitation (CPR) outcomes have focused on survival to hospital discharge. Little is known about long‐term outcomes following in‐hospital cardiac arrest in older adults.
Findings
The authors analyzed data from the Get With the GuidelinesResuscitation registry from 2000 to 2008 and Medicare inpatient files from 2000 to 2010. The cohort included 6972 patients at 401 hospitals who were discharged after surviving in‐hospital arrest. Outcomes were survival and freedom from hospital readmission at 1 year after discharge. At discharge, 48% of patients had either no or mild neurologic disability at discharge; the remainder had moderate to severe neurologic disability. Overall, 58% of patients who were discharged were still alive at 1 year. Survival rates were lowest for patients who were discharged in coma or vegetative state (8% at 1 year), and highest for those discharged with mild or no disability (73% at 1 year). Older patients had lower survival rates than younger patients, as did men compared with women and blacks compared with whites. At 1 year, 34.4% of the patients had not been readmitted. Predictors of readmission were similar to those for lower survival rates.
Cautions
This study only analyzed survival data from patients who survived to hospital discharge after receiving in‐hospital CPR, not all patients who had a cardiac arrest. Thus, the survival rates reported here do not include patients who died during the original arrest, or who survived the arrest but died during their hospitalization. The 1‐year survival rate for people aged 65 years and above following a cardiac arrest is not reported but is likely to be about 10%, based on data from this registry.[8] Data were not available for health status, neurologic status, or quality of life of the survivors at 1 year.
Implications
Older patients who receive in‐hospital CPR and have a good neurologic status at hospital discharge have good long‐term outcomes. In counseling patients about CPR, it is important to note that most patients who receive CPR do not survive to hospital discharge.
Families Who Were Present During CPR Had Decreased Post‐traumatic Stress Symptoms
Jabre P, Belpomme V, Azoulay E, et al. Family presence during cardiopulmonary resuscitation. N Engl J Med. 2013;368:10081018.
Background
Family members who watch their loved ones undergo (CPR) might have increased emotional distress. Alternatively, observing CPR may allow for appreciation of the efforts taken for their loved one and provide comfort at a challenging time. The right balance of benefit and harm is unclear.
Findings
Between 2009 and 2011, 15 prehospital emergency medical service units in France were randomized to offer adult family members the opportunity to observe CPR or follow their usual practice. A total of 570 relatives were enrolled. In the intervention group, 79% of relatives observed CPR, compared to 43% in the control group. There was no difference in the effectiveness of CPR between the 2 groups. At 90 days, post‐traumatic stress symptoms were more common in the control group (adjusted odds ratio [OR]: 1.7; 95% confidence interval [CI]: 1.2‐2.5). At 90 days, those who were present for the resuscitation also had fewer symptoms of anxiety and fewer symptoms of depression (P0.009 for both). Stress of the medical teams involved in the CPR was not different between the 2 groups. No malpractice claims were filed in either group.
Cautions
The study was conducted only in France, so the results may not be generalizable outside of France. In addition, the observed resuscitation was for patients who suffered a cardiac arrest in the home; it is unclear if the same results would be found in the emergency department or hospital.
Implications
This is the highest quality study to date in this area that argues for actively inviting family members to be present for resuscitation efforts in the home. Further studies are needed to determine if hospitals should implement standard protocols. In the meantime, providers who perform CPR should consider inviting families to observe, as it may result in less emotional distress for family members.
COMMUNICATION AND DECISION MAKING
Surrogate Decision Makers Interpreted Prognostic Information Optimistically
Zier LS, Sottile PD, Hong SY, et al. Surrogate decision makers' interpretation of prognostic information: a mixed‐methods study. Ann Intern Med. 2012;156:360366.
Background
Surrogates of critically ill patients often have beliefs about prognosis that are discordant from what is told to them by providers. Little is known about why this is the case.
Findings
Eighty surrogates of patients in intensive care units (ICUs) were given questionnaires with hypothetical prognostic statements and asked to identify a survival probability associated with each statement on a 0% to 100% scale. Interviewers examined the questionnaires to identify responses that were not concordant with the given prognostic statements. They then interviewed participants to determine why the answers were discordant. The researchers found that surrogates were more likely to offer an overoptimistic interpretation of statements communicating a high risk of death, compared to statements communicating a low risk of death. The qualitative interviews revealed that surrogates felt they needed to express ongoing optimism and that patient factors not known to the medical team would lead to better outcomes.
Cautions
The participants were surrogates who were present in the ICU at the time when study investigators were there, and thus the results may not be generalizable to all surrogates. Only a subset of participants completed qualitative interviews. Prognostic statements were hypothetical. Written prognostic statements may be interpreted differently than spoken statements.
Implications
Surrogate decision makers may interpret prognostic statements optimistically, especially when a high risk of death is estimated. Inaccurate interpretation may be related to personal beliefs about the patients' strengths and a need to hold onto hope for a positive outcome. When communicating with surrogates of critically ill patients, providers should be aware that, beyond the actual information shared, many other factors influence surrogates' beliefs about prognosis.
A Majority of Patients With Metastatic Cancer Felt That Chemotherapy Might Cure Their Disease
Weeks JC, Catalano PJ, Chronin A, et al. Patients' expectations about effects of chemotherapy for advanced cancer. N Engl J Med. 2012;367:16161625.
Background
Chemotherapy for advanced cancer is not curative, and many cancer patients overestimate their prognosis. Little is known about patients' understanding of the goals of chemotherapy when cancer is advanced.
Findings
Participants were part of the Cancer Care Outcomes Research and Surveillance study. Patients with stage IV lung or colon cancer who opted to receive chemotherapy (n=1193) were asked how likely they thought it was that the chemotherapy would cure their cancer. A majority (69% of lung cancer patients and 81% of colon cancer patients) felt that chemotherapy might cure their disease. Those who rated their physicians very favorably in satisfaction surveys were more likely to feel that that chemotherapy might be curative, compared to those who rated their physician less favorably (OR: 1.90; 95% CI: 1.33‐2.72).
Cautions
The study did not include patients who died soon after diagnosis and thus does not provide information about those who opted for chemotherapy but did not survive to the interview. It is possible that responses were influenced by participants' need to express optimism (social desirability bias). It is not clear how or whether prognostic disclosure by physicians caused the lower satisfaction ratings.
Implications
Despite the fact that stage IV lung and colon cancer are not curable with chemotherapy, a majority of patients reported believing that chemotherapy might cure their disease. Hospital clinicians should be aware that many patients who they view as terminally ill believe their illness may be cured.
Older Patients Who Viewed a Goals‐of‐Care Video at Admission to a Skilled Nursing Facility Were More Likely to Prefer Comfort Care
Volandes AE, Brandeis GH, Davis AD, et al. A randomized controlled trial of a goals‐of‐care video for elderly patients admitted to skilled nursing facilities. J Palliat Med. 2012;15:805811.
Background
Seriously ill older patients are frequently discharged from hospitals to skilled nursing facilities (SNFs). It is important to clarify and document patients' goals for care at the time of admission to SNFs, to ensure that care provided there is consistent with patients' preferences. Previous work has shown promise using videos to assist patients in advance‐care planning, providing realistic and standardized portrayals of different treatment options.[9, 10]
Findings
English‐speaking patients at least 65 years of age who did not have altered mental status were randomized to hear a verbal description (n=51) or view a 6‐minute video (n=50) that presented the same information accompanied by pictures of patients of 3 possible goals of medical care: life‐prolonging care, limited medical care, and comfort care. After the video or narrative, patients were asked what their care preference would be if they became more ill while at the SNF. Patients who viewed the video were more likely to report a preference for comfort care, compared to patients who received the narrative, 80% vs 57%, P=0.02. In a review of medical records, only 31% of patients who reported a preference for comfort care had a do not resuscitate order at the SNF.
Cautions
The study was conducted at 2 nursing homes located in the Boston, Massachusetts area, which may limit generalizability. Assessors were not blinded to whether the patient saw the video or received the narrative, which may have introduced bias. The authors note that the video aimed to present the different care options without valuing one over the other, though it may have inadvertently presented one option in a more favorable light.
Implications
Videos may be powerful tools for helping nursing home patients to clarify goals of care, and might be applied in the hospital setting prior to transferring patients to nursing homes. There is a significant opportunity to improve concordance of care with preferences through better documentation and implementation of code status orders when transferring patients to SNFs.
Acknowledgments
Disclosures: Drs. Anderson and Johnson and Mr. Horton received an honorarium and support for travel to present findings resulting from the literature review at the Annual Assembly of the American Academy of Hospice and Palliative Medicine and Hospice and Palliative Nurses Association on March 16, 2013 in New Orleans, Louisiana. Dr. Anderson was funded by the National Center for Advancing Translational Sciences, National Institutes of Health, through UCSF‐CTSI grant number KL2TR000143. Its contents are solely the responsibility of the authors and do not necessarily represent the official views of the NIH. The authors report no conflicts of interest.
APPENDIX
Journals That Were Hand Searched to Identify Articles, By Topic Area
General:
- British Medical Journal
- Journal of the American Medical Association
- Lancet
- New England Journal of Medicine
Internal medicine:
- Annals Internal Medicine
- Archives Internal Medicine
- Journal of General Internal Medicine
- Journal of Hospital Medicine
Palliative care and symptom management:
- Journal Pain and Symptom Management
- Journal of Palliative Care
- Journal of Palliative Medicine
- Palliative Medicine
- Pain
Oncology:
- Journal of Clinical Oncology
- Supportive Care in Cancer
Critical care:
- American Journal of Respiratory and Critical Care Medicine
- Critical Care Medicine
Pediatrics:
- Pediatrics
Geriatrics:
- Journal of the American Geriatrics Society
Education:
- Academic Medicine
Nursing:
- Journal of Hospice and Palliative Nursing
- Oncology Nursing Forum
- The Dartmouth Atlas of Health Care. Percent of Medicare decedents hospitalized at least once during the last six months of life 2007. Available at: http://www.dartmouthatlas.org/data/table.aspx?ind=133. Accessed October 30, 2013.
- , , , et al. Change in end‐of‐life care for Medicare beneficiaries: site of death, place of care, and health care transitions in 2000, 2005, and 2009. JAMA. 2013;309(5):470–477.
- , , , et al. End‐of‐life care for lung cancer patients in the United States and Ontario. J Natl Cancer Inst. 2011;103(11):853–862.
- , , , , . Core competencies in hospital medicine: development and methodology. J Hosp Med. 2006;1(suppl 1):48–56.
- Society of Hospital Medicine; 2008.The core competencies in hospital medicine. http://www.hospitalmedicine.org/Content/NavigationMenu/Education/CoreCurriculum/Core_Competencies.htm. Accessed October 30, 2013.
- , , , , . Management of a malignant pleural effusion: British Thoracic Society Pleural Disease Guideline. Thorax. 2010;65:ii32–ii40.
- , . A comparison of sennosides‐based bowel protocols with and without docusate in hospitalized patients with cancer. J Palliat Med. 2008;11(4):575–581.
- , , , , , . Trends in survival after In‐hospital cardiac arrest. N Engl J Med. 2012;367:1912–1920.
- , , , et al. Use of video to facilitate end‐of‐life discussions with patients with cancer: a randomized controlled trial. J Clin Oncol. 2010;28(2):305–310.
- , , , et al. Augmenting advance care planning in poor prognosis cancer with a video decision aid: a preintervention‐postintervention study. Cancer. 2012;118(17):4331–4338.
Seriously ill patients frequently receive care in hospitals,[1, 2, 3] and palliative care is a core competency for hospitalists.[4, 5] The goal of this update was to summarize and critique recently published research that has the highest potential to impact the clinical practice of palliative care in the hospital. We reviewed articles published between January 2012 and May 2013. To identify articles, we hand‐searched 22 leading journals (see Appendix) and the Cochrane Database of Systematic Reviews, and performed a PubMed keyword search using the terms hospice and palliative care. We evaluated identified articles based on scientific rigor and relevance to hospital practice. In this review, we summarize 9 articles that were collectively selected as having the highest impact on the clinical practice of hospital palliative care. We summarize each article and its findings and note cautions and implications for practice.
SYMPTOM MANAGEMENT
Indwelling Pleural Catheters and Talc Pleurodesis Provide Similar Dyspnea Relief in Patients With Malignant Pleural Effusions
Davies HE, Mishra EK, Kahan BC, et al. Effect of an indwelling pleural catheter vs chest tube and talc pleurodesis for relieving dyspnea in patients with malignant pleural effusion. JAMA. 2012;307:23832389.
Background
Expert guidelines recommend chest‐tube insertion and talc pleurodesis as a first‐line therapy for symptomatic malignant pleural effusions, but indwelling pleural catheters are gaining in popularity.[6] The optimal management is unknown.
Findings
A total of 106 patients with newly diagnosed symptomatic malignant pleural effusion were randomized to undergo talc pleurodesis or placement of an indwelling pleural catheter. Most patients had metastatic breast or lung cancer. Overall, there were no differences in relief of dyspnea at 42 days between patients who received indwelling catheters and pleurodesis; importantly, more than 75% of patients in both groups reported improved shortness of breath. The initial hospitalization was much shorter in the indwelling catheter group (0 days vs 4 days). There was no difference in quality of life, but in surviving patients, dyspnea at 6 months was better with the indwelling catheter. In the talc group, 22% of patients required further pleural procedures compared with 6% in the indwelling catheter group. Patients in the talc group had a higher frequency of adverse events than in the catheter group (40% vs 13%). In the catheter group, the most common adverse events were pleural infection, cellulitis, and catheter obstruction.
Cautions
The study was small and unblinded, and the primary outcome was subjective dyspnea. The study occurred at 7 hospitals, and the impact of institutional or provider experience was not taken into account. Last, overall costs of care, which could impact the choice of intervention, were not calculated.
Implications
This was a small but well‐done study showing that indwelling catheters and talc pleurodesis provide similar relief of dyspnea 42 days postintervention. Given these results, both interventions seem to be acceptable options. Clinicians and patients could select the best option based on local procedural expertise and patient factors such as preference, ability to manage a catheter, and life expectancy.
Most Dying Patients Do Not Experience Increased Respiratory Distress When Oxygen is Withdrawn
Campbell ML, Yarandi H, Dove‐Medows E. Oxygen is nonbeneficial for most patients who are near death. J Pain Symptom Manage. 2013;45(3):517523.
Background
Oxygen is frequently administered to patients at the end of life, yet there is limited evidence evaluating whether oxygen reduces respiratory distress in dying patients.
Findings
In this double‐blind, repeated‐measure study, patients served as their own controls as the investigators evaluated respiratory distress with and without oxygen therapy. The study included 32 patients who were enrolled in hospice or seen in palliative care consultation and had a diagnosis such as lung cancer or heart failure that might cause dyspnea. Medical air (nasal cannula with air flow), supplemental oxygen, and no flow were randomly alternated every 10 minutes for 1 hour. Blinded research assistants used a validated observation scale to compare respiratory distress under each condition. At baseline, 27 of 32 (84%) patients were on oxygen. Three patients, all of whom were conscious and on oxygen at baseline, experienced increased respiratory distress without oxygen; reapplication of supplemental oxygen relieved their distress. The other 29 patients had no change in respiratory distress under the oxygen, medical air, and no flow conditions.
Cautions
All patients in this study were near death as measured by the Palliative Performance Scale, which assesses prognosis based on functional status and level of consciousness. Patients were excluded if they were receiving high‐flow oxygen by face mask or were experiencing respiratory distress at the time of initial evaluation. Some patients experienced increased discomfort after withdrawal of oxygen. Close observation is needed to determine which patients will experience distress.
Implications
The majority of patients who were receiving oxygen at baseline experienced no change in respiratory comfort when oxygen was withdrawn, supporting previous evidence that oxygen provides little benefit in nonhypoxemic patients. Oxygen may be an unnecessary intervention near death and has the potential to add to discomfort through nasal dryness and decreased mobility.
Sennosides Performed Similarly to Docusate Plus Sennosides in Managing Opioid‐Induced Constipation in Seriously Ill Patients
Tarumi Y, Wilson MP, Szafran O, Spooner GR. Randomized, double‐blind, placebo‐controlled trial of oral docusate in the management of constipation in hospice patients. J Pain Symptom Manage. 2013;45:213.
Background
Seriously ill patients frequently suffer from constipation, often as a result of opioid analgesics. Hospital clinicians should seek to optimize bowel regimens to prevent opioid‐induced constipation. A combination of the stimulant laxative sennoside and the stool softener docusate is often recommended to treat and prevent constipation. Docusate may not have additional benefit to sennoside, and may have significant burdens, including disturbing the absorption of other medications, adding to patients' pill burden and increasing nurse workload.[7]
Findings
In this double‐blinded trial, 74 patients in 3 inpatient hospices in Canada were randomized to receive sennoside plus either docusate 100 mg, or placebo tablets twice daily, or sennoside plus placebo for 10 days. Most patients had cancer as a life‐limiting diagnosis and received opioids during the study period. All were able to tolerate pills and food or sips of fluid. There was no significant difference between the 2 groups in stool frequency, volume, consistency, or patients' perceptions of difficulty with defecation. The percentage of patients who had a bowel movement at least every 3 days was 71% in the docusate plus sennoside group and 81% in the sennoside only group (P=0.45). There was also no significant difference between the groups in sennoside dose (which ranged between 13, 8.6 mg tablets daily), mean morphine equivalent daily dosage, or other bowel interventions.
Cautions
The trial was small, though it was adequately powered to detect a clinically meaningful difference between the 2 groups of 0.5 in the average number of bowel movements per day. The consent rate was low (26%); the authors do not detail reasons patients were not randomized. Patients who did not participate might have had different responses.
Implications
Consistent with previous work,[7] these results indicate that docusate is probably not needed for routine management of opioid‐induced constipation in seriously ill patients.
Sublingual Atropine Performed Similarly to Placebo in Reducing Noise Associated With Respiratory Rattle Near Death
Heisler M, Hamilton G, Abbott A, et al. Randomized double‐blind trial of sublingual atropine vs. placebo for the management of death rattle. J Pain Symptom Manage. 2012;45(1):1422.
Background
Increased respiratory tract secretions in patients near death can cause noisy breathing, often referred to as a death rattle. Antimuscarinic medications, such as atropine, are frequently used to decrease audible respirations and family distress, though little evidence exists to support this practice.
Findings
In this double‐blind, placebo‐controlled, parallel group trial at 3 inpatient hospices, 177 terminally ill patients with audible respiratory secretions were randomized to 2 drops of sublingual atropine 1% solution or placebo drops. Bedside nurses rated patients' respiratory secretions at enrollment, and 2 and 4 hours after receiving atropine or placebo. There were no differences in noise score between subjects treated with atropine and placebo at 2 hours (37.8% vs. 41.3%, P=0.24) or at 4 hours (39.7% and 51.7%, P=0.21). There were no differences in the safety end point of change in heart rate (P=0.47).
Cautions
Previous studies comparing different anticholinergic medications and routes of administration to manage audible respiratory secretions had variable response rates but suggested a benefit to antimuscarinic medications. However, these trials had significant methodological limitations including lack of randomization and blinding. The improvement in death rattle over time in other studies may suggest a favorable natural course for respiratory secretions rather than a treatment effect.
Implications
Although generalizability to other antimuscarinic medications and routes of administration is limited, in a randomized, double‐blind, placebo‐controlled trial, sublingual atropine did not reduce the noise from respiratory secretions when compared to placebo.
PATIENT AND FAMILY OUTCOMES AFTER CARDIOPULMONARY RESUSCITATION
Over Half of Older Adult Survivors of In‐Hospital Cardiopulmonary Resuscitation Were Alive At 1 Year
Chan PS, Krumholz HM, Spertus JA, et al. Long‐term outcomes in elderly survivors of in‐hospital cardiac arrest. N Engl J Med. 2013;368:10191026.
Background
Studies of cardiopulmonary resuscitation (CPR) outcomes have focused on survival to hospital discharge. Little is known about long‐term outcomes following in‐hospital cardiac arrest in older adults.
Findings
The authors analyzed data from the Get With the GuidelinesResuscitation registry from 2000 to 2008 and Medicare inpatient files from 2000 to 2010. The cohort included 6972 patients at 401 hospitals who were discharged after surviving in‐hospital arrest. Outcomes were survival and freedom from hospital readmission at 1 year after discharge. At discharge, 48% of patients had either no or mild neurologic disability at discharge; the remainder had moderate to severe neurologic disability. Overall, 58% of patients who were discharged were still alive at 1 year. Survival rates were lowest for patients who were discharged in coma or vegetative state (8% at 1 year), and highest for those discharged with mild or no disability (73% at 1 year). Older patients had lower survival rates than younger patients, as did men compared with women and blacks compared with whites. At 1 year, 34.4% of the patients had not been readmitted. Predictors of readmission were similar to those for lower survival rates.
Cautions
This study only analyzed survival data from patients who survived to hospital discharge after receiving in‐hospital CPR, not all patients who had a cardiac arrest. Thus, the survival rates reported here do not include patients who died during the original arrest, or who survived the arrest but died during their hospitalization. The 1‐year survival rate for people aged 65 years and above following a cardiac arrest is not reported but is likely to be about 10%, based on data from this registry.[8] Data were not available for health status, neurologic status, or quality of life of the survivors at 1 year.
Implications
Older patients who receive in‐hospital CPR and have a good neurologic status at hospital discharge have good long‐term outcomes. In counseling patients about CPR, it is important to note that most patients who receive CPR do not survive to hospital discharge.
Families Who Were Present During CPR Had Decreased Post‐traumatic Stress Symptoms
Jabre P, Belpomme V, Azoulay E, et al. Family presence during cardiopulmonary resuscitation. N Engl J Med. 2013;368:10081018.
Background
Family members who watch their loved ones undergo (CPR) might have increased emotional distress. Alternatively, observing CPR may allow for appreciation of the efforts taken for their loved one and provide comfort at a challenging time. The right balance of benefit and harm is unclear.
Findings
Between 2009 and 2011, 15 prehospital emergency medical service units in France were randomized to offer adult family members the opportunity to observe CPR or follow their usual practice. A total of 570 relatives were enrolled. In the intervention group, 79% of relatives observed CPR, compared to 43% in the control group. There was no difference in the effectiveness of CPR between the 2 groups. At 90 days, post‐traumatic stress symptoms were more common in the control group (adjusted odds ratio [OR]: 1.7; 95% confidence interval [CI]: 1.2‐2.5). At 90 days, those who were present for the resuscitation also had fewer symptoms of anxiety and fewer symptoms of depression (P0.009 for both). Stress of the medical teams involved in the CPR was not different between the 2 groups. No malpractice claims were filed in either group.
Cautions
The study was conducted only in France, so the results may not be generalizable outside of France. In addition, the observed resuscitation was for patients who suffered a cardiac arrest in the home; it is unclear if the same results would be found in the emergency department or hospital.
Implications
This is the highest quality study to date in this area that argues for actively inviting family members to be present for resuscitation efforts in the home. Further studies are needed to determine if hospitals should implement standard protocols. In the meantime, providers who perform CPR should consider inviting families to observe, as it may result in less emotional distress for family members.
COMMUNICATION AND DECISION MAKING
Surrogate Decision Makers Interpreted Prognostic Information Optimistically
Zier LS, Sottile PD, Hong SY, et al. Surrogate decision makers' interpretation of prognostic information: a mixed‐methods study. Ann Intern Med. 2012;156:360366.
Background
Surrogates of critically ill patients often have beliefs about prognosis that are discordant from what is told to them by providers. Little is known about why this is the case.
Findings
Eighty surrogates of patients in intensive care units (ICUs) were given questionnaires with hypothetical prognostic statements and asked to identify a survival probability associated with each statement on a 0% to 100% scale. Interviewers examined the questionnaires to identify responses that were not concordant with the given prognostic statements. They then interviewed participants to determine why the answers were discordant. The researchers found that surrogates were more likely to offer an overoptimistic interpretation of statements communicating a high risk of death, compared to statements communicating a low risk of death. The qualitative interviews revealed that surrogates felt they needed to express ongoing optimism and that patient factors not known to the medical team would lead to better outcomes.
Cautions
The participants were surrogates who were present in the ICU at the time when study investigators were there, and thus the results may not be generalizable to all surrogates. Only a subset of participants completed qualitative interviews. Prognostic statements were hypothetical. Written prognostic statements may be interpreted differently than spoken statements.
Implications
Surrogate decision makers may interpret prognostic statements optimistically, especially when a high risk of death is estimated. Inaccurate interpretation may be related to personal beliefs about the patients' strengths and a need to hold onto hope for a positive outcome. When communicating with surrogates of critically ill patients, providers should be aware that, beyond the actual information shared, many other factors influence surrogates' beliefs about prognosis.
A Majority of Patients With Metastatic Cancer Felt That Chemotherapy Might Cure Their Disease
Weeks JC, Catalano PJ, Chronin A, et al. Patients' expectations about effects of chemotherapy for advanced cancer. N Engl J Med. 2012;367:16161625.
Background
Chemotherapy for advanced cancer is not curative, and many cancer patients overestimate their prognosis. Little is known about patients' understanding of the goals of chemotherapy when cancer is advanced.
Findings
Participants were part of the Cancer Care Outcomes Research and Surveillance study. Patients with stage IV lung or colon cancer who opted to receive chemotherapy (n=1193) were asked how likely they thought it was that the chemotherapy would cure their cancer. A majority (69% of lung cancer patients and 81% of colon cancer patients) felt that chemotherapy might cure their disease. Those who rated their physicians very favorably in satisfaction surveys were more likely to feel that that chemotherapy might be curative, compared to those who rated their physician less favorably (OR: 1.90; 95% CI: 1.33‐2.72).
Cautions
The study did not include patients who died soon after diagnosis and thus does not provide information about those who opted for chemotherapy but did not survive to the interview. It is possible that responses were influenced by participants' need to express optimism (social desirability bias). It is not clear how or whether prognostic disclosure by physicians caused the lower satisfaction ratings.
Implications
Despite the fact that stage IV lung and colon cancer are not curable with chemotherapy, a majority of patients reported believing that chemotherapy might cure their disease. Hospital clinicians should be aware that many patients who they view as terminally ill believe their illness may be cured.
Older Patients Who Viewed a Goals‐of‐Care Video at Admission to a Skilled Nursing Facility Were More Likely to Prefer Comfort Care
Volandes AE, Brandeis GH, Davis AD, et al. A randomized controlled trial of a goals‐of‐care video for elderly patients admitted to skilled nursing facilities. J Palliat Med. 2012;15:805811.
Background
Seriously ill older patients are frequently discharged from hospitals to skilled nursing facilities (SNFs). It is important to clarify and document patients' goals for care at the time of admission to SNFs, to ensure that care provided there is consistent with patients' preferences. Previous work has shown promise using videos to assist patients in advance‐care planning, providing realistic and standardized portrayals of different treatment options.[9, 10]
Findings
English‐speaking patients at least 65 years of age who did not have altered mental status were randomized to hear a verbal description (n=51) or view a 6‐minute video (n=50) that presented the same information accompanied by pictures of patients of 3 possible goals of medical care: life‐prolonging care, limited medical care, and comfort care. After the video or narrative, patients were asked what their care preference would be if they became more ill while at the SNF. Patients who viewed the video were more likely to report a preference for comfort care, compared to patients who received the narrative, 80% vs 57%, P=0.02. In a review of medical records, only 31% of patients who reported a preference for comfort care had a do not resuscitate order at the SNF.
Cautions
The study was conducted at 2 nursing homes located in the Boston, Massachusetts area, which may limit generalizability. Assessors were not blinded to whether the patient saw the video or received the narrative, which may have introduced bias. The authors note that the video aimed to present the different care options without valuing one over the other, though it may have inadvertently presented one option in a more favorable light.
Implications
Videos may be powerful tools for helping nursing home patients to clarify goals of care, and might be applied in the hospital setting prior to transferring patients to nursing homes. There is a significant opportunity to improve concordance of care with preferences through better documentation and implementation of code status orders when transferring patients to SNFs.
Acknowledgments
Disclosures: Drs. Anderson and Johnson and Mr. Horton received an honorarium and support for travel to present findings resulting from the literature review at the Annual Assembly of the American Academy of Hospice and Palliative Medicine and Hospice and Palliative Nurses Association on March 16, 2013 in New Orleans, Louisiana. Dr. Anderson was funded by the National Center for Advancing Translational Sciences, National Institutes of Health, through UCSF‐CTSI grant number KL2TR000143. Its contents are solely the responsibility of the authors and do not necessarily represent the official views of the NIH. The authors report no conflicts of interest.
APPENDIX
Journals That Were Hand Searched to Identify Articles, By Topic Area
General:
- British Medical Journal
- Journal of the American Medical Association
- Lancet
- New England Journal of Medicine
Internal medicine:
- Annals Internal Medicine
- Archives Internal Medicine
- Journal of General Internal Medicine
- Journal of Hospital Medicine
Palliative care and symptom management:
- Journal Pain and Symptom Management
- Journal of Palliative Care
- Journal of Palliative Medicine
- Palliative Medicine
- Pain
Oncology:
- Journal of Clinical Oncology
- Supportive Care in Cancer
Critical care:
- American Journal of Respiratory and Critical Care Medicine
- Critical Care Medicine
Pediatrics:
- Pediatrics
Geriatrics:
- Journal of the American Geriatrics Society
Education:
- Academic Medicine
Nursing:
- Journal of Hospice and Palliative Nursing
- Oncology Nursing Forum
- The Dartmouth Atlas of Health Care. Percent of Medicare decedents hospitalized at least once during the last six months of life 2007. Available at: http://www.dartmouthatlas.org/data/table.aspx?ind=133. Accessed October 30, 2013.
- , , , et al. Change in end‐of‐life care for Medicare beneficiaries: site of death, place of care, and health care transitions in 2000, 2005, and 2009. JAMA. 2013;309(5):470–477.
- , , , et al. End‐of‐life care for lung cancer patients in the United States and Ontario. J Natl Cancer Inst. 2011;103(11):853–862.
- , , , , . Core competencies in hospital medicine: development and methodology. J Hosp Med. 2006;1(suppl 1):48–56.
- Society of Hospital Medicine; 2008.The core competencies in hospital medicine. http://www.hospitalmedicine.org/Content/NavigationMenu/Education/CoreCurriculum/Core_Competencies.htm. Accessed October 30, 2013.
- , , , , . Management of a malignant pleural effusion: British Thoracic Society Pleural Disease Guideline. Thorax. 2010;65:ii32–ii40.
- , . A comparison of sennosides‐based bowel protocols with and without docusate in hospitalized patients with cancer. J Palliat Med. 2008;11(4):575–581.
- , , , , , . Trends in survival after In‐hospital cardiac arrest. N Engl J Med. 2012;367:1912–1920.
- , , , et al. Use of video to facilitate end‐of‐life discussions with patients with cancer: a randomized controlled trial. J Clin Oncol. 2010;28(2):305–310.
- , , , et al. Augmenting advance care planning in poor prognosis cancer with a video decision aid: a preintervention‐postintervention study. Cancer. 2012;118(17):4331–4338.
Was that pressure ulcer ‘present on admission?’
Pressure ulcers have been the focus of an increasing amount of attention over the past few years, appearing everyplace from the local evening news to the government’s list of potentially preventable conditions, where they can carry a pretty steep financial penalty. When I was in residency, for some reason, they just did not seem to be such a common or important issue ... or perhaps we just didn’t pay them their due respect.
These days, they command the attention of legislators, hospital administrators, and physicians alike, not just the attention of nurses and patients, as in days past. Not long ago, the July 2, 2013, issue of Annals of Internal Medicine devoted a significant portion of an issue to the topic of pressure ulcers.
While I already knew pressure ulcers are a significant cause of morbidity, and, infrequently, mortality, I was shocked to learn the extent of this condition – an estimated 1.3 to 3 million adults in this country are affected – and that the cost to treat a pressure ulcer ranges between $37,800 and $70,000 – yes, each! The yearly cost to the U.S. health care system may be as high as $11 billion! That’s a figure I would expect to see with diabetes complications or advanced heart disease.
The article, titled "Pressure Ulcer Treatment Strategies: A Systematic Comparative Effectiveness Review," summarized evidence comparing the efficacy and safety of various treatment strategies for adults with pressure ulcers. Researchers found that using air-fluidized beds, protein supplementation, electrical stimulation, and radiant heat dressings had moderate-strength evidence for healing (Ann. Intern. Med. 2013 July 2;159:39-50).
Pressure ulcer treatment and prevention are too frequently passed on to nursing staff, probably in part because physicians are busy addressing the primary cause for admission and in part because, quite frankly, the nursing staff treat the ulcers on a day-to-day basis and are more likely to have received an in-service educational session about various treatments, not to mention they are often more up-to-date on the latest formulary alternatives for treating various stages of skin breakdown.
But hospitalists should also have some skin in the game, pardon my pun.
There are simple things we can do to help the surveillance for decubitus ulcers, such as having patients turn on their sides when we listen to their lungs, instead if asking them to sit up in bed or listening anteriorly. That way we can take a quick glance at their bottoms when we auscultate their lungs. We can also reposition some patients ourselves when we see them lying in an awkward position. Asking them or their family members to take part in frequent repositioning is yet another simple task.
With the profound impact pressure ulcers can have on quality of care, risk of complications, medical costs, and even length of stay, hospitalists are in a unique position to positively influence the rate of pressure ulcer formation by having a heightened sense of awareness of our individual patient’s risk and how we can best play a major role in preventing preventable skin breakdown.
Dr. Hester is a hospitalist with Baltimore-Washington Medical Center who has a passion for empowering patients to partner in their health care. She is the creator of the Patient Whiz, a patient-engagement app for iOS.
Younger adults with brain metastases survive longer with radiosurgery alone
ATLANTA – Younger adults with one to three brain metastases survive longer when they are treated with stereotactic radiosurgery alone rather than whole-brain radiation therapy or a combination of both modalities, researchers reported at the annual meeting of the American Society for Radiation Oncology.
Among patients aged 35-50 years, stereotactic radiosurgery (SRS) alone was associated with hazard ratios (HR) for death ranging from 0.46 to 0.64, compared with an age-matched cohort treated with a combination of SRS and whole-brain radiation therapy (WBRT), based on a meta-analysis of data on 389 individual patients in three randomized clinical trials.
For local control, however, the data show a benefit for combined SRS and WBRT. For control of distant brain metastases, the data indicate a benefit for the combined therapies, but only among patients aged 55 years and older, reported Dr. Arjun Sahgal, associate professor of radiation oncology at the University of Toronto.

"Our overall survival results favoring radiosurgery alone in younger patients may be explained by the lack of benefit of whole-brain radiation with respect to distant brain control in this cohort, while still exposing them to the harms of whole-brain radiation with respect to memory function and quality of life," he said.
Dr. Sahgal and his colleagues had previously published an aggregate meta-analysis showing that WBRT and SRS improved distant and local brain control but without overall survival benefit compared with SRS alone.
The current study looked at the raw, individual patient data from the three randomized controlled trials included in the original aggregate analysis. The trials included a 2006 study of 132 patients with an endpoint of brain tumor recurrence, a 2009 trial looking at the effect of SRS/WBRT on neurocognitive function in 58 patients, and a 2011 study examining the effect of adjuvant SRS on World Health Organization performance status scores.
The overall median time to local failure in the trials was 6.6 months for SRS alone, compared with 7.7 months for SRS/WBRT. Time to distant failure was also shorter with SRS alone, at a median of 4.7 vs. 7.7 months, respectively. Median time to death, however, was longer with SRS, at 10 vs. 8.2 months.
In a multivariate model for overall survival, the HR was 0.46 for patients at age 35 years, 0.52 at age 40, 0.58 at age 45, and 0.64 at age 50; all hazard ratios had significant confidence intervals. For patients aged 55 years and older, however, the HR for overall survival was not significant.
Patients with only one metastasis had a significantly lower risk of dying, compared with those who had two or three metastases (HR, 0.72).
The risk of local failure was significantly greater with SRS alone for patients aged 45-70.
The risk of new distant metastases was significant with SRS alone for patients aged 55 years and older, and was significantly lower for patients with one metastasis (HR, 0.63) vs. two or more metastases.
Salvage therapy was performed in 28% of patients who underwent SRS alone and 12% of those who received the combined therapies. Distant brain failures occurred in 54% of those in the SRS alone group, compared with 34% of those in the SRS/WBRT group.
Patients who underwent salvage therapy had significantly greater survival rates than those who did not, and this effect did not vary significantly by age, Dr. Sahgal reported.
The authors did not report specific funding sources. Dr. Sahgal reported having no relevant financial disclosures.
ATLANTA – Younger adults with one to three brain metastases survive longer when they are treated with stereotactic radiosurgery alone rather than whole-brain radiation therapy or a combination of both modalities, researchers reported at the annual meeting of the American Society for Radiation Oncology.
Among patients aged 35-50 years, stereotactic radiosurgery (SRS) alone was associated with hazard ratios (HR) for death ranging from 0.46 to 0.64, compared with an age-matched cohort treated with a combination of SRS and whole-brain radiation therapy (WBRT), based on a meta-analysis of data on 389 individual patients in three randomized clinical trials.
For local control, however, the data show a benefit for combined SRS and WBRT. For control of distant brain metastases, the data indicate a benefit for the combined therapies, but only among patients aged 55 years and older, reported Dr. Arjun Sahgal, associate professor of radiation oncology at the University of Toronto.
"Our overall survival results favoring radiosurgery alone in younger patients may be explained by the lack of benefit of whole-brain radiation with respect to distant brain control in this cohort, while still exposing them to the harms of whole-brain radiation with respect to memory function and quality of life," he said.
Dr. Sahgal and his colleagues had previously published an aggregate meta-analysis showing that WBRT and SRS improved distant and local brain control but without overall survival benefit compared with SRS alone.
The current study looked at the raw, individual patient data from the three randomized controlled trials included in the original aggregate analysis. The trials included a 2006 study of 132 patients with an endpoint of brain tumor recurrence, a 2009 trial looking at the effect of SRS/WBRT on neurocognitive function in 58 patients, and a 2011 study examining the effect of adjuvant SRS on World Health Organization performance status scores.
The overall median time to local failure in the trials was 6.6 months for SRS alone, compared with 7.7 months for SRS/WBRT. Time to distant failure was also shorter with SRS alone, at a median of 4.7 vs. 7.7 months, respectively. Median time to death, however, was longer with SRS, at 10 vs. 8.2 months.
In a multivariate model for overall survival, the HR was 0.46 for patients at age 35 years, 0.52 at age 40, 0.58 at age 45, and 0.64 at age 50; all hazard ratios had significant confidence intervals. For patients aged 55 years and older, however, the HR for overall survival was not significant.
Patients with only one metastasis had a significantly lower risk of dying, compared with those who had two or three metastases (HR, 0.72).
The risk of local failure was significantly greater with SRS alone for patients aged 45-70.
The risk of new distant metastases was significant with SRS alone for patients aged 55 years and older, and was significantly lower for patients with one metastasis (HR, 0.63) vs. two or more metastases.
Salvage therapy was performed in 28% of patients who underwent SRS alone and 12% of those who received the combined therapies. Distant brain failures occurred in 54% of those in the SRS alone group, compared with 34% of those in the SRS/WBRT group.
Patients who underwent salvage therapy had significantly greater survival rates than those who did not, and this effect did not vary significantly by age, Dr. Sahgal reported.
The authors did not report specific funding sources. Dr. Sahgal reported having no relevant financial disclosures.
AT THE ASTRO ANNUAL MEETING
Major finding: Stereotactic radiosurgery was associated with significantly longer overall survival among patients age 50 years and younger (hazard ratios from 0.46 to 0.64).
Data source: Meta-analysis of individual patient data from three randomized controlled clinical trials enrolling a total of 389 patients.
Disclosures: The authors did not report specific funding sources. Dr. Sahgal reported having no relevant financial disclosures.

Don’t ignore headaches in teens with bipolar disorder
ORLANDO – Canadian teenagers with bipolar disorder who reported having headaches also had more severe disease symptoms than did those who did not have headaches, according to an unpublished study.
"We echo previous calls for screening and identification of impairing headaches, such as migraines, among people with mood disorders for two reasons," Dr. Benjamin I. Goldstein, the study’s senior author, said in an interview.
"First, presence of impairing headaches may represent a subtype of bipolar disorder with unique course, characteristics, and perhaps treatment. Second, underrecognition and undertreatment of impairing headaches is well documented among adults with bipolar disorder, and our findings suggest the potential importance of treating these headaches among youth with bipolar disorder as well," said Dr. Goldstein, of Sunnybrook Health Sciences Centre, Toronto, whose poster was presented at the annual meeting of the American Academy of Child and Adolescent Psychiatry.

Most of the studies so far have been done on adults, and not much is known about this possible association among teens, noted Dr. Goldstein and his coinvestigators.
They studied 55 outpatients aged between 13 and 19 years, with bipolar disorder I, II, or not otherwise specified (NOS). Roughly 60% of the patients were female.
Thirty-three of the teens, or 60%, reported headaches, and these individuals had significantly higher rates of intake depressions score, intake mania score, and global functioning score, the researchers found.
Also, these teens had significantly greater identity confusion, anger/depression, and disinhibition/persistence.
Meanwhile, nearly half of patients with BP-II reported headaches, compared with 18% of the patients with BP-I, and 36% of those with BP-NOS.
But psychiatric hospitalizations and psychosis rates showed an opposite trend. Teens without headaches had a significantly higher rate in both categories, compared with those who had headaches.
"This was a somewhat counterintuitive finding, given the other findings of increased illness severity among youth with headaches," Dr. Goldstein wrote. "Bipolar disorder shares numerous features with psychotic disorders as well as affective disorders, such as unipolar depression and anxiety. We could speculate that whatever causal factors are implicated in headaches among youth with bipolar disorder may be more closely linked with the depression and anxiety than they are with psychosis, which is a frequent precipitant of hospitalization."
The researchers wrote that there’s a need for longitudinal studies to identify specific BP symptoms most associated with headaches, in addition to identifying biomarkers that might help with understanding the pathophysiology. There’s also a need to "identify the possible need of specific treatments for youth with BP [who] suffer from comorbid headaches."
One of the study’s limitations was its cross-sectional design and lack of a comparison group, according to the authors.
Dr. Goldstein is a consultant for Bristol-Myers Squibb and has received honoraria from Purdue Pharma.
On Twitter @NaseemSMiller
ORLANDO – Canadian teenagers with bipolar disorder who reported having headaches also had more severe disease symptoms than did those who did not have headaches, according to an unpublished study.
"We echo previous calls for screening and identification of impairing headaches, such as migraines, among people with mood disorders for two reasons," Dr. Benjamin I. Goldstein, the study’s senior author, said in an interview.
"First, presence of impairing headaches may represent a subtype of bipolar disorder with unique course, characteristics, and perhaps treatment. Second, underrecognition and undertreatment of impairing headaches is well documented among adults with bipolar disorder, and our findings suggest the potential importance of treating these headaches among youth with bipolar disorder as well," said Dr. Goldstein, of Sunnybrook Health Sciences Centre, Toronto, whose poster was presented at the annual meeting of the American Academy of Child and Adolescent Psychiatry.
Most of the studies so far have been done on adults, and not much is known about this possible association among teens, noted Dr. Goldstein and his coinvestigators.
They studied 55 outpatients aged between 13 and 19 years, with bipolar disorder I, II, or not otherwise specified (NOS). Roughly 60% of the patients were female.
Thirty-three of the teens, or 60%, reported headaches, and these individuals had significantly higher rates of intake depressions score, intake mania score, and global functioning score, the researchers found.
Also, these teens had significantly greater identity confusion, anger/depression, and disinhibition/persistence.
Meanwhile, nearly half of patients with BP-II reported headaches, compared with 18% of the patients with BP-I, and 36% of those with BP-NOS.
But psychiatric hospitalizations and psychosis rates showed an opposite trend. Teens without headaches had a significantly higher rate in both categories, compared with those who had headaches.
"This was a somewhat counterintuitive finding, given the other findings of increased illness severity among youth with headaches," Dr. Goldstein wrote. "Bipolar disorder shares numerous features with psychotic disorders as well as affective disorders, such as unipolar depression and anxiety. We could speculate that whatever causal factors are implicated in headaches among youth with bipolar disorder may be more closely linked with the depression and anxiety than they are with psychosis, which is a frequent precipitant of hospitalization."
The researchers wrote that there’s a need for longitudinal studies to identify specific BP symptoms most associated with headaches, in addition to identifying biomarkers that might help with understanding the pathophysiology. There’s also a need to "identify the possible need of specific treatments for youth with BP [who] suffer from comorbid headaches."
One of the study’s limitations was its cross-sectional design and lack of a comparison group, according to the authors.
Dr. Goldstein is a consultant for Bristol-Myers Squibb and has received honoraria from Purdue Pharma.
On Twitter @NaseemSMiller
AT THE AACAP ANNUAL MEETING
Major finding: Teenagers with headaches had significantly greater identity confusion (P = .026) as measured by the LPI, and anger/depression (P = .024) and disinhibition/persistence (P = .007).
Data source: Study of 55 outpatients aged between 13 and 19 years with bipolar disorder I, II or not otherwise specified (NOS).
Disclosures: Dr. Goldstein is a consultant for BMS, and has received honoraria from Purdue Pharma.
