User login
Auditory musical hallucinations: When a patient complains, ‘I hear a symphony!’
Nonpsychotic auditory musical hallucinations—hearing singing voices, musical tones, song lyrics, or instrumental music—occur in >20% of outpatients who have a diagnosis of an anxiety, affective, or schizophrenic disorder, with the highest prevalence (41%) in patients with obsessive-compulsive disorder (OCD).1 OCD comorbidity with other psychiatric disorders increases the frequency of auditory musical hallucinations. Auditory musical hallucinations mainly affect older (mean age, 61.5 years) females who have tinnitus and severe, high-frequency, sensorineural hearing loss.1 Auditory musical hallucinations occur in psychiatric diseases, ictal states of complex partial seizures, abnormalities of the auditory cortex, thalamic infarcts, subarachnoid hemorrhage, tumors of the brain stem, intoxication, and progressive deafness.1,2
What patients report hearing
Some patients identify 1 musical instrument that dominates others. The musical tones are reported to have a vibrating quality, similar to the sound produced by blowing air through a paper-covered comb. Some patients hear singing voices, predominantly deep in tone, although the words usually are not clear.
Patients with auditory musical hallucinations associated with deafness may not have dementia or psychosis. Both sensorineural and conductive involvement indicates a mixed type of deafness. Pure tone audiograms show a bilateral loss of >30 decibels, affecting the higher and lower ranges.2,3 Cerebral atrophy and microangiopathic changes are common co-occurring findings on MRI.
Treatment options
Reassure your patient that the experience is not necessarily associated with a psychotic disorder. Perform a complete history, physical, and neurologic examination. Rule out unilateral symptoms, tinnitus, and hearing loss. If she (he) is experiencing unilateral symptoms, pulsatile tinnitus, unilateral hearing loss, and a constant feeling of unsteadiness, further evaluation is necessary to exclude underlying pathology. Treating concurrent insomnia, depression, or anxiety might resolve the hallucinations.4
Nonpharmacotherapeutic treatments include hearing amplification, and masking tinnitus with a hearing aid emitting low-volume music or sounds of nature (ie, rainfall).4 Two cases have reported successful carbamazepine therapy; 2 other cases demonstrated success with clomipramine.5 Frequently, symptoms spontaneously remit.
Consider electroconvulsive therapy (ECT) for patients with musical hallucinations that are refractory to medical treatment and cause distress; 3 patients with concurrent major depressive disorder showed improvement after ECT.6 Antipsychotics are not recommended as first-line treatment.
Disclosure
Dr. Jain reports no financial relationship with any company whose products are mentioned in this article or with manufacturers of competing products.
1. Hermesh H, Konas S, Shiloh R, et al. Musical hallucinations: prevalence in psychotic and nonpsychotic outpatients. J Clin Psychiatry. 2004;65(2):191-197.
2. Schakenraad SM, Teunisse RJ, Olde Rikkert MG. Musical hallucinations in psychiatric patients. Int J Geriatr Psychiatry. 2006;21(4):394-397.
3. Evers S, Ellger T. The clinical spectrum of musical hallucinations. J Neurol Sci. 2004;227(1):55-65.
4. Zegarra NM, Cuetter AC, Briones DF, et al. Nonpsychotic auditory musical hallucinations in elderly persons with progressive deafness. Clin Geriatr. 2007;15(11):33-37.
5. Mahendran R. The psychopathology of musical hallucinations. Singapore Med J. 2007;48(2):e68-e70.
6. Wengel SP, Burke WJ, Holemon D. Musical hallucinations. The sounds of silence? J Am Geriatr Soc. 1989;37(2):163-166.
Nonpsychotic auditory musical hallucinations—hearing singing voices, musical tones, song lyrics, or instrumental music—occur in >20% of outpatients who have a diagnosis of an anxiety, affective, or schizophrenic disorder, with the highest prevalence (41%) in patients with obsessive-compulsive disorder (OCD).1 OCD comorbidity with other psychiatric disorders increases the frequency of auditory musical hallucinations. Auditory musical hallucinations mainly affect older (mean age, 61.5 years) females who have tinnitus and severe, high-frequency, sensorineural hearing loss.1 Auditory musical hallucinations occur in psychiatric diseases, ictal states of complex partial seizures, abnormalities of the auditory cortex, thalamic infarcts, subarachnoid hemorrhage, tumors of the brain stem, intoxication, and progressive deafness.1,2
What patients report hearing
Some patients identify 1 musical instrument that dominates others. The musical tones are reported to have a vibrating quality, similar to the sound produced by blowing air through a paper-covered comb. Some patients hear singing voices, predominantly deep in tone, although the words usually are not clear.
Patients with auditory musical hallucinations associated with deafness may not have dementia or psychosis. Both sensorineural and conductive involvement indicates a mixed type of deafness. Pure tone audiograms show a bilateral loss of >30 decibels, affecting the higher and lower ranges.2,3 Cerebral atrophy and microangiopathic changes are common co-occurring findings on MRI.
Treatment options
Reassure your patient that the experience is not necessarily associated with a psychotic disorder. Perform a complete history, physical, and neurologic examination. Rule out unilateral symptoms, tinnitus, and hearing loss. If she (he) is experiencing unilateral symptoms, pulsatile tinnitus, unilateral hearing loss, and a constant feeling of unsteadiness, further evaluation is necessary to exclude underlying pathology. Treating concurrent insomnia, depression, or anxiety might resolve the hallucinations.4
Nonpharmacotherapeutic treatments include hearing amplification, and masking tinnitus with a hearing aid emitting low-volume music or sounds of nature (ie, rainfall).4 Two cases have reported successful carbamazepine therapy; 2 other cases demonstrated success with clomipramine.5 Frequently, symptoms spontaneously remit.
Consider electroconvulsive therapy (ECT) for patients with musical hallucinations that are refractory to medical treatment and cause distress; 3 patients with concurrent major depressive disorder showed improvement after ECT.6 Antipsychotics are not recommended as first-line treatment.
Disclosure
Dr. Jain reports no financial relationship with any company whose products are mentioned in this article or with manufacturers of competing products.
1. Hermesh H, Konas S, Shiloh R, et al. Musical hallucinations: prevalence in psychotic and nonpsychotic outpatients. J Clin Psychiatry. 2004;65(2):191-197.
2. Schakenraad SM, Teunisse RJ, Olde Rikkert MG. Musical hallucinations in psychiatric patients. Int J Geriatr Psychiatry. 2006;21(4):394-397.
3. Evers S, Ellger T. The clinical spectrum of musical hallucinations. J Neurol Sci. 2004;227(1):55-65.
4. Zegarra NM, Cuetter AC, Briones DF, et al. Nonpsychotic auditory musical hallucinations in elderly persons with progressive deafness. Clin Geriatr. 2007;15(11):33-37.
5. Mahendran R. The psychopathology of musical hallucinations. Singapore Med J. 2007;48(2):e68-e70.
6. Wengel SP, Burke WJ, Holemon D. Musical hallucinations. The sounds of silence? J Am Geriatr Soc. 1989;37(2):163-166.
Angry, inattentive, and sidelined
CASE Angry and depressed
Y is a 16-year-old male who presents with his mother to our clinic for medication evaluation because of anger issues and problems learning in school. He says he has been feeling depressed for several months and noticed significant irritability. Y sleeps excessively, sometimes for more than 12 hours a day, and eats more than he usually does. He reports feeling hopeless, helpless, and guilty for letting his family down. Y, who is in the 10th grade, acknowledges trouble focusing and concentrating but attributed this to a previous diagnosis of attention-deficit/hyperactivity disorder (ADHD). He stopped taking his stimulant medication several months ago because he did not like taking it. He denies thoughts of self-harm or thinking about death.
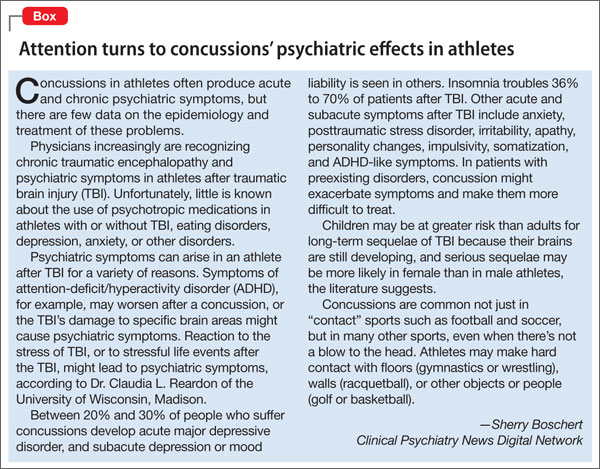
Y’s mother reports that her son had been athletic but had to stop playing football because he has had 5 concussions. Y’s inability to play sports appears to be a precipitating factor in his decline in mood (Box). He had his first concussion at age 13; the last one was several months before his presenting to the clinic. Y experienced loss of consciousness and unsteady gait after his concussions and was hospitalized for some of them. Y says his life goals are “playing sports and being a marine,” which may be compromised because of his head injuries.
His mother reports Y is having more anger outbursts and says his personality is changing. Y viewed this change as just being more assertive and fails to see that others may be scared by his behavior. He is getting into more fights at school and is more impulsive and unpredictable, according to his mother. Y is struggling in school with cognitive deficits and memory problems; his grade point average (GPA) drops from 3.5 to 0.3 over several months. He had been homeschooled initially because of uncontrolled impulsivity and aggression, but was reintegrated to public school. Y has a history of a mathematics disorder but had done well without school accommodations before the head injuries. Lack of access to his peers and poor self-esteem because of his declining grades are making his mood worse. He denies a history of substance use and his urine drug screen is negative.
Recently, Y’s grandfather, with whom he had been close, died and 2 friends were killed in car accidents in the last few years. Y has no history of psychiatric hospitalization. He had seen a psychotherapist for depression. He had been on lisdexamfetamine, 30 mg/d, citalopram, 10 mg/d, and an unknown dose of dextroamphetamine. He had no major medical comorbidities. He lives with his mother. His parents are separated but he has frequent contact with his father. His developmental history is unremarkable. There was a questionable family history of schizophrenia, “nervous breakdowns,” depression, and bipolar disorder. There was no family history of suicide.
On his initial mental status examination, Y appears to be his stated age and is dressed appropriately. He is well dressed, suggesting that he puts a lot of care into his personal appearance. He is alert and oriented. He is cooperative and has fair eye contact. His gait is normal and no motor abnormalities are evident. His speech is normal in rate, rhythm, and volume. He can remember events with great accuracy. He reports that his mood is depressed and “down.” His affect appears irritable and he has low frustration tolerance, especially towards his mother. He is easy to anger but is re-directable. He does not endorse thoughts of suicidality or harm to others. He denies auditory or visual hallucinations, and paranoia. He does not appear to be responding to internal stimuli. His judgment and insight are fair.
a) major depressive disorder
b) oppositional defiant disorder
c) bipolar disorder, most recent episode depressed
d) ADHD, untreated
e) post-concussion syndrome
The authors' observations
Traumatic brain injury (TBI) affects 1.7 to 3.8 million people in the United States. More than 473,000 children present to the emergency room annually with TBI, approximately 75% of whom are given a label of mild TBI in the United States.1-3 TBI patients present with varying degrees of problems ranging from headaches to cognitive deficits and death. Symptoms may be transient or permanent.4 Prepubescent children are at higher risk and are more likely to sustain permanent damage post-TBI, with problems in attention, executive functioning, memory, and cognition.5-7
Prognosis depends on severity of injury and environmental factors, including socioeconomic status, family dysfunction, and access to resources.8 Patients may present during the acute concussion phase with physical symptoms, such as headaches, nausea, vomiting, sensitivity to light and sounds, and memory deficits, and psychiatric complaints such as anger, irritability, and mood swings. Symptoms may persist post-concussion, leading to problems in personal relationships and social and occupational functioning, and neuropsychiatric manifestations, including changes in personality, depression, suicidal thoughts, and substance dependence. As seen in this case, Y had neuropsychiatric manifestations after his TBI but other factors, such as his ADHD diagnosis and the death of his grandfather and friends, may have contributed to his presentation.
Up to one-half of children with brain injuries may be at increased risk for unfavorable behavioral outcomes, which include internalizing and externalizing presentations.9 These behavioral problems may emerge several years after the injury and often persist or get worse with time. Behavioral functioning before injury usually dictates long-term outcomes post injury. The American Academy of Neurology recently released guidelines for the assessment and treatment of athletes with concussions (see Related Resources).
TREATMENT Restart medication
We restart Y on citalopram, 10 mg/d, which he tolerated in the past, and increase it to 20 mg/d after 4 days to address his depression and irritability. He also is restarted on lisdexamfetamine, 30 mg/d, for his ADHD. We give his mother the Child Behavior Checklist and Teacher’s Report Forms to gather additional collateral information. We ask Y to follow up in 1 month and we encourage him to continue seeing his psychotherapist.
a) neuropsychological testing
b) neurology referral
c) imaging studies
d) no testing
EVALUATION Testing
Although Y denies feeling depressed to the neuropsychologist, the examiner notes her concerns about his depression based on his mental status examination during testing.
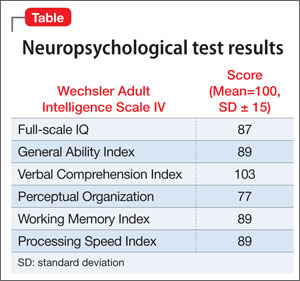
Neuropsychological testing reveals a discrepancy noted between normal verbal skills and perceptual intellectual skills that were in the borderline range (Table). Testing revealed results supporting executive dysfunction and distractibility, which are consistent with his history of ADHD. Y’s broad reading scores are in the 20th percentile and math scores in the 30th percentile. Although he has a history of a mathematics disorder, his reading deficits are considered a decline compared with his previous performance.
The authors' observations
Y is a 16-year-old male who presented with anger, depression, and academic problems. He had genetic loading with a questionable family history of schizophrenia, “nervous breakdowns,” depression, and bipolar disorder. Other than his concussions, Y was healthy, however, he had pre-morbid, untreated ADHD. He was doing well academically until his concussions, after which he started to see a steep decline in his grades. He was struggling with low self-esteem, which affected his mood. Multiple contributors perpetuated his difficulties, including, his inability to play sports; being home-schooled; removal from his friends; deaths of close friends and family; and a concern that his medical limitation to refrain from physical activities was affecting his career ambitions, contributing to his sense of hopelessness.
Y responded well to the stimulant and antidepressant, but it is important to note the increased risk of non-compliance in teenagers, even when they report seemingly minor side effects, despite doing well clinically. Y required frequent psychiatric follow up and repeat neuropsychological evaluation to monitor his progress.
OUTCOME Back on the playing field
At Y’s 1 month follow up, he reports feeling less depressed but citalopram, 20 mg/d, makes him feel “plain.” His GPA increases to 2.5 and he completes 10th grade. Lisdexamfetamine is titrated to 60 mg/d, he is focusing at school, and his anger is better controlled. Y’s mother is hesitant to change any medications because of her son’s overall improvement.
A few weeks before his next follow up appointment, Y’s mother calls stating that his depression is worse as he has not been taking citalopram because he doesn’t like how it makes him feel. He is started on fluoxetine, 10 mg/d. At his next appointment, Y says that he tolerates fluoxetine. His mood improves substantially and he is doing much better. Y’s mother says she feel that her son is more social, smiling more, and sleeping and eating better.
Several months after Y’s school performance, mood, and behaviors improve, his physicians give him permission to play non-contact sports. He is excited to play baseball. Because of his symptoms, we recommend continuing treating his ADHD and depressive symptoms and monitoring the need for medication. We discussed with Y nonpharmacotherapeutic options, including access to an individualized education plan at school, individual therapy, and formalized cognitive training.
Bottom Line
Traumatic brain injury (TBI) affects children and adults with long-term sequelae, which affects outcomes. Outcome is dependent on several risk factors. Many patients with TBI also suffer from neuropsychiatric symptoms that affect their functioning at home and in social and occupational settings. Those with premorbid psychiatric conditions need to be closely monitored because they may be at greater risk for problems with mood and executive function. Treatment should be targeted to individual complaints.
Related Resources
- Giza CC, Kutcher JS, Ashwal S, et al. Summary of evidence-based guideline update: evaluation and management of concussion in sports: report of the Guideline Development Subcommittee of the American Academy of Neurology. Neurology. 2013;80(24): 2250-2257.
- Reardon CL, Factor RM. Sport psychiatry: a systematic review of diagnosis and medical treatment of mental illness in athletes. Sports Med. 2010;40(11):961-980.
Drug Brand Names
Citalopram • Celexa Dextroamphetamine • Adderall
Fluoxetine • Prozac Lisdexamfetamine dimesylate • Vyvanse
Disclosure
The authors report no financial relationships with any company whose products are mentioned in this article or with manufacturers of competing products.
1. Jager TE, Weiss HB, Coben JH, et al. Traumatic brain injuries evaluated in US emergency departments, 1992-1994. Acad Emerg Med. 2000;7(2):134-140.
2. Committee on Quality Improvement American Academy of Pediatrics; Commission on Clinical Policies and Research American Academy of Family Physicians. The management of minor closed head injury in children. Pediatrics. 1999;104(6):1407-1415.
3. Koepsell TD, Rivara FP, Vavilala MS, et al. Incidence and descriptive epidemiologic features of traumatic brain injury in King County, Washington. Pediatrics. 2011;128(5):946-954.
4. Sahler CS, Greenwald BD. Traumatic brain injury in sports: a review [published online July 9, 2012]. Rehabil Res Pract. 2012;2012:659652. doi: 10.1155/2012/659652.
5. Crowe L, Babl F, Anderson V, et al. The epidemiology of paediatric head injuries: data from a referral centre in Victoria, Australia. J Paediatr Child Health. 2009;45(6):346-350.
6. Anderson V, Catroppa C, Morse S, et al. Intellectual outcome from preschool traumatic brain injury: a 5-year prospective, longitudinal study. Pediatrics. 2009;124(6):e1064-1071.
7. Jaffe KM, Fay GC, Polissar NL, et al. Severity of pediatric traumatic brain injury and neurobehavioral recovery at one year—a cohort study. Arch Phys Med Rehabil. 1993; 74(6):587-595.
8. Anderson VA, Catroppa C, Dudgeon P, et al. Understanding predictors of functional recovery and outcome 30 months following early childhood head injury. Neuropsychology. 2006;20(1):42-57.
9. Li L, Liu J. The effect of pediatric traumatic brain injury on behavioral outcomes: a systematic review. Dev Med Child Neurol. 2013;55(1):37-45.
CASE Angry and depressed
Y is a 16-year-old male who presents with his mother to our clinic for medication evaluation because of anger issues and problems learning in school. He says he has been feeling depressed for several months and noticed significant irritability. Y sleeps excessively, sometimes for more than 12 hours a day, and eats more than he usually does. He reports feeling hopeless, helpless, and guilty for letting his family down. Y, who is in the 10th grade, acknowledges trouble focusing and concentrating but attributed this to a previous diagnosis of attention-deficit/hyperactivity disorder (ADHD). He stopped taking his stimulant medication several months ago because he did not like taking it. He denies thoughts of self-harm or thinking about death.
Y’s mother reports that her son had been athletic but had to stop playing football because he has had 5 concussions. Y’s inability to play sports appears to be a precipitating factor in his decline in mood (Box). He had his first concussion at age 13; the last one was several months before his presenting to the clinic. Y experienced loss of consciousness and unsteady gait after his concussions and was hospitalized for some of them. Y says his life goals are “playing sports and being a marine,” which may be compromised because of his head injuries.
His mother reports Y is having more anger outbursts and says his personality is changing. Y viewed this change as just being more assertive and fails to see that others may be scared by his behavior. He is getting into more fights at school and is more impulsive and unpredictable, according to his mother. Y is struggling in school with cognitive deficits and memory problems; his grade point average (GPA) drops from 3.5 to 0.3 over several months. He had been homeschooled initially because of uncontrolled impulsivity and aggression, but was reintegrated to public school. Y has a history of a mathematics disorder but had done well without school accommodations before the head injuries. Lack of access to his peers and poor self-esteem because of his declining grades are making his mood worse. He denies a history of substance use and his urine drug screen is negative.
Recently, Y’s grandfather, with whom he had been close, died and 2 friends were killed in car accidents in the last few years. Y has no history of psychiatric hospitalization. He had seen a psychotherapist for depression. He had been on lisdexamfetamine, 30 mg/d, citalopram, 10 mg/d, and an unknown dose of dextroamphetamine. He had no major medical comorbidities. He lives with his mother. His parents are separated but he has frequent contact with his father. His developmental history is unremarkable. There was a questionable family history of schizophrenia, “nervous breakdowns,” depression, and bipolar disorder. There was no family history of suicide.
On his initial mental status examination, Y appears to be his stated age and is dressed appropriately. He is well dressed, suggesting that he puts a lot of care into his personal appearance. He is alert and oriented. He is cooperative and has fair eye contact. His gait is normal and no motor abnormalities are evident. His speech is normal in rate, rhythm, and volume. He can remember events with great accuracy. He reports that his mood is depressed and “down.” His affect appears irritable and he has low frustration tolerance, especially towards his mother. He is easy to anger but is re-directable. He does not endorse thoughts of suicidality or harm to others. He denies auditory or visual hallucinations, and paranoia. He does not appear to be responding to internal stimuli. His judgment and insight are fair.
a) major depressive disorder
b) oppositional defiant disorder
c) bipolar disorder, most recent episode depressed
d) ADHD, untreated
e) post-concussion syndrome
The authors' observations
Traumatic brain injury (TBI) affects 1.7 to 3.8 million people in the United States. More than 473,000 children present to the emergency room annually with TBI, approximately 75% of whom are given a label of mild TBI in the United States.1-3 TBI patients present with varying degrees of problems ranging from headaches to cognitive deficits and death. Symptoms may be transient or permanent.4 Prepubescent children are at higher risk and are more likely to sustain permanent damage post-TBI, with problems in attention, executive functioning, memory, and cognition.5-7
Prognosis depends on severity of injury and environmental factors, including socioeconomic status, family dysfunction, and access to resources.8 Patients may present during the acute concussion phase with physical symptoms, such as headaches, nausea, vomiting, sensitivity to light and sounds, and memory deficits, and psychiatric complaints such as anger, irritability, and mood swings. Symptoms may persist post-concussion, leading to problems in personal relationships and social and occupational functioning, and neuropsychiatric manifestations, including changes in personality, depression, suicidal thoughts, and substance dependence. As seen in this case, Y had neuropsychiatric manifestations after his TBI but other factors, such as his ADHD diagnosis and the death of his grandfather and friends, may have contributed to his presentation.
Up to one-half of children with brain injuries may be at increased risk for unfavorable behavioral outcomes, which include internalizing and externalizing presentations.9 These behavioral problems may emerge several years after the injury and often persist or get worse with time. Behavioral functioning before injury usually dictates long-term outcomes post injury. The American Academy of Neurology recently released guidelines for the assessment and treatment of athletes with concussions (see Related Resources).
TREATMENT Restart medication
We restart Y on citalopram, 10 mg/d, which he tolerated in the past, and increase it to 20 mg/d after 4 days to address his depression and irritability. He also is restarted on lisdexamfetamine, 30 mg/d, for his ADHD. We give his mother the Child Behavior Checklist and Teacher’s Report Forms to gather additional collateral information. We ask Y to follow up in 1 month and we encourage him to continue seeing his psychotherapist.
a) neuropsychological testing
b) neurology referral
c) imaging studies
d) no testing
EVALUATION Testing
Although Y denies feeling depressed to the neuropsychologist, the examiner notes her concerns about his depression based on his mental status examination during testing.
Neuropsychological testing reveals a discrepancy noted between normal verbal skills and perceptual intellectual skills that were in the borderline range (Table). Testing revealed results supporting executive dysfunction and distractibility, which are consistent with his history of ADHD. Y’s broad reading scores are in the 20th percentile and math scores in the 30th percentile. Although he has a history of a mathematics disorder, his reading deficits are considered a decline compared with his previous performance.
The authors' observations
Y is a 16-year-old male who presented with anger, depression, and academic problems. He had genetic loading with a questionable family history of schizophrenia, “nervous breakdowns,” depression, and bipolar disorder. Other than his concussions, Y was healthy, however, he had pre-morbid, untreated ADHD. He was doing well academically until his concussions, after which he started to see a steep decline in his grades. He was struggling with low self-esteem, which affected his mood. Multiple contributors perpetuated his difficulties, including, his inability to play sports; being home-schooled; removal from his friends; deaths of close friends and family; and a concern that his medical limitation to refrain from physical activities was affecting his career ambitions, contributing to his sense of hopelessness.
Y responded well to the stimulant and antidepressant, but it is important to note the increased risk of non-compliance in teenagers, even when they report seemingly minor side effects, despite doing well clinically. Y required frequent psychiatric follow up and repeat neuropsychological evaluation to monitor his progress.
OUTCOME Back on the playing field
At Y’s 1 month follow up, he reports feeling less depressed but citalopram, 20 mg/d, makes him feel “plain.” His GPA increases to 2.5 and he completes 10th grade. Lisdexamfetamine is titrated to 60 mg/d, he is focusing at school, and his anger is better controlled. Y’s mother is hesitant to change any medications because of her son’s overall improvement.
A few weeks before his next follow up appointment, Y’s mother calls stating that his depression is worse as he has not been taking citalopram because he doesn’t like how it makes him feel. He is started on fluoxetine, 10 mg/d. At his next appointment, Y says that he tolerates fluoxetine. His mood improves substantially and he is doing much better. Y’s mother says she feel that her son is more social, smiling more, and sleeping and eating better.
Several months after Y’s school performance, mood, and behaviors improve, his physicians give him permission to play non-contact sports. He is excited to play baseball. Because of his symptoms, we recommend continuing treating his ADHD and depressive symptoms and monitoring the need for medication. We discussed with Y nonpharmacotherapeutic options, including access to an individualized education plan at school, individual therapy, and formalized cognitive training.
Bottom Line
Traumatic brain injury (TBI) affects children and adults with long-term sequelae, which affects outcomes. Outcome is dependent on several risk factors. Many patients with TBI also suffer from neuropsychiatric symptoms that affect their functioning at home and in social and occupational settings. Those with premorbid psychiatric conditions need to be closely monitored because they may be at greater risk for problems with mood and executive function. Treatment should be targeted to individual complaints.
Related Resources
- Giza CC, Kutcher JS, Ashwal S, et al. Summary of evidence-based guideline update: evaluation and management of concussion in sports: report of the Guideline Development Subcommittee of the American Academy of Neurology. Neurology. 2013;80(24): 2250-2257.
- Reardon CL, Factor RM. Sport psychiatry: a systematic review of diagnosis and medical treatment of mental illness in athletes. Sports Med. 2010;40(11):961-980.
Drug Brand Names
Citalopram • Celexa Dextroamphetamine • Adderall
Fluoxetine • Prozac Lisdexamfetamine dimesylate • Vyvanse
Disclosure
The authors report no financial relationships with any company whose products are mentioned in this article or with manufacturers of competing products.
1. Jager TE, Weiss HB, Coben JH, et al. Traumatic brain injuries evaluated in US emergency departments, 1992-1994. Acad Emerg Med. 2000;7(2):134-140.
2. Committee on Quality Improvement American Academy of Pediatrics; Commission on Clinical Policies and Research American Academy of Family Physicians. The management of minor closed head injury in children. Pediatrics. 1999;104(6):1407-1415.
3. Koepsell TD, Rivara FP, Vavilala MS, et al. Incidence and descriptive epidemiologic features of traumatic brain injury in King County, Washington. Pediatrics. 2011;128(5):946-954.
4. Sahler CS, Greenwald BD. Traumatic brain injury in sports: a review [published online July 9, 2012]. Rehabil Res Pract. 2012;2012:659652. doi: 10.1155/2012/659652.
5. Crowe L, Babl F, Anderson V, et al. The epidemiology of paediatric head injuries: data from a referral centre in Victoria, Australia. J Paediatr Child Health. 2009;45(6):346-350.
6. Anderson V, Catroppa C, Morse S, et al. Intellectual outcome from preschool traumatic brain injury: a 5-year prospective, longitudinal study. Pediatrics. 2009;124(6):e1064-1071.
7. Jaffe KM, Fay GC, Polissar NL, et al. Severity of pediatric traumatic brain injury and neurobehavioral recovery at one year—a cohort study. Arch Phys Med Rehabil. 1993; 74(6):587-595.
8. Anderson VA, Catroppa C, Dudgeon P, et al. Understanding predictors of functional recovery and outcome 30 months following early childhood head injury. Neuropsychology. 2006;20(1):42-57.
9. Li L, Liu J. The effect of pediatric traumatic brain injury on behavioral outcomes: a systematic review. Dev Med Child Neurol. 2013;55(1):37-45.
NHLBI hands off hypertension guidelines to ACC, AHA
The two U.S. groups most active in issuing guidelines and recommendations for cardiovascular disease diagnosis and management, the American College of Cardiology and American Heart Association, received a surprise in June when the National Heart, Lung, and Blood Institute suddenly announced that it would shift to these and other "partner organizations" primary responsibility for the next updates of U.S. hypertension guidelines, national cholesterol-management guidelines, and the other cardiovascular disease–related management recommendations that the institute has had in the works.
The NHLBI launched "a collaborative relationship with the ACC, AHA, and other organizations because they said they are not in a position to endorse guidelines, they must be endorsed by other organizations," said Dr. Sidney C. Smith Jr., professor of medicine at the University of North Carolina in Chapel Hill. Dr. Smith is a member of the panel that’s been writing the Eighth Report of the Joint National Committee on Prevention, Detection, Evaluation, and Treatment of High Blood Pressure (JNC 8), and has been active for a long time in the ACC and AHA guidelines-development process.

On June 19, Dr. Gary H. Gibbons, NHLBI director, and his associates announced that effective immediately the institute was getting out of the guidelines-issuing business (Circulation 2013; doi: 10.1161/CIRCULATIONAHA.113.004587).
"Just over the past couple of months we began to look at how this will be done. Everyone wants the process to move quickly. How quickly can these organizations put it together? That’s the limiting factor right now," Dr. Smith said in an interview in early September.
While the ACC and AHA have on record some 20 sets of practice guidelines that cover most facets of cardiology, their list omits areas that the NHLBI covered in the past, notably hypertension and hypercholesterolemia assessment and management.
"The ACC and AHA guideline process is very expensive, and we wouldn’t dream of duplicating something when people you trust were commissioned by someone else [NHLBI] to do the work," said Dr. Kim Allan Williams Sr. of Wayne State University, Detroit. Dr. Williams will take the position of professor of medicine and chief of cardiovascular services at Rush University Medical Center in Chicago on Nov. 1. He serves as vice-president of the ACC. "We have all been under the impression that JNC 8 was being put together and getting published soon," he said in an interview.
Dr. Williams stressed that he and other ACC officials have pledged not to talk about the JNC 8 process until transition from the NHLBI works itself out, but he offered this succinct observation: The ACC "has made a commitment to go forward with the JNC process. There will be a publication from that panel, although it may not have that name."
Dr. Smith and Dr. Williams said that they had no relevant disclosures.
On Twitter @mitchelzoler
The two U.S. groups most active in issuing guidelines and recommendations for cardiovascular disease diagnosis and management, the American College of Cardiology and American Heart Association, received a surprise in June when the National Heart, Lung, and Blood Institute suddenly announced that it would shift to these and other "partner organizations" primary responsibility for the next updates of U.S. hypertension guidelines, national cholesterol-management guidelines, and the other cardiovascular disease–related management recommendations that the institute has had in the works.
The NHLBI launched "a collaborative relationship with the ACC, AHA, and other organizations because they said they are not in a position to endorse guidelines, they must be endorsed by other organizations," said Dr. Sidney C. Smith Jr., professor of medicine at the University of North Carolina in Chapel Hill. Dr. Smith is a member of the panel that’s been writing the Eighth Report of the Joint National Committee on Prevention, Detection, Evaluation, and Treatment of High Blood Pressure (JNC 8), and has been active for a long time in the ACC and AHA guidelines-development process.
On June 19, Dr. Gary H. Gibbons, NHLBI director, and his associates announced that effective immediately the institute was getting out of the guidelines-issuing business (Circulation 2013; doi: 10.1161/CIRCULATIONAHA.113.004587).
"Just over the past couple of months we began to look at how this will be done. Everyone wants the process to move quickly. How quickly can these organizations put it together? That’s the limiting factor right now," Dr. Smith said in an interview in early September.
While the ACC and AHA have on record some 20 sets of practice guidelines that cover most facets of cardiology, their list omits areas that the NHLBI covered in the past, notably hypertension and hypercholesterolemia assessment and management.
"The ACC and AHA guideline process is very expensive, and we wouldn’t dream of duplicating something when people you trust were commissioned by someone else [NHLBI] to do the work," said Dr. Kim Allan Williams Sr. of Wayne State University, Detroit. Dr. Williams will take the position of professor of medicine and chief of cardiovascular services at Rush University Medical Center in Chicago on Nov. 1. He serves as vice-president of the ACC. "We have all been under the impression that JNC 8 was being put together and getting published soon," he said in an interview.
Dr. Williams stressed that he and other ACC officials have pledged not to talk about the JNC 8 process until transition from the NHLBI works itself out, but he offered this succinct observation: The ACC "has made a commitment to go forward with the JNC process. There will be a publication from that panel, although it may not have that name."
Dr. Smith and Dr. Williams said that they had no relevant disclosures.
On Twitter @mitchelzoler

Ponatinib trials put on partial hold
As a result of adverse events, all trials of the tyrosine kinase inhibitor ponatinib (Iclusig) have been placed on partial clinical hold.
The US Food and Drug Administration (FDA) has paused new enrollment in the trials.
Patients already enrolled will continue to receive ponatinib, but at reduced doses. If trial enrollment resumes, eligibility criteria will change.
These actions come after ponatinib’s makers, Ariad Pharmaceuticals, reviewed extended follow-up data from the PACE trial and observed an increase in thrombotic events.
This phase 2 trial is testing ponatinib in patients with chronic myeloid leukemia (CML) or Philadelphia chromosome-positive acute lymphoblastic leukemia (Ph+ ALL) who have resisted or cannot tolerate therapy with dasatinib or nilotinib.
At a median follow-up of 24 months, 11.8% of PACE patients developed serious arterial thrombosis, including 6.2% with cardiovascular events, 4% with cerebrovascular events, and 3.6% with peripheral vascular events. (Some patients had more than one type of event.) In comparison, 8% of patients had serious arterial thrombosis at 11 months of follow-up.
The rate of serious venous occlusion also increased with extended follow-up. At 24 months, the event had occurred in 2.9% of patients, compared to 2.2% at 11 months of follow-up.
Ariad noted, however, that the incidence rate of arterial thrombotic events has not increased when it is normalized to the duration of treatment exposure. There were 10 events per 100 patient-years in the original analysis and 9.6 events per 100 patient-years in the current analysis.
Nevertheless, Ariad has announced the following changes to the clinical development program for ponatinib.
First, the FDA has paused patient enrollment in all clinical studies of ponatinib. Subject to agreement with the FDA, enrollment will resume with dose changes and other modifications.
Patients who are currently receiving ponatinib will continue on therapy. However, doses will be reduced, on a trial-by-trial basis, from the current 45-mg-daily dose.
The dose in patients enrolled in the EPIC trial will be reduced to 30 mg daily, unless they have achieved a major molecular response. In these patients, the dose will be reduced to 15 mg daily. EPIC is a phase 3 trial testing ponatinib in patients with newly diagnosed CML.
Once enrollment resumes for ponatinib trials, the eligibility criteria will be modified to exclude patients who have experienced prior arterial thrombosis resulting in heart attack or stroke.
The US prescribing information for ponatinib has not yet changed. The drug is still available in the US to patients with resistant or intolerant CML or Ph+ ALL at the approved, once-daily dose of 45 mg. Ponatinib was approved for this indication in the US in December and in the European Union in July.
Ariad is consulting with the FDA and other health authorities about changes in ponatinib’s product labeling to reflect the updated information.
The company is sending a written communication to healthcare providers outlining this information. Ariad is also informing the European Medicines Agency and other regulatory agencies of the changes.
For more information about the changes in ponatinib trials, visit www.clinicaltrials.gov, email inquiries to [email protected], or call the Ariad US toll-free number: (855) 552-7423, the European Union toll-free number: 800 00027423, or the international number: +1 (617)-503-7423. ![]()
Spouses surveyed report influence on CTS applicant decision making
A resident’s ability to balance work and personal life is dependent on multiple factors, with spousal or partner approval likely comprising one of the most important, according to a report published in the Journal of Surgical Education. The report details the results of an electronic survey sent to thoracic surgery spouses via contact with all thoracic surgery residents over 2 years at two training programs and all current thoracic surgery residents in 2010.
A total of 66 surveys were completed and returned (a response rate of 19%), with 86% of the respondents being women, and 82% being married for a mean of 4.3 years; 59% had children, and 64% were planning on having more children within 3 years.
Nearly 90%of the spouses responding reported that they want to travel to more of the interviews, and that they had some to complete influence on which training program to attend, according to Mr. Michael Bohl and Dr. Rishindra M. Reddy of the Section of Thoracic Surgery at the University of Michigan, Ann Arbor (J. Surg. Education 2013;70:640-6).
Nearly 80% of the respondents also reported that they wanted more information on salary and on housing, as well as access to faculty spouses. The top 3 factors in chosing a program they reported were: quality of fellowship, geographic location, and proximity to family.
Knowledge of the extent of influence and the desires of spouses with regard to CTStraining positions might allow targeting these needs at a point early enough in the process to help capture general surgery residents interested in but not committed to CTS residency, the researchers suggested.
"The results show numerous demographic and characteristic trends which, if further validated by definitive studies, would be applicable to all post-surgery residency training programs and may help CTS programs to be more competitive in attracting applicants and their families.
The authors had no relevant disclosures.
Human papillomavirus: Is it going to our heads?
In the dawn of the vaccines Gardasil and Cervarix, pediatricians, family physicians, and ob.gyns. are faced with the daunting task of educating parents about the sexually transmitted infection human papillomavirus.
We can all relate to the moment the words leave our mouths, and the parents are already refusing it because they are sure their children will never engage in such activities. Or they have been inundated with negative media reports that there are many side effects, and that the body will clear the human papillomavirus (HPV) infection on its own. It is understandable that there would be some hesitation to consent to a three-dose vaccine for a virus that is passed sexually for a child who most recently was more interested in dolls than the opposite sex. As well, many pediatricians are on the fence as to how important it is to give this vaccine to the 10- to 16-year-olds, so they shy away from detailed explanations, and the vaccine is declined.
Well, half of all oropharyngeal cancers are caused by HPV (Oral Oncol. 2011;47:1048-54), and the incidence of oropharyngeal cancers caused by HPV has increased from 16% in 1984-1989 to 72% in .2000-2004 (J. Clin. Oncol. 2011;29:4294-301).

Another CDC report on results of the 2006-2010 National Survey of Family Growth indicated that although the rates of vaginal intercourse were declining among teens, the rates of oral sex were escalating. In the survey of more than 6,000 teens aged 15-19 years, 41% of females admitted to performing oral sex, as did 35% of males. That number increased to more than 80% in both men and women when 20- to 26-year-olds were surveyed. (Natl. Health Stat. Report 2012;56:1-16).
The reason put forth for the increase in oral sex was that teens deemed it a "safer" way to have sex, and some even felt that it is not a form of sex and that they maintain their virginity as long as they don’t engage in vaginal intercourse. Many studies even point out that teens deem oral sex as a casual interaction and term it the new "goodnight kiss."
With this reality, as pediatricians and family physicians, we need to get very comfortable with this vaccine and be aggressive about educating families about the risk not only of cervical cancer, but vaginal, vulvar, and penile cancers, and most importantly the oral cancers. The time from infection to presentation of a tumor is usually about 10 years.
Although there are more than 100 strains of HPV and our bodies can clear most of them in 1-2 years, HPV 16/18 has been shown to be oncogenic and much harder to treat in the oropharyngeal area when compared with the cervical area. It also has been noted that the survival rate is better and there is less metastasis with HPV-associated cancers than non–HPV-associated cancers.
Current studies support that the HPV vaccines are decreasing the incidence of HPV infections (J. Inf. Dis. 2013;208:385-93). Awareness and education are key to eradication of this virus, and prevention starts in our offices.
Dr. Pearce is a pediatrician in Frankfort, Ill. E-mail her at [email protected].
In the dawn of the vaccines Gardasil and Cervarix, pediatricians, family physicians, and ob.gyns. are faced with the daunting task of educating parents about the sexually transmitted infection human papillomavirus.
We can all relate to the moment the words leave our mouths, and the parents are already refusing it because they are sure their children will never engage in such activities. Or they have been inundated with negative media reports that there are many side effects, and that the body will clear the human papillomavirus (HPV) infection on its own. It is understandable that there would be some hesitation to consent to a three-dose vaccine for a virus that is passed sexually for a child who most recently was more interested in dolls than the opposite sex. As well, many pediatricians are on the fence as to how important it is to give this vaccine to the 10- to 16-year-olds, so they shy away from detailed explanations, and the vaccine is declined.
Well, half of all oropharyngeal cancers are caused by HPV (Oral Oncol. 2011;47:1048-54), and the incidence of oropharyngeal cancers caused by HPV has increased from 16% in 1984-1989 to 72% in .2000-2004 (J. Clin. Oncol. 2011;29:4294-301).
Another CDC report on results of the 2006-2010 National Survey of Family Growth indicated that although the rates of vaginal intercourse were declining among teens, the rates of oral sex were escalating. In the survey of more than 6,000 teens aged 15-19 years, 41% of females admitted to performing oral sex, as did 35% of males. That number increased to more than 80% in both men and women when 20- to 26-year-olds were surveyed. (Natl. Health Stat. Report 2012;56:1-16).
The reason put forth for the increase in oral sex was that teens deemed it a "safer" way to have sex, and some even felt that it is not a form of sex and that they maintain their virginity as long as they don’t engage in vaginal intercourse. Many studies even point out that teens deem oral sex as a casual interaction and term it the new "goodnight kiss."
With this reality, as pediatricians and family physicians, we need to get very comfortable with this vaccine and be aggressive about educating families about the risk not only of cervical cancer, but vaginal, vulvar, and penile cancers, and most importantly the oral cancers. The time from infection to presentation of a tumor is usually about 10 years.
Although there are more than 100 strains of HPV and our bodies can clear most of them in 1-2 years, HPV 16/18 has been shown to be oncogenic and much harder to treat in the oropharyngeal area when compared with the cervical area. It also has been noted that the survival rate is better and there is less metastasis with HPV-associated cancers than non–HPV-associated cancers.
Current studies support that the HPV vaccines are decreasing the incidence of HPV infections (J. Inf. Dis. 2013;208:385-93). Awareness and education are key to eradication of this virus, and prevention starts in our offices.
Dr. Pearce is a pediatrician in Frankfort, Ill. E-mail her at [email protected].

Coordinated Care Approach May Be Best for Patients with Heart Failure
A new study that found no association between increased levels of hospitalist or cardiologist care and improved 30-day outcomes in older patients with heart failure might mean a coordinated approach is best, says the report’s lead author.
“Associations Between Use of the Hospitalist Model and Quality of Care and Outcomes of Older Patients Hospitalized for Heart Failure,” published in JACC Heart Failure, analyzed data from a heart-failure registry that included 31,505 Medicare beneficiaries in 166 hospitals.
After multivariable adjustment, researchers found that a 10% increase in the use of hospitalists was not related to an improvement in 30-day readmission rates, but it was linked to a slight increase in mortality (risk ratio: 1.03; 95% confidence interval [CI]: 1.00 to 1.06) and a decrease in length of stay (0.09 days; 95% CI: 0.02 to 0.16).
Similar results for 30-day readmission rates were found when care was associated with a 10% increase in the use of cardiologists, prompting lead author and cardiologist Robb Kociol, MD, to suggest that perhaps a hybrid model using both HM and cardiologist specialists may improve outcomes.
"Comanagement, or commingling of hospitalist and cardiologist care, in these patients may improve at least adherence to measures we know are associated with improved quality of care," says Dr. Kociol, director of advanced-heart-failure and ventricular-assist devices at the CardioVascular Institute at Beth Israel Deaconess Medical Center in Boston.
The paper also reported that increased use of hospitalists in hospitals with high use of cardiologists was associated with improved defect-free adherence to a composite of heart failure performance measures (risk ratio: 1.03; 95% CI: 1.01 to 1.06). Dr. Kociol says further research is needed to tease out just how a hybrid model of hospitalist-cardiologist care would work.
"One model might be that all of these patients are cared for by hospitalists with automatic cardiology consultation," he adds. "Or maybe we find a way to risk-stratify which patients are under the hospitalist service and which patients are cared for by cardiologists. None of those questions are answered in this analysis, but the paper does suggest there may be something that needs to be studied further."
Visit our website for more information on hospitalists’ impact on patient outcomes.
Hospitalist Appointed HHS’ Director of Provider Outreach
Matthew Heinz, MD, a hospitalist from Tucson, Ariz., has been appointed director of provider outreach at the U.S. Department of Health and Human Services (HHS), a position the agency created specifically to educate the public on health-care policies.
A practicing hospitalist at Tucson Medical Center and a former Arizona state legislator, Dr. Heinz travels to Washington a couple of weekends a month to work directly with healthcare providers, community leaders, and LGBT groups to provide information about implementation of the Affordable Care Act (ACA), including its coverage options and the enrollment period that started Oct. 1. He then brings questions and concerns back to HHS Secretary Kathleen Sebelius directly.
"Serving as a resource for providers and the community is a great honor," Dr. Heinz says. "It is an exciting time to be part of the Department of Health and Human Services; so much is happening with healthcare due to the ACA."
As a hospitalist for seven years, he says he understands what it means to be uninsured in America and what it can do to families economically. "I see firsthand how profoundly the lack of health insurance affects my patients," he says. "We have to make implementing the Affordable Care Act a priority, as providers, to help these families and individuals get the medical care that they need.
"This kind of change [in policies] hasn't been attempted since Medicare in the 1970s," Dr. Heinz says of the ACA. "It is a unique time and place. I'm pleased and honored that I am able to serve in this way."
Visit our website for more information on how the Affordable Care Act will affect hospitalists.
IMRT bests conventional radiation for soft-tissue sarcomas of the extremities
ATLANTA – Intensity-modulated radiation therapy proved significantly better than conventional radiation for local control of soft-tissue sarcomas of the extremities, according to new study results, investigators reported at the annual meeting of the American Society for Radiation Oncology.
The 5-year local control rate with intensity-modulated radiation therapy (IMRT) was 92.4%, compared with 85% for external-beam radiation therapy (EBRT), said Dr. Kaled M. Alektiar, a radiation oncologist at Memorial Sloan-Kettering Cancer Center in New York.
The benefits of IMRT were seen despite a preponderance of higher risks in patients treated with IMRT. And, "the morbidity profile, especially for chronic lymphedema of grade 3 or higher, was significantly less," Dr. Alektiar said.
He and his coinvestigators looked at 320 patients who underwent definitive surgery and radiation therapy at Memorial Sloan-Kettering for primary, nonmetastatic soft-tissue sarcomas of the extremities. Of this group, 155 received EBRT with a conventional technique, usually three-dimensional conformal radiation, and 165 patients received IMRT.
Most of the tumors (74.7%) were in the lower extremity, 45.6% were at least 10 cm in diameter, 92.2% were in deep tissue, 82.5% were high grade, and 40% had close or positive surgical margins. The majority of patients (75.9%) received adjuvant chemotherapy.
There were significantly more patients with positive or close margins in the IMRT group than in the conventional EBRT group (47.9% vs. 31.6%; P = .003), and more patients treated with IMRT had high-grade histology tumors, although this difference had only borderline significance (86.7% vs. 78.1%; P =.055).
Additionally, significantly more patients in the IMRT group received preoperative radiation (21.2% vs. 3.2%; P less than .001). Otherwise, the groups were balanced in terms of demographics, tumor size, depth, and use of CT in treatment planning.
The median follow-up was 49.5 months (42 months for patients treated with IMRT, and 87 months for those treated with EBRT). The 5-year local recurrence rates were 7.6% for IMRT and 15% for conventional EBRT. The median time to local recurrence was 18 months in each group.
Eight patients required amputations for salvage, including three in the IMRT cohort and five in the conventional radiation cohort.
In multivariate analysis, three factors that were significantly prognostic for local failure were IMRT (hazard ratio, 0.46; P = .02), age less than 50 years (HR, 0.44; P = .04), and a tumor size of 10 cm or less in the longest dimension (HR, 0.53; P = .05).
Overall survival at 5 years was 69.1% for IMRT and 75.6% for EBRT, a difference that was not significant.
Rates of grade 3 or 4 acute toxicities, including infected and noninfected wound complications and radiation dermatitis, were similar between the groups. Patients treated with IMRT had significantly shorter treatment interruptions, at a mean of 0.8 days, compared with 2.2 days for patients treated with conventional EBRT. Chronic grade 3 or higher lymphedema did not occur in any patients treated with IMRT, compared with four patients treated with conventional EBRT (P = .053).
The study was supported by a grant from the Clinical and Translational Science Center at Weill Cornell Medical College, New York. Dr. Alektiar reported having no relevant financial disclosures.
AT THE ASTRO ANNUAL MEETING
Major finding: The 5-year local control rate with intensity-modulated radiation therapy was 92.4%, compared with 85% for conventional external-beam radiation therapy.
Data source: Retrospective study of 320 patients treated for soft-tissue sarcomas of the extremities.
Disclosures: The study was supported by a grant from the Clinical and Translational Science Center at Weill Cornell Medical College, New York. Dr. Alektiar reported having no relevant financial disclosures.