User login
Patient Care Circle and Care Transitions
The focus on care transitions and readmissions is expanding beyond the development of risk scores based on objective clinical data to quality improvement interventions involving the key stakeholders in the process, namely the patients and their multidisciplinary providers.[1, 2] The Institute for Healthcare Improvement's State Action on Avoidable Rehospitalizations initiative promotes formulating a specific transition plan and developing multidisciplinary management strategies for all patients.[3] The Transition of Care Consensus Policy Statement developed by a coalition including the American College of Physicians and Society of Hospital Medicine emphasizes accountability, communication, and involvement of the patient and family members in plans of care.[4] Yet, interventions to reduce readmissions and improve the quality and safety of care transitions remain only modestly and inconsistently effective.
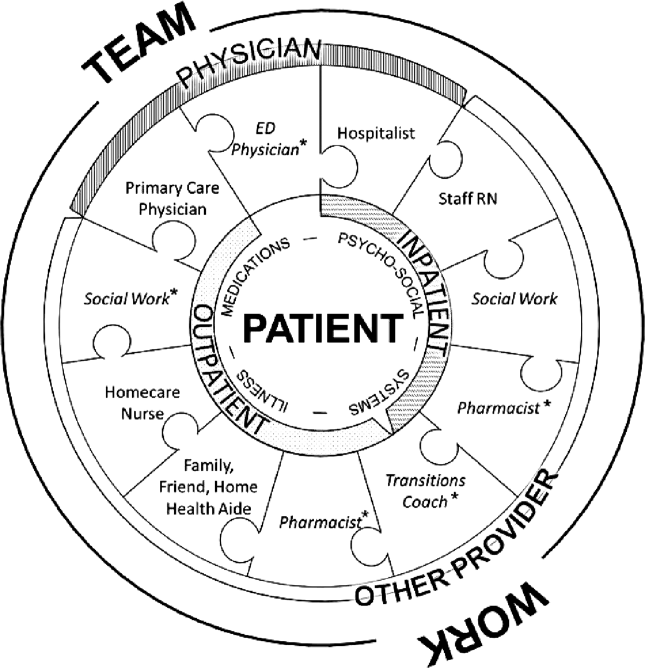
Successful interventions are those that are combined and coordinated, and shared across the hospital and community settings.[5] In this study, we sought to understand the issues leading to readmissions and barriers as perceived by patients, family members, physicians, nurses, and social workers. We compared and contrasted the perspectives by discipline and used this information to design a descriptive framework of a multidisciplinary, collaborative, and coordinated support network integral to effective care transitions, which we term a Patient Care Circle (PCC) (Figure 1).

METHODS
Study Design
We recruited a purposive sample of general medicine patients with same‐site 30‐day readmissions, and those directly involved in their care, to participate in interviews and focus groups to investigate explanations for unplanned readmissions (Table 1). We sought subjects' perspectives based on extrapolations from previous research that identified multiple stakeholders involved in the care transitions process,[1, 2, 5, 6, 7, 8] and our own professional experience with patient readmissions.
| Role | No. (%) | No. Interviewed | No. in Focus Group | |
|---|---|---|---|---|
| ||||
| Patient | 12 | NA | ||
| Male | 10 (90.9) | |||
| Average age, y, range | 3172 | |||
| Insurance | ||||
| Medicare | 5 (41.7) | |||
| Medicaid | 1 (8.3) | |||
| Medicare/Medicaid | 2 (16.7) | |||
| Private | 4 (33.3) | |||
| Race | ||||
| White | 8 (66.7) | |||
| Black | 2 (16.7) | |||
| Other | 2 (16.7) | |||
| Has PMD | 9 (75.0) | |||
| Has home caregiver (family or aide) | 10 (90.9) | |||
| Physician | ||||
| Hospitalista | 9b | |||
| Index | 10 | |||
| Readmit | 9 | |||
| Primary care physician | 5 | NA | ||
| Other provider | ||||
| RN | ||||
| Inpatient staff | 5 | 7 | ||
| Visiting home | NA | 6 | ||
| Social work | NA | 6 | ||
| Other caregivers | ||||
| Family | 2 | NA | ||
| Home aides | 0 | NA | ||
| Total | 43 | 28 | ||
Site Selection
All interviews and focus groups were conducted at New YorkPresbyterian/Weill Cornell Medical Center (NYP/WC), a large urban academic medical center in New York City serving a racially and socioeconomically diverse population. The institutional review boards at Weill Cornell Medical College and Hunter College approved this study.
Data Collection Tools
We developed semistructured interview and focus group guides (see Supporting Information, Appendixes 17, in the online version of this article) by reviewing published literature[8, 9, 10, 11, 12] and readmission pilot data that identified challenges associated with hospital discharges. Interviews were patient specific, and providers involved directly in their care were asked to consider reasons for the patients' readmissions and whether they could have been prevented. Provider interview guides were modified from the patient interview script and tailored toward their role in the patient's care.
One focus group guide was used for all sessions, allowing us to compare and contrast emerging themes across disciplines. Participants were asked to discuss perceived causes for readmissions and barriers to improvement.
All questions were open‐ended to gain insight into participants' beliefs regarding the causes of readmissions and to limit researcher bias. We iteratively reviewed and modified the guides to ensure the questions were effectively worded.
Recruiting
Using a centralized clinical database, we identified patients aged 18 years and older for interviews, who were readmitted within 30 days to NYP/WC between May 2011 and May 2012, and had an attending hospitalist during the initial and readmission visits. We confirmed patients' English fluency and cognitive ability by contacting their attending physician. Patients provided written consent prior to interview.
For interviews, we asked patients to identify their outpatient physicians and providers; inpatient hospitalists and providers were identified from the patients' charts. For focus groups, we recruited volunteers among all division hospitalists and solicited volunteer inpatient nursing, social work, and homecare nursing participants through organizational liaisons (Table 1).
Data Collection
We interviewed patients in person at their bedside. We interviewed physicians and other caregivers in person or by telephone during the course of the patient's readmission. We conducted 4 discipline‐specific 90‐minute focus groups for hospitalists, inpatient staff nurses, homecare nurses, and hospital social workers. Patient interviews and focus groups were audio‐recorded and transcribed using a professional service.
Data Analysis
We analyzed 47 transcripts (43 interviews, 4 focus groups) during research group meetings using grounded theory[13] to generate overarching themes felt to influence readmissions through iterative reviewing of transcripts. We attributed codes to salient text and documented recurring topics that emerged. Two researchers independently assessed responses from the patient‐specific interviews for variability among the various disciplines. We ended our data collection after we ceased to find new topics from participants (thematic saturation).[14]
Three researchers, in consultation with the larger team, coded the 4 focus group transcripts to generate a codebook with definitions and examples of recurring concepts. They then coded the 43 interview transcripts using the codebook. The entire team met regularly to address questions and potential discrepancies.
We achieved greater trustworthiness of the analysis by using multiple modes of triangulation, a qualitative method that relies on points of comparison and contrast.[15] We achieved methodological triangulation by using both interviews and focus groups, and achieved internal triangulation by having researchers in the clinical, social, and behavioral sciences routinely critique the evolving codebook.
RESULTS
We recruited 43 interview and 28 focus group participants (Table 1). From our transcript analysis, we generated 22 codes and categorized them into 5 themes embodying the issues pertinent to readmissions from the perspective of the stakeholders: (1) teamwork, (2) health systems navigation and management, (3) illness severity and health needs, (4) psychosocial stability; and (5) medications (Table 2).
We applied these codes and themes to build a descriptive framework depicting what we believed is the essential foundation for successful care transitions, a collaborative unified patient‐centered network to address complex healthcare‐related issues across disciplines and across settings (Figure 1). Our model illustrates the interplay between the various physician and care‐provider roles as well as the relationship of the structure of the care circle to each theme.
Care Circle Theme
Teamwork
Comprehensive, effective collaboration and communication among members of the PCC were required for the circle to function successfully and establish safe ongoing patient care across settings. Teamwork required a shared purpose and aligned incentives among all stakeholders to work as a unified patient‐centered network.
Dysfunctional teamwork led to fragmented care. Hospitalists and patients cited difficulties coordinating in‐hospital management plans with multiple consulting subspecialists. Social workers ascribed 1 potential cause for unplanned readmissions to insufficient feedback from homecare agencies regarding patients following hospital discharge:
I wouldn't mind hearing [from the home agencies][the patient] won't let me in the door' patient's doing well' or patient's still not compliant.' If we don't knowthen we can't address it [until] they come back in [to the hospital].
Meanwhile, accurate handoff of information affected the care provided by homecare nurses:
We go into assess [the patient at home] and we see something totally different than what wason a piece of paper.
Patient‐Centered Themes
Four patient‐centered themes were identified that posed challenges in the transitions process and required the support and teamwork of the PCC to deal with effectually.
Health Systems Navigation and Management
The complexities of the healthcare system in the hospital and in the community presented challenges for patients with greater needs. Meeting higher levels of patient care needs was difficult in a system where prioritizing competing responsibilities was a recurrent issue. Inpatient nurses shared:
Educat[ing] people and empower[ing] them about their health. [I]t's kind of lostwhen we have so many [tasks] that we're responsible for, the patient gets lost in all of these things. For patients requiring ongoing sub‐acute care, limited weekend and holiday hospital and skilled nursing facility personnel added to the difficulty of arranging discharges and executing care plans.
Social workers noted:
[S]ometimes people are ready for discharge and there's noprimary care physician [willing to follow them].
Obtaining additional support following discharge was another concern for patients with homecare needs:
With the Medicaid changeshomecare is going to be less [than] what's provided [now]. So they're going into a lesssafe environment. [Social worker]
Illness Severity and Health Needs
The ability to cope with disease and related stressors depended on complexity of illness, level of health literacy, and underlying psychiatric issues overlapping with the theme of psychosocial stability. Early identification and mitigation of potential postdischarge complications required PCC collaboration.
All groups agreed that patients with chronic complex comorbidities often warranted frequent access to the inpatient setting regardless of outpatient medical care:
I'm not surprised [my patient was readmitted] becausealmost anything that goes wrong leads her to the hospital. Her readmission is not avoidable because of the severity of her illness. [Primary care physician]
With patients living longer with terminal illness, several groups voiced concern regarding the frequency of hospitalizations:
People [go] into hospice in the last week of their life as opposed to in the last six months of their life.The doctor has to bring this up [I] can't do it. [Homecare nurse]
Another prevalent issue was the emotional stress that accompanies acute or exacerbations of illness. One patient shared,
I also have a four‐year‐old son. Obviously, I'm not able to care for him as much as I was. My wifehas been diagnosed with leukemia.
Psychosocial Stability
Discharge from the hospital often requires psychosocial adjustment, which may be overlooked, underestimated, or dismissed by patients and providers.
[One patient] was very visually impaired. Lives by himself. But he's youngso he wanted to go home [not] a nursing home. He got home. He got up in the middle of the night. [P]ut the wound vac[uum] on the counter [and it] fell. It broke. It started beeping. He panicked, couldn't get in touch with any of the visiting nurses because it was 2:00 a.m. And he [was readmitted], and now is saying he wants to go to sub‐acute, because he can't handle it at home. [Social worker]
Engaging patients who seemed capable of participating in their own care was often frustrating for providers:
It's depressing because you're trying to help somebody [but] they don't want to help themselves and you know you'll see them right back [in the hospital] again. [Inpatient nurse]
Social support and socioeconomic factors also impacted patients' and families' ability to cope and adjust to the community after discharge. One family member commented that he and his wife have always cared for the patient together but now he cares for her alone and must hire a private duty aide to assist.
Medications
The degree to which obtaining, understanding, and taking medications exists as an impediment to safe transitions was patient specific and dependent on all of the patient‐centered themes above. Recognition and effective intervention required a multitiered, multidisciplinary approach. Homecare nurses reflected:
Discharge planning doesn't ensure that there is someone that can go to the pharmacy to get [medications] until the [visiting] nurse comes in and sets something up.
Methods used for medication education were not always effective in reaching the patient:
I shouldn't really say that they didn't [discuss medication side effects] because I was in a lot of pain. I really don't recall somebody giving me specific [information on] side effects on the medication. [Patient]
DISCUSSION
We categorized our findings into5 principle themes that influence care transitions: teamwork, systems navigation and management, illness severity, and health needs, psychosocial stability, and medications. Many of these themes have been targeted in the literature for interventions to reduce readmissions and improve care transitions. An overarching theme of our study was the importance of the Patient Care Circle, a support system required to implement and execute comprehensive patient‐centered plans for safe and effective transitions across all settings.
Collectively, our themes emphasized that communication and comprehensive planning between all members of the PCC were instrumental to the circle's ability to address issues pertaining to the patient‐centered themes: systems navigation and management, illness severity and health needs, psychosocial stability, and medications. The strength of the bonds and collaboration within the PCC were directly dependent on the success of teamwork.
The interplay between the 4 patient‐centered themes and the degree to which they affect readmissions were variable and patient dependent. Complexities of the healthcare system and issues surrounding medications became more apparent with worsening disease severity and psychosocial instability. Complicated patients requiring more multidisciplinary interaction highlighted limitations of dispersed teams and staffing ratios. Patients faced with insurance restrictions, difficulties attending appointments, and obtaining medications required pooling the efforts of multiple PCC members to help them. Thus, these themes emphasized not only the importance of teamwork required for care coordination, but also guided the membership of the PCC to meet the patient's specific needs across the inpatient and outpatient settings.
When participants were asked to identify modifiable reasons for readmissions, the overwhelming collective response was inadequate communication and collaboration among PCC members. Clear role assignments and delegation of responsibility were also necessary to avoid gaps in care. Significant barriers to improvement included limited resources and inability to maintain the integrity of the support network needed for safe transitions.
Finally, we compared and contrasted the perceptions of the different disciplines on the factors contributing to each patient's readmission. Over all, there was substantial overlap. However, each perspective added additional layers of information allowing for a more comprehensive understanding of the problem. This demonstrated the utility of multidisciplinary patient‐centered interviews to examine readmissions and elucidate areas for intervention.
Several disciplines were not included in interviews or focus groups but were identified by our study participants as integral to a comprehensive Patient Care Circle. These include emergency medicine physicians, inpatient and outpatient pharmacists, and outpatient social workers. Some disciplines were not included due to challenges identifying discrete providers and with arranging interviews or focus groups. As their roles were mentioned several times in multiple forums, we have included them in our descriptive framework.
We designed this study with the hope of completing a full complement of patient‐specific interviews that included all stakeholders for 4 male and 4 female patients. For several reasons, we were unable to do so including challenges contacting providers and family members, and coordinating the timing of interviews with patient visits. Further, our focus on English‐speaking patients admitted to general medicine teams may limit generalizability to other vulnerable patient groups. Nevertheless, we believe we succeeded in interviewing a representative sample and obtained thematic saturation with the information obtained from our interviews and focus groups.
Last, the focus of this project was to obtain the perspectives of a full spectrum of stakeholders in the care transitions process to gain a better understanding of the reasons for readmissions. Although we did ask study participants to identify areas that may have been modifiable, we did not expand the discussion to include potential interventions, which will be the next step in our study.
CONCLUSION
Our article describes 5 main themes derived from the perspectives of multiple stakeholders involved in the care transitions process. An overarching theme was the importance of a multidisciplinary, coordinated collaborative care circle to ensure safe patient‐centered care in all settings.
The results of this study can be used by researchers and applied by care providers to improve the care transitions process. Researchers can build on our model by studying methods and interventions to improve the function of the care circle and design guidelines to create a more effective and integrated network. Institutions can adapt our methodology and tools to identify the needs of their own patient population and optimize membership in the PCC accordingly.
We feel that improving the structure and function of the care circle is necessary prior to designing interventions targeting the patient‐centered themes. Strengthening the teamwork of the PCC is fundamental to improving the quality of care transitions and reducing preventable readmissions.
Acknowledgments
The authors thank the patients, family members, social workers, nurses, and physicians who participated in their study. The authors are grateful to their research assistants for their assistance with conducting interviews, focus groups, and data collection.
Disclosures: This study was supported by the Weill Cornell Clinical and Translational Science Center: UL1 RR024996. Dr. Press is supported in part through funds provided to him as a Nanette Laitman Clinical Scholar in Public Health at the Weill Cornell Medical College. An earlier version of the article was presented as a poster at the Society of Hospital Medicine annual conference in San Diego, California in 2012.
- , , , et al. Factors contributing to all‐cause 30‐day readmissions: a structured case series across 18 hospitals. Med Care. 2012;50:599–605.
- , , , , , . Perceptions of readmitted patients on the transition from hospital to home. J Hosp Med. 2012;7(9):709–712.
- Institute for Healthcare Improvement.State Action on Avoidable Rehospitalizations (STAAR) initiative. Available at: http://www.ihi.org/offerings/Initiatives/STAAR/Pages/Improvement.aspx. Accessed January 28, 2013.
- , , , et al. Transition of Care Consensus Policy Statement, American College of Physicians–Society of General Internal Medicine–Society of Hospital Medicine–American Geriatric Society–American College of Emergency Physicians–Society of Academic Emergency Medicine. J Gen Intern Med. 2009;24(8):971–976.
- , , , . Moving beyond readmission penalties: creating an ideal process to improve transitional care. J Hosp Med. 2013;8(2):102–109.
- , , , , . Interventions to reduce 30‐day rehospitalization: a systematic review. Ann Intern Med. 2011;155:520–528.
- , , , . Promoting effective transitions of care at hospital discharge: a review of key issues for hospitalists. J Hosp Med. 2008;2:314–323.
- , , , , . How‐to guide: improving transitions from the hospital to community settings to reduce avoidable rehospitalizations. Cambridge, MA: Institute for Healthcare Improvement; June 2012. Available at: www.IHI.org. Accessed December 31, 2012.
- BOOSTing care transitions. Philadelphia, PA: Society of Hospital Medicine; 2008. Available at: http://www.hospitalmedicine.org/ResourceRoomRedesign/RR_CareTransitions/CT_Home.cfm. Accessed October 20, 2012.
- , , . Predictive validity of a questionnaire that identifies older persons at risk for hospital admission. J Am Geriatr Soc. 1995;43(4):374–377.
- . The care transitions program: healthcare services for improving quality and safety during care hand‐offs. Denver, CO: Care Transitions Program; 2007. Available at: http://www.caretransitions.org. Accessed October 22, 2012.
- , , , , . Did I do as best as the system would let me? Healthcare professional views on hospital to home care transitions. J Gen Intern Med. 2012;27(12):1649–1656.
- , . The Discovery of Grounded Theory: Strategies for Qualitative Research. Chicago, IL: Aldine; 1967.
- . The significance of saturation. Qual Health Res. 1995;5(2):147–149.
- . Understanding reliability and validity in qualitative research. Qual Rep. 2003;8(4):597–607.
The focus on care transitions and readmissions is expanding beyond the development of risk scores based on objective clinical data to quality improvement interventions involving the key stakeholders in the process, namely the patients and their multidisciplinary providers.[1, 2] The Institute for Healthcare Improvement's State Action on Avoidable Rehospitalizations initiative promotes formulating a specific transition plan and developing multidisciplinary management strategies for all patients.[3] The Transition of Care Consensus Policy Statement developed by a coalition including the American College of Physicians and Society of Hospital Medicine emphasizes accountability, communication, and involvement of the patient and family members in plans of care.[4] Yet, interventions to reduce readmissions and improve the quality and safety of care transitions remain only modestly and inconsistently effective.
Successful interventions are those that are combined and coordinated, and shared across the hospital and community settings.[5] In this study, we sought to understand the issues leading to readmissions and barriers as perceived by patients, family members, physicians, nurses, and social workers. We compared and contrasted the perspectives by discipline and used this information to design a descriptive framework of a multidisciplinary, collaborative, and coordinated support network integral to effective care transitions, which we term a Patient Care Circle (PCC) (Figure 1).
METHODS
Study Design
We recruited a purposive sample of general medicine patients with same‐site 30‐day readmissions, and those directly involved in their care, to participate in interviews and focus groups to investigate explanations for unplanned readmissions (Table 1). We sought subjects' perspectives based on extrapolations from previous research that identified multiple stakeholders involved in the care transitions process,[1, 2, 5, 6, 7, 8] and our own professional experience with patient readmissions.
| Role | No. (%) | No. Interviewed | No. in Focus Group | |
|---|---|---|---|---|
| ||||
| Patient | 12 | NA | ||
| Male | 10 (90.9) | |||
| Average age, y, range | 3172 | |||
| Insurance | ||||
| Medicare | 5 (41.7) | |||
| Medicaid | 1 (8.3) | |||
| Medicare/Medicaid | 2 (16.7) | |||
| Private | 4 (33.3) | |||
| Race | ||||
| White | 8 (66.7) | |||
| Black | 2 (16.7) | |||
| Other | 2 (16.7) | |||
| Has PMD | 9 (75.0) | |||
| Has home caregiver (family or aide) | 10 (90.9) | |||
| Physician | ||||
| Hospitalista | 9b | |||
| Index | 10 | |||
| Readmit | 9 | |||
| Primary care physician | 5 | NA | ||
| Other provider | ||||
| RN | ||||
| Inpatient staff | 5 | 7 | ||
| Visiting home | NA | 6 | ||
| Social work | NA | 6 | ||
| Other caregivers | ||||
| Family | 2 | NA | ||
| Home aides | 0 | NA | ||
| Total | 43 | 28 | ||
Site Selection
All interviews and focus groups were conducted at New YorkPresbyterian/Weill Cornell Medical Center (NYP/WC), a large urban academic medical center in New York City serving a racially and socioeconomically diverse population. The institutional review boards at Weill Cornell Medical College and Hunter College approved this study.
Data Collection Tools
We developed semistructured interview and focus group guides (see Supporting Information, Appendixes 17, in the online version of this article) by reviewing published literature[8, 9, 10, 11, 12] and readmission pilot data that identified challenges associated with hospital discharges. Interviews were patient specific, and providers involved directly in their care were asked to consider reasons for the patients' readmissions and whether they could have been prevented. Provider interview guides were modified from the patient interview script and tailored toward their role in the patient's care.
One focus group guide was used for all sessions, allowing us to compare and contrast emerging themes across disciplines. Participants were asked to discuss perceived causes for readmissions and barriers to improvement.
All questions were open‐ended to gain insight into participants' beliefs regarding the causes of readmissions and to limit researcher bias. We iteratively reviewed and modified the guides to ensure the questions were effectively worded.
Recruiting
Using a centralized clinical database, we identified patients aged 18 years and older for interviews, who were readmitted within 30 days to NYP/WC between May 2011 and May 2012, and had an attending hospitalist during the initial and readmission visits. We confirmed patients' English fluency and cognitive ability by contacting their attending physician. Patients provided written consent prior to interview.
For interviews, we asked patients to identify their outpatient physicians and providers; inpatient hospitalists and providers were identified from the patients' charts. For focus groups, we recruited volunteers among all division hospitalists and solicited volunteer inpatient nursing, social work, and homecare nursing participants through organizational liaisons (Table 1).
Data Collection
We interviewed patients in person at their bedside. We interviewed physicians and other caregivers in person or by telephone during the course of the patient's readmission. We conducted 4 discipline‐specific 90‐minute focus groups for hospitalists, inpatient staff nurses, homecare nurses, and hospital social workers. Patient interviews and focus groups were audio‐recorded and transcribed using a professional service.
Data Analysis
We analyzed 47 transcripts (43 interviews, 4 focus groups) during research group meetings using grounded theory[13] to generate overarching themes felt to influence readmissions through iterative reviewing of transcripts. We attributed codes to salient text and documented recurring topics that emerged. Two researchers independently assessed responses from the patient‐specific interviews for variability among the various disciplines. We ended our data collection after we ceased to find new topics from participants (thematic saturation).[14]
Three researchers, in consultation with the larger team, coded the 4 focus group transcripts to generate a codebook with definitions and examples of recurring concepts. They then coded the 43 interview transcripts using the codebook. The entire team met regularly to address questions and potential discrepancies.
We achieved greater trustworthiness of the analysis by using multiple modes of triangulation, a qualitative method that relies on points of comparison and contrast.[15] We achieved methodological triangulation by using both interviews and focus groups, and achieved internal triangulation by having researchers in the clinical, social, and behavioral sciences routinely critique the evolving codebook.
RESULTS
We recruited 43 interview and 28 focus group participants (Table 1). From our transcript analysis, we generated 22 codes and categorized them into 5 themes embodying the issues pertinent to readmissions from the perspective of the stakeholders: (1) teamwork, (2) health systems navigation and management, (3) illness severity and health needs, (4) psychosocial stability; and (5) medications (Table 2).
We applied these codes and themes to build a descriptive framework depicting what we believed is the essential foundation for successful care transitions, a collaborative unified patient‐centered network to address complex healthcare‐related issues across disciplines and across settings (Figure 1). Our model illustrates the interplay between the various physician and care‐provider roles as well as the relationship of the structure of the care circle to each theme.
Care Circle Theme
Teamwork
Comprehensive, effective collaboration and communication among members of the PCC were required for the circle to function successfully and establish safe ongoing patient care across settings. Teamwork required a shared purpose and aligned incentives among all stakeholders to work as a unified patient‐centered network.
Dysfunctional teamwork led to fragmented care. Hospitalists and patients cited difficulties coordinating in‐hospital management plans with multiple consulting subspecialists. Social workers ascribed 1 potential cause for unplanned readmissions to insufficient feedback from homecare agencies regarding patients following hospital discharge:
I wouldn't mind hearing [from the home agencies][the patient] won't let me in the door' patient's doing well' or patient's still not compliant.' If we don't knowthen we can't address it [until] they come back in [to the hospital].
Meanwhile, accurate handoff of information affected the care provided by homecare nurses:
We go into assess [the patient at home] and we see something totally different than what wason a piece of paper.
Patient‐Centered Themes
Four patient‐centered themes were identified that posed challenges in the transitions process and required the support and teamwork of the PCC to deal with effectually.
Health Systems Navigation and Management
The complexities of the healthcare system in the hospital and in the community presented challenges for patients with greater needs. Meeting higher levels of patient care needs was difficult in a system where prioritizing competing responsibilities was a recurrent issue. Inpatient nurses shared:
Educat[ing] people and empower[ing] them about their health. [I]t's kind of lostwhen we have so many [tasks] that we're responsible for, the patient gets lost in all of these things. For patients requiring ongoing sub‐acute care, limited weekend and holiday hospital and skilled nursing facility personnel added to the difficulty of arranging discharges and executing care plans.
Social workers noted:
[S]ometimes people are ready for discharge and there's noprimary care physician [willing to follow them].
Obtaining additional support following discharge was another concern for patients with homecare needs:
With the Medicaid changeshomecare is going to be less [than] what's provided [now]. So they're going into a lesssafe environment. [Social worker]
Illness Severity and Health Needs
The ability to cope with disease and related stressors depended on complexity of illness, level of health literacy, and underlying psychiatric issues overlapping with the theme of psychosocial stability. Early identification and mitigation of potential postdischarge complications required PCC collaboration.
All groups agreed that patients with chronic complex comorbidities often warranted frequent access to the inpatient setting regardless of outpatient medical care:
I'm not surprised [my patient was readmitted] becausealmost anything that goes wrong leads her to the hospital. Her readmission is not avoidable because of the severity of her illness. [Primary care physician]
With patients living longer with terminal illness, several groups voiced concern regarding the frequency of hospitalizations:
People [go] into hospice in the last week of their life as opposed to in the last six months of their life.The doctor has to bring this up [I] can't do it. [Homecare nurse]
Another prevalent issue was the emotional stress that accompanies acute or exacerbations of illness. One patient shared,
I also have a four‐year‐old son. Obviously, I'm not able to care for him as much as I was. My wifehas been diagnosed with leukemia.
Psychosocial Stability
Discharge from the hospital often requires psychosocial adjustment, which may be overlooked, underestimated, or dismissed by patients and providers.
[One patient] was very visually impaired. Lives by himself. But he's youngso he wanted to go home [not] a nursing home. He got home. He got up in the middle of the night. [P]ut the wound vac[uum] on the counter [and it] fell. It broke. It started beeping. He panicked, couldn't get in touch with any of the visiting nurses because it was 2:00 a.m. And he [was readmitted], and now is saying he wants to go to sub‐acute, because he can't handle it at home. [Social worker]
Engaging patients who seemed capable of participating in their own care was often frustrating for providers:
It's depressing because you're trying to help somebody [but] they don't want to help themselves and you know you'll see them right back [in the hospital] again. [Inpatient nurse]
Social support and socioeconomic factors also impacted patients' and families' ability to cope and adjust to the community after discharge. One family member commented that he and his wife have always cared for the patient together but now he cares for her alone and must hire a private duty aide to assist.
Medications
The degree to which obtaining, understanding, and taking medications exists as an impediment to safe transitions was patient specific and dependent on all of the patient‐centered themes above. Recognition and effective intervention required a multitiered, multidisciplinary approach. Homecare nurses reflected:
Discharge planning doesn't ensure that there is someone that can go to the pharmacy to get [medications] until the [visiting] nurse comes in and sets something up.
Methods used for medication education were not always effective in reaching the patient:
I shouldn't really say that they didn't [discuss medication side effects] because I was in a lot of pain. I really don't recall somebody giving me specific [information on] side effects on the medication. [Patient]
DISCUSSION
We categorized our findings into5 principle themes that influence care transitions: teamwork, systems navigation and management, illness severity, and health needs, psychosocial stability, and medications. Many of these themes have been targeted in the literature for interventions to reduce readmissions and improve care transitions. An overarching theme of our study was the importance of the Patient Care Circle, a support system required to implement and execute comprehensive patient‐centered plans for safe and effective transitions across all settings.
Collectively, our themes emphasized that communication and comprehensive planning between all members of the PCC were instrumental to the circle's ability to address issues pertaining to the patient‐centered themes: systems navigation and management, illness severity and health needs, psychosocial stability, and medications. The strength of the bonds and collaboration within the PCC were directly dependent on the success of teamwork.
The interplay between the 4 patient‐centered themes and the degree to which they affect readmissions were variable and patient dependent. Complexities of the healthcare system and issues surrounding medications became more apparent with worsening disease severity and psychosocial instability. Complicated patients requiring more multidisciplinary interaction highlighted limitations of dispersed teams and staffing ratios. Patients faced with insurance restrictions, difficulties attending appointments, and obtaining medications required pooling the efforts of multiple PCC members to help them. Thus, these themes emphasized not only the importance of teamwork required for care coordination, but also guided the membership of the PCC to meet the patient's specific needs across the inpatient and outpatient settings.
When participants were asked to identify modifiable reasons for readmissions, the overwhelming collective response was inadequate communication and collaboration among PCC members. Clear role assignments and delegation of responsibility were also necessary to avoid gaps in care. Significant barriers to improvement included limited resources and inability to maintain the integrity of the support network needed for safe transitions.
Finally, we compared and contrasted the perceptions of the different disciplines on the factors contributing to each patient's readmission. Over all, there was substantial overlap. However, each perspective added additional layers of information allowing for a more comprehensive understanding of the problem. This demonstrated the utility of multidisciplinary patient‐centered interviews to examine readmissions and elucidate areas for intervention.
Several disciplines were not included in interviews or focus groups but were identified by our study participants as integral to a comprehensive Patient Care Circle. These include emergency medicine physicians, inpatient and outpatient pharmacists, and outpatient social workers. Some disciplines were not included due to challenges identifying discrete providers and with arranging interviews or focus groups. As their roles were mentioned several times in multiple forums, we have included them in our descriptive framework.
We designed this study with the hope of completing a full complement of patient‐specific interviews that included all stakeholders for 4 male and 4 female patients. For several reasons, we were unable to do so including challenges contacting providers and family members, and coordinating the timing of interviews with patient visits. Further, our focus on English‐speaking patients admitted to general medicine teams may limit generalizability to other vulnerable patient groups. Nevertheless, we believe we succeeded in interviewing a representative sample and obtained thematic saturation with the information obtained from our interviews and focus groups.
Last, the focus of this project was to obtain the perspectives of a full spectrum of stakeholders in the care transitions process to gain a better understanding of the reasons for readmissions. Although we did ask study participants to identify areas that may have been modifiable, we did not expand the discussion to include potential interventions, which will be the next step in our study.
CONCLUSION
Our article describes 5 main themes derived from the perspectives of multiple stakeholders involved in the care transitions process. An overarching theme was the importance of a multidisciplinary, coordinated collaborative care circle to ensure safe patient‐centered care in all settings.
The results of this study can be used by researchers and applied by care providers to improve the care transitions process. Researchers can build on our model by studying methods and interventions to improve the function of the care circle and design guidelines to create a more effective and integrated network. Institutions can adapt our methodology and tools to identify the needs of their own patient population and optimize membership in the PCC accordingly.
We feel that improving the structure and function of the care circle is necessary prior to designing interventions targeting the patient‐centered themes. Strengthening the teamwork of the PCC is fundamental to improving the quality of care transitions and reducing preventable readmissions.
Acknowledgments
The authors thank the patients, family members, social workers, nurses, and physicians who participated in their study. The authors are grateful to their research assistants for their assistance with conducting interviews, focus groups, and data collection.
Disclosures: This study was supported by the Weill Cornell Clinical and Translational Science Center: UL1 RR024996. Dr. Press is supported in part through funds provided to him as a Nanette Laitman Clinical Scholar in Public Health at the Weill Cornell Medical College. An earlier version of the article was presented as a poster at the Society of Hospital Medicine annual conference in San Diego, California in 2012.
- , , , et al. Factors contributing to all‐cause 30‐day readmissions: a structured case series across 18 hospitals. Med Care. 2012;50:599–605.
- , , , , , . Perceptions of readmitted patients on the transition from hospital to home. J Hosp Med. 2012;7(9):709–712.
- Institute for Healthcare Improvement.State Action on Avoidable Rehospitalizations (STAAR) initiative. Available at: http://www.ihi.org/offerings/Initiatives/STAAR/Pages/Improvement.aspx. Accessed January 28, 2013.
- , , , et al. Transition of Care Consensus Policy Statement, American College of Physicians–Society of General Internal Medicine–Society of Hospital Medicine–American Geriatric Society–American College of Emergency Physicians–Society of Academic Emergency Medicine. J Gen Intern Med. 2009;24(8):971–976.
- , , , . Moving beyond readmission penalties: creating an ideal process to improve transitional care. J Hosp Med. 2013;8(2):102–109.
- , , , , . Interventions to reduce 30‐day rehospitalization: a systematic review. Ann Intern Med. 2011;155:520–528.
- , , , . Promoting effective transitions of care at hospital discharge: a review of key issues for hospitalists. J Hosp Med. 2008;2:314–323.
- , , , , . How‐to guide: improving transitions from the hospital to community settings to reduce avoidable rehospitalizations. Cambridge, MA: Institute for Healthcare Improvement; June 2012. Available at: www.IHI.org. Accessed December 31, 2012.
- BOOSTing care transitions. Philadelphia, PA: Society of Hospital Medicine; 2008. Available at: http://www.hospitalmedicine.org/ResourceRoomRedesign/RR_CareTransitions/CT_Home.cfm. Accessed October 20, 2012.
- , , . Predictive validity of a questionnaire that identifies older persons at risk for hospital admission. J Am Geriatr Soc. 1995;43(4):374–377.
- . The care transitions program: healthcare services for improving quality and safety during care hand‐offs. Denver, CO: Care Transitions Program; 2007. Available at: http://www.caretransitions.org. Accessed October 22, 2012.
- , , , , . Did I do as best as the system would let me? Healthcare professional views on hospital to home care transitions. J Gen Intern Med. 2012;27(12):1649–1656.
- , . The Discovery of Grounded Theory: Strategies for Qualitative Research. Chicago, IL: Aldine; 1967.
- . The significance of saturation. Qual Health Res. 1995;5(2):147–149.
- . Understanding reliability and validity in qualitative research. Qual Rep. 2003;8(4):597–607.
© 2013 Society of Hospital Medicine
Periprocedural Use of Blood Products
Although inpatient blood product transfusion is common, many uses have not been subject to rigorous clinical study, and great practice variations exist. Of particular interest to the hospitalist is the use of red blood cells (RBCs), plasma, and platelets prior to an invasive procedure to correct anemia or a perceived bleeding risk. When considering blood product use in this context, the hospitalist faces 2 questions. First, what are the risks of anemia, thrombocytopenia, or abnormal coagulation tests? Second, what is the evidence that administration of the blood product in question improves outcomes such as bleeding and mortality? We address these questions in this review of the data supporting the use of RBCs, platelets, and plasma prior to invasive procedures.
RED BLOOD CELLS
Anemia is the most common hematologic concern in the perioperative setting. In 2009, approximately 15 million units of RBCs were transfused in the United States, 40% to 70% of which were given in the perioperative setting.[1, 2]
Risks of Periprocedural Anemia
The best evidence regarding the risks of perioperative anemia comes from studies in patients who declined blood transfusions. A retrospective cohort study of 1958 consecutive surgical patients who refused transfusions due to religious reasons showed an increase in 30‐day mortality as preoperative hemoglobin values fell, especially for those with preoperative hemoglobin concentrations 6 g/dL.[3] For patients with underlying cardiovascular disease, the risk of death was greatest when the preoperative hemoglobin value was 10 g/dL. Subsequent analysis showed that mortality rose with postoperative hemoglobin levels 7 g/dL, with a sharp rise in morbidity (myocardial infarction [MI], congestive heart failure [CHF], arrhythmia, and infection) and mortality in those with postoperative hemoglobin of 5 to 6 g/dL.[4] These results are consistent with studies of healthy volunteers who underwent acute isovolumic hemoglobin reduction, demonstrating clinical changes when hemoglobin values fell to 5 to 7 g/dL.[5, 6, 7, 8]
Several large, retrospective cohort studies have evaluated anemia and perioperative morbidity and mortality. A 2007 study analyzed data from over 310,000 predominantly male patients over age 65 years undergoing major noncardiac surgery.[9] Even mild degrees of preoperative anemia were associated with increased 30‐day mortality and cardiovascular morbidity (cardiac arrest or Q‐wave MI), with a monotonic rise in mortality (3.5%35.4%) and cardiac events (1.8%14.6%) when the hematocrit was 39%. Utilizing data from the American College of Surgeons' National Surgical Quality Improvement Program database, a 2011 study evaluated over 227,000 patients who underwent major noncardiac surgery.[10] Again, even mild anemia (hematocrit 29%39%) was independently associated with an increase in 30‐day composite morbidity, including MI, stroke, pneumonia, acute renal failure, wound infection, sepsis (13.27%), and mortality (3.52%).
Does RBC Transfusion Improve Outcomes?
Although the evidence argues that perioperative anemia is associated with poor surgical outcomes, it is not clear whether RBC transfusion in the perioperative setting improves these outcomes. Furthermore, the optimal perioperative hemoglobin level remains controversial. Importantly, most periprocedural trials were not sufficiently powered to assess differences in clinical outcomes.[11]
Several noteworthy randomized controlled trials (RCTs) comprise the bulk of the evidence regarding transfusion thresholds and are summarized in Table 1. The Transfusion Requirements in Critical Care (TRICC) was a landmark trial that randomized patients to a restrictive or a liberal transfusion strategy and demonstrated a trend toward lower 30‐day mortality in the restrictive group.[12] In addition, the restrictive transfusion group had lower rates of myocardial infarction and pulmonary edema. A subsequent subanalysis found no difference in mortality in patients with underlying cardiovascular disease.[13]
| Study/Year | No. of Patients | Brief Description | Transfusion Strategy | Outcomes (Restrictive Versus Liberal) |
|---|---|---|---|---|
| ||||
| Herbert et al. (TRICC)/1999[12] | 838 | Normovolemic patients admitted to ICU with Hg 9 g/dL within 72 hours of admission. | Restrictive: Hg maintained 79 g/dL. Liberal: Hg maintained 1012 g/dL. | 30‐day mortality (18.7% vs 23.3%, P=0.11). Pulmonary edema (5.3% vs 10.7%, P0.01) and MI (0.7% vs 2.9%, P=0.02) rates while in the ICU. |
| Carson et al. (FOCUS)/2011[14] | 2016 | Patients undergoing surgery for hip fracture with a history of cardiovascular disease or cardiovascular risk factors. | Restrictive: transfused for Hg 8 g/dL or symptomatic anemia. Liberal: transfused to maintain Hg >10 g/dL. | Primary outcome of death or the inability to walk 10 feet across the room without human assistance at 60 days (34.7% vs 35.2%, P=0.9). Composite of in‐hospital ACS or death (5.2% vs. 4.3%). The frequencies of in‐hospital clinical events and adverse events did not differ significantly between groups. |
| Hajjar et al. (TRACS)/2010[15] | 502 | Patients admitted to ICU for elective cardiac surgery with cardiopulmonary bypass. | Restrictive: transfused to maintain Hct 24%. Liberal: transfused to maintain Hct 30%. | Composite end point of 30‐day all‐cause mortality+severe in‐hospital morbidity (cardiogenic shock, ARDS, or AKI requiring renal replacement therapy) (11% vs 10%, P=0.85). |
| Bracey et al./1999[16] | 428 | Patients undergoing first‐time elective coronary surgical revascularization. | Restrictive: postoperative transfusion for Hg 8 g/dL or predetermined clinical conditions requiring RBC transfusion (ie, hemodynamic instability). | Hospital mortality (1.4% vs 2.7%, P=0.3). |
| Liberal: transfusion at discretion of physician with institutional guidelines recommending postoperative transfusion for Hg 9 g/dL. | No differences in morbidity (including pulmonary complications, renal failure, and MI), duration of mechanical ventilation, and length of hospital stay (7.52.9 days vs 7.94.9 days). | |||
| Villanueva et al./2013[17] | 921 | Severe upper GI bleeding, gastroscopy within 6 hours. | Restrictive: transfused if Hg 7 g/dL. Liberal: transfused if Hg 9 g/dL. | Survival at 6 weeks (95% vs 91%, P=0.02). |
| Rebleeding (10% vs 16%, P=0.01). Adverse event rate including transfusion reactions, ACS, AKI, pulmonary complications, infection, and stroke or TIA (40% vs 48%, P=0.02). | ||||
| Carson et al. (MINT)/2013[18] | 110 | Pilot study in patients with Hg 10 g/dL and either ACS or stable angina undergoing cardiac catheterization. | Restrictive: transfused if Hg 8 g/dL or symptomatic anemia. Liberal: transfused to raise Hg 10 g/dL. | Composite primary outcome of all cause mortality+MI+unscheduled coronary revascularization within 30 days (25.5% vs 10.9%, P=0.054). Death at 30 days (13% vs 1.8%, P=0.032). |
| Cooper et al. (CRIT)/2011[19] | 45 | Pilot study in patients with acute MI (chest pain and positive cardiac biomarker) and Hct 30% within 72 hours of symptom onset. | Restrictive: transfused to maintain Hct 24%27%. | The primary composite outcome (in‐hospital death, recurrent MI, or new or worsening CHF) (13% vs 38%, P=0.046). |
| Liberal: transfused to maintain Hct 30% to 33%. | ||||
The largest RCT of transfusion thresholds, the Transfusion Trigger Trial for Functional Outcomes in Cardiovascular Patients Undergoing Surgical Hip Fracture Repair (FOCUS), randomized patients undergoing surgery for hip fracture with a history of cardiovascular disease or cardiovascular risk factors to a restrictive or liberal transfusion strategy.[14] The primary outcome of death or the inability to walk 10 feet across the room without human assistance at 60 days was similar in both the liberal and restrictive group, and the composite rate of acute coronary syndrome and in‐hospital death, stroke, CHF, venous thromboembolism, and the frequencies of other in‐hospital events or lengths of stay did not differ between the groups.
Several RCTs have examined the effect of transfusion practice on patients undergoing elective cardiac surgery. The Transfusion Requirements After Cardiac Surgery (TRACS) study did not show a difference in the primary composite outcome of 30‐day all‐cause mortality and in‐hospital morbidity between the restrictive and liberal transfusion groups.[15] A second cardiac surgery trial also found no difference in mortality or morbidity outcomes when comparing a restrictive versus liberal transfusion threshold.[16]
A recent RBC transfusion trial evaluated transfusion thresholds in patients with severe upper gastrointestinal bleeding.[17] All patients underwent gastroscopy within 6 hours of hospital admission and were randomly allocated to a restrictive or liberal transfusion threshold. The restrictive group had a significantly higher survival at 6 weeks when compared to the liberal group, as well as lower rates of adverse events such as further bleeding, acute coronary syndrome, transfusion reactions, and pulmonary edema.
Finally, the Myocardial Ischemia and Transfusion (MINT) pilot trial evaluated 110 patients with hemoglobin concentration l10 g/dL admitted for ST‐segment elevation MI, nonST‐segment elevation MI, unstable angina, or stable coronary disease undergoing a cardiac catheterization.[18] The composite end point of death, MI, and unscheduled revascularizations within 30 days was higher in the restrictive group when compared to the liberal group, and 30‐day mortality was less frequent in liberal strategy compared to restrictive strategy. Given the small study size and the fact that patients in the restrictive group were significantly older than those in the liberal group, the results of this study must be interpreted carefully. The results of this trial contrast an earlier RCT of 45 patients admitted with acute MI, which showed higher rates of in‐hospital death, recurrent MI, or CHF in the liberal transfusion group versus the restrictive group.[19] Clearly, there is insufficient evidence to define transfusion threshold in acute coronary syndrome, and further study is needed in this area.
A recent meta‐analysis of 19 RCTs through February 2011 compared restrictive versus liberal transfusion strategies.[11] Although not all of these studies looked at periprocedural RBC transfusion, employment of a restrictive strategy saved an average of 1.19 units of blood per patient transfused without a difference in 30‐day mortality. This meta‐analysis also showed that in‐hospital mortality was 23% lower in patients assigned to a restrictive strategy, and there were no differences in cardiac events or strokes between restrictive and liberal strategies.
Encompassing the latest evidence, the AABB (formerly, the American Association of Blood Banks) guidelines recommend a restrictive transfusion strategy utilizing a transfusion threshold of 7 to 8 g/dL in stable hospitalized patients.[20] The AABB also recommends a restrictive strategy for patients with underlying cardiovascular disease, advocating for a transfusion threshold of 8 g/dL or less, or for symptoms of anemia. No transfusion recommendations were provided for acute coronary syndrome.
PLASMA
In the United States, approximately 4 million units of frozen plasma (FP) were transfused in 2006, and recent data demonstrate that relative to RBCs, the number of FP units transfused in the United States is higher than in other countries with advanced medical care.[1, 21, 22] Many transfusions are given prior to a procedure to correct perceived bleeding risk.
Risks of Periprocedural Coagulopathy
Laboratory measures of coagulation such as prothrombin time (PT)/emnternational normalized ratio (INR) are frequently used to guide transfusion of FP. A 3‐month audit at Massachusetts General Hospital found approximately one‐third of all FP units used outside of the operating room were requested before a procedure because of an elevated INR.[23] However, PT and activated partial thromboplastin time were never validated in nonbleeding patients, and INR was never validated for use in non‐vitamin K antagonist settings.[24, 25]
A recent systematic review assessed whether abnormalities in preprocedure coagulation tests correlate with increased risk of bleeding.[26] Analysis of 24 observational studies and 1 RCT included nearly 2000 procedures performed on patients with abnormal coagulation studies and concluded that there is not sufficient data to support PT and INR as predictors of bleeding risk. One study examining how well INR can be used to predict the degree of deficiency of a given factor found that blood samples with an INR as high as 1.9 contained factor levels adequate to support hemostasis.[27]
Furthermore, there is surprisingly little evidence to support the ability of FP to correct an abnormal INR. Given that the INR of FP can be as high as 1.3, transfusion will have little effect on minimally elevated INRs. This point is highlighted by a prospective study evaluating the effectiveness of transfusing FP to correct an increased INR in patients with a mildly prolonged PT (13.1 to 17 seconds). Of 121 patients studied, 1% normalized their INR, and only 15% demonstrated improvement at least halfway to normal.[28] There was no correlation between plasma dose and change in INR. Additionally, a study attempting to quantify the relationship between change in INR and the pretransfusion INR observed that a reliable significant change in INR is only likely when the INR is >1.7.[29]
Does FP Transfusion Improve Outcomes?
Most clinical uses of FP are not supported by evidence from RCTs. A 2012 systematic review examining the clinical effectiveness of FP included RCT data from 1964 to 2011.[30] In terms of periprocedural FP administration, this review included studies of FP in cardiac surgery and revealed a lack of evidence to support the effectiveness of FP to prevent bleeding. Notably, this review did not examine the use of FP prior to percutaneous procedures.
Despite the paucity of evidence to guide FP transfusions, in 2010 the AABB published practice guidelines to assist practitioners in the use of FP.[22, 31] In terms of periprocedural FP administration, these practice guidelines questioned the use of FP in surgical or trauma patients without massive bleeding, as only 6 studies were available for analysis. The panel could not recommend for or against the use of FP in surgical patients, although meta‐analysis showed that FP transfusion was associated with a trend toward increased risk of death. No studies of nonsurgical invasive procedures met review inclusion criteria. Given the potential for harm and the lack of data with regard to use of FP prior to nonsurgical invasive procedures, hospitalists should view the use of FP prior to a procedure with caution.
The Society of Interventional Radiology (SIR) recently published consensus guidelines for periprocedural management of coagulation status and hemostasis risk in percutaneous‐guided interventions.[32] Acknowledging the lack of data regarding periprocedural management of patients with abnormal coagulation parameters, this society's Standards of Practice Committee recommends that in the absence of warfarin treatment or liver disease, preprocedure INR testing should be conducted only prior to procedures with moderate to high bleeding risk.[32] Notably, low bleeding risk procedures include thoracentesis, paracentesis, drainage catheter exchange, and dialysis access interventions. This recommendation is consistent with observational studies of paracentesis and thoracentesis, which have failed to show increased bleeding risk in patients with an elevated INR. The largest of these studies retrospectively examined 608 patient procedures and found no significant difference in hemoglobin drop or average hemoglobin among patients with normal PT compared to patients with prolonged PT who underwent either a paracentesis or thoracentesis.[33]
In patients scheduled to undergo moderate or high bleeding risk procedures, these guidelines recommend that the INR be corrected to 1.5, although this recommendation was derived by Delphi consensus of expert practitioners due to lack of available data.[32] Central venous catheter insertion highlights the discrepancy between SIR recommendations and review of the available, albeit limited, data. A study of 580 patients with an INR >1.5 found that only 1 patient had a major bleeding event due to accidental puncture of the carotid artery.[34] Along with several others, this study is cited as evidence that central venous catheterization can be performed safely in patients with coagulation abnormalities.[32] However, because of the observational nature of these data, SIR guidelines categorize central venous catheterization as a moderate risk procedure, and as such recommend a preprocedure INR check and correction of INR to 1.5.[32] There are no prospective studies looking at what INR it is safe to perform endoscopic interventions.[35] Additionally, there are no studies looking at the effect of preprocedure FP administration on endoscopic outcomes.
PLATELETS
Over 10 million units of platelets are transfused in the United States annually.[1] Severe thrombocytopenia is thought to confer increased bleeding risk, and allogenic platelet transfusions are commonly given to thrombocytopenic patients as supportive care.[36] Given that recommendations on platelet transfusion thresholds are largely derived from studies looking at patients with hematological malignancies, there is concern about using these data to inform transfusion thresholds in other patient populations. Despite this limitation, we examine the evidence for an optimum platelet transfusion threshold and review available practice guidelines for the perioperative setting.
Risks of Thrombocytopenia and When to Transfuse
Hemostasis depends on an adequate number of functional platelets along with an intact coagulation system. Circulating platelets likely contribute to hemostasis via an endothelial supportive function by plugging gaps in the endothelium of blood vessels.[36] Early observational studies of clinically stable patients with chronic thrombocytopenia showed that significant spontaneous bleeding through an intact vascular system typically occurred with a platelet count below 5,000 platelets/L.[37, 38] Despite this, a platelet count of 20,000/L was adopted as a transfusion threshold and used for over 25 years.[36]
Beginning in the late 1990s, RCTs comparing a prophylactic transfusion trigger of 10,000 platelets/L to 20,000 platelets/L showed no difference in hemorrhagic risks or RBC transfusion requirements.[39, 40, 41, 42] The American Society of Clinical Oncology and the British Committee for Standards in Haematology (BCSH) now recommend a prophylactic platelet transfusion trigger of 10,000/L for all patients with chronic thrombocytopenia due to hypoproliferative causes.[43] A 2012 Cochrane review of 13 RCTs examining prophylactic platelet transfusion for prevention of bleeding in patients with hematological disorders did not find evidence to change this recommendation, but did question the strength of the data showing bleeding risk equivalency between 10,000/L and 20,000/L.[44]
In addition to studies examining platelet transfusion thresholds, various studies have questioned whether platelet transfusions should be given prophylactically before bleeding onset or as treatment afterward. Two early small RCTs and several observational studies examining prophylactic versus therapeutic platelet transfusion failed to show increased risk of bleeding or mortality in patients with leukemia who were transfused only after bleeding had begun.[45, 46] However, a recent RCT of 600 patients undergoing chemotherapy or stem cell transplantation showed that patients who were not given prophylactic platelet transfusions had more days with bleeding and shorter time to first bleeding episode compared to patients given prophylactic platelet transfusion for a platelet count below 10,000/L.[47] This study supports continued use of prophylactic platelet transfusions to prevent bleeding. Based on this recent trial and the 2012 Cochrane review, prophylactic platelet transfusion for a platelet count lower than 10,000/L is currently the standard of care for patients with chronic thrombocytopenia due to a hypoproliferative cause.
Perioperative Platelet Transfusion Practice Guidelines
It is unknown at what platelet count the risk of surgical bleeding increases, and there are no definitive studies to guide the use of prophylactic platelet transfusions for patients prior to procedures. Given this paucity of data, we are left to review consensus expert opinion and the nonrandomized studies that inform them.
Prior to surgical procedures, prophylactic platelet transfusion is rarely required for platelet counts >100,000/L and is usually required for a platelet count 50,000/L.[48] For platelet counts in the range of 50,000/L to 100,000/L, guidelines from the American Society of Anesthesiologists and the Royal College of Physicians state that platelet transfusion should be based on the extent of surgery, the risk and ability to control bleeding, the rate of bleeding with regard to trauma, the presence of platelet dysfunction, and other coagulation abnormalities.[48] Recognizing the inability to easily control bleeding during neurosurgical procedures and the potential for significant adverse outcomes with intracranial bleeding, experts recommend that neurosurgical patients have platelet counts maintained >100,000/L.[43]
For bedside and minimally invasive procedures, various thresholds are considered standard of care without rigorous supporting data. For example, based solely on interpretation of case reports, a platelet count of 80,000/L has been proposed by the American Red Cross, the French Society of Anesthesiology, and the BCSH for epidural anesthesia in patients with thrombocytopenia due to idiopathic thrombocytopenia.[49] For endoscopic procedures, the American Society for Gastrointestinal Endoscopy recommends a platelet count of 50,000/L for therapeutic procedures and 20,000/L for low‐risk diagnostic procedures.[35]
Procedures such as lumbar puncture, central venous catheterization, paracentesis, and thoracentesis have also not been well studied in the setting of thrombocytopenia. Based on case reports and case series, lumbar puncture is thought to require a platelet count of 10,000 to 20,000/L in patients with marrow failure but 50,000/L in patients without hematologic malignancies.[49, 50, 51] In terms of central venous catheter placement, a recent retrospective analysis included 193 adult leukemic patients who received 604 central venous catheter placements at 1 institution.[52] This study showed that only platelet counts below 20,000/L were associated with a higher risk of nonsevere bleeding. These results are consistent with several earlier observational studies reporting a very low risk of bleeding in patients with thrombocytopenia requiring central venous catheterization.[53, 54] With regard to paracentesis and thoracentesis, a study of 391 patients who underwent paracentesis and 207 patients who underwent thoracentesis did not demonstrate bleeding with platelet counts of 50,000/L to 100,000/L.[33] However, no specific platelet transfusion threshold was identified by this retrospective single‐institution study.
SUMMARY
We summarize our recommendations in Table 2, recognizing that evidence is limited and many of these recommendations are based on expert opinion. The limited evidence highlights opportunity for hospitalist‐driven research in periprocedural blood product transfusion.
|
| RBC transfusion |
| Transfusion threshold of Hg 78 g/dL or symptomatic anemia in most hemodynamically stable hospitalized patients. |
| Transfusion threshold of Hg 8 g/dL or for symptomatic anemia in patients with underlying CV disease. |
| Optimal transfusion threshold is unknown in patients with acute coronary syndrome. |
| Frozen plasma transfusion |
| Insufficient evidence to support routine INR testing for low‐risk procedures in the absence of warfarin treatment or liver disease. |
| Transfusion may be considered prior to procedures with moderate to high bleeding risk when INR >1.5. |
| Insufficient evidence to guide transfusion practice prior to endoscopic procedures. |
| Platelet transfusion |
| Transfusion threshold of 20,000/L for low bleeding risk procedures, including central venous catheters. |
| Transfusion threshold of 50,000100,000/L for moderate bleeding risk procedures. |
| Transfusion threshold of 100,000/L for neurosurgical procedures. |
| Transfusion threshold of 50,000/L for therapeutic endoscopy and 20,000/L for low‐risk diagnostic endoscopy. |
ACKNOWLEDGEMENTS
Disclosures: Dr. Carson reports grants from the National Institutes of Health (NIH) during the conduct of the study, personal fees from Cerus Corporation, grants from Amgen, and grants from the NIH outside the submitted work.
- , , , . Report of the US Department of Health and Human Services. The 2009 national blood collection and utilization survey report. Washington, DC: US Department of Health and Human Services, Office of the Assistant Secretary for Health; 2011.
- , , , , . Where does blood go? Prospective observational study of red cell transfusion in north England. BMJ. 2002;325(7368):803.
- , , , et al. Effect of anaemia and cardiovascular disease on surgical mortality and morbidity. Lancet. 1996;348(9034):1055–1060.
- , , , . Mortality and morbidity in patients with very low postoperative Hb levels who decline blood transfusion. Transfusion. 2002;42(7):812–818.
- , , , et al. Human cardiovascular and metabolic response to acute, severe isovolemic anemia. JAMA. 1998;279(3):217–221.
- , , , et al. Electrocardiographic ST‐segment changes during acute, severe isovolemic hemodilution in humans. Anesthesiology. 2000;93(4):1004–1010.
- , , , et al. Acute severe isovolemic anemia impairs cognitive function and memory in humans. Anesthesiology. 2000;92(6):1646–1652.
- , , , , , . Fatigue during acute isovolemic anemia in healthy, resting humans. Transfusion. 2000;40(4):457–460.
- , , , et al. Preoperative hematocrit levels and postoperative outcomes in older patients undergoing noncardiac surgery. JAMA. 2007;297(22):2481–2488.
- , , , et al. Preoperative anaemia and postoperative outcomes in non‐cardiac surgery: a retrospective cohort study. Lancet. 2011;378(9800):1396–1407.
- , , . Transfusion thresholds and other strategies for guiding allogeneic red blood cell transfusion. Cochrane Database Syst Rev. 2012;4:CD002042.
- , , , et al. A multicenter, randomized, controlled clinical trial of transfusion requirements in critical care. Transfusion Requirements in Critical Care Investigators, Canadian Critical Care Trials Group. N Engl J Med. 1999;340(6):409–417.
- , , , et al. Is a low transfusion threshold safe in critically ill patients with cardiovascular diseases? Crit Care Med. 2001;29(2):227–234.
- , , , et al. Liberal or restrictive transfusion in high‐risk patients after hip surgery. N Engl J Med. 2011;365(26):2453–2462.
- , , , et al. Transfusion requirements after cardiac surgery: the TRACS randomized controlled trial. JAMA. 2010;304(14):1559–1567.
- , , , et al. Lowering the hemoglobin threshold for transfusion in coronary artery bypass procedures: effect on patient outcome. Transfusion. 1999;39(10):1070–1077.
- , , , et al. Transfusion strategies for acute upper gastrointestinal bleeding. N Engl J Med. 2013;368(1):11–21.
- , , , et al. Liberal versus restrictive transfusion thresholds for patients with symptomatic coronary artery disease. Am Heart J. 2013;165(6):964–971.
- , , , et al. Conservative versus liberal red cell transfusion in acute myocardial infarction (the CRIT Randomized Pilot Study). Am J Cardiol. 2011;108(8):1108–1111.
- , , , et al. Red blood cell transfusion: a clinical practice guideline from the AABB. Ann Intern Med. 2012;157(1):49–58.
- , . Is fresh frozen plasma overtransfused in the United States? Transfusion. 2004;44(11):1674–1675.
- , , , et al. The effect of plasma transfusion on morbidity and mortality: a systematic review and meta‐analysis. Transfusion. 2010;50(6):1370–1383.
- , . Why do physicians request fresh frozen plasma? Transfusion. 2004;44(9):1393–1394.
- . Predicting hemorrhage using preoperative coagulation screening assays. Curr Hematol Rep. 2004;3(5):324–330.
- , . Plasma transfusion for bedside, radiologically guided, and operating room invasive procedures. Transfusion. 2012;52(suppl 1):20S–29S.
- , ; Transfusion Medicine/Hemostasis Clinical Trials Network. Paucity of studies to support that abnormal coagulation test results predict bleeding in the setting of invasive procedures: an evidence‐based review. Transfusion. 2005;45(9):1413–1425.
- . Interpretation of the international normalised ratio in patients with liver disease. Lancet. 2002;359(9300):47–48.
- , , . Effect of fresh‐frozen plasma transfusion on prothrombin time and bleeding in patients with mild coagulation abnormalities. Transfusion. 2006;46(8):1279–1285.
- , . Toward rational fresh frozen plasma transfusion: The effect of plasma transfusion on coagulation test results. Am J Clin Pathol. 2006;126(1):133–139.
- , , , , . Is fresh‐frozen plasma clinically effective? An update of a systematic review of randomized controlled trials. Transfusion. 2012;52(8):1673–1686; quiz 1673.
- , , , et al. Evidence‐based practice guidelines for plasma transfusion. Transfusion. 2010;50(6):1227–1239.
- , , , et al. Consensus guidelines for periprocedural management of coagulation status and hemostasis risk in percutaneous image‐guided interventions. J Vasc Interv Radiol. 2012;23(6):727–736.
- , . Lack of increased bleeding after paracentesis and thoracentesis in patients with mild coagulation abnormalities. Transfusion. 1991;31(2):164–171.
- , . Central venous cannulation in patients with liver disease and coagulopathy—a prospective audit. Intensive Care Med. 1999;25(5):481–485.
- ASGE Standards of Practice Committee; , , , et al. Management of antithrombotic agents for endoscopic procedures. Gastrointest Endosc. 2009;70(6):1060–1070.
- , , , . New strategies for the optimal use of platelet transfusions. Hematology Am Soc Hematol Educ Program. 2008:198–204.
- , . Thrombocytopenia: mechanisms and management of defects in platelet production. Clin Haematol. 1978;7(3):523–539.
- , , . The quantitative relation between platelet count and hemorrhage in patients with acute leukemia. N Engl J Med. 1962;266:905–909.
- , , , et al. The threshold for prophylactic platelet transfusions in adults with acute myeloid leukemia. Gruppo Italiano Malattie Ematologiche Maligne dell'Adulto. N Engl J Med. 1997;337(26):1870–1875.
- , , , , , . Randomized study of prophylactic platelet transfusion threshold during induction therapy for adult acute leukemia: 10,000/microL versus 20,000/microL. J Clin Oncol. 1997;15(3):1143–1149.
- , , , et al. Safety and cost effectiveness of a 10 x 10(9)/L trigger for prophylactic platelet transfusions compared with the traditional 20 x 10(9)/L trigger: a prospective comparative trial in 105 patients with acute myeloid leukemia. Blood. 1998;91(10):3601–3606.
- , , , et al. A prospective randomized trial of prophylactic platelet transfusion and bleeding incidence in hematopoietic stem cell transplant recipients: 10,000/L versus 20,000/microL trigger. Biol Blood Marrow Transplant. 2002;8(10):569–576.
- . Evidence‐based platelet transfusion guidelines. Hematology Am Soc Hematol Educ Program. 2007:172–178.
- , , , et al. Prophylactic platelet transfusion for prevention of bleeding in patients with haematological disorders after chemotherapy and stem cell transplantation. Cochrane Database Syst Rev. 2012;5:CD004269.
- , , , et al. Indications for platelet transfusion in children with acute leukemia. Am J Hematol. 1982;12(4):347–356.
- , , , , . Platelet prophylaxis in acute non‐lymphoblastic leukaemia. Lancet. 1978;1(8058):267.
- , , , et al. A no‐prophylaxis platelet‐transfusion strategy for hematologic cancers. N Engl J Med. 2013;368(19):1771–1780.
- , . Transfusion in the operating room and the intensive care unit: current practice and future directions. Int Anesthesiol Clin. 2000;38(4):149–169.
- , , . The risk of spinal haematoma following neuraxial anaesthesia or lumbar puncture in thrombocytopenic individuals. Br J Haematol. 2010;148(1):15–25.
- , . Personal practice: how we manage the risk of bleeding and thrombosis in children and young adults with acute lymphoblastic leukaemia. Br J Haematol. 2011;152(5):505–511.
- , , , , . Safety of lumbar puncture for adults with acute leukemia and restrictive prophylactic platelet transfusion. Ann Hematol. 2003;82(9):570–573.
- , , , , . Optimal preprocedural platelet transfusion threshold for central venous catheter insertions in patients with thrombocytopenia. Transfusion. 2011;51(11):2269–2276.
- , , . Central venous catheter placement in patients with disorders of hemostasis. Chest. 1996;110(1):185–188.
- , , , , , . Central venous catheterization in patients with coagulopathy. Arch Surg. 1992;127(3):273–275.
Although inpatient blood product transfusion is common, many uses have not been subject to rigorous clinical study, and great practice variations exist. Of particular interest to the hospitalist is the use of red blood cells (RBCs), plasma, and platelets prior to an invasive procedure to correct anemia or a perceived bleeding risk. When considering blood product use in this context, the hospitalist faces 2 questions. First, what are the risks of anemia, thrombocytopenia, or abnormal coagulation tests? Second, what is the evidence that administration of the blood product in question improves outcomes such as bleeding and mortality? We address these questions in this review of the data supporting the use of RBCs, platelets, and plasma prior to invasive procedures.
RED BLOOD CELLS
Anemia is the most common hematologic concern in the perioperative setting. In 2009, approximately 15 million units of RBCs were transfused in the United States, 40% to 70% of which were given in the perioperative setting.[1, 2]
Risks of Periprocedural Anemia
The best evidence regarding the risks of perioperative anemia comes from studies in patients who declined blood transfusions. A retrospective cohort study of 1958 consecutive surgical patients who refused transfusions due to religious reasons showed an increase in 30‐day mortality as preoperative hemoglobin values fell, especially for those with preoperative hemoglobin concentrations 6 g/dL.[3] For patients with underlying cardiovascular disease, the risk of death was greatest when the preoperative hemoglobin value was 10 g/dL. Subsequent analysis showed that mortality rose with postoperative hemoglobin levels 7 g/dL, with a sharp rise in morbidity (myocardial infarction [MI], congestive heart failure [CHF], arrhythmia, and infection) and mortality in those with postoperative hemoglobin of 5 to 6 g/dL.[4] These results are consistent with studies of healthy volunteers who underwent acute isovolumic hemoglobin reduction, demonstrating clinical changes when hemoglobin values fell to 5 to 7 g/dL.[5, 6, 7, 8]
Several large, retrospective cohort studies have evaluated anemia and perioperative morbidity and mortality. A 2007 study analyzed data from over 310,000 predominantly male patients over age 65 years undergoing major noncardiac surgery.[9] Even mild degrees of preoperative anemia were associated with increased 30‐day mortality and cardiovascular morbidity (cardiac arrest or Q‐wave MI), with a monotonic rise in mortality (3.5%35.4%) and cardiac events (1.8%14.6%) when the hematocrit was 39%. Utilizing data from the American College of Surgeons' National Surgical Quality Improvement Program database, a 2011 study evaluated over 227,000 patients who underwent major noncardiac surgery.[10] Again, even mild anemia (hematocrit 29%39%) was independently associated with an increase in 30‐day composite morbidity, including MI, stroke, pneumonia, acute renal failure, wound infection, sepsis (13.27%), and mortality (3.52%).
Does RBC Transfusion Improve Outcomes?
Although the evidence argues that perioperative anemia is associated with poor surgical outcomes, it is not clear whether RBC transfusion in the perioperative setting improves these outcomes. Furthermore, the optimal perioperative hemoglobin level remains controversial. Importantly, most periprocedural trials were not sufficiently powered to assess differences in clinical outcomes.[11]
Several noteworthy randomized controlled trials (RCTs) comprise the bulk of the evidence regarding transfusion thresholds and are summarized in Table 1. The Transfusion Requirements in Critical Care (TRICC) was a landmark trial that randomized patients to a restrictive or a liberal transfusion strategy and demonstrated a trend toward lower 30‐day mortality in the restrictive group.[12] In addition, the restrictive transfusion group had lower rates of myocardial infarction and pulmonary edema. A subsequent subanalysis found no difference in mortality in patients with underlying cardiovascular disease.[13]
| Study/Year | No. of Patients | Brief Description | Transfusion Strategy | Outcomes (Restrictive Versus Liberal) |
|---|---|---|---|---|
| ||||
| Herbert et al. (TRICC)/1999[12] | 838 | Normovolemic patients admitted to ICU with Hg 9 g/dL within 72 hours of admission. | Restrictive: Hg maintained 79 g/dL. Liberal: Hg maintained 1012 g/dL. | 30‐day mortality (18.7% vs 23.3%, P=0.11). Pulmonary edema (5.3% vs 10.7%, P0.01) and MI (0.7% vs 2.9%, P=0.02) rates while in the ICU. |
| Carson et al. (FOCUS)/2011[14] | 2016 | Patients undergoing surgery for hip fracture with a history of cardiovascular disease or cardiovascular risk factors. | Restrictive: transfused for Hg 8 g/dL or symptomatic anemia. Liberal: transfused to maintain Hg >10 g/dL. | Primary outcome of death or the inability to walk 10 feet across the room without human assistance at 60 days (34.7% vs 35.2%, P=0.9). Composite of in‐hospital ACS or death (5.2% vs. 4.3%). The frequencies of in‐hospital clinical events and adverse events did not differ significantly between groups. |
| Hajjar et al. (TRACS)/2010[15] | 502 | Patients admitted to ICU for elective cardiac surgery with cardiopulmonary bypass. | Restrictive: transfused to maintain Hct 24%. Liberal: transfused to maintain Hct 30%. | Composite end point of 30‐day all‐cause mortality+severe in‐hospital morbidity (cardiogenic shock, ARDS, or AKI requiring renal replacement therapy) (11% vs 10%, P=0.85). |
| Bracey et al./1999[16] | 428 | Patients undergoing first‐time elective coronary surgical revascularization. | Restrictive: postoperative transfusion for Hg 8 g/dL or predetermined clinical conditions requiring RBC transfusion (ie, hemodynamic instability). | Hospital mortality (1.4% vs 2.7%, P=0.3). |
| Liberal: transfusion at discretion of physician with institutional guidelines recommending postoperative transfusion for Hg 9 g/dL. | No differences in morbidity (including pulmonary complications, renal failure, and MI), duration of mechanical ventilation, and length of hospital stay (7.52.9 days vs 7.94.9 days). | |||
| Villanueva et al./2013[17] | 921 | Severe upper GI bleeding, gastroscopy within 6 hours. | Restrictive: transfused if Hg 7 g/dL. Liberal: transfused if Hg 9 g/dL. | Survival at 6 weeks (95% vs 91%, P=0.02). |
| Rebleeding (10% vs 16%, P=0.01). Adverse event rate including transfusion reactions, ACS, AKI, pulmonary complications, infection, and stroke or TIA (40% vs 48%, P=0.02). | ||||
| Carson et al. (MINT)/2013[18] | 110 | Pilot study in patients with Hg 10 g/dL and either ACS or stable angina undergoing cardiac catheterization. | Restrictive: transfused if Hg 8 g/dL or symptomatic anemia. Liberal: transfused to raise Hg 10 g/dL. | Composite primary outcome of all cause mortality+MI+unscheduled coronary revascularization within 30 days (25.5% vs 10.9%, P=0.054). Death at 30 days (13% vs 1.8%, P=0.032). |
| Cooper et al. (CRIT)/2011[19] | 45 | Pilot study in patients with acute MI (chest pain and positive cardiac biomarker) and Hct 30% within 72 hours of symptom onset. | Restrictive: transfused to maintain Hct 24%27%. | The primary composite outcome (in‐hospital death, recurrent MI, or new or worsening CHF) (13% vs 38%, P=0.046). |
| Liberal: transfused to maintain Hct 30% to 33%. | ||||
The largest RCT of transfusion thresholds, the Transfusion Trigger Trial for Functional Outcomes in Cardiovascular Patients Undergoing Surgical Hip Fracture Repair (FOCUS), randomized patients undergoing surgery for hip fracture with a history of cardiovascular disease or cardiovascular risk factors to a restrictive or liberal transfusion strategy.[14] The primary outcome of death or the inability to walk 10 feet across the room without human assistance at 60 days was similar in both the liberal and restrictive group, and the composite rate of acute coronary syndrome and in‐hospital death, stroke, CHF, venous thromboembolism, and the frequencies of other in‐hospital events or lengths of stay did not differ between the groups.
Several RCTs have examined the effect of transfusion practice on patients undergoing elective cardiac surgery. The Transfusion Requirements After Cardiac Surgery (TRACS) study did not show a difference in the primary composite outcome of 30‐day all‐cause mortality and in‐hospital morbidity between the restrictive and liberal transfusion groups.[15] A second cardiac surgery trial also found no difference in mortality or morbidity outcomes when comparing a restrictive versus liberal transfusion threshold.[16]
A recent RBC transfusion trial evaluated transfusion thresholds in patients with severe upper gastrointestinal bleeding.[17] All patients underwent gastroscopy within 6 hours of hospital admission and were randomly allocated to a restrictive or liberal transfusion threshold. The restrictive group had a significantly higher survival at 6 weeks when compared to the liberal group, as well as lower rates of adverse events such as further bleeding, acute coronary syndrome, transfusion reactions, and pulmonary edema.
Finally, the Myocardial Ischemia and Transfusion (MINT) pilot trial evaluated 110 patients with hemoglobin concentration l10 g/dL admitted for ST‐segment elevation MI, nonST‐segment elevation MI, unstable angina, or stable coronary disease undergoing a cardiac catheterization.[18] The composite end point of death, MI, and unscheduled revascularizations within 30 days was higher in the restrictive group when compared to the liberal group, and 30‐day mortality was less frequent in liberal strategy compared to restrictive strategy. Given the small study size and the fact that patients in the restrictive group were significantly older than those in the liberal group, the results of this study must be interpreted carefully. The results of this trial contrast an earlier RCT of 45 patients admitted with acute MI, which showed higher rates of in‐hospital death, recurrent MI, or CHF in the liberal transfusion group versus the restrictive group.[19] Clearly, there is insufficient evidence to define transfusion threshold in acute coronary syndrome, and further study is needed in this area.
A recent meta‐analysis of 19 RCTs through February 2011 compared restrictive versus liberal transfusion strategies.[11] Although not all of these studies looked at periprocedural RBC transfusion, employment of a restrictive strategy saved an average of 1.19 units of blood per patient transfused without a difference in 30‐day mortality. This meta‐analysis also showed that in‐hospital mortality was 23% lower in patients assigned to a restrictive strategy, and there were no differences in cardiac events or strokes between restrictive and liberal strategies.
Encompassing the latest evidence, the AABB (formerly, the American Association of Blood Banks) guidelines recommend a restrictive transfusion strategy utilizing a transfusion threshold of 7 to 8 g/dL in stable hospitalized patients.[20] The AABB also recommends a restrictive strategy for patients with underlying cardiovascular disease, advocating for a transfusion threshold of 8 g/dL or less, or for symptoms of anemia. No transfusion recommendations were provided for acute coronary syndrome.
PLASMA
In the United States, approximately 4 million units of frozen plasma (FP) were transfused in 2006, and recent data demonstrate that relative to RBCs, the number of FP units transfused in the United States is higher than in other countries with advanced medical care.[1, 21, 22] Many transfusions are given prior to a procedure to correct perceived bleeding risk.
Risks of Periprocedural Coagulopathy
Laboratory measures of coagulation such as prothrombin time (PT)/emnternational normalized ratio (INR) are frequently used to guide transfusion of FP. A 3‐month audit at Massachusetts General Hospital found approximately one‐third of all FP units used outside of the operating room were requested before a procedure because of an elevated INR.[23] However, PT and activated partial thromboplastin time were never validated in nonbleeding patients, and INR was never validated for use in non‐vitamin K antagonist settings.[24, 25]
A recent systematic review assessed whether abnormalities in preprocedure coagulation tests correlate with increased risk of bleeding.[26] Analysis of 24 observational studies and 1 RCT included nearly 2000 procedures performed on patients with abnormal coagulation studies and concluded that there is not sufficient data to support PT and INR as predictors of bleeding risk. One study examining how well INR can be used to predict the degree of deficiency of a given factor found that blood samples with an INR as high as 1.9 contained factor levels adequate to support hemostasis.[27]
Furthermore, there is surprisingly little evidence to support the ability of FP to correct an abnormal INR. Given that the INR of FP can be as high as 1.3, transfusion will have little effect on minimally elevated INRs. This point is highlighted by a prospective study evaluating the effectiveness of transfusing FP to correct an increased INR in patients with a mildly prolonged PT (13.1 to 17 seconds). Of 121 patients studied, 1% normalized their INR, and only 15% demonstrated improvement at least halfway to normal.[28] There was no correlation between plasma dose and change in INR. Additionally, a study attempting to quantify the relationship between change in INR and the pretransfusion INR observed that a reliable significant change in INR is only likely when the INR is >1.7.[29]
Does FP Transfusion Improve Outcomes?
Most clinical uses of FP are not supported by evidence from RCTs. A 2012 systematic review examining the clinical effectiveness of FP included RCT data from 1964 to 2011.[30] In terms of periprocedural FP administration, this review included studies of FP in cardiac surgery and revealed a lack of evidence to support the effectiveness of FP to prevent bleeding. Notably, this review did not examine the use of FP prior to percutaneous procedures.
Despite the paucity of evidence to guide FP transfusions, in 2010 the AABB published practice guidelines to assist practitioners in the use of FP.[22, 31] In terms of periprocedural FP administration, these practice guidelines questioned the use of FP in surgical or trauma patients without massive bleeding, as only 6 studies were available for analysis. The panel could not recommend for or against the use of FP in surgical patients, although meta‐analysis showed that FP transfusion was associated with a trend toward increased risk of death. No studies of nonsurgical invasive procedures met review inclusion criteria. Given the potential for harm and the lack of data with regard to use of FP prior to nonsurgical invasive procedures, hospitalists should view the use of FP prior to a procedure with caution.
The Society of Interventional Radiology (SIR) recently published consensus guidelines for periprocedural management of coagulation status and hemostasis risk in percutaneous‐guided interventions.[32] Acknowledging the lack of data regarding periprocedural management of patients with abnormal coagulation parameters, this society's Standards of Practice Committee recommends that in the absence of warfarin treatment or liver disease, preprocedure INR testing should be conducted only prior to procedures with moderate to high bleeding risk.[32] Notably, low bleeding risk procedures include thoracentesis, paracentesis, drainage catheter exchange, and dialysis access interventions. This recommendation is consistent with observational studies of paracentesis and thoracentesis, which have failed to show increased bleeding risk in patients with an elevated INR. The largest of these studies retrospectively examined 608 patient procedures and found no significant difference in hemoglobin drop or average hemoglobin among patients with normal PT compared to patients with prolonged PT who underwent either a paracentesis or thoracentesis.[33]
In patients scheduled to undergo moderate or high bleeding risk procedures, these guidelines recommend that the INR be corrected to 1.5, although this recommendation was derived by Delphi consensus of expert practitioners due to lack of available data.[32] Central venous catheter insertion highlights the discrepancy between SIR recommendations and review of the available, albeit limited, data. A study of 580 patients with an INR >1.5 found that only 1 patient had a major bleeding event due to accidental puncture of the carotid artery.[34] Along with several others, this study is cited as evidence that central venous catheterization can be performed safely in patients with coagulation abnormalities.[32] However, because of the observational nature of these data, SIR guidelines categorize central venous catheterization as a moderate risk procedure, and as such recommend a preprocedure INR check and correction of INR to 1.5.[32] There are no prospective studies looking at what INR it is safe to perform endoscopic interventions.[35] Additionally, there are no studies looking at the effect of preprocedure FP administration on endoscopic outcomes.
PLATELETS
Over 10 million units of platelets are transfused in the United States annually.[1] Severe thrombocytopenia is thought to confer increased bleeding risk, and allogenic platelet transfusions are commonly given to thrombocytopenic patients as supportive care.[36] Given that recommendations on platelet transfusion thresholds are largely derived from studies looking at patients with hematological malignancies, there is concern about using these data to inform transfusion thresholds in other patient populations. Despite this limitation, we examine the evidence for an optimum platelet transfusion threshold and review available practice guidelines for the perioperative setting.
Risks of Thrombocytopenia and When to Transfuse
Hemostasis depends on an adequate number of functional platelets along with an intact coagulation system. Circulating platelets likely contribute to hemostasis via an endothelial supportive function by plugging gaps in the endothelium of blood vessels.[36] Early observational studies of clinically stable patients with chronic thrombocytopenia showed that significant spontaneous bleeding through an intact vascular system typically occurred with a platelet count below 5,000 platelets/L.[37, 38] Despite this, a platelet count of 20,000/L was adopted as a transfusion threshold and used for over 25 years.[36]
Beginning in the late 1990s, RCTs comparing a prophylactic transfusion trigger of 10,000 platelets/L to 20,000 platelets/L showed no difference in hemorrhagic risks or RBC transfusion requirements.[39, 40, 41, 42] The American Society of Clinical Oncology and the British Committee for Standards in Haematology (BCSH) now recommend a prophylactic platelet transfusion trigger of 10,000/L for all patients with chronic thrombocytopenia due to hypoproliferative causes.[43] A 2012 Cochrane review of 13 RCTs examining prophylactic platelet transfusion for prevention of bleeding in patients with hematological disorders did not find evidence to change this recommendation, but did question the strength of the data showing bleeding risk equivalency between 10,000/L and 20,000/L.[44]
In addition to studies examining platelet transfusion thresholds, various studies have questioned whether platelet transfusions should be given prophylactically before bleeding onset or as treatment afterward. Two early small RCTs and several observational studies examining prophylactic versus therapeutic platelet transfusion failed to show increased risk of bleeding or mortality in patients with leukemia who were transfused only after bleeding had begun.[45, 46] However, a recent RCT of 600 patients undergoing chemotherapy or stem cell transplantation showed that patients who were not given prophylactic platelet transfusions had more days with bleeding and shorter time to first bleeding episode compared to patients given prophylactic platelet transfusion for a platelet count below 10,000/L.[47] This study supports continued use of prophylactic platelet transfusions to prevent bleeding. Based on this recent trial and the 2012 Cochrane review, prophylactic platelet transfusion for a platelet count lower than 10,000/L is currently the standard of care for patients with chronic thrombocytopenia due to a hypoproliferative cause.
Perioperative Platelet Transfusion Practice Guidelines
It is unknown at what platelet count the risk of surgical bleeding increases, and there are no definitive studies to guide the use of prophylactic platelet transfusions for patients prior to procedures. Given this paucity of data, we are left to review consensus expert opinion and the nonrandomized studies that inform them.
Prior to surgical procedures, prophylactic platelet transfusion is rarely required for platelet counts >100,000/L and is usually required for a platelet count 50,000/L.[48] For platelet counts in the range of 50,000/L to 100,000/L, guidelines from the American Society of Anesthesiologists and the Royal College of Physicians state that platelet transfusion should be based on the extent of surgery, the risk and ability to control bleeding, the rate of bleeding with regard to trauma, the presence of platelet dysfunction, and other coagulation abnormalities.[48] Recognizing the inability to easily control bleeding during neurosurgical procedures and the potential for significant adverse outcomes with intracranial bleeding, experts recommend that neurosurgical patients have platelet counts maintained >100,000/L.[43]
For bedside and minimally invasive procedures, various thresholds are considered standard of care without rigorous supporting data. For example, based solely on interpretation of case reports, a platelet count of 80,000/L has been proposed by the American Red Cross, the French Society of Anesthesiology, and the BCSH for epidural anesthesia in patients with thrombocytopenia due to idiopathic thrombocytopenia.[49] For endoscopic procedures, the American Society for Gastrointestinal Endoscopy recommends a platelet count of 50,000/L for therapeutic procedures and 20,000/L for low‐risk diagnostic procedures.[35]
Procedures such as lumbar puncture, central venous catheterization, paracentesis, and thoracentesis have also not been well studied in the setting of thrombocytopenia. Based on case reports and case series, lumbar puncture is thought to require a platelet count of 10,000 to 20,000/L in patients with marrow failure but 50,000/L in patients without hematologic malignancies.[49, 50, 51] In terms of central venous catheter placement, a recent retrospective analysis included 193 adult leukemic patients who received 604 central venous catheter placements at 1 institution.[52] This study showed that only platelet counts below 20,000/L were associated with a higher risk of nonsevere bleeding. These results are consistent with several earlier observational studies reporting a very low risk of bleeding in patients with thrombocytopenia requiring central venous catheterization.[53, 54] With regard to paracentesis and thoracentesis, a study of 391 patients who underwent paracentesis and 207 patients who underwent thoracentesis did not demonstrate bleeding with platelet counts of 50,000/L to 100,000/L.[33] However, no specific platelet transfusion threshold was identified by this retrospective single‐institution study.
SUMMARY
We summarize our recommendations in Table 2, recognizing that evidence is limited and many of these recommendations are based on expert opinion. The limited evidence highlights opportunity for hospitalist‐driven research in periprocedural blood product transfusion.
|
| RBC transfusion |
| Transfusion threshold of Hg 78 g/dL or symptomatic anemia in most hemodynamically stable hospitalized patients. |
| Transfusion threshold of Hg 8 g/dL or for symptomatic anemia in patients with underlying CV disease. |
| Optimal transfusion threshold is unknown in patients with acute coronary syndrome. |
| Frozen plasma transfusion |
| Insufficient evidence to support routine INR testing for low‐risk procedures in the absence of warfarin treatment or liver disease. |
| Transfusion may be considered prior to procedures with moderate to high bleeding risk when INR >1.5. |
| Insufficient evidence to guide transfusion practice prior to endoscopic procedures. |
| Platelet transfusion |
| Transfusion threshold of 20,000/L for low bleeding risk procedures, including central venous catheters. |
| Transfusion threshold of 50,000100,000/L for moderate bleeding risk procedures. |
| Transfusion threshold of 100,000/L for neurosurgical procedures. |
| Transfusion threshold of 50,000/L for therapeutic endoscopy and 20,000/L for low‐risk diagnostic endoscopy. |
ACKNOWLEDGEMENTS
Disclosures: Dr. Carson reports grants from the National Institutes of Health (NIH) during the conduct of the study, personal fees from Cerus Corporation, grants from Amgen, and grants from the NIH outside the submitted work.
- , , , . Report of the US Department of Health and Human Services. The 2009 national blood collection and utilization survey report. Washington, DC: US Department of Health and Human Services, Office of the Assistant Secretary for Health; 2011.
- , , , , . Where does blood go? Prospective observational study of red cell transfusion in north England. BMJ. 2002;325(7368):803.
- , , , et al. Effect of anaemia and cardiovascular disease on surgical mortality and morbidity. Lancet. 1996;348(9034):1055–1060.
- , , , . Mortality and morbidity in patients with very low postoperative Hb levels who decline blood transfusion. Transfusion. 2002;42(7):812–818.
- , , , et al. Human cardiovascular and metabolic response to acute, severe isovolemic anemia. JAMA. 1998;279(3):217–221.
- , , , et al. Electrocardiographic ST‐segment changes during acute, severe isovolemic hemodilution in humans. Anesthesiology. 2000;93(4):1004–1010.
- , , , et al. Acute severe isovolemic anemia impairs cognitive function and memory in humans. Anesthesiology. 2000;92(6):1646–1652.
- , , , , , . Fatigue during acute isovolemic anemia in healthy, resting humans. Transfusion. 2000;40(4):457–460.
- , , , et al. Preoperative hematocrit levels and postoperative outcomes in older patients undergoing noncardiac surgery. JAMA. 2007;297(22):2481–2488.
- , , , et al. Preoperative anaemia and postoperative outcomes in non‐cardiac surgery: a retrospective cohort study. Lancet. 2011;378(9800):1396–1407.
- , , . Transfusion thresholds and other strategies for guiding allogeneic red blood cell transfusion. Cochrane Database Syst Rev. 2012;4:CD002042.
- , , , et al. A multicenter, randomized, controlled clinical trial of transfusion requirements in critical care. Transfusion Requirements in Critical Care Investigators, Canadian Critical Care Trials Group. N Engl J Med. 1999;340(6):409–417.
- , , , et al. Is a low transfusion threshold safe in critically ill patients with cardiovascular diseases? Crit Care Med. 2001;29(2):227–234.
- , , , et al. Liberal or restrictive transfusion in high‐risk patients after hip surgery. N Engl J Med. 2011;365(26):2453–2462.
- , , , et al. Transfusion requirements after cardiac surgery: the TRACS randomized controlled trial. JAMA. 2010;304(14):1559–1567.
- , , , et al. Lowering the hemoglobin threshold for transfusion in coronary artery bypass procedures: effect on patient outcome. Transfusion. 1999;39(10):1070–1077.
- , , , et al. Transfusion strategies for acute upper gastrointestinal bleeding. N Engl J Med. 2013;368(1):11–21.
- , , , et al. Liberal versus restrictive transfusion thresholds for patients with symptomatic coronary artery disease. Am Heart J. 2013;165(6):964–971.
- , , , et al. Conservative versus liberal red cell transfusion in acute myocardial infarction (the CRIT Randomized Pilot Study). Am J Cardiol. 2011;108(8):1108–1111.
- , , , et al. Red blood cell transfusion: a clinical practice guideline from the AABB. Ann Intern Med. 2012;157(1):49–58.
- , . Is fresh frozen plasma overtransfused in the United States? Transfusion. 2004;44(11):1674–1675.
- , , , et al. The effect of plasma transfusion on morbidity and mortality: a systematic review and meta‐analysis. Transfusion. 2010;50(6):1370–1383.
- , . Why do physicians request fresh frozen plasma? Transfusion. 2004;44(9):1393–1394.
- . Predicting hemorrhage using preoperative coagulation screening assays. Curr Hematol Rep. 2004;3(5):324–330.
- , . Plasma transfusion for bedside, radiologically guided, and operating room invasive procedures. Transfusion. 2012;52(suppl 1):20S–29S.
- , ; Transfusion Medicine/Hemostasis Clinical Trials Network. Paucity of studies to support that abnormal coagulation test results predict bleeding in the setting of invasive procedures: an evidence‐based review. Transfusion. 2005;45(9):1413–1425.
- . Interpretation of the international normalised ratio in patients with liver disease. Lancet. 2002;359(9300):47–48.
- , , . Effect of fresh‐frozen plasma transfusion on prothrombin time and bleeding in patients with mild coagulation abnormalities. Transfusion. 2006;46(8):1279–1285.
- , . Toward rational fresh frozen plasma transfusion: The effect of plasma transfusion on coagulation test results. Am J Clin Pathol. 2006;126(1):133–139.
- , , , , . Is fresh‐frozen plasma clinically effective? An update of a systematic review of randomized controlled trials. Transfusion. 2012;52(8):1673–1686; quiz 1673.
- , , , et al. Evidence‐based practice guidelines for plasma transfusion. Transfusion. 2010;50(6):1227–1239.
- , , , et al. Consensus guidelines for periprocedural management of coagulation status and hemostasis risk in percutaneous image‐guided interventions. J Vasc Interv Radiol. 2012;23(6):727–736.
- , . Lack of increased bleeding after paracentesis and thoracentesis in patients with mild coagulation abnormalities. Transfusion. 1991;31(2):164–171.
- , . Central venous cannulation in patients with liver disease and coagulopathy—a prospective audit. Intensive Care Med. 1999;25(5):481–485.
- ASGE Standards of Practice Committee; , , , et al. Management of antithrombotic agents for endoscopic procedures. Gastrointest Endosc. 2009;70(6):1060–1070.
- , , , . New strategies for the optimal use of platelet transfusions. Hematology Am Soc Hematol Educ Program. 2008:198–204.
- , . Thrombocytopenia: mechanisms and management of defects in platelet production. Clin Haematol. 1978;7(3):523–539.
- , , . The quantitative relation between platelet count and hemorrhage in patients with acute leukemia. N Engl J Med. 1962;266:905–909.
- , , , et al. The threshold for prophylactic platelet transfusions in adults with acute myeloid leukemia. Gruppo Italiano Malattie Ematologiche Maligne dell'Adulto. N Engl J Med. 1997;337(26):1870–1875.
- , , , , , . Randomized study of prophylactic platelet transfusion threshold during induction therapy for adult acute leukemia: 10,000/microL versus 20,000/microL. J Clin Oncol. 1997;15(3):1143–1149.
- , , , et al. Safety and cost effectiveness of a 10 x 10(9)/L trigger for prophylactic platelet transfusions compared with the traditional 20 x 10(9)/L trigger: a prospective comparative trial in 105 patients with acute myeloid leukemia. Blood. 1998;91(10):3601–3606.
- , , , et al. A prospective randomized trial of prophylactic platelet transfusion and bleeding incidence in hematopoietic stem cell transplant recipients: 10,000/L versus 20,000/microL trigger. Biol Blood Marrow Transplant. 2002;8(10):569–576.
- . Evidence‐based platelet transfusion guidelines. Hematology Am Soc Hematol Educ Program. 2007:172–178.
- , , , et al. Prophylactic platelet transfusion for prevention of bleeding in patients with haematological disorders after chemotherapy and stem cell transplantation. Cochrane Database Syst Rev. 2012;5:CD004269.
- , , , et al. Indications for platelet transfusion in children with acute leukemia. Am J Hematol. 1982;12(4):347–356.
- , , , , . Platelet prophylaxis in acute non‐lymphoblastic leukaemia. Lancet. 1978;1(8058):267.
- , , , et al. A no‐prophylaxis platelet‐transfusion strategy for hematologic cancers. N Engl J Med. 2013;368(19):1771–1780.
- , . Transfusion in the operating room and the intensive care unit: current practice and future directions. Int Anesthesiol Clin. 2000;38(4):149–169.
- , , . The risk of spinal haematoma following neuraxial anaesthesia or lumbar puncture in thrombocytopenic individuals. Br J Haematol. 2010;148(1):15–25.
- , . Personal practice: how we manage the risk of bleeding and thrombosis in children and young adults with acute lymphoblastic leukaemia. Br J Haematol. 2011;152(5):505–511.
- , , , , . Safety of lumbar puncture for adults with acute leukemia and restrictive prophylactic platelet transfusion. Ann Hematol. 2003;82(9):570–573.
- , , , , . Optimal preprocedural platelet transfusion threshold for central venous catheter insertions in patients with thrombocytopenia. Transfusion. 2011;51(11):2269–2276.
- , , . Central venous catheter placement in patients with disorders of hemostasis. Chest. 1996;110(1):185–188.
- , , , , , . Central venous catheterization in patients with coagulopathy. Arch Surg. 1992;127(3):273–275.
CDC Report Confirms Hospitalists’ Role in Fight against Antibiotic-Resistant Pathogens
Describing the enormity of the problem of antibiotic resistance and warning of the “potentially catastrophic consequences of inaction,” the Centers for Disease Control and Prevention (CDC) announced in September that more than 2 million people a year are sickened by infections that are resistant to treatment with antibiotics.
Moreover, the CDC says 23,000 people die as a result.
The report is a call to action for hospitalists, who are in a position to participate in efforts to prevent infections and control their spread once they’re discovered, says Jean Patel, PhD, deputy director of the office of antimicrobial resistance at the CDC. She also says the medical community cannot expect that new treatments will become available to fight all of these new infections.

—Robert Orenstein, DO, infectious disease expert, Mayo Clinic, Rochester, Minn.
“All of the drugs also are going to have some gaps in their range of activity” Dr. Patel explains. “For that reason, we’re sounding the alarm that it’s important to pay attention to infection control and antibiotic stewardship practices.”
The report, “Antibiotic Resistance Threats to the United States, 2013” creates three categories of antibiotic-resistant pathogens. In the “urgent” tier are Clostridium difficile, which the CDC estimates is responsible for 250,000 infections a year and 14,000 deaths; carbapenem-resistant Enterobacteriaceae, estimated to be responsible for 9,000 infections a year and 600 deaths; and Neisseria gonorrhoeae, at 246,000 infections.
These bacteria are considered an “immediate public health threat that requires urgent and aggressive action.”
Twelve pathogens in the second category, described as “a serious concern,” require “prompt and sustained action to ensure the problem does not grow.” Of particular interest to hospitalists in this group, Dr. Patel says, is methicillin-resistant Staphylococcus aureus (MRSA). The CDC estimates that more than 80,000 severe MRSA infections and more than 11,000 deaths occur in the U.S. every year.
MRSA was not ranked as an “urgent” threat only because the number of infections is decreasing, and because there are antibiotics that still work on MRSA.
Another infection that should be on hospitalists’ radar is Streptococcus pneumoniae. A new vaccine is helping to decrease the number of these infections, but hospitalists should be vigilant about infections that could escape the vaccine and become resistant, Dr. Patel says.
Ketino Kobaidze, MD, assistant professor at the Emory University School of Medicine in Atlanta and a member of the antimicrobial stewardship and infectious disease control committees at Emory University Hospital Midtown, says the most important thing for hospitalists “is to follow up with whatever you’re ordering and notice right away what happens with these tests. If it’s positive or negative, redirect your care.”
Robert Orenstein, DO, an infectious disease expert at Mayo Clinic, praises the report and says hospitalists have a key role to play. “We need to educate them and build systems that target antimicrobials to the infecting agents and limit their use,” he says. TH
Tom Collins is a freelance writer in South Florida.
Describing the enormity of the problem of antibiotic resistance and warning of the “potentially catastrophic consequences of inaction,” the Centers for Disease Control and Prevention (CDC) announced in September that more than 2 million people a year are sickened by infections that are resistant to treatment with antibiotics.
Moreover, the CDC says 23,000 people die as a result.
The report is a call to action for hospitalists, who are in a position to participate in efforts to prevent infections and control their spread once they’re discovered, says Jean Patel, PhD, deputy director of the office of antimicrobial resistance at the CDC. She also says the medical community cannot expect that new treatments will become available to fight all of these new infections.
—Robert Orenstein, DO, infectious disease expert, Mayo Clinic, Rochester, Minn.
“All of the drugs also are going to have some gaps in their range of activity” Dr. Patel explains. “For that reason, we’re sounding the alarm that it’s important to pay attention to infection control and antibiotic stewardship practices.”
The report, “Antibiotic Resistance Threats to the United States, 2013” creates three categories of antibiotic-resistant pathogens. In the “urgent” tier are Clostridium difficile, which the CDC estimates is responsible for 250,000 infections a year and 14,000 deaths; carbapenem-resistant Enterobacteriaceae, estimated to be responsible for 9,000 infections a year and 600 deaths; and Neisseria gonorrhoeae, at 246,000 infections.
These bacteria are considered an “immediate public health threat that requires urgent and aggressive action.”
Twelve pathogens in the second category, described as “a serious concern,” require “prompt and sustained action to ensure the problem does not grow.” Of particular interest to hospitalists in this group, Dr. Patel says, is methicillin-resistant Staphylococcus aureus (MRSA). The CDC estimates that more than 80,000 severe MRSA infections and more than 11,000 deaths occur in the U.S. every year.
MRSA was not ranked as an “urgent” threat only because the number of infections is decreasing, and because there are antibiotics that still work on MRSA.
Another infection that should be on hospitalists’ radar is Streptococcus pneumoniae. A new vaccine is helping to decrease the number of these infections, but hospitalists should be vigilant about infections that could escape the vaccine and become resistant, Dr. Patel says.
Ketino Kobaidze, MD, assistant professor at the Emory University School of Medicine in Atlanta and a member of the antimicrobial stewardship and infectious disease control committees at Emory University Hospital Midtown, says the most important thing for hospitalists “is to follow up with whatever you’re ordering and notice right away what happens with these tests. If it’s positive or negative, redirect your care.”
Robert Orenstein, DO, an infectious disease expert at Mayo Clinic, praises the report and says hospitalists have a key role to play. “We need to educate them and build systems that target antimicrobials to the infecting agents and limit their use,” he says. TH
Tom Collins is a freelance writer in South Florida.
CDC Recommends Four “Core Actions” to Fight Antimicrobial Resistance
1. Prevent infections.
This might be the most obvious way to fight antibiotic-resistance—if there’s no infection, there is no need to worry about one that can’t be treated. Hospitalists can help prevent infection by quickly and effectively treating those who are infected to prevent the spread, washing hands, and promoting effective cleaning habits.
2. Tracking.
The CDC has programs to gather information on antibiotic-resistant infections, causes of infections, and risk factors for infections. With this information, hospitalists can stay aware of the threats. They can also help by remaining vigilant about signs of new resistance and helping to get that information to the CDC.
The CDC is now working on a new module that will collect antimicrobial-susceptibility data that’s generated in hospital labs, Dr. Patel says.
“This will be compiled in a national database and then made available to state and local public health departments that could track anti-microbial resistance trends in their own state,” she says. “We hope those data will then be used to identify new trends in anti-microbial resistance and used to strategize how to prevent resistance from being transmitted locally.”
3. Antibiotic stewardship.
The CDC says prescribing antibiotics only when necessary and tailoring treatment as narrowly as possible might be the most important step in fighting antimicrobial resistance. The CDC estimates that up to half of antibiotic use in humans is unnecessary.
The CDC is working to capture data on antibiotic use in healthcare settings, which will be used for benchmarking antibiotic use among different institutions and regions.
“I think this additional information will really help healthcare institutions measure how well antibiotics are being used in their institutions and make appropriate adjustments,” Dr. Patel says.
4. New drugs and diagnostic tests.
New antibiotics will be needed because, while resistance can be slowed, it cannot be stopped. However, the number of New Drug Application approvals for antibiotics has fallen drastically—nearly 20 from 1980 to 1984, but fewer than five from 2005 to 2012, according to the CDC report. TH
When does benign shyness become social anxiety, a treatable disorder?
Since the appearance of social anxiety disorder (SAD) in the DSM-III in 1980, research on its prevalence, characteristics, and treatment have grown (Box 11,2). In addition to the name, the definition of SAD has changed over the years; as a result, its prevalence has increased in recent cohort studies. This has led to debate over whether the experience of shyness is being over-pathologized, or whether SAD has been underdiagnosed in earlier decades. Those who argue that shyness is being over-pathologized note that it is a normal human experience that has evolutionary functions (eg, preventing engagement in harmful social relationships3). Others argue that a high degree of shyness is not beneficial in terms of evolution because it causes the individual to be shunned, so to speak, by society.4
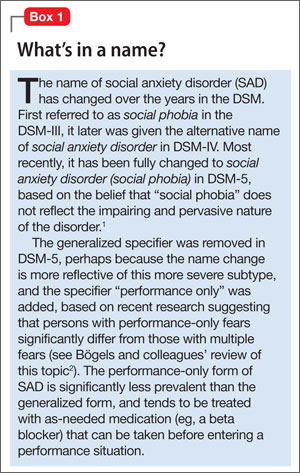
Why worry about ‘over-pathologizing’?
The medicalization of shyness might be a reflection of Western societal values of assertiveness and gregariousness; other societies that value modesty and reticence do not over-pathologize shyness.5 It is important not to assume that someone who is shy necessarily has a “pathologic” level of social anxiety, especially because some people who are shy view that condition as a positive quality, much like sensitivity and conscientiousness.5
The broader issue of what constitutes a mental disorder arises in this debate. A “disorder” is a socially constructed label that describes a set of symptoms occurring together and its associated behaviors, not a real entity with etiological homogeneity.6 Labeling emotional problems “disordered” assumes that happiness is the natural homeostatic state, and distressing emotional states are abnormal and need to be changed.7 A diagnostic label can help improve communication and understand maladaptive behaviors; if that label is reified, however, it can lead to assumptions that the etiology, course, and treatment response are known. Proponents of the diagnostic psychiatric nomenclature have acknowledged the dangers of over-pathologizing normal experiences of living (such as fear) by way of diagnostic labeling.8
Determining when shyness becomes a clinically significant problem—what we call SAD here—demands a delicate distinction that has important implications for treatment. On one hand, if shyness is over-pathologized, persons who neither desire nor need treatment might be subjected to unnecessary and costly intervention. On the other hand, if SAD is underdiagnosed, some persons will not receive treatment that might be beneficial to them.
In this article, we review the similarities and differences between shyness and SAD, and provide recommendations for determining when shyness becomes a more clinically significant problem. We also highlight the importance of this distinction as it pertains to management, and provide suggestions for treatment approaches.
SAD: Definition, prevalence
SAD is defined as a significant fear of embarrassment or humiliation in social or performance-based situations, to a point at which the affected person often avoids these situations or endures them only with a high level of distress9 (Table 1, and Box 2). SAD can be distinguished from other anxiety disorders based on the source and content of the fear (ie, the source being social interaction or performance situations, and the content being a fear that one will show a behavior that will cause embarrassment). SAD also should be distinguished from autism spectrum disorders, in which persons have limited social communication capabilities and inadequate age-appropriate social relationships.
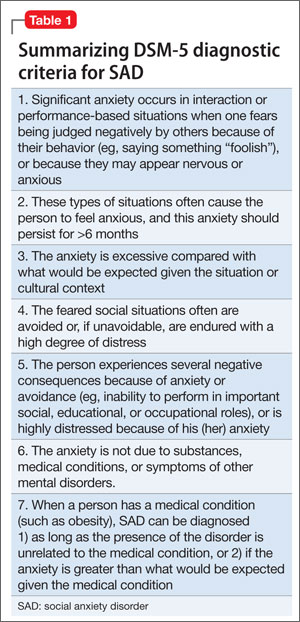
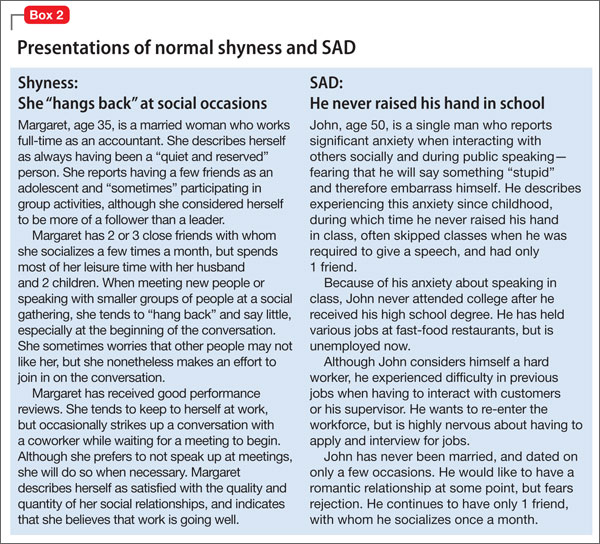
SAD is most highly comorbid with mood and anxiety disorders, with rates of at least 30% in clinical samples.10 The disorder also is highly comorbid with avoidant personality disorder—to a point at which it is argued that they are one and the same disorder.11
As with other psychiatric disorders, anxiety must cause significant impairment or distress. What constitutes significant impairment or distress is subjective, and the arbitrary nature of this criterion can influence estimates of the prevalence of SAD. For example, prevalence ranges as widely as 1.9% to 20.4% when different cut-offs are used for distress ratings and the number of impaired domains.12
The prevalence of SAD varies from 1 epidemiological study to another (ie, the Epidemiological Catchment Area [ECA] Study and the National Comorbidity Survey [NCS])—in part, a consequence of the differing definitions of significant impairment or distress. The ECA study assessed the clinical significance of each symptom in anxiety disorders; the NCS assessed overall clinical significance of the disorder. When the clinical significance criterion was applied at the symptom level to the NCS dataset (as was done in the ECA study), 1-year prevalence decreased by 50% (from 7.4% to 3.7%).13 The manner in which significant impairment or distress is defined (ie, conservatively or liberally) impacts whether social anxiety symptoms are classified as disordered or non-disordered.
Shyness: Definition, prevalence
Shyness often refers to 1) anxiety, inhibition, reticence, or a combination of these findings, in social and interpersonal situations, and 2) a fear of negative evaluation by others.14 It is a normal facet of personality that combines the experience of social anxiety and inhibited behavior,15 and also has been described as a stable temperament.16 Shyness is common; in the NCS study,17 26% of women and 19% of men characterized themselves as “very shy”; in the NCS Adolescent study,18 nearly 50% of adolescents self-identified as shy.
Persons who are shy tend to self-report greater social anxiety and embarrassment in social situations than non-shy persons do; they also might experience greater autonomic reactivity—especially blushing—in social or performance situations.15 Furthermore, shy persons are more likely to have axis I comorbidity and traits of introversion and neuroticism, compared with non-shy persons.14
Research suggests that temperament and behavioral inhibition are risk factors for mood and anxiety disorders, and appear to have a particularly strong relationship with SAD.19 A recent prospective study showed that shyness tends to increase steeply in toddlerhood, then stabilizes in childhood. Shyness in childhood—but not toddlerhood—is predictive of anxiety, depression, and poorer social skills in adolescence.20
A qualitative, or just quantitative, difference?
It is clear that SAD and shyness share several features—including anxiety and embarrassment—in social interactions. This raises a question: Are SAD and shyness distinct qualitatively, or do they represent points along a continuum, with SAD being an extreme form of shyness?
Continuum hypothesis. Support for the continuum hypothesis includes evidence that SAD and shyness share several features, including autonomic arousal, deficits in social skills (eg, aversion of gaze, difficulty initiating and maintaining conversation), avoidance of social situations, and fear of negative evaluation.21,22 In addition, both shyness and SAD are highly heritable,23 and mothers of shy children have a significantly higher rate of SAD than non-shy children do.24 No familial or genetic studies have compared heritability and familial aggregation in shyness and SAD.
According to the continuum hypothesis, if SAD is an extreme form of shyness, all (or nearly all) persons who have a diagnosis of SAD also would be characterized as shy. However, only approximately one-half of such persons report having been shy in childhood.17 Less than one-quarter of shy persons meet criteria for SAD.14,18 Because many persons who are shy do not meet criteria for SAD, and many who have SAD were not considered shy earlier in life, it has been suggested that this supports a qualitative distinction.
Qualitative distinctiveness. Despite having similarities, several features distinguish the experience of SAD from that of shyness. Compared with shyness, a SAD diagnosis is associated with:
- greater comorbidity
- greater severity of avoidance and impairment
- poorer quality of life.18,21,25
Studies that compared SAD, shyness without SAD, and non-shyness have shown that the shyness without SAD group more closely resembles the non-shy group than the SAD group—particularly with regard to impairment, presence of substance use, and other behavioral problems.18,25
Given the evidence, experts have concluded that shyness and a SAD diagnosis are overlapping yet different constructs that encapsulate qualitative and quantitative differences.25 There is a spectrum of shyness that ranges from a normative level to a higher level that overlaps the experience of SAD, but the 2 states represent different constructs.25
Guidance for making an assessment. Because of similarities in anxiety, embarrassment, and other symptoms in social situations, the best way to determine whether shyness crosses the line into a clinically significant problem is to assess the severity of the anxiety and associated degree of impairment and distress. More severe anxiety paired with distress about having anxiety and significant impairment in multiple areas of functioning might indicate more problematic social anxiety—a diagnosis of SAD—not just “normal” shyness.
It is important to take into account the environmental and cultural context of a patient’s distress and impairment because these features might fall within a normal range, given immediate circumstances (such as speaking in front of a large audience when one is not normally called on to do so, to a degree that does not interfere with general social functioning6).
What is considered a normative range depends on the developmental stage:
- Among children, a greater level of shyness might be considered more normative when it manifests during developmental stages in which separation anxiety appears.
- Among adolescents, a greater level of shyness might be considered normative especially during early adolescence (when social relationships become more important), and during times of transition (ie, entering high school).
- In adulthood, a greater level of normative shyness or social anxiety might be present during a major life change (eg, beginning to date again after the loss of a lengthy marriage or romantic relationship).
Assessment tools
Assessment tools can help you differentiate normal shyness from SAD. Several empirically-validated rating scales exist, including clinician-rated and self-report scales.
Liebowitz Social Anxiety Scale26 rates the severity of fear and avoidance in a variety of social interaction and performance-based situations. However, it was developed primarily as a clinician-rated scale and might be more burdensome to complete in practice. In addition, it does not provide cut-offs to indicate when more clinically significant anxiety might be likely.
Clinically Useful Social Anxiety Disorder Outcome Scale (CUSADOS)27 and Mini-Social Phobia Inventory (Mini-SPIN)28 are brief self-report scales that provide cut-offs to suggest further assessment is warranted. A cut-off score of 16 on the CUSADOS suggests the presence of SAD with 73% diagnostic efficiency.
One disadvantage to relying on a rating scale alone is the narrow focus on symptoms. Given that shyness and SAD share similar symptoms, it is necessary to assess the degree of impairment related to these symptoms to determine whether the problem is clinically significant. The overly narrow focus on symptoms utilized by the biomedical approach has been criticized for contributing to the medicalization of normal shyness.5
Diagnostic interviews, such as the Structured Clinical Interview for DSM-IV Axis I Disorders29 include sections on SAD that assess avoidance and impairment/distress associated with anxiety. Because these interviews may increase the time burden during an office visit, there are several general questions outside of a structured interview that you can ask, such as: “Has this anxiety interfered with your ability to initiate or maintain friendships? If so, how?” (Table 2). Persons with clinically significant social anxiety, rather than shyness, tend to report greater effects on their relationships and on work or school performance, as well as greater distress about having that anxiety.
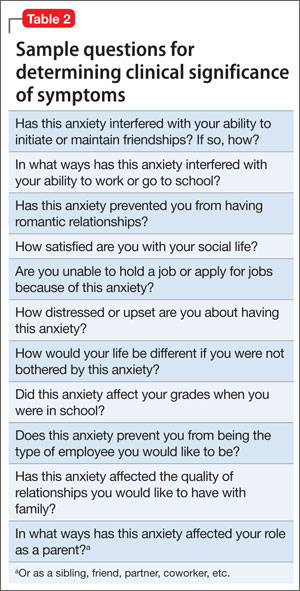
Treatment approaches based on distinctions
Exercise care in making the distinction between normal shyness and dysfunctional and impairing levels of anxiety characteristic of SAD, because persons who display normal shyness but who are overdiagnosed might feel stigmatized by a diagnostic label.5 Also, overpathologizing shyness takes what is a social problem out of context, and could promote treatment strategies that might not be helpful or effective.30
Unnecessary diagnosis might lead to unnecessary treatment, such as prescribing an antidepressant or benzodiazepine. Avoiding such a situation is important, because of the side effects associated with medication and the potential for dependence and withdrawal effects with benzodiazepines.
Persons who exhibit normal shyness do not require medical treatment and, often, do not want it. However, some people may be interested in improving their ability to function in social interactions. Self-help approaches or brief psychotherapy (eg, cognitive-behavioral therapy [CBT]) should be the first step—and might be all that is necessary.
The opposite side of the problem. Under-recognition of clinically significant social anxiety can lead to under-treatment, which is common even in patients with a SAD diagnosis.31 Treatment options include CBT, medication, and CBT combined with medication (Table 3):
- several studies have demonstrated the short- and long-term efficacy of CBT alone for SAD
- medication alone has been efficacious in the short-term, but less efficacious than CBT in the long-term
- combined treatment also has been shown to be more efficacious than CBT or medication alone in the short-term
- there is evidence to suggest that CBT alone is more efficacious in the long-term compared with combined treatment.a
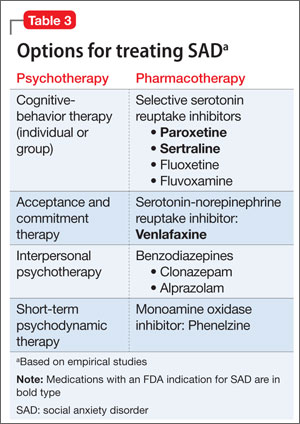
CBT is recommended as an appropriate first-line option, especially for mild and moderate SAD; it is the preferred initial treatment option of the United Kingdom’s National Institute for Health and Care Excellence (NICE). For more severe presentations (such as the presence of comorbidity) or when a patient did not respond to an adequate course of CBT, combined treatment might be an option—the goal being to taper the medication and continue CBT as a longer-term treatment. Research has shown that continuing CBT while discontinuing medication helps prevent relapse.32,33
Appropriate pharmacotherapy options include selective serotonin reuptake inhibitors and serotonin-norepinephrine reuptake inhibitors.34 Increasingly, benzodiazepines are considered less desirable; they are not recommended for routine use in SAD in the NICE guidelines. Those guidelines call for continuing pharmacotherapy for 6 months when a patient responds to treatment within 3 months, then discontinuing medication with the aid of CBT.
Bottom Line
The severity of anxiety and associated impairment and distress are the main variables that differentiate normal shyness and clinically significant social anxiety. Taking care not to over-pathologize normal shyness and common social anxiety concerns or underdiagnose severe, impairing social anxiety disorder has important implications for treatment—and for whether a patient needs treatment at all.
Related Resources
National Institute for Health and Care Excellence. Social anxiety disorder: recognition, assessment, and treatment of social anxiety disorder. http://guidance.nice.org.uk/cg159.
• Hofmann SG, DiBartolo PM, eds. Social anxiety: clinical, developmental, and social perspectives, 2nd ed. London, United Kingdom: Academic Press; 2010.
• The Shyness Institute. www.shyness.com.
Drug Brand Names
Alprazolam • Xanax Clonazepam • Klonopin Fluoxetine • Prozac
Fluvoxamine • Luvox Paroxetine • Paxil Phenelzine • Nardil
Sertraline • Zoloft Venlafaxine • Effexor
Disclosure
The authors report no financial relationships with any company whose products are mentioned in this article or with manufacturers of competing products.
Featured Audio
Kristy L. Dalrymple, PhD, discusses, treating social anxiety disorder. Dr. Dalrymple is Staff Psychologist, Department of Psychiatry, Rhode Island Hospital, and Assistant Professor of Psychiatry and Human Behavior, Alpert Medical School of Brown University, Providence, Rhode Island.
1. Bruce LC, Coles ME, Heimberg RG. Social phobia and social anxiety disorder: effect of disorder name on recommendation for treatment. Am J Psychiatry. 2012;169(5):538.
2. Bögels SM, Alden L, Beidel DC, et al. Social anxiety disorder: questions and answers for the DSM-V. Depress Anxiety. 2010;27:168-189.
3. Wakefield JC, Horwitz AV, Schmitz MF. Are we overpathologizing the socially anxious? Social phobia from a harmful dysfunction perspective. Can J Psychiatry. 2005;50(6):317-319.
4. Campbell-Sills L, Stein MB. Justifying the diagnostic status of social phobia: a reply to Wakefield, Horwitz, and Schmitz. Can J Psychiatry. 2005;50(6):320-323.
5. Scott S. The medicalisation of shyness: from social misfits to social fitness. Sociology of Health and Illness. 2006;28(2):133-153.
6. Wakefield JC. The DSM-5 debate over the bereavement exclusion: psychiatric diagnosis and the future of empirically supported treatment. Clin Psychol Rev. 2013; 33(7):825-845.
7. Hayes SC, Strosahl KD, Wilson KG. Acceptance and commitment therapy: the process and practice of mindful change. New York, NY: Guilford Press; 2012.
8. Kupfer DJ, First MB, Regier DA, eds. A research agenda for DSM-V. Washington, DC: American Psychiatric Association; 2002.
9. Diagnostic and statistical manual of mental disorders, 5th ed. Washington, DC: American Psychiatric Association; 2013.
10. Dalrymple KL, Zimmerman M. Does comorbid social anxiety disorder impact the clinical presentation of principal major depressive disorder? J Affect Disord. 2007;100:241-247.
11. Dalrymple KL. Issues and controversies surrounding the diagnosis and treatment of social anxiety disorder. Expert Rev Neurother. 2012;12(8):993-1008.
12. Furmark T, Tillfors M, Everz PO, et al. Social phobia in the general population: prevalence and sociodemographic profile. Soc Psychiatry Psychiatr Epidemiol. 1999;34:416-424.
13. Narrow WE, Rae DS, Robins LN, et al. Revised prevalence estimates of mental disorders in the United States: using a clinical significance criterion to reconcile 2 surveys’ estimates. Arch Gen Psychiatry. 2002;59:115-123.
14. Heiser NA, Turner SM, Beidel DC. Shyness: relationship to social phobia and other psychiatric disorders. Behav Res Ther. 2003;41:209-221.
15. Hofmann SG, Moscovitch DA, Hyo-Jin K. Autonomic correlates of social anxiety and embarrassment in shy and non-shy individuals. Int J Psychophysiology. 2006;61:134-142.
16. Kagan J. Temperamental contributions to affective and behavioral profiles in childhood. In: Hofmann SG, DiBartolo PM, eds. From social anxiety to social phobia: multiple perspectives. Needham Heights, MA: Allyn & Bacon; 2001:216-234.
17. Cox BJ, MacPherson PS, Enns MW. Psychiatric correlates of childhood shyness in a nationally representative sample. Behav Res Ther. 2005;43:1019-1027.
18. Burstein M, Ameli-Grillon L, Merikangas KR. Shyness versus social phobia in US youth. Pediatrics. 2011;128:917-925.
19. Hirshfeld-Becker DR, Micco J, Henin A, et al. Behavioral inhibition. Depress Anxiety. 2008;25:357-367.
20. Karevold E, Ystrom E, Coplan RJ, et al. A prospective longitudinal study of shyness from infancy to adolescence: stability, age-related changes, and prediction of socio-emotional functioning. J Abnorm Child Psychol. 2012; 40:1167-1177.
21. Chavira DA, Stein MB, Malcarne VL. Scrutinizing the relationship between shyness and social phobia. J Anxiety Disord. 2002;16:585-598.
22. Schneier FR, Blanco C, Antia SX, et al. The social anxiety spectrum. Psychiatr Clin N Am. 2002;25:757-774.
23. Stein MB, Chavira DA, Jang KL. Bringing up bashful baby: developmental pathways to social phobia. Psychiatr Clin N Am. 2001;24:797-818.
24. Cooper PJ, Eke M. Childhood shyness and maternal social phobia: a community study. Br J Psychiatry. 1999;174:439-443.
25. Heiser NA, Turner SM, Beidel DC, et al. Differentiating social phobia from shyness. J Anxiety Disord. 2009;23:469-476.
26. Liebowitz MR. Social phobia. Mod Probl Pharmacopsychiatry. 1987;22:141-173.
27. Dalrymple, KL, Martinez J, Tepe E, et al. A clinically useful social anxiety disorder outcome scale. Compr Psychiatry. 2013;54(7):758-765.
28. Connor KM, Kobak KA, Churchill LE, et al. Mini-SPIN: a brief screening assessment for generalized social anxiety disorder. Depress Anxiety. 2001;14(2):137-140.
29. First MB, Gibbon M, Spitzer RL, et al. Structured Clinical Interview for DSM-IV Axis II personality disorders (SCID-II). Washington, DC: American Psychiatric Press, Inc; 1997.
30. Conrad P. Medicalization and social control. Ann Rev Sociology. 1992;18:209-232.
31. Zimmerman M, Chelminski I. Clinician recognition of anxiety disorders in depressed outpatients. J Psychiatr Res. 2003;37:325-333.
32. Gelernter CS, Uhde TW, Cimbolic P, et al. Cognitive-behavioral and pharmacological treatments of social phobia: a controlled study. Arch Gen Psychiatry. 1991;48:938-945.
33. Otto MW, Smits JA, Reese HE. Cognitive-behavioral therapy for the treatment of anxiety disorders. J Clin Psychiatry. 2004;65(suppl 5):34-41.
34. Blanco C, Bragdon LB, Schneier FR, et al. The evidence-based pharmacotherapy of social anxiety disorder. Int J Neuropsychopharmacol. 2013;16:235-249.
Since the appearance of social anxiety disorder (SAD) in the DSM-III in 1980, research on its prevalence, characteristics, and treatment have grown (Box 11,2). In addition to the name, the definition of SAD has changed over the years; as a result, its prevalence has increased in recent cohort studies. This has led to debate over whether the experience of shyness is being over-pathologized, or whether SAD has been underdiagnosed in earlier decades. Those who argue that shyness is being over-pathologized note that it is a normal human experience that has evolutionary functions (eg, preventing engagement in harmful social relationships3). Others argue that a high degree of shyness is not beneficial in terms of evolution because it causes the individual to be shunned, so to speak, by society.4
Why worry about ‘over-pathologizing’?
The medicalization of shyness might be a reflection of Western societal values of assertiveness and gregariousness; other societies that value modesty and reticence do not over-pathologize shyness.5 It is important not to assume that someone who is shy necessarily has a “pathologic” level of social anxiety, especially because some people who are shy view that condition as a positive quality, much like sensitivity and conscientiousness.5
The broader issue of what constitutes a mental disorder arises in this debate. A “disorder” is a socially constructed label that describes a set of symptoms occurring together and its associated behaviors, not a real entity with etiological homogeneity.6 Labeling emotional problems “disordered” assumes that happiness is the natural homeostatic state, and distressing emotional states are abnormal and need to be changed.7 A diagnostic label can help improve communication and understand maladaptive behaviors; if that label is reified, however, it can lead to assumptions that the etiology, course, and treatment response are known. Proponents of the diagnostic psychiatric nomenclature have acknowledged the dangers of over-pathologizing normal experiences of living (such as fear) by way of diagnostic labeling.8
Determining when shyness becomes a clinically significant problem—what we call SAD here—demands a delicate distinction that has important implications for treatment. On one hand, if shyness is over-pathologized, persons who neither desire nor need treatment might be subjected to unnecessary and costly intervention. On the other hand, if SAD is underdiagnosed, some persons will not receive treatment that might be beneficial to them.
In this article, we review the similarities and differences between shyness and SAD, and provide recommendations for determining when shyness becomes a more clinically significant problem. We also highlight the importance of this distinction as it pertains to management, and provide suggestions for treatment approaches.
SAD: Definition, prevalence
SAD is defined as a significant fear of embarrassment or humiliation in social or performance-based situations, to a point at which the affected person often avoids these situations or endures them only with a high level of distress9 (Table 1, and Box 2). SAD can be distinguished from other anxiety disorders based on the source and content of the fear (ie, the source being social interaction or performance situations, and the content being a fear that one will show a behavior that will cause embarrassment). SAD also should be distinguished from autism spectrum disorders, in which persons have limited social communication capabilities and inadequate age-appropriate social relationships.
SAD is most highly comorbid with mood and anxiety disorders, with rates of at least 30% in clinical samples.10 The disorder also is highly comorbid with avoidant personality disorder—to a point at which it is argued that they are one and the same disorder.11
As with other psychiatric disorders, anxiety must cause significant impairment or distress. What constitutes significant impairment or distress is subjective, and the arbitrary nature of this criterion can influence estimates of the prevalence of SAD. For example, prevalence ranges as widely as 1.9% to 20.4% when different cut-offs are used for distress ratings and the number of impaired domains.12
The prevalence of SAD varies from 1 epidemiological study to another (ie, the Epidemiological Catchment Area [ECA] Study and the National Comorbidity Survey [NCS])—in part, a consequence of the differing definitions of significant impairment or distress. The ECA study assessed the clinical significance of each symptom in anxiety disorders; the NCS assessed overall clinical significance of the disorder. When the clinical significance criterion was applied at the symptom level to the NCS dataset (as was done in the ECA study), 1-year prevalence decreased by 50% (from 7.4% to 3.7%).13 The manner in which significant impairment or distress is defined (ie, conservatively or liberally) impacts whether social anxiety symptoms are classified as disordered or non-disordered.
Shyness: Definition, prevalence
Shyness often refers to 1) anxiety, inhibition, reticence, or a combination of these findings, in social and interpersonal situations, and 2) a fear of negative evaluation by others.14 It is a normal facet of personality that combines the experience of social anxiety and inhibited behavior,15 and also has been described as a stable temperament.16 Shyness is common; in the NCS study,17 26% of women and 19% of men characterized themselves as “very shy”; in the NCS Adolescent study,18 nearly 50% of adolescents self-identified as shy.
Persons who are shy tend to self-report greater social anxiety and embarrassment in social situations than non-shy persons do; they also might experience greater autonomic reactivity—especially blushing—in social or performance situations.15 Furthermore, shy persons are more likely to have axis I comorbidity and traits of introversion and neuroticism, compared with non-shy persons.14
Research suggests that temperament and behavioral inhibition are risk factors for mood and anxiety disorders, and appear to have a particularly strong relationship with SAD.19 A recent prospective study showed that shyness tends to increase steeply in toddlerhood, then stabilizes in childhood. Shyness in childhood—but not toddlerhood—is predictive of anxiety, depression, and poorer social skills in adolescence.20
A qualitative, or just quantitative, difference?
It is clear that SAD and shyness share several features—including anxiety and embarrassment—in social interactions. This raises a question: Are SAD and shyness distinct qualitatively, or do they represent points along a continuum, with SAD being an extreme form of shyness?
Continuum hypothesis. Support for the continuum hypothesis includes evidence that SAD and shyness share several features, including autonomic arousal, deficits in social skills (eg, aversion of gaze, difficulty initiating and maintaining conversation), avoidance of social situations, and fear of negative evaluation.21,22 In addition, both shyness and SAD are highly heritable,23 and mothers of shy children have a significantly higher rate of SAD than non-shy children do.24 No familial or genetic studies have compared heritability and familial aggregation in shyness and SAD.
According to the continuum hypothesis, if SAD is an extreme form of shyness, all (or nearly all) persons who have a diagnosis of SAD also would be characterized as shy. However, only approximately one-half of such persons report having been shy in childhood.17 Less than one-quarter of shy persons meet criteria for SAD.14,18 Because many persons who are shy do not meet criteria for SAD, and many who have SAD were not considered shy earlier in life, it has been suggested that this supports a qualitative distinction.
Qualitative distinctiveness. Despite having similarities, several features distinguish the experience of SAD from that of shyness. Compared with shyness, a SAD diagnosis is associated with:
- greater comorbidity
- greater severity of avoidance and impairment
- poorer quality of life.18,21,25
Studies that compared SAD, shyness without SAD, and non-shyness have shown that the shyness without SAD group more closely resembles the non-shy group than the SAD group—particularly with regard to impairment, presence of substance use, and other behavioral problems.18,25
Given the evidence, experts have concluded that shyness and a SAD diagnosis are overlapping yet different constructs that encapsulate qualitative and quantitative differences.25 There is a spectrum of shyness that ranges from a normative level to a higher level that overlaps the experience of SAD, but the 2 states represent different constructs.25
Guidance for making an assessment. Because of similarities in anxiety, embarrassment, and other symptoms in social situations, the best way to determine whether shyness crosses the line into a clinically significant problem is to assess the severity of the anxiety and associated degree of impairment and distress. More severe anxiety paired with distress about having anxiety and significant impairment in multiple areas of functioning might indicate more problematic social anxiety—a diagnosis of SAD—not just “normal” shyness.
It is important to take into account the environmental and cultural context of a patient’s distress and impairment because these features might fall within a normal range, given immediate circumstances (such as speaking in front of a large audience when one is not normally called on to do so, to a degree that does not interfere with general social functioning6).
What is considered a normative range depends on the developmental stage:
- Among children, a greater level of shyness might be considered more normative when it manifests during developmental stages in which separation anxiety appears.
- Among adolescents, a greater level of shyness might be considered normative especially during early adolescence (when social relationships become more important), and during times of transition (ie, entering high school).
- In adulthood, a greater level of normative shyness or social anxiety might be present during a major life change (eg, beginning to date again after the loss of a lengthy marriage or romantic relationship).
Assessment tools
Assessment tools can help you differentiate normal shyness from SAD. Several empirically-validated rating scales exist, including clinician-rated and self-report scales.
Liebowitz Social Anxiety Scale26 rates the severity of fear and avoidance in a variety of social interaction and performance-based situations. However, it was developed primarily as a clinician-rated scale and might be more burdensome to complete in practice. In addition, it does not provide cut-offs to indicate when more clinically significant anxiety might be likely.
Clinically Useful Social Anxiety Disorder Outcome Scale (CUSADOS)27 and Mini-Social Phobia Inventory (Mini-SPIN)28 are brief self-report scales that provide cut-offs to suggest further assessment is warranted. A cut-off score of 16 on the CUSADOS suggests the presence of SAD with 73% diagnostic efficiency.
One disadvantage to relying on a rating scale alone is the narrow focus on symptoms. Given that shyness and SAD share similar symptoms, it is necessary to assess the degree of impairment related to these symptoms to determine whether the problem is clinically significant. The overly narrow focus on symptoms utilized by the biomedical approach has been criticized for contributing to the medicalization of normal shyness.5
Diagnostic interviews, such as the Structured Clinical Interview for DSM-IV Axis I Disorders29 include sections on SAD that assess avoidance and impairment/distress associated with anxiety. Because these interviews may increase the time burden during an office visit, there are several general questions outside of a structured interview that you can ask, such as: “Has this anxiety interfered with your ability to initiate or maintain friendships? If so, how?” (Table 2). Persons with clinically significant social anxiety, rather than shyness, tend to report greater effects on their relationships and on work or school performance, as well as greater distress about having that anxiety.
Treatment approaches based on distinctions
Exercise care in making the distinction between normal shyness and dysfunctional and impairing levels of anxiety characteristic of SAD, because persons who display normal shyness but who are overdiagnosed might feel stigmatized by a diagnostic label.5 Also, overpathologizing shyness takes what is a social problem out of context, and could promote treatment strategies that might not be helpful or effective.30
Unnecessary diagnosis might lead to unnecessary treatment, such as prescribing an antidepressant or benzodiazepine. Avoiding such a situation is important, because of the side effects associated with medication and the potential for dependence and withdrawal effects with benzodiazepines.
Persons who exhibit normal shyness do not require medical treatment and, often, do not want it. However, some people may be interested in improving their ability to function in social interactions. Self-help approaches or brief psychotherapy (eg, cognitive-behavioral therapy [CBT]) should be the first step—and might be all that is necessary.
The opposite side of the problem. Under-recognition of clinically significant social anxiety can lead to under-treatment, which is common even in patients with a SAD diagnosis.31 Treatment options include CBT, medication, and CBT combined with medication (Table 3):
- several studies have demonstrated the short- and long-term efficacy of CBT alone for SAD
- medication alone has been efficacious in the short-term, but less efficacious than CBT in the long-term
- combined treatment also has been shown to be more efficacious than CBT or medication alone in the short-term
- there is evidence to suggest that CBT alone is more efficacious in the long-term compared with combined treatment.a
CBT is recommended as an appropriate first-line option, especially for mild and moderate SAD; it is the preferred initial treatment option of the United Kingdom’s National Institute for Health and Care Excellence (NICE). For more severe presentations (such as the presence of comorbidity) or when a patient did not respond to an adequate course of CBT, combined treatment might be an option—the goal being to taper the medication and continue CBT as a longer-term treatment. Research has shown that continuing CBT while discontinuing medication helps prevent relapse.32,33
Appropriate pharmacotherapy options include selective serotonin reuptake inhibitors and serotonin-norepinephrine reuptake inhibitors.34 Increasingly, benzodiazepines are considered less desirable; they are not recommended for routine use in SAD in the NICE guidelines. Those guidelines call for continuing pharmacotherapy for 6 months when a patient responds to treatment within 3 months, then discontinuing medication with the aid of CBT.
Bottom Line
The severity of anxiety and associated impairment and distress are the main variables that differentiate normal shyness and clinically significant social anxiety. Taking care not to over-pathologize normal shyness and common social anxiety concerns or underdiagnose severe, impairing social anxiety disorder has important implications for treatment—and for whether a patient needs treatment at all.
Related Resources
National Institute for Health and Care Excellence. Social anxiety disorder: recognition, assessment, and treatment of social anxiety disorder. http://guidance.nice.org.uk/cg159.
• Hofmann SG, DiBartolo PM, eds. Social anxiety: clinical, developmental, and social perspectives, 2nd ed. London, United Kingdom: Academic Press; 2010.
• The Shyness Institute. www.shyness.com.
Drug Brand Names
Alprazolam • Xanax Clonazepam • Klonopin Fluoxetine • Prozac
Fluvoxamine • Luvox Paroxetine • Paxil Phenelzine • Nardil
Sertraline • Zoloft Venlafaxine • Effexor
Disclosure
The authors report no financial relationships with any company whose products are mentioned in this article or with manufacturers of competing products.
Featured Audio
Kristy L. Dalrymple, PhD, discusses, treating social anxiety disorder. Dr. Dalrymple is Staff Psychologist, Department of Psychiatry, Rhode Island Hospital, and Assistant Professor of Psychiatry and Human Behavior, Alpert Medical School of Brown University, Providence, Rhode Island.
1. Bruce LC, Coles ME, Heimberg RG. Social phobia and social anxiety disorder: effect of disorder name on recommendation for treatment. Am J Psychiatry. 2012;169(5):538.
2. Bögels SM, Alden L, Beidel DC, et al. Social anxiety disorder: questions and answers for the DSM-V. Depress Anxiety. 2010;27:168-189.
3. Wakefield JC, Horwitz AV, Schmitz MF. Are we overpathologizing the socially anxious? Social phobia from a harmful dysfunction perspective. Can J Psychiatry. 2005;50(6):317-319.
4. Campbell-Sills L, Stein MB. Justifying the diagnostic status of social phobia: a reply to Wakefield, Horwitz, and Schmitz. Can J Psychiatry. 2005;50(6):320-323.
5. Scott S. The medicalisation of shyness: from social misfits to social fitness. Sociology of Health and Illness. 2006;28(2):133-153.
6. Wakefield JC. The DSM-5 debate over the bereavement exclusion: psychiatric diagnosis and the future of empirically supported treatment. Clin Psychol Rev. 2013; 33(7):825-845.
7. Hayes SC, Strosahl KD, Wilson KG. Acceptance and commitment therapy: the process and practice of mindful change. New York, NY: Guilford Press; 2012.
8. Kupfer DJ, First MB, Regier DA, eds. A research agenda for DSM-V. Washington, DC: American Psychiatric Association; 2002.
9. Diagnostic and statistical manual of mental disorders, 5th ed. Washington, DC: American Psychiatric Association; 2013.
10. Dalrymple KL, Zimmerman M. Does comorbid social anxiety disorder impact the clinical presentation of principal major depressive disorder? J Affect Disord. 2007;100:241-247.
11. Dalrymple KL. Issues and controversies surrounding the diagnosis and treatment of social anxiety disorder. Expert Rev Neurother. 2012;12(8):993-1008.
12. Furmark T, Tillfors M, Everz PO, et al. Social phobia in the general population: prevalence and sociodemographic profile. Soc Psychiatry Psychiatr Epidemiol. 1999;34:416-424.
13. Narrow WE, Rae DS, Robins LN, et al. Revised prevalence estimates of mental disorders in the United States: using a clinical significance criterion to reconcile 2 surveys’ estimates. Arch Gen Psychiatry. 2002;59:115-123.
14. Heiser NA, Turner SM, Beidel DC. Shyness: relationship to social phobia and other psychiatric disorders. Behav Res Ther. 2003;41:209-221.
15. Hofmann SG, Moscovitch DA, Hyo-Jin K. Autonomic correlates of social anxiety and embarrassment in shy and non-shy individuals. Int J Psychophysiology. 2006;61:134-142.
16. Kagan J. Temperamental contributions to affective and behavioral profiles in childhood. In: Hofmann SG, DiBartolo PM, eds. From social anxiety to social phobia: multiple perspectives. Needham Heights, MA: Allyn & Bacon; 2001:216-234.
17. Cox BJ, MacPherson PS, Enns MW. Psychiatric correlates of childhood shyness in a nationally representative sample. Behav Res Ther. 2005;43:1019-1027.
18. Burstein M, Ameli-Grillon L, Merikangas KR. Shyness versus social phobia in US youth. Pediatrics. 2011;128:917-925.
19. Hirshfeld-Becker DR, Micco J, Henin A, et al. Behavioral inhibition. Depress Anxiety. 2008;25:357-367.
20. Karevold E, Ystrom E, Coplan RJ, et al. A prospective longitudinal study of shyness from infancy to adolescence: stability, age-related changes, and prediction of socio-emotional functioning. J Abnorm Child Psychol. 2012; 40:1167-1177.
21. Chavira DA, Stein MB, Malcarne VL. Scrutinizing the relationship between shyness and social phobia. J Anxiety Disord. 2002;16:585-598.
22. Schneier FR, Blanco C, Antia SX, et al. The social anxiety spectrum. Psychiatr Clin N Am. 2002;25:757-774.
23. Stein MB, Chavira DA, Jang KL. Bringing up bashful baby: developmental pathways to social phobia. Psychiatr Clin N Am. 2001;24:797-818.
24. Cooper PJ, Eke M. Childhood shyness and maternal social phobia: a community study. Br J Psychiatry. 1999;174:439-443.
25. Heiser NA, Turner SM, Beidel DC, et al. Differentiating social phobia from shyness. J Anxiety Disord. 2009;23:469-476.
26. Liebowitz MR. Social phobia. Mod Probl Pharmacopsychiatry. 1987;22:141-173.
27. Dalrymple, KL, Martinez J, Tepe E, et al. A clinically useful social anxiety disorder outcome scale. Compr Psychiatry. 2013;54(7):758-765.
28. Connor KM, Kobak KA, Churchill LE, et al. Mini-SPIN: a brief screening assessment for generalized social anxiety disorder. Depress Anxiety. 2001;14(2):137-140.
29. First MB, Gibbon M, Spitzer RL, et al. Structured Clinical Interview for DSM-IV Axis II personality disorders (SCID-II). Washington, DC: American Psychiatric Press, Inc; 1997.
30. Conrad P. Medicalization and social control. Ann Rev Sociology. 1992;18:209-232.
31. Zimmerman M, Chelminski I. Clinician recognition of anxiety disorders in depressed outpatients. J Psychiatr Res. 2003;37:325-333.
32. Gelernter CS, Uhde TW, Cimbolic P, et al. Cognitive-behavioral and pharmacological treatments of social phobia: a controlled study. Arch Gen Psychiatry. 1991;48:938-945.
33. Otto MW, Smits JA, Reese HE. Cognitive-behavioral therapy for the treatment of anxiety disorders. J Clin Psychiatry. 2004;65(suppl 5):34-41.
34. Blanco C, Bragdon LB, Schneier FR, et al. The evidence-based pharmacotherapy of social anxiety disorder. Int J Neuropsychopharmacol. 2013;16:235-249.

Shyness or social anxiety disorder?

Auditory musical hallucinations: When a patient complains, ‘I hear a symphony!’
Nonpsychotic auditory musical hallucinations—hearing singing voices, musical tones, song lyrics, or instrumental music—occur in >20% of outpatients who have a diagnosis of an anxiety, affective, or schizophrenic disorder, with the highest prevalence (41%) in patients with obsessive-compulsive disorder (OCD).1 OCD comorbidity with other psychiatric disorders increases the frequency of auditory musical hallucinations. Auditory musical hallucinations mainly affect older (mean age, 61.5 years) females who have tinnitus and severe, high-frequency, sensorineural hearing loss.1 Auditory musical hallucinations occur in psychiatric diseases, ictal states of complex partial seizures, abnormalities of the auditory cortex, thalamic infarcts, subarachnoid hemorrhage, tumors of the brain stem, intoxication, and progressive deafness.1,2
What patients report hearing
Some patients identify 1 musical instrument that dominates others. The musical tones are reported to have a vibrating quality, similar to the sound produced by blowing air through a paper-covered comb. Some patients hear singing voices, predominantly deep in tone, although the words usually are not clear.
Patients with auditory musical hallucinations associated with deafness may not have dementia or psychosis. Both sensorineural and conductive involvement indicates a mixed type of deafness. Pure tone audiograms show a bilateral loss of >30 decibels, affecting the higher and lower ranges.2,3 Cerebral atrophy and microangiopathic changes are common co-occurring findings on MRI.
Treatment options
Reassure your patient that the experience is not necessarily associated with a psychotic disorder. Perform a complete history, physical, and neurologic examination. Rule out unilateral symptoms, tinnitus, and hearing loss. If she (he) is experiencing unilateral symptoms, pulsatile tinnitus, unilateral hearing loss, and a constant feeling of unsteadiness, further evaluation is necessary to exclude underlying pathology. Treating concurrent insomnia, depression, or anxiety might resolve the hallucinations.4
Nonpharmacotherapeutic treatments include hearing amplification, and masking tinnitus with a hearing aid emitting low-volume music or sounds of nature (ie, rainfall).4 Two cases have reported successful carbamazepine therapy; 2 other cases demonstrated success with clomipramine.5 Frequently, symptoms spontaneously remit.
Consider electroconvulsive therapy (ECT) for patients with musical hallucinations that are refractory to medical treatment and cause distress; 3 patients with concurrent major depressive disorder showed improvement after ECT.6 Antipsychotics are not recommended as first-line treatment.
Disclosure
Dr. Jain reports no financial relationship with any company whose products are mentioned in this article or with manufacturers of competing products.
1. Hermesh H, Konas S, Shiloh R, et al. Musical hallucinations: prevalence in psychotic and nonpsychotic outpatients. J Clin Psychiatry. 2004;65(2):191-197.
2. Schakenraad SM, Teunisse RJ, Olde Rikkert MG. Musical hallucinations in psychiatric patients. Int J Geriatr Psychiatry. 2006;21(4):394-397.
3. Evers S, Ellger T. The clinical spectrum of musical hallucinations. J Neurol Sci. 2004;227(1):55-65.
4. Zegarra NM, Cuetter AC, Briones DF, et al. Nonpsychotic auditory musical hallucinations in elderly persons with progressive deafness. Clin Geriatr. 2007;15(11):33-37.
5. Mahendran R. The psychopathology of musical hallucinations. Singapore Med J. 2007;48(2):e68-e70.
6. Wengel SP, Burke WJ, Holemon D. Musical hallucinations. The sounds of silence? J Am Geriatr Soc. 1989;37(2):163-166.
Nonpsychotic auditory musical hallucinations—hearing singing voices, musical tones, song lyrics, or instrumental music—occur in >20% of outpatients who have a diagnosis of an anxiety, affective, or schizophrenic disorder, with the highest prevalence (41%) in patients with obsessive-compulsive disorder (OCD).1 OCD comorbidity with other psychiatric disorders increases the frequency of auditory musical hallucinations. Auditory musical hallucinations mainly affect older (mean age, 61.5 years) females who have tinnitus and severe, high-frequency, sensorineural hearing loss.1 Auditory musical hallucinations occur in psychiatric diseases, ictal states of complex partial seizures, abnormalities of the auditory cortex, thalamic infarcts, subarachnoid hemorrhage, tumors of the brain stem, intoxication, and progressive deafness.1,2
What patients report hearing
Some patients identify 1 musical instrument that dominates others. The musical tones are reported to have a vibrating quality, similar to the sound produced by blowing air through a paper-covered comb. Some patients hear singing voices, predominantly deep in tone, although the words usually are not clear.
Patients with auditory musical hallucinations associated with deafness may not have dementia or psychosis. Both sensorineural and conductive involvement indicates a mixed type of deafness. Pure tone audiograms show a bilateral loss of >30 decibels, affecting the higher and lower ranges.2,3 Cerebral atrophy and microangiopathic changes are common co-occurring findings on MRI.
Treatment options
Reassure your patient that the experience is not necessarily associated with a psychotic disorder. Perform a complete history, physical, and neurologic examination. Rule out unilateral symptoms, tinnitus, and hearing loss. If she (he) is experiencing unilateral symptoms, pulsatile tinnitus, unilateral hearing loss, and a constant feeling of unsteadiness, further evaluation is necessary to exclude underlying pathology. Treating concurrent insomnia, depression, or anxiety might resolve the hallucinations.4
Nonpharmacotherapeutic treatments include hearing amplification, and masking tinnitus with a hearing aid emitting low-volume music or sounds of nature (ie, rainfall).4 Two cases have reported successful carbamazepine therapy; 2 other cases demonstrated success with clomipramine.5 Frequently, symptoms spontaneously remit.
Consider electroconvulsive therapy (ECT) for patients with musical hallucinations that are refractory to medical treatment and cause distress; 3 patients with concurrent major depressive disorder showed improvement after ECT.6 Antipsychotics are not recommended as first-line treatment.
Disclosure
Dr. Jain reports no financial relationship with any company whose products are mentioned in this article or with manufacturers of competing products.
1. Hermesh H, Konas S, Shiloh R, et al. Musical hallucinations: prevalence in psychotic and nonpsychotic outpatients. J Clin Psychiatry. 2004;65(2):191-197.
2. Schakenraad SM, Teunisse RJ, Olde Rikkert MG. Musical hallucinations in psychiatric patients. Int J Geriatr Psychiatry. 2006;21(4):394-397.
3. Evers S, Ellger T. The clinical spectrum of musical hallucinations. J Neurol Sci. 2004;227(1):55-65.
4. Zegarra NM, Cuetter AC, Briones DF, et al. Nonpsychotic auditory musical hallucinations in elderly persons with progressive deafness. Clin Geriatr. 2007;15(11):33-37.
5. Mahendran R. The psychopathology of musical hallucinations. Singapore Med J. 2007;48(2):e68-e70.
6. Wengel SP, Burke WJ, Holemon D. Musical hallucinations. The sounds of silence? J Am Geriatr Soc. 1989;37(2):163-166.
Angry, inattentive, and sidelined
CASE Angry and depressed
Y is a 16-year-old male who presents with his mother to our clinic for medication evaluation because of anger issues and problems learning in school. He says he has been feeling depressed for several months and noticed significant irritability. Y sleeps excessively, sometimes for more than 12 hours a day, and eats more than he usually does. He reports feeling hopeless, helpless, and guilty for letting his family down. Y, who is in the 10th grade, acknowledges trouble focusing and concentrating but attributed this to a previous diagnosis of attention-deficit/hyperactivity disorder (ADHD). He stopped taking his stimulant medication several months ago because he did not like taking it. He denies thoughts of self-harm or thinking about death.
Y’s mother reports that her son had been athletic but had to stop playing football because he has had 5 concussions. Y’s inability to play sports appears to be a precipitating factor in his decline in mood (Box). He had his first concussion at age 13; the last one was several months before his presenting to the clinic. Y experienced loss of consciousness and unsteady gait after his concussions and was hospitalized for some of them. Y says his life goals are “playing sports and being a marine,” which may be compromised because of his head injuries.
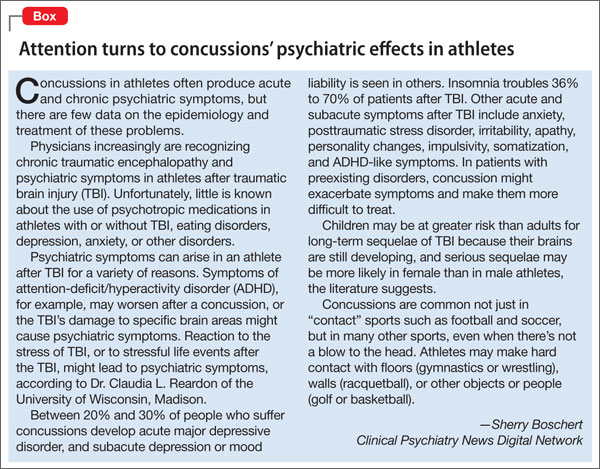
His mother reports Y is having more anger outbursts and says his personality is changing. Y viewed this change as just being more assertive and fails to see that others may be scared by his behavior. He is getting into more fights at school and is more impulsive and unpredictable, according to his mother. Y is struggling in school with cognitive deficits and memory problems; his grade point average (GPA) drops from 3.5 to 0.3 over several months. He had been homeschooled initially because of uncontrolled impulsivity and aggression, but was reintegrated to public school. Y has a history of a mathematics disorder but had done well without school accommodations before the head injuries. Lack of access to his peers and poor self-esteem because of his declining grades are making his mood worse. He denies a history of substance use and his urine drug screen is negative.
Recently, Y’s grandfather, with whom he had been close, died and 2 friends were killed in car accidents in the last few years. Y has no history of psychiatric hospitalization. He had seen a psychotherapist for depression. He had been on lisdexamfetamine, 30 mg/d, citalopram, 10 mg/d, and an unknown dose of dextroamphetamine. He had no major medical comorbidities. He lives with his mother. His parents are separated but he has frequent contact with his father. His developmental history is unremarkable. There was a questionable family history of schizophrenia, “nervous breakdowns,” depression, and bipolar disorder. There was no family history of suicide.
On his initial mental status examination, Y appears to be his stated age and is dressed appropriately. He is well dressed, suggesting that he puts a lot of care into his personal appearance. He is alert and oriented. He is cooperative and has fair eye contact. His gait is normal and no motor abnormalities are evident. His speech is normal in rate, rhythm, and volume. He can remember events with great accuracy. He reports that his mood is depressed and “down.” His affect appears irritable and he has low frustration tolerance, especially towards his mother. He is easy to anger but is re-directable. He does not endorse thoughts of suicidality or harm to others. He denies auditory or visual hallucinations, and paranoia. He does not appear to be responding to internal stimuli. His judgment and insight are fair.
a) major depressive disorder
b) oppositional defiant disorder
c) bipolar disorder, most recent episode depressed
d) ADHD, untreated
e) post-concussion syndrome
The authors' observations
Traumatic brain injury (TBI) affects 1.7 to 3.8 million people in the United States. More than 473,000 children present to the emergency room annually with TBI, approximately 75% of whom are given a label of mild TBI in the United States.1-3 TBI patients present with varying degrees of problems ranging from headaches to cognitive deficits and death. Symptoms may be transient or permanent.4 Prepubescent children are at higher risk and are more likely to sustain permanent damage post-TBI, with problems in attention, executive functioning, memory, and cognition.5-7
Prognosis depends on severity of injury and environmental factors, including socioeconomic status, family dysfunction, and access to resources.8 Patients may present during the acute concussion phase with physical symptoms, such as headaches, nausea, vomiting, sensitivity to light and sounds, and memory deficits, and psychiatric complaints such as anger, irritability, and mood swings. Symptoms may persist post-concussion, leading to problems in personal relationships and social and occupational functioning, and neuropsychiatric manifestations, including changes in personality, depression, suicidal thoughts, and substance dependence. As seen in this case, Y had neuropsychiatric manifestations after his TBI but other factors, such as his ADHD diagnosis and the death of his grandfather and friends, may have contributed to his presentation.
Up to one-half of children with brain injuries may be at increased risk for unfavorable behavioral outcomes, which include internalizing and externalizing presentations.9 These behavioral problems may emerge several years after the injury and often persist or get worse with time. Behavioral functioning before injury usually dictates long-term outcomes post injury. The American Academy of Neurology recently released guidelines for the assessment and treatment of athletes with concussions (see Related Resources).
TREATMENT Restart medication
We restart Y on citalopram, 10 mg/d, which he tolerated in the past, and increase it to 20 mg/d after 4 days to address his depression and irritability. He also is restarted on lisdexamfetamine, 30 mg/d, for his ADHD. We give his mother the Child Behavior Checklist and Teacher’s Report Forms to gather additional collateral information. We ask Y to follow up in 1 month and we encourage him to continue seeing his psychotherapist.
a) neuropsychological testing
b) neurology referral
c) imaging studies
d) no testing
EVALUATION Testing
Although Y denies feeling depressed to the neuropsychologist, the examiner notes her concerns about his depression based on his mental status examination during testing.
Neuropsychological testing reveals a discrepancy noted between normal verbal skills and perceptual intellectual skills that were in the borderline range (Table). Testing revealed results supporting executive dysfunction and distractibility, which are consistent with his history of ADHD. Y’s broad reading scores are in the 20th percentile and math scores in the 30th percentile. Although he has a history of a mathematics disorder, his reading deficits are considered a decline compared with his previous performance.
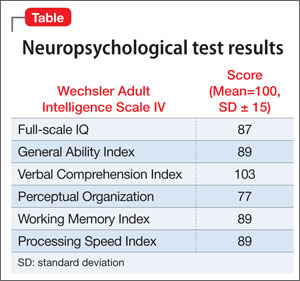
The authors' observations
Y is a 16-year-old male who presented with anger, depression, and academic problems. He had genetic loading with a questionable family history of schizophrenia, “nervous breakdowns,” depression, and bipolar disorder. Other than his concussions, Y was healthy, however, he had pre-morbid, untreated ADHD. He was doing well academically until his concussions, after which he started to see a steep decline in his grades. He was struggling with low self-esteem, which affected his mood. Multiple contributors perpetuated his difficulties, including, his inability to play sports; being home-schooled; removal from his friends; deaths of close friends and family; and a concern that his medical limitation to refrain from physical activities was affecting his career ambitions, contributing to his sense of hopelessness.
Y responded well to the stimulant and antidepressant, but it is important to note the increased risk of non-compliance in teenagers, even when they report seemingly minor side effects, despite doing well clinically. Y required frequent psychiatric follow up and repeat neuropsychological evaluation to monitor his progress.
OUTCOME Back on the playing field
At Y’s 1 month follow up, he reports feeling less depressed but citalopram, 20 mg/d, makes him feel “plain.” His GPA increases to 2.5 and he completes 10th grade. Lisdexamfetamine is titrated to 60 mg/d, he is focusing at school, and his anger is better controlled. Y’s mother is hesitant to change any medications because of her son’s overall improvement.
A few weeks before his next follow up appointment, Y’s mother calls stating that his depression is worse as he has not been taking citalopram because he doesn’t like how it makes him feel. He is started on fluoxetine, 10 mg/d. At his next appointment, Y says that he tolerates fluoxetine. His mood improves substantially and he is doing much better. Y’s mother says she feel that her son is more social, smiling more, and sleeping and eating better.
Several months after Y’s school performance, mood, and behaviors improve, his physicians give him permission to play non-contact sports. He is excited to play baseball. Because of his symptoms, we recommend continuing treating his ADHD and depressive symptoms and monitoring the need for medication. We discussed with Y nonpharmacotherapeutic options, including access to an individualized education plan at school, individual therapy, and formalized cognitive training.
Bottom Line
Traumatic brain injury (TBI) affects children and adults with long-term sequelae, which affects outcomes. Outcome is dependent on several risk factors. Many patients with TBI also suffer from neuropsychiatric symptoms that affect their functioning at home and in social and occupational settings. Those with premorbid psychiatric conditions need to be closely monitored because they may be at greater risk for problems with mood and executive function. Treatment should be targeted to individual complaints.
Related Resources
- Giza CC, Kutcher JS, Ashwal S, et al. Summary of evidence-based guideline update: evaluation and management of concussion in sports: report of the Guideline Development Subcommittee of the American Academy of Neurology. Neurology. 2013;80(24): 2250-2257.
- Reardon CL, Factor RM. Sport psychiatry: a systematic review of diagnosis and medical treatment of mental illness in athletes. Sports Med. 2010;40(11):961-980.
Drug Brand Names
Citalopram • Celexa Dextroamphetamine • Adderall
Fluoxetine • Prozac Lisdexamfetamine dimesylate • Vyvanse
Disclosure
The authors report no financial relationships with any company whose products are mentioned in this article or with manufacturers of competing products.
1. Jager TE, Weiss HB, Coben JH, et al. Traumatic brain injuries evaluated in US emergency departments, 1992-1994. Acad Emerg Med. 2000;7(2):134-140.
2. Committee on Quality Improvement American Academy of Pediatrics; Commission on Clinical Policies and Research American Academy of Family Physicians. The management of minor closed head injury in children. Pediatrics. 1999;104(6):1407-1415.
3. Koepsell TD, Rivara FP, Vavilala MS, et al. Incidence and descriptive epidemiologic features of traumatic brain injury in King County, Washington. Pediatrics. 2011;128(5):946-954.
4. Sahler CS, Greenwald BD. Traumatic brain injury in sports: a review [published online July 9, 2012]. Rehabil Res Pract. 2012;2012:659652. doi: 10.1155/2012/659652.
5. Crowe L, Babl F, Anderson V, et al. The epidemiology of paediatric head injuries: data from a referral centre in Victoria, Australia. J Paediatr Child Health. 2009;45(6):346-350.
6. Anderson V, Catroppa C, Morse S, et al. Intellectual outcome from preschool traumatic brain injury: a 5-year prospective, longitudinal study. Pediatrics. 2009;124(6):e1064-1071.
7. Jaffe KM, Fay GC, Polissar NL, et al. Severity of pediatric traumatic brain injury and neurobehavioral recovery at one year—a cohort study. Arch Phys Med Rehabil. 1993; 74(6):587-595.
8. Anderson VA, Catroppa C, Dudgeon P, et al. Understanding predictors of functional recovery and outcome 30 months following early childhood head injury. Neuropsychology. 2006;20(1):42-57.
9. Li L, Liu J. The effect of pediatric traumatic brain injury on behavioral outcomes: a systematic review. Dev Med Child Neurol. 2013;55(1):37-45.
CASE Angry and depressed
Y is a 16-year-old male who presents with his mother to our clinic for medication evaluation because of anger issues and problems learning in school. He says he has been feeling depressed for several months and noticed significant irritability. Y sleeps excessively, sometimes for more than 12 hours a day, and eats more than he usually does. He reports feeling hopeless, helpless, and guilty for letting his family down. Y, who is in the 10th grade, acknowledges trouble focusing and concentrating but attributed this to a previous diagnosis of attention-deficit/hyperactivity disorder (ADHD). He stopped taking his stimulant medication several months ago because he did not like taking it. He denies thoughts of self-harm or thinking about death.
Y’s mother reports that her son had been athletic but had to stop playing football because he has had 5 concussions. Y’s inability to play sports appears to be a precipitating factor in his decline in mood (Box). He had his first concussion at age 13; the last one was several months before his presenting to the clinic. Y experienced loss of consciousness and unsteady gait after his concussions and was hospitalized for some of them. Y says his life goals are “playing sports and being a marine,” which may be compromised because of his head injuries.
His mother reports Y is having more anger outbursts and says his personality is changing. Y viewed this change as just being more assertive and fails to see that others may be scared by his behavior. He is getting into more fights at school and is more impulsive and unpredictable, according to his mother. Y is struggling in school with cognitive deficits and memory problems; his grade point average (GPA) drops from 3.5 to 0.3 over several months. He had been homeschooled initially because of uncontrolled impulsivity and aggression, but was reintegrated to public school. Y has a history of a mathematics disorder but had done well without school accommodations before the head injuries. Lack of access to his peers and poor self-esteem because of his declining grades are making his mood worse. He denies a history of substance use and his urine drug screen is negative.
Recently, Y’s grandfather, with whom he had been close, died and 2 friends were killed in car accidents in the last few years. Y has no history of psychiatric hospitalization. He had seen a psychotherapist for depression. He had been on lisdexamfetamine, 30 mg/d, citalopram, 10 mg/d, and an unknown dose of dextroamphetamine. He had no major medical comorbidities. He lives with his mother. His parents are separated but he has frequent contact with his father. His developmental history is unremarkable. There was a questionable family history of schizophrenia, “nervous breakdowns,” depression, and bipolar disorder. There was no family history of suicide.
On his initial mental status examination, Y appears to be his stated age and is dressed appropriately. He is well dressed, suggesting that he puts a lot of care into his personal appearance. He is alert and oriented. He is cooperative and has fair eye contact. His gait is normal and no motor abnormalities are evident. His speech is normal in rate, rhythm, and volume. He can remember events with great accuracy. He reports that his mood is depressed and “down.” His affect appears irritable and he has low frustration tolerance, especially towards his mother. He is easy to anger but is re-directable. He does not endorse thoughts of suicidality or harm to others. He denies auditory or visual hallucinations, and paranoia. He does not appear to be responding to internal stimuli. His judgment and insight are fair.
a) major depressive disorder
b) oppositional defiant disorder
c) bipolar disorder, most recent episode depressed
d) ADHD, untreated
e) post-concussion syndrome
The authors' observations
Traumatic brain injury (TBI) affects 1.7 to 3.8 million people in the United States. More than 473,000 children present to the emergency room annually with TBI, approximately 75% of whom are given a label of mild TBI in the United States.1-3 TBI patients present with varying degrees of problems ranging from headaches to cognitive deficits and death. Symptoms may be transient or permanent.4 Prepubescent children are at higher risk and are more likely to sustain permanent damage post-TBI, with problems in attention, executive functioning, memory, and cognition.5-7
Prognosis depends on severity of injury and environmental factors, including socioeconomic status, family dysfunction, and access to resources.8 Patients may present during the acute concussion phase with physical symptoms, such as headaches, nausea, vomiting, sensitivity to light and sounds, and memory deficits, and psychiatric complaints such as anger, irritability, and mood swings. Symptoms may persist post-concussion, leading to problems in personal relationships and social and occupational functioning, and neuropsychiatric manifestations, including changes in personality, depression, suicidal thoughts, and substance dependence. As seen in this case, Y had neuropsychiatric manifestations after his TBI but other factors, such as his ADHD diagnosis and the death of his grandfather and friends, may have contributed to his presentation.
Up to one-half of children with brain injuries may be at increased risk for unfavorable behavioral outcomes, which include internalizing and externalizing presentations.9 These behavioral problems may emerge several years after the injury and often persist or get worse with time. Behavioral functioning before injury usually dictates long-term outcomes post injury. The American Academy of Neurology recently released guidelines for the assessment and treatment of athletes with concussions (see Related Resources).
TREATMENT Restart medication
We restart Y on citalopram, 10 mg/d, which he tolerated in the past, and increase it to 20 mg/d after 4 days to address his depression and irritability. He also is restarted on lisdexamfetamine, 30 mg/d, for his ADHD. We give his mother the Child Behavior Checklist and Teacher’s Report Forms to gather additional collateral information. We ask Y to follow up in 1 month and we encourage him to continue seeing his psychotherapist.
a) neuropsychological testing
b) neurology referral
c) imaging studies
d) no testing
EVALUATION Testing
Although Y denies feeling depressed to the neuropsychologist, the examiner notes her concerns about his depression based on his mental status examination during testing.
Neuropsychological testing reveals a discrepancy noted between normal verbal skills and perceptual intellectual skills that were in the borderline range (Table). Testing revealed results supporting executive dysfunction and distractibility, which are consistent with his history of ADHD. Y’s broad reading scores are in the 20th percentile and math scores in the 30th percentile. Although he has a history of a mathematics disorder, his reading deficits are considered a decline compared with his previous performance.
The authors' observations
Y is a 16-year-old male who presented with anger, depression, and academic problems. He had genetic loading with a questionable family history of schizophrenia, “nervous breakdowns,” depression, and bipolar disorder. Other than his concussions, Y was healthy, however, he had pre-morbid, untreated ADHD. He was doing well academically until his concussions, after which he started to see a steep decline in his grades. He was struggling with low self-esteem, which affected his mood. Multiple contributors perpetuated his difficulties, including, his inability to play sports; being home-schooled; removal from his friends; deaths of close friends and family; and a concern that his medical limitation to refrain from physical activities was affecting his career ambitions, contributing to his sense of hopelessness.
Y responded well to the stimulant and antidepressant, but it is important to note the increased risk of non-compliance in teenagers, even when they report seemingly minor side effects, despite doing well clinically. Y required frequent psychiatric follow up and repeat neuropsychological evaluation to monitor his progress.
OUTCOME Back on the playing field
At Y’s 1 month follow up, he reports feeling less depressed but citalopram, 20 mg/d, makes him feel “plain.” His GPA increases to 2.5 and he completes 10th grade. Lisdexamfetamine is titrated to 60 mg/d, he is focusing at school, and his anger is better controlled. Y’s mother is hesitant to change any medications because of her son’s overall improvement.
A few weeks before his next follow up appointment, Y’s mother calls stating that his depression is worse as he has not been taking citalopram because he doesn’t like how it makes him feel. He is started on fluoxetine, 10 mg/d. At his next appointment, Y says that he tolerates fluoxetine. His mood improves substantially and he is doing much better. Y’s mother says she feel that her son is more social, smiling more, and sleeping and eating better.
Several months after Y’s school performance, mood, and behaviors improve, his physicians give him permission to play non-contact sports. He is excited to play baseball. Because of his symptoms, we recommend continuing treating his ADHD and depressive symptoms and monitoring the need for medication. We discussed with Y nonpharmacotherapeutic options, including access to an individualized education plan at school, individual therapy, and formalized cognitive training.
Bottom Line
Traumatic brain injury (TBI) affects children and adults with long-term sequelae, which affects outcomes. Outcome is dependent on several risk factors. Many patients with TBI also suffer from neuropsychiatric symptoms that affect their functioning at home and in social and occupational settings. Those with premorbid psychiatric conditions need to be closely monitored because they may be at greater risk for problems with mood and executive function. Treatment should be targeted to individual complaints.
Related Resources
- Giza CC, Kutcher JS, Ashwal S, et al. Summary of evidence-based guideline update: evaluation and management of concussion in sports: report of the Guideline Development Subcommittee of the American Academy of Neurology. Neurology. 2013;80(24): 2250-2257.
- Reardon CL, Factor RM. Sport psychiatry: a systematic review of diagnosis and medical treatment of mental illness in athletes. Sports Med. 2010;40(11):961-980.
Drug Brand Names
Citalopram • Celexa Dextroamphetamine • Adderall
Fluoxetine • Prozac Lisdexamfetamine dimesylate • Vyvanse
Disclosure
The authors report no financial relationships with any company whose products are mentioned in this article or with manufacturers of competing products.
1. Jager TE, Weiss HB, Coben JH, et al. Traumatic brain injuries evaluated in US emergency departments, 1992-1994. Acad Emerg Med. 2000;7(2):134-140.
2. Committee on Quality Improvement American Academy of Pediatrics; Commission on Clinical Policies and Research American Academy of Family Physicians. The management of minor closed head injury in children. Pediatrics. 1999;104(6):1407-1415.
3. Koepsell TD, Rivara FP, Vavilala MS, et al. Incidence and descriptive epidemiologic features of traumatic brain injury in King County, Washington. Pediatrics. 2011;128(5):946-954.
4. Sahler CS, Greenwald BD. Traumatic brain injury in sports: a review [published online July 9, 2012]. Rehabil Res Pract. 2012;2012:659652. doi: 10.1155/2012/659652.
5. Crowe L, Babl F, Anderson V, et al. The epidemiology of paediatric head injuries: data from a referral centre in Victoria, Australia. J Paediatr Child Health. 2009;45(6):346-350.
6. Anderson V, Catroppa C, Morse S, et al. Intellectual outcome from preschool traumatic brain injury: a 5-year prospective, longitudinal study. Pediatrics. 2009;124(6):e1064-1071.
7. Jaffe KM, Fay GC, Polissar NL, et al. Severity of pediatric traumatic brain injury and neurobehavioral recovery at one year—a cohort study. Arch Phys Med Rehabil. 1993; 74(6):587-595.
8. Anderson VA, Catroppa C, Dudgeon P, et al. Understanding predictors of functional recovery and outcome 30 months following early childhood head injury. Neuropsychology. 2006;20(1):42-57.
9. Li L, Liu J. The effect of pediatric traumatic brain injury on behavioral outcomes: a systematic review. Dev Med Child Neurol. 2013;55(1):37-45.
NHLBI hands off hypertension guidelines to ACC, AHA
The two U.S. groups most active in issuing guidelines and recommendations for cardiovascular disease diagnosis and management, the American College of Cardiology and American Heart Association, received a surprise in June when the National Heart, Lung, and Blood Institute suddenly announced that it would shift to these and other "partner organizations" primary responsibility for the next updates of U.S. hypertension guidelines, national cholesterol-management guidelines, and the other cardiovascular disease–related management recommendations that the institute has had in the works.
The NHLBI launched "a collaborative relationship with the ACC, AHA, and other organizations because they said they are not in a position to endorse guidelines, they must be endorsed by other organizations," said Dr. Sidney C. Smith Jr., professor of medicine at the University of North Carolina in Chapel Hill. Dr. Smith is a member of the panel that’s been writing the Eighth Report of the Joint National Committee on Prevention, Detection, Evaluation, and Treatment of High Blood Pressure (JNC 8), and has been active for a long time in the ACC and AHA guidelines-development process.

On June 19, Dr. Gary H. Gibbons, NHLBI director, and his associates announced that effective immediately the institute was getting out of the guidelines-issuing business (Circulation 2013; doi: 10.1161/CIRCULATIONAHA.113.004587).
"Just over the past couple of months we began to look at how this will be done. Everyone wants the process to move quickly. How quickly can these organizations put it together? That’s the limiting factor right now," Dr. Smith said in an interview in early September.
While the ACC and AHA have on record some 20 sets of practice guidelines that cover most facets of cardiology, their list omits areas that the NHLBI covered in the past, notably hypertension and hypercholesterolemia assessment and management.
"The ACC and AHA guideline process is very expensive, and we wouldn’t dream of duplicating something when people you trust were commissioned by someone else [NHLBI] to do the work," said Dr. Kim Allan Williams Sr. of Wayne State University, Detroit. Dr. Williams will take the position of professor of medicine and chief of cardiovascular services at Rush University Medical Center in Chicago on Nov. 1. He serves as vice-president of the ACC. "We have all been under the impression that JNC 8 was being put together and getting published soon," he said in an interview.
Dr. Williams stressed that he and other ACC officials have pledged not to talk about the JNC 8 process until transition from the NHLBI works itself out, but he offered this succinct observation: The ACC "has made a commitment to go forward with the JNC process. There will be a publication from that panel, although it may not have that name."
Dr. Smith and Dr. Williams said that they had no relevant disclosures.
On Twitter @mitchelzoler
The two U.S. groups most active in issuing guidelines and recommendations for cardiovascular disease diagnosis and management, the American College of Cardiology and American Heart Association, received a surprise in June when the National Heart, Lung, and Blood Institute suddenly announced that it would shift to these and other "partner organizations" primary responsibility for the next updates of U.S. hypertension guidelines, national cholesterol-management guidelines, and the other cardiovascular disease–related management recommendations that the institute has had in the works.
The NHLBI launched "a collaborative relationship with the ACC, AHA, and other organizations because they said they are not in a position to endorse guidelines, they must be endorsed by other organizations," said Dr. Sidney C. Smith Jr., professor of medicine at the University of North Carolina in Chapel Hill. Dr. Smith is a member of the panel that’s been writing the Eighth Report of the Joint National Committee on Prevention, Detection, Evaluation, and Treatment of High Blood Pressure (JNC 8), and has been active for a long time in the ACC and AHA guidelines-development process.
On June 19, Dr. Gary H. Gibbons, NHLBI director, and his associates announced that effective immediately the institute was getting out of the guidelines-issuing business (Circulation 2013; doi: 10.1161/CIRCULATIONAHA.113.004587).
"Just over the past couple of months we began to look at how this will be done. Everyone wants the process to move quickly. How quickly can these organizations put it together? That’s the limiting factor right now," Dr. Smith said in an interview in early September.
While the ACC and AHA have on record some 20 sets of practice guidelines that cover most facets of cardiology, their list omits areas that the NHLBI covered in the past, notably hypertension and hypercholesterolemia assessment and management.
"The ACC and AHA guideline process is very expensive, and we wouldn’t dream of duplicating something when people you trust were commissioned by someone else [NHLBI] to do the work," said Dr. Kim Allan Williams Sr. of Wayne State University, Detroit. Dr. Williams will take the position of professor of medicine and chief of cardiovascular services at Rush University Medical Center in Chicago on Nov. 1. He serves as vice-president of the ACC. "We have all been under the impression that JNC 8 was being put together and getting published soon," he said in an interview.
Dr. Williams stressed that he and other ACC officials have pledged not to talk about the JNC 8 process until transition from the NHLBI works itself out, but he offered this succinct observation: The ACC "has made a commitment to go forward with the JNC process. There will be a publication from that panel, although it may not have that name."
Dr. Smith and Dr. Williams said that they had no relevant disclosures.
On Twitter @mitchelzoler

Ponatinib trials put on partial hold
As a result of adverse events, all trials of the tyrosine kinase inhibitor ponatinib (Iclusig) have been placed on partial clinical hold.
The US Food and Drug Administration (FDA) has paused new enrollment in the trials.
Patients already enrolled will continue to receive ponatinib, but at reduced doses. If trial enrollment resumes, eligibility criteria will change.
These actions come after ponatinib’s makers, Ariad Pharmaceuticals, reviewed extended follow-up data from the PACE trial and observed an increase in thrombotic events.
This phase 2 trial is testing ponatinib in patients with chronic myeloid leukemia (CML) or Philadelphia chromosome-positive acute lymphoblastic leukemia (Ph+ ALL) who have resisted or cannot tolerate therapy with dasatinib or nilotinib.
At a median follow-up of 24 months, 11.8% of PACE patients developed serious arterial thrombosis, including 6.2% with cardiovascular events, 4% with cerebrovascular events, and 3.6% with peripheral vascular events. (Some patients had more than one type of event.) In comparison, 8% of patients had serious arterial thrombosis at 11 months of follow-up.
The rate of serious venous occlusion also increased with extended follow-up. At 24 months, the event had occurred in 2.9% of patients, compared to 2.2% at 11 months of follow-up.
Ariad noted, however, that the incidence rate of arterial thrombotic events has not increased when it is normalized to the duration of treatment exposure. There were 10 events per 100 patient-years in the original analysis and 9.6 events per 100 patient-years in the current analysis.
Nevertheless, Ariad has announced the following changes to the clinical development program for ponatinib.
First, the FDA has paused patient enrollment in all clinical studies of ponatinib. Subject to agreement with the FDA, enrollment will resume with dose changes and other modifications.
Patients who are currently receiving ponatinib will continue on therapy. However, doses will be reduced, on a trial-by-trial basis, from the current 45-mg-daily dose.
The dose in patients enrolled in the EPIC trial will be reduced to 30 mg daily, unless they have achieved a major molecular response. In these patients, the dose will be reduced to 15 mg daily. EPIC is a phase 3 trial testing ponatinib in patients with newly diagnosed CML.
Once enrollment resumes for ponatinib trials, the eligibility criteria will be modified to exclude patients who have experienced prior arterial thrombosis resulting in heart attack or stroke.
The US prescribing information for ponatinib has not yet changed. The drug is still available in the US to patients with resistant or intolerant CML or Ph+ ALL at the approved, once-daily dose of 45 mg. Ponatinib was approved for this indication in the US in December and in the European Union in July.
Ariad is consulting with the FDA and other health authorities about changes in ponatinib’s product labeling to reflect the updated information.
The company is sending a written communication to healthcare providers outlining this information. Ariad is also informing the European Medicines Agency and other regulatory agencies of the changes.
For more information about the changes in ponatinib trials, visit www.clinicaltrials.gov, email inquiries to [email protected], or call the Ariad US toll-free number: (855) 552-7423, the European Union toll-free number: 800 00027423, or the international number: +1 (617)-503-7423. ![]()