User login
Meeting the Challenge of Recurrent CDI
As noted elsewhere in this supplement, recent studies show a high rate of recurrent Clostridium difficile infection (CDI) despite the availability of evidence‐based guidelines for CDI treatment. 1, 2 Treatment with vancomycin has been associated with recurrence in 25% or more of patients. The risk for recurrence increases with each episode, and is greater than 60% in patients with more than 2 episodes. 1, 3, 4 Identification of patients at risk for recurrence is critical to early diagnosis and prompt treatment. 5 Because recurrent CDI is so widespread, it should be common practice to educate patients about this complication, including:
-
The risk for continued exposure to C. difficile in the hospital or home environment and strategies for appropriate hygiene to minimize reinfection.
-
When to contact a healthcare professional for recurrent symptoms. 1
CASE STUDY CONTINUED
In the previous article in this supplement, a case study for patient A.L. was presented. A.L. is an 87‐year‐old woman who developed initial inpatient CDI in a rehabilitation facility. She was empirically started on oral metronidazole, 500 mg 3 times a day. Her symptoms improved but she became febrile with an elevated white blood cell (WBC) count. She was transferred to an acute care facility where her treatment was switched to oral vancomycin 125 mg 4 times daily. A proctoscopic exam confirmed pseudomembranous colitis, and her treatment regimen was increased to oral vancomycin 500 mg 4 times daily plus intravenous (IV) metronidazole 500 mg every 8 hours. The CDI responded to therapy and she was discharged to home care.
Ten days after her hospital discharge, A.L. noted a change in the character of her stools, which became looser and increased in frequency, accompanied by a foul odor that she recalls was present during her previous episode. The following day, she developed frank watery stools occurring every 1‐2 hours and had 2 incontinent episodes. Her family brought her to the emergency department because she was also light‐headed, confused, and had increased abdominal cramping. Intravenous fluid resuscitation was started, along with oral vancomycin, 125 mg every 6 hours for 14 days, followed by a vancomycin taper and pulse, which consisted of 125 mg twice daily for 7 days, once daily for 7 days, once every other day for 7 days, then every third day. Stool was sent to the lab for C. difficile testing in the middle of the taper regimen. The result was negative. Ten days after tapering the oral vancomycin regimen to every third day, she developed loose stools with the same odor, followed by increased frequency and frank watery stools.
This case illustrates several aspects of recurrent CDI. First, the recurrent episode may be severe, as evidenced by the need for IV fluid resuscitation in addition to specific anti‐C. difficile treatment. Second, although the patient was treated appropriately with standard 4 times daily vancomycin followed by a taper, subsequent recurrences may still occur, usually near the end of the taper/pulse (as in this case) or shortly after finishing the regimen. Finally, test of cure stool testing (either toxin testing, culture, or polymerase chain reaction [PCR]) may be misleading and is NOT recommended for managing recurrent CDI. Although subsequent management of this case was not addressed, repeating the standard vancomycin regimen, followed again by a taper/pulse would be a realistic option, as vancomycin resistance in C. difficile has not been reported and the patient would be expected to respond. Other management options should also be considered and are discussed below.
SHEA/IDSA RECOMMENDATIONS
There is no strong evidence to support a particular treatment strategy for recurrent CDI. 5 The Society for Healthcare Epidemiology of America/Infectious Diseases Society of America (SHEA/IDSA) guidelines 6 recommends the following:
-
When severe or complicated CDI is suspected, initiate empiric treatment as soon as the diagnosis is suspected (C‐III).
-
Treatment of the first recurrence is usually with the same regimen as for the initial episode (A‐II), but should be stratified by disease severity (C‐III).
-
Do not use metronidazole beyond first recurrence or for long‐term chronic therapy (B‐II).
-
Treatment of second or later recurrences with vancomycin using a taper and/or pulse regimen is the preferred next strategy (B‐III).
-
No recommendations can be made regarding prevention of recurrent CDI in patients requiring continued antimicrobial therapy (C‐III).
The vancomycin taper/pulse regimen is one of the most widely used regimens for treatment of recurrent CDI. 5 A tapered oral vancomycin regimen consists of a stepwise decrease in dose over a period of time. Intermittent or pulsed vancomycin therapy consists of administering the drug every few days.
A standard course of antibiotic therapy eradicates vegetative cells of C. difficile, but is not effective against spores. Administering antibiotics over an extended time period at decreasing doses (tapered regimen) or intermittent delivery (pulsed regimen) gradually clears C. difficile by eradicating cells as the spores germinate. 5 Thus, a taper/pulse regimen of vancomycin, in theory, leads to a decreased rate of recurrence and may aid restoration of the normal microflora. 5
Evidence for efficacy of the tapered dosage regimen is based on a post hoc analysis of patients treated for recurrence in 2 trials of probiotic treatment with Saccharomyces boulardii. When standard‐dose oral vancomycin (125 mg 4 times daily) was compared with high‐dose vancomycin (500 mg twice daily for 7 to 14 days), recurrence rates were not statistically different. However, a tapered regimen of vancomycin resulted in significantly fewer recurrences (31%, P = 0.01), as did a pulsed dose of vancomycin (14.3%, P = 0.02). 4 One empiric pulsed‐dose regimen consists of oral vancomycin, 125 mg every 6 hours for 14 days, followed by tapering to 125 mg every 12 hours for 7 days, then 125 mg once daily for another 7 days, followed in turn by pulse‐dosed vancomycin (125 mg once every 2 days for 4 doses, then once every 3 days for 5 doses, or longer). 1 Prolonged courses of metronidazole are not recommended because of potential adverse effects, including peripheral neuropathy. 1
Management of patients with multiple recurrences of CDI is difficult, and no regimens are supported by adequate clinical evidence. 5 Various strategies have been tried, including probiotics, antibiotics, toxin binders, and immune‐based treatments. 1 The strategy behind use of probiotics is to augment colonization resistance. The probiotic S. boulardii, 1 g daily for 4 weeks, decreased recurrence compared with placebo in a small study of 60 patients when given during and after standard treatment (ie, metronidazole or vancomycin). In patients receiving high‐dose vancomycin plus S. boulardii, 3 of 18 (16.7%) had a recurrence compared with 7 of 14 (50%) receiving high‐dose vancomycin plus placebo (P = 0.05). 7 However, a larger follow‐up study did not show a significant overall benefit of S. boulardii over placebo. 1, 7 In addition, there have been a few case reports of systemic infections in immunocompromised patients treated with probiotics. 8 Overall, the results of studies with probiotics, including Lactobacilli, have been inconsistent.
Another approach to restoring a normal gastrointestinal microflora is fecal transplantation, where a small amount of fresh feces from a healthy donor (ideally someone who lives with the patient), is suspended in saline, filtered, and administered through a nasogastric tube, by colonoscope, or by enema. In a recent case series of 18 patients, this approach showed a 94% success rate. 9
Another potential strategy to prevent recurrence is to block colonization of pathogenic C. difficile strains by administration of nontoxigenic and nonpathogenic strains of C. difficile. Researchers have identified a nontoxigenic strain that is being developed as a targeted biotherapeutic probiotic for human use. 1 Because patients with recurrent CDI lack a strong immune response to C. difficile toxins, IV immunoglobulin (IVIG) has been used empirically to provide passive immunotherapy. It has shown benefit in some case series of patients with multiple recurrences. 1, 10, 11
Other antibiotics have also been investigated in conjunction with vancomycin for recurrent infection. Rifaximin has good in vitro activity against C. difficile, and is not absorbed from the gastrointestinal tract. Oral rifaximin, 400 to 800 mg daily for 14 days following discontinuation of vancomycin, was shown to prevent further recurrence in 7 of 8 patients with a history of 4 to 8 CDI recurrences. 1, 12 It is important to note that rifaximin resistance has been reported in clinical isolates of C. difficile, and may be more common than initially thought, particularly among epidemic strains. 13
Fidaxomicin, a narrow‐spectrum macrocyclic antibiotic, was also compared with vancomycin in 2 multicenter, randomized, double‐blind Phase 3 clinical trials of 1105 adults with confirmed CDI. 14 Patients were treated with either oral fidaxomicin (200 mg every 12 hours) or oral vancomycin (125 mg every 6 hours) for 10 days. 15, 16 The clinical cure rate with fidaxomicin was comparable to vancomycin in both studies. 14 In the more recent study, 59.8% of subjects (N = 535) were receiving concomitant antibiotics during CDI treatment; among this group, treatment with fidaxomicin was associated with a significantly lower recurrence rate than treatment with vancomycin (17.6% vs 29.5%, P = 0.027). 15 In addition, there was a sustained clinical response. Global cure, also a secondary endpoint, was defined as patients who were cured and did not have a recurrence during a subsequent 4‐week period, compared with treatment with vancomycin (67.5% vs 53.4%, P = 0.020). 15 These results confirm the findings from the first fidaxomicin Phase 3 study 16 and suggest that even when concomitant antibiotics are administered, fidaxomicin may be more effective than vancomycin in preventing CDI recurrence.
SUMMARY
Because hospitalists take a leadership role and often coordinate care for patients with CDI, they can take an active role to ensure that clinicians are aware of evidence‐based treatments for recurrent CDI, and the importance of routine follow‐up and persistence. The most important considerations in managing patients with recurrent CDI are to:
-
Continue to try new or previous approaches, beginning with those that are evidence‐based, followed by options that have been shown to work but are not backed by strong clinical evidence.
-
Provide consistent follow‐up and ongoing support.
-
Be sympatheticbecause this condition has significant detrimental impact on quality of life.
- . A 76‐year‐old man with recurrent Clostridium difficile‐associated diarrhea: review of C difficile infection. JAMA. 2009;301(9):954–962.
- . Clostridium difficile and the disease it causes. Methods Mol Biol. 2010;646:9–35.
- , , , et al. A randomized placebo‐controlled trial of Saccharomyces boulardii in combination with standard antibiotics for Clostridium difficile disease. JAMA. 1994;271(24):1913–1918.
- , , . Breaking the cycle: treatment strategies for 163 cases of recurrent Clostridium difficile disease. Am J Gastroenterol. 2002;97(7):1769–1775.
- . Recurrent Clostridium difficile infection: a review of risk factors, treatments, and outcomes. J Infect. 2009;58(6):403–410.
- , , , et al. Clinical practice guidelines for Clostridium difficile infection in adults: 2010 update by the Society for Healthcare Epidemiology of America (SHEA) and the Infectious Diseases Society of America (IDSA). Infect Control Hosp Epidemiol. 2010;31(5):431–455.
- , , , et al. The search for a better treatment for recurrent Clostridium difficile disease: use of high‐dose vancomycin combined with Saccharomyces boulardii. Clin Infect Dis. 2000;31(4):1012–1017.
- , , , et al. Saccharomyces cerevisiae fungemia after Saccharomyces boulardii treatment in immunocompromised patients. J Clin Gastroenterol. 2003;36(1):41–43.
- , , . Recurrent Clostridium difficile colitis: case series involving 18 patients treated with donor stool administered via a nasogastric tube. Clin Infect Dis. 2003;36(5):580–585.
- , , , et al. Treatment with intravenously administered gamma globulin of chronic relapsing colitis induced by Clostridium difficile toxin. J Pediatr. 1991;118(4 pt 1):633–637.
- . Descriptive study of intravenous immunoglobulin for the treatment of recurrent Clostridium difficile diarrhoea. J Antimicrob Chemother. 2004;53(5):882–884.
- , , , , . Interruption of recurrent Clostridium difficile‐associated diarrhea episodes by serial therapy with vancomycin and rifaximin. Clin Infect Dis. 2007;44(6):846–848.
- , , , et al. Rifampin and rifaximin resistance in clinical isolates of Clostridium difficile. Antimicrob Agents Chemother. 2008;52(8):2813–2817.
- , , , , , . Efficacy and safety of fidaxomicin (FDX) vs. vancomycin (VAN) in Clostridium difficile infection (CDI) in 2 randomized controlled trials (RCT) with 1105 patients [abstract 1417]. Presented at: The 48th Annual IDSA Meeting; October 21–24, 2010; Vancouver, BC, Canada.
- , , , , , . Randomized clinical trial in Clostridium difficile infection confirms superiority of fidaxomicin over vancomycin [abstract 828630]. Presented at: Digestive Disease Week 2010; May 4, 2010; New Orleans, LA.
- , , , et al for the OPT‐80–003 Clinical Study Group. Fidaxomicin versus vancomycin for Clostridium difficile infection. N Engl J Med. 2011;364(5):422–431.
As noted elsewhere in this supplement, recent studies show a high rate of recurrent Clostridium difficile infection (CDI) despite the availability of evidence‐based guidelines for CDI treatment. 1, 2 Treatment with vancomycin has been associated with recurrence in 25% or more of patients. The risk for recurrence increases with each episode, and is greater than 60% in patients with more than 2 episodes. 1, 3, 4 Identification of patients at risk for recurrence is critical to early diagnosis and prompt treatment. 5 Because recurrent CDI is so widespread, it should be common practice to educate patients about this complication, including:
-
The risk for continued exposure to C. difficile in the hospital or home environment and strategies for appropriate hygiene to minimize reinfection.
-
When to contact a healthcare professional for recurrent symptoms. 1
CASE STUDY CONTINUED
In the previous article in this supplement, a case study for patient A.L. was presented. A.L. is an 87‐year‐old woman who developed initial inpatient CDI in a rehabilitation facility. She was empirically started on oral metronidazole, 500 mg 3 times a day. Her symptoms improved but she became febrile with an elevated white blood cell (WBC) count. She was transferred to an acute care facility where her treatment was switched to oral vancomycin 125 mg 4 times daily. A proctoscopic exam confirmed pseudomembranous colitis, and her treatment regimen was increased to oral vancomycin 500 mg 4 times daily plus intravenous (IV) metronidazole 500 mg every 8 hours. The CDI responded to therapy and she was discharged to home care.
Ten days after her hospital discharge, A.L. noted a change in the character of her stools, which became looser and increased in frequency, accompanied by a foul odor that she recalls was present during her previous episode. The following day, she developed frank watery stools occurring every 1‐2 hours and had 2 incontinent episodes. Her family brought her to the emergency department because she was also light‐headed, confused, and had increased abdominal cramping. Intravenous fluid resuscitation was started, along with oral vancomycin, 125 mg every 6 hours for 14 days, followed by a vancomycin taper and pulse, which consisted of 125 mg twice daily for 7 days, once daily for 7 days, once every other day for 7 days, then every third day. Stool was sent to the lab for C. difficile testing in the middle of the taper regimen. The result was negative. Ten days after tapering the oral vancomycin regimen to every third day, she developed loose stools with the same odor, followed by increased frequency and frank watery stools.
This case illustrates several aspects of recurrent CDI. First, the recurrent episode may be severe, as evidenced by the need for IV fluid resuscitation in addition to specific anti‐C. difficile treatment. Second, although the patient was treated appropriately with standard 4 times daily vancomycin followed by a taper, subsequent recurrences may still occur, usually near the end of the taper/pulse (as in this case) or shortly after finishing the regimen. Finally, test of cure stool testing (either toxin testing, culture, or polymerase chain reaction [PCR]) may be misleading and is NOT recommended for managing recurrent CDI. Although subsequent management of this case was not addressed, repeating the standard vancomycin regimen, followed again by a taper/pulse would be a realistic option, as vancomycin resistance in C. difficile has not been reported and the patient would be expected to respond. Other management options should also be considered and are discussed below.
SHEA/IDSA RECOMMENDATIONS
There is no strong evidence to support a particular treatment strategy for recurrent CDI. 5 The Society for Healthcare Epidemiology of America/Infectious Diseases Society of America (SHEA/IDSA) guidelines 6 recommends the following:
-
When severe or complicated CDI is suspected, initiate empiric treatment as soon as the diagnosis is suspected (C‐III).
-
Treatment of the first recurrence is usually with the same regimen as for the initial episode (A‐II), but should be stratified by disease severity (C‐III).
-
Do not use metronidazole beyond first recurrence or for long‐term chronic therapy (B‐II).
-
Treatment of second or later recurrences with vancomycin using a taper and/or pulse regimen is the preferred next strategy (B‐III).
-
No recommendations can be made regarding prevention of recurrent CDI in patients requiring continued antimicrobial therapy (C‐III).
The vancomycin taper/pulse regimen is one of the most widely used regimens for treatment of recurrent CDI. 5 A tapered oral vancomycin regimen consists of a stepwise decrease in dose over a period of time. Intermittent or pulsed vancomycin therapy consists of administering the drug every few days.
A standard course of antibiotic therapy eradicates vegetative cells of C. difficile, but is not effective against spores. Administering antibiotics over an extended time period at decreasing doses (tapered regimen) or intermittent delivery (pulsed regimen) gradually clears C. difficile by eradicating cells as the spores germinate. 5 Thus, a taper/pulse regimen of vancomycin, in theory, leads to a decreased rate of recurrence and may aid restoration of the normal microflora. 5
Evidence for efficacy of the tapered dosage regimen is based on a post hoc analysis of patients treated for recurrence in 2 trials of probiotic treatment with Saccharomyces boulardii. When standard‐dose oral vancomycin (125 mg 4 times daily) was compared with high‐dose vancomycin (500 mg twice daily for 7 to 14 days), recurrence rates were not statistically different. However, a tapered regimen of vancomycin resulted in significantly fewer recurrences (31%, P = 0.01), as did a pulsed dose of vancomycin (14.3%, P = 0.02). 4 One empiric pulsed‐dose regimen consists of oral vancomycin, 125 mg every 6 hours for 14 days, followed by tapering to 125 mg every 12 hours for 7 days, then 125 mg once daily for another 7 days, followed in turn by pulse‐dosed vancomycin (125 mg once every 2 days for 4 doses, then once every 3 days for 5 doses, or longer). 1 Prolonged courses of metronidazole are not recommended because of potential adverse effects, including peripheral neuropathy. 1
Management of patients with multiple recurrences of CDI is difficult, and no regimens are supported by adequate clinical evidence. 5 Various strategies have been tried, including probiotics, antibiotics, toxin binders, and immune‐based treatments. 1 The strategy behind use of probiotics is to augment colonization resistance. The probiotic S. boulardii, 1 g daily for 4 weeks, decreased recurrence compared with placebo in a small study of 60 patients when given during and after standard treatment (ie, metronidazole or vancomycin). In patients receiving high‐dose vancomycin plus S. boulardii, 3 of 18 (16.7%) had a recurrence compared with 7 of 14 (50%) receiving high‐dose vancomycin plus placebo (P = 0.05). 7 However, a larger follow‐up study did not show a significant overall benefit of S. boulardii over placebo. 1, 7 In addition, there have been a few case reports of systemic infections in immunocompromised patients treated with probiotics. 8 Overall, the results of studies with probiotics, including Lactobacilli, have been inconsistent.
Another approach to restoring a normal gastrointestinal microflora is fecal transplantation, where a small amount of fresh feces from a healthy donor (ideally someone who lives with the patient), is suspended in saline, filtered, and administered through a nasogastric tube, by colonoscope, or by enema. In a recent case series of 18 patients, this approach showed a 94% success rate. 9
Another potential strategy to prevent recurrence is to block colonization of pathogenic C. difficile strains by administration of nontoxigenic and nonpathogenic strains of C. difficile. Researchers have identified a nontoxigenic strain that is being developed as a targeted biotherapeutic probiotic for human use. 1 Because patients with recurrent CDI lack a strong immune response to C. difficile toxins, IV immunoglobulin (IVIG) has been used empirically to provide passive immunotherapy. It has shown benefit in some case series of patients with multiple recurrences. 1, 10, 11
Other antibiotics have also been investigated in conjunction with vancomycin for recurrent infection. Rifaximin has good in vitro activity against C. difficile, and is not absorbed from the gastrointestinal tract. Oral rifaximin, 400 to 800 mg daily for 14 days following discontinuation of vancomycin, was shown to prevent further recurrence in 7 of 8 patients with a history of 4 to 8 CDI recurrences. 1, 12 It is important to note that rifaximin resistance has been reported in clinical isolates of C. difficile, and may be more common than initially thought, particularly among epidemic strains. 13
Fidaxomicin, a narrow‐spectrum macrocyclic antibiotic, was also compared with vancomycin in 2 multicenter, randomized, double‐blind Phase 3 clinical trials of 1105 adults with confirmed CDI. 14 Patients were treated with either oral fidaxomicin (200 mg every 12 hours) or oral vancomycin (125 mg every 6 hours) for 10 days. 15, 16 The clinical cure rate with fidaxomicin was comparable to vancomycin in both studies. 14 In the more recent study, 59.8% of subjects (N = 535) were receiving concomitant antibiotics during CDI treatment; among this group, treatment with fidaxomicin was associated with a significantly lower recurrence rate than treatment with vancomycin (17.6% vs 29.5%, P = 0.027). 15 In addition, there was a sustained clinical response. Global cure, also a secondary endpoint, was defined as patients who were cured and did not have a recurrence during a subsequent 4‐week period, compared with treatment with vancomycin (67.5% vs 53.4%, P = 0.020). 15 These results confirm the findings from the first fidaxomicin Phase 3 study 16 and suggest that even when concomitant antibiotics are administered, fidaxomicin may be more effective than vancomycin in preventing CDI recurrence.
SUMMARY
Because hospitalists take a leadership role and often coordinate care for patients with CDI, they can take an active role to ensure that clinicians are aware of evidence‐based treatments for recurrent CDI, and the importance of routine follow‐up and persistence. The most important considerations in managing patients with recurrent CDI are to:
-
Continue to try new or previous approaches, beginning with those that are evidence‐based, followed by options that have been shown to work but are not backed by strong clinical evidence.
-
Provide consistent follow‐up and ongoing support.
-
Be sympatheticbecause this condition has significant detrimental impact on quality of life.
- . A 76‐year‐old man with recurrent Clostridium difficile‐associated diarrhea: review of C difficile infection. JAMA. 2009;301(9):954–962.
- . Clostridium difficile and the disease it causes. Methods Mol Biol. 2010;646:9–35.
- , , , et al. A randomized placebo‐controlled trial of Saccharomyces boulardii in combination with standard antibiotics for Clostridium difficile disease. JAMA. 1994;271(24):1913–1918.
- , , . Breaking the cycle: treatment strategies for 163 cases of recurrent Clostridium difficile disease. Am J Gastroenterol. 2002;97(7):1769–1775.
- . Recurrent Clostridium difficile infection: a review of risk factors, treatments, and outcomes. J Infect. 2009;58(6):403–410.
- , , , et al. Clinical practice guidelines for Clostridium difficile infection in adults: 2010 update by the Society for Healthcare Epidemiology of America (SHEA) and the Infectious Diseases Society of America (IDSA). Infect Control Hosp Epidemiol. 2010;31(5):431–455.
- , , , et al. The search for a better treatment for recurrent Clostridium difficile disease: use of high‐dose vancomycin combined with Saccharomyces boulardii. Clin Infect Dis. 2000;31(4):1012–1017.
- , , , et al. Saccharomyces cerevisiae fungemia after Saccharomyces boulardii treatment in immunocompromised patients. J Clin Gastroenterol. 2003;36(1):41–43.
- , , . Recurrent Clostridium difficile colitis: case series involving 18 patients treated with donor stool administered via a nasogastric tube. Clin Infect Dis. 2003;36(5):580–585.
- , , , et al. Treatment with intravenously administered gamma globulin of chronic relapsing colitis induced by Clostridium difficile toxin. J Pediatr. 1991;118(4 pt 1):633–637.
- . Descriptive study of intravenous immunoglobulin for the treatment of recurrent Clostridium difficile diarrhoea. J Antimicrob Chemother. 2004;53(5):882–884.
- , , , , . Interruption of recurrent Clostridium difficile‐associated diarrhea episodes by serial therapy with vancomycin and rifaximin. Clin Infect Dis. 2007;44(6):846–848.
- , , , et al. Rifampin and rifaximin resistance in clinical isolates of Clostridium difficile. Antimicrob Agents Chemother. 2008;52(8):2813–2817.
- , , , , , . Efficacy and safety of fidaxomicin (FDX) vs. vancomycin (VAN) in Clostridium difficile infection (CDI) in 2 randomized controlled trials (RCT) with 1105 patients [abstract 1417]. Presented at: The 48th Annual IDSA Meeting; October 21–24, 2010; Vancouver, BC, Canada.
- , , , , , . Randomized clinical trial in Clostridium difficile infection confirms superiority of fidaxomicin over vancomycin [abstract 828630]. Presented at: Digestive Disease Week 2010; May 4, 2010; New Orleans, LA.
- , , , et al for the OPT‐80–003 Clinical Study Group. Fidaxomicin versus vancomycin for Clostridium difficile infection. N Engl J Med. 2011;364(5):422–431.
Strategies for Prevention of CDI
Infection control is a critical component of an overall management strategy for Clostridium difficile infection (CDI). In fact, preventing patients from acquiring this nosocomial condition in the healthcare setting has been identified as the most essential component.1 In 2008, the Society for Healthcare Epidemiology of America/Infectious Diseases Society of America (SHEA/IDSA) published a compendium of strategies to prevent healthcare‐associated infections, including CDI. This guideline includes graded recommendations and provides helpful strategies for applying them in a healthcare facility. An effective and comprehensive preventive program to reduce the incidence and impact of CDI requires several key components:2
-
Communication of responsibilities and accountability.
-
Application of special recommendations if the incidence of CDI is not adequately controlled with the basic recommendations (Table 2).2
| Recommendation | Grade* |
|---|---|
| |
| Contact precautions for patients with CDI until 48 hr after diarrhea resolves | A‐I for gloves |
| A‐II for hand hygiene | |
| B‐III for gowns | |
| B‐III for single‐patient room | |
| Ensure adequate disinfection of equipment and environment | B‐II for environment |
| B‐III for equipment | |
| Laboratory‐based alert system to notify clinical and infection prevention and control personnel if patient diagnosed with CDI | B‐III for alert system |
| Conduct CDI surveillance and feedback data to units and hospital administrators | B‐III for CDI surveillance |
| Educate healthcare personnel, housekeeping personnel, and hospital administration about CDI | B‐III for hospital staff education |
| Educate patients and their families about CDI, as appropriate | B‐III for patient education |
| Measure hand hygiene and contact precaution compliance | B‐III for monitoring compliance |
| Recommendations | Grade* |
|---|---|
| |
| Initiate an antimicrobial stewardship program | A‐II |
| Use diluted sodium hypochlorite for environmental disinfection if current practices deemed adequate | B‐II |
| Intensify efforts at hand hygiene and contact precaution compliance | B‐III |
| Preferentially use soap and water when performing hand hygiene after caring for a patient with CDI | B‐III |
| Place patients in contact precautions while C. difficile testing is pending | B‐III |
| Prolong contact precautions until discharge | B‐III |
| Assess the adequacy of room cleaning | B‐III |
Many healthcare providers are involved in patient care, and therefore each of these departmentsincluding administration, the medical staff, the infection control department, nursing, pharmacy, the clinical laboratory, and environmental controlmust be supportive of, and accountable for, implementing strategies to prevent CDI. Hospital administration must ensure that nursing, environmental services, and infection prevention and control have adequate support. The department of infection prevention and control should take the lead role in designing, implementing, and monitoring the CDI prevention program, including the education of hospital staff.
Clinical staff must comply with infection prevention and control policies, and have a high index of suspicion for rapid identification of patients with CDI, so they can be placed under contact precautions and started on treatment quickly. Nursing and physician leaders must hold personnel accountable for adhering to infection prevention and control policies. Finally, environmental services play a key role and must ensure that housekeeping personnel are appropriately trained and monitored to ensure they are following effective cleaning policies and procedures.
TRANSMISSION OF CDI
Healthcare workers are a primary mode of C. difficile transmission. C. difficile spores end up on multiple hospital surfaces and contaminate healthcare worker hands and medical devices (stethoscopes, thermometers, etc) used on multiple patients. One study found that after caring for a patient with CDI, 59% of healthcare workers had hand contamination regardless of whether or not they actually touched the patient.3 Many studies have shown that patients in adjacent rooms are at equal or higher risk of acquiring CDI as patients admitted to the same room.4, 5 Although a recent study found that admission to an intensive care unit room that previously housed a patient for CDI was a risk factor for developing CDI, 89% of patients who actually developed CDI did not have this risk factor.6 This indicates that most C. difficile acquisitions came from healthcare workers.
CONTACT PRECAUTIONS AND STRICT HAND HYGIENE ARE KEY
The combination of appropriate contact precautions and strict hand hygiene has been reported to reduce the incidence of CDI by as much as 80%.1, 7, 8 The CDI prevention recommendation with the strongest level of evidence is the donning of gloves when caring for a patient with CDI (Table 1).9
The optimal method of hand hygiene after caring for a patient with CDI is a matter of some confusion. Alcohol‐based hand sanitizers did not reduce the amount of C. difficile spores on the hands of volunteers contaminated with a known quantity of C. difficile spores.10 However, studies have not found an increase in CDI with use of alcohol‐based hand sanitizers or a decrease in CDI with use of soap and water.11 In addition, several of these studies have found the use of alcohol‐based hand hygiene products to be associated with decreases in methicillin‐resistant Staphylococcus aureus or vancomycin‐resistant enterococcus. For these reasons, in non‐outbreak settings, hand hygiene with alcohol‐based hand sanitizers, in addition to wearing gloves as a component of contact precautions, is considered an acceptable method of hand hygiene after caring for a patient with CDI.11 In outbreak settings, however, preferential use of soap and water is recommended after caring for a patient with CDI because of the theoretical increase in risk of C. difficile transmission based on the volunteer hand contamination studies.2, 11, 12
DISINFECTION OF EQUIPMENT AND ENVIRONMENT
Environmental services staff must be educated about the incidence, transmission of, and impact of CDI, as well as strategies effective for C. difficile spores, which are resistant to standard cleaning products and may persist in patient rooms for many months.1 During CDI outbreaks, rooms should be cleaned with a chlorine‐based disinfectant (either an Environmental Protection Agency‐approved disinfectant with known sporicidal activity or a 1:10 dilution of household bleach), which rapidly destroys C. difficile spores.1 The sporicidal solution should have a contact time of at least 10 minutes.2 Efforts to control spores in the environment and prevent transmission are even more important considering recent data demonstrating that hypervirulent C. difficile strains may have increased sporulation, which in combination with increased toxin production, pose a major management challenge.13 Identification and removal of other sources of C. difficile, including replacement of electronic rectal thermometers with disposable thermometers, can also reduce the incidence of CDI.12
ANTIMICROBIAL STEWARDSHIP AND RESTRICTION
Interventions to ensure appropriate use of antibiotics, including antimicrobial stewardship programs and antibiotic restriction programs, are also effective. A study during an outbreak of a hypervirulent strain of C. difficile showed that an antimicrobial stewardship program reduced the incidence of CDI by 60%.14 In this study, the antimicrobial stewardship program focused on shifting antimicrobial selection to antimicrobials that were associated with a lower risk of CDI at their institution whenever possible. Reducing unnecessary antimicrobial use was stressed as well. Formal restrictions were not instituted; rather, clinicians received education and pocket guides to assist in antimicrobial selection.
Several studies have found respiratory fluoroquinolones, such as gatifloxacin or moxifloxacin, to be associated with the highest risk of CDI during outbreaks due to the BI/NAP1/027 strain.15, 16 Interestingly, this antimicrobial stewardship program recommended respiratory fluoroquinolones over cephalosporins for community‐acquired pneumonia, as cephalosporins historically have been strongly associated with CDI. Nevertheless, the incidence of CDI decreased after initiation of the antimicrobial stewardship program, despite increased use of respiratory fluoroquinolones. The antimicrobial stewardship program was implemented prior to the identification of the fluoroquinolone‐resistant epidemic strain. This shows that herd protection against CDI can occur by improvements in overall antimicrobial prescribing practices by decreasing the total number of patients at risk for CDI. This, in turn, will decrease the number of patients who develop CDI and contribute to the spread of C. difficile. In addition to using education to improve antimicrobial prescribing, several studies have found that restriction of specific antimicrobials associated with CDI (for example, clindamycin or fluoroquinolones) can result in a decrease in CDI.1, 1720
INSIGHTS ABOUT OPPORTUNITIES FOR IMPROVEMENT
Results of a recent point prevalence survey conducted by the Association for Professionals in Infection Control and Epidemiology, Inc (APIC) provide important insights into knowledge and clinical practice gaps related to early diagnosis and prevention of CDI.21 More than 12,000 APIC members were asked to provide a 1‐day snapshot of patients identified with CDI or colonization at their institutions. Responses from 648 (12.5%) acute care hospitals in the United States, representing 47 states, indicate a clear need to improve infection control practices.21 The following recommendations are based on recent evidence:
-
Patients should be placed in contact isolation at the first suspicion of CDI, and kept in isolation for up to 2 days after diarrhea resolves because contamination persists in the environment that long.2 Of note, this differs from the SHEA/IDSA Clinical Practice Guidelines for Clostridium difficile Infection in Adults, which state: Maintain contact precautions for the duration of diarrhea.12 The Centers for Disease Control and Prevention (CDC) currently recommends contact precautions for the duration of illness when caring for patients with CDI.22
-
Bleach solution should be used for routine and terminal cleaning during CDI outbreaks, as recommended by SHEA/IDSA and the CDC.
-
Hand washing with soap and water is more effective than alcohol‐based hand sanitizers for removal of spores. However, appropriate donning and removal of gloves prevents hand contamination with C. difficile spores, likely explaining why hand washing with soap and water has not been associated with a decrease in CDI compared with alcohol‐based products.
-
A formal program to educate environmental services personnel should be implemented to ensure they understand their critical role on the infection control team and effective strategies for cleaning.
SPECIAL APPROACHES
When basic approaches are not effective to reduce the incidence of CDI, the SHEA has recommendations for special approaches, which should be implemented as appropriate for each institution (summarized in Table 2).2 Strategies for prevention of CDI are also available from the CDC and the Institute for Healthcare Improvement (IHI).23, 24
SUMMARY
Effective management and prevention of CDI requires a multidisciplinary approach that includes leaders in hospital administration, clinicians, the infection control department, nursing, pharmacy, and the clinical laboratory, as well as environmental services. All of these professionals must be accountable and take an active role in implementing and complying with evidence‐based strategies to ensure that patients at risk are identified early and managed appropriately, and that effective strategies for prevention are in place. Hospitalists, as front‐line caregivers, physician leaders in their hospitals, and coordinators of patient care, can play a key role in these regards. Care when deciding when and which antimicrobial to use to treat non‐CDI infections; being attuned to symptoms that may be due to CDI, and prompt diagnosis and treatment of CDI; adhering to infection control policies; awareness of cleaning practices; and also being an active member of the infection control committee are all ways that hospitalists may take active roles in preventing CDI.
- ,.Clostridium difficile infection in the intensive care unit.Infect Dis Clin North Am.2009;23(3):727–743.
- ,,.Strategies to prevent Clostridium difficile infections in acute care hospitals.Infect Control Hosp Epidemiol.2008;29(suppl 1):S81–S92.
- ,,,.Nosocomial acquisition of Clostridium difficile infection.N Engl J Med.1989;320(4):204–210.
- ,,, et al.Acquisition of Clostridium difficile by hospitalized patients: evidence for colonized new admissions as a source of infection.J Infect Dis.1992;166:561–567.
- ,.The role of physical proximity in nosocomial diarrhea.Clin Infect Dis.2000;31(3):717–722.
- ,,, et al.Evaluation of hospital room assignment and acquisition of Clostridium difficile infection.Infect Control Hosp Epidemiol.2011;32(3):201–206.
- ,,,,.Effectiveness of infection control program in controlling nosocomial Clostridium difficile.Am J Infect Control.1998;26(6):588–593.
- ,,, et al.Control of an outbreak of infection with the hypervirulent Clostridium difficile BI strain in a university hospital using a comprehensive “bundle” approach.Clin Infect Dis.2007;45(10):1266–1273.
- ,,, et al.Epidemics of diarrhea caused by a clindamycin‐resistant strain of Clostridium difficile in four hospitals.N Engl J Med.1999;341(22):1645–1651.
- ,,,,.Hand hygiene with soap and water is superior to alcohol rub and antiseptic wipes for removal of Clostridium difficile.Infect Control Hosp Epidemiol.2009;30(10):939–944.
- ,,.Measures to control and prevent Clostridium difficile infection.Clin Infect Dis.2008;46(suppl 1):S43–S49.
- ,,, et al.Clinical practice guidelines for Clostridium difficile infection in adults: 2010 update by the Society for Healthcare Epidemiology of America (SHEA) and the Infectious Diseases Society of America (IDSA).Infect Control Hosp Epidemiol.2010;31(5):431–455.
- ,,, et al.Human hypervirulent Clostridium difficile strains exhibit increased sporulation as well as robust toxin production.J Bacteriol.2010;192(19):4904–4911.
- ,,,,.Impact of a reduction in the use of high‐risk antibiotics on the course of an epidemic of Clostridium difficile‐associated disease caused by the hypervirulent NAP1/027 strain.Clin Infect Dis.2007;45(suppl 2):S112–S121.
- ,,, et al.Emergence of fluoroquinolones as the predominant risk factor for Clostridium difficile‐associated diarrhea: a cohort study during an epidemic in Quebec, Canada.Clin Infect Dis.2005;41(9):1254–1260.
- ,,,, et al.A predominantly clonal multi‐institutional outbreak of Clostridium difficile‐associated diarrhea with high morbidity and mortality.N Engl J Med.2005;353:2442–2449.
- ,,, et al.Hospital‐wide restriction of clindamycin: effect on the incidence of Clostridium difficile‐associated diarrhea and cost.Ann Intern Med.1998;128:989–995.
- ,,, et al.Interventions to improve antibiotic prescribing practices for hospital inpatients.Cochrane Database Syst Rev.2005CD003543.
- ,.Impact of changes in antibiotic policy on Clostridium difficile‐associated diarrhoea (CDAD) over a five‐year period in a district general hospital.J Hosp Infect.2003;54:104–108.
- ,,, et al.Antibiotic prescribing policy and Clostridium difficile diarrhoea.Q J Med.2004;97:423–429.
- Association for Professionals in Infection Control and Epidemiology (APIC). Guide to the elimination of Clostridium difficile in healthcare settings. Available at: http://www.apic.org/Content/NavigationMenu/PracticeGuidance/APICEliminationGuides/C.diff_Elimination_guide_logo.pdf. Accessed August 9,2011.
- Centers for Disease Control and Prevention. Frequently asked questions about Clostridium difficile for healthcare providers. Available at: http://www.cdc.gov/HAI/organisms/cdiff/Cdiff_faqs_HCP.html. Accessed August 9,2011.
- Centers for Disease Control and Prevention. Information about the current strain of Clostridium difficile. Available at: http://www.cdc.gov/HAI/organisms/cdiff/Cdiff‐current‐strain.html. Accessed June 15,2011.
- Institute for Healthcare Improvement. Available at: http://www.ihi.org. Accessed July 26,2011.
Infection control is a critical component of an overall management strategy for Clostridium difficile infection (CDI). In fact, preventing patients from acquiring this nosocomial condition in the healthcare setting has been identified as the most essential component.1 In 2008, the Society for Healthcare Epidemiology of America/Infectious Diseases Society of America (SHEA/IDSA) published a compendium of strategies to prevent healthcare‐associated infections, including CDI. This guideline includes graded recommendations and provides helpful strategies for applying them in a healthcare facility. An effective and comprehensive preventive program to reduce the incidence and impact of CDI requires several key components:2
-
Communication of responsibilities and accountability.
-
Application of special recommendations if the incidence of CDI is not adequately controlled with the basic recommendations (Table 2).2
| Recommendation | Grade* |
|---|---|
| |
| Contact precautions for patients with CDI until 48 hr after diarrhea resolves | A‐I for gloves |
| A‐II for hand hygiene | |
| B‐III for gowns | |
| B‐III for single‐patient room | |
| Ensure adequate disinfection of equipment and environment | B‐II for environment |
| B‐III for equipment | |
| Laboratory‐based alert system to notify clinical and infection prevention and control personnel if patient diagnosed with CDI | B‐III for alert system |
| Conduct CDI surveillance and feedback data to units and hospital administrators | B‐III for CDI surveillance |
| Educate healthcare personnel, housekeeping personnel, and hospital administration about CDI | B‐III for hospital staff education |
| Educate patients and their families about CDI, as appropriate | B‐III for patient education |
| Measure hand hygiene and contact precaution compliance | B‐III for monitoring compliance |
| Recommendations | Grade* |
|---|---|
| |
| Initiate an antimicrobial stewardship program | A‐II |
| Use diluted sodium hypochlorite for environmental disinfection if current practices deemed adequate | B‐II |
| Intensify efforts at hand hygiene and contact precaution compliance | B‐III |
| Preferentially use soap and water when performing hand hygiene after caring for a patient with CDI | B‐III |
| Place patients in contact precautions while C. difficile testing is pending | B‐III |
| Prolong contact precautions until discharge | B‐III |
| Assess the adequacy of room cleaning | B‐III |
Many healthcare providers are involved in patient care, and therefore each of these departmentsincluding administration, the medical staff, the infection control department, nursing, pharmacy, the clinical laboratory, and environmental controlmust be supportive of, and accountable for, implementing strategies to prevent CDI. Hospital administration must ensure that nursing, environmental services, and infection prevention and control have adequate support. The department of infection prevention and control should take the lead role in designing, implementing, and monitoring the CDI prevention program, including the education of hospital staff.
Clinical staff must comply with infection prevention and control policies, and have a high index of suspicion for rapid identification of patients with CDI, so they can be placed under contact precautions and started on treatment quickly. Nursing and physician leaders must hold personnel accountable for adhering to infection prevention and control policies. Finally, environmental services play a key role and must ensure that housekeeping personnel are appropriately trained and monitored to ensure they are following effective cleaning policies and procedures.
TRANSMISSION OF CDI
Healthcare workers are a primary mode of C. difficile transmission. C. difficile spores end up on multiple hospital surfaces and contaminate healthcare worker hands and medical devices (stethoscopes, thermometers, etc) used on multiple patients. One study found that after caring for a patient with CDI, 59% of healthcare workers had hand contamination regardless of whether or not they actually touched the patient.3 Many studies have shown that patients in adjacent rooms are at equal or higher risk of acquiring CDI as patients admitted to the same room.4, 5 Although a recent study found that admission to an intensive care unit room that previously housed a patient for CDI was a risk factor for developing CDI, 89% of patients who actually developed CDI did not have this risk factor.6 This indicates that most C. difficile acquisitions came from healthcare workers.
CONTACT PRECAUTIONS AND STRICT HAND HYGIENE ARE KEY
The combination of appropriate contact precautions and strict hand hygiene has been reported to reduce the incidence of CDI by as much as 80%.1, 7, 8 The CDI prevention recommendation with the strongest level of evidence is the donning of gloves when caring for a patient with CDI (Table 1).9
The optimal method of hand hygiene after caring for a patient with CDI is a matter of some confusion. Alcohol‐based hand sanitizers did not reduce the amount of C. difficile spores on the hands of volunteers contaminated with a known quantity of C. difficile spores.10 However, studies have not found an increase in CDI with use of alcohol‐based hand sanitizers or a decrease in CDI with use of soap and water.11 In addition, several of these studies have found the use of alcohol‐based hand hygiene products to be associated with decreases in methicillin‐resistant Staphylococcus aureus or vancomycin‐resistant enterococcus. For these reasons, in non‐outbreak settings, hand hygiene with alcohol‐based hand sanitizers, in addition to wearing gloves as a component of contact precautions, is considered an acceptable method of hand hygiene after caring for a patient with CDI.11 In outbreak settings, however, preferential use of soap and water is recommended after caring for a patient with CDI because of the theoretical increase in risk of C. difficile transmission based on the volunteer hand contamination studies.2, 11, 12
DISINFECTION OF EQUIPMENT AND ENVIRONMENT
Environmental services staff must be educated about the incidence, transmission of, and impact of CDI, as well as strategies effective for C. difficile spores, which are resistant to standard cleaning products and may persist in patient rooms for many months.1 During CDI outbreaks, rooms should be cleaned with a chlorine‐based disinfectant (either an Environmental Protection Agency‐approved disinfectant with known sporicidal activity or a 1:10 dilution of household bleach), which rapidly destroys C. difficile spores.1 The sporicidal solution should have a contact time of at least 10 minutes.2 Efforts to control spores in the environment and prevent transmission are even more important considering recent data demonstrating that hypervirulent C. difficile strains may have increased sporulation, which in combination with increased toxin production, pose a major management challenge.13 Identification and removal of other sources of C. difficile, including replacement of electronic rectal thermometers with disposable thermometers, can also reduce the incidence of CDI.12
ANTIMICROBIAL STEWARDSHIP AND RESTRICTION
Interventions to ensure appropriate use of antibiotics, including antimicrobial stewardship programs and antibiotic restriction programs, are also effective. A study during an outbreak of a hypervirulent strain of C. difficile showed that an antimicrobial stewardship program reduced the incidence of CDI by 60%.14 In this study, the antimicrobial stewardship program focused on shifting antimicrobial selection to antimicrobials that were associated with a lower risk of CDI at their institution whenever possible. Reducing unnecessary antimicrobial use was stressed as well. Formal restrictions were not instituted; rather, clinicians received education and pocket guides to assist in antimicrobial selection.
Several studies have found respiratory fluoroquinolones, such as gatifloxacin or moxifloxacin, to be associated with the highest risk of CDI during outbreaks due to the BI/NAP1/027 strain.15, 16 Interestingly, this antimicrobial stewardship program recommended respiratory fluoroquinolones over cephalosporins for community‐acquired pneumonia, as cephalosporins historically have been strongly associated with CDI. Nevertheless, the incidence of CDI decreased after initiation of the antimicrobial stewardship program, despite increased use of respiratory fluoroquinolones. The antimicrobial stewardship program was implemented prior to the identification of the fluoroquinolone‐resistant epidemic strain. This shows that herd protection against CDI can occur by improvements in overall antimicrobial prescribing practices by decreasing the total number of patients at risk for CDI. This, in turn, will decrease the number of patients who develop CDI and contribute to the spread of C. difficile. In addition to using education to improve antimicrobial prescribing, several studies have found that restriction of specific antimicrobials associated with CDI (for example, clindamycin or fluoroquinolones) can result in a decrease in CDI.1, 1720
INSIGHTS ABOUT OPPORTUNITIES FOR IMPROVEMENT
Results of a recent point prevalence survey conducted by the Association for Professionals in Infection Control and Epidemiology, Inc (APIC) provide important insights into knowledge and clinical practice gaps related to early diagnosis and prevention of CDI.21 More than 12,000 APIC members were asked to provide a 1‐day snapshot of patients identified with CDI or colonization at their institutions. Responses from 648 (12.5%) acute care hospitals in the United States, representing 47 states, indicate a clear need to improve infection control practices.21 The following recommendations are based on recent evidence:
-
Patients should be placed in contact isolation at the first suspicion of CDI, and kept in isolation for up to 2 days after diarrhea resolves because contamination persists in the environment that long.2 Of note, this differs from the SHEA/IDSA Clinical Practice Guidelines for Clostridium difficile Infection in Adults, which state: Maintain contact precautions for the duration of diarrhea.12 The Centers for Disease Control and Prevention (CDC) currently recommends contact precautions for the duration of illness when caring for patients with CDI.22
-
Bleach solution should be used for routine and terminal cleaning during CDI outbreaks, as recommended by SHEA/IDSA and the CDC.
-
Hand washing with soap and water is more effective than alcohol‐based hand sanitizers for removal of spores. However, appropriate donning and removal of gloves prevents hand contamination with C. difficile spores, likely explaining why hand washing with soap and water has not been associated with a decrease in CDI compared with alcohol‐based products.
-
A formal program to educate environmental services personnel should be implemented to ensure they understand their critical role on the infection control team and effective strategies for cleaning.
SPECIAL APPROACHES
When basic approaches are not effective to reduce the incidence of CDI, the SHEA has recommendations for special approaches, which should be implemented as appropriate for each institution (summarized in Table 2).2 Strategies for prevention of CDI are also available from the CDC and the Institute for Healthcare Improvement (IHI).23, 24
SUMMARY
Effective management and prevention of CDI requires a multidisciplinary approach that includes leaders in hospital administration, clinicians, the infection control department, nursing, pharmacy, and the clinical laboratory, as well as environmental services. All of these professionals must be accountable and take an active role in implementing and complying with evidence‐based strategies to ensure that patients at risk are identified early and managed appropriately, and that effective strategies for prevention are in place. Hospitalists, as front‐line caregivers, physician leaders in their hospitals, and coordinators of patient care, can play a key role in these regards. Care when deciding when and which antimicrobial to use to treat non‐CDI infections; being attuned to symptoms that may be due to CDI, and prompt diagnosis and treatment of CDI; adhering to infection control policies; awareness of cleaning practices; and also being an active member of the infection control committee are all ways that hospitalists may take active roles in preventing CDI.
- ,.Clostridium difficile infection in the intensive care unit.Infect Dis Clin North Am.2009;23(3):727–743.
- ,,.Strategies to prevent Clostridium difficile infections in acute care hospitals.Infect Control Hosp Epidemiol.2008;29(suppl 1):S81–S92.
- ,,,.Nosocomial acquisition of Clostridium difficile infection.N Engl J Med.1989;320(4):204–210.
- ,,, et al.Acquisition of Clostridium difficile by hospitalized patients: evidence for colonized new admissions as a source of infection.J Infect Dis.1992;166:561–567.
- ,.The role of physical proximity in nosocomial diarrhea.Clin Infect Dis.2000;31(3):717–722.
- ,,, et al.Evaluation of hospital room assignment and acquisition of Clostridium difficile infection.Infect Control Hosp Epidemiol.2011;32(3):201–206.
- ,,,,.Effectiveness of infection control program in controlling nosocomial Clostridium difficile.Am J Infect Control.1998;26(6):588–593.
- ,,, et al.Control of an outbreak of infection with the hypervirulent Clostridium difficile BI strain in a university hospital using a comprehensive “bundle” approach.Clin Infect Dis.2007;45(10):1266–1273.
- ,,, et al.Epidemics of diarrhea caused by a clindamycin‐resistant strain of Clostridium difficile in four hospitals.N Engl J Med.1999;341(22):1645–1651.
- ,,,,.Hand hygiene with soap and water is superior to alcohol rub and antiseptic wipes for removal of Clostridium difficile.Infect Control Hosp Epidemiol.2009;30(10):939–944.
- ,,.Measures to control and prevent Clostridium difficile infection.Clin Infect Dis.2008;46(suppl 1):S43–S49.
- ,,, et al.Clinical practice guidelines for Clostridium difficile infection in adults: 2010 update by the Society for Healthcare Epidemiology of America (SHEA) and the Infectious Diseases Society of America (IDSA).Infect Control Hosp Epidemiol.2010;31(5):431–455.
- ,,, et al.Human hypervirulent Clostridium difficile strains exhibit increased sporulation as well as robust toxin production.J Bacteriol.2010;192(19):4904–4911.
- ,,,,.Impact of a reduction in the use of high‐risk antibiotics on the course of an epidemic of Clostridium difficile‐associated disease caused by the hypervirulent NAP1/027 strain.Clin Infect Dis.2007;45(suppl 2):S112–S121.
- ,,, et al.Emergence of fluoroquinolones as the predominant risk factor for Clostridium difficile‐associated diarrhea: a cohort study during an epidemic in Quebec, Canada.Clin Infect Dis.2005;41(9):1254–1260.
- ,,,, et al.A predominantly clonal multi‐institutional outbreak of Clostridium difficile‐associated diarrhea with high morbidity and mortality.N Engl J Med.2005;353:2442–2449.
- ,,, et al.Hospital‐wide restriction of clindamycin: effect on the incidence of Clostridium difficile‐associated diarrhea and cost.Ann Intern Med.1998;128:989–995.
- ,,, et al.Interventions to improve antibiotic prescribing practices for hospital inpatients.Cochrane Database Syst Rev.2005CD003543.
- ,.Impact of changes in antibiotic policy on Clostridium difficile‐associated diarrhoea (CDAD) over a five‐year period in a district general hospital.J Hosp Infect.2003;54:104–108.
- ,,, et al.Antibiotic prescribing policy and Clostridium difficile diarrhoea.Q J Med.2004;97:423–429.
- Association for Professionals in Infection Control and Epidemiology (APIC). Guide to the elimination of Clostridium difficile in healthcare settings. Available at: http://www.apic.org/Content/NavigationMenu/PracticeGuidance/APICEliminationGuides/C.diff_Elimination_guide_logo.pdf. Accessed August 9,2011.
- Centers for Disease Control and Prevention. Frequently asked questions about Clostridium difficile for healthcare providers. Available at: http://www.cdc.gov/HAI/organisms/cdiff/Cdiff_faqs_HCP.html. Accessed August 9,2011.
- Centers for Disease Control and Prevention. Information about the current strain of Clostridium difficile. Available at: http://www.cdc.gov/HAI/organisms/cdiff/Cdiff‐current‐strain.html. Accessed June 15,2011.
- Institute for Healthcare Improvement. Available at: http://www.ihi.org. Accessed July 26,2011.
Improving Sleep in Hospitalized Patients
In recent years, the philosophy of major hospitals has become more patient‐centered with increased focus on outcomes, safety, and patient satisfaction. To this end, many hospitals are looking for innovative ways not only to optimize quality of care, but also to improve patient satisfaction.
Sleep is a domain in which the goals of improving patient outcomes and satisfaction can be mutually achieved. Poor sleep has become a prevalent problem, and a single night of complete sleep loss can result in the undesirable consequences of daytime sleepiness, lethargy, irritability, confusion, and poor short‐term memory.1, 2 Literature has also suggested that chronic partial sleep loss can have significant consequences for safety, mood stability, neurological and medical functioning, and quality of life.38 The importance of acknowledging the relationship between sleep and a patient's level of functioning is magnified in the context of hospitalized patients, particularly those undergoing neurological inpatient care. Changes in level of alertness due to sleep loss can have serious implications for these patients, as they can lead to unnecessary testing and decreased participation with rehabilitative services.
Among the potential causes of sleep deprivation in hospitalized patients are poor pain control, lights, activities of others, and increased noise levels. The effect that increased noise has on patients has been evaluated in a variety of hospital settings, most notably in pediatric and adult intensive care units and nursing homes.9, 10 Noise has been shown to increase blood pressure, heart rate, respiratory rate, and body temperature. It has also been associated with failure to thrive, impaired immune function, delayed wound healing, and increased stress levels.11
The majority of literature regarding sleep disturbance in the hospital has focused on sleep disruption in the intensive care unit, where interventions associated with sleep loss are required to deliver the appropriate standard level of care.1218 However, few evidence‐based strategies to promote sleep quality in hospitalized patients have been evaluated.16, 1823 In this study, we aimed to examine sleep among neurological and neurosurgical inpatients, identify specific sleep‐disruptive factors, and assess patient satisfaction regarding their sleep. We implemented a sleep‐promoting protocol with the hypothesis that improvement of modifiable sleep‐disruptive factors would improve sleep and patient satisfaction.
METHODS
Study Design
This prospective, observational study was designed and implemented by an interdisciplinary team of physicians, neuroscience nurses, and hospital administrators.
Patient Selection
The study was performed on a Neurology and Neurosurgery unit, with both private and semi‐private rooms, at a large, urban, tertiary teaching hospital from February 2009 through June 2010. During enrollment periods, all patients on the unit were screened daily for eligibility. Eligible patients were medically stable and capable of giving verbal consent. Patients who were less than 16 years of age, encephalopathic, aphasic, or non‐English speaking were excluded. Eligible patients were asked for consent to participate in the study. After consultation with the hospital's institutional review board (IRB) committee, written consent was waived in this observational, quality improvement study.
Study Timeline
The study comprised 4 phases (Figure 1). In Phase 1, we collected baseline data on patients in the unit. Data were collected in the form of sleep surveys, Press Ganey surveys, and noise meter recordings. The baseline phase (Phase 1) lasted 10 weeks from February to April 2009. We then implemented a novel sleep‐promoting intervention called Basic Sleep Rounds (Phase 2, May to August 2009). After discontinuing Basic Sleep Rounds, data were collected for the washout phase (Phase 3, September 2009 to February 2010). An enhanced version of the sleep‐promoting intervention called Deluxe Sleep Rounds was then instituted (Phase 4, March to June 2010). In Phases 2 and 4, sleep rounds were implemented for 2 weeks before data collection to ensure uniform application of Sleep Rounds.

Sleep Promoting Interventions
Prior to implementing Basic Sleep Rounds in Phase 2, a nursing in‐service was performed where staff were educated about sleep in the hospital and about the planned interventions, and posters promoting sleep were hung on the unit. Basic Sleep Rounds were performed during Phase 2 by the patient's bedside nurse or the unit charge nurse. This occurred for all patients on the unit at approximately 23:00 nightly using the Basic Sleep Rounds checklist, which formalized simple hospital functions, such as lights out, television off, room temperature adjustment, and a final restroom usage (Figure 2). For Phase 4, a team of undergraduate volunteers was organized to assist with the delivery of Sleep Rounds. In this phase (Deluxe Sleep Rounds), nurses performed Basic Sleep Rounds by completing the checklist, and undergraduate volunteers offered patients any of the following sleep amenities: warm blanket, warm milk, white‐noise machine, hypoallergenic lotion, or room spritzer.24, 25

Additionally, during the Basic and Deluxe intervention phases, noise‐sensitive traffic lights (Talk Light Too;
Data Collection
A survey was designed to evaluate sleep quality, estimate sleep quantity, identify sleep disruptors, and assess patient satisfaction (see Supporting Figure 1 in the online version of this article). The survey was given to all eligible participants on the morning after their second night in the unit. This time point was chosen to account for potentially confounding first night effects, and to ensure that enrolled patients spent a full night in the unit.
To better evaluate one of the sleep disruptors, a subset of the survey participants had noise meters placed in their rooms. Every morning, a member of the team would visit all eligible patients to ask if they were willing to participate in this portion of the study. Data recorded between 8:00 PM and 8:00 AM on the second night of each participant's stay were later used for analysis. Noise was recorded in decibels using a Vernier Sound Level Meter, attached to a LabQuest data collection device (
Scores from Press Ganey surveys were also analyzed. These surveys were mailed to patients shortly after hospital discharge, and subsequently processed by Press Ganey Associates, Inc (
Data Analysis
Most datasets were not described by a normal distribution, thus most data are presented as medians with interquartile ranges (IQR), and comparisons between datasets were made using the MannWhitney U test. Press Ganey data are presented as means with standard errors of the mean, as distributed by Press Ganey. P 0.05 was considered significant for all data comparisons.
RESULTS
Basic demographic data were available on all participants from whom both noise and survey data were collected. As in Table 1, these participants were demographically similar (P 0.05) with regards to age, sex, and ethnic background. For unknown reasons, neurosurgery patients comprised the majority of participants in Phases 1 and 3, and neurology patients comprised the majority in Phase 2. This difference was not significant.
| Demographic | Phase 1 (n = 32) | Phase 2 (n = 33) | Phase 3 (n = 30) |
|---|---|---|---|
| Average age | 49 1 | 43 3 | 46 3 |
| % Female | 71% | 71% | 57% |
| % Neurology | 42% | 65% | 37% |
| % White | 67% | 77% | 73% |
Sleep Survey
A total of 253 sleep surveys were collected in all 4 phases. Data generated from these surveys are demonstrated in Table 2. On a 7‐point scale (1 being the best score, corresponding to the answer none, and 7 the worst, corresponding to extreme), the median scores for overall difficulty sleeping were not significantly different in Phases 1, 2, and 4. In Phase 3, the median score was 4 (moderate), significantly worse than in the other 3 phases (0.002 P 0.01). Despite the reported difficulty sleeping during Phase 3, the median number of hours of sleep and awakenings in Phases 1, 2, 3, and 4 were not significantly different. Sleep latency was scored on a 6‐point scale (1 being the best, corresponding to 010 min, and 6 the worst, corresponding to greater than 45 minutes). Similar sleep latency was reported in Phases 1, 3, and 4. However, median sleep latency in Phase 2 was 1 (010 min), significantly shorter than in the other phases (0.001 P 0.02). Despite similar survey results throughout most of the phases, there was a significant improvement in sleep latency in the Basic Sleep Rounds phase (Phase 2), and a significant worsening in overall difficulty sleeping in the washout phase (Phase 3).
| Survey Question | Phase 1 | Phase 2 | Phase 3 | Phase 4 |
|---|---|---|---|---|
| ||||
| 1. How much difficulty did you have sleeping last night? | 3 | 2 | 4* | 3 |
| IQR 4 N = 100 | IQR 4 N = 78 | IQR 3 N = 75 | IQR 2 N = 22 | |
| 2. How many hours did you sleep last night? | 6 hr | 6 hr | 5 hr | 5 hr |
| IQR 4 N = 98 | IQR 3 N = 77 | IQR 3 N = 72 | IQR 2 N = 22 | |
| 3. About how many times did you wake up during the night while you were trying to sleep? | 3 | 3 | 4 | 3 |
| IQR 3 N = 101 | IQR 3 N = 77 | IQR 3 N = 73 | IQR 3 N = 22 | |
| 4. How long did it take you to go to sleep last night? | 3 (1620 min) | 1 (010 min) | 2 (1115 min) | 2 (1115 min) |
| IQR 3 N = 101 | IQR 2 N = 77 | IQR 4 N = 75 | IQR 3 N = 22 | |
Participants also ranked each of the 7 queried disruptive factors on a 7‐point scale with regards to degree of sleep interruption. Even though less than half of the participants were in shared rooms, the presence of a roommate among those with roommates was the only sleep disrupter that ranked differently among the 4 phases. In Phases 1 and 2, when asked how much their sleep was disturbed by roommates, the median response was 1 (none), IQR = 1 (N = 41 and 31, respectively). In Phase 4, the median was 2 (a little), IQR = 2 (N = 6), but not significantly different. Answers in Phase 3 were significantly different, with a median of 3 (mild), IQR = 3 (N = 30) (0.005 P 0.006). Because there were no other statistically significant differences among individual sleep disruptors as compared by phases, survey data from all 4 phases for these factors was also analyzed collectively. Pain and staff interruptions (IQR = 3, N = 252 and IQR = 2, N = 253, respectively) were reported as the most disturbing factors, each with a median of 2 (a little). All remaining factors had a median score of 1 (none): noise inside the room (IQR = 2, N = 253), noise outside of the room (IQR = 1, N = 253), temperature (IQR = 1, N = 253), noise outside of the building (IQR = 0, N = 252), and light (IQR = 0, N = 252).
Noise Meter Recordings
Noise data were recorded from 95 participants in Phases 1 through 3, yielding high‐quality data suitable for analysis from 63 participants (11 in Phase 1, 24 in Phase 2, and 28 in Phase 3). Recorded noise ranged from 35 to 80 dB. As shown in Supporting Figure 2 in the online version of this article, raw data were plotted as decibels as a function of time. Noise levels were then analyzed in aggregate and for each of four 3‐hour time blocks (8 PM11 PM, 11 PM 2 AM,, 2 AM 5 AM, and 5 AM8 AM). Median noise levels during the entire 12‐hour period increased significantly between the first 3 phases of the study (P 0.001): 38.6 dB (IQR 5.4) in Phase 1; 40.6 dB (IQR 5.3) in Phase 2; and 43.5 (IQR 7) in Phase 3. As in Supporting Table 1 in the online version of this article, within each phase, the median noise levels were significantly less during the 11 PM2 AM and 2 AM5 AM periods, as compared to the 8 PM11 PM and 5 AM8 AM periods (P 0.001). Due to equipment dysfunction, noise data were not available for Phase 4.
Press Ganey Survey
A total of 457 Press Ganey surveys were collected. According to these surveys, patients' mean raw score of noise, on a scale from 1 to 100 (100 representing the best score), ranged from a low of 59.5 7.2 (January 2010; N = 21) to a high of 82.1 5.2 (April 2009; N = 21). Figure 3 illustrates the monthly trend of the mean score for noise compared to the national average compiled from other large hospitals around the country. It demonstrates that during the phases in which Sleep Rounds were performed (Phases 2 and 4), patients' perceptions of noise were improved.

DISCUSSION
The major conclusions of this study are: 1) hospitalized patients suffer from poor sleep quality and quantity; 2) implementation of simple measures such as Sleep Rounds to change standard practice within the hospital is feasible and effective; and 3) despite an increase in measured noise, patients' perception of their sleep and of noise levels was improved by these measures. This study developed and tested a sleep promotion program that could easily be implemented on any inpatient floor. Our Sleep Rounds checklist outlines a novel, but simple approach to sleep health by hospital providers, with the immediate goal of improving sleep among inpatients and the ultimate goal of improving outcomes.
Our study confirms that sleep disruption is prevalent among patients admitted to general hospital wards. In this study, patients reported a median of 5 hours of sleep, 3 awakenings, and sleep latency of 1115 minutes. Although not alarmingly low, 5 hours is only 60% of the recommended 8 hours of sleep for healthy individuals each night and 72% of the 6.9 hours of sleep reported by the average American each night.26 Poor pain control, frequent staff interactions, and the presence of roommates were rated as most problematic by the patients we surveyed. Interestingly, patients rated noise, temperature, and light as less problematic sleep disruptors.
Although we did not detect a statistically significant improvement in total sleep time or number of awakenings, there was a significant improvement in sleep latency during Phase 2 of the study when Basic Sleep Rounds were performed. In Phase 3 (washout phase), there was less active participation by the nursing staff in sleep hygiene promotion, and patients' perception of sleep quality was significantly worse than it was in other phases. These results suggest that the perception of sleep quality and quantity could have been enhanced by both our Basic (Phase 2) and Deluxe (Phase 4) Sleep Rounds interventions.
We were able to achieve appropriate noise levels at night (40 dB) during this study, even before our intervention began.27 Noise levels increased 2 dB between Phases 1 and 2, and another 3 dB in Phase 3. Although the changes in decibel level were statistically significant, a change of 23 dB is barely perceptible.28 Interestingly, despite the increase in measured noise throughout the study, Press Ganey results showed a trend towards perceived improvement in noise levels just before implementation of the first intervention. This may be attributable to an increased awareness of noise created by consenting patients and placing noise meters in their rooms. Perception of noise worsened significantly during the washout phase, suggesting that abandonment of Sleep Rounds was associated with less concern about noise.
Prior to initiating this study, an educational in‐service was conducted for the nursing team regarding the purpose and overall aims of this project. This may have raised awareness of the importance of sleep before collection of Phase 1 data, and had the unintended effect of an increased focus on sleep even before Sleep Rounds began. Other limitations of the study include lack of objective sleep data, nonrandomized design, inability to demonstrate causality, generalizability of results, inability to control for comorbidity including baseline sleep hygiene, limited patient numbers, inability to blind patients and team members, and difficulty obtaining accurate and complete noise data on all patients enrolled.
This study suggests that although it remains difficult for patients to sleep well in the hospital, it is possible to improve sleep and patients' perception of their sleep while they are hospitalized. Further studies are warranted to systematically evaluate interventions aimed at improving and overcoming the identified sleep disruptors without compromising patient care. However, we believe that Sleep Rounds could be associated with improvements in inpatient sleep hygiene and patient satisfaction, and could ultimately benefit patient outcomes.
Acknowledgements
The authors thank JoEllen Robinson, Jane Hill, and the nursing staff of Meyer 8 for their invaluable contributions to this project.
- .Sleep in acute care settings: an integrative review.J Nurs Scholarsh.2000;32(1):31–38.
- ,.Nursing standard‐of‐practice protocol: sleep disturbances in elderly patients. The NICHE Faculty.Geriatr Nurs.1995;16(5):238–243.
- ,,, et al.Sleep patterns and mortality among elderly patients in a geriatric hospital.Gerontology.2000;46(6):318–322.
- ,,.Sleep, insomnia and falls in elderly patients.Sleep Med.2008;9(suppl 1):S18–S22.
- ,,,,,.Behavioural and physiological reactivity to noise in the newborn.J Paediatr Child Health.2004;40(5–6):275–281.
- ,,.Sleep problems as a risk factor for falls in a sample of community‐dwelling adults aged 64–99 years.J Am Geriatr Soc.2000;48(10):1234–1240.
- ,,, et al.Reducing dangerous nighttime events in persons with dementia by using a nighttime monitoring system.Alzheimers Dement.2009;5(5):419–426.
- ,.Neurocognitive consequences of sleep deprivation.Semin Neurol.2005;25(1):117–129.
- ,,,,.The nursing home at night: effects of an intervention on noise, light, and sleep.J Am Geriatr Soc.1999;47(4):430–438.
- ,,,,.Sleep in hospitalized elders: a pilot study.Geriatr Nurs.2010;31(4):263–271.
- ,.Interactive relationships between hospital patients' noise‐induced stress and other stress with sleep.Heart Lung.2001;30(4):237–243.
- ,,.The impact of noise on patients' sleep and the effectiveness of noise reduction strategies in intensive care units.Crit Care.2009;13(2):208.
- ,,,,,.Sleep in critically ill patients requiring mechanical ventilation.Chest.2000;117(3):809–818.
- ,.Adverse effects of sleep deprivation in the ICU.Crit Care Clin.2008;24(3):461–476, v–vi.
- ,,,,.Abnormal sleep/wake cycles and the effect of environmental noise on sleep disruption in the intensive care unit.Am J Respir Crit Care Med.2001;163(2):451–457.
- ,.Responses of premature infants to routine nursing interventions and noise in the NICU.Nurs Res.1995;44(3):179–185.
- ,,,,.Noise, stress, and annoyance in a pediatric intensive care unit.Crit Care Med.2003;31(1):113–119.
- ,,,,.Effects of guidelines implementation in a surgical intensive care unit to control nighttime light and noise levels.Crit Care Med.2000;28(7):2242–2247.
- ,,,,.Noise control: a nursing team's approach to sleep promotion.Am J Nurs.2004;104(2):40–48; quiz 48–49.
- ,,, et al.Environmental noise sources and interventions to minimize them: a tale of 2 hospitals.J Nurs Care Qual.2008;23(3):216–224; quiz 225–216.
- ,,, et al.Interventions to reduce decibel levels on patient care units.Am Surg.1998;64(9):894–899.
- ,,,.Examining the feasibility of implementing specific nursing interventions to promote sleep in hospitalized elderly patients.Geriatr Nurs.2008;29(3):197–206.
- ,,,.Applicability of two brief evidence‐based interventions to improve sleep quality in inpatient mental health care.Int J Ment Health Nurs.2011;20(5)319–327.
- .Sleep deprivation in critical care units.Crit Care Nurs Q.2003;26(3):179–189; quiz 190–171.
- ,,,.Sleep promotion in hospitalized elders.Medsurg Nurs.2003;12(5):279–289; quiz 290.
- 2005 NSF Sleep in America Poll.Washington, DC:National Sleep Foundation;2005.
- ,,.Guidelines for Community Noise.Geneva, Switzerland:World Health Organization;1999.
- PhysicsArchives.com.2010. Available at: http://physicsarchives.com/index.php/courses/219. Accessed May 15, 2011.
In recent years, the philosophy of major hospitals has become more patient‐centered with increased focus on outcomes, safety, and patient satisfaction. To this end, many hospitals are looking for innovative ways not only to optimize quality of care, but also to improve patient satisfaction.
Sleep is a domain in which the goals of improving patient outcomes and satisfaction can be mutually achieved. Poor sleep has become a prevalent problem, and a single night of complete sleep loss can result in the undesirable consequences of daytime sleepiness, lethargy, irritability, confusion, and poor short‐term memory.1, 2 Literature has also suggested that chronic partial sleep loss can have significant consequences for safety, mood stability, neurological and medical functioning, and quality of life.38 The importance of acknowledging the relationship between sleep and a patient's level of functioning is magnified in the context of hospitalized patients, particularly those undergoing neurological inpatient care. Changes in level of alertness due to sleep loss can have serious implications for these patients, as they can lead to unnecessary testing and decreased participation with rehabilitative services.
Among the potential causes of sleep deprivation in hospitalized patients are poor pain control, lights, activities of others, and increased noise levels. The effect that increased noise has on patients has been evaluated in a variety of hospital settings, most notably in pediatric and adult intensive care units and nursing homes.9, 10 Noise has been shown to increase blood pressure, heart rate, respiratory rate, and body temperature. It has also been associated with failure to thrive, impaired immune function, delayed wound healing, and increased stress levels.11
The majority of literature regarding sleep disturbance in the hospital has focused on sleep disruption in the intensive care unit, where interventions associated with sleep loss are required to deliver the appropriate standard level of care.1218 However, few evidence‐based strategies to promote sleep quality in hospitalized patients have been evaluated.16, 1823 In this study, we aimed to examine sleep among neurological and neurosurgical inpatients, identify specific sleep‐disruptive factors, and assess patient satisfaction regarding their sleep. We implemented a sleep‐promoting protocol with the hypothesis that improvement of modifiable sleep‐disruptive factors would improve sleep and patient satisfaction.
METHODS
Study Design
This prospective, observational study was designed and implemented by an interdisciplinary team of physicians, neuroscience nurses, and hospital administrators.
Patient Selection
The study was performed on a Neurology and Neurosurgery unit, with both private and semi‐private rooms, at a large, urban, tertiary teaching hospital from February 2009 through June 2010. During enrollment periods, all patients on the unit were screened daily for eligibility. Eligible patients were medically stable and capable of giving verbal consent. Patients who were less than 16 years of age, encephalopathic, aphasic, or non‐English speaking were excluded. Eligible patients were asked for consent to participate in the study. After consultation with the hospital's institutional review board (IRB) committee, written consent was waived in this observational, quality improvement study.
Study Timeline
The study comprised 4 phases (Figure 1). In Phase 1, we collected baseline data on patients in the unit. Data were collected in the form of sleep surveys, Press Ganey surveys, and noise meter recordings. The baseline phase (Phase 1) lasted 10 weeks from February to April 2009. We then implemented a novel sleep‐promoting intervention called Basic Sleep Rounds (Phase 2, May to August 2009). After discontinuing Basic Sleep Rounds, data were collected for the washout phase (Phase 3, September 2009 to February 2010). An enhanced version of the sleep‐promoting intervention called Deluxe Sleep Rounds was then instituted (Phase 4, March to June 2010). In Phases 2 and 4, sleep rounds were implemented for 2 weeks before data collection to ensure uniform application of Sleep Rounds.
Sleep Promoting Interventions
Prior to implementing Basic Sleep Rounds in Phase 2, a nursing in‐service was performed where staff were educated about sleep in the hospital and about the planned interventions, and posters promoting sleep were hung on the unit. Basic Sleep Rounds were performed during Phase 2 by the patient's bedside nurse or the unit charge nurse. This occurred for all patients on the unit at approximately 23:00 nightly using the Basic Sleep Rounds checklist, which formalized simple hospital functions, such as lights out, television off, room temperature adjustment, and a final restroom usage (Figure 2). For Phase 4, a team of undergraduate volunteers was organized to assist with the delivery of Sleep Rounds. In this phase (Deluxe Sleep Rounds), nurses performed Basic Sleep Rounds by completing the checklist, and undergraduate volunteers offered patients any of the following sleep amenities: warm blanket, warm milk, white‐noise machine, hypoallergenic lotion, or room spritzer.24, 25
Additionally, during the Basic and Deluxe intervention phases, noise‐sensitive traffic lights (Talk Light Too;
Data Collection
A survey was designed to evaluate sleep quality, estimate sleep quantity, identify sleep disruptors, and assess patient satisfaction (see Supporting Figure 1 in the online version of this article). The survey was given to all eligible participants on the morning after their second night in the unit. This time point was chosen to account for potentially confounding first night effects, and to ensure that enrolled patients spent a full night in the unit.
To better evaluate one of the sleep disruptors, a subset of the survey participants had noise meters placed in their rooms. Every morning, a member of the team would visit all eligible patients to ask if they were willing to participate in this portion of the study. Data recorded between 8:00 PM and 8:00 AM on the second night of each participant's stay were later used for analysis. Noise was recorded in decibels using a Vernier Sound Level Meter, attached to a LabQuest data collection device (
Scores from Press Ganey surveys were also analyzed. These surveys were mailed to patients shortly after hospital discharge, and subsequently processed by Press Ganey Associates, Inc (
Data Analysis
Most datasets were not described by a normal distribution, thus most data are presented as medians with interquartile ranges (IQR), and comparisons between datasets were made using the MannWhitney U test. Press Ganey data are presented as means with standard errors of the mean, as distributed by Press Ganey. P 0.05 was considered significant for all data comparisons.
RESULTS
Basic demographic data were available on all participants from whom both noise and survey data were collected. As in Table 1, these participants were demographically similar (P 0.05) with regards to age, sex, and ethnic background. For unknown reasons, neurosurgery patients comprised the majority of participants in Phases 1 and 3, and neurology patients comprised the majority in Phase 2. This difference was not significant.
| Demographic | Phase 1 (n = 32) | Phase 2 (n = 33) | Phase 3 (n = 30) |
|---|---|---|---|
| Average age | 49 1 | 43 3 | 46 3 |
| % Female | 71% | 71% | 57% |
| % Neurology | 42% | 65% | 37% |
| % White | 67% | 77% | 73% |
Sleep Survey
A total of 253 sleep surveys were collected in all 4 phases. Data generated from these surveys are demonstrated in Table 2. On a 7‐point scale (1 being the best score, corresponding to the answer none, and 7 the worst, corresponding to extreme), the median scores for overall difficulty sleeping were not significantly different in Phases 1, 2, and 4. In Phase 3, the median score was 4 (moderate), significantly worse than in the other 3 phases (0.002 P 0.01). Despite the reported difficulty sleeping during Phase 3, the median number of hours of sleep and awakenings in Phases 1, 2, 3, and 4 were not significantly different. Sleep latency was scored on a 6‐point scale (1 being the best, corresponding to 010 min, and 6 the worst, corresponding to greater than 45 minutes). Similar sleep latency was reported in Phases 1, 3, and 4. However, median sleep latency in Phase 2 was 1 (010 min), significantly shorter than in the other phases (0.001 P 0.02). Despite similar survey results throughout most of the phases, there was a significant improvement in sleep latency in the Basic Sleep Rounds phase (Phase 2), and a significant worsening in overall difficulty sleeping in the washout phase (Phase 3).
| Survey Question | Phase 1 | Phase 2 | Phase 3 | Phase 4 |
|---|---|---|---|---|
| ||||
| 1. How much difficulty did you have sleeping last night? | 3 | 2 | 4* | 3 |
| IQR 4 N = 100 | IQR 4 N = 78 | IQR 3 N = 75 | IQR 2 N = 22 | |
| 2. How many hours did you sleep last night? | 6 hr | 6 hr | 5 hr | 5 hr |
| IQR 4 N = 98 | IQR 3 N = 77 | IQR 3 N = 72 | IQR 2 N = 22 | |
| 3. About how many times did you wake up during the night while you were trying to sleep? | 3 | 3 | 4 | 3 |
| IQR 3 N = 101 | IQR 3 N = 77 | IQR 3 N = 73 | IQR 3 N = 22 | |
| 4. How long did it take you to go to sleep last night? | 3 (1620 min) | 1 (010 min) | 2 (1115 min) | 2 (1115 min) |
| IQR 3 N = 101 | IQR 2 N = 77 | IQR 4 N = 75 | IQR 3 N = 22 | |
Participants also ranked each of the 7 queried disruptive factors on a 7‐point scale with regards to degree of sleep interruption. Even though less than half of the participants were in shared rooms, the presence of a roommate among those with roommates was the only sleep disrupter that ranked differently among the 4 phases. In Phases 1 and 2, when asked how much their sleep was disturbed by roommates, the median response was 1 (none), IQR = 1 (N = 41 and 31, respectively). In Phase 4, the median was 2 (a little), IQR = 2 (N = 6), but not significantly different. Answers in Phase 3 were significantly different, with a median of 3 (mild), IQR = 3 (N = 30) (0.005 P 0.006). Because there were no other statistically significant differences among individual sleep disruptors as compared by phases, survey data from all 4 phases for these factors was also analyzed collectively. Pain and staff interruptions (IQR = 3, N = 252 and IQR = 2, N = 253, respectively) were reported as the most disturbing factors, each with a median of 2 (a little). All remaining factors had a median score of 1 (none): noise inside the room (IQR = 2, N = 253), noise outside of the room (IQR = 1, N = 253), temperature (IQR = 1, N = 253), noise outside of the building (IQR = 0, N = 252), and light (IQR = 0, N = 252).
Noise Meter Recordings
Noise data were recorded from 95 participants in Phases 1 through 3, yielding high‐quality data suitable for analysis from 63 participants (11 in Phase 1, 24 in Phase 2, and 28 in Phase 3). Recorded noise ranged from 35 to 80 dB. As shown in Supporting Figure 2 in the online version of this article, raw data were plotted as decibels as a function of time. Noise levels were then analyzed in aggregate and for each of four 3‐hour time blocks (8 PM11 PM, 11 PM 2 AM,, 2 AM 5 AM, and 5 AM8 AM). Median noise levels during the entire 12‐hour period increased significantly between the first 3 phases of the study (P 0.001): 38.6 dB (IQR 5.4) in Phase 1; 40.6 dB (IQR 5.3) in Phase 2; and 43.5 (IQR 7) in Phase 3. As in Supporting Table 1 in the online version of this article, within each phase, the median noise levels were significantly less during the 11 PM2 AM and 2 AM5 AM periods, as compared to the 8 PM11 PM and 5 AM8 AM periods (P 0.001). Due to equipment dysfunction, noise data were not available for Phase 4.
Press Ganey Survey
A total of 457 Press Ganey surveys were collected. According to these surveys, patients' mean raw score of noise, on a scale from 1 to 100 (100 representing the best score), ranged from a low of 59.5 7.2 (January 2010; N = 21) to a high of 82.1 5.2 (April 2009; N = 21). Figure 3 illustrates the monthly trend of the mean score for noise compared to the national average compiled from other large hospitals around the country. It demonstrates that during the phases in which Sleep Rounds were performed (Phases 2 and 4), patients' perceptions of noise were improved.
DISCUSSION
The major conclusions of this study are: 1) hospitalized patients suffer from poor sleep quality and quantity; 2) implementation of simple measures such as Sleep Rounds to change standard practice within the hospital is feasible and effective; and 3) despite an increase in measured noise, patients' perception of their sleep and of noise levels was improved by these measures. This study developed and tested a sleep promotion program that could easily be implemented on any inpatient floor. Our Sleep Rounds checklist outlines a novel, but simple approach to sleep health by hospital providers, with the immediate goal of improving sleep among inpatients and the ultimate goal of improving outcomes.
Our study confirms that sleep disruption is prevalent among patients admitted to general hospital wards. In this study, patients reported a median of 5 hours of sleep, 3 awakenings, and sleep latency of 1115 minutes. Although not alarmingly low, 5 hours is only 60% of the recommended 8 hours of sleep for healthy individuals each night and 72% of the 6.9 hours of sleep reported by the average American each night.26 Poor pain control, frequent staff interactions, and the presence of roommates were rated as most problematic by the patients we surveyed. Interestingly, patients rated noise, temperature, and light as less problematic sleep disruptors.
Although we did not detect a statistically significant improvement in total sleep time or number of awakenings, there was a significant improvement in sleep latency during Phase 2 of the study when Basic Sleep Rounds were performed. In Phase 3 (washout phase), there was less active participation by the nursing staff in sleep hygiene promotion, and patients' perception of sleep quality was significantly worse than it was in other phases. These results suggest that the perception of sleep quality and quantity could have been enhanced by both our Basic (Phase 2) and Deluxe (Phase 4) Sleep Rounds interventions.
We were able to achieve appropriate noise levels at night (40 dB) during this study, even before our intervention began.27 Noise levels increased 2 dB between Phases 1 and 2, and another 3 dB in Phase 3. Although the changes in decibel level were statistically significant, a change of 23 dB is barely perceptible.28 Interestingly, despite the increase in measured noise throughout the study, Press Ganey results showed a trend towards perceived improvement in noise levels just before implementation of the first intervention. This may be attributable to an increased awareness of noise created by consenting patients and placing noise meters in their rooms. Perception of noise worsened significantly during the washout phase, suggesting that abandonment of Sleep Rounds was associated with less concern about noise.
Prior to initiating this study, an educational in‐service was conducted for the nursing team regarding the purpose and overall aims of this project. This may have raised awareness of the importance of sleep before collection of Phase 1 data, and had the unintended effect of an increased focus on sleep even before Sleep Rounds began. Other limitations of the study include lack of objective sleep data, nonrandomized design, inability to demonstrate causality, generalizability of results, inability to control for comorbidity including baseline sleep hygiene, limited patient numbers, inability to blind patients and team members, and difficulty obtaining accurate and complete noise data on all patients enrolled.
This study suggests that although it remains difficult for patients to sleep well in the hospital, it is possible to improve sleep and patients' perception of their sleep while they are hospitalized. Further studies are warranted to systematically evaluate interventions aimed at improving and overcoming the identified sleep disruptors without compromising patient care. However, we believe that Sleep Rounds could be associated with improvements in inpatient sleep hygiene and patient satisfaction, and could ultimately benefit patient outcomes.
Acknowledgements
The authors thank JoEllen Robinson, Jane Hill, and the nursing staff of Meyer 8 for their invaluable contributions to this project.
- .Sleep in acute care settings: an integrative review.J Nurs Scholarsh.2000;32(1):31–38.
- ,.Nursing standard‐of‐practice protocol: sleep disturbances in elderly patients. The NICHE Faculty.Geriatr Nurs.1995;16(5):238–243.
- ,,, et al.Sleep patterns and mortality among elderly patients in a geriatric hospital.Gerontology.2000;46(6):318–322.
- ,,.Sleep, insomnia and falls in elderly patients.Sleep Med.2008;9(suppl 1):S18–S22.
- ,,,,,.Behavioural and physiological reactivity to noise in the newborn.J Paediatr Child Health.2004;40(5–6):275–281.
- ,,.Sleep problems as a risk factor for falls in a sample of community‐dwelling adults aged 64–99 years.J Am Geriatr Soc.2000;48(10):1234–1240.
- ,,, et al.Reducing dangerous nighttime events in persons with dementia by using a nighttime monitoring system.Alzheimers Dement.2009;5(5):419–426.
- ,.Neurocognitive consequences of sleep deprivation.Semin Neurol.2005;25(1):117–129.
- ,,,,.The nursing home at night: effects of an intervention on noise, light, and sleep.J Am Geriatr Soc.1999;47(4):430–438.
- ,,,,.Sleep in hospitalized elders: a pilot study.Geriatr Nurs.2010;31(4):263–271.
- ,.Interactive relationships between hospital patients' noise‐induced stress and other stress with sleep.Heart Lung.2001;30(4):237–243.
- ,,.The impact of noise on patients' sleep and the effectiveness of noise reduction strategies in intensive care units.Crit Care.2009;13(2):208.
- ,,,,,.Sleep in critically ill patients requiring mechanical ventilation.Chest.2000;117(3):809–818.
- ,.Adverse effects of sleep deprivation in the ICU.Crit Care Clin.2008;24(3):461–476, v–vi.
- ,,,,.Abnormal sleep/wake cycles and the effect of environmental noise on sleep disruption in the intensive care unit.Am J Respir Crit Care Med.2001;163(2):451–457.
- ,.Responses of premature infants to routine nursing interventions and noise in the NICU.Nurs Res.1995;44(3):179–185.
- ,,,,.Noise, stress, and annoyance in a pediatric intensive care unit.Crit Care Med.2003;31(1):113–119.
- ,,,,.Effects of guidelines implementation in a surgical intensive care unit to control nighttime light and noise levels.Crit Care Med.2000;28(7):2242–2247.
- ,,,,.Noise control: a nursing team's approach to sleep promotion.Am J Nurs.2004;104(2):40–48; quiz 48–49.
- ,,, et al.Environmental noise sources and interventions to minimize them: a tale of 2 hospitals.J Nurs Care Qual.2008;23(3):216–224; quiz 225–216.
- ,,, et al.Interventions to reduce decibel levels on patient care units.Am Surg.1998;64(9):894–899.
- ,,,.Examining the feasibility of implementing specific nursing interventions to promote sleep in hospitalized elderly patients.Geriatr Nurs.2008;29(3):197–206.
- ,,,.Applicability of two brief evidence‐based interventions to improve sleep quality in inpatient mental health care.Int J Ment Health Nurs.2011;20(5)319–327.
- .Sleep deprivation in critical care units.Crit Care Nurs Q.2003;26(3):179–189; quiz 190–171.
- ,,,.Sleep promotion in hospitalized elders.Medsurg Nurs.2003;12(5):279–289; quiz 290.
- 2005 NSF Sleep in America Poll.Washington, DC:National Sleep Foundation;2005.
- ,,.Guidelines for Community Noise.Geneva, Switzerland:World Health Organization;1999.
- PhysicsArchives.com.2010. Available at: http://physicsarchives.com/index.php/courses/219. Accessed May 15, 2011.
Overcome by Weakness
The approach to clinical conundrums by an expert clinician is revealed through the presentation of an actual patient's case in an approach typical of a morning report. Similarly to patient care, sequential pieces of information are provided to the clinician, who is unfamiliar with the case. The focus is on the thought processes of both the clinical team caring for the patient and the discussant.
This icon represents the patient's case. Each paragraph that follows represents the discussant's thoughts.
An 89‐year‐old man presented to the emergency department with progressive fatigue, confusion, and generalized weakness over 2 months, worsening in the prior few days.
Four categories of disease account for most cases of confusion in the elderly: metabolic derangements; infection (both within and outside of the central nervous system); structural brain disorder (eg, bleed or tumor); and toxins (generally medications). It will be important early on to determine if weakness refers to true loss of motor function, reflecting a neuromuscular lesion.
At baseline, the patient had normal cognition, ambulated without assistance, and was independent in activities of daily living. Over the preceding 2 months, general functional decline, unsteady gait, balance problems, and word‐finding difficulty developed. He also needed a front‐wheel walker to avoid falling. One month prior to presentation, the patient's children noticed he was markedly fatigued and was requiring a nightly sedative‐hypnotic in order to fall asleep.
He denied any recent travel, sick contacts, or recent illness. He denied vertigo, dizziness, or syncope. He reported occasional urinary incontinence which he attributed to being too weak to get to the bathroom promptly.
This rapid progression over 2 months is not consistent with the time course of the more common neurodegenerative causes of dementia, such as Alzheimer's or Parkinson's disease. In Parkinson's, cognitive impairment is a late feature, occurring years after gait and motor disturbances develop. Normal pressure hydrocephalus, which causes the classic triad of incontinence, ataxia, and confusion, would also be unlikely to develop so abruptly. Although we do not think of vascular (multi‐infarct) dementia as having such a short time course, on occasion a seemingly rapid presentation is the postscript to a more insidious progression that has been underway for years. A subdural hematoma, which may have occurred with any of his falls, must also be considered, as should neoplastic and paraneoplastic processes.
His past medical history included paroxysmal atrial fibrillation, diabetes mellitus, hypertension, hyperlipidemia, coronary artery disease complicated by prior myocardial infarction for which he underwent coronary artery bypass grafting 7 years prior, mild aortic sclerosis and insufficiency, mild mitral regurgitation, anemia, recurrent low‐grade bladder cancer treated with serial local resections over the last 8 years, low‐grade prostate cancer which had not required treatment, hypothyroidism, chronic kidney disease, and lumbar spinal stenosis.
His atrial fibrillation and valvular disease put him at risk for thrombotic and infective embolic phenomena causing multiple cerebral infarcts. He has all the requisite underlying conditions for vascular dementia. Untreated hypothyroidism could explain his decline and sedation. Prostate and bladder cancers would be unusual causes of subacute central nervous system (CNS) disease. Finally, his chronic kidney disease may have progressed to uremia.
One year prior to admission, the patient developed bilateral shoulder pain, right‐sided headache with loss of vision in his right eye, fevers, and an elevated erythrocyte sedimentation rate (ESR). Although temporal artery biopsy specimens did not reveal arterial inflammation, he was started on high‐dose prednisone for polymyalgia rheumatica and giant cell arteritis (GCA); he experienced improvement in his ESR and in all symptoms, with the exception of permanent right eye blindness. Maintenance prednisone was continued for disease suppression.
Even without confirmatory biopsy results, the clinical case for GCA was compelling and the rationale for starting steroids strong; his sustained response over 1 year further supports the diagnosis. GCA is almost always confined to extracranial vessels, and altered sensorium would be an unusual manifestation. His extended treatment with prednisone expands the list of CNS and systemic infections, particularly opportunistic ones, for which he is now at risk.
Outpatient medications were prednisone at doses fluctuating between 10 and 20 mg daily, furosemide 20 mg daily, amiodarone 200 mg daily, levothyroxine 50 mcg daily, alendronate 70 mg weekly, eszopiclone 1 mg nightly, losartan 50 mg daily, and warfarin. The patient was an accomplished professor and had published a book 1 year prior to admission. He quit smoking over 30 years ago, and he occasionally drank wine. He denied any drug use.
Three months prior to the current presentation, the patient was hospitalized for right upper‐lobe pneumonia for which he received a course of doxycycline, and his symptoms improved. Follow‐up chest x‐ray, 4 weeks later (2 months prior to admission), showed only slight improvement of the right upper‐lobe opacity.
Leading possibilities for the persistent lung opacity are cancer and untreated infection. After 3 decades of being tobacco‐free, his smoking‐related risk of cancer is low, but remains above baseline population risk. There are at least 4 ways untreated lung cancer may render patients confused: direct metastases to the brain, carcinomatous or lymphomatous meningitis, paraneoplastic phenomenon (eg, limbic encephalitis), and metabolic derangements (eg, syndrome of inappropriate antidiuretic hormone secretion, hypercalcemia).
The upper‐lobe infiltrate that failed to improve with doxycycline could also reflect an aspiration pneumonia that evolved into an abscess, or an infection with mycobacteria or endemic fungi.
In the emergency department, the patient's temperature was 38.5C, blood pressure 139/56 mmHg, heart rate 92 beats per minute, respiratory rate 18 breaths per minute, and oxygen saturation while breathing ambient room air was 98%.
He was alert and well‐appearing. Jugular venous pressure was normal. The thyroid was normal. He had rhonchi in his right anterior upper chest and right lower lung base. Cardiac exam demonstrated a regular rhythm, with a 3/6 systolic murmur at the second right intercostal space that radiated to the carotids, and a 2/6 nonradiating holosystolic murmur at the apex. Abdomen was soft with no organomegaly or masses. There was no lymphadenopathy, and his extremities showed no clubbing or edema. There were multiple contusions in various stages of healing on his legs.
He was confused, had word‐finding difficulty, and frequently would lose his train of thought, stopping in mid‐sentence. He had no dysarthria. Cranial nerves were normal, except for reduced visual acuity and diminished pupillary response to light in his right pupil, which had been previously documented. Finger‐to‐nose testing was slow bilaterally, but was more sluggish on the right. Rapid alternating hand movements were intact. He was unable to perform heel‐to‐shin testing. Sensation was intact. Plantar reflexes were flexor bilaterally. Strength in his limbs was preserved both distally and proximally, and deep tendon reflexes were normal. However, he was unable to sit up or stand on his own due to weakness.
The fever on prednisone is a red flag for infection. The infection may be the primary diagnosis (eg, meningoencephalitis) or may reflect an additional superimposed insult (eg, urinary tract infection) on the underlying encephalopathy. Two murmurs in a febrile patient with the multifocal CNS findings suggest endocarditis. The abnormalities on chest examination could indicate a lung infection complicated by hematogenous spread to the brain, such as a lung abscess (secondary to the aspiration event), tuberculosis (TB), or endemic fungal infection.
Serum chemistries were normal, and the serum creatinine was 1.1 mg/dL. White blood cell count was 20,100 per mm3 with 90% neutrophils, 9% lymphocytes, and 1% monocytes. Hemoglobin was 13.7 g/dL, platelet count was 464,000 per mm3. Thyroid stimulating hormone (TSH) was 6.0 IU/mL (normal, 5.5). International normalized ratio (INR) was 2.2. Urinalysis was normal. Transaminases, bilirubin, and alkaline phosphatase were normal. Lactate was 1.9 mmol/L.
Electrocardiogram (EKG) was unchanged from his baseline. ESR was >120 mm/hr (the maximum reportable value); his ESR measurements had been gradually rising during the previous 4 months. Chest x‐ray demonstrated a right upper‐lobe opacity, slightly more pronounced in comparison with chest x‐ray 2 months earlier.
His fever, leukocytosis, elevated ESR, and thrombocytosis all reflect severe inflammation. While infection and then malignancy remain the primary considerations, a third category of inflammatory diseaseautoimmunitywarrants mention. For instance, Wegener's granulomatosis can cause pulmonary and CNS disease in the elderly.
Intravenous ceftriaxone and oral doxycycline were administered. Chest computed tomography (CT) (Figure 1) demonstrated dense right upper‐lobe mass‐like consolidation with associated adenopathy and pleural effusion; in addition, several nodules were present in the left and right lower lobes, the largest of which was 10 mm. CT of the chest 10 months prior to current admission had been normal. CT of the brain, performed without contrast, demonstrated multiple areas of abnormal vasogenic edema with suggestion of underlying masses.

The imaging provides evidence of a combined pulmonaryCNS syndrome. It is far more common for disease to originate in the lungs (a common portal of entry and environmental exposure) and spread to the brain than vice versa. The list of diseases and pathogens that affect the lungs and spread to the brain includes: primary lung cancer, lymphoma, bacteria, mycobacteria, fungi, molds (eg, Aspergillus), Wegener's granulomatosis, and lymphomatoid granulomatosis. Bacterial lung abscess, such as that caused by Streptococcus milleri group, may spread to the brain. Nocardia, a ubiquitous soil organism, infects immunocompromised patients and causes a similar pattern. Actinomycosis is an atypical infection that may mimic cancer, particularly in the lungs; while head and neck disease is characteristic, CNS involvement is less so. Overall, the imaging does not specifically pinpoint 1 entity, but infection remains heavily favored over malignancy, with autoimmunity a distant third.
Respiratory cultures showed normal respiratory flora. Blood cultures grew no organisms. Two samples of induced sputum were negative for acid‐fast bacilli (AFB) on smear examination. Forty‐eight hours after a purified protein derivative (PPD) skin test was placed, there was 0 mm of induration. Magnetic resonance imaging (MRI) of the brain (Figure 2) demonstrated 8 ring‐enhancing supratentorial lesions at the graywhite junction.

Negative blood cultures substantially lower the probability of bacterial endocarditis; there are no epidemiologic risk factors for the rare causes of culture‐negative endocarditis (eg, farm exposure, homelessness). Two negative smears for AFB with dense pulmonary or cavitary disease signify a low probability of tuberculosis.
In the setting of depressed cell‐mediated immunity (eg, human immunodeficiency virus [HIV] infection or chronic prednisone use), multiple ring‐enhancing CNS lesions are a classic appearance of toxoplasmosis, but they also are typical of bacterial brain abscesses and Nocardia. Brain metastases are usually solid, but as central necrosis develops, peripheral enhancement may appear. The diffuse distribution and the localization at the graywhite junction further support a hematogenously disseminated process, but do not differentiate infection from metastases.
Transthoracic echocardiogram demonstrated normal left ventricular ejection fraction, clinically insignificant aortic sclerosis and mitral regurgitation, and no evidence of vegetations. Results of a CT‐guided fine‐needle aspiration of the lung were nondiagnostic, showing necropurulent material and benign lung parenchyma with fibrosis. A core biopsy of the lung showed alveolar tissue with patchy mild deposition of fibrinous material and rare scattered acute and chronic inflammatory cells without granulomas. Pleural fluid cytology showed reactive mesothelial cells with mixed inflammatory cells. There were no fungal elements or malignant cells.
The failure to detect malignancy after 2 biopsies and 1 thoracentesis lowers the suspicion of cancer, and thereby bolsters the probability of atypical infections which may elude diagnosis on routine cultures and biopsy. A detailed history, with attention to geographic exposures, is warranted to see which endemic mycosis would put him most at risk. Based on his California residency, disseminated coccidiomycosis or the ubiquitous Cryptococcus are conceivable. Nocardia remains a strong consideration because of his chronic immunosuppression and the lung‐CNS pattern.
Fungal stains and cultures from the biopsies and pleural fluid were negative. Serum antibodies to coccidiomycosis and serum cryptococcal antigen tests were negative. On the eighth hospital day, the microbiology lab reported a few acid‐fast bacilli from a third induced sputum sample. RNA amplification testing for Mycobacterium tuberculosis was negative.
Due to his continued decline, the patient met with the palliative care team and expressed his desire to go home with hospice. While arrangements were being made, he died later that day in the hospital.
There is reasonable evidence that tuberculosis is not the culprit pathogen here: negative PPD, 2 negative sputa in the setting of a massive necrotic lesion, and a negative RNA amplification test. Nontuberculous mycobacteria such as Mycobacterium avium complex (MAC) and M. kansasii may cause disease similar to TB, but they are usually not this difficult to identify. Nocardia is classically a weakly acid‐fast positive bacteria and fits this patient's clinical picture best.
Four colonies of Nocardia (not further speciated) were identified postmortem from the patient's sputum.
DISCUSSION
Nocardia species are ubiquitous soil‐dwelling, Gram‐positive, branching rods which are weakly positive with acid‐fast staining.1 Almost all Nocardia infections occur in patients with immune systems compromised by chronic disease (HIV, malignancy, alcoholism, chronic lung or kidney disease) or by medications. Corticosteroid treatment is the most frequent risk factor. In cases of nocardiosis in patients taking steroids, the median daily prednisone dose was 25 mg (range, 1080 mg) for a median duration of 3 months.2, 3
Nocardia should be considered in any patient with unexplained pulmonary, CNS, or cutaneous disease and appropriate risk factors. Pulmonary disease is most common, seen in approximately two‐thirds of patients, and is typically bilateral. Chest radiographic findings include infiltrates (59%), nodules (35%), effusions, and cavities.2 Up to half of all cases of pulmonary nocardiosis are associated with hematogenous dissemination, most commonly to the CNS, where manifestations include incidentally discovered asymptomatic lesions, headache, confusion, and focal neurologic deficits; meningitis is rare.1 CNS involvement and severe predisposing illness are adverse prognostic markers.
Diagnosis of nocardiosis is typically delayed by 6 weeks to 1 year.4, 5 This has been attributed to its rarity, its nonspecific and indolent presentation, its slow growth, and the difficulty isolating Nocardia from clinical specimens. Although Nocardia may disseminate widely to almost any site, isolation of Nocardia from blood cultures is rare. Clinicians must rely on sputum or tissue samples to demonstrate the characteristic Gram‐positive rods which stain weakly on acid‐fast preparations. Polymerase chain reaction (PCR)‐based tests improve the yield but are not routinely available.
The standard antibiotic for the treatment of Nocardia infections is trimethoprim‐sulfamethoxazole (TMP‐SMX) which has excellent CNS penetration. In patients with pulmonary disease or CNS dissemination, a second parenteral antimicrobial (usually amikacin or imipenem) is typically added to TMP‐SMX, and treatment is extended to 12 months or longer.6, 7 Prophylaxis with TMP‐SMX, which is usually prescribed to prevent Pneumocystis jirovecii in susceptible hosts, also reduces the incidence of Nocardia.2, 3, 6 Nocardia's restricted susceptibility pattern presents a challenge for hospitalists, as TMP‐SMX and aminoglycosides are rarely administered empirically for cases of suspected pneumonia or atypical pulmonary infections (other than P. jirovecii).
When confronted with the pattern of simultaneous pulmonary and CNS lesions, hospitalists must consider infections (lung abscess, mycobacteria, fungi, Nocardia), malignancies, and autoimmune conditions (sarcoidosis, Wegener's granulomatosis). This patient's weakness was a direct result of his weakened immune system, which allowed this weakly acid‐fast organism to flourish. Only by recognizing the possibility of nocardiosis (eg, a patient receiving steroids who develops pulmonary and CNS lesions) is there hope for early diagnosis and treatment.
TEACHING POINTS
-
Suspect disseminated nocardiosis in immunocompromised patients with unexplained pulmonary disease and CNS disease characterized by multiple ring‐enhancing abscesses.
-
Corticosteroid treatment is the most common risk factor for Nocardia infections. Patients taking prednisone at doses in excess of 10 mg daily for greater than 3 months should receive P. jirovecii prophylaxis with TMP‐SMX, which also reduces the incidence of Nocardia.
-
Prolonged courses of TMP‐SMX combined with at least 1 other agent for at least 612 months are typically required to treat disseminated Nocardia.
Acknowledgements
Disclosure: Dr Thomas E. Baudendistel is a former Deputy Editor at the Journal of Hospital Medicine and received a stipend for this work.
- ,.Nocardia species: host‐parasite relationships.Clin Microbiol Rev.1994;7:213–264.
- ,,,,,.Nocardiosis at the turn of the century.Medicine (Baltimore).2009;88:250–261.
- ,.A case series and focused review of nocardiosis: clinical and microbiologic aspects.Medicine (Baltimore).2004;83:300–313.
- ,,, et al.Pulmonary nocardiosis: risk factors and outcomes.Respirology.2007;12:394–400.
- ,.Infection with Nocardia species in Queensland. A review of 102 clinical isolates.Med J Aust.1992;156:692–697.
- .Nocardia in solid organ transplant recipients.Am J Transplant.2009;9:S70–S77.
- .Nocardiosis.Clin Infect Dis.1996;22:891–905.
The approach to clinical conundrums by an expert clinician is revealed through the presentation of an actual patient's case in an approach typical of a morning report. Similarly to patient care, sequential pieces of information are provided to the clinician, who is unfamiliar with the case. The focus is on the thought processes of both the clinical team caring for the patient and the discussant.
This icon represents the patient's case. Each paragraph that follows represents the discussant's thoughts.
An 89‐year‐old man presented to the emergency department with progressive fatigue, confusion, and generalized weakness over 2 months, worsening in the prior few days.
Four categories of disease account for most cases of confusion in the elderly: metabolic derangements; infection (both within and outside of the central nervous system); structural brain disorder (eg, bleed or tumor); and toxins (generally medications). It will be important early on to determine if weakness refers to true loss of motor function, reflecting a neuromuscular lesion.
At baseline, the patient had normal cognition, ambulated without assistance, and was independent in activities of daily living. Over the preceding 2 months, general functional decline, unsteady gait, balance problems, and word‐finding difficulty developed. He also needed a front‐wheel walker to avoid falling. One month prior to presentation, the patient's children noticed he was markedly fatigued and was requiring a nightly sedative‐hypnotic in order to fall asleep.
He denied any recent travel, sick contacts, or recent illness. He denied vertigo, dizziness, or syncope. He reported occasional urinary incontinence which he attributed to being too weak to get to the bathroom promptly.
This rapid progression over 2 months is not consistent with the time course of the more common neurodegenerative causes of dementia, such as Alzheimer's or Parkinson's disease. In Parkinson's, cognitive impairment is a late feature, occurring years after gait and motor disturbances develop. Normal pressure hydrocephalus, which causes the classic triad of incontinence, ataxia, and confusion, would also be unlikely to develop so abruptly. Although we do not think of vascular (multi‐infarct) dementia as having such a short time course, on occasion a seemingly rapid presentation is the postscript to a more insidious progression that has been underway for years. A subdural hematoma, which may have occurred with any of his falls, must also be considered, as should neoplastic and paraneoplastic processes.
His past medical history included paroxysmal atrial fibrillation, diabetes mellitus, hypertension, hyperlipidemia, coronary artery disease complicated by prior myocardial infarction for which he underwent coronary artery bypass grafting 7 years prior, mild aortic sclerosis and insufficiency, mild mitral regurgitation, anemia, recurrent low‐grade bladder cancer treated with serial local resections over the last 8 years, low‐grade prostate cancer which had not required treatment, hypothyroidism, chronic kidney disease, and lumbar spinal stenosis.
His atrial fibrillation and valvular disease put him at risk for thrombotic and infective embolic phenomena causing multiple cerebral infarcts. He has all the requisite underlying conditions for vascular dementia. Untreated hypothyroidism could explain his decline and sedation. Prostate and bladder cancers would be unusual causes of subacute central nervous system (CNS) disease. Finally, his chronic kidney disease may have progressed to uremia.
One year prior to admission, the patient developed bilateral shoulder pain, right‐sided headache with loss of vision in his right eye, fevers, and an elevated erythrocyte sedimentation rate (ESR). Although temporal artery biopsy specimens did not reveal arterial inflammation, he was started on high‐dose prednisone for polymyalgia rheumatica and giant cell arteritis (GCA); he experienced improvement in his ESR and in all symptoms, with the exception of permanent right eye blindness. Maintenance prednisone was continued for disease suppression.
Even without confirmatory biopsy results, the clinical case for GCA was compelling and the rationale for starting steroids strong; his sustained response over 1 year further supports the diagnosis. GCA is almost always confined to extracranial vessels, and altered sensorium would be an unusual manifestation. His extended treatment with prednisone expands the list of CNS and systemic infections, particularly opportunistic ones, for which he is now at risk.
Outpatient medications were prednisone at doses fluctuating between 10 and 20 mg daily, furosemide 20 mg daily, amiodarone 200 mg daily, levothyroxine 50 mcg daily, alendronate 70 mg weekly, eszopiclone 1 mg nightly, losartan 50 mg daily, and warfarin. The patient was an accomplished professor and had published a book 1 year prior to admission. He quit smoking over 30 years ago, and he occasionally drank wine. He denied any drug use.
Three months prior to the current presentation, the patient was hospitalized for right upper‐lobe pneumonia for which he received a course of doxycycline, and his symptoms improved. Follow‐up chest x‐ray, 4 weeks later (2 months prior to admission), showed only slight improvement of the right upper‐lobe opacity.
Leading possibilities for the persistent lung opacity are cancer and untreated infection. After 3 decades of being tobacco‐free, his smoking‐related risk of cancer is low, but remains above baseline population risk. There are at least 4 ways untreated lung cancer may render patients confused: direct metastases to the brain, carcinomatous or lymphomatous meningitis, paraneoplastic phenomenon (eg, limbic encephalitis), and metabolic derangements (eg, syndrome of inappropriate antidiuretic hormone secretion, hypercalcemia).
The upper‐lobe infiltrate that failed to improve with doxycycline could also reflect an aspiration pneumonia that evolved into an abscess, or an infection with mycobacteria or endemic fungi.
In the emergency department, the patient's temperature was 38.5C, blood pressure 139/56 mmHg, heart rate 92 beats per minute, respiratory rate 18 breaths per minute, and oxygen saturation while breathing ambient room air was 98%.
He was alert and well‐appearing. Jugular venous pressure was normal. The thyroid was normal. He had rhonchi in his right anterior upper chest and right lower lung base. Cardiac exam demonstrated a regular rhythm, with a 3/6 systolic murmur at the second right intercostal space that radiated to the carotids, and a 2/6 nonradiating holosystolic murmur at the apex. Abdomen was soft with no organomegaly or masses. There was no lymphadenopathy, and his extremities showed no clubbing or edema. There were multiple contusions in various stages of healing on his legs.
He was confused, had word‐finding difficulty, and frequently would lose his train of thought, stopping in mid‐sentence. He had no dysarthria. Cranial nerves were normal, except for reduced visual acuity and diminished pupillary response to light in his right pupil, which had been previously documented. Finger‐to‐nose testing was slow bilaterally, but was more sluggish on the right. Rapid alternating hand movements were intact. He was unable to perform heel‐to‐shin testing. Sensation was intact. Plantar reflexes were flexor bilaterally. Strength in his limbs was preserved both distally and proximally, and deep tendon reflexes were normal. However, he was unable to sit up or stand on his own due to weakness.
The fever on prednisone is a red flag for infection. The infection may be the primary diagnosis (eg, meningoencephalitis) or may reflect an additional superimposed insult (eg, urinary tract infection) on the underlying encephalopathy. Two murmurs in a febrile patient with the multifocal CNS findings suggest endocarditis. The abnormalities on chest examination could indicate a lung infection complicated by hematogenous spread to the brain, such as a lung abscess (secondary to the aspiration event), tuberculosis (TB), or endemic fungal infection.
Serum chemistries were normal, and the serum creatinine was 1.1 mg/dL. White blood cell count was 20,100 per mm3 with 90% neutrophils, 9% lymphocytes, and 1% monocytes. Hemoglobin was 13.7 g/dL, platelet count was 464,000 per mm3. Thyroid stimulating hormone (TSH) was 6.0 IU/mL (normal, 5.5). International normalized ratio (INR) was 2.2. Urinalysis was normal. Transaminases, bilirubin, and alkaline phosphatase were normal. Lactate was 1.9 mmol/L.
Electrocardiogram (EKG) was unchanged from his baseline. ESR was >120 mm/hr (the maximum reportable value); his ESR measurements had been gradually rising during the previous 4 months. Chest x‐ray demonstrated a right upper‐lobe opacity, slightly more pronounced in comparison with chest x‐ray 2 months earlier.
His fever, leukocytosis, elevated ESR, and thrombocytosis all reflect severe inflammation. While infection and then malignancy remain the primary considerations, a third category of inflammatory diseaseautoimmunitywarrants mention. For instance, Wegener's granulomatosis can cause pulmonary and CNS disease in the elderly.
Intravenous ceftriaxone and oral doxycycline were administered. Chest computed tomography (CT) (Figure 1) demonstrated dense right upper‐lobe mass‐like consolidation with associated adenopathy and pleural effusion; in addition, several nodules were present in the left and right lower lobes, the largest of which was 10 mm. CT of the chest 10 months prior to current admission had been normal. CT of the brain, performed without contrast, demonstrated multiple areas of abnormal vasogenic edema with suggestion of underlying masses.
The imaging provides evidence of a combined pulmonaryCNS syndrome. It is far more common for disease to originate in the lungs (a common portal of entry and environmental exposure) and spread to the brain than vice versa. The list of diseases and pathogens that affect the lungs and spread to the brain includes: primary lung cancer, lymphoma, bacteria, mycobacteria, fungi, molds (eg, Aspergillus), Wegener's granulomatosis, and lymphomatoid granulomatosis. Bacterial lung abscess, such as that caused by Streptococcus milleri group, may spread to the brain. Nocardia, a ubiquitous soil organism, infects immunocompromised patients and causes a similar pattern. Actinomycosis is an atypical infection that may mimic cancer, particularly in the lungs; while head and neck disease is characteristic, CNS involvement is less so. Overall, the imaging does not specifically pinpoint 1 entity, but infection remains heavily favored over malignancy, with autoimmunity a distant third.
Respiratory cultures showed normal respiratory flora. Blood cultures grew no organisms. Two samples of induced sputum were negative for acid‐fast bacilli (AFB) on smear examination. Forty‐eight hours after a purified protein derivative (PPD) skin test was placed, there was 0 mm of induration. Magnetic resonance imaging (MRI) of the brain (Figure 2) demonstrated 8 ring‐enhancing supratentorial lesions at the graywhite junction.
Negative blood cultures substantially lower the probability of bacterial endocarditis; there are no epidemiologic risk factors for the rare causes of culture‐negative endocarditis (eg, farm exposure, homelessness). Two negative smears for AFB with dense pulmonary or cavitary disease signify a low probability of tuberculosis.
In the setting of depressed cell‐mediated immunity (eg, human immunodeficiency virus [HIV] infection or chronic prednisone use), multiple ring‐enhancing CNS lesions are a classic appearance of toxoplasmosis, but they also are typical of bacterial brain abscesses and Nocardia. Brain metastases are usually solid, but as central necrosis develops, peripheral enhancement may appear. The diffuse distribution and the localization at the graywhite junction further support a hematogenously disseminated process, but do not differentiate infection from metastases.
Transthoracic echocardiogram demonstrated normal left ventricular ejection fraction, clinically insignificant aortic sclerosis and mitral regurgitation, and no evidence of vegetations. Results of a CT‐guided fine‐needle aspiration of the lung were nondiagnostic, showing necropurulent material and benign lung parenchyma with fibrosis. A core biopsy of the lung showed alveolar tissue with patchy mild deposition of fibrinous material and rare scattered acute and chronic inflammatory cells without granulomas. Pleural fluid cytology showed reactive mesothelial cells with mixed inflammatory cells. There were no fungal elements or malignant cells.
The failure to detect malignancy after 2 biopsies and 1 thoracentesis lowers the suspicion of cancer, and thereby bolsters the probability of atypical infections which may elude diagnosis on routine cultures and biopsy. A detailed history, with attention to geographic exposures, is warranted to see which endemic mycosis would put him most at risk. Based on his California residency, disseminated coccidiomycosis or the ubiquitous Cryptococcus are conceivable. Nocardia remains a strong consideration because of his chronic immunosuppression and the lung‐CNS pattern.
Fungal stains and cultures from the biopsies and pleural fluid were negative. Serum antibodies to coccidiomycosis and serum cryptococcal antigen tests were negative. On the eighth hospital day, the microbiology lab reported a few acid‐fast bacilli from a third induced sputum sample. RNA amplification testing for Mycobacterium tuberculosis was negative.
Due to his continued decline, the patient met with the palliative care team and expressed his desire to go home with hospice. While arrangements were being made, he died later that day in the hospital.
There is reasonable evidence that tuberculosis is not the culprit pathogen here: negative PPD, 2 negative sputa in the setting of a massive necrotic lesion, and a negative RNA amplification test. Nontuberculous mycobacteria such as Mycobacterium avium complex (MAC) and M. kansasii may cause disease similar to TB, but they are usually not this difficult to identify. Nocardia is classically a weakly acid‐fast positive bacteria and fits this patient's clinical picture best.
Four colonies of Nocardia (not further speciated) were identified postmortem from the patient's sputum.
DISCUSSION
Nocardia species are ubiquitous soil‐dwelling, Gram‐positive, branching rods which are weakly positive with acid‐fast staining.1 Almost all Nocardia infections occur in patients with immune systems compromised by chronic disease (HIV, malignancy, alcoholism, chronic lung or kidney disease) or by medications. Corticosteroid treatment is the most frequent risk factor. In cases of nocardiosis in patients taking steroids, the median daily prednisone dose was 25 mg (range, 1080 mg) for a median duration of 3 months.2, 3
Nocardia should be considered in any patient with unexplained pulmonary, CNS, or cutaneous disease and appropriate risk factors. Pulmonary disease is most common, seen in approximately two‐thirds of patients, and is typically bilateral. Chest radiographic findings include infiltrates (59%), nodules (35%), effusions, and cavities.2 Up to half of all cases of pulmonary nocardiosis are associated with hematogenous dissemination, most commonly to the CNS, where manifestations include incidentally discovered asymptomatic lesions, headache, confusion, and focal neurologic deficits; meningitis is rare.1 CNS involvement and severe predisposing illness are adverse prognostic markers.
Diagnosis of nocardiosis is typically delayed by 6 weeks to 1 year.4, 5 This has been attributed to its rarity, its nonspecific and indolent presentation, its slow growth, and the difficulty isolating Nocardia from clinical specimens. Although Nocardia may disseminate widely to almost any site, isolation of Nocardia from blood cultures is rare. Clinicians must rely on sputum or tissue samples to demonstrate the characteristic Gram‐positive rods which stain weakly on acid‐fast preparations. Polymerase chain reaction (PCR)‐based tests improve the yield but are not routinely available.
The standard antibiotic for the treatment of Nocardia infections is trimethoprim‐sulfamethoxazole (TMP‐SMX) which has excellent CNS penetration. In patients with pulmonary disease or CNS dissemination, a second parenteral antimicrobial (usually amikacin or imipenem) is typically added to TMP‐SMX, and treatment is extended to 12 months or longer.6, 7 Prophylaxis with TMP‐SMX, which is usually prescribed to prevent Pneumocystis jirovecii in susceptible hosts, also reduces the incidence of Nocardia.2, 3, 6 Nocardia's restricted susceptibility pattern presents a challenge for hospitalists, as TMP‐SMX and aminoglycosides are rarely administered empirically for cases of suspected pneumonia or atypical pulmonary infections (other than P. jirovecii).
When confronted with the pattern of simultaneous pulmonary and CNS lesions, hospitalists must consider infections (lung abscess, mycobacteria, fungi, Nocardia), malignancies, and autoimmune conditions (sarcoidosis, Wegener's granulomatosis). This patient's weakness was a direct result of his weakened immune system, which allowed this weakly acid‐fast organism to flourish. Only by recognizing the possibility of nocardiosis (eg, a patient receiving steroids who develops pulmonary and CNS lesions) is there hope for early diagnosis and treatment.
TEACHING POINTS
-
Suspect disseminated nocardiosis in immunocompromised patients with unexplained pulmonary disease and CNS disease characterized by multiple ring‐enhancing abscesses.
-
Corticosteroid treatment is the most common risk factor for Nocardia infections. Patients taking prednisone at doses in excess of 10 mg daily for greater than 3 months should receive P. jirovecii prophylaxis with TMP‐SMX, which also reduces the incidence of Nocardia.
-
Prolonged courses of TMP‐SMX combined with at least 1 other agent for at least 612 months are typically required to treat disseminated Nocardia.
Acknowledgements
Disclosure: Dr Thomas E. Baudendistel is a former Deputy Editor at the Journal of Hospital Medicine and received a stipend for this work.
- ,.Nocardia species: host‐parasite relationships.Clin Microbiol Rev.1994;7:213–264.
- ,,,,,.Nocardiosis at the turn of the century.Medicine (Baltimore).2009;88:250–261.
- ,.A case series and focused review of nocardiosis: clinical and microbiologic aspects.Medicine (Baltimore).2004;83:300–313.
- ,,, et al.Pulmonary nocardiosis: risk factors and outcomes.Respirology.2007;12:394–400.
- ,.Infection with Nocardia species in Queensland. A review of 102 clinical isolates.Med J Aust.1992;156:692–697.
- .Nocardia in solid organ transplant recipients.Am J Transplant.2009;9:S70–S77.
- .Nocardiosis.Clin Infect Dis.1996;22:891–905.
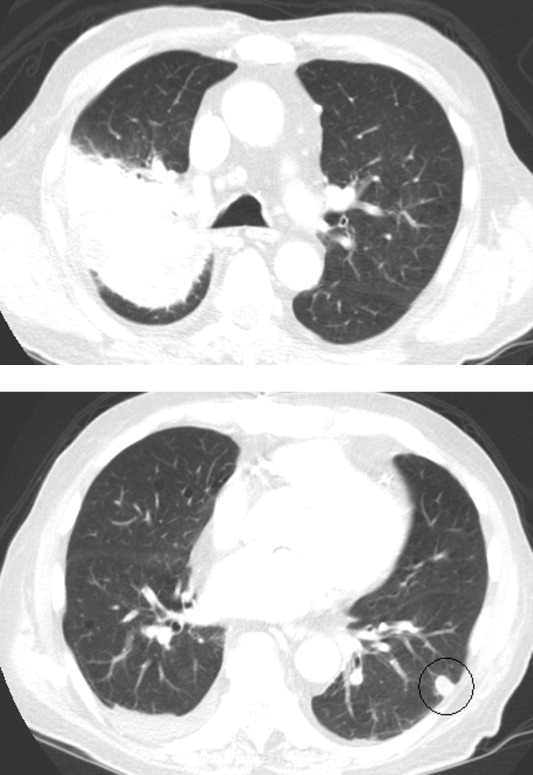
Rounding up the usual suspects
A 76‐year‐old white male presented to his primary care physician with a 40‐pound weight loss and gradual decline in function over the prior 6 months. In addition, over the previous 2 months, he had begun to suffer a constant, non‐bloody, and non‐productive cough accompanied by night sweats. Associated complaints included a decline in physical activity, increased sleep needs, decreased appetite, irritability, and generalized body aches.
The patient, an elderly man, presents with a subacute, progressive systemic illness, which appears to have a pulmonary component. Broad disease categories meriting consideration include infections such as tuberculosis, endemic fungi, and infectious endocarditis; malignancies including bronchogenic carcinoma, as well as a variety of other neoplasms; and rheumatologic conditions including temporal arteritis/polymyalgia rheumatica and Wegener's granulomatosis. His complaints of anhedonia, somnolence, and irritability, while decidedly nonspecific, raise the possibility of central nervous system involvement.
His past medical history was notable for coronary artery disease, moderate aortic stenosis, hypertension, hyperlipidemia, and chronic sinusitis. Two years ago, he had unexplained kidney failure. Anti‐neutrophilic cytoplasmic antibodies (ANCA) were present, and indirect immunoflorescence revealed a peri‐nuclear (P‐ANCA) pattern on kidney biopsy. The patient had been empirically placed on azathioprine for presumed focal segmental glomerulosclerosis (FSGS), and his renal function remained stable at an estimated glomerular filtrate rate ranging from 15 to 30 mL/min/1.73 m2. His other medications included nifedipine, metoprolol, aspirin, isosorbide mononitrate, atorvastatin, calcitriol, and docusate. His family and social histories were unremarkable, including no history of tobacco. He had no pets and denied illicit drug use. He admitted to spending a considerable amount of time gardening, including working in his yard in bare feet.
The associations of focal segmental glomerulosclerosis, if indeed this diagnosis is correct, include lupus, vasculitis, and human immunodeficiency virus (HIV) infection. The nephrotic syndrome is a frequent manifestation of this entity, although, based on limited information, this patient does not appear to be clinically nephrotic. If possible, the biopsy pathology should be reviewed by a pathologist with interest in the kidney. The report of a positive P‐ANCA may not be particularly helpful here, given the frequency of false‐positive results, and in any event, P‐ANCAs have been associated with a host of conditions other than vasculitis.
The patient's gardening exposure, in bare feet no less, is intriguing. This potentially places him at risk for fungal infections including blastomycosis, histoplasmosis, cryptococcosis, and sporotrichosis. Gardening without shoes is a somewhat different enterprise in northeast Ohio than, say, Mississippi, and it will be helpful to know where this took place. Exposure in Appalachia or the South should prompt consideration of disseminated strongyloidiasis, given his azathioprine use.
Vital signs were as follows: blood pressure 151/76 mmHg, pulse 67 beats per minute, respiratory rate 20 breaths per minute, temperature 35.6C, and oxygen saturation 98% on room air. On examination, he appeared very thin but not in distress. Examination of the skin did not reveal rashes or lesions, and there was no lymphadenopathy. His thyroid was symmetric and normal in size. Lungs were clear to auscultation, and cardiac exam revealed a regular rate with a previously documented III/VI holosystolic murmur over the aortic auscultatory area. Abdominal exam revealed no organomegaly or tenderness. Joints were noted to be non‐inflamed, and extremities non‐edematous. Radial, brachial, popliteal, and dorsalis pedis pulses were normal bilaterally. A neurological exam revealed no focal deficits.
The physical examination does not help to substantively narrow or redirect the differential diagnosis. Although he appears to be tachypneic, this may simply reflect charting artifact. At this point, I would like to proceed with a number of basic diagnostic studies. In addition to complete blood count with differential, chemistries, and liver function panel, I would also obtain a thyroid stimulating hormone (TSH) assay, urinalysis, blood cultures, erythrocyte sedimentation rate/C‐reactive protein, a HIV enzyme‐linked immunosorbent assay (ELISA), chest radiograph, and a repeat ANCA panel. A purified protein derivative (PPD) skin test should be placed.
Blood chemistries were as follows: glucose 88 mg/dL, blood urea nitrogen (BUN) 48 mg/dL, creatinine 2.71 mg/dL, sodium 139 mmol/L, potassium 5.5 mmol/L, chloride 103 mmol/L, CO2 28 mmol/L, and anion gap 8 mmol/L. TSH, urinalysis, and PPD tests were unremarkable. His white blood cell count (WBC) was 33.62 K/L with 94% eosinophils and an absolute eosinophil count of 31.6 K/L. His platelet count was 189 K/L, hemoglobin 12.1 g/dL, and hematocrit 36.9%. A chest x‐ray revealed reticular opacities in the mid‐to‐lower lungs, and subsequent computed tomography (CT) scan of the chest demonstrated multiple bilateral indeterminate nodules and right axillary adenopathy.
The patient's strikingly elevated absolute eosinophil count is a very important clue that helps to significantly focus the diagnostic possibilities. In general, an eosinophilia this pronounced signifies one of several possibilities, including primary hypereosinophilic syndrome, ChurgStrauss syndrome, parasitic infection with an active tissue migration phase, eosinophilic leukemia, and perhaps chronic eosinophilic pneumonia. In addition, Wegener's granulomatosis still merits consideration, although an eosinophil count this high would certainly be unusual.
Of the above possibilities, ChurgStrauss seems less likely given his apparent absence of a history of asthma. Parasitic infections, particularly ascariasis but also strongyloidiasis, hookworm, and even visceral larva migrans are possible, although we have not been told whether geographical exposure exists to support the first 3 of these. Hypereosinophilic syndrome remains a strong consideration, although the patient does not yet clearly meet criteria for this diagnosis.
At this juncture, I would send stool and sputum for ova and parasite exam, and order Strongyloides serology, have the peripheral smear reviewed by a pathologist, await the repeat ANCA studies, and consider obtaining hematology consultation.
Tests for anti‐Smith, anti‐ribonuclear (RNP), anti‐SSA, anti‐SSB, anti‐centromere, anti‐Scl 70, and anti‐Jo antibodies were negative. Repeat ANCA testing was positive with P‐ANCA pattern on indirect immunofluorescence. His erythrocyte sedimentation rate and C‐reactive Protein (CRP) were mildly elevated at 29 mm/hr and 1.1 mg/dL, respectively. An immunodeficiency panel work‐up consisting of CD3, CD4, CD8, CD19, T‐cell, B‐cell, and natural killer (NK) cell differential counts demonstrated CD8 T‐cell depletion. Blood cultures demonstrated no growth at 72 hours. No definite M protein was identified on serum and urine protein electrophoresis. Strongyloides IgG was negative. HIV ELISA was negative. A serologic fungal battery to measure antibodies against Aspergillus, Blastomyces, Histoplasma, and Coccidiodes was negative. A microscopic examination of stool and sputum for ova and parasites was also negative. A peripheral blood smear showed anisocytosis and confirmed the elevated eosinophil count.
The preceding wealth of information helps to further refine the picture. The positive P‐ANCA by ELISA as well as immunofluorescence suggests this is a real phenomenon, and makes ChurgStrauss syndrome more likely, despite the absence of preceding or concurrent asthma. I am not aware of an association between P‐ANCA and hypereosinophilic syndrome, nor of a similar link to either chronic eosinophilic pneumonia or hematological malignancies. Although I would like to see 2 additional stool studies for ova and parasites performed by an experienced laboratory technician before discarding the diagnosis of parasitic infection entirely, I am increasingly suspicious that this patient has a prednisone‐deficient state, most likely ChurgStrauss syndrome. I am uncertain of the relationship between his more recent symptoms and his pre‐existing kidney disease, but proceeding to lung biopsy appears to be appropriate.
Bronchoscopic examination with accompanying bronchoalveolar lavage (BAL) and transbronchial biopsy were performed. The BAL showed many Aspergillus fumigatus as well as hemosiderin‐laden macrophages, and the biopsy demonstrated an eosinophilic infiltrate throughout the interstitia, alveolar spaces, and bronchiolar walls. However, the airways did not show features of asthma, capillaritis, vasculitis, or granulomas. A bone marrow biopsy showed no evidence of clonal hematologic disease.
The Aspergillus recovered from BAL, although unexpected, probably does not adequately explain the picture. I am not convinced that the patient has invasive aspergillosis, and although components of the case are consistent with allergic bronchopulmonary aspergillosis, the absence of an asthma history and the extreme degree of peripheral eosinophilia seem to speak against this diagnosis. The biopsy does not corroborate a vasculitic process, but the yield of transbronchial biopsy is relatively low in this setting, and the pulmonary vasculitides remain in play unless a more substantial biopsy specimen is obtained. It is worth noting that high‐dose corticosteroids are a risk factor for the conversion of Aspergillus colonization to invasive aspergillosis, and treatment with voriconazole would certainly be appropriate if prednisone was to be initiated.
I believe ChurgStrauss syndrome, hypereosinophilic syndrome, and chronic eosinophilic pneumonia remain the leading diagnostic possibilities, with the P‐ANCA likely serving as a red herring if the diagnosis turns out to be one of the latter entities. An open lung biopsy would be an appropriate next step, after first obtaining those additional ova and parasite exams for completeness.
An infectious diseases specialist recommended that the patient be discharged on voriconazole 300 mg PO bid for Aspergillus colonization with an underlying lung disease and likely allergic bronchopulmonary aspergillosis or invasive aspergillosis. Steroid therapy was contemplated but not initiated.
Three weeks later, the patient re‐presented with worsening of fatigue and cognitive deterioration marked by episodes of confusion and word‐finding difficulties. His WBC had increased to 45.67 K/L (94% eosinophils). He had now lost a total of 70 pounds, and an increase in generalized weakness was apparent. His blood pressure on presentation was 120/63 mmHg, pulse rate 75 beats per minute, respiratory rate 18 breaths per minute, temperature 35.8C, and oxygen saturation 97% on room air. He appeared cachectic, but not in overt distress. His skin, head, neck, chest, cardiac, abdominal, peripheral vascular, and neurological exam demonstrated no change from the last admission. A follow‐up chest x‐ray showed mild pulmonary edema and new poorly defined pulmonary nodules in the right upper lobe. A repeat CT scan of the thorax demonstrated interval progression of ground‐glass attenuation nodules, which were now more solid‐appearing and increased in number, and present in all lobes of the lung. A CT of the brain did not reveal acute processes such as intracranial hemorrhage, infarction, or mass lesions. Lumbar puncture was performed, with a normal opening pressure. Analysis of the clear and colorless cerebrospinal fluid (CSF) showed 1 red blood cell count (RBC)/L, 2 WBC/L with 92% lymphocytes, glucose 68 mg/dL, and protein 39 mg/dL. CSF fungal cultures, routine cultures, venereal disease reaction level (VDRL), and cryptococcal antigen were negative. CSF cytology did not demonstrate malignant cells. Multiple ova and parasite exams obtained from the previous admission were confirmed to be negative.
The patient's continued deterioration points to either ChurgStrauss syndrome or hypereosinophilic syndrome, I believe. His renal function and P‐ANCA (if related) support the former possibility, while the development of what now appear to be clear encephalopathic symptoms are more in favor of the latter. I would initiate steroid therapy while proceeding to an open lung biopsy in an effort to secure a definitive diagnosis, again under the cover of voriconazole, and would ask for hematology input if this had not already been obtained.
A video‐assisted right thoracoscopy with wedge resection of 2 visible nodules in the right lower lobe was performed. The biopsy conclusively diagnosed a peripheral T‐cell lymphoma. The patient's condition deteriorated, and ultimately he and his family chose a palliative approach.
COMMENTARY
Eosinophils are cells of myeloid lineage that contain cationic‐rich protein granules that mediate allergic response, reaction to parasitic infections, tissue inflammation, and immune modulation.1, 2 Eosinophilia (absolute eosinophil count 600 cells/L) suggests the possibility of a wide array of disorders. The degree of eosinophilia can be categorized as mild (6001500 cells/L), moderate (15005000 cells/L), or severe (>5000 cells/L).3 It may signify a reactive phenomenon (secondary) or, less commonly, either an underlying hematological neoplasm (primary) or an idiopathic process.2 Clinicians faced with an unexplained eosinophilia should seek the most frequent causes first.
Initial investigation should include a careful travel history; consideration of both prescription and over‐the‐counter medications, especially non‐steroidal anti‐inflammatory drugs (NSAIDs), with withdrawal of non‐essential agents; serology for Strongyloides stercoralis antibodies (and possibly other helminths, depending on potential exposure) should be assessed; and stool examinations for ova and parasites should be obtained. The possibility of a wide variety of other potential causes of eosinophilia (Table 1) should be entertained,413 and a careful search for end‐organ damage related to eosinophilic infiltration should be performed if eosinophilia is moderate or severe.1
| Differential Diagnoses | Comments |
|---|---|
| Asthma and common allergic diseases (atopic dermatitis, allergic rhinitis) | Levels >1500 cell/l are uncommon |
| Paraneoplastic eosinophilia | Associated with adenocarcinomas, Hodgkin disease, T‐cell lymphomas, and systemic mastocytosis |
| Drugs and drug‐associated eosinophilic syndromes | Commonly associated with antibiotics (especially B‐lactams) and anti‐epileptic drugs |
| Immunodeficiency disorders | Hyper‐IgE syndrome and Omenn syndrome are rare causes of eosinophilia |
| Adrenal insufficiency | Important consideration in the critical care setting because endogenous glucocorticoids are involved in the stimulation of eosinophil apoptosis |
| Organ‐specific eosinophilic disorders | Examples: acute and chronic eosinophilic pneumonia, gastrointestinal eosinophilic disorders (esophagitis, colitis) |
| Primary eosinophilia: clonal or idiopathic | Clonal eosinophilia has histologic, cytogenetic, or molecular evidence of an underlying myeloid malignancy |
| Helminthic infections | An active tissue migration phase may manifest with hypereosinophilia |
| Hypereosinophilic syndrome | Classic criteria: hypereosinophilia for at least 6 mo, exclusion of both secondary and clonal eosinophilia, and evidence of organ involvement |
| ChurgStrauss syndrome | Hypereosinophilia with asthma, systemic vasculitis, migratory pulmonary infiltrates, sinusitis, and extravascular eosinophils |
| Allergic bronchopulmonary aspergillosis (ABPA) | Major criteria: history of asthma, central bronchiectasis, immediate skin reactivity to Aspergillus, elevated total serum IgE (>1000 ng/mL), elevated IgE or IgG to Aspergillus |
Hypereosinophilia is defined as an eosinophil level greater than 1500 cells/L. These levels may be associated with end‐organ damage regardless of the underlying etiology, although the degree of eosinophilia frequently does not correlate closely with eosinophilic tissue infiltration. As a result, relatively modest degrees of peripheral eosinophilia may be seen in association with end‐organ damage, while severe eosinophilia may be tolerated well for prolonged periods in other cases.1 The most serious complications of hypereosinophilia are myocardial damage with ultimate development of cardiac fibrosis and refractory heart failure; pulmonary involvement with hypoxia; and involvement of both the central and peripheral nervous systems including stroke, encephalopathy, and mononeuritis multiplex. A number of studies should be considered to help evaluate for the possibility of end‐organ damage as well as to assess for the presence of primary and idiopathic causes of hypereosinophilia. These include peripheral blood smear looking particularly for dysplastic eosinophils or blasts, serum tryptase, serum vitamin B12, serum IgE, cardiac troponin levels, anti‐neutrophil cytoplasmic antibody, electrocardiography, echocardiography, pulmonary function tests, and thoracoabdominal CT scanning. Endoscopic studies with esophageal, duodenal, and colonic biopsy should be performed if eosinophilic gastroenteritis is suspected.1, 7, 10
While more modest degrees of eosinophilia are associated with a plethora of conditions, severe eosinophilia, especially that approaching the levels displayed by this patient, suggests a much more circumscribed differential diagnosis. This should prompt consideration of ChurgStrauss syndrome, parasitic infection with an active tissue migration phase, and hypereosinophilic syndrome (HES).4 HES has classically been characterized by hypereosinophilia for at least 6 months, exclusion of both secondary and clonal eosinophilia, and evidence of end‐organ involvement. More recently, however, a revised definition consisting of marked eosinophilia with reasonable exclusion of other causes has gained favor.1, 7, 10, 1416 While perhaps as many as 75% of cases of HES continue to be considered idiopathic at present, 2 subtypes have now been recognized, with important prognostic and therapeutic implications. Myeloproliferative HES has a strong male predominance, is frequently associated with elevated serum tryptase and B12 levels, often manifests with hepatosplenomegaly, and displays a characteristic gene mutation, FIP1L1/PDGFRA. Lymphocytic HES is typified by polyclonal eosinophilic expansion in response to elevated IL‐5 levels, is associated with less cardiac involvement and a somewhat more favorable prognosis in the absence of therapy, and has been associated with transformation into T‐cell lymphoma.1, 1417 We suspect, though we are unable to prove, that our patient was finally diagnosed at the end of a journey that began as lymphocytic HES and ultimately progressed to T‐cell lymphoma. T‐cell lymphoma has rarely been associated with profound eosinophilia. This appears to reflect disordered production of IL‐5, as was true of this patient, and many of these cases may represent transformed lymphocytic HES.14
Specific therapy exists for the myeloproliferative subtype of HES, consisting of the tyrosine kinase inhibitor imatinib, with excellent response in typical cases. Initial treatment of most other extreme eosinophilic syndromes not caused by parasitic infection, including lymphocytic and idiopathic HES as well as ChurgStrauss syndrome, consists of high‐dose corticosteroids, with a variety of other agents used as second‐line and steroid‐sparing treatments. The urgency of therapy is dictated by the presence and severity of end‐organ damage, and in some instances corticosteroids may need to be given before the diagnosis is fully secure. When S. stercoralis infection has not been ruled out, concurrent therapy with ivermectin should be given to prevent triggering Strongyloides hyperinfection. Hematology input is critical when HES is under serious consideration, with bone marrow examination, cytogenetic studies, T‐cell phenotyping and T‐cell receptor rearrangement studies essential in helping to establish the correct diagnosis.10, 17
The differential diagnosis of peripheral eosinophilia is broad and requires a thorough, stepwise approach. Although profound eosinophilia is usually caused by a limited number of diseases, this patient reminds us that Captain Renault's advice in the film Casablanca to round up the usual suspects does not always suffice, as the diagnosis of T‐cell lymphoma was not considered by either the clinicians or the discussant until lung biopsy results became available. Most patients with hypereosinophilia not caused by parasitic infection will ultimately require an invasive procedure to establish a diagnosis, which is essential before embarking on an often‐toxic course of therapy, as well as for providing an accurate prognosis.
TEACHING POINTS
-
The most common causes of eosinophilia include helminthic infections (the leading cause worldwide), asthma, allergic conditions (the leading cause in the United States), malignancies, and drugs.
-
Hypereosinophilia may lead to end‐organ damage. The most important etiologies include ChurgStrauss Syndrome, HES, or a helminthic infection in the larval migration phase.
-
The mainstay of therapy for most cases of HES is corticosteroids. The goal of therapy is to prevent, or ameliorate, end‐organ damage.
- ,.Practical approach to the patient with hypereosinophilia.J Allergy Clin Immunol.2010;126(1):39–44.
- ,,.Eosinophilia: secondary, clonal and idiopathic.Br J Haematol.2006;133(5):468–492.
- .Blood eosinophilia: a new paradigm in disease classification, diagnosis, and treatment.Mayo Clin Proc.2005;80(1):75–83.
- ,,,.Clinical manifestations and treatment of Churg‐Strauss syndrome.Rheum Dis Clin North Am.2010;36(3):527–543.
- ,,,.Relative eosinophilia and functional adrenal insufficiency in critically ill patients.Lancet.1999;353(9165):1675–1676.
- ,,,.Opposing effects of glucocorticoids on the rate of apoptosis in neutrophilic and eosinophilic granulocytes.J Immunol.1996;156(10):4422–4428.
- ,.Eosinophilic disorders.J Allergy Clin Immunol.2007;119(6):1291–1300; quiz 1301–1302.
- ,.Pulmonary eosinophilia.Clin Rev Allergy Immunol.2008;34(3):367–371.
- .Eosinophilic diseases of the gastrointestinal tract.Scand J Gastroenterol.2010;45(9):1013–1021.
- ,,.Hypereosinophilic syndrome and clonal eosinophilia: point‐of‐care diagnostic algorithm and treatment update.Mayo Clin Proc.2010;85(2):158–164.
- ,,,,,.Eosinophilia as a predictor of food allergy in atopic dermatitis.Allergy Asthma Proc.2010;31(2):e18–e24.
- ,,, et al.The American College of Rheumatology 1990 criteria for the classification of Churg‐Strauss syndrome (allergic granulomatosis and angiitis).Arthritis Rheum.1990;33(8):1094–1100.
- .Allergic bronchopulmonary aspergillosis. In: Adkinson NF, Yunginger JW, Busse WW, et al, eds. Middleton's Allergy Principles 2003:1353–1371.
- ,,, et al.TARC and IL‐5 expression correlates with tissue eosinophilia in peripheral T‐cell lymphomas.Leuk Res.2008;32(9):1431–1438.
- ,,.Hypereosinophilic syndrome and proliferative diseases.Acta Dermatovenerol Croat.2009;17(4):323–330.
- ,.The hypereosinophilic syndromes: current concepts and treatments.Br J Haematol.2009;145(3):271–285.
- ,,.Lymphocytic variant hypereosinophilic syndromes.Immunol Allergy Clin North Am.2007;27(3):389–413.
A 76‐year‐old white male presented to his primary care physician with a 40‐pound weight loss and gradual decline in function over the prior 6 months. In addition, over the previous 2 months, he had begun to suffer a constant, non‐bloody, and non‐productive cough accompanied by night sweats. Associated complaints included a decline in physical activity, increased sleep needs, decreased appetite, irritability, and generalized body aches.
The patient, an elderly man, presents with a subacute, progressive systemic illness, which appears to have a pulmonary component. Broad disease categories meriting consideration include infections such as tuberculosis, endemic fungi, and infectious endocarditis; malignancies including bronchogenic carcinoma, as well as a variety of other neoplasms; and rheumatologic conditions including temporal arteritis/polymyalgia rheumatica and Wegener's granulomatosis. His complaints of anhedonia, somnolence, and irritability, while decidedly nonspecific, raise the possibility of central nervous system involvement.
His past medical history was notable for coronary artery disease, moderate aortic stenosis, hypertension, hyperlipidemia, and chronic sinusitis. Two years ago, he had unexplained kidney failure. Anti‐neutrophilic cytoplasmic antibodies (ANCA) were present, and indirect immunoflorescence revealed a peri‐nuclear (P‐ANCA) pattern on kidney biopsy. The patient had been empirically placed on azathioprine for presumed focal segmental glomerulosclerosis (FSGS), and his renal function remained stable at an estimated glomerular filtrate rate ranging from 15 to 30 mL/min/1.73 m2. His other medications included nifedipine, metoprolol, aspirin, isosorbide mononitrate, atorvastatin, calcitriol, and docusate. His family and social histories were unremarkable, including no history of tobacco. He had no pets and denied illicit drug use. He admitted to spending a considerable amount of time gardening, including working in his yard in bare feet.
The associations of focal segmental glomerulosclerosis, if indeed this diagnosis is correct, include lupus, vasculitis, and human immunodeficiency virus (HIV) infection. The nephrotic syndrome is a frequent manifestation of this entity, although, based on limited information, this patient does not appear to be clinically nephrotic. If possible, the biopsy pathology should be reviewed by a pathologist with interest in the kidney. The report of a positive P‐ANCA may not be particularly helpful here, given the frequency of false‐positive results, and in any event, P‐ANCAs have been associated with a host of conditions other than vasculitis.
The patient's gardening exposure, in bare feet no less, is intriguing. This potentially places him at risk for fungal infections including blastomycosis, histoplasmosis, cryptococcosis, and sporotrichosis. Gardening without shoes is a somewhat different enterprise in northeast Ohio than, say, Mississippi, and it will be helpful to know where this took place. Exposure in Appalachia or the South should prompt consideration of disseminated strongyloidiasis, given his azathioprine use.
Vital signs were as follows: blood pressure 151/76 mmHg, pulse 67 beats per minute, respiratory rate 20 breaths per minute, temperature 35.6C, and oxygen saturation 98% on room air. On examination, he appeared very thin but not in distress. Examination of the skin did not reveal rashes or lesions, and there was no lymphadenopathy. His thyroid was symmetric and normal in size. Lungs were clear to auscultation, and cardiac exam revealed a regular rate with a previously documented III/VI holosystolic murmur over the aortic auscultatory area. Abdominal exam revealed no organomegaly or tenderness. Joints were noted to be non‐inflamed, and extremities non‐edematous. Radial, brachial, popliteal, and dorsalis pedis pulses were normal bilaterally. A neurological exam revealed no focal deficits.
The physical examination does not help to substantively narrow or redirect the differential diagnosis. Although he appears to be tachypneic, this may simply reflect charting artifact. At this point, I would like to proceed with a number of basic diagnostic studies. In addition to complete blood count with differential, chemistries, and liver function panel, I would also obtain a thyroid stimulating hormone (TSH) assay, urinalysis, blood cultures, erythrocyte sedimentation rate/C‐reactive protein, a HIV enzyme‐linked immunosorbent assay (ELISA), chest radiograph, and a repeat ANCA panel. A purified protein derivative (PPD) skin test should be placed.
Blood chemistries were as follows: glucose 88 mg/dL, blood urea nitrogen (BUN) 48 mg/dL, creatinine 2.71 mg/dL, sodium 139 mmol/L, potassium 5.5 mmol/L, chloride 103 mmol/L, CO2 28 mmol/L, and anion gap 8 mmol/L. TSH, urinalysis, and PPD tests were unremarkable. His white blood cell count (WBC) was 33.62 K/L with 94% eosinophils and an absolute eosinophil count of 31.6 K/L. His platelet count was 189 K/L, hemoglobin 12.1 g/dL, and hematocrit 36.9%. A chest x‐ray revealed reticular opacities in the mid‐to‐lower lungs, and subsequent computed tomography (CT) scan of the chest demonstrated multiple bilateral indeterminate nodules and right axillary adenopathy.
The patient's strikingly elevated absolute eosinophil count is a very important clue that helps to significantly focus the diagnostic possibilities. In general, an eosinophilia this pronounced signifies one of several possibilities, including primary hypereosinophilic syndrome, ChurgStrauss syndrome, parasitic infection with an active tissue migration phase, eosinophilic leukemia, and perhaps chronic eosinophilic pneumonia. In addition, Wegener's granulomatosis still merits consideration, although an eosinophil count this high would certainly be unusual.
Of the above possibilities, ChurgStrauss seems less likely given his apparent absence of a history of asthma. Parasitic infections, particularly ascariasis but also strongyloidiasis, hookworm, and even visceral larva migrans are possible, although we have not been told whether geographical exposure exists to support the first 3 of these. Hypereosinophilic syndrome remains a strong consideration, although the patient does not yet clearly meet criteria for this diagnosis.
At this juncture, I would send stool and sputum for ova and parasite exam, and order Strongyloides serology, have the peripheral smear reviewed by a pathologist, await the repeat ANCA studies, and consider obtaining hematology consultation.
Tests for anti‐Smith, anti‐ribonuclear (RNP), anti‐SSA, anti‐SSB, anti‐centromere, anti‐Scl 70, and anti‐Jo antibodies were negative. Repeat ANCA testing was positive with P‐ANCA pattern on indirect immunofluorescence. His erythrocyte sedimentation rate and C‐reactive Protein (CRP) were mildly elevated at 29 mm/hr and 1.1 mg/dL, respectively. An immunodeficiency panel work‐up consisting of CD3, CD4, CD8, CD19, T‐cell, B‐cell, and natural killer (NK) cell differential counts demonstrated CD8 T‐cell depletion. Blood cultures demonstrated no growth at 72 hours. No definite M protein was identified on serum and urine protein electrophoresis. Strongyloides IgG was negative. HIV ELISA was negative. A serologic fungal battery to measure antibodies against Aspergillus, Blastomyces, Histoplasma, and Coccidiodes was negative. A microscopic examination of stool and sputum for ova and parasites was also negative. A peripheral blood smear showed anisocytosis and confirmed the elevated eosinophil count.
The preceding wealth of information helps to further refine the picture. The positive P‐ANCA by ELISA as well as immunofluorescence suggests this is a real phenomenon, and makes ChurgStrauss syndrome more likely, despite the absence of preceding or concurrent asthma. I am not aware of an association between P‐ANCA and hypereosinophilic syndrome, nor of a similar link to either chronic eosinophilic pneumonia or hematological malignancies. Although I would like to see 2 additional stool studies for ova and parasites performed by an experienced laboratory technician before discarding the diagnosis of parasitic infection entirely, I am increasingly suspicious that this patient has a prednisone‐deficient state, most likely ChurgStrauss syndrome. I am uncertain of the relationship between his more recent symptoms and his pre‐existing kidney disease, but proceeding to lung biopsy appears to be appropriate.
Bronchoscopic examination with accompanying bronchoalveolar lavage (BAL) and transbronchial biopsy were performed. The BAL showed many Aspergillus fumigatus as well as hemosiderin‐laden macrophages, and the biopsy demonstrated an eosinophilic infiltrate throughout the interstitia, alveolar spaces, and bronchiolar walls. However, the airways did not show features of asthma, capillaritis, vasculitis, or granulomas. A bone marrow biopsy showed no evidence of clonal hematologic disease.
The Aspergillus recovered from BAL, although unexpected, probably does not adequately explain the picture. I am not convinced that the patient has invasive aspergillosis, and although components of the case are consistent with allergic bronchopulmonary aspergillosis, the absence of an asthma history and the extreme degree of peripheral eosinophilia seem to speak against this diagnosis. The biopsy does not corroborate a vasculitic process, but the yield of transbronchial biopsy is relatively low in this setting, and the pulmonary vasculitides remain in play unless a more substantial biopsy specimen is obtained. It is worth noting that high‐dose corticosteroids are a risk factor for the conversion of Aspergillus colonization to invasive aspergillosis, and treatment with voriconazole would certainly be appropriate if prednisone was to be initiated.
I believe ChurgStrauss syndrome, hypereosinophilic syndrome, and chronic eosinophilic pneumonia remain the leading diagnostic possibilities, with the P‐ANCA likely serving as a red herring if the diagnosis turns out to be one of the latter entities. An open lung biopsy would be an appropriate next step, after first obtaining those additional ova and parasite exams for completeness.
An infectious diseases specialist recommended that the patient be discharged on voriconazole 300 mg PO bid for Aspergillus colonization with an underlying lung disease and likely allergic bronchopulmonary aspergillosis or invasive aspergillosis. Steroid therapy was contemplated but not initiated.
Three weeks later, the patient re‐presented with worsening of fatigue and cognitive deterioration marked by episodes of confusion and word‐finding difficulties. His WBC had increased to 45.67 K/L (94% eosinophils). He had now lost a total of 70 pounds, and an increase in generalized weakness was apparent. His blood pressure on presentation was 120/63 mmHg, pulse rate 75 beats per minute, respiratory rate 18 breaths per minute, temperature 35.8C, and oxygen saturation 97% on room air. He appeared cachectic, but not in overt distress. His skin, head, neck, chest, cardiac, abdominal, peripheral vascular, and neurological exam demonstrated no change from the last admission. A follow‐up chest x‐ray showed mild pulmonary edema and new poorly defined pulmonary nodules in the right upper lobe. A repeat CT scan of the thorax demonstrated interval progression of ground‐glass attenuation nodules, which were now more solid‐appearing and increased in number, and present in all lobes of the lung. A CT of the brain did not reveal acute processes such as intracranial hemorrhage, infarction, or mass lesions. Lumbar puncture was performed, with a normal opening pressure. Analysis of the clear and colorless cerebrospinal fluid (CSF) showed 1 red blood cell count (RBC)/L, 2 WBC/L with 92% lymphocytes, glucose 68 mg/dL, and protein 39 mg/dL. CSF fungal cultures, routine cultures, venereal disease reaction level (VDRL), and cryptococcal antigen were negative. CSF cytology did not demonstrate malignant cells. Multiple ova and parasite exams obtained from the previous admission were confirmed to be negative.
The patient's continued deterioration points to either ChurgStrauss syndrome or hypereosinophilic syndrome, I believe. His renal function and P‐ANCA (if related) support the former possibility, while the development of what now appear to be clear encephalopathic symptoms are more in favor of the latter. I would initiate steroid therapy while proceeding to an open lung biopsy in an effort to secure a definitive diagnosis, again under the cover of voriconazole, and would ask for hematology input if this had not already been obtained.
A video‐assisted right thoracoscopy with wedge resection of 2 visible nodules in the right lower lobe was performed. The biopsy conclusively diagnosed a peripheral T‐cell lymphoma. The patient's condition deteriorated, and ultimately he and his family chose a palliative approach.
COMMENTARY
Eosinophils are cells of myeloid lineage that contain cationic‐rich protein granules that mediate allergic response, reaction to parasitic infections, tissue inflammation, and immune modulation.1, 2 Eosinophilia (absolute eosinophil count 600 cells/L) suggests the possibility of a wide array of disorders. The degree of eosinophilia can be categorized as mild (6001500 cells/L), moderate (15005000 cells/L), or severe (>5000 cells/L).3 It may signify a reactive phenomenon (secondary) or, less commonly, either an underlying hematological neoplasm (primary) or an idiopathic process.2 Clinicians faced with an unexplained eosinophilia should seek the most frequent causes first.
Initial investigation should include a careful travel history; consideration of both prescription and over‐the‐counter medications, especially non‐steroidal anti‐inflammatory drugs (NSAIDs), with withdrawal of non‐essential agents; serology for Strongyloides stercoralis antibodies (and possibly other helminths, depending on potential exposure) should be assessed; and stool examinations for ova and parasites should be obtained. The possibility of a wide variety of other potential causes of eosinophilia (Table 1) should be entertained,413 and a careful search for end‐organ damage related to eosinophilic infiltration should be performed if eosinophilia is moderate or severe.1
| Differential Diagnoses | Comments |
|---|---|
| Asthma and common allergic diseases (atopic dermatitis, allergic rhinitis) | Levels >1500 cell/l are uncommon |
| Paraneoplastic eosinophilia | Associated with adenocarcinomas, Hodgkin disease, T‐cell lymphomas, and systemic mastocytosis |
| Drugs and drug‐associated eosinophilic syndromes | Commonly associated with antibiotics (especially B‐lactams) and anti‐epileptic drugs |
| Immunodeficiency disorders | Hyper‐IgE syndrome and Omenn syndrome are rare causes of eosinophilia |
| Adrenal insufficiency | Important consideration in the critical care setting because endogenous glucocorticoids are involved in the stimulation of eosinophil apoptosis |
| Organ‐specific eosinophilic disorders | Examples: acute and chronic eosinophilic pneumonia, gastrointestinal eosinophilic disorders (esophagitis, colitis) |
| Primary eosinophilia: clonal or idiopathic | Clonal eosinophilia has histologic, cytogenetic, or molecular evidence of an underlying myeloid malignancy |
| Helminthic infections | An active tissue migration phase may manifest with hypereosinophilia |
| Hypereosinophilic syndrome | Classic criteria: hypereosinophilia for at least 6 mo, exclusion of both secondary and clonal eosinophilia, and evidence of organ involvement |
| ChurgStrauss syndrome | Hypereosinophilia with asthma, systemic vasculitis, migratory pulmonary infiltrates, sinusitis, and extravascular eosinophils |
| Allergic bronchopulmonary aspergillosis (ABPA) | Major criteria: history of asthma, central bronchiectasis, immediate skin reactivity to Aspergillus, elevated total serum IgE (>1000 ng/mL), elevated IgE or IgG to Aspergillus |
Hypereosinophilia is defined as an eosinophil level greater than 1500 cells/L. These levels may be associated with end‐organ damage regardless of the underlying etiology, although the degree of eosinophilia frequently does not correlate closely with eosinophilic tissue infiltration. As a result, relatively modest degrees of peripheral eosinophilia may be seen in association with end‐organ damage, while severe eosinophilia may be tolerated well for prolonged periods in other cases.1 The most serious complications of hypereosinophilia are myocardial damage with ultimate development of cardiac fibrosis and refractory heart failure; pulmonary involvement with hypoxia; and involvement of both the central and peripheral nervous systems including stroke, encephalopathy, and mononeuritis multiplex. A number of studies should be considered to help evaluate for the possibility of end‐organ damage as well as to assess for the presence of primary and idiopathic causes of hypereosinophilia. These include peripheral blood smear looking particularly for dysplastic eosinophils or blasts, serum tryptase, serum vitamin B12, serum IgE, cardiac troponin levels, anti‐neutrophil cytoplasmic antibody, electrocardiography, echocardiography, pulmonary function tests, and thoracoabdominal CT scanning. Endoscopic studies with esophageal, duodenal, and colonic biopsy should be performed if eosinophilic gastroenteritis is suspected.1, 7, 10
While more modest degrees of eosinophilia are associated with a plethora of conditions, severe eosinophilia, especially that approaching the levels displayed by this patient, suggests a much more circumscribed differential diagnosis. This should prompt consideration of ChurgStrauss syndrome, parasitic infection with an active tissue migration phase, and hypereosinophilic syndrome (HES).4 HES has classically been characterized by hypereosinophilia for at least 6 months, exclusion of both secondary and clonal eosinophilia, and evidence of end‐organ involvement. More recently, however, a revised definition consisting of marked eosinophilia with reasonable exclusion of other causes has gained favor.1, 7, 10, 1416 While perhaps as many as 75% of cases of HES continue to be considered idiopathic at present, 2 subtypes have now been recognized, with important prognostic and therapeutic implications. Myeloproliferative HES has a strong male predominance, is frequently associated with elevated serum tryptase and B12 levels, often manifests with hepatosplenomegaly, and displays a characteristic gene mutation, FIP1L1/PDGFRA. Lymphocytic HES is typified by polyclonal eosinophilic expansion in response to elevated IL‐5 levels, is associated with less cardiac involvement and a somewhat more favorable prognosis in the absence of therapy, and has been associated with transformation into T‐cell lymphoma.1, 1417 We suspect, though we are unable to prove, that our patient was finally diagnosed at the end of a journey that began as lymphocytic HES and ultimately progressed to T‐cell lymphoma. T‐cell lymphoma has rarely been associated with profound eosinophilia. This appears to reflect disordered production of IL‐5, as was true of this patient, and many of these cases may represent transformed lymphocytic HES.14
Specific therapy exists for the myeloproliferative subtype of HES, consisting of the tyrosine kinase inhibitor imatinib, with excellent response in typical cases. Initial treatment of most other extreme eosinophilic syndromes not caused by parasitic infection, including lymphocytic and idiopathic HES as well as ChurgStrauss syndrome, consists of high‐dose corticosteroids, with a variety of other agents used as second‐line and steroid‐sparing treatments. The urgency of therapy is dictated by the presence and severity of end‐organ damage, and in some instances corticosteroids may need to be given before the diagnosis is fully secure. When S. stercoralis infection has not been ruled out, concurrent therapy with ivermectin should be given to prevent triggering Strongyloides hyperinfection. Hematology input is critical when HES is under serious consideration, with bone marrow examination, cytogenetic studies, T‐cell phenotyping and T‐cell receptor rearrangement studies essential in helping to establish the correct diagnosis.10, 17
The differential diagnosis of peripheral eosinophilia is broad and requires a thorough, stepwise approach. Although profound eosinophilia is usually caused by a limited number of diseases, this patient reminds us that Captain Renault's advice in the film Casablanca to round up the usual suspects does not always suffice, as the diagnosis of T‐cell lymphoma was not considered by either the clinicians or the discussant until lung biopsy results became available. Most patients with hypereosinophilia not caused by parasitic infection will ultimately require an invasive procedure to establish a diagnosis, which is essential before embarking on an often‐toxic course of therapy, as well as for providing an accurate prognosis.
TEACHING POINTS
-
The most common causes of eosinophilia include helminthic infections (the leading cause worldwide), asthma, allergic conditions (the leading cause in the United States), malignancies, and drugs.
-
Hypereosinophilia may lead to end‐organ damage. The most important etiologies include ChurgStrauss Syndrome, HES, or a helminthic infection in the larval migration phase.
-
The mainstay of therapy for most cases of HES is corticosteroids. The goal of therapy is to prevent, or ameliorate, end‐organ damage.
- ,.Practical approach to the patient with hypereosinophilia.J Allergy Clin Immunol.2010;126(1):39–44.
- ,,.Eosinophilia: secondary, clonal and idiopathic.Br J Haematol.2006;133(5):468–492.
- .Blood eosinophilia: a new paradigm in disease classification, diagnosis, and treatment.Mayo Clin Proc.2005;80(1):75–83.
- ,,,.Clinical manifestations and treatment of Churg‐Strauss syndrome.Rheum Dis Clin North Am.2010;36(3):527–543.
- ,,,.Relative eosinophilia and functional adrenal insufficiency in critically ill patients.Lancet.1999;353(9165):1675–1676.
- ,,,.Opposing effects of glucocorticoids on the rate of apoptosis in neutrophilic and eosinophilic granulocytes.J Immunol.1996;156(10):4422–4428.
- ,.Eosinophilic disorders.J Allergy Clin Immunol.2007;119(6):1291–1300; quiz 1301–1302.
- ,.Pulmonary eosinophilia.Clin Rev Allergy Immunol.2008;34(3):367–371.
- .Eosinophilic diseases of the gastrointestinal tract.Scand J Gastroenterol.2010;45(9):1013–1021.
- ,,.Hypereosinophilic syndrome and clonal eosinophilia: point‐of‐care diagnostic algorithm and treatment update.Mayo Clin Proc.2010;85(2):158–164.
- ,,,,,.Eosinophilia as a predictor of food allergy in atopic dermatitis.Allergy Asthma Proc.2010;31(2):e18–e24.
- ,,, et al.The American College of Rheumatology 1990 criteria for the classification of Churg‐Strauss syndrome (allergic granulomatosis and angiitis).Arthritis Rheum.1990;33(8):1094–1100.
- .Allergic bronchopulmonary aspergillosis. In: Adkinson NF, Yunginger JW, Busse WW, et al, eds. Middleton's Allergy Principles 2003:1353–1371.
- ,,, et al.TARC and IL‐5 expression correlates with tissue eosinophilia in peripheral T‐cell lymphomas.Leuk Res.2008;32(9):1431–1438.
- ,,.Hypereosinophilic syndrome and proliferative diseases.Acta Dermatovenerol Croat.2009;17(4):323–330.
- ,.The hypereosinophilic syndromes: current concepts and treatments.Br J Haematol.2009;145(3):271–285.
- ,,.Lymphocytic variant hypereosinophilic syndromes.Immunol Allergy Clin North Am.2007;27(3):389–413.
Vaccine Refusal
"The next patient is a 5-year-old who is unable to walk," reports the overnight resident at the morning sign-out. "He had a day of fever 4 days ago, leg pain beginning 2 days ago, and yesterday he awoke with refusal to bear weight."
As we get to the differential diagnosis, I try to expand on the list of possibilities rather than merely accept the working diagnosis of myositis developed in the emergency department.

We start with the common paradigm, "If you hear hoof beats behind you, you turn around expecting to see a horse, not a zebra. However, beware the hard-charging rhinoceros that will run you over if you don’t turn around fast enough." What is the rhinoceros in this situation? A septic hip. That needs to be ruled out emergently. If suspected, you get an immediate orthopedics consult and probably an aspiration of the hip, as destruction of the joint can occur in less than 24 hours. Physical exam had excluded this possibility. The hip was nontender.
The physical exam had revealed some mild tenderness of the calves.
"What if there were decreased or absent reflexes?" I ask. Several people jump on the diagnosis of Guillain-Barré syndrome. Correct, although I lament that only one of the four history and physicals obtained in the ED or by the admitting team had documented testing any reflexes. Teaching point made – do thorough physicals.
"What if," I asked, "you had detected weakness in the legs?" The room is silent as people consider the options. I hint, "It’s mostly of historical interest." After more silence, a medical student proffers polio. That is correct. A resident admits that she would never have thought of that diagnosis. Years of training had matured her book learning into a more honed clinical judgment. To a modern resident, polio isn’t a zebra, it’s nearly a unicorn.
I had the opportunity to check my e-mail prior to going on family-centered rounds. It contained two reminders that on that date in 1954 large-scale immunization with the Salk vaccine had begun.
The purpose of my column "Beyond the White Coat" is to provide updates, news, and perspective from the fields of law, philosophy, and the humanities that have an impact on clinical medicine. Historical events provide perspective. I was acutely aware that morning of the difference between what I faced and what one of my predecessors in the 1950s would have faced.
In that bygone era, the nightmare for many parents was putting an infant to bed with a fever, not knowing whether the baby would wake up paralyzed. Because of medical progress, I didn’t have to deliver such a grim diagnosis. I had good news to give. "Your child has a muscle inflammation that occasionally occurs after influenza and some other viruses. The muscle enzyme test this morning is improved from yesterday. The clinical exam is also better. He is now bearing weight. He’s going to be fine. I expect full recovery in another 1-3 days."
Parental refusal of vaccines remains a significant and growing problem. The Wall Street Journal last month carried yet another article about pediatricians who fire from their practice parents who refuse vaccines ("More Doctors Fire Vaccine Refusers," Feb. 15, 2012). The American Academy of Pediatrics has a policy statement discouraging such a response (Pediatrics 2005;115:1428-31), but many physicians disagree with that policy (Arch. Pediatr. Adolesc. Med. 2005;159:929-34). A wide variety of reasons are given to justify the practice. Other physicians, working locally such as in this Missouri article, are encouraging the virtue of accommodation ("Responding With Empathy to Parents Fears of Vaccinations," Missouri Medicine, Jan/Feb 2012). (Full disclosure: I’m proud to say I work with those two Missouri doctors.)
I have a research interest in parental refusals of care, as indicated in my September 2011 column ("A Parents Refusal and the Harm Principle," September 2011, p. 32). I won’t try to settle the vaccine controversy here. For me, this isn’t an issue of parental authority, parens patriae, and medical liability. The real motivation for spending the extra time educating and guiding parents who are worried about the safety of vaccines is rooted in my gratitude that I will never have to walk into a room and break the horrific news of polio to a family. It is a debt I owe those who came before me: the scientists, clinicians, parents, and children, who conquered polio. For those efforts, thank you.
P.S. My patient did get a flu shot before discharge.
Dr. Powell is associate professor of pediatrics at St. Louis University and a pediatric hospitalist at SSM Cardinal Glennon Children’s Medical Center, St. Louis.
"The next patient is a 5-year-old who is unable to walk," reports the overnight resident at the morning sign-out. "He had a day of fever 4 days ago, leg pain beginning 2 days ago, and yesterday he awoke with refusal to bear weight."
As we get to the differential diagnosis, I try to expand on the list of possibilities rather than merely accept the working diagnosis of myositis developed in the emergency department.
We start with the common paradigm, "If you hear hoof beats behind you, you turn around expecting to see a horse, not a zebra. However, beware the hard-charging rhinoceros that will run you over if you don’t turn around fast enough." What is the rhinoceros in this situation? A septic hip. That needs to be ruled out emergently. If suspected, you get an immediate orthopedics consult and probably an aspiration of the hip, as destruction of the joint can occur in less than 24 hours. Physical exam had excluded this possibility. The hip was nontender.
The physical exam had revealed some mild tenderness of the calves.
"What if there were decreased or absent reflexes?" I ask. Several people jump on the diagnosis of Guillain-Barré syndrome. Correct, although I lament that only one of the four history and physicals obtained in the ED or by the admitting team had documented testing any reflexes. Teaching point made – do thorough physicals.
"What if," I asked, "you had detected weakness in the legs?" The room is silent as people consider the options. I hint, "It’s mostly of historical interest." After more silence, a medical student proffers polio. That is correct. A resident admits that she would never have thought of that diagnosis. Years of training had matured her book learning into a more honed clinical judgment. To a modern resident, polio isn’t a zebra, it’s nearly a unicorn.
I had the opportunity to check my e-mail prior to going on family-centered rounds. It contained two reminders that on that date in 1954 large-scale immunization with the Salk vaccine had begun.
The purpose of my column "Beyond the White Coat" is to provide updates, news, and perspective from the fields of law, philosophy, and the humanities that have an impact on clinical medicine. Historical events provide perspective. I was acutely aware that morning of the difference between what I faced and what one of my predecessors in the 1950s would have faced.
In that bygone era, the nightmare for many parents was putting an infant to bed with a fever, not knowing whether the baby would wake up paralyzed. Because of medical progress, I didn’t have to deliver such a grim diagnosis. I had good news to give. "Your child has a muscle inflammation that occasionally occurs after influenza and some other viruses. The muscle enzyme test this morning is improved from yesterday. The clinical exam is also better. He is now bearing weight. He’s going to be fine. I expect full recovery in another 1-3 days."
Parental refusal of vaccines remains a significant and growing problem. The Wall Street Journal last month carried yet another article about pediatricians who fire from their practice parents who refuse vaccines ("More Doctors Fire Vaccine Refusers," Feb. 15, 2012). The American Academy of Pediatrics has a policy statement discouraging such a response (Pediatrics 2005;115:1428-31), but many physicians disagree with that policy (Arch. Pediatr. Adolesc. Med. 2005;159:929-34). A wide variety of reasons are given to justify the practice. Other physicians, working locally such as in this Missouri article, are encouraging the virtue of accommodation ("Responding With Empathy to Parents Fears of Vaccinations," Missouri Medicine, Jan/Feb 2012). (Full disclosure: I’m proud to say I work with those two Missouri doctors.)
I have a research interest in parental refusals of care, as indicated in my September 2011 column ("A Parents Refusal and the Harm Principle," September 2011, p. 32). I won’t try to settle the vaccine controversy here. For me, this isn’t an issue of parental authority, parens patriae, and medical liability. The real motivation for spending the extra time educating and guiding parents who are worried about the safety of vaccines is rooted in my gratitude that I will never have to walk into a room and break the horrific news of polio to a family. It is a debt I owe those who came before me: the scientists, clinicians, parents, and children, who conquered polio. For those efforts, thank you.
P.S. My patient did get a flu shot before discharge.
Dr. Powell is associate professor of pediatrics at St. Louis University and a pediatric hospitalist at SSM Cardinal Glennon Children’s Medical Center, St. Louis.
Afghan-Born Hospitalist Gives Back through Free California Clinic
When Ahmad Nooristani, MD, became a physician, part of his motivation was to help his native country. “I wanted to become a physician so that I could give back,” says Dr. Nooristani, who emigrated to the U.S. from Afghanistan in 1981. He graduated medical school in 2008.

One way to address preventive care for the uninsured, he reasoned, was to open a free clinic. In 2009, in addition to his seven-on/seven-off duties as a hospitalist, Dr. Nooristani began work on establishing a clinic for uninsured patients in his new hometown. Almost three years and countless fundraising events later, the Noor Foundation Clinic opened its doors in October 2011, offering not just primary care but ophthalmologic examinations, nutrition counseling, physical therapy, and point-of-service testing, too. For now, the clinic is open Friday and Saturday afternoons; all care is free.
Dr. Nooristani has worked 20 hours a week on the project. He’s recruited 400 volunteers, ranging from high-level administrators from the county’s hospitals to community fundraisers to off-duty nurses and physician colleagues.
“He’s a hard-working guy and is always looking for ways to improve things,” says hospitalist colleague Christian Voge, MD, medical director and president of San Luis Hospitalists. “I think he saw a need and is trying to give back.”
A Gap to Fill
Located on the central coast of California, San Luis Obispo County has a population of 269,637, according to 2010 U.S. Census figures. County public health officer Penny A. Borenstein, MD, MPH, says that figures from such surveys as the California Health Interview Survey and the Census Bureau indicate that approximately 35,000 of the county’s residents had no health insurance at some point in the last 12 months. The number of those who are underinsured (i.e. who carry minimal catastrophic insurance with high deductibles) is harder to quantify.
——Christian Voge, MD, medical director and president, San Luis Hospitalists AMC
Although other clinic options exist in the county, through Medi-Cal and the County Medical Services Program, Dr. Borenstein believes that the Noor Foundation Clinic will help address gaps.
“Even a sliding scale fee [such as those charged by community health centers] can sometimes be a deterrent to people,” she notes. “I give [Dr. Nooristani] many kudos for taking the bull by the horn and saying, ‘Let’s at least try to put something together to help fill the gaps in a very imperfect healthcare system.’”
New Skills Acquired
During an interview just days after the clinic opened its doors, Dr. Nooristani voiced some amazement about the long permitting process. “The hoops you have to jump through—it’s unbelievable,” he said.
Subject to federal, state, and county regulations, the clinic had to be retrofitted with a $25,000 air filtration and ducting system, among other upgrades. As a result, the foundation was paying rent for two years before the clinic opened its doors. “I could have seen a few thousand patients,” Dr. Nooristani says. “I mean, think about the complications I could have prevented.”
Still, he’s philosophical about the process. “On the flipside, I’m glad I did it this way. As tedious and time-consuming as it was, it served the purpose of bringing the whole community together,” he says.
Fundraising events for the foundation, as well as private donations, raised a total of $80,000 in a two-year period. Just before the clinic opened, the San Luis Obispo County Board of Supervisors approved a $75,000 grant to the Noor Foundation to cover the annual costs of point-of-service testing. And a broad swath of the county’s office holders, healthcare administrators, and community leaders attended the clinic’s grand opening.
Geared to the Patient
Keeping in mind his patient population, Dr. Nooristani plans to incorporate patient education on managing chronic illnesses. An ophthalmologist has volunteered one day a month. A separate optometric examination room is outfitted with all the requisite equipment, and eyeglasses have been donated.
Furnished tastefully throughout, the clinic does not have the stark quality sometimes associated with free clinics. Dr. Nooristani also is respectful of patients’ time: “I don’t want anybody sitting in the waiting room for more than 30 minutes,” he says.
That’s why the appointment calendar is structured to accommodate future appointments, and he currently staffs each clinic day with two physicians and additional providers. He’s also savvy about his use of volunteers, limiting their hours to avoid burnout. (Listen to Dr. Nooristani talk about access to preventive care and starting free clinics.)
Catching Fire
Dr. Nooristani already has his sights set on more clinics, hopefully in his home country. In the meantime, though, he says, “people need care here.”
Like the meaning of the clinic name (“noor” means hope, and his name translates to “land of hope”), he hopes to inspire others to follow his lead. “Any community, big or small, can do this,” he says, enthusiasm in his voice. “You just have to keep your eyes on the prize.”
Gretchen Henkel is a freelance writer based in California.
When Ahmad Nooristani, MD, became a physician, part of his motivation was to help his native country. “I wanted to become a physician so that I could give back,” says Dr. Nooristani, who emigrated to the U.S. from Afghanistan in 1981. He graduated medical school in 2008.
One way to address preventive care for the uninsured, he reasoned, was to open a free clinic. In 2009, in addition to his seven-on/seven-off duties as a hospitalist, Dr. Nooristani began work on establishing a clinic for uninsured patients in his new hometown. Almost three years and countless fundraising events later, the Noor Foundation Clinic opened its doors in October 2011, offering not just primary care but ophthalmologic examinations, nutrition counseling, physical therapy, and point-of-service testing, too. For now, the clinic is open Friday and Saturday afternoons; all care is free.
Dr. Nooristani has worked 20 hours a week on the project. He’s recruited 400 volunteers, ranging from high-level administrators from the county’s hospitals to community fundraisers to off-duty nurses and physician colleagues.
“He’s a hard-working guy and is always looking for ways to improve things,” says hospitalist colleague Christian Voge, MD, medical director and president of San Luis Hospitalists. “I think he saw a need and is trying to give back.”
A Gap to Fill
Located on the central coast of California, San Luis Obispo County has a population of 269,637, according to 2010 U.S. Census figures. County public health officer Penny A. Borenstein, MD, MPH, says that figures from such surveys as the California Health Interview Survey and the Census Bureau indicate that approximately 35,000 of the county’s residents had no health insurance at some point in the last 12 months. The number of those who are underinsured (i.e. who carry minimal catastrophic insurance with high deductibles) is harder to quantify.
——Christian Voge, MD, medical director and president, San Luis Hospitalists AMC
Although other clinic options exist in the county, through Medi-Cal and the County Medical Services Program, Dr. Borenstein believes that the Noor Foundation Clinic will help address gaps.
“Even a sliding scale fee [such as those charged by community health centers] can sometimes be a deterrent to people,” she notes. “I give [Dr. Nooristani] many kudos for taking the bull by the horn and saying, ‘Let’s at least try to put something together to help fill the gaps in a very imperfect healthcare system.’”
New Skills Acquired
During an interview just days after the clinic opened its doors, Dr. Nooristani voiced some amazement about the long permitting process. “The hoops you have to jump through—it’s unbelievable,” he said.
Subject to federal, state, and county regulations, the clinic had to be retrofitted with a $25,000 air filtration and ducting system, among other upgrades. As a result, the foundation was paying rent for two years before the clinic opened its doors. “I could have seen a few thousand patients,” Dr. Nooristani says. “I mean, think about the complications I could have prevented.”
Still, he’s philosophical about the process. “On the flipside, I’m glad I did it this way. As tedious and time-consuming as it was, it served the purpose of bringing the whole community together,” he says.
Fundraising events for the foundation, as well as private donations, raised a total of $80,000 in a two-year period. Just before the clinic opened, the San Luis Obispo County Board of Supervisors approved a $75,000 grant to the Noor Foundation to cover the annual costs of point-of-service testing. And a broad swath of the county’s office holders, healthcare administrators, and community leaders attended the clinic’s grand opening.
Geared to the Patient
Keeping in mind his patient population, Dr. Nooristani plans to incorporate patient education on managing chronic illnesses. An ophthalmologist has volunteered one day a month. A separate optometric examination room is outfitted with all the requisite equipment, and eyeglasses have been donated.
Furnished tastefully throughout, the clinic does not have the stark quality sometimes associated with free clinics. Dr. Nooristani also is respectful of patients’ time: “I don’t want anybody sitting in the waiting room for more than 30 minutes,” he says.
That’s why the appointment calendar is structured to accommodate future appointments, and he currently staffs each clinic day with two physicians and additional providers. He’s also savvy about his use of volunteers, limiting their hours to avoid burnout. (Listen to Dr. Nooristani talk about access to preventive care and starting free clinics.)
Catching Fire
Dr. Nooristani already has his sights set on more clinics, hopefully in his home country. In the meantime, though, he says, “people need care here.”
Like the meaning of the clinic name (“noor” means hope, and his name translates to “land of hope”), he hopes to inspire others to follow his lead. “Any community, big or small, can do this,” he says, enthusiasm in his voice. “You just have to keep your eyes on the prize.”
Gretchen Henkel is a freelance writer based in California.
Online System Doesn’t Affect Pneumonia, Heart Attack Mortality Rates
A study released in the past week shows that Hospital Compare, Medicare's online system for patients to compare the efficacy of hospitals, had little or no impact on 30-day mortality rates for three common inpatient conditions. But a leading hospitalist says the findings should not detract from the value of transparency in medical performance.
"It's version 1.0 of public reporting," says Win Whitcomb, MD, MHM, medical director of healthcare quality at Baystate Medical Center, Springfield, Mass. "To expect that it's going to lower mortality rates in the first iteration, it's not a realistic expectation. ... It's the beginning of a very long journey. We have to take the long view."
The Health Affairs report, “Medicare's Public Reporting Initiatives on Hospital Quality Had Modest Or No Impact on Morality From Three Key Conditions," found that public reporting had no impact on the mortality rates for heart attacks and pneumonia and "minimal impact" on heart-failure cases. The authors, who analyzed Medicare claims data from 2000 to 2008, also suggested that Hospital Compare "did not result in patients being directed toward higher-quality hospitals."
Dr. Whitcomb says he's not surprised by the results, given other literature that has shown limited impacts from public reporting. But he sees an opportunity to build better reporting systems, via in-person, electronic, or mobile portals that are more focused on user interface. For example, he says, it takes about 22 minutes to review a single patient's file for reported measurements in a heart-failure case. Automating that process would give hospitalists and other physicians additional time to deal directly with patients.
"What the quality initiative movement has to figure out is how to spend more time on making care better and less time on measurement and reporting," Dr. Whitcomb says. "Often, the important work of changing care to make it more evidence-based ... doesn’t get the focus."
Pioneering Hospitalists Earn Masters of Hospital Medicine Designation
Three pioneering hospitalists will join seven distinguished colleagues at the pinnacle of recognition from their field when SHM inducts them as Masters of Hospital Medicine (MHM) at HM12 in San Diego in April, singling them out for what the society calls "the utmost demonstration of dedication to the field of hospital medicine through significant contributions to the development and maturation of the profession."
While the practice of hospital medicine can be personally satisfying, leadership positions are even more gratifying from developing "systems of care that affect not just my own patients but all patients in the hospital," says Patrick J. Cawley, MD, MBA, MHM, CPE, FACP, FACHE, chief medical officer at Medical University of South Carolina (MUSC) Medical Center in Charleston, where he is responsible for the quality and safety of all of its patient care programs and clinical service lines.
Dr. Cawley, one of this year's MHM honorees, is a past president of SHM. He founded an HM program at Duke University and later managed a private HM practice in Conway, S.C., before coming to MUSC.
Peter Lindenauer, MD, MSc, MHM, FACP, who now directs the Center for Quality of Care Research at Baystate Medical Center in Springfield, Mass., is also being honored. Hired as a hospitalist at the University of California at San Francisco in July 1996, he was a founding SHM board member, then called the National Association of Inpatient Physicians (NAIP).
Since moving to Baystate, Dr. Lindenauer has held leadership roles in quality improvement, clinical informatics, and research. His center studies the quality and outcomes of hospital care, the effectiveness of treatments and care strategies for patients with common medical conditions, and methods for translating evidence-based treatments into routine clinical practice.
The third honoree, Mark Williams, MD, FACP, MHM, professor and chief of the division of hospital medicine at Northwestern University Feinberg School of Medicine in Chicago, now leads one of the largest hospitalist practices in an academic setting, but he also founded one of the first hospitalist groups at an inner city public hospital, Grady Hospital in Atlanta, in 1998.
An inaugural fellow of hospital medicine, a past president of SHM, and founding editor-in-chief of the Journal of Hospital Medicine, Dr. Williams has served on numerous SHM committees. He is the principal investigator of SHM's Project BOOST, and leads its new Hospitalist Program Peak Performance initiative. His published research focuses on quality improvement (QI), care transitions, teamwork and health literacy.
C. difficile Infections Hit All-Time High
Clostridium difficile infections have reached an all-time high in the United States, and 94% of these infections initiate with medical care, based on data from the Centers for Disease Control and Prevention. C. difficile–related deaths increased from 3,000 in 1999-2000 to 14,000 in 2006-2007, according to the CDC.
The data were published as a CDC Vital Signs report and were presented in a telebriefing on March 6.
C. difficile is "a formidable opponent," and a patient safety issue everywhere that medical care is provided, said Dr. Clifford McDonald, a CDC epidemiologist and the lead author of the report. CDC’s data show that 25% of C. difficile infections first appear in hospitalized patients, while 75% occur either in nursing home residents or in people recently treated in doctors’ offices or clinics. People most at risk are those who take antibiotics and receive care in an outpatient setting.
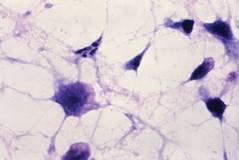
In general, the risk of developing C. difficile increases with age; although half of C. difficile infections occur in those younger than 65 years, 90% of C. difficile-related deaths occur in those aged 65 years and older, said Dr. McDonald.
He said that clinicians can help reduce C. difficile infections by following six steps:
• Prescribe antibiotics judiciously.
• Be proactive about testing patients for C. difficile if they develop diarrhea while taking antibiotics.
• Isolate patients with C. difficile.
• Wear gloves and gowns when treating C. difficile patients, even for short visits.
• Clean surfaces in exam and treatment rooms with bleach or other spore-killing products.
• When a patient transfers to another facility, notify the medical team about a C. difficile infection.
Also, be sure to order the appropriate cultures to determine whether antibiotics are really needed, Dr. McDonald suggested, and watch for signs that signal C. difficile. "Antibiotic-associated diarrhea is very common," but C. difficile accounts for only about one-third of that, he said.
However, certain clues suggest C. difficile, including more than three unformed stools in 24 hours, fever, abdominal pain, diarrhea that continues once an antibiotic has been discontinued, or diarrhea that began only once an antibiotic was discontinued, he said.
If someone has been on antibiotics, think about C. difficile early and get them tested, whether they are patients in inpatient or outpatient facilities, Dr. McDonald emphasized.
To determine the current prevalence of C. difficile, CDC researchers reviewed data from their Emerging Infections Program, which conducted population-based surveillance from eight geographic areas, and the National Healthcare Safety Network (NHSN). In 2010, a total of 10,342 cases of C. difficile infection were identified via the Emerging Infections Program in 2010, and a total of 42,157 incident laboratory-identified CDI events were reported via the NHSN.
On a positive note, early results from state-led programs in Illinois, Massachusetts, and New York showed that hospital collaboration can reduce C. difficile infections, Dr. McDonald said. The 71 hospitals in these states that participated in C. difficile–prevention programs reduced infection rates by 20% over 21 months. "These promising results follow similar efforts in England, a nation that dropped C. difficile infections by more than 50% during a recent 3-year period," the CDC researchers said in the full report (MMWR 2012;61:1-6).
For additional information about tracking HAIs infections, contact the Emerging Infections Program or the NHSN.
Dr. McDonald had no financial conflicts to disclose.
The recent alarm by the Centers for Disease Control and Prevention which reports on the increasing incidence and burden of Clostridium difficile infections (CDI) in the United States is drawing attention to a phenomenon which is already well- known to gastroenterologists and infectious Ddisease physicians worldwide. In fact, the sweeping changes in the epidemiology of CDI – with reports of increasing rates, outbreaks, and elevated morbidity and mortality since 2002 originally in parts of Canada and the United States – has now been described in almost every developed country which keeps statistics on this infection.
The only fact which is even more alarming in the CDC’s report is that there has not been any “leveling off” or abatement in this health care–associated complication in the U.S. Although GI and ID physicians, hospitalists, and many other health care providers around the globe have been aware of the disquieting rise in CDI since 2002, the hoped-for stabilization or reduction in its incidence due to aggressive infection prevention and control (IPC) techniques, as has been seen in the U.K., has not materialized in the U.S. and central Canada.
Why is it so difficult to control CDI? Because it requires the accomplishment of multiple simultaneous aggressive IPC maneuvers – all of which must be done correctly -– in order to overcome this infection on an institutional level:
- Appropriate antimicrobial use and stewardship- Rapid testing, isolation, and treatment of any patient with diarrhea who has recently received antibiotics, while awaiting test results
- Rigorous hand-washing and appropriate use of personal protective equipment when in contact with suspected or confirmed cases
- Meticulous and frequent environmental cleaning with sporicidal agents which are tolerable to patients and personnel
- Attention to cleaning and disinfection of the innumerable shared pieces of medical equipment, like blood pressure cuffs, thermometers, bladder scanners, and the like
- High level of scrutiny for quickly detecting and treating recurrences, which occur in 15%-40% of CDI patients
- Real-time surveillance to detect outbreaks and effect heightened measures, when necessary.
The “new CDI” has demonstrated itself to be an unforgiving infection in health care facilities. Any lapse in one or more of the above IPC interventions is enough to cause a rise in the incidence or complication rate.
It is unclear exactly why the “new CDI” is behaving as it does. Certainly, the appearance of a new hyper-virulent strain with additional fluoroquinolone resistance (on top of C. difficile’s “usual” multi-drug resistance), a mutation in the toxin regulator gene, and a seemingly greater propensity to sporulate (and thus resist disinfection) appears to be the event which has coincided with the re-emergence of this disease during the past 10 years.
However, not all of the clinical aspects of this “new CDI” can be explained by these findings alone. For instance, the rapid progression from diarrhea to fulminant colitis in the elderly and the immunocompromised, the high recurrence rate (compared with historical controls) and the elevated morbidity (i.e., colectomy and need for intensive care) and mortality remain unnerving manifestations without a real explanation.
The number of scientific publications describing the new epidemiology, pathogenesis, and prophylactic or treatment options has risen impressively over the past several years in order to gain an understanding of this relentless bacterium.
Medical journals are not the only place for CDI-related news, however. The internet and social media sites are rife with stories of personal tragedies from this affliction. Typical stories like a healthy grandfather undergoing uncomplicated elective surgery but then dying from antibiotic-induced CDI during or soon after his hospitalization are too commonly detailed in surveillance data and in personal blogs.
Sites dedicated to and run by patients who have suffered from CDI compete with other sites established by the all-too-commonly depressed individuals who have had to undergo a therapeutic colectomy or who are suffering multiple recurrences of this disease and are searching for centers offering a fecal transplant.
There is no doubt that the true tragedy of CDI, a health care complication with an attributable mortality of almost 15% in the frail elderly over 85 years of age, is the fact that it is more likely to kill than the primary cause of hospitalization (such as a pneumonia, cellulitis, or hip fracture) in this population.
At a time when CDI is clearly overcoming our ability to control it in many parts of the world, it remains puzzling why the U.S. and many European countries do not yet have a true, real-time local and national CDI surveillance network for tracking the number of cases.
Using hospital discharge data or disease coding has been shown to be inaccurate and too late to be of immediate use. Real-time local, state, and national CDI surveillance is essential in telling us where we are, where we are going, and what we have to do to control this affliction. There is clearly a battle going on between health care providers and CDI in many countries, including the U.S. and Canada. We need to use as many tools and tricks as possible to gain control. This is one war we cannot afford to lose.
MARK MILLER, M.D., FRCPC, is Chief, Infectious Diseases, and Head, Infection Prevention and Control Unit, Jewish General Hospital, Montreal.
Clostridium difficile infections have reached an all-time high in the United States, and 94% of these infections initiate with medical care, based on data from the Centers for Disease Control and Prevention. C. difficile–related deaths increased from 3,000 in 1999-2000 to 14,000 in 2006-2007, according to the CDC.
The data were published as a CDC Vital Signs report and were presented in a telebriefing on March 6.
C. difficile is "a formidable opponent," and a patient safety issue everywhere that medical care is provided, said Dr. Clifford McDonald, a CDC epidemiologist and the lead author of the report. CDC’s data show that 25% of C. difficile infections first appear in hospitalized patients, while 75% occur either in nursing home residents or in people recently treated in doctors’ offices or clinics. People most at risk are those who take antibiotics and receive care in an outpatient setting.
In general, the risk of developing C. difficile increases with age; although half of C. difficile infections occur in those younger than 65 years, 90% of C. difficile-related deaths occur in those aged 65 years and older, said Dr. McDonald.
He said that clinicians can help reduce C. difficile infections by following six steps:
• Prescribe antibiotics judiciously.
• Be proactive about testing patients for C. difficile if they develop diarrhea while taking antibiotics.
• Isolate patients with C. difficile.
• Wear gloves and gowns when treating C. difficile patients, even for short visits.
• Clean surfaces in exam and treatment rooms with bleach or other spore-killing products.
• When a patient transfers to another facility, notify the medical team about a C. difficile infection.
Also, be sure to order the appropriate cultures to determine whether antibiotics are really needed, Dr. McDonald suggested, and watch for signs that signal C. difficile. "Antibiotic-associated diarrhea is very common," but C. difficile accounts for only about one-third of that, he said.
However, certain clues suggest C. difficile, including more than three unformed stools in 24 hours, fever, abdominal pain, diarrhea that continues once an antibiotic has been discontinued, or diarrhea that began only once an antibiotic was discontinued, he said.
If someone has been on antibiotics, think about C. difficile early and get them tested, whether they are patients in inpatient or outpatient facilities, Dr. McDonald emphasized.
To determine the current prevalence of C. difficile, CDC researchers reviewed data from their Emerging Infections Program, which conducted population-based surveillance from eight geographic areas, and the National Healthcare Safety Network (NHSN). In 2010, a total of 10,342 cases of C. difficile infection were identified via the Emerging Infections Program in 2010, and a total of 42,157 incident laboratory-identified CDI events were reported via the NHSN.
On a positive note, early results from state-led programs in Illinois, Massachusetts, and New York showed that hospital collaboration can reduce C. difficile infections, Dr. McDonald said. The 71 hospitals in these states that participated in C. difficile–prevention programs reduced infection rates by 20% over 21 months. "These promising results follow similar efforts in England, a nation that dropped C. difficile infections by more than 50% during a recent 3-year period," the CDC researchers said in the full report (MMWR 2012;61:1-6).
For additional information about tracking HAIs infections, contact the Emerging Infections Program or the NHSN.
Dr. McDonald had no financial conflicts to disclose.
Major Finding: C. difficile-related deaths increased from 3,000 in 1999-2000 to 14,000 in 2006-2007.
Data Source: The data were taken from the Centers for Disease Control and Prevention’s Emerging Infections Program and the National Healthcare Safety Network (NHSN).
Disclosures: Dr. McDonald had no financial conflicts to disclose.