User login
“Smart Bed” Could Improve Efficiency
John LaCourse, PhD, professor and chair of the University of New Hampshire's Department of Electrical and Computer Engineering, has developed an algorithm to create a "smart" hospital bed that will communicate with other devices (i.e. X-rays or blood-pressure monitors) to monitor a patient's health and automatically make necessary adjustments.
To connect the small computers built into medical devices and avoid patent infringement, Dr. LaCourse plans to use a CANopen system, a common bus, or communication zone. If medical equipment manufacturers approve, the software can be implemented without any modifications to standard hospital beds.
"Medical errors are generated because devices don't talk to each other," LaCourse says. "What we're trying to do is break down that wall, work with the manufacturers, and see if we could get the common bus to be used."
For example, the "smart" beds could be used to measure and reduce the risks of apnea: If the bed determines that a patient ceases breathing, it will automatically change positions until the condition improves. LaCourse, however, envisions the beds having a "broad use," including blood-pressure measurements and respiratory and X-ray analyses, both in hospitals and homecare situations.
Anuj K. Dalal, MD, FHM, a hospitalist at Brigham and Women's Hospital in Boston, says "smart" beds are "an interesting concept."
"There is definitely interest in people trying to figure out how to monitor a patient’s status in real time," he says.
However, Dr. Dalal notes, there are potential consequences of relying too heavily on technology: "There can be a whole host of readings why the blood pressure drops. Moving the bed around could improve the readings, but it may not necessarily mean it’s improving the patient."
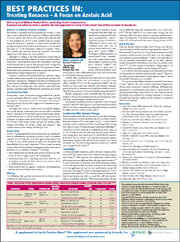
BEST PRACTICES IN: Treating Rosacea - A Focus on Azelaic Acid
A supplement to Family Practice News. This supplement was sponsored by Intendis, Inc.
Written by Ruth Williams, Medical Writer, and Medisys Health Communications, LLC, on behalf of Intendis, Inc.
•Topics
•Faculty/Faculty Disclosures

To view the supplement, click the image above.
Topics
• Rosacea: A Common, Chronic Condition
• Treatment Essentials
• Azelaic Acid
• Efficacy
• Combination With Systemic Therapy
• Tolerability
• AzA in Practice
Faculty/Faculty Disclosure
Hilary E. Baldwin, MD
Associate Professor of Dermatology
SUNY-Brooklyn
Brooklyn, New York
Dr Baldwin is a Consultant/Advisory Board/ Speakers' Bureau member of Allergan, Inc., Coria Laboratories Ltd, Galderma Laboratories, L.P., GlaxoSmithKline, Intendis, Inc., Medicis Pharmaceutical Corporation, OrthoNeutrogena, Ranbaxy Pharmaceuticals, sanofi-aventis, and Stiefel Laboratories.
Copyright © 2010 Elsevier Inc.
A supplement to Family Practice News. This supplement was sponsored by Intendis, Inc.
Written by Ruth Williams, Medical Writer, and Medisys Health Communications, LLC, on behalf of Intendis, Inc.
•Topics
•Faculty/Faculty Disclosures
To view the supplement, click the image above.
Topics
• Rosacea: A Common, Chronic Condition
• Treatment Essentials
• Azelaic Acid
• Efficacy
• Combination With Systemic Therapy
• Tolerability
• AzA in Practice
Faculty/Faculty Disclosure
Hilary E. Baldwin, MD
Associate Professor of Dermatology
SUNY-Brooklyn
Brooklyn, New York
Dr Baldwin is a Consultant/Advisory Board/ Speakers' Bureau member of Allergan, Inc., Coria Laboratories Ltd, Galderma Laboratories, L.P., GlaxoSmithKline, Intendis, Inc., Medicis Pharmaceutical Corporation, OrthoNeutrogena, Ranbaxy Pharmaceuticals, sanofi-aventis, and Stiefel Laboratories.
Copyright © 2010 Elsevier Inc.
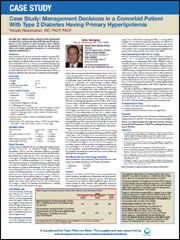
CASE STUDY: Management Decisions in a Comorbid Patient With Type 2 Diabetes Having Primary Hyperlipidemia
A supplement to Family Practice News. This supplement was sponsored by Daiichi Sankyo, Inc.
•Topics
•Faculty/Faculty Disclosures

To view the supplement, click the image above.
Topics
• Background
• Current Visit
• Laboratory Results
• Clinical Discussion
• Endocrinologist Consultation
• New Treatment Regimen With Add-On Therapy
• Conclusions
Faculty
Yehuda Handelsman, MD, FACP, FACE
Medical Director, Metabolic Institute of America
Chair and Program Director, 7th World Congress on Insulin Resistance Chair, International Committee for Insulin Resistance
18372 Clark Street, Suite 212
Tarzana, CA 91356
E-mail:[email protected]
Web site:www.TheMetabolicCenter.com
Dr Handelsman is a consultant for Bristol-Myers Squibb Company, Daiichi Sankyo, Inc., GlaxoSmithKline, Medtronic, Merck, Xoma, and Tethys;he has received clinical research grant funding from Takeda, Daiichi Sankyo Inc., GlaxoSmithKline, and Novo Nordisk; and he is on the speakers bureau for AstraZeneca, Bristol-Myers Squibb, Daiichi Sankyo Inc., GlaxoSmithKline, Merck, and Novartis. He also serves on the advisory board for CLINICAL ENDOCRINOLOGY NEWS.
Copyright © 2010 Elsevier Inc.
A supplement to Family Practice News. This supplement was sponsored by Daiichi Sankyo, Inc.
•Topics
•Faculty/Faculty Disclosures
To view the supplement, click the image above.
Topics
• Background
• Current Visit
• Laboratory Results
• Clinical Discussion
• Endocrinologist Consultation
• New Treatment Regimen With Add-On Therapy
• Conclusions
Faculty
Yehuda Handelsman, MD, FACP, FACE
Medical Director, Metabolic Institute of America
Chair and Program Director, 7th World Congress on Insulin Resistance Chair, International Committee for Insulin Resistance
18372 Clark Street, Suite 212
Tarzana, CA 91356
E-mail:[email protected]
Web site:www.TheMetabolicCenter.com
Dr Handelsman is a consultant for Bristol-Myers Squibb Company, Daiichi Sankyo, Inc., GlaxoSmithKline, Medtronic, Merck, Xoma, and Tethys;he has received clinical research grant funding from Takeda, Daiichi Sankyo Inc., GlaxoSmithKline, and Novo Nordisk; and he is on the speakers bureau for AstraZeneca, Bristol-Myers Squibb, Daiichi Sankyo Inc., GlaxoSmithKline, Merck, and Novartis. He also serves on the advisory board for CLINICAL ENDOCRINOLOGY NEWS.
Copyright © 2010 Elsevier Inc.
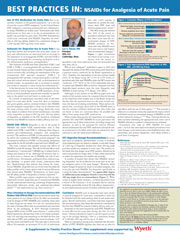
BEST PRACTICES IN: NSAIDS for Analgesia of Acute Pain
A supplement to Family Practice News. This supplement was supported by Wyeth.
•Topics
•Faculty/Faculty Disclosures
To view the supplement, click the image above. | 
To view video podcast of this Best Practice, click the image above. |
• Use of OTC Medication for Acute Pain
• Rationale for Ibuprofen Use in Acute Pain
• NSAID Side Effects
• More Attention to Dosage Recommendations Will Reduce Side Effects Risk
• OTC Ibuprofen Dosage Recommendations
• Conclusion
Faculty/Faculty Disclosure
Lee S. Simon, MD
Principal
SDG, LLC.
Cambridge, Mass.
Dr Simon previously served as the Division Director of the Arthritis, Analgesic & Ophthalmologic Drug Product Division at the US Food and Drug Administration Center for Drug Evaluation and Research. He is a Principal in SDG, LLC., a consulting company.
A supplement to Family Practice News. This supplement was supported by Wyeth.
•Topics
•Faculty/Faculty Disclosures
|
To view the supplement, click the image above. |
To view video podcast of this Best Practice, click the image above. |
• Use of OTC Medication for Acute Pain
• Rationale for Ibuprofen Use in Acute Pain
• NSAID Side Effects
• More Attention to Dosage Recommendations Will Reduce Side Effects Risk
• OTC Ibuprofen Dosage Recommendations
• Conclusion
Faculty/Faculty Disclosure
Lee S. Simon, MD
Principal
SDG, LLC.
Cambridge, Mass.
Dr Simon previously served as the Division Director of the Arthritis, Analgesic & Ophthalmologic Drug Product Division at the US Food and Drug Administration Center for Drug Evaluation and Research. He is a Principal in SDG, LLC., a consulting company.

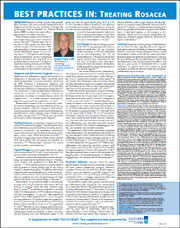
BEST PRACTICES IN: Treating Rosacea
A supplement to Family Practice News. This supplement was supported by Galderma.
•Topics
•Faculty/Faculty Disclosures

To view the supplement, click the image above.
Topics
• Background
• Diagnosis and Differential Diagnosis
• Treating Rosacea
• Topical Therapy
• Oral Therapy
• Treatment Selection
• Summary
Faculty/Faculty Disclosure
Joseph F. Fowler, MD
Clinical Professor of Dermatology
University of Louisville
Dermatology Specialists PSC
Louisville, KY
Dr. Fowler has received clinical grants from and is a consultant to Galderma, Inc.
Copyright © 2009 Elsevier Inc.
A supplement to Family Practice News. This supplement was supported by Galderma.
•Topics
•Faculty/Faculty Disclosures
To view the supplement, click the image above.
Topics
• Background
• Diagnosis and Differential Diagnosis
• Treating Rosacea
• Topical Therapy
• Oral Therapy
• Treatment Selection
• Summary
Faculty/Faculty Disclosure
Joseph F. Fowler, MD
Clinical Professor of Dermatology
University of Louisville
Dermatology Specialists PSC
Louisville, KY
Dr. Fowler has received clinical grants from and is a consultant to Galderma, Inc.
Copyright © 2009 Elsevier Inc.
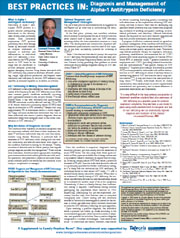
Diagnosis and Management of Alpha-1 Antitrypsin Deficiency
A supplement to Family Practice News. This supplement was supported by Talecris Biotherapeutics.
•Topics
•Faculty/Faculty Disclosures
To view the supplement, click the image above.
Topics
•What is Alpha-1 Antitrypsin Deficiency?
•AAT Deficiency is Widely Underrecognized
•Why Are Rates of Diagnosis So Low?
•Optimal Diagnosis and Management Strategies
Faculty/Faculty Disclosures
Faculty/Faculty Disclosures
Leonard Fromer, MD
Assistant Clinical Professor, Family Medicine
David Geffen School of Medicine
University of California
Los Angeles
Dr. Fromer is a consultant for Talecris Biotherapeutics, Inc.
Copyright © 2009 Elsevier Inc.

EGFR Status May Explain Depression-Survival Link in NSCLC
ANAHEIM, CALIF. – Notable survival differences between depressed and nondepressed patients with non–small cell lung cancer may be attributable to EGFR-mutation status, according to a small but provocative study conducted by Dr. William Pirl of the cancer center at Massachusetts General Hospital in Boston.
The investigation arose from the observation by Dr. Pirl that NSCLC patients with EGFR (epidermal growth factor receptor) mutations were rarely referred for psychiatric evaluation of depression, which is a common comorbid diagnosis among cancer patients and one that is increasingly linked to decreased survival.
He wondered whether the 15% of lung cancer patients with EGFR mutations might be less susceptible to depression because they would know of their more optimistic prognosis, relative to other patients with the disease. Could their avoidance of depression relate to smoking status, since more patients with EGFR mutations are nonsmokers? Or is it possible that a biological explanation might underlie the relationship between depression and survival in NSCLC?
Results of his study of newly diagnosed NSCLC patients point to biology, although potential biological pathways are still under investigation, Dr. Pirl said in an interview following a presentation of his latest findings at the annual conference of the American Psychosocial Oncology Society.
In a previous study of 43 recently diagnosed NSCLC patients, he and associates found that patients who were depressed according to Hospital Anxiety and Depression Scale scores lived a median of 2.5 months, compared with median survival rates of 10.4 months in nondepressed patients (Psychosomatics 2008 May-June [doi:10.1176/appi.psy.49.3.218]).
To determine whether tumor genotypes played a role, Dr. Pirl’s team administered the MDS (Major Depression Rating Scale, which is a scale derived from the Hamilton Rating Scale for Depression and the Melancholia Scale, and aligned with DSM-IV criteria for major depressive disorder) and the PHQ-9 (Patient Health Questionnaire–9) to 148 patients with metastatic NSCLC prior to the processing of their genotype results. They found the following:
- None of 16 patients with an EGFR mutation had depression, based on either instrument.
- In all, 4 of 27 patients (15%) with wild-type mutations as well as 17 of 105 (16%) of those with unknown mutations met criteria for depression, according to the MDS.
- Even more patients with wild-type mutations (9 of 27, or 33%) and unknown mutations (32 of 105, or 39%) met criteria for depression, according to the PHQ-9.
After 3 years, significantly more depressed patients than nondepressed patients had died (hazard ratio, 1.75; P = .03). Patients with an EGFR genotype also had a significant survival advantage over other patients in the study (P = .004).
"[If we put] genotype into the survival model, depression is no longer significantly associated with survival," reported Dr. Pirl, director of the hospital’s center of psychiatric oncology and behavioral sciences.
A study will soon be underway to explore plausible biological pathways linking EGFR, depression, and survival.
One candidate is tumor growth factor–alpha (TGF-alpha), a ligand of EGFR known to cause circadian rhythm dysfunction. Dr. Pirl noted in his talk that EGFR mutants do not produce TGF-alpha.
If replicated, the study could "raise larger questions about the biological pathways to depression and could possibly uncover a novel pathway in people with medical illnesses," he added in an interview.
Dr. Pirl’s coinvestigators included Dr. Jennifer S. Temel, a medical oncologist, and Joseph Greer, Ph.D., associate director of behavioral medicine at the hospital. They reported having no relevant financial disclosures.
FROM THE ANNUAL CONFERENCE OF THE AMERICAN PSYCHOSOCIAL ONCOLOGY SOCIETY
Major Finding: None of 16 patients with EGFR mutations met criteria for depression, but 4 of 27 patients (15%) with wild-type mutations and 17 of 105 (16%) with unknown mutations did so.
Data Source: A study of 148 patients newly diagnosed with NSCLC.
Disclosures: Researchers reported no relevant financial disclosures.
The Effective Management of Chronic Constipation and IBS-C
A supplement to Internal Medicine News and supported by Takeda Pharmaceuticals North America, Inc.
To view the supplement, click the image above.
This supplement has been designed to meet the educational needs of clinicians relative to the diagnosis and effective management of chronic constipation and IBS-C.
Faculty
Harold Fields, MD
Founder, Village Family Practice
Houston, TX
Wendy Wright, MS, RN, ARNP, FNP, FAANP
Owner, Wright & Associates
Family Healthcare
Amherst, NH
Copyright © 2008 Elsevier Inc.

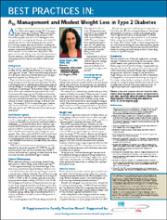
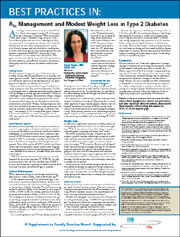
A1c Management and Modest Weight Loss in Type 2 Diabetes
A supplement to Family Practice News and supported by Amylin/Lilly.

To view the supplement, click the image above.
Faculty
Anne Peters, MD, FACP, CDE
Director
University of Southern
California Clinical
Diabetes Programs
Los Angeles, Calif.
Copyright © 2008 Elsevier Inc.
A supplement to Family Practice News and supported by Amylin/Lilly.
To view the supplement, click the image above.
Faculty
Anne Peters, MD, FACP, CDE
Director
University of Southern
California Clinical
Diabetes Programs
Los Angeles, Calif.
Copyright © 2008 Elsevier Inc.
A supplement to Family Practice News and supported by Amylin/Lilly.
To view the supplement, click the image above.
Faculty
Anne Peters, MD, FACP, CDE
Director
University of Southern
California Clinical
Diabetes Programs
Los Angeles, Calif.
Copyright © 2008 Elsevier Inc.
Pricey Problems
Hospitalists working to reduce readmissions and medication errors would do well to consider a new policy report that suggests the two systemic problems cost the healthcare system $46 billion a year.
The white paper sets out to identify specific actions—such as creating detailed discharge plans, having pharmacists make follow-up calls after discharge, and using bar-code technology to verify drug dosages—that public and private decision-makers can use to help tackle the issues. While the bureaucratic checklist devised by the New England Healthcare Institute (NEHI) and the National Priorities Partnership is a good broad brush, the report's value may lie in how it prods physicians to change the way care is delivered.
"It's a quick and easy guide, but what's beneath it is quite complex," says Karen Nelson, a former nurse and senior vice president for clinical affairs for the Massachusetts Hospital Association. "We've seen terrific pockets of expertise … but the real work has to come for all providers and programs to do this at the same time."
Nelson believes hospitalists are "clearly essential team leaders" in fighting both medication errors and readmissions. Medication reconciliation is a problem in each of those silos that HM groups battle daily. To wit, the Agency for Healthcare Research and Quality (AHRQ) has awarded SHM a $1.5 million grant for a three-year, multicenter medication reconciliation QI study. “As care-transition managers, hospitalists are well-positioned to analyze the pitfalls of care coordination and develop and implement quality-improvement solutions to improve patient safety," says Joseph Miller, SHM's senior vice president and chief solutions officer.
Nelson says NEHI's "compact action briefs" suggest that payment bundling is one answer to wasteful spending. However, while hospitalists agree the payment system needs work, they caution against the potential consequences of such a drastic shift.
"It really makes the case to move away from the fee-for-service model," Nelson says. "What we need to do is redesign the system to cover the patient regardless of encounter or what the driver is."