User login
Glycemic Control in Academic Hospitals
Hyperglycemia is a common occurrence in hospitalized patients, with and without a prior diagnosis of diabetes mellitus.13 Estimates of prevalence of diabetes mellitus in hospitalized adult patients range from 12% to 25%.4 Hyperglycemia is a strong predictor of adverse clinical outcome in a range of diseases such as acute stroke, congestive heart failure, community‐acquired pneumonia, and acute myocardial infarction.58 Hyperglycemia is also a risk factor for surgical infection in patients undergoing cardiac surgery.9, 10 A landmark prospective randomized controlled clinical trial by van den Berghe et al.11 demonstrated that tight glucose control (target blood glucose level 80110 mg/dL) with intravenous insulin in critically ill surgical patients led to dramatic reductions in acute renal failure, critical illness polyneuropathy, hospital mortality, and bloodstream infection. Other clinical studies have demonstrated that glycemic control with intravenous insulin improves clinical outcomes and reduces length of stay in patients with diabetes undergoing cardiac surgery.12, 13
Based upon these findings, the American College of Endocrinology (ACE) published recommendations in 2004 for hospital diabetes and metabolic control.14 Similar recommendations for hospital glycemic control have been included in the American Diabetes Association (ADA) guidelines since 2005.15 There is now emerging consensus that use of continuous insulin infusion given through a standardized protocol is the standard of care to control hyperglycemia in critically ill patients.1618 Likewise, use of specific hospital insulin regimens that include basal and short‐acting insulin with appropriate bedside glucose monitoring and avoiding use of sliding scale short‐acting insulin alone has become recognized as the most effective approach for glucose management in hospitalized patients not requiring intravenous insulin.4, 1921
The University HealthSystem Consortium (UHC) is an alliance of 97 academic health centers and 153 of their associated hospitals that conducts benchmarking studies on clinical and operational topics with member academic medical centers and develops new programs to improve quality of care, patient safety, and operational, clinical, and financial performance. In late 2004, UHC launched the Glycemic Control Benchmarking Project to determine the current status of glycemic control in adult patients admitted to academic medical centers, types of treatment employed to control glucose, and operational measures and practices of care for glycemic control in the hospital setting. The goal of the project was to describe contemporary glucose management for the purpose of identifying best practices. The information was later shared with each participating medical center to allow them to better align care delivery with ADA and ACE guidelines. Thirty‐seven academic medical centers agreed to participate and submit patient level data as well as an operational survey of current policies and practices for hospital glycemic control. This report summarizes the key findings from retrospective analyses of hospital and patient‐level data and describes contemporary management of hyperglycemia in academic medical centers.
PATIENTS AND METHODS
To be eligible for the study, hospital patients at each participating medical center had to be 18 years of age, have a 72‐hour or longer length of stay, and be admitted with 1 or more of the following Diagnostic‐related group (DRG) codes: 89 (simple pneumonia/ pleurisy), 109 (coronary artery bypass grafting without catheterization), 127 (heart failure and shock), 143 (chest pain), 209 (joint/limb procedure), 316 (renal failure), 478 (other vascular procedures), or 527 (percutaneous intervention with drug eluting stent without acute myocardial infarction). The DRG codes were selected from analysis of the UHC Clinical Data Base because they were the most common adult medical and surgical admission codes that included diabetes as a secondary diagnosis for academic medical centers and were believed to best represent the majority of hospital admissions. Each participating medical center received a secure electronic listing of their eligible patients discharged between July 1, 2004 and September 30, 2004 from the UHC Clinical Data Base. Each center identified data extractors who were trained via teleconference and received technical and content support by UHC staff. The data were collected by chart review and submitted electronically to UHC from February to April 2005.
For each medical center, patients were screened in reverse chronological order proceeding back in time until the minimum number of 50 eligible cases was obtained or until all potential cases were screened. Although 50 cases was the recommended minimum sample size per site, each medical center was encouraged to submit as many eligible cases as possible. The median number of cases submitted by site was 50 (interquartile range [IQR], 4251). Cases were entered into the study if they met the eligibility criteria and at least one of the following inclusion criteria: (1) two consecutive blood glucose readings >180 mg/dL within a 24hour period, or (2) insulin treatment at any time during the hospitalization. Exclusion criteria included history of pancreatic transplant, pregnancy at time of admission, hospice or palliative care during hospital admission, and patients who received insulin for a reason other than blood glucose control (ie, hyperkalemia). Early in the data collection, DRG 209 was dropped from potential screening due to the low yield of meeting screening criteria for blood glucose readings. Of the 315 cases screened for DRG 209 only 44 met all inclusion criteria and remain in the study population.
A maximum of 3 consecutive days of blood glucose (BG) readings were collected for each patient, referred to as measurement day 1, measurement day 2, and measurement day 3. Measurement day 1 is defined as the day the first of 2 consecutive blood glucose levels >180 mg/dL occurred during the hospitalization or as the first day insulin was administered during the hospitalization, whichever came first; 40.6% of patients had the day of admission as their first measurement day. Glucose measurements were recorded by hour for each measurement day as available, and if more than 1 glucose value was available within a particular hour, only the first result was recorded. Both bedside and laboratory serum glucose values were utilized, and glycosylated hemoglobin (A1C) values were included if they were recorded during the hospitalization or within 30 days prior to admission;22 95.7% of patients had BG results reported for all 3 measurement days. We defined estimated 6 AM glucose for each subject as: the 6 AM glucose if it was available; otherwise the average of the 5 AM and 7 AM glucose values if at least 1 of them was available; otherwise the average of the 4 AM and 8 AM glucose values if at least 1 of them was available. Relevant demographics, medical history, hospitalization details, type and route of insulin administration, and discharge data were also collected. For subcutaneous insulin administration, use of regular, lispro, or aspart insulin was classified as short‐acting insulin; use of neutral protamine Hagedorn (NPH), ultralente, or glargine insulin was classified as long‐acting insulin. For analysis of glycemic control measures, patient‐days in which location or glucose data were not recorded were excluded from analysis. For the analysis comparing subcutaneous versus intravenous insulin treatment on glucose control, patients who received a combination of therapy with subcutaneous and intravenous insulin on the same measurement day were excluded from the analysis (44 patients on day 1, 96 on day 2, and 47 on day 3). For this retrospective analysis, UHC provided a deidentified data set to the authors. The study protocol was reviewed by the Vanderbilt University Institutional Review Board and deemed to be nonhuman subject research since the data set contained no personal or institutional identifiers. Therefore, no informed consent of subjects was required.
Measures of glucose control (median glucose and estimated 6 AM glucose) were analyzed by patient‐day,23 and were compared by a Wilcoxon rank sum test or an analysis of variance, as indicated. P values <0.05 were considered significant. To compare effects of intravenous (IV) insulin, subcutaneous long‐acting short‐acting insulin, and subcutaneous short‐acting insulin use alone on glycemic control, mixed effects linear regression modeling for median glucose and mixed effects logistic regression modeling for hyperglycemia and hypoglycemia were used to adjust for fixed effects of age, gender, diabetes status, all patient refined diagnosis related groups (APR‐DRG) severity of illness score, outpatient diabetes treatment, patient location, admission diagnosis, and random effect of hospital site. Separate regression models were performed for measurement days 2 and 3. Statistical analyses were performed with Stata version 8 (Stata Corporation, College Station, TX), R version 2.1.0 (R Foundation for Statistical Computing, Vienna, Austria;
RESULTS
Thirty‐seven US academic medical centers from 24 states contributed to the analysis. A total of 4,367 cases meeting age, length of stay, and DRG criteria were screened for inclusion in the study; 2,649 (60.7%) screened cases were excluded due to failure to meet inclusion criteria (51%) or presence of exclusionary conditions (9.7%); 1,718 (39.3%) screened cases met all criteria and were included in this analysis. Patient characteristics are summarized in Table 1. A majority of patients (79%) had a documented history of diabetes, and most of these were classified as type 2 diabetes in the hospital record. Of the patients who were classified as having diabetes on admission, 50.8% were on some form of outpatient insulin therapy with or without oral diabetes agents. Patients with a diagnosis of diabetes had a median admission glucose of 158 mg/dL (IQR, 118221), which was significantly higher than the median admission glucose of 119 mg/dL (IQR, 100160) for patients without diabetes (P < 0.001, rank‐sum test).
| |
| n | 1718 |
| Age (years), median (IQR) | 65 (5674) |
| Male | 928 (54) |
| Female | 790 (46) |
| Admission glucose (mg/dL) | 149 (111207) |
| Race/Ethnicity | |
| White | 1048 (61.0) |
| Black | 480 (27.9) |
| Hispanic | 67 (3.9) |
| Other | 123 (7.2) |
| Diabetes history | 1358 (79.0) |
| Type 2 diabetes mellitus | 996 (58.0) |
| Type 1 diabetes mellitus | 128 (7.5) |
| Unspecified/other diabetes mellitus | 234 (13.6) |
| No history of diabetes mellitus | 360 (21.0) |
| Outpatient diabetes treatment | |
| Insulin only | 522 (30.4) |
| Oral agents only | 505 (29.4) |
| Insulin and oral agents | 168 (9.8) |
| No drug therapy | 137 (8.0) |
| Not documented | 26 (1.5) |
| Hospitalization DRG | |
| 127 Heart failure | 443 (25.8) |
| 109 Coronary artery bypass grafting | 389 (22.6) |
| 316 Renal failure | 251 (14.6) |
| 478 Other vascular procedure | 195 (11.4) |
| 89 Pneumonia | 186 (10.8) |
| 527 Percutaneous intervention with stent | 136 (7.9) |
| 143 Chest pain | 74 (4.3) |
| 209 Joint/limb procedure | 44 (2.6) |
| Primary insurer | |
| Medicare | 961 (56.0) |
| Private/commercial | 392 (22.8) |
| Medicaid | 200 (11.6) |
| Government | 88 (5.1) |
| Self‐pay | 67 (3.9) |
| Other/unknown | 10 (0.6) |
To determine overall glycemic control for the cohort, median glucose was calculated for each patient, stratified by diabetes status and location for each measurement day (Table 2). Patient‐days with a location of emergency department (96 patients on day 1, 6 on day 2, and 2 on day 3) and two patients whose location was not defined were excluded from the analysis. Overall, median glucose declined from measurement day 1 to day 3. For patients with diabetes, median glucose was significantly lower in the intensive care unit (ICU) compared to the general ward or intermediate care for measurement days 1 and 2, but not day 3. This difference was more pronounced in patients without diabetes, with median glucose significantly lower in the ICU for all 3 measurement days compared to other locations. As expected, median glucose was lower for patients without diabetes compared to patients with diabetes for all measurement days and locations. Hyperglycemia was common; 867 of 1,718 (50%) patients had at least 1 glucose measurement 180 mg/dL on both days 2 and 3; 18% of all patients had a median glucose 180 mg/dL on all 3 measurement days. Daily 6 AM glucose was the summary glycemic control measure in the clinical trial by van den Berghe et al.,11 with goal glucose of 80 to 110 mg/dL in the intensive treatment group. Since the glycemic target of the American College of Endocrinology Position Statement is <110 mg/dL (based largely on van den Berghe et al.11) we also calculated estimated 6 AM glucose for ICU patient‐days to determine the proportion of patients attaining this target.14 Estimated 6 AM glucose was lower in ICU patients without diabetes compared to those with diabetes. For patients with diabetes, only 20% of patients in the ICU had an estimated 6 AM glucose 110 mg/dL on measurement day 2, and only 24% on day 3. For patients without diabetes, 27% and 25% had an estimated 6 AM glucose 110 mg/dL on days 2 and 3, respectively.
| Measurement by Location | |||
|---|---|---|---|
| Day 1 | Day 2 | Day 3 | |
| |||
| Patients with diabetes | |||
| Estimated 6 AM glucose (mg/dL) | |||
| Intensive care unit | 153.0 (119.0204.0) | 148.0 (118.0183.0) | 144.0 (113.0191.0) |
| n | 167 | 231 | 161 |
| Median glucose (mg/dL) | |||
| General floor | 186.0 (151.0229.0) | 163.0 (131.0210.0) | 161.0 (127.0203.4) |
| n | 681 | 757 | 758 |
| Intermediate care | 193.0 (155.3233.8) | 170.0 (137.0215.5) | 169.0 (137.9215.6) |
| n | 291 | 333 | 348 |
| Intensive care unit | 177.5 (149.6213.6) | 152.5 (128.3187.0) | 156.5 (124.5194.3) |
| n | 294 | 247 | 175 |
| P value* | 0.038 | <0.001 | 0.068 |
| Patients without diabetes | |||
| Estimated 6 AM glucose (mg/dL) | |||
| Intensive care unit | 133.0 (104.5174.0) | 134.0 (109.0169.0) | 128.0 (111.5151.3) |
| n | 98 | 157 | 80 |
| Median glucose (mg/dL) | |||
| General floor | 179.0 (149.5209.5) | 161.3 (131.4188.3) | 143.5 (122.0170.0) |
| n | 91 | 96 | 133 |
| Intermediate care | 168.3 (138.1193.8) | 137.0 (119.8161.5) | 129.3 (116.3145.5) |
| n | 46 | 71 | 86 |
| Intensive care unit | 153.8 (132.9188.8) | 136.5 (120.0157.0) | 129.0 (116.0143.8) |
| n | 218 | 186 | 106 |
| P value* | <0.001 | <0.001 | <0.001 |
For the overall cohort, insulin was the most common treatment for hyperglycemia, with 84.6% of all patients receiving some form of insulin therapy on the second measurement day. On the second day, 30.8% received short‐acting subcutaneous insulin only, 8.2% received intravenous insulin infusion, 22.5% received both short‐acting and long‐acting subcutaneous insulin, 3.9% received oral agents, 23% received some combination of insulin therapies and/or oral agents, and 11.9% received no treatment. To determine the effect of intravenous versus subcutaneous insulin treatment on glycemic control, we compared patients by insulin treatment and location for each measurement day (Table 3). Intravenous insulin was used predominantly in the ICU, and was associated with significantly lower median glucose compared to subcutaneous insulin in both locations for all 3 measurement days. As expected, the average number of glucose measures per patient was significantly higher for those receiving intravenous insulin. Intravenous insulin use in the ICU was associated with a significantly lower number of patients with hyperglycemia, defined as the number who had 1 or more glucose values 180 mg/dL during a given measurement day. Of note, intravenous insulin use in the ICU was associated with a significantly higher proportion of patients who had hypoglycemia (defined as the number of patients who had one or more glucose values <70 mg/dL) compared to subcutaneous insulin only on measurement day 1 (8.1% versus 2.9%; P = 0.021), but not on days 2 (12.7% versus 8.0%; P > 0.05) or 3 (12.7% versus 7.8%; P > 0.05). Severe hypoglycemia, defined as a blood glucose recording <50 mg/dL,24 was rare, and occurred in only 2.8% of all patient days. On measurement day 1, 34 patients had a total of 49 severe hypoglycemic events; on day 2, 54 patients had 68 severe hypoglycemic events; on day 3, 54 patients had 68 severe hypoglycemic events. Only 3 patients had severe hypoglycemic events on all 3 measurement days. Analysis of severe hypoglycemia events stratified by intravenous versus subcutaneous insulin did not show any significant differences for any of the 3 measurement days (data not shown).
| Location/Day | Outcome | Intravenous Insulin | Subcutaneous Insulin | P Value* |
|---|---|---|---|---|
| ||||
| Intensive Care Unit, Day 1 | Patient's glucose, median (mg/dL) | 148.0 | 183.0 | <0.001 |
| Interquartile range | 128.0178.0 | 154.8211.0 | ||
| Hypoglycemic patients, n (%) | 16 (8.1) | 6 (2.9) | 0.021 | |
| Hyperglycemic patients, n (%) | 130 (66.0) | 175 (85.0) | <0.001 | |
| Average glucose measures/patient | 8.4 | 4.8 | <0.001 | |
| Patients, n | 197 | 206 | ||
| Intermediate/General Ward, Day 1 | Patient's glucose, median (mg/dL) | 152.0 | 186.5 | <0.001 |
| Interquartile range | 131.0164.5 | 150.0230.0 | ||
| Hypoglycemic patients, n (%) | 1 (4.1) | 71 (7.4) | ns | |
| Hyperglycemic patients, n (%) | 18 (78.3) | 808 (83.9) | ns | |
| Average glucose measures/patient | 9.7 | 3.8 | <0.001 | |
| Patients, n | 23 | 962 | ||
| Intensive Care Unit, Day 2 | Patient's glucose, median (mg/dL) | 124.8 | 159.8 | <0.001 |
| Interquartile range | 110.4140.5 | 138.6197.4 | ||
| Hypoglycemic patients, n (%) | 15 (12.7) | 14 (8.0) | ns | |
| Hyperglycemic patients, n (%) | 53 (44.9) | 135 (76.7) | <0.001 | |
| Average glucose measures/patient | 12.5 | 5.3 | <0.001 | |
| Patients, n | 118 | 176 | ||
| Intermediate/General Ward, Day 2 | Patient's glucose, median (mg/dL) | 136.0 | 168.8 | <0.001 |
| Interquartile range | 116.0168.0 | 136.1215.5 | ||
| Hypoglycemic patients, n (%) | 2 (6.7) | 113 (11.3) | ns | |
| Hyperglycemic patients, n (%) | 18 (60.0) | 784 (78.6) | 0.015 | |
| Average glucose measures/patient | 11.0 | 4.6 | <0.001 | |
| Patients, n | 30 | 996 | ||
| Intensive Care Unit, Day 3 | Patient's glucose, median (mg/dL) | 123.5 | 171.0 | <0.001 |
| Interquartile range | 110.0137.1 | 137.3198.5 | ||
| Hypoglycemic patients, n (%) | 7 (12.7) | 11 (7.8) | ns | |
| Hyperglycemic patients, n (%) | 24 (43.6) | 101 (71.1) | <0.001 | |
| Average glucose measures/patient | 11.4 | 4.8 | <0.001 | |
| Patients, n | 54 | 141 | ||
| Intermediate/General Ward, Day 3 | Patient's glucose, median (mg/dL) | 129.8 | 166.0 | <0.001 |
| Interquartile range | 120.5142.3 | 131.5208.0 | ||
| Hypoglycemic patients, n (%) | 3 (13.6) | 104 (9.8) | ns | |
| Hyperglycemic patients, n (%) | 13 (59.1) | 773 (72.7) | ns | |
| Average glucose measures/patient | 10.3 | 4.3 | <0.001 | |
| Patients, n | 22 | 1,055 | ||
We hypothesized that use of subcutaneous long‐acting (basal) insulin (with or without short‐acting insulin) would be associated with superior glucose control compared to use of subcutaneous short‐acting insulin (sliding scale and/or scheduled prandial insulin) alone. We performed an exploratory multivariate regression analysis to compare the effect of IV insulin, long acting subcutaneous insulin short acting insulin, or short acting subcutaneous insulin alone on median glucose, hyperglycemic events (glucose 180 mg/dL), and hypoglycemic events (glucose <70 mg/dL) for days 2 and 3 (Table 4). Compared to short‐acting subcutaneous insulin alone, use of IV insulin but not long‐acting subcutaneous insulin was predictive of lower median glucose for days 2 and 3. Use of long‐acting subcutaneous insulin was not associated with significantly lower odds of hyperglycemic events for days 2 and 3, but was associated with higher odds of hypoglycemic events on day 2 (odds ratio [OR], 1.8; P = 0.01) when compared to short‐acting subcutaneous insulin alone.
| Glucose Control Measure | Intravenous Insulin Infusion | Long‐Acting Subcutaneous Insulin |
|---|---|---|
| ||
| Median glucose | ||
| Day 2, n = 1,297 | 32.0 (45.4 to 18.5); P < 0.001* | 5.1 (13.8 to 3.6); P = 0.25* |
| Day 3, n = 1,251 | 33.0 (48.9 to 17); P < 0.001* | 3.4 (5.2 to 11.9); P = 0.44* |
| Patient has 1 hyperglycemic event | ||
| Day 2, n = 1,298 | 0.4 (0.20.6); P < 0.001 | 0.7 (0.51.1); P = 0.11 |
| Day 3, n = 1,261 | 0.6 (0.31.1); P = 0.11 | 0.8 (0.61.1); P = 0.24 |
| Patient has 1 hypoglycemic event | ||
| Day 2, n = 1,298 | 2.1 (1.04.7); P = 0.07 | 1.8 (1.22.9); P = 0.010 |
| Day 3, n = 1,261 | 4.0 (1.69.8); P = 0.003 | 1.4 (0.92.3); P = 0.13 |
We measured the performance of recommended hospital diabetes care practices (A1C assessment, documentation of diabetes history in the hospital record, admission laboratory glucose assessment, bedside glucose monitoring, recommended insulin therapy)14, 15 for all study patients, and also stratified performance by hospital (Table 5); 98.6% of all patients with a diagnosis of diabetes had physician documentation of their diabetes status recorded in the hospital record, and there was consistently high performance of this by hospital (Table 5); 77% of all patients with a history of diabetes had a laboratory blood glucose result recorded within 8 hours of hospital admission, and 81.3% of patients with a history of diabetes had blood glucose monitored at least 4 times on measurement day 2. Performance by hospital (Table 5) varied widely for glucose monitoring (range, 56.5%95.5% of patients by hospital) and admission laboratory glucose assessment (range, 39.0%97.1% of patients by hospital).
| Diabetes Care Measure | Mean Hospital Performance (%) | Standard Deviation (%) | Range (%) |
|---|---|---|---|
| |||
| Physician documentation of diabetes history in medical record | 98.8 | 2.1 | 91.5100 |
| A1C assessment documented for diabetes patients (measured during hospitalization or within 30 days prior to admission) | 33.7 | 15.4 | 3.162.9 |
| Laboratory glucose assessment within 8 hours of hospital presentation for diabetes patients | 77.0 | 13.4 | 39.097.1 |
| Blood glucose monitoring at least 4 times on second measurement day for diabetes patients | 81.6 | 10.8 | 56.595.5 |
| Percentage of patients receiving insulin therapy who were given short and long‐acting insulin OR IV insulin infusion OR insulin pump therapy on second measurement day | 44.9 | 14.3 | 12.176.5 |
Of all patients, 31% had A1C measurement recorded during their hospitalization or within 30 days prior to admission. There was wide variation in hospital performance of A1C assessment in patients with diabetes (Table 5). Patients with a diagnosis of diabetes had a median A1C of 7.4% (IQR, 6.4%8.9%; n = 473), and those without a diagnosis of diabetes had a median A1C of 5.9% (IQR, 5.6%6.4%; n = 70). Of the patients with a history of diabetes who had A1C recorded, 59% had a value >7%. Of the patients without a history of diabetes who had A1C recorded, 43% had a value >6.0%, suggesting previously undiagnosed diabetes.25
We found wide variation among hospitals (range, 12.1%76.5%) in use of recommended regimens of insulin therapy, defined as short‐acting and long‐acting subcutaneous insulin or IV insulin infusion or insulin pump therapy on second measurement day. Endocrine/diabetes consultation was infrequent, only 9% of all patients were evaluated by an endocrinologist or diabetologist at any time during the hospitalization.
DISCUSSION
In this retrospective analysis of hospitalized patients who had 2 consecutive blood glucose values 180 mg/dL and/or received insulin therapy, hyperglycemia was common and hypoglycemia was infrequent. Use of intravenous insulin was associated with better glucose control, and did not increase the frequency of severe hypoglycemic events (glucose <50 mg/dL). The majority of patients with a history of diabetes had physician documentation in the hospital chart, laboratory serum glucose obtained within 8 hours of hospital admission, and at least 4 blood glucose determinations on the second measurement day.
Only 35% of patients with diabetes had an A1C measurement and of these almost 60% had an A1C level >7%. Though the A1C may not greatly affect acute glucose management in the hospital setting, it does identify patients that may require intensification of diabetes therapy at hospital discharge and coordination of outpatient follow‐up. A report of a UHC clinical benchmarking project of ambulatory diabetes care in academic medical centers demonstrated high rates of diagnostic testing, but only 34% of patients were at the A1C goal, and only 40% of patients above the A1C goal had adjustment of their diabetes regimen at their last clinic visit.26 In a retrospective study of patients with diabetes mellitus admitted to an academic teaching hospital, only 20% of discharges indicated a plan for diabetes follow‐up.27 Thus, intensification of antihyperglycemic therapy and formulation of a diabetes follow‐up plan on hospital discharge in those patients with A1C >7% represents an opportunity to improve glycemic control in the ambulatory setting. Also, measurement of A1C can be used for diabetes case‐finding in hospitalized patients with hyperglycemia.25 Previously unrecognized diabetes is a common finding in patients admitted with cardiovascular disease. In a study of patients admitted with myocardial infarction, 25% were found to have previously undiagnosed diabetes.28 Hospital patients with hyperglycemia but without a prior diagnosis of diabetes who have an elevation of A1C >6.0% can be identified as at‐risk for diabetes and postdischarge glucose evaluation can be arranged.
The target of maintaining all glucose values 180 mg/dL recommended in the 20052007 American Diabetes Association guidelines for hospital diabetes management was not commonly achieved, with over 70% of patients who received subcutaneous insulin therapy having 1 or more glucose values >180 on all 3 measurement days, regardless of patient location.15 The target of maintaining critically ill patients as close to 110 mg/dL as possible was also difficult to achieve, with only 25% of ICU patients having an estimated 6 AM glucose <110 mg/dL on measurement day 3. A prospective cohort study of 107 inpatients with diabetes at Brigham and Women's Hospital showed a 76% prevalence of patients with at least one BG >180 mg/dL.29 In that study, 90% of patients had a sliding‐scale order, 36% received an oral diabetes agent, and 43% received basal insulin at some time during hospitalization. A recently published analysis by Wexler et al.30 compiled data of hospitalized patients with diabetes from an earlier 2003 UHC Diabetes Benchmarking Project (n = 274) and patients from 15 not‐for‐profit member hospitals of VHA, Incorporated (n = 725) to examine the prevalence of hyperglycemia and hypoglycemia. Hyperglycemia (defined as a single BG value >200 mg/dL) was common, occurring in 77% of patients in the UHC cohort and 76% in the VHA, Inc. cohort. This was comparable to our findings that 76.7% of ICU patients and 78.6% of ward patients treated with subcutaneous insulin had 1 or more BG values 180 mg/dL on measurement day 2. Wexler et al.30 also determined that use of basal insulin was associated with a higher prevalence of hyperglycemia and hypoglycemia in their study. Our regression analysis finding that long‐acting (basal) insulin use was not associated with improvement in glycemic control is consistent with the findings of the aforementioned study. There are a number of potential explanations for this: (1) underdosing of basal insulin or lack of adequate prandial insulin coverage for nutritional intake; (2) lack of effective titration in response to hyperglycemia; and (3) variation in the ordering and administration of basal insulin at different hospital sites.
Use of both manual and computerized IV insulin protocols has been shown to provide effective glucose control in critically ill patients.1618 Though intravenous insulin use was associated with better overall glucose control in our study; only about 50% of ICU patients received it on measurement day 1. A recent prospective randomized clinical trial demonstrated superior glycemic control in noncritically ill hospitalized patients with type 2 diabetes with basal/bolus insulin therapy compared to sliding scale insulin alone.31 Use of basal/bolus insulin regimens as part of a comprehensive hospital diabetes management program has been shown to improve glycemic control in an academic medical center.20 Therefore, we do not believe that our regression analysis findings invalidate the concept of basal/bolus insulin for inpatients with hyperglycemia, but rather indicate the need for more research into subcutaneous insulin regimens and hospital care practices that lead to improved glucose control. We found wide variation in hospital use of basal/bolus insulin regimens. Overall only 22.5% of all patients on the second measurement day received both short‐acting and long‐acting subcutaneous insulin, compared to 30.8% who received short‐acting subcutaneous insulin only. A recent consensus statement on inpatient glycemic control by the American College of Endocrinology and American Diabetes Association highlighted the systematic barriers to improved glycemic control in hospitals, such as inadequate knowledge of diabetes management techniques, fear of hypoglycemia, and skepticism about benefits of tighter glucose control.32
There are some important limitations to this study. The data are retrospective and only a limited number of hospital days and clinical variables could be assessed for each patient. As indicated in Table 3, there were significant differences in the frequency of glucose measurement depending on treatment, which can potentially bias estimated prevalence of hyperglycemia and hypoglycemia. We did not have a practical method to assess nutritional status or the adequacy of insulin dosing over time for each patient. We also could not assess the association of glycemic control on clinical outcomes such as hospital mortality or infection rates. Since this study was exclusively in academic medical centers, the generalization of findings to community‐based medical centers may be limited. The risk‐benefit of tight glycemic control in medical ICU patients based on clinical trial evidence has been unclear, and there is not broad agreement among clinicians on the recommended target for glycemic control in this group.3335 When we analyzed glycemic control in ICU patients we did not have a practical method to control for type of ICU and variations in individual ICU glycemic control targets. We recognize that the 2004 American College of Endocrinology recommendation of maintaining glucose 110 mg/dL may not be appropriate for all critically ill patients.14 Finally, clinical trial data are lacking on the effect of tight glucose control on major clinical outcomes for noncritically ill hospital patients. This has led to significant controversy regarding glycemic targets for different subgroups of hospitalized patients.34, 36
In summary, we found a high prevalence of persistent hyperglycemia in this large cohort of hospitalized patients, and hypoglycemia was infrequent. Use of IV insulin was associated with improvement in glycemic control, but was used in less than half of ICU patients. There was wide variation in hospital performance of recommended diabetes care measures. Opportunities to improve care in academic medical centers include expanded use of intravenous and subcutaneous basal/bolus insulin protocols and increased frequency of A1C testing.
- ,,, et al.Effects of admission hyperglycemia on mortality and costs in acute ischemic stroke.Neurology.2002;59:67–71.
- ,,,,,.Hyperglycemia: an independent marker of in‐hospital mortality in patients with undiagnosed diabetes.J Clin Endocrinol Metab.2002;87:978–982.
- ,,,,.Unrecognized diabetes among hospitalized patients.Diabetes Care.1998;21:246–249.
- ,,, et al.Management of diabetes and hyperglycemia in hospitals.Diabetes Care.2004;27:553–591.
- ,,.Admission plasma glucose. Independent risk factor for long‐term prognosis after myocardial infarction even in nondiabetic patients.Diabetes Care.1999;22:1827–1831.
- ,,,,.Stress hyperglycemia and prognosis of stroke in nondiabetic and diabetic patients: a systematic overview.Stroke.2001;32:2426–2432.
- ,,,.Stress hyperglycaemia and increased risk of death after myocardial infarction in patients with and without diabetes: a systematic overview.Lancet.2000;355:773–778.
- ,,,,,.The relation between hyperglycemia and outcomes in 2,471 patients admitted to the hospital with community‐acquired pneumonia.Diabetes Care.2005;28:810–815.
- ,,, et al.Modifiable risk factors associated with deep sternal site infection after coronary artery bypass grafting.J Thorac Cardiovasc Surg.2000;119:108–114.
- ,,,,.The association of diabetes and glucose control with surgical‐site infections among cardiothoracic surgery patients.Infect Control Hosp Epidemiol.2001;22:607–612.
- ,,, et al.Intensive insulin therapy in the critically ill patients.N Engl J Med.2001;345:1359–1367.
- ,,,,,.Tight glycemic control in diabetic coronary artery bypass graft patients improves perioperative outcomes and decreases recurrent ischemic events.Circulation.2004;109:1497–1502.
- ,,.Effect of hyperglycemia and continuous intravenous insulin infusions on outcomes of cardiac surgical procedures: the Portland Diabetic Project.Endocr Pract.2004;10(Suppl 2):21–33.
- ,,, et al.American College of Endocrinology position statement on inpatient diabetes and metabolic control.Endocr Pract.2004;10(Suppl 2):4–9.
- American Diabetes Association.Standards of medical care in diabetes.Diabetes Care.2005;28(Suppl 1):S4–S36.
- ,,, et al.Implementation of a safe and effective insulin infusion protocol in a medical intensive care unit.Diabetes Care.2004;27:461–467.
- ,,,,.Use of a computerized guideline for glucose regulation in the intensive care unit improved both guideline adherence and glucose regulation.J Am Med Inform Assoc.2005;12:172–180.
- ,,, et al.Computer‐based insulin infusion protocol improves glycemia control over manual protocol.J Am Med Inform Assoc.2007;14:278–287.
- ,,,,.Management of diabetes mellitus in hospitalized patients: efficiency and effectiveness of sliding‐scale insulin therapy.Pharmacotherapy.2006;26:1421–1432.
- ,,,.Eliminating inpatient sliding‐scale insulin: a reeducation project with medical house staff.Diabetes Care.2005;28:1008–1011.
- ,,.70/30 insulin algorithm versus sliding scale insulin.Ann Pharmacother.2005;39:1606–1610.
- ,,,.Glucose measurement: confounding issues in setting targets for inpatient management.Diabetes Care.2007;30:403–409.
- ,,, et al.“Glucometrics”—assessing the quality of inpatient glucose management.Diabetes Technol Ther.2006;8:560–569.
- American Diabetes Association.Hospital admission guidelines for diabetes.Diabetes Care.2004;27(Suppl 1):S103.
- ,,,,,,.Utility of HbA(1c) levels for diabetes case finding in hospitalized patients with hyperglycemia.Diabetes Care.2003;26:1064–1068.
- ,,.Quality of diabetes care in U.S. academic medical centers: low rates of medical regimen change.Diabetes Care.2005;28:337–442.
- ,,, et al.Diabetes care in the hospital: is there clinical inertia?J Hosp Med.2006;1:151–160.
- ,,, et al.Glucose metabolism in patients with acute myocardial infarction and no previous diagnosis of diabetes mellitus: a prospective study.Lancet.2002;359:2140–2144.
- ,,,,.Inpatient management of diabetes and hyperglycemia among general medicine patients at a large teaching hospital.J Hosp Med.2006;1:145–150.
- ,,,,.Prevalence of hyper‐ and hypoglycemia among inpatients with diabetes: a national survey of 44 U.S. hospitals.Diabetes Care.2007;30:367–369.
- ,,, et al.Randomized study of basal‐bolus insulin therapy in the inpatient management of patients with type 2 diabetes (RABBIT 2 trial).Diabetes Care.2007;30:2181–2186.
- The ACE/ADA Task Force on Inpatient Diabetes.American College of Endocrinology and American Diabetes Association Consensus Statement on Inpatient Diabetes and Glycemic Control: a call to action.Diabetes Care.2006;29:1955–1962.
- ,,, et al.Intensive insulin therapy in the medical ICU.N Engl J Med.2006;354:449–461.
- ,,.Tight blood glucose control with insulin in the ICU: facts and controversies.Chest.2007;132:268–278.
- ,,, et al.Intensive insulin therapy and pentastarch resuscitation in severe sepsis.NEngl J Med.2008;358:125–139.
- ,.Counterpoint: Inpatient glucose management: a premature call to arms?Diabetes Care.2005;28:976–979.
Hyperglycemia is a common occurrence in hospitalized patients, with and without a prior diagnosis of diabetes mellitus.13 Estimates of prevalence of diabetes mellitus in hospitalized adult patients range from 12% to 25%.4 Hyperglycemia is a strong predictor of adverse clinical outcome in a range of diseases such as acute stroke, congestive heart failure, community‐acquired pneumonia, and acute myocardial infarction.58 Hyperglycemia is also a risk factor for surgical infection in patients undergoing cardiac surgery.9, 10 A landmark prospective randomized controlled clinical trial by van den Berghe et al.11 demonstrated that tight glucose control (target blood glucose level 80110 mg/dL) with intravenous insulin in critically ill surgical patients led to dramatic reductions in acute renal failure, critical illness polyneuropathy, hospital mortality, and bloodstream infection. Other clinical studies have demonstrated that glycemic control with intravenous insulin improves clinical outcomes and reduces length of stay in patients with diabetes undergoing cardiac surgery.12, 13
Based upon these findings, the American College of Endocrinology (ACE) published recommendations in 2004 for hospital diabetes and metabolic control.14 Similar recommendations for hospital glycemic control have been included in the American Diabetes Association (ADA) guidelines since 2005.15 There is now emerging consensus that use of continuous insulin infusion given through a standardized protocol is the standard of care to control hyperglycemia in critically ill patients.1618 Likewise, use of specific hospital insulin regimens that include basal and short‐acting insulin with appropriate bedside glucose monitoring and avoiding use of sliding scale short‐acting insulin alone has become recognized as the most effective approach for glucose management in hospitalized patients not requiring intravenous insulin.4, 1921
The University HealthSystem Consortium (UHC) is an alliance of 97 academic health centers and 153 of their associated hospitals that conducts benchmarking studies on clinical and operational topics with member academic medical centers and develops new programs to improve quality of care, patient safety, and operational, clinical, and financial performance. In late 2004, UHC launched the Glycemic Control Benchmarking Project to determine the current status of glycemic control in adult patients admitted to academic medical centers, types of treatment employed to control glucose, and operational measures and practices of care for glycemic control in the hospital setting. The goal of the project was to describe contemporary glucose management for the purpose of identifying best practices. The information was later shared with each participating medical center to allow them to better align care delivery with ADA and ACE guidelines. Thirty‐seven academic medical centers agreed to participate and submit patient level data as well as an operational survey of current policies and practices for hospital glycemic control. This report summarizes the key findings from retrospective analyses of hospital and patient‐level data and describes contemporary management of hyperglycemia in academic medical centers.
PATIENTS AND METHODS
To be eligible for the study, hospital patients at each participating medical center had to be 18 years of age, have a 72‐hour or longer length of stay, and be admitted with 1 or more of the following Diagnostic‐related group (DRG) codes: 89 (simple pneumonia/ pleurisy), 109 (coronary artery bypass grafting without catheterization), 127 (heart failure and shock), 143 (chest pain), 209 (joint/limb procedure), 316 (renal failure), 478 (other vascular procedures), or 527 (percutaneous intervention with drug eluting stent without acute myocardial infarction). The DRG codes were selected from analysis of the UHC Clinical Data Base because they were the most common adult medical and surgical admission codes that included diabetes as a secondary diagnosis for academic medical centers and were believed to best represent the majority of hospital admissions. Each participating medical center received a secure electronic listing of their eligible patients discharged between July 1, 2004 and September 30, 2004 from the UHC Clinical Data Base. Each center identified data extractors who were trained via teleconference and received technical and content support by UHC staff. The data were collected by chart review and submitted electronically to UHC from February to April 2005.
For each medical center, patients were screened in reverse chronological order proceeding back in time until the minimum number of 50 eligible cases was obtained or until all potential cases were screened. Although 50 cases was the recommended minimum sample size per site, each medical center was encouraged to submit as many eligible cases as possible. The median number of cases submitted by site was 50 (interquartile range [IQR], 4251). Cases were entered into the study if they met the eligibility criteria and at least one of the following inclusion criteria: (1) two consecutive blood glucose readings >180 mg/dL within a 24hour period, or (2) insulin treatment at any time during the hospitalization. Exclusion criteria included history of pancreatic transplant, pregnancy at time of admission, hospice or palliative care during hospital admission, and patients who received insulin for a reason other than blood glucose control (ie, hyperkalemia). Early in the data collection, DRG 209 was dropped from potential screening due to the low yield of meeting screening criteria for blood glucose readings. Of the 315 cases screened for DRG 209 only 44 met all inclusion criteria and remain in the study population.
A maximum of 3 consecutive days of blood glucose (BG) readings were collected for each patient, referred to as measurement day 1, measurement day 2, and measurement day 3. Measurement day 1 is defined as the day the first of 2 consecutive blood glucose levels >180 mg/dL occurred during the hospitalization or as the first day insulin was administered during the hospitalization, whichever came first; 40.6% of patients had the day of admission as their first measurement day. Glucose measurements were recorded by hour for each measurement day as available, and if more than 1 glucose value was available within a particular hour, only the first result was recorded. Both bedside and laboratory serum glucose values were utilized, and glycosylated hemoglobin (A1C) values were included if they were recorded during the hospitalization or within 30 days prior to admission;22 95.7% of patients had BG results reported for all 3 measurement days. We defined estimated 6 AM glucose for each subject as: the 6 AM glucose if it was available; otherwise the average of the 5 AM and 7 AM glucose values if at least 1 of them was available; otherwise the average of the 4 AM and 8 AM glucose values if at least 1 of them was available. Relevant demographics, medical history, hospitalization details, type and route of insulin administration, and discharge data were also collected. For subcutaneous insulin administration, use of regular, lispro, or aspart insulin was classified as short‐acting insulin; use of neutral protamine Hagedorn (NPH), ultralente, or glargine insulin was classified as long‐acting insulin. For analysis of glycemic control measures, patient‐days in which location or glucose data were not recorded were excluded from analysis. For the analysis comparing subcutaneous versus intravenous insulin treatment on glucose control, patients who received a combination of therapy with subcutaneous and intravenous insulin on the same measurement day were excluded from the analysis (44 patients on day 1, 96 on day 2, and 47 on day 3). For this retrospective analysis, UHC provided a deidentified data set to the authors. The study protocol was reviewed by the Vanderbilt University Institutional Review Board and deemed to be nonhuman subject research since the data set contained no personal or institutional identifiers. Therefore, no informed consent of subjects was required.
Measures of glucose control (median glucose and estimated 6 AM glucose) were analyzed by patient‐day,23 and were compared by a Wilcoxon rank sum test or an analysis of variance, as indicated. P values <0.05 were considered significant. To compare effects of intravenous (IV) insulin, subcutaneous long‐acting short‐acting insulin, and subcutaneous short‐acting insulin use alone on glycemic control, mixed effects linear regression modeling for median glucose and mixed effects logistic regression modeling for hyperglycemia and hypoglycemia were used to adjust for fixed effects of age, gender, diabetes status, all patient refined diagnosis related groups (APR‐DRG) severity of illness score, outpatient diabetes treatment, patient location, admission diagnosis, and random effect of hospital site. Separate regression models were performed for measurement days 2 and 3. Statistical analyses were performed with Stata version 8 (Stata Corporation, College Station, TX), R version 2.1.0 (R Foundation for Statistical Computing, Vienna, Austria;
RESULTS
Thirty‐seven US academic medical centers from 24 states contributed to the analysis. A total of 4,367 cases meeting age, length of stay, and DRG criteria were screened for inclusion in the study; 2,649 (60.7%) screened cases were excluded due to failure to meet inclusion criteria (51%) or presence of exclusionary conditions (9.7%); 1,718 (39.3%) screened cases met all criteria and were included in this analysis. Patient characteristics are summarized in Table 1. A majority of patients (79%) had a documented history of diabetes, and most of these were classified as type 2 diabetes in the hospital record. Of the patients who were classified as having diabetes on admission, 50.8% were on some form of outpatient insulin therapy with or without oral diabetes agents. Patients with a diagnosis of diabetes had a median admission glucose of 158 mg/dL (IQR, 118221), which was significantly higher than the median admission glucose of 119 mg/dL (IQR, 100160) for patients without diabetes (P < 0.001, rank‐sum test).
| |
| n | 1718 |
| Age (years), median (IQR) | 65 (5674) |
| Male | 928 (54) |
| Female | 790 (46) |
| Admission glucose (mg/dL) | 149 (111207) |
| Race/Ethnicity | |
| White | 1048 (61.0) |
| Black | 480 (27.9) |
| Hispanic | 67 (3.9) |
| Other | 123 (7.2) |
| Diabetes history | 1358 (79.0) |
| Type 2 diabetes mellitus | 996 (58.0) |
| Type 1 diabetes mellitus | 128 (7.5) |
| Unspecified/other diabetes mellitus | 234 (13.6) |
| No history of diabetes mellitus | 360 (21.0) |
| Outpatient diabetes treatment | |
| Insulin only | 522 (30.4) |
| Oral agents only | 505 (29.4) |
| Insulin and oral agents | 168 (9.8) |
| No drug therapy | 137 (8.0) |
| Not documented | 26 (1.5) |
| Hospitalization DRG | |
| 127 Heart failure | 443 (25.8) |
| 109 Coronary artery bypass grafting | 389 (22.6) |
| 316 Renal failure | 251 (14.6) |
| 478 Other vascular procedure | 195 (11.4) |
| 89 Pneumonia | 186 (10.8) |
| 527 Percutaneous intervention with stent | 136 (7.9) |
| 143 Chest pain | 74 (4.3) |
| 209 Joint/limb procedure | 44 (2.6) |
| Primary insurer | |
| Medicare | 961 (56.0) |
| Private/commercial | 392 (22.8) |
| Medicaid | 200 (11.6) |
| Government | 88 (5.1) |
| Self‐pay | 67 (3.9) |
| Other/unknown | 10 (0.6) |
To determine overall glycemic control for the cohort, median glucose was calculated for each patient, stratified by diabetes status and location for each measurement day (Table 2). Patient‐days with a location of emergency department (96 patients on day 1, 6 on day 2, and 2 on day 3) and two patients whose location was not defined were excluded from the analysis. Overall, median glucose declined from measurement day 1 to day 3. For patients with diabetes, median glucose was significantly lower in the intensive care unit (ICU) compared to the general ward or intermediate care for measurement days 1 and 2, but not day 3. This difference was more pronounced in patients without diabetes, with median glucose significantly lower in the ICU for all 3 measurement days compared to other locations. As expected, median glucose was lower for patients without diabetes compared to patients with diabetes for all measurement days and locations. Hyperglycemia was common; 867 of 1,718 (50%) patients had at least 1 glucose measurement 180 mg/dL on both days 2 and 3; 18% of all patients had a median glucose 180 mg/dL on all 3 measurement days. Daily 6 AM glucose was the summary glycemic control measure in the clinical trial by van den Berghe et al.,11 with goal glucose of 80 to 110 mg/dL in the intensive treatment group. Since the glycemic target of the American College of Endocrinology Position Statement is <110 mg/dL (based largely on van den Berghe et al.11) we also calculated estimated 6 AM glucose for ICU patient‐days to determine the proportion of patients attaining this target.14 Estimated 6 AM glucose was lower in ICU patients without diabetes compared to those with diabetes. For patients with diabetes, only 20% of patients in the ICU had an estimated 6 AM glucose 110 mg/dL on measurement day 2, and only 24% on day 3. For patients without diabetes, 27% and 25% had an estimated 6 AM glucose 110 mg/dL on days 2 and 3, respectively.
| Measurement by Location | |||
|---|---|---|---|
| Day 1 | Day 2 | Day 3 | |
| |||
| Patients with diabetes | |||
| Estimated 6 AM glucose (mg/dL) | |||
| Intensive care unit | 153.0 (119.0204.0) | 148.0 (118.0183.0) | 144.0 (113.0191.0) |
| n | 167 | 231 | 161 |
| Median glucose (mg/dL) | |||
| General floor | 186.0 (151.0229.0) | 163.0 (131.0210.0) | 161.0 (127.0203.4) |
| n | 681 | 757 | 758 |
| Intermediate care | 193.0 (155.3233.8) | 170.0 (137.0215.5) | 169.0 (137.9215.6) |
| n | 291 | 333 | 348 |
| Intensive care unit | 177.5 (149.6213.6) | 152.5 (128.3187.0) | 156.5 (124.5194.3) |
| n | 294 | 247 | 175 |
| P value* | 0.038 | <0.001 | 0.068 |
| Patients without diabetes | |||
| Estimated 6 AM glucose (mg/dL) | |||
| Intensive care unit | 133.0 (104.5174.0) | 134.0 (109.0169.0) | 128.0 (111.5151.3) |
| n | 98 | 157 | 80 |
| Median glucose (mg/dL) | |||
| General floor | 179.0 (149.5209.5) | 161.3 (131.4188.3) | 143.5 (122.0170.0) |
| n | 91 | 96 | 133 |
| Intermediate care | 168.3 (138.1193.8) | 137.0 (119.8161.5) | 129.3 (116.3145.5) |
| n | 46 | 71 | 86 |
| Intensive care unit | 153.8 (132.9188.8) | 136.5 (120.0157.0) | 129.0 (116.0143.8) |
| n | 218 | 186 | 106 |
| P value* | <0.001 | <0.001 | <0.001 |
For the overall cohort, insulin was the most common treatment for hyperglycemia, with 84.6% of all patients receiving some form of insulin therapy on the second measurement day. On the second day, 30.8% received short‐acting subcutaneous insulin only, 8.2% received intravenous insulin infusion, 22.5% received both short‐acting and long‐acting subcutaneous insulin, 3.9% received oral agents, 23% received some combination of insulin therapies and/or oral agents, and 11.9% received no treatment. To determine the effect of intravenous versus subcutaneous insulin treatment on glycemic control, we compared patients by insulin treatment and location for each measurement day (Table 3). Intravenous insulin was used predominantly in the ICU, and was associated with significantly lower median glucose compared to subcutaneous insulin in both locations for all 3 measurement days. As expected, the average number of glucose measures per patient was significantly higher for those receiving intravenous insulin. Intravenous insulin use in the ICU was associated with a significantly lower number of patients with hyperglycemia, defined as the number who had 1 or more glucose values 180 mg/dL during a given measurement day. Of note, intravenous insulin use in the ICU was associated with a significantly higher proportion of patients who had hypoglycemia (defined as the number of patients who had one or more glucose values <70 mg/dL) compared to subcutaneous insulin only on measurement day 1 (8.1% versus 2.9%; P = 0.021), but not on days 2 (12.7% versus 8.0%; P > 0.05) or 3 (12.7% versus 7.8%; P > 0.05). Severe hypoglycemia, defined as a blood glucose recording <50 mg/dL,24 was rare, and occurred in only 2.8% of all patient days. On measurement day 1, 34 patients had a total of 49 severe hypoglycemic events; on day 2, 54 patients had 68 severe hypoglycemic events; on day 3, 54 patients had 68 severe hypoglycemic events. Only 3 patients had severe hypoglycemic events on all 3 measurement days. Analysis of severe hypoglycemia events stratified by intravenous versus subcutaneous insulin did not show any significant differences for any of the 3 measurement days (data not shown).
| Location/Day | Outcome | Intravenous Insulin | Subcutaneous Insulin | P Value* |
|---|---|---|---|---|
| ||||
| Intensive Care Unit, Day 1 | Patient's glucose, median (mg/dL) | 148.0 | 183.0 | <0.001 |
| Interquartile range | 128.0178.0 | 154.8211.0 | ||
| Hypoglycemic patients, n (%) | 16 (8.1) | 6 (2.9) | 0.021 | |
| Hyperglycemic patients, n (%) | 130 (66.0) | 175 (85.0) | <0.001 | |
| Average glucose measures/patient | 8.4 | 4.8 | <0.001 | |
| Patients, n | 197 | 206 | ||
| Intermediate/General Ward, Day 1 | Patient's glucose, median (mg/dL) | 152.0 | 186.5 | <0.001 |
| Interquartile range | 131.0164.5 | 150.0230.0 | ||
| Hypoglycemic patients, n (%) | 1 (4.1) | 71 (7.4) | ns | |
| Hyperglycemic patients, n (%) | 18 (78.3) | 808 (83.9) | ns | |
| Average glucose measures/patient | 9.7 | 3.8 | <0.001 | |
| Patients, n | 23 | 962 | ||
| Intensive Care Unit, Day 2 | Patient's glucose, median (mg/dL) | 124.8 | 159.8 | <0.001 |
| Interquartile range | 110.4140.5 | 138.6197.4 | ||
| Hypoglycemic patients, n (%) | 15 (12.7) | 14 (8.0) | ns | |
| Hyperglycemic patients, n (%) | 53 (44.9) | 135 (76.7) | <0.001 | |
| Average glucose measures/patient | 12.5 | 5.3 | <0.001 | |
| Patients, n | 118 | 176 | ||
| Intermediate/General Ward, Day 2 | Patient's glucose, median (mg/dL) | 136.0 | 168.8 | <0.001 |
| Interquartile range | 116.0168.0 | 136.1215.5 | ||
| Hypoglycemic patients, n (%) | 2 (6.7) | 113 (11.3) | ns | |
| Hyperglycemic patients, n (%) | 18 (60.0) | 784 (78.6) | 0.015 | |
| Average glucose measures/patient | 11.0 | 4.6 | <0.001 | |
| Patients, n | 30 | 996 | ||
| Intensive Care Unit, Day 3 | Patient's glucose, median (mg/dL) | 123.5 | 171.0 | <0.001 |
| Interquartile range | 110.0137.1 | 137.3198.5 | ||
| Hypoglycemic patients, n (%) | 7 (12.7) | 11 (7.8) | ns | |
| Hyperglycemic patients, n (%) | 24 (43.6) | 101 (71.1) | <0.001 | |
| Average glucose measures/patient | 11.4 | 4.8 | <0.001 | |
| Patients, n | 54 | 141 | ||
| Intermediate/General Ward, Day 3 | Patient's glucose, median (mg/dL) | 129.8 | 166.0 | <0.001 |
| Interquartile range | 120.5142.3 | 131.5208.0 | ||
| Hypoglycemic patients, n (%) | 3 (13.6) | 104 (9.8) | ns | |
| Hyperglycemic patients, n (%) | 13 (59.1) | 773 (72.7) | ns | |
| Average glucose measures/patient | 10.3 | 4.3 | <0.001 | |
| Patients, n | 22 | 1,055 | ||
We hypothesized that use of subcutaneous long‐acting (basal) insulin (with or without short‐acting insulin) would be associated with superior glucose control compared to use of subcutaneous short‐acting insulin (sliding scale and/or scheduled prandial insulin) alone. We performed an exploratory multivariate regression analysis to compare the effect of IV insulin, long acting subcutaneous insulin short acting insulin, or short acting subcutaneous insulin alone on median glucose, hyperglycemic events (glucose 180 mg/dL), and hypoglycemic events (glucose <70 mg/dL) for days 2 and 3 (Table 4). Compared to short‐acting subcutaneous insulin alone, use of IV insulin but not long‐acting subcutaneous insulin was predictive of lower median glucose for days 2 and 3. Use of long‐acting subcutaneous insulin was not associated with significantly lower odds of hyperglycemic events for days 2 and 3, but was associated with higher odds of hypoglycemic events on day 2 (odds ratio [OR], 1.8; P = 0.01) when compared to short‐acting subcutaneous insulin alone.
| Glucose Control Measure | Intravenous Insulin Infusion | Long‐Acting Subcutaneous Insulin |
|---|---|---|
| ||
| Median glucose | ||
| Day 2, n = 1,297 | 32.0 (45.4 to 18.5); P < 0.001* | 5.1 (13.8 to 3.6); P = 0.25* |
| Day 3, n = 1,251 | 33.0 (48.9 to 17); P < 0.001* | 3.4 (5.2 to 11.9); P = 0.44* |
| Patient has 1 hyperglycemic event | ||
| Day 2, n = 1,298 | 0.4 (0.20.6); P < 0.001 | 0.7 (0.51.1); P = 0.11 |
| Day 3, n = 1,261 | 0.6 (0.31.1); P = 0.11 | 0.8 (0.61.1); P = 0.24 |
| Patient has 1 hypoglycemic event | ||
| Day 2, n = 1,298 | 2.1 (1.04.7); P = 0.07 | 1.8 (1.22.9); P = 0.010 |
| Day 3, n = 1,261 | 4.0 (1.69.8); P = 0.003 | 1.4 (0.92.3); P = 0.13 |
We measured the performance of recommended hospital diabetes care practices (A1C assessment, documentation of diabetes history in the hospital record, admission laboratory glucose assessment, bedside glucose monitoring, recommended insulin therapy)14, 15 for all study patients, and also stratified performance by hospital (Table 5); 98.6% of all patients with a diagnosis of diabetes had physician documentation of their diabetes status recorded in the hospital record, and there was consistently high performance of this by hospital (Table 5); 77% of all patients with a history of diabetes had a laboratory blood glucose result recorded within 8 hours of hospital admission, and 81.3% of patients with a history of diabetes had blood glucose monitored at least 4 times on measurement day 2. Performance by hospital (Table 5) varied widely for glucose monitoring (range, 56.5%95.5% of patients by hospital) and admission laboratory glucose assessment (range, 39.0%97.1% of patients by hospital).
| Diabetes Care Measure | Mean Hospital Performance (%) | Standard Deviation (%) | Range (%) |
|---|---|---|---|
| |||
| Physician documentation of diabetes history in medical record | 98.8 | 2.1 | 91.5100 |
| A1C assessment documented for diabetes patients (measured during hospitalization or within 30 days prior to admission) | 33.7 | 15.4 | 3.162.9 |
| Laboratory glucose assessment within 8 hours of hospital presentation for diabetes patients | 77.0 | 13.4 | 39.097.1 |
| Blood glucose monitoring at least 4 times on second measurement day for diabetes patients | 81.6 | 10.8 | 56.595.5 |
| Percentage of patients receiving insulin therapy who were given short and long‐acting insulin OR IV insulin infusion OR insulin pump therapy on second measurement day | 44.9 | 14.3 | 12.176.5 |
Of all patients, 31% had A1C measurement recorded during their hospitalization or within 30 days prior to admission. There was wide variation in hospital performance of A1C assessment in patients with diabetes (Table 5). Patients with a diagnosis of diabetes had a median A1C of 7.4% (IQR, 6.4%8.9%; n = 473), and those without a diagnosis of diabetes had a median A1C of 5.9% (IQR, 5.6%6.4%; n = 70). Of the patients with a history of diabetes who had A1C recorded, 59% had a value >7%. Of the patients without a history of diabetes who had A1C recorded, 43% had a value >6.0%, suggesting previously undiagnosed diabetes.25
We found wide variation among hospitals (range, 12.1%76.5%) in use of recommended regimens of insulin therapy, defined as short‐acting and long‐acting subcutaneous insulin or IV insulin infusion or insulin pump therapy on second measurement day. Endocrine/diabetes consultation was infrequent, only 9% of all patients were evaluated by an endocrinologist or diabetologist at any time during the hospitalization.
DISCUSSION
In this retrospective analysis of hospitalized patients who had 2 consecutive blood glucose values 180 mg/dL and/or received insulin therapy, hyperglycemia was common and hypoglycemia was infrequent. Use of intravenous insulin was associated with better glucose control, and did not increase the frequency of severe hypoglycemic events (glucose <50 mg/dL). The majority of patients with a history of diabetes had physician documentation in the hospital chart, laboratory serum glucose obtained within 8 hours of hospital admission, and at least 4 blood glucose determinations on the second measurement day.
Only 35% of patients with diabetes had an A1C measurement and of these almost 60% had an A1C level >7%. Though the A1C may not greatly affect acute glucose management in the hospital setting, it does identify patients that may require intensification of diabetes therapy at hospital discharge and coordination of outpatient follow‐up. A report of a UHC clinical benchmarking project of ambulatory diabetes care in academic medical centers demonstrated high rates of diagnostic testing, but only 34% of patients were at the A1C goal, and only 40% of patients above the A1C goal had adjustment of their diabetes regimen at their last clinic visit.26 In a retrospective study of patients with diabetes mellitus admitted to an academic teaching hospital, only 20% of discharges indicated a plan for diabetes follow‐up.27 Thus, intensification of antihyperglycemic therapy and formulation of a diabetes follow‐up plan on hospital discharge in those patients with A1C >7% represents an opportunity to improve glycemic control in the ambulatory setting. Also, measurement of A1C can be used for diabetes case‐finding in hospitalized patients with hyperglycemia.25 Previously unrecognized diabetes is a common finding in patients admitted with cardiovascular disease. In a study of patients admitted with myocardial infarction, 25% were found to have previously undiagnosed diabetes.28 Hospital patients with hyperglycemia but without a prior diagnosis of diabetes who have an elevation of A1C >6.0% can be identified as at‐risk for diabetes and postdischarge glucose evaluation can be arranged.
The target of maintaining all glucose values 180 mg/dL recommended in the 20052007 American Diabetes Association guidelines for hospital diabetes management was not commonly achieved, with over 70% of patients who received subcutaneous insulin therapy having 1 or more glucose values >180 on all 3 measurement days, regardless of patient location.15 The target of maintaining critically ill patients as close to 110 mg/dL as possible was also difficult to achieve, with only 25% of ICU patients having an estimated 6 AM glucose <110 mg/dL on measurement day 3. A prospective cohort study of 107 inpatients with diabetes at Brigham and Women's Hospital showed a 76% prevalence of patients with at least one BG >180 mg/dL.29 In that study, 90% of patients had a sliding‐scale order, 36% received an oral diabetes agent, and 43% received basal insulin at some time during hospitalization. A recently published analysis by Wexler et al.30 compiled data of hospitalized patients with diabetes from an earlier 2003 UHC Diabetes Benchmarking Project (n = 274) and patients from 15 not‐for‐profit member hospitals of VHA, Incorporated (n = 725) to examine the prevalence of hyperglycemia and hypoglycemia. Hyperglycemia (defined as a single BG value >200 mg/dL) was common, occurring in 77% of patients in the UHC cohort and 76% in the VHA, Inc. cohort. This was comparable to our findings that 76.7% of ICU patients and 78.6% of ward patients treated with subcutaneous insulin had 1 or more BG values 180 mg/dL on measurement day 2. Wexler et al.30 also determined that use of basal insulin was associated with a higher prevalence of hyperglycemia and hypoglycemia in their study. Our regression analysis finding that long‐acting (basal) insulin use was not associated with improvement in glycemic control is consistent with the findings of the aforementioned study. There are a number of potential explanations for this: (1) underdosing of basal insulin or lack of adequate prandial insulin coverage for nutritional intake; (2) lack of effective titration in response to hyperglycemia; and (3) variation in the ordering and administration of basal insulin at different hospital sites.
Use of both manual and computerized IV insulin protocols has been shown to provide effective glucose control in critically ill patients.1618 Though intravenous insulin use was associated with better overall glucose control in our study; only about 50% of ICU patients received it on measurement day 1. A recent prospective randomized clinical trial demonstrated superior glycemic control in noncritically ill hospitalized patients with type 2 diabetes with basal/bolus insulin therapy compared to sliding scale insulin alone.31 Use of basal/bolus insulin regimens as part of a comprehensive hospital diabetes management program has been shown to improve glycemic control in an academic medical center.20 Therefore, we do not believe that our regression analysis findings invalidate the concept of basal/bolus insulin for inpatients with hyperglycemia, but rather indicate the need for more research into subcutaneous insulin regimens and hospital care practices that lead to improved glucose control. We found wide variation in hospital use of basal/bolus insulin regimens. Overall only 22.5% of all patients on the second measurement day received both short‐acting and long‐acting subcutaneous insulin, compared to 30.8% who received short‐acting subcutaneous insulin only. A recent consensus statement on inpatient glycemic control by the American College of Endocrinology and American Diabetes Association highlighted the systematic barriers to improved glycemic control in hospitals, such as inadequate knowledge of diabetes management techniques, fear of hypoglycemia, and skepticism about benefits of tighter glucose control.32
There are some important limitations to this study. The data are retrospective and only a limited number of hospital days and clinical variables could be assessed for each patient. As indicated in Table 3, there were significant differences in the frequency of glucose measurement depending on treatment, which can potentially bias estimated prevalence of hyperglycemia and hypoglycemia. We did not have a practical method to assess nutritional status or the adequacy of insulin dosing over time for each patient. We also could not assess the association of glycemic control on clinical outcomes such as hospital mortality or infection rates. Since this study was exclusively in academic medical centers, the generalization of findings to community‐based medical centers may be limited. The risk‐benefit of tight glycemic control in medical ICU patients based on clinical trial evidence has been unclear, and there is not broad agreement among clinicians on the recommended target for glycemic control in this group.3335 When we analyzed glycemic control in ICU patients we did not have a practical method to control for type of ICU and variations in individual ICU glycemic control targets. We recognize that the 2004 American College of Endocrinology recommendation of maintaining glucose 110 mg/dL may not be appropriate for all critically ill patients.14 Finally, clinical trial data are lacking on the effect of tight glucose control on major clinical outcomes for noncritically ill hospital patients. This has led to significant controversy regarding glycemic targets for different subgroups of hospitalized patients.34, 36
In summary, we found a high prevalence of persistent hyperglycemia in this large cohort of hospitalized patients, and hypoglycemia was infrequent. Use of IV insulin was associated with improvement in glycemic control, but was used in less than half of ICU patients. There was wide variation in hospital performance of recommended diabetes care measures. Opportunities to improve care in academic medical centers include expanded use of intravenous and subcutaneous basal/bolus insulin protocols and increased frequency of A1C testing.
- ,,, et al.Effects of admission hyperglycemia on mortality and costs in acute ischemic stroke.Neurology.2002;59:67–71.
- ,,,,,.Hyperglycemia: an independent marker of in‐hospital mortality in patients with undiagnosed diabetes.J Clin Endocrinol Metab.2002;87:978–982.
- ,,,,.Unrecognized diabetes among hospitalized patients.Diabetes Care.1998;21:246–249.
- ,,, et al.Management of diabetes and hyperglycemia in hospitals.Diabetes Care.2004;27:553–591.
- ,,.Admission plasma glucose. Independent risk factor for long‐term prognosis after myocardial infarction even in nondiabetic patients.Diabetes Care.1999;22:1827–1831.
- ,,,,.Stress hyperglycemia and prognosis of stroke in nondiabetic and diabetic patients: a systematic overview.Stroke.2001;32:2426–2432.
- ,,,.Stress hyperglycaemia and increased risk of death after myocardial infarction in patients with and without diabetes: a systematic overview.Lancet.2000;355:773–778.
- ,,,,,.The relation between hyperglycemia and outcomes in 2,471 patients admitted to the hospital with community‐acquired pneumonia.Diabetes Care.2005;28:810–815.
- ,,, et al.Modifiable risk factors associated with deep sternal site infection after coronary artery bypass grafting.J Thorac Cardiovasc Surg.2000;119:108–114.
- ,,,,.The association of diabetes and glucose control with surgical‐site infections among cardiothoracic surgery patients.Infect Control Hosp Epidemiol.2001;22:607–612.
- ,,, et al.Intensive insulin therapy in the critically ill patients.N Engl J Med.2001;345:1359–1367.
- ,,,,,.Tight glycemic control in diabetic coronary artery bypass graft patients improves perioperative outcomes and decreases recurrent ischemic events.Circulation.2004;109:1497–1502.
- ,,.Effect of hyperglycemia and continuous intravenous insulin infusions on outcomes of cardiac surgical procedures: the Portland Diabetic Project.Endocr Pract.2004;10(Suppl 2):21–33.
- ,,, et al.American College of Endocrinology position statement on inpatient diabetes and metabolic control.Endocr Pract.2004;10(Suppl 2):4–9.
- American Diabetes Association.Standards of medical care in diabetes.Diabetes Care.2005;28(Suppl 1):S4–S36.
- ,,, et al.Implementation of a safe and effective insulin infusion protocol in a medical intensive care unit.Diabetes Care.2004;27:461–467.
- ,,,,.Use of a computerized guideline for glucose regulation in the intensive care unit improved both guideline adherence and glucose regulation.J Am Med Inform Assoc.2005;12:172–180.
- ,,, et al.Computer‐based insulin infusion protocol improves glycemia control over manual protocol.J Am Med Inform Assoc.2007;14:278–287.
- ,,,,.Management of diabetes mellitus in hospitalized patients: efficiency and effectiveness of sliding‐scale insulin therapy.Pharmacotherapy.2006;26:1421–1432.
- ,,,.Eliminating inpatient sliding‐scale insulin: a reeducation project with medical house staff.Diabetes Care.2005;28:1008–1011.
- ,,.70/30 insulin algorithm versus sliding scale insulin.Ann Pharmacother.2005;39:1606–1610.
- ,,,.Glucose measurement: confounding issues in setting targets for inpatient management.Diabetes Care.2007;30:403–409.
- ,,, et al.“Glucometrics”—assessing the quality of inpatient glucose management.Diabetes Technol Ther.2006;8:560–569.
- American Diabetes Association.Hospital admission guidelines for diabetes.Diabetes Care.2004;27(Suppl 1):S103.
- ,,,,,,.Utility of HbA(1c) levels for diabetes case finding in hospitalized patients with hyperglycemia.Diabetes Care.2003;26:1064–1068.
- ,,.Quality of diabetes care in U.S. academic medical centers: low rates of medical regimen change.Diabetes Care.2005;28:337–442.
- ,,, et al.Diabetes care in the hospital: is there clinical inertia?J Hosp Med.2006;1:151–160.
- ,,, et al.Glucose metabolism in patients with acute myocardial infarction and no previous diagnosis of diabetes mellitus: a prospective study.Lancet.2002;359:2140–2144.
- ,,,,.Inpatient management of diabetes and hyperglycemia among general medicine patients at a large teaching hospital.J Hosp Med.2006;1:145–150.
- ,,,,.Prevalence of hyper‐ and hypoglycemia among inpatients with diabetes: a national survey of 44 U.S. hospitals.Diabetes Care.2007;30:367–369.
- ,,, et al.Randomized study of basal‐bolus insulin therapy in the inpatient management of patients with type 2 diabetes (RABBIT 2 trial).Diabetes Care.2007;30:2181–2186.
- The ACE/ADA Task Force on Inpatient Diabetes.American College of Endocrinology and American Diabetes Association Consensus Statement on Inpatient Diabetes and Glycemic Control: a call to action.Diabetes Care.2006;29:1955–1962.
- ,,, et al.Intensive insulin therapy in the medical ICU.N Engl J Med.2006;354:449–461.
- ,,.Tight blood glucose control with insulin in the ICU: facts and controversies.Chest.2007;132:268–278.
- ,,, et al.Intensive insulin therapy and pentastarch resuscitation in severe sepsis.NEngl J Med.2008;358:125–139.
- ,.Counterpoint: Inpatient glucose management: a premature call to arms?Diabetes Care.2005;28:976–979.
Copyright © 2009 Society of Hospital Medicine
Paging goldilocks: How much glycemic control is just right?
There is no doubt that hyperglycemia among hospitalized patients correlates with worse prognosis. Further, there are well‐documented mechanisms by which poor glycemic control may directly impact outcomes. For example, hyperglycemia and insulin deficiency can impair neutrophil function, exacerbate inflammation, and impair endothelium‐mediated dilatation,1, 2 whereas hypoglycemia increases sympathetic tone. And both severe hyperglycemia and hypoglycemia, of course, can precipitate altered mental status. But certainly not all of the morbid outcomes associated with poor glycemic control in the hospitalincluding infection, cardiac events and deathare caused by poor glycemic control in the hospital. Elevated glucose levels in the hospital are often seen in sicker patients with raging stress hormones and in brittle diabetics with a present‐on‐admission condition that has been ravaging their vasculature for years. This means that virtually all observational studies demonstrating worse outcomes in the setting of poor glucose control in the hospital will be severely confounded by comorbid illness, and much confounding will remain even after multivariate adjustment.3
Nonetheless, high‐quality randomized controlled trials that have focused on critically ill patients,4, 5 rather than general medical patients, have generated intense interest and fostered the belief that controlling the glucose level of all hospitalized patients is probably a good idea. (Although, more recently, even the data supporting glycemic control in the critically ill have been challenged.)6 Enthusiasm for implementing aggressive glycemic control protocols outside of the intensive care unit (ICU) appears widespread, as is evident in this issue of JHM.711 In this issue, two articles detail the challenges of implementing glycemia control protocols.7, 8 The research teams employed different protocols and used different metrics, but there are common themes: (1) The process was iterative. Interventions were piloted, then rolled out, and substantial effort was needed to foster continued attention to the interventions. (2) The process was multidisciplinary. Buy‐in and input were needed not only from physicians, but also from nurses, pharmacists, dieticians, clinical data system experts, and probably patients. (3) Impacting process measures was easier than impacting surrogate outcome measures. Specifically, despite dramatic changes in the use of carefully vetted order sets and protocols, the impact on glycemia was modest and sometimes inconsistent.
These studies illustrate that implementing protocols to control glycemia is neither easy, nor consistently associated with improved glycemic controllet alone improved major clinical outcomes. Three complementary observational studies911 further illustrate how hard it is to optimize glycemic control in the hospital setting. Together, the observational and interventional studies demonstrate how difficult it is to measure success. Should we focus on the mean glucose value achieved or the frequency of extreme glucose values (which are, by definition, more dangerous)? Should we look at glycemic control in every patient who is placed on a protocol, even those who barely need any insulin at all, or should we focus our interventions and analyses on those patients with more severe dysglycemia at baseline? This latter issue is fundamentally important, since the rollout of any systemwide glycemia protocol that results in higher catchment rates will appear more effective than it really is by enriching the postintervention data with healthier patients.
Before embarking on time‐intensive efforts to improve care, maybe we should be sure that the evidence supports our efforts.12 Recent recommendations from the American Diabetes Association state that for non‐critically ill patients: there is no clear evidence for specific blood glucose goals.13 (This recommendation, based on expert consensus or clinical experience, further states that because cohort data suggest that outcomes are better in hospitalized patients with fasting glucose <126 mg/dL and all random glucose values <180 to 200 mg/dL, these goals are reasonable if they can be safely achieved.) But given the challenges associated with implementing glycemia protocols, one might argue that hospitalists should invest their quality improvement efforts elsewhere.
So where does this leave us? What target glucose is not too high, not too low, but just right? Given the ever‐increasing number of quality improvement measures and interventions that are expected in the hospital, what amount of time, effort, and money devoted to improving inpatient glycemic control is just right? And what do our patients think? Should we be feeding our patients low glycemic load diets, or letting them indulge in one of the few creature comforts remaining in a semiprivate room?
What is clear from the results of the research published in this issue of JHM (regardless of whether we think that an inpatient pre‐meal glucose of 160 mg/dL is good, bad, or neither), is that we need to continue to develop systems, strategies, and teams to rapidly disseminate quality improvement interventions locally. We need multidisciplinary inputfrom physicians, nurses, dieticians, pharmacists, and patientsto do it right. So, even if the pendulum swings away from tight glycemic control in the hospital, the lessons we learned from these authors' valiant efforts to tame inpatient glycemia may provide us with the tools and knowledge required to successfully tackle other clinical issues such as delirium prevention, pain control, medication reconciliation, and handoffs. The striking obstacles (both in implementation and analysis) faced and overcome by the authors of the articles in this issue of JHM will hopefully embolden them to take on other quality improvement interventions that are perhaps more likely to help hospitalized patients.
- ,,,,.Intensive insulin therapy exerts antiinflammatory effects in critically ill patients and counteracts the adverse effect of low mannose‐binding lectin levels.J Clin Endocrinol Metab.2003;88:1082–1088.
- ,,,,.Insulin infusion in acute illness.J Clin Invest.2005;115:2069–2072.
- ,,,.In search of fewer independent risk factors.Arch Intern Med.2005;165:138–145.
- ,,, et al.Intensive insulin therapy in the critically ill patients.N Engl J Med.2001;345:1359–1367.
- ,,, et al.Intensive insulin therapy in the medical ICU.N Engl J Med.2006;354:449–461.
- ,,.Benefits and risks of tight glucose control in critically ill adults: a meta‐analysis.JAMA.2008;300:933–944.
- ,,,,.Inpatient management of diabetes and hyperglycemia among general medicine patients at a large teaching hospital.J Hosp Med.2006;1:145–150.
- ,,,; for the SHM Glycemic Control Task Force.Subcutaneous insulin order sets and protocols: effective design and implementation strategies.J Hosp Med.2008;3(S5):29–41.
- , ,, et al.Computer‐based insulin infusion protocol improves glycemia control over manual protocol.J Am Med Inform Assoc.2007;14:278–287.
- ,,,,.Estimated risk for undiagnosed diabetes in the emergency department: a multicenter survey.Acad Emerg Med.2007;14:492–495.
- ,,,,,.Evaluation of glycemic control following discontinuation of an intensive insulin protocol.J Hosp Med.2009;28–34.
- ,,.The tension between needing to improve care and knowing how to do it.N Engl J Med.2007;357:608–613.
- American Diabetes Association. Standards of medical care in diabetes—2008.Diabetes Care.2008;31(Suppl 1):S12–S54.
There is no doubt that hyperglycemia among hospitalized patients correlates with worse prognosis. Further, there are well‐documented mechanisms by which poor glycemic control may directly impact outcomes. For example, hyperglycemia and insulin deficiency can impair neutrophil function, exacerbate inflammation, and impair endothelium‐mediated dilatation,1, 2 whereas hypoglycemia increases sympathetic tone. And both severe hyperglycemia and hypoglycemia, of course, can precipitate altered mental status. But certainly not all of the morbid outcomes associated with poor glycemic control in the hospitalincluding infection, cardiac events and deathare caused by poor glycemic control in the hospital. Elevated glucose levels in the hospital are often seen in sicker patients with raging stress hormones and in brittle diabetics with a present‐on‐admission condition that has been ravaging their vasculature for years. This means that virtually all observational studies demonstrating worse outcomes in the setting of poor glucose control in the hospital will be severely confounded by comorbid illness, and much confounding will remain even after multivariate adjustment.3
Nonetheless, high‐quality randomized controlled trials that have focused on critically ill patients,4, 5 rather than general medical patients, have generated intense interest and fostered the belief that controlling the glucose level of all hospitalized patients is probably a good idea. (Although, more recently, even the data supporting glycemic control in the critically ill have been challenged.)6 Enthusiasm for implementing aggressive glycemic control protocols outside of the intensive care unit (ICU) appears widespread, as is evident in this issue of JHM.711 In this issue, two articles detail the challenges of implementing glycemia control protocols.7, 8 The research teams employed different protocols and used different metrics, but there are common themes: (1) The process was iterative. Interventions were piloted, then rolled out, and substantial effort was needed to foster continued attention to the interventions. (2) The process was multidisciplinary. Buy‐in and input were needed not only from physicians, but also from nurses, pharmacists, dieticians, clinical data system experts, and probably patients. (3) Impacting process measures was easier than impacting surrogate outcome measures. Specifically, despite dramatic changes in the use of carefully vetted order sets and protocols, the impact on glycemia was modest and sometimes inconsistent.
These studies illustrate that implementing protocols to control glycemia is neither easy, nor consistently associated with improved glycemic controllet alone improved major clinical outcomes. Three complementary observational studies911 further illustrate how hard it is to optimize glycemic control in the hospital setting. Together, the observational and interventional studies demonstrate how difficult it is to measure success. Should we focus on the mean glucose value achieved or the frequency of extreme glucose values (which are, by definition, more dangerous)? Should we look at glycemic control in every patient who is placed on a protocol, even those who barely need any insulin at all, or should we focus our interventions and analyses on those patients with more severe dysglycemia at baseline? This latter issue is fundamentally important, since the rollout of any systemwide glycemia protocol that results in higher catchment rates will appear more effective than it really is by enriching the postintervention data with healthier patients.
Before embarking on time‐intensive efforts to improve care, maybe we should be sure that the evidence supports our efforts.12 Recent recommendations from the American Diabetes Association state that for non‐critically ill patients: there is no clear evidence for specific blood glucose goals.13 (This recommendation, based on expert consensus or clinical experience, further states that because cohort data suggest that outcomes are better in hospitalized patients with fasting glucose <126 mg/dL and all random glucose values <180 to 200 mg/dL, these goals are reasonable if they can be safely achieved.) But given the challenges associated with implementing glycemia protocols, one might argue that hospitalists should invest their quality improvement efforts elsewhere.
So where does this leave us? What target glucose is not too high, not too low, but just right? Given the ever‐increasing number of quality improvement measures and interventions that are expected in the hospital, what amount of time, effort, and money devoted to improving inpatient glycemic control is just right? And what do our patients think? Should we be feeding our patients low glycemic load diets, or letting them indulge in one of the few creature comforts remaining in a semiprivate room?
What is clear from the results of the research published in this issue of JHM (regardless of whether we think that an inpatient pre‐meal glucose of 160 mg/dL is good, bad, or neither), is that we need to continue to develop systems, strategies, and teams to rapidly disseminate quality improvement interventions locally. We need multidisciplinary inputfrom physicians, nurses, dieticians, pharmacists, and patientsto do it right. So, even if the pendulum swings away from tight glycemic control in the hospital, the lessons we learned from these authors' valiant efforts to tame inpatient glycemia may provide us with the tools and knowledge required to successfully tackle other clinical issues such as delirium prevention, pain control, medication reconciliation, and handoffs. The striking obstacles (both in implementation and analysis) faced and overcome by the authors of the articles in this issue of JHM will hopefully embolden them to take on other quality improvement interventions that are perhaps more likely to help hospitalized patients.
- ,,,,.Intensive insulin therapy exerts antiinflammatory effects in critically ill patients and counteracts the adverse effect of low mannose‐binding lectin levels.J Clin Endocrinol Metab.2003;88:1082–1088.
- ,,,,.Insulin infusion in acute illness.J Clin Invest.2005;115:2069–2072.
- ,,,.In search of fewer independent risk factors.Arch Intern Med.2005;165:138–145.
- ,,, et al.Intensive insulin therapy in the critically ill patients.N Engl J Med.2001;345:1359–1367.
- ,,, et al.Intensive insulin therapy in the medical ICU.N Engl J Med.2006;354:449–461.
- ,,.Benefits and risks of tight glucose control in critically ill adults: a meta‐analysis.JAMA.2008;300:933–944.
- ,,,,.Inpatient management of diabetes and hyperglycemia among general medicine patients at a large teaching hospital.J Hosp Med.2006;1:145–150.
- ,,,; for the SHM Glycemic Control Task Force.Subcutaneous insulin order sets and protocols: effective design and implementation strategies.J Hosp Med.2008;3(S5):29–41.
- , ,, et al.Computer‐based insulin infusion protocol improves glycemia control over manual protocol.J Am Med Inform Assoc.2007;14:278–287.
- ,,,,.Estimated risk for undiagnosed diabetes in the emergency department: a multicenter survey.Acad Emerg Med.2007;14:492–495.
- ,,,,,.Evaluation of glycemic control following discontinuation of an intensive insulin protocol.J Hosp Med.2009;28–34.
- ,,.The tension between needing to improve care and knowing how to do it.N Engl J Med.2007;357:608–613.
- American Diabetes Association. Standards of medical care in diabetes—2008.Diabetes Care.2008;31(Suppl 1):S12–S54.
Short of breath, not short of diagnoses
The approach to clinical conundrums by an expert clinician is revealed through presentation of an actual patient's case in an approach typical of morning report. Similar to patient care, sequential pieces of information are provided to the clinician who is unfamiliar with the case. The focus is on the thought processes of both the clinical team caring for the patient and the discussant.
A 71‐year‐old African‐American woman presented to the emergency department with chest pain, shortness of breath, and cough. She had initially presented to her primary care physician 2 weeks previously complaining of worsening cough and shortness of breath and was told to continue her inhaled albuterol and glucocorticoids and was prescribed a prednisone taper and an unknown course of antibiotics. She noted no improvement in her symptoms despite compliance with this treatment. Three days prior to admission she described the gradual onset of left‐sided pleuritic chest pain with continued cough, associated with yellow sputum and worsening dyspnea. Review of systems was remarkable for generalized weakness and malaise. She denied fever, chills, orthopnea, paroxysmal nocturnal dyspnea, lower extremity edema, diarrhea, nausea, vomiting, or abdominal pain.
Her past medical history included a diagnosis of chronic obstructive pulmonary disease (COPD) but pulmonary function tests 7 years prior to admission showed an forced expiratory volume in the first second (FEV1)/forced vital capacity (FVC) ratio of 81%. She had a 30 pack‐year history of smoking, but quit 35 years ago. The patient also carried a diagnosis of heart failure, but an echocardiogram done 1 year ago demonstrated a left ventricular ejection fraction of 65% to 70% without diastolic dysfunction but mild right ventricular dilation and hypertrophy. Additionally, she had known nonobstructive coronary atherosclerotic heart disease, dyslipidemia, hypertension, morbid obesity, depression, and a documented chronic right hemidiaphragm elevation.
At this point the history suggests that the patient does not have a clear diagnosis of COPD. The lack of definitive spirometry evidence of chronic airway obstruction concerns me; I think that she may have been mistakenly treated with chronic inhaled steroids and doses of antibiotics for an acute exacerbation of chronic lung disease. Additional review of her history gives some indication of advanced lung disease, with her recent echocardiogram showing strain on the right ventricle with right ventricular hypertrophy and dilation, but there is no mention of the presence or severity of pulmonary hypertension. Nonetheless, I would be concerned that she probably has underlying significant cor pulmonale.
The patient now re‐presents with a worsening of her pulmonary symptoms. Her left‐sided pleuritic pain would make me concerned that she had a pulmonary embolus (PE). This morbidly obese patient with new pulmonary symptoms, right ventricular strain on her previous echocardiogram, and a persistent elevated right hemidiaphragm suggests a presentation of another PE.
At this time I cannot rule out other common possibilities such as infectious pneumonia. If she does have pneumonia, I would be concerned she could be harboring a multidrug‐resistant bacterial infection given her recent course of antibiotics in addition to her use of both chronic inhaled and intermittent oral glucocorticoids.
After gathering the rest of her full medical history, I would focus my physical exam on looking for evidence of parenchymal lung disease, signs of pulmonary hypertension, and pneumonia.
Her surgical history includes a previous hysterectomy, cholecystectomy, hernia repair, and left hepatic lobectomy for a benign mass. Her outpatient medications were ibuprofen, bupropion, fluvastatin, atenolol, potassium, aspirin, clopidogrel, albuterol inhaler, fluticasone/salmeterol inhaler, and omeprazole. She reports an allergy to penicillin and to sulfa drugs. Her mother died of an unknown cancer at age 77 years. She denied any international travel and she has always lived in Georgia.
The patient has been retired since 1992, having previously worked for the U.S. Postal Service. She admits to occasional alcohol intake (2 to 3 drinks a month). No recent travel, surgery, or prolonged immobilization was noted.
On initial examination she was alert and mentally appropriate, but appeared to be in mild respiratory distress with a respiratory rate of 28 breaths/minute. Her blood pressure (BP) was 99/70, heart rate 102, temperature of 38.2C, and oxygen saturation of 93% on room air and 97% on 2 L of oxygen via nasal cannula. Auscultation of her lungs revealed crackles over her left anterior lung field, bronchial breath sounds in the left posterior midlung, and bibasilar crackles. No wheezing was noted. Her cardiovascular exam and the remainder of her physical exam were unremarkable except for morbid obesity.
While my initial thoughts were leaning toward an exacerbation of chronic lung disease or possibly a new PE, at this moment, infection seems more likely. Indeed, her pulmonary findings suggest a left‐sided inflammatory process, and her vital signs meet criteria for systemic inflammatory response syndrome (SIRS). My primary concern is sepsis due to a drug‐resistant bacterial infection, including Staphylococcus aureus or gram‐negative bacteria or possibly more unusual organisms such as Nocardia or fungi, due to her recent use of antibiotics and chronic inhaled steroid use and recent course of oral glucocorticoids.
Conversely, the SIRS could be a manifestation of a noninfectious lung process such as acute interstitial pneumonia or an eosinophilic pneumonia. Given the diagnostic complexity, I would strongly consider consulting a pulmonologist if the patient did not improve quickly. At this point, I would like to review a posterior‐anterior (PA) and lateral chest radiograph, and room air arterial blood gas (ABG) in addition to basic laboratory test values.
Laboratory data obtained on admission was remarkable for a white blood cell (WBC) count of 26,500/L with 75% neutrophils and 6% eosinophils. Hemoglobin was 14.4 gm/dL. Platelet count was 454,000/L. Serum chemistries showed a sodium of 137 mEq/dL, potassium 4.3 mEq/dL, Cl 108 mEq/dL, bicarbonate 19 mEq/dL, blood urea nitrogen (BUN) 8 mg/dL, creatinine 1.0 mg/dL, and glucose 137 mg/dL. Cardiac enzymes were normal. Calcium was 9.8 mg/dL, albumin 2.7 gm/dL, total protein 6.9 gm/dL, AST 36 U/L, ALT 54 U/L and the bilirubin was normal. Chest radiograph (Figure 1) demonstrated a left perihilar infiltrate with air bronchograms and marked right hemidiaphragm elevation as seen on previous films. Unchanged increased interstitial markings were also present. Her electrocardiogram (ECG) showed normal sinus rhythm, normal axis, and QRS duration with nonspecific diffuse T‐wave abnormalities.

Given her presentation, I am worried about how well she is oxygenating and ventilating. An ABG should be done to assess her status more accurately. An albumin of 2.7 gm/dL indicates that she is fairly sick. I would not hesitate to consider testing the patient for human immunodeficiency virus (HIV) given how this information would dramatically change the differential diagnoses of her pulmonary process.
I am still most concerned about sepsis secondary to pneumonia in this patient with multiple chronic comorbidities, underlying chronic lung disease, receiving chronic inhaled glucocorticoids and a recent course of oral glucocorticoids and antibiotics. While I would initiate hydration I do not see a clear indication for early goal‐directed therapy for severe sepsis. In addition to obtaining an ABG and starting intravenous fluids, I would also draw blood cultures, send sputum for gram stain, culture, and sensitivity, and perform a urinalysis. I would also administer empiric antibiotics as quickly as possible based on a number of pneumonia clinical studies suggesting improved outcomes with early antibiotic administration. Because of her use of antibiotics and both inhaled and oral glucocorticoids, she is at higher risk for potentially multidrug‐resistant bacterial pathogens, including Staphyloccocus aureus and gram‐negative bacteria such as Pseudomonas and Klebsiella (Table 1). Therefore, I would initially cover her broadly for these organisms.
| Meets Any of the Following |
|---|
| Antimicrobial therapy in the preceding 90 days |
| Current hospitalization of 5 days or more |
| High frequency of antibiotic resistance in the community or in the specific hospital unit |
| Presence of risk factors for healthcare‐associated pneumonia (HCAP) |
| Hospitalization for >2 days in the preceding 90 days |
| Residence in nursing home or long‐term care facility (LTAC) for at least 5 days in last 90 days |
| Home infusion therapy including intravenous antibiotics within 30 days |
| Home wound care within 30 days |
| Chronic hemodialysis in hospital or clinic within 30 days |
| Family member with multidrug‐resistant pathogen |
| Immunosuppressive disease and/or therapy |
In addition to initial treatment choice, the inpatient triage decision is another important issue, especially at a community hospital where intensive care unit (ICU) resources are rare and often the admission decision is between sending a moderately sick patient to a regular floor bed or the medical ICU. Both the American Thoracic Society and Infectious Diseases Society of America support an ICU triage protocol in their guidelines for the management of community‐acquired pneumonia in adults that utilizes the following 9 minor criteria, of which the presence of at least 3 should support ICU admission: respiratory rate 30 breaths/minute; oxygenation index (pressure of oxygen [PaO2]/fraction of inspired oxygen [FiO2] ratio) 250; multilobar infiltrates; confusion/disorientation; uremia (BUN level 20 mg/dL); leukopenia (WBC count <4,000 cells/mm3); thrombocytopenia (platelet count <100,000 cells/mm3); hypothermia (core temperature <36C); and hypotension requiring aggressive fluid. Despite the absence of these criteria in this patient, it is important to note that no triage protocol has been adequately prospectively validated. Retrospective study of the minor criteria has found that the presence of at least 2 of the following 3 clinical criteria to have the highest specificity for predicting cardiopulmonary decompensation and subsequent need for ICU care: (1) initial hypotension (BP <90/60) on presentation with response to initial intravenous fluids to a BP >90/60; (2) oxygenation failure as indicated by PaO2/FiO2 ratio less than 250; or (3) the presence of multilobar or bilateral infiltrates on chest radiography.
I also want to comment on the relative elevation of her calcium, especially given the low albumin. This may simply be due to volume depletion, as many older patients have asymptomatic mild primary hyperparathyroidism. However, this elevated calcium may be a clue to the underlying lung process. Granulomatous lung disease due to tuberculosis or fungal infection could yield elevated calcium levels via increases in macrophage production of the active vitamin D metabolite calcitriol. This will need to be followed and a parathormone (PTH) level would be the best first test to request if the calcium level remains elevated. If the PTH level is suppressed, granulomatous disease or malignancy would be the more likely cause.
The patient was admitted with a presumptive diagnosis of community‐acquired pneumonia, was started on ceftriaxone and azithromycin, and given intravenous fluids, oxygen, and continued on inhaled salmeterol/fluticasone. Sputum was ordered for gram stain, culture, and sensitivity, and blood cultures were obtained. Urinalysis showed 1‐5 WBCs/high‐power field. Venous thromboembolism prophylaxis was initiated with subcutaneous heparin 5,000 units 8 hours. Her blood pressure normalized rapidly and during the next few days she stated she was feeling better. Despite continued significant wheezing her oxygen saturation remained at 98% on 2 L of oxygen via nasal cannula and she was less tachypneic. Attempts at obtaining an ABG were unsuccessful, and the patient subsequently refused additional attempts. Over the first few days her WBC count remained elevated above 20,000/L, with worsening bandemia (11%), and fever ranging from 38C to 39C. Sputum analysis was initially unsuccessful and blood cultures remained negative.
I am concerned about the persistent fever and elevated WBC count, and want to emphasize that I might have treated her with broader spectrum antibiotics to cover additional multidrug‐resistant bacterial organisms. I would have initially ordered vancomycin to cover methicillin resistant Staphylococcus aureus (MRSA) plus 2 additional antibiotics that cover multidrug‐resistant gram negative pathogens including Pseudomonas aeruginosa.
On the fifth hospital day, her WBC count dropped to 13,400/L and she defervesced. However, her respiratory status worsened during that same day with increased tachypnea. Of note, no results were reported from the initial sputum cultures and they were reordered and a noncontrast chest computed tomography (CT) was also ordered.
I think at this point, even though she has remained stable hemodynamically and oxygenating easily with supplemental oxygen, the question of whether or not her primary process is infectious or noninfectious lingers. I agree with obtaining a chest CT scan.
I am not surprised that sputum was not evaluated despite the orders. Among hospitalized patients with pneumonia, we frequently find that about a third of the time sputum cannot be obtained, about a third of the time it is obtained but the quality is unsatisfactory, and only a third of the time does the sputum sample meet criteria (less than 5 squamous epithelial cells per high‐power field) for adequate interpretation of the gram‐stain and culture result. Unfortunately, no one has developed a better way to improve this process. Nonetheless, I believe we do not try hard enough to obtain sputum in the first hours of evaluating our patients. I joke with our internal medicine residents that they should carry a sputum cup with them when they evaluate a patient with possible pneumonia. One recent prospective study of the value of sputum gram‐staining in community‐acquired pneumonia has found it to be highly specific for identifying Streptococcus pneumoniae or Haemophilus influenzae pneumonia.
The CT scan (Figure 2) performed on hospital day 6 demonstrated consolidation in the left upper lobe with areas of cavitation. There was also interstitial infiltrate extending into the lingula. Elevation of the right hemidiaphragm with atelectasis in both lung bases was also noted. A small effusion was present on the left and possibly a minimal effusion on the right as well. There was no pericardial effusion and only a few small pretracheal and periaortic lymph nodes were noted.

Given her failure to improve significantly after 6 days of antibiotic treatment, and her recent use of glucocorticoids, I would expand my diagnostic considerations to include other necrotizing bacterial infections, tuberculosis, fungus, and Nocardia.
Given the results of the CT scan she was placed in respiratory isolation to rule out active pulmonary tuberculosis. Though tachypneic, her blood pressure and pulse remained stable. However, her oxygen saturation deteriorated, declining to 92% on 2 L of oxygen via nasal cannula during hospital days 6 and 7. Subsequent successful attempts at collecting sputum yielded rapid growth of yeast (not Cryptococcus spp.). Pulmonary and infectious disease consultations were obtained and vancomycin was added to her regimen. The patient subsequently agreed to undergo diagnostic bronchoscopy.
I agree with obtaining input from expert consultants. I think we too often underutilize consultation in patients that are better but not completely better when we are not entirely sure what is going on. Evidence of noncryptococcus yeast in sputum may sometimes indicate colonization with Candida spp. without any significant clinical consequence. This finding may alternatively suggest the possibility of a true fungal pneumonia caused by 1 of the dimorphic fungi, including Histoplasma capsulatum, Paracoccidioides brasiliensis, Blastomyces dermatitides, or Coccidioides immitis. However, in this case there is not a strong epidemiologic patient history of exposure to any of these types of fungi.
Three sputum smears were negative for acid fast bacilli (AFB). Bronchoscopy revealed grossly abnormal mucosa in the left upper lobe and bronchomalacia, but no obstructive lesions. A transthoracic echocardiogram was ordered to evaluate her degree of pulmonary hypertension.
The 3 sputum specimens that were negative for AFB despite cavitary lung disease have high sensitivity for ruling out pulmonary tuberculosis. In addition, given the absence of any bacterial pathogen isolated from these specimens, I would pursue the possibility of other potential fungal pathogens given the patient's subacute course, history of using inhaled and oral corticosteroids, sputum results, and the presence of a cavitary lesion on her CT scan images.
Cytologic examination of the bronchoalveolar lavage (BAL) sample showed a cell differential of 1% bands, 58% neutrophils, 9% lymphs, and 27% eosinophils. The routine postbronchoscopy chest radiograph showed complete opacification of the left lung. The patient's WBC count rose to 26,000/L but she remained afebrile. Echocardiogram was reported to be of very poor quality due to her obesity. The cardiologist reviewing the echocardiogram called the attending physicians and stated there was possibly something in the left pulmonary artery and aortic dissection could not be ruled out.
The presence of eosinophilia on BAL may be a very important clue as to what lung pathology she has. In fact, eosinophilia in this setting may indicate the possibility of parasitic or fungal infection of the lung, or inflammation of the airway associated to drug toxicity, asthma, or environmental toxin exposure. With this additional information, I am concerned that she may be harboring an atypical infection such as an invasive fungus. The echocardiogram results are unclear to me but will need to be clarified with additional testing.
The interpretation of the transbronchial biopsy specimen was limited but suggested invasive pseudomembranous tracheal bronchitis due to aspergillosis. The routine hematoxylin and eosin stain showed portions of alveolar lung tissue and some collapsed submucosal bronchial glands with relatively normal‐looking lung tissue but along the edge of the spaces were obvious fungal organisms. The Gomori's methenamine silver (GMS) stain suggested the presence of Aspergillus organisms (Figure 3). Fungal cultures were also negative for any of the other dimorphic fungi or for molds.

Despite the negative culture results, the overall clinical picture suggests a necrotizing pneumonia caused by an invasive Aspergillus affecting both the bronchial tree and the lower respiratory tract. Generally, necrotizing pneumonias usually have a slow response to antimicrobial therapy. Given the inherent difficulty in differentiating clearly between invasive and noninvasive disease based on a transbronchial biopsy specimen, initiating antifungal therapy for invasive aspergillosis is appropriate in this patient. This patient's recent use of oral glucocorticoids and chronic use of inhaled glucocorticoids are both potential risk factors that predisposed this patient to develop invasive aspergillosis.
Many times we simply follow treatment guidelines for different categories of pneumonia, and have limited or inadequate clinical information to make more definitive diagnoses. While we need these treatment protocols, physicians must avoid falling into the trap that antibiotics treat all infectious etiologies in the lung and we should make reasonable efforts to pin down the etiology. All of us have been fooled by atypical presentations of tuberculosis, fungus, and noninfectious diseases of the lung. I think it behooves us to be vigilant about alternative diagnoses and consider pursuing additional studies whenever the clinical response to initial treatment does not meet our expectations.
Subsequently, the patient's additional cultures remained negative. The official echocardiogram report was read as questionable PE in the pulmonary artery. A spiral CT angiogram revealed a pulmonary artery embolus in the left upper lobe and she was treated with anticoagulation. Her shortness of breath improved steadily and she was successfully discharged after receiving 9 days of oral voriconazole. Outpatient pulmonary function testing documented the presence of chronic obstructive lung disease. She completed a 5‐month course of voriconazole therapy with significant clinical and radiologic improvement of her pulmonary infiltrate. She also completed a 12‐month treatment with warfarin for the concomitant pulmonary embolism. On follow‐up at 12 months she was doing well.
COMMENTARY
Aspergillosis caused particularly by Aspergillus fumigatus is considered an emerging infectious disease that frequently produces significant morbidity and mortality among immunocompromised patients.1, 2 The most frequently‐affected organs by this fungal pathogen include the lung and the central nervous system. There are 3 pathogenic mechanisms of Aspergillus infection of the lung: colonization, hypersensitivity reaction, and invasive aspergillosis.1
Invasive pulmonary aspergillosis is predominantly seen among individuals with severe degrees of immunosuppression as a result of solid‐organ transplantation, immunosuppressive therapies for autoimmune diseases, systemic glucocorticoids, and chemotherapy for hematologic malignancies. Mortality due to invasive aspergillosis continues to be very high (>58%) despite our improved ability to diagnose this condition and newer therapies to treat immunocompromised individuals.1 Invasive aspergillosis can manifest clinically in multiple ways. These include: (1) an invasive vascular process in which fungal organisms invade blood vessels, causing a rapidly progressive and often fatal illness; (2) necrotizing pseudomembranous tracheal bronchitis; (3) chronic necrotizing aspergillosis; (4) bronchopleural fistula; or (5) empyema.35 In our case, while the pathologic findings were most suggestive of an invasive pseudomembranous tracheal bronchitis, the overall clinical picture was most compatible with a necrotizing pneumonia due to invasive aspergillosis.
In addition to the traditional identified risk factors for invasive pulmonary aspergillosis, a number of reports during the last decade have demonstrated the occurrence of invasive aspergillosis in patients with COPD.14 A systematic review of the literature demonstrated that among 1,941 patients with invasive aspergillosis, 26 (1.3%) had evidence of COPD as the main risk factor for developing invasive aspergillosis.1 A single report has associated the potential use of inhaled steroids with the occurrence of invasive aspergillosis in this patient population.2 However, other factors that may promote increased susceptibility to invasive fungal infection among patients with COPD include the use of long‐term or repeated short‐term glucocorticoid treatments, and the presence of multiple additional comorbidities, which may be found in this same population such as diabetes, malnutrition, or end‐stage renal disease.3, 4 Most reported series have demonstrated a high mortality rate of invasive pulmonary aspergillosis in patients with COPD.14
The diagnosis of invasive pulmonary aspergillosis represents a significant clinical challenge. Diagnostic algorithms incorporating CT, antigen detection testing (for serum galactomannan and ‐glucan) as well as polymerase chain reaction diagnostic testing appear to be beneficial in the early diagnosis of invasive aspergillosis in particular settings such as in allogeneic hematopoietic stem cell transplantation.5 The role of antigen testing to identify early invasive aspergillosis in patients with COPD remains uncertain since it has been evaluated in a limited number of patients and therefore clinical suspicion is critical to push clinicians to pursue invasive tissue biopsy and cultures to confirm the diagnosis.3, 4
Based on the available clinical case series and in our case, invasive pulmonary aspergillosis should be suspected in COPD patients with rapidly progressive pneumonia not responding to antibacterial therapy and who have received oral or inhaled glucocorticoids in the recent past. In addition, this case also illustrates that occasionally, patients present with more than 1 life‐threatening diagnosis. This patient was also diagnosed with PE despite adequate prophylaxis. In addition to the well‐known clinical risk factors of obesity and lung disease, the underlying infection may have contributed to a systemic or local hypercoagulable condition that further increased her risk for venous thromboembolism.
KEY TEACHING POINTS
-
Clinicians should remember to consider a broad differential in patients presenting with pneumonia, including the possibility of fungal pathogens in patients with known risk factors and in patients with multiple, potentially immunosuppressive comorbidities, or in patients who do not improve on standard antibiotic therapy.
-
There is some evidence of an association between COPD and invasive aspergillosis, likely due to the frequent use of oral corticosteroids and/or chronic inhaled steroids in this population.
- ,,.Aspergillosis case‐fatality rate: systematic review of the literature.Clin Infect Dis.2001;32:358–366.
- ,,,,.Invasive pulmonary filamentous fungal infection in a patient receiving inhaled corticosteroid therapy.Clin Infect Dis.2002;35:e54–e56.
- ,,, et al.Invasive pulmonary aspergillosis in chronic obstructive pulmonary disease: an emerging fungal pathogen.Clin Microbiol Infect.2005;11:427–429.
- ,,,,,.Invasive pulmonary aspergillosis in patients with chronic obstructive pulmonary disease: report of eight cases and review.Clin Infect Dis.1998;26:1473–1475.
- ,.Current approaches to diagnosis and treatment to invasive aspergillosis.Am J Respir Crit Care Med.2006;173:707–717.
The approach to clinical conundrums by an expert clinician is revealed through presentation of an actual patient's case in an approach typical of morning report. Similar to patient care, sequential pieces of information are provided to the clinician who is unfamiliar with the case. The focus is on the thought processes of both the clinical team caring for the patient and the discussant.
A 71‐year‐old African‐American woman presented to the emergency department with chest pain, shortness of breath, and cough. She had initially presented to her primary care physician 2 weeks previously complaining of worsening cough and shortness of breath and was told to continue her inhaled albuterol and glucocorticoids and was prescribed a prednisone taper and an unknown course of antibiotics. She noted no improvement in her symptoms despite compliance with this treatment. Three days prior to admission she described the gradual onset of left‐sided pleuritic chest pain with continued cough, associated with yellow sputum and worsening dyspnea. Review of systems was remarkable for generalized weakness and malaise. She denied fever, chills, orthopnea, paroxysmal nocturnal dyspnea, lower extremity edema, diarrhea, nausea, vomiting, or abdominal pain.
Her past medical history included a diagnosis of chronic obstructive pulmonary disease (COPD) but pulmonary function tests 7 years prior to admission showed an forced expiratory volume in the first second (FEV1)/forced vital capacity (FVC) ratio of 81%. She had a 30 pack‐year history of smoking, but quit 35 years ago. The patient also carried a diagnosis of heart failure, but an echocardiogram done 1 year ago demonstrated a left ventricular ejection fraction of 65% to 70% without diastolic dysfunction but mild right ventricular dilation and hypertrophy. Additionally, she had known nonobstructive coronary atherosclerotic heart disease, dyslipidemia, hypertension, morbid obesity, depression, and a documented chronic right hemidiaphragm elevation.
At this point the history suggests that the patient does not have a clear diagnosis of COPD. The lack of definitive spirometry evidence of chronic airway obstruction concerns me; I think that she may have been mistakenly treated with chronic inhaled steroids and doses of antibiotics for an acute exacerbation of chronic lung disease. Additional review of her history gives some indication of advanced lung disease, with her recent echocardiogram showing strain on the right ventricle with right ventricular hypertrophy and dilation, but there is no mention of the presence or severity of pulmonary hypertension. Nonetheless, I would be concerned that she probably has underlying significant cor pulmonale.
The patient now re‐presents with a worsening of her pulmonary symptoms. Her left‐sided pleuritic pain would make me concerned that she had a pulmonary embolus (PE). This morbidly obese patient with new pulmonary symptoms, right ventricular strain on her previous echocardiogram, and a persistent elevated right hemidiaphragm suggests a presentation of another PE.
At this time I cannot rule out other common possibilities such as infectious pneumonia. If she does have pneumonia, I would be concerned she could be harboring a multidrug‐resistant bacterial infection given her recent course of antibiotics in addition to her use of both chronic inhaled and intermittent oral glucocorticoids.
After gathering the rest of her full medical history, I would focus my physical exam on looking for evidence of parenchymal lung disease, signs of pulmonary hypertension, and pneumonia.
Her surgical history includes a previous hysterectomy, cholecystectomy, hernia repair, and left hepatic lobectomy for a benign mass. Her outpatient medications were ibuprofen, bupropion, fluvastatin, atenolol, potassium, aspirin, clopidogrel, albuterol inhaler, fluticasone/salmeterol inhaler, and omeprazole. She reports an allergy to penicillin and to sulfa drugs. Her mother died of an unknown cancer at age 77 years. She denied any international travel and she has always lived in Georgia.
The patient has been retired since 1992, having previously worked for the U.S. Postal Service. She admits to occasional alcohol intake (2 to 3 drinks a month). No recent travel, surgery, or prolonged immobilization was noted.
On initial examination she was alert and mentally appropriate, but appeared to be in mild respiratory distress with a respiratory rate of 28 breaths/minute. Her blood pressure (BP) was 99/70, heart rate 102, temperature of 38.2C, and oxygen saturation of 93% on room air and 97% on 2 L of oxygen via nasal cannula. Auscultation of her lungs revealed crackles over her left anterior lung field, bronchial breath sounds in the left posterior midlung, and bibasilar crackles. No wheezing was noted. Her cardiovascular exam and the remainder of her physical exam were unremarkable except for morbid obesity.
While my initial thoughts were leaning toward an exacerbation of chronic lung disease or possibly a new PE, at this moment, infection seems more likely. Indeed, her pulmonary findings suggest a left‐sided inflammatory process, and her vital signs meet criteria for systemic inflammatory response syndrome (SIRS). My primary concern is sepsis due to a drug‐resistant bacterial infection, including Staphylococcus aureus or gram‐negative bacteria or possibly more unusual organisms such as Nocardia or fungi, due to her recent use of antibiotics and chronic inhaled steroid use and recent course of oral glucocorticoids.
Conversely, the SIRS could be a manifestation of a noninfectious lung process such as acute interstitial pneumonia or an eosinophilic pneumonia. Given the diagnostic complexity, I would strongly consider consulting a pulmonologist if the patient did not improve quickly. At this point, I would like to review a posterior‐anterior (PA) and lateral chest radiograph, and room air arterial blood gas (ABG) in addition to basic laboratory test values.
Laboratory data obtained on admission was remarkable for a white blood cell (WBC) count of 26,500/L with 75% neutrophils and 6% eosinophils. Hemoglobin was 14.4 gm/dL. Platelet count was 454,000/L. Serum chemistries showed a sodium of 137 mEq/dL, potassium 4.3 mEq/dL, Cl 108 mEq/dL, bicarbonate 19 mEq/dL, blood urea nitrogen (BUN) 8 mg/dL, creatinine 1.0 mg/dL, and glucose 137 mg/dL. Cardiac enzymes were normal. Calcium was 9.8 mg/dL, albumin 2.7 gm/dL, total protein 6.9 gm/dL, AST 36 U/L, ALT 54 U/L and the bilirubin was normal. Chest radiograph (Figure 1) demonstrated a left perihilar infiltrate with air bronchograms and marked right hemidiaphragm elevation as seen on previous films. Unchanged increased interstitial markings were also present. Her electrocardiogram (ECG) showed normal sinus rhythm, normal axis, and QRS duration with nonspecific diffuse T‐wave abnormalities.
Given her presentation, I am worried about how well she is oxygenating and ventilating. An ABG should be done to assess her status more accurately. An albumin of 2.7 gm/dL indicates that she is fairly sick. I would not hesitate to consider testing the patient for human immunodeficiency virus (HIV) given how this information would dramatically change the differential diagnoses of her pulmonary process.
I am still most concerned about sepsis secondary to pneumonia in this patient with multiple chronic comorbidities, underlying chronic lung disease, receiving chronic inhaled glucocorticoids and a recent course of oral glucocorticoids and antibiotics. While I would initiate hydration I do not see a clear indication for early goal‐directed therapy for severe sepsis. In addition to obtaining an ABG and starting intravenous fluids, I would also draw blood cultures, send sputum for gram stain, culture, and sensitivity, and perform a urinalysis. I would also administer empiric antibiotics as quickly as possible based on a number of pneumonia clinical studies suggesting improved outcomes with early antibiotic administration. Because of her use of antibiotics and both inhaled and oral glucocorticoids, she is at higher risk for potentially multidrug‐resistant bacterial pathogens, including Staphyloccocus aureus and gram‐negative bacteria such as Pseudomonas and Klebsiella (Table 1). Therefore, I would initially cover her broadly for these organisms.
| Meets Any of the Following |
|---|
| Antimicrobial therapy in the preceding 90 days |
| Current hospitalization of 5 days or more |
| High frequency of antibiotic resistance in the community or in the specific hospital unit |
| Presence of risk factors for healthcare‐associated pneumonia (HCAP) |
| Hospitalization for >2 days in the preceding 90 days |
| Residence in nursing home or long‐term care facility (LTAC) for at least 5 days in last 90 days |
| Home infusion therapy including intravenous antibiotics within 30 days |
| Home wound care within 30 days |
| Chronic hemodialysis in hospital or clinic within 30 days |
| Family member with multidrug‐resistant pathogen |
| Immunosuppressive disease and/or therapy |
In addition to initial treatment choice, the inpatient triage decision is another important issue, especially at a community hospital where intensive care unit (ICU) resources are rare and often the admission decision is between sending a moderately sick patient to a regular floor bed or the medical ICU. Both the American Thoracic Society and Infectious Diseases Society of America support an ICU triage protocol in their guidelines for the management of community‐acquired pneumonia in adults that utilizes the following 9 minor criteria, of which the presence of at least 3 should support ICU admission: respiratory rate 30 breaths/minute; oxygenation index (pressure of oxygen [PaO2]/fraction of inspired oxygen [FiO2] ratio) 250; multilobar infiltrates; confusion/disorientation; uremia (BUN level 20 mg/dL); leukopenia (WBC count <4,000 cells/mm3); thrombocytopenia (platelet count <100,000 cells/mm3); hypothermia (core temperature <36C); and hypotension requiring aggressive fluid. Despite the absence of these criteria in this patient, it is important to note that no triage protocol has been adequately prospectively validated. Retrospective study of the minor criteria has found that the presence of at least 2 of the following 3 clinical criteria to have the highest specificity for predicting cardiopulmonary decompensation and subsequent need for ICU care: (1) initial hypotension (BP <90/60) on presentation with response to initial intravenous fluids to a BP >90/60; (2) oxygenation failure as indicated by PaO2/FiO2 ratio less than 250; or (3) the presence of multilobar or bilateral infiltrates on chest radiography.
I also want to comment on the relative elevation of her calcium, especially given the low albumin. This may simply be due to volume depletion, as many older patients have asymptomatic mild primary hyperparathyroidism. However, this elevated calcium may be a clue to the underlying lung process. Granulomatous lung disease due to tuberculosis or fungal infection could yield elevated calcium levels via increases in macrophage production of the active vitamin D metabolite calcitriol. This will need to be followed and a parathormone (PTH) level would be the best first test to request if the calcium level remains elevated. If the PTH level is suppressed, granulomatous disease or malignancy would be the more likely cause.
The patient was admitted with a presumptive diagnosis of community‐acquired pneumonia, was started on ceftriaxone and azithromycin, and given intravenous fluids, oxygen, and continued on inhaled salmeterol/fluticasone. Sputum was ordered for gram stain, culture, and sensitivity, and blood cultures were obtained. Urinalysis showed 1‐5 WBCs/high‐power field. Venous thromboembolism prophylaxis was initiated with subcutaneous heparin 5,000 units 8 hours. Her blood pressure normalized rapidly and during the next few days she stated she was feeling better. Despite continued significant wheezing her oxygen saturation remained at 98% on 2 L of oxygen via nasal cannula and she was less tachypneic. Attempts at obtaining an ABG were unsuccessful, and the patient subsequently refused additional attempts. Over the first few days her WBC count remained elevated above 20,000/L, with worsening bandemia (11%), and fever ranging from 38C to 39C. Sputum analysis was initially unsuccessful and blood cultures remained negative.
I am concerned about the persistent fever and elevated WBC count, and want to emphasize that I might have treated her with broader spectrum antibiotics to cover additional multidrug‐resistant bacterial organisms. I would have initially ordered vancomycin to cover methicillin resistant Staphylococcus aureus (MRSA) plus 2 additional antibiotics that cover multidrug‐resistant gram negative pathogens including Pseudomonas aeruginosa.
On the fifth hospital day, her WBC count dropped to 13,400/L and she defervesced. However, her respiratory status worsened during that same day with increased tachypnea. Of note, no results were reported from the initial sputum cultures and they were reordered and a noncontrast chest computed tomography (CT) was also ordered.
I think at this point, even though she has remained stable hemodynamically and oxygenating easily with supplemental oxygen, the question of whether or not her primary process is infectious or noninfectious lingers. I agree with obtaining a chest CT scan.
I am not surprised that sputum was not evaluated despite the orders. Among hospitalized patients with pneumonia, we frequently find that about a third of the time sputum cannot be obtained, about a third of the time it is obtained but the quality is unsatisfactory, and only a third of the time does the sputum sample meet criteria (less than 5 squamous epithelial cells per high‐power field) for adequate interpretation of the gram‐stain and culture result. Unfortunately, no one has developed a better way to improve this process. Nonetheless, I believe we do not try hard enough to obtain sputum in the first hours of evaluating our patients. I joke with our internal medicine residents that they should carry a sputum cup with them when they evaluate a patient with possible pneumonia. One recent prospective study of the value of sputum gram‐staining in community‐acquired pneumonia has found it to be highly specific for identifying Streptococcus pneumoniae or Haemophilus influenzae pneumonia.
The CT scan (Figure 2) performed on hospital day 6 demonstrated consolidation in the left upper lobe with areas of cavitation. There was also interstitial infiltrate extending into the lingula. Elevation of the right hemidiaphragm with atelectasis in both lung bases was also noted. A small effusion was present on the left and possibly a minimal effusion on the right as well. There was no pericardial effusion and only a few small pretracheal and periaortic lymph nodes were noted.
Given her failure to improve significantly after 6 days of antibiotic treatment, and her recent use of glucocorticoids, I would expand my diagnostic considerations to include other necrotizing bacterial infections, tuberculosis, fungus, and Nocardia.
Given the results of the CT scan she was placed in respiratory isolation to rule out active pulmonary tuberculosis. Though tachypneic, her blood pressure and pulse remained stable. However, her oxygen saturation deteriorated, declining to 92% on 2 L of oxygen via nasal cannula during hospital days 6 and 7. Subsequent successful attempts at collecting sputum yielded rapid growth of yeast (not Cryptococcus spp.). Pulmonary and infectious disease consultations were obtained and vancomycin was added to her regimen. The patient subsequently agreed to undergo diagnostic bronchoscopy.
I agree with obtaining input from expert consultants. I think we too often underutilize consultation in patients that are better but not completely better when we are not entirely sure what is going on. Evidence of noncryptococcus yeast in sputum may sometimes indicate colonization with Candida spp. without any significant clinical consequence. This finding may alternatively suggest the possibility of a true fungal pneumonia caused by 1 of the dimorphic fungi, including Histoplasma capsulatum, Paracoccidioides brasiliensis, Blastomyces dermatitides, or Coccidioides immitis. However, in this case there is not a strong epidemiologic patient history of exposure to any of these types of fungi.
Three sputum smears were negative for acid fast bacilli (AFB). Bronchoscopy revealed grossly abnormal mucosa in the left upper lobe and bronchomalacia, but no obstructive lesions. A transthoracic echocardiogram was ordered to evaluate her degree of pulmonary hypertension.
The 3 sputum specimens that were negative for AFB despite cavitary lung disease have high sensitivity for ruling out pulmonary tuberculosis. In addition, given the absence of any bacterial pathogen isolated from these specimens, I would pursue the possibility of other potential fungal pathogens given the patient's subacute course, history of using inhaled and oral corticosteroids, sputum results, and the presence of a cavitary lesion on her CT scan images.
Cytologic examination of the bronchoalveolar lavage (BAL) sample showed a cell differential of 1% bands, 58% neutrophils, 9% lymphs, and 27% eosinophils. The routine postbronchoscopy chest radiograph showed complete opacification of the left lung. The patient's WBC count rose to 26,000/L but she remained afebrile. Echocardiogram was reported to be of very poor quality due to her obesity. The cardiologist reviewing the echocardiogram called the attending physicians and stated there was possibly something in the left pulmonary artery and aortic dissection could not be ruled out.
The presence of eosinophilia on BAL may be a very important clue as to what lung pathology she has. In fact, eosinophilia in this setting may indicate the possibility of parasitic or fungal infection of the lung, or inflammation of the airway associated to drug toxicity, asthma, or environmental toxin exposure. With this additional information, I am concerned that she may be harboring an atypical infection such as an invasive fungus. The echocardiogram results are unclear to me but will need to be clarified with additional testing.
The interpretation of the transbronchial biopsy specimen was limited but suggested invasive pseudomembranous tracheal bronchitis due to aspergillosis. The routine hematoxylin and eosin stain showed portions of alveolar lung tissue and some collapsed submucosal bronchial glands with relatively normal‐looking lung tissue but along the edge of the spaces were obvious fungal organisms. The Gomori's methenamine silver (GMS) stain suggested the presence of Aspergillus organisms (Figure 3). Fungal cultures were also negative for any of the other dimorphic fungi or for molds.
Despite the negative culture results, the overall clinical picture suggests a necrotizing pneumonia caused by an invasive Aspergillus affecting both the bronchial tree and the lower respiratory tract. Generally, necrotizing pneumonias usually have a slow response to antimicrobial therapy. Given the inherent difficulty in differentiating clearly between invasive and noninvasive disease based on a transbronchial biopsy specimen, initiating antifungal therapy for invasive aspergillosis is appropriate in this patient. This patient's recent use of oral glucocorticoids and chronic use of inhaled glucocorticoids are both potential risk factors that predisposed this patient to develop invasive aspergillosis.
Many times we simply follow treatment guidelines for different categories of pneumonia, and have limited or inadequate clinical information to make more definitive diagnoses. While we need these treatment protocols, physicians must avoid falling into the trap that antibiotics treat all infectious etiologies in the lung and we should make reasonable efforts to pin down the etiology. All of us have been fooled by atypical presentations of tuberculosis, fungus, and noninfectious diseases of the lung. I think it behooves us to be vigilant about alternative diagnoses and consider pursuing additional studies whenever the clinical response to initial treatment does not meet our expectations.
Subsequently, the patient's additional cultures remained negative. The official echocardiogram report was read as questionable PE in the pulmonary artery. A spiral CT angiogram revealed a pulmonary artery embolus in the left upper lobe and she was treated with anticoagulation. Her shortness of breath improved steadily and she was successfully discharged after receiving 9 days of oral voriconazole. Outpatient pulmonary function testing documented the presence of chronic obstructive lung disease. She completed a 5‐month course of voriconazole therapy with significant clinical and radiologic improvement of her pulmonary infiltrate. She also completed a 12‐month treatment with warfarin for the concomitant pulmonary embolism. On follow‐up at 12 months she was doing well.
COMMENTARY
Aspergillosis caused particularly by Aspergillus fumigatus is considered an emerging infectious disease that frequently produces significant morbidity and mortality among immunocompromised patients.1, 2 The most frequently‐affected organs by this fungal pathogen include the lung and the central nervous system. There are 3 pathogenic mechanisms of Aspergillus infection of the lung: colonization, hypersensitivity reaction, and invasive aspergillosis.1
Invasive pulmonary aspergillosis is predominantly seen among individuals with severe degrees of immunosuppression as a result of solid‐organ transplantation, immunosuppressive therapies for autoimmune diseases, systemic glucocorticoids, and chemotherapy for hematologic malignancies. Mortality due to invasive aspergillosis continues to be very high (>58%) despite our improved ability to diagnose this condition and newer therapies to treat immunocompromised individuals.1 Invasive aspergillosis can manifest clinically in multiple ways. These include: (1) an invasive vascular process in which fungal organisms invade blood vessels, causing a rapidly progressive and often fatal illness; (2) necrotizing pseudomembranous tracheal bronchitis; (3) chronic necrotizing aspergillosis; (4) bronchopleural fistula; or (5) empyema.35 In our case, while the pathologic findings were most suggestive of an invasive pseudomembranous tracheal bronchitis, the overall clinical picture was most compatible with a necrotizing pneumonia due to invasive aspergillosis.
In addition to the traditional identified risk factors for invasive pulmonary aspergillosis, a number of reports during the last decade have demonstrated the occurrence of invasive aspergillosis in patients with COPD.14 A systematic review of the literature demonstrated that among 1,941 patients with invasive aspergillosis, 26 (1.3%) had evidence of COPD as the main risk factor for developing invasive aspergillosis.1 A single report has associated the potential use of inhaled steroids with the occurrence of invasive aspergillosis in this patient population.2 However, other factors that may promote increased susceptibility to invasive fungal infection among patients with COPD include the use of long‐term or repeated short‐term glucocorticoid treatments, and the presence of multiple additional comorbidities, which may be found in this same population such as diabetes, malnutrition, or end‐stage renal disease.3, 4 Most reported series have demonstrated a high mortality rate of invasive pulmonary aspergillosis in patients with COPD.14
The diagnosis of invasive pulmonary aspergillosis represents a significant clinical challenge. Diagnostic algorithms incorporating CT, antigen detection testing (for serum galactomannan and ‐glucan) as well as polymerase chain reaction diagnostic testing appear to be beneficial in the early diagnosis of invasive aspergillosis in particular settings such as in allogeneic hematopoietic stem cell transplantation.5 The role of antigen testing to identify early invasive aspergillosis in patients with COPD remains uncertain since it has been evaluated in a limited number of patients and therefore clinical suspicion is critical to push clinicians to pursue invasive tissue biopsy and cultures to confirm the diagnosis.3, 4
Based on the available clinical case series and in our case, invasive pulmonary aspergillosis should be suspected in COPD patients with rapidly progressive pneumonia not responding to antibacterial therapy and who have received oral or inhaled glucocorticoids in the recent past. In addition, this case also illustrates that occasionally, patients present with more than 1 life‐threatening diagnosis. This patient was also diagnosed with PE despite adequate prophylaxis. In addition to the well‐known clinical risk factors of obesity and lung disease, the underlying infection may have contributed to a systemic or local hypercoagulable condition that further increased her risk for venous thromboembolism.
KEY TEACHING POINTS
-
Clinicians should remember to consider a broad differential in patients presenting with pneumonia, including the possibility of fungal pathogens in patients with known risk factors and in patients with multiple, potentially immunosuppressive comorbidities, or in patients who do not improve on standard antibiotic therapy.
-
There is some evidence of an association between COPD and invasive aspergillosis, likely due to the frequent use of oral corticosteroids and/or chronic inhaled steroids in this population.
- ,,.Aspergillosis case‐fatality rate: systematic review of the literature.Clin Infect Dis.2001;32:358–366.
- ,,,,.Invasive pulmonary filamentous fungal infection in a patient receiving inhaled corticosteroid therapy.Clin Infect Dis.2002;35:e54–e56.
- ,,, et al.Invasive pulmonary aspergillosis in chronic obstructive pulmonary disease: an emerging fungal pathogen.Clin Microbiol Infect.2005;11:427–429.
- ,,,,,.Invasive pulmonary aspergillosis in patients with chronic obstructive pulmonary disease: report of eight cases and review.Clin Infect Dis.1998;26:1473–1475.
- ,.Current approaches to diagnosis and treatment to invasive aspergillosis.Am J Respir Crit Care Med.2006;173:707–717.
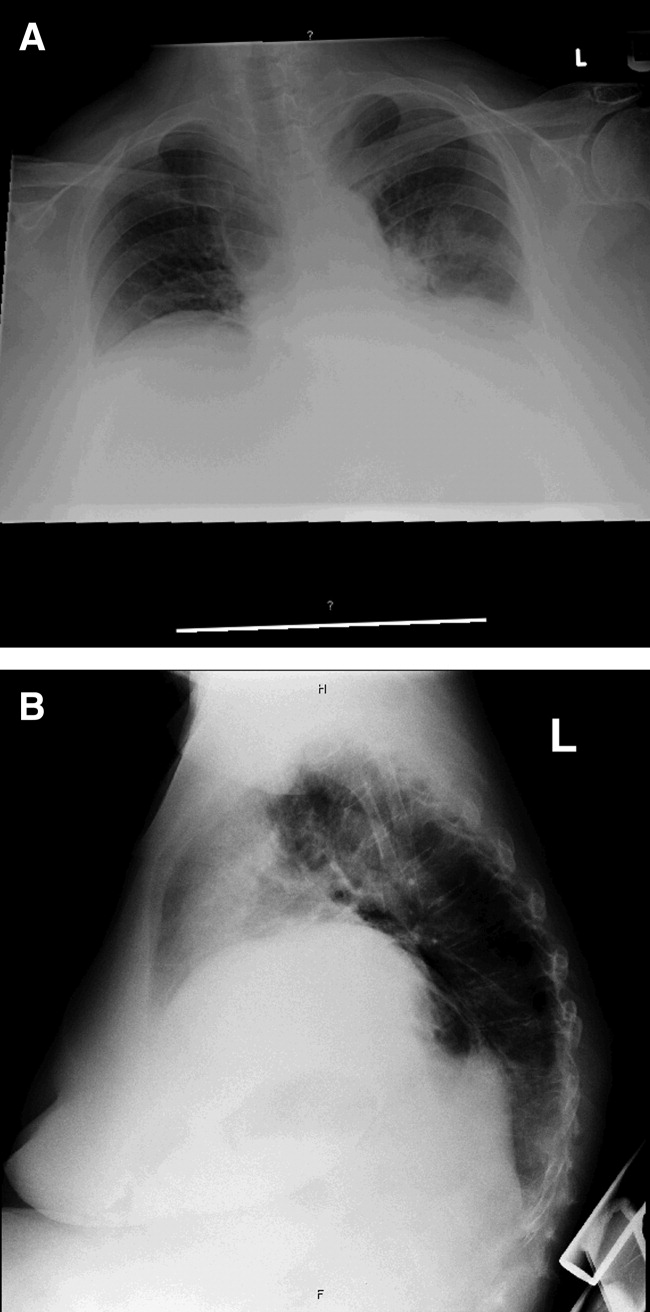
Resident Perceptions of Hyperglycemia
Ongoing surveillance indicates that the number of hospitalizations involving patients with a diagnosis of diabetes mellitus is increasing in the United States.1, 2 Hospitalized patients with hyperglycemia have worse outcomes (eg, greater mortality, longer length of stay, and more infections) than those without high glucose levels.3, 4 The rate of adverse outcomes associated with hyperglycemia can be decreased with improved management.3, 4 Consequently, the American Diabetes Association and the American College of Endocrinology advocate lower glucose targets for all hospitalized patients regardless of whether they have a known diagnosis of diabetes.3, 4
Practitioners continue to debate the exact glucose targets that should be attained for inpatients;5, 6 however, there is more to inpatient hyperglycemia management than just trying to achieve a specific glucose range. Caring for patients with diabetes in the hospital is complex and must also encompass patient safety, but many practitioners perceive a state of glycemic chaos in the hospital.7 Because many physicians frequently overlook diabetes and glucose control in the hospital, appropriate therapeutic responses to hyperglycemia do not occur.810 National,11, 12 state,13 and specialty societies3, 4, 14 are working toimprove care for hospitalized patients with hyperglycemia. A recent consensus conference emphasized the need to develop broad‐based educational programs to increase awareness about the importance of inpatient glycemic control and to develop a standardized set of tools for hospitals to use to improve care.4 However, there is ongoing concern about the slow pace at which hospitals are implementing recommendations about glycemic control.4
Intensive and prolonged educational efforts about the importance of glycemic control will be essential ingredients of any quality improvement effort designed to create glycemic order out of glycemic chaos in the hospital.15 Before educational interventions and policies directed at improving the management of hyperglycemia in hospitalized patients can be developed, institutions need to gain a better understanding of how clinicians view the importance of inpatient glucose control and which barriers they perceive as constraints to their ability to care for inpatients with hyperglycemia.
At Atlanta Medical Center (AMC), the large urban teaching hospital where this study was conducted, the glucose control team detected resistance to changes that were implemented to improve the hospital's quality of glycemic control;16 this observation led to a desire to gain more information about practitioner attitudes regarding inpatient glucose control management. Data on practitioner attitudes and beliefs about inpatient hyperglycemia are only now emerging and are limited to studies from a single institution.17, 18 Thus, additional studies are needed to determine whether findings from these first studies are applicable to other types of hospital settings that have different inpatient populations. To gain additional insight into clinician beliefs about inpatient glucose control, we adapted a previously published questionnaire17, 18 and used it to survey resident physicians training at AMC.
METHODS
Setting
AMC is a community teaching hospital located in downtown Atlanta, Georgia, and it is a 460‐bed tertiary care facility. All adult general medical and surgical specialties are represented, in addition to obstetrics and gynecology, a neonatal unit, a level 2 trauma unit, a stroke unit, and an inpatient rehabilitation unit. The inpatient population is mostly minority in mix, with 45% African American, 37% Caucasian, 12% Hispanic, and 6% other races.16, 19 Various types of practitioners provide patient care at AMC, including postgraduate trainees (resident physicians), graduate medical education faculty, physician assistants, and nurse practitioners.
Description of Survey
A previously published survey instrument (the Mayo Clinic Inpatient Diabetes Attitude Survey) was adapted for this project.17, 18 The survey was developed by a team of endocrinologists and primary care physicians with the assistance of our institutional experts in survey design; it was then piloted and submitted to iterative cycles of review and revision.17 The survey was used to assess beliefs first among resident physicians17 and then among midlevel practitioners at the same facility.18 The survey tool was specifically developed to evaluate perceptions of practitioners about inpatient glucose management, including beliefs about the importance of glucose control in the hospital, optimal glucose targets, and barriers to the successful treatment of hyperglycemia. Additionally, the questionnaire was previously used to solicit residents' perceptions about the proportion of their inpatient practices represented by diabetes patients, their beliefs regarding whether patients were achieving their glucose targets, their degree of comfort with managing hyperglycemia and using insulin therapy, and their familiarity with existing institutional policies and preprinted insulin order sets.17, 18 The questionnaire was expanded from its original version to include questions about the use of intravenous insulin.
Survey Participants
As in most academic teaching facilities, at AMC resident physicians treat many of the inpatients who have a diagnosis of diabetes, making the residents an important group to target for educational programs focused on inpatient glucose management. Thus, the audience for this survey included only resident physicians who had ongoing inpatient responsibilities so that the data could be used to assist in educational planning strategies for increasing awareness and improving treatment of inpatients with hyperglycemia. We identified 85 residents who met the inclusion criteria, and we conducted the survey from March to April 2007.
Data Analysis
Written surveys were collected and entered into SurveyTracker version 4.0 (Training Technologies, Inc., Lebanon, Ohio) for analysis. We then examined the distribution of responses to individual questions. Finally, we listed the frequency of expressed barriers to inpatient glucose management from most common to least common.
RESULTS
Respondent Demographics
Sixty‐six of 85 residents (78%) responded to the survey. The mean age of the respondents was 31 years, 47% were men, 33% were in their first year of residency training, and 73% had graduated from medical school during the year 2002 or later. The residents represented the following departments: 41% from internal medicine (n = 27), 18% from family medicine (n = 12), 15% from general surgery (n = 10), 12% from orthopedics (n = 8), and 14% from obstetrics and gynecology (n = 9).
Perceptions About Inpatient Burden of Diabetes
When asked to estimate the percentage of their hospitalized patients who were considered to have a diagnosis of diabetes or hyperglycemia, 14% of the residents indicated that 0% to 20% of their hospitalized patients were in this category, 30% of the residents estimated that 21% to 40% of their inpatients were in this group, and 25% of the residents believed that such a diagnosis applied to 41% to 60% of their inpatients. Additionally, 23% of the residents said that 61% to 80% of their inpatients were considered to have a diagnosis of diabetes or hyperglycemia, 3% of the residents estimated that 81% to 100% of their hospitalized patients had such a diagnosis, and 5% of the residents were unsure. Thus, respondents perceived that diabetes constituted a substantial portion of their inpatient practices, with 50% of the residents estimating that more than 40% of their hospitalized patients had a diagnosis of diabetes or hyperglycemia and nearly 25% of responding residents believing that more than 60% of their inpatients had the same diagnosis.
Views on the Importance of Glycemic Control
Most resident physicians believed that good glycemic control was important in hospitalized patients (Table 1); 97% believed that it was very important to have tight glycemic control in critically‐ill patients, 72% emphasized that it was very important in non‐critically‐ill patients, and 85% indicated that it was very important during the perioperative period. Nearly all residents believed that it was important to achieve good glycemic control in pregnant patients (Table 1).
| ||||
| Category | Response | |||
| Importance of Treating Hyperglycemia | Very Important | Somewhat Important | Not at All Important | Don't Know |
| Critically ill patients | 97 | 3 | 0 | 0 |
| Non‐critically‐ill patients | 72 | 26 | 2 | 0 |
| Perioperative patients | 85 | 15 | 0 | 0 |
| Pregnant patients | 97 | 3 | 0 | 0 |
| Comfort Level | Very Comfortable | Somewhat Comfortable | Not at All Comfortable | Don't Know |
| Treating hyperglycemia | 42 | 47 | 11 | 0 |
| Treating hypoglycemia | 49 | 44 | 6 | 1 |
| Using subcutaneous insulin | 44 | 44 | 11 | 1 |
| Using insulin drips | 38 | 42 | 18 | 2 |
| Using insulin pumps* | 14 | 17 | 58 | 12 |
| Familiarity | Very Familiar | Somewhat Familiar | Not at All Familiar | Unaware of Policy |
| Insulin pump policy | 9 | 15 | 52 | 24 |
| Insulin pump orders | 6 | 17 | 54 | 23 |
| Hypoglycemia policy | 23 | 45 | 17 | 15 |
| Subcutaneous insulin orders | 34 | 35 | 14 | 17 |
| Intravenous insulin orders | 38 | 33 | 21 | 8 |
| Glucose Goal, mg/dL | 80‐110 | 111‐180 | 181‐250 | Don't Know |
| Critically ill patients | 91 | 6 | 2 | 1 |
| Non‐critically‐ill patients | 53 | 46 | 0 | 1 |
| Perioperative patients | 76 | 23 | 0 | 1 |
| Glucose Level for Initiation of IV Insulin, mg/dL | >110 | >140 | >180 | Don't Know |
| Critically ill patients | 8 | 30 | 51 | 11 |
| Non‐critically‐ill patients | 1 | 6 | 65 | 28 |
| Pregnant patients | 8 | 27 | 30 | 35 |
Comfort With Treatment and Management
Survey participants were asked how comfortable they felt about different scenarios pertaining to inpatient glucose management (Table 1). Although more than 40% of respondents indicated that they felt very comfortable treating hyperglycemia and hypoglycemia in the hospital, a large proportion (50% or more) also indicated that they were only somewhat comfortable or not at all comfortable treating these conditions. Similarly, in response to questions about their degree of comfort working with subcutaneous or intravenous insulin, more than 50% of trainees were only somewhat comfortable or not at all comfortable. Finally, most were not at all comfortable with the use of insulin pumps in the hospital (Table 1).
Familiarity With Existing Policies and Procedures
Most of the trainees indicated that they were not at all familiar with existing hospital policies and orders pertaining to insulin pumps (Table 1). Most respondents were only somewhat familiar with the institutional hypoglycemia policy, but a substantial percentage (32%) were either not at all familiar or even unaware that an institutional hypoglycemia policy existed. Similarly, most were only somewhat familiar, not at all familiar, or even unaware of orders or policies pertaining to use of subcutaneous or intravenous insulin (Table 1).
Beliefs About Glucose Targets and Hypoglycemia
When asked to indicate the target glucose levels that they would like to achieve, most resident physicians indicated that good glycemic control meant a target range of 80 to 110 mg/dL for critically‐ill patients and for perioperative patients. For non‐critically‐ill patients, targets were split between a target range of 80 to 110 mg/dL and 111 to 180 mg/dL. Trainees rarely suggested targets greater than 180 mg/dL (Table 1).
Most respondents believed that they were achieving their glycemic goals in 41% to 60% of their patients (Fig. 1A). More than half (56%) perceived that they were achieving their glucose targets in more than 40% of their diabetes patients. When asked at what glucose level they first considered the patient to be hypoglycemic, half of the respondents chose <60 mg/dL (Fig. 1B), although some had even lower cutoffs before they considered someone to have a diagnosis of hypoglycemia.

Thresholds for Starting Intravenous Insulin
For both critically‐ill and non‐critically‐ill patients, most resident physicians indicated that they would wait until the glucose level was greater than 180 mg/dL before starting an insulin infusion (Table 1). Likewise, obstetrics residents identified a glucose level greater than 180 mg/dL as a threshold to start intravenous insulin in pregnant patients.
Perceived Barriers to Care
The survey concluded with a question that asked resident physicians to choose from a list of factors they perceived as obstacles to inpatient glucose management. The 5 most frequently chosen obstacles, from most common to least common, were as follows: knowing what insulin type or regimen works best, fluctuating insulin demands related to stress and risk of causing patient hypoglycemia (cited with equal frequency), unpredictable changes in patient diet and meal times, and unpredictable timing of patient procedures (Table 2).
| Barrier | Response, Number (%) (n = 66) |
|---|---|
| |
| Knowing what insulin type or regimen works best | 26 (39) |
| Fluctuating insulin demands related to stress/concomitantly used medications | 26 (39) |
| Risk of causing hypoglycemia | 25 (38) |
| Unpredictable changes in patient diet and mealtimes | 25 (38) |
| Unpredictable timing of patient procedures | 19 (29) |
| Patient not in hospital long enough to control glucose adequately | 18 (27) |
| Shift changes and cross‐coverage lead to inconsistent management | 18 (27) |
| Knowing best options to treat hyperglycemia | 16 (24) |
| Knowing when to start insulin | 14 (21) |
| Knowing how to adjust insulin | 14 (21) |
| Conversion between different forms of insulin | 13 (20) |
| Lack of guidelines on how to treat hyperglycemia | 11 (17) |
| Preferring to defer management to outpatient care or to another specialty | 10 (15) |
| Knowing how to start insulin | 10 (15) |
| Knowing how to best prevent hypoglycemia | 7 (11) |
| None, I have no trouble treating hyperglycemia in the hospital | 7 (11) |
| Glucose management not adequately addressed on rounds | 6 (9) |
| Treating hyperglycemia is not a priority in the hospital | 6 (9) |
| Other* | 4 (6) |
| Disagreement with other team members on how to control glucose | 3 (5) |
DISCUSSION
In recent years national and regional organizations have focused greater attention on the management of hyperglycemia among inpatient populations by introducing and promoting guidelines for better care.3, 4, 1114 A consensus conference in 2006 urged hospitals to move rapidly to make euglycemia a goal for all inpatients and to make patient safety in glycemic control a reality. 20 AMC has already taken some steps toward understanding and improving its hospital‐based care of hyperglycemia, including understanding the mortality associated with hyperglycemia within the institution and implementing a novel insulin infusion algorithm.16, 19
Before hospitals can develop high‐quality improvement and educational programs focused on inpatient hyperglycemia, they will need more insight into their clinicians' views on inpatient glycemic control and the perceived barriers to successful treatment of hyperglycemia. However, the only data that have been published about practitioner attitudes on inpatient diabetes and glycemic control are from a single institution.17, 18 Thus, analyses should be broadened to include different types of hospital settings to determine common beliefs on the topic.
AMC is very different from the hospital facility where earlier studies on physician attitudes about inpatient glucose management were conducted. Whereas the site of the earlier studies is located in the Southwest and has a diabetes inpatient population that is primarily white, AMC is an urban hospital in the Southeast whose diabetes inpatient population is primarily minority.21 Despite the institutional, geographic, and patient population differences, however, results of the current survey suggest that there may be similar beliefs among practitioners about inpatient glucose management as well as common knowledge deficits that can be targeted for educational interventions.
Similar to the resident physicians surveyed in previous studies,17, 18 AMC resident physicians considered diabetes to be a substantial part of their inpatient practices: 56% of respondents believed that more than 40% of their inpatients had a diagnosis of diabetes. Historically, the prevalence at AMC of hyperglycemia has been about 38% and the prevalence of diabetes about 26%.19 The increasing number of hospital dismissals attributable to diabetes likely has increased the inpatient prevalence of the disease at AMC as well, but very high rates perceived by some residents (eg, 81%‐100%) are likely not accurate. Nonetheless, this perception of such a large burden of diabetes clearly substantiates the need to provide pertinent information and essential tools to clinicians for successful management of hyperglycemia in hospital patients. We also established that most AMC resident physicians who were surveyed believed that good glucose control was very important in situations relating to critical illness or noncritical illness. For most respondents, good glucose control was also very important in the perioperative period. This finding suggests that the trainees understand the importance of good glucose control in such situations.
In keeping with findings from previous studies,17, 18 respondents to this survey indicated glucose targets that would be well within currently existing guidelines.3, 4 Glucose management training might be improved by conveying whether actual glucose outcomes match residents' perceived achievement of glycemic control.
Insulin is the recommended treatment for inpatient hyperglycemia,3, 4 yet residents' responses reflected concern about insulin use. The most commonly noted issues, cited with equal frequency, were related to insulin use: knowing what insulin type or regimen works best and fluctuating insulin demands related to stress/concomitantly used medications. Our survey did not evaluate whether residents had different degrees of comfort with different subcutaneous insulin programs (eg, sliding scale versus basal‐bolus). Future surveys could be modified to better hone in on evaluating self‐perceived competencies in these areas.
Given the increasing complexity of insulin therapy, resident physicians' perception of insulin administration as the top barrier to inpatient glucose management may not be surprising.17, 18 The number of insulin analogs has increased in recent years. Moreover, numerous intravenous insulin algorithms are available.22, 23 Errors in insulin administration are among the most frequently occurring medication errors in hospitals.24 To address patient safety and medical system errors in the fields of diabetes and endocrinology, the American College of Endocrinology published a position statement on the topic in 2005.25 Guidelines about when to initiate insulin therapy, how to choose from numerous insulin treatment options, and how to adjust therapy in response to rapidly changing clinical situations will have to be integrated into any effort to improve inpatient glucose management. One study indicated that an educational process focused on teaching residents about insulin therapy can be successful.26
Clinician fear of hypoglycemia is often perceived as the primary obstacle to successful control of inpatient glucose levels;3, 27 however, this was not the chief concern expressed by either AMC resident physicians or by practitioners surveyed in prior studies.17, 18 Emerging data suggest that hypoglycemia in the hospital is actually uncommon.21, 28 As hospitals intensify hyperglycemia management efforts, hypoglycemia and concerns about its frequency of occurrence will most likely increase. No consensus exists regarding the number of hypoglycemic events that are acceptable in a hospitalized patient. The American Diabetes Association Workgroup on Hypoglycemia has defined hypoglycemia as an (arterialized venous) plasma glucose concentration of less than or equal to 70 mg/dL.29 As a group, residents surveyed for the current study were not consistent in their definition of hypoglycemia.
The residents at AMC also reported potential obstacles to care besides insulin management that suggest system‐based problems. Unpredictable timing of patient procedures and unpredictable changes in patient diet and mealtimes were among the 5 most frequently cited concerns. Other concerns included patient not in hospital long enough to adequately control glucose and shift changes and cross‐coverage lead to inconsistent management. These findings are identical to those of prior studies17, 18 and suggest system‐based problems as common barriers to inpatient glucose management. Some of these obstacles, such as length of hospital stay and timing of procedures, would be difficult to reengineer. However, other aspects, such as adjusting therapy to mealtimes and ensuring standardization of treatment across shifts, could be addressed through institution‐wide education and changes in policies.
As in previous studies, another major finding that emerged from this survey was the lack of resident physician familiarity with existing policies and procedures related to inpatient glucose management. AMC has a longstanding policy on hypoglycemia management and has preprinted order sets for subcutaneous insulin. AMC has implemented a revised insulin infusion algorithm16 in addition to a policy and an order set for the use of insulin pumps.30 There are no specific data on how many patients receiving insulin pump therapy are hospitalized, but these patients are likely to be encountered only rarely in the hospital setting. Hence, it may not be surprising that residents are unfamiliar with policies pertaining to inpatient insulin pump use, but they should at least be aware that guidance is available. One of the first steps to enhancing and standardizing hospital glucose management may simply be to make certain that clinicians are familiar with policies that are already in place within the institution.
A limitation of this study is the small sample size. The results of the present study should not be extrapolated to nonresident medical staff such as attending physicians, but the questionnaire could be adapted, with minor modifications, to investigate how other health care professionals view inpatient glucose management. In addition, the questionnaire could be used to assess changes in beliefs over time. Future studies should be designed to correlate resident perceptions about their inpatient diabetes care and actual practice patterns.
More surveys such as the one reported on here need to be conducted in additional institutions in order to expand our understanding of practitioner attitudes regarding inpatient diabetes care. Data from the current study and previous ones suggest that practitioners share beliefs, knowledge deficits, and perceived barriers about inpatient glucose management. Most AMC resident physicians recognized the importance of good glucose control and set target glucose ranges consistent with existing guidelines. Knowledge deficits may be addressed by developing training programs that specifically spotlight insulin use in the hospital. As a first step to quality improvement, training programs should focus on familiarizing staff with existing institutional policies and procedures pertaining to hospital hyperglycemia. In addition, hospitals need to design strategies to overcome perceived and actual barriers to care so that they can realize the desired improvement in the management of hyperglycemia in their patients. We have already begun the development and implementation of educational modules directed at addressing many of these important issues.
- Centers for Disease Control and Prevention. Hospitalization for diabetes as first‐listed diagnosis. Available at: http://www.cdc.gov/diabetes/statistics/dmfirst/index.htm. Accessed October2008.
- Centers for Disease Control and Prevention. Hospitalizations for diabetes as any‐listed diagnosis. Available at: http://www.cdc.gov/diabetes/statistics/dmany/index.htm. Accessed October2008.
- ,,, et al.Management of diabetes and hyperglycemia in hospitals.Diabetes Care.2004;27:553–591.
- ACE/ADA Task Force on Inpatient Diabetes.American College of Endocrinology and American Diabetes Association consensus statement on inpatient diabetes and glycemic control.Endocr Pract.2006;12:458–468.
- ,.Counterpoint: inpatient glucose management: a premature call to arms?Diabetes Care.2005;28:976–979.
- ,.Point: inpatient glucose management: the emperor finally has clothes.Diabetes Care.2005;28:973–975.
- ,.Glycemic chaos (not glycemic control) still the rule for inpatient care: how do we stop the insanity? [Editorial]J Hosp Med.2006;1:141–144.
- ,,,,.Unrecognized diabetes among hospitalized patients.Diabetes Care.1998;21:246–249.
- ,,, et al.Diabetes care in the hospital: is there clinical inertia?J Hosp Med.2006;1:151–160.
- ,,,,.Inpatient management of diabetes and hyperglycemia among general medicine patients at a large teaching hospital.J Hosp Med.2006;1:145–150.
- The Joint Commission. Inpatient diabetes. Available at: http://www.jointcommission.org/CertificationPrograms/Inpatient+Diabetes. Accessed October2008.
- Institute for Healthcare Improvement. Implement effective glucose control. Available at: http://www.ihi.org/IHI/Topics/CriticalCare/IntensiveCare/Changes/ImplementEffectiveGlucoseControl.htm. Accessed October2008.
- ,,, et al.;the Georgia Hospital Association Diabetes Special Interest Group. Working to improve care of hospital hyperglycemia through statewide collaboration.Endocr Pract.2007;13:45–50.
- Society of Hospital Medicine. Glycemic control resource room. Available at: http://www.hospitalmedicine.org/AM/Template.cfm?Section=Search_Advanced_Search1:383–385.
- ,,, et al.Improving hyperglycemia management in the intensive care unit: preliminary report of a nurse‐driven quality improvement project using a redesigned insulin infusion algorithm.Diabetes Educ.2006;32:394–403.
- ,,, et al.Management of inpatient hyperglycemia: assessing perceptions and barriers to care among resident physicians.Endocr Pract.2007;13:117–124.
- ,,, et al.Beliefs about hospital diabetes and perceived barriers to glucose management among inpatient midlevel practitioners.Diabetes Educ.2008;34:75–83.
- ,,,,,.Hyperglycemia: an independent marker of in‐hospital mortality in patients with undiagnosed diabetes.J Clin Endocrinol Metab.2002;87:978–982.
- .Patient safety and inpatient glycemic control: translating concepts into action.Endocr Pract.2006;12 (Suppl 3):49–55.
- ,,, et al.Diabetes care in hospitalized noncritically ill patients: more evidence for clinical inertia and negative therapeutic momentum.J Hosp Med.2007;2:203–211.
- ,,.Insulin infusion protocols for critically ill patients: a highlight of differences and similarities.Endocr Pract.2007;13:137–146.
- ,,.Intensive insulin therapy in critical care: a review of 12 protocols.Diabetes Care.2007;30:1005–1011.
- Institute for Safe Medication Practices. ISMP's list of high‐alert medications. Available at: http://www.ismp.org/Tools/highalertmedications.pdf. Accessed October2008.
- American Association of Clinical Endocrinologists. Patient safety and medical system errors in diabetes and endocrinology consensus conference: position statement. Available at: http://www.aace.com/pub/pdf/guidelines/PatientSafetyPositionStatement.pdf. Accessed October2008.
- ,,,.Eliminating inpatient sliding‐scale insulin: a reeducation project with medical house staff.Diabetes Care.2005;28:1008–1011.
- ,,, et al.Hospital hypoglycemia: not only treatment but also prevention.Endocr Pract.2004;10 (Suppl 2):89–99.
- ,,,,.Inpatient point‐of‐care bedside glucose testing: preliminary data on use of connectivity informatics to measure hospital glycemic control.Diabetes Technol Ther.2007;9:493–500.
- Workgroup on Hypoglycemia, American Diabetes Association.Defining and reporting hypoglycemia in diabetes: a report from the American Diabetes Association Workgroup on Hypoglycemia.Diabetes Care.2005;28:1245–1249.
- ,,, et al.Use of continuous subcutaneous insulin infusion (insulin pump) therapy in the hospital setting: proposed guidelines and outcome measures.Diabetes Educ.2005;31:849–857.
Ongoing surveillance indicates that the number of hospitalizations involving patients with a diagnosis of diabetes mellitus is increasing in the United States.1, 2 Hospitalized patients with hyperglycemia have worse outcomes (eg, greater mortality, longer length of stay, and more infections) than those without high glucose levels.3, 4 The rate of adverse outcomes associated with hyperglycemia can be decreased with improved management.3, 4 Consequently, the American Diabetes Association and the American College of Endocrinology advocate lower glucose targets for all hospitalized patients regardless of whether they have a known diagnosis of diabetes.3, 4
Practitioners continue to debate the exact glucose targets that should be attained for inpatients;5, 6 however, there is more to inpatient hyperglycemia management than just trying to achieve a specific glucose range. Caring for patients with diabetes in the hospital is complex and must also encompass patient safety, but many practitioners perceive a state of glycemic chaos in the hospital.7 Because many physicians frequently overlook diabetes and glucose control in the hospital, appropriate therapeutic responses to hyperglycemia do not occur.810 National,11, 12 state,13 and specialty societies3, 4, 14 are working toimprove care for hospitalized patients with hyperglycemia. A recent consensus conference emphasized the need to develop broad‐based educational programs to increase awareness about the importance of inpatient glycemic control and to develop a standardized set of tools for hospitals to use to improve care.4 However, there is ongoing concern about the slow pace at which hospitals are implementing recommendations about glycemic control.4
Intensive and prolonged educational efforts about the importance of glycemic control will be essential ingredients of any quality improvement effort designed to create glycemic order out of glycemic chaos in the hospital.15 Before educational interventions and policies directed at improving the management of hyperglycemia in hospitalized patients can be developed, institutions need to gain a better understanding of how clinicians view the importance of inpatient glucose control and which barriers they perceive as constraints to their ability to care for inpatients with hyperglycemia.
At Atlanta Medical Center (AMC), the large urban teaching hospital where this study was conducted, the glucose control team detected resistance to changes that were implemented to improve the hospital's quality of glycemic control;16 this observation led to a desire to gain more information about practitioner attitudes regarding inpatient glucose control management. Data on practitioner attitudes and beliefs about inpatient hyperglycemia are only now emerging and are limited to studies from a single institution.17, 18 Thus, additional studies are needed to determine whether findings from these first studies are applicable to other types of hospital settings that have different inpatient populations. To gain additional insight into clinician beliefs about inpatient glucose control, we adapted a previously published questionnaire17, 18 and used it to survey resident physicians training at AMC.
METHODS
Setting
AMC is a community teaching hospital located in downtown Atlanta, Georgia, and it is a 460‐bed tertiary care facility. All adult general medical and surgical specialties are represented, in addition to obstetrics and gynecology, a neonatal unit, a level 2 trauma unit, a stroke unit, and an inpatient rehabilitation unit. The inpatient population is mostly minority in mix, with 45% African American, 37% Caucasian, 12% Hispanic, and 6% other races.16, 19 Various types of practitioners provide patient care at AMC, including postgraduate trainees (resident physicians), graduate medical education faculty, physician assistants, and nurse practitioners.
Description of Survey
A previously published survey instrument (the Mayo Clinic Inpatient Diabetes Attitude Survey) was adapted for this project.17, 18 The survey was developed by a team of endocrinologists and primary care physicians with the assistance of our institutional experts in survey design; it was then piloted and submitted to iterative cycles of review and revision.17 The survey was used to assess beliefs first among resident physicians17 and then among midlevel practitioners at the same facility.18 The survey tool was specifically developed to evaluate perceptions of practitioners about inpatient glucose management, including beliefs about the importance of glucose control in the hospital, optimal glucose targets, and barriers to the successful treatment of hyperglycemia. Additionally, the questionnaire was previously used to solicit residents' perceptions about the proportion of their inpatient practices represented by diabetes patients, their beliefs regarding whether patients were achieving their glucose targets, their degree of comfort with managing hyperglycemia and using insulin therapy, and their familiarity with existing institutional policies and preprinted insulin order sets.17, 18 The questionnaire was expanded from its original version to include questions about the use of intravenous insulin.
Survey Participants
As in most academic teaching facilities, at AMC resident physicians treat many of the inpatients who have a diagnosis of diabetes, making the residents an important group to target for educational programs focused on inpatient glucose management. Thus, the audience for this survey included only resident physicians who had ongoing inpatient responsibilities so that the data could be used to assist in educational planning strategies for increasing awareness and improving treatment of inpatients with hyperglycemia. We identified 85 residents who met the inclusion criteria, and we conducted the survey from March to April 2007.
Data Analysis
Written surveys were collected and entered into SurveyTracker version 4.0 (Training Technologies, Inc., Lebanon, Ohio) for analysis. We then examined the distribution of responses to individual questions. Finally, we listed the frequency of expressed barriers to inpatient glucose management from most common to least common.
RESULTS
Respondent Demographics
Sixty‐six of 85 residents (78%) responded to the survey. The mean age of the respondents was 31 years, 47% were men, 33% were in their first year of residency training, and 73% had graduated from medical school during the year 2002 or later. The residents represented the following departments: 41% from internal medicine (n = 27), 18% from family medicine (n = 12), 15% from general surgery (n = 10), 12% from orthopedics (n = 8), and 14% from obstetrics and gynecology (n = 9).
Perceptions About Inpatient Burden of Diabetes
When asked to estimate the percentage of their hospitalized patients who were considered to have a diagnosis of diabetes or hyperglycemia, 14% of the residents indicated that 0% to 20% of their hospitalized patients were in this category, 30% of the residents estimated that 21% to 40% of their inpatients were in this group, and 25% of the residents believed that such a diagnosis applied to 41% to 60% of their inpatients. Additionally, 23% of the residents said that 61% to 80% of their inpatients were considered to have a diagnosis of diabetes or hyperglycemia, 3% of the residents estimated that 81% to 100% of their hospitalized patients had such a diagnosis, and 5% of the residents were unsure. Thus, respondents perceived that diabetes constituted a substantial portion of their inpatient practices, with 50% of the residents estimating that more than 40% of their hospitalized patients had a diagnosis of diabetes or hyperglycemia and nearly 25% of responding residents believing that more than 60% of their inpatients had the same diagnosis.
Views on the Importance of Glycemic Control
Most resident physicians believed that good glycemic control was important in hospitalized patients (Table 1); 97% believed that it was very important to have tight glycemic control in critically‐ill patients, 72% emphasized that it was very important in non‐critically‐ill patients, and 85% indicated that it was very important during the perioperative period. Nearly all residents believed that it was important to achieve good glycemic control in pregnant patients (Table 1).
| ||||
| Category | Response | |||
| Importance of Treating Hyperglycemia | Very Important | Somewhat Important | Not at All Important | Don't Know |
| Critically ill patients | 97 | 3 | 0 | 0 |
| Non‐critically‐ill patients | 72 | 26 | 2 | 0 |
| Perioperative patients | 85 | 15 | 0 | 0 |
| Pregnant patients | 97 | 3 | 0 | 0 |
| Comfort Level | Very Comfortable | Somewhat Comfortable | Not at All Comfortable | Don't Know |
| Treating hyperglycemia | 42 | 47 | 11 | 0 |
| Treating hypoglycemia | 49 | 44 | 6 | 1 |
| Using subcutaneous insulin | 44 | 44 | 11 | 1 |
| Using insulin drips | 38 | 42 | 18 | 2 |
| Using insulin pumps* | 14 | 17 | 58 | 12 |
| Familiarity | Very Familiar | Somewhat Familiar | Not at All Familiar | Unaware of Policy |
| Insulin pump policy | 9 | 15 | 52 | 24 |
| Insulin pump orders | 6 | 17 | 54 | 23 |
| Hypoglycemia policy | 23 | 45 | 17 | 15 |
| Subcutaneous insulin orders | 34 | 35 | 14 | 17 |
| Intravenous insulin orders | 38 | 33 | 21 | 8 |
| Glucose Goal, mg/dL | 80‐110 | 111‐180 | 181‐250 | Don't Know |
| Critically ill patients | 91 | 6 | 2 | 1 |
| Non‐critically‐ill patients | 53 | 46 | 0 | 1 |
| Perioperative patients | 76 | 23 | 0 | 1 |
| Glucose Level for Initiation of IV Insulin, mg/dL | >110 | >140 | >180 | Don't Know |
| Critically ill patients | 8 | 30 | 51 | 11 |
| Non‐critically‐ill patients | 1 | 6 | 65 | 28 |
| Pregnant patients | 8 | 27 | 30 | 35 |
Comfort With Treatment and Management
Survey participants were asked how comfortable they felt about different scenarios pertaining to inpatient glucose management (Table 1). Although more than 40% of respondents indicated that they felt very comfortable treating hyperglycemia and hypoglycemia in the hospital, a large proportion (50% or more) also indicated that they were only somewhat comfortable or not at all comfortable treating these conditions. Similarly, in response to questions about their degree of comfort working with subcutaneous or intravenous insulin, more than 50% of trainees were only somewhat comfortable or not at all comfortable. Finally, most were not at all comfortable with the use of insulin pumps in the hospital (Table 1).
Familiarity With Existing Policies and Procedures
Most of the trainees indicated that they were not at all familiar with existing hospital policies and orders pertaining to insulin pumps (Table 1). Most respondents were only somewhat familiar with the institutional hypoglycemia policy, but a substantial percentage (32%) were either not at all familiar or even unaware that an institutional hypoglycemia policy existed. Similarly, most were only somewhat familiar, not at all familiar, or even unaware of orders or policies pertaining to use of subcutaneous or intravenous insulin (Table 1).
Beliefs About Glucose Targets and Hypoglycemia
When asked to indicate the target glucose levels that they would like to achieve, most resident physicians indicated that good glycemic control meant a target range of 80 to 110 mg/dL for critically‐ill patients and for perioperative patients. For non‐critically‐ill patients, targets were split between a target range of 80 to 110 mg/dL and 111 to 180 mg/dL. Trainees rarely suggested targets greater than 180 mg/dL (Table 1).
Most respondents believed that they were achieving their glycemic goals in 41% to 60% of their patients (Fig. 1A). More than half (56%) perceived that they were achieving their glucose targets in more than 40% of their diabetes patients. When asked at what glucose level they first considered the patient to be hypoglycemic, half of the respondents chose <60 mg/dL (Fig. 1B), although some had even lower cutoffs before they considered someone to have a diagnosis of hypoglycemia.
Thresholds for Starting Intravenous Insulin
For both critically‐ill and non‐critically‐ill patients, most resident physicians indicated that they would wait until the glucose level was greater than 180 mg/dL before starting an insulin infusion (Table 1). Likewise, obstetrics residents identified a glucose level greater than 180 mg/dL as a threshold to start intravenous insulin in pregnant patients.
Perceived Barriers to Care
The survey concluded with a question that asked resident physicians to choose from a list of factors they perceived as obstacles to inpatient glucose management. The 5 most frequently chosen obstacles, from most common to least common, were as follows: knowing what insulin type or regimen works best, fluctuating insulin demands related to stress and risk of causing patient hypoglycemia (cited with equal frequency), unpredictable changes in patient diet and meal times, and unpredictable timing of patient procedures (Table 2).
| Barrier | Response, Number (%) (n = 66) |
|---|---|
| |
| Knowing what insulin type or regimen works best | 26 (39) |
| Fluctuating insulin demands related to stress/concomitantly used medications | 26 (39) |
| Risk of causing hypoglycemia | 25 (38) |
| Unpredictable changes in patient diet and mealtimes | 25 (38) |
| Unpredictable timing of patient procedures | 19 (29) |
| Patient not in hospital long enough to control glucose adequately | 18 (27) |
| Shift changes and cross‐coverage lead to inconsistent management | 18 (27) |
| Knowing best options to treat hyperglycemia | 16 (24) |
| Knowing when to start insulin | 14 (21) |
| Knowing how to adjust insulin | 14 (21) |
| Conversion between different forms of insulin | 13 (20) |
| Lack of guidelines on how to treat hyperglycemia | 11 (17) |
| Preferring to defer management to outpatient care or to another specialty | 10 (15) |
| Knowing how to start insulin | 10 (15) |
| Knowing how to best prevent hypoglycemia | 7 (11) |
| None, I have no trouble treating hyperglycemia in the hospital | 7 (11) |
| Glucose management not adequately addressed on rounds | 6 (9) |
| Treating hyperglycemia is not a priority in the hospital | 6 (9) |
| Other* | 4 (6) |
| Disagreement with other team members on how to control glucose | 3 (5) |
DISCUSSION
In recent years national and regional organizations have focused greater attention on the management of hyperglycemia among inpatient populations by introducing and promoting guidelines for better care.3, 4, 1114 A consensus conference in 2006 urged hospitals to move rapidly to make euglycemia a goal for all inpatients and to make patient safety in glycemic control a reality. 20 AMC has already taken some steps toward understanding and improving its hospital‐based care of hyperglycemia, including understanding the mortality associated with hyperglycemia within the institution and implementing a novel insulin infusion algorithm.16, 19
Before hospitals can develop high‐quality improvement and educational programs focused on inpatient hyperglycemia, they will need more insight into their clinicians' views on inpatient glycemic control and the perceived barriers to successful treatment of hyperglycemia. However, the only data that have been published about practitioner attitudes on inpatient diabetes and glycemic control are from a single institution.17, 18 Thus, analyses should be broadened to include different types of hospital settings to determine common beliefs on the topic.
AMC is very different from the hospital facility where earlier studies on physician attitudes about inpatient glucose management were conducted. Whereas the site of the earlier studies is located in the Southwest and has a diabetes inpatient population that is primarily white, AMC is an urban hospital in the Southeast whose diabetes inpatient population is primarily minority.21 Despite the institutional, geographic, and patient population differences, however, results of the current survey suggest that there may be similar beliefs among practitioners about inpatient glucose management as well as common knowledge deficits that can be targeted for educational interventions.
Similar to the resident physicians surveyed in previous studies,17, 18 AMC resident physicians considered diabetes to be a substantial part of their inpatient practices: 56% of respondents believed that more than 40% of their inpatients had a diagnosis of diabetes. Historically, the prevalence at AMC of hyperglycemia has been about 38% and the prevalence of diabetes about 26%.19 The increasing number of hospital dismissals attributable to diabetes likely has increased the inpatient prevalence of the disease at AMC as well, but very high rates perceived by some residents (eg, 81%‐100%) are likely not accurate. Nonetheless, this perception of such a large burden of diabetes clearly substantiates the need to provide pertinent information and essential tools to clinicians for successful management of hyperglycemia in hospital patients. We also established that most AMC resident physicians who were surveyed believed that good glucose control was very important in situations relating to critical illness or noncritical illness. For most respondents, good glucose control was also very important in the perioperative period. This finding suggests that the trainees understand the importance of good glucose control in such situations.
In keeping with findings from previous studies,17, 18 respondents to this survey indicated glucose targets that would be well within currently existing guidelines.3, 4 Glucose management training might be improved by conveying whether actual glucose outcomes match residents' perceived achievement of glycemic control.
Insulin is the recommended treatment for inpatient hyperglycemia,3, 4 yet residents' responses reflected concern about insulin use. The most commonly noted issues, cited with equal frequency, were related to insulin use: knowing what insulin type or regimen works best and fluctuating insulin demands related to stress/concomitantly used medications. Our survey did not evaluate whether residents had different degrees of comfort with different subcutaneous insulin programs (eg, sliding scale versus basal‐bolus). Future surveys could be modified to better hone in on evaluating self‐perceived competencies in these areas.
Given the increasing complexity of insulin therapy, resident physicians' perception of insulin administration as the top barrier to inpatient glucose management may not be surprising.17, 18 The number of insulin analogs has increased in recent years. Moreover, numerous intravenous insulin algorithms are available.22, 23 Errors in insulin administration are among the most frequently occurring medication errors in hospitals.24 To address patient safety and medical system errors in the fields of diabetes and endocrinology, the American College of Endocrinology published a position statement on the topic in 2005.25 Guidelines about when to initiate insulin therapy, how to choose from numerous insulin treatment options, and how to adjust therapy in response to rapidly changing clinical situations will have to be integrated into any effort to improve inpatient glucose management. One study indicated that an educational process focused on teaching residents about insulin therapy can be successful.26
Clinician fear of hypoglycemia is often perceived as the primary obstacle to successful control of inpatient glucose levels;3, 27 however, this was not the chief concern expressed by either AMC resident physicians or by practitioners surveyed in prior studies.17, 18 Emerging data suggest that hypoglycemia in the hospital is actually uncommon.21, 28 As hospitals intensify hyperglycemia management efforts, hypoglycemia and concerns about its frequency of occurrence will most likely increase. No consensus exists regarding the number of hypoglycemic events that are acceptable in a hospitalized patient. The American Diabetes Association Workgroup on Hypoglycemia has defined hypoglycemia as an (arterialized venous) plasma glucose concentration of less than or equal to 70 mg/dL.29 As a group, residents surveyed for the current study were not consistent in their definition of hypoglycemia.
The residents at AMC also reported potential obstacles to care besides insulin management that suggest system‐based problems. Unpredictable timing of patient procedures and unpredictable changes in patient diet and mealtimes were among the 5 most frequently cited concerns. Other concerns included patient not in hospital long enough to adequately control glucose and shift changes and cross‐coverage lead to inconsistent management. These findings are identical to those of prior studies17, 18 and suggest system‐based problems as common barriers to inpatient glucose management. Some of these obstacles, such as length of hospital stay and timing of procedures, would be difficult to reengineer. However, other aspects, such as adjusting therapy to mealtimes and ensuring standardization of treatment across shifts, could be addressed through institution‐wide education and changes in policies.
As in previous studies, another major finding that emerged from this survey was the lack of resident physician familiarity with existing policies and procedures related to inpatient glucose management. AMC has a longstanding policy on hypoglycemia management and has preprinted order sets for subcutaneous insulin. AMC has implemented a revised insulin infusion algorithm16 in addition to a policy and an order set for the use of insulin pumps.30 There are no specific data on how many patients receiving insulin pump therapy are hospitalized, but these patients are likely to be encountered only rarely in the hospital setting. Hence, it may not be surprising that residents are unfamiliar with policies pertaining to inpatient insulin pump use, but they should at least be aware that guidance is available. One of the first steps to enhancing and standardizing hospital glucose management may simply be to make certain that clinicians are familiar with policies that are already in place within the institution.
A limitation of this study is the small sample size. The results of the present study should not be extrapolated to nonresident medical staff such as attending physicians, but the questionnaire could be adapted, with minor modifications, to investigate how other health care professionals view inpatient glucose management. In addition, the questionnaire could be used to assess changes in beliefs over time. Future studies should be designed to correlate resident perceptions about their inpatient diabetes care and actual practice patterns.
More surveys such as the one reported on here need to be conducted in additional institutions in order to expand our understanding of practitioner attitudes regarding inpatient diabetes care. Data from the current study and previous ones suggest that practitioners share beliefs, knowledge deficits, and perceived barriers about inpatient glucose management. Most AMC resident physicians recognized the importance of good glucose control and set target glucose ranges consistent with existing guidelines. Knowledge deficits may be addressed by developing training programs that specifically spotlight insulin use in the hospital. As a first step to quality improvement, training programs should focus on familiarizing staff with existing institutional policies and procedures pertaining to hospital hyperglycemia. In addition, hospitals need to design strategies to overcome perceived and actual barriers to care so that they can realize the desired improvement in the management of hyperglycemia in their patients. We have already begun the development and implementation of educational modules directed at addressing many of these important issues.
- Centers for Disease Control and Prevention. Hospitalization for diabetes as first‐listed diagnosis. Available at: http://www.cdc.gov/diabetes/statistics/dmfirst/index.htm. Accessed October2008.
- Centers for Disease Control and Prevention. Hospitalizations for diabetes as any‐listed diagnosis. Available at: http://www.cdc.gov/diabetes/statistics/dmany/index.htm. Accessed October2008.
- ,,, et al.Management of diabetes and hyperglycemia in hospitals.Diabetes Care.2004;27:553–591.
- ACE/ADA Task Force on Inpatient Diabetes.American College of Endocrinology and American Diabetes Association consensus statement on inpatient diabetes and glycemic control.Endocr Pract.2006;12:458–468.
- ,.Counterpoint: inpatient glucose management: a premature call to arms?Diabetes Care.2005;28:976–979.
- ,.Point: inpatient glucose management: the emperor finally has clothes.Diabetes Care.2005;28:973–975.
- ,.Glycemic chaos (not glycemic control) still the rule for inpatient care: how do we stop the insanity? [Editorial]J Hosp Med.2006;1:141–144.
- ,,,,.Unrecognized diabetes among hospitalized patients.Diabetes Care.1998;21:246–249.
- ,,, et al.Diabetes care in the hospital: is there clinical inertia?J Hosp Med.2006;1:151–160.
- ,,,,.Inpatient management of diabetes and hyperglycemia among general medicine patients at a large teaching hospital.J Hosp Med.2006;1:145–150.
- The Joint Commission. Inpatient diabetes. Available at: http://www.jointcommission.org/CertificationPrograms/Inpatient+Diabetes. Accessed October2008.
- Institute for Healthcare Improvement. Implement effective glucose control. Available at: http://www.ihi.org/IHI/Topics/CriticalCare/IntensiveCare/Changes/ImplementEffectiveGlucoseControl.htm. Accessed October2008.
- ,,, et al.;the Georgia Hospital Association Diabetes Special Interest Group. Working to improve care of hospital hyperglycemia through statewide collaboration.Endocr Pract.2007;13:45–50.
- Society of Hospital Medicine. Glycemic control resource room. Available at: http://www.hospitalmedicine.org/AM/Template.cfm?Section=Search_Advanced_Search1:383–385.
- ,,, et al.Improving hyperglycemia management in the intensive care unit: preliminary report of a nurse‐driven quality improvement project using a redesigned insulin infusion algorithm.Diabetes Educ.2006;32:394–403.
- ,,, et al.Management of inpatient hyperglycemia: assessing perceptions and barriers to care among resident physicians.Endocr Pract.2007;13:117–124.
- ,,, et al.Beliefs about hospital diabetes and perceived barriers to glucose management among inpatient midlevel practitioners.Diabetes Educ.2008;34:75–83.
- ,,,,,.Hyperglycemia: an independent marker of in‐hospital mortality in patients with undiagnosed diabetes.J Clin Endocrinol Metab.2002;87:978–982.
- .Patient safety and inpatient glycemic control: translating concepts into action.Endocr Pract.2006;12 (Suppl 3):49–55.
- ,,, et al.Diabetes care in hospitalized noncritically ill patients: more evidence for clinical inertia and negative therapeutic momentum.J Hosp Med.2007;2:203–211.
- ,,.Insulin infusion protocols for critically ill patients: a highlight of differences and similarities.Endocr Pract.2007;13:137–146.
- ,,.Intensive insulin therapy in critical care: a review of 12 protocols.Diabetes Care.2007;30:1005–1011.
- Institute for Safe Medication Practices. ISMP's list of high‐alert medications. Available at: http://www.ismp.org/Tools/highalertmedications.pdf. Accessed October2008.
- American Association of Clinical Endocrinologists. Patient safety and medical system errors in diabetes and endocrinology consensus conference: position statement. Available at: http://www.aace.com/pub/pdf/guidelines/PatientSafetyPositionStatement.pdf. Accessed October2008.
- ,,,.Eliminating inpatient sliding‐scale insulin: a reeducation project with medical house staff.Diabetes Care.2005;28:1008–1011.
- ,,, et al.Hospital hypoglycemia: not only treatment but also prevention.Endocr Pract.2004;10 (Suppl 2):89–99.
- ,,,,.Inpatient point‐of‐care bedside glucose testing: preliminary data on use of connectivity informatics to measure hospital glycemic control.Diabetes Technol Ther.2007;9:493–500.
- Workgroup on Hypoglycemia, American Diabetes Association.Defining and reporting hypoglycemia in diabetes: a report from the American Diabetes Association Workgroup on Hypoglycemia.Diabetes Care.2005;28:1245–1249.
- ,,, et al.Use of continuous subcutaneous insulin infusion (insulin pump) therapy in the hospital setting: proposed guidelines and outcome measures.Diabetes Educ.2005;31:849–857.
Copyright © 2009 Society of Hospital Medicine
Triple Therapy for CLL
Dr. Tadeusz Robak and Dr. Michael Hallek discuss data suggesting that adding rituximab to fludarabine and cyclophosphamide improves survival in advanced chronic lymphocytic leukemia. Bob Finn of Elsevier Global Medical News (EGMN) reports from the annual meeting of the American Society of Hematology.
Dr. Tadeusz Robak and Dr. Michael Hallek discuss data suggesting that adding rituximab to fludarabine and cyclophosphamide improves survival in advanced chronic lymphocytic leukemia. Bob Finn of Elsevier Global Medical News (EGMN) reports from the annual meeting of the American Society of Hematology.
Dr. Tadeusz Robak and Dr. Michael Hallek discuss data suggesting that adding rituximab to fludarabine and cyclophosphamide improves survival in advanced chronic lymphocytic leukemia. Bob Finn of Elsevier Global Medical News (EGMN) reports from the annual meeting of the American Society of Hematology.
Study: Hospitalists Improve ED Throughput
Hospitalist-led, active-bed management can save hospitals millions of dollars a year by reducing ambulance diversions and trimming emergency department (ED) throughput times, according to a single-institution study.
The study in Annals of Internal Medicine (2008;149(11):804-810) found twice-daily bed management rounds in the ICU and regular visits to the ED to assess flow reduced ED throughput by 98 minutes. It also cut the number of ambulance diversions for overcrowding by 6% and reduced diversions caused by a lack of ICU beds by 27%. The study compared data from November 2005 to February 2006 (control period) and November 2006 to February 2007 (intervention period).
Lead author Eric Howell, MD, a hospitalist with Collaborative Inpatient Medical Service at Johns Hopkins Bayview Medical Center in Baltimore, estimated ambulance diversions cost hospitals $1,000 to $8,000 an hour. His study found a decrease of more than 2,000 hours in ambulance diversions, which could translate into $16 million in annual savings
"You've got to have the money up front," Dr. Howell says, acknowledging startup costs for a new or expanded hospitalist program. "You can't do it on the cheap. It falls apart."
Smaller hospitalist groups without the staffing for a full-time program could run a 12-hour, daytime version, or a trial run during specific hours.
"It's not an easy thing to do," he says, "but it adds tremendous value to a hospitalist group."
Research Roundup
Question: Can thrombolysis with alteplase improve stroke symptoms more than three hours after symptom onset?
Background: For acute ischemic stroke (AIS), trial evidence demonstrates tissue plasminogen activator (tPA) improves outcomes when given within three hours of symptom onset. Although the benefit of alteplase (a recombinant tPA therapeutic) decreases as the time from stroke symptom onset increases, some observational studies have suggested this drug may improve long-term neurologic outcomes even after the three-hour time limit.
Study Design: A multicenter, double blind, randomized placebo-controlled study with intention-to-treat analysis.
Setting: Multicenter, multinational study in Europe.
Synopsis: More than 800 patients presenting with stroke symptoms were diagnosed with ischemic stroke. Stroke severity was somewhat lower than prior tPA trials, and patients were randomized to receive either 0.9 mg per kg of alteplase by IV (up to 90 mg) or placebo.
Based on validated patient symptom scores, outcome was favorable in 52.4% of the alteplase group and 45.2% in the placebo group, leading to an absolute benefit of 7.2% and a number-needed-to-treat of 14. Although risk of any intracranial hemorrhage (ICH) was higher in the alteplase group (2.4% vs. 0.3%), symptomatic ICH was only marginally different, and mortality was similar in both groups, (7.7% vs. 8.4%).
This trial suggests the use of alteplase can be extended to four and a half hours after the onset of AIS symptoms without significantly increasing the overall mortality of these patients. A premium should be placed on earlier treatment, as the efficacy of alteplase decreases exponentially with time.
Bottom Line: Alteplase shows a statistically significant and clinically important improvement of AIS symptoms up to four and a half hours after the onset of stroke, without increasing mortality.
Citation: NEJM. 2008;359:1317-1329.
—Reviewed for the e-wire by Elbert Chun, MD, John Vazquez, MD, Larry Beer, MD, Maged Doss, MD, Vana Bollineni, MD, Mohammed S. Singapuri, MD, Dan Dressler, MD, MsCR, Emory University Hospital, Atlanta
At Work in Washington

SHM’s 20-member Public Policy Committee, headed by Eric Siegal, MD, had a busy 2008 addressing the many legislative and regulatory issues affecting hospitalists. As a result of our efforts, SHM’s visibility with key lawmakers, the Medicare Payment Advisory Commission (MedPAC), and the Centers for Medicare and Medicaid Services (CMS) has increased significantly, and policymakers now routinely turn to us for advice and expertise. Here is an update on how the committee represents hospital medicine—and your interests—in our nation’s capital.
Medicare Payment Cuts Prevented
Earlier this year, SHM’s Public Policy Committee (PPC) worked tirelessly to secure passage of H.R. 6331, the Medicare Improvements for Patients and Providers Act (MIPPA). It blocked the 10.6% physician payment cut, which was scheduled to go into effect July 1, 2008, and extended current payment rates through Dec. 31, 2009 Thanks in part to concerted advocacy by SHM and its members, Congress voted overwhelmingly July 15 to override President Bush’s veto of this measure. The new law (P.L. 110-275) includes 18 months of relief from scheduled cuts in Part B Medicare payments, other increases in reimbursement for inpatient evaluation and management services, and several SHM-supported quality improvement initiatives.
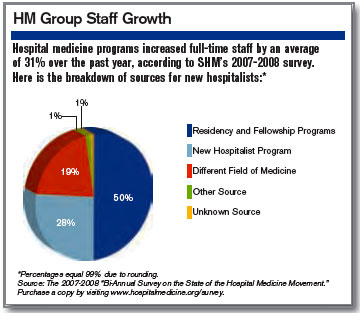
Beginning Jan. 1, hospitalists will see a 1.1% increase in Part B payments, instead of a projected 5.4% cut. SHM strongly supported provisions of the bill, which requires CMS to apply budget-neutral adjustments for 2007 and 2008 to the conversion factor. This change will result in an estimated average gain of another 3% in total Medicare payments for hospitalists.
SHM also supported continued funding of the Physician Quality Reporting Initiative (PQRI) and other quality provisions contained in MIPPA. Under the new Medicare act, hospitalists who successfully report quality measures are eligible for a bonus payment in 2009 and 2010 of 2% (up from 1.5%) of their total Medicare allowed charges. The new law also requires the U.S. Secretary of Health and Human Services (HHS) to develop a plan to transition to a value-based purchasing program for physician services.
SHM took multiple steps to influence MIPPA’s successful passage. Here are a few of those steps:
- When Sen. Max Baucus (D-Montana), chair of the Senate Finance Committee, announced he was working on legislation to reverse the pending cuts in Medicare payments, the PPC immediately commended his efforts and offered our assistance with the bill, specifically focusing on quality improvement provisions.
- Sen. Baucus introduced S. 3101, which formed the basis of the final Medicare bill, H.R. 6331, in June. On June 9, the PPC sent a letter to Sen. Baucus, formally supporting his efforts to address the pending payment reductions and praising other provisions in the bill promoting quality reporting, including continuation of the PQRI program; a requirement that measures be endorsed by a consensus-based, standard-setting entity such as the National Quality Forum, which CMS posts on its Web site the list of providers who participate in the PQRI; and that HHS provide confidential feedback to providers regarding their resource use.
- In a July 10 letter, we urged President Bush to immediately sign H.R. 6331 into law, stating, “This legislation, passed by bipartisan margins in both the House and Senate, contains many positive elements for hospitalists and their patients, and deserves your support.”
- As part of our advocacy efforts, the PPC launched a comprehensive, grassroots campaign to pass MIPPA, sending an unprecedented number of communications to inform and mobilize SHM members. In the month leading up to final passage of H.R. 6331, we sent 12 legislative e-mail updates to SHM members, urging each member to contact his or her lawmakers via our legislation action center. As a result of this outreach, hospitalists generated a total of 1,269 messages to members of Congress, urging policy makers to stop the Medicare cuts to physician payments. We thank all of you who visited the action center and contacted your lawmakers. Your efforts were vital to the success of SHM’s campaign to stop the cuts and passage of H.R. 6331.
Payment Advisory Commission Interaction
The PPC has made SHM’s engagement with the influential Medicare Payment Advisory Commission a top priority. An independent Congressional agency established by the Balanced Budget Act of 1997, MedPAC advises Congress on issues affecting the Medicare program. Our efforts to educate the commission and staff about hospital medicine are paying off. Through attendance at MedPAC meetings, as well as conference calls and face-to-face meetings with staff, SHM has educated the commission about the positive contributions hospitalists are making throughout the country.
PPC members attended MedPAC’s March 5, 2008, meeting and addressed the commission during the public comment period. The PPC offered to further educate the commission regarding the role hospital medicine can play in Medicare reform. In June, key SHM leaders met with MedPAC staff, including executive director Mark Miller, in Washington to discuss hospital medicine and SHM’s quality improvement initiatives, including Project BOOST. At MedPAC’s request, the PPC has worked to develop a “starter set” of metrics to define high-performing hospitalist programs. It might form a basis for future value-based purchasing initiatives.
Also in June, MedPAC released its report to Congress on “Reforming the Delivery System,” which contained extensive information and feedback from SHM.
The PPC continues to monitor MedPAC’s work, particularly its recommendations for changes in Medicare payment for care provided around a hospitalization to encourage care coordination and efficiency. To reduce hospital readmissions, the commission’s June report to Congress recommended, among other things, that CMS conduct a voluntary pilot program to test bundled payment for all services around a hospitalization for select conditions.
Value-Based Purchasing
Together with SHM’s Performance and Standards Committee, the PPC continues to monitor and comment on CMS’s value-based purchasing (VBP) initiatives, as well as educate SHM members on what the initiatives mean for hospitalists. On June 11, SHM hosted a teleconference on VBP. It featured Thomas Valuck, MD, JD, medical officer and senior adviser, Center for Medicare Management, CMS. In his presentation, Dr. Valuck acknowledged the unique role hospitalists play in VBP programs, and he commended SHM for its proactive stance and constructive engagement with CMS.
On Aug. 29, the PPC submitted comments on CMS’s proposed FY 2009 physician payment rule. This rule proposed additional improvements to the PQRI; discussed CMS’s interest in developing a “Physician Compare” Web site to report quality of care and value for services provided by physicians; solicited comments on CMS’s proposed preventable hospital-acquired conditions; and proposed a new, targeted exception to the physician self-referral statute for programs using economic incentives to foster high quality, cost-effective care. Visit http://www.hospital medicine.org/Content/Navigation Menu/AdvocacyPolicy/LegislativeRegulatoryUpdates/Legislative_Regulato.htm for a summary of the final rule.
Increased AHRQ Appropriations
Through its participation in the Friends of Agency for Healthcare Research and Quality (AHRQ) coalition, visits to Congressional offices by members and staff, and grassroots advocacy via our legislative action center, SHM continues to advocate for increased funding for this important agency. Last fall, President Bush signed a continuing resolution, P.L. 110-329, which funds government agencies, including AHRQ, at current levels through March 6. The resolution was necessary because none of the 12 individual FY 2009 appropriations bills, including the Labor Department-Health and Human Services-Education Department measure, which contains funding for AHRQ and the National Institutes of Health, had been enacted into law. Early this year lawmakers are expected to attempt to pass the remaining appropriations bills and forward them to President-elect Obama.
What’s Ahead?
This year promises to be busy on the healthcare policy front. SHM is poised to make major contributions to the debate, given its advocacy on key issues over the past year and the goodwill it has generated among policymakers. The PPC will devote considerable time to crafting hospital medicine-specific recommendations on health reform, including bundling and its implications for hospitalists; and providing input to CMS’s value-based purchasing initiatives, including the agency’s report to Congress, which is due May 2010. We also will continue to pursue a separate CMS specialty billing code for hospitalists.
The PPC strives to keep SHM members informed about legislative and regulatory activities through monthly updates posted to the advocacy section of the SHM Web site, articles in The Hospitalist, and items in the new SHM e-Wire. Letters to Congress and CMS are located on the Web site, as well.
When an important issue arises, you likely will receive an e-mail urging you to visit our legislative action center (www.hospitalmedicine.org/beheard) and contact your members of Congress. We depend on your involvement in the legislative process in order to be effective in Washington. TH
Laura Allendorf is senior advisor for advocacy and government affairs for the Society of Hospital Medicine. Contact her at [email protected].
SHM’s 20-member Public Policy Committee, headed by Eric Siegal, MD, had a busy 2008 addressing the many legislative and regulatory issues affecting hospitalists. As a result of our efforts, SHM’s visibility with key lawmakers, the Medicare Payment Advisory Commission (MedPAC), and the Centers for Medicare and Medicaid Services (CMS) has increased significantly, and policymakers now routinely turn to us for advice and expertise. Here is an update on how the committee represents hospital medicine—and your interests—in our nation’s capital.
Medicare Payment Cuts Prevented
Earlier this year, SHM’s Public Policy Committee (PPC) worked tirelessly to secure passage of H.R. 6331, the Medicare Improvements for Patients and Providers Act (MIPPA). It blocked the 10.6% physician payment cut, which was scheduled to go into effect July 1, 2008, and extended current payment rates through Dec. 31, 2009 Thanks in part to concerted advocacy by SHM and its members, Congress voted overwhelmingly July 15 to override President Bush’s veto of this measure. The new law (P.L. 110-275) includes 18 months of relief from scheduled cuts in Part B Medicare payments, other increases in reimbursement for inpatient evaluation and management services, and several SHM-supported quality improvement initiatives.
Beginning Jan. 1, hospitalists will see a 1.1% increase in Part B payments, instead of a projected 5.4% cut. SHM strongly supported provisions of the bill, which requires CMS to apply budget-neutral adjustments for 2007 and 2008 to the conversion factor. This change will result in an estimated average gain of another 3% in total Medicare payments for hospitalists.
SHM also supported continued funding of the Physician Quality Reporting Initiative (PQRI) and other quality provisions contained in MIPPA. Under the new Medicare act, hospitalists who successfully report quality measures are eligible for a bonus payment in 2009 and 2010 of 2% (up from 1.5%) of their total Medicare allowed charges. The new law also requires the U.S. Secretary of Health and Human Services (HHS) to develop a plan to transition to a value-based purchasing program for physician services.
SHM took multiple steps to influence MIPPA’s successful passage. Here are a few of those steps:
- When Sen. Max Baucus (D-Montana), chair of the Senate Finance Committee, announced he was working on legislation to reverse the pending cuts in Medicare payments, the PPC immediately commended his efforts and offered our assistance with the bill, specifically focusing on quality improvement provisions.
- Sen. Baucus introduced S. 3101, which formed the basis of the final Medicare bill, H.R. 6331, in June. On June 9, the PPC sent a letter to Sen. Baucus, formally supporting his efforts to address the pending payment reductions and praising other provisions in the bill promoting quality reporting, including continuation of the PQRI program; a requirement that measures be endorsed by a consensus-based, standard-setting entity such as the National Quality Forum, which CMS posts on its Web site the list of providers who participate in the PQRI; and that HHS provide confidential feedback to providers regarding their resource use.
- In a July 10 letter, we urged President Bush to immediately sign H.R. 6331 into law, stating, “This legislation, passed by bipartisan margins in both the House and Senate, contains many positive elements for hospitalists and their patients, and deserves your support.”
- As part of our advocacy efforts, the PPC launched a comprehensive, grassroots campaign to pass MIPPA, sending an unprecedented number of communications to inform and mobilize SHM members. In the month leading up to final passage of H.R. 6331, we sent 12 legislative e-mail updates to SHM members, urging each member to contact his or her lawmakers via our legislation action center. As a result of this outreach, hospitalists generated a total of 1,269 messages to members of Congress, urging policy makers to stop the Medicare cuts to physician payments. We thank all of you who visited the action center and contacted your lawmakers. Your efforts were vital to the success of SHM’s campaign to stop the cuts and passage of H.R. 6331.
Payment Advisory Commission Interaction
The PPC has made SHM’s engagement with the influential Medicare Payment Advisory Commission a top priority. An independent Congressional agency established by the Balanced Budget Act of 1997, MedPAC advises Congress on issues affecting the Medicare program. Our efforts to educate the commission and staff about hospital medicine are paying off. Through attendance at MedPAC meetings, as well as conference calls and face-to-face meetings with staff, SHM has educated the commission about the positive contributions hospitalists are making throughout the country.
PPC members attended MedPAC’s March 5, 2008, meeting and addressed the commission during the public comment period. The PPC offered to further educate the commission regarding the role hospital medicine can play in Medicare reform. In June, key SHM leaders met with MedPAC staff, including executive director Mark Miller, in Washington to discuss hospital medicine and SHM’s quality improvement initiatives, including Project BOOST. At MedPAC’s request, the PPC has worked to develop a “starter set” of metrics to define high-performing hospitalist programs. It might form a basis for future value-based purchasing initiatives.
Also in June, MedPAC released its report to Congress on “Reforming the Delivery System,” which contained extensive information and feedback from SHM.
The PPC continues to monitor MedPAC’s work, particularly its recommendations for changes in Medicare payment for care provided around a hospitalization to encourage care coordination and efficiency. To reduce hospital readmissions, the commission’s June report to Congress recommended, among other things, that CMS conduct a voluntary pilot program to test bundled payment for all services around a hospitalization for select conditions.
Value-Based Purchasing
Together with SHM’s Performance and Standards Committee, the PPC continues to monitor and comment on CMS’s value-based purchasing (VBP) initiatives, as well as educate SHM members on what the initiatives mean for hospitalists. On June 11, SHM hosted a teleconference on VBP. It featured Thomas Valuck, MD, JD, medical officer and senior adviser, Center for Medicare Management, CMS. In his presentation, Dr. Valuck acknowledged the unique role hospitalists play in VBP programs, and he commended SHM for its proactive stance and constructive engagement with CMS.
On Aug. 29, the PPC submitted comments on CMS’s proposed FY 2009 physician payment rule. This rule proposed additional improvements to the PQRI; discussed CMS’s interest in developing a “Physician Compare” Web site to report quality of care and value for services provided by physicians; solicited comments on CMS’s proposed preventable hospital-acquired conditions; and proposed a new, targeted exception to the physician self-referral statute for programs using economic incentives to foster high quality, cost-effective care. Visit http://www.hospital medicine.org/Content/Navigation Menu/AdvocacyPolicy/LegislativeRegulatoryUpdates/Legislative_Regulato.htm for a summary of the final rule.
Increased AHRQ Appropriations
Through its participation in the Friends of Agency for Healthcare Research and Quality (AHRQ) coalition, visits to Congressional offices by members and staff, and grassroots advocacy via our legislative action center, SHM continues to advocate for increased funding for this important agency. Last fall, President Bush signed a continuing resolution, P.L. 110-329, which funds government agencies, including AHRQ, at current levels through March 6. The resolution was necessary because none of the 12 individual FY 2009 appropriations bills, including the Labor Department-Health and Human Services-Education Department measure, which contains funding for AHRQ and the National Institutes of Health, had been enacted into law. Early this year lawmakers are expected to attempt to pass the remaining appropriations bills and forward them to President-elect Obama.
What’s Ahead?
This year promises to be busy on the healthcare policy front. SHM is poised to make major contributions to the debate, given its advocacy on key issues over the past year and the goodwill it has generated among policymakers. The PPC will devote considerable time to crafting hospital medicine-specific recommendations on health reform, including bundling and its implications for hospitalists; and providing input to CMS’s value-based purchasing initiatives, including the agency’s report to Congress, which is due May 2010. We also will continue to pursue a separate CMS specialty billing code for hospitalists.
The PPC strives to keep SHM members informed about legislative and regulatory activities through monthly updates posted to the advocacy section of the SHM Web site, articles in The Hospitalist, and items in the new SHM e-Wire. Letters to Congress and CMS are located on the Web site, as well.
When an important issue arises, you likely will receive an e-mail urging you to visit our legislative action center (www.hospitalmedicine.org/beheard) and contact your members of Congress. We depend on your involvement in the legislative process in order to be effective in Washington. TH
Laura Allendorf is senior advisor for advocacy and government affairs for the Society of Hospital Medicine. Contact her at [email protected].
Non-Physician Providers Critical to Hospital Medicine Practices
Non-Physician Providers Critical to Hospital Medicine Practices
In “Maximizing NPPs in Hospitalist Practices” (Practice Management, October 2008, p. 69), John Nelson, MD, implies a financial advantage to hiring nurse practitioners (NPs) rather than physician assistants (PAs):
“A PA’s work will nearly always require a physician being physically present during some portion of the patient visit and co-signing chart notes and orders. Nurse practitioners, on the other hand, may be able to perform certain patient-care activities independently. Medicare and other payers typically reimburse at 85% of the rate customarily paid to MDs for the same service.”
Dr. Nelson: Do you mean to imply NPs providing hospitalist coverage should function independently, without any physician supervision, oversight, or input? I do not know of any hospitals that allow NPs to admit and manage patients independently, despite their independent practice status. In my opinion, it would be detrimental to patient care to allow non-physician providers to provide completely independent, unsupervised hospital care.
In addition, I know of no hospital practice setting that requires a physician to be physically present during a PA’s exam. In all hospital practice settings that I am aware of, a supervising or attending physician (not necessarily the one on the PA’s license), must see the patient at some time each day, not necessarily at the same time as the PA.
In that scenario, the physician pays a brief visit to the patient to corroborate the PA’s exam and plan. The physician then writes a brief, seen-and-agreed note, and can bill 100% of the Medicare reimbursement, not the 85% for a NP visit. How this compares economically depends, of course, on relative salaries. But it provides physician oversight of the NPP, which assumedly will improve quality of care (though I have no studies to cite to that effect).
Do you have some other reason for your anti-PA, pro-NP bias? Is your personal experience colored by working with more competent NPs, in your opinion, and less competent PAs? Perhaps that would make for a more interesting, better-defined column.
Richard Buckberg, PA-C, Maine Medical Center, Portland, Maine
SHM’s Non-Physician Provider (NPP) Committee was delighted to see the recent article by Dr. Nelson, MD, regarding the use of NPPs in hospital medicine. These columns spotlighted HM’s increasing utilization of NPPs, a role that only is expected to increase in number and breadth, based on the increasing need for competent, comprehensive care of the acutely ill.
Dr. Nelson made many excellent points that may benefit from some clarification or expansion. Dr. Nelson states a PA “will nearly always require a physician being physically present during some portion of the patient visit and co-signing chart notes and orders.” This is incorrect, and seems to imply PAs are more difficult to assimilate into practice than NPs. Depending upon variability in legal limitations and hospital bylaws, both PAs and NPs may see a patient without a physician present. In order to bill for a shared visit and receive 100% reimbursement, the attending physician needs to have a face-to-face encounter with that patient at some point in the day and document a portion of the evaluation and management (e.g., history, physical exam, or medical decision-making).
Alternatively, in most states, both NPs and PAs can see patients independently and bill for their services at 85% of the physician’s Medicare rate. Obtaining 100% reimbursement for NPP services when using the shared billing model is efficient and simple. Though variability exists, more specifically in hospital culture, utilization of these roles can positively impact the bottom line of reimbursement. Therefore, it is essential to understand all of the regulations before developing a business model incorporating NPPs.
Dr. Nelson also points out that using NPPs in a clerical fashion, such as discharge planning, is not optimizing the NPPs capabilities. This point is well taken. If clerical assistance is needed, hire the appropriate discipline.
He also says in order to integrate and maximize the benefit of the NPP to a particular practice, a careful analysis of the needs of the practice should be performed prior to hiring. This will allow both physicians and the NPP to have clear expectations. An emphasis should be placed on the importance of recognizing the level of experience will likely impact the role. For example, utilizing a new graduate in a short-stay observation unit with limited diagnoses and treatments may make sense, but utilizing an NPP as a nocturnist, cross-covering and independently admitting patients, would require an NPP with years of experience. It is crucial to hire the right NPP with the right qualifications and experience for the job.
Dr. Nelson states patient satisfaction may decline by adding NPPs to the practice. Rather than focusing on possible dilution of a patient experience with the addition of another healthcare provider, one should instead consider the potential of adding another perspective to the team. Two providers with unique educational backgrounds and insight may indeed be better than one. Utilization of NPPs can increase face time with patients, subsequently increasing patient satisfaction. Additionally, research in outpatient settings shows no difference in patient satisfaction between physicians and NPPs; more research in inpatient settings needs to be performed.
We encourage HMG directors to refer to our expanded section on SHM’s Web site, “Practice Resources,” which has a wealth of information regarding NPP utilization. The NPP committee will be hosting two courses at the annual meeting, “The Basics: Can NPs/PAs Meet Our Needs,” and “Advanced Concepts: Three Different Practice Models.”
Jina Saltzman, PA-C, University of Chicago Medical Center
Dear readers: My main goal in writing the column was to indicate that NPs and PAs could be valuable contributors to many hospitalist practices. Yet, many practices fail to create the optimal role for them, one that contributes to patient outcomes, efficiency and economic health, and provides a rewarding role for the NPP.
I do not have an anti-PA, pro-NP bias. My intention was not to take sides regarding whether PAs or NPs are more skilled or better for patients. I think that is a function of the individual, much more than their training certificate (same with MDs). I did not intend to imply “nurse practitioners providing hospitalist coverage should function independently, without any physician supervision, oversight, or input.”
Lastly, I did make a factual error regarding the differences in physician supervision required for NPs and PAs. Saltzman’s letter above addresses the error. TH
Perilous Intersection
When Amsterdam Airport Schiphol in the Netherlands revamped its men’s restrooms, the architects installed small, Euro-style urinals: a surefire way to throw urine off target. To solve this problem, the black outline of a fly was etched in the porcelain near each urinal’s drain. Users’ aim improved and spillage was reduced by 80%. “They try to power blast it away,” says Sanjay Saint, MD, hospitalist and professor of internal medicine at the Ann Arbor VA Medical Center, University of Michigan. “By the time they might realize that the fly isn’t going anywhere, the men are done and walking away.”
It’s a guy thing, sure. It also is an example of a human factors intervention. “Science teaches us that implementing a design for a machine or device that elicits an instinctive reaction from someone using it is a clear-cut way to avoid error,” Dr. Saint explains.
What It Is and Why It’s Important
Human factors (HF), or human factors engineering (HFE), also sometimes called usability engineering or systems-based practice, refers to the study of human abilities and characteristics as they affect the design and smooth operation of equipment, systems, and jobs.1 HF is the basic science underlying much of patient safety practice. For instance, the current recommendation that hospitals standardize equipment, such as ventilators, programmable IV pumps, and defibrillators, is an example of making tasks human friendly. The use of cognitive psychology and biomechanics to develop and improve software and hand tools are another example of HF principles.
In general, HF examines the component tasks of an activity in terms of three factorial domains: physical and environmental factors, cognitive factors (skill demands and mental workload), and organizational factors. Each task is assessed in terms of necessary interactions of the individual and work environment, the device/system design, and associated team dynamics.
HF use in healthcare is not new; for roughly four decades HF researchers have emphasized the key role of HF in safe medical design, healthcare facility operations, and patient safety processes. HF helps organizations deepen analyses of adverse events and develop effective solutions.2 HF is used in the design of labeling, warnings or alarms, software programs, information displays, paper forms, process and activity flow, workplace design, cognitive aids, decision support systems, and policies and protocols.
For hospitalists, human factors knowledge is most useful in process improvement, says John Gosbee, MD, MS, a human factors engineering and healthcare specialist at the University of Michigan. Dr. Gosbee, who has worked with hospitalists in Ann Arbor and around the country, originally studied aerospace medicine, pursued a subspecialty in occupational medicine, and from 1988 to 1992 worked at NASA designing space hospitals. In the dozens of lectures and workshops he has conducted, he has learned numerous physicians resist learning about HF. At first they protest, claiming they “didn’t go to medical school to become engineers” or “weren’t hired to have you tell us we need to be some kind of designer or computer-science software evaluator.”
Dr. Gosbee couldn’t agree more, but after the a-ha! moment, usually in an interactive experience when the hospitalist sees a poor system design is an obstacle to safety and process flow, they open up to adopting the HF mindset. Once on board with HF, hospitalists are quick to translate the theories to their own practices, identifying potential vulnerabilities and risks.
Manufacturers of healthcare equipment and systems don’t want to hear from “safety geeks,” Dr. Gosbee says; the companies want to hear from front-line providers who regularly use the products. “Hospitalists are in great position to provide that input because they see what happens across a broad swath of hospital settings,” he says, “and they could amalgamate the fact that everyone across specialties is having some trouble with this computer screen or new infusion device.”
Dr. Gosbee’s first-hand knowledge and experience solving hospitalist issues with HF techniques evolved into a teaching career. He says the university administration supports his belief in the practicality of HF lessons, and he now works as the lead instructor for a majority of the university’s medical residents.
“Human factors engineering is an efficient way to flip people’s brains around 180 degrees toward systems thinking,” Dr. Gosbee explains, “which is required if the organization wants to become a high-reliability organization.”3
Examples in Medicine
Russ Cucina, MD, MS, hospitalist at the University of California San Francisco Medical Center, describes a practical example of human factors engineering in a simple, widely used design. When cars ran on leaded gasoline, the design of the leaded gas pump nozzle precluded it from being inserted into an unleaded gas tank. “Even though one was clearly labeled leaded and other unleaded, human beings are bad at catching those things, especially when they’re in a hurry and under stress,” says Dr. Cucina, whose research includes clinical human-computer interaction science with an emphasis on human factors and patient safety.
A similar concept is what is missing from the Swan Ganz catheter design. The three ports (proximal, middle, and distal) connecting the catheter to the ICU monitor all have the same shape, making it easy to errantly connect one or more to the wrong port. “You’d think the manufacturers would shape the connectors in a way that would preclude incorrect connections,” Dr. Cucina says, “but that has not been done. We leave it to the vigilance of the bedside nurse or intensivist or hospitalist to hook these up correctly, rather than redesigning them so that cannot be done incorrectly.”
One way to think about human factors engineering is to think about forcing “a round peg into a square hole.” In the hospital setting, round pegs into square holes equate to errors. HF tries to solve the issue (round peg into a round hole, and vice versa). “Were you to apply human factors to the Swan Ganz catheter port connectors,” Dr. Cucina says, “you’d have round into the round hole, square into the square, and triangular into the triangular. You’d have no choice but to do the right thing.”
Efforts to implement systems that anticipate and minimize the chances of human error, such as computer physician order entry and patient bar coding, are attempts to overcome by design those instances where it is possible to place round pegs into square holes.
HF Projects in Motion
A number of hospitalists around the country have or are using HF as part of projects and studies to reduce human errors.
Culture change: In the early 2000s, Janet Nagamine, MD, a hospitalist with Kaiser Permanente in Santa Clara, Calif., and her colleagues took human factors concepts to front-line ICU staff. The human factors training provided a framework to reinforce three basic concepts: all humans make errors; processes can be designed to reduce the possibility of error; and processes can be designed so errors are detected and corrected before causing injury.4 “My colleagues and I knew that the punitive, ‘shame-and-blame’ culture around mistakes and errors were preventing us from identifying problems and moving forward with solutions,” Dr. Nagamine says.
A former ICU nurse and current chair of SHM’s Hospital Quality and Patient Safety (HQPS) Committee, Dr. Nagamine first became involved in HF when she realized how many patients suffered adverse events stemming from poorly designed medical systems. “Some of my most respected mentors were involved in these kinds of cases, and I knew eventually that would be me,” she says. It was a disturbing reality. During her medical training it was drilled into her head smart, diligent doctors would be successful. “But bad things happen in medicine; it’s part of what we do,” she says. “Rather than deny that things will inevitably go wrong, I wanted to study safety science and reliable system design.” She asked herself, how can we prevent the same mistakes from happening to competent people who practice in poorly designed systems? “The patterns are there,” she says. “You can train your eyes to look for vulnerabilities and patterns, then find the solutions.”
After she started looking at adverse events as system failures, rather than solely personal failures, she engaged the staff to redesign systems. She introduced HF concepts and provided an infrastructure to make it safe to report and discuss problems. The project included a new medication error reporting system and the creation of departmental patient safety teams. A palpable culture change developed when front-line staff and managers became empowered to find solutions working side-by-side with the quality and risk management departments.
The result? A dramatic increase in medication errors and near-miss reports: from eight faulty problems per quarter in 2000 to 200 reports per quarter by 2001.
To sum up the essence of Dr. Nagamine’s project, she invokes her favorite quotation from systems expert James Reason: “We can’t change the human condition, but we can change the conditions under which humans work.”1,5
Bar coding workarounds: Hospitalist Tosha Wetterneck, MD, and her colleagues at the University of Wisconsin School of Medicine and Dentistry focused their HF-trained eyes on medication errors.5 The team applied HF concepts as part of a study of bar-coded medication administration systems (BCMAs). Ideally, BCMAs help confirm the five rights of medication administration: the right patient, drug, dose, route, and time. The study authors identified the hospitalist staff had developed 46 workarounds in place of proper use of the BCMA. With each workaround, the researchers identified six potential errors. Furthermore, nurses were overriding the BCMA alerts for 4.2% of patients charted, and for 10.3% of total medication.
By creating an exhaustive template, the study authors broke down the use of BCMA workarounds to the finest detail of task component. They learned many workarounds were engendered by difficulties with the technology and by interactions between BCMA technologies and environmental, technical, process, workload, training, and policy concerns. Data shows BCMAs still have an important role in preventing error; during one year, almost 24,000 BCMA alerts led users to change their action, instead of overriding an alert. “These causes (and related workarounds) are neither rare nor secret,” the authors write. “They are hiding in plain sight.”1,5
Dr. Wetterneck is part of the Systems Engineering Initiative for Patient Safety (SEIPS), an interdisciplinary research group located within the Center for Quality and Productivity Improvement in the College of Engineering at the University of Wisconsin-Madison.6,7 SEIPS uses HF principles to study the safety and quality of healthcare systems.
Congestive heart failure order sets: Researchers in another study incorporated HF science in their review of clinical practice guideline use and application for congestive heart failure (CHF). Reingold and Kulstad studied the impact of HF design elements on order set utilization and recommendations compliance.8
Using retrospective medical record review of adult patients admitted from the emergency department with CHF, the study measured acuity and clinical practice guideline (CPG) parameters before and after introducing new orders. In 87 adult patients before and 84 patients after beginning the new order set, attention to HF design elements significantly improved utilization of the orders and CPG compliance.
Infusion device programming: In another instance, a multidisciplinary research team applied HF design principles to common nursing procedures: programming an insulin infusion and programming a heparin infusion.9,10 An HF usability checklist was developed, and it revealed systematic error-provoking conditions in both tasks.
The good news is the pitfalls were remedied easily.
Not only did researchers subsequently commit to modify training procedures and redesign preprinted orders, they took the bigger step of providing feedback to the manufacturer and committing to incorporate usability testing in future procurement of medical devices. TH
Andrea M. Sattinger is a medical writer based in North Carolina and a frequent contributor to The Hospitalist.
References
1. Gosbee JW. Conclusion: you need human factors engineering expertise to see design hazards that are hiding in “plain sight!” Jt Comm J Qual Saf. 2004;30(12):696-700.
2. Gosbee J. Introduction to the human factors engineering series. Jt Comm J Qual Saf. 2004;30(4): 215-219.
3. Reason J. Human error: models and management. BMJ. 2000; 320(7237):768-770.
4. Etchells E, Juurlink D, Levinson W. Medication errors: the human factor. CMAJ. 2008;178(1):63-64.
5. Koppel R, Wetterneck T, Telles JL, Karsh BT. Workarounds to barcode medication administration systems: their occurrences, causes, and threats to patient safety. J Am Med Inform Assoc. 2008;15(4):408-423.
6. SEIPS model. http://cqpi.engr.wisc.edu/seips_ home/. Accessed Dec. 20, 2008.
7. Carayon P, Schoofs Hundt A, Karsh BT, et al. Work system design for patient safety: the SEIPS model. Qual Saf Health Care. 2006;15 Suppl 1:850-858.
8. Reingold S, Kulstad E. Impact of human factor design on the use of order sets in the treatment of congestive heart failure. Acad Emerg Med. 2007;14(11):1097-1105.
9. Etchells E, Bailey C, Biason R, et al. Human factors in action: getting “pumped” at a nursing usability laboratory. Healthc Q. 2006;9 Spec No:69-74.
10. Carayon P, Wetterneck T, Schoofs Hundt A, et al. Observing nurse interaction with infusion pump technologies. In: Henriksen K, Battles J, Lewin D, eds. Advances in Patient Safety: From Research to Implementation. Rockville, Md.: Agency for Healthcare Research and Quality; Feb. 2005, AHRQ Publication No. 05-0021-2.