User login
Be vigilant for vulvar intraepithelial neoplasia— here is why
How should you evaluate a patient who has a cytologic diagnosis of atypical glandular cells (AGC)?
Charles J. Dunton, MD (Examining the Evidence; August 2011)
What is optimal surveillance after treatment for high-grade cervical intraepithelial neoplasia (CIN)?
Alan G. Waxman, MD, MPH (Examining the Evidence; June 2011)
2 HPV vaccines, 7 questions that you need answered
Neal M. Lonky, MD, MPH, and an expert panel (August 2010)
Dr. Massad reports no financial relationships relevant to this article.
The societal shifts of the 1960s generated many changes—among them, permanently altered sexual mores. That may be a primary reason why the incidence of vulvar intraepithelial neoplasia (VIN) increased more than 400% between 1973 and 2000, says L. Stewart Massad, Jr, MD, chairman of the Practice Committee of the American Society for Colposcopy and Cervical Pathology (ASCCP) and member of the ACOG Committee on Gynecologic Practice—and one of the authors of a new joint Committee Opinion on the management of VIN.1 This precancer is often associated with carcinogenic types of human papillomavirus (HPV), the most common sexually transmitted disease in the nation.
The 400% statistic caught the attention of OBG Management. The editors invited Dr. Massad to discuss the subject of VIN at length, elaborating on key issues such as its prevention, identification, treatment, and surveillance.
How to identify a VIN lesion
OBG Management: What is VIN? What does it look like?
Dr. Massad: VIN is a premalignant condition of the vulva that may present as unifocal or multifocal lesions. These lesions may be flesh-colored, hypopigmented, or hyperpigmented (FIGURE). They also may be erythematous, flat, or raised. They can be found on any part of the vulva. The dysplastic cells may extend into hair shafts or sweat glands; they don’t penetrate the basement membrane, however, so, by definition, they aren’t invasive.
Usual-type VIN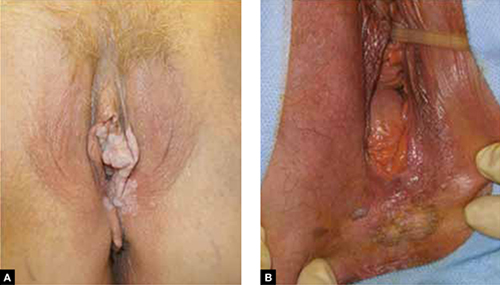
A. This warty lesion is hyperpigmented around the periphery, hypopigmented in the center. B. Another warty lesion. Both images reflect the application of acetic acid.OBG Management: Why has the incidence increased so considerably?
Dr. Massad: The data we have on incidence comes from the Surveillance, Epidemiology and End Results (SEER) program of the National Cancer Institute, as reported by Judson and colleagues.2 Although better reporting of findings of VIN may play a role, the rising incidence seems to be attributable to changes in sexual behavior over the past half century. The incidence of vulvar cancer rose during the same period—about 20%.3 The much slower growth in the incidence of vulvar cancer suggests that treatment of VIN has blunted the risk of cancer.
OBG Management: Is VIN associated with any particular type of HPV?
Dr. Massad: Yes, more than 80% of VIN lesions are associated with HPV 16.
OBG Management: One study from 2005 noted that the mean age of women with VIN decreased from 50 years before 1980 to 39 years in subsequent years.4 Why are more younger women developing VIN?
Dr. Massad: The study that showed that age shift was from New Zealand. The authors speculated that the change was due to earlier sexual activity among women who smoke: HPV, especially HPV 16, and smoking are important risk factors for VIN. The question hasn’t been definitively answered.
OBG Management: What are the risk factors for VIN?
Dr. Massad: Smoking is a big one. More than 50% of women who have VIN are smokers. Thirty percent have concurrent or prior cervical intraepithelial neoplasia (CIN) or vaginal intraepithelial neoplasia (VAIN). The risk of invasion rises with age at the time of the initial diagnosis and with longer follow-up. I can talk about surveillance a little later.
Are some lesions more worrisome than others?
OBG Management: Are VIN lesions categorized similarly to CIN lesions—that is, using three different grades of severity?
Dr. Massad: Until recently, that was the case, but it is no longer so. Broadly, there are now two classes of VIN, according to the International Society for the Study of Vulvovaginal Disease (ISSVD): usual-type VIN and differentiated VIN.
ACOG and ASCCP have embraced this classification system, although not all pathologists have done so, and clinicians may still see reports using the old three-tier system.
Usual-type VIN is associated with infection with high-risk types of HPV—most notably, HPV 16, as I mentioned. Histologically, usual-type VIN can mimic common genital warts, and the warty subtype shows keratosis at the surface, a spiky or undulating surface, and vertical maturation of cells in the lesion but with pleomorphic cells filling half or more of the epithelial thickness. The basaloid subtype of usual VIN shows little maturation.
Differentiated VIN exhibits more subtle atypia, with keratin pearls and an eosinophilic cytoplasm.
Biologically, usual-type VIN is associated with HPV and linked to smoking and sexual activity, as we discussed. As its name suggests, it is found more frequently than differentiated VIN. It is most common in women in their late 30s to early 50s.
In contrast, differentiated VIN is not associated with HPV and is more common in postmenopausal women; it is frequently seen with lichen sclerosus.
OBG Management: When did this new way of classifying VIN—as usual-type and differentiated—originate?
Dr. Massad: The ISVVD classification system changed in 2004. Before then, it paralleled the CIN classification system, with three grades of intraepithelial neoplasia corresponding to the thickness of the epithelium filled by dysplastic cells: VIN 1, 2, and 3. However, VIN 1 was not really neoplastic. It reflected infection with HPV, and although it might progress to higher-grade dysplasia or cancer, the risk was minimal. So the ISVVD revised the classification system to include only high-grade VIN—the old VIN 2 and VIN 3. HPV-associated lesions with dysplastic cells confined to the lower third of the epithelium are managed like genital warts, with observation for spontaneous regression or treatment with topical therapy or surgery.
How to screen for VIN
OBG Management: What screening strategy is recommended for VIN?
Dr. Massad: There is no such recommendation. Screening for VIN hasn’t been implemented for several reasons. Most important, other than inspection of the vulva by a clinician, there is no good screening test. VIN isn’t very common, so mass inspection for lesions is unlikely to be cost-effective. The sensitivity and specificity of inspection by a clinician aren’t known. Most lesions are found by women, their partners, or clinicians before cancer develops. And most disease is treated before cancer arises.
OBG Management: Isn’t there a need for heightened scrutiny of the vulva?
Dr. Massad: Yes. Women should examine their genitalia several times a year and seek attention if anything changes. That’s especially true for women who have risk factors, such as smoking, immunosuppression, and a history of being treated for cervical dysplasia. It’s the same concept we employ when teaching women to identify early breast lesions through self-examination.
The biggest challenges in detecting VIN are educating women to report vulvar skin changes to their clinicians for assessment and educating clinicians to examine the vulva before inserting the speculum for cervical screening and vaginal inspection.
OBG Management: Is another challenge distinguishing some forms of VIN from genital warts?
Dr. Massad: It can be a challenge, but clinicians should recall that warts are most common among women around the time of the onset of sexual activity. Older women sometimes develop warts with a new sexual partner. However, when women in their 40s and older develop new warty lesions, always suspect VIN. A woman in her 60s or older who has a new, warty-appearing vulvar lesion should be assumed to have VIN or cancer.
OBG Management: Does VIN ever regress spontaneously?
Dr. Massad: Yes. There have been reports of spontaneous regression of VIN, especially in young women. Regrettably, there are also reports of progression to cancer during observation. There are no characteristics that allow us to distinguish lesions that are going to progress from those that will regress. The ACOG-ASCCP Committee Opinion recommends treatment of all VIN.1
Can VIN be prevented?
OBG Management: The Committee Opinion recommends that the quadrivalent HPV vaccine be offered to women “in target populations” because it can decrease the risk of VIN. What are those target populations?
Dr. Massad: The target population for HPV vaccination is 11- and 12-year-old girls, but catch-up vaccination is acceptable in patients as old as 26 years.
OBG Management: Why isn’t the bivalent vaccine recommended?
Dr. Massad: Only the quadrivalent vaccine has been approved by the US Food and Drug Administration (FDA) for prevention of VIN, although, in theory, the bivalent vaccine ought to be effective as well.
When to biopsy
OBG Management: Do you recommend that any suspect lesion on the vulva be biopsied?
Dr. Massad: The decision to biopsy should be individualized. However, women who have apparent warts that fail to respond to topical therapy should undergo biopsy, as should older women with warty lesions. Keep in mind that older women may develop verrucous carcinomas and may benefit from excision of enlarging warty lesions even if a biopsy is reported as only condylomata. Clinicians should not biopsy varicosities or obvious flat nevi.
OBG Management: Is colposcopy ever helpful in assessing vulvar lesions?
Dr. Massad: Most vulvar lesions can be identified without colposcopy, but colposcopy is useful in determining the extent of lesions. It often reveals subclinical disease not evident at the time of vulvar inspection.
OBG Management: When colposcopy is used, is the procedure the same as for cervical examination?
Dr. Massad: Not exactly. The clinician should apply 5% acetic acid for 5 minutes using a gauze sponge, but the magnification should be 63 to 103—not 153, as it is for cervical examination. It’s important to distinguish hyperplasia from VIN. In general, hyperplastic lesions are faint, gray, diffuse, and flat, whereas VIN lesions are raised and irregular in shape, with sharp borders.
OBG Management: What about toluidine blue? Is it useful in inspection of lesions?
Dr. Massad: Toluidine blue stains skin that is irritated. It isn’t very specific for VIN or vulvar cancer, and it can make colposcopy difficult, so experts no longer recommend it.
OBG Management: What are the treatment options for VIN?
Dr. Massad: They include surgical excision, laser ablation, and topical therapy with 5% imiquimod. All are potentially effective. The Committee Opinion doesn’t specify a preference, except to say that excision is advised when there is any suspicion of cancer to preserve a sample for pathologic analysis. Ablation destroys the lesion, making assessment of possible invasion impossible, and imiquimod may allow disease to progress during observation.
OBG Management: The Committee Opinion recommends wide local excision when cancer is suspected. What size of margin is optimal?
Dr. Massad: In general, a margin of 5 to 10 mm around the lesion is recommended. Vulvectomy isn’t needed because close follow-up usually identifies recurrence before invasion occurs.
OBG Management: When is laser ablation a good choice?
Dr. Massad: Whenever a biopsy shows VIN and cancer is not suspected. Laser ablation is ideal when lesions are multifocal or extensive, although repeated treatments may be required to resolve small foci of residual disease. Done with careful attention to power density and depth of ablation, laser therapy can be less disfiguring than excision.
OBG Management: You mentioned 5% imiquimod. Is there evidence that it’s effective in the treatment of VIN?
Dr. Massad: Multiple randomized, controlled trials have shown 5% imiquimod to be effective against VIN, although the agent does not have approval from the FDA for that indication.5,6 Lower concentrations of imiquimod have not been studied in the treatment of VIN. Women treated with this topical therapy should be followed every 4 weeks with colposcopy because progression to cancer has been reported during imiquimod therapy. Lesions that fail to respond completely after a full course of imiquimod should be treated with excision or laser ablation.
Surveillance is critical
OBG Management: According to the Committee Opinion, the recurrence rate of VIN can reach 30% to 50%.7 Why so high?
Dr. Massad: Usual-type VIN reflects exposure to carcinogenic HPV, and differentiated VIN arises from a vulvar dystrophy. In both situations, treatments destroy VIN and arrest progress to cancer, but the entire vulvar skin remains subject to the inciting condition.
OBG Management: Would skinning vulvectomy eliminate the risk of recurrence?
Dr. Massad: Full vulvectomy is crippling and usually unnecessary. Most patients and clinicians accept the risk of recurrence of VIN to avoid the side effects of radical treatment.
OBG Management: What kind of surveillance is recommended after treatment?
Dr. Massad: Patients should perform vulvar self-examination every few months. They should also be examined 6 and 12 months after initial treatment and annually thereafter because the risk of recurrence may persist for years.
Because VIN is associated with carcinogenic HPV, women with VIN should undergo an annual Pap test.
OBG Management: Thank you, Dr. Massad. Let’s hope the incidence of this precancer begins to decline.
- Recommend the quadrivalent HPV vaccine for girls in the target age range (11 and 12 years old) to reduce the risk of VIN.
- Encourage smoking cessation.
- Make it a practice to inspect the vulva before inserting the speculum for cervical examination.
- Biopsy most pigmented lesions on the vulva. Biopsy all warty lesions in postmenopausal women and in women who fail topical treatment for genital warts.
- Treat all VIN lesions. When cancer is suspected, use wide local excision with a margin of 5 to 10 mm.
- Keep in mind that dysplastic cells can extend into hair follicles and sweat glands.
- Closely follow up all women treated for VIN (6 and 12 months after treatment and annually thereafter) and encourage them to examine their vulva several times every year. Perform an annual Pap test for any woman found to have VIN.
We want to hear from you! Tell us what you think.
1. Committee on Gynecologic Practice; American College of Obstetricians and Gynecologists. Committee Opinion #509: Management of vulvar intraepithelial neoplasia. Obstet Gynecol. 2011;118(5):1192-1194.
2. Judson PL, Habermann EB, Baxter NN, Durham SB, Virnig BA. Trends in the incidence of invasive and in situ vulvar carcinoma. Obstet Gynecol. 2006;107(5):1018-1022.
3. Markowitz LE, Dunne EF, Saraiya M, Lawson HW, Chesson H, Unger ER. Quadrivalent human papillomavirus vaccine: recommendations of the Advisory Committee on Immunization Practices (ACIP). MMWR Recomm Rep. 2007;56(RR-2):1-24.
4. Jones RW, Rowan DM, Stewart AW. Vulvar intraepithelial neoplasia: aspects of the natural history and outcome in 405 women. Obstet Gynecol. 2005;106(6):1319-1326.
5. Van Seters M, van Beurden M, ten Kate FJW, et al. Treatment of vulvar intraepithelial neoplasia with topical imiquimod. N Engl J Med. 2008;358(14):1465-1473.
6. Terlou A, van Seters M, Ewing PC, et al. Treatment of vaginal intraepithelial neoplasia with topical imiquimod: seven years median follow-up of a randomized clinical trial. Gynecol Oncol. 2011;121(1):157-162.
7. Hillemanns P, Wang X, Staehle S, Michels W, Dannecker C. Evaluation of different treatment modalities for vulvar intraepithelial neoplasia (VIN): CO2 laser vaporization, photodynamic therapy, excision and vulvectomy. Gynecol Oncol. 2006;100(2):271-275.

Stewart L. Massad, Jr, MD
Dr. Massad is Professor of Obstetrics and Gynecology in the Division of Gynecologic Oncology at Washington University in St. Louis School of Medicine in St. Louis, Mo.
Stewart L. Massad, Jr, MD
Dr. Massad is Professor of Obstetrics and Gynecology in the Division of Gynecologic Oncology at Washington University in St. Louis School of Medicine in St. Louis, Mo.
Stewart L. Massad, Jr, MD
Dr. Massad is Professor of Obstetrics and Gynecology in the Division of Gynecologic Oncology at Washington University in St. Louis School of Medicine in St. Louis, Mo.
How should you evaluate a patient who has a cytologic diagnosis of atypical glandular cells (AGC)?
Charles J. Dunton, MD (Examining the Evidence; August 2011)
What is optimal surveillance after treatment for high-grade cervical intraepithelial neoplasia (CIN)?
Alan G. Waxman, MD, MPH (Examining the Evidence; June 2011)
2 HPV vaccines, 7 questions that you need answered
Neal M. Lonky, MD, MPH, and an expert panel (August 2010)
Dr. Massad reports no financial relationships relevant to this article.
The societal shifts of the 1960s generated many changes—among them, permanently altered sexual mores. That may be a primary reason why the incidence of vulvar intraepithelial neoplasia (VIN) increased more than 400% between 1973 and 2000, says L. Stewart Massad, Jr, MD, chairman of the Practice Committee of the American Society for Colposcopy and Cervical Pathology (ASCCP) and member of the ACOG Committee on Gynecologic Practice—and one of the authors of a new joint Committee Opinion on the management of VIN.1 This precancer is often associated with carcinogenic types of human papillomavirus (HPV), the most common sexually transmitted disease in the nation.
The 400% statistic caught the attention of OBG Management. The editors invited Dr. Massad to discuss the subject of VIN at length, elaborating on key issues such as its prevention, identification, treatment, and surveillance.
How to identify a VIN lesion
OBG Management: What is VIN? What does it look like?
Dr. Massad: VIN is a premalignant condition of the vulva that may present as unifocal or multifocal lesions. These lesions may be flesh-colored, hypopigmented, or hyperpigmented (FIGURE). They also may be erythematous, flat, or raised. They can be found on any part of the vulva. The dysplastic cells may extend into hair shafts or sweat glands; they don’t penetrate the basement membrane, however, so, by definition, they aren’t invasive.
Usual-type VIN
A. This warty lesion is hyperpigmented around the periphery, hypopigmented in the center. B. Another warty lesion. Both images reflect the application of acetic acid.OBG Management: Why has the incidence increased so considerably?
Dr. Massad: The data we have on incidence comes from the Surveillance, Epidemiology and End Results (SEER) program of the National Cancer Institute, as reported by Judson and colleagues.2 Although better reporting of findings of VIN may play a role, the rising incidence seems to be attributable to changes in sexual behavior over the past half century. The incidence of vulvar cancer rose during the same period—about 20%.3 The much slower growth in the incidence of vulvar cancer suggests that treatment of VIN has blunted the risk of cancer.
OBG Management: Is VIN associated with any particular type of HPV?
Dr. Massad: Yes, more than 80% of VIN lesions are associated with HPV 16.
OBG Management: One study from 2005 noted that the mean age of women with VIN decreased from 50 years before 1980 to 39 years in subsequent years.4 Why are more younger women developing VIN?
Dr. Massad: The study that showed that age shift was from New Zealand. The authors speculated that the change was due to earlier sexual activity among women who smoke: HPV, especially HPV 16, and smoking are important risk factors for VIN. The question hasn’t been definitively answered.
OBG Management: What are the risk factors for VIN?
Dr. Massad: Smoking is a big one. More than 50% of women who have VIN are smokers. Thirty percent have concurrent or prior cervical intraepithelial neoplasia (CIN) or vaginal intraepithelial neoplasia (VAIN). The risk of invasion rises with age at the time of the initial diagnosis and with longer follow-up. I can talk about surveillance a little later.
Are some lesions more worrisome than others?
OBG Management: Are VIN lesions categorized similarly to CIN lesions—that is, using three different grades of severity?
Dr. Massad: Until recently, that was the case, but it is no longer so. Broadly, there are now two classes of VIN, according to the International Society for the Study of Vulvovaginal Disease (ISSVD): usual-type VIN and differentiated VIN.
ACOG and ASCCP have embraced this classification system, although not all pathologists have done so, and clinicians may still see reports using the old three-tier system.
Usual-type VIN is associated with infection with high-risk types of HPV—most notably, HPV 16, as I mentioned. Histologically, usual-type VIN can mimic common genital warts, and the warty subtype shows keratosis at the surface, a spiky or undulating surface, and vertical maturation of cells in the lesion but with pleomorphic cells filling half or more of the epithelial thickness. The basaloid subtype of usual VIN shows little maturation.
Differentiated VIN exhibits more subtle atypia, with keratin pearls and an eosinophilic cytoplasm.
Biologically, usual-type VIN is associated with HPV and linked to smoking and sexual activity, as we discussed. As its name suggests, it is found more frequently than differentiated VIN. It is most common in women in their late 30s to early 50s.
In contrast, differentiated VIN is not associated with HPV and is more common in postmenopausal women; it is frequently seen with lichen sclerosus.
OBG Management: When did this new way of classifying VIN—as usual-type and differentiated—originate?
Dr. Massad: The ISVVD classification system changed in 2004. Before then, it paralleled the CIN classification system, with three grades of intraepithelial neoplasia corresponding to the thickness of the epithelium filled by dysplastic cells: VIN 1, 2, and 3. However, VIN 1 was not really neoplastic. It reflected infection with HPV, and although it might progress to higher-grade dysplasia or cancer, the risk was minimal. So the ISVVD revised the classification system to include only high-grade VIN—the old VIN 2 and VIN 3. HPV-associated lesions with dysplastic cells confined to the lower third of the epithelium are managed like genital warts, with observation for spontaneous regression or treatment with topical therapy or surgery.
How to screen for VIN
OBG Management: What screening strategy is recommended for VIN?
Dr. Massad: There is no such recommendation. Screening for VIN hasn’t been implemented for several reasons. Most important, other than inspection of the vulva by a clinician, there is no good screening test. VIN isn’t very common, so mass inspection for lesions is unlikely to be cost-effective. The sensitivity and specificity of inspection by a clinician aren’t known. Most lesions are found by women, their partners, or clinicians before cancer develops. And most disease is treated before cancer arises.
OBG Management: Isn’t there a need for heightened scrutiny of the vulva?
Dr. Massad: Yes. Women should examine their genitalia several times a year and seek attention if anything changes. That’s especially true for women who have risk factors, such as smoking, immunosuppression, and a history of being treated for cervical dysplasia. It’s the same concept we employ when teaching women to identify early breast lesions through self-examination.
The biggest challenges in detecting VIN are educating women to report vulvar skin changes to their clinicians for assessment and educating clinicians to examine the vulva before inserting the speculum for cervical screening and vaginal inspection.
OBG Management: Is another challenge distinguishing some forms of VIN from genital warts?
Dr. Massad: It can be a challenge, but clinicians should recall that warts are most common among women around the time of the onset of sexual activity. Older women sometimes develop warts with a new sexual partner. However, when women in their 40s and older develop new warty lesions, always suspect VIN. A woman in her 60s or older who has a new, warty-appearing vulvar lesion should be assumed to have VIN or cancer.
OBG Management: Does VIN ever regress spontaneously?
Dr. Massad: Yes. There have been reports of spontaneous regression of VIN, especially in young women. Regrettably, there are also reports of progression to cancer during observation. There are no characteristics that allow us to distinguish lesions that are going to progress from those that will regress. The ACOG-ASCCP Committee Opinion recommends treatment of all VIN.1
Can VIN be prevented?
OBG Management: The Committee Opinion recommends that the quadrivalent HPV vaccine be offered to women “in target populations” because it can decrease the risk of VIN. What are those target populations?
Dr. Massad: The target population for HPV vaccination is 11- and 12-year-old girls, but catch-up vaccination is acceptable in patients as old as 26 years.
OBG Management: Why isn’t the bivalent vaccine recommended?
Dr. Massad: Only the quadrivalent vaccine has been approved by the US Food and Drug Administration (FDA) for prevention of VIN, although, in theory, the bivalent vaccine ought to be effective as well.
When to biopsy
OBG Management: Do you recommend that any suspect lesion on the vulva be biopsied?
Dr. Massad: The decision to biopsy should be individualized. However, women who have apparent warts that fail to respond to topical therapy should undergo biopsy, as should older women with warty lesions. Keep in mind that older women may develop verrucous carcinomas and may benefit from excision of enlarging warty lesions even if a biopsy is reported as only condylomata. Clinicians should not biopsy varicosities or obvious flat nevi.
OBG Management: Is colposcopy ever helpful in assessing vulvar lesions?
Dr. Massad: Most vulvar lesions can be identified without colposcopy, but colposcopy is useful in determining the extent of lesions. It often reveals subclinical disease not evident at the time of vulvar inspection.
OBG Management: When colposcopy is used, is the procedure the same as for cervical examination?
Dr. Massad: Not exactly. The clinician should apply 5% acetic acid for 5 minutes using a gauze sponge, but the magnification should be 63 to 103—not 153, as it is for cervical examination. It’s important to distinguish hyperplasia from VIN. In general, hyperplastic lesions are faint, gray, diffuse, and flat, whereas VIN lesions are raised and irregular in shape, with sharp borders.
OBG Management: What about toluidine blue? Is it useful in inspection of lesions?
Dr. Massad: Toluidine blue stains skin that is irritated. It isn’t very specific for VIN or vulvar cancer, and it can make colposcopy difficult, so experts no longer recommend it.
OBG Management: What are the treatment options for VIN?
Dr. Massad: They include surgical excision, laser ablation, and topical therapy with 5% imiquimod. All are potentially effective. The Committee Opinion doesn’t specify a preference, except to say that excision is advised when there is any suspicion of cancer to preserve a sample for pathologic analysis. Ablation destroys the lesion, making assessment of possible invasion impossible, and imiquimod may allow disease to progress during observation.
OBG Management: The Committee Opinion recommends wide local excision when cancer is suspected. What size of margin is optimal?
Dr. Massad: In general, a margin of 5 to 10 mm around the lesion is recommended. Vulvectomy isn’t needed because close follow-up usually identifies recurrence before invasion occurs.
OBG Management: When is laser ablation a good choice?
Dr. Massad: Whenever a biopsy shows VIN and cancer is not suspected. Laser ablation is ideal when lesions are multifocal or extensive, although repeated treatments may be required to resolve small foci of residual disease. Done with careful attention to power density and depth of ablation, laser therapy can be less disfiguring than excision.
OBG Management: You mentioned 5% imiquimod. Is there evidence that it’s effective in the treatment of VIN?
Dr. Massad: Multiple randomized, controlled trials have shown 5% imiquimod to be effective against VIN, although the agent does not have approval from the FDA for that indication.5,6 Lower concentrations of imiquimod have not been studied in the treatment of VIN. Women treated with this topical therapy should be followed every 4 weeks with colposcopy because progression to cancer has been reported during imiquimod therapy. Lesions that fail to respond completely after a full course of imiquimod should be treated with excision or laser ablation.
Surveillance is critical
OBG Management: According to the Committee Opinion, the recurrence rate of VIN can reach 30% to 50%.7 Why so high?
Dr. Massad: Usual-type VIN reflects exposure to carcinogenic HPV, and differentiated VIN arises from a vulvar dystrophy. In both situations, treatments destroy VIN and arrest progress to cancer, but the entire vulvar skin remains subject to the inciting condition.
OBG Management: Would skinning vulvectomy eliminate the risk of recurrence?
Dr. Massad: Full vulvectomy is crippling and usually unnecessary. Most patients and clinicians accept the risk of recurrence of VIN to avoid the side effects of radical treatment.
OBG Management: What kind of surveillance is recommended after treatment?
Dr. Massad: Patients should perform vulvar self-examination every few months. They should also be examined 6 and 12 months after initial treatment and annually thereafter because the risk of recurrence may persist for years.
Because VIN is associated with carcinogenic HPV, women with VIN should undergo an annual Pap test.
OBG Management: Thank you, Dr. Massad. Let’s hope the incidence of this precancer begins to decline.
- Recommend the quadrivalent HPV vaccine for girls in the target age range (11 and 12 years old) to reduce the risk of VIN.
- Encourage smoking cessation.
- Make it a practice to inspect the vulva before inserting the speculum for cervical examination.
- Biopsy most pigmented lesions on the vulva. Biopsy all warty lesions in postmenopausal women and in women who fail topical treatment for genital warts.
- Treat all VIN lesions. When cancer is suspected, use wide local excision with a margin of 5 to 10 mm.
- Keep in mind that dysplastic cells can extend into hair follicles and sweat glands.
- Closely follow up all women treated for VIN (6 and 12 months after treatment and annually thereafter) and encourage them to examine their vulva several times every year. Perform an annual Pap test for any woman found to have VIN.
We want to hear from you! Tell us what you think.
1. Committee on Gynecologic Practice; American College of Obstetricians and Gynecologists. Committee Opinion #509: Management of vulvar intraepithelial neoplasia. Obstet Gynecol. 2011;118(5):1192-1194.
2. Judson PL, Habermann EB, Baxter NN, Durham SB, Virnig BA. Trends in the incidence of invasive and in situ vulvar carcinoma. Obstet Gynecol. 2006;107(5):1018-1022.
3. Markowitz LE, Dunne EF, Saraiya M, Lawson HW, Chesson H, Unger ER. Quadrivalent human papillomavirus vaccine: recommendations of the Advisory Committee on Immunization Practices (ACIP). MMWR Recomm Rep. 2007;56(RR-2):1-24.
4. Jones RW, Rowan DM, Stewart AW. Vulvar intraepithelial neoplasia: aspects of the natural history and outcome in 405 women. Obstet Gynecol. 2005;106(6):1319-1326.
5. Van Seters M, van Beurden M, ten Kate FJW, et al. Treatment of vulvar intraepithelial neoplasia with topical imiquimod. N Engl J Med. 2008;358(14):1465-1473.
6. Terlou A, van Seters M, Ewing PC, et al. Treatment of vaginal intraepithelial neoplasia with topical imiquimod: seven years median follow-up of a randomized clinical trial. Gynecol Oncol. 2011;121(1):157-162.
7. Hillemanns P, Wang X, Staehle S, Michels W, Dannecker C. Evaluation of different treatment modalities for vulvar intraepithelial neoplasia (VIN): CO2 laser vaporization, photodynamic therapy, excision and vulvectomy. Gynecol Oncol. 2006;100(2):271-275.
How to prepare your patient for the many nuances of postpartum sexuality
CASE: Waiting for an OK to resume sex
L. L. is a 29-year-old woman, G1P1, who delivered a healthy infant 4 weeks ago by spontaneous vaginal birth. The delivery involved a 2-day induction of labor for preeclampsia and a second-degree tear that was repaired without complication. The patient also experienced postpartum hemorrhage that was managed with bimanual massage and uterotonics and for which she ultimately required transfusion of blood products. Her hospital course was otherwise unremarkable.
Before pregnancy, L. L. had a normal medical history and conceived spontaneously. Her antenatal course was uncomplicated.
Today, she returns for her postpartum visit. She reports being tired and says she still has some pain at the site of the tear, but reports no problems with urinary or fecal continence. She denies being depressed, and her Edinburgh Postnatal Depression Scale (EPDS) score is consistent with that report. She is breastfeeding and appears to be doing well on the progestin-only pill for contraception. She has not yet attempted intercourse because she is complying with instructions to wait until she sees you for her postpartum visit.
How should you counsel her about resuming sexual activity?

Childbirth is a central event in a woman’s life. Pregnancy and delivery are a time of psychological, biological, and physical transformation, and the postpartum period—the “fourth trimester”—is no exception. Sexual function may be affected. In fact, many women who seek assistance for sexual dissatisfaction note that their problem arose in the postpartum period.1
Postpartum sexuality involves considerably more than the physical act of genital stimulation—with or without intromission or penile penetration—and depends on more than the physical state of recovery of the vagina (after vaginal delivery). It also depends on:
- the woman’s sexual drive and motivation
- her general state of health and quality of life
- her emotional readiness to resume sexual intimacy with a partner
- her adaptation to the maternal role and ability to balance her identity as a mother with her identity as a sexual being
- her relationship with her partner.
Given all these contributing factors, many of which fall outside the scope of the clinical practice of obstetrics and gynecology, how do we go about counseling our patients about the resumption of sexual activity?
Other questions:
- How can we help patients manage expectations about the quality of their postpartum sexual function?
- What guidance can we provide regarding the interplay of psychosexual and physical aspects of the puerperium?
- Can we offer a method of screening for sexual dysfunction in the puerperium? If so, will it help prevent sexual problems or hasten their resolution?
This article addresses these issues. Ultimately, the answer to the question of when to resume sexual activity should reflect an awareness of cultural norms and taboos as well as familiarity with empirically based recommendations.
Traditional postpartum sexual education is not evidence-based and has limited effectiveness. More up-to-date strategies can be easily incorporated into even the busiest clinical practice. We offer the following counseling model for you to consider when addressing the sexual health of patients postpartum.
Educate, legitimize, and normalize
The first sexual encounter after childbirth can be an important step for couples to reclaim their intimate relationship.
Adaptation to the parental role, physical healing, hormonal changes, breastfeeding, and sleep deprivation contribute to a profound psychosocial challenge. The resumption of sexual activities and a satisfying postpartum sex life depend on many variables, many of which the patient may not even be aware.
First, do not assume that all patients are heterosexual and that intercourse is their only form of sexual activity.
Second, it is important to be proactive in antepartum and postpartum counseling and to offer anticipatory guidance. Counseling can take place any time during routine prenatal care, as well as at the time of hospital discharge and the postpartum visit.
Reassure the patient that, if sexual activity and frequency are lower during pregnancy and the postpartum period, it is likely a normal transition. Also give the patient time to talk about her expectations and perceptions. Explain to her the normal fluctuations and variability of sexual interest and enjoyment in pregnancy and the puerperium, and suggest that she consider alternative options for intimate expression, non-coital sexual activities, and mutual pleasure within her cultural context.
Be thorough
Take a comprehensive medical, obstetric, psychological, and social history as part of the sexual history. Also perform a physical intake and exam. Questions about urinary and fecal incontinence ought to be part of all postpartum assessment.
Other potential areas to address include the quality of the relationship, prepregnancy sexual function, the support network, planned or unplanned state of the pregnancy, previous pregnancy and delivery outcomes, the health status of current children, and present, previous, and future contraceptive use.29
Consider multiple visits
It is hard to know exactly when to evaluate a patient for postpartum sexual dysfunction, given the impact of pudendal nerve latency, fatigue, and breastfeeding. For this reason, assessment on multiple occasions may be appropriate. Numerous validated scales to assess sexual function can be easily incorporated into clinical practice.
Couples counseling and therapy may be needed in some cases; be aware of referral services in your area for sexual wellness specialists.
The bottom line: A “successful” sexual life does not necessarily mean adequate genital function (e.g., coital orgasm, improved clitoral blood flow, increased sexual frequency) but, rather, a sexual life that is intimate and satisfying to the individual patient.
A paucity of research
To date, research into sexuality during the postpartum period has focused primarily on the physical changes and constraints that affect the mechanics and frequency of intercourse and overall sexual satisfaction and desire.2 This perspective has begun to broaden to include the psychological aspects of sexuality.
TABLE 1
These validated tools can help you measure female sexual dysfunction
| Tool | Area assessed |
|---|---|
| Female Sexual Function Index (FSFI)30 | Desire, arousal, orgasm, and pain |
| Female Sexual Function Index 6-Item (FSFI-6)31 | Desire, arousal, orgasm, and pain |
| McCoy Female Sexual Function Questionnaire*32 | Presence of female sexual disorders |
| Brief Sexual Symptoms Checklist33 | Screener for sexual concerns |
| Female Sexual Distress Scale – Revised34 | Distress |
| Intimate Relationship Scale*35 | Changes in sexual relationship |
| Sexual Quality of Life – Female (SQol-F)36 | Quality of life in women with female sexual dysfunction |
| Golombok Rust Inventory of Sexual Satisfaction (GRISS)37 | Quality of sexual relationship |
| Decreased Sexual Desire Screener38 | Brief diagnostic tool for hypoactive sexual desire disorder |
| * Validated in pregnant and/or postpartum women | |
Women’s sexual health during the postpartum period has generally been under-researched. It wasn’t until the past decade that validated sexual function questionnaires were utilized. Although a number of these instruments are now available (TABLE 1, TABLE 2, FIGURE), it remains unclear whether they can accurately measure postpartum sexual function. Despite these limitations, significant information has been elicited that can be used to counsel patients struggling with postpartum sexual concerns.
TABLE 2
The 6-item Female Sexual Function Index*
| Question | Responses | |||||
|---|---|---|---|---|---|---|
| 0 points | 5 points | 4 points | 3 points | 2 points | 1 point | |
| How would you rate your level of sexual desire or interest? | No sexual activity | Very high | High | Moderate | Low | Very low or none at all |
| How would you rate your level of sexual arousal (“turn on”) during sexual activity or intercourse? | No sexual activity | Very high | High | Moderate | Low | Very low or none at all |
| How often did you become lubricated (“wet”) during sexual activity or intercourse? | No sexual activity | Almost always or always | Most times | Sometimes | A few times | Almost never or never |
| When you had sexual stimulation or intercourse, how often did you reach orgasm? | No sexual activity | Almost always or always | Most times | Sometimes | A few times | Almost never or never |
| How satisfied have you been overall with your sexual life? | No sexual activity | Very satisfied | Moderately satisfied | About equally satisfied and dissatisfied | Moderately dissatisfied | Very dissatisfied |
| How often did you experience discomfort or pain during vaginal penetration? | Did not attempt intercourse | Almost never or never | A few times | Sometimes | Most times | Almost always or always |
| *The components of this index are to be assessed over the past 4 weeks. The score is the sum of the ordinal responses to the 6 items and ranges from 2 to 30. A score of less than 19 indicates a need for further investigation, including the full-length Female Sexual Function Index. Source: Adapted from Isidori et al.31 | ||||||
Ideal period of abstinence is unknown
Although our knowledge of the female genital tract in the puerperium is based upon histologic evidence, there are no evidence-based policies to outline the ideal period of postpartum coital abstinence. It seems reasonable to assume that our traditional scientific recommendations developed in part to prevent uterine infection and disruption of sutured wounds. These concerns, combined with cultural and societal norms, have led to the routine discouragement of sexual activity until 4 to 6 weeks postpartum.
The possibility of shortening the period of postpartum abstinence was first suggested by the American College of Obstetricians and Gynecologists (ACOG) in 1984.1 In 1985, Pritchard and colleagues wrote about the individualization of postpartum prohibitions of sexual activity in Williams Obstetrics.1 The earliest time at which intercourse may be safely resumed is unknown, but the 23rd edition of Williams Obstetrics states that a woman can resume sexual intercourse as early as 2 weeks, based on her comfort and desire.3 The sixth edition of the American Academy of Pediatrics (AAP) and ACOG guidelines for perinatal care also states that the risks ought to be minimal at 2 weeks postpartum.4
BRIEF SEXUAL SYMPTOMS CHECKLIST FOR WOMEN (BSSC-W)
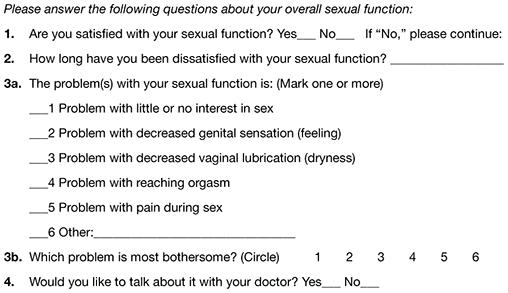
Reprinted from Hatzichristou et al. 33
Low desire is not unusual
Although a patient may be granted “permission” to engage in coital activity, other variables influence her decision. It is well known that sexual desire may fluctuate during pregnancy and typically decreases significantly during the third trimester.2 Many women enter the postpartum period with lower levels of sexual desire and satisfaction, and these depressed levels may continue for some time.2 Twenty-five percent of women report worsened sexual function, including diminished sexual satisfaction, during pregnancy that persists for 6 to 12 months postpartum.5 By 12 weeks postpartum, 80% to 93% of women have resumed intercourse, but as many as 83% report sexual problems during the first 3 months of the postpartum period. At 6 months, 18% to 30% of these women may still be experiencing sexual problems, including dyspareunia.5,6
In 1998, von Sydow performed a meta-content analysis of all existing studies on parental sexuality during pregnancy and the first 6 months postpartum.7 Using psychological and medical data banks, she brought together information from two branches of science and identified 59 relevant studies in English or German between 1950 and 1996. Although the majority of studies were retrospective and failed to utilize a validated instrument, von Sydow determined that, overall, sexual interest and activity were low or nonexistent during the first months after delivery. There was high variability between individuals, however, and levels of sexual interest and activity of individual women remained relatively constant from the time before pregnancy until 1 year postpartum.7 von Sydow determined that there is great variability in female sexuality during pregnancy and postpartum; this variability may represent fluctuations during this phase of life. She also determined that severe psychosexual and marital problems are much more prevalent in the postpartum period than during pregnancy and persist long after a physical cause can be used as an explanation.7
Fatigue and quality of the relationship have an impact on sexual function
De Judicibus and colleagues identified a broad range of variables that have a detrimental impact on sexuality at 12 weeks postpartum, most particularly:
- marital dissatisfaction
- dyspareunia
- fatigue
- depression
- breastfeeding.2
There is evidence to suggest that the addition of the first child reduces marital quality after the first month postpartum, and this decline in marital satisfaction continues for 6 to 18 months postpartum.2 Witting and coworkers suggested that this decline may represent a transitional phase of parenthood for some couples; data support the positive effects on overall marital satisfaction with the addition of children.8 Women who were more satisfied with their relationships reported higher sexual satisfaction and greater frequency of intercourse.2,8
Fatigue is one of the most common problems women experience during pregnancy and postpartum and is a common reason given for loss of sexual desire and interest, infrequent sexual activity, and lack of enjoyment.5 A high level of exhaustion is found during the first 8 weeks postpartum. Although it declines over the next 6 months, it does not appear to resolve completely in a good number of women.9
Don’t underestimate the impact of obstetric morbidity
Surprisingly, the long-term impact of severe obstetric events on postpartum maternal health is often overlooked. Waterstone and colleagues found that women who have severe obstetric morbidity, such as massive hemorrhage, preeclampsia, sepsis, and uterine rupture, experience significant changes in sexual health and well-being.10 They conducted a prospective cohort study of such women, measuring sexual activity, general health, and postpartum depression. They utilized two validated postnatal questionnaires—the Short Form 36 (SF-36) to measure general health and the EPDS. Women who had uncomplicated pregnancies and childbirth tended to perform well in most SF-36 categories, whereas women who had experienced severe morbidity scored worse in almost every category. These women also reported problems with intercourse. Thirteen percent of women had not resumed sexual relations by 6 to 12 months postpartum; of these women, more than half reported a fear of conceiving as a reason.
The female body undergoes dramatic physiologic, anatomic, and psychological changes immediately following delivery and throughout the restoration of its pre-pregnant state. This fourth trimester usually lasts 6 to 12 weeks.39
Uterus. The uterus undergoes rapid involution after separation of the placenta. By 2 to 4 weeks postpartum, it may no longer be palpable abdominally, and by 6 weeks, it usually has returned to its nonpregnant state and size. Seven to 14 days after delivery, a woman often experiences an episode of heavier vaginal bleeding that corresponds with the sloughing of the placental bed eschar. During this time of involution, myometrial vessels may be 5 mm or larger in diameter.40
Lochia. The postpartum lochia begins to change within days of birth, transitioning through its stages of lochia rubra, serosa, and alba. It decreases by 3 weeks postpartum and is likely completely resolved by 6 weeks.
Prolactin is responsible for lactogenesis. When the prolactin level is maintained through breastfeeding, it depresses ovarian production of estrogen by suppressing pituitary gonadotropin secretion, triggering a period of “steroid starvation” after the loss of estrogen and progesterone production from the placenta.1
Vagina. Early in the postpartum period, the vagina is typically edematous and lax and, as a result of parturition, there may be not only a spontaneous tear or episiotomy that must heal, but superficial small tears that do not require suturing. Ruggae begin to reappear by 3 weeks, and the vaginal epithelium will begin to mature under the influence of estrogen production. Much of this tissue damage is healed by 6 weeks postpartum.
The perception of pregnant and postpartum women’s sexuality varies, based on religious and cultural norms. In some religions and cultures, sexual activity is forbidden for 2 to 3 months postpartum; in others, it is prohibited until the child is weaned from the breast. The postpartum woman and lochia have traditionally been perceived as unclean, and many religions have specific proscriptions regarding the management of this time in a woman’s life.1 Although early cultures did not study these issues specifically, their doctrines suggest that they had some awareness of the natural physiologic transition of a woman’s body after she has given birth.
Exploring the role of body image
Paul and coworkers prospectively assessed female sexual function, body image, and pelvic symptoms from the first trimester until 6 months postpartum.11 They utilized the validated questionnaire instruments of the Female Sexual Function Index (FSFI), the Body Exposure during Sexual Activities Questionnaire (BESAQ), the short forms of the Urogenital Distress Inventory (UDI-6), the Incontinence Impact Questionnaire (IIQ-7), and the Fecal Incontinence Quality of Life Scale (FIQOL). They found that sexual activity and sexual function scores were highest before pregnancy, declined between the first and third trimesters, and did not return to pre-pregnancy baselines even by 6 months postpartum.11
Differences in sexual practices contributed to these patterns. Kissing, fondling, and vaginal intercourse remained stable across pregnancy, whereas oral sex, breast stimulation, and masturbation declined in the third trimester.
The decline of these activities during pregnancy and postpartum has been seen in other studies as well.12
Obstacles to sexual activity also changed across pregnancy and the postpartum period. Vaginal pain was more problematic in the third trimester and postpartum, whereas feelings of unattractiveness and issues of body image were present throughout pregnancy and at their worst in the postpartum period. Sexual function scores based on the FSFI declined during pregnancy and did not return to pre-pregnancy or first-trimester levels by 6 months postpartum. Urinary symptoms, as measured by the UDI-6, were associated with lower sexual function scores during the postpartum period. The association between urinary incontinence and sexual dysfunction has been seen in other studies.13,14
The enduring effects of perineal trauma
Childbirth may physically affect a woman’s sexual function through perineal trauma, pudendal neuropathy, and vaginal dryness associated with breastfeeding. There is an obvious connection between perineal laceration and perineal pain and problems with intercourse.5 Overall, dyspareunia is reported by 41% to 67% of women 2 to 3 months after delivery.15 Women who have an episiotomy complain of increased perineal pain and delayed return of sexual activity, compared with women who deliver with an intact perineum.16
Persistent dyspareunia is strongly associated with the severity of perineal trauma and operative vaginal delivery.3,17 Multiple studies have investigated this association and found a positive correlation 3 to 6 months postpartum,6,9,17 but the long-term effects and association remain unclear.18
Findings from research. Rogers and colleagues prospectively studied the effect of perineal trauma on postpartum sexual function in a midwifery population of women who had a low rate of episiotomy and operative vaginal delivery.6 They utilized the Intimate Relationship Scale (IRS), a validated questionnaire to measure postpartum sexual function in couples. Most women in this study had resumed sexual activity by 3 months postpartum and did not have postpartum inactivity or dysfunction, based on their IRS scores. However, women who were identified as having experienced major trauma (second-, third-, or fourth-degree laceration or a repaired first-degree laceration) had significantly less desire to engage in activities such as touching and stroking with their partner.6
Present-day limits on the routine use of episiotomy and operative vaginal delivery have yielded a lower rate of third- and fourth-degree laceration.19 Second-degree lacerations are common and constitute the majority of perineal trauma in births without episiotomy.20 There is evidence that the use of synthetic absorbable suture, such as polyglactin, rather than chromic suture, results in less postpartum perineal pain, as does leaving the well-approximated perineal skin edges unsutured.20
Signorello and coworkers found that second-, third-, and fourth-degree lacerations increased the risk of postpartum dyspareunia; operative vaginal delivery (forceps or vacuum) was also an independent risk factor for dyspareunia.21
The impact of route of delivery
Some researchers have concluded that the route of delivery has an impact on the long-term pelvic floor health of women.18 In 1986, Snooks and colleagues analyzed possible obstetric risk factors for damage to the innervation of the pelvic floor, which can lead to both stress urinary and anorectal incontinence.22 They found that the process of vaginal delivery causes a compression and stretch type of injury to the pudendal nerve, as well as the possibility of severe perineal lacerations. This injury may be less likely to occur when cesarean delivery is performed before labor, avoiding direct perineal trauma and possible pudendal neuropathy.15 Because the pudendal nerve mediates some of the reflex pathways in the female sexual response, it is plausible that damage to it could result in sexual dysfunction.
Women who deliver vaginally have a higher rate of fecal and urinary incontinence than women who deliver by cesarean.16,23 The presence of incontinence, however, does not always have a significant long-term effect on one’s sexual life.6
In the Term Breech Trial, the route of delivery had no impact on the resumption of intercourse, dyspareunia, or sexual satisfaction.23 Although the trial was randomized and controlled, it had many limitations that call its generalizability into question in regard to postpartum sexual dysfunction.
The National Institutes of Health (NIH) State-of-the-Science Conference on Cesarean Delivery on Maternal Request indicated that, by 6 months postpartum, there is no difference in sexual function based on the route of delivery.24 However, Lydon-Rochelle and colleagues used the SF-36 to assess reported general health status and found that women who had cesarean delivery or assisted vaginal delivery exhibited significantly poorer postpartum functional status than women who had spontaneous vaginal delivery in five areas at 7 weeks postpartum: physical functioning, mental health, general health perception, bodily pain, social functioning, and ability to perform daily activities.25 Women were more likely to be readmitted to the hospital and more likely to report fatigue during the first 2 months after cesarean delivery.9 It appears that women who undergo cesarean delivery have an elevated risk of nondyspareunia-related causes of sexual dysfunction. Any protective effect of cesarean on sexual function is limited to the early postnatal period and is related to the absence of perineal injury.18
How breastfeeding can affect sexual desire
Evidence is strong that breastfeeding reduces a woman’s sexual desire and the frequency of intercourse.1,5 A high level of prolactin suppresses ovarian production of estrogen, thereby reducing vaginal lubrication. Some women and their partner may identify this loss of lubrication as a lack of arousal. This type of vaginal dryness should be explained, and the use of a lubricant should be encouraged in breastfeeding women.
Nipple sensitivity may develop, making touching and foreplay uncomfortable in some women. One third to one half of mothers find breastfeeding to be an erotic experience, and one fourth feel guilty about this sexual excitement; others stop nursing or wean early due to these feelings.1,7 Women are often not educated about the relationship between the release of oxytocin, uterine contractions, milk ejection, sexual arousal, and orgasm; raising the subject can help to diminish any potential distress over this response.
Sleep disturbances from feeding on demand contribute to fatigue and exhaustion.
Many women may not realize that their loss of interest in sex may be because they are receiving sufficient physical contact or touching through their nurturing interactions with the baby. This may leave the partner feeling isolated and envious of the mother-baby relationship.
Couples should be encouraged to discuss these feelings to avoid misperceptions and to maintain the relationship dyad as a priority to prevent the development of relationship problems.
The majority of women will discuss contraception with a health provider, but only 15% will voluntarily discuss their sexual needs or dysfunction.17 This finding is alarming given that, during the postpartum period, two of every three new mothers will experience at least one problem related to sexual function, including dyspareunia, decreased libido, difficulty achieving orgasm, and vaginal dryness.41 This lack of discussion with a health-care provider may be the result of several variables: incomplete knowledge on the part of the provider about what affects sexual function, poor training in the taking of an effective sexual history, and uneasiness on the part of the patient about discussing the issue.5,42
Postnatal depression takes a toll
Depressed mood and emotional lability in the postpartum period are negatively associated with sexual interest, enjoyment, coital activity, and perceived tenderness of the partner.7 Conversely, reduced sexual interest, desire and satisfaction; a lower frequency of intercourse; and later resumption of intercourse are associated with a higher number of psychiatric symptoms in the postpartum period.2 Between 10% and 15% of women experience postpartum depression (PPD).26 Depression has been associated with a decreased frequency and interest in sexual activity at 8 to 12 weeks postpartum.2,5
Chivers and colleagues assessed sexual functioning and sexual behavior in women with and without symptoms of PPD using the FSFI and EPDS. Although theirs was a small study, they found that women who had depressive symptoms also reported poorer functioning in regard to sexual arousal, orgasm, pain, lubrication, and sexual satisfaction.26 Morof and coworkers found that women who had PPD were less likely to have resumed intercourse by 6 months postpartum; they were also less likely to engage in other sexual activities.27
Role of pharmacotherapy
Many women are started on antidepressant medication near the time of delivery or during the immediate postpartum period. Often, serotonin reuptake inhibitors (SRIs) are used because there is minimal transmission of this class of medication through breast milk. However, the potential sexual side effects of these medications should be discussed because they are the agents most commonly associated with female sexual dysfunction.28
For clinicians
American Association of Sex Educators, Counselors, and Therapists – A not-for-profit, interdisciplinary professional organization comprising sexuality educators, sexuality counselors, sex therapists, physicians, social workers, and other clinicians. Its home page links to a referral page and other resources. http://www.aasect.org" target="_blank">http://www.aasect.org
Association of Reproductive Health Professionals offers a resource for clinicians on postpartum counseling about sexuality. http://www.arhp.org/publications-and-resources/quick-reference-guide-for-clinicians/postpartum-counseling/contraception" target="_blank">http://www.arhp.org/publications-and-resources/quick-reference-guide-for-clinicians/postpartum-counseling/contraception
For patients
Mayo Clinic provides a fact sheet entitled “Sex after pregnancy: Set your own timeline.” http://www.mayoclinic.com/health/sex-after-pregnancy/PR00146" target="_blank">http://www.mayoclinic.com/health/sex-after-pregnancy/PR00146
Sex and a Healthier You – This site offers information for patients on sexuality and relationships. http://www.sexandahealthieryou.org/sex-health/index.html" target="_blank">http://www.sexandahealthieryou.org/sex-health/index.html
We want to hear from you! Tell us what you think.
1. Reamy KJ, White SE. Sexuality in the puerperium: a review. Arch Sex Behav. 1987;16(2):165-186.
2. De Judicibus MA, McCabe MP. Psychological factors and the sexuality of pregnant and postpartum women. J Sex Res. 2002;39(2):94-103.
3. The puerperium. In: Cunningham FG Leveno KJ, Bloom SL, Hauth JC, Rouse DJ, Spong CY, eds. Williams Obstetrics. 23rd ed. New York, NY: McGraw-Hill Co.; 2010:646-660.
4. The American Academy of Pediatrics (AAP), American College of Obstetricians Gynecologists (ACOG) Guidelines for perinatal care. 6th ed. Washington DC: AAP, ACOG; 2008.
5. Glazener CM. Sexual function after childbirth: women’s experiences persistent morbidity and lack of professional recognition. Br J Obstet Gynaecol. 1997;104(3):330-335.
6. Rogers RG, Borders, N,, Leeman L, Albers L. Does spontaneous genital tract trauma impact postpartum sexual function? J Midwifery Womens Health. 2009;54(2):98-103.
7. von Sydow K. Sexuality during pregnancy and after childbirth: a metacontent analysis of 59 studies. J Psychosom Res. 1999;47(1):27-49.
8. Witting K, Santtila P, Alanko K, et al. Female sexual function and its associations with number of children, pregnancy, and relationship satisfaction. J Sex Marital Ther. 2008;34(2):89-106.
9. Thompson JF, Roberts CL, Currie M, Elwood DA. Prevalence and persistence of health problems after childbirth: associations with parity and method of birth. Birth. 2002;29(2):83-94.
10. Waterstone M, Wolfe C, Hooper R, Bewley S. Postnatal morbidity after childbirth and severe obstetric morbidity. BJOG. 2003;110(2):128-133.
11. Pauls RN, Occhino JA, Dryfhout VL. Effects of pregnancy on female sexual function and body image: A prospective study. J Sex Med. 2008;5(8):1915-1922.
12. von Sydow K, Ullmeyer M, Happ N. Sexual activity during pregnancy and after childbirth: Results from the Sexual P Questionnaire. J Psychosom Obstet Gynaecol. 2001;22(1):29-40.
13. Uebersax JS, Wyman JF, Shumaker SA, McClish DK, Fantl JA. Short forms to assess life quality and symptom distress for urinary incontinence in women: The Incontinence Impact Questionnaire and the Urogenital Distress Inventory. Continence Program for Women Rsearch Group. Neurourol Urodyn. 1995;14(2):131-139.
14. Barber MD, Visco AG, Wyman JF, Fantl JA, Bump RC; Continence Program for Women Research Group. Sexual function in women with urinary incontinence and pelvic organ prolapse. Obstet Gynecol. 2002;99(2):281-289.
15. Handa VL. Sexual function and childbirth. Semin Perinatol. 2006;30(5):253-256.
16. Klein MC, Gauthier RJ, Robbins JM, et al. Relationship of episiotomy to perineal trauma and morbidity, sexual dysfunction, and pelvic floor relaxation. Am J Obstet Gynecol. 1994;171(3):591-598.
17. Barrett G, Pendry E, Peacock J, Victor C, Thakar, Manyonda I. Women’s sexual health after childbirth. BJOG. 2000;107(2):186-195.
18. Barrett G, Peacock J, Victor CR, Manyonda I. Cesarean section and postnatal sexual health. Birth. 2005;32(4):306-311.
19. Eason E, Labrecque M, Wells G, Feldman P. Preventing perineal trauma during childbirth: a systematic review. Obstet Gynecol. 2000;95(3):464-471.
20. Leeman LM, Rogers RG, Greulich B, Albers LL. Do unsutured second-degree perineal lacerations affect postpartum functional outcomes? J Am Board Fam Med. 2007;20(5):451-457.
21. Signorello L, Harlow BL, Chekos AK, Repke JT. Postpartum sexual functioning and its relationship to perineal trauma: A retrospective cohort study of primiparous women. Am J Obstet Gynecol. 2001;184(5):881-890.
22. Snooks SJ, Swash M, Henry MW, Setchell M. Risk factors in childbirth causing damage to the pelvic floor innervation. In J Colorect Dis. 1986;1(1):20-24.
23. Hannah ME, Whyte H, Hannah WJ, et al. Term Breech Trial Collaborative Group. Maternal outcomes at 2 years after planned cesarean section versus planned vaginal birth for breech presentation at term: the international randomized Term Breech Trial. Am J Obstet Gynecol. 2004;191(3):917-927.
24. NIH State-of-the-Science Conference Statement on Cesarean Delivery on Maternal Request NIH Consens Sci Statements. 2006;23:1-29.http://consensus.nih.gov/2006/cesareanstatement.htm. Accessed December 6 2011.
25. Lydon-Rochelle MT, Holt VL, Martin DP. Delivery method and self-reported postpartum general health status among primiparous women. Paediatr Perinat Epidemiol. 2001;15(3):232-240.
26. Chivers ML, Pittini MD, Grigoriadis S, Villegas L, Ross LE. The relationship between sexual functioning and depressive symptomatology in postpartum women: a pilot study. J Sex Med. 2011;8(3):792-799.
27. Morof D, Barrett G, Peacock J, Victor CR, Manyonda I. Postnatal depression and sexual health after childbirth. Obstet Gynecol. 2003;102(6):1318-1325.
28. American College of Obstetricians and Gynecologists Committee on Practice Bulletins-Gynecology. ACOG Practice Bulletin No.119: Female sexual dysfunction. Obstet Gynecol. 2011;117(4):996-1007.
29. Read J. Sexual problems associated with infertility pregnancy and ageing. BMJ. 2004;329(7465):559-561.
30. Rosen R, Brown C, Heiman J, et al. The Female Sexual Function Index (FSFI): a multidimensional self-report instrument for the assessment of female sexual function. J Sex Marital Ther. 2000;26:191-208.
31. Isidori AM, Pozza C, Esposito K, et al. The Female Sexual Function Index (FSFI): Development and validation of a 6-item version of the female sexual function index (FSFI) as a diagnostic tool for female sexual dysfunction. J Sex Med. 2010;7(3):1139-11.
32. McCoy NL. The McCoy Female Sexuality Questionnaire. Quality Life Res. 2000;9(suppl 6):739-745.
33. Hatzichristou D, Rosen RC, Derogatis LR, et al. Recommendations for the clinical evaluation of men and women with sexual dysfunction. J Sex Med. 2010;7(1 Pt 1):337-348.
34. DeRogatis LR, Allgood A, Rosen RC, Leiblum S, Zipfel L, Guo CY. Development and evaluation of the Women’s Sexual Interest Diagnostic Interview (WSID): a structured interview to diagnose hypoactive sexual desire disorder (HSDD) in standardized patients. J Sex Med. 2008;5(12):2827-2841.
35. Fischman SH, Rankin EA, Soeken KL, Lenz ER. Changes in sexual relationships in postpartum couples. J Obstet Gynecol Neonatal Nurs. 1986;15(1):58-63.
36. Sillis T, Wunderlich G, Pyke R, et al. The Sexual Interest and Desire Inventory-Female (SIDI-F): item response analyses of data from women diagnosed with hypoactive sexual desire disorder. J Sex Med. 2005;2(6):801-818.
37. Rust J, Golombok S. The Golombok-Rust Inventory of Sexual Satisfaction (GRISS). Br J Clin Psych. 1985;24(Pt 1):63-64.
38. Clayton AH, Balon R. The impact of mental illness and psychotropic medications on sexual functioning: the evidence and management. J Sex Med. 2009;6(5):1200-1213.
39. Jennings B, Edmundson M. The postpartum period: after confinement: the fourth trimester. Clin Obstet Gynecol. 1980;23(4):1093-1103.
40. Oppenheimer LS, Sheriff EA, Goodman JDS, shah D, James CE. The duration of lochia. Br J Obstet Gynaecol. 1986;93(7):754-757.
41. Connolly A, Thorp J, Pahel L. Effects of pregnancy and childbirth on postpartum sexual function: a longitudinal prospective study. Int Urogynecol J Pelvic Floor Dysfunct. 2005;16(4):263-267.
42. Pancholy AB, Goldenhar L, Fellner AN, Crisp C, Kleeman S, Pauls R. Resident education and training in female sexuality: results of a national survey. J Sex Med. 2011;8(2):361-366.
| Dr. Rezaee offers 5 tips for talking to patients about postpartum sexuality |

Roya Rezaee, M
Dr. Rezaee is Assistant Professor of Obstetrics and Gynecology at the University Hospitals Case Medical Center, MacDonald Women's Hospital, and Medical Director of the Women's Health Center at the University Hospitals Case Medical Center in Cleveland, Ohio.

Sheryl Kingsberg, PhD
Dr. Kingsberg is Chief of the Division of Behavioral Medicine at the University Hospitals Case Medical Center, MacDonald Women's Hospital, and Professor of Reproductive Biology and Psychiatry at Case Western Reserve University School of Medicine in Cleveland, Ohio.
Dr. Rezaee receives grant or research support from Paladin Technologies. Dr. Kingsberg receives grant or research support from BioSante and Paladin Technologies, and is a consultant to BioSante Pharmaceuticals, Pfizer, Norvo Nordisk, Viveve, Trimel Pharmaceuticals, and Sprout Pharmaceuticals.
| Dr. Rezaee offers 5 tips for talking to patients about postpartum sexuality |
Roya Rezaee, M
Dr. Rezaee is Assistant Professor of Obstetrics and Gynecology at the University Hospitals Case Medical Center, MacDonald Women's Hospital, and Medical Director of the Women's Health Center at the University Hospitals Case Medical Center in Cleveland, Ohio.
Sheryl Kingsberg, PhD
Dr. Kingsberg is Chief of the Division of Behavioral Medicine at the University Hospitals Case Medical Center, MacDonald Women's Hospital, and Professor of Reproductive Biology and Psychiatry at Case Western Reserve University School of Medicine in Cleveland, Ohio.
Dr. Rezaee receives grant or research support from Paladin Technologies. Dr. Kingsberg receives grant or research support from BioSante and Paladin Technologies, and is a consultant to BioSante Pharmaceuticals, Pfizer, Norvo Nordisk, Viveve, Trimel Pharmaceuticals, and Sprout Pharmaceuticals.
CASE: Waiting for an OK to resume sex
L. L. is a 29-year-old woman, G1P1, who delivered a healthy infant 4 weeks ago by spontaneous vaginal birth. The delivery involved a 2-day induction of labor for preeclampsia and a second-degree tear that was repaired without complication. The patient also experienced postpartum hemorrhage that was managed with bimanual massage and uterotonics and for which she ultimately required transfusion of blood products. Her hospital course was otherwise unremarkable.
Before pregnancy, L. L. had a normal medical history and conceived spontaneously. Her antenatal course was uncomplicated.
Today, she returns for her postpartum visit. She reports being tired and says she still has some pain at the site of the tear, but reports no problems with urinary or fecal continence. She denies being depressed, and her Edinburgh Postnatal Depression Scale (EPDS) score is consistent with that report. She is breastfeeding and appears to be doing well on the progestin-only pill for contraception. She has not yet attempted intercourse because she is complying with instructions to wait until she sees you for her postpartum visit.
How should you counsel her about resuming sexual activity?
Childbirth is a central event in a woman’s life. Pregnancy and delivery are a time of psychological, biological, and physical transformation, and the postpartum period—the “fourth trimester”—is no exception. Sexual function may be affected. In fact, many women who seek assistance for sexual dissatisfaction note that their problem arose in the postpartum period.1
Postpartum sexuality involves considerably more than the physical act of genital stimulation—with or without intromission or penile penetration—and depends on more than the physical state of recovery of the vagina (after vaginal delivery). It also depends on:
- the woman’s sexual drive and motivation
- her general state of health and quality of life
- her emotional readiness to resume sexual intimacy with a partner
- her adaptation to the maternal role and ability to balance her identity as a mother with her identity as a sexual being
- her relationship with her partner.
Given all these contributing factors, many of which fall outside the scope of the clinical practice of obstetrics and gynecology, how do we go about counseling our patients about the resumption of sexual activity?
Other questions:
- How can we help patients manage expectations about the quality of their postpartum sexual function?
- What guidance can we provide regarding the interplay of psychosexual and physical aspects of the puerperium?
- Can we offer a method of screening for sexual dysfunction in the puerperium? If so, will it help prevent sexual problems or hasten their resolution?
This article addresses these issues. Ultimately, the answer to the question of when to resume sexual activity should reflect an awareness of cultural norms and taboos as well as familiarity with empirically based recommendations.
Traditional postpartum sexual education is not evidence-based and has limited effectiveness. More up-to-date strategies can be easily incorporated into even the busiest clinical practice. We offer the following counseling model for you to consider when addressing the sexual health of patients postpartum.
Educate, legitimize, and normalize
The first sexual encounter after childbirth can be an important step for couples to reclaim their intimate relationship.
Adaptation to the parental role, physical healing, hormonal changes, breastfeeding, and sleep deprivation contribute to a profound psychosocial challenge. The resumption of sexual activities and a satisfying postpartum sex life depend on many variables, many of which the patient may not even be aware.
First, do not assume that all patients are heterosexual and that intercourse is their only form of sexual activity.
Second, it is important to be proactive in antepartum and postpartum counseling and to offer anticipatory guidance. Counseling can take place any time during routine prenatal care, as well as at the time of hospital discharge and the postpartum visit.
Reassure the patient that, if sexual activity and frequency are lower during pregnancy and the postpartum period, it is likely a normal transition. Also give the patient time to talk about her expectations and perceptions. Explain to her the normal fluctuations and variability of sexual interest and enjoyment in pregnancy and the puerperium, and suggest that she consider alternative options for intimate expression, non-coital sexual activities, and mutual pleasure within her cultural context.
Be thorough
Take a comprehensive medical, obstetric, psychological, and social history as part of the sexual history. Also perform a physical intake and exam. Questions about urinary and fecal incontinence ought to be part of all postpartum assessment.
Other potential areas to address include the quality of the relationship, prepregnancy sexual function, the support network, planned or unplanned state of the pregnancy, previous pregnancy and delivery outcomes, the health status of current children, and present, previous, and future contraceptive use.29
Consider multiple visits
It is hard to know exactly when to evaluate a patient for postpartum sexual dysfunction, given the impact of pudendal nerve latency, fatigue, and breastfeeding. For this reason, assessment on multiple occasions may be appropriate. Numerous validated scales to assess sexual function can be easily incorporated into clinical practice.
Couples counseling and therapy may be needed in some cases; be aware of referral services in your area for sexual wellness specialists.
The bottom line: A “successful” sexual life does not necessarily mean adequate genital function (e.g., coital orgasm, improved clitoral blood flow, increased sexual frequency) but, rather, a sexual life that is intimate and satisfying to the individual patient.
A paucity of research
To date, research into sexuality during the postpartum period has focused primarily on the physical changes and constraints that affect the mechanics and frequency of intercourse and overall sexual satisfaction and desire.2 This perspective has begun to broaden to include the psychological aspects of sexuality.
TABLE 1
These validated tools can help you measure female sexual dysfunction
| Tool | Area assessed |
|---|---|
| Female Sexual Function Index (FSFI)30 | Desire, arousal, orgasm, and pain |
| Female Sexual Function Index 6-Item (FSFI-6)31 | Desire, arousal, orgasm, and pain |
| McCoy Female Sexual Function Questionnaire*32 | Presence of female sexual disorders |
| Brief Sexual Symptoms Checklist33 | Screener for sexual concerns |
| Female Sexual Distress Scale – Revised34 | Distress |
| Intimate Relationship Scale*35 | Changes in sexual relationship |
| Sexual Quality of Life – Female (SQol-F)36 | Quality of life in women with female sexual dysfunction |
| Golombok Rust Inventory of Sexual Satisfaction (GRISS)37 | Quality of sexual relationship |
| Decreased Sexual Desire Screener38 | Brief diagnostic tool for hypoactive sexual desire disorder |
| * Validated in pregnant and/or postpartum women | |
Women’s sexual health during the postpartum period has generally been under-researched. It wasn’t until the past decade that validated sexual function questionnaires were utilized. Although a number of these instruments are now available (TABLE 1, TABLE 2, FIGURE), it remains unclear whether they can accurately measure postpartum sexual function. Despite these limitations, significant information has been elicited that can be used to counsel patients struggling with postpartum sexual concerns.
TABLE 2
The 6-item Female Sexual Function Index*
| Question | Responses | |||||
|---|---|---|---|---|---|---|
| 0 points | 5 points | 4 points | 3 points | 2 points | 1 point | |
| How would you rate your level of sexual desire or interest? | No sexual activity | Very high | High | Moderate | Low | Very low or none at all |
| How would you rate your level of sexual arousal (“turn on”) during sexual activity or intercourse? | No sexual activity | Very high | High | Moderate | Low | Very low or none at all |
| How often did you become lubricated (“wet”) during sexual activity or intercourse? | No sexual activity | Almost always or always | Most times | Sometimes | A few times | Almost never or never |
| When you had sexual stimulation or intercourse, how often did you reach orgasm? | No sexual activity | Almost always or always | Most times | Sometimes | A few times | Almost never or never |
| How satisfied have you been overall with your sexual life? | No sexual activity | Very satisfied | Moderately satisfied | About equally satisfied and dissatisfied | Moderately dissatisfied | Very dissatisfied |
| How often did you experience discomfort or pain during vaginal penetration? | Did not attempt intercourse | Almost never or never | A few times | Sometimes | Most times | Almost always or always |
| *The components of this index are to be assessed over the past 4 weeks. The score is the sum of the ordinal responses to the 6 items and ranges from 2 to 30. A score of less than 19 indicates a need for further investigation, including the full-length Female Sexual Function Index. Source: Adapted from Isidori et al.31 | ||||||
Ideal period of abstinence is unknown
Although our knowledge of the female genital tract in the puerperium is based upon histologic evidence, there are no evidence-based policies to outline the ideal period of postpartum coital abstinence. It seems reasonable to assume that our traditional scientific recommendations developed in part to prevent uterine infection and disruption of sutured wounds. These concerns, combined with cultural and societal norms, have led to the routine discouragement of sexual activity until 4 to 6 weeks postpartum.
The possibility of shortening the period of postpartum abstinence was first suggested by the American College of Obstetricians and Gynecologists (ACOG) in 1984.1 In 1985, Pritchard and colleagues wrote about the individualization of postpartum prohibitions of sexual activity in Williams Obstetrics.1 The earliest time at which intercourse may be safely resumed is unknown, but the 23rd edition of Williams Obstetrics states that a woman can resume sexual intercourse as early as 2 weeks, based on her comfort and desire.3 The sixth edition of the American Academy of Pediatrics (AAP) and ACOG guidelines for perinatal care also states that the risks ought to be minimal at 2 weeks postpartum.4
BRIEF SEXUAL SYMPTOMS CHECKLIST FOR WOMEN (BSSC-W)
Reprinted from Hatzichristou et al. 33
Low desire is not unusual
Although a patient may be granted “permission” to engage in coital activity, other variables influence her decision. It is well known that sexual desire may fluctuate during pregnancy and typically decreases significantly during the third trimester.2 Many women enter the postpartum period with lower levels of sexual desire and satisfaction, and these depressed levels may continue for some time.2 Twenty-five percent of women report worsened sexual function, including diminished sexual satisfaction, during pregnancy that persists for 6 to 12 months postpartum.5 By 12 weeks postpartum, 80% to 93% of women have resumed intercourse, but as many as 83% report sexual problems during the first 3 months of the postpartum period. At 6 months, 18% to 30% of these women may still be experiencing sexual problems, including dyspareunia.5,6
In 1998, von Sydow performed a meta-content analysis of all existing studies on parental sexuality during pregnancy and the first 6 months postpartum.7 Using psychological and medical data banks, she brought together information from two branches of science and identified 59 relevant studies in English or German between 1950 and 1996. Although the majority of studies were retrospective and failed to utilize a validated instrument, von Sydow determined that, overall, sexual interest and activity were low or nonexistent during the first months after delivery. There was high variability between individuals, however, and levels of sexual interest and activity of individual women remained relatively constant from the time before pregnancy until 1 year postpartum.7 von Sydow determined that there is great variability in female sexuality during pregnancy and postpartum; this variability may represent fluctuations during this phase of life. She also determined that severe psychosexual and marital problems are much more prevalent in the postpartum period than during pregnancy and persist long after a physical cause can be used as an explanation.7
Fatigue and quality of the relationship have an impact on sexual function
De Judicibus and colleagues identified a broad range of variables that have a detrimental impact on sexuality at 12 weeks postpartum, most particularly:
- marital dissatisfaction
- dyspareunia
- fatigue
- depression
- breastfeeding.2
There is evidence to suggest that the addition of the first child reduces marital quality after the first month postpartum, and this decline in marital satisfaction continues for 6 to 18 months postpartum.2 Witting and coworkers suggested that this decline may represent a transitional phase of parenthood for some couples; data support the positive effects on overall marital satisfaction with the addition of children.8 Women who were more satisfied with their relationships reported higher sexual satisfaction and greater frequency of intercourse.2,8
Fatigue is one of the most common problems women experience during pregnancy and postpartum and is a common reason given for loss of sexual desire and interest, infrequent sexual activity, and lack of enjoyment.5 A high level of exhaustion is found during the first 8 weeks postpartum. Although it declines over the next 6 months, it does not appear to resolve completely in a good number of women.9
Don’t underestimate the impact of obstetric morbidity
Surprisingly, the long-term impact of severe obstetric events on postpartum maternal health is often overlooked. Waterstone and colleagues found that women who have severe obstetric morbidity, such as massive hemorrhage, preeclampsia, sepsis, and uterine rupture, experience significant changes in sexual health and well-being.10 They conducted a prospective cohort study of such women, measuring sexual activity, general health, and postpartum depression. They utilized two validated postnatal questionnaires—the Short Form 36 (SF-36) to measure general health and the EPDS. Women who had uncomplicated pregnancies and childbirth tended to perform well in most SF-36 categories, whereas women who had experienced severe morbidity scored worse in almost every category. These women also reported problems with intercourse. Thirteen percent of women had not resumed sexual relations by 6 to 12 months postpartum; of these women, more than half reported a fear of conceiving as a reason.
The female body undergoes dramatic physiologic, anatomic, and psychological changes immediately following delivery and throughout the restoration of its pre-pregnant state. This fourth trimester usually lasts 6 to 12 weeks.39
Uterus. The uterus undergoes rapid involution after separation of the placenta. By 2 to 4 weeks postpartum, it may no longer be palpable abdominally, and by 6 weeks, it usually has returned to its nonpregnant state and size. Seven to 14 days after delivery, a woman often experiences an episode of heavier vaginal bleeding that corresponds with the sloughing of the placental bed eschar. During this time of involution, myometrial vessels may be 5 mm or larger in diameter.40
Lochia. The postpartum lochia begins to change within days of birth, transitioning through its stages of lochia rubra, serosa, and alba. It decreases by 3 weeks postpartum and is likely completely resolved by 6 weeks.
Prolactin is responsible for lactogenesis. When the prolactin level is maintained through breastfeeding, it depresses ovarian production of estrogen by suppressing pituitary gonadotropin secretion, triggering a period of “steroid starvation” after the loss of estrogen and progesterone production from the placenta.1
Vagina. Early in the postpartum period, the vagina is typically edematous and lax and, as a result of parturition, there may be not only a spontaneous tear or episiotomy that must heal, but superficial small tears that do not require suturing. Ruggae begin to reappear by 3 weeks, and the vaginal epithelium will begin to mature under the influence of estrogen production. Much of this tissue damage is healed by 6 weeks postpartum.
The perception of pregnant and postpartum women’s sexuality varies, based on religious and cultural norms. In some religions and cultures, sexual activity is forbidden for 2 to 3 months postpartum; in others, it is prohibited until the child is weaned from the breast. The postpartum woman and lochia have traditionally been perceived as unclean, and many religions have specific proscriptions regarding the management of this time in a woman’s life.1 Although early cultures did not study these issues specifically, their doctrines suggest that they had some awareness of the natural physiologic transition of a woman’s body after she has given birth.
Exploring the role of body image
Paul and coworkers prospectively assessed female sexual function, body image, and pelvic symptoms from the first trimester until 6 months postpartum.11 They utilized the validated questionnaire instruments of the Female Sexual Function Index (FSFI), the Body Exposure during Sexual Activities Questionnaire (BESAQ), the short forms of the Urogenital Distress Inventory (UDI-6), the Incontinence Impact Questionnaire (IIQ-7), and the Fecal Incontinence Quality of Life Scale (FIQOL). They found that sexual activity and sexual function scores were highest before pregnancy, declined between the first and third trimesters, and did not return to pre-pregnancy baselines even by 6 months postpartum.11
Differences in sexual practices contributed to these patterns. Kissing, fondling, and vaginal intercourse remained stable across pregnancy, whereas oral sex, breast stimulation, and masturbation declined in the third trimester.
The decline of these activities during pregnancy and postpartum has been seen in other studies as well.12
Obstacles to sexual activity also changed across pregnancy and the postpartum period. Vaginal pain was more problematic in the third trimester and postpartum, whereas feelings of unattractiveness and issues of body image were present throughout pregnancy and at their worst in the postpartum period. Sexual function scores based on the FSFI declined during pregnancy and did not return to pre-pregnancy or first-trimester levels by 6 months postpartum. Urinary symptoms, as measured by the UDI-6, were associated with lower sexual function scores during the postpartum period. The association between urinary incontinence and sexual dysfunction has been seen in other studies.13,14
The enduring effects of perineal trauma
Childbirth may physically affect a woman’s sexual function through perineal trauma, pudendal neuropathy, and vaginal dryness associated with breastfeeding. There is an obvious connection between perineal laceration and perineal pain and problems with intercourse.5 Overall, dyspareunia is reported by 41% to 67% of women 2 to 3 months after delivery.15 Women who have an episiotomy complain of increased perineal pain and delayed return of sexual activity, compared with women who deliver with an intact perineum.16
Persistent dyspareunia is strongly associated with the severity of perineal trauma and operative vaginal delivery.3,17 Multiple studies have investigated this association and found a positive correlation 3 to 6 months postpartum,6,9,17 but the long-term effects and association remain unclear.18
Findings from research. Rogers and colleagues prospectively studied the effect of perineal trauma on postpartum sexual function in a midwifery population of women who had a low rate of episiotomy and operative vaginal delivery.6 They utilized the Intimate Relationship Scale (IRS), a validated questionnaire to measure postpartum sexual function in couples. Most women in this study had resumed sexual activity by 3 months postpartum and did not have postpartum inactivity or dysfunction, based on their IRS scores. However, women who were identified as having experienced major trauma (second-, third-, or fourth-degree laceration or a repaired first-degree laceration) had significantly less desire to engage in activities such as touching and stroking with their partner.6
Present-day limits on the routine use of episiotomy and operative vaginal delivery have yielded a lower rate of third- and fourth-degree laceration.19 Second-degree lacerations are common and constitute the majority of perineal trauma in births without episiotomy.20 There is evidence that the use of synthetic absorbable suture, such as polyglactin, rather than chromic suture, results in less postpartum perineal pain, as does leaving the well-approximated perineal skin edges unsutured.20
Signorello and coworkers found that second-, third-, and fourth-degree lacerations increased the risk of postpartum dyspareunia; operative vaginal delivery (forceps or vacuum) was also an independent risk factor for dyspareunia.21
The impact of route of delivery
Some researchers have concluded that the route of delivery has an impact on the long-term pelvic floor health of women.18 In 1986, Snooks and colleagues analyzed possible obstetric risk factors for damage to the innervation of the pelvic floor, which can lead to both stress urinary and anorectal incontinence.22 They found that the process of vaginal delivery causes a compression and stretch type of injury to the pudendal nerve, as well as the possibility of severe perineal lacerations. This injury may be less likely to occur when cesarean delivery is performed before labor, avoiding direct perineal trauma and possible pudendal neuropathy.15 Because the pudendal nerve mediates some of the reflex pathways in the female sexual response, it is plausible that damage to it could result in sexual dysfunction.
Women who deliver vaginally have a higher rate of fecal and urinary incontinence than women who deliver by cesarean.16,23 The presence of incontinence, however, does not always have a significant long-term effect on one’s sexual life.6
In the Term Breech Trial, the route of delivery had no impact on the resumption of intercourse, dyspareunia, or sexual satisfaction.23 Although the trial was randomized and controlled, it had many limitations that call its generalizability into question in regard to postpartum sexual dysfunction.
The National Institutes of Health (NIH) State-of-the-Science Conference on Cesarean Delivery on Maternal Request indicated that, by 6 months postpartum, there is no difference in sexual function based on the route of delivery.24 However, Lydon-Rochelle and colleagues used the SF-36 to assess reported general health status and found that women who had cesarean delivery or assisted vaginal delivery exhibited significantly poorer postpartum functional status than women who had spontaneous vaginal delivery in five areas at 7 weeks postpartum: physical functioning, mental health, general health perception, bodily pain, social functioning, and ability to perform daily activities.25 Women were more likely to be readmitted to the hospital and more likely to report fatigue during the first 2 months after cesarean delivery.9 It appears that women who undergo cesarean delivery have an elevated risk of nondyspareunia-related causes of sexual dysfunction. Any protective effect of cesarean on sexual function is limited to the early postnatal period and is related to the absence of perineal injury.18
How breastfeeding can affect sexual desire
Evidence is strong that breastfeeding reduces a woman’s sexual desire and the frequency of intercourse.1,5 A high level of prolactin suppresses ovarian production of estrogen, thereby reducing vaginal lubrication. Some women and their partner may identify this loss of lubrication as a lack of arousal. This type of vaginal dryness should be explained, and the use of a lubricant should be encouraged in breastfeeding women.
Nipple sensitivity may develop, making touching and foreplay uncomfortable in some women. One third to one half of mothers find breastfeeding to be an erotic experience, and one fourth feel guilty about this sexual excitement; others stop nursing or wean early due to these feelings.1,7 Women are often not educated about the relationship between the release of oxytocin, uterine contractions, milk ejection, sexual arousal, and orgasm; raising the subject can help to diminish any potential distress over this response.
Sleep disturbances from feeding on demand contribute to fatigue and exhaustion.
Many women may not realize that their loss of interest in sex may be because they are receiving sufficient physical contact or touching through their nurturing interactions with the baby. This may leave the partner feeling isolated and envious of the mother-baby relationship.
Couples should be encouraged to discuss these feelings to avoid misperceptions and to maintain the relationship dyad as a priority to prevent the development of relationship problems.
The majority of women will discuss contraception with a health provider, but only 15% will voluntarily discuss their sexual needs or dysfunction.17 This finding is alarming given that, during the postpartum period, two of every three new mothers will experience at least one problem related to sexual function, including dyspareunia, decreased libido, difficulty achieving orgasm, and vaginal dryness.41 This lack of discussion with a health-care provider may be the result of several variables: incomplete knowledge on the part of the provider about what affects sexual function, poor training in the taking of an effective sexual history, and uneasiness on the part of the patient about discussing the issue.5,42
Postnatal depression takes a toll
Depressed mood and emotional lability in the postpartum period are negatively associated with sexual interest, enjoyment, coital activity, and perceived tenderness of the partner.7 Conversely, reduced sexual interest, desire and satisfaction; a lower frequency of intercourse; and later resumption of intercourse are associated with a higher number of psychiatric symptoms in the postpartum period.2 Between 10% and 15% of women experience postpartum depression (PPD).26 Depression has been associated with a decreased frequency and interest in sexual activity at 8 to 12 weeks postpartum.2,5
Chivers and colleagues assessed sexual functioning and sexual behavior in women with and without symptoms of PPD using the FSFI and EPDS. Although theirs was a small study, they found that women who had depressive symptoms also reported poorer functioning in regard to sexual arousal, orgasm, pain, lubrication, and sexual satisfaction.26 Morof and coworkers found that women who had PPD were less likely to have resumed intercourse by 6 months postpartum; they were also less likely to engage in other sexual activities.27
Role of pharmacotherapy
Many women are started on antidepressant medication near the time of delivery or during the immediate postpartum period. Often, serotonin reuptake inhibitors (SRIs) are used because there is minimal transmission of this class of medication through breast milk. However, the potential sexual side effects of these medications should be discussed because they are the agents most commonly associated with female sexual dysfunction.28
For clinicians
American Association of Sex Educators, Counselors, and Therapists – A not-for-profit, interdisciplinary professional organization comprising sexuality educators, sexuality counselors, sex therapists, physicians, social workers, and other clinicians. Its home page links to a referral page and other resources. http://www.aasect.org" target="_blank">http://www.aasect.org
Association of Reproductive Health Professionals offers a resource for clinicians on postpartum counseling about sexuality. http://www.arhp.org/publications-and-resources/quick-reference-guide-for-clinicians/postpartum-counseling/contraception" target="_blank">http://www.arhp.org/publications-and-resources/quick-reference-guide-for-clinicians/postpartum-counseling/contraception
For patients
Mayo Clinic provides a fact sheet entitled “Sex after pregnancy: Set your own timeline.” http://www.mayoclinic.com/health/sex-after-pregnancy/PR00146" target="_blank">http://www.mayoclinic.com/health/sex-after-pregnancy/PR00146
Sex and a Healthier You – This site offers information for patients on sexuality and relationships. http://www.sexandahealthieryou.org/sex-health/index.html" target="_blank">http://www.sexandahealthieryou.org/sex-health/index.html
We want to hear from you! Tell us what you think.
1. Reamy KJ, White SE. Sexuality in the puerperium: a review. Arch Sex Behav. 1987;16(2):165-186.
2. De Judicibus MA, McCabe MP. Psychological factors and the sexuality of pregnant and postpartum women. J Sex Res. 2002;39(2):94-103.
3. The puerperium. In: Cunningham FG Leveno KJ, Bloom SL, Hauth JC, Rouse DJ, Spong CY, eds. Williams Obstetrics. 23rd ed. New York, NY: McGraw-Hill Co.; 2010:646-660.
4. The American Academy of Pediatrics (AAP), American College of Obstetricians Gynecologists (ACOG) Guidelines for perinatal care. 6th ed. Washington DC: AAP, ACOG; 2008.
5. Glazener CM. Sexual function after childbirth: women’s experiences persistent morbidity and lack of professional recognition. Br J Obstet Gynaecol. 1997;104(3):330-335.
6. Rogers RG, Borders, N,, Leeman L, Albers L. Does spontaneous genital tract trauma impact postpartum sexual function? J Midwifery Womens Health. 2009;54(2):98-103.
7. von Sydow K. Sexuality during pregnancy and after childbirth: a metacontent analysis of 59 studies. J Psychosom Res. 1999;47(1):27-49.
8. Witting K, Santtila P, Alanko K, et al. Female sexual function and its associations with number of children, pregnancy, and relationship satisfaction. J Sex Marital Ther. 2008;34(2):89-106.
9. Thompson JF, Roberts CL, Currie M, Elwood DA. Prevalence and persistence of health problems after childbirth: associations with parity and method of birth. Birth. 2002;29(2):83-94.
10. Waterstone M, Wolfe C, Hooper R, Bewley S. Postnatal morbidity after childbirth and severe obstetric morbidity. BJOG. 2003;110(2):128-133.
11. Pauls RN, Occhino JA, Dryfhout VL. Effects of pregnancy on female sexual function and body image: A prospective study. J Sex Med. 2008;5(8):1915-1922.
12. von Sydow K, Ullmeyer M, Happ N. Sexual activity during pregnancy and after childbirth: Results from the Sexual P Questionnaire. J Psychosom Obstet Gynaecol. 2001;22(1):29-40.
13. Uebersax JS, Wyman JF, Shumaker SA, McClish DK, Fantl JA. Short forms to assess life quality and symptom distress for urinary incontinence in women: The Incontinence Impact Questionnaire and the Urogenital Distress Inventory. Continence Program for Women Rsearch Group. Neurourol Urodyn. 1995;14(2):131-139.
14. Barber MD, Visco AG, Wyman JF, Fantl JA, Bump RC; Continence Program for Women Research Group. Sexual function in women with urinary incontinence and pelvic organ prolapse. Obstet Gynecol. 2002;99(2):281-289.
15. Handa VL. Sexual function and childbirth. Semin Perinatol. 2006;30(5):253-256.
16. Klein MC, Gauthier RJ, Robbins JM, et al. Relationship of episiotomy to perineal trauma and morbidity, sexual dysfunction, and pelvic floor relaxation. Am J Obstet Gynecol. 1994;171(3):591-598.
17. Barrett G, Pendry E, Peacock J, Victor C, Thakar, Manyonda I. Women’s sexual health after childbirth. BJOG. 2000;107(2):186-195.
18. Barrett G, Peacock J, Victor CR, Manyonda I. Cesarean section and postnatal sexual health. Birth. 2005;32(4):306-311.
19. Eason E, Labrecque M, Wells G, Feldman P. Preventing perineal trauma during childbirth: a systematic review. Obstet Gynecol. 2000;95(3):464-471.
20. Leeman LM, Rogers RG, Greulich B, Albers LL. Do unsutured second-degree perineal lacerations affect postpartum functional outcomes? J Am Board Fam Med. 2007;20(5):451-457.
21. Signorello L, Harlow BL, Chekos AK, Repke JT. Postpartum sexual functioning and its relationship to perineal trauma: A retrospective cohort study of primiparous women. Am J Obstet Gynecol. 2001;184(5):881-890.
22. Snooks SJ, Swash M, Henry MW, Setchell M. Risk factors in childbirth causing damage to the pelvic floor innervation. In J Colorect Dis. 1986;1(1):20-24.
23. Hannah ME, Whyte H, Hannah WJ, et al. Term Breech Trial Collaborative Group. Maternal outcomes at 2 years after planned cesarean section versus planned vaginal birth for breech presentation at term: the international randomized Term Breech Trial. Am J Obstet Gynecol. 2004;191(3):917-927.
24. NIH State-of-the-Science Conference Statement on Cesarean Delivery on Maternal Request NIH Consens Sci Statements. 2006;23:1-29.http://consensus.nih.gov/2006/cesareanstatement.htm. Accessed December 6 2011.
25. Lydon-Rochelle MT, Holt VL, Martin DP. Delivery method and self-reported postpartum general health status among primiparous women. Paediatr Perinat Epidemiol. 2001;15(3):232-240.
26. Chivers ML, Pittini MD, Grigoriadis S, Villegas L, Ross LE. The relationship between sexual functioning and depressive symptomatology in postpartum women: a pilot study. J Sex Med. 2011;8(3):792-799.
27. Morof D, Barrett G, Peacock J, Victor CR, Manyonda I. Postnatal depression and sexual health after childbirth. Obstet Gynecol. 2003;102(6):1318-1325.
28. American College of Obstetricians and Gynecologists Committee on Practice Bulletins-Gynecology. ACOG Practice Bulletin No.119: Female sexual dysfunction. Obstet Gynecol. 2011;117(4):996-1007.
29. Read J. Sexual problems associated with infertility pregnancy and ageing. BMJ. 2004;329(7465):559-561.
30. Rosen R, Brown C, Heiman J, et al. The Female Sexual Function Index (FSFI): a multidimensional self-report instrument for the assessment of female sexual function. J Sex Marital Ther. 2000;26:191-208.
31. Isidori AM, Pozza C, Esposito K, et al. The Female Sexual Function Index (FSFI): Development and validation of a 6-item version of the female sexual function index (FSFI) as a diagnostic tool for female sexual dysfunction. J Sex Med. 2010;7(3):1139-11.
32. McCoy NL. The McCoy Female Sexuality Questionnaire. Quality Life Res. 2000;9(suppl 6):739-745.
33. Hatzichristou D, Rosen RC, Derogatis LR, et al. Recommendations for the clinical evaluation of men and women with sexual dysfunction. J Sex Med. 2010;7(1 Pt 1):337-348.
34. DeRogatis LR, Allgood A, Rosen RC, Leiblum S, Zipfel L, Guo CY. Development and evaluation of the Women’s Sexual Interest Diagnostic Interview (WSID): a structured interview to diagnose hypoactive sexual desire disorder (HSDD) in standardized patients. J Sex Med. 2008;5(12):2827-2841.
35. Fischman SH, Rankin EA, Soeken KL, Lenz ER. Changes in sexual relationships in postpartum couples. J Obstet Gynecol Neonatal Nurs. 1986;15(1):58-63.
36. Sillis T, Wunderlich G, Pyke R, et al. The Sexual Interest and Desire Inventory-Female (SIDI-F): item response analyses of data from women diagnosed with hypoactive sexual desire disorder. J Sex Med. 2005;2(6):801-818.
37. Rust J, Golombok S. The Golombok-Rust Inventory of Sexual Satisfaction (GRISS). Br J Clin Psych. 1985;24(Pt 1):63-64.
38. Clayton AH, Balon R. The impact of mental illness and psychotropic medications on sexual functioning: the evidence and management. J Sex Med. 2009;6(5):1200-1213.
39. Jennings B, Edmundson M. The postpartum period: after confinement: the fourth trimester. Clin Obstet Gynecol. 1980;23(4):1093-1103.
40. Oppenheimer LS, Sheriff EA, Goodman JDS, shah D, James CE. The duration of lochia. Br J Obstet Gynaecol. 1986;93(7):754-757.
41. Connolly A, Thorp J, Pahel L. Effects of pregnancy and childbirth on postpartum sexual function: a longitudinal prospective study. Int Urogynecol J Pelvic Floor Dysfunct. 2005;16(4):263-267.
42. Pancholy AB, Goldenhar L, Fellner AN, Crisp C, Kleeman S, Pauls R. Resident education and training in female sexuality: results of a national survey. J Sex Med. 2011;8(2):361-366.
Clostridium difficile Infection
Clostridium difficile, a causative pathogen in antibiotic-associated colitis,1 is a slow-growing, spore-forming, gram-positive anaerobic bacillus,2 named difficile because it was so difficult to culture. Although this pathogenic spore was first identified in the 1930s,3 its vegetative, toxin-producing form was not recognized as a causative organism in diarrhea and colitis until the late 1970s.4,5 Since that time, C difficile has become a growing challenge to health care providers for accurate diagnosis, treatment, and containment of the spread of disease. C difficile infection (CDI) often takes a virulent course with associated morbidity, mortality, and health care costs.6
EPIDEMIOLOGY
In healthy adult patient populations, 2% to 3% are colonized with C difficile.2 The colonization rate among healthy infants is significantly higher, between 60% and 70%, but clinical infection is uncommon.7 As the colon becomes populated with flora, between ages 18 and 24 months, the carrier state disappears.8
In the hospital setting, 20% to 30% of patients become colonized with the organism by the fecal-oral route, which is facilitated when antibiotic therapy disrupts normal flora in the gut, enabling C difficile spores to proliferate; most patients are asymptomatic.5 In 2005, in US acute care hospitals, the incidence of CDI was reported at 84 cases per 100,000 patients.9C difficile remains the leading pathogen associated with inpatient antibiotic-associated diarrhea (AAD). It can be identified as the causative organism in 15% to 25% of cases of AAD in hospitalized patients.2
The mortality rate among hospitalized patients rises significantly in those identified with C difficile: 20.6%, compared with 7.0% of matched inpatient controls.10 ICU admission poses a significant burden of disease: The overall incidence of infection in the ICU population is about 4%. ICU patients who contract CDI have up to a 20% rate of fulminant colitis, a severe form of the disease often necessitating surgery. In this segment of the inpatient population, the mortality rate can approach 60%.8
Data analyzed by Zilberberg11 have demonstrated a significant increase in C difficile–associated infections in US hospitals in recent years. In 2001, the number of discharged patients with documented CDI was approximately 134,000, compared with 291,000 in 2005. The rising incidence of CDI has been attributed to increased antibiotic use, aging of the population, an increasing rate of comorbid conditions, fluoroquinolone resistance, and increased suspicion for the illness, which has led to increased use of testing.12,13
Of Significant Concern
Recurrent disease poses a particular challenge to the health care system. It has been reported that recurrence rates for CDI are between 15% and 35% after a first bout and between 33% and 65% after subsequent episodes of infection.2,14
A hypervirulent strain, the North American pulsed-field gel electrophoresis type 1 (NAP1/B1/027) has been implicated in several C difficile outbreaks.15 This subtype, which is especially resistant to fluoroquinolones,1 produces toxins earlier and in much greater quantities, including toxins A and B at levels 15 to 20 times greater than those seen in less virulent subtypes.4,12 Thus, the NAP1 strain is implicated in more severe disease and is more lethal.16 Affected patients have a 30-day mortality rate twice as high as that among patients with other strains of C difficile.12
The calculated cost of CDI adds between $2,454 and $7,179 in nonreimbursable costs per hospitalized patient, and an additional 3.6 to 7.0 days to their hospital stays.17 Estimates for CDI treatment in the US range from $436 million to $3 billion per year.6,17
Community-Acquired CDI
Community-acquired C difficile infection (CA-CDI) is a subtype that develops in patients who have not been hospitalized in the previous year,18 with incidence recently reported at 11.16 cases per 100,000 person-years.19 Affected patients tend to be younger than those with hospital-acquired infection and to have a less severe disease course. To meet the criteria of this subgroup, according to recent clinical practice guidelines jointly issued by the Society for Healthcare Epidemiology of America and the Infectious Diseases Society of America (SHEA-IDSA),1 a patient may have developed symptoms no sooner than 12 weeks after hospital discharge (if any hospitalization occurred).
It is always important to perform a thorough history in patients with suspected CA-CDI to assess for recent hospitalizations and antibiotic use. In a retrospective study published in 2011, Kuntz et al19 found that CA-CDI–affected patients were six times as likely as healthy controls to have taken antimicrobials within 180 days before illness (including beta-lactam/beta-lactamase inhibitors, cephalosporins, clindamycin, fluoroquinolones, and penicillin) and twice as likely to have used gastric acid suppressants in that time.
One emerging theory is that CA-CDI is spread through food-borne illness. Unlike the vegetative form that resides in the bowel, C difficile spores are resistant to temperatures at which food is cooked (as they are to alcohol and many other disinfectant agents).5 Several studies have shown that livestock can harbor C difficile.12
PATHOPHYSIOLOGY
Normal gastrointestinal flora resist colonization and proliferation of C difficile; colonization of nontoxigenic strains appears to be protective against toxigenic strains.1 Alteration in the colonic bacterial environment, including the suppression of normal flora proliferation that can occur when a patient receives antibiotics or antineoplastic agents, is thought to allow the overgrowth of C difficile.2
Only C difficile strains that produce exotoxins (the enterotoxin toxin A, and the cytotoxin toxin B) are pathogenic. The organism produces a variety of adhesion proteins (with production accelerated by the presence of antibiotics, such as ampicillin and clindamycin), leading the toxins to bind to specific receptors in the intestinal mucosal cells. C difficile also produces proteases that trigger degradation of the intestinal extracellular matrix and disruption of epithelial cell signaling.16 The toxins activate proinflammatory cytokines, including interleukin (IL)-1, tumor necrosis factor (TNF)-, and IL-8. The result is an intestinal inflammatory response that is clinically apparent in the form of diarrhea and pseudomembranous colitis (PMC).20
RISK FACTORS
Among several known risk factors for CDI (see Table 11,2,4,18,21-24), perhaps the most widely recognized is the use of nearly any antimicrobial agent. Previous administration of antibiotics has been documented in about 95% of inpatients with CDI. Broad-spectrum antibiotics with anti-anaerobic coverage appear to pose the greatest risk.1,4 These include clindamycin, along with cephalosporins, fluoroquinolones, and beta-lactams.1,13 Fluoroquinolone use has been implicated in the development of the NAP1 subtype of the disease.25 In patients who receive multiple antibiotics or prolonged courses, an even greater risk for CDI is incurred.4 Even single-dose administration of an antibiotic carries a CDI risk of about 1.5%.21
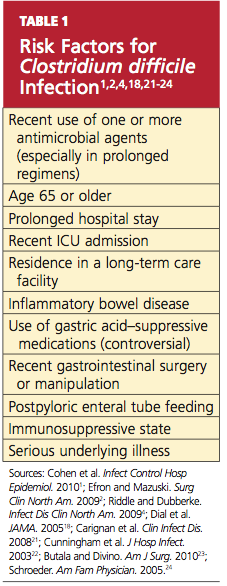
A prolonged hospital stay or residence in a long-term care facility increases the risk for CDI, as does advanced age.1 Patients 65 or older have a 20-fold higher risk for CDI than their younger counterparts.1,2 Patients with inflammatory bowel disease (IBD) have an increased risk for CDI.23
It has been theorized that the use of gastric acid–suppressive medications can increase the risk for CDI to between 2.5 and 2.9 times that among persons who do not take these agents.18,22 Results from other trials have refuted this theory, however.13,26
Additional risk factors include ICU admission, recent gastrointestinal surgery or manipulation, immunosuppression, and serious underlying illnesses.24 Postpyloric enteral tube feeding has also been implicated as a risk factor; this route bypasses the stomach, where a very acidic environment ordinarily helps to kill the organism.4
CLINICAL PRESENTATION
Watery diarrhea, occurring 10 to 15 times in a day, is the most common manifestation of CDI. It may present during administration of an antimicrobial agent or within a few days afterward; rarely, it can develop as long as two months after cessation of such treatment.2 In most studies, median onset of diarrhea is about two days.20 Descriptive characteristics of the stool, including odor and color, may vary. Diarrhea may be accompanied by lower abdominal pain, cramping, low-grade fever, and leukocytosis.
In some patients, particularly those taking narcotics, diarrhea may be absent. This manifestation may signal a more severe disease course, including the possibility of fulminant infection. Endoscopic evaluation of the colon may reveal the classic pseudomembranes (ie, adherent yellow plaques)2; see figure.
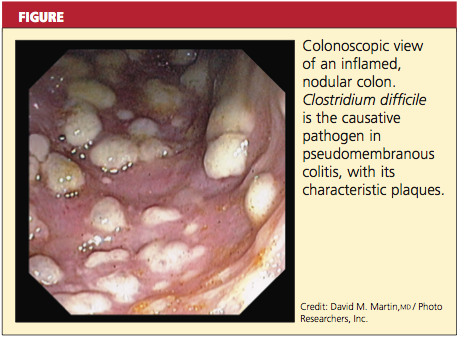
Stratifying Disease Severity
The severity of CDI-associated colitis increases as systemic symptoms worsen and the clinical picture deteriorates.4 In the 2010 SHEA-IDSA guidelines,1 CDI is stratified, both in the initial episode and the first recurrence, as mild-to-moderate, severe, or severe complicated. The following data may be used to appropriately stage disease severity in the initial episode:
• Mild-to-moderate disease is characterized by nonbloody diarrhea (fewer than 10 to 12 bowel movements per day), possibly accompanied by mild, crampy abdominal pain. Typically, affected patients do not exhibit significant systemic symptoms or marked abdominal tenderness. Leukocytosis is usually represented by fewer than 15,000 cells/L, and the serum creatinine level is less than 1.5 times the baseline level.1,2,5,8
• Severe disease, which should always be a consideration in older patients,1 includes profuse, watery diarrhea, significant abdominal pain and distension, fever, nausea and vomiting, and clinical volume depletion. Significant leukocytosis (≥ 15,000 cells/L) and serum creatinine ≥ 1.5 times baseline or leukopenia with possible bandemia may occur.1,27 Occult blood may be present, but frank blood is rare. A history of ICU admission alone increases the classification to severe due to the aforementioned poor outcomes associated with CDI in ICU patients.8,24
• Severe, complicated CDI may involve hypotension, shock, or a paralytic ileus1; a paradoxical decrease or absence of diarrhea may occur.2 At the severe end of the disease spectrum, toxic megacolon can develop and progress to colonic perforation.2,5,8,28 Hypoalbuminemia may be present due to the large protein losses in the course of the disease.28
The Most Severe Manifestations
Fulminant CDI can occur in 3% to 8% of patients with CDI.27,29 Fulminant disease carries a mortality rate between 35% and 80%.23 The patient’s clinical picture may resemble that seen in severe disease, with the addition of an acute abdomen indicating peritonitis; lethargy, hypotension, oliguria (including renal failure), and/or tachycardia due to a severe systemic inflammatory response induced by toxin production from C difficile. Up to 20% of patients with fulminant C difficile do not have diarrhea due to reasons explained previously.2,5,23
Bacteremia occurs rarely in patients with CDI.1,30 Risk factors for this severe condition include failure of medical treatment, leukocytosis exceeding 16,000 cells/L, surgery in the previous 30 days, a history of IBD, and previous administration of IV immunoglobulin.23
DIAGNOSIS
According to recommendations from the SHEA-IDSA expert panel,1 only unformed stool from symptomatic patients should be tested for C difficile or its toxins. In spite of slow turnaround time, stool culture (followed by toxigenic culture to identify a toxigenic isolate) is currently considered standard testing for C difficile. Cell cytotoxin assay has 98% sensitivity and 99% specificity, but turnaround time is 24 to 48 hours,28 potentially delaying treatment for patients who test positive.
Enzyme immunoassay (EIA) testing for C difficile toxin A and toxin B yields results within hours but is not as sensitive as the cell cytotoxin assay.1 Because toxin testing lacks sensitivity, a two-step strategy has been proposed and is called an “interim recommendation” by the SHEA-IDSA guideline authors: EIA testing for glutamate dehydrogenase (GDH), an enzyme produced by C difficile; then, in patients with positive results, confirmation by cell cytotoxin assay or toxigenic culture.1,4,28 (EIA testing for GDH can be a rapid, inexpensive method for ruling out CDI.28)
Polymerase chain reaction testing, recently developed for the detection of pathogenic C difficile, is rapid, sensitive, and specific.1 However, this method has not yet gained wide acceptance due to its relatively high cost.6
Imaging Options
Endoscopic visualization confirming the presence of PMC is also considered diagnostic of CDI; although half of patients with CDI lack this finding on endoscopy, CDI is present in 95% of patients with confirmed PMC.1,28 Colonoscopy is advantageous over sigmoidoscopy because up to one-third of patients have only right-sided colonic involvement.28 To its disadvantage, endoscopy carries a risk for perforation (particularly in patients with fulminant disease), as well as the inherent risks of sedation required to perform the procedure.
Though not specific, CT can be used as an adjunct to the diagnosis; features such as colonic wall thickening, pericolic stranding, ascites, pneumatosis, and free air resulting from perforation may suggest CDI and help determine the extent of disease.4,20 The accordion sign (high-attenuation oral contrast in the colon lumen, alternating with low attenuation of inflamed mucosa) and the double halo sign (IV contrast having varying degrees of attenuation due to submucosal inflammation and hyperemia) have also been reported in patients with CDI and may indicate PMC or fulminant CDI.28
The small intestine is typically not involved in CDI except in the setting of ileus and the rare entity of C difficile enteritis.2 Plain radiography is only helpful in cases of ileus or megacolon.28
PHARMACOLOGIC TREATMENT
Discontinuation of the offending drug (usually an antibiotic), whenever possible, is the first step; up to 25% of CDI patients recover without any further therapies. Limiting management to antibiotic withdrawal, however, is currently recommended only in patients with the mildest form of CDI due to the risk for subsequent fulminant disease and clinical deterioration.14 In patients with suspected severe (but unconfirmed) CDI, empiric treatment with one of the antimicrobial agents listed below may be appropriate5 (see also Table 21,8,14). For patients with confirmed illness who require continued antimicrobial therapy, an agent not associated with CDI may be substituted (eg, sulfamethoxazole, macrolides, aminoglycosides).14

Metronidazole is the first-line agent for mild-to-moderate initial disease.1 The mechanism of action is through DNA disruption and inhibition of nucleic acid synthesis, a process that induces cell death. Metronidazole also appears to have anti-inflammatory, antioxidant, and immunomodulating properties that assist in overcoming the disease. It should not be used in women who are pregnant.8
Dosage of the drug is 250 mg four times per day or 500 mg three times a day, given orally; or parenterally, if the patient cannot take it orally. The duration is 10 to 14 days (or longer in patients with underlying infection),1 and the cost is much lower than that of other appropriate antimicrobial agents (ie, less than $1/day).2,31
In patients with severe or refractory disease, vancomycin should be used. Vancomycin has shown superiority in severe disease compared with metronidazole, with clinical cure rates of 97% and 76%, respectively.1,4,32 The typical oral dosage is 125 mg four times per day for 10 days.1
Vancomycin is effective only when given enterally; the drug is not absorbed by the gastrointestinal tract, allowing it to achieve high concentrations in the colon. In the patient who cannot receive standard enteral therapy, vancomycin can be instilled directly into the colon by enema or colonic catheter. With this route of administration, there is a small risk for iatrogenic perforation.2 There has been advocacy in very severe or fulminant disease to use vancomycin (orally or rectally) combined with IV metronidazole.1,8 The cost for 10 to 14 days of treatment ranges from $1,000 to $1,500.31
Earlier this year, fidaxomicin, a macrocyclic antibiotic, was approved for treatment of CDI in adults. This agent has minimal systemic absorption and works in the intestinal lumen by inhibiting the bacterial RNA polymerase.33 In a randomized, controlled trial involving 629 patients, fidaxomicin’s effectiveness was found comparable to that of vancomycin for treatment of CDI (clinical cure rates in the intention-to-treat analysis, 88.2% vs 85.8%, respectively), and fidaxomicin-treated patients had a lower rate of recurrence after initial use (15.4% vs 25.3%, respectively; patients with fulminant disease were not included).33 Dosage is 200 mg every 12 hours for 10 days,33,34 at a reported cost of $2,800.31
Neither oral bacitracin nor fusidic acid has been shown to eliminate CDI or reduce recurrence.1,5,33
Clinical resolution reveals adequate response to treatment and need not be confirmed by laboratory testing. Asymptomatic carriers do not require treatment.5
Less Conventional Agents
Several nonantibiotic treatment regimens have been proposed for CDI. Use of probiotics has been controversial. In a systematic review, Dendukuri et al35 found insufficient evidence in the routine use of probiotics to prevent or treat CDI. There have even been reports of Saccharomyces boulardii–associated fungemia and lactobacillus-associated bacteremia resulting from probiotics use.36
An anion-exchange resin, cholestyramine, is thought to help bind toxins; when studied, however, it failed to show promising results in improving patients’ clinical course.1,37 Additionally, it can bind to other drugs, such as vancomycin, resulting in decreased pharmacologic efficacy of this and other agents.1,2 Therefore, it is not recommended.
Intravenous immunoglobulin can provide an option for treatment of severe and/or recurrent disease as a last resort.1,38 Thus far, only results from small observational or retrospective studies have supported its use.
SURGICAL OPTIONS
Early surgical consultation is warranted in severe or refractory disease9 and in patients with specific manifestations detected via abdominal/pelvic CT: ileus, perforation, obstruction, thickening of the colonic wall, toxic megacolon, ascites, necrotizing colitis, or a systemic inflammatory response that could lead to multiorgan system failure.14,27 Colectomy is undertaken in 0.4% to 3.5% of patients with CDI,2 with a goal of resecting the involved bowel and diverting the fecal stream. In the past, near-total colectomy was the treatment of choice.2
There have been published reports of successful segmental resection for fulminant CDI.23 The mortality rate is approximately 50% in patients who undergo colectomy.2 Survival rates are noted to improve with early and prompt surgical management of severe disease,8,29 which can be life threatening.14
A recently developed procedure for fulminant disease involves creating a diverting loop ileostomy. Through the ostomy, 8 L of propylene glycol electrolyte solution is instilled to reduce the colonic C difficile count; the patient is also administered a vancomycin enema. In a literature review of recent studies involving patients who underwent the procedure, Olivas et al29 reported a 30-day mortality rate of 19%, and 93% of surviving patients did not require a colectomy. Further investigation to reduce surgical mortality in patients with fulminant disease is ongoing.
INVESTIGATIVE TREATMENT OPTIONS
Fecal transplantation from healthy donors to those infected with pathogenic C difficile via nasogastric tube or enema have been studied.1,39 The theory is to help reconstitute normal colonic flora with the transplanted stool. This treatment option has only very limited data and acceptance.8
Promising research has been published regarding the infusion of combined monoclonal antibodies against toxin A and toxin B. Among 200 patients who were randomized to receive the study therapy or placebo, the rate of recurrence was 7% versus 25%, respectively; recurrence rates among patients infected with the virulent NAP1/B1/027 strain were 8% and 32%, respectively.40 Length of stay did not improve in patients taking monoclonal antibodies, and adverse events were reported in both patient groups.
In preliminary trials, a parenteral vaccine containing inactivated toxins A and B was reported safe and capable of triggering a “vigorous” serum antitoxin A response in healthy adults.9,14
ADDITIONAL MANAGEMENT RECOMMENDATIONS
Medications that slow gastrointestinal motility should not be used, as the slowing of peristalsis may allow toxins to accumulate in the colon, leading to worsening disease.18,22 The use of opiates and anti-diarrheal medications should be limited.24
Aggressive fluid and electrolyte replacement should be administered until diarrhea has been resolved (usually within three to six days). Patients may require vasoactive medications to support hemodynamics.2,5,14,24
Patients with mild disease can eat as they normally would. Those with severe disease, including those who may require surgery, fare best with bowel rest and possibly enteral nutrition.
Monitoring the patient for signs of improvement during the first 24 to 48 hours is an important component of management. The patient’s white blood cell count and temperature, the number and frequency of bowel movements, and the overall clinical picture should be evaluated daily. Patients who show improvement should complete the current regimen.
TREATMENT FAILURE AND RECURRENT CDI
If a patient’s condition does not improve or worsens at any point during therapy for CDI, a change to another antimicrobial agent is warranted. Also, surgical, gastroenterological, and/or infectious disease consult may be needed if no improvement is evident after five days of seemingly appropriate therapy.14,24
Recurrent CDI, which occurs at least once in 6% to 25% of treated patients, is most likely to occur 7 to 14 days after treatment completion.1,14 Seldom caused by resistant strains of C difficile, it is more likely to result from inadequate adherence to treatment, the presence of residual spores in the colon after treatment, or reinfection—although relapse is considered more common than reinfection.14,24 However, since a patient’s symptoms may have other causes, confirmation of recurrence should be sought through laboratory testing.
Recurrent illness is managed in the same way as successful initial therapy, based on the severity of disease; vancomycin is recommended for the first recurrence in a patient with a rising white blood cell count or serum creatinine level. Otherwise, metronidazole use may be considered.1
In patients who experience a second recurrence of confirmed CDI, a tapered or pulsed-dose regimen of oral vancomycin over a six-week period has been advocated1,8,14 (for details, see Table 2).
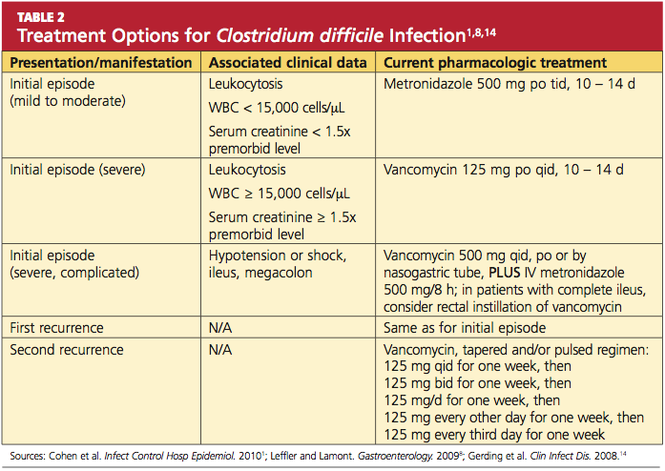
Results from small studies of patients with several recurrences of CDI suggest that oral rifaximin therapy can reduce subsequent recurrences if administered immediately after the conclusion of a course of vancomycin.1,41
PREVENTION OF C DIFFICILE INFECTION
Although “research gaps” exist regarding the optimal strategies to prevent CDI,1 decreased prescribing of nonessential antibiotics is key. Without the alteration in colonic flora caused by antimicrobial use, gut colonization cannot occur, and C difficile typically cannot proliferate.2
Preventing transmission of the pathogen is challenging in health care facilities, where C difficile spores have been cultured from staff members’ hands and from beds, floors, windowsills, and other areas; the spores can survive in hospital rooms for as long as 40 days after a patient with CDI has been discharged.24 Appropriate isolation precautions are essential, including single-patient–use equipment (eg, disposable rectal thermometers) and caregivers’ use of gowns, vinyl gloves, and cleaning agents that are effective against the spores, particularly bleach.1 Alcohol-based products are not effective against C difficile spores; diligent handwashing with soap or chlorhexidine is imperative to prevent the spread of CDI.1,2
CONCLUSION
Clinicians and patients alike face the clinical challenge of Clostridium difficile infection. Mild to moderate disease can be treated medically with excellent success rates. Severe disease carries a significant risk to life, and a multidisciplinary approach including early surgical consultation is warranted.
With early recognition and appropriate treatment, along with strict adherence to isolation policies, the health care community can help limit the spread of this insidious illness and its associated morbidity and mortality.
REFERENCES
1. Cohen SH, Gerding DN, Johnson S, et al. Clinical practice guidelines for Clostridium difficile infection in adults: 2010 update by the Society for Healthcare Epidemiology of America (SHEA) and the Infectious Diseases Society of America (IDSA). Infect Control Hosp Epidemiol. 2010;31(5):431-455.
2. Efron PA, Mazuski JE. Clostridium difficile colitis. Surg Clin North Am. 2009;89(2):483-500.
3. Hall IC, O’Toole E. Intestinal flora in newborn infants with a description of a new pathogenic anaerobe, Bacillus difficilis. Am J Dis Child. 1935;49:390-402.
4. Riddle DJ, Dubberke ER. Clostridium difficile infection in the intensive care unit. Infect Dis Clin North Am. 2009;23(3):727-743.
5. Sunenshine RH, McDonald LC. Clostridium difficile–associated disease: new challenges from an established pathogen. Cleve Clin J Med. 2006; 73(2):187-197.
6. Currie B. Improved testing methods are improving diagnosis of Clostridium difficile infections. Advance Administrators Laboratory. 2009;21:10. http://laboratory-manager.advance web.com/Article/PCR-for-C-diff.aspx. Accessed November 8, 2011.
7. Larson HE, Barclay FE, Honour P, Hill ID. Epidemiology of Clostridium difficile in infants. J Infect Dis. 1982;146(6):727-733.
8. Leffler DA, Lamont JT. Treatment of Clostridium difficile–associated disease. Gastroenterology. 2009;136(6):1899-1912.
9. Kelly CP, Lamont JT. Clostridium difficile: more difficult than ever. N Engl J Med. 2008;359(18): 1932-1940.
10. Pépin J, Valiquette L, Cossette B. Mortality attributed to nosocomial Clostridium difficile–associated disease during an epidemic caused by a hypervirulent strain in Quebec. CMAJ. 2005; 173(9):1037-1042.
11. Zilberberg MD. Clostridium difficile–related hospitalizations among US adults, 2006. Emerg Infect Dis. 2009;15(1):122-124.
12. Khanna S, Pardi DS. The growing incidence and severity of Clostridium difficile infection in the inpatient and outpatient settings. Expert Rev Gastroenterol Hepatol. 2010;4(4):409-416.
13. Pépin J, Saheb N, Coulombe MA, et al. Emergence of fluoroquinolones as the predominant risk factor for Clostridium difficile–associated diarrhea: a cohort study during an epidemic in Quebec. Clin Infect Dis. 2005;41(9):1254-1260.
14. Gerding DN, Muto CA, Owens RC Jr. Treatment of Clostridium difficile infection. Clin Infect Dis. 2008;46 suppl 1:S32-S42.
15. McDonald LC, Killgore GE, Thompson A, et al. An epidemic, toxin gene-variant strain of Clostridium difficile. N Engl J Med. 2005;353(23): 2433-2441.
16. Dawson LF, Valiente E, Wren BW. Clostridium difficile: a continually evolving and problematic pathogen. Infect Genet Evol. 2009;9(6):
1410-1417.
17. Dubberke ER, Reske KA, Olsen MA, et al. Short- and long-term attributable costs of Clostridium difficile–associated disease in nonsurgical patients. Clin Infect Dis. 2008;46(4):497-504.
18. Dial S, Delaney JAC, Barkun An, et al. Use of gastric acid–suppression agents and the risk of community-acquired Clostridium difficile disease. JAMA. 2005;294(23):2989-2995.
19. Kuntz JL, Chrischilles EA, Pendergast JF, et al. Incidence of and risk factors for community-associated Clostridium difficile infection: a nested case-control study. BMC Infect Dis. 2011 Jul 15;11:194.
20. Kelly CP, Lamont JT. Antibiotic-associated diarrhea, pseudomembranous enterocolitis, and Clostridium difficile–associated diarrhea and colitis. In: Feldman M, Friedman LS, Brandt LJ, eds. Sleisenger and Fordtran’s Gastrointestinal and Liver Disease. 9th ed. Philadelphia, PA: WB Saunders; 2010:1889-1902.
21. Carignan A, Allard C, Pépin J, et al. Risk of Clostridium difficile infection after perioperative antibacterial prophylaxis before and during an outbreak of infection due to a hypervirulent strain. Clin Infect Dis. 2008;46(12):1838-1843.
22. Cunningham R, Dale B, Undy B, Gaunt N. Proton pump inhibitors as a risk factor for Clostridium difficile diarrhoea. J Hosp Infect. 2003; 54(3):243-245.
23. Butala P, Divino CM. Surgical aspects of fulminant Clostridium difficile colitis. Am J Surg. 2010;200(1):131-135.
24. Schroeder MS. Clostridium difficile–associated diarrhea. Am Fam Physician. 2005;71(5): 921-928.
25. Deshpande A, Pant C, Jain A, et al. Do fluoroquinolones predispose patients to Clostridium difficile–associated disease? A review of the evidence. Curr Med Res Opin. 2008;24(2):329-333.
26. Lowe DO, Mamdani MM, Kopp A, et al. Proton pump inhibitors and hospitalization for Clostridium difficile–associated disease: a population-based study. Clin Infect Dis. 2006;43(10): 1272-1276.
27. Sailhamer EA, Carson K, Chang Y, et al. Fulminant Clostridium difficile colitis: patterns of care and predictors of mortality. Arch Surg. 2009;144(5):433-439.
28. Bartlett JG, Gerding DN. Clinical recognition and diagnosis of Clostridium difficile. Clin Infect Dis. 2008;46 suppl 1:S12-S18.
29. Olivas AP, Umanskiy K, Zuckerbraun B, Alverdy JC. Avoiding colectomy during surgical management of fulminant Clostridium difficile colitis. Surg Infect. 2010;11(3):299-305.
30. Feldman RJ, Kallich M, Weinstein MP. Bacteremia due to Clostridium difficile: case report and review of extraintestinal C difficile infections. Clin Infect Dis. 1995;20(6):1560-1562.
31. BioPharm Physicians. What next for Dificid (fidaxomicin)? Jun 6, 2011. www.biopharmphysi cians.com/what-next-for-dificid-fidaxomicin. Accessed November 7, 2011.
32. Zar FA, Bakkanagari SR, Moorthi KM, Davis MB. A comparison of vancomycin and metronidazole for the treatment of Clostridium difficile–associated diarrhea, stratified by disease severity. Clin Infect Dis. 2007;45(3):302-307.
33. Louie TJ, Miller MA, Mullane KM, et al; OPT-80-003 Clinical study Group. Fidaxomicin versus vancomycin for Clostridium difficile infection. N Engl J Med. 2011;364(5):422-431.
34. Sullivan KM, Spooner LM. Fidaxomicin: a macrocyclic antibiotic for the management of Clostridium difficile infection. Ann Pharmacother. 2010;44(2):352-359.
35. Dendukuri N, Costa V, McGregor M, Brophy JM. Probiotic therapy for the prevention and treatment of Clostridium difficile–associated diarrhea: a systematic review. CMAJ. 2005;173(2): 167-170.
36. Segarra-Newnham M. Probiotics for Clostridium difficile–associated diarrhea: focus on Lactobacillus rhamnosus GG and Saccharomyces boulardii. Ann Pharmacother. 2007;41(7): 1212-1221.
37. Lagrotteria D, Holmes S, Smieja M, et al. Prospective, randomized inpatient study of oral metronidazole versus oral metronidazole and rifampin for treatment of primary episode of Clostridium difficile–associated diarrhea. Clin Infect Dis. 2006;43(5):547-552.
38. McPherson S, Rees CJ, Ellis R, et al. Intravenous immunoglobulin for the treatment of severe, refractory, and recurrent Clostridium difficile diarrhea. Dis Colon Rectum. 2006;49(5): 640-645.
39. Aas J, Gessert CE, Bakken JS. Recurrent Clostridium difficile colitis: case series involving 18 patients treated with donor stool administered via a nasogastric tube. Clin Infect Dis. 2003; 36(5):580-585.
40. Lowy I, Molrine DC, Leav BA, et al. Treatment with monoclonal antibodies against Clostridium difficile toxins. N Engl J Med. 2010;362(3): 197-205.
41. Johnson S, Schriever C, Galang M, et al. Interruption of recurrent Clostridium difficile–associated diarrhea episodes by serial therapy with vancomycin and rifaximin. Clin Infect Dis. 2007; 44(6):846-848.
Clostridium difficile, a causative pathogen in antibiotic-associated colitis,1 is a slow-growing, spore-forming, gram-positive anaerobic bacillus,2 named difficile because it was so difficult to culture. Although this pathogenic spore was first identified in the 1930s,3 its vegetative, toxin-producing form was not recognized as a causative organism in diarrhea and colitis until the late 1970s.4,5 Since that time, C difficile has become a growing challenge to health care providers for accurate diagnosis, treatment, and containment of the spread of disease. C difficile infection (CDI) often takes a virulent course with associated morbidity, mortality, and health care costs.6
EPIDEMIOLOGY
In healthy adult patient populations, 2% to 3% are colonized with C difficile.2 The colonization rate among healthy infants is significantly higher, between 60% and 70%, but clinical infection is uncommon.7 As the colon becomes populated with flora, between ages 18 and 24 months, the carrier state disappears.8
In the hospital setting, 20% to 30% of patients become colonized with the organism by the fecal-oral route, which is facilitated when antibiotic therapy disrupts normal flora in the gut, enabling C difficile spores to proliferate; most patients are asymptomatic.5 In 2005, in US acute care hospitals, the incidence of CDI was reported at 84 cases per 100,000 patients.9C difficile remains the leading pathogen associated with inpatient antibiotic-associated diarrhea (AAD). It can be identified as the causative organism in 15% to 25% of cases of AAD in hospitalized patients.2
The mortality rate among hospitalized patients rises significantly in those identified with C difficile: 20.6%, compared with 7.0% of matched inpatient controls.10 ICU admission poses a significant burden of disease: The overall incidence of infection in the ICU population is about 4%. ICU patients who contract CDI have up to a 20% rate of fulminant colitis, a severe form of the disease often necessitating surgery. In this segment of the inpatient population, the mortality rate can approach 60%.8
Data analyzed by Zilberberg11 have demonstrated a significant increase in C difficile–associated infections in US hospitals in recent years. In 2001, the number of discharged patients with documented CDI was approximately 134,000, compared with 291,000 in 2005. The rising incidence of CDI has been attributed to increased antibiotic use, aging of the population, an increasing rate of comorbid conditions, fluoroquinolone resistance, and increased suspicion for the illness, which has led to increased use of testing.12,13
Of Significant Concern
Recurrent disease poses a particular challenge to the health care system. It has been reported that recurrence rates for CDI are between 15% and 35% after a first bout and between 33% and 65% after subsequent episodes of infection.2,14
A hypervirulent strain, the North American pulsed-field gel electrophoresis type 1 (NAP1/B1/027) has been implicated in several C difficile outbreaks.15 This subtype, which is especially resistant to fluoroquinolones,1 produces toxins earlier and in much greater quantities, including toxins A and B at levels 15 to 20 times greater than those seen in less virulent subtypes.4,12 Thus, the NAP1 strain is implicated in more severe disease and is more lethal.16 Affected patients have a 30-day mortality rate twice as high as that among patients with other strains of C difficile.12
The calculated cost of CDI adds between $2,454 and $7,179 in nonreimbursable costs per hospitalized patient, and an additional 3.6 to 7.0 days to their hospital stays.17 Estimates for CDI treatment in the US range from $436 million to $3 billion per year.6,17
Community-Acquired CDI
Community-acquired C difficile infection (CA-CDI) is a subtype that develops in patients who have not been hospitalized in the previous year,18 with incidence recently reported at 11.16 cases per 100,000 person-years.19 Affected patients tend to be younger than those with hospital-acquired infection and to have a less severe disease course. To meet the criteria of this subgroup, according to recent clinical practice guidelines jointly issued by the Society for Healthcare Epidemiology of America and the Infectious Diseases Society of America (SHEA-IDSA),1 a patient may have developed symptoms no sooner than 12 weeks after hospital discharge (if any hospitalization occurred).
It is always important to perform a thorough history in patients with suspected CA-CDI to assess for recent hospitalizations and antibiotic use. In a retrospective study published in 2011, Kuntz et al19 found that CA-CDI–affected patients were six times as likely as healthy controls to have taken antimicrobials within 180 days before illness (including beta-lactam/beta-lactamase inhibitors, cephalosporins, clindamycin, fluoroquinolones, and penicillin) and twice as likely to have used gastric acid suppressants in that time.
One emerging theory is that CA-CDI is spread through food-borne illness. Unlike the vegetative form that resides in the bowel, C difficile spores are resistant to temperatures at which food is cooked (as they are to alcohol and many other disinfectant agents).5 Several studies have shown that livestock can harbor C difficile.12
PATHOPHYSIOLOGY
Normal gastrointestinal flora resist colonization and proliferation of C difficile; colonization of nontoxigenic strains appears to be protective against toxigenic strains.1 Alteration in the colonic bacterial environment, including the suppression of normal flora proliferation that can occur when a patient receives antibiotics or antineoplastic agents, is thought to allow the overgrowth of C difficile.2
Only C difficile strains that produce exotoxins (the enterotoxin toxin A, and the cytotoxin toxin B) are pathogenic. The organism produces a variety of adhesion proteins (with production accelerated by the presence of antibiotics, such as ampicillin and clindamycin), leading the toxins to bind to specific receptors in the intestinal mucosal cells. C difficile also produces proteases that trigger degradation of the intestinal extracellular matrix and disruption of epithelial cell signaling.16 The toxins activate proinflammatory cytokines, including interleukin (IL)-1, tumor necrosis factor (TNF)-, and IL-8. The result is an intestinal inflammatory response that is clinically apparent in the form of diarrhea and pseudomembranous colitis (PMC).20
RISK FACTORS
Among several known risk factors for CDI (see Table 11,2,4,18,21-24), perhaps the most widely recognized is the use of nearly any antimicrobial agent. Previous administration of antibiotics has been documented in about 95% of inpatients with CDI. Broad-spectrum antibiotics with anti-anaerobic coverage appear to pose the greatest risk.1,4 These include clindamycin, along with cephalosporins, fluoroquinolones, and beta-lactams.1,13 Fluoroquinolone use has been implicated in the development of the NAP1 subtype of the disease.25 In patients who receive multiple antibiotics or prolonged courses, an even greater risk for CDI is incurred.4 Even single-dose administration of an antibiotic carries a CDI risk of about 1.5%.21
A prolonged hospital stay or residence in a long-term care facility increases the risk for CDI, as does advanced age.1 Patients 65 or older have a 20-fold higher risk for CDI than their younger counterparts.1,2 Patients with inflammatory bowel disease (IBD) have an increased risk for CDI.23
It has been theorized that the use of gastric acid–suppressive medications can increase the risk for CDI to between 2.5 and 2.9 times that among persons who do not take these agents.18,22 Results from other trials have refuted this theory, however.13,26
Additional risk factors include ICU admission, recent gastrointestinal surgery or manipulation, immunosuppression, and serious underlying illnesses.24 Postpyloric enteral tube feeding has also been implicated as a risk factor; this route bypasses the stomach, where a very acidic environment ordinarily helps to kill the organism.4
CLINICAL PRESENTATION
Watery diarrhea, occurring 10 to 15 times in a day, is the most common manifestation of CDI. It may present during administration of an antimicrobial agent or within a few days afterward; rarely, it can develop as long as two months after cessation of such treatment.2 In most studies, median onset of diarrhea is about two days.20 Descriptive characteristics of the stool, including odor and color, may vary. Diarrhea may be accompanied by lower abdominal pain, cramping, low-grade fever, and leukocytosis.
In some patients, particularly those taking narcotics, diarrhea may be absent. This manifestation may signal a more severe disease course, including the possibility of fulminant infection. Endoscopic evaluation of the colon may reveal the classic pseudomembranes (ie, adherent yellow plaques)2; see figure.
Stratifying Disease Severity
The severity of CDI-associated colitis increases as systemic symptoms worsen and the clinical picture deteriorates.4 In the 2010 SHEA-IDSA guidelines,1 CDI is stratified, both in the initial episode and the first recurrence, as mild-to-moderate, severe, or severe complicated. The following data may be used to appropriately stage disease severity in the initial episode:
• Mild-to-moderate disease is characterized by nonbloody diarrhea (fewer than 10 to 12 bowel movements per day), possibly accompanied by mild, crampy abdominal pain. Typically, affected patients do not exhibit significant systemic symptoms or marked abdominal tenderness. Leukocytosis is usually represented by fewer than 15,000 cells/L, and the serum creatinine level is less than 1.5 times the baseline level.1,2,5,8
• Severe disease, which should always be a consideration in older patients,1 includes profuse, watery diarrhea, significant abdominal pain and distension, fever, nausea and vomiting, and clinical volume depletion. Significant leukocytosis (≥ 15,000 cells/L) and serum creatinine ≥ 1.5 times baseline or leukopenia with possible bandemia may occur.1,27 Occult blood may be present, but frank blood is rare. A history of ICU admission alone increases the classification to severe due to the aforementioned poor outcomes associated with CDI in ICU patients.8,24
• Severe, complicated CDI may involve hypotension, shock, or a paralytic ileus1; a paradoxical decrease or absence of diarrhea may occur.2 At the severe end of the disease spectrum, toxic megacolon can develop and progress to colonic perforation.2,5,8,28 Hypoalbuminemia may be present due to the large protein losses in the course of the disease.28
The Most Severe Manifestations
Fulminant CDI can occur in 3% to 8% of patients with CDI.27,29 Fulminant disease carries a mortality rate between 35% and 80%.23 The patient’s clinical picture may resemble that seen in severe disease, with the addition of an acute abdomen indicating peritonitis; lethargy, hypotension, oliguria (including renal failure), and/or tachycardia due to a severe systemic inflammatory response induced by toxin production from C difficile. Up to 20% of patients with fulminant C difficile do not have diarrhea due to reasons explained previously.2,5,23
Bacteremia occurs rarely in patients with CDI.1,30 Risk factors for this severe condition include failure of medical treatment, leukocytosis exceeding 16,000 cells/L, surgery in the previous 30 days, a history of IBD, and previous administration of IV immunoglobulin.23
DIAGNOSIS
According to recommendations from the SHEA-IDSA expert panel,1 only unformed stool from symptomatic patients should be tested for C difficile or its toxins. In spite of slow turnaround time, stool culture (followed by toxigenic culture to identify a toxigenic isolate) is currently considered standard testing for C difficile. Cell cytotoxin assay has 98% sensitivity and 99% specificity, but turnaround time is 24 to 48 hours,28 potentially delaying treatment for patients who test positive.
Enzyme immunoassay (EIA) testing for C difficile toxin A and toxin B yields results within hours but is not as sensitive as the cell cytotoxin assay.1 Because toxin testing lacks sensitivity, a two-step strategy has been proposed and is called an “interim recommendation” by the SHEA-IDSA guideline authors: EIA testing for glutamate dehydrogenase (GDH), an enzyme produced by C difficile; then, in patients with positive results, confirmation by cell cytotoxin assay or toxigenic culture.1,4,28 (EIA testing for GDH can be a rapid, inexpensive method for ruling out CDI.28)
Polymerase chain reaction testing, recently developed for the detection of pathogenic C difficile, is rapid, sensitive, and specific.1 However, this method has not yet gained wide acceptance due to its relatively high cost.6
Imaging Options
Endoscopic visualization confirming the presence of PMC is also considered diagnostic of CDI; although half of patients with CDI lack this finding on endoscopy, CDI is present in 95% of patients with confirmed PMC.1,28 Colonoscopy is advantageous over sigmoidoscopy because up to one-third of patients have only right-sided colonic involvement.28 To its disadvantage, endoscopy carries a risk for perforation (particularly in patients with fulminant disease), as well as the inherent risks of sedation required to perform the procedure.
Though not specific, CT can be used as an adjunct to the diagnosis; features such as colonic wall thickening, pericolic stranding, ascites, pneumatosis, and free air resulting from perforation may suggest CDI and help determine the extent of disease.4,20 The accordion sign (high-attenuation oral contrast in the colon lumen, alternating with low attenuation of inflamed mucosa) and the double halo sign (IV contrast having varying degrees of attenuation due to submucosal inflammation and hyperemia) have also been reported in patients with CDI and may indicate PMC or fulminant CDI.28
The small intestine is typically not involved in CDI except in the setting of ileus and the rare entity of C difficile enteritis.2 Plain radiography is only helpful in cases of ileus or megacolon.28
PHARMACOLOGIC TREATMENT
Discontinuation of the offending drug (usually an antibiotic), whenever possible, is the first step; up to 25% of CDI patients recover without any further therapies. Limiting management to antibiotic withdrawal, however, is currently recommended only in patients with the mildest form of CDI due to the risk for subsequent fulminant disease and clinical deterioration.14 In patients with suspected severe (but unconfirmed) CDI, empiric treatment with one of the antimicrobial agents listed below may be appropriate5 (see also Table 21,8,14). For patients with confirmed illness who require continued antimicrobial therapy, an agent not associated with CDI may be substituted (eg, sulfamethoxazole, macrolides, aminoglycosides).14
Metronidazole is the first-line agent for mild-to-moderate initial disease.1 The mechanism of action is through DNA disruption and inhibition of nucleic acid synthesis, a process that induces cell death. Metronidazole also appears to have anti-inflammatory, antioxidant, and immunomodulating properties that assist in overcoming the disease. It should not be used in women who are pregnant.8
Dosage of the drug is 250 mg four times per day or 500 mg three times a day, given orally; or parenterally, if the patient cannot take it orally. The duration is 10 to 14 days (or longer in patients with underlying infection),1 and the cost is much lower than that of other appropriate antimicrobial agents (ie, less than $1/day).2,31
In patients with severe or refractory disease, vancomycin should be used. Vancomycin has shown superiority in severe disease compared with metronidazole, with clinical cure rates of 97% and 76%, respectively.1,4,32 The typical oral dosage is 125 mg four times per day for 10 days.1
Vancomycin is effective only when given enterally; the drug is not absorbed by the gastrointestinal tract, allowing it to achieve high concentrations in the colon. In the patient who cannot receive standard enteral therapy, vancomycin can be instilled directly into the colon by enema or colonic catheter. With this route of administration, there is a small risk for iatrogenic perforation.2 There has been advocacy in very severe or fulminant disease to use vancomycin (orally or rectally) combined with IV metronidazole.1,8 The cost for 10 to 14 days of treatment ranges from $1,000 to $1,500.31
Earlier this year, fidaxomicin, a macrocyclic antibiotic, was approved for treatment of CDI in adults. This agent has minimal systemic absorption and works in the intestinal lumen by inhibiting the bacterial RNA polymerase.33 In a randomized, controlled trial involving 629 patients, fidaxomicin’s effectiveness was found comparable to that of vancomycin for treatment of CDI (clinical cure rates in the intention-to-treat analysis, 88.2% vs 85.8%, respectively), and fidaxomicin-treated patients had a lower rate of recurrence after initial use (15.4% vs 25.3%, respectively; patients with fulminant disease were not included).33 Dosage is 200 mg every 12 hours for 10 days,33,34 at a reported cost of $2,800.31
Neither oral bacitracin nor fusidic acid has been shown to eliminate CDI or reduce recurrence.1,5,33
Clinical resolution reveals adequate response to treatment and need not be confirmed by laboratory testing. Asymptomatic carriers do not require treatment.5
Less Conventional Agents
Several nonantibiotic treatment regimens have been proposed for CDI. Use of probiotics has been controversial. In a systematic review, Dendukuri et al35 found insufficient evidence in the routine use of probiotics to prevent or treat CDI. There have even been reports of Saccharomyces boulardii–associated fungemia and lactobacillus-associated bacteremia resulting from probiotics use.36
An anion-exchange resin, cholestyramine, is thought to help bind toxins; when studied, however, it failed to show promising results in improving patients’ clinical course.1,37 Additionally, it can bind to other drugs, such as vancomycin, resulting in decreased pharmacologic efficacy of this and other agents.1,2 Therefore, it is not recommended.
Intravenous immunoglobulin can provide an option for treatment of severe and/or recurrent disease as a last resort.1,38 Thus far, only results from small observational or retrospective studies have supported its use.
SURGICAL OPTIONS
Early surgical consultation is warranted in severe or refractory disease9 and in patients with specific manifestations detected via abdominal/pelvic CT: ileus, perforation, obstruction, thickening of the colonic wall, toxic megacolon, ascites, necrotizing colitis, or a systemic inflammatory response that could lead to multiorgan system failure.14,27 Colectomy is undertaken in 0.4% to 3.5% of patients with CDI,2 with a goal of resecting the involved bowel and diverting the fecal stream. In the past, near-total colectomy was the treatment of choice.2
There have been published reports of successful segmental resection for fulminant CDI.23 The mortality rate is approximately 50% in patients who undergo colectomy.2 Survival rates are noted to improve with early and prompt surgical management of severe disease,8,29 which can be life threatening.14
A recently developed procedure for fulminant disease involves creating a diverting loop ileostomy. Through the ostomy, 8 L of propylene glycol electrolyte solution is instilled to reduce the colonic C difficile count; the patient is also administered a vancomycin enema. In a literature review of recent studies involving patients who underwent the procedure, Olivas et al29 reported a 30-day mortality rate of 19%, and 93% of surviving patients did not require a colectomy. Further investigation to reduce surgical mortality in patients with fulminant disease is ongoing.
INVESTIGATIVE TREATMENT OPTIONS
Fecal transplantation from healthy donors to those infected with pathogenic C difficile via nasogastric tube or enema have been studied.1,39 The theory is to help reconstitute normal colonic flora with the transplanted stool. This treatment option has only very limited data and acceptance.8
Promising research has been published regarding the infusion of combined monoclonal antibodies against toxin A and toxin B. Among 200 patients who were randomized to receive the study therapy or placebo, the rate of recurrence was 7% versus 25%, respectively; recurrence rates among patients infected with the virulent NAP1/B1/027 strain were 8% and 32%, respectively.40 Length of stay did not improve in patients taking monoclonal antibodies, and adverse events were reported in both patient groups.
In preliminary trials, a parenteral vaccine containing inactivated toxins A and B was reported safe and capable of triggering a “vigorous” serum antitoxin A response in healthy adults.9,14
ADDITIONAL MANAGEMENT RECOMMENDATIONS
Medications that slow gastrointestinal motility should not be used, as the slowing of peristalsis may allow toxins to accumulate in the colon, leading to worsening disease.18,22 The use of opiates and anti-diarrheal medications should be limited.24
Aggressive fluid and electrolyte replacement should be administered until diarrhea has been resolved (usually within three to six days). Patients may require vasoactive medications to support hemodynamics.2,5,14,24
Patients with mild disease can eat as they normally would. Those with severe disease, including those who may require surgery, fare best with bowel rest and possibly enteral nutrition.
Monitoring the patient for signs of improvement during the first 24 to 48 hours is an important component of management. The patient’s white blood cell count and temperature, the number and frequency of bowel movements, and the overall clinical picture should be evaluated daily. Patients who show improvement should complete the current regimen.
TREATMENT FAILURE AND RECURRENT CDI
If a patient’s condition does not improve or worsens at any point during therapy for CDI, a change to another antimicrobial agent is warranted. Also, surgical, gastroenterological, and/or infectious disease consult may be needed if no improvement is evident after five days of seemingly appropriate therapy.14,24
Recurrent CDI, which occurs at least once in 6% to 25% of treated patients, is most likely to occur 7 to 14 days after treatment completion.1,14 Seldom caused by resistant strains of C difficile, it is more likely to result from inadequate adherence to treatment, the presence of residual spores in the colon after treatment, or reinfection—although relapse is considered more common than reinfection.14,24 However, since a patient’s symptoms may have other causes, confirmation of recurrence should be sought through laboratory testing.
Recurrent illness is managed in the same way as successful initial therapy, based on the severity of disease; vancomycin is recommended for the first recurrence in a patient with a rising white blood cell count or serum creatinine level. Otherwise, metronidazole use may be considered.1
In patients who experience a second recurrence of confirmed CDI, a tapered or pulsed-dose regimen of oral vancomycin over a six-week period has been advocated1,8,14 (for details, see Table 2).
Results from small studies of patients with several recurrences of CDI suggest that oral rifaximin therapy can reduce subsequent recurrences if administered immediately after the conclusion of a course of vancomycin.1,41
PREVENTION OF C DIFFICILE INFECTION
Although “research gaps” exist regarding the optimal strategies to prevent CDI,1 decreased prescribing of nonessential antibiotics is key. Without the alteration in colonic flora caused by antimicrobial use, gut colonization cannot occur, and C difficile typically cannot proliferate.2
Preventing transmission of the pathogen is challenging in health care facilities, where C difficile spores have been cultured from staff members’ hands and from beds, floors, windowsills, and other areas; the spores can survive in hospital rooms for as long as 40 days after a patient with CDI has been discharged.24 Appropriate isolation precautions are essential, including single-patient–use equipment (eg, disposable rectal thermometers) and caregivers’ use of gowns, vinyl gloves, and cleaning agents that are effective against the spores, particularly bleach.1 Alcohol-based products are not effective against C difficile spores; diligent handwashing with soap or chlorhexidine is imperative to prevent the spread of CDI.1,2
CONCLUSION
Clinicians and patients alike face the clinical challenge of Clostridium difficile infection. Mild to moderate disease can be treated medically with excellent success rates. Severe disease carries a significant risk to life, and a multidisciplinary approach including early surgical consultation is warranted.
With early recognition and appropriate treatment, along with strict adherence to isolation policies, the health care community can help limit the spread of this insidious illness and its associated morbidity and mortality.
REFERENCES
1. Cohen SH, Gerding DN, Johnson S, et al. Clinical practice guidelines for Clostridium difficile infection in adults: 2010 update by the Society for Healthcare Epidemiology of America (SHEA) and the Infectious Diseases Society of America (IDSA). Infect Control Hosp Epidemiol. 2010;31(5):431-455.
2. Efron PA, Mazuski JE. Clostridium difficile colitis. Surg Clin North Am. 2009;89(2):483-500.
3. Hall IC, O’Toole E. Intestinal flora in newborn infants with a description of a new pathogenic anaerobe, Bacillus difficilis. Am J Dis Child. 1935;49:390-402.
4. Riddle DJ, Dubberke ER. Clostridium difficile infection in the intensive care unit. Infect Dis Clin North Am. 2009;23(3):727-743.
5. Sunenshine RH, McDonald LC. Clostridium difficile–associated disease: new challenges from an established pathogen. Cleve Clin J Med. 2006; 73(2):187-197.
6. Currie B. Improved testing methods are improving diagnosis of Clostridium difficile infections. Advance Administrators Laboratory. 2009;21:10. http://laboratory-manager.advance web.com/Article/PCR-for-C-diff.aspx. Accessed November 8, 2011.
7. Larson HE, Barclay FE, Honour P, Hill ID. Epidemiology of Clostridium difficile in infants. J Infect Dis. 1982;146(6):727-733.
8. Leffler DA, Lamont JT. Treatment of Clostridium difficile–associated disease. Gastroenterology. 2009;136(6):1899-1912.
9. Kelly CP, Lamont JT. Clostridium difficile: more difficult than ever. N Engl J Med. 2008;359(18): 1932-1940.
10. Pépin J, Valiquette L, Cossette B. Mortality attributed to nosocomial Clostridium difficile–associated disease during an epidemic caused by a hypervirulent strain in Quebec. CMAJ. 2005; 173(9):1037-1042.
11. Zilberberg MD. Clostridium difficile–related hospitalizations among US adults, 2006. Emerg Infect Dis. 2009;15(1):122-124.
12. Khanna S, Pardi DS. The growing incidence and severity of Clostridium difficile infection in the inpatient and outpatient settings. Expert Rev Gastroenterol Hepatol. 2010;4(4):409-416.
13. Pépin J, Saheb N, Coulombe MA, et al. Emergence of fluoroquinolones as the predominant risk factor for Clostridium difficile–associated diarrhea: a cohort study during an epidemic in Quebec. Clin Infect Dis. 2005;41(9):1254-1260.
14. Gerding DN, Muto CA, Owens RC Jr. Treatment of Clostridium difficile infection. Clin Infect Dis. 2008;46 suppl 1:S32-S42.
15. McDonald LC, Killgore GE, Thompson A, et al. An epidemic, toxin gene-variant strain of Clostridium difficile. N Engl J Med. 2005;353(23): 2433-2441.
16. Dawson LF, Valiente E, Wren BW. Clostridium difficile: a continually evolving and problematic pathogen. Infect Genet Evol. 2009;9(6):
1410-1417.
17. Dubberke ER, Reske KA, Olsen MA, et al. Short- and long-term attributable costs of Clostridium difficile–associated disease in nonsurgical patients. Clin Infect Dis. 2008;46(4):497-504.
18. Dial S, Delaney JAC, Barkun An, et al. Use of gastric acid–suppression agents and the risk of community-acquired Clostridium difficile disease. JAMA. 2005;294(23):2989-2995.
19. Kuntz JL, Chrischilles EA, Pendergast JF, et al. Incidence of and risk factors for community-associated Clostridium difficile infection: a nested case-control study. BMC Infect Dis. 2011 Jul 15;11:194.
20. Kelly CP, Lamont JT. Antibiotic-associated diarrhea, pseudomembranous enterocolitis, and Clostridium difficile–associated diarrhea and colitis. In: Feldman M, Friedman LS, Brandt LJ, eds. Sleisenger and Fordtran’s Gastrointestinal and Liver Disease. 9th ed. Philadelphia, PA: WB Saunders; 2010:1889-1902.
21. Carignan A, Allard C, Pépin J, et al. Risk of Clostridium difficile infection after perioperative antibacterial prophylaxis before and during an outbreak of infection due to a hypervirulent strain. Clin Infect Dis. 2008;46(12):1838-1843.
22. Cunningham R, Dale B, Undy B, Gaunt N. Proton pump inhibitors as a risk factor for Clostridium difficile diarrhoea. J Hosp Infect. 2003; 54(3):243-245.
23. Butala P, Divino CM. Surgical aspects of fulminant Clostridium difficile colitis. Am J Surg. 2010;200(1):131-135.
24. Schroeder MS. Clostridium difficile–associated diarrhea. Am Fam Physician. 2005;71(5): 921-928.
25. Deshpande A, Pant C, Jain A, et al. Do fluoroquinolones predispose patients to Clostridium difficile–associated disease? A review of the evidence. Curr Med Res Opin. 2008;24(2):329-333.
26. Lowe DO, Mamdani MM, Kopp A, et al. Proton pump inhibitors and hospitalization for Clostridium difficile–associated disease: a population-based study. Clin Infect Dis. 2006;43(10): 1272-1276.
27. Sailhamer EA, Carson K, Chang Y, et al. Fulminant Clostridium difficile colitis: patterns of care and predictors of mortality. Arch Surg. 2009;144(5):433-439.
28. Bartlett JG, Gerding DN. Clinical recognition and diagnosis of Clostridium difficile. Clin Infect Dis. 2008;46 suppl 1:S12-S18.
29. Olivas AP, Umanskiy K, Zuckerbraun B, Alverdy JC. Avoiding colectomy during surgical management of fulminant Clostridium difficile colitis. Surg Infect. 2010;11(3):299-305.
30. Feldman RJ, Kallich M, Weinstein MP. Bacteremia due to Clostridium difficile: case report and review of extraintestinal C difficile infections. Clin Infect Dis. 1995;20(6):1560-1562.
31. BioPharm Physicians. What next for Dificid (fidaxomicin)? Jun 6, 2011. www.biopharmphysi cians.com/what-next-for-dificid-fidaxomicin. Accessed November 7, 2011.
32. Zar FA, Bakkanagari SR, Moorthi KM, Davis MB. A comparison of vancomycin and metronidazole for the treatment of Clostridium difficile–associated diarrhea, stratified by disease severity. Clin Infect Dis. 2007;45(3):302-307.
33. Louie TJ, Miller MA, Mullane KM, et al; OPT-80-003 Clinical study Group. Fidaxomicin versus vancomycin for Clostridium difficile infection. N Engl J Med. 2011;364(5):422-431.
34. Sullivan KM, Spooner LM. Fidaxomicin: a macrocyclic antibiotic for the management of Clostridium difficile infection. Ann Pharmacother. 2010;44(2):352-359.
35. Dendukuri N, Costa V, McGregor M, Brophy JM. Probiotic therapy for the prevention and treatment of Clostridium difficile–associated diarrhea: a systematic review. CMAJ. 2005;173(2): 167-170.
36. Segarra-Newnham M. Probiotics for Clostridium difficile–associated diarrhea: focus on Lactobacillus rhamnosus GG and Saccharomyces boulardii. Ann Pharmacother. 2007;41(7): 1212-1221.
37. Lagrotteria D, Holmes S, Smieja M, et al. Prospective, randomized inpatient study of oral metronidazole versus oral metronidazole and rifampin for treatment of primary episode of Clostridium difficile–associated diarrhea. Clin Infect Dis. 2006;43(5):547-552.
38. McPherson S, Rees CJ, Ellis R, et al. Intravenous immunoglobulin for the treatment of severe, refractory, and recurrent Clostridium difficile diarrhea. Dis Colon Rectum. 2006;49(5): 640-645.
39. Aas J, Gessert CE, Bakken JS. Recurrent Clostridium difficile colitis: case series involving 18 patients treated with donor stool administered via a nasogastric tube. Clin Infect Dis. 2003; 36(5):580-585.
40. Lowy I, Molrine DC, Leav BA, et al. Treatment with monoclonal antibodies against Clostridium difficile toxins. N Engl J Med. 2010;362(3): 197-205.
41. Johnson S, Schriever C, Galang M, et al. Interruption of recurrent Clostridium difficile–associated diarrhea episodes by serial therapy with vancomycin and rifaximin. Clin Infect Dis. 2007; 44(6):846-848.
Even Minimal Physical Activity Helps in Metabolic Syndrome
Effectiveness of the MOVE! Program Among African American Veterans:Weight Loss and Quality of Life
Predictors of Length of Stay Among Older Veterans With Schizophrenia Living in VA Community Living Centers
Peanut Allergy Awareness
Among all persons with food allergies, those who are allergic to peanuts are at greatest risk for anaphylactic symptoms.1 About 30,000 cases of food allergy–related anaphylaxis are seen in the nation’s emergency departments (EDs) each year, and the food most commonly responsible is peanuts.2 What can primary care providers do to reduce the number of peanut allergy–associated anaphylactic reactions and fatalities, both in the ED and in the larger community?
According to a guideline from the National Institute of Allergy and Infectious Diseases (NIAID),3 prevalence of peanut allergy is about 0.6% of the US population, although in an 11-year survey involving more than 13,000 respondents, Sicherer et al4 reported allergy to peanuts, tree nuts, or both in 1.4%, possibly translating to some three million Americans; British researchers have reported peanut allergy in 1.8% of an 1,100-member children’s cohort.5 The risk of exposure to peanuts and the associated risk for severe and possibly fatal anaphylaxis present a lifelong struggle for both patient and family.
ETIOLOGY OF PEANUT ALLERGIES
Food allergy prevalence has reportedly doubled in recent decades, with a significant increase also seen in allergy severity.6 Allergies involving eggs, nuts, fish, milk, and other foods represent the leading cause of hospital-treated anaphylaxis throughout the world.1 Unlike other allergenic foods that affect only one age-group, peanuts are among the foods that trigger the “vast majority” of allergic reactions in young children, teenagers, and adults alike.3
Increases in reported episodes of peanut allergy reactions may be occurring for several reasons:
• Many people have adopted vegetarian diets, and nuts are considered a good protein source6
• Environmental exposures are increasingly common
• More people are genetically vulnerable, as the role of family history becomes clearer
• Food preparation methods (eg, shared processing equipment, contaminated raw materials, formulation errors) and inaccurate labeling lead to accidental exposures7,8
• Exposure to nuts in utero or during breastfeeding is more common.9 Nowak-Wegrzyn and Sampson6 point to the promotion of peanut butter as an economical, nutritious food source for children and for women during pregnancy and lactation; mothers’ consumption of peanuts more than once a week during pregnancy and lactation have been linked to overexposure for their children.9
Other trends that may contribute to peanut allergy prevalence are the early introduction of solid foods in the infant diet and the use of skin products that contain peanut oil.6
Environment and Genetics
The body of knowledge regarding the specific causes of peanut allergy is increasing constantly. Several known peanut proteins (Ara h1, Ara h2, Ara h3, Ara h6, Ara h7, and Ara h9; Ara h8 is a homologous allergen that may account for peanut/birch cross-reactivity) are thought to be responsible for the initial sensitization to peanuts in vulnerable persons, triggering the associated immunoglobulin E (IgE)–mediated response.10-12 Approximately 75% of known peanut-allergic patients will react to these proteins on their first ingestion after being sensitized.9
Since IgE antibodies do not cross the placenta, it is believed that sensitization to peanut proteins must occur in utero or through breast milk. This form of sensitization predisposes these patients to the initial life-threatening anaphylactic reaction.9
There is strong evidence that genetic factors may play a role in peanut allergies.2 In a study of 58 pairs of twins by Sicherer et al,13 heritability of peanut allergy was estimated at 82%, with 64% of monozygotic pairs, versus 7% of dizygotic pairs, showing concordance for peanut allergy. However, the genetic loci that may be responsible for specific food allergies have not yet been identified.2
It is believed that manifestations of food allergy are very similar to those of asthma and atopic dermatitis. According to Green and colleagues,14 82% of peanut-allergic children who visited a referral clinic also had atopic dermatitis. These conditions appear to be triggered by similar mechanisms, mediated by both environmental and genetic factors.2,14-16 Hong et al2 are optimistic about the advances being made in food allergy genetics. Increased understanding, they feel, may lead to new treatment options for potentially fatal food allergies.2
PATIENT PRESENTATION AND HISTORY
As with any IgE-mediated immune response, the patient must have been exposed to the allergen in question. Most patients present with a history of having ingested raw or boiled peanuts and/or foods produced in a facility that also processes nuts.1,18 Clinical symptoms of peanut allergy may develop within seconds of ingestion. For some patients, consumption of as little as 5 to 50 mg of peanut protein can trigger symptoms.19 (A single peanut from a jar of commercially processed peanuts contains approximately 300 mg of potentially allergenic protein.1)
Typically, the most dramatically affected patients have a medical history of asthma or other IgE-mediated immune reactions.1 In one study, young adults with IgE-mediated peanut allergy were found at especially high risk for severe anaphylaxis.6 Seventy-five percent of patients who have a reaction to peanuts do so following their first ingestion (after the initial exposure).
The mean patient age for a diagnosis of peanut allergy is about 14 months; only 20% of the patients diagnosed with a peanut allergy (most likely those with a baseline peanut-specific serum IgE level 18) will outgrow it by the time they reach school age.18,20 Those who do should be encouraged to consume peanuts on a regular basis; according to Byrne et al,21 8% of patients with allergy resolution experience recurrence, a possible result of infrequent peanut consumption.
PHYSICAL EXAMINATION
Patients with peanut allergies can present with a range of symptoms, possibly involving cutaneous, cardiovascular, gastrointestinal, and/or respiratory systems (see Table 115,22). The more notable symptoms, possibly developing within 15 minutes of exposure, are progressive upper and lower respiratory difficulties, vomiting, diarrhea, hypotension, edema of the face and hands, arrhythmia, throat tightness (in serious cases, approaching anaphylaxis), and possibly loss of consciousness. Such severe reactions often occur in the child who has ingested raw peanuts or tree nuts.22
Milder physical exam findings include erythema, pruritus, conjunctivitis, abdominal pain, nasal congestion, itchy throat, and sneezing. These reactions may have been triggered by foods produced in a facility that also processes nuts, household utensils used to prepare foods that contain nuts, or cross-contamination from another child.9,15,24
DIAGNOSTIC WORK-UP
The diagnosis of a patient with a peanut allergy is made through thorough history taking, careful physical examination, allergy testing with either a skin prick test (SPT) or serum-specific IgE, and oral food challenges. The gold standard for diagnosing food allergy is the double-blind, placebo-controlled oral food challenge,2,25-27 as this test alone can determine the amount of peanut protein needed to trigger a reaction in the given patient.9 However, this is a difficult test to administer and must be performed under strict medical supervision.21
It has been determined that a wheal size of 8.0 mm or greater on the SPT has a 95% to 100% positive predictive value for peanut allergy.1,26,27 Although conflicting results have been reported in some patients between SPT and the oral food challenge, a negative SPT result is considered useful for excluding IgE-mediated allergic responses.22
Researchers examining the peanut-specific serum IgE have demonstrated a 95% to 99% positive predictive value when serum levels exceed 15 kU/L.26,27 This cutoff value in peanut allergy patients is considered suggestive of allergic reactivity, although negative results on an oral food challenge have been reported in more than 25% of children with serum levels exceeding the cutoff.25-27 Testing may have been to whole peanut extract rather than the molecular components (eg, Ara h8).11,12
This past summer, the FDA approved a component test that detects allergen components that include Ara h1, h2, h3, h8, and h9.11,12 Another specific version of the serum IgE test has been in development, one that measures the patient’s IgE reactions to the Ara h2 and Ara h8 components in peanut protein. Johnson and colleagues10,28 have found an increasing level of serum IgE anti–Ara h2 in children who were unable to pass the oral peanut challenge, whereas serum IgE anti–Ara h8 was higher in those who did pass the challenge.28
DIAGNOSING ANAPHYLAXIS
The manifestation of anaphylaxis in patients allergic to peanuts or tree nuts can be life-threatening.29 Symptoms include intense pruritus with flushing of the skin, urticaria, and angioedema, upper-respiratory obstruction resulting from laryngeal edema, and hypotension.30 The clinical criteria for diagnosing anaphylaxis can be found in Table 2.30,31
It is important to recognize the signs and symptoms of anaphylaxis in patients with a peanut allergy; many patients who present to the ED represent first-time reactions. Among patients with life-threatening symptoms on initial reaction, 71% will have similarly severe reactions in subsequent episodes (compared with 44% of patients whose first reaction was not life-threatening).3
TREATMENT, INCLUDING PATIENT EDUCATION
Currently there is no cure for peanut allergy, and no appropriate therapies yet exist to reduce allergy severity. Modest gains have been reported in raising tolerance threshold levels through peanut oral immunotherapy—a long, painstaking process.19,21,32 For now, treatment for peanut allergy is directed at controlling symptoms, once a reaction has occurred. Therefore, the clinician’s goal is to educate peanut-allergic patients and their families on avoiding accidental peanut ingestion, recognizing signs and symptoms of an allergic reaction, and preparing an emergency plan.4
Because four in five patients can expect peanut allergy to last for a lifetime,18,20 strict avoidance of peanuts and peanut products is essential—though difficult because of accidental exposure to food allergens (for example, when dining in restaurants or purchasing bakery products22,32), cross-contamination (as can occur when a food preparation area is not properly cleaned), and allergen cross-reactivity (such as consumption of other legumes).1 Patients must be taught to read food labels carefully for possible hidden sources of peanuts (see Table 37,8); in some cases, product labels bear helpful advisory wording, such as “may contain peanuts.”34,35 US legislation mandates that listed ingredients on food packaging include the eight foods that account for 90% of allergic reactions:
• Peanuts
• Tree nuts
• Egg
• Milk
• Wheat
• Soybeans
• Fish
• Crustacean shellfish.34
Treatment for Anaphylaxis
In pediatric patients, administration of epinephrine is the definitive treatment for anaphylaxis; both the child and parents should carry an epinephrine self-injection device at all times in the event of accidental peanut ingestion. These devices are available in two strengths, based on the child’s weight, and expiration dates should be noted with care. Correct use of the epinephrine self-injection device should be reviewed at each office visit.6
Early-stage allergic reactions can be managed by oral antihistamines, such as diphenhydramine (1 mg/kg body weight up to 75 mg) and an intramuscular injection of epinephrine.1 Prompt transport to the ED should follow (see “Management of Anaphylaxis in the ED”1,9).
PREVENTION
A 2010 expert panel on diagnosis and management of food allergy sponsored by the NIAID, NIH,3 does not advise women to restrict their diet during pregnancy and lactation. Similarly, the United Kingdom’s Department of Health and the Food Standards Agency (DHFSA)36,37 does not support the belief that eating peanuts and peanut-containing foods during pregnancy correlates with a child’s potential for developing a peanut allergy.
The DHFSA does recommend breastfeeding infants for the first six months, if possible, and that mothers refrain from introducing peanut-containing foods during that time. They also recommend that foods associated with a high risk for allergy be introduced into a child’s diet one at a time, to make it easier to identify any allergenic substance.36,37
Lastly, the DHFSA advises parents with a family history of peanut allergy to introduce peanuts only after consulting with their health care provider. The same consideration is advised if a child has already been diagnosed with another allergy.34 According to the American Academy of Pediatrics,6,38 children at high risk for food allergy (eg, atopic disease in both parents or one parent and one sibling) should be breastfed or be given hypoallergenic formula until age 1 year, with no solid foods before age 6 months; peanut-containing foods should not be given before age 3 or 4 years.
CONCLUSION
Peanut allergy can present a lifelong battle for affected patients. Eating one peanut or being exposed even to minute amounts of peanut protein could mean life or death without appropriate management. Reading food labels carefully, preparing peanut-free foods, recognizing the signs and symptoms of anaphylaxis, and obtaining the necessary treatment when allergic reactions occur are essential for peanut-allergic patients and their families.
REFERENCES
1. Burks AW. Peanut allergy. Lancet. 2008;371 (9623):1538-1546.
2. Hong X, Tsai HJ, Wang X. Genetics of food allergy. Curr Opin Pediatr. 2009;21(6):770-776.
3. Boyce JA, Assa’ad A, Burks AW, et al. Guidelines for the diagnosis and management of food allergy in the United States: report of the NIAID-sponsored expert panel. J Allergy Clin Immunol. 2010;126(6 suppl):S1-S58.
4. Sicherer S, Muñoz-Furlong A, Godbold JH, Sampson HA. US prevalence of self-reported peanut, tree nut, and sesame allergy: 11-year follow-up. J Allergy Clin Immunol. 2010;125(6):1322-1326.
5. Hourihane JO, Aiken R, Briggs R, et al. The impact of government advice to pregnant mothers regarding peanut avoidance on the prevalence of peanut allergy in United Kingdom children at school entry. J Allergy Clin Immunol. 2007;312(5):1197-1202.
6. Nowak-Wegrzyn A, Sampson HA. Adverse reactions to foods. Med Clin North Am. 2006;90(1):97-127.
7. Puglisi G, Frieri M. Update on hidden food allergens and food labeling. Allergy Asthma Proc. 2007;28(6):634-639.
8. Hefle SL. Hidden food allergens. Curr Opin Allergy Clin Immunol. 2001;1(3):269-271.
9. Lee CW, Sheffer AL. Peanut allergy. Allergy Asthma Proc. 2003;24(4):259-264.
10. Boughton B. New test for peanut allergy a step forward. www.medscape.com/viewarticle/740133. Accessed November 16, 2011.
11. Asarnoj A, Movérare R, Östblom E, et al. IgE to peanut allergen components: relation to peanut symptoms and pollen sensitization in 8-year-olds. Allergy. 2010;65(9):1189-1195.
12. Codreanu F, Collignon O, Roitel O, et al. A novel immunoassay using recombinant allergens simplifies peanut allergy diagnosis. Int Arch Allergy Immunol. 2011;154(3):216-226.
13. Sicherer SH, Furlong TJ, Maes HH, et al. Genetics of peanut allergy: a twin study. J Allergy Clin Immunol. 2000;106(1 pt 1):53-56.
14. Green TD, LaBelle VS, Steele PH, et al. Clinical characteristics of peanut-allergic children: recent changes. Pediatrics. 2007;120(6):1304-1310.
15. Al-ahmed N, Alsowaidi S, Vadas P. Peanut allergy: an overview. Allergy Asthma Clin Immunol. 2008;4(4):139-143.
16. Björkstén B. Genetic and environmental risk factors for the development of food allergy. Curr Opin Allergy Clin Immunol. 2005;5(3):249-253.
17. Lack G. Epidemiologic risks for food allergy. J Allergy Clin Immunol. 2008;121(6):1331-1336.
18. Skolnick HS, Conover-Walker MK, Koerner CB, et al. The natural history of peanut allergy. J Allergy Clin Immunol. 2001;107(2):367-374.
19. Clark AT, Islam S, King Y, et al. Successful oral tolerance induction in severe peanut allergy. Allergy. 2009;64(8):1218-1220.
20. Busse PJ, Nowak-Wegrzyn AH, Noone SA, et al. Recurrent peanut allergy. N Engl J Med. 2002; 347(19):1535-1536.
21. Byrne AM, Malka-Rais J, Burks AW, Fleischer DM. How do we know when peanut and tree nut allergy have resolved, and how do we keep it resolved? Clin Exp Allergy. 2010;49(9):1303-1311.
22. Sampson HA. Update on food allergy. J Allergy Clin Immunol. 2004;113(5):805-819.
23. Furlong TJ, Desimone J, Sicherer SH. Peanut and tree nut allergic reactions in restaurants and other establishments. J Allergy Clin Immunol. 2001;108(5):866-870.
24. Nelson HS, Lahr J, Rule R, et al. Treatment of anaphylactic sensitivity to peanuts by immunotherapy with injections of aqueous peanut extract. J Allergy Clin Immunol. 1997;99(6 pt 1):744-751.
25. Du Toit G, Santos A, Roberts G, et al. The diagnosis of IgE-mediated food allergy in childhood. Pediatr Allergy Immunol. 2009;20(4):309-319.
26. Roberts G, Lack G. Diagnosing peanut allergy with skin prick and specific IgE testing. J Allergy Clin Immunol. 2005;115(6):1291-1296.
27. Wainstein BK, Yee A, Jelley D, et al. Combining skin prick, immediate skin application and specific-IgE testing in the diagnosis of peanut allergy in children. Pediatr Allergy Immunol. 2007;18(3):231-239.
28. Johnson K, Keet C, Hamilton R, Wood R. Predictive value of peanut component specific IgE in a clinical population. Presented at: 2011 Annual Meeting, American Academy of Allergy, Asthma and Immunology; March 19, 2011; San Francisco, CA. Abstract 267.
29. Sheffer AL. Allergen avoidance to reduce asthma-related morbidity. N Engl J Med. 2004;351(11):1134-1136.
30. Russell S, Monroe K, Losek JD. Anaphylaxis management in the pediatric emergency department: opportunities for improvement. Pediatr Emerg Care. 2010;26(2):71-76.
31. Sampson HA, Munoz-Furlong A, Campbell RL, et al. Second symposium on the definition and management of anaphylaxis: summary report—Second National Institute of Allergy and Infectious Disease/Food Allergy and Anaphylaxis Network symposium. J Allergy Clin Immunol. 2006;117(2):391-397.
32. Blumchen K, Ulbricht H, Staden U, et al. Oral peanut immunotherapy in children with peanut anaphylaxis. J Allergy Clin Immunol. 2010; 126(1):83-91.
33. Yu JW, Kagan R, Verreault N, et al. Accidental ingestions in children with peanut allergy. J Allergy Clin Immunol. 2006;118(2):466-472.
34. Taylor SL, Hefle SL. Food allergen labeling in the USA and Europe. Curr Opin Allergy Clin Immunol. 2006;6(3):186-190.
35. Sampson HA, Srivastava K, Li XM, Burks AW. New perspectives for the treatment of food allergy (peanut). Arb Paul Ehrlich Inst Bundesamt Sera Impfstoffe Frankf A M. 2003;(94):236-244.
36. McLean S, Sheikh A. Does avoidance of peanuts in early life reduce the risk of peanut allergy? BMJ. 2010 Mar 11;340:c424.
37. Department of Health. Revised government advice on consumption of peanut during pregnancy, breastfeeding, and early life and development of peanut allergy (Aug 2009). www.dh.gov.uk/en/Healthcare/Children/Maternity/Maternalandinfantnutrition/DH_104490. Accessed November 16, 2011.
38. American Academy of Pediatrics. Committee on Nutrition. Hypoallergenic infant formulas. Pediatrics. 2000;106(2):346-349.
Grand Rounds: Pregnant Woman, 33, With Leg Pain and Numbness
A 33-year-old woman in her 32nd week of pregnancy (gravida 3, para 2) presented to the emergency department (ED) with a five-day history of weakness and ascending numbness below the right knee. She related a two-week history of right-sided low back pain that radiated to the right buttock and was associated with severe right lower extremity (RLE) pain, most prominent in the posterolateral aspect of the right calf. She denied perianal numbness, incontinence, or other changes in bowel or bladder function. She also denied left lower extremity involvement or trauma.
The patient had had one uneventful pregnancy to date. Her medical history included hypothyroidism, treated with levothyroxine; and anxiety, for which she was taking sertraline. She denied any history of allergies, alcohol consumption, smoking, or illicit drug use. She had been evaluated twice and received reassurance in the two weeks before her presentation to the ED. She was admitted to the obstetric service secondary to pain, and a stat MRI rather than x-ray was ordered by obstetrics. An orthopedic consult was ordered. A spine surgeon happened to be on call.
Examination revealed that the patient walked plantigrade, with her right foot slightly externally rotated. She was unable to dorsiflex or plantarflex her right foot. She was unable to heel- or toe-walk on the right side, possessed 0 out of 5 strength at the right extensor hallucis longus and 2 to 3 out of 5 at the right tibialis anterior and gastroc soleus complex. She complained of pain with right leg elevation exceeding 30° and had very limited sensation to light touch in the right L5 and S1 dermatomes. Deep tendon reflex was absent at the right ankle. The patient refused a rectal exam or post-void evaluation.
The initial diagnosis considered by the ED clinician was sciatica, with a differential diagnosis that included pelvic pain of pregnancy, lumbar sprain strain, sciatica, lumbar disk, herniated nucleus pulposus with radiculopathy, and cauda equina syndrome. Trauma was considered and ruled out, as were malignancies; inflammatory, infectious, or degenerative conditions; or other compressive processes.1
Lumbar MRI demonstrated a very large, right-sided disk herniation at L5-S1 with an extruded fragment that was severely compressing the thecal sac and the right S1 nerve root, causing severe right foraminal stenosis at the level of L5-S1. Degenerative changes were noted at L4-5 with disk dessication and no lesions seen.
The patient was diagnosed with cauda equina syndrome, which was felt to be causing severe RLE weakness and ascending numbness. The options of observation, analgesia, physical therapy, and epidural injections were discussed with the patient; however, surgery was strongly recommended due to her profound weakness and the severity of pain she was experiencing, in addition to the size of the disk herniation. She opted for surgery.
The patient was given epidural anesthesia at the L3-4 level, with a catheter left in place during the procedure. A test dose of lidocaine (1.5 cc) with epinephrine was injected to ensure proper placement, and bupivacaine 0.5% was given in increments of 5.0 cc three times during the case. Propofol was administered for sedation, and a 2.0-mg dose of a long-acting morphine was given to the patient before removal of the epidural catheter. Fetal monitoring was performed by obstetrics throughout the procedure.
A laminotomy, partial facetectomy, and diskectomy were performed at L5-S1 with excision of a free fragment. Surgical pathology described the disk as fibrocartilaginous tissue measuring 3.5 cm x 1.4 cm x 0.6 cm.
DISCUSSION
Although nearly half of pregnant women experience low back pain, cauda equina syndrome (CES), a complication of lumbar disk herniation, is extremely rare in the gravid patient.2 In a decade-long review of 48,760 consecutive deliveries, LaBan et al3 identified symptomatic lumbar herniated nucleus pulposus in only five patients (approximately one in 10,000 pregnancies). In pregnant women who do experience CES, symptoms most commonly develop between the fifth and seventh month of pregnancy.4 According to Small et al,5 “The major pitfall in diagnosis is not including CES in the back pain differential.”
True CES presents as a triad of symptoms: lower extremity weakness, altered sensation in the skin of the buttocks and upper posterior thighs (saddle anesthesia), and dysfunction or paralysis of the bowel and bladder. However, few patients present with all of the classic symptoms,6 and patients with CES are often dismissed by several clinicians in their search for relief before presenting to a subspecialist. Kostuik et al7 consider “unilateral sciatica with motor and sensory disturbance” a more common presentation of CES; also indicative of this condition, they report, is “urinary dysfunction combined with motor and sensory loss in the presence of a disc lesion.”
The polypeptide relaxin, which is secreted by the corpus luteum to promote joint laxity in late pregnancy, has been associated with low back pain and pelvic pain of pregnancy; it has also been suggested as a possible contributing cause of CES during pregnancy.8,9 Additionally, increased lumbar lordosis with positional and postural stress may cause direct pressure by the gravid uterus on nerve roots. The great vessels may also be compressed by the uterus, resulting in ischemia of the neural element and back pain that radiates to the legs.10 Many cases of lumbar disk prolapse occur during the first and second trimesters. The most clinically incapacitated patients have been found to have the highest levels of relaxin.9
The Diagnosis
Early diagnosis of CES, through proper physical examination and radiologic studies, is paramount. A rectal examination should be performed to assess for sphincter tone (which may be diminished in 80% of patients) and to assess for perineal sensation.5 Catheterization yielding a postvoid residual urine greater than 100/200 cc is reported to have a specificity and sensitivity of 90% or greater for CES. Small et al5 recommend a straight leg raise maneuver to assess for radiculopathy.
Various studies in the literature support the use of MRI in the gravid patient to confirm the diagnosis of CES and to identify the degree and level of disk protrusion.2-4,11
Treatment
CES requires urgent surgical decompression.11 Early recognition of CES attributable to lumbar disk prolapse, report O’Laoire et al,12 is essential to prevent irreversible sphincter paralysis. They liken the condition’s urgency to that of extradural hematoma in a head injury.
Disk surgery during pregnancy—preferably a team effort, with obstetrics performing perioperative fetal monitoring—has been deemed a safe management method.2,4 Spinal or general anesthesia during nonobstetric surgery is generally considered safe for both mother and fetus.13,14 Adequate oxygenation without risk for hyperventilation is considered essential.15
PATIENT OUTCOME
In the immediate postoperative period, the patient continued to complain of RLE pain, which abated significantly by the time she was discharged. When she was seen in follow-up four days later, she was able to heel- and toe-walk on the right side, and her strength had improved to 3 or 4 out of 5 at the RLE. She continued to experience diminished sensation to the plantar aspect of the right foot, which persisted at the one-month follow up. At that visit, the patient also reported occasional pain in the right buttock. Physical therapy was started to strengthen the RLE.
By three months postsurgery, the patient had undergone uneventful vaginal delivery. She had an entirely benign exam with 5 out of 5 strength at the RLE and no neurologic deficits. She was cleared to return to light weightlifting with good technique and lumbar support but was told to refrain from running until the sixth month postsurgery.
CONCLUSION
Although the case patient did not have a “true” (ie, typical) presentation of CES, her symptoms warranted a full workup and treatment to prevent possible long-term sequelae. Medical practitioners should be familiar with the triad presentation of CES. They must differentiate lower back pain of muscular origin from lumbar disk herniation and be able to appreciate the degree of symptom severity reported by the gravid patient. A thorough history and physical assessment must be performed in every such case. When in doubt, the clinician must err on the side of caution, referring the patient for MRI and consulting with a specialist.
REFERENCES
1. Johnston RA. The management of acute spinal cord compression. J Neurol Neurosurg Psychiatr. 1993;56(10):1046-1054.
2. Brown MD, Levi AD. Surgery for lumbar disc herniation during pregnancy. Spine (Phila PA 1976). 2001;26(5):440-443.
3. LaBan MM, Perrin JCS, Latimer FR. Pregnancy and the herniated lumbar disc. Arch Phys Med Rehabil. 1983;64(7):319-321.
4. LaBan MM, Rapp NS, Van Oeyen P, Meerschaert JR. The lumbar herniated disk of pregnancy: a report of six cases identified by magnetic resonance imaging. Arch Phys Med Rehabil. 1995;76(5):476-479.
5. Small SA, Perron AD, Brady WJ. Orthopedic pitfalls: cauda equina syndrome. Am J Emerg Med. 2005;23(2):159-163.
6. Tay EC, Chacha PB. Midline prolapse of a lumbar intervertebral disc with compression of the cauda equina. J Bone Joint Surg. 1979;61(1):43-46.
7. Kostuik JP, Harrington I, Alexander D, et al. Cauda equina syndrome and lumbar disc herniation. J Bone Joint Surg Am. 1986;68(3):386-391.
8. Russell R, Reynolds F. Back pain, pregnancy, and childbirth. BMJ. 1997;314(7087):1062-1063.
9. MacLennan AH, Nicholson R, Green RC, Bath M. Serum relaxin and pelvic pain of pregnancy. Lancet. 1986;2(8501):243-245.
10. Ashkan K, Casey AT, Powell M, Crockard HA. Back pain during pregnancy and after childbirth: an unusual cause not to miss. J R Soc Med. 1998;91(2):88-90.
11. Busse JW, Bhandari M, Schnittker JB, et al. Delayed presentation of cauda equina syndrome secondary to lumbar disc herniation: functional outcomes and health-related quality of life. CJEM. 2001;3(4):285-291.
12. O’Laoire SA, Crockard HA, Thomas DG. Prognosis for sphincter recovery after operation for cauda equina compression owing to lumbar disc prolapse. Br Med J (Clin Res Ed). 1981;282(6279):1852-1854.
13. Kuczkowski KM. The safety of anaesthetics in pregnant women. Expert Opin Drug Saf. 2006; 5(2):251-264.
14. Kuczkowski KM. Nonobstetric surgery during pregnancy: what are the risks of anesthesia? Obstet Gynecol Surv. 2004;59(1):52-56.
15. Birnbach DJ, Browne IM. Anesthesia for obstetrics. In: Miller RD, Eriksson LI, Fleisher LA, et al. Miller’s Anesthesia. Philadelphia, PA: Churchill Livingston, Elsevier Health Science; 2010: 2203-2240.