User login
YOU HAVE A NEW JOB: Monitor the lipid profile
Dr. Dayspring serves on the advisory board for LipoScience. Dr. Helmbold reports no financial relationships relevant to this article.
Add another item to your ever-growing list of responsibilities: monitoring your patients’ risk of atherosclerosis.
This task used to be the purview of internists and cardiologists but, because gynecologists are increasingly serving as a primary care provider, you need to learn to recognize and diagnose the many clinical expressions of atherosclerosis in your aging patients.
A crucial part of that knowledge is a thorough understanding of each and every lipid concentration parameter reported within the standard lipid profile. This article reviews those parameters, explains how to interpret them individually and in combination, and introduces a new paradigm: the analysis of lipoprotein particle concentrations as a more precise way to determine risk.
If used in its entirety, the lipid profile provides a significant amount of information about the presence or absence of pathologic lipoprotein concentrations. Far too many clinicians focus solely on low-density lipoprotein cholesterol (LDL-C) and ignore the rest of the profile. Failure to consider the other variables is one reason why atherosclerotic disease is underdiagnosed and undertreated in the United States in many patients—especially women.1
1. Look at the triglyceride (TG) level. If it is >500 mg/dL, treatment is indicated, and TG reduction takes precedence over all other lipid concentrations. If TG is <500 mg/dL, go to Step 2.
2. Look at the low-density lipoprotein cholesterol (LDL-C) level. If it is >190 mg/dL, drug therapy is indicated regardless of other findings. At lower levels, the need for therapy is based on the patient’s overall risk of cardiovascular disease (CVD). Therapeutic lifestyle recommendations are always indicated.
3. Look at high-density lipoprotein cholesterol (HDL-C). Increased risk is present if it is <50 mg/dL, the threshold for women. Do not assume that high HDL-C always means low CVD risk.
4. Calculate the total cholesterol (TC)/HDL-C ratio (a surrogate of apoB/apoA-I ratio). Increased risk is present if it is >4.0.
5. Calculate the non-HDL-C level (TC minus HDL-C). If it is >130 mg/dL (or >100 mg/dL in very-high-risk women), therapy is warranted. Newer data reveal that this calculation is always equal to, or better than, LDL-C at predicting CVD risk. Non-HDL-C is less valuable if TG is >500 mg/dL.
6. Calculate the TG/HDL-C ratio to estimate the size of LDL. If the ratio is >3.8, the likelihood of small LDL is 80%. (Small LDL usually has very high LDL-P.)
Why lipoproteins are important
There is only one absolute in atherosclerosis: Sterols—predominantly cholesterol—enter the artery wall, where they are oxidized, internalized by macrophages, and transformed into foam cells, the histologic hallmark of atherosclerosis. With the accumulation of foam cells, fatty streaks develop and, ultimately, so does complex plaque.
Lipids associated with cardiovascular disease (CVD) include:
- cholesterol
- noncholesterol sterols such as sitosterol, campesterol, and others of mostly plant or shellfish origin
- triacylglycerol, or triglycerides (TG)
- phospholipids.
Because lipids are insoluble in aqueous solutions such as plasma, they must be “trafficked” within protein-enwrapped particles called lipoproteins. The surface proteins that provide structure and solubility to lipoproteins are called apolipoproteins. A key concept is that, with their surface apolipoproteins and cholesterol core, certain lipoproteins are potential agents of atherogenesis in that they transport sterols into the artery wall.2
Estimation of the risk of CVD involves careful analysis of all standard lipid concentrations and their various ratios, and prediction of the potential presence of atherogenic lipoproteins. Successful prevention or treatment of atherosclerosis entails limiting the presence of atherogenic lipoproteins.
A new paradigm is on its way
The atherogenicity of lipoprotein particles is determined by particle concentration as well as other variables, including particle size, lipid composition, and distinct surface apolipoproteins.
Lipoproteins smaller than 70 nm in diameter are driven into the arterial intima primarily by concentration gradients, regardless of lipid composition or particle size.3 A recent Consensus Statement from the American Diabetes Association and the American College of Cardiology observed that quantitative analysis of these potentially atherogenic lipoproteins is one of the best lipid/lipoprotein-related determinants of CVD risk.4 Lipoprotein particle concentrations have emerged not only as superb predictors of risk, but also as goals of therapy.5-7
Because of cost, third-party reimbursement, varying test availability, and lack of interpretive knowledge, few clinicians routinely order lipoprotein quantification. Historically, CVD risk and goals of therapy have been based on lipid concentrations (the amount of lipids trafficked within lipoprotein cores) reported in the lipid profile. Guidelines from the National Cholesterol Education Program, Adult Treatment Panel III (NCEP ATP-III)8,9 and the American Heart Association (AHA) CVD Prevention in Women10,11 use lipid concentrations such as total cholesterol (TC), LDL-C, high-density lipoprotein cholesterol (HDL-C), and TG as estimates or surrogates of lipoprotein concentrations ( TABLE 1 ).
The day is rapidly approaching, however, when lipoprotein concentrations may replace the lipid profile in clinical practice. It is critical that clinicians develop a solid understanding of lipoprotein physiology and pathology.7,12 It also is crucial that we be as skilled as possible in accurately predicting lipoprotein pathology using all of the lipid concentration parameters present in the lipid panel.
TABLE 1
Desirable lipid values for women
| Lipid | Level (mg/dL) |
|---|---|
| Total cholesterol | <200 |
| Low-density lipoprotein (LDL) cholesterol | <100 |
| High-density lipoprotein (HDL) cholesterol | ≥50 |
| Triglycerides | <150 |
| Non-HDL-cholesterol | <130 |
| FOR VERY HIGH-RISK PATIENTS | |
| LDL-C | <70 |
| Non-HDL-C | <100 |
| Source: American Heart Association | |
How lipoproteins are analyzed
Lipoproteins can be separated into their components using any of several methodologies, including ultracentrifugation, electrophoresis, apolipoprotein content analysis, and nuclear magnetic resonance (NMR) spectroscopy. Of these, only the last two provide information on particle concentrations.13,14
Apolipoprotein content analysis reveals two major categories of particles:
- alpha-lipoproteins, or HDL, which contain two to four molecules of apolipoprotein A-I (apoA-I)
- beta-lipoproteins, a collective group of chylomicrons, very-low-density lipoproteins (VLDL), intermediate-density lipoproteins (IDL), and LDL, each containing a single molecule of apolipoprotein B (apoB). Because of very different half-lives (chylomicrons, 1 hour; VLDL, 2–6 hours; IDL, 1–2 hours; LDL, 2–3 days), the great majority (90% to 95%) of apoB-containing particles are LDL. Although apoB measurement yields quantification of all beta-lipoproteins, it is primarily a surrogate of LDL particle (LDL-P) concentration.15
Individual particle concentrations, determined by NMR spectroscopy, are reported as VLDL-P, IDL-P, LDL-P, and HDL-P (see the “Glossary”).14
Several epidemiologic studies that enrolled both genders found the best predictors of risk to be:
- elevated levels of apoB or LDL-P and reduced levels of apoA-I or HDL-P
- a high apoB/apoA-I ratio or LDL-P/HDL-P ratio.6,13,14
After adjustment for lipoprotein concentration data (apoB or LDL-P), other lipoprotein characteristics such as particle lipid content, size, or composition, for the most part, had no statistically significant relationship with the risk of cardiovascular disease.16,17
Lipids and lipoproteins: A glossary
| Variable | What is it? |
|---|---|
| Triglycerides (TG) | The triacylglycerol concentration within all of the TG-trafficking lipoproteins in 100 mL or 1 dL of plasma |
| Total cholesterol (TC) | Cholesterol content of all lipoproteins in 1 dL of plasma |
| Low-density lipoprotein (LDL) cholesterol | Cholesterol content of all intermediate-density lipoprotein (IDL) and LDL particles in 1 dL of plasma |
| High-density lipoprotein (HDL) cholesterol | Cholesterol content of all HDL particles in 1 dL of plasma |
| Very-low-density lipoprotein (VLDL) cholesterol | Cholesterol content of all VLDL particles in 1 dL of plasma |
| Remnant-C | Cholesterol content of all remnants in 1 dL of plasma |
| Lipoprotein (a) [Lp(a)] cholesterol | Cholesterol content of LDL particles that have apo(a) attached |
| Lp(a) concentration | Concentration of apo(a) in 1 dL of plasma |
| Non-HDL cholesterol | Cholesterol within all apoB particles in 1 dL of plasma |
| LDL-P | Number of LDL particles in 1 L of plasma (expressed in nmol/L). This represents LDL particles of all sizes |
| Small LDL-P | Number of small and intermediate LDL particles in 1 L of plasma (nmol/L) |
| HDL-P | Number of HDL particles in 1 L of plasma (μmol/L). HDL-P is also reported as large, intermediate, and small HDL-P (μmol/L) |
| VLDL-P | Number of VLDL particles in 1 L of plasma (nmol/L) |
| IDL-P | Number of IDL particles in 1 L of plasma (nmol/L) |
| LDL size | Diameter of the predominant LDL species:
|
Using lipid measurements to estimate lipoproteins
Total cholesterol represents the cholesterol content within all lipoproteins in 1 dL of plasma. Because beta-lipoproteins are considerably larger than alpha-lipoproteins, approximately 75% of total cholesterol is carried in the apoB-containing particles, making TC an apoB surrogate.
VLDL-C, an often ignored variable, is not measured but calculated using the Friedewald formula, dividing TG by five. This calculation assumes—often erroneously as TG levels rise—that TG consists only of VLDL particles and that VLDL composition contains five times more TG than cholesterol molecules.
A desirable TG level is <150 mg/dL, so normal VLDL-C is 150/5 or <30 mg/dL.
LDL-C is also an apoB surrogate
Although VLDL-C is a weak apoB surrogate,15 data from the Framingham Heart Study showed it to be a good predictor of VLDL remnant particles.18 However, because the vast majority of beta-lipoproteins are LDL, LDL-C (especially if elevated) is a better apoB surrogate than VLDL-C and is the primary CVD risk factor and goal of therapy in every current guideline.
LDL-C is usually a calculated value using the formula:
LDL-C = TC – (HDL-C + VLDL-C)
Upon special order, laboratories can directly measure LDL-C. This option is most useful when TG levels are high, rendering the Friedewald formula less accurate ( TABLE 2 ).19 For population cut points and desirable goals of therapy for lipid and lipoprotein concentrations, see the FIGURE .
TABLE 2
How lipid concentrations are determined
| TC = apoA-I-C + apoB-C |
| TC = HDL-C + LDL-C + VLDL-C + IDL-C + Chylomicron-C + Lp(a)-C + Remnant-C |
| In a fasting patient under normal circumstances, there are no chylomicrons and remnants (smaller chylomicrons or VLDL particles) and very few, if any, IDL particles. These are postprandial lipoproteins. Most patients do not have Lp(a) pathology. Therefore, the lipid concentration formula simplifies: |
| TC = HDL-C + LDL-C + VLDL-C |
| VLDL-C is estimated by TG/5 (assumes that all TG is in VLDL and that VLDL TG:cholesterol composition is 5:1). Therefore: |
| TC = HDL-C + LDL-C + TG/5 |
| LDL-C = TC – (HDL-C + TG/5) |
| Non-HDL-C = TC – HDL-C |
| In actuality, the calculated or directly measured LDL-C values in the standard lipid panel represent LDL-C + IDL-C + Lp(a)-C. However, because labs do not usually separate IDL and Lp(a) particles from LDL (without significant added expense), only total LDL-C is reported. |
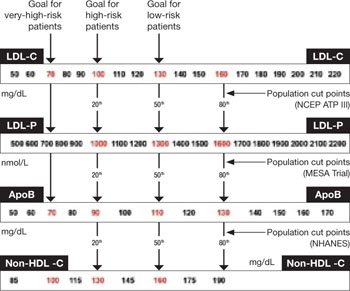
FIGURE Population percentile cut points and goals for LDL-C, LDL-P, ApoB, and non-HDL-C
HDL-C, apoA-I are inversely related to cardiovascular risk
The epidemiologic data strongly indicate that both HDL-C and apoA-I are strongly and inversely related to CVD risk.6 HDL particles are a heterogenous collection of:
- unlipidated apoA-I
- very small pre-beta HDL
- more mature, lipidated HDL3 and HDL2 species (HDL3 smaller than HDL2).
NMR nomenclature identifies the smaller HDL species as H1 and H2 and the larger HDL species as H4 and H5.14 The smaller HDL species also contain apoA-II.
Although HDL can acquire cholesterol from any cell, including arterial-wall foam cells, the majority of HDL lipidation occurs in the liver or proximal small intestine, after which it is trafficked to steroidogenic tissue, adipocytes, or back to the liver. Normally, HDL carries little TG.20 The only lipid concentration that can serve as a surrogate of apoA-I or HDL-P is HDL-C, where the assumption is that higher HDL-C indicates higher apoA-I, and vice versa.
In reality, the correlation between apoA-I and HDL-C varies because each HDL particle can have from two to four apoA-I molecules, and the volume of cholesterol within the particle is a function of particle size and its TG content. For the most part, total HDL-C is indicative of the cholesterol carried in the larger, mature HDL2 (H4, H5) particles; patients with low HDL-C typically lack these mature, lipidated HDL particles.
Because HDL rapidly and repeatedly lipidates and then delipidates, there is no relationship between the HDL-C level and the complex dynamic process termed reverse cholesterol transport process. Neither HDL-C, nor apoA-I, nor HDL-P, nor HDL size is consistently related to HDL particle functionality—i.e., the ability of HDL to lipidate or delipidate, appropriately traffic cholesterol, or perform numerous other nonlipid antiatherogenic functions.20,21
Two premenopausal women undergo assessment of their basic lipid panel, with these results:
| LIPID | PATIENT 1 | PATIENT 2 |
|---|---|---|
| Total cholesterol (TC) | 180 | 180 |
| LDL-C | 100 | 100 |
| HDL-C | 60 | 40 |
| VLDL-C | 20 | 40 |
| Triglycerides (TG) | 100 | 200 |
| Non-HDL-C | 120 | 160 |
| TC/HDL-C ratio | 3.0 | 4.5 |
| TG/HDL-C ratio | 1.6 | 5.0 |
| LDL-C, low-density lipoprotein cholesterol | ||
| HDL-C, high-density lipoprotein cholesterol | ||
| VLDL-C, very-low-density lipoprotein cholesterol | ||
Both patients have the same desirable TC and LDL-C values. However, further analysis reveals an abnormal TC/HDL-C ratio and an abnormal non-HDL-C level in patient 2. This finding indicates a higher risk of CVD.
In addition, the TG/HDL-C ratio of 5.0 in patient 2 is highly suggestive of small-LDL phenotype B. That designation means that this patient will have 40% to 70% more LDL particles to traffic her LDL-C than patient 1, who appears to have LDL of normal size.27 The elevated VLDL-C of patient 2 indicates the presence of VLDL remnants, which predict risk above that conveyed by LDL-C.7
The typical clinician, looking only at TC or LDL-C, would miss the increased risk (high apoB) in patient 2. Obvious clues to her lipoprotein pathology are the elevated TG and reduced HDL-C (TG-HDL axis disorder). Beyond elevated TG and reduced HDL-C, patient 2 is also likely to have increased waist size, subtle hypertension, and possibly impaired fasting glucose—three additional parameters of metabolic syndrome.7,10,25
Focus on lipoprotein particle concentrations
To most accurately predict lipid-related CVD risk, you must determine which patients have elevated numbers of atherogenic lipoproteins using actual particle concentrations. In most practices, lipoprotein particle numbers must be estimated by scrutinizing all of the lipid concentrations and ratios (not simply LDL-C).
TC and, especially, LDL-C are apoB and LDL-P surrogates, but the best lipid concentration estimate of apoB is the calculated non-HDL-C value. By subtracting HDL-C from TC, it is possible to identify the cholesterol not in the HDL particles but in all of the potentially atherogenic apoB particles. In essence, non-HDL-C is VLDL-C plus LDL-C. This equation yields a better apoB or LDL-P proxy, compared with LDL-C alone.18 If a patient has reached her LDL-C goal but still has a high non-HDL-C level, we can assume that there are still too many apoB particles and that they are contributing to residual risk.
Because LDL is the predominant apoB species, non-HDL-C is the best lipid concentration predictor of LDL-P.15 Because neither TC nor HDL-C assays require a patient to fast, non-HDL-C is accurate in nonfasting patients, making it a very practical way to screen for CVD risk.8 In the Women’s Health Study, which involved mostly healthy women, non-HDL-C predicted the risk of coronary heart disease as well as apoB did, but not as well as LDL-P.22,23 In independent, separately published analyses from the Framingham Off-spring Study, LDL-P was a better predictor of risk than LDL-C and apoB.15,24
NCEP ATP-III guidelines introduced non-HDL-C as a secondary goal of therapy in patients with TG >200 mg/dL. Subsequent data indicate that non-HDL-C is always a better predictor of risk than LDL-C is, regardless of TG levels.18
The AHA Women’s Guideline was the first to set a desired non-HDL-C level (130 mg/dL) independent of the TG value.10 Because a normal VLDL-C concentration is 30 mg/dL, the non-HDL-C goal is 30 mg/dL above the desired LDL-C goal. For example, if the desired LDL-C value is 100 mg/dL, the non-HDL-C goal is 130 mg/dL. If the desired LDL-C goal is 70 mg/dL—as it is in a patient at very high risk—the non-HDL-C goal would be 100 mg/dL ( FIGURE ).9,11
Insulin resistance diminishes accuracy of lipid profile
The ability to predict lipoprotein particle concentrations using the lipid profile becomes far less accurate in situations associated with insulin resistance and metabolic syndrome in patients who have TG-HDL axis disorders. In women, these disorders are typified by an elevation of TG >150 mg/dL and a decrease in HDL-C <50 mg/dL, with borderline or normal LDL-C levels.25
As TG begins to rise above 120 mg/dL, hepatic secretion of TG-rich VLDL particles increases. As VLDL-TG is hydrolyzed by lipoprotein lipase in muscle and fat cells, in a process termed lipolysis, VLDL shrinks and transforms into IDL. Ultimately, unless it is cleared by hepatic LDL receptors, the IDL undergoes additional lipolysis by hepatic lipase and transforms into LDL particles. Because of their longer half-life, these LDL particles accumulate, further elevating apoB and LDL-P.
In the presence of TG-rich VLDL and chylomicrons, additional pathologic particle remodeling occurs. By way of a lipid transfer protein called cholesteryl ester transfer protein (CETP), some of the TG molecules present in TG-rich lipoproteins are exchanged for cholesteryl esters in LDL and HDL. This lipid transfer creates LDL and HDL that are TG-rich and cholesterol-poor, enabling additional TG lipolysis by hepatic lipase to create smaller LDL and HDL. The latter is so small that it can pass through renal glomeruli and be excreted, leading to reductions of HDL-P, apoA-I, and HDL-C.
Also created in this process are smaller, atherogenic, cholesterol-rich VLDL and chylomicron remnants, diagnosable by an elevated VLDL-C. Patients who have this pathology typically have elevated TG, reduced HDL-C, variable LDL-C, and an increased TG/HDL-C ratio (>3.8), which are indicative of too many small LDL particles (high apoB, LDL-P) and reduced number of HDL particles (high apoB/A-I ratio).26,27
Such a scenario, typical of TG-HDL axis disorders, explains much of the risk associated with rising TG levels and is very common in premenopausal women who have insulin-resistant states such as type 2 diabetes or polycystic ovary syndrome and in menopausal women who have insulin resistance and coronary artery disease.1
LDL-C and LDL-P do not always correlate
Because the volume of a lipoprotein is a function of its radius cubed (V = 4/3πr3),14 a patient who has small LDL will require up to 40% to 70% more LDL particles to traffic a given amount of LDL-C. In such a patient, there is often little correlation between LDL-C and LDL-P or apoB values. Regardless of the LDL-C, the apoB, LDL-P, or non-HDL-C is often elevated.28 This risk, which cannot be predicted by looking only at LDL-C, is the main reason guidelines advocate the use of non-HDL-C or the TC/HDL-C ratio.8,11 (See the case studies.)
In summary, a large part of the risk of CVD seen in patients who have low HDL-C derives from the associated increase in the number of apoB particles, mostly composed of small LDL, as well as an increase in remnant particles.15,21,28 This crucial point explains why treatment of low HDL-C states should always first target apoB or LDL-P (LDL-C and non-HDL-C), rather than apoA-I or HDL-C ( TABLES 3 and 4 ).8,9
TABLE 3
Lipid markers of small low-density lipoproteins
| High-density lipoprotein cholesterol (HDL-C) <50 mg/dL |
| Triglyceride (TG) >130–150 mg/dL |
| Total cholesterol/HDL-C ratio >4.0 with normal low-density lipoprotein cholesterol (LDL-C) |
| TG/HDL-C ratio >3.8 in women |
| Unremarkable LDL-C but elevated non-HDL-C |
TABLE 4
Lipid markers of remnant lipoproteins
| Triglyceride (TG) >150–200 mg/dL |
| Very-low-density lipoprotein cholesterol >30 mg/dL |
| Unremarkable low-density lipoprotein cholesterol with elevated non-high-density lipoprotein cholesterol (HDL-C) |
| Low HDL-C in insulin-resistant patients |
| Elevated total cholesterol/HDL-C ratio and TG >150 mg/dL |
A few words of advice
The driving forces of atherogenesis are increased numbers of apoB-containing lipoproteins and impaired endothelial integrity. ApoB and LDL-P are the available lab assays that most accurately quantify atherogenic particle number.
The lipid-concentration surrogates that you should be using to better predict apoB and CVD risk are:
- TC (unless HDL-C is very high)
- LDL-C
- Non-HDL-C
- TC/HDL-C ratio
- TG/HDL-C ratio.
Because LDL is by far the most numerous of the apoB particles present in plasma, it is the primary agent of atherogenesis. However, apoB and LDL-P do not correlate with LDL-C when LDL particles are small, are TG-rich and cholesterol-poor, or simply cholesterol-poor (seen in some patients who have low LDL-C levels).7,15
Both NCEP ATP-III and AHA Women’s Guidelines use the TC/HDL ratio as a powerful risk predictor. However, as a goal of therapy, these guidelines recommend normalizing LDL-C and then non-HDL-C.8,11 In reality, normalization of non-HDL-C takes care of LDL-C as well. For example, say a patient has LDL-C <100 mg/dL, but non-HDL-C >130 mg/dL or TC/HDL-C ratio >4. These readings indicate residual risk and suggest that an elevated number of apoB particles is present. Therapy to normalize non-HDL-C or, better yet, apoB/LDL-P, is warranted. The clue that residual risk is present even when LDL-C is normal is the reduction of HDL-C and elevation of TG and non-HDL-C.
1. Lloyd-Jones DM, O’Donnell CJ, D’Agostino RB, et al. Applicability of cholesterol-lowering primary prevention trials to a general population. The Framingham Heart Study. Arch Intern Med. 2001;161:949-954.
2. Biggerstaff KD, Wooten JS. Understanding lipoproteins as transporters of cholesterol and other lipids. Adv Physiol Educ. 2004;28:105-106.
3. Nordestgaard BG, Wooten R, Lewis B. Selective retention of VLDL, IDL and LDL in the arterial intima of genetically hyperlipidemic rabbits in vivo. Molecular size as a determinant of fractional loss from the intima-inner media. Arterioscler Thromb Vasc Biol. 1995;15:534-542.
4. Brunzell JD, Davidson M, Furberg CD, et al. Lipoprotein management in patients with cardiometabolic risk. Consensus statement from the American Diabetes Association and the American College of Cardiology Foundation. Diabetes Care. 2008;31:811-822.
5. Barter PJ, Ballantyne CM, Carmena R, et al. ApoB versus cholesterol in estimating cardiovascular risk and in guiding therapy: report of the thirty-person/ten-country panel. J Intern Med. 2006;259:247-258.
6. Walldius G, Jungner I, Holme I, Aastveit AH, Kolar W, Steiner E. High apolipoprotein B, low apolipoprotein A-I, and improvement in the prediction of fatal myocardial infarction (AMORIS study): a prospective study. Lancet. 2001;358:2026-2033.
7. Mudd JO, Borlaug BA, Johnson PV, et al. Beyond low-density lipoprotein cholesterol: defining the role of low-density lipoprotein heterogeneity in coronary artery disease. J Am Coll Cardiol. 2007;50:1735-1741.
8. Executive Summary of the Third Report of the National Cholesterol Education Program (NCEP) Expert Panel on Detection, Evaluation, and Treatment of High Blood Cholesterol in Adults (Adult Treatment Panel III). JAMA. 2001;285:2486-2497.
9. Grundy SM, Cleeman JI, Merz CN, et al. Implications of recent clinical trials for the National Cholesterol Education Program Adult Treatment Panel III Guidelines. Circulation. 2004;110:227-239.
10. Mosca L, Appel LJ, Benjamin EJ, et al. Evidence-based guidelines for cardiovascular disease prevention in women. Circulation. 2004;109:672-693.
11. Mosca L, Banka CL, Benjamin EJ, et al. Evidence-based guidelines for cardiovascular disease prevention in women: 2007 update. Circulation. 2007;115:1481.-
12. Sniderman AD. Apolipoprotein B versus non-high-density lipoprotein cholesterol. And the winner is… Circulation. 2005;112:3366-3367.
13. Sniderman AD, Marcovina SM. Apolipoprotein A-I and B. Clin Lab Med. 2006;26:733-750.
14. Jeyarajah EJ, Cromwell WC, Otvos JD. Lipoprotein particle analysis by nuclear magnetic resonance spectroscopy. Clin Lab Med. 2006;26:847-870.
15. Cromwell WC, Otvos JD, Keyes MJ, et al. LDL particle number and risk of future cardiovascular disease in the Framingham Off spring Study—implications for LDL management. J Clin Lipidol. 2007;1:583-592.
16. El Harchaoui K, van der Steeg WA, Stroes ES, et al. Value of low-density lipoprotein particle number and size as predictors of coronary artery disease in apparently healthy men and women: the EPIC-Norfolk Prospective Population Study. J Am Coll Cardiol. 2007;49:547-553.
17. Mora S, Szklo M, Otvos JD, et al. LDL particle subclasses, LDL particle size, and carotid atherosclerosis in the Multi-Ethnic Study of Atherosclerosis (MESA). Atherosclerosis. 2007;192:211-217.
18. Liu J, Sempos CT, Donahue RP, et al. Non-high-density lipoprotein and very-low-density lipoprotein cholesterol and their predictive risk values in coronary heart disease. Am J Cardiol. 2006;98:1363-1368.
19. National Cholesterol Education Program. Recommendations on lipoprotein measurement from the Working Group on Lipoprotein Measurement. National Institutes of Health. National Heart, Lung, and Blood Institute. NIH Publication No. 95-3044. Bethesda, Md: September 1995.
20. Dayspring T. High density lipoproteins: emerging knowledge. J Cardiometabol Syndr. 2007;2:59-62.
21. Cromwell WC. High-density lipoprotein associations with coronary heart disease: does measurement of cholesterol content give the best result? J Clin Lipidol. 2007;1:57-64.
22. Ridker PM, Rifai N, Cook NR, et al. Non-HDL cholesterol, apolipoproteins A-I and B100, standard lipid measures, lipid ratios, and CRP as risk factors for cardiovascular disease in women. JAMA. 2005;294:326.-
23. Blake GJ, Otvos JD, Rifai N, Ridker PM. Low-density lipoprotein particle concentration and size as determined by nuclear magnetic resonance spectroscopy as predictors of cardiovascular disease in women. Circulation. 2002;106:1930-1937.
24. Ingelsson E, Schaefer EJ, Contois JH, et al. Clinical utility of different lipid measures for prediction of coronary heart disease in men and women. JAMA. 2007;298:776-785.
25. Szapary PO, Rader DJ. The triglyceride-high-density lipoprotein axis: an important target of therapy. Am Heart J. 2004;148:211-221.
26. Davidson MH, Yannicelli D. New concepts in dyslipidemia in the metabolic syndrome and diabetes. Metab Syndr Relat Disord. 2006;4:299-314.
27. Hanak V, Munoz J, Teague J, Stanley A, Jr, Bittner V. Accuracy of the triglyceride to high-density lipoprotein cholesterol ratio for prediction of the low-density lipoprotein phenotype B. Am J Cardiol. 2004;94:219-222.
28. Kathiresan S, Otvos JD, Sullivan LM, et al. Increased small low-density lipoprotein particle number: a prominent feature of the metabolic syndrome in the Framingham Heart Study. Circulation. 2006;113:20-29.
Dr. Dayspring serves on the advisory board for LipoScience. Dr. Helmbold reports no financial relationships relevant to this article.
Add another item to your ever-growing list of responsibilities: monitoring your patients’ risk of atherosclerosis.
This task used to be the purview of internists and cardiologists but, because gynecologists are increasingly serving as a primary care provider, you need to learn to recognize and diagnose the many clinical expressions of atherosclerosis in your aging patients.
A crucial part of that knowledge is a thorough understanding of each and every lipid concentration parameter reported within the standard lipid profile. This article reviews those parameters, explains how to interpret them individually and in combination, and introduces a new paradigm: the analysis of lipoprotein particle concentrations as a more precise way to determine risk.
If used in its entirety, the lipid profile provides a significant amount of information about the presence or absence of pathologic lipoprotein concentrations. Far too many clinicians focus solely on low-density lipoprotein cholesterol (LDL-C) and ignore the rest of the profile. Failure to consider the other variables is one reason why atherosclerotic disease is underdiagnosed and undertreated in the United States in many patients—especially women.1
1. Look at the triglyceride (TG) level. If it is >500 mg/dL, treatment is indicated, and TG reduction takes precedence over all other lipid concentrations. If TG is <500 mg/dL, go to Step 2.
2. Look at the low-density lipoprotein cholesterol (LDL-C) level. If it is >190 mg/dL, drug therapy is indicated regardless of other findings. At lower levels, the need for therapy is based on the patient’s overall risk of cardiovascular disease (CVD). Therapeutic lifestyle recommendations are always indicated.
3. Look at high-density lipoprotein cholesterol (HDL-C). Increased risk is present if it is <50 mg/dL, the threshold for women. Do not assume that high HDL-C always means low CVD risk.
4. Calculate the total cholesterol (TC)/HDL-C ratio (a surrogate of apoB/apoA-I ratio). Increased risk is present if it is >4.0.
5. Calculate the non-HDL-C level (TC minus HDL-C). If it is >130 mg/dL (or >100 mg/dL in very-high-risk women), therapy is warranted. Newer data reveal that this calculation is always equal to, or better than, LDL-C at predicting CVD risk. Non-HDL-C is less valuable if TG is >500 mg/dL.
6. Calculate the TG/HDL-C ratio to estimate the size of LDL. If the ratio is >3.8, the likelihood of small LDL is 80%. (Small LDL usually has very high LDL-P.)
Why lipoproteins are important
There is only one absolute in atherosclerosis: Sterols—predominantly cholesterol—enter the artery wall, where they are oxidized, internalized by macrophages, and transformed into foam cells, the histologic hallmark of atherosclerosis. With the accumulation of foam cells, fatty streaks develop and, ultimately, so does complex plaque.
Lipids associated with cardiovascular disease (CVD) include:
- cholesterol
- noncholesterol sterols such as sitosterol, campesterol, and others of mostly plant or shellfish origin
- triacylglycerol, or triglycerides (TG)
- phospholipids.
Because lipids are insoluble in aqueous solutions such as plasma, they must be “trafficked” within protein-enwrapped particles called lipoproteins. The surface proteins that provide structure and solubility to lipoproteins are called apolipoproteins. A key concept is that, with their surface apolipoproteins and cholesterol core, certain lipoproteins are potential agents of atherogenesis in that they transport sterols into the artery wall.2
Estimation of the risk of CVD involves careful analysis of all standard lipid concentrations and their various ratios, and prediction of the potential presence of atherogenic lipoproteins. Successful prevention or treatment of atherosclerosis entails limiting the presence of atherogenic lipoproteins.
A new paradigm is on its way
The atherogenicity of lipoprotein particles is determined by particle concentration as well as other variables, including particle size, lipid composition, and distinct surface apolipoproteins.
Lipoproteins smaller than 70 nm in diameter are driven into the arterial intima primarily by concentration gradients, regardless of lipid composition or particle size.3 A recent Consensus Statement from the American Diabetes Association and the American College of Cardiology observed that quantitative analysis of these potentially atherogenic lipoproteins is one of the best lipid/lipoprotein-related determinants of CVD risk.4 Lipoprotein particle concentrations have emerged not only as superb predictors of risk, but also as goals of therapy.5-7
Because of cost, third-party reimbursement, varying test availability, and lack of interpretive knowledge, few clinicians routinely order lipoprotein quantification. Historically, CVD risk and goals of therapy have been based on lipid concentrations (the amount of lipids trafficked within lipoprotein cores) reported in the lipid profile. Guidelines from the National Cholesterol Education Program, Adult Treatment Panel III (NCEP ATP-III)8,9 and the American Heart Association (AHA) CVD Prevention in Women10,11 use lipid concentrations such as total cholesterol (TC), LDL-C, high-density lipoprotein cholesterol (HDL-C), and TG as estimates or surrogates of lipoprotein concentrations ( TABLE 1 ).
The day is rapidly approaching, however, when lipoprotein concentrations may replace the lipid profile in clinical practice. It is critical that clinicians develop a solid understanding of lipoprotein physiology and pathology.7,12 It also is crucial that we be as skilled as possible in accurately predicting lipoprotein pathology using all of the lipid concentration parameters present in the lipid panel.
TABLE 1
Desirable lipid values for women
| Lipid | Level (mg/dL) |
|---|---|
| Total cholesterol | <200 |
| Low-density lipoprotein (LDL) cholesterol | <100 |
| High-density lipoprotein (HDL) cholesterol | ≥50 |
| Triglycerides | <150 |
| Non-HDL-cholesterol | <130 |
| FOR VERY HIGH-RISK PATIENTS | |
| LDL-C | <70 |
| Non-HDL-C | <100 |
| Source: American Heart Association | |
How lipoproteins are analyzed
Lipoproteins can be separated into their components using any of several methodologies, including ultracentrifugation, electrophoresis, apolipoprotein content analysis, and nuclear magnetic resonance (NMR) spectroscopy. Of these, only the last two provide information on particle concentrations.13,14
Apolipoprotein content analysis reveals two major categories of particles:
- alpha-lipoproteins, or HDL, which contain two to four molecules of apolipoprotein A-I (apoA-I)
- beta-lipoproteins, a collective group of chylomicrons, very-low-density lipoproteins (VLDL), intermediate-density lipoproteins (IDL), and LDL, each containing a single molecule of apolipoprotein B (apoB). Because of very different half-lives (chylomicrons, 1 hour; VLDL, 2–6 hours; IDL, 1–2 hours; LDL, 2–3 days), the great majority (90% to 95%) of apoB-containing particles are LDL. Although apoB measurement yields quantification of all beta-lipoproteins, it is primarily a surrogate of LDL particle (LDL-P) concentration.15
Individual particle concentrations, determined by NMR spectroscopy, are reported as VLDL-P, IDL-P, LDL-P, and HDL-P (see the “Glossary”).14
Several epidemiologic studies that enrolled both genders found the best predictors of risk to be:
- elevated levels of apoB or LDL-P and reduced levels of apoA-I or HDL-P
- a high apoB/apoA-I ratio or LDL-P/HDL-P ratio.6,13,14
After adjustment for lipoprotein concentration data (apoB or LDL-P), other lipoprotein characteristics such as particle lipid content, size, or composition, for the most part, had no statistically significant relationship with the risk of cardiovascular disease.16,17
Lipids and lipoproteins: A glossary
| Variable | What is it? |
|---|---|
| Triglycerides (TG) | The triacylglycerol concentration within all of the TG-trafficking lipoproteins in 100 mL or 1 dL of plasma |
| Total cholesterol (TC) | Cholesterol content of all lipoproteins in 1 dL of plasma |
| Low-density lipoprotein (LDL) cholesterol | Cholesterol content of all intermediate-density lipoprotein (IDL) and LDL particles in 1 dL of plasma |
| High-density lipoprotein (HDL) cholesterol | Cholesterol content of all HDL particles in 1 dL of plasma |
| Very-low-density lipoprotein (VLDL) cholesterol | Cholesterol content of all VLDL particles in 1 dL of plasma |
| Remnant-C | Cholesterol content of all remnants in 1 dL of plasma |
| Lipoprotein (a) [Lp(a)] cholesterol | Cholesterol content of LDL particles that have apo(a) attached |
| Lp(a) concentration | Concentration of apo(a) in 1 dL of plasma |
| Non-HDL cholesterol | Cholesterol within all apoB particles in 1 dL of plasma |
| LDL-P | Number of LDL particles in 1 L of plasma (expressed in nmol/L). This represents LDL particles of all sizes |
| Small LDL-P | Number of small and intermediate LDL particles in 1 L of plasma (nmol/L) |
| HDL-P | Number of HDL particles in 1 L of plasma (μmol/L). HDL-P is also reported as large, intermediate, and small HDL-P (μmol/L) |
| VLDL-P | Number of VLDL particles in 1 L of plasma (nmol/L) |
| IDL-P | Number of IDL particles in 1 L of plasma (nmol/L) |
| LDL size | Diameter of the predominant LDL species:
|
Using lipid measurements to estimate lipoproteins
Total cholesterol represents the cholesterol content within all lipoproteins in 1 dL of plasma. Because beta-lipoproteins are considerably larger than alpha-lipoproteins, approximately 75% of total cholesterol is carried in the apoB-containing particles, making TC an apoB surrogate.
VLDL-C, an often ignored variable, is not measured but calculated using the Friedewald formula, dividing TG by five. This calculation assumes—often erroneously as TG levels rise—that TG consists only of VLDL particles and that VLDL composition contains five times more TG than cholesterol molecules.
A desirable TG level is <150 mg/dL, so normal VLDL-C is 150/5 or <30 mg/dL.
LDL-C is also an apoB surrogate
Although VLDL-C is a weak apoB surrogate,15 data from the Framingham Heart Study showed it to be a good predictor of VLDL remnant particles.18 However, because the vast majority of beta-lipoproteins are LDL, LDL-C (especially if elevated) is a better apoB surrogate than VLDL-C and is the primary CVD risk factor and goal of therapy in every current guideline.
LDL-C is usually a calculated value using the formula:
LDL-C = TC – (HDL-C + VLDL-C)
Upon special order, laboratories can directly measure LDL-C. This option is most useful when TG levels are high, rendering the Friedewald formula less accurate ( TABLE 2 ).19 For population cut points and desirable goals of therapy for lipid and lipoprotein concentrations, see the FIGURE .
TABLE 2
How lipid concentrations are determined
| TC = apoA-I-C + apoB-C |
| TC = HDL-C + LDL-C + VLDL-C + IDL-C + Chylomicron-C + Lp(a)-C + Remnant-C |
| In a fasting patient under normal circumstances, there are no chylomicrons and remnants (smaller chylomicrons or VLDL particles) and very few, if any, IDL particles. These are postprandial lipoproteins. Most patients do not have Lp(a) pathology. Therefore, the lipid concentration formula simplifies: |
| TC = HDL-C + LDL-C + VLDL-C |
| VLDL-C is estimated by TG/5 (assumes that all TG is in VLDL and that VLDL TG:cholesterol composition is 5:1). Therefore: |
| TC = HDL-C + LDL-C + TG/5 |
| LDL-C = TC – (HDL-C + TG/5) |
| Non-HDL-C = TC – HDL-C |
| In actuality, the calculated or directly measured LDL-C values in the standard lipid panel represent LDL-C + IDL-C + Lp(a)-C. However, because labs do not usually separate IDL and Lp(a) particles from LDL (without significant added expense), only total LDL-C is reported. |
FIGURE Population percentile cut points and goals for LDL-C, LDL-P, ApoB, and non-HDL-C
HDL-C, apoA-I are inversely related to cardiovascular risk
The epidemiologic data strongly indicate that both HDL-C and apoA-I are strongly and inversely related to CVD risk.6 HDL particles are a heterogenous collection of:
- unlipidated apoA-I
- very small pre-beta HDL
- more mature, lipidated HDL3 and HDL2 species (HDL3 smaller than HDL2).
NMR nomenclature identifies the smaller HDL species as H1 and H2 and the larger HDL species as H4 and H5.14 The smaller HDL species also contain apoA-II.
Although HDL can acquire cholesterol from any cell, including arterial-wall foam cells, the majority of HDL lipidation occurs in the liver or proximal small intestine, after which it is trafficked to steroidogenic tissue, adipocytes, or back to the liver. Normally, HDL carries little TG.20 The only lipid concentration that can serve as a surrogate of apoA-I or HDL-P is HDL-C, where the assumption is that higher HDL-C indicates higher apoA-I, and vice versa.
In reality, the correlation between apoA-I and HDL-C varies because each HDL particle can have from two to four apoA-I molecules, and the volume of cholesterol within the particle is a function of particle size and its TG content. For the most part, total HDL-C is indicative of the cholesterol carried in the larger, mature HDL2 (H4, H5) particles; patients with low HDL-C typically lack these mature, lipidated HDL particles.
Because HDL rapidly and repeatedly lipidates and then delipidates, there is no relationship between the HDL-C level and the complex dynamic process termed reverse cholesterol transport process. Neither HDL-C, nor apoA-I, nor HDL-P, nor HDL size is consistently related to HDL particle functionality—i.e., the ability of HDL to lipidate or delipidate, appropriately traffic cholesterol, or perform numerous other nonlipid antiatherogenic functions.20,21
Two premenopausal women undergo assessment of their basic lipid panel, with these results:
| LIPID | PATIENT 1 | PATIENT 2 |
|---|---|---|
| Total cholesterol (TC) | 180 | 180 |
| LDL-C | 100 | 100 |
| HDL-C | 60 | 40 |
| VLDL-C | 20 | 40 |
| Triglycerides (TG) | 100 | 200 |
| Non-HDL-C | 120 | 160 |
| TC/HDL-C ratio | 3.0 | 4.5 |
| TG/HDL-C ratio | 1.6 | 5.0 |
| LDL-C, low-density lipoprotein cholesterol | ||
| HDL-C, high-density lipoprotein cholesterol | ||
| VLDL-C, very-low-density lipoprotein cholesterol | ||
Both patients have the same desirable TC and LDL-C values. However, further analysis reveals an abnormal TC/HDL-C ratio and an abnormal non-HDL-C level in patient 2. This finding indicates a higher risk of CVD.
In addition, the TG/HDL-C ratio of 5.0 in patient 2 is highly suggestive of small-LDL phenotype B. That designation means that this patient will have 40% to 70% more LDL particles to traffic her LDL-C than patient 1, who appears to have LDL of normal size.27 The elevated VLDL-C of patient 2 indicates the presence of VLDL remnants, which predict risk above that conveyed by LDL-C.7
The typical clinician, looking only at TC or LDL-C, would miss the increased risk (high apoB) in patient 2. Obvious clues to her lipoprotein pathology are the elevated TG and reduced HDL-C (TG-HDL axis disorder). Beyond elevated TG and reduced HDL-C, patient 2 is also likely to have increased waist size, subtle hypertension, and possibly impaired fasting glucose—three additional parameters of metabolic syndrome.7,10,25
Focus on lipoprotein particle concentrations
To most accurately predict lipid-related CVD risk, you must determine which patients have elevated numbers of atherogenic lipoproteins using actual particle concentrations. In most practices, lipoprotein particle numbers must be estimated by scrutinizing all of the lipid concentrations and ratios (not simply LDL-C).
TC and, especially, LDL-C are apoB and LDL-P surrogates, but the best lipid concentration estimate of apoB is the calculated non-HDL-C value. By subtracting HDL-C from TC, it is possible to identify the cholesterol not in the HDL particles but in all of the potentially atherogenic apoB particles. In essence, non-HDL-C is VLDL-C plus LDL-C. This equation yields a better apoB or LDL-P proxy, compared with LDL-C alone.18 If a patient has reached her LDL-C goal but still has a high non-HDL-C level, we can assume that there are still too many apoB particles and that they are contributing to residual risk.
Because LDL is the predominant apoB species, non-HDL-C is the best lipid concentration predictor of LDL-P.15 Because neither TC nor HDL-C assays require a patient to fast, non-HDL-C is accurate in nonfasting patients, making it a very practical way to screen for CVD risk.8 In the Women’s Health Study, which involved mostly healthy women, non-HDL-C predicted the risk of coronary heart disease as well as apoB did, but not as well as LDL-P.22,23 In independent, separately published analyses from the Framingham Off-spring Study, LDL-P was a better predictor of risk than LDL-C and apoB.15,24
NCEP ATP-III guidelines introduced non-HDL-C as a secondary goal of therapy in patients with TG >200 mg/dL. Subsequent data indicate that non-HDL-C is always a better predictor of risk than LDL-C is, regardless of TG levels.18
The AHA Women’s Guideline was the first to set a desired non-HDL-C level (130 mg/dL) independent of the TG value.10 Because a normal VLDL-C concentration is 30 mg/dL, the non-HDL-C goal is 30 mg/dL above the desired LDL-C goal. For example, if the desired LDL-C value is 100 mg/dL, the non-HDL-C goal is 130 mg/dL. If the desired LDL-C goal is 70 mg/dL—as it is in a patient at very high risk—the non-HDL-C goal would be 100 mg/dL ( FIGURE ).9,11
Insulin resistance diminishes accuracy of lipid profile
The ability to predict lipoprotein particle concentrations using the lipid profile becomes far less accurate in situations associated with insulin resistance and metabolic syndrome in patients who have TG-HDL axis disorders. In women, these disorders are typified by an elevation of TG >150 mg/dL and a decrease in HDL-C <50 mg/dL, with borderline or normal LDL-C levels.25
As TG begins to rise above 120 mg/dL, hepatic secretion of TG-rich VLDL particles increases. As VLDL-TG is hydrolyzed by lipoprotein lipase in muscle and fat cells, in a process termed lipolysis, VLDL shrinks and transforms into IDL. Ultimately, unless it is cleared by hepatic LDL receptors, the IDL undergoes additional lipolysis by hepatic lipase and transforms into LDL particles. Because of their longer half-life, these LDL particles accumulate, further elevating apoB and LDL-P.
In the presence of TG-rich VLDL and chylomicrons, additional pathologic particle remodeling occurs. By way of a lipid transfer protein called cholesteryl ester transfer protein (CETP), some of the TG molecules present in TG-rich lipoproteins are exchanged for cholesteryl esters in LDL and HDL. This lipid transfer creates LDL and HDL that are TG-rich and cholesterol-poor, enabling additional TG lipolysis by hepatic lipase to create smaller LDL and HDL. The latter is so small that it can pass through renal glomeruli and be excreted, leading to reductions of HDL-P, apoA-I, and HDL-C.
Also created in this process are smaller, atherogenic, cholesterol-rich VLDL and chylomicron remnants, diagnosable by an elevated VLDL-C. Patients who have this pathology typically have elevated TG, reduced HDL-C, variable LDL-C, and an increased TG/HDL-C ratio (>3.8), which are indicative of too many small LDL particles (high apoB, LDL-P) and reduced number of HDL particles (high apoB/A-I ratio).26,27
Such a scenario, typical of TG-HDL axis disorders, explains much of the risk associated with rising TG levels and is very common in premenopausal women who have insulin-resistant states such as type 2 diabetes or polycystic ovary syndrome and in menopausal women who have insulin resistance and coronary artery disease.1
LDL-C and LDL-P do not always correlate
Because the volume of a lipoprotein is a function of its radius cubed (V = 4/3πr3),14 a patient who has small LDL will require up to 40% to 70% more LDL particles to traffic a given amount of LDL-C. In such a patient, there is often little correlation between LDL-C and LDL-P or apoB values. Regardless of the LDL-C, the apoB, LDL-P, or non-HDL-C is often elevated.28 This risk, which cannot be predicted by looking only at LDL-C, is the main reason guidelines advocate the use of non-HDL-C or the TC/HDL-C ratio.8,11 (See the case studies.)
In summary, a large part of the risk of CVD seen in patients who have low HDL-C derives from the associated increase in the number of apoB particles, mostly composed of small LDL, as well as an increase in remnant particles.15,21,28 This crucial point explains why treatment of low HDL-C states should always first target apoB or LDL-P (LDL-C and non-HDL-C), rather than apoA-I or HDL-C ( TABLES 3 and 4 ).8,9
TABLE 3
Lipid markers of small low-density lipoproteins
| High-density lipoprotein cholesterol (HDL-C) <50 mg/dL |
| Triglyceride (TG) >130–150 mg/dL |
| Total cholesterol/HDL-C ratio >4.0 with normal low-density lipoprotein cholesterol (LDL-C) |
| TG/HDL-C ratio >3.8 in women |
| Unremarkable LDL-C but elevated non-HDL-C |
TABLE 4
Lipid markers of remnant lipoproteins
| Triglyceride (TG) >150–200 mg/dL |
| Very-low-density lipoprotein cholesterol >30 mg/dL |
| Unremarkable low-density lipoprotein cholesterol with elevated non-high-density lipoprotein cholesterol (HDL-C) |
| Low HDL-C in insulin-resistant patients |
| Elevated total cholesterol/HDL-C ratio and TG >150 mg/dL |
A few words of advice
The driving forces of atherogenesis are increased numbers of apoB-containing lipoproteins and impaired endothelial integrity. ApoB and LDL-P are the available lab assays that most accurately quantify atherogenic particle number.
The lipid-concentration surrogates that you should be using to better predict apoB and CVD risk are:
- TC (unless HDL-C is very high)
- LDL-C
- Non-HDL-C
- TC/HDL-C ratio
- TG/HDL-C ratio.
Because LDL is by far the most numerous of the apoB particles present in plasma, it is the primary agent of atherogenesis. However, apoB and LDL-P do not correlate with LDL-C when LDL particles are small, are TG-rich and cholesterol-poor, or simply cholesterol-poor (seen in some patients who have low LDL-C levels).7,15
Both NCEP ATP-III and AHA Women’s Guidelines use the TC/HDL ratio as a powerful risk predictor. However, as a goal of therapy, these guidelines recommend normalizing LDL-C and then non-HDL-C.8,11 In reality, normalization of non-HDL-C takes care of LDL-C as well. For example, say a patient has LDL-C <100 mg/dL, but non-HDL-C >130 mg/dL or TC/HDL-C ratio >4. These readings indicate residual risk and suggest that an elevated number of apoB particles is present. Therapy to normalize non-HDL-C or, better yet, apoB/LDL-P, is warranted. The clue that residual risk is present even when LDL-C is normal is the reduction of HDL-C and elevation of TG and non-HDL-C.
1. Lloyd-Jones DM, O’Donnell CJ, D’Agostino RB, et al. Applicability of cholesterol-lowering primary prevention trials to a general population. The Framingham Heart Study. Arch Intern Med. 2001;161:949-954.
2. Biggerstaff KD, Wooten JS. Understanding lipoproteins as transporters of cholesterol and other lipids. Adv Physiol Educ. 2004;28:105-106.
3. Nordestgaard BG, Wooten R, Lewis B. Selective retention of VLDL, IDL and LDL in the arterial intima of genetically hyperlipidemic rabbits in vivo. Molecular size as a determinant of fractional loss from the intima-inner media. Arterioscler Thromb Vasc Biol. 1995;15:534-542.
4. Brunzell JD, Davidson M, Furberg CD, et al. Lipoprotein management in patients with cardiometabolic risk. Consensus statement from the American Diabetes Association and the American College of Cardiology Foundation. Diabetes Care. 2008;31:811-822.
5. Barter PJ, Ballantyne CM, Carmena R, et al. ApoB versus cholesterol in estimating cardiovascular risk and in guiding therapy: report of the thirty-person/ten-country panel. J Intern Med. 2006;259:247-258.
6. Walldius G, Jungner I, Holme I, Aastveit AH, Kolar W, Steiner E. High apolipoprotein B, low apolipoprotein A-I, and improvement in the prediction of fatal myocardial infarction (AMORIS study): a prospective study. Lancet. 2001;358:2026-2033.
7. Mudd JO, Borlaug BA, Johnson PV, et al. Beyond low-density lipoprotein cholesterol: defining the role of low-density lipoprotein heterogeneity in coronary artery disease. J Am Coll Cardiol. 2007;50:1735-1741.
8. Executive Summary of the Third Report of the National Cholesterol Education Program (NCEP) Expert Panel on Detection, Evaluation, and Treatment of High Blood Cholesterol in Adults (Adult Treatment Panel III). JAMA. 2001;285:2486-2497.
9. Grundy SM, Cleeman JI, Merz CN, et al. Implications of recent clinical trials for the National Cholesterol Education Program Adult Treatment Panel III Guidelines. Circulation. 2004;110:227-239.
10. Mosca L, Appel LJ, Benjamin EJ, et al. Evidence-based guidelines for cardiovascular disease prevention in women. Circulation. 2004;109:672-693.
11. Mosca L, Banka CL, Benjamin EJ, et al. Evidence-based guidelines for cardiovascular disease prevention in women: 2007 update. Circulation. 2007;115:1481.-
12. Sniderman AD. Apolipoprotein B versus non-high-density lipoprotein cholesterol. And the winner is… Circulation. 2005;112:3366-3367.
13. Sniderman AD, Marcovina SM. Apolipoprotein A-I and B. Clin Lab Med. 2006;26:733-750.
14. Jeyarajah EJ, Cromwell WC, Otvos JD. Lipoprotein particle analysis by nuclear magnetic resonance spectroscopy. Clin Lab Med. 2006;26:847-870.
15. Cromwell WC, Otvos JD, Keyes MJ, et al. LDL particle number and risk of future cardiovascular disease in the Framingham Off spring Study—implications for LDL management. J Clin Lipidol. 2007;1:583-592.
16. El Harchaoui K, van der Steeg WA, Stroes ES, et al. Value of low-density lipoprotein particle number and size as predictors of coronary artery disease in apparently healthy men and women: the EPIC-Norfolk Prospective Population Study. J Am Coll Cardiol. 2007;49:547-553.
17. Mora S, Szklo M, Otvos JD, et al. LDL particle subclasses, LDL particle size, and carotid atherosclerosis in the Multi-Ethnic Study of Atherosclerosis (MESA). Atherosclerosis. 2007;192:211-217.
18. Liu J, Sempos CT, Donahue RP, et al. Non-high-density lipoprotein and very-low-density lipoprotein cholesterol and their predictive risk values in coronary heart disease. Am J Cardiol. 2006;98:1363-1368.
19. National Cholesterol Education Program. Recommendations on lipoprotein measurement from the Working Group on Lipoprotein Measurement. National Institutes of Health. National Heart, Lung, and Blood Institute. NIH Publication No. 95-3044. Bethesda, Md: September 1995.
20. Dayspring T. High density lipoproteins: emerging knowledge. J Cardiometabol Syndr. 2007;2:59-62.
21. Cromwell WC. High-density lipoprotein associations with coronary heart disease: does measurement of cholesterol content give the best result? J Clin Lipidol. 2007;1:57-64.
22. Ridker PM, Rifai N, Cook NR, et al. Non-HDL cholesterol, apolipoproteins A-I and B100, standard lipid measures, lipid ratios, and CRP as risk factors for cardiovascular disease in women. JAMA. 2005;294:326.-
23. Blake GJ, Otvos JD, Rifai N, Ridker PM. Low-density lipoprotein particle concentration and size as determined by nuclear magnetic resonance spectroscopy as predictors of cardiovascular disease in women. Circulation. 2002;106:1930-1937.
24. Ingelsson E, Schaefer EJ, Contois JH, et al. Clinical utility of different lipid measures for prediction of coronary heart disease in men and women. JAMA. 2007;298:776-785.
25. Szapary PO, Rader DJ. The triglyceride-high-density lipoprotein axis: an important target of therapy. Am Heart J. 2004;148:211-221.
26. Davidson MH, Yannicelli D. New concepts in dyslipidemia in the metabolic syndrome and diabetes. Metab Syndr Relat Disord. 2006;4:299-314.
27. Hanak V, Munoz J, Teague J, Stanley A, Jr, Bittner V. Accuracy of the triglyceride to high-density lipoprotein cholesterol ratio for prediction of the low-density lipoprotein phenotype B. Am J Cardiol. 2004;94:219-222.
28. Kathiresan S, Otvos JD, Sullivan LM, et al. Increased small low-density lipoprotein particle number: a prominent feature of the metabolic syndrome in the Framingham Heart Study. Circulation. 2006;113:20-29.
The unbearable unhappiness of the ObGyn: A crisis looms
Dr. Weinstein has no financial relationships relevant to this article.
“I CAN’T GET NO SATISFACTION”—Mick Jagger and Keith Richards, 1965
“FOR THE TIMES THEY ARE A-CHANGIN’”—Bob Dylan, 1964
The lyrics of two songs written more than 40 years ago are an excellent way to describe today’s physician workforce. Regrettably, many physicians who grew up listening to these performer-philosophers have yet to heed the words of Bob Dylan. Instead, they echo the sentiments of Mick Jagger and Keith Richards without doing much to correct the problem.
Why the decline in work satisfaction? Many reasons have been cited, including:
- loss of autonomy
- economic pressures
- an increasing degree of government and insurer control over practice
- the liability crisis
- a divergence between professional and personal expectations
- physicians’ own high career expectations
- a desire for more time for family and self.1
The growing level of dissatisfaction with the practice of medicine has, clearly, reached crisis level: Twenty percent of all physicians report that they are dissatisfied with their career.2,3 And lack of fulfillment appears to be developing much earlier in the life of a physician than has so far been appreciated. Not only is it showing up in residents, job dissatisfaction is evident even among medical students. It is quite revealing—and depressing—that 40% of young physicians would choose not to go to medical school if they had to choose again.
In this article, I examine the characteristics of the dissatisfied physician, explain the apparent reasons for this lack of fulfillment, and propose a number of steps that can be taken to salvage the situation, lengthen the time that a physician works, on average, and add flexibility and variety to work life.

Ultimate effect of dissatisfaction? Loss of a physician
An unhappy physician is two or three times more likely to leave the profession or decrease the number of hours worked than a satisfied physician is.4 And when a physician leaves the workforce, we lose a valuable resource. The estimated replacement cost for a physician in 1992 to 1999 dollars was $250,000, and that cost is at least 50% higher today.5,6 Besides the monetary loss, there is disruption to other members of the practice group and to patients when a physician leaves the profession.
Landon and colleagues found that the average age of a physician working full-time was 47 years, compared with 53 years for a physician who was working fewer than 20 hours a week and 63 years for a physician at retirement.4 However, these data are approximately 7 years old; current figures are likely to show curtailment of work hours at even younger ages.
It is not realistic to expect that 1) the educational system will increase medical school class size and 2) enough physicians will finish training and develop a mature practice in the time necessary to offset the number of physicians now altering their workloads or exiting the workforce.
Does gender influence the satisfaction rate?
The profession of medicine has changed strikingly over the past 20 years. Once male-dominated, it now is gender-equal and, in some specialties, female-dominated.
This rapid gender shift in medicine has received much of the blame for the decline in physician satisfaction. However, data suggest that, among full-time academic faculty who do not have children, productivity and career satisfaction are the same for women as for men.7 A recent study of internists found few gender differences in work-life balance, work hours, and attitudes toward patient care.8
Among surgeons, an equal percentage of each gender believes that the work schedule leaves too little time for personal and family life.9 Although it has been suggested that women prefer to work fewer hours than men, evidence indicates that younger men have the same desire to work less and spend more time with family.10
That said, there are some gender-related differences in medical workforce characteristics:
- Women reduce their clinical activity during childbearing and childrearing and retire 5.5 years earlier than men do4
- In obstetrics, women younger than 40 years are four times more likely to reduce work hours or completely stop practice than male obstetricians are11
- Among surgeons, 90% of women live in dual-career households, compared with 50% of men9
- When the surgeon is male, children are cared for by spouses in 63% of households; when the surgeon is female, children are cared for by an employee in 88% of households9
- Among surgical subspecialists, women are more likely to be divorced or separated and to have fewer or no children; 34% spend 21 to 40 hours weekly on household management.12
Despite these differences, a review of the literature on physician dissatisfaction suggests that the gender shift in medicine is not responsible for the growing level of dissatisfaction.
After much talk of an impending physician shortage, many medical schools have increased class size, and a number of new medical schools recently opened or are on their way to opening. The Association of American Medical Colleges recommends that medical school class size increase 30% by 2015.32
Some experts believe that there will be a dearth of generalist physicians; others think that specialists will be in short supply.
Possible causes of the shortage
The coming physician shortage has been attributed to a number of variables, including:
- an aging population, which will require a greater level of health care
- aging physicians, with as many as 30% of the current workforce expected to retire during the next 5 to 10 years
- an increase in the number of female physicians who work fewer hours than their male counterparts
- an increase in physicians from Generations X and Y, who place greater emphasis on lifestyle and personal time.33
Cooper, who has written extensively on physician workforce numbers, believes that placement of the Medicare-funded graduate medical education (GME) position cap approximately 10 years ago has been the major driver of the physician shortage. Improvement will come, he says, only when this cap is lifted or altered.34
Are there enough doctors?
The number of physicians per capita is at its highest point in 50 years in the United States, yet the Council of Graduate Medical Education predicts a 10% shortfall by 2020.35 When regions with a high supply of physicians are compared with regions with a low supply, outcomes are the same, and patients do not perceive any physician shortfall.36,37 It is interesting that, in regions where there is a high supply of physicians, physicians perceive there to be greater difficulty in providing the quality of care they desire for their patients.38
A greater supply of physicians leads to more tests and procedures and higher costs.37 Goodman and Fisher believe that having more specialists decreases the flexibility of the physician workforce. They also believe that the GME cap should be maintained, funding should be reallocated to the more cognitive specialties, and the current payment system should be reformed.35 (Any physician who has attended a hospital medical executive committee meeting knows that reallocation of resources to cognitive specialties will never happen: Hospitals want more surgical procedures to boost their bottom line.)
A review of the many studies and opinions published about current work-force numbers and future needs makes it obvious that very little evidence exists to support any of the recommendations made by experts. Almost all studies mention adding to the workforce with minimal discussion about how to keep the current workforce from leaving—a much better use of resources.
Age is the determining factor
The Baby Boomer generation (born between 1946 and 1964), which had largely controlled all aspects of medicine, especially leadership roles, is rapidly being replaced by physicians from Generations X and Y (born between 1965 and 1980, and 1981 and 2001, respectively), who value personal time and lifestyle much more than “Boomers” have.13
These younger physicians demand flexibility and variety in their careers. They grow dissatisfied when these aspects of their work lives fall out of their control. And when it comes to choosing a specialty in which to practice, these physicians see a balanced lifestyle as the key variable.13
Much of the discussion of dissatisfaction in medicine has contrasted Baby Boomers with subsequent generations. The Boomer physician typically has a traditional marriage, with the spouse doing most of the parenting and managing household duties. The Boomer physician is more likely to be male, work long hours, and see professional life as the overall driving force of daily existence.
However, the perception that a Boomer physician is immune to career dissatisfaction is incorrect. Dissatisfaction and departure from practice are directly related to age, with those who are 50 or older more likely to experience them.14 In another study, age and dissatisfaction were the principal factors positively associated with intention to leave practice.15
For Generations X and Y, time is the overarching issue
Generations X and Y physicians are an equal mix of genders, with the majority of couples having dual careers. Their desire for balanced work and family life has made time the primary issue in rising dissatisfaction with medicine. There is less time for each patient encounter, more time required for documentation to justify reimbursement, more time necessary to deal with practice management, and less time to handle family issues—especially personal well-being.16 These issues have also contributed to rising dissatisfaction among Baby Boomers.
Enter, the 80-hour workweek
In 2003, the Accreditation Council for Graduate Medical Education instituted the 80-hour workweek in an attempt to improve patient safety and the lifestyle of physicians in training. Many senior physicians believed that work-hour restriction would erode the quality of training, but this does not appear to have occurred.
Work-hour restriction among surgical residents has had no effect on academic performance but has markedly decreased psychological distress.17 Among medical residents, work-hour restriction has improved career satisfaction and decreased emotional exhaustion—but residents perceive restrictions to have impinged on patient care and resident education.18 Although surgical residents believe that restriction has reduced overall stress, improved quality of life, and provided time in which to manage their personal life, they are concerned about the limitation on exposure to patients—yet 96% of these residents would not be willing to add an additional year to their training.19
There is evidence that about one third of a resident’s time is spent performing activities of marginal or no educational value.20 By eliminating these activities and making better use of simulators and patient surrogates, the workweek could be reduced even further, allowing the physician in training more time for interaction with patients and providing a better balance between work and personal life.
If the goal is to retain physicians in the work-force, it is more important to reduce dissatisfaction than to increase satisfaction. Why? People who are dissatisfied are more likely to change what they are doing than those with any level of satisfaction.4
The profession must understand that burnout is common and directly related to increasing dissatisfaction.21
Burnout typically occurs when one has a highly demanding position with limited autonomy. A physician experiences burnout when one or more of the following is present:
- emotional exhaustion
- feelings of inadequacy in terms of personal accomplishment
- depersonalization
- increasing cynicism in personal interactions.21
This is an accurate description of the current state of medical practice.
Because “the times they are a-changin’,” it is necessary that leaders within the medical profession drastically change the way that medicine is taught and practiced.22-24
Any further changes—beyond work-hour limitations—should be carefully designed with a mechanism in place to evaluate effects on both physicians and patients. A new approach to the practice of medicine is desperately needed to allow a better work-life balance while maintaining the focus on quality and safety.
Ways to reduce dissatisfaction
Dr. Abigail Zuger summed up the feelings of many when she wrote: “The profession of medicine has taken its members on a wild ride during the past century: a slow, glorious climb in well-being, followed by a steep, stomach-churning fall.”25
I offer the following proposals for discussion. My primary aim in developing these suggestions was to give physicians more of that most precious of commodities: time. More time has the potential to change the work-life balance and improve both professional and personal satisfaction at the same time that it decreases dissatisfaction.
Again: The key to retaining physicians in the workforce is to decrease dissatisfaction. That is more likely to have the desired effect of a larger, stable workforce than is increasing the number of medical students and physicians in training. As is true in most aspects of life, it is easier and cheaper to improve what you already have, recycle what you can, and replace only what is absolutely necessary.
Recommendations—for practitioners, academic and private
- Limit work hours to 50 or fewer per week. Many physicians work too many hours; this is not beneficial to them, their families, and their patients.26 For both patient safety and physician well-being, it is time to voluntarily restrict our work hours before federal legislation creates limits for us.
- Develop new models of practice, such as the use of a laborist for obstetric coverage. The implementation of a hospital-based laborist program allows a safer environment for the patient, a rapid-response team presence, and a controlled lifestyle for physicians who desire to practice obstetrics.27 Structured properly, such models are revenue-neutral for the institution. (See OBG Management’s recent article, “The laborists are here, but can they thrive in US hospitals?” in the August 2008 issue, available at www.obgmanagement.com.)
- Create part-time professional liability insurance policies. Premiums for these policies should be prorated according to the amount of clinical time worked and the physician’s work record. Insurance policies also need to be written to cover a slot rather than a particular individual, so that several physicians can share the same position to equal one full-time practitioner.
- Increase job sharing and part-time employment so that these options become more attractive. With job sharing, two physicians work 50% of the time, adding up to one full-time practitioner. This option will reduce physician dissatisfaction and has the potential to increase the work life of the practitioner while improving patient safety.28 Job sharing will also facilitate recruitment and retention of the current workforce.29
- Acquire time- and money-management skills. Most practitioners need to develop these abilities because so many stressors are related to limits on time and money.
- In academic medicine, revamp the current career trajectory. The timeline that includes tenure and unrealistic expectations for promotion is archaic and needs to be eliminated. Most Generations X and Y physicians find it to be inflexible at exactly the wrong time in their life. Forced to choose between work on one hand and family and personal well-being on the other, they will almost always choose family and personal life first.30 Similar changes are recommended for the private practitioner under consideration for partnership.
Recommendations—for physicians in training
- Limit work hours to 65 or fewer per week. The current 80-hour week is not conducive to improving physician satisfaction or safe care. There is evidence that work exceeding 18 hours a day may impair a physician.31 No physician likes working long hours, and it is clearly not safe for patients. Elimination of responsibilities of no or marginal educational value would make a 65-hour work-week practical. Training institutions will need to add more support staff, including physician extenders, to implement a shorter week.
- Increase the use of teaching simulators. This improvement would assist in the development of technical skills. The training institution would be responsible for developing a simulation center. In areas with multiple training programs, a central location would be developed, with cost shared by all parties. Some of the cost would be recouped by the time saved in the operating room. There is also the potential to prevent medical errors and reduce liability cost. (See OBG Management’s recent article, “How simulation can train, and refresh, physicians for critical OB events,” which describes, among other issues, the use of regional simulation centers. The article appeared in the September 2008 issue, available at www.obgmanagement.com.)
- Teach physicians in training time- and money-management skills. Many of the stressors experienced by these young physicians relate to understanding how to budget time and money.
- Sponsor 24-hour, on-site child care at reasonable or no cost. This recommendation for the training institution is important because child care for the dual-career couple is difficult to arrange, often incompatible with the couple’s schedule, and expensive. Any training institution that sponsors a residency program and benefits from this low-cost workforce should be required by the Accreditation Council of Graduate Medical Education to fund this benefit. It is the right thing to do and is certainly a valuable recruiting tool. It will make physicians who have children feel more comfortable working the hours required for their training while removing a major stressor—worrying about their child.
- Supply extra support for residents when a co-resident is on maternity or paternity leave. The training institution should implement this protection to prevent working residents from being penalized when it is necessary for a co-resident to be on leave.
- Create the option of job sharing during residency. In the business world, job sharing has become common and increases satisfaction and productivity. A resident would work half-time, with salary and benefits prorated so that the cost to the sponsoring institution is revenue-neutral. This would be a valuable recruiting tool among residents who are willing to accept a prolonged period of training.
We need a dialogue on these and other recommendations Such a conversation will allow the medical profession to continue to attract and retain the best and brightest professionals. As the satirical poet Auguste Marseille Barthélemy pointed out, way back in 1832: “The absurd man is he who never changes.”
1. Holsinger JW, Jr, Beaton B. Physician professionalism for a new century. Clin Anat. 2006;19:473-479.
2. Buchbinder SB, Wilson M, Melick CF, Powe NR. Primary care physician job satisfaction and turnover. Am J Manag Care. 2001;7:701-713.
3. Leigh JP, Kravitz RL, Schembri M, Samuels SJ, Mobley S. Physician career satisfaction across specialties. Arch Intern Med. 2002;162:1577-1584.
4. Landon BE, Reschovsky JD, Pham HH, Blumenthal D. Leaving medicine: the consequences of physician dissatisfaction. Med Care. 2006;44:234-242.
5. Berger JE, Boyle RL, Jr. How to avoid the high costs of physician turnover. Med Group Manage J. 1992;39:80-91.
6. Buchbinder SB, Wilson M, Melick CF, Powe NR. Estimates of costs of primary care physician turnover. Am J Manag Care. 1999;5:1431-1438.
7. Carr PL, Ash AS, Friedman RH, et al. Relation of family responsibilities and gender to the productivity and career satisfaction of medical faculty. Ann Intern Med. 1998;129:532-538.
8. Jovic E, Wallace JE, Lemaire J. The generation and gender shifts in medicine: an exploratory survey of internal medicine physicians. BMC Health Serv Res. 2006;6:55-71.
9. Schroen AT, Brownstein MR, Sheldon GF. Women in academic general surgery. Acad Med. 2004;79:310-318.
10. Helliger PJ, Hingstman L. Career p and the work-family balance in medicine: gender differences among medical specialists. Soc Sci Med. 2000;50:1235-1246.
11. Pearse WH, Haffner WHJ, Primack A. Effect of gender on the obstetric-gynecologic work force. Obstet Gynecol. 2001;97:794-797.
12. Grandis JR, Gooding WF, Zamboni BA, et al. The gender gap in a surgical subspecialty. Arch Otolaryngol Head Neck Surg. 2004;130:695-702.
13. Schwartz RW, Jarecky RK, Strodel WE, Haley JV, Young B, Griffen WO, Jr. Controllable lifestyle: a new focus in career choice by medical students. Acad Med. 1989;64:606-609.
14. Pathman DE, Konrad TR, Williams ES, et al. Physician job satisfaction, dissatisfaction, and turnover. J Fam Pract. 2002;51:593.-
15. Rittenhouse DR, Mertz E, Keane D, Grumbach K. No exit: an evaluation of measures of physician attrition. Health Serv Res. 2004;39:1572-1588.
16. Weinstein L, Wolfe H. The downward spiral of physician satisfaction: an attempt to avert a crisis within the medical profession. Obstet Gynecol. 2007;109:1181-1183.
17. Zaré SM, Galanko JA, Behrns KE, et al. Psychologic well-being of surgery residents after inception of the 80-hour workweek: a multi-institutional study. Surgery. 2005;138:150-157.
18. Goitein L, Shanafelt TD, Wipf JE, Slatore CG, Back AL. The effects of work-hour limitations on resident well-being, patient care, and education in an internal medicine residency program. Arch Intern Med. 2005;165:2601-2606.
19. Karamanoukian RL, Ku JK, DeLaRosa J, Karamanoukian HL, Evans GR. The effects of restricted work hours on clinical training. Am Surg. 2006;72:19-21.
20. Boex JR, Leahy PJ. Understanding residents’ work: moving beyond counting hours to assessing educational value. Acad Med. 2003;78:939-944.
21. Gabbe SG, Webb LE, Moore DE, Jr, Mandel LS, Melville JL, Spickard WA, Jr. Can mentors prevent and reduce burnout in new chairs of departments of obstetrics and gynecology: results from a prospective, randomized pilot study. Am J Obstet Gynecol. 2008;198:653.e1-653.e7.
22. Cooke M, Irby DM, Sullivan W, Ludmerer KM. American medical education 100 years after the Flexner report. N Engl J Med. 2006;355:1339-1344.
23. Jauhar S. The demise of the physical exam. N Engl J Med. 2006;354:548-551.
24. Arky RA. Shattuck Lecture. The family business—to educate. N Engl J Med. 2006;354:1922-1926.
25. Zuger A. Dissatisfaction with medical practice. N Engl J Med. 2004;350:69-75.
26. Weinstein L, Garite TJ. On call for obstetrics—time for a change. Am J Obstet Gynecol. 2007;196:3.-
27. Weinstein L. The laborist: a new focus of practice for the obstetrician. Am J Obstet Gynecol. 2003;188:310-312.
28. Parkerton PH, Wagner EH, Smith DG, Straley HL. Effect of part-time practice on patient outcome. J Gen Intern Med. 2003;18:717-724.
29. Shields MC, Shields MT. Working with Generation X physicians. Physician Exec. 2003;29:14-18.
30. Williams J. Unbending Gender: Why Family and Work Conflict and What To Do About It. New York: Oxford University Press; 2000.
31. American College of Obstetricians and Gynecologists. ACOG Committee Opinion No. 398: Fatigue and patient safety. Washington, DC: ACOG; Feb 2008.
32. Association of American Medical Colleges. AAMC statement on the physician workforce, June 2006. Available at: http://www. aamc.org/workforce/workforceposition.pdf. Accessed Oct. 31, 2008.
33. Iglehart JK. Grassroots activism and the pursuit of an expanded physician supply. N Engl J Med. 2008;358:1741-1749.
34. Cooper RA. It’s time to address the problem of physician shortages: graduate medical education is the key. Ann Surg. 2007;246:527-534.
35. Goodman DC, Fisher ES. Physician workforce crisis? Wrong diagnosis, wrong prescription. N Engl J Med. 2008;358:1658-1661.
36. Goodman DC, Fisher ES, Little GA, Stukel TA, Chang CH, Schoendorf KS. The relation between the availability of neonatal intensive care and neonatal mortality. N Engl J Med. 2002;346:1538-1544.
37. Fisher ES, Wennberg DE, Stukel TA, Gottlieb DJ, Lucas FL, Pinder EL. The implications of regional variations in Medicare spending. Ann Intern Med. 2003;138:273-298.
38. Sirovich BE, Gottlieb DJ, Welch HG, Fisher ES. Regional variations in health care intensity and physician perceptions of quality of care. Ann Intern Med. 2006;144:641-649.
Dr. Weinstein has no financial relationships relevant to this article.
“I CAN’T GET NO SATISFACTION”—Mick Jagger and Keith Richards, 1965
“FOR THE TIMES THEY ARE A-CHANGIN’”—Bob Dylan, 1964
The lyrics of two songs written more than 40 years ago are an excellent way to describe today’s physician workforce. Regrettably, many physicians who grew up listening to these performer-philosophers have yet to heed the words of Bob Dylan. Instead, they echo the sentiments of Mick Jagger and Keith Richards without doing much to correct the problem.
Why the decline in work satisfaction? Many reasons have been cited, including:
- loss of autonomy
- economic pressures
- an increasing degree of government and insurer control over practice
- the liability crisis
- a divergence between professional and personal expectations
- physicians’ own high career expectations
- a desire for more time for family and self.1
The growing level of dissatisfaction with the practice of medicine has, clearly, reached crisis level: Twenty percent of all physicians report that they are dissatisfied with their career.2,3 And lack of fulfillment appears to be developing much earlier in the life of a physician than has so far been appreciated. Not only is it showing up in residents, job dissatisfaction is evident even among medical students. It is quite revealing—and depressing—that 40% of young physicians would choose not to go to medical school if they had to choose again.
In this article, I examine the characteristics of the dissatisfied physician, explain the apparent reasons for this lack of fulfillment, and propose a number of steps that can be taken to salvage the situation, lengthen the time that a physician works, on average, and add flexibility and variety to work life.
Ultimate effect of dissatisfaction? Loss of a physician
An unhappy physician is two or three times more likely to leave the profession or decrease the number of hours worked than a satisfied physician is.4 And when a physician leaves the workforce, we lose a valuable resource. The estimated replacement cost for a physician in 1992 to 1999 dollars was $250,000, and that cost is at least 50% higher today.5,6 Besides the monetary loss, there is disruption to other members of the practice group and to patients when a physician leaves the profession.
Landon and colleagues found that the average age of a physician working full-time was 47 years, compared with 53 years for a physician who was working fewer than 20 hours a week and 63 years for a physician at retirement.4 However, these data are approximately 7 years old; current figures are likely to show curtailment of work hours at even younger ages.
It is not realistic to expect that 1) the educational system will increase medical school class size and 2) enough physicians will finish training and develop a mature practice in the time necessary to offset the number of physicians now altering their workloads or exiting the workforce.
Does gender influence the satisfaction rate?
The profession of medicine has changed strikingly over the past 20 years. Once male-dominated, it now is gender-equal and, in some specialties, female-dominated.
This rapid gender shift in medicine has received much of the blame for the decline in physician satisfaction. However, data suggest that, among full-time academic faculty who do not have children, productivity and career satisfaction are the same for women as for men.7 A recent study of internists found few gender differences in work-life balance, work hours, and attitudes toward patient care.8
Among surgeons, an equal percentage of each gender believes that the work schedule leaves too little time for personal and family life.9 Although it has been suggested that women prefer to work fewer hours than men, evidence indicates that younger men have the same desire to work less and spend more time with family.10
That said, there are some gender-related differences in medical workforce characteristics:
- Women reduce their clinical activity during childbearing and childrearing and retire 5.5 years earlier than men do4
- In obstetrics, women younger than 40 years are four times more likely to reduce work hours or completely stop practice than male obstetricians are11
- Among surgeons, 90% of women live in dual-career households, compared with 50% of men9
- When the surgeon is male, children are cared for by spouses in 63% of households; when the surgeon is female, children are cared for by an employee in 88% of households9
- Among surgical subspecialists, women are more likely to be divorced or separated and to have fewer or no children; 34% spend 21 to 40 hours weekly on household management.12
Despite these differences, a review of the literature on physician dissatisfaction suggests that the gender shift in medicine is not responsible for the growing level of dissatisfaction.
After much talk of an impending physician shortage, many medical schools have increased class size, and a number of new medical schools recently opened or are on their way to opening. The Association of American Medical Colleges recommends that medical school class size increase 30% by 2015.32
Some experts believe that there will be a dearth of generalist physicians; others think that specialists will be in short supply.
Possible causes of the shortage
The coming physician shortage has been attributed to a number of variables, including:
- an aging population, which will require a greater level of health care
- aging physicians, with as many as 30% of the current workforce expected to retire during the next 5 to 10 years
- an increase in the number of female physicians who work fewer hours than their male counterparts
- an increase in physicians from Generations X and Y, who place greater emphasis on lifestyle and personal time.33
Cooper, who has written extensively on physician workforce numbers, believes that placement of the Medicare-funded graduate medical education (GME) position cap approximately 10 years ago has been the major driver of the physician shortage. Improvement will come, he says, only when this cap is lifted or altered.34
Are there enough doctors?
The number of physicians per capita is at its highest point in 50 years in the United States, yet the Council of Graduate Medical Education predicts a 10% shortfall by 2020.35 When regions with a high supply of physicians are compared with regions with a low supply, outcomes are the same, and patients do not perceive any physician shortfall.36,37 It is interesting that, in regions where there is a high supply of physicians, physicians perceive there to be greater difficulty in providing the quality of care they desire for their patients.38
A greater supply of physicians leads to more tests and procedures and higher costs.37 Goodman and Fisher believe that having more specialists decreases the flexibility of the physician workforce. They also believe that the GME cap should be maintained, funding should be reallocated to the more cognitive specialties, and the current payment system should be reformed.35 (Any physician who has attended a hospital medical executive committee meeting knows that reallocation of resources to cognitive specialties will never happen: Hospitals want more surgical procedures to boost their bottom line.)
A review of the many studies and opinions published about current work-force numbers and future needs makes it obvious that very little evidence exists to support any of the recommendations made by experts. Almost all studies mention adding to the workforce with minimal discussion about how to keep the current workforce from leaving—a much better use of resources.
Age is the determining factor
The Baby Boomer generation (born between 1946 and 1964), which had largely controlled all aspects of medicine, especially leadership roles, is rapidly being replaced by physicians from Generations X and Y (born between 1965 and 1980, and 1981 and 2001, respectively), who value personal time and lifestyle much more than “Boomers” have.13
These younger physicians demand flexibility and variety in their careers. They grow dissatisfied when these aspects of their work lives fall out of their control. And when it comes to choosing a specialty in which to practice, these physicians see a balanced lifestyle as the key variable.13
Much of the discussion of dissatisfaction in medicine has contrasted Baby Boomers with subsequent generations. The Boomer physician typically has a traditional marriage, with the spouse doing most of the parenting and managing household duties. The Boomer physician is more likely to be male, work long hours, and see professional life as the overall driving force of daily existence.
However, the perception that a Boomer physician is immune to career dissatisfaction is incorrect. Dissatisfaction and departure from practice are directly related to age, with those who are 50 or older more likely to experience them.14 In another study, age and dissatisfaction were the principal factors positively associated with intention to leave practice.15
For Generations X and Y, time is the overarching issue
Generations X and Y physicians are an equal mix of genders, with the majority of couples having dual careers. Their desire for balanced work and family life has made time the primary issue in rising dissatisfaction with medicine. There is less time for each patient encounter, more time required for documentation to justify reimbursement, more time necessary to deal with practice management, and less time to handle family issues—especially personal well-being.16 These issues have also contributed to rising dissatisfaction among Baby Boomers.
Enter, the 80-hour workweek
In 2003, the Accreditation Council for Graduate Medical Education instituted the 80-hour workweek in an attempt to improve patient safety and the lifestyle of physicians in training. Many senior physicians believed that work-hour restriction would erode the quality of training, but this does not appear to have occurred.
Work-hour restriction among surgical residents has had no effect on academic performance but has markedly decreased psychological distress.17 Among medical residents, work-hour restriction has improved career satisfaction and decreased emotional exhaustion—but residents perceive restrictions to have impinged on patient care and resident education.18 Although surgical residents believe that restriction has reduced overall stress, improved quality of life, and provided time in which to manage their personal life, they are concerned about the limitation on exposure to patients—yet 96% of these residents would not be willing to add an additional year to their training.19
There is evidence that about one third of a resident’s time is spent performing activities of marginal or no educational value.20 By eliminating these activities and making better use of simulators and patient surrogates, the workweek could be reduced even further, allowing the physician in training more time for interaction with patients and providing a better balance between work and personal life.
If the goal is to retain physicians in the work-force, it is more important to reduce dissatisfaction than to increase satisfaction. Why? People who are dissatisfied are more likely to change what they are doing than those with any level of satisfaction.4
The profession must understand that burnout is common and directly related to increasing dissatisfaction.21
Burnout typically occurs when one has a highly demanding position with limited autonomy. A physician experiences burnout when one or more of the following is present:
- emotional exhaustion
- feelings of inadequacy in terms of personal accomplishment
- depersonalization
- increasing cynicism in personal interactions.21
This is an accurate description of the current state of medical practice.
Because “the times they are a-changin’,” it is necessary that leaders within the medical profession drastically change the way that medicine is taught and practiced.22-24
Any further changes—beyond work-hour limitations—should be carefully designed with a mechanism in place to evaluate effects on both physicians and patients. A new approach to the practice of medicine is desperately needed to allow a better work-life balance while maintaining the focus on quality and safety.
Ways to reduce dissatisfaction
Dr. Abigail Zuger summed up the feelings of many when she wrote: “The profession of medicine has taken its members on a wild ride during the past century: a slow, glorious climb in well-being, followed by a steep, stomach-churning fall.”25
I offer the following proposals for discussion. My primary aim in developing these suggestions was to give physicians more of that most precious of commodities: time. More time has the potential to change the work-life balance and improve both professional and personal satisfaction at the same time that it decreases dissatisfaction.
Again: The key to retaining physicians in the workforce is to decrease dissatisfaction. That is more likely to have the desired effect of a larger, stable workforce than is increasing the number of medical students and physicians in training. As is true in most aspects of life, it is easier and cheaper to improve what you already have, recycle what you can, and replace only what is absolutely necessary.
Recommendations—for practitioners, academic and private
- Limit work hours to 50 or fewer per week. Many physicians work too many hours; this is not beneficial to them, their families, and their patients.26 For both patient safety and physician well-being, it is time to voluntarily restrict our work hours before federal legislation creates limits for us.
- Develop new models of practice, such as the use of a laborist for obstetric coverage. The implementation of a hospital-based laborist program allows a safer environment for the patient, a rapid-response team presence, and a controlled lifestyle for physicians who desire to practice obstetrics.27 Structured properly, such models are revenue-neutral for the institution. (See OBG Management’s recent article, “The laborists are here, but can they thrive in US hospitals?” in the August 2008 issue, available at www.obgmanagement.com.)
- Create part-time professional liability insurance policies. Premiums for these policies should be prorated according to the amount of clinical time worked and the physician’s work record. Insurance policies also need to be written to cover a slot rather than a particular individual, so that several physicians can share the same position to equal one full-time practitioner.
- Increase job sharing and part-time employment so that these options become more attractive. With job sharing, two physicians work 50% of the time, adding up to one full-time practitioner. This option will reduce physician dissatisfaction and has the potential to increase the work life of the practitioner while improving patient safety.28 Job sharing will also facilitate recruitment and retention of the current workforce.29
- Acquire time- and money-management skills. Most practitioners need to develop these abilities because so many stressors are related to limits on time and money.
- In academic medicine, revamp the current career trajectory. The timeline that includes tenure and unrealistic expectations for promotion is archaic and needs to be eliminated. Most Generations X and Y physicians find it to be inflexible at exactly the wrong time in their life. Forced to choose between work on one hand and family and personal well-being on the other, they will almost always choose family and personal life first.30 Similar changes are recommended for the private practitioner under consideration for partnership.
Recommendations—for physicians in training
- Limit work hours to 65 or fewer per week. The current 80-hour week is not conducive to improving physician satisfaction or safe care. There is evidence that work exceeding 18 hours a day may impair a physician.31 No physician likes working long hours, and it is clearly not safe for patients. Elimination of responsibilities of no or marginal educational value would make a 65-hour work-week practical. Training institutions will need to add more support staff, including physician extenders, to implement a shorter week.
- Increase the use of teaching simulators. This improvement would assist in the development of technical skills. The training institution would be responsible for developing a simulation center. In areas with multiple training programs, a central location would be developed, with cost shared by all parties. Some of the cost would be recouped by the time saved in the operating room. There is also the potential to prevent medical errors and reduce liability cost. (See OBG Management’s recent article, “How simulation can train, and refresh, physicians for critical OB events,” which describes, among other issues, the use of regional simulation centers. The article appeared in the September 2008 issue, available at www.obgmanagement.com.)
- Teach physicians in training time- and money-management skills. Many of the stressors experienced by these young physicians relate to understanding how to budget time and money.
- Sponsor 24-hour, on-site child care at reasonable or no cost. This recommendation for the training institution is important because child care for the dual-career couple is difficult to arrange, often incompatible with the couple’s schedule, and expensive. Any training institution that sponsors a residency program and benefits from this low-cost workforce should be required by the Accreditation Council of Graduate Medical Education to fund this benefit. It is the right thing to do and is certainly a valuable recruiting tool. It will make physicians who have children feel more comfortable working the hours required for their training while removing a major stressor—worrying about their child.
- Supply extra support for residents when a co-resident is on maternity or paternity leave. The training institution should implement this protection to prevent working residents from being penalized when it is necessary for a co-resident to be on leave.
- Create the option of job sharing during residency. In the business world, job sharing has become common and increases satisfaction and productivity. A resident would work half-time, with salary and benefits prorated so that the cost to the sponsoring institution is revenue-neutral. This would be a valuable recruiting tool among residents who are willing to accept a prolonged period of training.
We need a dialogue on these and other recommendations Such a conversation will allow the medical profession to continue to attract and retain the best and brightest professionals. As the satirical poet Auguste Marseille Barthélemy pointed out, way back in 1832: “The absurd man is he who never changes.”
1. Holsinger JW, Jr, Beaton B. Physician professionalism for a new century. Clin Anat. 2006;19:473-479.
2. Buchbinder SB, Wilson M, Melick CF, Powe NR. Primary care physician job satisfaction and turnover. Am J Manag Care. 2001;7:701-713.
3. Leigh JP, Kravitz RL, Schembri M, Samuels SJ, Mobley S. Physician career satisfaction across specialties. Arch Intern Med. 2002;162:1577-1584.
4. Landon BE, Reschovsky JD, Pham HH, Blumenthal D. Leaving medicine: the consequences of physician dissatisfaction. Med Care. 2006;44:234-242.
5. Berger JE, Boyle RL, Jr. How to avoid the high costs of physician turnover. Med Group Manage J. 1992;39:80-91.
6. Buchbinder SB, Wilson M, Melick CF, Powe NR. Estimates of costs of primary care physician turnover. Am J Manag Care. 1999;5:1431-1438.
7. Carr PL, Ash AS, Friedman RH, et al. Relation of family responsibilities and gender to the productivity and career satisfaction of medical faculty. Ann Intern Med. 1998;129:532-538.
8. Jovic E, Wallace JE, Lemaire J. The generation and gender shifts in medicine: an exploratory survey of internal medicine physicians. BMC Health Serv Res. 2006;6:55-71.
9. Schroen AT, Brownstein MR, Sheldon GF. Women in academic general surgery. Acad Med. 2004;79:310-318.
10. Helliger PJ, Hingstman L. Career p and the work-family balance in medicine: gender differences among medical specialists. Soc Sci Med. 2000;50:1235-1246.
11. Pearse WH, Haffner WHJ, Primack A. Effect of gender on the obstetric-gynecologic work force. Obstet Gynecol. 2001;97:794-797.
12. Grandis JR, Gooding WF, Zamboni BA, et al. The gender gap in a surgical subspecialty. Arch Otolaryngol Head Neck Surg. 2004;130:695-702.
13. Schwartz RW, Jarecky RK, Strodel WE, Haley JV, Young B, Griffen WO, Jr. Controllable lifestyle: a new focus in career choice by medical students. Acad Med. 1989;64:606-609.
14. Pathman DE, Konrad TR, Williams ES, et al. Physician job satisfaction, dissatisfaction, and turnover. J Fam Pract. 2002;51:593.-
15. Rittenhouse DR, Mertz E, Keane D, Grumbach K. No exit: an evaluation of measures of physician attrition. Health Serv Res. 2004;39:1572-1588.
16. Weinstein L, Wolfe H. The downward spiral of physician satisfaction: an attempt to avert a crisis within the medical profession. Obstet Gynecol. 2007;109:1181-1183.
17. Zaré SM, Galanko JA, Behrns KE, et al. Psychologic well-being of surgery residents after inception of the 80-hour workweek: a multi-institutional study. Surgery. 2005;138:150-157.
18. Goitein L, Shanafelt TD, Wipf JE, Slatore CG, Back AL. The effects of work-hour limitations on resident well-being, patient care, and education in an internal medicine residency program. Arch Intern Med. 2005;165:2601-2606.
19. Karamanoukian RL, Ku JK, DeLaRosa J, Karamanoukian HL, Evans GR. The effects of restricted work hours on clinical training. Am Surg. 2006;72:19-21.
20. Boex JR, Leahy PJ. Understanding residents’ work: moving beyond counting hours to assessing educational value. Acad Med. 2003;78:939-944.
21. Gabbe SG, Webb LE, Moore DE, Jr, Mandel LS, Melville JL, Spickard WA, Jr. Can mentors prevent and reduce burnout in new chairs of departments of obstetrics and gynecology: results from a prospective, randomized pilot study. Am J Obstet Gynecol. 2008;198:653.e1-653.e7.
22. Cooke M, Irby DM, Sullivan W, Ludmerer KM. American medical education 100 years after the Flexner report. N Engl J Med. 2006;355:1339-1344.
23. Jauhar S. The demise of the physical exam. N Engl J Med. 2006;354:548-551.
24. Arky RA. Shattuck Lecture. The family business—to educate. N Engl J Med. 2006;354:1922-1926.
25. Zuger A. Dissatisfaction with medical practice. N Engl J Med. 2004;350:69-75.
26. Weinstein L, Garite TJ. On call for obstetrics—time for a change. Am J Obstet Gynecol. 2007;196:3.-
27. Weinstein L. The laborist: a new focus of practice for the obstetrician. Am J Obstet Gynecol. 2003;188:310-312.
28. Parkerton PH, Wagner EH, Smith DG, Straley HL. Effect of part-time practice on patient outcome. J Gen Intern Med. 2003;18:717-724.
29. Shields MC, Shields MT. Working with Generation X physicians. Physician Exec. 2003;29:14-18.
30. Williams J. Unbending Gender: Why Family and Work Conflict and What To Do About It. New York: Oxford University Press; 2000.
31. American College of Obstetricians and Gynecologists. ACOG Committee Opinion No. 398: Fatigue and patient safety. Washington, DC: ACOG; Feb 2008.
32. Association of American Medical Colleges. AAMC statement on the physician workforce, June 2006. Available at: http://www. aamc.org/workforce/workforceposition.pdf. Accessed Oct. 31, 2008.
33. Iglehart JK. Grassroots activism and the pursuit of an expanded physician supply. N Engl J Med. 2008;358:1741-1749.
34. Cooper RA. It’s time to address the problem of physician shortages: graduate medical education is the key. Ann Surg. 2007;246:527-534.
35. Goodman DC, Fisher ES. Physician workforce crisis? Wrong diagnosis, wrong prescription. N Engl J Med. 2008;358:1658-1661.
36. Goodman DC, Fisher ES, Little GA, Stukel TA, Chang CH, Schoendorf KS. The relation between the availability of neonatal intensive care and neonatal mortality. N Engl J Med. 2002;346:1538-1544.
37. Fisher ES, Wennberg DE, Stukel TA, Gottlieb DJ, Lucas FL, Pinder EL. The implications of regional variations in Medicare spending. Ann Intern Med. 2003;138:273-298.
38. Sirovich BE, Gottlieb DJ, Welch HG, Fisher ES. Regional variations in health care intensity and physician perceptions of quality of care. Ann Intern Med. 2006;144:641-649.
Managing community-acquired MRSA lesions: What works?
The author reports no financial disclosure relevant to this article.
- Community-acquired methicillin-resistant Staphylococcus aureus (CA-MRSA) abscesses are best managed surgically; postprocedure antibiotics do not substantially improve outcome. The cure rate with incision and drainage alone is at least 90%.
- If incision and drainage fail to promote healing within 7 days, oral antibiotics of choice are trimethoprim-sulfamethoxazole and tetracycline
- Eradication of nasal carriage of CA-MRSA generally does not help prevent spread of clinical MRSA infection in communities.
CASE: Tender suprapubic lesion
A previously healthy, 22-year-old law school student arrives at your office complaining of “abdominal pain.” She is previously healthy; temperature is normal.
You discover on examination that she has an erythematous, indurated, and tender 3-cm lesion on the suprapubic region. The lesion has no point, but its center is boggy.
Should you prescribe an antibiotic? And should you cover immediately for CA-MRSA? What other factors might influence your decision about treatment?
The incidence of MRSA is increasing in communities across the United States, challenging assumptions about the evaluation and management of skin and soft-tissue infections. In this article, I outline a rational approach to managing patients who have a lesion likely to be caused by CA-MRSA ( TABLE 1 ).
TABLE
Suspect CA-MRSA infection? Consider this treatment scheme
| When a patient meets these criteria… | Provide this management… | And select from these antibiotics |
|---|---|---|
| Lesion nonfluctuant; patient afebrile, healthy (Class 1 infection) | If no drainable abscess, give a common first-line antibiotic for skin and soft-tissue infection; reassess for response | —Semisynthetic penicillin —Oral first- or second-generation cephalosporin —Macrolide —Clindamycin |
| Lesion, fluctuant or pustular, <5 cm in diameter; fever or no fever (Class 2) | Drain abscess surgically if possible; use incision and drainage presumptively for MRSA and monitor closely for response; inpatient management may be indicated | —Trimethoprim sulfamethoxazole —Tetracycline —Clindamycin |
| Lesion, >5 cm in diameter, toxic appearance or at least one unstable comorbidity or a limb-threatening infection (Class 3) | Admit; consider infectious disease consult | Broad-spectrum agent, including vancomycin, for MRSA coverage |
| Sepsis syndrome or life-threatening infection (necrotizing fasciitis)(Class 4) | Admit; institute aggressive surgical debridement; request infectious disease consult | Broad-spectrum agent, including vancomycin, for MRSA coverage |
| Source: Eron et al6 and CDC7 . | ||
When to suspect MRSA skin infection
Patients who have a CA-MRSA skin infection often report a “spider bite” because the lesion appears suddenly and unexpectedly in an area where there is no history of trauma.1 Lesions often are pustular with central necrosis; there may be purulent drainage, redness, tenderness, and palpable fluctuance ( FIGURE ).
CA-MRSA skin lesions can occur anywhere on the body, though they appear most often in the axillae or the groin and buttocks. Patients may or may not have a fever.
Persons at increased risk of CA-MRSA disease include users of health clubs, participants in contact sports, men who have sex with men, children younger than 2 years, users of intravenous drugs, military personnel, and prisoners.2,3 Absence of these risk factors in a patient with a skin or soft-tissue infection does not, however, rule out MRSA.4
Regardless of the lesion’s appearance or the patient’s epidemiologic history, consider CA-MRSA if its prevalence in your community has reached 10% to 15%.
CA-MRSA can cause impetigo, but the often-benign nature of this clinical infection makes management decisions less crucial. However, do hospitalize any patient who has a MRSA infection who also exhibits fever or hypothermia, tachycardia >100 bpm, or hypotension with a systolic blood pressure <90 mm Hg or 20 mm Hg below baseline. A skin lesion >5 cm in diameter also likely requires hospitalization and a parenteral antibiotic.5
FIGURE Class-2 CA-MRSA lesion
This raised, red lesion contains a central eschar with dried pus. Such lesions are generally very tender and often fluctuant when palpated.
Incision and drainage are most important
Several management schemes have been proposed to guide the appropriate level of therapy based on presenting characteristics.6,7 If a lesion is clearly fluctuant, incise it and drain the fluid, or refer the patient for surgical consultation. If the lesion is not clearly fluctuant, needle aspiration may help to determine the need for more extensive incision and drainage or to collect a specimen for culture. Although culture of a skin lesion may not have been routine in the past, the advent of CA-MRSA has made it so—particularly given that MRSA lesions may not be clinically distinguishable from those caused by nonresistant S aureus.
Periodic postprocedure follow-up is indicated to ensure resolution of the infection. At the Boston University student health service, CA-MRSA patients return every few days for an appointment with nursing staff for wound irrigation and packing change until the lesion visibly improves. Systemic effects from the infection are monitored as well.
Incision and drainage technique reported. In one study, adult patients were treated with incision and drainage by a surgeon.8 The technique used a#11 blade applied in a “sawing motion” to create a wide opening. The wound cavity was explored for loculations and packed. The identical technique can be used in the office, with one caveat: This study included patients who had an abscess larger than 5 cm in diameter and some whose immune system was compromised—situations not managed routinely in the office.
Are antibiotics indicated after incision and drainage for MRSA?
In the same study,8 the cure rate with incision and drainage alone was just over 90%. The cure rate in the treatment arm of the study, in which patients also received an antibiotic, was 84% (the difference was statistically insignificant), and coverage was inadequate for MRSA. Treatment with cephalexin after incision and drainage resulted in one patient harmed for every 14 treated.
A pediatric study also showed that antibiotics do not affect the outcome of skin lesions following incision and drainage.5 When deciding whether to prescribe postprocedure antibiotics, keep in mind the need to avoid contributing further to bacterial resistance.
Generally, start the patient on trimethoprim (TMP)-sulfamethoxazole (SMX) or tetracycline if incision and drainage fail to promote healing of the MRSA lesion within 7 days. Clindamycin is an option, although resistance is increasingly common. Adjust the choice and dosage of antibiotic as needed once culture and susceptibility testing results are available.
TMP-SMX is generally well tolerated at the recommended dosage of one or two double-strength tablets (160 mg of TMP, 800 mg of SMX) twice daily for adults. If creatinine clearance is 15 to 30 mL/min, halve the dosage. The rate of sulfa allergy with TMP-SMX (3%) is similar to what is seen with other antibiotics.
Tetracycline’s dosing schedule—for adults, 250 or 500 mg, four times daily— makes it difficult to use. Gastrointestinal upset, phototoxicity, and hepatotoxicity can occur. The possibility of tooth discoloration precludes its use in children.
Clindamycin carries a high rate of gastrointestinal-related problems—Clostridium difficile infection in particular (10% incidence, regardless of route). Inducible resistance to clindamycin is 50% in MRSA infections.9 Recent use of antibiotics may increase the likelihood of clindamycin resistance, with erythromycin in particular inducing such resistance. The dosage typically is 150 to 300 mg, every 6 hours.
Doxycycline and minocycline are not recommended. Both carry a 21% failure rate.10
Linezolid is costly and has many drug interactions. In particular, linezolid has the potential to cause serotonin syndrome with agents that affect the serotonergic system. Linezolid may also interact with medications that affect the adrenergic system (pressor agents). Routine use in the community without infectious disease consultation is not advised.
For lesions that are neither fluctuant nor purulent
In such cases, appropriate first-line antibiotics are a semisynthetic penicillin (e.g., dicloxacillin), a first- or second-generation oral cephalosporin, a macrolide, and clindamycin.10 These antibiotics are preferable for group A streptococcal infections, erysipelas (which can be aggressive), and impetigo. Adjustments can be made as culture results become available or if the clinical response is inadequate. There is no particular utility in waiting to administer oral antibiotics in cases of erysipelas or impetigo, although topical antibiotics can often be used for limited cases of impetigo.
CASE RESOLVED
Your patient, who meets criteria for a Class 2 CA-MRSA infection, undergoes incision and drainage of the lesion. No antibiotic is administered.
Two weeks of daily packing of the wound follow—again, without an antibiotic. Subsequently, the wound heals without sign of infection.
Prevention: Simple precautions are the rule
Most CA-MRSA infections result from direct contact with a patient’s wound or from wound drainage on environmental surfaces.
In the medical office. In addition to using sterile technique during incision and drainage, all staff members must wash hands with soap and water or an alcohol-based sanitizer. For the most part, MRSA remains susceptible to triclosan, a topical antiseptic in commercial hand soaps.
Clean equipment as needed with 10% sodium hypochlorite solution or another agent effective against MRSA. Surgical instruments should be disposable or sterilized after each use.
At the patient’s home. Instruct patients to clean the wound, wearing fresh disposable gloves each time, and to cover it with a new, dry dressing. Tell families to avoid sharing linens and clothing unless they have been washed in hot soap and water and dried in a heated dryer. MRSA can live for weeks or months on surfaces exposed to infected wounds11 ; these surfaces can be disinfected with a 10% solution of bleach.
In sports environments. Athletes who have a CA-MRSA infection should not compete unless the wound can be completely covered with a dry dressing. Recommend to those in charge of school and commercial facilities that, in a confirmed case of MRSA infection, they routinely clean locker rooms and sports equipment with either a 10% bleach solution or commercial disinfectant. There is no evidence, however, that more widespread or vigorous cleaning—such as dismantling a training room and all its cardio-fitness equipment for disinfecting—prevents the spread of MRSA.
Encourage athletes to wash their hands properly. Communal towels should be washed in hot water (>140°F) with bleach before reuse. Personal equipment should be cleaned according to the manufacturer’s instructions. Athletes should use a clean towel to provide a barrier between their skin and the surfaces of weight-room and cardio-fitness equipment. They should also clean equipment before and after use with an appropriate cleanser, such as a disinfectant hand wipe.
Screening household contacts for MRSA isn’t useful; attempts to eradicate colonization are generally ineffective. In a large study of military personnel, intranasal mupirocin failed to decrease nasal carriage of MRSA and the incidence of MRSA infections.11 The MRSA nasal colonization rate was 3.9%; 121 persons colonized with MRSA needed to be treated with nasal mupirocin to prevent one MRSA infection in the total study population.
More complex antibiotic regimens are sometimes used in an attempt to eradicate MRSA carriage, but they also have limited effectiveness and carry the general risks of antibiotic use (e.g., gastrointestinal disturbance, allergic reaction). If your office is considering an eradication attempt, consult first with an infectious disease clinician.
Suggested Reading
1. Moran GJ, Krishnadasan A, Gorwitz RJ, et al. EMERGEncy ID Net Study Group Methicillin-resistant S aureus infections among patients in the emergency department. N Engl J Med. 2006;355:666-674.
2. Cohen PR. The skin in the gym: a comprehensive review of the cutaneous manifestations of community-acquired methicillin-resistant Staphylococcus aureus infection in athletes. Clin Dermatol. 2008;26:16-26.
3. Cohen PR. Community-acquired methicillin-resistant Staphylococcus aureus skin infections: implications for patients and practitioners. Am J Clin Dermatol. 2007;8:259-270.
4. Miller LG, Perdreau-Remington F, Bayer AS, et al. Clinical and epidemiologic characteristics cannot distinguish community-associated methicillin-resistant Staphylococcus aureus infection from methicillin-susceptible S aureus infection: a prospective investigation. Clin Infect Dis. 2007;44:471-482.
5. Lee MC, Rios AM, Aten MF, et al. Management and outcome of children with skin and soft tissue abscesses caused by community-acquired methicillin-resistant Staphylococcus aureus. Pediatr Infect Dis J. 2004;23:123-127.
6. Eron LJ, Lipsky BA, Low DE, et al. Expert panel on managing skin and soft tissue infections Managing skin and soft tissue infections: expert panel recommendations on key decision points. J Antimicrob Chemother. 2003;52(Suppl 1):i3-i17.
7. Centers for Disease Control and Prevention American Medical Association Infectious Diseases Society of America. Outpatient management of skin and soft tissue infections in the era of community-associated MRSA. September 2007. Available at: http://www.amaassn.org/ama1/pub/upload/mm/36/ca_mrsa_desk_102007.pdf. Accessed November 11, 2008.
8. Rajendran PM, Young D, Maurer T, et al. Randomized, double-blind, placebo-controlled trial of cephalexin for treatment of uncomplicated skin abscesses in a population at risk for community-acquired methicillin-resistant Staphylococcus aureus infection. Antimicrob Agents Chemother. 2007;51:4044-4048.
9. Stevens DL, Bisno AL, Chambers HF, et al. Infectious Diseases Society of America Practice guidelines for the diagnosis and management of skin and soft-tissue infections. Clin Infect Dis. 2005;41:1373-1406.
10. Dellit TH, Duchin J. Guidelines for Evaluation and Management of Community-Associated Methicillin Resistant Staphylococcus aureus Skin and Soft Tissue Infections in Outpatient Settings. December 2007. Available at: http://www.kingcounty.gov/healthservices/health/communicable/providers/~/media/health/
publichealth/documents/communicable/MRSA_guide-lines.ashx. Accessed November 11, 2008.
11. Ellis MW, Griffith ME, Dooley DP, et al. Targeted intranasal mupirocin to prevent colonization and infection by community-associated methicillin-resistant Staphylococcus aureus strains in soldiers: a cluster randomized controlled trial. Antimicrob Agents Chemother. 2007;51:3591-3598.
The author reports no financial disclosure relevant to this article.
- Community-acquired methicillin-resistant Staphylococcus aureus (CA-MRSA) abscesses are best managed surgically; postprocedure antibiotics do not substantially improve outcome. The cure rate with incision and drainage alone is at least 90%.
- If incision and drainage fail to promote healing within 7 days, oral antibiotics of choice are trimethoprim-sulfamethoxazole and tetracycline
- Eradication of nasal carriage of CA-MRSA generally does not help prevent spread of clinical MRSA infection in communities.
CASE: Tender suprapubic lesion
A previously healthy, 22-year-old law school student arrives at your office complaining of “abdominal pain.” She is previously healthy; temperature is normal.
You discover on examination that she has an erythematous, indurated, and tender 3-cm lesion on the suprapubic region. The lesion has no point, but its center is boggy.
Should you prescribe an antibiotic? And should you cover immediately for CA-MRSA? What other factors might influence your decision about treatment?
The incidence of MRSA is increasing in communities across the United States, challenging assumptions about the evaluation and management of skin and soft-tissue infections. In this article, I outline a rational approach to managing patients who have a lesion likely to be caused by CA-MRSA ( TABLE 1 ).
TABLE
Suspect CA-MRSA infection? Consider this treatment scheme
| When a patient meets these criteria… | Provide this management… | And select from these antibiotics |
|---|---|---|
| Lesion nonfluctuant; patient afebrile, healthy (Class 1 infection) | If no drainable abscess, give a common first-line antibiotic for skin and soft-tissue infection; reassess for response | —Semisynthetic penicillin —Oral first- or second-generation cephalosporin —Macrolide —Clindamycin |
| Lesion, fluctuant or pustular, <5 cm in diameter; fever or no fever (Class 2) | Drain abscess surgically if possible; use incision and drainage presumptively for MRSA and monitor closely for response; inpatient management may be indicated | —Trimethoprim sulfamethoxazole —Tetracycline —Clindamycin |
| Lesion, >5 cm in diameter, toxic appearance or at least one unstable comorbidity or a limb-threatening infection (Class 3) | Admit; consider infectious disease consult | Broad-spectrum agent, including vancomycin, for MRSA coverage |
| Sepsis syndrome or life-threatening infection (necrotizing fasciitis)(Class 4) | Admit; institute aggressive surgical debridement; request infectious disease consult | Broad-spectrum agent, including vancomycin, for MRSA coverage |
| Source: Eron et al6 and CDC7 . | ||
When to suspect MRSA skin infection
Patients who have a CA-MRSA skin infection often report a “spider bite” because the lesion appears suddenly and unexpectedly in an area where there is no history of trauma.1 Lesions often are pustular with central necrosis; there may be purulent drainage, redness, tenderness, and palpable fluctuance ( FIGURE ).
CA-MRSA skin lesions can occur anywhere on the body, though they appear most often in the axillae or the groin and buttocks. Patients may or may not have a fever.
Persons at increased risk of CA-MRSA disease include users of health clubs, participants in contact sports, men who have sex with men, children younger than 2 years, users of intravenous drugs, military personnel, and prisoners.2,3 Absence of these risk factors in a patient with a skin or soft-tissue infection does not, however, rule out MRSA.4
Regardless of the lesion’s appearance or the patient’s epidemiologic history, consider CA-MRSA if its prevalence in your community has reached 10% to 15%.
CA-MRSA can cause impetigo, but the often-benign nature of this clinical infection makes management decisions less crucial. However, do hospitalize any patient who has a MRSA infection who also exhibits fever or hypothermia, tachycardia >100 bpm, or hypotension with a systolic blood pressure <90 mm Hg or 20 mm Hg below baseline. A skin lesion >5 cm in diameter also likely requires hospitalization and a parenteral antibiotic.5
FIGURE Class-2 CA-MRSA lesion
This raised, red lesion contains a central eschar with dried pus. Such lesions are generally very tender and often fluctuant when palpated.
Incision and drainage are most important
Several management schemes have been proposed to guide the appropriate level of therapy based on presenting characteristics.6,7 If a lesion is clearly fluctuant, incise it and drain the fluid, or refer the patient for surgical consultation. If the lesion is not clearly fluctuant, needle aspiration may help to determine the need for more extensive incision and drainage or to collect a specimen for culture. Although culture of a skin lesion may not have been routine in the past, the advent of CA-MRSA has made it so—particularly given that MRSA lesions may not be clinically distinguishable from those caused by nonresistant S aureus.
Periodic postprocedure follow-up is indicated to ensure resolution of the infection. At the Boston University student health service, CA-MRSA patients return every few days for an appointment with nursing staff for wound irrigation and packing change until the lesion visibly improves. Systemic effects from the infection are monitored as well.
Incision and drainage technique reported. In one study, adult patients were treated with incision and drainage by a surgeon.8 The technique used a#11 blade applied in a “sawing motion” to create a wide opening. The wound cavity was explored for loculations and packed. The identical technique can be used in the office, with one caveat: This study included patients who had an abscess larger than 5 cm in diameter and some whose immune system was compromised—situations not managed routinely in the office.
Are antibiotics indicated after incision and drainage for MRSA?
In the same study,8 the cure rate with incision and drainage alone was just over 90%. The cure rate in the treatment arm of the study, in which patients also received an antibiotic, was 84% (the difference was statistically insignificant), and coverage was inadequate for MRSA. Treatment with cephalexin after incision and drainage resulted in one patient harmed for every 14 treated.
A pediatric study also showed that antibiotics do not affect the outcome of skin lesions following incision and drainage.5 When deciding whether to prescribe postprocedure antibiotics, keep in mind the need to avoid contributing further to bacterial resistance.
Generally, start the patient on trimethoprim (TMP)-sulfamethoxazole (SMX) or tetracycline if incision and drainage fail to promote healing of the MRSA lesion within 7 days. Clindamycin is an option, although resistance is increasingly common. Adjust the choice and dosage of antibiotic as needed once culture and susceptibility testing results are available.
TMP-SMX is generally well tolerated at the recommended dosage of one or two double-strength tablets (160 mg of TMP, 800 mg of SMX) twice daily for adults. If creatinine clearance is 15 to 30 mL/min, halve the dosage. The rate of sulfa allergy with TMP-SMX (3%) is similar to what is seen with other antibiotics.
Tetracycline’s dosing schedule—for adults, 250 or 500 mg, four times daily— makes it difficult to use. Gastrointestinal upset, phototoxicity, and hepatotoxicity can occur. The possibility of tooth discoloration precludes its use in children.
Clindamycin carries a high rate of gastrointestinal-related problems—Clostridium difficile infection in particular (10% incidence, regardless of route). Inducible resistance to clindamycin is 50% in MRSA infections.9 Recent use of antibiotics may increase the likelihood of clindamycin resistance, with erythromycin in particular inducing such resistance. The dosage typically is 150 to 300 mg, every 6 hours.
Doxycycline and minocycline are not recommended. Both carry a 21% failure rate.10
Linezolid is costly and has many drug interactions. In particular, linezolid has the potential to cause serotonin syndrome with agents that affect the serotonergic system. Linezolid may also interact with medications that affect the adrenergic system (pressor agents). Routine use in the community without infectious disease consultation is not advised.
For lesions that are neither fluctuant nor purulent
In such cases, appropriate first-line antibiotics are a semisynthetic penicillin (e.g., dicloxacillin), a first- or second-generation oral cephalosporin, a macrolide, and clindamycin.10 These antibiotics are preferable for group A streptococcal infections, erysipelas (which can be aggressive), and impetigo. Adjustments can be made as culture results become available or if the clinical response is inadequate. There is no particular utility in waiting to administer oral antibiotics in cases of erysipelas or impetigo, although topical antibiotics can often be used for limited cases of impetigo.
CASE RESOLVED
Your patient, who meets criteria for a Class 2 CA-MRSA infection, undergoes incision and drainage of the lesion. No antibiotic is administered.
Two weeks of daily packing of the wound follow—again, without an antibiotic. Subsequently, the wound heals without sign of infection.
Prevention: Simple precautions are the rule
Most CA-MRSA infections result from direct contact with a patient’s wound or from wound drainage on environmental surfaces.
In the medical office. In addition to using sterile technique during incision and drainage, all staff members must wash hands with soap and water or an alcohol-based sanitizer. For the most part, MRSA remains susceptible to triclosan, a topical antiseptic in commercial hand soaps.
Clean equipment as needed with 10% sodium hypochlorite solution or another agent effective against MRSA. Surgical instruments should be disposable or sterilized after each use.
At the patient’s home. Instruct patients to clean the wound, wearing fresh disposable gloves each time, and to cover it with a new, dry dressing. Tell families to avoid sharing linens and clothing unless they have been washed in hot soap and water and dried in a heated dryer. MRSA can live for weeks or months on surfaces exposed to infected wounds11 ; these surfaces can be disinfected with a 10% solution of bleach.
In sports environments. Athletes who have a CA-MRSA infection should not compete unless the wound can be completely covered with a dry dressing. Recommend to those in charge of school and commercial facilities that, in a confirmed case of MRSA infection, they routinely clean locker rooms and sports equipment with either a 10% bleach solution or commercial disinfectant. There is no evidence, however, that more widespread or vigorous cleaning—such as dismantling a training room and all its cardio-fitness equipment for disinfecting—prevents the spread of MRSA.
Encourage athletes to wash their hands properly. Communal towels should be washed in hot water (>140°F) with bleach before reuse. Personal equipment should be cleaned according to the manufacturer’s instructions. Athletes should use a clean towel to provide a barrier between their skin and the surfaces of weight-room and cardio-fitness equipment. They should also clean equipment before and after use with an appropriate cleanser, such as a disinfectant hand wipe.
Screening household contacts for MRSA isn’t useful; attempts to eradicate colonization are generally ineffective. In a large study of military personnel, intranasal mupirocin failed to decrease nasal carriage of MRSA and the incidence of MRSA infections.11 The MRSA nasal colonization rate was 3.9%; 121 persons colonized with MRSA needed to be treated with nasal mupirocin to prevent one MRSA infection in the total study population.
More complex antibiotic regimens are sometimes used in an attempt to eradicate MRSA carriage, but they also have limited effectiveness and carry the general risks of antibiotic use (e.g., gastrointestinal disturbance, allergic reaction). If your office is considering an eradication attempt, consult first with an infectious disease clinician.
Suggested Reading
1. Moran GJ, Krishnadasan A, Gorwitz RJ, et al. EMERGEncy ID Net Study Group Methicillin-resistant S aureus infections among patients in the emergency department. N Engl J Med. 2006;355:666-674.
2. Cohen PR. The skin in the gym: a comprehensive review of the cutaneous manifestations of community-acquired methicillin-resistant Staphylococcus aureus infection in athletes. Clin Dermatol. 2008;26:16-26.
3. Cohen PR. Community-acquired methicillin-resistant Staphylococcus aureus skin infections: implications for patients and practitioners. Am J Clin Dermatol. 2007;8:259-270.
4. Miller LG, Perdreau-Remington F, Bayer AS, et al. Clinical and epidemiologic characteristics cannot distinguish community-associated methicillin-resistant Staphylococcus aureus infection from methicillin-susceptible S aureus infection: a prospective investigation. Clin Infect Dis. 2007;44:471-482.
5. Lee MC, Rios AM, Aten MF, et al. Management and outcome of children with skin and soft tissue abscesses caused by community-acquired methicillin-resistant Staphylococcus aureus. Pediatr Infect Dis J. 2004;23:123-127.
6. Eron LJ, Lipsky BA, Low DE, et al. Expert panel on managing skin and soft tissue infections Managing skin and soft tissue infections: expert panel recommendations on key decision points. J Antimicrob Chemother. 2003;52(Suppl 1):i3-i17.
7. Centers for Disease Control and Prevention American Medical Association Infectious Diseases Society of America. Outpatient management of skin and soft tissue infections in the era of community-associated MRSA. September 2007. Available at: http://www.amaassn.org/ama1/pub/upload/mm/36/ca_mrsa_desk_102007.pdf. Accessed November 11, 2008.
8. Rajendran PM, Young D, Maurer T, et al. Randomized, double-blind, placebo-controlled trial of cephalexin for treatment of uncomplicated skin abscesses in a population at risk for community-acquired methicillin-resistant Staphylococcus aureus infection. Antimicrob Agents Chemother. 2007;51:4044-4048.
9. Stevens DL, Bisno AL, Chambers HF, et al. Infectious Diseases Society of America Practice guidelines for the diagnosis and management of skin and soft-tissue infections. Clin Infect Dis. 2005;41:1373-1406.
10. Dellit TH, Duchin J. Guidelines for Evaluation and Management of Community-Associated Methicillin Resistant Staphylococcus aureus Skin and Soft Tissue Infections in Outpatient Settings. December 2007. Available at: http://www.kingcounty.gov/healthservices/health/communicable/providers/~/media/health/
publichealth/documents/communicable/MRSA_guide-lines.ashx. Accessed November 11, 2008.
11. Ellis MW, Griffith ME, Dooley DP, et al. Targeted intranasal mupirocin to prevent colonization and infection by community-associated methicillin-resistant Staphylococcus aureus strains in soldiers: a cluster randomized controlled trial. Antimicrob Agents Chemother. 2007;51:3591-3598.
Does Clinical Inertia Vary According to Provider Type?
Stroke Management in Elderly Patients
Calcium, Phosphate, and Heart Risk
Teen Prescription Drug Abuse: A National Epidemic
Abuse of prescription drugs has been a national problem for decades, but recently the number of young Americans using prescription drugs for nonmedical purposes has been increasing at an alarming rate. Between 1999 and 2006, the US Department of Health and Human Services reports, the number of surveyed 12- to 17-year-olds who reported nonmedical use of a psychotherapeutic medication within the previous year increased by more than 60%.1
High-profile cases have thrust the problem into public view. In July 2007, the son of former Vice President Al Gore was arrested on suspicion of illegal possession of Vicodin®, Xanax®, Valium®, and Adderall®.2 And in January 2008, the 28-year-old actor Heath Ledger was found dead of acute intoxication resulting from the combined effects of oxycodone, hydrocodone, diazepam, temazepam, alprazolam, and doxylamine.3
Recent public awareness campaigns have taken up the fight against prescription drug abuse, as demonstrated in television ads from the Partnership for a Drug-Free America (www.drugfree.org). Their clear message is that abuse of prescription drugs can be as dangerous as that of illicit drugs like cocaine or heroin.
In 2005, an estimated 1.4 million US emergency department (ED) visits were related to substance abuse—in 37% of cases, abuse of prescription drugs. Prescription drug overdose is common among 12- to 17-year-olds, with more than 13,000 ED visits per year attributed to overmedication.4 The prescription drugs that are most commonly abused have potentially serious adverse effects and can cause accidental disability or death. They are also frequently implicated in suicide attempts: 45% involve prescription pain medication and 56%, sedatives or stimulants.4
It is imperative for clinicians, especially emergency medicine providers (EMPs), to appreciate the magnitude of prescription drug abuse among adolescents so that overdoses or chronic abuse can be identified appropriately, and treatment and prevention strategies can be implemented. An understanding of the basic pharmacology and toxicology of commonly abused prescription medications is especially helpful.
Awareness of the current trends and demographics of prescription drug abuse will enable EMPs to reevaluate their prescribing practices. The challenge is to maximize safe and effective treatment while minimizing the diversion of prescription drugs and the development of substance abuse disorders.
Defining the Problem
Using the three behavioral variables of intent, practice, and consequences, this definition can be established: Prescription drug abuse is the use of a controlled substance for reasons other than that for which it was prescribed, often in dosages different from those prescribed, resulting in disability or dysfunction and often involving illegal activity and risk of harm to the abuser.5
The National Institute on Drug Abuse6 designates prescription drugs with potential for abuse as psychotherapeutics. Classes of psychotherapeutics, in descending order of prevalence of abuse, are pain relievers, tranquilizers, stimulants, and sedatives.1
Increasing Prevalence
The most recent National Survey on Drug Use and Health (NSDUH) showed use of illicit drugs and overall teen drug use at a five-year low. Since 2002, current illicit drug use among 12- to 17-year-olds has declined by 16%, including an 18% decrease in current marijuana use and a marked 25% decrease in marijuana use among teenage boys.1,7,8
Yet these promising findings are overshadowed by the alarming number of young people who report misusing prescription drugs. More youth now initiate drug use with prescription pain relievers than with marijuana.1 In two recent studies, 5.2 million respondents 12 or older had used prescription pain relievers nonmedically in the previous month—a 10% increase since 2005. Concurrently, overall nonmedical use of prescription drugs among 12- to 17-year-olds increased by 12%.1,7 (See figure.1)
Among adolescents, pain relievers are the most commonly abused prescription drugs. On an average day in 2006, 2,517 adolescents used pain relievers nonmedically for the first time.1 The wide availability of these drugs contributes significantly to the problem. A recent analysis of Drug Enforcement Administration (DEA) data shows that in 1996, Americans purchased more than 200,000 pounds of codeine, hydrocodone, meperidine, morphine, and oxycodone. Between 1997 and 2007, the volume of five major painkillers distributed in the US rose by 90%. Sales of oxycodone alone rose nearly 600% between 1997 and 20059,10 (see Table 19-11).
The simultaneous decline in use of illicit drugs and increase in prescription drug abuse may be explained in part by teenagers' perception that abusing prescriptions is less harmful and less risky than using illicit street drugs. Widespread direct-to-consumer advertising for pain relievers, psychotropics, and sedatives may also lead teens to rationalize their use of prescriptions.
What Demographics Tell Us
Prevalence of prescription drug abuse by adolescents varies by region, ethnicity, and gender. It is highest in small cities and the Western states and lowest in urban areas of the Northeast. Prevalence rates are highest among American Indians or Alaska Natives (17%) and lowest among adolescents of Asian descent (7%). In general, Caucasian youths are more likely to misuse prescription psychotherapeutics than are African-Americans or Asian-Americans.1
Notably, rates of nonmedical prescription use among 12- to 17-year-olds were higher in girls than in boys for pain relievers, stimulants, and tranquilizers.1 In all other age-groups, prescription drug abuse is more prevalent among males.
Several risk factors correlate significantly with adolescent nonmedical prescription use, including mental health treatment, use of illicit drugs, female gender, and binge drinking. Self-reported lack of religiosity, high rates of family conflict, and presence of sensation-seeking behaviors are also considered risk factors.11,12
Diversion of Prescription Psychotherapeutics
Diversion, the most common means of obtaining medications for unintended purposes, encompasses a number of inappropriate or illegal activities, including selling, trading, or sharing legitimately prescribed medications. Patients trying to obtain greater quantities than would ordinarily be prescribed (for primary or secondary purposes) may resort to doctor-shopping, falsely claiming a lost prescription, seeking escalating dosing from the provider, or forgery.
In addition to the long-established routes of diversion (eg, theft, doctor-shopping, malingering), prescription exchange among teenagers is a growing trend. Opioids and other agents are increasingly available to young patients through family members, because rising numbers of prescriptions are being written. These startling increases may reflect a fear of litigation for undertreating patients' pain or a concern to score well in patient satisfaction surveys. Other possible factors are a paradigm shift in pain management, the ever-increasing use of EDs by patients with chronic pain, or influence from the pharmaceutical industry. Nevertheless, the result is a flood of available drugs complicating a system that is already fraught with abuse.
Despite the rise in prescriptions for opioids, only about 14% of those used by teenagers are prescribed for them. Most teens who abuse prescription medications obtain them from peers or family members with legitimate prescriptions. About one-third of those who use prescription opioids rely on Internet no-prescription Web sites (NPWs) or drug dealers.8
In a 2005 Web-based survey of 1,086 high school students, 49% had been prescribed a sleeping aid, sedative, stimulant, or pain medication at least once.10 Among these students, 24% (27.5% of girls; 17.4% of boys) reported having lent their prescriptions or given them to other students.10 Having their medications stolen or being forced to give them away were often cited as significant problems.
Internet NPWs offer teenagers nearly unlimited opportunities to buy psychotherapeutics privately. The Government Accountability Office estimates that some 400 Internet pharmacies (200 based overseas) were selling drugs illegally in 2003.13 Identification beyond a credit card is rarely required, and search engines facilitate purchasing: Using search terms like "no prescription vicodin," Gordon et al14 reported a hit rate of 80% to 90% for NPWs but no links to addiction help–related sites. Buying psychotherapeutics from drug dealers is less discreet but often more expensive (see Table 215,16).
Identifying and Managing Abuse and Overdose
Three drug classes account for the majority of prescription medication abuse among teenagers: opioids, stimulants, and sedative-hypnotics (see Table 31,17). Dose-response curves suggest their anticipated effects, but individual responses vary; anyone willing to take a prescribed medication for nonmedical purposes is at risk for adverse effects. The following is a brief review of presenting signs and symptoms, appropriate intervention, and long-term complications of prescription drug abuse and overdose.18
Opioids
Of the three psychotherapeutic classes mentioned, opioids are most commonly used for nonmedical purposes. This class comprises naturally derived opiates (eg, heroin, morphine, codeine), semisynthetic opioids (eg, hydrocodone, oxycodone), and synthetically made opioids (eg, fentanyl, methadone, meperidine).
After ingestion, the initial effect is relaxation and blunted response to pain. With increasing doses, drowsiness ensues, with a reduction in pulse rate and blood pressure. Other common findings include muscle flaccidity, pupillary miosis, bradypnea, and decreased bowel sounds. (NOTE: Among the opioids, meperidine does not cause miosis.) Significant overdose results in the classic presentation of central nervous system (CNS) and respiratory depression and miosis; the episode may culminate in coma, apnea, and even death.
Treatment of a patient who pre-sents with opioid overdose consists of airway and ventilatory support, with special consideration given to opioid antagonists (eg, naloxone) that competitively inhibit the binding of opioid agonists. The goal of naloxone therapy is to elicit appropriate spontaneous ventilation, not necessarily complete arousal. Precipitation of withdrawal symptoms should be avoided, and clinicians should be aware that the half-life of naloxone is relatively short (especially compared with methadone); resedation may follow initial improvement.
Oxycodone (OxyContin®) is of particular concern, in part due to its potency—and its subsequent prevalence. According to Monitoring the Future,19 a remarkable 5.3% prevalence of oxycodone use was reported in 12th graders in 2007.
Ordinarily, an 80-mg dose of oxycodone is slowly released over 12 hours, but numerous methods are used to circumvent the pill's time-release matrix; these uses are associated with high morbidity and mortality rates. Crushed oxycodone—hillbilly heroin—is immediately available for systemic absorption. Insufflation, too, results in relatively immediate effects. Slower absorption can be achieved by parachuting—a method of rolling or folding powdered or crushed drugs in toilet paper or other thin paper and ingesting it.18
Oxycodone injection requires more preparation. After the wax coating is removed, the pill is crushed into a fine powder, mixed with water, and liquefied over heat; any remaining wax is extracted, and the liquid is filtered through cotton and injected. Residual impurities can cause significant intravascular complications.
Stimulants
These agents include amphetamines and amphetamine-like drugs, such as phendimetrazine and benzphetamine, which are marketed as weight-loss medications. Methamphetamine is the most commonly abused drug in this class, with a lifetime use rate, throughout the US population, of 4.9%.7 However, only a small proportion is derived from the prescription forms used to treat attention-deficit/hyperactivity disorder or narcolepsy.
The two most commonly abused individual stimulants are methylphenidate (Ritalin®) and dextroamphetamine (Dexedrine®), with US lifetime use rates of 1.7% and 1.1%, respectively.7 As a class, prescription diet pills have a higher rate of nonmedical US lifetime use, 3.4%.
Despite amphetamines' low therapeutic index, persons who use them are known to develop high tolerance with ongoing use.18 Clinical response to amphetamines can be described as sympathomimetic effects, with CNS signs and symptoms ranging from anxiety and euphoria to severe agitation, hyperthermia, and seizures. Tachycardia, hypertension, diaphoresis, and tremors are classic symptoms. Potentially lethal complications include tachyarrhythmias, myocardial infarction, rhabdomyolysis, status epilepticus, and intracranial hemorrhage. Chronic use can lead to cardiomyopathy, dental decay, paranoia, and pulmonary hypertension.
The mainstays of treatment include blunting the sympathomimetic response with benzodiazepines and addressing the secondary complications of stimulant use. Managing agitation, hyperthermia, rhabdomyolysis, seizures, and tachydysrhythmias are critical following severe toxicity.18
Sedative-Hypnotic Medications
Under the umbrella of sedative-hypnotic agents fall benzodiazepines, barbiturates, skeletal muscle relaxants, antidepressants, and antihistamines. Certainly, benzodiazepines dominate this assortment, but several other medications pose serious risk when used nonmedically. Despite their preponderance, benzodiazepines cause relatively few deaths (compared with barbiturates), especially when they are used alone.
Although the clinical presentation of a patient with benzodiazepine overdose varies according to the specific agent ingested, common features include drowsiness, CNS depression, stupor, nystagmus, hypothermia, respiratory depression, and coma.18 Occasionally, ataxia is the only presenting sign of accidental benzodiazepine ingestion in the pediatric patient, but CNS depression is usually present. Cardiovascular instability can result directly, from depression of myocardial contractility, medullary depression, and vasodilation; or indirectly, from respiratory compromise. Ancillary signs, such as barbiturate blisters, may facilitate the diagnosis.
Primary treatment remains airway support with symptomatic and supportive care. Though rarely indicated following benzodiazepine poisoning, flumazenil is a competitive inhibitor of benzodiazepine receptors. It should be considered only in patients previously naive to benzodiazepines (as in the case of accidental pediatric ingestion) or following iatrogenic sedation. Use of flumazenil after long-term benzodiazepine therapy or in patients with a lowered seizure threshold may precipitate an acute withdrawal state, arrhythmias, and seizures. With proper airway support and monitoring, most patients improve clinically as the drugs are metabolized.18
Preventive Strategies for Emergency Medicine Clinicians
Although data involving emergency PAs and NPs are not readily available, fewer than 40% of physicians receive formal medical school training in recognizing prescription drug abuse or diversion.4 According to the Center on Addiction and Substance Abuse (CASA) survey, 43% of physicians neglect to ask about prescription drug abuse during the patient history.20
Because continuity of care is inherently lacking in emergency medicine, certain active interventions are recommended during the patient encounter to limit nonmedical use of prescription drugs. Three particularly important techniques are recognizing cardinal features of patients who seek to obtain psychotherapeutic medications for nonmedical purposes; adapting prescription writing habits to provide safe, appropriate interventions; and educating patients.
In a limited time, EMPs must obtain as much information as possible about a patient's illness and personal situation without appearing to be suspicious or judgmental; confrontations may prompt some patients to resort to verbal aggression. Many EMPs pride themselves on their aptitude for "reading" patients and gaining their trust during the initial encounter.
Patterns in the medical records may indicate a history of prescription drug abuse. A more detailed history might elicit other relevant risk factors: a history of chronic pain, psychiatric disorders—even smoking within one hour of waking in the morning.4,20 In the presence of two or more risk factors, strong consideration should be given to nonnarcotic treatment of pain and referral to a primary care clinician for multidisciplinary intervention.
Several available screening tools can increase sensitivity while standardizing the process; examples are the Screener and Opioid Assessment for Patients in Pain (see www.painedu.org) and the Screening Instrument for Substance Abuse Potential.21 These may be more useful in the primary care or outpatient setting than in the ED with its time constraints.
The manner in which EMPs write prescriptions can have direct impact on medication diversion. In the ED, prescriptions are more commonly written for opioid pain medications than for sedatives or stimulants. While addressing pain adequately is important, it is often appropriate to prescribe lower-potency opioids or even nonnarcotic pain relievers. EMPs should limit the total number of pills specified in proportion to the immediate diagnosis, and refills should not be provided—if for no other reason than to encourage timely follow-up.
Delayed-release opioids, because they lack the protective measures built into delayed-release stimulants, should be avoided in the ED for treatment of acute pain; research is under way to develop oxycodone in viscous gel form that is immune to injection.22 In other efforts, opioids are being combined with the antagonist naloxone to blunt the opioids' immediate euphoric effects.20 Writing out the number of pills on hand-written prescriptions and using watermark paper for computer-generated prescriptions can also diminish forgery and diversion.
Patient Education
Educating patients—especially teenagers—about the potential for drug tolerance, dependence, and abuse plays an integral role in combating this problem. With most diverted prescription psychotherapeutic medications coming from family or friends, convincing parents to safeguard prescriptions in the household is critical. A huge discrepancy exists between what parents perceive about their children's prescription drug use and what actually occurs. Although 21% of teenagers admit to using prescription pain medications for their psychotherapeutic effects, only 1% of parents consider it "extremely likely" or "very likely" that their child has done so.23
When parents actively address this important issue—teaching their children about the dangers of drug and prescription drug abuse—these practices can be reduced by nearly half.23 Impressing on parents the importance of their role in preventing prescription drug abuse may be the single most important way for EMPs to further the cause.
Resources for Concerned Clinicians
The DEA and the FDA rely on a complex set of databases to monitor prescription drug abuse. The Drug Abuse Warning Network (DAWN)24 and the NSDUH,8 administered by the Department of Health and Human Services, are two examples. DAWN is a public health surveillance system that monitors drug-related visits to hospital EDs through chart review and drug-related deaths investigated by medical examiners and coroners. By joining DAWN, EDs can gain access to real-time data and receive payments to participate in data collection.24 NSDUH gathers data by administering in-home, face-to-face questionnaires to a representative sample of the population. Both programs publish reports on the Internet and make findings available to the general public.8,24
Also in the arena of prescription drug abuse monitoring is an industry-initiated database known as RADARS (Researched Abuse, Diversion and Addiction-Related Surveillance), developed by Purdue Pharma to address diversion and abuse of OxyContin®. RADARS' goal is to develop proactive, timely, geographically sensitive methods to detect abuse and diversion of OxyContin and other scheduled prescription medications.25 This program acquires high-quality data from drug abuse experts, law enforcement agencies, and regional Poison Control Centers, covering more than 80% of the nation's zip codes. Regionally specific risk-minimization strategies are RADARS' next goal.
Conclusion
Clinicians who provide emergency care are in a position to slow, or even reverse, the escalating misuse of prescription medications by teenage patients. Primary care providers, too, are called on to keep abreast of emerging reports on this trend, to reconsider how they write prescriptions for psychotherapeutic agents, and to be vigilant to the signs of abuse in their adolescent patients.
1. Substance Abuse and Mental Health Services Administration. Results from the 2006 National Survey on Drug Use and Health: National Findings. Rockville, MD: Office of Applied Studies, NSDUH Series H-32; DHHS Publication No. SMA 07-4293. 2007.
2. CNN. Al Gore's son faces drug charges. www.cnn.com/2007/POLITICS/07/20/gore.son/index.html. Accessed October 28, 2008.
3. CNN. Ledger's death caused by accidental overdose. www.cnn.com/2008/SHOWBIZ/Movies/02/06/heath.ledger/index.html. Accessed October 28, 2008.
4. Hertz JA, Knight JR. Prescription drug misuse: a growing national problem. Adolesc Med Clin. 2006;17(3):751-769.
5. Isaacson JH, Hopper JA, Alford DP, Parran T. Prescription drug use and abuse: risk factors, red flags, and prevention strategies. Postgrad Med. 2005;118(1):19-26.
6. National Institute on Drug Abuse, NIH. Trends in prescription drug abuse. www.nida.nih.gov/ResearchReports/Prescription/prescription5.html. Accessed October 28, 2008.
7. Colliver JD, Kroutil LA, Dai L, Gfroerer JC. Misuse of Prescription Drugs: Data From the 2002, 2003, and 2004 National Surveys on Drug Use and Health. Rockville, MD: Substance Abuse and Mental Health Services Administration, Office of Applied Studies; DHHS Publication No. SMA 06-4192, Analytic Series A-28. 2006.
8. Substance Abuse and Mental Health Services Administration. Results from the 2004 National Survey on Drug Use and Health: National Findings. Rockville, MD: Office of Applied Studies; NSDUH Series H-28, DHHS Publication No. SMA 05-4062. 2005.
9. Thomas CP, Conrad P, Casler R, Goodman E. Trends in the use of psychotropic medications among adolescents, 1994 to 2001. Psychiatr Serv. 2006;57(1):63-69.
10. Boyd CJ, McCabe SE, Cranford JA, Young A. Prescription drug abuse and diversion among adolescents in a southeast Michigan school district. Arch Pediatr Adolesc Med. 2007;161(3):276-281.
11. Herman-Stahl MA, Krebs CP, Kroutil LA, Heller DC. Risk and protective factors for nonmedical use of prescription stimulants and methamphetamine among adolescents. J Adolesc Health. 2006;39(3):374-380.
12. National Center on Addiction and Substance Abuse. Formative years: pathways to substance abuse among girls and young women ages 8-22. New York, NY: National Center on Addiction and Substance Abuse at Columbia University; 2003.
13. US General Accounting Office. Internet Pharmacies: Adding Disclosure Requirements Would Aid State and Federal Oversight. Washington, DC: GAO Publication No. GAO-01-69. October 2000.
14. Gordon SM, Forman RF, Siatkowski C. Knowledge and use of the Internet as a source of controlled substances. J Subst Abuse Treat. 2006;30(3):271-274.
15. Cabinet for Health and Family Services, Office of the Inspector General. Overview and demonstration of Enhanced KASPER (Kentucky All Schedule Prescription Electronic Reporting; eKASPER) program (2005). http://chfs.ky.gov/NR/rdonlyres/908A3CE2-D12F-4F90-9790-CCB2A8591067/0/PremierFinalIII.pdf. Accessed October 28, 2008.
16. Goldman B. Unmasking the illicit drug seeker. USA Today. October 19, 2006.
17. Miller NS. Failure of enforcement controlled substance laws in health policy for prescribing opiate medications: a painful assessment of morbidity and mortality. Am J Ther. 2006;13(6):527-533.
18. Olson KR. Specific poisons and drugs: diagnosis and treatment. In: Olson KR. Poisoning and Drug Overdose. 4th ed. McGraw-Hill Medical. 2006.
19. Johnston LD, O'Malley PM, Bachman JG, Schulenberg JE. Monitoring the Future: National Survey Results on Drug Use, 1975-2006: Volume I, Secondary School Students. Bethesda, MD: National Institute on Drug Abuse; NIH Publication No. 07-6205. 2007.
20. Wilson JF. Strategies to stop abuse of prescribed opioid drugs. Ann Intern Med. 2007;146(12):897-900.
21. Coambs RB, Jarry JL, Santhiapillai AC, et al. The SISAP: a new screening instrument for identifying potential opioid abusers in the management of chronic nonmalignant pain within general medical practice. Pain Res Manage. 1996;1(3):155-162.
22. Webster LR. PTI-821: sustained-release oxycodone using gel-cap technology. Expert Opin Investig Drugs. 2007; 16(3):359-366.
23. Manchikanti L. Prescription drug abuse: what is being done to address this new drug epidemic? Testimony before the Subcommittee on Criminal Justice, Drug Policy and Human Resources. Pain Physician. 2006;9(4):287-321.
24. Drug Abuse Warning Network. Welcome to the New Drug Abuse Warning Network (DAWN). http://dawninfo.samhsa.gov. Accessed October 28, 2008.
25. Cicero TJ, Dart RC, Inciardi JA, et al. The development of a comprehensive risk-management program for prescription opioid analgesics: researched abuse, diversion and addiction-related surveillance (RADARS). Pain Med. 2007;8(2):157-170.
Abuse of prescription drugs has been a national problem for decades, but recently the number of young Americans using prescription drugs for nonmedical purposes has been increasing at an alarming rate. Between 1999 and 2006, the US Department of Health and Human Services reports, the number of surveyed 12- to 17-year-olds who reported nonmedical use of a psychotherapeutic medication within the previous year increased by more than 60%.1
High-profile cases have thrust the problem into public view. In July 2007, the son of former Vice President Al Gore was arrested on suspicion of illegal possession of Vicodin®, Xanax®, Valium®, and Adderall®.2 And in January 2008, the 28-year-old actor Heath Ledger was found dead of acute intoxication resulting from the combined effects of oxycodone, hydrocodone, diazepam, temazepam, alprazolam, and doxylamine.3
Recent public awareness campaigns have taken up the fight against prescription drug abuse, as demonstrated in television ads from the Partnership for a Drug-Free America (www.drugfree.org). Their clear message is that abuse of prescription drugs can be as dangerous as that of illicit drugs like cocaine or heroin.
In 2005, an estimated 1.4 million US emergency department (ED) visits were related to substance abuse—in 37% of cases, abuse of prescription drugs. Prescription drug overdose is common among 12- to 17-year-olds, with more than 13,000 ED visits per year attributed to overmedication.4 The prescription drugs that are most commonly abused have potentially serious adverse effects and can cause accidental disability or death. They are also frequently implicated in suicide attempts: 45% involve prescription pain medication and 56%, sedatives or stimulants.4
It is imperative for clinicians, especially emergency medicine providers (EMPs), to appreciate the magnitude of prescription drug abuse among adolescents so that overdoses or chronic abuse can be identified appropriately, and treatment and prevention strategies can be implemented. An understanding of the basic pharmacology and toxicology of commonly abused prescription medications is especially helpful.
Awareness of the current trends and demographics of prescription drug abuse will enable EMPs to reevaluate their prescribing practices. The challenge is to maximize safe and effective treatment while minimizing the diversion of prescription drugs and the development of substance abuse disorders.
Defining the Problem
Using the three behavioral variables of intent, practice, and consequences, this definition can be established: Prescription drug abuse is the use of a controlled substance for reasons other than that for which it was prescribed, often in dosages different from those prescribed, resulting in disability or dysfunction and often involving illegal activity and risk of harm to the abuser.5
The National Institute on Drug Abuse6 designates prescription drugs with potential for abuse as psychotherapeutics. Classes of psychotherapeutics, in descending order of prevalence of abuse, are pain relievers, tranquilizers, stimulants, and sedatives.1
Increasing Prevalence
The most recent National Survey on Drug Use and Health (NSDUH) showed use of illicit drugs and overall teen drug use at a five-year low. Since 2002, current illicit drug use among 12- to 17-year-olds has declined by 16%, including an 18% decrease in current marijuana use and a marked 25% decrease in marijuana use among teenage boys.1,7,8
Yet these promising findings are overshadowed by the alarming number of young people who report misusing prescription drugs. More youth now initiate drug use with prescription pain relievers than with marijuana.1 In two recent studies, 5.2 million respondents 12 or older had used prescription pain relievers nonmedically in the previous month—a 10% increase since 2005. Concurrently, overall nonmedical use of prescription drugs among 12- to 17-year-olds increased by 12%.1,7 (See figure.1)
Among adolescents, pain relievers are the most commonly abused prescription drugs. On an average day in 2006, 2,517 adolescents used pain relievers nonmedically for the first time.1 The wide availability of these drugs contributes significantly to the problem. A recent analysis of Drug Enforcement Administration (DEA) data shows that in 1996, Americans purchased more than 200,000 pounds of codeine, hydrocodone, meperidine, morphine, and oxycodone. Between 1997 and 2007, the volume of five major painkillers distributed in the US rose by 90%. Sales of oxycodone alone rose nearly 600% between 1997 and 20059,10 (see Table 19-11).
The simultaneous decline in use of illicit drugs and increase in prescription drug abuse may be explained in part by teenagers' perception that abusing prescriptions is less harmful and less risky than using illicit street drugs. Widespread direct-to-consumer advertising for pain relievers, psychotropics, and sedatives may also lead teens to rationalize their use of prescriptions.
What Demographics Tell Us
Prevalence of prescription drug abuse by adolescents varies by region, ethnicity, and gender. It is highest in small cities and the Western states and lowest in urban areas of the Northeast. Prevalence rates are highest among American Indians or Alaska Natives (17%) and lowest among adolescents of Asian descent (7%). In general, Caucasian youths are more likely to misuse prescription psychotherapeutics than are African-Americans or Asian-Americans.1
Notably, rates of nonmedical prescription use among 12- to 17-year-olds were higher in girls than in boys for pain relievers, stimulants, and tranquilizers.1 In all other age-groups, prescription drug abuse is more prevalent among males.
Several risk factors correlate significantly with adolescent nonmedical prescription use, including mental health treatment, use of illicit drugs, female gender, and binge drinking. Self-reported lack of religiosity, high rates of family conflict, and presence of sensation-seeking behaviors are also considered risk factors.11,12
Diversion of Prescription Psychotherapeutics
Diversion, the most common means of obtaining medications for unintended purposes, encompasses a number of inappropriate or illegal activities, including selling, trading, or sharing legitimately prescribed medications. Patients trying to obtain greater quantities than would ordinarily be prescribed (for primary or secondary purposes) may resort to doctor-shopping, falsely claiming a lost prescription, seeking escalating dosing from the provider, or forgery.
In addition to the long-established routes of diversion (eg, theft, doctor-shopping, malingering), prescription exchange among teenagers is a growing trend. Opioids and other agents are increasingly available to young patients through family members, because rising numbers of prescriptions are being written. These startling increases may reflect a fear of litigation for undertreating patients' pain or a concern to score well in patient satisfaction surveys. Other possible factors are a paradigm shift in pain management, the ever-increasing use of EDs by patients with chronic pain, or influence from the pharmaceutical industry. Nevertheless, the result is a flood of available drugs complicating a system that is already fraught with abuse.
Despite the rise in prescriptions for opioids, only about 14% of those used by teenagers are prescribed for them. Most teens who abuse prescription medications obtain them from peers or family members with legitimate prescriptions. About one-third of those who use prescription opioids rely on Internet no-prescription Web sites (NPWs) or drug dealers.8
In a 2005 Web-based survey of 1,086 high school students, 49% had been prescribed a sleeping aid, sedative, stimulant, or pain medication at least once.10 Among these students, 24% (27.5% of girls; 17.4% of boys) reported having lent their prescriptions or given them to other students.10 Having their medications stolen or being forced to give them away were often cited as significant problems.
Internet NPWs offer teenagers nearly unlimited opportunities to buy psychotherapeutics privately. The Government Accountability Office estimates that some 400 Internet pharmacies (200 based overseas) were selling drugs illegally in 2003.13 Identification beyond a credit card is rarely required, and search engines facilitate purchasing: Using search terms like "no prescription vicodin," Gordon et al14 reported a hit rate of 80% to 90% for NPWs but no links to addiction help–related sites. Buying psychotherapeutics from drug dealers is less discreet but often more expensive (see Table 215,16).
Identifying and Managing Abuse and Overdose
Three drug classes account for the majority of prescription medication abuse among teenagers: opioids, stimulants, and sedative-hypnotics (see Table 31,17). Dose-response curves suggest their anticipated effects, but individual responses vary; anyone willing to take a prescribed medication for nonmedical purposes is at risk for adverse effects. The following is a brief review of presenting signs and symptoms, appropriate intervention, and long-term complications of prescription drug abuse and overdose.18
Opioids
Of the three psychotherapeutic classes mentioned, opioids are most commonly used for nonmedical purposes. This class comprises naturally derived opiates (eg, heroin, morphine, codeine), semisynthetic opioids (eg, hydrocodone, oxycodone), and synthetically made opioids (eg, fentanyl, methadone, meperidine).
After ingestion, the initial effect is relaxation and blunted response to pain. With increasing doses, drowsiness ensues, with a reduction in pulse rate and blood pressure. Other common findings include muscle flaccidity, pupillary miosis, bradypnea, and decreased bowel sounds. (NOTE: Among the opioids, meperidine does not cause miosis.) Significant overdose results in the classic presentation of central nervous system (CNS) and respiratory depression and miosis; the episode may culminate in coma, apnea, and even death.
Treatment of a patient who pre-sents with opioid overdose consists of airway and ventilatory support, with special consideration given to opioid antagonists (eg, naloxone) that competitively inhibit the binding of opioid agonists. The goal of naloxone therapy is to elicit appropriate spontaneous ventilation, not necessarily complete arousal. Precipitation of withdrawal symptoms should be avoided, and clinicians should be aware that the half-life of naloxone is relatively short (especially compared with methadone); resedation may follow initial improvement.
Oxycodone (OxyContin®) is of particular concern, in part due to its potency—and its subsequent prevalence. According to Monitoring the Future,19 a remarkable 5.3% prevalence of oxycodone use was reported in 12th graders in 2007.
Ordinarily, an 80-mg dose of oxycodone is slowly released over 12 hours, but numerous methods are used to circumvent the pill's time-release matrix; these uses are associated with high morbidity and mortality rates. Crushed oxycodone—hillbilly heroin—is immediately available for systemic absorption. Insufflation, too, results in relatively immediate effects. Slower absorption can be achieved by parachuting—a method of rolling or folding powdered or crushed drugs in toilet paper or other thin paper and ingesting it.18
Oxycodone injection requires more preparation. After the wax coating is removed, the pill is crushed into a fine powder, mixed with water, and liquefied over heat; any remaining wax is extracted, and the liquid is filtered through cotton and injected. Residual impurities can cause significant intravascular complications.
Stimulants
These agents include amphetamines and amphetamine-like drugs, such as phendimetrazine and benzphetamine, which are marketed as weight-loss medications. Methamphetamine is the most commonly abused drug in this class, with a lifetime use rate, throughout the US population, of 4.9%.7 However, only a small proportion is derived from the prescription forms used to treat attention-deficit/hyperactivity disorder or narcolepsy.
The two most commonly abused individual stimulants are methylphenidate (Ritalin®) and dextroamphetamine (Dexedrine®), with US lifetime use rates of 1.7% and 1.1%, respectively.7 As a class, prescription diet pills have a higher rate of nonmedical US lifetime use, 3.4%.
Despite amphetamines' low therapeutic index, persons who use them are known to develop high tolerance with ongoing use.18 Clinical response to amphetamines can be described as sympathomimetic effects, with CNS signs and symptoms ranging from anxiety and euphoria to severe agitation, hyperthermia, and seizures. Tachycardia, hypertension, diaphoresis, and tremors are classic symptoms. Potentially lethal complications include tachyarrhythmias, myocardial infarction, rhabdomyolysis, status epilepticus, and intracranial hemorrhage. Chronic use can lead to cardiomyopathy, dental decay, paranoia, and pulmonary hypertension.
The mainstays of treatment include blunting the sympathomimetic response with benzodiazepines and addressing the secondary complications of stimulant use. Managing agitation, hyperthermia, rhabdomyolysis, seizures, and tachydysrhythmias are critical following severe toxicity.18
Sedative-Hypnotic Medications
Under the umbrella of sedative-hypnotic agents fall benzodiazepines, barbiturates, skeletal muscle relaxants, antidepressants, and antihistamines. Certainly, benzodiazepines dominate this assortment, but several other medications pose serious risk when used nonmedically. Despite their preponderance, benzodiazepines cause relatively few deaths (compared with barbiturates), especially when they are used alone.
Although the clinical presentation of a patient with benzodiazepine overdose varies according to the specific agent ingested, common features include drowsiness, CNS depression, stupor, nystagmus, hypothermia, respiratory depression, and coma.18 Occasionally, ataxia is the only presenting sign of accidental benzodiazepine ingestion in the pediatric patient, but CNS depression is usually present. Cardiovascular instability can result directly, from depression of myocardial contractility, medullary depression, and vasodilation; or indirectly, from respiratory compromise. Ancillary signs, such as barbiturate blisters, may facilitate the diagnosis.
Primary treatment remains airway support with symptomatic and supportive care. Though rarely indicated following benzodiazepine poisoning, flumazenil is a competitive inhibitor of benzodiazepine receptors. It should be considered only in patients previously naive to benzodiazepines (as in the case of accidental pediatric ingestion) or following iatrogenic sedation. Use of flumazenil after long-term benzodiazepine therapy or in patients with a lowered seizure threshold may precipitate an acute withdrawal state, arrhythmias, and seizures. With proper airway support and monitoring, most patients improve clinically as the drugs are metabolized.18
Preventive Strategies for Emergency Medicine Clinicians
Although data involving emergency PAs and NPs are not readily available, fewer than 40% of physicians receive formal medical school training in recognizing prescription drug abuse or diversion.4 According to the Center on Addiction and Substance Abuse (CASA) survey, 43% of physicians neglect to ask about prescription drug abuse during the patient history.20
Because continuity of care is inherently lacking in emergency medicine, certain active interventions are recommended during the patient encounter to limit nonmedical use of prescription drugs. Three particularly important techniques are recognizing cardinal features of patients who seek to obtain psychotherapeutic medications for nonmedical purposes; adapting prescription writing habits to provide safe, appropriate interventions; and educating patients.
In a limited time, EMPs must obtain as much information as possible about a patient's illness and personal situation without appearing to be suspicious or judgmental; confrontations may prompt some patients to resort to verbal aggression. Many EMPs pride themselves on their aptitude for "reading" patients and gaining their trust during the initial encounter.
Patterns in the medical records may indicate a history of prescription drug abuse. A more detailed history might elicit other relevant risk factors: a history of chronic pain, psychiatric disorders—even smoking within one hour of waking in the morning.4,20 In the presence of two or more risk factors, strong consideration should be given to nonnarcotic treatment of pain and referral to a primary care clinician for multidisciplinary intervention.
Several available screening tools can increase sensitivity while standardizing the process; examples are the Screener and Opioid Assessment for Patients in Pain (see www.painedu.org) and the Screening Instrument for Substance Abuse Potential.21 These may be more useful in the primary care or outpatient setting than in the ED with its time constraints.
The manner in which EMPs write prescriptions can have direct impact on medication diversion. In the ED, prescriptions are more commonly written for opioid pain medications than for sedatives or stimulants. While addressing pain adequately is important, it is often appropriate to prescribe lower-potency opioids or even nonnarcotic pain relievers. EMPs should limit the total number of pills specified in proportion to the immediate diagnosis, and refills should not be provided—if for no other reason than to encourage timely follow-up.
Delayed-release opioids, because they lack the protective measures built into delayed-release stimulants, should be avoided in the ED for treatment of acute pain; research is under way to develop oxycodone in viscous gel form that is immune to injection.22 In other efforts, opioids are being combined with the antagonist naloxone to blunt the opioids' immediate euphoric effects.20 Writing out the number of pills on hand-written prescriptions and using watermark paper for computer-generated prescriptions can also diminish forgery and diversion.
Patient Education
Educating patients—especially teenagers—about the potential for drug tolerance, dependence, and abuse plays an integral role in combating this problem. With most diverted prescription psychotherapeutic medications coming from family or friends, convincing parents to safeguard prescriptions in the household is critical. A huge discrepancy exists between what parents perceive about their children's prescription drug use and what actually occurs. Although 21% of teenagers admit to using prescription pain medications for their psychotherapeutic effects, only 1% of parents consider it "extremely likely" or "very likely" that their child has done so.23
When parents actively address this important issue—teaching their children about the dangers of drug and prescription drug abuse—these practices can be reduced by nearly half.23 Impressing on parents the importance of their role in preventing prescription drug abuse may be the single most important way for EMPs to further the cause.
Resources for Concerned Clinicians
The DEA and the FDA rely on a complex set of databases to monitor prescription drug abuse. The Drug Abuse Warning Network (DAWN)24 and the NSDUH,8 administered by the Department of Health and Human Services, are two examples. DAWN is a public health surveillance system that monitors drug-related visits to hospital EDs through chart review and drug-related deaths investigated by medical examiners and coroners. By joining DAWN, EDs can gain access to real-time data and receive payments to participate in data collection.24 NSDUH gathers data by administering in-home, face-to-face questionnaires to a representative sample of the population. Both programs publish reports on the Internet and make findings available to the general public.8,24
Also in the arena of prescription drug abuse monitoring is an industry-initiated database known as RADARS (Researched Abuse, Diversion and Addiction-Related Surveillance), developed by Purdue Pharma to address diversion and abuse of OxyContin®. RADARS' goal is to develop proactive, timely, geographically sensitive methods to detect abuse and diversion of OxyContin and other scheduled prescription medications.25 This program acquires high-quality data from drug abuse experts, law enforcement agencies, and regional Poison Control Centers, covering more than 80% of the nation's zip codes. Regionally specific risk-minimization strategies are RADARS' next goal.
Conclusion
Clinicians who provide emergency care are in a position to slow, or even reverse, the escalating misuse of prescription medications by teenage patients. Primary care providers, too, are called on to keep abreast of emerging reports on this trend, to reconsider how they write prescriptions for psychotherapeutic agents, and to be vigilant to the signs of abuse in their adolescent patients.
1. Substance Abuse and Mental Health Services Administration. Results from the 2006 National Survey on Drug Use and Health: National Findings. Rockville, MD: Office of Applied Studies, NSDUH Series H-32; DHHS Publication No. SMA 07-4293. 2007.
2. CNN. Al Gore's son faces drug charges. www.cnn.com/2007/POLITICS/07/20/gore.son/index.html. Accessed October 28, 2008.
3. CNN. Ledger's death caused by accidental overdose. www.cnn.com/2008/SHOWBIZ/Movies/02/06/heath.ledger/index.html. Accessed October 28, 2008.
4. Hertz JA, Knight JR. Prescription drug misuse: a growing national problem. Adolesc Med Clin. 2006;17(3):751-769.
5. Isaacson JH, Hopper JA, Alford DP, Parran T. Prescription drug use and abuse: risk factors, red flags, and prevention strategies. Postgrad Med. 2005;118(1):19-26.
6. National Institute on Drug Abuse, NIH. Trends in prescription drug abuse. www.nida.nih.gov/ResearchReports/Prescription/prescription5.html. Accessed October 28, 2008.
7. Colliver JD, Kroutil LA, Dai L, Gfroerer JC. Misuse of Prescription Drugs: Data From the 2002, 2003, and 2004 National Surveys on Drug Use and Health. Rockville, MD: Substance Abuse and Mental Health Services Administration, Office of Applied Studies; DHHS Publication No. SMA 06-4192, Analytic Series A-28. 2006.
8. Substance Abuse and Mental Health Services Administration. Results from the 2004 National Survey on Drug Use and Health: National Findings. Rockville, MD: Office of Applied Studies; NSDUH Series H-28, DHHS Publication No. SMA 05-4062. 2005.
9. Thomas CP, Conrad P, Casler R, Goodman E. Trends in the use of psychotropic medications among adolescents, 1994 to 2001. Psychiatr Serv. 2006;57(1):63-69.
10. Boyd CJ, McCabe SE, Cranford JA, Young A. Prescription drug abuse and diversion among adolescents in a southeast Michigan school district. Arch Pediatr Adolesc Med. 2007;161(3):276-281.
11. Herman-Stahl MA, Krebs CP, Kroutil LA, Heller DC. Risk and protective factors for nonmedical use of prescription stimulants and methamphetamine among adolescents. J Adolesc Health. 2006;39(3):374-380.
12. National Center on Addiction and Substance Abuse. Formative years: pathways to substance abuse among girls and young women ages 8-22. New York, NY: National Center on Addiction and Substance Abuse at Columbia University; 2003.
13. US General Accounting Office. Internet Pharmacies: Adding Disclosure Requirements Would Aid State and Federal Oversight. Washington, DC: GAO Publication No. GAO-01-69. October 2000.
14. Gordon SM, Forman RF, Siatkowski C. Knowledge and use of the Internet as a source of controlled substances. J Subst Abuse Treat. 2006;30(3):271-274.
15. Cabinet for Health and Family Services, Office of the Inspector General. Overview and demonstration of Enhanced KASPER (Kentucky All Schedule Prescription Electronic Reporting; eKASPER) program (2005). http://chfs.ky.gov/NR/rdonlyres/908A3CE2-D12F-4F90-9790-CCB2A8591067/0/PremierFinalIII.pdf. Accessed October 28, 2008.
16. Goldman B. Unmasking the illicit drug seeker. USA Today. October 19, 2006.
17. Miller NS. Failure of enforcement controlled substance laws in health policy for prescribing opiate medications: a painful assessment of morbidity and mortality. Am J Ther. 2006;13(6):527-533.
18. Olson KR. Specific poisons and drugs: diagnosis and treatment. In: Olson KR. Poisoning and Drug Overdose. 4th ed. McGraw-Hill Medical. 2006.
19. Johnston LD, O'Malley PM, Bachman JG, Schulenberg JE. Monitoring the Future: National Survey Results on Drug Use, 1975-2006: Volume I, Secondary School Students. Bethesda, MD: National Institute on Drug Abuse; NIH Publication No. 07-6205. 2007.
20. Wilson JF. Strategies to stop abuse of prescribed opioid drugs. Ann Intern Med. 2007;146(12):897-900.
21. Coambs RB, Jarry JL, Santhiapillai AC, et al. The SISAP: a new screening instrument for identifying potential opioid abusers in the management of chronic nonmalignant pain within general medical practice. Pain Res Manage. 1996;1(3):155-162.
22. Webster LR. PTI-821: sustained-release oxycodone using gel-cap technology. Expert Opin Investig Drugs. 2007; 16(3):359-366.
23. Manchikanti L. Prescription drug abuse: what is being done to address this new drug epidemic? Testimony before the Subcommittee on Criminal Justice, Drug Policy and Human Resources. Pain Physician. 2006;9(4):287-321.
24. Drug Abuse Warning Network. Welcome to the New Drug Abuse Warning Network (DAWN). http://dawninfo.samhsa.gov. Accessed October 28, 2008.
25. Cicero TJ, Dart RC, Inciardi JA, et al. The development of a comprehensive risk-management program for prescription opioid analgesics: researched abuse, diversion and addiction-related surveillance (RADARS). Pain Med. 2007;8(2):157-170.
Hamstring Injuries
Cauda Equina Syndrome: A Comprehensive Review
OSTEOPOROSIS
Dr. Goldstein serves on the advisory boards of Eli Lilly, Pfizer, GlaxoSmithKline, Novo Nordisk, Novartis, Procter & Gamble, Upsher Smith, and Wyeth; is a consultant for Cook ObGyn and Ackrad Labs (a Cooper Co.); and is a speaker for Eli Lilly, Novo Nordisk, Procter & Gamble, and Wyeth.
- release of the long-awaited fracture risk-assessment tool, FRAX, from the World Health Organization
- release of updated guidelines on osteoporosis treatment from the National Osteoporosis Foundation—the first revision since 2003
- investigations of a possible association between atrial fibrillation and oral bisphosphonates
- release of guidelines on diagnosis, risk identification, prevention, and management of bisphosphonate-associated osteonecrosis of the jaw
- reports of low-energy femoral-shaft fractures associated with long-term use of alendronate
- report of data from a comparison of alendronate and denosumab, a new antiresorptive agent.
Each of these is explored in detail in this review.
FRAX tool makes it possible to direct therapy to women who need it most
The World Health Organization (WHO) has finally released the FRAX risk-assessment tool, which enables clinicians to calculate a woman’s 10-year risk of developing a hip fracture or any major osteoporotic fracture. The tool (at www.shef.ac.uk/FRAX) should, ultimately, be available as part of all dual-energy x-ray absorptiometry (DXA) software so that, when bone mass is measured, the patient’s 10-year risk of hip fracture and overall osteoporotic fracture is reported along with bone density.
FRAX has different thresholds for treatment from country to country, depending on resources available. The tool uses age, weight, height, fracture history, parental fracture history, smoking status, glucocorticoid use, history of rheumatoid arthritis, alcohol consumption, and bone mineral density (BMD) of the femoral neck to determine a woman’s risk of fracture.
In many respects, this tool is a welcome change from the use of BMD measurements alone. I have long been concerned that many clinicians base treatment decisions solely on T-scores. Compare, for example, a 51-year-old newly menopausal woman who has a T-score of -2.0 at the hip with a 67-year-old woman who has the same T-score but who entered menopause at age 48 with a T-score of 0. These women have the same bone mass but very different degrees of bone quality and fracture risk.
Nevertheless, use of an arbitrary threshold (i.e., 3% risk of hip fracture and 20% risk of any osteoporotic fracture over the next 10 years) to determine who gets treatment has limitations. Virtually all bone experts would agree that a pharmacotherapeutic agent that reduces hip fracture by 50% is a “home run.” However, if we deny treatment until a woman’s 10-year risk of hip fracture reaches 3%, that is the same as saying that, for every 100 women who are treated, only 1.5 will fracture a hip instead of three. The health establishment may call that cost-effective, but it will not be acceptable to all patients.
Moreover, patients do not always understand the difference between risk reduction and prevention. It pays to remember these facts when counseling women.
NOF uses new risk-assessment tool to refine treatment guidelines
National Osteoporosis Foundation. Clinician’s Guide to Prevention and Treatment of Osteoporosis. Available at: www.nof.org/professionals/clinicians_guide_landing_pg.htm. Accessed October 8, 2008.
Dawson-Hughes B, Tosteson ANA, Melton LJ 3rd, et al, for the National Osteoporosis Foundation Guide Committee. Implications of absolute fracture risk assessment for osteoporosis practice guidelines in the USA. Osteoporos Int. 2008;19:449–458.
Siris E, Delmas PD. Assessment of 10-year absolute fracture risk: a new paradigm with worldwide application [editorial]. Osteoporos Int. 2008;19:383–384.
In February, the National Osteoporosis Foundation (NOF) updated its Clinician’s Guide to Prevention and Treatment of Osteoporosis, first published in 1999 and last revised (with minor changes) in 2003. The guidelines are available at www.nof.org/professionals/clinicians_guide_landing_pg.htm, along with a link to the WHO fracture risk-assessment tool, FRAX (www.shef.ac.uk/FRAX).
The previous NOF guidelines applied only to postmenopausal white women and based recommendations for intervention entirely on a patient’s T-score, with some modification of the level of intervention with the presence of clinical risk factors. The new guidelines make use of FRAX to focus recommendations on those at highest risk of fracture.
When to begin treatment
The new NOF guidelines advise the practitioner to:
- check for secondary causes of osteoporosis
- recommend BMD testing for women 65 years and older, for younger postmenopausal women when the risk-factor profile raises concern, and when there is a history of fracture
- initiate treatment in women who have had hip or vertebral fracture
- initiate treatment in women who have a DXA-based T-score ≤-2.5 at the femoral neck, total hip, or spine
- initiate treatment in postmenopausal women who have low bone mass (T-score >-2.5 but <-1.0) and a 10-year risk of hip fracture ≥3% or a 10-year probability of any major osteoporosis-related fracture >20%, based on the US-adopted WHO absolute fracture risk model
- measure BMD in DXA centers that use accepted quality assurance measures appropriate for monitoring bone loss every 2 years. For patients on pharmacotherapy, DXA BMD testing is typically performed 2 years after initiating therapy and at 2-year intervals thereafter.
New determinants of treatment
These guidelines replace earlier ones in which all postmenopausal women who had a T-score <-2.0 and those who had a T-score <-1.5 “with risk factors” were candidates for therapy.
Treatment shifts to older population
The new guidelines will probably shift some treatment from younger patients who have a modestly reduced BMD to an older population more likely to have a higher risk of fracture.
For example, consider the following patient—a 52-year-old Caucasian woman who:
- is 5 ft 4 in tall and weighs 130 lb
- has no family or personal history of fracture
- doesn’t smoke or use alcohol excessively
- doesn’t use glucocorticoids
- has no rheumatoid arthritis
- has a femoral-neck T-score of -2.1.
She has a 10-year risk of hip fracture of 1.5% and an 8.5% risk of any major osteoporotic fracture. Therefore, she is no longer a candidate for pharmacotherapy. (Under the previous guidelines, she was.)
Conversely, a 77-year-old woman who has the same height, weight, and history and a T-score of the femoral neck of -1.4, has a 10-year risk of hip fracture of 2.7% and a 23% risk of any major osteoporotic fracture. She is now a candidate for pharmacotherapy. (Under the previous guidelines, she was not a candidate.)
How to counsel the patient
The updated guidelines also include a range of recommendations on what information to include in patient counseling:
- the risk of osteoporosis and related fracture
- the need to get adequate calcium (1,200 mg/day) and vitamin D (800 to 1,000 IU/day)
- the importance of regular weight-bearing and muscle-strengthening exercise to reduce the risk of fall and fracture
- the need to avoid smoking and excess alcohol intake.
Oral bisphosphonates and atrial fibrillation—is there a link?
Heckbert SR, Li G, Cummings SR, Smith NL, Psaty BM. Use of alendronate and risk of incident atrial fibrillation in women. Arch Intern Med. 2008;168:826–831.
Black DM, Delmas PD, Eastell R, et al, for the HORIZON Pivotal Fracture Trial. Once-yearly zoledronic acid for treatment of postmenopausal osteoporosis. N Engl J Med. 2007;356:1809–1822.
Sørensen HT, Christensen S, Mehnert F, et al. Use of bisphosphonates among women and risk of atrial fibrillation and flutter: population-based case-control study. BMJ. 2008;336:813–816.
Postmenopausal women who have osteoporosis and are treated with once-yearly IV zoledronic acid have a higher risk of serious atrial fibrillation than nonusers do, according to a recent publication from the Health Outcomes and Reduced Incidence with Zoledronic Acid Once Yearly (HORIZON) trial. This finding was unexpected and had not been recognized previously. But does it indicate elevated risk with oral bisphosphonate use?
In the Fracture Intervention Trial (FIT) of alendronate for patients who have osteoporosis, the risk of serious atrial fibrillation was higher in alendronate recipients (1.5%, n=47) than in nonusers (1.0%, n=31).1 However, this difference did not quite reach statistical significance (p=.07).
One case-control study points to 3% risk
The findings in regard to annual infusion of zoledronic acid prompted further evaluation of oral bisphosphonates. Heckbert and colleagues conducted a population-based case-control study at Group Health, an integrated health-care delivery system in Washington state, and estimated that 3% of incident atrial fibrillation might be explained by alendronate use.
Over 3 years, they identified 719 women who had a confirmed history of atrial fibrillation and 966 controls who did not, selected at random from the Group Health enrollment but matched for age and presence or absence of treated hypertension. More atrial fibrillation case patients than controls had ever used alendronate (6.5% [n=47] vs 4.1% [n=40]; p=.03).
Compared with never users of any bisphosphonate, those who had used alendronate had a higher risk of incident atrial fibrillation (odds ratio, 1.86; 95% confidence interval [CI], 1.09–3.15) after adjustment for matching variables, a diagnosis of osteoporosis, and history of cardiovascular disease.
Second case-control study finds no elevated risk
Sørensen and associates conducted a case-control study using medical databases in Denmark and concluded that there is no increased risk of atrial fibrillation and flutter with use of an oral bisphosphonate. They identified 13,586 patients who had atrial fibrillation and flutter and 65,054 patients who did not. Of these, 435 cases (3.2%) and 1,958 controls (2.9%) were current users of a bisphosphonate for osteoporosis. Etidronate and alendronate were used with almost the same frequency among cases and controls. The adjusted relative risk of atrial fibrillation with current use of a bisphosphonate, compared with nonuse, was 0.95 (95% CI, 0.84–1.07). New users had a relative risk of 0.75 (95% CI, 0.49–1.16), broadly similar to the estimate for continuing users (relative risk, 0.96; 95% CI, 0.85–1.09).
Bottom line? There is no compelling evidence that oral bisphosphonates cause an increase in atrial fibrillation. Even in the smaller case-control study that found a suggestion of elevated risk, the authors think that, at most, 3% of cases of atrial fibrillation might be attributable to oral alendronate.
An approach to osteonecrosis of the jaw among bisphosphonate users
Khan AA, Sándor GK, Dore E, et al. Canadian consensus practice guidelines for bisphosphonate-associated osteonecrosis of the jaw. J Rheumatol. 2008;35:1391–1397.
Since 2003, when the first reports of osteonecrosis of the jaw (ONJ) in patients receiving bisphosphonates were published, there has been widespread uncertainty among patients, physicians, and oral surgeons about diagnosis, identification of individuals at risk, prevention, and management of this troubling disorder (FIGURE 1).
To address these concerns, a multidisciplinary task force was convened by the Canadian Association of Oral and Maxillofacial Surgeons to systematically review the data. The task force included representatives from national and international societies representing the disciplines of oral surgery, dentistry, oral pathology, oral medicine, endocrinology, rheumatology, and oncology.
After reviewing the data, the task force made the following recommendations:
- In all oncology patients, a thorough dental examination, including radiographs, should be completed before IV bisphosphonate therapy is initiated. In this population, any invasive dental procedure is ideally completed before the start of high-dose bisphosphonate therapy. For nonurgent procedures in current users of bisphosphonate therapy, the drug should be discontinued 3 to 6 months before the dental treatment.
- Nononcology patients who are starting oral or IV bisphosphonate therapy do not require a dental examination beforehand, provided dental care is appropriate and oral hygiene is good.
- All patients taking a bisphosponate should be encouraged to stop smoking, limit alcohol use, and maintain good oral hygiene.
- Patients who have already been diagnosed with ONJ are best managed with supportive care, including pain control, treatment of secondary infection, and removal of necrotic debris. Aggressive debridement is contraindicated.
These recommendations are extremely helpful, especially because they make it clear that the average patient who has osteoporosis does not need to discontinue therapy before undergoing a dental procedure. Nor do patients who are about to embark on therapy—oral or IV—need any special dental examination as long as they maintain good oral hygiene and dental self-care.
Task force members were identified on the basis of their knowledge and expertise in the diagnosis and management of ONJ.
FIGURE 1 Osteonecrosis of the jaw
Blood flow to bone tissue is decreased in osteonecrosis of the jaw, leading to death of that tissue and the eventual collapse of bone.
ILLUSTRATIONS BY ROB FLEWELL FOR OBG MANAGEMENT
Distinctive fracture pattern linked to long-term alendronate
Neviaser AS, Lane JM, Lenart BA, Edobor-Osula F, Lorich DG. Low-energy femoral shaft fractures associated with alendronate use. J Orthop Trauma. 2008;22:346–350.
Patients who sustain a fracture of the proximal femoral shaft after minimal or no trauma are likely to be long-term users of alendronate, according to a recent study. These fractures are characterized by a simple transverse pattern, “beaking” of the cortex on one side, and hypertrophy of the diaphyseal cortex (FIGURE 2).
In a retrospective study, Neviaser and colleagues blindly reviewed both radiographs and medical records of 59 patients who had femoral-shaft fractures. Among the 25 users of alendronate, 19 had experienced low- or no-trauma fractures with this distinctive pattern; only one nonuser had (odds ratio, 139.33; 95% CI, 19.0–939.4; p<.0001). This fracture pattern was 98% specific to alendronate use.
The average duration of alendronate use in patients who had this fracture pattern was significantly longer than in those who did not (6.9 years vs 2.5 years, respectively; p=.002). Only one patient with this fracture pattern had been taking alendronate for less than 4 years.
FIGURE 2 Low-impact femoral fracture
Simple transverse fractures of the proximal femur after low or no trauma have been linked to long-term alendronate use.
First reports came in 2005
Neviaser and associates mention case reports from 2005 that described nine patients who sustained spontaneous nontraumatic, nonpathologic fractures while on prolonged alendronate therapy (>3 years).2 In 2007, Goh and colleagues reported 13 subtrochanteric fractures, nine of which occurred in patients treated with alendronate. Of the nine, eight had a pattern associated with cortical hypertrophy.3
Cause-and-effect relationship remains unproven
The proximal femoral shaft is normally subjected to high stress, Neviaser and colleagues observe, and would not be expected to fracture from minimal trauma without underlying bone pathology.
In their study, 11 patients who had untreated osteoporosis had femoral-shaft fractures, but none had this specific pattern (unicortical beak, hypertrophied diaphyseal cortex). The authors hypothesize that adynamic metabolism from impaired resorption may be the underlying pathophysiology that leads to these fractures. They also point out that, although the pattern was 98% specific to alendronate users, this does not necessarily prove cause and effect—only an association. Clearly, further study is necessary.
Denosumab outperforms alendronate in phase 3 trial
Brown JP, Prince RL, Deal C, et al. Comparison of the effect of denosumab and alendronate on bone mineral density and biochemical markers of bone turnover in postmenopausal women with low bone mass: a randomized, blinded, phase 3 trial. J Bone Miner Res. 2008; Sep 3 [Epub ahead of print].
In the first head-to-head comparison of a nonbisphosphonate with alendronate, Brown and colleagues found significantly increased BMD at the total hip with denosumab after 12 months of use (3.5% vs 2.6%; p<.0001). This finding was reported at the American Society of Bone and Mineral Research annual meeting in Montreal in September.
Denosumab is an antiresorptive agent that inhibits osteoclast-mediated bone resorption and works through a different pathway than bisphosphonates. It is a fully human monoclonal antibody that neutralizes RANKL, a key mediator of osteoclast function, formation, and survival. Denosumab is injectable (subcutaneous) and is given every 6 months.
All sites showed improvement in BMD
In the phase 3 trial, 1,189 postmenopausal women who had a T-score at the total hip or lumbar spine ≤-2.0 were randomized to receive a subcutaneous injection of denosumab (60 mg every 6 months plus an oral placebo weekly) or oral alendronate (70 mg weekly plus a subcutaneous placebo injection every 6 months). Bone mineral density was monitored at various sites to detect any changes, as were bone-turnover markers at various times during the study.
In addition to BMD at the total hip, denosumab increased BMD at the following sites at 12 months, compared with alendronate:
- femoral neck, 0.6%
- trochanter, 1.0%
- lumbar spine, 1.1%
- distal radius, 0.6% (p≤.0002 at all sites).
Denosumab also was associated with a significantly greater reduction of bone-turnover markers than alendronate. The two groups had similar laboratory values and adverse events.
Although these preliminary results are extremely encouraging, we await data on fracture reduction from a study under way in postmenopausal women who have osteoporosis before definitive recommendations can be made about this agent.
1. Cummings SR, Schwartz AV, Black DM. Alendronate and atrial fibrillation [letter]. N Engl J Med. 2007;356:1895-1896.
2. Odvina CV, Zerwekh JE, Rao DS, Maalouf N, Gottschalk FA, Pak CY. Severely suppressed bone turnover: a potential complication of alendronate therapy. J Clin Endocrinol Metab. 2005;90:1294-1301.
3. Goh SK, Yang KY, Koh JS, et al. Subtrochanteric insufficiency fractures in patients on alendronate therapy: a caution. J Bone Joint Surg Br. 2007;89:349-353.
Dr. Goldstein serves on the advisory boards of Eli Lilly, Pfizer, GlaxoSmithKline, Novo Nordisk, Novartis, Procter & Gamble, Upsher Smith, and Wyeth; is a consultant for Cook ObGyn and Ackrad Labs (a Cooper Co.); and is a speaker for Eli Lilly, Novo Nordisk, Procter & Gamble, and Wyeth.
- release of the long-awaited fracture risk-assessment tool, FRAX, from the World Health Organization
- release of updated guidelines on osteoporosis treatment from the National Osteoporosis Foundation—the first revision since 2003
- investigations of a possible association between atrial fibrillation and oral bisphosphonates
- release of guidelines on diagnosis, risk identification, prevention, and management of bisphosphonate-associated osteonecrosis of the jaw
- reports of low-energy femoral-shaft fractures associated with long-term use of alendronate
- report of data from a comparison of alendronate and denosumab, a new antiresorptive agent.
Each of these is explored in detail in this review.
FRAX tool makes it possible to direct therapy to women who need it most
The World Health Organization (WHO) has finally released the FRAX risk-assessment tool, which enables clinicians to calculate a woman’s 10-year risk of developing a hip fracture or any major osteoporotic fracture. The tool (at www.shef.ac.uk/FRAX) should, ultimately, be available as part of all dual-energy x-ray absorptiometry (DXA) software so that, when bone mass is measured, the patient’s 10-year risk of hip fracture and overall osteoporotic fracture is reported along with bone density.
FRAX has different thresholds for treatment from country to country, depending on resources available. The tool uses age, weight, height, fracture history, parental fracture history, smoking status, glucocorticoid use, history of rheumatoid arthritis, alcohol consumption, and bone mineral density (BMD) of the femoral neck to determine a woman’s risk of fracture.
In many respects, this tool is a welcome change from the use of BMD measurements alone. I have long been concerned that many clinicians base treatment decisions solely on T-scores. Compare, for example, a 51-year-old newly menopausal woman who has a T-score of -2.0 at the hip with a 67-year-old woman who has the same T-score but who entered menopause at age 48 with a T-score of 0. These women have the same bone mass but very different degrees of bone quality and fracture risk.
Nevertheless, use of an arbitrary threshold (i.e., 3% risk of hip fracture and 20% risk of any osteoporotic fracture over the next 10 years) to determine who gets treatment has limitations. Virtually all bone experts would agree that a pharmacotherapeutic agent that reduces hip fracture by 50% is a “home run.” However, if we deny treatment until a woman’s 10-year risk of hip fracture reaches 3%, that is the same as saying that, for every 100 women who are treated, only 1.5 will fracture a hip instead of three. The health establishment may call that cost-effective, but it will not be acceptable to all patients.
Moreover, patients do not always understand the difference between risk reduction and prevention. It pays to remember these facts when counseling women.
NOF uses new risk-assessment tool to refine treatment guidelines
National Osteoporosis Foundation. Clinician’s Guide to Prevention and Treatment of Osteoporosis. Available at: www.nof.org/professionals/clinicians_guide_landing_pg.htm. Accessed October 8, 2008.
Dawson-Hughes B, Tosteson ANA, Melton LJ 3rd, et al, for the National Osteoporosis Foundation Guide Committee. Implications of absolute fracture risk assessment for osteoporosis practice guidelines in the USA. Osteoporos Int. 2008;19:449–458.
Siris E, Delmas PD. Assessment of 10-year absolute fracture risk: a new paradigm with worldwide application [editorial]. Osteoporos Int. 2008;19:383–384.
In February, the National Osteoporosis Foundation (NOF) updated its Clinician’s Guide to Prevention and Treatment of Osteoporosis, first published in 1999 and last revised (with minor changes) in 2003. The guidelines are available at www.nof.org/professionals/clinicians_guide_landing_pg.htm, along with a link to the WHO fracture risk-assessment tool, FRAX (www.shef.ac.uk/FRAX).
The previous NOF guidelines applied only to postmenopausal white women and based recommendations for intervention entirely on a patient’s T-score, with some modification of the level of intervention with the presence of clinical risk factors. The new guidelines make use of FRAX to focus recommendations on those at highest risk of fracture.
When to begin treatment
The new NOF guidelines advise the practitioner to:
- check for secondary causes of osteoporosis
- recommend BMD testing for women 65 years and older, for younger postmenopausal women when the risk-factor profile raises concern, and when there is a history of fracture
- initiate treatment in women who have had hip or vertebral fracture
- initiate treatment in women who have a DXA-based T-score ≤-2.5 at the femoral neck, total hip, or spine
- initiate treatment in postmenopausal women who have low bone mass (T-score >-2.5 but <-1.0) and a 10-year risk of hip fracture ≥3% or a 10-year probability of any major osteoporosis-related fracture >20%, based on the US-adopted WHO absolute fracture risk model
- measure BMD in DXA centers that use accepted quality assurance measures appropriate for monitoring bone loss every 2 years. For patients on pharmacotherapy, DXA BMD testing is typically performed 2 years after initiating therapy and at 2-year intervals thereafter.
New determinants of treatment
These guidelines replace earlier ones in which all postmenopausal women who had a T-score <-2.0 and those who had a T-score <-1.5 “with risk factors” were candidates for therapy.
Treatment shifts to older population
The new guidelines will probably shift some treatment from younger patients who have a modestly reduced BMD to an older population more likely to have a higher risk of fracture.
For example, consider the following patient—a 52-year-old Caucasian woman who:
- is 5 ft 4 in tall and weighs 130 lb
- has no family or personal history of fracture
- doesn’t smoke or use alcohol excessively
- doesn’t use glucocorticoids
- has no rheumatoid arthritis
- has a femoral-neck T-score of -2.1.
She has a 10-year risk of hip fracture of 1.5% and an 8.5% risk of any major osteoporotic fracture. Therefore, she is no longer a candidate for pharmacotherapy. (Under the previous guidelines, she was.)
Conversely, a 77-year-old woman who has the same height, weight, and history and a T-score of the femoral neck of -1.4, has a 10-year risk of hip fracture of 2.7% and a 23% risk of any major osteoporotic fracture. She is now a candidate for pharmacotherapy. (Under the previous guidelines, she was not a candidate.)
How to counsel the patient
The updated guidelines also include a range of recommendations on what information to include in patient counseling:
- the risk of osteoporosis and related fracture
- the need to get adequate calcium (1,200 mg/day) and vitamin D (800 to 1,000 IU/day)
- the importance of regular weight-bearing and muscle-strengthening exercise to reduce the risk of fall and fracture
- the need to avoid smoking and excess alcohol intake.
Oral bisphosphonates and atrial fibrillation—is there a link?
Heckbert SR, Li G, Cummings SR, Smith NL, Psaty BM. Use of alendronate and risk of incident atrial fibrillation in women. Arch Intern Med. 2008;168:826–831.
Black DM, Delmas PD, Eastell R, et al, for the HORIZON Pivotal Fracture Trial. Once-yearly zoledronic acid for treatment of postmenopausal osteoporosis. N Engl J Med. 2007;356:1809–1822.
Sørensen HT, Christensen S, Mehnert F, et al. Use of bisphosphonates among women and risk of atrial fibrillation and flutter: population-based case-control study. BMJ. 2008;336:813–816.
Postmenopausal women who have osteoporosis and are treated with once-yearly IV zoledronic acid have a higher risk of serious atrial fibrillation than nonusers do, according to a recent publication from the Health Outcomes and Reduced Incidence with Zoledronic Acid Once Yearly (HORIZON) trial. This finding was unexpected and had not been recognized previously. But does it indicate elevated risk with oral bisphosphonate use?
In the Fracture Intervention Trial (FIT) of alendronate for patients who have osteoporosis, the risk of serious atrial fibrillation was higher in alendronate recipients (1.5%, n=47) than in nonusers (1.0%, n=31).1 However, this difference did not quite reach statistical significance (p=.07).
One case-control study points to 3% risk
The findings in regard to annual infusion of zoledronic acid prompted further evaluation of oral bisphosphonates. Heckbert and colleagues conducted a population-based case-control study at Group Health, an integrated health-care delivery system in Washington state, and estimated that 3% of incident atrial fibrillation might be explained by alendronate use.
Over 3 years, they identified 719 women who had a confirmed history of atrial fibrillation and 966 controls who did not, selected at random from the Group Health enrollment but matched for age and presence or absence of treated hypertension. More atrial fibrillation case patients than controls had ever used alendronate (6.5% [n=47] vs 4.1% [n=40]; p=.03).
Compared with never users of any bisphosphonate, those who had used alendronate had a higher risk of incident atrial fibrillation (odds ratio, 1.86; 95% confidence interval [CI], 1.09–3.15) after adjustment for matching variables, a diagnosis of osteoporosis, and history of cardiovascular disease.
Second case-control study finds no elevated risk
Sørensen and associates conducted a case-control study using medical databases in Denmark and concluded that there is no increased risk of atrial fibrillation and flutter with use of an oral bisphosphonate. They identified 13,586 patients who had atrial fibrillation and flutter and 65,054 patients who did not. Of these, 435 cases (3.2%) and 1,958 controls (2.9%) were current users of a bisphosphonate for osteoporosis. Etidronate and alendronate were used with almost the same frequency among cases and controls. The adjusted relative risk of atrial fibrillation with current use of a bisphosphonate, compared with nonuse, was 0.95 (95% CI, 0.84–1.07). New users had a relative risk of 0.75 (95% CI, 0.49–1.16), broadly similar to the estimate for continuing users (relative risk, 0.96; 95% CI, 0.85–1.09).
Bottom line? There is no compelling evidence that oral bisphosphonates cause an increase in atrial fibrillation. Even in the smaller case-control study that found a suggestion of elevated risk, the authors think that, at most, 3% of cases of atrial fibrillation might be attributable to oral alendronate.
An approach to osteonecrosis of the jaw among bisphosphonate users
Khan AA, Sándor GK, Dore E, et al. Canadian consensus practice guidelines for bisphosphonate-associated osteonecrosis of the jaw. J Rheumatol. 2008;35:1391–1397.
Since 2003, when the first reports of osteonecrosis of the jaw (ONJ) in patients receiving bisphosphonates were published, there has been widespread uncertainty among patients, physicians, and oral surgeons about diagnosis, identification of individuals at risk, prevention, and management of this troubling disorder (FIGURE 1).
To address these concerns, a multidisciplinary task force was convened by the Canadian Association of Oral and Maxillofacial Surgeons to systematically review the data. The task force included representatives from national and international societies representing the disciplines of oral surgery, dentistry, oral pathology, oral medicine, endocrinology, rheumatology, and oncology.
After reviewing the data, the task force made the following recommendations:
- In all oncology patients, a thorough dental examination, including radiographs, should be completed before IV bisphosphonate therapy is initiated. In this population, any invasive dental procedure is ideally completed before the start of high-dose bisphosphonate therapy. For nonurgent procedures in current users of bisphosphonate therapy, the drug should be discontinued 3 to 6 months before the dental treatment.
- Nononcology patients who are starting oral or IV bisphosphonate therapy do not require a dental examination beforehand, provided dental care is appropriate and oral hygiene is good.
- All patients taking a bisphosponate should be encouraged to stop smoking, limit alcohol use, and maintain good oral hygiene.
- Patients who have already been diagnosed with ONJ are best managed with supportive care, including pain control, treatment of secondary infection, and removal of necrotic debris. Aggressive debridement is contraindicated.
These recommendations are extremely helpful, especially because they make it clear that the average patient who has osteoporosis does not need to discontinue therapy before undergoing a dental procedure. Nor do patients who are about to embark on therapy—oral or IV—need any special dental examination as long as they maintain good oral hygiene and dental self-care.
Task force members were identified on the basis of their knowledge and expertise in the diagnosis and management of ONJ.
FIGURE 1 Osteonecrosis of the jaw
Blood flow to bone tissue is decreased in osteonecrosis of the jaw, leading to death of that tissue and the eventual collapse of bone.
ILLUSTRATIONS BY ROB FLEWELL FOR OBG MANAGEMENT
Distinctive fracture pattern linked to long-term alendronate
Neviaser AS, Lane JM, Lenart BA, Edobor-Osula F, Lorich DG. Low-energy femoral shaft fractures associated with alendronate use. J Orthop Trauma. 2008;22:346–350.
Patients who sustain a fracture of the proximal femoral shaft after minimal or no trauma are likely to be long-term users of alendronate, according to a recent study. These fractures are characterized by a simple transverse pattern, “beaking” of the cortex on one side, and hypertrophy of the diaphyseal cortex (FIGURE 2).
In a retrospective study, Neviaser and colleagues blindly reviewed both radiographs and medical records of 59 patients who had femoral-shaft fractures. Among the 25 users of alendronate, 19 had experienced low- or no-trauma fractures with this distinctive pattern; only one nonuser had (odds ratio, 139.33; 95% CI, 19.0–939.4; p<.0001). This fracture pattern was 98% specific to alendronate use.
The average duration of alendronate use in patients who had this fracture pattern was significantly longer than in those who did not (6.9 years vs 2.5 years, respectively; p=.002). Only one patient with this fracture pattern had been taking alendronate for less than 4 years.
FIGURE 2 Low-impact femoral fracture
Simple transverse fractures of the proximal femur after low or no trauma have been linked to long-term alendronate use.
First reports came in 2005
Neviaser and associates mention case reports from 2005 that described nine patients who sustained spontaneous nontraumatic, nonpathologic fractures while on prolonged alendronate therapy (>3 years).2 In 2007, Goh and colleagues reported 13 subtrochanteric fractures, nine of which occurred in patients treated with alendronate. Of the nine, eight had a pattern associated with cortical hypertrophy.3
Cause-and-effect relationship remains unproven
The proximal femoral shaft is normally subjected to high stress, Neviaser and colleagues observe, and would not be expected to fracture from minimal trauma without underlying bone pathology.
In their study, 11 patients who had untreated osteoporosis had femoral-shaft fractures, but none had this specific pattern (unicortical beak, hypertrophied diaphyseal cortex). The authors hypothesize that adynamic metabolism from impaired resorption may be the underlying pathophysiology that leads to these fractures. They also point out that, although the pattern was 98% specific to alendronate users, this does not necessarily prove cause and effect—only an association. Clearly, further study is necessary.
Denosumab outperforms alendronate in phase 3 trial
Brown JP, Prince RL, Deal C, et al. Comparison of the effect of denosumab and alendronate on bone mineral density and biochemical markers of bone turnover in postmenopausal women with low bone mass: a randomized, blinded, phase 3 trial. J Bone Miner Res. 2008; Sep 3 [Epub ahead of print].
In the first head-to-head comparison of a nonbisphosphonate with alendronate, Brown and colleagues found significantly increased BMD at the total hip with denosumab after 12 months of use (3.5% vs 2.6%; p<.0001). This finding was reported at the American Society of Bone and Mineral Research annual meeting in Montreal in September.
Denosumab is an antiresorptive agent that inhibits osteoclast-mediated bone resorption and works through a different pathway than bisphosphonates. It is a fully human monoclonal antibody that neutralizes RANKL, a key mediator of osteoclast function, formation, and survival. Denosumab is injectable (subcutaneous) and is given every 6 months.
All sites showed improvement in BMD
In the phase 3 trial, 1,189 postmenopausal women who had a T-score at the total hip or lumbar spine ≤-2.0 were randomized to receive a subcutaneous injection of denosumab (60 mg every 6 months plus an oral placebo weekly) or oral alendronate (70 mg weekly plus a subcutaneous placebo injection every 6 months). Bone mineral density was monitored at various sites to detect any changes, as were bone-turnover markers at various times during the study.
In addition to BMD at the total hip, denosumab increased BMD at the following sites at 12 months, compared with alendronate:
- femoral neck, 0.6%
- trochanter, 1.0%
- lumbar spine, 1.1%
- distal radius, 0.6% (p≤.0002 at all sites).
Denosumab also was associated with a significantly greater reduction of bone-turnover markers than alendronate. The two groups had similar laboratory values and adverse events.
Although these preliminary results are extremely encouraging, we await data on fracture reduction from a study under way in postmenopausal women who have osteoporosis before definitive recommendations can be made about this agent.
1. Cummings SR, Schwartz AV, Black DM. Alendronate and atrial fibrillation [letter]. N Engl J Med. 2007;356:1895-1896.
2. Odvina CV, Zerwekh JE, Rao DS, Maalouf N, Gottschalk FA, Pak CY. Severely suppressed bone turnover: a potential complication of alendronate therapy. J Clin Endocrinol Metab. 2005;90:1294-1301.
3. Goh SK, Yang KY, Koh JS, et al. Subtrochanteric insufficiency fractures in patients on alendronate therapy: a caution. J Bone Joint Surg Br. 2007;89:349-353.