User login
A Motivational Interviewing Training Program for Tobacco Cessation Counseling in Primary Care
Primary care providers (PCPs) need effective tools for activating health behavior change for the 125 million Americans living with a chronic condition.1 Smoking is an important and difficult behavior to change, and a motivator for quitting is tobacco cessation advice from a PCP.2,3 However, few PCPs provide comprehensive tobacco cessation counseling as part of routine care.4,5 One perceived barrier that providers report is their lack of training to be effective tobacco cessation advocates.4,6-8
Motivational interviewing (MI) promotes behavior change by using a nonadversarial approach aimed at resolving patient ambivalence. Motivational interviewing tools, such as asking open-ended questions, providing summary statements of what the patient expresses, reflective listening, and affirmations, are used to spur an intrinsic drive to change. These techniques have been applied to a broad range of health behaviors with positive outcomes and demonstrated efficacy.9-11 Furthermore, MI can be used in primary care for changing tobacco use, alcohol consumption, physical activity, and diet.12-14
Despite its efficacy, MI can be time-intensive to learn. Fortunately, even abbreviated MI can influence patient behavior.15,16 Rollnick and others have developed MI interventions that are deliverable in 5 to 10 minutes.17,18 These brief interventions focus on performing a rapid assessment of patients’ perceived importance and self-efficacy for change.17,18
There is increased interest in training health care professionals (HCPs) in MI, yet there is no consensus on the most effective training approach.19,20 Practitioners with many competing priorities often like to learn new skills through self-study or onetime workshops. Yet evidence suggests that these are not effective methods for gaining MI proficiency. Instead, MI training sessions that offer feedback and coaching are more effective in helping participants retain MI skills over time.21,22
The authors developed and successfully pilot-tested an MI training program called the Motivational Interviewing Smoking Treatment Enhancement Program (MI-STEP) for HCPs. This program was designed to facilitate tobacco cessation care in the VHA primary care patient centered medical home, which VHA calls patient aligned care teams (PACTs).23 The main conclusions of this pilot study have been reported elsewhere.24
The objective of this article is to describe the process evaluation the authors conducted during the MI-STEP study to gain a better understanding of how the implementation of the MI training program could be improved. The authors identified barriers and facilitators from the perspectives of MI champions and PACT practitioners.
Methods
Thirty-four PACT practitioners (physicians, nurse practitioners, registered nurses, licensed practical nurses, and pharmacists) at 2 VA medical centers were randomly assigned to a high- or moderate-intensity MI training program during the summer of 2012. This training was delivered by “MI champions,” who were recruited from PACTs and who attended a 3-day advanced training class on MI. The training included MI skills practice, group case analysis, various role-play exercises, and didactics adapted from the Rx for Change program.25 The curriculum also addressed tobacco cessation counseling using the national tobacco cessation guideline.2 Each site’s health behavior coordinator (HBC) also was recruited to be an MI champion. The HBCs are typically psychologists who have received prior training in MI as well as facilitator and clinician coaching. At the VA, HBCs are charged with integrating preventive services into care. The participating sites’ institutional review boards approved all study procedures.
MI-STEP Training Program
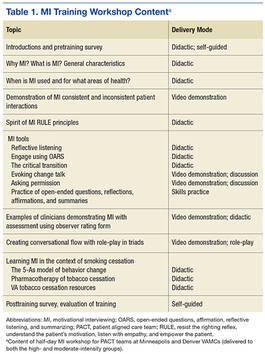
All 34 practitioners attended a half-day on-site MI training workshop led by the site’s HBC. This training covered the basics of MI and used interactive learning methods such as role-play (Table 1). The study practitioners also received self-study materials, and throughout the study period had access to the MI champions. Practitioners who were randomized to high-intensity MI training also attended 6 supplemental 1-hour “booster sessions” to enhance specific MI skills. The MI champions led 3 of the 1-hour booster sessions with a standard agenda, including patient cases and MI exercises. During the other 3 booster sessions, participants used patient cases to interact with a standardized patient over the telephone, and the MI champions provided feedback and coaching.
Process Evaluation
Six months after the program’s completion, investigators conducted an evaluation of the MI-STEP training program with MI champions and study practitioners. One-hour focus group sessions (2 in Minneapolis; 1 in Denver) were conducted with the MI champions by a co-investigator in Minneapolis and a facilitator in Denver. Notes were taken during the sessions. MI champions were asked about the quality of their training sessions, challenges to getting PACT members to participate in the site training, challenges to teaching MI, and how they felt MI fit within VA health care philosophy.
Ten training study practitioners were randomly selected and stratified based on group intensity assignment, discipline, and site to participate in in-depth interviews. The interviews lasted about 30 minutes, and Minneapolis study investigators conducted in-person interviews with local participants and telephone interviews with Denver participants. The interviews focused on experiences with both high- and moderate-intensity MI training programs, how MI was used in their practice, barriers to implementing MI, impressions of the MI training program, and their interactions with MI champions.
Focus group leaders were experienced interviewers who had not previously interacted with MI champions in the context of this study. Investigators conducting study practitioner interviews were blinded to group assignment. All interviews were audio-recorded and transcribed verbatim. Study investigators reviewed the focus group notes and interview transcripts, identified themes independently, and then discussed group themes. The most salient themes were selected to inform implementation of a larger scale MI training program.
Results
Nine MI champions participated in the focus groups, and 8 study practitioners from both sites representing all clinical disciplines completed in-depth interviews. Table 2 identifies the characteristics of each population. 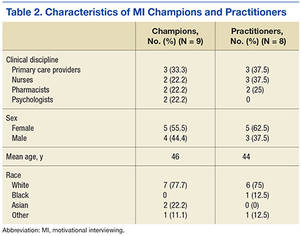
MI Champion Focus Group Themes
The champions were asked to discuss all aspects of the program, including their training as champions, role as trainers, attitudes about using MI during patient encounters, and participation in the training program. Themes from the MI champion focus groups were placed in the following categories based on the authors’ analytic approach: training MI champions, training study practitioners, and attitudes about MI.
Training MI champions. The champions identified role-play exercises and receiving feedback as strengths of the training program. The champions also expressed the desire for more hands-on practice, especially in small groups. They wanted additional training on teaching MI and facilitating the booster sessions. The champions wanted an expert to train them on how to give feedback and how to best coach practitioners in their use of MI. Champions expressed a desire to have follow-up training sessions with the standardized patient to help them hone their newly acquired coaching skills.
Training study practitioners. The champions’ key role was to train local practitioners and lead the booster sessions for the high-intensity MI training group. Champions felt ill-prepared to fully cover the training materials during the initial half-day workshop and 6 booster sessions. Champions identified difficulty coordinating schedules with the practitioners and lack of compensation for participation as significant barriers to implementing the booster sessions. Champions felt that using a standardized patient during the booster sessions was a strength of the program and that making the cases more realistic could have further enhanced the program.
Attitudes about MI. Champions from both sites perceived MI to have a positive impact on patient care. However, all champions noted there were challenges in using MI in practice. Champions felt MI takes time, energy, and practice to gain proficiency. The current primary care system is not set up to support the use of MI. The appointment time slots are fixed, and VHA goals and the spirit of MI are not always compatible. VHA performance measures encourage providers to achieve performance targets with each patient, often requiring use of directives for patients on what to do. In contrast, MI encourages the patient to take the lead on goal setting and prioritizing.
Study Practitioner Interview Themes
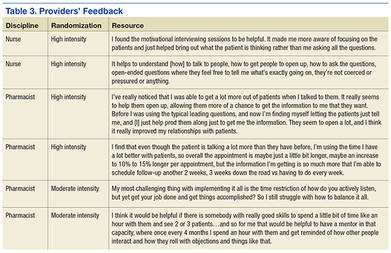
The practitioners were asked to discuss MI skills training, using MI skills with patients, integrating MI into daily practice, getting other PACT members involved, booster sessions, interactions with champions, and suggestions for improving the MI program. Themes from the study practitioner interviews were grouped into the following categories: MI skills training, using MI skills, integrating MI into practice, and suggestions for improving MI training (Table 3).
MI skills training. Overall, the MI high-intensity participants stated they learned useful skills. They reported asking more questions that are open-ended and were more aware of the patient’s perspective. Practitioners reported that booster sessions provided a way to reinforce, refine, and practice their MI skills. Practitioners reported that having the champion located in their own PACT was critical for connecting with their champion between sessions. Nurses and doctors reported that not having time to meet with champions was a barrier, while pharmacists reported more flexibility.
The moderate-intensity participants reported that the training had less impact. Half the respondents reported that they did not remember much of the MI training and either forgot or did not use the newly learned MI skills.
Using MI skills. Both high- and moderate-intensity participants reported using open-ended questions, reflections, affirmations, motivation scales, and active listening.
Practitioners reported that MI helped them focus on patient-centered care, since MI is collaborative. Even when a session was not successful in leading to behavior change, practitioners felt more satisfied with the quality of the interaction.
Integrating MI into practice. The high- and moderate-intensity practitioners had different perceptions of using MI in daily practice. High-intensity participants thought MI required an initial time investment, but that would be balanced by a decrease in the number of follow-up visits needed and/or delay the time between visits. The moderate-intensity participants were more likely to report struggling with the amount of time MI took.
Suggestions for improving MI training. Practitioners from both training groups offered suggestions for improving MI training. Supervisor buy-in was deemed critical to getting other PACT members involved. Practitioners suggested providing compensation or making training mandatory to help motivate others to participate in MI training. Also, practitioners were ready to expand the MI training beyond smoking cessation to incorporate other diseases and multiple comorbidities.
The moderate-intensity participants suggested more training, practice, follow-up, and feedback. These participants also suggested boosterlike sessions.
Discussion
Champions and study practitioners reported that learning MI skills was useful. The participants felt that MI was consistent with their personal philosophies regarding patient-centered care and that MI had a positive impact on patient care. Practitioners and MI champions offered several insights for improving the delivery of MI training. First, practitioners and champions highlighted how important practice and feedback were to learning MI. Booster sessions, standardized patients, and critical feedback enhanced learning.
Second, champions reported that they wanted more training in how to teach MI. Third, practitioners and champions repeatedly stated that finding the time needed to become proficient in MI was difficult and that using the MI approach with patients took additional time during clinical sessions. However, participants in the high-intensity group reported more satisfaction with the quality of their patient encounters and the freedom to follow up with patients less often.
There were aspects of the environment and MI training program that facilitated the MI learning process. The high-intensity group cited booster session feedback as being reinforcing; the moderate-intensity group expressed a desire to practice their newly acquired skill and felt feedback and coaching would have enhanced their learning. Practitioners and champions reported that using a standardized patient to enhance experiential learning activities was an asset. Standardized patients have been used successfully in other training programs.21
Implementing an MI training program posed a number of challenges. The biggest barrier was lack of time. PACT members found it difficult to attend a half-day MI workshop, practice MI skills, and incorporate MI routinely into daily practice. However, without the investment of time, even basic MI proficiency is unachievable.22
This study highlighted several ways to improve feedback and coaching. First, the authors would expand the MI champion curriculum to include training to provide effective feedback/coaching. Second, the authors would train the standardized patient on how to provide feedback to the MI learner. As implemented, the standardized patient evaluated the learner only on whether the patient felt “heard” by the learner.
Perhaps most critical to the success of an MI training program is institutional support. There needs to be adequate time and space for the training process as well as support for ongoing learning and feedback as MI skills are refined. Furthermore, sufficient time is needed during patients’ appointments to allow for MI-oriented conversations. Time is an important, valuable, and scarce resource that institutions control. Administrators should realize that the up-front investment is likely to provide a downstream return as providers become proficient in MI.
There is an urgent need to find ways to incorporate training into the daily practice of busy HCPs. Although this study was limited by its small sample, it demonstrated the feasibility of implementing an MI training program for practitioners working in a busy primary care environment. This study offers concrete suggestions for overcoming barriers and enhancing facilitators, which can guide much needed larger studies as they examine MI training effectiveness on patient and clinician outcomes.
Champions and practitioners reported that learning MI was important, but opportunities to practice and receive critical feedback are needed to achieve proficiency and improve confidence. Both champions and study practitioners thought practicing with a standardized patient would enrich their learning. However, dedicated time for learning and practicing MI skills is critical and hard to arrange.
Conclusion
Practitioners can use MI to activate health behavior change in their patients. Training PACT practitioners to use MI is feasible. The results of this evaluation can be used to inform the next iteration of an MI training program for HCPs by highlighting the facilitators of and barriers to training.
Because of the interest in activating patient-centered health behavior change, these findings are important. The educational and practice opportunities were well received. Training with standardized patients and incorporating MI champions into PACTs facilitated training. However, the lack of time was a major barrier to learning and practicing MI skills and will need to be addressed. If effectively implemented, training providers by using an evidence-based approach, such as MI, can promote long-term health.
Acknowledgments
This study was funded by VA Health Services Research & Development (HSR&D) Rapid Response Project 11-019. The Center for Chronic Disease Outcomes Research is supported by the VA, VHA, Office of Research and Development, and HSR&D. Dr. Widome was supported by a VA HSR&D Career Development Award.
1. Anderson G, Horvath J. The growing burden of chronic disease in America. Public Health Rep. 2004;119(3):263-270
2. Fiore MC, Jaen CR, Baker TB, et al. Treating Tobacco Use and Dependence: 2008 Update. Clinical Practice Guideline. Rockville, MD: U.S. Dept of Health and Human Services, Public Health Service; 2008.
3. Park E, Eaton CA, Goldstein MG, et al. The development of a decisional balance measure of physician smoking cessation interventions. Prev Med. 2001;33(4):261-267.
4. Ferketich AK, Khan Y, Wewers ME. Are physicians asking about tobacco use and assisting with cessation? Results from the 2001-2004 National Ambulatory Medical Care Survey (NAMCS). Prev Med. 2006;43(6):472-476.
5. Marcy TW, Skelly J, Shiffman RN, Flynn BS. Facilitating adherence to the tobacco use treatment guideline with computer-mediated decision support systems: physician and clinic office manager perspectives. Prev Med. 2005;41(2):479-487.
6. Cabana MD, Rand CS, Powe NR, et al. Why don't physicians follow clinical practice guidelines? A framework for improvement. JAMA. 1999;282(15):1458-1465.
7. Jaén CR, McIlvain H, Pol L, Phillips RL Jr, Flocke S, Crabtree BF. Tailoring tobacco counseling to the competing demands in the clinical encounter. J Fam Pract. 2001;50(10):859-863.
8. Malte CA, McFall M, Chow B, Beckham JC, Carmody TP, Saxon AJ. Survey of providers' attitudes toward integrating smoking cessation treatment into posttraumatic stress disorder care. Psychol Addict Behav. 2013;27(1):249-255.
9. Hettema J, Steele J, Miller WR. Motivational interviewing. Annu Rev Clin Psychol. 2005;1:91-111.
10. Rollnick S, Miller WR, Butler BC. Motivational Interviewing in Health Care: Helping Patients Change Behavior. New York, NY: Guilford Press; 2008.
11. Miller WR. Motivational interviewing with problem drinkers. Behav Psychother. 1983;11(2):147-172.
12. Brodie DA, Inoue A. Motivational interviewing to promote physical activity for people with chronic heart failure. J Adv Nurs. 2005;50(5):518-527.
13. Perry CK, Rosenfeld AG, Bennett JA, Potempa K. Heart-to-Heart: promoting walking in rural women through motivational interviewing and group support. J Cardiovascular Nurs. 2007;22(4):304-312.
14. West DS, DiLillo V, Bursac Z, Gore SA, Greene PG. Motivational interviewing improves weight loss in women with type 2 diabetes. Diabetes Care. 2007;30(5):1081-1087.
15. Fiore MC, Novotny TE, Pierce JP, et al. Trends in cigarette smoking in the United States. JAMA. 1989;261(1):49-55.
16. Lancaster T, Stead L. Physician advice for smoking cessation. Cochrane Database Syst Rev. 2004;18(4):CD000165.
17. Butler C, Rollnick S, Cohen D, Bachmann M, Russell I, Stott N. Motivational counseling versus brief advice for smokers in general practice: a randomized trial. Br J Gen Pract. 1999;49(445):611-616.
18. Rollnick S, Heather N, Bell A. Negotiating behaviour change in medical settings: the development of brief motivational interviewing. J Ment Health. 1992;1(1):25-37.
19. Madson MB, Loignon AC, Lane C. Training in motivational interviewing: a systematic review. J Subst Abuse Treat. 2009;36(1):101-109.
20. Miller WR, Yahne CE, Moyers TB, Martinez J, Pirritano M. A randomized trial of methods to help clinicians learn motivational interviewing. J Consult Clin Psychol. 2004;72(6):1050-1062.
21. Lundahl B, Burke BL. The effectiveness and applicability of motivational interviewing: a practice-friendly review of four meta-analyses. J Clin Pyschol. 2009;65(11):1232-1245.
22. Miller WR, Moyers TB. Eight stages in Learning motivational interviewing. J Teaching Addict. 2006;5(1):13-15.
23. Rosland AM, Nelson K, Sun H, et al. The patient-centered medical home in the Veterans Health Administration. Am J Manag Care. 2013;19(7):e263-e272.
24. Fu S, Roth C, Battaglia CT, et al. Training primary care clinicians in motivational interviewing: a comparison of two models. Patient Educ Couns. 2015;98(1):61-68.
25. School of Pharmacy & Medicine University of California, San Francisco. Rx for change website. http://rxforchange.ucsf.edu/. Accessed May 25, 2016.
Primary care providers (PCPs) need effective tools for activating health behavior change for the 125 million Americans living with a chronic condition.1 Smoking is an important and difficult behavior to change, and a motivator for quitting is tobacco cessation advice from a PCP.2,3 However, few PCPs provide comprehensive tobacco cessation counseling as part of routine care.4,5 One perceived barrier that providers report is their lack of training to be effective tobacco cessation advocates.4,6-8
Motivational interviewing (MI) promotes behavior change by using a nonadversarial approach aimed at resolving patient ambivalence. Motivational interviewing tools, such as asking open-ended questions, providing summary statements of what the patient expresses, reflective listening, and affirmations, are used to spur an intrinsic drive to change. These techniques have been applied to a broad range of health behaviors with positive outcomes and demonstrated efficacy.9-11 Furthermore, MI can be used in primary care for changing tobacco use, alcohol consumption, physical activity, and diet.12-14
Despite its efficacy, MI can be time-intensive to learn. Fortunately, even abbreviated MI can influence patient behavior.15,16 Rollnick and others have developed MI interventions that are deliverable in 5 to 10 minutes.17,18 These brief interventions focus on performing a rapid assessment of patients’ perceived importance and self-efficacy for change.17,18
There is increased interest in training health care professionals (HCPs) in MI, yet there is no consensus on the most effective training approach.19,20 Practitioners with many competing priorities often like to learn new skills through self-study or onetime workshops. Yet evidence suggests that these are not effective methods for gaining MI proficiency. Instead, MI training sessions that offer feedback and coaching are more effective in helping participants retain MI skills over time.21,22
The authors developed and successfully pilot-tested an MI training program called the Motivational Interviewing Smoking Treatment Enhancement Program (MI-STEP) for HCPs. This program was designed to facilitate tobacco cessation care in the VHA primary care patient centered medical home, which VHA calls patient aligned care teams (PACTs).23 The main conclusions of this pilot study have been reported elsewhere.24
The objective of this article is to describe the process evaluation the authors conducted during the MI-STEP study to gain a better understanding of how the implementation of the MI training program could be improved. The authors identified barriers and facilitators from the perspectives of MI champions and PACT practitioners.
Methods
Thirty-four PACT practitioners (physicians, nurse practitioners, registered nurses, licensed practical nurses, and pharmacists) at 2 VA medical centers were randomly assigned to a high- or moderate-intensity MI training program during the summer of 2012. This training was delivered by “MI champions,” who were recruited from PACTs and who attended a 3-day advanced training class on MI. The training included MI skills practice, group case analysis, various role-play exercises, and didactics adapted from the Rx for Change program.25 The curriculum also addressed tobacco cessation counseling using the national tobacco cessation guideline.2 Each site’s health behavior coordinator (HBC) also was recruited to be an MI champion. The HBCs are typically psychologists who have received prior training in MI as well as facilitator and clinician coaching. At the VA, HBCs are charged with integrating preventive services into care. The participating sites’ institutional review boards approved all study procedures.
MI-STEP Training Program
All 34 practitioners attended a half-day on-site MI training workshop led by the site’s HBC. This training covered the basics of MI and used interactive learning methods such as role-play (Table 1). The study practitioners also received self-study materials, and throughout the study period had access to the MI champions. Practitioners who were randomized to high-intensity MI training also attended 6 supplemental 1-hour “booster sessions” to enhance specific MI skills. The MI champions led 3 of the 1-hour booster sessions with a standard agenda, including patient cases and MI exercises. During the other 3 booster sessions, participants used patient cases to interact with a standardized patient over the telephone, and the MI champions provided feedback and coaching.
Process Evaluation
Six months after the program’s completion, investigators conducted an evaluation of the MI-STEP training program with MI champions and study practitioners. One-hour focus group sessions (2 in Minneapolis; 1 in Denver) were conducted with the MI champions by a co-investigator in Minneapolis and a facilitator in Denver. Notes were taken during the sessions. MI champions were asked about the quality of their training sessions, challenges to getting PACT members to participate in the site training, challenges to teaching MI, and how they felt MI fit within VA health care philosophy.
Ten training study practitioners were randomly selected and stratified based on group intensity assignment, discipline, and site to participate in in-depth interviews. The interviews lasted about 30 minutes, and Minneapolis study investigators conducted in-person interviews with local participants and telephone interviews with Denver participants. The interviews focused on experiences with both high- and moderate-intensity MI training programs, how MI was used in their practice, barriers to implementing MI, impressions of the MI training program, and their interactions with MI champions.
Focus group leaders were experienced interviewers who had not previously interacted with MI champions in the context of this study. Investigators conducting study practitioner interviews were blinded to group assignment. All interviews were audio-recorded and transcribed verbatim. Study investigators reviewed the focus group notes and interview transcripts, identified themes independently, and then discussed group themes. The most salient themes were selected to inform implementation of a larger scale MI training program.
Results
Nine MI champions participated in the focus groups, and 8 study practitioners from both sites representing all clinical disciplines completed in-depth interviews. Table 2 identifies the characteristics of each population.
MI Champion Focus Group Themes
The champions were asked to discuss all aspects of the program, including their training as champions, role as trainers, attitudes about using MI during patient encounters, and participation in the training program. Themes from the MI champion focus groups were placed in the following categories based on the authors’ analytic approach: training MI champions, training study practitioners, and attitudes about MI.
Training MI champions. The champions identified role-play exercises and receiving feedback as strengths of the training program. The champions also expressed the desire for more hands-on practice, especially in small groups. They wanted additional training on teaching MI and facilitating the booster sessions. The champions wanted an expert to train them on how to give feedback and how to best coach practitioners in their use of MI. Champions expressed a desire to have follow-up training sessions with the standardized patient to help them hone their newly acquired coaching skills.
Training study practitioners. The champions’ key role was to train local practitioners and lead the booster sessions for the high-intensity MI training group. Champions felt ill-prepared to fully cover the training materials during the initial half-day workshop and 6 booster sessions. Champions identified difficulty coordinating schedules with the practitioners and lack of compensation for participation as significant barriers to implementing the booster sessions. Champions felt that using a standardized patient during the booster sessions was a strength of the program and that making the cases more realistic could have further enhanced the program.
Attitudes about MI. Champions from both sites perceived MI to have a positive impact on patient care. However, all champions noted there were challenges in using MI in practice. Champions felt MI takes time, energy, and practice to gain proficiency. The current primary care system is not set up to support the use of MI. The appointment time slots are fixed, and VHA goals and the spirit of MI are not always compatible. VHA performance measures encourage providers to achieve performance targets with each patient, often requiring use of directives for patients on what to do. In contrast, MI encourages the patient to take the lead on goal setting and prioritizing.
Study Practitioner Interview Themes
The practitioners were asked to discuss MI skills training, using MI skills with patients, integrating MI into daily practice, getting other PACT members involved, booster sessions, interactions with champions, and suggestions for improving the MI program. Themes from the study practitioner interviews were grouped into the following categories: MI skills training, using MI skills, integrating MI into practice, and suggestions for improving MI training (Table 3).
MI skills training. Overall, the MI high-intensity participants stated they learned useful skills. They reported asking more questions that are open-ended and were more aware of the patient’s perspective. Practitioners reported that booster sessions provided a way to reinforce, refine, and practice their MI skills. Practitioners reported that having the champion located in their own PACT was critical for connecting with their champion between sessions. Nurses and doctors reported that not having time to meet with champions was a barrier, while pharmacists reported more flexibility.
The moderate-intensity participants reported that the training had less impact. Half the respondents reported that they did not remember much of the MI training and either forgot or did not use the newly learned MI skills.
Using MI skills. Both high- and moderate-intensity participants reported using open-ended questions, reflections, affirmations, motivation scales, and active listening.
Practitioners reported that MI helped them focus on patient-centered care, since MI is collaborative. Even when a session was not successful in leading to behavior change, practitioners felt more satisfied with the quality of the interaction.
Integrating MI into practice. The high- and moderate-intensity practitioners had different perceptions of using MI in daily practice. High-intensity participants thought MI required an initial time investment, but that would be balanced by a decrease in the number of follow-up visits needed and/or delay the time between visits. The moderate-intensity participants were more likely to report struggling with the amount of time MI took.
Suggestions for improving MI training. Practitioners from both training groups offered suggestions for improving MI training. Supervisor buy-in was deemed critical to getting other PACT members involved. Practitioners suggested providing compensation or making training mandatory to help motivate others to participate in MI training. Also, practitioners were ready to expand the MI training beyond smoking cessation to incorporate other diseases and multiple comorbidities.
The moderate-intensity participants suggested more training, practice, follow-up, and feedback. These participants also suggested boosterlike sessions.
Discussion
Champions and study practitioners reported that learning MI skills was useful. The participants felt that MI was consistent with their personal philosophies regarding patient-centered care and that MI had a positive impact on patient care. Practitioners and MI champions offered several insights for improving the delivery of MI training. First, practitioners and champions highlighted how important practice and feedback were to learning MI. Booster sessions, standardized patients, and critical feedback enhanced learning.
Second, champions reported that they wanted more training in how to teach MI. Third, practitioners and champions repeatedly stated that finding the time needed to become proficient in MI was difficult and that using the MI approach with patients took additional time during clinical sessions. However, participants in the high-intensity group reported more satisfaction with the quality of their patient encounters and the freedom to follow up with patients less often.
There were aspects of the environment and MI training program that facilitated the MI learning process. The high-intensity group cited booster session feedback as being reinforcing; the moderate-intensity group expressed a desire to practice their newly acquired skill and felt feedback and coaching would have enhanced their learning. Practitioners and champions reported that using a standardized patient to enhance experiential learning activities was an asset. Standardized patients have been used successfully in other training programs.21
Implementing an MI training program posed a number of challenges. The biggest barrier was lack of time. PACT members found it difficult to attend a half-day MI workshop, practice MI skills, and incorporate MI routinely into daily practice. However, without the investment of time, even basic MI proficiency is unachievable.22
This study highlighted several ways to improve feedback and coaching. First, the authors would expand the MI champion curriculum to include training to provide effective feedback/coaching. Second, the authors would train the standardized patient on how to provide feedback to the MI learner. As implemented, the standardized patient evaluated the learner only on whether the patient felt “heard” by the learner.
Perhaps most critical to the success of an MI training program is institutional support. There needs to be adequate time and space for the training process as well as support for ongoing learning and feedback as MI skills are refined. Furthermore, sufficient time is needed during patients’ appointments to allow for MI-oriented conversations. Time is an important, valuable, and scarce resource that institutions control. Administrators should realize that the up-front investment is likely to provide a downstream return as providers become proficient in MI.
There is an urgent need to find ways to incorporate training into the daily practice of busy HCPs. Although this study was limited by its small sample, it demonstrated the feasibility of implementing an MI training program for practitioners working in a busy primary care environment. This study offers concrete suggestions for overcoming barriers and enhancing facilitators, which can guide much needed larger studies as they examine MI training effectiveness on patient and clinician outcomes.
Champions and practitioners reported that learning MI was important, but opportunities to practice and receive critical feedback are needed to achieve proficiency and improve confidence. Both champions and study practitioners thought practicing with a standardized patient would enrich their learning. However, dedicated time for learning and practicing MI skills is critical and hard to arrange.
Conclusion
Practitioners can use MI to activate health behavior change in their patients. Training PACT practitioners to use MI is feasible. The results of this evaluation can be used to inform the next iteration of an MI training program for HCPs by highlighting the facilitators of and barriers to training.
Because of the interest in activating patient-centered health behavior change, these findings are important. The educational and practice opportunities were well received. Training with standardized patients and incorporating MI champions into PACTs facilitated training. However, the lack of time was a major barrier to learning and practicing MI skills and will need to be addressed. If effectively implemented, training providers by using an evidence-based approach, such as MI, can promote long-term health.
Acknowledgments
This study was funded by VA Health Services Research & Development (HSR&D) Rapid Response Project 11-019. The Center for Chronic Disease Outcomes Research is supported by the VA, VHA, Office of Research and Development, and HSR&D. Dr. Widome was supported by a VA HSR&D Career Development Award.
1. Anderson G, Horvath J. The growing burden of chronic disease in America. Public Health Rep. 2004;119(3):263-270
2. Fiore MC, Jaen CR, Baker TB, et al. Treating Tobacco Use and Dependence: 2008 Update. Clinical Practice Guideline. Rockville, MD: U.S. Dept of Health and Human Services, Public Health Service; 2008.
3. Park E, Eaton CA, Goldstein MG, et al. The development of a decisional balance measure of physician smoking cessation interventions. Prev Med. 2001;33(4):261-267.
4. Ferketich AK, Khan Y, Wewers ME. Are physicians asking about tobacco use and assisting with cessation? Results from the 2001-2004 National Ambulatory Medical Care Survey (NAMCS). Prev Med. 2006;43(6):472-476.
5. Marcy TW, Skelly J, Shiffman RN, Flynn BS. Facilitating adherence to the tobacco use treatment guideline with computer-mediated decision support systems: physician and clinic office manager perspectives. Prev Med. 2005;41(2):479-487.
6. Cabana MD, Rand CS, Powe NR, et al. Why don't physicians follow clinical practice guidelines? A framework for improvement. JAMA. 1999;282(15):1458-1465.
7. Jaén CR, McIlvain H, Pol L, Phillips RL Jr, Flocke S, Crabtree BF. Tailoring tobacco counseling to the competing demands in the clinical encounter. J Fam Pract. 2001;50(10):859-863.
8. Malte CA, McFall M, Chow B, Beckham JC, Carmody TP, Saxon AJ. Survey of providers' attitudes toward integrating smoking cessation treatment into posttraumatic stress disorder care. Psychol Addict Behav. 2013;27(1):249-255.
9. Hettema J, Steele J, Miller WR. Motivational interviewing. Annu Rev Clin Psychol. 2005;1:91-111.
10. Rollnick S, Miller WR, Butler BC. Motivational Interviewing in Health Care: Helping Patients Change Behavior. New York, NY: Guilford Press; 2008.
11. Miller WR. Motivational interviewing with problem drinkers. Behav Psychother. 1983;11(2):147-172.
12. Brodie DA, Inoue A. Motivational interviewing to promote physical activity for people with chronic heart failure. J Adv Nurs. 2005;50(5):518-527.
13. Perry CK, Rosenfeld AG, Bennett JA, Potempa K. Heart-to-Heart: promoting walking in rural women through motivational interviewing and group support. J Cardiovascular Nurs. 2007;22(4):304-312.
14. West DS, DiLillo V, Bursac Z, Gore SA, Greene PG. Motivational interviewing improves weight loss in women with type 2 diabetes. Diabetes Care. 2007;30(5):1081-1087.
15. Fiore MC, Novotny TE, Pierce JP, et al. Trends in cigarette smoking in the United States. JAMA. 1989;261(1):49-55.
16. Lancaster T, Stead L. Physician advice for smoking cessation. Cochrane Database Syst Rev. 2004;18(4):CD000165.
17. Butler C, Rollnick S, Cohen D, Bachmann M, Russell I, Stott N. Motivational counseling versus brief advice for smokers in general practice: a randomized trial. Br J Gen Pract. 1999;49(445):611-616.
18. Rollnick S, Heather N, Bell A. Negotiating behaviour change in medical settings: the development of brief motivational interviewing. J Ment Health. 1992;1(1):25-37.
19. Madson MB, Loignon AC, Lane C. Training in motivational interviewing: a systematic review. J Subst Abuse Treat. 2009;36(1):101-109.
20. Miller WR, Yahne CE, Moyers TB, Martinez J, Pirritano M. A randomized trial of methods to help clinicians learn motivational interviewing. J Consult Clin Psychol. 2004;72(6):1050-1062.
21. Lundahl B, Burke BL. The effectiveness and applicability of motivational interviewing: a practice-friendly review of four meta-analyses. J Clin Pyschol. 2009;65(11):1232-1245.
22. Miller WR, Moyers TB. Eight stages in Learning motivational interviewing. J Teaching Addict. 2006;5(1):13-15.
23. Rosland AM, Nelson K, Sun H, et al. The patient-centered medical home in the Veterans Health Administration. Am J Manag Care. 2013;19(7):e263-e272.
24. Fu S, Roth C, Battaglia CT, et al. Training primary care clinicians in motivational interviewing: a comparison of two models. Patient Educ Couns. 2015;98(1):61-68.
25. School of Pharmacy & Medicine University of California, San Francisco. Rx for change website. http://rxforchange.ucsf.edu/. Accessed May 25, 2016.

Impact of a Drop-in Group Medical Appointment on Tobacco Quit Rates
Every year in the U.S., more than 435,000 people die of illnesses related to tobacco use.1 The CDC reported that from 2012 to 2013, 21.3% of adults used some form of tobacco daily or on some days.2 Veterans are not excluded from these numbers: A 2005 survey found 22.2% of VA patients were current smokers, and 71.2% of VA patients had smoked at least 100 cigarettes in their life.3
Military personnel have a higher propensity to be in situations that increase the risk of tobacco use than the general population does.3,4 These situations include alternating between periods of high stress and boredom, separation from loved ones, perceived camaraderie involved with tobacco use, and the limitation of healthier coping mechanisms.3,4 Stress and boredom have been cited as the top reasons for initiating tobacco use when deployed.3,4 Furthermore, once military personnel return from deployment, they may have difficulty quitting tobacco due to depression, sleeplessness, change in the structure of everyday life, or a second deployment.4
In 2009 Bondurant and Wedge predicted that the VA would spend $30.9 billion in preventable smoking-related expenditures by 2024.3 The negative health effects and the financial impact of tobacco make cessation programs an important investment for the VA.
In 2012, the CDC reported that 70% of veterans want to quit tobacco; therefore, veterans likely would be interested in tobacco cessation programs.4 Reasons veterans noted for quitting included family, changes in the social norm, better overall health, and better ability to breathe.4 Veterans also identified that tobacco cessation programs with convenience, personalization, reduced-cost medications, and peer support would be most helpful.4
According to a 2008 tobacco use and dependence guideline update, the most effective therapy for quitting tobacco is counseling plus pharmacotherapy.1 According to the guideline, the number of counseling sessions combined with pharmacotherapy is strongly related to the likelihood of quitting.1 A number of studies also have shown that telephone counseling is effective for tobacco cessation.5 However, a previous study in veterans found that scheduled face-to-face counseling sessions may be more effective than telephone counseling.6 Dent and colleagues found a statistically significant quit rate at 6 months of 28% in the face-to-face group vs 11.8% in the telephone group.6
After reviewing the guidelines, analyzing the studies, and learning what veterans find most helpful in tobacco cessation programs, the Sioux Falls VA Health Care System (SFVAHCS) in South Dakota took a unique approach to tobacco cessation. In 2012, SFVAHCS implemented a tobacco cessation drop-in group medical appointment (DIGMA) to improve tobacco quit rates. The DIGMA is a 1-hour, educational supportive clinic that allows veterans to drop in during any class anytime, regardless of their tobacco use status. This clinic mostly serves outpatients; however, inpatients also are welcome. Patients are informed of the DIGMA by a health care provider (HCP) or patient information flyers posted throughout SFVAHCS.
The DIGMA takes place once a week in a classroom next to a primary care waiting area, making it easily accessible. During the DIGMA, an HCP, such as a nurse or physician, provides behavioral education. VA materials (Primary Care and Tobacco Cessation Handbook and My Tobacco Cessation Workbook designed by Julianne Himstreet, PharmD, BCPS) are used to guide classes.7,8 These books address barriers to quitting, coping with nicotine withdrawal, planning for quit day, handling tobacco cravings, watching out for triggers, and staying tobacco free.7,8 Clinical pharmacists also are present at the DIGMA for patients who want to start or continue pharmacotherapy. The pharmacists can prescribe tobacco cessation medications and follow up on the success or adverse effects (AEs) of therapy.
The purpose of this study was to examine how a voluntary, drop-in, face-to-face tobacco cessation clinic impacts tobacco quit rates in veterans receiving pharmacotherapy.
Methods
A retrospective chart review was performed for all study site outpatients started on pharmacotherapy for tobacco cessation between September 1, 2012 and August 31, 2013, as determined by pharmacy dispensing records. Two groups were evaluated in this study: the pharmacotherapy-only (PO) group and the DIGMA group. Pharmacotherapy was most often prescribed by an HCP in the PO group. Other prescribers may have included pharmacists, mental health providers, and hospitalists. The second group was the DIGMA group, which included patients who were on tobacco cessation pharmacotherapy and attended at least 1 DIGMA class within a year of starting pharmacotherapy.
For this study, pharmacotherapy included nicotine gum, nicotine lozenge, nicotine patch, bupropion, varenicline, and any combination of these medications. Patients were excluded if they died, moved, or were lost to follow-up within 1 year of starting pharmacotherapy for a new quit attempt; were not at the beginning of a quit attempt; or were taking bupropion for mood or depression only.
One hundred thirty-six patients attended the DIGMA during the study period, but only 49 patients met the inclusion criteria. Patients also were excluded because they were not at the beginning of a quit attempt, were not receiving pharmacotherapy, or were not seen by an HCP to assess tobacco status after receiving tobacco cessation pharmacotherapy.
A total of 1,807 patients were identified as potential candidates for the PO group. Once the DIGMA patients were identified, an equal number of patients were randomly chosen for the PO group. To ensure that the PO group was random, the patient list was alphabetized, and patients were selected if they met the PO inclusion criteria, starting at the top of the list and moving down until the needed number was met.
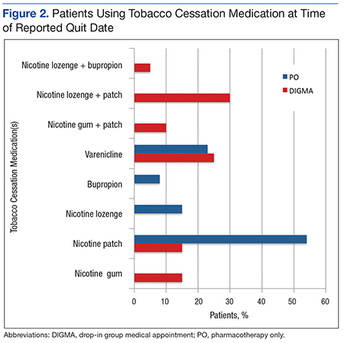
The primary endpoint was the tobacco quit rate within 1 year of starting pharmacotherapy for a new quit attempt. Tobacco use status was determined from the patient’s electronic medical record. A subgroup analysis was performed to determine the percentage of patients using each tobacco cessation medication or a combination of medications at the time of the reported quit date.
This study also looked at the number of DIGMA classes attended by patients who quit tobacco and the number of times patients switched pharmacotherapy during the 1-year time frame. A chi-square test was executed to evaluate the primary endpoint, and descriptive statistics were performed for the subgroup analysis. A P value of ≤ .05 was deemed significant.
Results
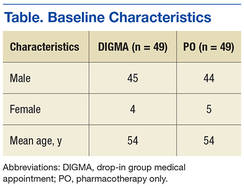
A total of 98 patients were included with 49 patients in each study arm. Baseline characteristics were similar between the groups with an average age of 54 years in both groups (Table). As shown in Figure 1, 40.8% of patients in the DIGMA group quit tobacco compared with 26.5% in the PO group (P = .19). 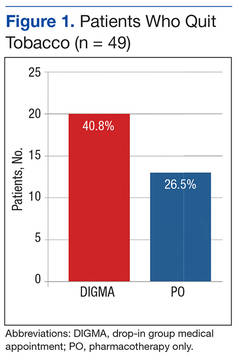
Discussion
The tobacco quit rate of veterans on pharmacotherapy who attended at least 1 DIGMA class was higher than the quit rate of veterans on pharmacotherapy only. Although the difference between quit rates was not statistically significant, the difference was clinically important. Every time a patient quits tobacco, years of negative health consequences and cost to the health care system may be prevented. Patients who quit tobacco and continue to attend DIGMA classes also can provide support and advice to others who are trying to quit.
The study results also suggest that the tobacco cessation DIGMA provided personalized care to veterans, as demonstrated by patients in the DIGMA group switching pharmacotherapy and using combination therapy more often. Access to pharmacists who can prescribe medications, change therapy, and assist with AEs gave patients the opportunity to determine the most efficacious therapy. Pharmacists also are aware of the pros and cons of the different tobacco cessation medications and are able to help patients pick the best medication to start with or change to.
Patients in the DIGMA group who quit tobacco attended an average of 1.4 classes. Those who attended the DIGMA may have been inherently more motivated to quit tobacco. However, the unique design of the DIGMA may have better equipped patients to quit tobacco after just 1 or 2 classes.
Limitations
Overall, an average attendance of 1.4 classes is a limitation; previous studies have shown that quit rates have a positive correlation with the number of counseling sessions attended.1 Another limitation is the small sample size. In addition, statistical power was not calculated. Tobacco use was not consistently documented in patients’ charts by the HCP and may not have been addressed at every visit. Some patients who quit tobacco may have been missed due to the lack of documentation of tobacco use status. Last, because reviewing a patient chart ended once documentation of tobacco cessation was found, some patients may have relapsed after quitting.
The study site likely could have offered better notice of the presence of the DIGMA. Although flyers and advertisements were available and posted, some tobacco-using patients may not have been aware of the DIGMA. The SFVAHCS could increase awareness of the program if the pharmacy provided a DIGMA flyer with each outpatient tobacco cessation prescription.
A larger, prospective study would be beneficial and might show statistically significant differences in tobacco quit rates. Further studies that address whether the DIGMA helps patients who have quit tobacco to remain tobacco free are needed.
Conclusion
Patients who attended the tobacco cessation DIGMA received personalized care and had a higher tobacco quit rate than did patients receiving standard treatment. However, due to study limitations, these results should be confirmed with future studies.
Acknowledgments
This material is the result of work supported with resources and the use of facilities at the Sioux Falls VA Health Care System in Sioux Falls, South Dakota.
1. U.S. Department of Health and Human Services. Clinical practice guidelines. Treating tobacco use and dependence: 2008 update. Health Resource and Services Administration website. http://bphc.hrsa.gov/buckets/treatingtobacco.pdf. Published May 2008. Accessed July 8, 2016.
2. Agaku IT, King BA, Husten CG, et al; Centers for Disease Control and Prevention (CDC). Tobacco product use among adults--United States, 2012-2013. MMWR Morb Mortal Wkly Rep. 2014;63(25):542-547.
3. Bondurant S, Wedge R, eds. Combating Tobacco Use in Military and Veteran Populations. Washington, DC: The National Academies Press; 2009.
4. Gierisch JM, Straits-Tröster K, Calhoun PS, Beckham JC, Acheson S, Hamlett-Berry K. Tobacco use among Iraq- and Afghanistan-era veterans: a qualitative study of barriers, facilitators, and treatment p. Prev Chronic Dis. 2012;9:E58.
5. Chen T, Kazerooni R, Vannort E, et al. Comparison of an intensive pharmacist-managed telephone clinic with standard of care for tobacco cessation in a veteran population. Health Promot Pract. 2014;15(4):512-520.
6. Dent LA, Harris KJ, Noonan CW. Randomized trial assessing the effectiveness of a pharmacist-delivered program for smoking cessation. Ann Pharmacother. 2009;43(2):194-201.
7. Himstreet J. My Tobacco Cessation Workbook. Washington, DC: U.S. Department of Veterans Affairs; 2014.
8. Himstreet J. Primary Care & Tobacco Cessation Handbook. Washington, DC: U.S. Department of Veterans Affairs; 2013.
Every year in the U.S., more than 435,000 people die of illnesses related to tobacco use.1 The CDC reported that from 2012 to 2013, 21.3% of adults used some form of tobacco daily or on some days.2 Veterans are not excluded from these numbers: A 2005 survey found 22.2% of VA patients were current smokers, and 71.2% of VA patients had smoked at least 100 cigarettes in their life.3
Military personnel have a higher propensity to be in situations that increase the risk of tobacco use than the general population does.3,4 These situations include alternating between periods of high stress and boredom, separation from loved ones, perceived camaraderie involved with tobacco use, and the limitation of healthier coping mechanisms.3,4 Stress and boredom have been cited as the top reasons for initiating tobacco use when deployed.3,4 Furthermore, once military personnel return from deployment, they may have difficulty quitting tobacco due to depression, sleeplessness, change in the structure of everyday life, or a second deployment.4
In 2009 Bondurant and Wedge predicted that the VA would spend $30.9 billion in preventable smoking-related expenditures by 2024.3 The negative health effects and the financial impact of tobacco make cessation programs an important investment for the VA.
In 2012, the CDC reported that 70% of veterans want to quit tobacco; therefore, veterans likely would be interested in tobacco cessation programs.4 Reasons veterans noted for quitting included family, changes in the social norm, better overall health, and better ability to breathe.4 Veterans also identified that tobacco cessation programs with convenience, personalization, reduced-cost medications, and peer support would be most helpful.4
According to a 2008 tobacco use and dependence guideline update, the most effective therapy for quitting tobacco is counseling plus pharmacotherapy.1 According to the guideline, the number of counseling sessions combined with pharmacotherapy is strongly related to the likelihood of quitting.1 A number of studies also have shown that telephone counseling is effective for tobacco cessation.5 However, a previous study in veterans found that scheduled face-to-face counseling sessions may be more effective than telephone counseling.6 Dent and colleagues found a statistically significant quit rate at 6 months of 28% in the face-to-face group vs 11.8% in the telephone group.6
After reviewing the guidelines, analyzing the studies, and learning what veterans find most helpful in tobacco cessation programs, the Sioux Falls VA Health Care System (SFVAHCS) in South Dakota took a unique approach to tobacco cessation. In 2012, SFVAHCS implemented a tobacco cessation drop-in group medical appointment (DIGMA) to improve tobacco quit rates. The DIGMA is a 1-hour, educational supportive clinic that allows veterans to drop in during any class anytime, regardless of their tobacco use status. This clinic mostly serves outpatients; however, inpatients also are welcome. Patients are informed of the DIGMA by a health care provider (HCP) or patient information flyers posted throughout SFVAHCS.
The DIGMA takes place once a week in a classroom next to a primary care waiting area, making it easily accessible. During the DIGMA, an HCP, such as a nurse or physician, provides behavioral education. VA materials (Primary Care and Tobacco Cessation Handbook and My Tobacco Cessation Workbook designed by Julianne Himstreet, PharmD, BCPS) are used to guide classes.7,8 These books address barriers to quitting, coping with nicotine withdrawal, planning for quit day, handling tobacco cravings, watching out for triggers, and staying tobacco free.7,8 Clinical pharmacists also are present at the DIGMA for patients who want to start or continue pharmacotherapy. The pharmacists can prescribe tobacco cessation medications and follow up on the success or adverse effects (AEs) of therapy.
The purpose of this study was to examine how a voluntary, drop-in, face-to-face tobacco cessation clinic impacts tobacco quit rates in veterans receiving pharmacotherapy.
Methods
A retrospective chart review was performed for all study site outpatients started on pharmacotherapy for tobacco cessation between September 1, 2012 and August 31, 2013, as determined by pharmacy dispensing records. Two groups were evaluated in this study: the pharmacotherapy-only (PO) group and the DIGMA group. Pharmacotherapy was most often prescribed by an HCP in the PO group. Other prescribers may have included pharmacists, mental health providers, and hospitalists. The second group was the DIGMA group, which included patients who were on tobacco cessation pharmacotherapy and attended at least 1 DIGMA class within a year of starting pharmacotherapy.
For this study, pharmacotherapy included nicotine gum, nicotine lozenge, nicotine patch, bupropion, varenicline, and any combination of these medications. Patients were excluded if they died, moved, or were lost to follow-up within 1 year of starting pharmacotherapy for a new quit attempt; were not at the beginning of a quit attempt; or were taking bupropion for mood or depression only.
One hundred thirty-six patients attended the DIGMA during the study period, but only 49 patients met the inclusion criteria. Patients also were excluded because they were not at the beginning of a quit attempt, were not receiving pharmacotherapy, or were not seen by an HCP to assess tobacco status after receiving tobacco cessation pharmacotherapy.
A total of 1,807 patients were identified as potential candidates for the PO group. Once the DIGMA patients were identified, an equal number of patients were randomly chosen for the PO group. To ensure that the PO group was random, the patient list was alphabetized, and patients were selected if they met the PO inclusion criteria, starting at the top of the list and moving down until the needed number was met.
The primary endpoint was the tobacco quit rate within 1 year of starting pharmacotherapy for a new quit attempt. Tobacco use status was determined from the patient’s electronic medical record. A subgroup analysis was performed to determine the percentage of patients using each tobacco cessation medication or a combination of medications at the time of the reported quit date.
This study also looked at the number of DIGMA classes attended by patients who quit tobacco and the number of times patients switched pharmacotherapy during the 1-year time frame. A chi-square test was executed to evaluate the primary endpoint, and descriptive statistics were performed for the subgroup analysis. A P value of ≤ .05 was deemed significant.
Results
A total of 98 patients were included with 49 patients in each study arm. Baseline characteristics were similar between the groups with an average age of 54 years in both groups (Table). As shown in Figure 1, 40.8% of patients in the DIGMA group quit tobacco compared with 26.5% in the PO group (P = .19).
Discussion
The tobacco quit rate of veterans on pharmacotherapy who attended at least 1 DIGMA class was higher than the quit rate of veterans on pharmacotherapy only. Although the difference between quit rates was not statistically significant, the difference was clinically important. Every time a patient quits tobacco, years of negative health consequences and cost to the health care system may be prevented. Patients who quit tobacco and continue to attend DIGMA classes also can provide support and advice to others who are trying to quit.
The study results also suggest that the tobacco cessation DIGMA provided personalized care to veterans, as demonstrated by patients in the DIGMA group switching pharmacotherapy and using combination therapy more often. Access to pharmacists who can prescribe medications, change therapy, and assist with AEs gave patients the opportunity to determine the most efficacious therapy. Pharmacists also are aware of the pros and cons of the different tobacco cessation medications and are able to help patients pick the best medication to start with or change to.
Patients in the DIGMA group who quit tobacco attended an average of 1.4 classes. Those who attended the DIGMA may have been inherently more motivated to quit tobacco. However, the unique design of the DIGMA may have better equipped patients to quit tobacco after just 1 or 2 classes.
Limitations
Overall, an average attendance of 1.4 classes is a limitation; previous studies have shown that quit rates have a positive correlation with the number of counseling sessions attended.1 Another limitation is the small sample size. In addition, statistical power was not calculated. Tobacco use was not consistently documented in patients’ charts by the HCP and may not have been addressed at every visit. Some patients who quit tobacco may have been missed due to the lack of documentation of tobacco use status. Last, because reviewing a patient chart ended once documentation of tobacco cessation was found, some patients may have relapsed after quitting.
The study site likely could have offered better notice of the presence of the DIGMA. Although flyers and advertisements were available and posted, some tobacco-using patients may not have been aware of the DIGMA. The SFVAHCS could increase awareness of the program if the pharmacy provided a DIGMA flyer with each outpatient tobacco cessation prescription.
A larger, prospective study would be beneficial and might show statistically significant differences in tobacco quit rates. Further studies that address whether the DIGMA helps patients who have quit tobacco to remain tobacco free are needed.
Conclusion
Patients who attended the tobacco cessation DIGMA received personalized care and had a higher tobacco quit rate than did patients receiving standard treatment. However, due to study limitations, these results should be confirmed with future studies.
Acknowledgments
This material is the result of work supported with resources and the use of facilities at the Sioux Falls VA Health Care System in Sioux Falls, South Dakota.
1. U.S. Department of Health and Human Services. Clinical practice guidelines. Treating tobacco use and dependence: 2008 update. Health Resource and Services Administration website. http://bphc.hrsa.gov/buckets/treatingtobacco.pdf. Published May 2008. Accessed July 8, 2016.
2. Agaku IT, King BA, Husten CG, et al; Centers for Disease Control and Prevention (CDC). Tobacco product use among adults--United States, 2012-2013. MMWR Morb Mortal Wkly Rep. 2014;63(25):542-547.
3. Bondurant S, Wedge R, eds. Combating Tobacco Use in Military and Veteran Populations. Washington, DC: The National Academies Press; 2009.
4. Gierisch JM, Straits-Tröster K, Calhoun PS, Beckham JC, Acheson S, Hamlett-Berry K. Tobacco use among Iraq- and Afghanistan-era veterans: a qualitative study of barriers, facilitators, and treatment p. Prev Chronic Dis. 2012;9:E58.
5. Chen T, Kazerooni R, Vannort E, et al. Comparison of an intensive pharmacist-managed telephone clinic with standard of care for tobacco cessation in a veteran population. Health Promot Pract. 2014;15(4):512-520.
6. Dent LA, Harris KJ, Noonan CW. Randomized trial assessing the effectiveness of a pharmacist-delivered program for smoking cessation. Ann Pharmacother. 2009;43(2):194-201.
7. Himstreet J. My Tobacco Cessation Workbook. Washington, DC: U.S. Department of Veterans Affairs; 2014.
8. Himstreet J. Primary Care & Tobacco Cessation Handbook. Washington, DC: U.S. Department of Veterans Affairs; 2013.
The Impact of Elder Abuse on a Growing Senior Veteran Population
Elder abuse represents a mounting and alarming national health problem that is likely to continue to grow as the older adult population in the U.S. increases from 35 to 72 million by 2030.1 Elder abuse was first described in the 1970s with colloquialisms such as “granny battering” or “elder mistreatment.”2
The National Research Council defines elder abuse as “intentional actions that cause harm or a serious risk of harm to an older adult by a caregiver or other person who stands in a trust relationship to the elder, or failure by a caregiver to satisfy the elders’ basic needs or to protect the elder from harm.”3 Elder abuse can further be differentiated into 6 types of abuse: physical, emotional, sexual, financial, neglect, and self-neglect (Table).
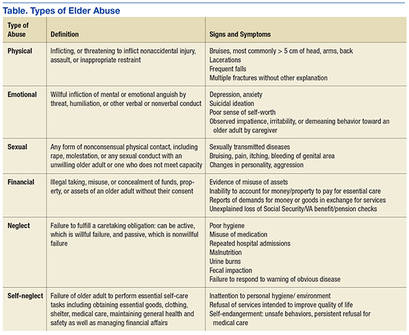
According to a National Research Council panel, an estimated 1 to 2 million Americans aged ≥ 65 years have been injured, exploited, or otherwise mistreated by someone on whom they depend on for care or protection.4 For each reported case of elder abuse, 5 more cases go unreported.5 Neglect is the most common type of abuse, followed closely by financial exploitation. Studies suggest that those aged > 80 years are 2 to 3 times more at risk for being abused compared with individuals aged between 65 and 80 years.5 Ninety percent of elder abuse occurs at the hands of perpetrators known to the victim, including 33% by adult children, 22% by other family members, and 11% by spouses or intimate partners.5 More than half, or 53%, of alleged perpetrators of elder abuse are female, and older women are 2 times more likely than men to be abused.6 Nevertheless, it should be noted that one-third of all cases of abuse occur to men, which contradicts myths that they are seldom at risk.
Recent data show that elder abuse also is detrimental to social, law, and health systems.7 Victims of elder abuse have decreased access to support systems and fewer physical, psychological, and economic reserves.7 As a result, the impact of a single incidence of elder abuse is magnified: Victims have a higher 10-year mortality and morbidity than that of older adults who have not been abused, they have significantly higher emergency department (ED) utilization and higher hospitalization rates, and they face an increased risk for institutionalization.7,8 Economic estimates suggest that cases of elder abuse contribute to more than $5.3 billion to the annual health care expenditure in the U.S.9
On the micro level, a busy clinician who sees between 20 to 40 patients daily could encounter at least 1 victim of elder abuse per day.10 Nevertheless, a national Adult Protective Services (APS) survey recently suggested that health care professionals (HCPs) were responsible for submitting 11.1% of all elder abuse reports—with physicians accounting for only 1% of reported cases.7 Several factors may help explain the reasons that so few physicians report elder abuse, including a lack of sufficient knowledge on elder abuse definitions, types, risk factors, signs and symptoms; a misunderstanding of the reporting process; or an unwillingness to get involved. A 2005 survey of almost 400 family and internal medicine physicians showed that 63% had never asked their patients about elder abuse, 98% said there should be more education on elder abuse, and 80% felt they had not been trained to diagnose elder abuse.11
Elder Abuse Legislation
The Elder Justice Act was enacted as part of the Patient Protection and Affordable Care Act in March 2010 and marked the first piece of federal legislation passed to authorize federal funds to address elder abuse, neglect, and exploitation. An Elder Justice Coordinating Counsel and an advisory board were established as national leadership in the HHS. Under this leadership and support of HHS Assistant Secretary for Aging Kathy Greenlee, an Elder Justice Interagency Working Group (EJWG) was formed in 2012 to further explore the national problem of elder abuse, neglect, and exploitation. The EJWG developed an elder abuse roadmap to provide a detailed, practical guide for teams, communities, states, and national entities, fostering a coordinated approach to reduce elder abuse, neglect, and exploitation.12
The roadmap includes initiatives such as the development of an interactive, online curriculum for legal aid and civil attorneys to identify and respond to elder abuse, what lawyers need to know about elder abuse by the Department of Justice, and the development of a voluntary national APS data system to collect national data on elder abuse by the HHS. Also there has been private stakeholder action by the Archstone Foundation/Keck School of Medicine of the University of Southern California, which is developing a national training initiative, and the Harry and Jeannette Weinberg Center for Elder Abuse Prevention at the Hebrew Home at Riverdale in New York, which is working on the development of emergency shelters for elder abuse victims.12 The 2015 White House Conference on Aging also has made elder justice one of its 4 tracks that aims to support the “dignity, independence, and quality of life of older Americans at a time when we’re seeing a huge surge in the number of older adults.”13
VHA Response to Elder Abuse
The VHA is the largest integrated, federally funded health care system in the U.S.14 The VA census estimates that about 13 million veterans and their single surviving spouses are aged ≥ 65 years, representing about one-third of the total senior population and 45.3% of the total veteran population.15 This number is expected to rise as the 7 million Vietnam-era veterans age.15
A 2000 comparative analysis of health status and medical resource use showed that the VA patient population had poorer health status, more medical conditions, and higher medical resource utilization, including more physician visits per year, more hospital admissions per year, and more days spent in the hospital per year compared with that of the general patient population.16 Another study determined that older veterans had higher rates of lifetime trauma exposure (85%) and posttraumatic stress disorder symptomatology secondary to combat and war zone-related exposure (53%).17Elderly veterans also may be eligible for a wide variety of VA benefits, such as disability compensation and pension, which might place them at a higher risk for financial exploitation.18 Additionally, VA programs such as Aid & Attendance or housebound benefits award additional monies to veterans who are eligible for or are receiving a VA pension.18 General knowledge of this may negatively impact older veterans. A 2010 Government Accountability Office (GAO) report revealed that guardians stole or otherwise improperly obtained $5.4 million in assets from 158 incapacitated victims, many of whom were older adults.19
From this composite, the veteran population is at particular risk for elder abuse due to high levels of physical and psychiatric vulnerability, frailty, substance use, and caregiver dependence.
VA Policy
Elder abuse in the VA health care system is governed by VA Directive 2012-022: Reporting Cases of Abuse and Neglect, which states that as a matter of policy, all VAMCs, VA outpatient clinics, vet centers, VA community living centers, home- based primary care, home- and community-based programs, state veterans homes, and community-based outpatient clinics must comply with their state laws for reporting abuse and neglect. Specifically, relevant state statutes must be followed for the “identification, evaluation, treatment, referral, and/or mandated reporting of possible victims of physical assault, rape or sexual molestation, abuse and/or neglect of elders, spouses, partners, and children.” Each VAMC director is required to ensure that policies and procedures addressing the identification, evaluation, treatment, referral and mandatory reporting of abuse and/or neglect are in compliance with the applicable state laws.
Under this policy, any VA HCP suspecting abuse, neglect, or exploitation of an individual is responsible for providing an examination and treatment to the veteran as well as making a report to the designated state agency and documenting confirmation of the report in the electronic health record of the veteran. VA HCPs are expected to make a referral for a comprehensive social work assessment conducted by a VA social worker that includes identification of problems and determination if the veteran needs to be removed from danger. Disposition planning is an integral part of this assessment and should include the possibility of provision of additional services for veterans and their caregivers and/or possible placement in an institutional setting. Likewise, care should be taken to avoid overdiagnosis or wrongful diagnosis.
In addition, the VA Social Work Program Office has implemented standardized national social work case management documentation requirements to be used by all VA social workers assigned within patient aligned care teams (PACTs) in Primary Care. Preliminary data captured by VA social workers who completed the national standardized electronic progress notes indicate there were about 3,700 veterans during fiscal year 2014 who were assessed by the social worker with a presenting issue of “Abuse and/or Neglect.” Further study is needed to better understand the demographics, psychosocial, and medical needs of this group.
VA Research and Elder Abuse
The prevalence of elder abuse among veterans is not currently known. The 2010 GAO report stated that although it could not be determined whether allegations of abuse were widespread, hundreds of allegations of physical abuse, neglect, and financial exploitation between 1990 and 2010 were noted.19 A 2006 study that examined the prevalence, types, and intervention outcomes of elder abuse cases among a sample of veterans noted that 5.4% of evaluated veterans had a case reported on their behalf.20 Recent unpublished findings from chart reviews of all cases of elder abuse reported by the Providence and Durham VAMCs to their state’s respective APS agencies between 2006 and 2012 showed 55 reported cases at the 2 institutions during the 7-year study period. Compared with national data on elder abuse prevalence, this finding suggests a significant underreporting of elder abuse within the VA health care system. These findings are likely concordant with the lack of reporting in the community. Nevertheless, VA research on elder abuse is scant and represents an important future research priority.
Conclusion
Elder abuse has long been a taboo topic. At present there is a sense of urgency to elevate elder abuse, neglect, and exploitation as a national concern and a priority for HCPs both within the VA health care system and community. Awareness of elder abuse and neglect needs to be highlighted in order for recognition and prompt intervention to follow. Interventions should include joint federal efforts to raise public awareness of the signs of elder abuse, steps to take, and how to intervene as concerned citizen. Bridges need to be connected between health care systems and community resources, utilizing social media and educational interventions. There also is a need for parallel campaigns geared to HCPs to ensure that veterans are being screened and elder abuse, neglect, and exploitation are being appropriately diagnosed and victims cared for.
Caregiver stress and burden also needs to be considered as elder abuse and neglect are not always intentional, and as we have seen with the research already done at the VA, most elder abuse cases can be resolved by swift recognition and timely addition of services in the home in lieu of institutionalization. Discussions on elder abuse should not be feared. Rather, these conversations between citizens as well as HCPs and their clients can be viewed as a point of advocacy for older adults. More specifically, identification of elder abuse can be improved with the implementation of elder abuse screening tools and development of a new tool to help identify at-risk veterans before abuse even occurs.
Prevention can be achieved with increased education to raise awareness of elder abuse. Treatment of elder abuse should include the development of a standard operating procedure on elder abuse, collaboration between state and local officials, such as department of elderly affairs or adult protective services, utilization of medical foster homes, increased accessibility to home-based primary care and respite services as well as the development of shelter beds in VA-associated nursing homes for victims of elder abuse.
Last, additional research is needed to better understand the prevalence of elder abuse among veterans, identify those who are most at risk within the veteran population, and inform the development of evidence-based interventions. As the number of older adults grows, the need for programs and services is critical to ensure protection and support of this vulnerable group within society.
1. Policastro C, Payne B. Assessing the level of elder abuse knowledge preprofessionals possess: implications for the further development of university curriculum. J Elder Abuse Negl. 2014;26(1):12-30.
2. Gorbien MJ, Eisenstein AR. Elder abuse and neglect: an overview. Clin Geriatr Med. 2005;21(2):279-292
3. National Research Council (US) Panel to Review Risk and Prevalence of Elder Abuse and Neglect; Bonnie R, Wallace R, eds. In: Elder Mistreatment: Abuse, Neglect and Exploitation in an Aging America. 1st ed. Washington, DC: The National Academies Press; 2003.
4. Wagenaar D, Rosenbaum R, Herman S, Page C. Elder abuse education in primary care residency programs: a cluster group analysis. Fam Med. 2009;41(7):481-486.
5. National Center on Elder Abuse. The national elder abuse incidence study: final report. Administration for Community Living website. http://aoa.gov/AoA_Programs/Elder_Rights/Elder_Abuse/docs/ABuseReport_Full.pdf. Published September 1998. Accessed July 11, 2016.
6. Bureau of Justice Statistics. Half of violent victimizations of the elderly in Michigan from 2005-2009 involved serious acts of violence. Bureau of Justice Statistics website. www.bjs.gov/content/pub/press/vcerlem0509pr.cfm. Accessed July 18, 2016.
7. Mosqueda L, Dong X. Elder abuse and neglect, “I don’t care anything about going to the doctor, to be honest…” JAMA. 2011;306(5):532-540.
8. Dong X, Simon MA. Elder abuse as a risk factor for hospitalization in older persons. JAMA Intern Med. 2013;173(10):911-917.
9. Choo WY, Hairi NN, Othman S, Francis DP, Baker PRA. Interventions for preventing abuse in the elderly (protocol). Cochrane Database Syst Rev. 2013;(1):CDO10321.
10. Halphen JM, Varas GM, Sadowsky JM. Recognizing and reporting elder abuse and neglect. Geriatrics. 2009;64(7):13-18.
11. Kennedy RD. Elder abuse and neglect: the experience, knowledge, and attitudes of primary care physicians. Fam Med. 2005;37(7):481-485.
12. National Center on Elder Abuse. The elder justice roadmap: a stakeholder initiative to respond to an emerging health, justice, financial and social crisis. National Center on Elder Abuse website. http://ncea.acl.gov/library/gov_report/docs/ejrp_roadmap.pdf. Accessed July 18 2016.
13. 2015 White House Conference on Aging. (WHCOA). U.S. Department of Health and Human Services website. http://www.whitehouseconferenceonaging.gov/2015-WHCOA-Final-Report.pdf. Accessed on July 15 2016.
14. U.S. Department of Veterans Affairs. About VA. U.S. Department of Veteran Affairs website. http://www.va.gov/about_va/vahistory.asp. Updated August 20, 2015. Accessed July 18 2016.
15. U.S. Department of Veterans Affairs. National center for veterans analysis and statistics, Veteran population. U.S. Department of Veterans Affairs website. http://www.va.gov/vetdata/veteran_population.asp.Updated April 15, 2016. Accessed July 18 2016.
16. Agha Z, Lofgren RP, VanRuiswyk JV, Layde PM. Are patients at veterans affairs medical centers sicker? A comparative analysis of health status and medical resource use. Arch Intern Med. 2000;160(21):3252-3257.
17. U.S. Department of Veterans Affairs. Posttraumatic stress symptoms among older adults: a review. U.S. Department of Veterans Affairs website. http://www.ptsd.va.gov/professional/treatment/older/ptsd_symptoms_older_adults.asp. Updated February 23, 2016. Accessed July 18, 2016.
18. U.S. Department of Veterans Affairs. Veterans: elderly veterans. U.S. Department of Veterans Affairs website. http://www.benefits.va.gov/persona/veteran-elderly.asp. Updated October 22, 2013. Accessed July 18, 2016.
19. United States Government Accountability Office. Guardianships: Cases of Financial Exploitation, Neglect, and Abuse of Seniors. Washington, DC: U.S. Government Printing Office. GAO-10-10460.
20. Moon A, Lawson K, Carpiac M, Spaziano E. Elder Abuse and neglect among veterans in Greater Los Angeles: prevalence, types, and interventional outcomes. J Gerontol Soc Work. 2006;46(3-4):187-204.
Elder abuse represents a mounting and alarming national health problem that is likely to continue to grow as the older adult population in the U.S. increases from 35 to 72 million by 2030.1 Elder abuse was first described in the 1970s with colloquialisms such as “granny battering” or “elder mistreatment.”2
The National Research Council defines elder abuse as “intentional actions that cause harm or a serious risk of harm to an older adult by a caregiver or other person who stands in a trust relationship to the elder, or failure by a caregiver to satisfy the elders’ basic needs or to protect the elder from harm.”3 Elder abuse can further be differentiated into 6 types of abuse: physical, emotional, sexual, financial, neglect, and self-neglect (Table).
According to a National Research Council panel, an estimated 1 to 2 million Americans aged ≥ 65 years have been injured, exploited, or otherwise mistreated by someone on whom they depend on for care or protection.4 For each reported case of elder abuse, 5 more cases go unreported.5 Neglect is the most common type of abuse, followed closely by financial exploitation. Studies suggest that those aged > 80 years are 2 to 3 times more at risk for being abused compared with individuals aged between 65 and 80 years.5 Ninety percent of elder abuse occurs at the hands of perpetrators known to the victim, including 33% by adult children, 22% by other family members, and 11% by spouses or intimate partners.5 More than half, or 53%, of alleged perpetrators of elder abuse are female, and older women are 2 times more likely than men to be abused.6 Nevertheless, it should be noted that one-third of all cases of abuse occur to men, which contradicts myths that they are seldom at risk.
Recent data show that elder abuse also is detrimental to social, law, and health systems.7 Victims of elder abuse have decreased access to support systems and fewer physical, psychological, and economic reserves.7 As a result, the impact of a single incidence of elder abuse is magnified: Victims have a higher 10-year mortality and morbidity than that of older adults who have not been abused, they have significantly higher emergency department (ED) utilization and higher hospitalization rates, and they face an increased risk for institutionalization.7,8 Economic estimates suggest that cases of elder abuse contribute to more than $5.3 billion to the annual health care expenditure in the U.S.9
On the micro level, a busy clinician who sees between 20 to 40 patients daily could encounter at least 1 victim of elder abuse per day.10 Nevertheless, a national Adult Protective Services (APS) survey recently suggested that health care professionals (HCPs) were responsible for submitting 11.1% of all elder abuse reports—with physicians accounting for only 1% of reported cases.7 Several factors may help explain the reasons that so few physicians report elder abuse, including a lack of sufficient knowledge on elder abuse definitions, types, risk factors, signs and symptoms; a misunderstanding of the reporting process; or an unwillingness to get involved. A 2005 survey of almost 400 family and internal medicine physicians showed that 63% had never asked their patients about elder abuse, 98% said there should be more education on elder abuse, and 80% felt they had not been trained to diagnose elder abuse.11
Elder Abuse Legislation
The Elder Justice Act was enacted as part of the Patient Protection and Affordable Care Act in March 2010 and marked the first piece of federal legislation passed to authorize federal funds to address elder abuse, neglect, and exploitation. An Elder Justice Coordinating Counsel and an advisory board were established as national leadership in the HHS. Under this leadership and support of HHS Assistant Secretary for Aging Kathy Greenlee, an Elder Justice Interagency Working Group (EJWG) was formed in 2012 to further explore the national problem of elder abuse, neglect, and exploitation. The EJWG developed an elder abuse roadmap to provide a detailed, practical guide for teams, communities, states, and national entities, fostering a coordinated approach to reduce elder abuse, neglect, and exploitation.12
The roadmap includes initiatives such as the development of an interactive, online curriculum for legal aid and civil attorneys to identify and respond to elder abuse, what lawyers need to know about elder abuse by the Department of Justice, and the development of a voluntary national APS data system to collect national data on elder abuse by the HHS. Also there has been private stakeholder action by the Archstone Foundation/Keck School of Medicine of the University of Southern California, which is developing a national training initiative, and the Harry and Jeannette Weinberg Center for Elder Abuse Prevention at the Hebrew Home at Riverdale in New York, which is working on the development of emergency shelters for elder abuse victims.12 The 2015 White House Conference on Aging also has made elder justice one of its 4 tracks that aims to support the “dignity, independence, and quality of life of older Americans at a time when we’re seeing a huge surge in the number of older adults.”13
VHA Response to Elder Abuse
The VHA is the largest integrated, federally funded health care system in the U.S.14 The VA census estimates that about 13 million veterans and their single surviving spouses are aged ≥ 65 years, representing about one-third of the total senior population and 45.3% of the total veteran population.15 This number is expected to rise as the 7 million Vietnam-era veterans age.15
A 2000 comparative analysis of health status and medical resource use showed that the VA patient population had poorer health status, more medical conditions, and higher medical resource utilization, including more physician visits per year, more hospital admissions per year, and more days spent in the hospital per year compared with that of the general patient population.16 Another study determined that older veterans had higher rates of lifetime trauma exposure (85%) and posttraumatic stress disorder symptomatology secondary to combat and war zone-related exposure (53%).17Elderly veterans also may be eligible for a wide variety of VA benefits, such as disability compensation and pension, which might place them at a higher risk for financial exploitation.18 Additionally, VA programs such as Aid & Attendance or housebound benefits award additional monies to veterans who are eligible for or are receiving a VA pension.18 General knowledge of this may negatively impact older veterans. A 2010 Government Accountability Office (GAO) report revealed that guardians stole or otherwise improperly obtained $5.4 million in assets from 158 incapacitated victims, many of whom were older adults.19
From this composite, the veteran population is at particular risk for elder abuse due to high levels of physical and psychiatric vulnerability, frailty, substance use, and caregiver dependence.
VA Policy
Elder abuse in the VA health care system is governed by VA Directive 2012-022: Reporting Cases of Abuse and Neglect, which states that as a matter of policy, all VAMCs, VA outpatient clinics, vet centers, VA community living centers, home- based primary care, home- and community-based programs, state veterans homes, and community-based outpatient clinics must comply with their state laws for reporting abuse and neglect. Specifically, relevant state statutes must be followed for the “identification, evaluation, treatment, referral, and/or mandated reporting of possible victims of physical assault, rape or sexual molestation, abuse and/or neglect of elders, spouses, partners, and children.” Each VAMC director is required to ensure that policies and procedures addressing the identification, evaluation, treatment, referral and mandatory reporting of abuse and/or neglect are in compliance with the applicable state laws.
Under this policy, any VA HCP suspecting abuse, neglect, or exploitation of an individual is responsible for providing an examination and treatment to the veteran as well as making a report to the designated state agency and documenting confirmation of the report in the electronic health record of the veteran. VA HCPs are expected to make a referral for a comprehensive social work assessment conducted by a VA social worker that includes identification of problems and determination if the veteran needs to be removed from danger. Disposition planning is an integral part of this assessment and should include the possibility of provision of additional services for veterans and their caregivers and/or possible placement in an institutional setting. Likewise, care should be taken to avoid overdiagnosis or wrongful diagnosis.
In addition, the VA Social Work Program Office has implemented standardized national social work case management documentation requirements to be used by all VA social workers assigned within patient aligned care teams (PACTs) in Primary Care. Preliminary data captured by VA social workers who completed the national standardized electronic progress notes indicate there were about 3,700 veterans during fiscal year 2014 who were assessed by the social worker with a presenting issue of “Abuse and/or Neglect.” Further study is needed to better understand the demographics, psychosocial, and medical needs of this group.
VA Research and Elder Abuse
The prevalence of elder abuse among veterans is not currently known. The 2010 GAO report stated that although it could not be determined whether allegations of abuse were widespread, hundreds of allegations of physical abuse, neglect, and financial exploitation between 1990 and 2010 were noted.19 A 2006 study that examined the prevalence, types, and intervention outcomes of elder abuse cases among a sample of veterans noted that 5.4% of evaluated veterans had a case reported on their behalf.20 Recent unpublished findings from chart reviews of all cases of elder abuse reported by the Providence and Durham VAMCs to their state’s respective APS agencies between 2006 and 2012 showed 55 reported cases at the 2 institutions during the 7-year study period. Compared with national data on elder abuse prevalence, this finding suggests a significant underreporting of elder abuse within the VA health care system. These findings are likely concordant with the lack of reporting in the community. Nevertheless, VA research on elder abuse is scant and represents an important future research priority.
Conclusion
Elder abuse has long been a taboo topic. At present there is a sense of urgency to elevate elder abuse, neglect, and exploitation as a national concern and a priority for HCPs both within the VA health care system and community. Awareness of elder abuse and neglect needs to be highlighted in order for recognition and prompt intervention to follow. Interventions should include joint federal efforts to raise public awareness of the signs of elder abuse, steps to take, and how to intervene as concerned citizen. Bridges need to be connected between health care systems and community resources, utilizing social media and educational interventions. There also is a need for parallel campaigns geared to HCPs to ensure that veterans are being screened and elder abuse, neglect, and exploitation are being appropriately diagnosed and victims cared for.
Caregiver stress and burden also needs to be considered as elder abuse and neglect are not always intentional, and as we have seen with the research already done at the VA, most elder abuse cases can be resolved by swift recognition and timely addition of services in the home in lieu of institutionalization. Discussions on elder abuse should not be feared. Rather, these conversations between citizens as well as HCPs and their clients can be viewed as a point of advocacy for older adults. More specifically, identification of elder abuse can be improved with the implementation of elder abuse screening tools and development of a new tool to help identify at-risk veterans before abuse even occurs.
Prevention can be achieved with increased education to raise awareness of elder abuse. Treatment of elder abuse should include the development of a standard operating procedure on elder abuse, collaboration between state and local officials, such as department of elderly affairs or adult protective services, utilization of medical foster homes, increased accessibility to home-based primary care and respite services as well as the development of shelter beds in VA-associated nursing homes for victims of elder abuse.
Last, additional research is needed to better understand the prevalence of elder abuse among veterans, identify those who are most at risk within the veteran population, and inform the development of evidence-based interventions. As the number of older adults grows, the need for programs and services is critical to ensure protection and support of this vulnerable group within society.
1. Policastro C, Payne B. Assessing the level of elder abuse knowledge preprofessionals possess: implications for the further development of university curriculum. J Elder Abuse Negl. 2014;26(1):12-30.
2. Gorbien MJ, Eisenstein AR. Elder abuse and neglect: an overview. Clin Geriatr Med. 2005;21(2):279-292
3. National Research Council (US) Panel to Review Risk and Prevalence of Elder Abuse and Neglect; Bonnie R, Wallace R, eds. In: Elder Mistreatment: Abuse, Neglect and Exploitation in an Aging America. 1st ed. Washington, DC: The National Academies Press; 2003.
4. Wagenaar D, Rosenbaum R, Herman S, Page C. Elder abuse education in primary care residency programs: a cluster group analysis. Fam Med. 2009;41(7):481-486.
5. National Center on Elder Abuse. The national elder abuse incidence study: final report. Administration for Community Living website. http://aoa.gov/AoA_Programs/Elder_Rights/Elder_Abuse/docs/ABuseReport_Full.pdf. Published September 1998. Accessed July 11, 2016.
6. Bureau of Justice Statistics. Half of violent victimizations of the elderly in Michigan from 2005-2009 involved serious acts of violence. Bureau of Justice Statistics website. www.bjs.gov/content/pub/press/vcerlem0509pr.cfm. Accessed July 18, 2016.
7. Mosqueda L, Dong X. Elder abuse and neglect, “I don’t care anything about going to the doctor, to be honest…” JAMA. 2011;306(5):532-540.
8. Dong X, Simon MA. Elder abuse as a risk factor for hospitalization in older persons. JAMA Intern Med. 2013;173(10):911-917.
9. Choo WY, Hairi NN, Othman S, Francis DP, Baker PRA. Interventions for preventing abuse in the elderly (protocol). Cochrane Database Syst Rev. 2013;(1):CDO10321.
10. Halphen JM, Varas GM, Sadowsky JM. Recognizing and reporting elder abuse and neglect. Geriatrics. 2009;64(7):13-18.
11. Kennedy RD. Elder abuse and neglect: the experience, knowledge, and attitudes of primary care physicians. Fam Med. 2005;37(7):481-485.
12. National Center on Elder Abuse. The elder justice roadmap: a stakeholder initiative to respond to an emerging health, justice, financial and social crisis. National Center on Elder Abuse website. http://ncea.acl.gov/library/gov_report/docs/ejrp_roadmap.pdf. Accessed July 18 2016.
13. 2015 White House Conference on Aging. (WHCOA). U.S. Department of Health and Human Services website. http://www.whitehouseconferenceonaging.gov/2015-WHCOA-Final-Report.pdf. Accessed on July 15 2016.
14. U.S. Department of Veterans Affairs. About VA. U.S. Department of Veteran Affairs website. http://www.va.gov/about_va/vahistory.asp. Updated August 20, 2015. Accessed July 18 2016.
15. U.S. Department of Veterans Affairs. National center for veterans analysis and statistics, Veteran population. U.S. Department of Veterans Affairs website. http://www.va.gov/vetdata/veteran_population.asp.Updated April 15, 2016. Accessed July 18 2016.
16. Agha Z, Lofgren RP, VanRuiswyk JV, Layde PM. Are patients at veterans affairs medical centers sicker? A comparative analysis of health status and medical resource use. Arch Intern Med. 2000;160(21):3252-3257.
17. U.S. Department of Veterans Affairs. Posttraumatic stress symptoms among older adults: a review. U.S. Department of Veterans Affairs website. http://www.ptsd.va.gov/professional/treatment/older/ptsd_symptoms_older_adults.asp. Updated February 23, 2016. Accessed July 18, 2016.
18. U.S. Department of Veterans Affairs. Veterans: elderly veterans. U.S. Department of Veterans Affairs website. http://www.benefits.va.gov/persona/veteran-elderly.asp. Updated October 22, 2013. Accessed July 18, 2016.
19. United States Government Accountability Office. Guardianships: Cases of Financial Exploitation, Neglect, and Abuse of Seniors. Washington, DC: U.S. Government Printing Office. GAO-10-10460.
20. Moon A, Lawson K, Carpiac M, Spaziano E. Elder Abuse and neglect among veterans in Greater Los Angeles: prevalence, types, and interventional outcomes. J Gerontol Soc Work. 2006;46(3-4):187-204.
Characteristics of High-Functioning Collaborations Between Primary Care and Podiatry in VHA PACTs
The patient centered medical home (PCMH) concept was developed in response to the need to improve the overall health care system in the U.S.1 The episodic/acute care model has not provided high-value health services for the costs incurred. A 2010 Commonwealth Fund report indicated that the U.S. was near the bottom on quality measures of patient safety, care coordination, access, efficiency, overall quality, and healthy life expectancy compared with 6 other western countries.2 The U.S. spends an average of $7,960 per capita, 2.5 times more than the average of the 6 other western countries surveyed, on health care.1 The core principles that define the PCMH include (1) enhanced access; (2) continuity; (3) comprehensiveness; (4) team-based care; (5) care coordination; (6) a systems-based approach to quality and safety; and (7) reimbursement structures consistent with the added value of this system.1
The VHA adapted the PCMH concept to fit its unique integrated health care system. The development and implementation of the patient aligned care teams (PACTs) was designed to advance and expand primary care through increased access, continuity, and coordination of care for veteran patients.3 To accomplish the care coordination component, a set of principals was developed to define its structure, using the PCMH neighbor concept. Recognizing the importance of specialty and subspecialty collaboration with primary care, the American College of Physicians issued a white paper in 2010 to define policies and features of this relationship.4 Those characteristics include bidirectional effective communication, coordination, and integration; appropriate and timely consultations and referrals; efficient, appropriate, and effective information flow; comanagement responsibility; patient-centered care, enhanced care access and high levels of care quality and safety; and whole-person coordination and integration by primary care.5
The purpose of this study was to describe the PCMH characteristics within VHA centers that self-identified as centers with good or fair/poor communication between PACTs and Podiatry. The authors’ prior work showed that higher levels of coordination were associated with lower rates of diabetes-related lower limb amputations at VA centers.6
Methods
The podiatry service chiefs at 107 VHA hospitals were sent an online survey via e-mail on October 2, 2014. Two follow-up e-mails were sent to centers that did not respond after 1 week and then again after 2 weeks. Respondents were not offered rewards or inducements to participate. Centers were chosen at random and represented the diversity of facility complexity groups. The VHA Facility Complexity Model classifies VHA facilities at levels 1a, 1b, 1c, 2, or 3. Level 1a facilities are the most complex and level 3 facilities are the least complex.
The survey was designed to determine the characteristics of high-functioning teams as defined by the joint principles of the PCMH and to assess the operational theories that good functioning teams possess the following characteristics, based on the VHA Handbook 1101.10 PACT Handbook.7
- Good bidirectional communication between PACT and podiatry.
- A working care coordination agreement (CCA) that defines referral processes, e-consult conversion when appropriate, and successful coordination of care.
- Face-to-face meetings to discuss and adjust the CCA and other program components.
The audience for the survey was the chiefs of podiatry at 107 medical centers, representing a combination of medical center complexity groups 1, 2, and 3. The survey consisted of questions designed to assess the self-reported relationship between PACT and Podiatry Service at each reporting medical center (Appendix).
Statistical Analysis
A group level analysis was performed between centers identifying themselves by having good or fair/poor communication between PACT and Podiatry. The Fisher exact test (2-sided) was used to assess for associations. Significance was set at P ≤ .05.
Results
The response rate for this survey was 54% (58/107). The Table describes the frequency of PCMH characteristics in good communicating and fair/poor communicating centers. Thirty-seven centers self-identified as having good communication between PACT and Podiatry, and 21 reported fair/poor communication (P = .015). Frequent bidirectional communication occurred in 68% of good communication centers and 10% in fair/poor communication centers (P < .001). There were no differences between good communicating centers and fair/poor communicating centers for having working care coordination agreements. In good communication centers, 69% of consults were appropriate at least 75% of the time compared with 40% of the time for fair/poor communication centers (P = .032). Active care coordination in most cases occurred in 53% of good communication centers vs 5% of fair/poor communication centers (P < .001).
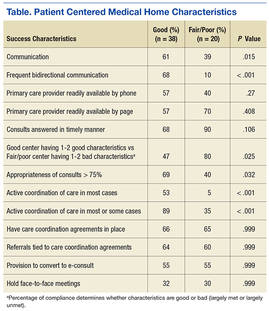
In the survey, characteristics supported by the joint principles statement for developing a PCMH were assessed.3 Favorable characteristics included good communication between providers (PACT and Podiatry), a high percentage of consults considered appropriate (> 75%), and high levels of coordination. Unfavorable characteristics included poor communication between providers (PACT and Podiatry), low percentage of consults considered inappropriate (< 75%), and poor levels of communication. In the survey, 47% of good communicating centers had 1 or 2 favorable characteristics for a PCMH compared with 80% fair/poor communication centers that had 1 or 2 unfavorable characteristics (P = .025) (Figure 1).
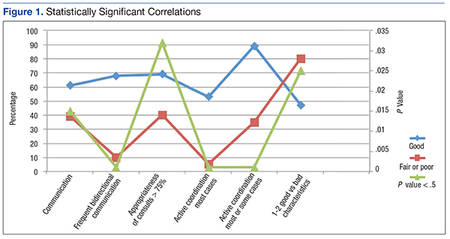
Figure 2 describes the equivocal correlations that were found between fair or poor self-reported centers and high-functioning PACT/Podiatry services with:
- Presence of a signed CCA.
- Multiple positive or negative characteristics.
- Referrals tied to the CCA.
- Provision to convert to an e-consult.
- Face-to-face meetings to review the CCA.
Discussion
The key to high-functioning PACT/Podiatry teams rests with the quality of the communication between providers. Without this basic tenet, CCAs cannot be effective. 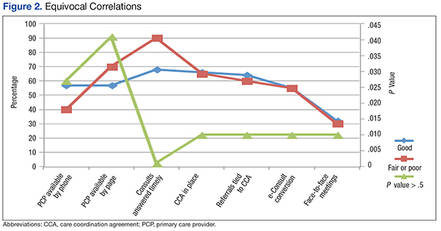
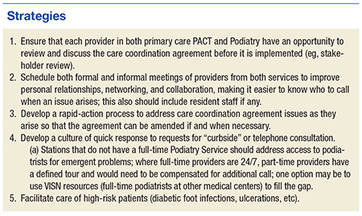
Conclusion
Self-reporting high-functioning PACT/Podiatry teams depend more on the relationships between providers, the ease of bidirectional communication and coordination of care, and a seemless consult and less on the formal care coordination documents and e-consults that reduce the direct exchanges between providers. 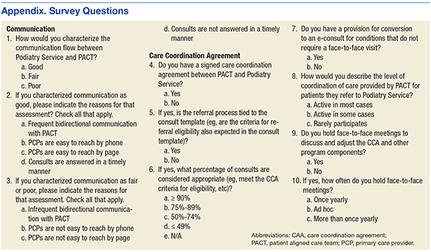
1. Arend J, Tsang-Quinn J, Levine C, Thomas D. The patient-centered medical home: history, components, and review of the evidence. Mt Sinai J Med. 2012;79(4):433-450.
2. Schoen, C, Osborn, R, Squires D, Doty MM, Pierson R, Applebaum S. How health insurance design affects access to care and costs by income, in eleven countries. Health Aff. 2010;29(12):2323;2334.
3. Bein B. AMA delegates adopt AAFP’s joint principles of patient-centered medical home. Ann Fam Med. 2009;7(1):86-87.
4. Kirschner, N, Greenlee, MC, The patient centered medical home neighbor: the interface of the patient centered medical home with specialty/subspecialty practices. Phildelphia, PA: American College of Physicians; 2010.
5. Nelson K, Sun H, Dolan E, et al. Elements of the patient-centered medical home associated with health outcomes among veterans: the role of primary care continuity, expanded access, and care coordination. J Ambul Care Manage. 2014;37(4):331-338.
6. Pogach L, Charns MP, Wrobel JS, et al. Impact of policies and performance measurement on development of organizational coordinating strategies for chronic care delivery. Am J Manag Care. 2014;10(2)(pt 2):171-180.
7. U.S. Department of Veteran Affairs. VHA Handbook 1101.10 PACT Handbook. Affairs, Washington DC: U.S. Department of Veterans Affairs; 2014.
8. Wrobel JS, Charns MP, Diehr P, et al. The relationship between provider coordination and diabetes-related foot outcomes. Diabetes Care. 2003;26(11):3042-3047.
9. Wrobel JS, Robbins JM, Charns MP, Bonacker KM, Reiber GE, Pogach L. Diabetes-related foot care at 10 Veterans Affairs medical centers: must do’s associated with successful microsystems. Jt Comm J Qual Patient Saf. 2006;32(4):206-213.
The patient centered medical home (PCMH) concept was developed in response to the need to improve the overall health care system in the U.S.1 The episodic/acute care model has not provided high-value health services for the costs incurred. A 2010 Commonwealth Fund report indicated that the U.S. was near the bottom on quality measures of patient safety, care coordination, access, efficiency, overall quality, and healthy life expectancy compared with 6 other western countries.2 The U.S. spends an average of $7,960 per capita, 2.5 times more than the average of the 6 other western countries surveyed, on health care.1 The core principles that define the PCMH include (1) enhanced access; (2) continuity; (3) comprehensiveness; (4) team-based care; (5) care coordination; (6) a systems-based approach to quality and safety; and (7) reimbursement structures consistent with the added value of this system.1
The VHA adapted the PCMH concept to fit its unique integrated health care system. The development and implementation of the patient aligned care teams (PACTs) was designed to advance and expand primary care through increased access, continuity, and coordination of care for veteran patients.3 To accomplish the care coordination component, a set of principals was developed to define its structure, using the PCMH neighbor concept. Recognizing the importance of specialty and subspecialty collaboration with primary care, the American College of Physicians issued a white paper in 2010 to define policies and features of this relationship.4 Those characteristics include bidirectional effective communication, coordination, and integration; appropriate and timely consultations and referrals; efficient, appropriate, and effective information flow; comanagement responsibility; patient-centered care, enhanced care access and high levels of care quality and safety; and whole-person coordination and integration by primary care.5
The purpose of this study was to describe the PCMH characteristics within VHA centers that self-identified as centers with good or fair/poor communication between PACTs and Podiatry. The authors’ prior work showed that higher levels of coordination were associated with lower rates of diabetes-related lower limb amputations at VA centers.6
Methods
The podiatry service chiefs at 107 VHA hospitals were sent an online survey via e-mail on October 2, 2014. Two follow-up e-mails were sent to centers that did not respond after 1 week and then again after 2 weeks. Respondents were not offered rewards or inducements to participate. Centers were chosen at random and represented the diversity of facility complexity groups. The VHA Facility Complexity Model classifies VHA facilities at levels 1a, 1b, 1c, 2, or 3. Level 1a facilities are the most complex and level 3 facilities are the least complex.
The survey was designed to determine the characteristics of high-functioning teams as defined by the joint principles of the PCMH and to assess the operational theories that good functioning teams possess the following characteristics, based on the VHA Handbook 1101.10 PACT Handbook.7
- Good bidirectional communication between PACT and podiatry.
- A working care coordination agreement (CCA) that defines referral processes, e-consult conversion when appropriate, and successful coordination of care.
- Face-to-face meetings to discuss and adjust the CCA and other program components.
The audience for the survey was the chiefs of podiatry at 107 medical centers, representing a combination of medical center complexity groups 1, 2, and 3. The survey consisted of questions designed to assess the self-reported relationship between PACT and Podiatry Service at each reporting medical center (Appendix).
Statistical Analysis
A group level analysis was performed between centers identifying themselves by having good or fair/poor communication between PACT and Podiatry. The Fisher exact test (2-sided) was used to assess for associations. Significance was set at P ≤ .05.
Results
The response rate for this survey was 54% (58/107). The Table describes the frequency of PCMH characteristics in good communicating and fair/poor communicating centers. Thirty-seven centers self-identified as having good communication between PACT and Podiatry, and 21 reported fair/poor communication (P = .015). Frequent bidirectional communication occurred in 68% of good communication centers and 10% in fair/poor communication centers (P < .001). There were no differences between good communicating centers and fair/poor communicating centers for having working care coordination agreements. In good communication centers, 69% of consults were appropriate at least 75% of the time compared with 40% of the time for fair/poor communication centers (P = .032). Active care coordination in most cases occurred in 53% of good communication centers vs 5% of fair/poor communication centers (P < .001).
In the survey, characteristics supported by the joint principles statement for developing a PCMH were assessed.3 Favorable characteristics included good communication between providers (PACT and Podiatry), a high percentage of consults considered appropriate (> 75%), and high levels of coordination. Unfavorable characteristics included poor communication between providers (PACT and Podiatry), low percentage of consults considered inappropriate (< 75%), and poor levels of communication. In the survey, 47% of good communicating centers had 1 or 2 favorable characteristics for a PCMH compared with 80% fair/poor communication centers that had 1 or 2 unfavorable characteristics (P = .025) (Figure 1).
Figure 2 describes the equivocal correlations that were found between fair or poor self-reported centers and high-functioning PACT/Podiatry services with:
- Presence of a signed CCA.
- Multiple positive or negative characteristics.
- Referrals tied to the CCA.
- Provision to convert to an e-consult.
- Face-to-face meetings to review the CCA.
Discussion
The key to high-functioning PACT/Podiatry teams rests with the quality of the communication between providers. Without this basic tenet, CCAs cannot be effective.
Conclusion
Self-reporting high-functioning PACT/Podiatry teams depend more on the relationships between providers, the ease of bidirectional communication and coordination of care, and a seemless consult and less on the formal care coordination documents and e-consults that reduce the direct exchanges between providers.
1. Arend J, Tsang-Quinn J, Levine C, Thomas D. The patient-centered medical home: history, components, and review of the evidence. Mt Sinai J Med. 2012;79(4):433-450.
2. Schoen, C, Osborn, R, Squires D, Doty MM, Pierson R, Applebaum S. How health insurance design affects access to care and costs by income, in eleven countries. Health Aff. 2010;29(12):2323;2334.
3. Bein B. AMA delegates adopt AAFP’s joint principles of patient-centered medical home. Ann Fam Med. 2009;7(1):86-87.
4. Kirschner, N, Greenlee, MC, The patient centered medical home neighbor: the interface of the patient centered medical home with specialty/subspecialty practices. Phildelphia, PA: American College of Physicians; 2010.
5. Nelson K, Sun H, Dolan E, et al. Elements of the patient-centered medical home associated with health outcomes among veterans: the role of primary care continuity, expanded access, and care coordination. J Ambul Care Manage. 2014;37(4):331-338.
6. Pogach L, Charns MP, Wrobel JS, et al. Impact of policies and performance measurement on development of organizational coordinating strategies for chronic care delivery. Am J Manag Care. 2014;10(2)(pt 2):171-180.
7. U.S. Department of Veteran Affairs. VHA Handbook 1101.10 PACT Handbook. Affairs, Washington DC: U.S. Department of Veterans Affairs; 2014.
8. Wrobel JS, Charns MP, Diehr P, et al. The relationship between provider coordination and diabetes-related foot outcomes. Diabetes Care. 2003;26(11):3042-3047.
9. Wrobel JS, Robbins JM, Charns MP, Bonacker KM, Reiber GE, Pogach L. Diabetes-related foot care at 10 Veterans Affairs medical centers: must do’s associated with successful microsystems. Jt Comm J Qual Patient Saf. 2006;32(4):206-213.
Integrating Palliative Care in COPD Treatment
The integration of palliative care in cancer care is an emerging trend driven by data on the benefits of palliative care intervention in the care of patients with terminal malignancies. Although studies have shown that patients with end-stage organ disease tend to develop similar symptoms and issues as those of cancer patients, the use of palliative care services among patients with end-stage organ disease seems to be limited.1 The clinical course of terminal malignancy is usually marked by a consistent decline, whereas organ failure is usually marked by periods of exacerbations in relation to decompensation.2 Patients with organ failure often exhibit a gradual and subtle decline over time, making it more challenging to predict the disease course.2
Woo and colleagues studied patients with chronic illnesses and showed that, similar to patients diagnosed with cancer, symptoms of fatigue, pain, and dyspnea were common.3 They also found that caregivers of patients with chronic illness reported suboptimal physical and emotional well-being as well as moderate levels of stress.3 These findings suggest that caregivers for cancer and noncancer patients will benefit from the support inherent in an interdisciplinary approach to palliative care.3 According to the CDC, the second leading cause of death in the U.S. in 2011 was cancer followed by chronic respiratory disease.4
The authors conducted a quality improvement (QI) initiative to explore the benefits of integrating palliative care in the care of patients with chronic obstructive pulmonary disease (COPD) and share outcomes of improved palliative care education at John D. Dingell VAMC (JDDVAMC) in Detroit, Michigan, for care of patients with COPD.
Background
Chronic obstructive pulmonary disease is a progressive, incurable lung disease.5 It also has been referred to as chronic bronchitis, emphysema, or chronic asthma.5 The degree of severity of COPD is determined by measuring the degree of air flow obstruction by conducting a spirometry test.5 Common symptoms associated with COPD include dyspnea, cough, wheezing, recurring respiratory infections, and generalized weakness.5
Compared with terminally ill patients with lung cancer, patients with COPD were found to have a poorer quality of life as well as more anxiety and depression.6 In a study to evaluate for breathlessness among patients with severe COPD and advanced cancer, Bausewein and colleagues found that both groups reported moderately distressing physical symptoms.7 Both groups also reported shortness of breath as their most distressing physical symptom and worrying as the most common psychological symptom.7 The study also identified a 50% commonality among the participants on palliative care needs.7
The common palliative care needs that were identified were the need for symptom management for breathlessness, access to information, ability to share feelings, a sense of wasted time, and assistance with practical matters.7 During the study’s 6-month data collection period, 61% of the patients with cancer and 10% of the patients with COPD died.7 Median survival for both groups showed that the patients with COPD had a significantly longer median survival of 589 days compared with 107 days for the patients with cancer.7
A retrospective review of patient records from 2010 to 2013 showed that providers referred only 5% of patients with COPD for palliative care.8 In the United Kingdom, the 5-year survival rate among patients diagnosed with severe COPD is 24% to 30%.9 Chronic obstructive pulmonary disease is one of the most common causes of hospital admissions, and treatments are aimed toward palliation of symptoms.9 As COPD reaches its end stage, incorporation of end-of-life (EOL) care should be considered. Signs that may indicate EOL care is needed include long-term oxygen therapy, depression, hospitalization for exacerbations at a rate of 2 or more a year, evidence of right-sided heart failure, cortisone treatment for > 6 weeks, and a history of noninvasive ventilation or admission to the intensive care unit (ICU).9
Nguyen and colleagues conducted a study in Montreal, Canada, among patients with moderate-to-severe COPD.10 The participants watched a DVD on EOL topics as well as life support measures and their implications.10 After watching the DVD, the researchers conducted interviews with the participants’ about their beliefs and experiences with regards to advance care planning.10 In conducting advance care planning, the participants identified having a relationship with the medical team and appropriate timing for the discussion as important.10
Crucial topics identified by participants included life expectancy, availability of medications to treat symptoms, different treatment options, stages of disease progression, and quality of EOL care.10 Other findings from the study included the participants’ desire to consider their families in the decision-making process.10 Becoming a burden to their families due to their need for physical and financial assistance and the inability to establish clear health care directives were identified as sources of concern.10 Many of the participants also shared a preference to die rather than to give up quality of life or mental capacity.10 Nguyen and colleagues also found that the severity of illness was not a good predictor of the participants’ readiness to engage in advance care planning.10
In Australia, a study conducted among bereaved and current caregivers for patients with severe COPD showed that > 20% of patients who had died of COPD required hands-on care by their caregivers.11 The caregivers also reported similar concerns as those patients with COPD, which included uncertainty about the future, fear of exacerbations, social isolation, and deteriorating health.11 They also reported competing emotions of loyalty, resentment, guilt, and exhaustion.11 Caregivers identified areas they felt could have improved their ability to provide care, such as availability of adaptive equipment, contingency plans for emergency situations, education on the illness, its symptoms and prognosis, and advance care planning information.11 The caregivers believed that receiving this information might have lessened their stress and plan for the future.11 Although most of the aspects of care that they identified as important are components of palliative care, most of the caregivers were unfamiliar with the term palliative care.11
QI Initiative
To improve palliative care education and use in the ICUs of the VA hospitals, the VHA conducted training, which was made available to intensive care providers on improving EOL care and communication. An attending physician in the ICU who also is a pulmonologist took part in this training in July 2013. To evaluate the outcome of this educational effort, the authors’ reviewed the palliative care referrals from 2012 to 2014.
Results
There were a total of 29 patients with COPD who were referred for palliative care services. Sixteen (55%) were referred by pulmonology. Medical oncology and primary care each referred 4 patients (14%). Acute care referred 5 patients (17%). Emergency department (ED) visits were compared 1 year prior with postpalliative care involvement in the patients’ care (Figure 1). The average ED visit for these patients prepalliative care was 3.2 days, and this dropped to 1.7 days postpalliative care involvement. Of the 29 patients, there were 7 who were never seen in the ED for symptoms of COPD prior to palliative care involvement in their care, and 17 who did not have ED visits after palliative care’s involvement in their care. Of the 29 patients, 3 had frequent visits to the ED (more than 10 days total) prepalliative care, and only 1 had frequent visits to the ED following involvement in the palliative care clinic.
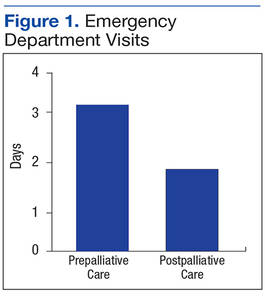
According to the JDDVAMC Managerial Cost Accounting Office (MCAO), the average cost to care for a patient who is presenting to the ED with symptoms related to COPD is $527. The cost of caring for the 22 patients who were seen at least once in the ED for symptoms related to their COPD would be $11,594. With palliative care involvement, only 12 of the 29 patients were seen in the ED for symptoms related to COPD for a total of $6,324, a savings of $5,270 for single ED visits for this set of patients.
Prior to palliative care involvement for the 29 patients, there were 27 admissions, which dropped to 15 admissions after palliative care involvement. According to the MCAO, the average cost to care for a patient who is admitted to the hospital due to an exacerbation of COPD is $20,944. With 27 admissions prior to palliative care involvement, the results total $565,488 compared with $314,160 for 15 admissions with palliative care involvement, showing a cost savings of $251,328.
Fourteen of the 29 patients had advance directive discussions, 9 of which were completed by assigning a durable power of attorney and/or completing a living will. There were 22 (76%) of the 29 patients who had code status discussions, and 18 (62%) elected not to be resuscitated (Figure 2). According to MCAO, the average cost to care for a patient in the ICU who required ventilator support for at least 96 hours is $102,175. For the 18 patients who decided not to pursue cardiopulmonary resuscitation, this results in a potential cost savings of $1,839,150.
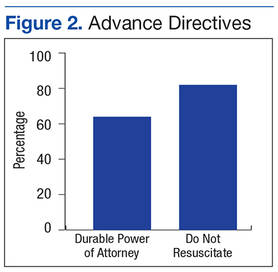
Conclusion
The outcome of this QI initiative is congruent with the findings published in the literature on the benefits of palliative care involvement in the care of patients with COPD. Palliative care involvement improved goals of care discussions and resulted in decreased ED visits. Palliative care educational outreach also seems to improve palliative care referrals.
In 2007, the American Thoracic Society issued a policy statement recommending that palliative care should be available at any stage during the course of a progressive or chronic respiratory disease or critical illness when the patient becomes symptomatic.12 Compared with patients with lung cancer, patients with COPD have to cope with symptom burden for a longer period. Breathlessness seems to be the most debilitating physical symptom for COPD and should trigger a palliative care referral.7 Comprehensive respiratory care similar to that for cancer care should be considered for severe COPD and should involve both the palliative care team and the pulmonary care teams for optimal results.
The results of this QI initiative also seem to support the potential benefits of palliative care involvement in the care of patients with other chronic illnesses that are expected to progress over time, leading to a shortened life expectancy.
1. Saini T, Murtagh FE, Dupont PJ, McKinnon PM, Hatfield P, Saunders Y. Comparative pilot study of symptoms and quality of life in cancer patients and patients with end stage renal disease. Palliat Med. 2006;20(6):631-636.
2. Lorenz KA, Lynn J, Dy SM, et al. Evidence for improving palliative care at end of life: a systematic review. Ann Intern Med. 2008;148(2):147-159.
3. Woo J, Lo R, Cheng JO, Wong F, Mak B. Quality of end-of-life care for non-cancer patients in a non-acute hospital. J Clin Nurs. 2011;20(13-14):1834-1841.
4. Hoyert DL, Xu JQ. Deaths: Preliminary Data for 2011. National Vital Statistics Reports. Vol 61. No 6. Hyattsville, MD: National Center for Health Statistics. 2012. Centers for Disease Control and Prevention website. http://www.cdc.gov/nchs/data/nvsr/nvsr61/nvsr61_06.pdf. Published October 10, 2012. Accessed July 1, 2016.
5. Barnett M. End of life issues in the management of COPD. J Comm Nurs. 2012; 26(3):4-8.
6. Fitzsimons D, Mullan D, Wilson JS, et al. The challenge of patients’ unmet palliative care needs in the final stages of chronic illness. Palliat Med. 2007;21(4):313-322.
7. Bausewein C, Booth S, Gysels M, Kühnbach R, Haberland B, Higginson IJ. Understanding breathlessness: cross-sectional comparison of symptom burden and palliative care needs in chronic obstructive pulmonary disease and cancer. J Palliat Med. 2010;13(9):1109-1118.
8. Schroedl C, Yount S, Szmullowicz E, Rosenberg SR, Kalhan R. Outpatient palliative care for chronic obstructive pulmonary disease: a case series. J Palliat Med. 2014;17(11):1256-1261.
9. Iley K. Improving palliative care for patients with COPD. Nurs Stand. 2012;26(37):40-46.
10. Nguyen M, Chamber-Evans J, Joubert A, Drouin I, Ouellet I. Exploring the advance care planning needs of moderately to severely ill people with COPD. Int J Palliat Nurs. 2013;19(8):389-395.
11. Philip J, Gold M, Brand C, Miller B, Douglass J, Sundararajan V. Facilitating change and adaptation: the experiences of current and bereaved carers of patients with severe chronic obstructive pulmonary disease. J Palliat Med. 2014;17(4):421-427.
12. Lanken PN, Terry PB, DeLisser HM, et al; American Thoracic Society End-of-Life Care Task Force. An official American Thoracic Society clinical policy statement: palliative care for patients with respiratory diseases and critical illness. Am J Respir Crit Care Med. 2008;177(8):912-927.
The integration of palliative care in cancer care is an emerging trend driven by data on the benefits of palliative care intervention in the care of patients with terminal malignancies. Although studies have shown that patients with end-stage organ disease tend to develop similar symptoms and issues as those of cancer patients, the use of palliative care services among patients with end-stage organ disease seems to be limited.1 The clinical course of terminal malignancy is usually marked by a consistent decline, whereas organ failure is usually marked by periods of exacerbations in relation to decompensation.2 Patients with organ failure often exhibit a gradual and subtle decline over time, making it more challenging to predict the disease course.2
Woo and colleagues studied patients with chronic illnesses and showed that, similar to patients diagnosed with cancer, symptoms of fatigue, pain, and dyspnea were common.3 They also found that caregivers of patients with chronic illness reported suboptimal physical and emotional well-being as well as moderate levels of stress.3 These findings suggest that caregivers for cancer and noncancer patients will benefit from the support inherent in an interdisciplinary approach to palliative care.3 According to the CDC, the second leading cause of death in the U.S. in 2011 was cancer followed by chronic respiratory disease.4
The authors conducted a quality improvement (QI) initiative to explore the benefits of integrating palliative care in the care of patients with chronic obstructive pulmonary disease (COPD) and share outcomes of improved palliative care education at John D. Dingell VAMC (JDDVAMC) in Detroit, Michigan, for care of patients with COPD.
Background
Chronic obstructive pulmonary disease is a progressive, incurable lung disease.5 It also has been referred to as chronic bronchitis, emphysema, or chronic asthma.5 The degree of severity of COPD is determined by measuring the degree of air flow obstruction by conducting a spirometry test.5 Common symptoms associated with COPD include dyspnea, cough, wheezing, recurring respiratory infections, and generalized weakness.5
Compared with terminally ill patients with lung cancer, patients with COPD were found to have a poorer quality of life as well as more anxiety and depression.6 In a study to evaluate for breathlessness among patients with severe COPD and advanced cancer, Bausewein and colleagues found that both groups reported moderately distressing physical symptoms.7 Both groups also reported shortness of breath as their most distressing physical symptom and worrying as the most common psychological symptom.7 The study also identified a 50% commonality among the participants on palliative care needs.7
The common palliative care needs that were identified were the need for symptom management for breathlessness, access to information, ability to share feelings, a sense of wasted time, and assistance with practical matters.7 During the study’s 6-month data collection period, 61% of the patients with cancer and 10% of the patients with COPD died.7 Median survival for both groups showed that the patients with COPD had a significantly longer median survival of 589 days compared with 107 days for the patients with cancer.7
A retrospective review of patient records from 2010 to 2013 showed that providers referred only 5% of patients with COPD for palliative care.8 In the United Kingdom, the 5-year survival rate among patients diagnosed with severe COPD is 24% to 30%.9 Chronic obstructive pulmonary disease is one of the most common causes of hospital admissions, and treatments are aimed toward palliation of symptoms.9 As COPD reaches its end stage, incorporation of end-of-life (EOL) care should be considered. Signs that may indicate EOL care is needed include long-term oxygen therapy, depression, hospitalization for exacerbations at a rate of 2 or more a year, evidence of right-sided heart failure, cortisone treatment for > 6 weeks, and a history of noninvasive ventilation or admission to the intensive care unit (ICU).9
Nguyen and colleagues conducted a study in Montreal, Canada, among patients with moderate-to-severe COPD.10 The participants watched a DVD on EOL topics as well as life support measures and their implications.10 After watching the DVD, the researchers conducted interviews with the participants’ about their beliefs and experiences with regards to advance care planning.10 In conducting advance care planning, the participants identified having a relationship with the medical team and appropriate timing for the discussion as important.10
Crucial topics identified by participants included life expectancy, availability of medications to treat symptoms, different treatment options, stages of disease progression, and quality of EOL care.10 Other findings from the study included the participants’ desire to consider their families in the decision-making process.10 Becoming a burden to their families due to their need for physical and financial assistance and the inability to establish clear health care directives were identified as sources of concern.10 Many of the participants also shared a preference to die rather than to give up quality of life or mental capacity.10 Nguyen and colleagues also found that the severity of illness was not a good predictor of the participants’ readiness to engage in advance care planning.10
In Australia, a study conducted among bereaved and current caregivers for patients with severe COPD showed that > 20% of patients who had died of COPD required hands-on care by their caregivers.11 The caregivers also reported similar concerns as those patients with COPD, which included uncertainty about the future, fear of exacerbations, social isolation, and deteriorating health.11 They also reported competing emotions of loyalty, resentment, guilt, and exhaustion.11 Caregivers identified areas they felt could have improved their ability to provide care, such as availability of adaptive equipment, contingency plans for emergency situations, education on the illness, its symptoms and prognosis, and advance care planning information.11 The caregivers believed that receiving this information might have lessened their stress and plan for the future.11 Although most of the aspects of care that they identified as important are components of palliative care, most of the caregivers were unfamiliar with the term palliative care.11
QI Initiative
To improve palliative care education and use in the ICUs of the VA hospitals, the VHA conducted training, which was made available to intensive care providers on improving EOL care and communication. An attending physician in the ICU who also is a pulmonologist took part in this training in July 2013. To evaluate the outcome of this educational effort, the authors’ reviewed the palliative care referrals from 2012 to 2014.
Results
There were a total of 29 patients with COPD who were referred for palliative care services. Sixteen (55%) were referred by pulmonology. Medical oncology and primary care each referred 4 patients (14%). Acute care referred 5 patients (17%). Emergency department (ED) visits were compared 1 year prior with postpalliative care involvement in the patients’ care (Figure 1). The average ED visit for these patients prepalliative care was 3.2 days, and this dropped to 1.7 days postpalliative care involvement. Of the 29 patients, there were 7 who were never seen in the ED for symptoms of COPD prior to palliative care involvement in their care, and 17 who did not have ED visits after palliative care’s involvement in their care. Of the 29 patients, 3 had frequent visits to the ED (more than 10 days total) prepalliative care, and only 1 had frequent visits to the ED following involvement in the palliative care clinic.
According to the JDDVAMC Managerial Cost Accounting Office (MCAO), the average cost to care for a patient who is presenting to the ED with symptoms related to COPD is $527. The cost of caring for the 22 patients who were seen at least once in the ED for symptoms related to their COPD would be $11,594. With palliative care involvement, only 12 of the 29 patients were seen in the ED for symptoms related to COPD for a total of $6,324, a savings of $5,270 for single ED visits for this set of patients.
Prior to palliative care involvement for the 29 patients, there were 27 admissions, which dropped to 15 admissions after palliative care involvement. According to the MCAO, the average cost to care for a patient who is admitted to the hospital due to an exacerbation of COPD is $20,944. With 27 admissions prior to palliative care involvement, the results total $565,488 compared with $314,160 for 15 admissions with palliative care involvement, showing a cost savings of $251,328.
Fourteen of the 29 patients had advance directive discussions, 9 of which were completed by assigning a durable power of attorney and/or completing a living will. There were 22 (76%) of the 29 patients who had code status discussions, and 18 (62%) elected not to be resuscitated (Figure 2). According to MCAO, the average cost to care for a patient in the ICU who required ventilator support for at least 96 hours is $102,175. For the 18 patients who decided not to pursue cardiopulmonary resuscitation, this results in a potential cost savings of $1,839,150.
Conclusion
The outcome of this QI initiative is congruent with the findings published in the literature on the benefits of palliative care involvement in the care of patients with COPD. Palliative care involvement improved goals of care discussions and resulted in decreased ED visits. Palliative care educational outreach also seems to improve palliative care referrals.
In 2007, the American Thoracic Society issued a policy statement recommending that palliative care should be available at any stage during the course of a progressive or chronic respiratory disease or critical illness when the patient becomes symptomatic.12 Compared with patients with lung cancer, patients with COPD have to cope with symptom burden for a longer period. Breathlessness seems to be the most debilitating physical symptom for COPD and should trigger a palliative care referral.7 Comprehensive respiratory care similar to that for cancer care should be considered for severe COPD and should involve both the palliative care team and the pulmonary care teams for optimal results.
The results of this QI initiative also seem to support the potential benefits of palliative care involvement in the care of patients with other chronic illnesses that are expected to progress over time, leading to a shortened life expectancy.
1. Saini T, Murtagh FE, Dupont PJ, McKinnon PM, Hatfield P, Saunders Y. Comparative pilot study of symptoms and quality of life in cancer patients and patients with end stage renal disease. Palliat Med. 2006;20(6):631-636.
2. Lorenz KA, Lynn J, Dy SM, et al. Evidence for improving palliative care at end of life: a systematic review. Ann Intern Med. 2008;148(2):147-159.
3. Woo J, Lo R, Cheng JO, Wong F, Mak B. Quality of end-of-life care for non-cancer patients in a non-acute hospital. J Clin Nurs. 2011;20(13-14):1834-1841.
4. Hoyert DL, Xu JQ. Deaths: Preliminary Data for 2011. National Vital Statistics Reports. Vol 61. No 6. Hyattsville, MD: National Center for Health Statistics. 2012. Centers for Disease Control and Prevention website. http://www.cdc.gov/nchs/data/nvsr/nvsr61/nvsr61_06.pdf. Published October 10, 2012. Accessed July 1, 2016.
5. Barnett M. End of life issues in the management of COPD. J Comm Nurs. 2012; 26(3):4-8.
6. Fitzsimons D, Mullan D, Wilson JS, et al. The challenge of patients’ unmet palliative care needs in the final stages of chronic illness. Palliat Med. 2007;21(4):313-322.
7. Bausewein C, Booth S, Gysels M, Kühnbach R, Haberland B, Higginson IJ. Understanding breathlessness: cross-sectional comparison of symptom burden and palliative care needs in chronic obstructive pulmonary disease and cancer. J Palliat Med. 2010;13(9):1109-1118.
8. Schroedl C, Yount S, Szmullowicz E, Rosenberg SR, Kalhan R. Outpatient palliative care for chronic obstructive pulmonary disease: a case series. J Palliat Med. 2014;17(11):1256-1261.
9. Iley K. Improving palliative care for patients with COPD. Nurs Stand. 2012;26(37):40-46.
10. Nguyen M, Chamber-Evans J, Joubert A, Drouin I, Ouellet I. Exploring the advance care planning needs of moderately to severely ill people with COPD. Int J Palliat Nurs. 2013;19(8):389-395.
11. Philip J, Gold M, Brand C, Miller B, Douglass J, Sundararajan V. Facilitating change and adaptation: the experiences of current and bereaved carers of patients with severe chronic obstructive pulmonary disease. J Palliat Med. 2014;17(4):421-427.
12. Lanken PN, Terry PB, DeLisser HM, et al; American Thoracic Society End-of-Life Care Task Force. An official American Thoracic Society clinical policy statement: palliative care for patients with respiratory diseases and critical illness. Am J Respir Crit Care Med. 2008;177(8):912-927.
Clinical and Sonographic Evaluation of Bicortical Button for Proximal Biceps Tenodesis
The long head of the biceps (LHB) tendon is a recognized source of shoulder pain. LHB tendon pathology is commonly associated with other shoulder conditions, such as superior labral tears, rotator cuff tears, or subacromial impingement, whereas isolated pathology, such as traumatic ruptures, tendinosis, or medial subluxation, is rare.1 Treatment of LHB pathology ranges from conservative measures to surgical measures, including tenotomy or tenodesis.2 LHB tenodesis offers the advantage of maintaining the length–tension relationship of the biceps muscle to prevent atrophy and avoid the Popeye deformity incurred from tenotomy alone. Tenodesis also prevents muscle cramping associated with contracted biceps muscle and better maintains elbow flexion and supination strength, which may be decreased with tenotomy.3 In addition, when a subpectoral biceps tenodesis technique is used, pain from LHB tendinopathy in the intertubercular groove may be reduced.4
Open subpectoral biceps tenodesis is a reproducible, efficient method for LHB tenodesis.4,5 A variety of fixation devices has been used: bone tunnels,6 keyhole fixation,7 suture anchors,6-9 and interference screws.6-8,10,11 More recently, a bicortical button has been used for LHB tendon tenodesis.12 Biomechanical studies have shown that load to failure is comparable for bicortical button fixation and interference screw fixation.13,14 In other models of tendon repair, the bicortical button has strength and stability comparable to those of interference screw fixation and enables earlier rehabilitation.15-17 However, there is concern that bicortical button fixation may result in axillary nerve (AN) or posterior circumflex humeral artery (PCHA) compromise because of the proximity of these neurovascular structures to the bicortical button.13,18-21
We conducted a study to functionally and sonographically assess the outcomes of patients who underwent open subpectoral biceps tenodesis with a bicortical button. Functional outcomes were assessed with patient-reported outcomes and physician-reported outcomes. Sonographic studies were used to evaluate the integrity of the tenodesis and determine the proximity of the button to the AN and the PCHA along the posterior proximal humerus.
Methods
After obtaining Institutional Review Board approval for this study, we retrospectively identified 28 consecutive patients who had proximal biceps tenodesis performed by a single surgeon (Dr. K.E. Swanson) using a mini-open subpectoral biceps tenodesis technique with a bicortical button between March 2011 and January 2013. All 28 patients were asked to participate in the study. Twenty-four (86%) agreed to complete 2 surgical outcome surveys, and 18 (64%) completed a 3-part clinical examination at minimum 12-month follow-up.
One of the surveys was Quick Disabilities of the Arm, Shoulder, and Hand (QuickDASH), a validated comprehensive disability survey that scores upper extremity functionality on a scale ranging from 0 (none) to 100 (extreme difficulty).22,23 The other survey scored pain on a scale ranging from 0 (none) to 100 (worst pain).
The clinical examination was completed during a single visit by an orthopedic surgeon (Dr. Meadows or Dr. Diesselhorst) different from the primary surgeon (Dr. K.E. Swanson) and by a clinician-sonologist (Dr. Finnoff). The examination’s 3 parts were physical examination of arm, biceps supination strength test, and ultrasonographic evaluation.
Physical Examination of Arm. Physical examination included palpation of bicipital groove, range of motion (ROM) of shoulder and elbow, and clinical deformity of biceps. Patients were questioned regarding symptoms of AN damage, including sensory and motor findings. Bicipital groove tenderness was assessed with a visual analog scale rating pain 0 to 10. ROM was measured in degrees and was presented as a percentage of full elbow ROM (150°) and full shoulder ROM (180°).
Biceps Supination Strength Test. Biceps supination strength was tested with a baseline hydraulic wrist dynamometer with door handle attachment. Patients were seated with the elbow bent 90° and the forearm in a neutral position. In a series of 3 trials, the patient maintained grip of the dynamometer doorknob while supinating the forearm. The tenodesed (operated) arm and contralateral unaffected (nonoperated) arm were tested in random order and recorded in pounds.
Ultrasonographic Evaluation. Ultrasonography was used to evaluate the tenodesis site. In each case, the biceps tendon was assessed to determine the location of the bicortical button in relation to the AN/PCHA neurovascular bundle. Whereas nerves are difficult to visualize with ultrasonography, arteries are readily seen. Dr. Finnoff used a CX50 ultrasound machine (Philips Medical Systems) with either a 12-3 MHz linear array or a 5-1 MHz curvilinear array transducer to measure the shortest distance from the PCHA to the button.
Each patient was placed in a lateral decubitus or prone position, and the skin of the upper arm was exposed. Tendon integrity was deemed either intact (continuity between biceps tendon and cortical button) or disrupted (lack of continuity between tendon and cortical button). The transducer was then placed in an anatomical sagittal plane over the posterior aspect of the proximal humerus. Power Doppler and cephalad and caudad transducer glides were used to identify the location of the PCHA. The transducer was then glided laterally and anteriorly around the humerus, following the course of the PCHA, until the cortical button was located. The narrowest interval between the PCHA and the cortical button was measured using the ultrasound machine’s software. A still image of each measurement was saved.
Surgical Technique
Biceps tenodesis indications included high-demand heavy laborers, athletes, and patients who preferred the cosmetic results of tenodesis over tenotomy. Most patients had acute symptomatic tears of the superior labrum with instability of the biceps anchor complex. Others had fraying and tenosynovitis of the LHB tendon. Any associated pathology was addressed during the same surgical period.
The surgical technique used was similar to that described by Snir and colleagues.12 Each patient was placed in the lateral decubitus position. Once pathology confirmed biceps tenodesis, the biceps tendon was tenotomized at the base of the superior labrum. A 3-cm incision was made along the axillary fold centered over the inferior border of the pectoralis major tendon. Blunt dissection was performed to define the inferior border of the pectoralis major tendon and to palpate the underlying biceps tendon as it exited the intertubercular groove. The LHB tendon was removed and prepared with No. 2 Fiberwire (Arthrex) in Krackow fashion starting 2 cm proximal to the musculotendinous junction. The excess tendon was excised.
A 3.2-mm guide wire was centered along the most distal aspect of the biceps groove and then drilled through the anterior cortex and just through the posterior cortex. A cannulated reamer, selected on the basis of the biceps tendon diameter (typically, 5-7 mm), was then drilled over the guide wire through the anterior cortex only. The Food and Drug Administration–approved cortical button (BicepsButton; Arthrex) was then loaded by passing the tendon suture ends through each side of the button in alternating fashion, thus allowing the button to slide along the sutures.
The button was loaded onto the BicepsButton deployment device and inserted through the drilled tunnel of the anterior cortex and just through the posterior cortex. The deployment device was then removed, and 1 suture end was pulled to allow the button to engage the posterior humeral cortex. Pulling on both sutures allowed the biceps tendon to slide through the anterior cortex hole of the humerus until the tendon reached the posterior humeral cortex. Tension was verified, and the sutures were tied over the tendon. The wound was then irrigated and closed.
Rehabilitation Program
Patients completed a standard rehabilitation protocol for biceps tenodesis24 along with rehabilitation protocols for any additional procedures performed. In phase 1 (weeks 0-2), they focused on gradual restoration of passive ROM and remained in a sling. In phase 2 (weeks 2-6), they focused on gradual restoration of active ROM, and by week 3 were weaned out of the sling. In phase 3 (weeks 6-8), they continued ROM and strengthening exercises to normalize strength, endurance, and neuromuscular control. In phase 4 (weeks 8-12), they focused on advanced strengthening exercises and return to activities.
Statistical Analysis
Descriptive statistics included means, medians, and SDs. Comparisons between operated and nonoperated arms and between dominant and nondominant arms were performed by a statistician using paired t tests with P = .05. Confidence intervals were calculated for operated and nonoperated arms and for dominant and nondominant arms by using the differences between them.
Results
Functional Outcomes
Surgical outcome scores and pain scores were obtained from 24 patients (86%) at minimum 12-month follow-up. Mean (SD) DASH score was 15.15 (17.6; median, 9), and mean (median) pain score was 12.61 (7).
Eighteen patients (64%) completed the clinical examination: 16 men (88.9%) and 2 women (11.1%). Mean age was 48.3 years (age range, 33-59 years). Of these 18 patients, 9 (50%) had surgery on the dominant arm, and the other 9 had surgery on the nondominant arm. All patients were right-hand–dominant. In 3 patients, biceps tenodesis was performed with only minimal arthroscopic débridement (20%); in the other 15, biceps tenodesis was performed concomitantly with 1 or more additional arthroscopic procedures: acromioplasty (73%), rotator cuff repair (47%), distal clavicle resection (33%), subacromial bursectomy (13%), microfracture of glenoid (13%), and posterior labral repair (7%).
The clinical examination was performed a mean of 15.2 months (range, 12-26 months) after surgery. Physical examination findings are listed in Table 1.
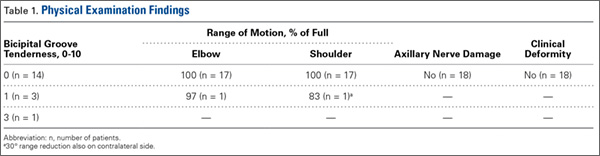
Forearm supination strength, averaged from 3 trials on each arm, was significantly (P = .01) greater in the nonoperated arm than in the operated arm (Table 2, Figure 1). A 95% confidence interval for the mean (SD) difference in strength was 9.35 (7.76) pounds, meaning that on average, the nonoperated arm will be 1.59 to 17.11 pounds stronger than the operated arm. In addition, strength of the dominant arm was greater than that of the nondominant arm (P = .05) regardless of which arm underwent surgery (Table 2, Figure 1). However, the mean (SD) difference in strength was 6.94 (8.39) pounds, indicating the observed difference was not statistically significant.
![]()
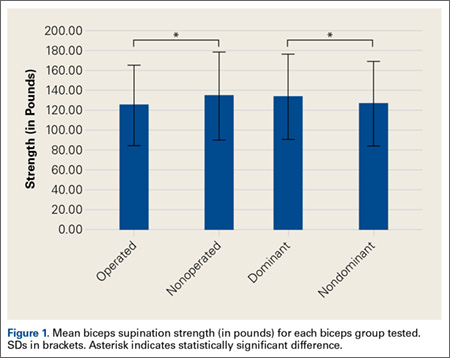
Sonographic Evaluation
According to the sonographic evaluations, the tenodesis was intact in all 18 patients (Figure 2). Estimated mean (SD) distance from button to PCHA was 18.17 (9.0) mm (median, 16.1 mm; range, 9.4-48 mm) (Figure 2, Figure 3). No patient indicated any symptoms of AN damage.

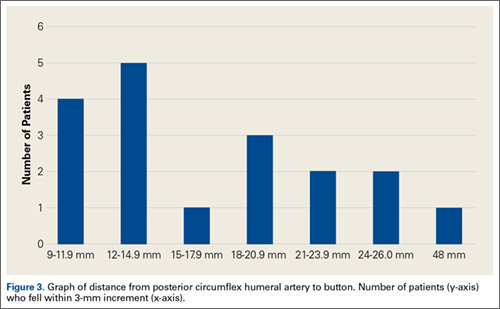
Discussion
There are few studies of functional outcomes of biceps tenodesis. Pain is a common measure of patient satisfaction. Mazzocca and colleagues25 reported a mean follow-up pain score of 1.1 (range, 0.5-1.9) out of 10 for a group of 41 patients who had subpectoral tenodesis with an interference screw. Millett and colleagues26 reported a mean postoperative pain score of 2.5 out of 10 for patients who had subpectoral interference screw fixation. Our patients reported a mean pain score of 12.6 out of 100 after minimum 12-month follow-up. We also assessed for pain in the intertubercular groove during palpation. Although some studies have shown that groove pain was eliminated by subpectoral biceps tenodesis,5 3 patients in our study had pain on groove palpation. The cause of this residual pain is unclear, but some studies have suggested a chronic degenerative pathologic process that occurs while the tendon is within the biceps groove.27 Removing the tendon from the groove may not remove the underlying cause of pain.
Our patients’ mean DASH score was 15.15 (within the excellent range). Normative mean (SD) DASH score for the general population is 10.1 (14.68).28
Functional strength of forearm supination, shoulder ROM, and elbow ROM are objective measures of patient performance after fixation. On Cybex testing, Phillips and colleagues29 found no difference in forearm supination strength or elbow flexion (compared with contralateral arm) after biceps tenodesis or conservative treatment for proximal biceps ruptures. Shank and colleagues30 compared elbow flexion and supination strength of the affected and unaffected arms after suture anchor subpectoral biceps tenodesis. There was no significant difference in Cybex results, but there was a 14% to 15% loss of average strength in the tenodesed versus nonsurgical arm. In the present study, we found a significant difference in forearm supination strength between the operated and nonoperated arms, but with only a 7% loss of average strength in the operated arms. The difference in strength ranged from 1.59 to 17.11 pounds, which may not be clinically significant, as supination strength ranged from 60 to 270 pounds.
Of the 18 patients in this study, 9 had surgery on the dominant arm, and the other 9 had surgery on the nondominant arm. Examining the effect of arm dominance on results revealed that patients with surgery on the nondominant arm tended to have substantially reduced supination strength in that arm vs the dominant arm. There was an 11% loss of average strength for nondominant vs dominant arms that had surgery. Examining nondominant arms only revealed a 13% loss of strength for operated vs nonoperated arms. There was no difference in forearm supination strengths between nonoperated arms (dominant vs nondominant) or between dominant arms (operated vs nonoperated). This suggests that, though hand dominance may not play a significant role in control patients’ forearm supination strength,30 it may have a substantial effect on surgical patients’ ability to regain strength when the nondominant arm is the surgical arm. One objective of this study was to measure the distance between the biceps cortical button on the posterior humeral cortex and the AN/PCHA neurovascular bundle. The AN bundles with the PCHA posterior to the humeral neck.31-33 As the AN travels with the PCHA, and the PCHA has been reliably identified with Doppler ultrasonography,34-36 the PCHA was used as a marker for the AN in this study. Our bicortical button technique places the button on the posterior aspect of the humerus, making AN and PCHA the nearest at-risk neurovascular structures. None of our patients had symptoms of AN damage. However, 2 patients indicated pain in the posterior aspect of the humerus during deltoid activation. Distance from the neurovascular structures to the button was 48 mm in one patient and 13.6 mm in the other. DASH scores were 43 and 27, respectively. Both patients’ 1-year pain score was 30. The first patient underwent arthroscopic acromioplasty, distal clavicle resection, and microfracture of the glenoid surface in addition to the subpectoral biceps tenodesis; the second underwent subacromial decompression and distal clavicle resection in addition to the subpectoral biceps tenodesis. Whether the associated pathology contributed to their persistent pain is unknown. However, given the distance from AN/PCHA to button, it is unlikely that their pain was a result of neurovascular compromise from the procedure.
Advantages of the cortical button include the ability to drill a smaller hole in the humerus for fixation, compared with the hole drilled for an interference screw. Despite the biomechanical strength of the screw, large (8 mm) cortical violations have been associated with increased fracture risk of the proximal humerus.37,38 The tendon may experience less trauma than that caused by being twisted against an interference screw, the most common location of failure of which is the tendon–screw interface.39 In addition, tendon healing may be improved through circumferential healing in the cortical button tunnel.
A concern of using a bicortical button for fixation is drilling through the posterior cortex, because of the proximity of the posterior neurovascular structures. In a case in which the posterior cord was injured, Rhee and colleagues40 used a suture pullout technique whereby a Beath pin was passed out of the posterior humerus and soft tissues to then hold tension on the biceps tendon during the tenodesis. The radial nerve potentially could have been injured by pin overpenetration or by becoming wrapped up in the soft tissues as the pin was spinning through them. In our technique, the posterior humeral cortex is drilled cautiously to avoid overpenetration and possibly getting the posterior soft tissues wrapped up in the guide pin. No AN injuries have been reported with this technique. Mean distance from AN to posterior cortical button in this study was 18.17 mm. In 2 cadaver studies of bicortical drilling for subpectoral biceps tenodesis, the ANs were 25.1 mm and 36.7 mm from the posterior drill hole.41,21
Limitations of this study included its design (case series) and limited number of follow-up patients. Of the 28 consecutive patients identified for the study, 10 did not undergo the clinical examination, as they either lived more than 3 hours away (8 patients) or could not be contacted (2 patients). Another study limitation was the inability to directly image ANs with ultrasound. Therefore, measurements of the distance from the PCHA to the button were used to estimate the distance from the AN/PCHA neurovascular bundle to the button.
In this study, functional outcomes were excellent, and there were no tenodesis failures or neurovascular complications. These preliminary findings indicate that subpectoral biceps tenodesis with a bicortical button is a viable treatment option for patients with the appropriate indications for this procedure.
1. Khazzam M, George MS, Churchill RS, Kuhn JE. Disorders of the long head of biceps tendon. J Shoulder Elbow Surg. 2012;21(1):136-145.
2. Geaney LE, Mazzocca AD. Biceps brachii tendon ruptures: a review of diagnosis and treatment of proximal and distal biceps tendon ruptures. Phys Sportsmed. 2010;38(2):117-125.
3. Kelly AM, Drakos MC, Fealy S, Taylor SA, O’Brien SJ. Arthroscopic release of the long head of the biceps tendon: functional outcome and clinical results. Am J Sports Med. 2005;33(2):208-213.
4. Provencher MT, LeClere LE, Romeo AA. Subpectoral biceps tenodesis. Sports Med Arthrosc Rev. 2008;16(3):170-176.
5. Nho SJ, Reiff SN, Verma NN, Slabaugh MA, Mazzocca AD, Romeo AA. Complications associated with subpectoral biceps tenodesis: low rates of incidence following surgery. J Shoulder Elbow Surg. 2010;19(5):764-768.
6. Mazzocca AD, Bicos J, Santangelo S, Romeo AA, Arciero RA. The biomechanical evaluation of four fixation techniques for proximal biceps tenodesis. Arthroscopy. 2005;21(11):1296-1306.
7. Ozalay, M, Akpinar S, Karaeminogullari O, et al. Mechanical strength of four different biceps tenodesis techniques. Arthroscopy. 2005;21(8):992-998.
8. Golish RS, Caldwell PE, Miller MD, et al. Interference screw versus suture anchor fixation for subpectoral tenodesis of the proximal biceps tendon: a cadaveric study. Arthroscopy. 2008;24(10):1103-1108.
9. Richards DP, Burkhart SS. A biomechanical analysis of two biceps tenodesis fixation techniques. Arthroscopy. 2005;21(7):861-866.
10. Mazzocca AD, Rios CG, Romeo AA, Arciero RA. Subpectoral biceps tenodesis with interference screw fixation. Arthroscopy. 2005;21(7):896.
11. Wolf RS, Zheng N, Weichel D. Long head biceps tenotomy versus tenodesis: a cadaveric biomechanical analysis. Arthroscopy. 2005;21(2):182-185.
12. Snir N, Hamula M, Wolfson T, Laible C, Sherman O. Long head of the biceps tenodesis with cortical button technique. Arthrosc Tech. 2013;2(2):e95-e97.
13. Arora AS, Singh A, Koonce RC. Biomechanical evaluation of a unicortical button versus interference screw for subpectoral biceps tenodesis. Arthroscopy. 2013;29(4):638-644.
14. Buchholz A, Martetschläger F, Siebenlist S, et al. Biomechanical comparison of intramedullary cortical button fixation and interference screw technique for subpectoral biceps tenodesis. Arthroscopy. 2013;29(5):845-853.
15. Bain GI, Prem H, Heptinstall RJ, Verhellen R, Paix D. Repair of distal biceps tendon rupture: a new technique using the Endobutton. J Shoulder Elbow Surg. 2000;9(2):120-126.
16. Greenberg JA. Endobutton repair of distal biceps tendon ruptures. J Hand Surg Am. 2009;34(8):1541-1548.
17. Heinzelmann AD, Savoie FH 3rd, Ramsey JR, Field LD, Mazzocca AD. A combined technique for distal biceps repair using a soft tissue button and biotenodesis interference screw. Am J Sports Med. 2009;37(5):989-994.
18. DeAngelis JP, Chen A, Wexler M, et al. Biomechanical characterization of unicortical button fixation: a novel technique for proximal subpectoral biceps tenodesis. Knee Surg Sports Traumatol Arthrosc. 2015;23(5):1434-1441.
19. Dickens JF, Kilcoyne KG, Tintle SM, Giuliani J, Schaefer RA, Rue JP. Subpectoral biceps tenodesis: an anatomic study and evaluation of at-risk structures. Am J Sports Med. 2012;40(10):2337-2341.
20. Sethi PM, Rajaram A, Beitzel K, Hackett TR, Chowaniec DM, Mazzocca AD. Biomechanical performance of subpectoral biceps tenodesis: a comparison of interference screw fixation, cortical button fixation, and interference screw diameter. J Shoulder Elbow Surg. 2013;22(4):451-457.
21. Sethi PM, Vadasdi K, Greene RT, Vitale MA, Duong M, Miller SR. Safety of open suprapectoral and subpectoral biceps tenodesis: an anatomic assessment of risk for neurologic injury. J Shoulder Elbow Surg. 2015;24(1):138-142.
22. Gummesson C, Ward MM, Atroshi I. The shortened Disabilities of the Arm, Shoulder and Hand questionnaire (QuickDASH): validity and reliability based on responses within the full-length DASH. BMC Musculoskelet Disord. 2006;7:44.
23. Schmidt CC, Brown BT, Sawardeker PJ, DeGravelle M Jr, Miller MC. Factors affecting supination strength after a distal biceps rupture. J Shoulder Elbow Surg. 2014;23(1):68-75.
24. Brotzman SB, Wilk KE, eds. Handbook of Orthopaedic Rehabilitation. Philadelphia, PA: Mosby Elsevier; 2007.
25. Mazzocca AD, Cote MP, Arciero CL, Romeo AA, Arciero RA. Clinical outcomes after subpectoral biceps tenodesis with an interference screw. Am J Sports Med. 2008;36(10):1922-1929.
26. Millett PJ, Snaders B, Gobezie R, Braun S, Warner JP. Interference screw versus suture anchor fixation for open subpectoral biceps tenodesis: does it matter? BMC Musculoskelet Disord. 2008;9(121):1-6.
27. Streit JJ, Shishani Y, Rodgers M, Gobezie R. Tendinopathy of the long head of the biceps tendon: histopathologic analysis of the extra-articular biceps tendon and tenosynovium. Open Access J Sports Med. 2015;6:63-70.
28. Hunsaker FG, Cioffi DA, Amadio PC, Wright JG, Caughlin B. The American Academy of Orthopaedic Surgeons outcomes instruments: normative values from the general population. J Bone Joint Surg Am. 2002;84(2):208-215.
29. Phillips BB, Canale ST, Sisk TD, Stralka SW, Wyatt KP. Rupture of the proximal biceps tendon in middle-aged patients. Orthop Rev. 1993;22(3):349-353.
30. Shank JR, Singleton SB, Braun S, et al. A comparison of forearm supination and elbow flexion strength in patients with long head of the biceps tenotomy or tenodesis. Arthroscopy. 2011;27(1):9-16.
31. Apaydin N, Tubbs RS, Loukas M, Duparc F. Review of the surgical anatomy of the axillary nerve and the anatomic basis of its iatrogenic and traumatic injury. Surg Radiol Anat. 2010;32(3):193-201.
32. Johnson D. Pectoral girdle and upper limp. In: Standring S, ed. Gray’s Anatomy. 40th ed. New York, NY: Elsevier; 2008:814-821.
33. Tubbs RS, Tyler-Kabara EC, Aikens AC, et al. Surgical anatomy of the axillary nerve within the quadrangular space. J Neurosurg. 2005;102(5):912-914.
34. Kim YA, Yoon KB, Kwon TD, Kim DH, Yoon DM. Evaluation of anatomic landmarks for axillary nerve block in the quadrilateral space. Acta Anaesthesiol Scand. 2014;58(5):567-571.
35. Robinson DJ, Marks P, Schneider-Kolsky ME. Ultrasound of the posterior circumflex humeral artery. J Med Imaging Radiat Oncol. 2010;54(3):219-223.
36. Rothe C, Asghar S, Andersen HL, Christensen JK, Lange KH. Ultrasound-guided block of the axillary nerve: a volunteer study of a new method. Acta Anaesthesiol Scand. 2011;55(5):565-570.
37. Reiff SN, Nho SJ, Romeo AA. Proximal humerus fracture after keyhole biceps tenodesis. Am J Orthop. 2010;39(7):E61-E63.
38. Sears BW, Spencer EE, Getz CL. Humeral fracture following subpectoral biceps tenodesis in 2 active, healthy patients. J Shoulder Elbow Surg. 2011;20(6):e7-e11.
39. Koch BS, Burks RT. Failure of biceps tenodesis with interference screw fixation. Arthroscopy. 2012;28(5):735-740.
40. Rhee PC, Spinner RJ, Bishop AT, Shin AY. Iatrogenic brachial plexus injuries associated with open subpectoral biceps tenodesis. Am J Sports Med. 2013;41(9):2048-2053.
41. Ding DY, Gupta A, Snir N, Wolfson T, Meislin RJ. Nerve proximity during bicortical drilling for subpectoral biceps tenodesis: a cadaveric study. Arthroscopy. 2014;30(8):942-946.
The long head of the biceps (LHB) tendon is a recognized source of shoulder pain. LHB tendon pathology is commonly associated with other shoulder conditions, such as superior labral tears, rotator cuff tears, or subacromial impingement, whereas isolated pathology, such as traumatic ruptures, tendinosis, or medial subluxation, is rare.1 Treatment of LHB pathology ranges from conservative measures to surgical measures, including tenotomy or tenodesis.2 LHB tenodesis offers the advantage of maintaining the length–tension relationship of the biceps muscle to prevent atrophy and avoid the Popeye deformity incurred from tenotomy alone. Tenodesis also prevents muscle cramping associated with contracted biceps muscle and better maintains elbow flexion and supination strength, which may be decreased with tenotomy.3 In addition, when a subpectoral biceps tenodesis technique is used, pain from LHB tendinopathy in the intertubercular groove may be reduced.4
Open subpectoral biceps tenodesis is a reproducible, efficient method for LHB tenodesis.4,5 A variety of fixation devices has been used: bone tunnels,6 keyhole fixation,7 suture anchors,6-9 and interference screws.6-8,10,11 More recently, a bicortical button has been used for LHB tendon tenodesis.12 Biomechanical studies have shown that load to failure is comparable for bicortical button fixation and interference screw fixation.13,14 In other models of tendon repair, the bicortical button has strength and stability comparable to those of interference screw fixation and enables earlier rehabilitation.15-17 However, there is concern that bicortical button fixation may result in axillary nerve (AN) or posterior circumflex humeral artery (PCHA) compromise because of the proximity of these neurovascular structures to the bicortical button.13,18-21
We conducted a study to functionally and sonographically assess the outcomes of patients who underwent open subpectoral biceps tenodesis with a bicortical button. Functional outcomes were assessed with patient-reported outcomes and physician-reported outcomes. Sonographic studies were used to evaluate the integrity of the tenodesis and determine the proximity of the button to the AN and the PCHA along the posterior proximal humerus.
Methods
After obtaining Institutional Review Board approval for this study, we retrospectively identified 28 consecutive patients who had proximal biceps tenodesis performed by a single surgeon (Dr. K.E. Swanson) using a mini-open subpectoral biceps tenodesis technique with a bicortical button between March 2011 and January 2013. All 28 patients were asked to participate in the study. Twenty-four (86%) agreed to complete 2 surgical outcome surveys, and 18 (64%) completed a 3-part clinical examination at minimum 12-month follow-up.
One of the surveys was Quick Disabilities of the Arm, Shoulder, and Hand (QuickDASH), a validated comprehensive disability survey that scores upper extremity functionality on a scale ranging from 0 (none) to 100 (extreme difficulty).22,23 The other survey scored pain on a scale ranging from 0 (none) to 100 (worst pain).
The clinical examination was completed during a single visit by an orthopedic surgeon (Dr. Meadows or Dr. Diesselhorst) different from the primary surgeon (Dr. K.E. Swanson) and by a clinician-sonologist (Dr. Finnoff). The examination’s 3 parts were physical examination of arm, biceps supination strength test, and ultrasonographic evaluation.
Physical Examination of Arm. Physical examination included palpation of bicipital groove, range of motion (ROM) of shoulder and elbow, and clinical deformity of biceps. Patients were questioned regarding symptoms of AN damage, including sensory and motor findings. Bicipital groove tenderness was assessed with a visual analog scale rating pain 0 to 10. ROM was measured in degrees and was presented as a percentage of full elbow ROM (150°) and full shoulder ROM (180°).
Biceps Supination Strength Test. Biceps supination strength was tested with a baseline hydraulic wrist dynamometer with door handle attachment. Patients were seated with the elbow bent 90° and the forearm in a neutral position. In a series of 3 trials, the patient maintained grip of the dynamometer doorknob while supinating the forearm. The tenodesed (operated) arm and contralateral unaffected (nonoperated) arm were tested in random order and recorded in pounds.
Ultrasonographic Evaluation. Ultrasonography was used to evaluate the tenodesis site. In each case, the biceps tendon was assessed to determine the location of the bicortical button in relation to the AN/PCHA neurovascular bundle. Whereas nerves are difficult to visualize with ultrasonography, arteries are readily seen. Dr. Finnoff used a CX50 ultrasound machine (Philips Medical Systems) with either a 12-3 MHz linear array or a 5-1 MHz curvilinear array transducer to measure the shortest distance from the PCHA to the button.
Each patient was placed in a lateral decubitus or prone position, and the skin of the upper arm was exposed. Tendon integrity was deemed either intact (continuity between biceps tendon and cortical button) or disrupted (lack of continuity between tendon and cortical button). The transducer was then placed in an anatomical sagittal plane over the posterior aspect of the proximal humerus. Power Doppler and cephalad and caudad transducer glides were used to identify the location of the PCHA. The transducer was then glided laterally and anteriorly around the humerus, following the course of the PCHA, until the cortical button was located. The narrowest interval between the PCHA and the cortical button was measured using the ultrasound machine’s software. A still image of each measurement was saved.
Surgical Technique
Biceps tenodesis indications included high-demand heavy laborers, athletes, and patients who preferred the cosmetic results of tenodesis over tenotomy. Most patients had acute symptomatic tears of the superior labrum with instability of the biceps anchor complex. Others had fraying and tenosynovitis of the LHB tendon. Any associated pathology was addressed during the same surgical period.
The surgical technique used was similar to that described by Snir and colleagues.12 Each patient was placed in the lateral decubitus position. Once pathology confirmed biceps tenodesis, the biceps tendon was tenotomized at the base of the superior labrum. A 3-cm incision was made along the axillary fold centered over the inferior border of the pectoralis major tendon. Blunt dissection was performed to define the inferior border of the pectoralis major tendon and to palpate the underlying biceps tendon as it exited the intertubercular groove. The LHB tendon was removed and prepared with No. 2 Fiberwire (Arthrex) in Krackow fashion starting 2 cm proximal to the musculotendinous junction. The excess tendon was excised.
A 3.2-mm guide wire was centered along the most distal aspect of the biceps groove and then drilled through the anterior cortex and just through the posterior cortex. A cannulated reamer, selected on the basis of the biceps tendon diameter (typically, 5-7 mm), was then drilled over the guide wire through the anterior cortex only. The Food and Drug Administration–approved cortical button (BicepsButton; Arthrex) was then loaded by passing the tendon suture ends through each side of the button in alternating fashion, thus allowing the button to slide along the sutures.
The button was loaded onto the BicepsButton deployment device and inserted through the drilled tunnel of the anterior cortex and just through the posterior cortex. The deployment device was then removed, and 1 suture end was pulled to allow the button to engage the posterior humeral cortex. Pulling on both sutures allowed the biceps tendon to slide through the anterior cortex hole of the humerus until the tendon reached the posterior humeral cortex. Tension was verified, and the sutures were tied over the tendon. The wound was then irrigated and closed.
Rehabilitation Program
Patients completed a standard rehabilitation protocol for biceps tenodesis24 along with rehabilitation protocols for any additional procedures performed. In phase 1 (weeks 0-2), they focused on gradual restoration of passive ROM and remained in a sling. In phase 2 (weeks 2-6), they focused on gradual restoration of active ROM, and by week 3 were weaned out of the sling. In phase 3 (weeks 6-8), they continued ROM and strengthening exercises to normalize strength, endurance, and neuromuscular control. In phase 4 (weeks 8-12), they focused on advanced strengthening exercises and return to activities.
Statistical Analysis
Descriptive statistics included means, medians, and SDs. Comparisons between operated and nonoperated arms and between dominant and nondominant arms were performed by a statistician using paired t tests with P = .05. Confidence intervals were calculated for operated and nonoperated arms and for dominant and nondominant arms by using the differences between them.
Results
Functional Outcomes
Surgical outcome scores and pain scores were obtained from 24 patients (86%) at minimum 12-month follow-up. Mean (SD) DASH score was 15.15 (17.6; median, 9), and mean (median) pain score was 12.61 (7).
Eighteen patients (64%) completed the clinical examination: 16 men (88.9%) and 2 women (11.1%). Mean age was 48.3 years (age range, 33-59 years). Of these 18 patients, 9 (50%) had surgery on the dominant arm, and the other 9 had surgery on the nondominant arm. All patients were right-hand–dominant. In 3 patients, biceps tenodesis was performed with only minimal arthroscopic débridement (20%); in the other 15, biceps tenodesis was performed concomitantly with 1 or more additional arthroscopic procedures: acromioplasty (73%), rotator cuff repair (47%), distal clavicle resection (33%), subacromial bursectomy (13%), microfracture of glenoid (13%), and posterior labral repair (7%).
The clinical examination was performed a mean of 15.2 months (range, 12-26 months) after surgery. Physical examination findings are listed in Table 1.
Forearm supination strength, averaged from 3 trials on each arm, was significantly (P = .01) greater in the nonoperated arm than in the operated arm (Table 2, Figure 1). A 95% confidence interval for the mean (SD) difference in strength was 9.35 (7.76) pounds, meaning that on average, the nonoperated arm will be 1.59 to 17.11 pounds stronger than the operated arm. In addition, strength of the dominant arm was greater than that of the nondominant arm (P = .05) regardless of which arm underwent surgery (Table 2, Figure 1). However, the mean (SD) difference in strength was 6.94 (8.39) pounds, indicating the observed difference was not statistically significant.
![]()
Sonographic Evaluation
According to the sonographic evaluations, the tenodesis was intact in all 18 patients (Figure 2). Estimated mean (SD) distance from button to PCHA was 18.17 (9.0) mm (median, 16.1 mm; range, 9.4-48 mm) (Figure 2, Figure 3). No patient indicated any symptoms of AN damage.
Discussion
There are few studies of functional outcomes of biceps tenodesis. Pain is a common measure of patient satisfaction. Mazzocca and colleagues25 reported a mean follow-up pain score of 1.1 (range, 0.5-1.9) out of 10 for a group of 41 patients who had subpectoral tenodesis with an interference screw. Millett and colleagues26 reported a mean postoperative pain score of 2.5 out of 10 for patients who had subpectoral interference screw fixation. Our patients reported a mean pain score of 12.6 out of 100 after minimum 12-month follow-up. We also assessed for pain in the intertubercular groove during palpation. Although some studies have shown that groove pain was eliminated by subpectoral biceps tenodesis,5 3 patients in our study had pain on groove palpation. The cause of this residual pain is unclear, but some studies have suggested a chronic degenerative pathologic process that occurs while the tendon is within the biceps groove.27 Removing the tendon from the groove may not remove the underlying cause of pain.
Our patients’ mean DASH score was 15.15 (within the excellent range). Normative mean (SD) DASH score for the general population is 10.1 (14.68).28
Functional strength of forearm supination, shoulder ROM, and elbow ROM are objective measures of patient performance after fixation. On Cybex testing, Phillips and colleagues29 found no difference in forearm supination strength or elbow flexion (compared with contralateral arm) after biceps tenodesis or conservative treatment for proximal biceps ruptures. Shank and colleagues30 compared elbow flexion and supination strength of the affected and unaffected arms after suture anchor subpectoral biceps tenodesis. There was no significant difference in Cybex results, but there was a 14% to 15% loss of average strength in the tenodesed versus nonsurgical arm. In the present study, we found a significant difference in forearm supination strength between the operated and nonoperated arms, but with only a 7% loss of average strength in the operated arms. The difference in strength ranged from 1.59 to 17.11 pounds, which may not be clinically significant, as supination strength ranged from 60 to 270 pounds.
Of the 18 patients in this study, 9 had surgery on the dominant arm, and the other 9 had surgery on the nondominant arm. Examining the effect of arm dominance on results revealed that patients with surgery on the nondominant arm tended to have substantially reduced supination strength in that arm vs the dominant arm. There was an 11% loss of average strength for nondominant vs dominant arms that had surgery. Examining nondominant arms only revealed a 13% loss of strength for operated vs nonoperated arms. There was no difference in forearm supination strengths between nonoperated arms (dominant vs nondominant) or between dominant arms (operated vs nonoperated). This suggests that, though hand dominance may not play a significant role in control patients’ forearm supination strength,30 it may have a substantial effect on surgical patients’ ability to regain strength when the nondominant arm is the surgical arm. One objective of this study was to measure the distance between the biceps cortical button on the posterior humeral cortex and the AN/PCHA neurovascular bundle. The AN bundles with the PCHA posterior to the humeral neck.31-33 As the AN travels with the PCHA, and the PCHA has been reliably identified with Doppler ultrasonography,34-36 the PCHA was used as a marker for the AN in this study. Our bicortical button technique places the button on the posterior aspect of the humerus, making AN and PCHA the nearest at-risk neurovascular structures. None of our patients had symptoms of AN damage. However, 2 patients indicated pain in the posterior aspect of the humerus during deltoid activation. Distance from the neurovascular structures to the button was 48 mm in one patient and 13.6 mm in the other. DASH scores were 43 and 27, respectively. Both patients’ 1-year pain score was 30. The first patient underwent arthroscopic acromioplasty, distal clavicle resection, and microfracture of the glenoid surface in addition to the subpectoral biceps tenodesis; the second underwent subacromial decompression and distal clavicle resection in addition to the subpectoral biceps tenodesis. Whether the associated pathology contributed to their persistent pain is unknown. However, given the distance from AN/PCHA to button, it is unlikely that their pain was a result of neurovascular compromise from the procedure.
Advantages of the cortical button include the ability to drill a smaller hole in the humerus for fixation, compared with the hole drilled for an interference screw. Despite the biomechanical strength of the screw, large (8 mm) cortical violations have been associated with increased fracture risk of the proximal humerus.37,38 The tendon may experience less trauma than that caused by being twisted against an interference screw, the most common location of failure of which is the tendon–screw interface.39 In addition, tendon healing may be improved through circumferential healing in the cortical button tunnel.
A concern of using a bicortical button for fixation is drilling through the posterior cortex, because of the proximity of the posterior neurovascular structures. In a case in which the posterior cord was injured, Rhee and colleagues40 used a suture pullout technique whereby a Beath pin was passed out of the posterior humerus and soft tissues to then hold tension on the biceps tendon during the tenodesis. The radial nerve potentially could have been injured by pin overpenetration or by becoming wrapped up in the soft tissues as the pin was spinning through them. In our technique, the posterior humeral cortex is drilled cautiously to avoid overpenetration and possibly getting the posterior soft tissues wrapped up in the guide pin. No AN injuries have been reported with this technique. Mean distance from AN to posterior cortical button in this study was 18.17 mm. In 2 cadaver studies of bicortical drilling for subpectoral biceps tenodesis, the ANs were 25.1 mm and 36.7 mm from the posterior drill hole.41,21
Limitations of this study included its design (case series) and limited number of follow-up patients. Of the 28 consecutive patients identified for the study, 10 did not undergo the clinical examination, as they either lived more than 3 hours away (8 patients) or could not be contacted (2 patients). Another study limitation was the inability to directly image ANs with ultrasound. Therefore, measurements of the distance from the PCHA to the button were used to estimate the distance from the AN/PCHA neurovascular bundle to the button.
In this study, functional outcomes were excellent, and there were no tenodesis failures or neurovascular complications. These preliminary findings indicate that subpectoral biceps tenodesis with a bicortical button is a viable treatment option for patients with the appropriate indications for this procedure.
1. Khazzam M, George MS, Churchill RS, Kuhn JE. Disorders of the long head of biceps tendon. J Shoulder Elbow Surg. 2012;21(1):136-145.
2. Geaney LE, Mazzocca AD. Biceps brachii tendon ruptures: a review of diagnosis and treatment of proximal and distal biceps tendon ruptures. Phys Sportsmed. 2010;38(2):117-125.
3. Kelly AM, Drakos MC, Fealy S, Taylor SA, O’Brien SJ. Arthroscopic release of the long head of the biceps tendon: functional outcome and clinical results. Am J Sports Med. 2005;33(2):208-213.
4. Provencher MT, LeClere LE, Romeo AA. Subpectoral biceps tenodesis. Sports Med Arthrosc Rev. 2008;16(3):170-176.
5. Nho SJ, Reiff SN, Verma NN, Slabaugh MA, Mazzocca AD, Romeo AA. Complications associated with subpectoral biceps tenodesis: low rates of incidence following surgery. J Shoulder Elbow Surg. 2010;19(5):764-768.
6. Mazzocca AD, Bicos J, Santangelo S, Romeo AA, Arciero RA. The biomechanical evaluation of four fixation techniques for proximal biceps tenodesis. Arthroscopy. 2005;21(11):1296-1306.
7. Ozalay, M, Akpinar S, Karaeminogullari O, et al. Mechanical strength of four different biceps tenodesis techniques. Arthroscopy. 2005;21(8):992-998.
8. Golish RS, Caldwell PE, Miller MD, et al. Interference screw versus suture anchor fixation for subpectoral tenodesis of the proximal biceps tendon: a cadaveric study. Arthroscopy. 2008;24(10):1103-1108.
9. Richards DP, Burkhart SS. A biomechanical analysis of two biceps tenodesis fixation techniques. Arthroscopy. 2005;21(7):861-866.
10. Mazzocca AD, Rios CG, Romeo AA, Arciero RA. Subpectoral biceps tenodesis with interference screw fixation. Arthroscopy. 2005;21(7):896.
11. Wolf RS, Zheng N, Weichel D. Long head biceps tenotomy versus tenodesis: a cadaveric biomechanical analysis. Arthroscopy. 2005;21(2):182-185.
12. Snir N, Hamula M, Wolfson T, Laible C, Sherman O. Long head of the biceps tenodesis with cortical button technique. Arthrosc Tech. 2013;2(2):e95-e97.
13. Arora AS, Singh A, Koonce RC. Biomechanical evaluation of a unicortical button versus interference screw for subpectoral biceps tenodesis. Arthroscopy. 2013;29(4):638-644.
14. Buchholz A, Martetschläger F, Siebenlist S, et al. Biomechanical comparison of intramedullary cortical button fixation and interference screw technique for subpectoral biceps tenodesis. Arthroscopy. 2013;29(5):845-853.
15. Bain GI, Prem H, Heptinstall RJ, Verhellen R, Paix D. Repair of distal biceps tendon rupture: a new technique using the Endobutton. J Shoulder Elbow Surg. 2000;9(2):120-126.
16. Greenberg JA. Endobutton repair of distal biceps tendon ruptures. J Hand Surg Am. 2009;34(8):1541-1548.
17. Heinzelmann AD, Savoie FH 3rd, Ramsey JR, Field LD, Mazzocca AD. A combined technique for distal biceps repair using a soft tissue button and biotenodesis interference screw. Am J Sports Med. 2009;37(5):989-994.
18. DeAngelis JP, Chen A, Wexler M, et al. Biomechanical characterization of unicortical button fixation: a novel technique for proximal subpectoral biceps tenodesis. Knee Surg Sports Traumatol Arthrosc. 2015;23(5):1434-1441.
19. Dickens JF, Kilcoyne KG, Tintle SM, Giuliani J, Schaefer RA, Rue JP. Subpectoral biceps tenodesis: an anatomic study and evaluation of at-risk structures. Am J Sports Med. 2012;40(10):2337-2341.
20. Sethi PM, Rajaram A, Beitzel K, Hackett TR, Chowaniec DM, Mazzocca AD. Biomechanical performance of subpectoral biceps tenodesis: a comparison of interference screw fixation, cortical button fixation, and interference screw diameter. J Shoulder Elbow Surg. 2013;22(4):451-457.
21. Sethi PM, Vadasdi K, Greene RT, Vitale MA, Duong M, Miller SR. Safety of open suprapectoral and subpectoral biceps tenodesis: an anatomic assessment of risk for neurologic injury. J Shoulder Elbow Surg. 2015;24(1):138-142.
22. Gummesson C, Ward MM, Atroshi I. The shortened Disabilities of the Arm, Shoulder and Hand questionnaire (QuickDASH): validity and reliability based on responses within the full-length DASH. BMC Musculoskelet Disord. 2006;7:44.
23. Schmidt CC, Brown BT, Sawardeker PJ, DeGravelle M Jr, Miller MC. Factors affecting supination strength after a distal biceps rupture. J Shoulder Elbow Surg. 2014;23(1):68-75.
24. Brotzman SB, Wilk KE, eds. Handbook of Orthopaedic Rehabilitation. Philadelphia, PA: Mosby Elsevier; 2007.
25. Mazzocca AD, Cote MP, Arciero CL, Romeo AA, Arciero RA. Clinical outcomes after subpectoral biceps tenodesis with an interference screw. Am J Sports Med. 2008;36(10):1922-1929.
26. Millett PJ, Snaders B, Gobezie R, Braun S, Warner JP. Interference screw versus suture anchor fixation for open subpectoral biceps tenodesis: does it matter? BMC Musculoskelet Disord. 2008;9(121):1-6.
27. Streit JJ, Shishani Y, Rodgers M, Gobezie R. Tendinopathy of the long head of the biceps tendon: histopathologic analysis of the extra-articular biceps tendon and tenosynovium. Open Access J Sports Med. 2015;6:63-70.
28. Hunsaker FG, Cioffi DA, Amadio PC, Wright JG, Caughlin B. The American Academy of Orthopaedic Surgeons outcomes instruments: normative values from the general population. J Bone Joint Surg Am. 2002;84(2):208-215.
29. Phillips BB, Canale ST, Sisk TD, Stralka SW, Wyatt KP. Rupture of the proximal biceps tendon in middle-aged patients. Orthop Rev. 1993;22(3):349-353.
30. Shank JR, Singleton SB, Braun S, et al. A comparison of forearm supination and elbow flexion strength in patients with long head of the biceps tenotomy or tenodesis. Arthroscopy. 2011;27(1):9-16.
31. Apaydin N, Tubbs RS, Loukas M, Duparc F. Review of the surgical anatomy of the axillary nerve and the anatomic basis of its iatrogenic and traumatic injury. Surg Radiol Anat. 2010;32(3):193-201.
32. Johnson D. Pectoral girdle and upper limp. In: Standring S, ed. Gray’s Anatomy. 40th ed. New York, NY: Elsevier; 2008:814-821.
33. Tubbs RS, Tyler-Kabara EC, Aikens AC, et al. Surgical anatomy of the axillary nerve within the quadrangular space. J Neurosurg. 2005;102(5):912-914.
34. Kim YA, Yoon KB, Kwon TD, Kim DH, Yoon DM. Evaluation of anatomic landmarks for axillary nerve block in the quadrilateral space. Acta Anaesthesiol Scand. 2014;58(5):567-571.
35. Robinson DJ, Marks P, Schneider-Kolsky ME. Ultrasound of the posterior circumflex humeral artery. J Med Imaging Radiat Oncol. 2010;54(3):219-223.
36. Rothe C, Asghar S, Andersen HL, Christensen JK, Lange KH. Ultrasound-guided block of the axillary nerve: a volunteer study of a new method. Acta Anaesthesiol Scand. 2011;55(5):565-570.
37. Reiff SN, Nho SJ, Romeo AA. Proximal humerus fracture after keyhole biceps tenodesis. Am J Orthop. 2010;39(7):E61-E63.
38. Sears BW, Spencer EE, Getz CL. Humeral fracture following subpectoral biceps tenodesis in 2 active, healthy patients. J Shoulder Elbow Surg. 2011;20(6):e7-e11.
39. Koch BS, Burks RT. Failure of biceps tenodesis with interference screw fixation. Arthroscopy. 2012;28(5):735-740.
40. Rhee PC, Spinner RJ, Bishop AT, Shin AY. Iatrogenic brachial plexus injuries associated with open subpectoral biceps tenodesis. Am J Sports Med. 2013;41(9):2048-2053.
41. Ding DY, Gupta A, Snir N, Wolfson T, Meislin RJ. Nerve proximity during bicortical drilling for subpectoral biceps tenodesis: a cadaveric study. Arthroscopy. 2014;30(8):942-946.
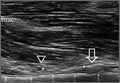
Biomechanical Evaluation of Two Arthroscopic Biceps Tenodesis Techniques: Proximal Interference Screw and Modified Percutaneous Intra-Articular Transtendon
Over the years, operative treatment of biceps pathology has escalated, likely secondary to increased identification and successful clinical outcomes. Although its true function remains controversial, the biceps tendon has been well accepted as a primary pain generator in the anterior aspect of the shoulder.1,2 Biceps pathology involves a spectrum of often overlapping findings—varying degrees of tearing, tendinitis, and instability. Pathology may be isolated or may present in association with other shoulder conditions, including impingement, bursitis, rotator cuff tears, SLAP (superior labral tear anterior to posterior) lesions, and acromioclavicular disorders.3
Operative treatment of disease of the long head of the biceps mandates an initial choice of tenotomy or tenodesis. Which approach is superior is controversial.4-6 Although tenotomy and tenodesis have comparably favorable clinical results, tenodesis is often recommended, particularly for younger, active patients, mostly because cosmetic deformity is possible with tenotomy.
Tenodesis may be performed arthroscopically or through an open incision, and the biceps tendon may be placed anywhere from in the joint to under the tendon of the pectoralis major tendon. In many recent biomechanical studies, interference screws had higher load to failure and improved stiffness in comparison with other fixation methods.7-19 Most of those studies focused on fixation in a subpectoral location. To our knowledge, only 2 studies of soft-tissue fixation have compared the percutaneous intra-articular transtendon (PITT) technique with other popular tenodesis techniques.20,21 The PITT technique demonstrated a common failure point, with sutures pulling through the tendon substance. It was hypothesized that adding a locking loop to the PITT suture configuration would further improve fixation.
We conducted a study to compare the biomechanical characteristics of 2 techniques for all-arthroscopic proximal biceps tenodesis: bioabsorbable interference screw (Biceptor; Smith & Nephew) and a locking-loop PITT modification developed at our institution.
Methods
Sixteen nonembalmed fresh-frozen human cadaveric shoulders (8 pairs: 3 male, 5 female) were used in this study. Mean specimen age was 55 years (range, 51-59 years). The specimens showed no evidence of high-grade osteoarthritic changes, biceps tendon fraying or tearing, biceps pulley lesions, or full-thickness rotator cuff tears. They were thawed at room temperature for 24 hours before the procedure.
In each pair, 1 shoulder was randomized to be treated with 1 of 2 arthroscopic biceps tenodesis techniques—modified PITT or Biceptor interference screw—and the other shoulder was treated with the other technique. Surgery was performed in an open fashion, and every attempt was made to simulate the arthroscopic approach. In all shoulders, biomechanical testing was completed immediately after tenodesis.
Modified PITT Technique
In an outside-in fashion, an 18-gauge spinal needle was used to pierce the transverse humeral ligament, the lateral aspect of the rotator interval tissue, and the biceps tendon. A second needle was then passed in similar fashion, piercing the biceps tendon just adjacent to the first needle (Figure 1A). A 0-polydioxanone monofilament suture (0-PDS; Ethicon, Johnson & Johnson) was threaded through the first needle and used to shuttle a single No. 2 braided nonabsorbable polyethylene suture (MaxBraid; Biomet Sports Medicine) back through the biceps tendon.
At this point, the free end of the nonabsorbable suture, which comes out of the anterior cannula during an arthroscopic procedure, was passed back into the glenohumeral joint (using a suture grasper), looped over the top of the biceps tendon, and brought back out of the joint anteriorly, thereby creating a locking loop around the tendon (Figure 1B). A shuttle suture (0-PDS) passed through the second needle was used to bring that anterior limb of nonabsorbable suture back through the biceps tendon, completing the stitch configuration (Figure 1C).
This process was repeated with another nonabsorbable suture. After suture passing was completed, the biceps was detached from its insertion at the superior labrum. The 2 nonabsorbable sutures, which would later be retrieved from the subacromial space, were then tied in standard fashion, securing the biceps tendon to the transverse humeral ligament/rotator interval tissue (Figure 1D).
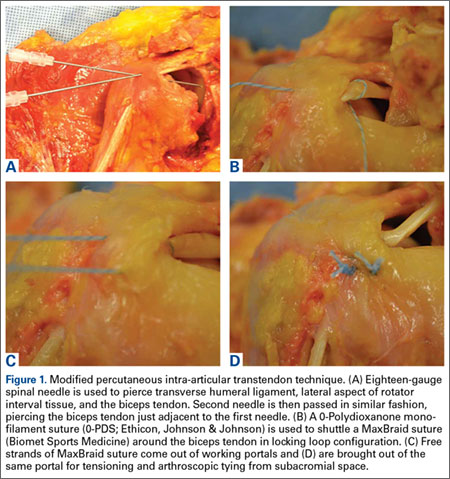
Biceptor Interference Screw Technique
The interference screw technique was performed in accordance with the manufacturer’s operative instructions.22 An 8 × 25-mm polyetheretherketone interference screw was used in all specimens, and the medium tendon fork was used to maintain tension on the biceps tendon during fixation (Figure 2A).
A 2.4-mm guide wire was inserted perpendicular to the humeral shaft, at the planned site of tenodesis, 10 mm distal to the entrance of the bicipital groove. An 8-mm cannulated reamer was passed over the wire, and a 30-mm tunnel was drilled (Figure 2B). The proximal part of the tendon was advanced into the center of the tunnel using the tendon fork (Figure 2C), and the tendon was held at the bottom of the tunnel with a 1.5-mm guide pin. The tendon fork was removed, and the cannulated interference screw was inserted over the guide pin between the 2 limbs of the biceps tendon (Figure 2D). The tendon was closely monitored to ensure it was not wrapped up when the screw was placed.
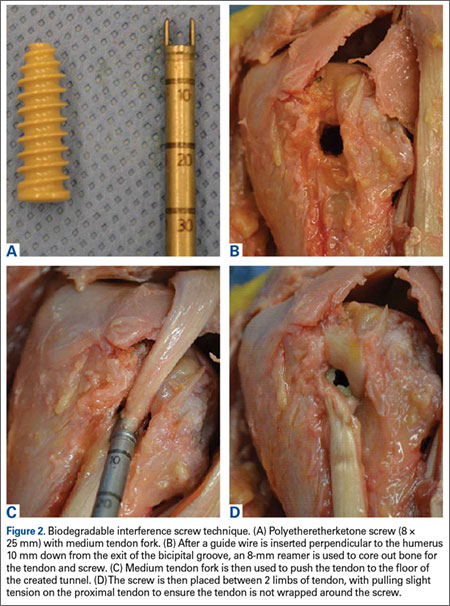
Biomechanical Testing
After each tenodesis, the humerus was amputated 5 inches distal to the fixation site. All extraneous soft tissue was dissected away, leaving the distal aspect of the biceps tendon as a free graft. Each proximal humerus–biceps tendon construct was then mounted on a materials testing machine. A custom-designed soft-tissue clamp was used to secure the distal aspect of the biceps tendon to the test actuator and load cell (Figure 3A). A custom-designed jig was used to stabilize the proximal humerus to the platform of the materials testing machine (Figure 3B). The specimens were mounted so that the line of pull throughout the testing protocol was applied parallel to the long axis of the humerus, thereby approximating the in vivo biceps force vector (Figure 3C). Digital cameras recorded each test for analysis of the mechanism of failure for each specimen. Marker dots were drawn on each tendon to assess tendon stretch before construct failure.
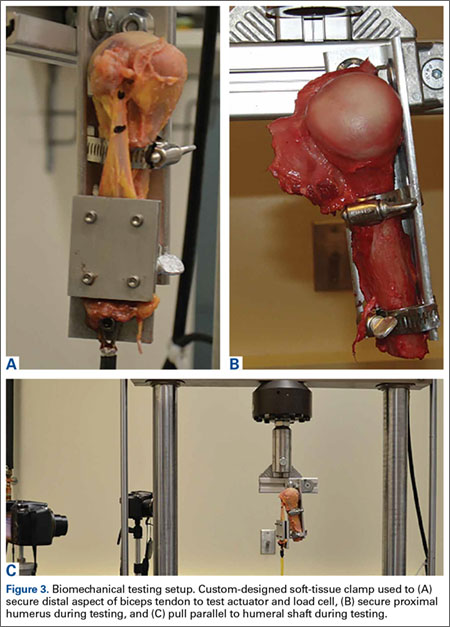
The tendons were preloaded to 10 N and then cycled at 0 to 50 N for 100 cycles at 1 Hz. After cyclic loading, axial load to failure was performed at a rate of 1.0 mm per second until a peak load was observed and subsequent loading led to tendon elongation with no further increase in load. Displacement and force applied during cyclic loading and load to failure were recorded. Stiffness was then calculated as the slope of the linear portion of the force-displacement curve using the least mean squares approach. Mechanism of failure was documented for each specimen.
Statistical Analysis
Analyzing our preliminary data with G*Power, we determined that a total sample size of 8 would be required (effect size [Cohen dz] was 1, α error probability was .05, power was .8). We hypothesized that the ultimate strength and stiffness of one group would be less than 1 SD above those of the other group. Paired t test with significance set at P < .05 was used to compare the techniques.
Results
Both repair constructs exhibited standard load-displacement curves, with a linear increase in load with displacement until the point of failure, at which time further displacement occurred with no discernible increase in load (Figure 4). Ultimate load to failure is determined as the highest point of the curve, and stiffness is calculated as the slope of the load-displacement curve.
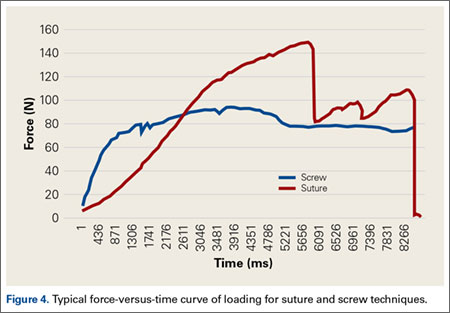
Mean axial displacement parallel to the shaft of the humerus with cyclic loading was 7.1 mm with the modified PITT technique and 7.9 mm with the interference screw technique. There was no macroscopically visible high-grade tearing or slippage of the biceps tendon in any specimen with cyclic loading for either repair construct.
Mean (SD) ultimate load to failure was significantly (P = .003) higher with the modified PITT technique, 157 (41) N, than with the interference screw technique, 107 (29) N; actual effect size (Cohen dz) was 1.19, difference of means was 50 N, and pooled SD was 42 N. The interference screw technique yielded significantly (P = .010) more mean (SD) stiffness, 38.7 (14.7) N/mm, than the modified PITT technique, 15.8 (9.1) N/mm; actual effect size (Cohen dz) was 1.37, difference of means was 22.9 N/mm, and pooled SD was 16.7 N/mm.
In the interference screw technique, the mode of failure was consistent. Of the 8 specimens, 7 failed at the screw–tendon interface at the distal aspect of the tunnel; in the eighth specimen, the entire tendon pulled out from under the screw construct. In the modified PITT technique, there was more variability in failure: tendon slipped through suture (4 specimens), tendon/suture construct as unit pulled through transverse ligament/rotator interval tissue (3), and suture failure (1).
Discussion
This study was the first to directly compare a bony interference screw technique with a soft-tissue technique (modified PITT). Fixation strength is crucial. A load of 112 N is applied to the long head of the biceps tendon when a person holds 1 kg of weight in the hand with the elbow at 90° flexion.22 As mean (SD) ultimate load to failure was 157 (41) N with the modified PITT technique and 107 (29) N with the interference screw technique in this study, the interference screw can be recommended only with some hesitation.
The interference screw was stiffer with cyclic loading—an expected outcome, as it was secured to rigid bone—vs soft tissue, as in the modified PITT technique. Although the clinical implications for the modified PITT technique are unknown, more than likely, with the tendon being secured to soft tissue, there will be scarring over time.
In laboratory testing of biceps tenodesis constructs, interference screw fixation has had superior load-to-failure characteristics in comparisons with other fixation methods. Golish and colleagues13 found significantly higher load to failure with a biotenodesis screw than with a double-loaded suture anchor for subpectoral tenodesis. Testing similar implants, in a location more proximal in the bicipital groove, Richards and Burkhart14 likewise found superior fixation strength with an interference screw. Ozalay and colleagues16 found superior strength in an interference screw compared with suture anchor, keyhole, and bone tunnel in sheep. In a pig model, the highest ultimate load to failure was found in an interference screw—vs keyhole, bone tunnel, suture anchor, and ligament washer.19 Load to failure for the interference screw in these studies ranged from 170 N to over 400 N.13,14,16,19
A few other investigators have studied the Biceptor interference screw. Slabaugh and colleagues15 found a mean (SD) load to failure of 173.9 (27.2) N for all specimens tested. Patzer and colleagues9,17 found that the mean (SD) ultimate load to failure with the Biceptor proximal interference screw, 173.9 (27.2) N, was superior to that of a suture anchor.
The mean (SD) ultimate load to failure reported for the Biceptor interference screw in the present study, 107 (29) N, is lower than the values reported in the other studies—not only for the Biceptor screw but for interference screws in general. Nevertheless, we performed the technique as the manufacturer recommended.22 Our results were consistent across all specimens studied. Interestingly, in the study by Slabaugh and colleagues,15 7 specimens failed at the tendon–screw interface during cyclic testing and were not included in the analysis of ultimate load to failure. As these specimens failed at a load between 5 N and 70 N, including their data would have significantly lowered the mean load to failure.
Concern over the Biceptor interference screw’s lower failure load relative to that of other interference screws has been raised before.9,17 A major issue is possible overstuffing of the humeral tunnel, as the hole is reamed the same size as the screw. With the Biceptor, the proximal and distal portions of the tendon are placed in the tunnel in a U-shaped configuration with the screw between these limbs. The idea is that the 2 biceps tendon limbs might become abraded and consecutively weaken as the screw is inserted between the tendon limbs, more so than with a single loop. This idea was suggested by the typical longitudinal tendon splitting that occurs at the screw–tendon interface at the distal aspect of the tunnel.23 In the present study, consistent failure (Figures 5A-5C) at the distal aspect of the screw–tendon junction supported the idea that the tendon is abraded during placement of the interference screw or during the friction-causing 90° turn the tendon takes into the bone on loading. There is no way to quantitatively examine tendon quality before interference screw placement, but on gross inspection all the tendons were of good quality. Slabaugh and colleagues15 also found consistent failure at the screw–tunnel interface.
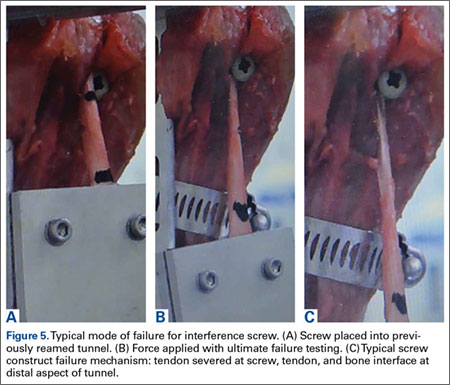
The PITT technique has been described as a simple all-arthroscopic soft-tissue technique for biceps tenodesis.23,24 Subsequently developed soft-tissue techniques have demonstrated clinical benefits.25-27 Proposed advantages of these techniques are lower cost associated with decreased implant needs, no reliance on quality of bone for fixation, suturing while biceps tendon is still attached to anchor (anatomical tension is closely reproduced), and less interference with any subsequent use of magnetic resonance imaging for diagnostic purposes in the shoulder.
There have been only 2 biomechanical studies of the PITT technique. Lopez-Vidriero and colleagues20 compared the biomechanical properties of the PITT and suture anchor techniques in a human cadaveric laboratory study and found that the PITT technique had mean (SD) ultimate load to failure of 142.7 (30.9) N and mean (SD) stiffness of 13.3 (3) N/mm. They observed consistent suture pullout through the tendon substance during failure, which suggests the most important factor for strength is the quality of the biceps tendon. Su and colleagues21 found biomechanically inferior results of the classic PITT technique as compared with the interference screw technique.
This article provides the first description of the modified PITT technique. Our mean (SD) load to failure of the modified PITT technique was 157 (41) N, slightly higher than that reported for the classic PITT technique, albeit under a different setup.20 There was more variation in ultimate load to failure in our study than in previous studies, which could be secondary to tissue quality. As the modified PITT technique relies on surrounding tissue holding the biceps in place, this tissue would need to be of good quality and strength to obtain strong fixation. A possible concern is that placing stitches in the rotator interval could increase the risk of shoulder stiffness, but this has not been encountered clinically.
A more variable mechanism of failure was also found in the present study. Although half the specimens failed by suture pullout through the tendon, similar to what Lopez-Vidriero and colleagues20 described, 3 of our 8 specimens failed with the entire biceps tendon–suture construct pulling through the transverse ligament tissue, and 1 specimen failed by suture breakage. Although these numbers are too small for making definitive statements, our modified PITT technique may add some security to the tendon–suture construct. Such added security may be of particular value in the setting of poor-quality, diseased tendon tissue, and the construct may be more limited by the strength of surrounding tissues. In addition, if failure occurs at the suture transverse humeral ligament–rotator interval interface, more surrounding rotator interval tissue can be incorporated into the tenodesis to decrease the likelihood of failure through this mechanism.
This study had several limitations. First, it was a time zero study in a cadaveric model with simulated biomechanical loading. As such, it provided information only on initial fixation strength and could not prove any superior clinical outcomes or account for any biological changes with healing that occurred over time. Second, the study may have been underpowered, though sample size was chosen in accordance with other cadaveric biomechanical studies. Third, all procedures were performed in an open manner, simulating the arthroscopic approach. Particularly in the setting of the modified PITT technique, this represented a best case scenario. Spinal needles and subsequent sutures were easily passed under direct visualization through the transverse humeral ligament, rotator interval, and biceps tendon. There is likely marked variability in this step during arthroscopy in which visualization is more limited, as in the setting of concomitant procedures, such as subacromial decompression or rotator cuff repair. In addition, all tendons tested were normal in appearance and gave no indication of chronic degenerative changes.
Another study limitation is that we did not quantify bone mineral density, which if poor would have affected interference screw strength. However, mean specimen age was 55 years, minimizing chances of poor bone quality. In addition, 7 of the 8 failures in the interference screw group occurred not with pullout but at the screw–tendon junction, suggesting poor bone quality was not a significant factor. As tendon diameter was not measured before the procedures were performed, there is the possibility it could have been better in the modified PITT group and worse in the interference screw group because of tunnel crowding, as noted.
1. Alpantaki K, McLaughlin D, Karagogeos D, Hadjipavlou A, Kontakis G. Sympathetic and sensory neural elements in the tendon of the long head of the biceps. J Bone Joint Surg Am. 2005;87(7):1580-1583.
2. Nho SJ, Strauss EJ, Lenart BA, et al. Long head of the biceps tendinopathy: diagnosis and management. J Am Acad Orthop Surg. 2010;18(11):645-656.
3. Khazzam M, George MS, Churchill RS, Kuhn JE. Disorders of the long head of biceps tendon. J Shoulder Elbow Surg. 2012;21(1):136-145.
4. Frost A, Zafar MS, Maffulli N. Tenotomy versus tenodesis in the management of pathologic lesions of the tendon of the long head of the biceps brachii. Am J Sports Med. 2009;37(4):828-833.
5. Hsu AR, Ghodadra NS, Provencher MT, Lewis PB, Bach BR. Biceps tenotomy versus tenodesis: a review of clinical outcomes and biomechanical results. J Shoulder Elbow Surg. 2011;20(2):326-332.
6. Slenker NR, Lawson K, Ciccotti MG, Dodson CC, Cohen SB. Biceps tenotomy versus tenodesis: clinical outcomes. Arthroscopy. 2012;28(4):576-582.
7. Mazzocca AD, Bicos J, Santangelo S, Romeo AA, Arciero RA. The biomechanical evaluation of four fixation techniques for proximal biceps tenodesis. Arthroscopy. 2005;21(11):1296-1306.
8. Millett PJ, Sanders B, Gobezie R, Braun S, Warner JJ. Interference screw vs. suture anchor fixation for open subpectoral biceps tenodesis: does it matter? BMC Musculoskelet Disord. 2008;9:121.
9. Patzer T, Rundic JM, Bobrowitsch E, Olender GD, Hurschler C, Schofer MD. Biomechanical comparison of arthroscopically performable techniques for suprapectoral biceps tenodesis. Arthroscopy. 2011;27(8):1036-1047.
10. Provencher MT, LeClere LE, Romeo AA. Subpectoral biceps tenodesis. Sports Med Arthrosc. 2008;16(3):170-176.
11. Mazzocca AD, Cote MP, Arciero CL, Romeo AA, Arciero RA. Clinical outcomes after subpectoral biceps tenodesis with an interference screw. Am J Sports Med. 2008;36(10):1922-1929.
12. Klepps S, Hazrati Y, Flatow E. Arthroscopic biceps tenodesis. Arthroscopy. 2002;18(9):1040-1045.
13. Golish SR, Caldwell PE 3rd, Miller MD, et al. Interference screw versus suture anchor fixation for subpectoral tenodesis of the proximal biceps tendon: a cadaveric study. Arthroscopy. 2008;24(10):1103-1108.
14. Richards DP, Burkhart SS. A biomechanical analysis of two biceps tenodesis fixation techniques. Arthroscopy. 2005;21(7):861-866.
15. Slabaugh MA, Frank RM, Van Thiel GS, et al. Biceps tenodesis with interference screw fixation: a biomechanical comparison of screw length and diameter. Arthroscopy. 2011;27(2):161-166.
16. Ozalay M, Akpinar S, Karaeminogullari O, et al. Mechanical strength of four different biceps tenodesis techniques. Arthroscopy. 2005;21(8):992-998.
17. Patzer T, Santo G, Olender GD, Wellmann M, Hurschler C, Schofer MD. Suprapectoral or subpectoral position for biceps tenodesis: biomechanical comparison of four different techniques in both positions. J Shoulder Elbow Surg. 2012;21(1):116-125.
18. Jayamoorthy T, Field JR, Costi JJ, Martin DK, Stanley RM, Hearn TC. Biceps tenodesis: a biomechanical study of fixation methods. J Shoulder Elbow Surg. 2004;13(2):160-164.
19. Kusma M, Dienst M, Eckert J, Steimer O, Kohn D. Tenodesis of the long head of biceps brachii: cyclic testing of five methods of fixation in a porcine model. J Shoulder Elbow Surg. 2008;17(6):967-973.
20. Lopez-Vidriero E, Costic RS, Fu FH, Rodosky MW. Biomechanical evaluation of 2 arthroscopic biceps tenodeses: double anchor versus percutaneous intra-articular transtendon (PITT) techniques. Am J Sports Med. 2010;38(1):146-152.
21. Su WR, Budoff JE, Chiang CH, Lee CJ, Lin CL. Biomechanical study comparing biceps wedge tenodesis with other proximal long head of the biceps tenodesis techniques. Arthroscopy. 2013;29(9):1498-1505.
22. Trenhaile SW. Biceptor Tenodesis System, Arthroscopic Biceps Tenodesis [operational instructions]. Andover, MA: Smith & Nephew; 2009:1-8.
23. Sekiya LC, Elkousy HA, Rodosky MW. Arthroscopic biceps tenodesis using the percutaneous intra-articular transtendon technique. Arthroscopy. 2003;19(10):1137-1141.
24. Elkousy HA, Fluhme DJ, O’Connor DP, Rodosky MW. Arthroscopic biceps tenodesis using the percutaneous, intra-articular trans-tendon technique: preliminary results. Orthopedics. 2005;28(11):1316-1319.
25. Castagna A, Conti M, Mouhsine E, Bungaro P, Garofalo R. Arthroscopic biceps tendon tenodesis; the anchorage technical note. Knee Surg Sports Traumatol Arthrosc. 2006;14(6):581-585.
26. Checchia SL, Doneux PS, Miyazaki AN, et al. Biceps tenodesis associated with arthroscopic repair of rotator cuff tears. J Shoulder Elbow Surg. 2005;14(2):138-144.
27. Moros C, Levine WN, Ahmad CS. Suture anchor and percutaneous intra-articular transtendon biceps tenodesis. Sports Med Arthrosc. 2008;16(3):177-179.
Over the years, operative treatment of biceps pathology has escalated, likely secondary to increased identification and successful clinical outcomes. Although its true function remains controversial, the biceps tendon has been well accepted as a primary pain generator in the anterior aspect of the shoulder.1,2 Biceps pathology involves a spectrum of often overlapping findings—varying degrees of tearing, tendinitis, and instability. Pathology may be isolated or may present in association with other shoulder conditions, including impingement, bursitis, rotator cuff tears, SLAP (superior labral tear anterior to posterior) lesions, and acromioclavicular disorders.3
Operative treatment of disease of the long head of the biceps mandates an initial choice of tenotomy or tenodesis. Which approach is superior is controversial.4-6 Although tenotomy and tenodesis have comparably favorable clinical results, tenodesis is often recommended, particularly for younger, active patients, mostly because cosmetic deformity is possible with tenotomy.
Tenodesis may be performed arthroscopically or through an open incision, and the biceps tendon may be placed anywhere from in the joint to under the tendon of the pectoralis major tendon. In many recent biomechanical studies, interference screws had higher load to failure and improved stiffness in comparison with other fixation methods.7-19 Most of those studies focused on fixation in a subpectoral location. To our knowledge, only 2 studies of soft-tissue fixation have compared the percutaneous intra-articular transtendon (PITT) technique with other popular tenodesis techniques.20,21 The PITT technique demonstrated a common failure point, with sutures pulling through the tendon substance. It was hypothesized that adding a locking loop to the PITT suture configuration would further improve fixation.
We conducted a study to compare the biomechanical characteristics of 2 techniques for all-arthroscopic proximal biceps tenodesis: bioabsorbable interference screw (Biceptor; Smith & Nephew) and a locking-loop PITT modification developed at our institution.
Methods
Sixteen nonembalmed fresh-frozen human cadaveric shoulders (8 pairs: 3 male, 5 female) were used in this study. Mean specimen age was 55 years (range, 51-59 years). The specimens showed no evidence of high-grade osteoarthritic changes, biceps tendon fraying or tearing, biceps pulley lesions, or full-thickness rotator cuff tears. They were thawed at room temperature for 24 hours before the procedure.
In each pair, 1 shoulder was randomized to be treated with 1 of 2 arthroscopic biceps tenodesis techniques—modified PITT or Biceptor interference screw—and the other shoulder was treated with the other technique. Surgery was performed in an open fashion, and every attempt was made to simulate the arthroscopic approach. In all shoulders, biomechanical testing was completed immediately after tenodesis.
Modified PITT Technique
In an outside-in fashion, an 18-gauge spinal needle was used to pierce the transverse humeral ligament, the lateral aspect of the rotator interval tissue, and the biceps tendon. A second needle was then passed in similar fashion, piercing the biceps tendon just adjacent to the first needle (Figure 1A). A 0-polydioxanone monofilament suture (0-PDS; Ethicon, Johnson & Johnson) was threaded through the first needle and used to shuttle a single No. 2 braided nonabsorbable polyethylene suture (MaxBraid; Biomet Sports Medicine) back through the biceps tendon.
At this point, the free end of the nonabsorbable suture, which comes out of the anterior cannula during an arthroscopic procedure, was passed back into the glenohumeral joint (using a suture grasper), looped over the top of the biceps tendon, and brought back out of the joint anteriorly, thereby creating a locking loop around the tendon (Figure 1B). A shuttle suture (0-PDS) passed through the second needle was used to bring that anterior limb of nonabsorbable suture back through the biceps tendon, completing the stitch configuration (Figure 1C).
This process was repeated with another nonabsorbable suture. After suture passing was completed, the biceps was detached from its insertion at the superior labrum. The 2 nonabsorbable sutures, which would later be retrieved from the subacromial space, were then tied in standard fashion, securing the biceps tendon to the transverse humeral ligament/rotator interval tissue (Figure 1D).
Biceptor Interference Screw Technique
The interference screw technique was performed in accordance with the manufacturer’s operative instructions.22 An 8 × 25-mm polyetheretherketone interference screw was used in all specimens, and the medium tendon fork was used to maintain tension on the biceps tendon during fixation (Figure 2A).
A 2.4-mm guide wire was inserted perpendicular to the humeral shaft, at the planned site of tenodesis, 10 mm distal to the entrance of the bicipital groove. An 8-mm cannulated reamer was passed over the wire, and a 30-mm tunnel was drilled (Figure 2B). The proximal part of the tendon was advanced into the center of the tunnel using the tendon fork (Figure 2C), and the tendon was held at the bottom of the tunnel with a 1.5-mm guide pin. The tendon fork was removed, and the cannulated interference screw was inserted over the guide pin between the 2 limbs of the biceps tendon (Figure 2D). The tendon was closely monitored to ensure it was not wrapped up when the screw was placed.
Biomechanical Testing
After each tenodesis, the humerus was amputated 5 inches distal to the fixation site. All extraneous soft tissue was dissected away, leaving the distal aspect of the biceps tendon as a free graft. Each proximal humerus–biceps tendon construct was then mounted on a materials testing machine. A custom-designed soft-tissue clamp was used to secure the distal aspect of the biceps tendon to the test actuator and load cell (Figure 3A). A custom-designed jig was used to stabilize the proximal humerus to the platform of the materials testing machine (Figure 3B). The specimens were mounted so that the line of pull throughout the testing protocol was applied parallel to the long axis of the humerus, thereby approximating the in vivo biceps force vector (Figure 3C). Digital cameras recorded each test for analysis of the mechanism of failure for each specimen. Marker dots were drawn on each tendon to assess tendon stretch before construct failure.
The tendons were preloaded to 10 N and then cycled at 0 to 50 N for 100 cycles at 1 Hz. After cyclic loading, axial load to failure was performed at a rate of 1.0 mm per second until a peak load was observed and subsequent loading led to tendon elongation with no further increase in load. Displacement and force applied during cyclic loading and load to failure were recorded. Stiffness was then calculated as the slope of the linear portion of the force-displacement curve using the least mean squares approach. Mechanism of failure was documented for each specimen.
Statistical Analysis
Analyzing our preliminary data with G*Power, we determined that a total sample size of 8 would be required (effect size [Cohen dz] was 1, α error probability was .05, power was .8). We hypothesized that the ultimate strength and stiffness of one group would be less than 1 SD above those of the other group. Paired t test with significance set at P < .05 was used to compare the techniques.
Results
Both repair constructs exhibited standard load-displacement curves, with a linear increase in load with displacement until the point of failure, at which time further displacement occurred with no discernible increase in load (Figure 4). Ultimate load to failure is determined as the highest point of the curve, and stiffness is calculated as the slope of the load-displacement curve.
Mean axial displacement parallel to the shaft of the humerus with cyclic loading was 7.1 mm with the modified PITT technique and 7.9 mm with the interference screw technique. There was no macroscopically visible high-grade tearing or slippage of the biceps tendon in any specimen with cyclic loading for either repair construct.
Mean (SD) ultimate load to failure was significantly (P = .003) higher with the modified PITT technique, 157 (41) N, than with the interference screw technique, 107 (29) N; actual effect size (Cohen dz) was 1.19, difference of means was 50 N, and pooled SD was 42 N. The interference screw technique yielded significantly (P = .010) more mean (SD) stiffness, 38.7 (14.7) N/mm, than the modified PITT technique, 15.8 (9.1) N/mm; actual effect size (Cohen dz) was 1.37, difference of means was 22.9 N/mm, and pooled SD was 16.7 N/mm.
In the interference screw technique, the mode of failure was consistent. Of the 8 specimens, 7 failed at the screw–tendon interface at the distal aspect of the tunnel; in the eighth specimen, the entire tendon pulled out from under the screw construct. In the modified PITT technique, there was more variability in failure: tendon slipped through suture (4 specimens), tendon/suture construct as unit pulled through transverse ligament/rotator interval tissue (3), and suture failure (1).
Discussion
This study was the first to directly compare a bony interference screw technique with a soft-tissue technique (modified PITT). Fixation strength is crucial. A load of 112 N is applied to the long head of the biceps tendon when a person holds 1 kg of weight in the hand with the elbow at 90° flexion.22 As mean (SD) ultimate load to failure was 157 (41) N with the modified PITT technique and 107 (29) N with the interference screw technique in this study, the interference screw can be recommended only with some hesitation.
The interference screw was stiffer with cyclic loading—an expected outcome, as it was secured to rigid bone—vs soft tissue, as in the modified PITT technique. Although the clinical implications for the modified PITT technique are unknown, more than likely, with the tendon being secured to soft tissue, there will be scarring over time.
In laboratory testing of biceps tenodesis constructs, interference screw fixation has had superior load-to-failure characteristics in comparisons with other fixation methods. Golish and colleagues13 found significantly higher load to failure with a biotenodesis screw than with a double-loaded suture anchor for subpectoral tenodesis. Testing similar implants, in a location more proximal in the bicipital groove, Richards and Burkhart14 likewise found superior fixation strength with an interference screw. Ozalay and colleagues16 found superior strength in an interference screw compared with suture anchor, keyhole, and bone tunnel in sheep. In a pig model, the highest ultimate load to failure was found in an interference screw—vs keyhole, bone tunnel, suture anchor, and ligament washer.19 Load to failure for the interference screw in these studies ranged from 170 N to over 400 N.13,14,16,19
A few other investigators have studied the Biceptor interference screw. Slabaugh and colleagues15 found a mean (SD) load to failure of 173.9 (27.2) N for all specimens tested. Patzer and colleagues9,17 found that the mean (SD) ultimate load to failure with the Biceptor proximal interference screw, 173.9 (27.2) N, was superior to that of a suture anchor.
The mean (SD) ultimate load to failure reported for the Biceptor interference screw in the present study, 107 (29) N, is lower than the values reported in the other studies—not only for the Biceptor screw but for interference screws in general. Nevertheless, we performed the technique as the manufacturer recommended.22 Our results were consistent across all specimens studied. Interestingly, in the study by Slabaugh and colleagues,15 7 specimens failed at the tendon–screw interface during cyclic testing and were not included in the analysis of ultimate load to failure. As these specimens failed at a load between 5 N and 70 N, including their data would have significantly lowered the mean load to failure.
Concern over the Biceptor interference screw’s lower failure load relative to that of other interference screws has been raised before.9,17 A major issue is possible overstuffing of the humeral tunnel, as the hole is reamed the same size as the screw. With the Biceptor, the proximal and distal portions of the tendon are placed in the tunnel in a U-shaped configuration with the screw between these limbs. The idea is that the 2 biceps tendon limbs might become abraded and consecutively weaken as the screw is inserted between the tendon limbs, more so than with a single loop. This idea was suggested by the typical longitudinal tendon splitting that occurs at the screw–tendon interface at the distal aspect of the tunnel.23 In the present study, consistent failure (Figures 5A-5C) at the distal aspect of the screw–tendon junction supported the idea that the tendon is abraded during placement of the interference screw or during the friction-causing 90° turn the tendon takes into the bone on loading. There is no way to quantitatively examine tendon quality before interference screw placement, but on gross inspection all the tendons were of good quality. Slabaugh and colleagues15 also found consistent failure at the screw–tunnel interface.
The PITT technique has been described as a simple all-arthroscopic soft-tissue technique for biceps tenodesis.23,24 Subsequently developed soft-tissue techniques have demonstrated clinical benefits.25-27 Proposed advantages of these techniques are lower cost associated with decreased implant needs, no reliance on quality of bone for fixation, suturing while biceps tendon is still attached to anchor (anatomical tension is closely reproduced), and less interference with any subsequent use of magnetic resonance imaging for diagnostic purposes in the shoulder.
There have been only 2 biomechanical studies of the PITT technique. Lopez-Vidriero and colleagues20 compared the biomechanical properties of the PITT and suture anchor techniques in a human cadaveric laboratory study and found that the PITT technique had mean (SD) ultimate load to failure of 142.7 (30.9) N and mean (SD) stiffness of 13.3 (3) N/mm. They observed consistent suture pullout through the tendon substance during failure, which suggests the most important factor for strength is the quality of the biceps tendon. Su and colleagues21 found biomechanically inferior results of the classic PITT technique as compared with the interference screw technique.
This article provides the first description of the modified PITT technique. Our mean (SD) load to failure of the modified PITT technique was 157 (41) N, slightly higher than that reported for the classic PITT technique, albeit under a different setup.20 There was more variation in ultimate load to failure in our study than in previous studies, which could be secondary to tissue quality. As the modified PITT technique relies on surrounding tissue holding the biceps in place, this tissue would need to be of good quality and strength to obtain strong fixation. A possible concern is that placing stitches in the rotator interval could increase the risk of shoulder stiffness, but this has not been encountered clinically.
A more variable mechanism of failure was also found in the present study. Although half the specimens failed by suture pullout through the tendon, similar to what Lopez-Vidriero and colleagues20 described, 3 of our 8 specimens failed with the entire biceps tendon–suture construct pulling through the transverse ligament tissue, and 1 specimen failed by suture breakage. Although these numbers are too small for making definitive statements, our modified PITT technique may add some security to the tendon–suture construct. Such added security may be of particular value in the setting of poor-quality, diseased tendon tissue, and the construct may be more limited by the strength of surrounding tissues. In addition, if failure occurs at the suture transverse humeral ligament–rotator interval interface, more surrounding rotator interval tissue can be incorporated into the tenodesis to decrease the likelihood of failure through this mechanism.
This study had several limitations. First, it was a time zero study in a cadaveric model with simulated biomechanical loading. As such, it provided information only on initial fixation strength and could not prove any superior clinical outcomes or account for any biological changes with healing that occurred over time. Second, the study may have been underpowered, though sample size was chosen in accordance with other cadaveric biomechanical studies. Third, all procedures were performed in an open manner, simulating the arthroscopic approach. Particularly in the setting of the modified PITT technique, this represented a best case scenario. Spinal needles and subsequent sutures were easily passed under direct visualization through the transverse humeral ligament, rotator interval, and biceps tendon. There is likely marked variability in this step during arthroscopy in which visualization is more limited, as in the setting of concomitant procedures, such as subacromial decompression or rotator cuff repair. In addition, all tendons tested were normal in appearance and gave no indication of chronic degenerative changes.
Another study limitation is that we did not quantify bone mineral density, which if poor would have affected interference screw strength. However, mean specimen age was 55 years, minimizing chances of poor bone quality. In addition, 7 of the 8 failures in the interference screw group occurred not with pullout but at the screw–tendon junction, suggesting poor bone quality was not a significant factor. As tendon diameter was not measured before the procedures were performed, there is the possibility it could have been better in the modified PITT group and worse in the interference screw group because of tunnel crowding, as noted.
1. Alpantaki K, McLaughlin D, Karagogeos D, Hadjipavlou A, Kontakis G. Sympathetic and sensory neural elements in the tendon of the long head of the biceps. J Bone Joint Surg Am. 2005;87(7):1580-1583.
2. Nho SJ, Strauss EJ, Lenart BA, et al. Long head of the biceps tendinopathy: diagnosis and management. J Am Acad Orthop Surg. 2010;18(11):645-656.
3. Khazzam M, George MS, Churchill RS, Kuhn JE. Disorders of the long head of biceps tendon. J Shoulder Elbow Surg. 2012;21(1):136-145.
4. Frost A, Zafar MS, Maffulli N. Tenotomy versus tenodesis in the management of pathologic lesions of the tendon of the long head of the biceps brachii. Am J Sports Med. 2009;37(4):828-833.
5. Hsu AR, Ghodadra NS, Provencher MT, Lewis PB, Bach BR. Biceps tenotomy versus tenodesis: a review of clinical outcomes and biomechanical results. J Shoulder Elbow Surg. 2011;20(2):326-332.
6. Slenker NR, Lawson K, Ciccotti MG, Dodson CC, Cohen SB. Biceps tenotomy versus tenodesis: clinical outcomes. Arthroscopy. 2012;28(4):576-582.
7. Mazzocca AD, Bicos J, Santangelo S, Romeo AA, Arciero RA. The biomechanical evaluation of four fixation techniques for proximal biceps tenodesis. Arthroscopy. 2005;21(11):1296-1306.
8. Millett PJ, Sanders B, Gobezie R, Braun S, Warner JJ. Interference screw vs. suture anchor fixation for open subpectoral biceps tenodesis: does it matter? BMC Musculoskelet Disord. 2008;9:121.
9. Patzer T, Rundic JM, Bobrowitsch E, Olender GD, Hurschler C, Schofer MD. Biomechanical comparison of arthroscopically performable techniques for suprapectoral biceps tenodesis. Arthroscopy. 2011;27(8):1036-1047.
10. Provencher MT, LeClere LE, Romeo AA. Subpectoral biceps tenodesis. Sports Med Arthrosc. 2008;16(3):170-176.
11. Mazzocca AD, Cote MP, Arciero CL, Romeo AA, Arciero RA. Clinical outcomes after subpectoral biceps tenodesis with an interference screw. Am J Sports Med. 2008;36(10):1922-1929.
12. Klepps S, Hazrati Y, Flatow E. Arthroscopic biceps tenodesis. Arthroscopy. 2002;18(9):1040-1045.
13. Golish SR, Caldwell PE 3rd, Miller MD, et al. Interference screw versus suture anchor fixation for subpectoral tenodesis of the proximal biceps tendon: a cadaveric study. Arthroscopy. 2008;24(10):1103-1108.
14. Richards DP, Burkhart SS. A biomechanical analysis of two biceps tenodesis fixation techniques. Arthroscopy. 2005;21(7):861-866.
15. Slabaugh MA, Frank RM, Van Thiel GS, et al. Biceps tenodesis with interference screw fixation: a biomechanical comparison of screw length and diameter. Arthroscopy. 2011;27(2):161-166.
16. Ozalay M, Akpinar S, Karaeminogullari O, et al. Mechanical strength of four different biceps tenodesis techniques. Arthroscopy. 2005;21(8):992-998.
17. Patzer T, Santo G, Olender GD, Wellmann M, Hurschler C, Schofer MD. Suprapectoral or subpectoral position for biceps tenodesis: biomechanical comparison of four different techniques in both positions. J Shoulder Elbow Surg. 2012;21(1):116-125.
18. Jayamoorthy T, Field JR, Costi JJ, Martin DK, Stanley RM, Hearn TC. Biceps tenodesis: a biomechanical study of fixation methods. J Shoulder Elbow Surg. 2004;13(2):160-164.
19. Kusma M, Dienst M, Eckert J, Steimer O, Kohn D. Tenodesis of the long head of biceps brachii: cyclic testing of five methods of fixation in a porcine model. J Shoulder Elbow Surg. 2008;17(6):967-973.
20. Lopez-Vidriero E, Costic RS, Fu FH, Rodosky MW. Biomechanical evaluation of 2 arthroscopic biceps tenodeses: double anchor versus percutaneous intra-articular transtendon (PITT) techniques. Am J Sports Med. 2010;38(1):146-152.
21. Su WR, Budoff JE, Chiang CH, Lee CJ, Lin CL. Biomechanical study comparing biceps wedge tenodesis with other proximal long head of the biceps tenodesis techniques. Arthroscopy. 2013;29(9):1498-1505.
22. Trenhaile SW. Biceptor Tenodesis System, Arthroscopic Biceps Tenodesis [operational instructions]. Andover, MA: Smith & Nephew; 2009:1-8.
23. Sekiya LC, Elkousy HA, Rodosky MW. Arthroscopic biceps tenodesis using the percutaneous intra-articular transtendon technique. Arthroscopy. 2003;19(10):1137-1141.
24. Elkousy HA, Fluhme DJ, O’Connor DP, Rodosky MW. Arthroscopic biceps tenodesis using the percutaneous, intra-articular trans-tendon technique: preliminary results. Orthopedics. 2005;28(11):1316-1319.
25. Castagna A, Conti M, Mouhsine E, Bungaro P, Garofalo R. Arthroscopic biceps tendon tenodesis; the anchorage technical note. Knee Surg Sports Traumatol Arthrosc. 2006;14(6):581-585.
26. Checchia SL, Doneux PS, Miyazaki AN, et al. Biceps tenodesis associated with arthroscopic repair of rotator cuff tears. J Shoulder Elbow Surg. 2005;14(2):138-144.
27. Moros C, Levine WN, Ahmad CS. Suture anchor and percutaneous intra-articular transtendon biceps tenodesis. Sports Med Arthrosc. 2008;16(3):177-179.
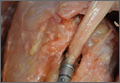
Is a Persistent Vacuum Phenomenon a Sign of Pseudarthrosis After Posterolateral Spinal Fusion?
The spinal vacuum sign or vacuum phenomenon (VP) is the radiographic finding of an air-density linear radiolucency in the intervertebral disc or vertebral body. The result of a gaseous accumulation, it is often a diagnostic sign of disc degeneration as well as a rare sign of infection, Schmorl node formation, or osteonecrosis.1,2 Although the VP was first described on plain radiographs, it is better seen on computed tomography (CT).3 Multiple studies have found a possible association between the VP and nonunion in diaphyseal fractures,4 ankylosing spondylitis,5,6 and lumbar spinal fusion.7
To our knowledge, no one has studied whether the intervertebral VP resolves after posterolateral lumbar spinal fusion in adults with degenerative spinal pathology, and no one has investigated the association between the persistence of the intervertebral VP and pseudarthrosis after posterolateral spinal fusion.
We conducted a study to determine whether the VP resolves after posterolateral lumbar spinal fusion procedures and whether persistence of the VP after fusion surgery is indicative of pseudarthrosis.
Materials and Methods
After obtaining Institutional Review Board approval for this study, we retrospectively reviewed the medical records of patients who had degenerative spinal stenosis with instability and the intervertebral vacuum sign on preoperative digital lumbar spine CT scans and who underwent posterolateral lumbar spinal fusion with or without instrumentation. Study inclusion criteria were lumbar spine CT at minimum 6-month follow-up after spinal fusion and preoperative and postoperative lumbar spine radiographs. Exclusion criteria were any type of interbody fusion procedure (anterior, posterior, transforaminal, lateral) at a level with the VP, age under 21 years, follow-up of less than 6 months, and incomplete radiographic records. As this was a retrospective study, patient consent was not required.
CT was performed with a 16-, 64-, or 128-slice multidetector CT scanner with effective tube current set at 250 to 320 mA, voltage set at 120 to 140 kV, and pitch set at 0.75 to 0.9. After axial acquisition of 3×3-mm isometric voxels, sagittal and coronal multiplanar images were reconstructed with a slice thickness of 2 mm. Patient demographics, diagnoses, and surgical details were recorded. All digital lumbar spine CT scans and radiographs were initially screened on PACS (picture archiving and communication system) by the orthopedic spine surgery fellow at an academic medical institution; then they were reviewed on a radiology reading room monitor by 3 observers (senior radiologist, senior orthopedic spine surgeon, orthopedic spine surgery fellow). Axial images and sagittal and coronal reconstructed images of the preoperative and postoperative follow-up lumbar CT scans—together with the lateral and anteroposterior lumbar spine radiographs—were evaluated for the intervertebral VP. Mean (SD) follow-up (with CT to assess fusion) was 1.6 (0.86) years (range, 0.75-3.38 years). Fusion at each level was evaluated on the postoperative follow-up CT on axial images and sagittal and coronal reconstructed images; criteria for fusion were continuous bridging bone across posterolateral gutters and facets on one or both sides at each intervertebral level.8 Pseudarthrosis was recorded if there was no continuity of bridging bone across both posterolateral gutters and facets, a complete radiolucent line on both sides across a level, or lysis or loosening around screws. All recordings were made by consensus, or by majority decision in case of disagreement.
Presence of the VP at the lumbar levels not included in the fusion was also recorded on the preoperative and follow-up CT scan and radiographs.
Descriptive and inferential statistical tests were performed as applicable. Pearson χ2 test and Fischer exact test were used to evaluate if there was a significant association between the groups where the VP disappeared and persisted and fusion and pseudarthrosis. Significance was set at P < .05. Statistical analysis was performed with Stata Version 10.0.
Results
Using the preoperative lumbar spine CT scans of 18 patients (10 men, 8 women), we identified 36 cases of intervertebral levels exhibiting the VP (median positive vacuum sign levels per patient, 2; minimum, 1; maximum, 5) at the levels included in the fusion (Table 1). Mean (SD) age at surgery was 67.6 (9.4) years (range, 46.5-79.6 years). Mean (SD) radiologic follow-up was 1.6 (0.86) years (range, 0.75-3.38 years). All patients underwent lumbar fusion with local autograft, allograft, and recombinant human bone morphogenetic protein 2. Spinal instrumentation was used in 16 of the 18 patients.
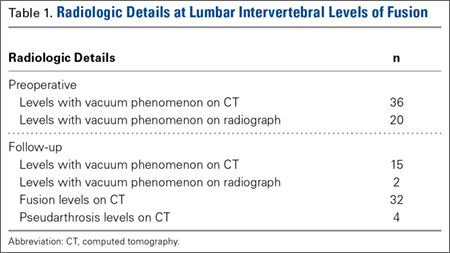
On preoperative CT, positive VP was diagnosed in the 36 cases as follows: L5–S1 (11 cases), L4–L5 (9 cases), L3–L4 (4 cases), L2–L3 (6 cases), L1–L2 (4 cases), and T12–L1 (2 cases). On follow-up CT, 15 cases showed persistence of the VP, and 21 cases showed disappearance of the VP (Table 1).
Evidence of spinal fusion was identified on follow-up CT in 32 (88.9%) of the 36 cases. In 3 of the 18 patients, nonunion was diagnosed. Of the 15 intervertebral cases in which the VP persisted, 13 (86.7%) showed evidence of fusion on CT, and 2 (13.3%) showed evidence of pseudarthrosis. Of the 21 intervertebral cases in which the VP disappeared, 19 (90.5%) showed evidence of fusion on CT, and 2 (9.5%) showed evidence of pseudarthrosis (Table 2). There was no significant difference in fusion rate or pseudarthrosis rate in the groups in which the VP persisted or disappeared (Fischer exact test, P = .99). There was no significant association between VP persistence or disappearance and sex, primary or revision surgery, or intervertebral level (Fischer exact test, P > .05). A case example is shown in the Figure.
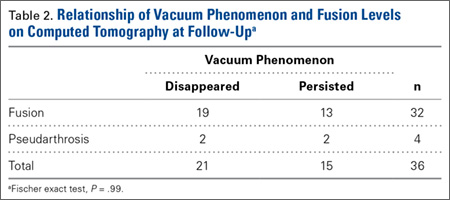
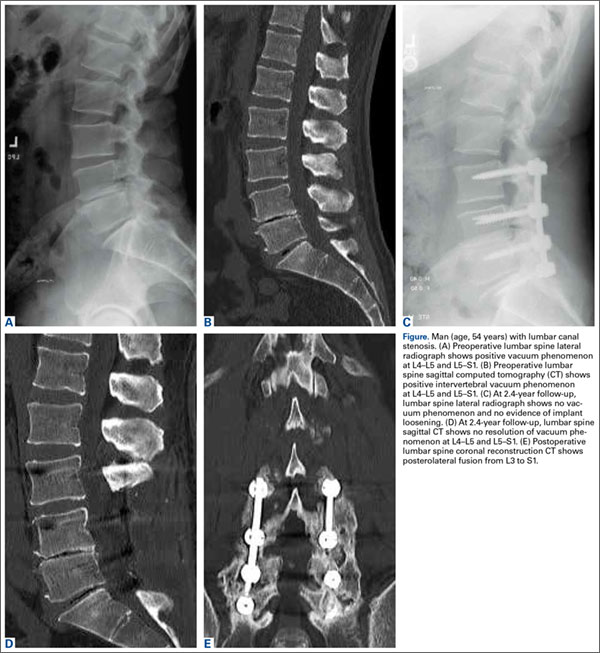
At levels not included in spinal fusion, CT identified the VP at 6 lumbar intervertebral levels before surgery and 11 levels at follow-up. The VP did not disappear at any level not included in the fusion. At follow-up, no new VP was identified in a segment included in fusion. Results are summarized in Table 3.
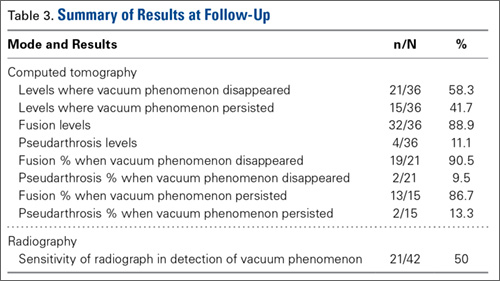
Discussion
The association of radiologic intervertebral VP and disc degeneration, first recognized by Knutsson1 in 1942, refers to the presence of gas, mainly containing nitrogen, in the crevices between or within vertebrae.2 The VP is more often seen in patients older than 50 years, on plain radiographs in hyperextension.9 CT is more sensitive than radiography in detecting the VP; Lardé and colleagues3 found it in about 50% of 50 patients on CT scans but in only 12% of patients on radiographs. The VP is visible because of the nitrogen gas that accumulates when there is a negative pressure within the disc space. Nitrogen emerges from the blood and moves into the disc space; perhaps the disc space opens, causing the negative pressure.1-3 On T1- or T2-weighted magnetic resonance imaging (MRI), the VP is visible as a signal void. MRI, however, is less accurate than CT.10 In a study of 10 patients who had low back pain and more than 1 level of intradiscal VP, and who underwent supine MRI examinations at 0, 1, and 2 hours, Wang and colleagues11 found that, after prolonged supine positioning, the signal intensity of the vacuum was replaced by hyperintense fluid contents. D’Anastasi and colleagues,12 in a study of 20 patients who had lumbar vacuum phenomenon on CT and underwent MRI examinations, found a significant correlation between presence of intradiscal fluid and amount of bone marrow edema on MRI and degenerative endplate abnormalities on CT. In the present study, we found that, after the spinal fusion vacuum phenomenon disappeared in 58.3% of the lumbar levels and persisted in 41.7% on follow-up CT at the levels included in posterolateral fusion, there were 5 new levels, adjacent to the lumbar fusion, where the VP was seen on the follow-up CT.
We studied whether evidence of a persistent vacuum sign on CT is indicative of pseudarthrosis. Other authors have reported an association between the VP and nonunion in fractures4 and ankylosing spondylitis.5,6 In a study of 19 patients with diaphyseal fractures, Stallenberg and colleagues4 found that, in 7 of the 10 patients with nonunion, the VP was detected on CT at the nonunion site. Martel5 first reported on the intervertebral VP in a case of ankylosing spondylitis with spinal pseudarthrosis. Ten years later, in a study of 18 patients with advanced ankylosing spondylitis with spinal pseudarthrosis, Chan and colleagues6 identified the intervertebral VP on CT in 7 patients. Edwards and colleagues7 studied 15 patients with prior lumbar fusion with 17 positive intervertebral VP levels on CT and found that the vacuum disc sign was a strong predictor of lumbar nonunion as determined by surgical exploration. Mirovsky and colleagues13 identified the intravertebral vacuum cleft in 26 patients with an osteoporotic vertebral fracture treated with vertebroplasty and concluded that nonunion of the vertebral fracture could be identified by presence of the intravertebral vacuum cleft on radiography. In the present study, there was radiologic evidence of lumbar spinal fusion in 89% of disc levels with a preoperative positive intervertebral VP and pseudarthrosis in 11% of disc levels. The rate of fusion at levels with the VP was comparable to the rate at intervertebral levels without the phenomenon. These findings indicate that persistence of the VP after spinal fusion is not an indication that fusion has not been achieved. Preoperative VP also did not predispose to failure of fusion. That there is a persistent vacuum disc might imply that, even after successful fusion as seen on CT, some motion may be occurring at the disc level to cause a negative pressure phenomenon. Even in cases of facet fusion with bridging bone, there may still be motion at the disc level, as fusions can plastically deform (even with screws in), particularly in elderly osteopenic bone. We found no association between a persistent vacuum sign and pseudarthrosis. Our study findings are clinically useful even if the benefits are limited. These findings may help surgeons avoid misinterpreting this sign as an indication for additional surgery.
This study had some limitations. First, radiographs were used to determine presence or absence of fusion. Although CT is widely considered the gold standard for noninvasive assessment of fusion,14 even when both posterolateral gutters and facets have been found to be fused on CT, the probability of a solid fusion on exploration ranges from 69% to 96%.8,15 Second, detection of the VP on radiographs and CT may be affected by patient position.11 Third, this was a retrospective series with a small number of patients and limited follow-up with CT. Arthrodesis and the VP may take years to fully evolve. It is possible that fusion rates could be higher on longer follow-up, and resolution of the VP may occur with longer follow-up. Fourth, clinical outcomes were not evaluated, as there are other confounding factors, apart from successful fusion, that could affect clinical outcomes. A larger prospective controlled study would be helpful.
Conclusion
The radiologic intervertebral VP may persist after posterolateral lumbar spinal fusion. We did not find an association between the VP and pseudarthrosis. In addition, VP persistence on follow-up CT was not indicative of pseudarthrosis, and VP disappearance was not indicative of fusion. The vacuum sign should not be misinterpreted as an indication for additional surgery.
1. Knutsson F. The vacuum phenomenon in the intervertebral discs. Acta Radiol. 1942;23:173-179.
2. Resnick D, Niwayama G, Guerra J Jr, Vint V, Usselman J. Spinal vacuum phenomenon: anatomical study and review. Radiology. 1981;139(2):341-348.
3. Lardé D, Mathieu D, Frija J, Gaston A, Vasile N. Spinal vacuum phenomenon: CT diagnosis and significance. J Comput Assist Tomogr. 1982;6(4):671-676.
4. Stallenberg B, Madani A, Burny F, Gevenois PA. The vacuum phenomenon: a CT sign of nonunited fracture. AJR Am J Roentgenol. 2001;176(5):1161-1164.
5. Martel W. Spinal pseudarthrosis: a complication of ankylosing spondylitis. Arthritis Rheum. 1978;21(4):485-490.
6. Chan FL, Ho EK, Chau EM. Spinal pseudarthrosis complicating ankylosing spondylitis: comparison of CT and conventional tomography. AJR Am J Roentgenol. 1988;150(3):611-614.
7. Edwards CE, Antonoiades SB, Ford L, Crabster E. CT vacuum disc sign: a highly specific predictor of lumbar nonunion. Poster presented at: 41st Annual Meeting of the Scoliosis Research Society; September 2006; Monterey, CA.
8. Carreon LY, Djurasovic M, Glassman SD, Sailer P. Diagnostic accuracy and reliability of fine-cut CT scans with reconstructions to determine the status of an instrumented posterolateral fusion with surgical exploration as reference standard. Spine. 2007;32(8):892-895.
9. Goobar JE, Pate D, Resnick D, Sartoris DJ. Radiography of the hyperextended lumbar spine: an effective technique for the demonstration of discal vacuum phenomena. Can Assoc Radiol J. 1987;38(4):271-274.
10. Grenier N, Grossman RI, Schiebler ML, Yeager BA, Goldberg HI, Kressel HY. Degenerative lumbar disk disease: pitfalls and usefulness of MR imaging in detection of vacuum phenomenon. Radiology. 1987;164(3):861-865.
11. Wang HJ, Chen BB, Yu CW, Hsu CY, Shih TT. Alteration of disc vacuum contents during prolonged supine positioning: evaluation with MR Image. Spine. 2007;32(23):2610-2615.
12. D’Anastasi M, Birkenmaier C, Schmidt GP, Wegener B, Reiser MF, Baur-Melnyk A. Correlation between vacuum phenomenon on CT and fluid on MRI in degenerative disks. AJR Am J Roentgenol. 2011;197(5):1182-1189.
13. Mirovsky Y, Anekstein Y, Shalmon E, Peer A. Vacuum clefts of the vertebral bodies. AJNR Am J Neuroradiol. 2005;26(7):1634-1640.
14. Selby MD, Clark SR, Hall DJ, Freeman BJ. Radiologic assessment of spinal fusion. J Am Acad Orthop Surg. 2012;20(11):694-703.
15. Kanayama M, Hashimoto T, Shigenobu K, Yamane S, Bauer TW, Togawa D. A prospective randomized study of posterolateral lumbar fusion using osteogenic protein-1 (OP-1) versus local autograft with ceramic bone substitute: emphasis of surgical exploration and histologic assessment. Spine. 2006;31(10):1067-1074.
The spinal vacuum sign or vacuum phenomenon (VP) is the radiographic finding of an air-density linear radiolucency in the intervertebral disc or vertebral body. The result of a gaseous accumulation, it is often a diagnostic sign of disc degeneration as well as a rare sign of infection, Schmorl node formation, or osteonecrosis.1,2 Although the VP was first described on plain radiographs, it is better seen on computed tomography (CT).3 Multiple studies have found a possible association between the VP and nonunion in diaphyseal fractures,4 ankylosing spondylitis,5,6 and lumbar spinal fusion.7
To our knowledge, no one has studied whether the intervertebral VP resolves after posterolateral lumbar spinal fusion in adults with degenerative spinal pathology, and no one has investigated the association between the persistence of the intervertebral VP and pseudarthrosis after posterolateral spinal fusion.
We conducted a study to determine whether the VP resolves after posterolateral lumbar spinal fusion procedures and whether persistence of the VP after fusion surgery is indicative of pseudarthrosis.
Materials and Methods
After obtaining Institutional Review Board approval for this study, we retrospectively reviewed the medical records of patients who had degenerative spinal stenosis with instability and the intervertebral vacuum sign on preoperative digital lumbar spine CT scans and who underwent posterolateral lumbar spinal fusion with or without instrumentation. Study inclusion criteria were lumbar spine CT at minimum 6-month follow-up after spinal fusion and preoperative and postoperative lumbar spine radiographs. Exclusion criteria were any type of interbody fusion procedure (anterior, posterior, transforaminal, lateral) at a level with the VP, age under 21 years, follow-up of less than 6 months, and incomplete radiographic records. As this was a retrospective study, patient consent was not required.
CT was performed with a 16-, 64-, or 128-slice multidetector CT scanner with effective tube current set at 250 to 320 mA, voltage set at 120 to 140 kV, and pitch set at 0.75 to 0.9. After axial acquisition of 3×3-mm isometric voxels, sagittal and coronal multiplanar images were reconstructed with a slice thickness of 2 mm. Patient demographics, diagnoses, and surgical details were recorded. All digital lumbar spine CT scans and radiographs were initially screened on PACS (picture archiving and communication system) by the orthopedic spine surgery fellow at an academic medical institution; then they were reviewed on a radiology reading room monitor by 3 observers (senior radiologist, senior orthopedic spine surgeon, orthopedic spine surgery fellow). Axial images and sagittal and coronal reconstructed images of the preoperative and postoperative follow-up lumbar CT scans—together with the lateral and anteroposterior lumbar spine radiographs—were evaluated for the intervertebral VP. Mean (SD) follow-up (with CT to assess fusion) was 1.6 (0.86) years (range, 0.75-3.38 years). Fusion at each level was evaluated on the postoperative follow-up CT on axial images and sagittal and coronal reconstructed images; criteria for fusion were continuous bridging bone across posterolateral gutters and facets on one or both sides at each intervertebral level.8 Pseudarthrosis was recorded if there was no continuity of bridging bone across both posterolateral gutters and facets, a complete radiolucent line on both sides across a level, or lysis or loosening around screws. All recordings were made by consensus, or by majority decision in case of disagreement.
Presence of the VP at the lumbar levels not included in the fusion was also recorded on the preoperative and follow-up CT scan and radiographs.
Descriptive and inferential statistical tests were performed as applicable. Pearson χ2 test and Fischer exact test were used to evaluate if there was a significant association between the groups where the VP disappeared and persisted and fusion and pseudarthrosis. Significance was set at P < .05. Statistical analysis was performed with Stata Version 10.0.
Results
Using the preoperative lumbar spine CT scans of 18 patients (10 men, 8 women), we identified 36 cases of intervertebral levels exhibiting the VP (median positive vacuum sign levels per patient, 2; minimum, 1; maximum, 5) at the levels included in the fusion (Table 1). Mean (SD) age at surgery was 67.6 (9.4) years (range, 46.5-79.6 years). Mean (SD) radiologic follow-up was 1.6 (0.86) years (range, 0.75-3.38 years). All patients underwent lumbar fusion with local autograft, allograft, and recombinant human bone morphogenetic protein 2. Spinal instrumentation was used in 16 of the 18 patients.
On preoperative CT, positive VP was diagnosed in the 36 cases as follows: L5–S1 (11 cases), L4–L5 (9 cases), L3–L4 (4 cases), L2–L3 (6 cases), L1–L2 (4 cases), and T12–L1 (2 cases). On follow-up CT, 15 cases showed persistence of the VP, and 21 cases showed disappearance of the VP (Table 1).
Evidence of spinal fusion was identified on follow-up CT in 32 (88.9%) of the 36 cases. In 3 of the 18 patients, nonunion was diagnosed. Of the 15 intervertebral cases in which the VP persisted, 13 (86.7%) showed evidence of fusion on CT, and 2 (13.3%) showed evidence of pseudarthrosis. Of the 21 intervertebral cases in which the VP disappeared, 19 (90.5%) showed evidence of fusion on CT, and 2 (9.5%) showed evidence of pseudarthrosis (Table 2). There was no significant difference in fusion rate or pseudarthrosis rate in the groups in which the VP persisted or disappeared (Fischer exact test, P = .99). There was no significant association between VP persistence or disappearance and sex, primary or revision surgery, or intervertebral level (Fischer exact test, P > .05). A case example is shown in the Figure.
At levels not included in spinal fusion, CT identified the VP at 6 lumbar intervertebral levels before surgery and 11 levels at follow-up. The VP did not disappear at any level not included in the fusion. At follow-up, no new VP was identified in a segment included in fusion. Results are summarized in Table 3.
Discussion
The association of radiologic intervertebral VP and disc degeneration, first recognized by Knutsson1 in 1942, refers to the presence of gas, mainly containing nitrogen, in the crevices between or within vertebrae.2 The VP is more often seen in patients older than 50 years, on plain radiographs in hyperextension.9 CT is more sensitive than radiography in detecting the VP; Lardé and colleagues3 found it in about 50% of 50 patients on CT scans but in only 12% of patients on radiographs. The VP is visible because of the nitrogen gas that accumulates when there is a negative pressure within the disc space. Nitrogen emerges from the blood and moves into the disc space; perhaps the disc space opens, causing the negative pressure.1-3 On T1- or T2-weighted magnetic resonance imaging (MRI), the VP is visible as a signal void. MRI, however, is less accurate than CT.10 In a study of 10 patients who had low back pain and more than 1 level of intradiscal VP, and who underwent supine MRI examinations at 0, 1, and 2 hours, Wang and colleagues11 found that, after prolonged supine positioning, the signal intensity of the vacuum was replaced by hyperintense fluid contents. D’Anastasi and colleagues,12 in a study of 20 patients who had lumbar vacuum phenomenon on CT and underwent MRI examinations, found a significant correlation between presence of intradiscal fluid and amount of bone marrow edema on MRI and degenerative endplate abnormalities on CT. In the present study, we found that, after the spinal fusion vacuum phenomenon disappeared in 58.3% of the lumbar levels and persisted in 41.7% on follow-up CT at the levels included in posterolateral fusion, there were 5 new levels, adjacent to the lumbar fusion, where the VP was seen on the follow-up CT.
We studied whether evidence of a persistent vacuum sign on CT is indicative of pseudarthrosis. Other authors have reported an association between the VP and nonunion in fractures4 and ankylosing spondylitis.5,6 In a study of 19 patients with diaphyseal fractures, Stallenberg and colleagues4 found that, in 7 of the 10 patients with nonunion, the VP was detected on CT at the nonunion site. Martel5 first reported on the intervertebral VP in a case of ankylosing spondylitis with spinal pseudarthrosis. Ten years later, in a study of 18 patients with advanced ankylosing spondylitis with spinal pseudarthrosis, Chan and colleagues6 identified the intervertebral VP on CT in 7 patients. Edwards and colleagues7 studied 15 patients with prior lumbar fusion with 17 positive intervertebral VP levels on CT and found that the vacuum disc sign was a strong predictor of lumbar nonunion as determined by surgical exploration. Mirovsky and colleagues13 identified the intravertebral vacuum cleft in 26 patients with an osteoporotic vertebral fracture treated with vertebroplasty and concluded that nonunion of the vertebral fracture could be identified by presence of the intravertebral vacuum cleft on radiography. In the present study, there was radiologic evidence of lumbar spinal fusion in 89% of disc levels with a preoperative positive intervertebral VP and pseudarthrosis in 11% of disc levels. The rate of fusion at levels with the VP was comparable to the rate at intervertebral levels without the phenomenon. These findings indicate that persistence of the VP after spinal fusion is not an indication that fusion has not been achieved. Preoperative VP also did not predispose to failure of fusion. That there is a persistent vacuum disc might imply that, even after successful fusion as seen on CT, some motion may be occurring at the disc level to cause a negative pressure phenomenon. Even in cases of facet fusion with bridging bone, there may still be motion at the disc level, as fusions can plastically deform (even with screws in), particularly in elderly osteopenic bone. We found no association between a persistent vacuum sign and pseudarthrosis. Our study findings are clinically useful even if the benefits are limited. These findings may help surgeons avoid misinterpreting this sign as an indication for additional surgery.
This study had some limitations. First, radiographs were used to determine presence or absence of fusion. Although CT is widely considered the gold standard for noninvasive assessment of fusion,14 even when both posterolateral gutters and facets have been found to be fused on CT, the probability of a solid fusion on exploration ranges from 69% to 96%.8,15 Second, detection of the VP on radiographs and CT may be affected by patient position.11 Third, this was a retrospective series with a small number of patients and limited follow-up with CT. Arthrodesis and the VP may take years to fully evolve. It is possible that fusion rates could be higher on longer follow-up, and resolution of the VP may occur with longer follow-up. Fourth, clinical outcomes were not evaluated, as there are other confounding factors, apart from successful fusion, that could affect clinical outcomes. A larger prospective controlled study would be helpful.
Conclusion
The radiologic intervertebral VP may persist after posterolateral lumbar spinal fusion. We did not find an association between the VP and pseudarthrosis. In addition, VP persistence on follow-up CT was not indicative of pseudarthrosis, and VP disappearance was not indicative of fusion. The vacuum sign should not be misinterpreted as an indication for additional surgery.
1. Knutsson F. The vacuum phenomenon in the intervertebral discs. Acta Radiol. 1942;23:173-179.
2. Resnick D, Niwayama G, Guerra J Jr, Vint V, Usselman J. Spinal vacuum phenomenon: anatomical study and review. Radiology. 1981;139(2):341-348.
3. Lardé D, Mathieu D, Frija J, Gaston A, Vasile N. Spinal vacuum phenomenon: CT diagnosis and significance. J Comput Assist Tomogr. 1982;6(4):671-676.
4. Stallenberg B, Madani A, Burny F, Gevenois PA. The vacuum phenomenon: a CT sign of nonunited fracture. AJR Am J Roentgenol. 2001;176(5):1161-1164.
5. Martel W. Spinal pseudarthrosis: a complication of ankylosing spondylitis. Arthritis Rheum. 1978;21(4):485-490.
6. Chan FL, Ho EK, Chau EM. Spinal pseudarthrosis complicating ankylosing spondylitis: comparison of CT and conventional tomography. AJR Am J Roentgenol. 1988;150(3):611-614.
7. Edwards CE, Antonoiades SB, Ford L, Crabster E. CT vacuum disc sign: a highly specific predictor of lumbar nonunion. Poster presented at: 41st Annual Meeting of the Scoliosis Research Society; September 2006; Monterey, CA.
8. Carreon LY, Djurasovic M, Glassman SD, Sailer P. Diagnostic accuracy and reliability of fine-cut CT scans with reconstructions to determine the status of an instrumented posterolateral fusion with surgical exploration as reference standard. Spine. 2007;32(8):892-895.
9. Goobar JE, Pate D, Resnick D, Sartoris DJ. Radiography of the hyperextended lumbar spine: an effective technique for the demonstration of discal vacuum phenomena. Can Assoc Radiol J. 1987;38(4):271-274.
10. Grenier N, Grossman RI, Schiebler ML, Yeager BA, Goldberg HI, Kressel HY. Degenerative lumbar disk disease: pitfalls and usefulness of MR imaging in detection of vacuum phenomenon. Radiology. 1987;164(3):861-865.
11. Wang HJ, Chen BB, Yu CW, Hsu CY, Shih TT. Alteration of disc vacuum contents during prolonged supine positioning: evaluation with MR Image. Spine. 2007;32(23):2610-2615.
12. D’Anastasi M, Birkenmaier C, Schmidt GP, Wegener B, Reiser MF, Baur-Melnyk A. Correlation between vacuum phenomenon on CT and fluid on MRI in degenerative disks. AJR Am J Roentgenol. 2011;197(5):1182-1189.
13. Mirovsky Y, Anekstein Y, Shalmon E, Peer A. Vacuum clefts of the vertebral bodies. AJNR Am J Neuroradiol. 2005;26(7):1634-1640.
14. Selby MD, Clark SR, Hall DJ, Freeman BJ. Radiologic assessment of spinal fusion. J Am Acad Orthop Surg. 2012;20(11):694-703.
15. Kanayama M, Hashimoto T, Shigenobu K, Yamane S, Bauer TW, Togawa D. A prospective randomized study of posterolateral lumbar fusion using osteogenic protein-1 (OP-1) versus local autograft with ceramic bone substitute: emphasis of surgical exploration and histologic assessment. Spine. 2006;31(10):1067-1074.
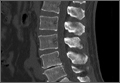
Using Aminocaproic Acid to Reduce Blood Loss After Primary Unilateral Total Knee Arthroplasty
During total knee arthroplasty (TKA), traditionally a thigh tourniquet is used to minimize blood loss. Although intraoperative blood loss is negligible, postoperative blood loss can be extensive, and patients often require blood transfusions. Transfusions expose patients to clinical risks and increase costs. Well-documented transfusion complications include allergic reaction, transfusion-related acute lung injury, transfusion-associated circulatory overload, venous thromboembolism, graft vs host disease, bloodborne infections, and immunomodulation.1 Although measures are taken to reduce these risks, the costs associated with transfusions continue to escalate.2
Postoperative bleeding is attributed to fibrinolytic system activation. The antifibrinolytic agent aminocaproic acid (ACA), a synthetic analogue of the amino acid lysine, acts by competitively blocking the lysine-binding site of plasminogen, inhibiting fibrinolysis.3 Multiple studies have shown that ACA and a similar drug, tranexamic acid, can reduce postoperative blood loss when used intravenously in unilateral TKA.4,5 However, more studies are needed to evaluate antifibrinolytic agents with comparative controls using standardized procedures and documented outcome measures. In addition, the majority of studies have used tranexamic acid rather than ACA, despite the lower cost and similar efficacy of ACA.1,4 ACA is an inexpensive medication with a low risk profile, making it an attractive alternative to historical post-TKA management (which has a higher rate of blood transfusions) and a viable replacement in protocols already implementing tranexamic acid, the more expensive antifibrinolytic.5,6 It has been proposed that ACA use reduces equipment (drain) costs, blood transfusion costs, exposure to complications of blood loss, and transfusion reactions and reduces or eliminates the need for costly medications, such as erythropoiesis-stimulating agents.
Kagoma and colleagues5 reported that antifibrinolytic agents may reduce bleeding by at least 300 mL and may reduce the need for transfusions by 50% or eliminate this need altogether. Other antifibrinolytic agents have been studied in unilateral TKA, with results showing decreased drainage and improved postoperative hemoglobin (Hb) levels.6
We conducted a study to evaluate the effectiveness of a single intraoperative dose of ACA in reducing postoperative blood loss and the need for blood transfusions with increased preservation of postoperative Hb levels.
Methods
In October 2011, Dr. Anderson initiated an intraoperative intravenous (IV) ACA protocol for primary unilateral TKA. Given the decreased drain output immediately observed, and patients’ increased postoperative Hb levels, a retrospective study was proposed. After obtaining full Institutional Review Board approval for the study, we retrospectively reviewed the medical charts of 50 consecutive patients who underwent primary unilateral TKA—the last 25 who had the surgery before the IV ACA protocol was initiated (control group) and the first 25 who were given the IV ACA medication during the surgery (antifibrinolytic group). Inclusion criteria were primary unilateral TKA, no bleeding dyscrasia, no history of anaphylactic response to antifibrinolytic agents, no history of deep vein thrombosis, and normal preoperative coagulation parameters, international normalized ratio (INR), and partial thromboplastin time. Exclusion criteria included lateral corner release, lateral retinacular release, combined extensive deep and superficial medial collateral ligament releases, and cardiac or peripheral stent in place.
Each surgery—a standard primary unilateral TKA with an intramedullary femoral component and an extramedullary tibial component—was performed by Dr. Anderson. Each component was cemented. Each patient underwent a posterior cruciate ligament release and/or a deep medial collateral ligament release. A well-padded thigh tourniquet was inflated before surgical incision, and it remained inflated until all postoperative surgical dressings were applied. Each patient in the antifibrinolytic group was given a 10-g dose of IV ACA at the start of implant cementation; the dose was administered over 10 minutes and was completely infused before tourniquet deflation. For each patient in the control group, a suction drain (Constavac, Stryker) was used. As postoperative drainage was so insignificant in the first 12 antifibrinolytic cases, use of the drain was then discontinued.
All patients received standard postoperative deep vein thrombosis prophylaxis in the form of warfarin in accordance with existing practice. Warfarin was given once a day starting the night of surgery and was continued until discharge based on daily INR values with an agreed-on target of 2.0. Thigh-high compression stockings and calf sequential compression devices were used in all cases. No patient in either group predonated blood or was given erythropoietin injections before or after surgery. Postoperative allogeneic transfusions were given to patients who were clinically symptomatic or short of breath; patients with hypotension uncorrectable with IV volume supplementation and an Hb level under 9.0 g/dL; and patients with an Hb level under 7.0 g/dL regardless of symptoms. All patients were monitored for postoperative adverse events and complications.
Postoperative blood loss (drain output), Hb levels on postoperative days 1 and 2 (POD-1, POD-2), blood transfusion amounts, and complications were recorded for all patients. Group means were compared with 2-sample t tests for independent samples. Data are reported as group means and SDs. All significance tests were 2-tailed, and statistical significance was set at P < .05.
Results
Fifty patients enrolled in the study: 25 in the control group and 25 in the antifibrinolytic group. Table 1 compares the main characteristics of the 2 groups. No significant differences were found between these groups for any of the characteristics considered.
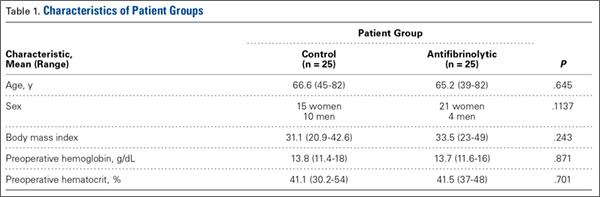
There was significantly (P < .0001) more postoperative drainage in the control group: Mean drain output was 410.9 mL for the control group and 155.0 mL for the antifibrinolytic group (Table 2). Patients in the antifibrinolytic group did not receive any blood transfusions, whereas 40% of patients in the control group received transfusions (P = .022). On average, the transfused patients received 0.4 unit of packed red blood cells.
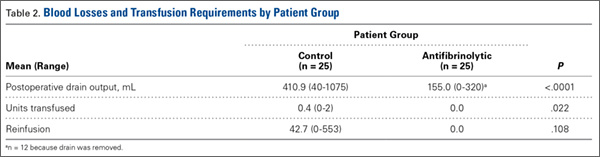
Although there was no statistically significant difference in POD-1 or POD-2 Hb levels between the antifibrinolytic and control groups, the antifibrinolytic group trended higher on POD-1 (11.1 g vs 10.7 g; P = .108) and POD-2 (11.5 g vs 10.2 g; P = .117) (Table 3). Mean Hb level was 8.1 g for control patients transfused on POD-1 and 7.9 g for control patients transfused on POD-2. For control patients who were not transfused, mean Hb level was 10.7 g on POD-1 and 10.2 g on POD-2.
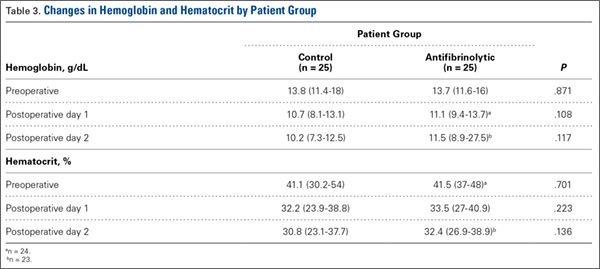
There were no adverse events (eg, anaphylaxis, hypersensitivity) in either group, and there was no difference in incision drainage or returns to operating room between the groups.
Discussion
In TKA, a tourniquet is used to minimize intraoperative blood loss; postoperative bleeding, however, is often extensive. Both surgery and tourniquet use are reported to enhance local fibrinolytic activity within the limb.8 The synthetic antifibrinolytic ACA reduces blood loss by clot stabilization rather than by promotion of clot formation.8
In the present study, a single intraoperative dose of IV ACA administered in primary unilateral TKA significantly reduced postoperative wound drainage and eliminated the need for postoperative allogeneic blood transfusions. In addition, patients who received ACA had higher Hb levels on POD-1 and POD-2. These results are similar to those of other clinical trials in which external blood losses were measured.4-7 The postoperative drain output differences (~250 mL) in our study are clinically relevant, as they indicate significant reductions in postoperative blood loss with the implementation of an antifibrinolytic operative protocol.
In a study by Ponnusamy and colleagues,1 blood transfusion after orthopedic surgery accounted for 10% of all packed red blood cell transfusions, but use varied widely. National TKA transfusion rates vary from 4.3% to 63.8% among surgeons and hospitals.9 This evidence calls for standardization and critical review of practices to ensure more efficient use of blood products, effectively protecting patients from unneeded complications and reducing hospital costs. Mounting evidence supporting the efficacy of ACA in reducing perioperative blood loss and lowering postoperative blood transfusion rates points toward including antifibrinolytic therapy in standard TKA protocols. In our study, 40% of control patients and no antifibrinolytic patients required a transfusion—a stark contrast.
Although our antifibrinolytic group’s postoperative Hb levels were not statistically significantly higher, their being elevated illustrates the protective effect of intraoperative use of antifibrinolytics in TKA. This elevation in Hb levels is especially valid given the similarity of the antifibrinolytic and control patients’ preoperative Hb levels (P = .871) (Table 1). Other studies have shown similar upward trends in postoperative Hb levels, many of which were statistically significant.5-8,10
Conclusion
This study showed that a single intraoperative 10-g dose of IV ACA significantly reduced perioperative blood loss and lowered blood transfusion rates in TKA. In addition, postoperative Hb levels were higher in the patients who received ACA than in patients who did not receive an antifibrinolytic. The positive effects of ACA were obtained without adverse events or complications, making use of this antifibrinolytic a relevant addition to TKA protocols.
1. Ponnusamy KE, Kim TJ, Khanuja HS. Perioperative blood transfusions in orthopaedic surgery. J Bone Joint Surg Am. 2014;96(21):1836-1844.
2. Spahn DR, Casutt M. Eliminating blood transfusions: new aspects and perspectives. Anesthesiology. 2000;93(1):242-255.
3. Van Aelbrouck C, Englberger L, Faraoni D. Review of the fibrinolytic system: comparison of different antifibrinolytics used during cardiopulmonary bypass. Recent Pat Cardiovasc Drug Discov. 2012;7(3):175-179.
4. Sepah YJ, Umer M, Ahmad T, Nasim F, Chaudhry MU, Umar M. Use of tranexamic acid is a cost effective method in preventing blood loss during and after total knee replacement. J Orthop Surg Res. 2011;6:22.
5. Kagoma YK, Crowther MA, Douketis J, Bhandari M, Eikelboom J, Lim W. Use of antifibrinolytic therapy to reduce transfusion in patients undergoing orthopedic surgery: a systematic review of randomized trials. Thromb Res. 2009;123(5):687-696.
6. Zufferey P, Merquiol F, Laporte S, et al. Do antifibrinolytics reduce allogeneic blood transfusion in orthopedic surgery? Anesthesiology. 2006;105(5):1034-1046.
7. Camarasa MA, Ollé G, Serra-Prat M, et al. Efficacy of aminocaproic, tranexamic acids in the control of bleeding during total knee replacement: a randomized clinical trial. Br J Anaesth. 2006;96(5):576-582.
8. Orpen NM, Little C, Walker G, Crawfurd EJ. Tranexamic acid reduces early post-operative blood loss after total knee arthroplasty: a prospective randomised controlled trial of 29 patients. Knee. 2006;13(2):106-110.
9. Chen AF, Klatt BA, Yazer MH, Waters JH. Blood utilization after primary total joint arthroplasty in a large hospital network. HSS J. 2013;9(2):123-128.
10. Aguilera X, Martinez-Zapata MJ, Bosch A, et al. Efficacy and safety of fibrin glue and tranexamic acid to prevent postoperative blood loss in total knee arthroplasty: a randomized controlled clinical trial. J Bone Joint Surg Am. 2013;95(22):2001-2007.
During total knee arthroplasty (TKA), traditionally a thigh tourniquet is used to minimize blood loss. Although intraoperative blood loss is negligible, postoperative blood loss can be extensive, and patients often require blood transfusions. Transfusions expose patients to clinical risks and increase costs. Well-documented transfusion complications include allergic reaction, transfusion-related acute lung injury, transfusion-associated circulatory overload, venous thromboembolism, graft vs host disease, bloodborne infections, and immunomodulation.1 Although measures are taken to reduce these risks, the costs associated with transfusions continue to escalate.2
Postoperative bleeding is attributed to fibrinolytic system activation. The antifibrinolytic agent aminocaproic acid (ACA), a synthetic analogue of the amino acid lysine, acts by competitively blocking the lysine-binding site of plasminogen, inhibiting fibrinolysis.3 Multiple studies have shown that ACA and a similar drug, tranexamic acid, can reduce postoperative blood loss when used intravenously in unilateral TKA.4,5 However, more studies are needed to evaluate antifibrinolytic agents with comparative controls using standardized procedures and documented outcome measures. In addition, the majority of studies have used tranexamic acid rather than ACA, despite the lower cost and similar efficacy of ACA.1,4 ACA is an inexpensive medication with a low risk profile, making it an attractive alternative to historical post-TKA management (which has a higher rate of blood transfusions) and a viable replacement in protocols already implementing tranexamic acid, the more expensive antifibrinolytic.5,6 It has been proposed that ACA use reduces equipment (drain) costs, blood transfusion costs, exposure to complications of blood loss, and transfusion reactions and reduces or eliminates the need for costly medications, such as erythropoiesis-stimulating agents.
Kagoma and colleagues5 reported that antifibrinolytic agents may reduce bleeding by at least 300 mL and may reduce the need for transfusions by 50% or eliminate this need altogether. Other antifibrinolytic agents have been studied in unilateral TKA, with results showing decreased drainage and improved postoperative hemoglobin (Hb) levels.6
We conducted a study to evaluate the effectiveness of a single intraoperative dose of ACA in reducing postoperative blood loss and the need for blood transfusions with increased preservation of postoperative Hb levels.
Methods
In October 2011, Dr. Anderson initiated an intraoperative intravenous (IV) ACA protocol for primary unilateral TKA. Given the decreased drain output immediately observed, and patients’ increased postoperative Hb levels, a retrospective study was proposed. After obtaining full Institutional Review Board approval for the study, we retrospectively reviewed the medical charts of 50 consecutive patients who underwent primary unilateral TKA—the last 25 who had the surgery before the IV ACA protocol was initiated (control group) and the first 25 who were given the IV ACA medication during the surgery (antifibrinolytic group). Inclusion criteria were primary unilateral TKA, no bleeding dyscrasia, no history of anaphylactic response to antifibrinolytic agents, no history of deep vein thrombosis, and normal preoperative coagulation parameters, international normalized ratio (INR), and partial thromboplastin time. Exclusion criteria included lateral corner release, lateral retinacular release, combined extensive deep and superficial medial collateral ligament releases, and cardiac or peripheral stent in place.
Each surgery—a standard primary unilateral TKA with an intramedullary femoral component and an extramedullary tibial component—was performed by Dr. Anderson. Each component was cemented. Each patient underwent a posterior cruciate ligament release and/or a deep medial collateral ligament release. A well-padded thigh tourniquet was inflated before surgical incision, and it remained inflated until all postoperative surgical dressings were applied. Each patient in the antifibrinolytic group was given a 10-g dose of IV ACA at the start of implant cementation; the dose was administered over 10 minutes and was completely infused before tourniquet deflation. For each patient in the control group, a suction drain (Constavac, Stryker) was used. As postoperative drainage was so insignificant in the first 12 antifibrinolytic cases, use of the drain was then discontinued.
All patients received standard postoperative deep vein thrombosis prophylaxis in the form of warfarin in accordance with existing practice. Warfarin was given once a day starting the night of surgery and was continued until discharge based on daily INR values with an agreed-on target of 2.0. Thigh-high compression stockings and calf sequential compression devices were used in all cases. No patient in either group predonated blood or was given erythropoietin injections before or after surgery. Postoperative allogeneic transfusions were given to patients who were clinically symptomatic or short of breath; patients with hypotension uncorrectable with IV volume supplementation and an Hb level under 9.0 g/dL; and patients with an Hb level under 7.0 g/dL regardless of symptoms. All patients were monitored for postoperative adverse events and complications.
Postoperative blood loss (drain output), Hb levels on postoperative days 1 and 2 (POD-1, POD-2), blood transfusion amounts, and complications were recorded for all patients. Group means were compared with 2-sample t tests for independent samples. Data are reported as group means and SDs. All significance tests were 2-tailed, and statistical significance was set at P < .05.
Results
Fifty patients enrolled in the study: 25 in the control group and 25 in the antifibrinolytic group. Table 1 compares the main characteristics of the 2 groups. No significant differences were found between these groups for any of the characteristics considered.
There was significantly (P < .0001) more postoperative drainage in the control group: Mean drain output was 410.9 mL for the control group and 155.0 mL for the antifibrinolytic group (Table 2). Patients in the antifibrinolytic group did not receive any blood transfusions, whereas 40% of patients in the control group received transfusions (P = .022). On average, the transfused patients received 0.4 unit of packed red blood cells.
Although there was no statistically significant difference in POD-1 or POD-2 Hb levels between the antifibrinolytic and control groups, the antifibrinolytic group trended higher on POD-1 (11.1 g vs 10.7 g; P = .108) and POD-2 (11.5 g vs 10.2 g; P = .117) (Table 3). Mean Hb level was 8.1 g for control patients transfused on POD-1 and 7.9 g for control patients transfused on POD-2. For control patients who were not transfused, mean Hb level was 10.7 g on POD-1 and 10.2 g on POD-2.
There were no adverse events (eg, anaphylaxis, hypersensitivity) in either group, and there was no difference in incision drainage or returns to operating room between the groups.
Discussion
In TKA, a tourniquet is used to minimize intraoperative blood loss; postoperative bleeding, however, is often extensive. Both surgery and tourniquet use are reported to enhance local fibrinolytic activity within the limb.8 The synthetic antifibrinolytic ACA reduces blood loss by clot stabilization rather than by promotion of clot formation.8
In the present study, a single intraoperative dose of IV ACA administered in primary unilateral TKA significantly reduced postoperative wound drainage and eliminated the need for postoperative allogeneic blood transfusions. In addition, patients who received ACA had higher Hb levels on POD-1 and POD-2. These results are similar to those of other clinical trials in which external blood losses were measured.4-7 The postoperative drain output differences (~250 mL) in our study are clinically relevant, as they indicate significant reductions in postoperative blood loss with the implementation of an antifibrinolytic operative protocol.
In a study by Ponnusamy and colleagues,1 blood transfusion after orthopedic surgery accounted for 10% of all packed red blood cell transfusions, but use varied widely. National TKA transfusion rates vary from 4.3% to 63.8% among surgeons and hospitals.9 This evidence calls for standardization and critical review of practices to ensure more efficient use of blood products, effectively protecting patients from unneeded complications and reducing hospital costs. Mounting evidence supporting the efficacy of ACA in reducing perioperative blood loss and lowering postoperative blood transfusion rates points toward including antifibrinolytic therapy in standard TKA protocols. In our study, 40% of control patients and no antifibrinolytic patients required a transfusion—a stark contrast.
Although our antifibrinolytic group’s postoperative Hb levels were not statistically significantly higher, their being elevated illustrates the protective effect of intraoperative use of antifibrinolytics in TKA. This elevation in Hb levels is especially valid given the similarity of the antifibrinolytic and control patients’ preoperative Hb levels (P = .871) (Table 1). Other studies have shown similar upward trends in postoperative Hb levels, many of which were statistically significant.5-8,10
Conclusion
This study showed that a single intraoperative 10-g dose of IV ACA significantly reduced perioperative blood loss and lowered blood transfusion rates in TKA. In addition, postoperative Hb levels were higher in the patients who received ACA than in patients who did not receive an antifibrinolytic. The positive effects of ACA were obtained without adverse events or complications, making use of this antifibrinolytic a relevant addition to TKA protocols.
1. Ponnusamy KE, Kim TJ, Khanuja HS. Perioperative blood transfusions in orthopaedic surgery. J Bone Joint Surg Am. 2014;96(21):1836-1844.
2. Spahn DR, Casutt M. Eliminating blood transfusions: new aspects and perspectives. Anesthesiology. 2000;93(1):242-255.
3. Van Aelbrouck C, Englberger L, Faraoni D. Review of the fibrinolytic system: comparison of different antifibrinolytics used during cardiopulmonary bypass. Recent Pat Cardiovasc Drug Discov. 2012;7(3):175-179.
4. Sepah YJ, Umer M, Ahmad T, Nasim F, Chaudhry MU, Umar M. Use of tranexamic acid is a cost effective method in preventing blood loss during and after total knee replacement. J Orthop Surg Res. 2011;6:22.
5. Kagoma YK, Crowther MA, Douketis J, Bhandari M, Eikelboom J, Lim W. Use of antifibrinolytic therapy to reduce transfusion in patients undergoing orthopedic surgery: a systematic review of randomized trials. Thromb Res. 2009;123(5):687-696.
6. Zufferey P, Merquiol F, Laporte S, et al. Do antifibrinolytics reduce allogeneic blood transfusion in orthopedic surgery? Anesthesiology. 2006;105(5):1034-1046.
7. Camarasa MA, Ollé G, Serra-Prat M, et al. Efficacy of aminocaproic, tranexamic acids in the control of bleeding during total knee replacement: a randomized clinical trial. Br J Anaesth. 2006;96(5):576-582.
8. Orpen NM, Little C, Walker G, Crawfurd EJ. Tranexamic acid reduces early post-operative blood loss after total knee arthroplasty: a prospective randomised controlled trial of 29 patients. Knee. 2006;13(2):106-110.
9. Chen AF, Klatt BA, Yazer MH, Waters JH. Blood utilization after primary total joint arthroplasty in a large hospital network. HSS J. 2013;9(2):123-128.
10. Aguilera X, Martinez-Zapata MJ, Bosch A, et al. Efficacy and safety of fibrin glue and tranexamic acid to prevent postoperative blood loss in total knee arthroplasty: a randomized controlled clinical trial. J Bone Joint Surg Am. 2013;95(22):2001-2007.