User login
Open Clinical Trials for Patients With Prostate Cancer
Providing access to clinical trials for veteran and active-duty military patients can be a challenge, but a significant number of trials are now recruiting patients from those patient populations. More than 63,000 open trials currently are listed on the ClinicalTrials.gov website. Many explicitly recruit patients from the VA (461 studies), the military (437 studies), and IHS (2 studies). The VA Health Services Research and Development department alone sponsors > 250 research initiatives, and many more are sponsored by Walter Reed National Medical Center and other major defense and VA facilities.
The clinical trials listed below are all open as of July 25, 2016; have at least 1 VA, DoD, or IHS location recruiting patients; and are focused on treatment for prostate cancer. For additional information and full inclusion/exclusion criteria, please consult https://clinicaltrials.gov.
Optimizing Veteran-Centered Prostate Cancer Survivorship Care
This study will provide much needed information about how to optimize the quality of care and quality of life of veterans who are survivors of prostate cancer.
ID: NCT01900561
Sponsor: VA Office of Research and Development
Location (contact): VA Ann Arbor Health Care System, Michigan (Tabitha Metreger); St. Louis VAMC, Missouri; John Cochran Division (Robert L. Grubb); VA Pittsburgh Healthcare System, University Drive Division, Pennslyvania (Bruce S. Ling)
Vitamin D3 Supplementation for Low-Risk Prostate Cancer: A Randomized Trial
Vitamin D promotes the differentiation of prostate cancer cells and maintains the differentiated phenotype of prostate epithelial cells. The results of the investigators’ clinical studies indicate that vitamin D3 supplementation results in a decrease of positive cancer cores at repeat biopsy in subjects with low-risk prostate cancer. The investigators hypothesize that veterans who have early-stage prostate cancer and who take vitamin D3 at 4,000 international units per day (intervention group) will show an improvement in the number of positive cores and in Gleason score at repeat biopsy, and a decreased likelihood of undergoing definitive treatment (prostatectomy or radiation therapy), compared to veteran subjects taking placebo (control group).
ID: NCT01759771
Sponsor: VA Office of Research and Development
Location (contact): Ralph H. Johnson VAMC, South Carolina (M. Rita I. Young)
An Epidemiological Study of Genetic Risk Factors for Prostate Cancer in African American and Caucasian Males
This study will examine the association of genetic variants and gene expression patterns with the risk of prostate cancer. It will include genotype analysis of blood DNA from 600 patients with the disease and from 600 healthy people, and there will be a gene expression analysis of prostate tumors.
ID: NCT00342771
Sponsor: National Cancer Institute
Location (contact): Baltimore VAMC, Maryland (Alexander Richard)
MRI-Based Active Surveillance to Avoid the Risks of Serial Biopsies in Men With Low-Risk Prostate Cancer
Phase II non-inferiority randomized trial of annual systematic biopsies versus mpMRI and targeted biopsies for men with low-risk prostate cancer on active surveillance with any volume Gleason Score 6, but no prior MRI imaging of the prostate.
ID: NCT02564549
Sponsor: Virginia Commonwealth University
Location (contact): Hunter Holmes McGuire VAMC, Virginia (Drew Moghanaki)
Enzalutamide With or Without Abiraterone and Prednisone in Treating Patients With Castration-Resistant Metastatic Prostate Cancer
This randomized phase III trial studies enzalutamide to see how well it works compared to enzalutamide, abiraterone, and prednisone in treating patients with castration-resistant metastatic prostate cancer. Androgens can cause the growth of prostate cancer cells. Drugs, such as enzalutamide, abiraterone acetate, and prednisone, may lessen the amount of androgens made by the body.
ID: NCT01949337
Sponsor: Alliance for Clinical Trials in Oncology
Location (contact): Naval Medical Center, California (Preston Gable); San Francisco VAMC, California (Terence Friedlander); VA Connecticut Healthcare System-West Haven Campus (Herta Chao); Washington DC VAMC (Anthony Arcenas); Edward Hines, Jr. VA Hospital, Illinois (Elizabeth Henry); Minneapolis VA Health Care System, Minnesota (Sharon Luikart); Kansas City VAMC, Missouri (Peter Van Veldhuizen); VA New Jersey Health Care System (Victor Chang); Bronx VAMC, New York (Yeun-Hee Park); VA Western New York Healthcare System-Buffalo (Lynn Steinbrenner); Syracus VAMC, New York (Namita Chittoria); Durham VAMC, North Carolina (Daphne Friedman); White River Junction VAMC, Vermont (Alexander Fuld); Clement J. Zablocki VAMC, Wisconsin (Elizabeth Gore)
S1216, Phase III ADT+TAK-700 vs ADT+ Bicalutamide for Metastatic Prostate Cancer
The purpose of this study is to compare overall survival in newly diagnosed metastatic prostate cancer patients randomly assigned to androgen deprivation therapy + TAK-700 vs ADT + bicalutamide.
ID: NCT01809691
Sponsor: Southwest Oncology Group
Location (contact): Washington DC VAMC (Anthony Arcenas); Edward Hines, Jr. Hines VA Hospital, Illinois (Elizabeth Henry); Kansas City VAMC, Missouri (Peter Van Veldhuizen); VA New Jersey Health Care System (Victor Chang); VA New York Harbor Healthcare System-Brooklyn Campus (Andrea N. Leaf); VA Western New York Health Care System-Buffalo (Lynn Steinbrenner); Portland VAMC, Oregon (Julie N. Graff); Michael E. DeBakey VAMC, Texas; Tripler Army Medical Center, Hawaii (Jeffrey L. Berenberg)
Stereotactic Body Radiation Therapy in Treating Patients With Metastatic Breast Cancer, Non-small Cell Lung Cancer, or Prostate Cancer
This phase I trial studies the side effects and the best dose of stereotactic body radiation therapy in treating patients with breast cancer, non-small cell lung cancer, or prostate cancer that has spread to other parts of the body. Stereotactic body radiation therapy delivers fewer, tightly-focused, high doses of radiation therapy to all known sites of cancer in the body while minimizing radiation exposure of surrounding normal tissue.
ID: NCT02206334
Sponsor: NRG Oncology, National Cancer Institute
Location (contact): Clement J. Zablocki VAMC, Wisconsin (Elizabeth Gore)
Ciprofloxacin Compared to Placebo in Diagnosing Prostate Cancer in Patients Undergoing Prostate Biopsy
This phase II trial studies ciprofloxacin compared to an inactive treatment (placebo) in diagnosing prostate cancer in patients undergoing removal of prostate cells or tissues for examination (biopsy). Ciprofloxacin is an antibiotic, a type of drug used to treat infections caused by bacteria. Giving ciprofloxacin to patients undergoing a prostate biopsy may help to lower abnormal prostate-specific antigen levels caused by bacterial infection of the prostate gland and may or may not affect the detection rate of prostate cancer.
ID: NCT02252978
Sponsor: Comprehensive Cancer Center of Wake Forest University
Location not yet recruiting (contact): W.G. (Bill) Hefner VAMC, North Carolina (Kethandapatti C. Balaji)
Prostate Active Surveillance Study
The Prostate Active Surveillance Study (PASS) is a research study for men who have chosen active surveillance as a management plan for their prostate cancer. Active surveillance is defined as close monitoring of prostate cancer with the offer of treatment if there are changes in test results. This study seeks to discover markers that will identify cancers that are more aggressive from those tumors that grow slowly.
ID: NCT00756665
Sponsor: University of Washington
Location (contact): VA Puget Sound Health Care System, Washington (Branda Levchak
Androgen-Deprivation Therapy and Radiation Therapy in Treating Patients With Prostate Cancer
Androgens can cause the growth of prostate cancer cells. Androgen deprivation therapy may stop the adrenal glands from making androgens. Radiation therapy uses high-energy X-rays to kill tumor cells. This randomized phase III trial studies androgen-deprivation therapy and radiation therapy in treating patients with prostate cancer.
ID: NCT01368588
Sponsor: Radiation Therapy Oncology Group
Location (contact): VA Long Beach Healthcare System, California (Samar H. Azawi); Clement J. Zablocki VAMC, Wisconsin (Elizabeth Gore)
Effect of Quercetin on Green Tea Polyphenol Uptake in Prostate Tissue From Patients With Prostate Cancer Undergoing Surgery
This randomized pilot phase I trial will evaluate if quercetin enhances the uptake of green tea polyphenols in the prostate tissue of men taking green tea extract and undergoing radical prostatectomy. Side effects of green tea extract and quercetin in combination with green tea extract will also be evaluated. In preclinical studies, green tea polyphenols have anticancer and cancer preventative effects in a number of malignancies. Likewise, in preclinical studies quercetin was found to enhance the anticancer effects of green tea. This trial is designed to translate these findings forward in a short-term human intervention trial.
ID: NCT01912820
Sponsor: Jonsson Comprehensive Cancer Center
Location (contact): VA Greater Los Angeles Healthcare System, California (William Aronson)
A Study to Evaluate Characteristics Predictive of a Positive Imaging Study for Distant Metastases in Patients With Castration-Resistant Prostate Cancer (PREDICT)
The primary purpose of this research is to describe patient characteristics predictive of an imaging study positive for distant metastases in patients with castration-resistant prostate cancer and no known distant metastases.
ID: NCT01981109
Sponsor: Dendreon
Location (contact): VA Greater Los Angeles Healthcare System, California (Amy Smallcomb)
Click here to read the digital edition.
Note: Page numbers differ between the print issue and digital edition.
Providing access to clinical trials for veteran and active-duty military patients can be a challenge, but a significant number of trials are now recruiting patients from those patient populations. More than 63,000 open trials currently are listed on the ClinicalTrials.gov website. Many explicitly recruit patients from the VA (461 studies), the military (437 studies), and IHS (2 studies). The VA Health Services Research and Development department alone sponsors > 250 research initiatives, and many more are sponsored by Walter Reed National Medical Center and other major defense and VA facilities.
The clinical trials listed below are all open as of July 25, 2016; have at least 1 VA, DoD, or IHS location recruiting patients; and are focused on treatment for prostate cancer. For additional information and full inclusion/exclusion criteria, please consult https://clinicaltrials.gov.
Optimizing Veteran-Centered Prostate Cancer Survivorship Care
This study will provide much needed information about how to optimize the quality of care and quality of life of veterans who are survivors of prostate cancer.
ID: NCT01900561
Sponsor: VA Office of Research and Development
Location (contact): VA Ann Arbor Health Care System, Michigan (Tabitha Metreger); St. Louis VAMC, Missouri; John Cochran Division (Robert L. Grubb); VA Pittsburgh Healthcare System, University Drive Division, Pennslyvania (Bruce S. Ling)
Vitamin D3 Supplementation for Low-Risk Prostate Cancer: A Randomized Trial
Vitamin D promotes the differentiation of prostate cancer cells and maintains the differentiated phenotype of prostate epithelial cells. The results of the investigators’ clinical studies indicate that vitamin D3 supplementation results in a decrease of positive cancer cores at repeat biopsy in subjects with low-risk prostate cancer. The investigators hypothesize that veterans who have early-stage prostate cancer and who take vitamin D3 at 4,000 international units per day (intervention group) will show an improvement in the number of positive cores and in Gleason score at repeat biopsy, and a decreased likelihood of undergoing definitive treatment (prostatectomy or radiation therapy), compared to veteran subjects taking placebo (control group).
ID: NCT01759771
Sponsor: VA Office of Research and Development
Location (contact): Ralph H. Johnson VAMC, South Carolina (M. Rita I. Young)
An Epidemiological Study of Genetic Risk Factors for Prostate Cancer in African American and Caucasian Males
This study will examine the association of genetic variants and gene expression patterns with the risk of prostate cancer. It will include genotype analysis of blood DNA from 600 patients with the disease and from 600 healthy people, and there will be a gene expression analysis of prostate tumors.
ID: NCT00342771
Sponsor: National Cancer Institute
Location (contact): Baltimore VAMC, Maryland (Alexander Richard)
MRI-Based Active Surveillance to Avoid the Risks of Serial Biopsies in Men With Low-Risk Prostate Cancer
Phase II non-inferiority randomized trial of annual systematic biopsies versus mpMRI and targeted biopsies for men with low-risk prostate cancer on active surveillance with any volume Gleason Score 6, but no prior MRI imaging of the prostate.
ID: NCT02564549
Sponsor: Virginia Commonwealth University
Location (contact): Hunter Holmes McGuire VAMC, Virginia (Drew Moghanaki)
Enzalutamide With or Without Abiraterone and Prednisone in Treating Patients With Castration-Resistant Metastatic Prostate Cancer
This randomized phase III trial studies enzalutamide to see how well it works compared to enzalutamide, abiraterone, and prednisone in treating patients with castration-resistant metastatic prostate cancer. Androgens can cause the growth of prostate cancer cells. Drugs, such as enzalutamide, abiraterone acetate, and prednisone, may lessen the amount of androgens made by the body.
ID: NCT01949337
Sponsor: Alliance for Clinical Trials in Oncology
Location (contact): Naval Medical Center, California (Preston Gable); San Francisco VAMC, California (Terence Friedlander); VA Connecticut Healthcare System-West Haven Campus (Herta Chao); Washington DC VAMC (Anthony Arcenas); Edward Hines, Jr. VA Hospital, Illinois (Elizabeth Henry); Minneapolis VA Health Care System, Minnesota (Sharon Luikart); Kansas City VAMC, Missouri (Peter Van Veldhuizen); VA New Jersey Health Care System (Victor Chang); Bronx VAMC, New York (Yeun-Hee Park); VA Western New York Healthcare System-Buffalo (Lynn Steinbrenner); Syracus VAMC, New York (Namita Chittoria); Durham VAMC, North Carolina (Daphne Friedman); White River Junction VAMC, Vermont (Alexander Fuld); Clement J. Zablocki VAMC, Wisconsin (Elizabeth Gore)
S1216, Phase III ADT+TAK-700 vs ADT+ Bicalutamide for Metastatic Prostate Cancer
The purpose of this study is to compare overall survival in newly diagnosed metastatic prostate cancer patients randomly assigned to androgen deprivation therapy + TAK-700 vs ADT + bicalutamide.
ID: NCT01809691
Sponsor: Southwest Oncology Group
Location (contact): Washington DC VAMC (Anthony Arcenas); Edward Hines, Jr. Hines VA Hospital, Illinois (Elizabeth Henry); Kansas City VAMC, Missouri (Peter Van Veldhuizen); VA New Jersey Health Care System (Victor Chang); VA New York Harbor Healthcare System-Brooklyn Campus (Andrea N. Leaf); VA Western New York Health Care System-Buffalo (Lynn Steinbrenner); Portland VAMC, Oregon (Julie N. Graff); Michael E. DeBakey VAMC, Texas; Tripler Army Medical Center, Hawaii (Jeffrey L. Berenberg)
Stereotactic Body Radiation Therapy in Treating Patients With Metastatic Breast Cancer, Non-small Cell Lung Cancer, or Prostate Cancer
This phase I trial studies the side effects and the best dose of stereotactic body radiation therapy in treating patients with breast cancer, non-small cell lung cancer, or prostate cancer that has spread to other parts of the body. Stereotactic body radiation therapy delivers fewer, tightly-focused, high doses of radiation therapy to all known sites of cancer in the body while minimizing radiation exposure of surrounding normal tissue.
ID: NCT02206334
Sponsor: NRG Oncology, National Cancer Institute
Location (contact): Clement J. Zablocki VAMC, Wisconsin (Elizabeth Gore)
Ciprofloxacin Compared to Placebo in Diagnosing Prostate Cancer in Patients Undergoing Prostate Biopsy
This phase II trial studies ciprofloxacin compared to an inactive treatment (placebo) in diagnosing prostate cancer in patients undergoing removal of prostate cells or tissues for examination (biopsy). Ciprofloxacin is an antibiotic, a type of drug used to treat infections caused by bacteria. Giving ciprofloxacin to patients undergoing a prostate biopsy may help to lower abnormal prostate-specific antigen levels caused by bacterial infection of the prostate gland and may or may not affect the detection rate of prostate cancer.
ID: NCT02252978
Sponsor: Comprehensive Cancer Center of Wake Forest University
Location not yet recruiting (contact): W.G. (Bill) Hefner VAMC, North Carolina (Kethandapatti C. Balaji)
Prostate Active Surveillance Study
The Prostate Active Surveillance Study (PASS) is a research study for men who have chosen active surveillance as a management plan for their prostate cancer. Active surveillance is defined as close monitoring of prostate cancer with the offer of treatment if there are changes in test results. This study seeks to discover markers that will identify cancers that are more aggressive from those tumors that grow slowly.
ID: NCT00756665
Sponsor: University of Washington
Location (contact): VA Puget Sound Health Care System, Washington (Branda Levchak
Androgen-Deprivation Therapy and Radiation Therapy in Treating Patients With Prostate Cancer
Androgens can cause the growth of prostate cancer cells. Androgen deprivation therapy may stop the adrenal glands from making androgens. Radiation therapy uses high-energy X-rays to kill tumor cells. This randomized phase III trial studies androgen-deprivation therapy and radiation therapy in treating patients with prostate cancer.
ID: NCT01368588
Sponsor: Radiation Therapy Oncology Group
Location (contact): VA Long Beach Healthcare System, California (Samar H. Azawi); Clement J. Zablocki VAMC, Wisconsin (Elizabeth Gore)
Effect of Quercetin on Green Tea Polyphenol Uptake in Prostate Tissue From Patients With Prostate Cancer Undergoing Surgery
This randomized pilot phase I trial will evaluate if quercetin enhances the uptake of green tea polyphenols in the prostate tissue of men taking green tea extract and undergoing radical prostatectomy. Side effects of green tea extract and quercetin in combination with green tea extract will also be evaluated. In preclinical studies, green tea polyphenols have anticancer and cancer preventative effects in a number of malignancies. Likewise, in preclinical studies quercetin was found to enhance the anticancer effects of green tea. This trial is designed to translate these findings forward in a short-term human intervention trial.
ID: NCT01912820
Sponsor: Jonsson Comprehensive Cancer Center
Location (contact): VA Greater Los Angeles Healthcare System, California (William Aronson)
A Study to Evaluate Characteristics Predictive of a Positive Imaging Study for Distant Metastases in Patients With Castration-Resistant Prostate Cancer (PREDICT)
The primary purpose of this research is to describe patient characteristics predictive of an imaging study positive for distant metastases in patients with castration-resistant prostate cancer and no known distant metastases.
ID: NCT01981109
Sponsor: Dendreon
Location (contact): VA Greater Los Angeles Healthcare System, California (Amy Smallcomb)
Click here to read the digital edition.
Note: Page numbers differ between the print issue and digital edition.
Note: Page numbers differ between the print issue and digital edition.
Hat-Wearing Patterns in Spectators Attending Baseball Games: A 10-Year Retrospective Comparison
Spectators at baseball games may be exposed to excess solar UV radiation (UVR), which has been linked to the development of both melanoma and nonmelanoma skin cancers.1,2 Although baseball hats traditionally are worn to demonstrate team support, they also may provide some sun protection for the head and face where skin cancers are commonly found.
The importance of protecting the skin from solar UVR has led to sun-protection programs and community education as well as efforts to evaluate the impact of these programs. Major League Baseball (MLB) has partnered with the American Academy of Dermatology since 1999 to promote the importance of sun protection and raise skin cancer awareness through its Play Sun Smart program.3 A study conducted 10 years ago (N=2030) evaluated hat use in spectators at MLB games and noted that less than half of all spectators in seating sections exposed to direct sunlight wore hats.4 The purpose of the current study was to evaluate how public education about sun protection has impacted the use of hats by spectators at MLB games in 2015 compared to the prior study in 2006.
Methods
Data were collected during a 3-game series (2 day games, 1 night game) in August 2015 in New York, New York. During one of the day games, 18,000 fans received a free wide-brimmed hat. High-resolution digital photographs of seating sections were obtained using a camera with a 300-mm lens. Using the same methodology as the prior study,4 sunny and shaded seating sections were photographed during all 3 games (Figure). Photographs of each section were analyzed by an independent reviewer using a high-resolution computer screen. Spectators wearing head coverings—baseball hats, visors, or hats with circumferential brims—were defined as using hats. The number of spectators wearing hats versus not wearing hats was recorded for all identical sections of interest. Bleacher seating was analyzed separately, as spectators presumably knew in advance of the continuous direct sun exposure during day games, and a subset of young children in the bleachers (<10 years of age) also was assessed. A continuously sunny section also was evaluated at the second and sixth innings to see if hats were presumably purchased during exposure. Statistical significance was determined using χ2 tests with P<.05 indicating statistical significance.

Results
This analysis consisted of 3539 spectators. In both the sunny and shaded sections of a day game, there were more spectators wearing hats (49% and 37%, respectively)(P<.001) than in the same sections at night games (35% and 29%, respectively)(Table 1). During the day game, more spectators wore hats in the sunny section than in the adjacent shaded section (49% vs 37%; P<.001). Analysis of the same 2 sections during the night game revealed no significant differences.
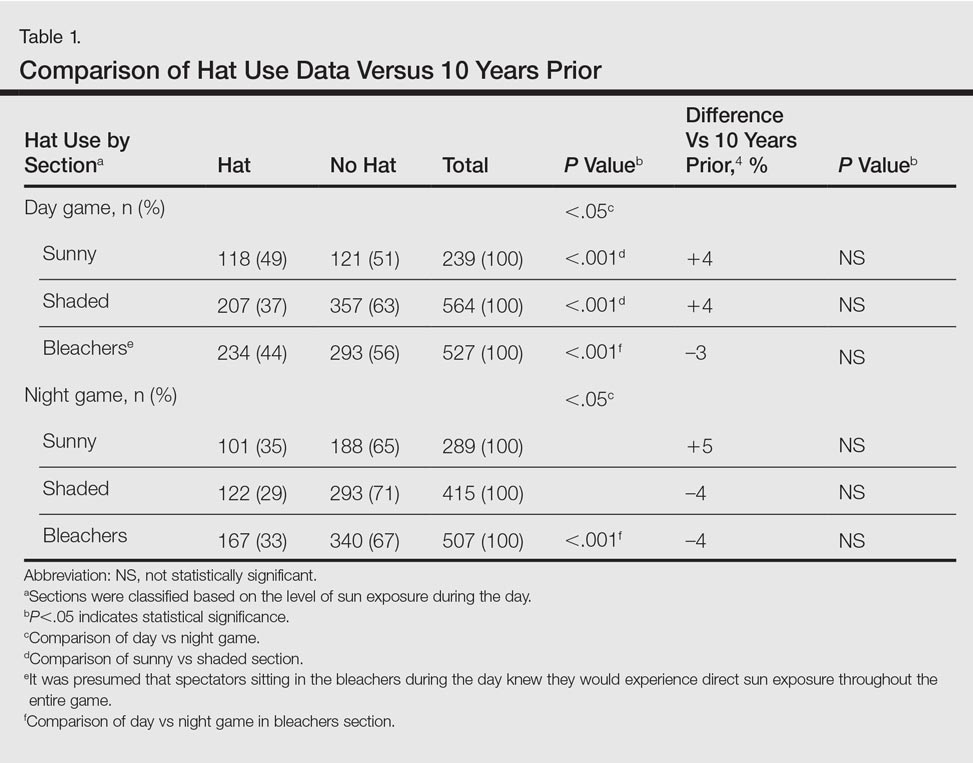
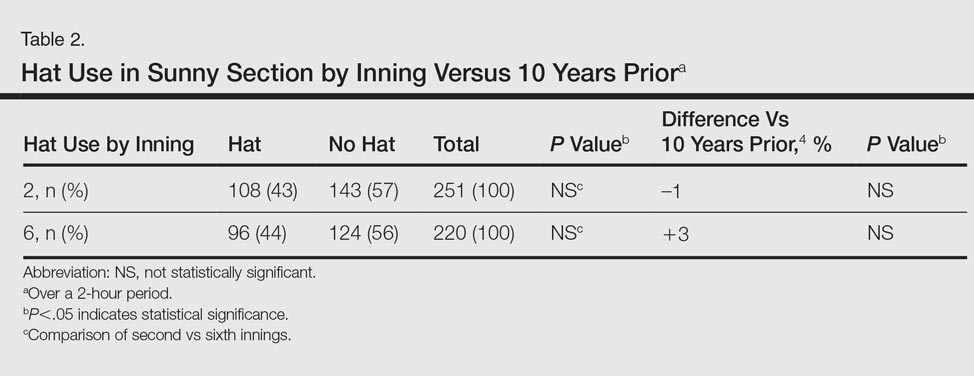
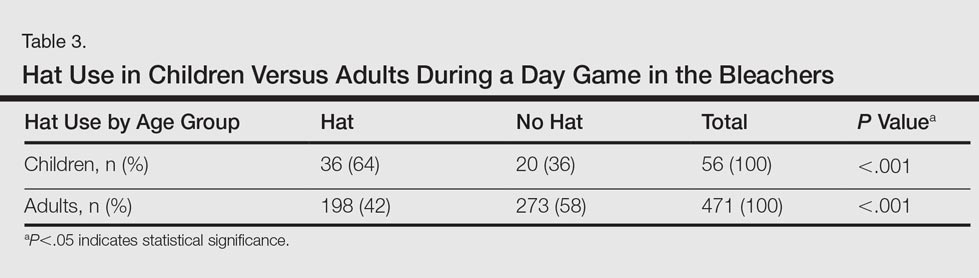
Spectators sitting in the bleachers during a day game who presumably knew to anticipate direct sun exposure showed no significant differences in hat-wearing patterns versus the sunny section (44% vs 49%) but were more likely to wear hats compared to those sitting in the bleachers at the night game (44% vs 33%)(P<.001)(Table 1). There was no significant difference in the number of hats worn by spectators in the sunny section in the second inning (43%) versus the same section after continuous sun exposure at the sixth inning (44%)(Table 2). Significantly more children seated in the bleachers during the day game wore hats compared to adults in the same section (64% vs 42%; P<.001)(Table 3). During the hat giveaway day, significantly more spectators wore hats (the majority of which were the free giveaway hats) across all sections studied (P<.001)(Table 4).

Comment
More than 23 million spectators attended daytime MLB games in 2015, with millions more attending minor league and amateur events.5Although sun-protection messages tend to be well understood and received by society, many choose to ignore them.6
In partnership with the American Academy of Dermatology, the MLB’s Play Sun Smart program has promoted UVR risk awareness at sporting events since 1999.3 Those affiliated with MLB teams also receive annual skin cancer screenings in conjunction with a public education effort in May of each season. However, despite the years of sun-protection education, our study found that less than half of attendees wore hats for UVR protection. In fact, there were no significant differences noted across all of the hat-wearing parameters studied (day vs night game, sunny vs shaded section, sunny section over course of game) between the current study compared to the results from 10 years prior4 (Tables 1 and 2). For spectators in the bleacher section, even presumably knowing in advance that seating would be in the sun did not significantly increase hat-wearing behavior. Although skin cancer rates continue to rise, hat-wearing trends remain stable, revealing a concerning trend.
Increased availability of sunscreen has led to improved sun-protective behaviors in many populations.7 In our study, the free hat giveaway had the greatest impact on hat wearing, which suggests that improved availability and access to hats can lead to an important opportunity for sun-protection programs to partner with hat manufacturers to augment their use and protective impact.
Sun avoidance during childhood and adolescence has been shown to decrease the risk for melanoma.1 Young children had the highest rate of hat usage in the current study, possibly due to parental example or dictates. Research has shown the importance of role models in promoting sun safety to young children,8,9 so perhaps use of hats by parents or MLB players contributed to the hat-wearing behavior observed in this subpopulation.
Given the limited change observed in hat-wearing behaviors over the last decade, a knowledge and behavioral gap appears to exist that may be able to be exploited to enhance future sun protection. Also, based on our findings, the MLB and other sun-protection education campaigns may wish to augment their UVR protective messages by offering hat giveaways, which appear to have a notable impact.
Acknowledgment
The authors thank Jessie Skapik, BS (New York, New York), for her independent review of the spectator photographs.
References
1. Rigel DS. Cutaneous ultraviolet exposure and its relationship to the development of skin cancer. J Am Acad Dermatol. 2008;58(5, suppl 2):S129-S132.
2. Lim HW, James WD, Rigel DS, et al. Adverse effects of ultraviolet radiation from the use of indoor tanning equipment: time to ban the tan. J Am Acad Dermatol. 2011;64:893-902.
3. Play Sun Smart. American Academy of Dermatology website. https://www.aad.org/public/spot-skin-cancer/programs/play-sun-smart. Accessed August 25, 2016.
4. Rigel AS, Lebwohl MG. Hat-wearing patterns in persons attending baseball games. J Am Acad Dermatol. 2006;54:918-919.
5. MLB attendance report - 2016. ESPN website. www.espn.go.com/mlb/attendance. Accessed May 20, 2016.
6. Turner D, Harrison SL, Buettner P, et al. Does being a “SunSmart School” influence hat-wearing compliance? an ecological study of hat-wearing rates at Australian primary schools in a region of high sun exposure [published online December 29, 2013]. Prev Med. 2014;60:107-114.
7. Dubas LE, Adams BB. Sunscreen use and availability among female collegiate athletes [published online February 3, 2012]. J Am Acad Dermatol. 2012;67:876.e1-876.e6.
8. O’Riodran DL, Geller AC, Brooks DR, et al. Sunburn reduction through parental role modeling and sunscreen vigilance. J Pediatr. 2003;142:67-72.
9. Turrisi R, Hillhouse J, Heavin S, et al. Examination of the short-term efficacy of a parent-based intervention to prevent skin cancer. J Behav Med. 2004;27:393-412.
Spectators at baseball games may be exposed to excess solar UV radiation (UVR), which has been linked to the development of both melanoma and nonmelanoma skin cancers.1,2 Although baseball hats traditionally are worn to demonstrate team support, they also may provide some sun protection for the head and face where skin cancers are commonly found.
The importance of protecting the skin from solar UVR has led to sun-protection programs and community education as well as efforts to evaluate the impact of these programs. Major League Baseball (MLB) has partnered with the American Academy of Dermatology since 1999 to promote the importance of sun protection and raise skin cancer awareness through its Play Sun Smart program.3 A study conducted 10 years ago (N=2030) evaluated hat use in spectators at MLB games and noted that less than half of all spectators in seating sections exposed to direct sunlight wore hats.4 The purpose of the current study was to evaluate how public education about sun protection has impacted the use of hats by spectators at MLB games in 2015 compared to the prior study in 2006.
Methods
Data were collected during a 3-game series (2 day games, 1 night game) in August 2015 in New York, New York. During one of the day games, 18,000 fans received a free wide-brimmed hat. High-resolution digital photographs of seating sections were obtained using a camera with a 300-mm lens. Using the same methodology as the prior study,4 sunny and shaded seating sections were photographed during all 3 games (Figure). Photographs of each section were analyzed by an independent reviewer using a high-resolution computer screen. Spectators wearing head coverings—baseball hats, visors, or hats with circumferential brims—were defined as using hats. The number of spectators wearing hats versus not wearing hats was recorded for all identical sections of interest. Bleacher seating was analyzed separately, as spectators presumably knew in advance of the continuous direct sun exposure during day games, and a subset of young children in the bleachers (<10 years of age) also was assessed. A continuously sunny section also was evaluated at the second and sixth innings to see if hats were presumably purchased during exposure. Statistical significance was determined using χ2 tests with P<.05 indicating statistical significance.
Results
This analysis consisted of 3539 spectators. In both the sunny and shaded sections of a day game, there were more spectators wearing hats (49% and 37%, respectively)(P<.001) than in the same sections at night games (35% and 29%, respectively)(Table 1). During the day game, more spectators wore hats in the sunny section than in the adjacent shaded section (49% vs 37%; P<.001). Analysis of the same 2 sections during the night game revealed no significant differences.
Spectators sitting in the bleachers during a day game who presumably knew to anticipate direct sun exposure showed no significant differences in hat-wearing patterns versus the sunny section (44% vs 49%) but were more likely to wear hats compared to those sitting in the bleachers at the night game (44% vs 33%)(P<.001)(Table 1). There was no significant difference in the number of hats worn by spectators in the sunny section in the second inning (43%) versus the same section after continuous sun exposure at the sixth inning (44%)(Table 2). Significantly more children seated in the bleachers during the day game wore hats compared to adults in the same section (64% vs 42%; P<.001)(Table 3). During the hat giveaway day, significantly more spectators wore hats (the majority of which were the free giveaway hats) across all sections studied (P<.001)(Table 4).
Comment
More than 23 million spectators attended daytime MLB games in 2015, with millions more attending minor league and amateur events.5Although sun-protection messages tend to be well understood and received by society, many choose to ignore them.6
In partnership with the American Academy of Dermatology, the MLB’s Play Sun Smart program has promoted UVR risk awareness at sporting events since 1999.3 Those affiliated with MLB teams also receive annual skin cancer screenings in conjunction with a public education effort in May of each season. However, despite the years of sun-protection education, our study found that less than half of attendees wore hats for UVR protection. In fact, there were no significant differences noted across all of the hat-wearing parameters studied (day vs night game, sunny vs shaded section, sunny section over course of game) between the current study compared to the results from 10 years prior4 (Tables 1 and 2). For spectators in the bleacher section, even presumably knowing in advance that seating would be in the sun did not significantly increase hat-wearing behavior. Although skin cancer rates continue to rise, hat-wearing trends remain stable, revealing a concerning trend.
Increased availability of sunscreen has led to improved sun-protective behaviors in many populations.7 In our study, the free hat giveaway had the greatest impact on hat wearing, which suggests that improved availability and access to hats can lead to an important opportunity for sun-protection programs to partner with hat manufacturers to augment their use and protective impact.
Sun avoidance during childhood and adolescence has been shown to decrease the risk for melanoma.1 Young children had the highest rate of hat usage in the current study, possibly due to parental example or dictates. Research has shown the importance of role models in promoting sun safety to young children,8,9 so perhaps use of hats by parents or MLB players contributed to the hat-wearing behavior observed in this subpopulation.
Given the limited change observed in hat-wearing behaviors over the last decade, a knowledge and behavioral gap appears to exist that may be able to be exploited to enhance future sun protection. Also, based on our findings, the MLB and other sun-protection education campaigns may wish to augment their UVR protective messages by offering hat giveaways, which appear to have a notable impact.
Acknowledgment
The authors thank Jessie Skapik, BS (New York, New York), for her independent review of the spectator photographs.
References
1. Rigel DS. Cutaneous ultraviolet exposure and its relationship to the development of skin cancer. J Am Acad Dermatol. 2008;58(5, suppl 2):S129-S132.
2. Lim HW, James WD, Rigel DS, et al. Adverse effects of ultraviolet radiation from the use of indoor tanning equipment: time to ban the tan. J Am Acad Dermatol. 2011;64:893-902.
3. Play Sun Smart. American Academy of Dermatology website. https://www.aad.org/public/spot-skin-cancer/programs/play-sun-smart. Accessed August 25, 2016.
4. Rigel AS, Lebwohl MG. Hat-wearing patterns in persons attending baseball games. J Am Acad Dermatol. 2006;54:918-919.
5. MLB attendance report - 2016. ESPN website. www.espn.go.com/mlb/attendance. Accessed May 20, 2016.
6. Turner D, Harrison SL, Buettner P, et al. Does being a “SunSmart School” influence hat-wearing compliance? an ecological study of hat-wearing rates at Australian primary schools in a region of high sun exposure [published online December 29, 2013]. Prev Med. 2014;60:107-114.
7. Dubas LE, Adams BB. Sunscreen use and availability among female collegiate athletes [published online February 3, 2012]. J Am Acad Dermatol. 2012;67:876.e1-876.e6.
8. O’Riodran DL, Geller AC, Brooks DR, et al. Sunburn reduction through parental role modeling and sunscreen vigilance. J Pediatr. 2003;142:67-72.
9. Turrisi R, Hillhouse J, Heavin S, et al. Examination of the short-term efficacy of a parent-based intervention to prevent skin cancer. J Behav Med. 2004;27:393-412.
Practice Points
- With less than half of attendees wearing hats to Major League Baseball games, there has been limited change in hat-wearing behavior over the last decade, possibly due to a knowledge or behavioral gap.
- Improved availability and access to hats can lead to improved sun-protective behaviors.

Medication List Discrepancies and Therapeutic Duplications Among Dual Use Veterans
In the U.S., 4.5 million ambulatory care visits occur annually due to adverse drug reactions (ADRs) of prescription medications.1 Many ADRs are severe, and they result in more than 100,000 death per year.2 A significant number of these ADRs are preventable and are a result of inappropriate prescribing.3 It is well-documented that inappropriate prescribing is exacerbated by the number of patients who see multiple prescribers and use many different prescription medications.4 This situation results in many versions of a patient’s medication list and in discrepancies across data sources.5
Medication list discrepancies have been researched in the context of care transitions between the hospital and home.6,7 However, less attention has been given to community-dwelling adults who use multiple outpatient prescribers, a practice common among older adults with chronic conditions who see a primary care provider and several specialists.4 Also, veterans are a growing patient population who use providers from multiple health care systems.8 Up to 70% of veterans enrolled in VA health care use both VA and non-VA providers. These patients are referred to as dual users.9,10
There has been an increasing push for patients to be more actively engaged in their own health care, including maintenance of their medication list and other personal health information.11-13 Providers have realized that patients have important experiences and preferences to share about how they use medications at home.14,15 Research suggests that patient interest and ability to use patient portals is variable and dependent on age, technical abilities, health literacy, and endorsement by their providers.16 Greater patient engagement in the medication management process is potentially advantageous, especially because providers from different health care systems often lack the capability to share medication list information.12,17
My HealtheVet, the VA’s patient portal, offers veterans several features. For example, users can securely message providers, refill prescriptions, check appointments, self-enter information, and download their VA health record (including medication history) using the Blue Button (BB) feature. The BB is managed by the HHS to provide consistency across electronic health record platforms.18,19
This BB medication list gives VA patients the tool they need to inform their providers about the medications they take, particularly dual users. VA patients that use multiple prescribers are subject to medication list discrepancies because of the fragmentation of information.4,20
Objectives
The objectives of this study were to (1) describe discrepancies between VA medication lists and non-VA provider medication lists for a group of veteran dual users; (2) identify therapeutic duplications in these lists; and (3) contextualize discrepancies by interviewing non-VA providers about their medication reconciliation processes and management of dual use patients.
Methods
This analysis is based on data collected as part of a pilot randomized controlled trial by Turvey and colleagues.21 Veterans with a diagnosis of ≥ 1 chronic health condition (eg, diabetes, hypertension) were invited by letter to participate in a study about using online management of their health information. Interested patients were screened to meet additional inclusion criteria, such as taking ≥ 5 medications, receiving care from a non-VA provider, an appointment with a non-VA provider within the study time frame, and access to a computer, online access, and printer.
Eligible veterans were randomized to receive either (1) BB training (intervention group) instructing patients to download the Continuity of Care Document and bring it to their non-VA provider visit; or (2) a training evaluating medical information online (control group). Training information was mailed, including written materials and phone support, to both groups. The intervention group could also access an online training link.
One of the objectives was to test whether downloading and bringing the health information to a non-VA appointment decreased medication list discrepancies. The sample was small, and differences in discrepancy rates between groups were not significant. Therefore, groups were combined for the present analysis. Visits occurred between December 2013 and December 2014. Greater detail about study design and primary results are available in the study by Turvey and colleagues.21
Study procedures were approved by the University of Iowa Institutional Review Board and the Iowa City VA Health Care System Research and Development Committee. All participants provided consent.
Identifying Discrepancies
A 4-phase process was used to address medication discrepancies.22,23 The first phase defined medication discrepancy categories. The mutually exclusive categories were dose, frequency, and missing discrepancies. In cases where a medication was both dose and frequency discrepant, only dose discrepancy was applied. For missing medications, entities on only the VA list were marked as “non-VA missing” and medications appearing on only the non-VA list would be denoted as “VA missing.” Medications with no discrepancy were marked as such.
Phase 2 involved collecting medication data. Medication lists from the VA medical record were printed at the time of the non-VA provider appointment. Non-VA medication lists were obtained by sending a medical record request for the visit note, medication list, and any associated visit test results to the non-VA provider office within 2 to 3 weeks of the appointment. Patient names from both lists were replaced with unique patient identifiers.
In phase 3, a research assistant abstracted the hard copy medication lists into a database and identified discrepancies. Variables included medication name, dose, frequency, and administration route. Although administration routes were collected, discrepancies were not assessed because this information commonly was not specified. Medications also were coded as prescription or over-the-counter (OTC). Durable medical equipment often was present on VA lists (eg, syringes, test strips) and was excluded from all analyses. Medications also were not coded as discrepant if they were referenced in a visit note as being changed by the non-VA provider. These combined lists were evaluated by the research assistant based on the discrepancy categories specified in phase 1 and were verified by a pharmacist.
Phase 4 involved counting medication discrepancies. Medication discrepancy rates were calculated at the patient level, both descriptively (mean number of discrepancies per patient) and as a proportion of medications discrepant (number of discrepancies divided by total medications).
Identifying Duplications and High-Risk Medications
A pharmacist examined each combined medication list to identify therapeutic duplications, defined as a patient using ≥ 2 medications from the same medication class (eg, patient taking 2 statin drugs) but not 2 drugs for the same condition (eg, fish oil and atorvastatin for dyslipidemia). High-risk medications also were noted, including anticoagulants, certain nonsteroidal anti-inflammatory drugs, oral and injectable hypoglycemics, opioids, sedatives, and hypnotics.24-26 These medications received special focus because of their link to a high risk for ADRs.27
Descriptive statistics were calculated for patient characteristics and for each discrepancy type, both overall and according to prescription OTC, and high-risk medications. The proportion of discrepant medications was calculated for each category. Bivariate correlations were calculated for select variables to understand potential relationships.
Interviews With Non-VA Providers
All patients were instructed to bring a consent letter and the 1-page questionnaire to their non-VA provider appointment. The questionnaire contained an item asking whether non-VA providers could be contacted for a 15- to 30-minute follow-up interview. The semistructured, qualitative interviews assessed their experiences working with VA providers and VA patients, experiences with VA documents or records, preferences for receiving information from the VA, experience with personal health records, and sharing information with the VA. Eight interviews were conducted, audio-recorded, and transcribed. The goal of the interviews was to explore and understand provider perspectives on managing dual use veterans, including medication reconciliation processes to add context to the interpretation of medication list analysis. Because the data set was relatively small, summaries of each interview were created to highlight main points. These main points were sorted into topics, summarized, and representative quotes were selected.
Results
Fifty veterans were included in the analysis (Table 1). The mean age was 68.5 (SD 6.2); 90% were men. On average, they reported having 6 chronic health conditions and a fair-to-good health status. Based on the combined medication lists from VA and non-VA providers, veterans took an average of 15.8 (SD 7.0) unique medications (combined prescription and OTC/vitamins) and had an average of 10.0 (SD 6.1) all-type discrepancies (Table 2).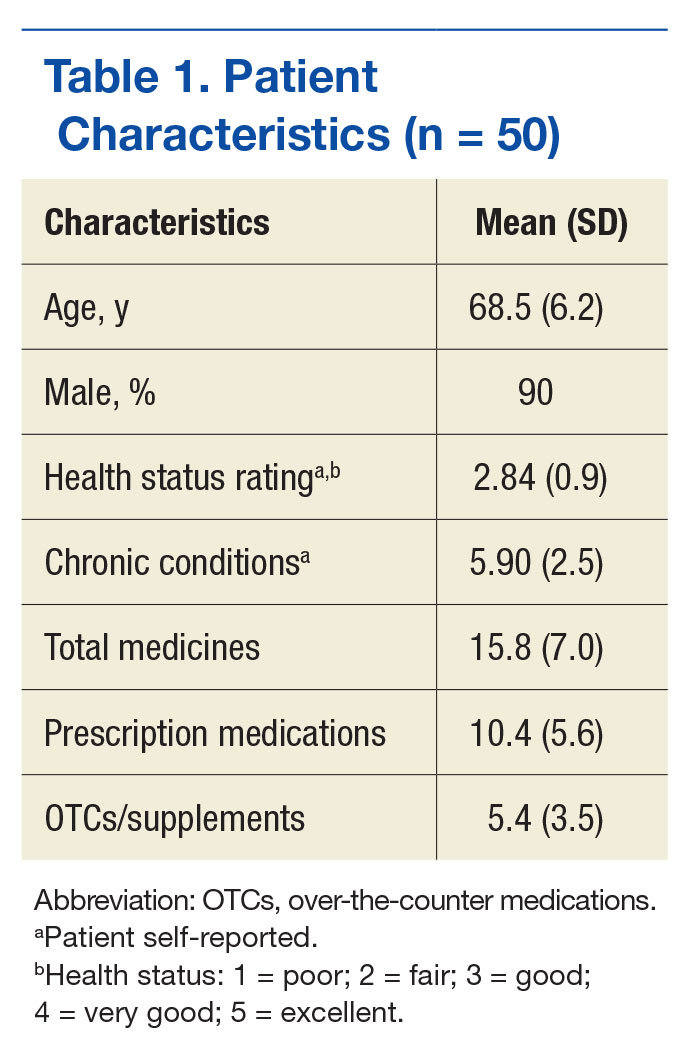
Overall, 58% of the prescription medications were discrepant: The most common discrepancy between the 2 lists was medication missing on one of the lists, which occurred 3.9 times per patient on average for prescription medications and 2.8 times per patient for OTCs. Frequency or dose discrepancies also were common between the lists at a rate of 1.9 discrepancies per patient for prescription medications and 1.2 discrepancies per patient for OTCs.
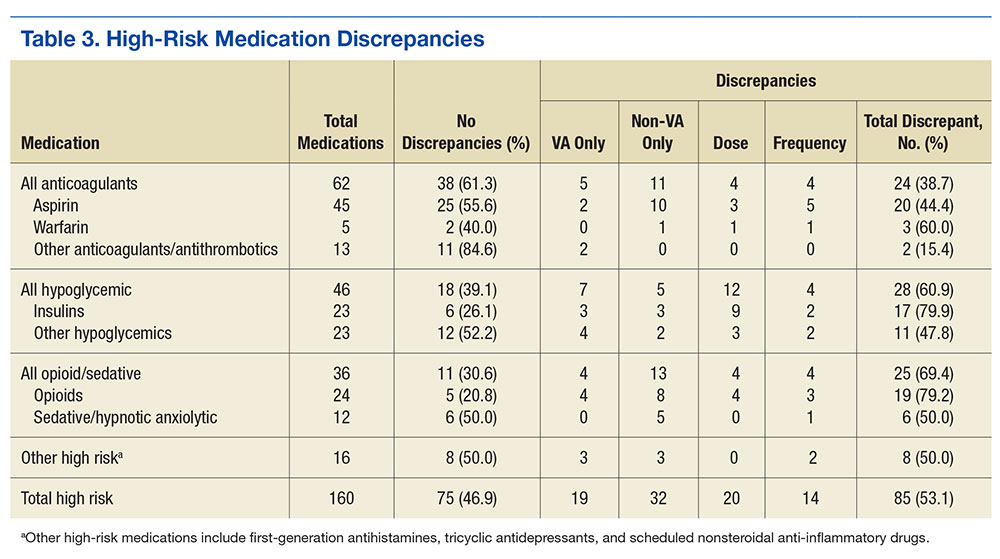
For high-risk medications, opiates and sedative medications had the most discrepancies between the lists because the VA practitioner may not have known that the patient was taking an opiate, although other discrepancies were present (Table 3). Anticoagulant discrepancies were the most consistent, most of these occurring with aspirin. Last, insulin commonly was dose discrepant between the 2 lists, although it also was missing from one list for a number of patients. Overall, high-risk medications shared a discrepancy rate (46.9%) similar to the overall rate.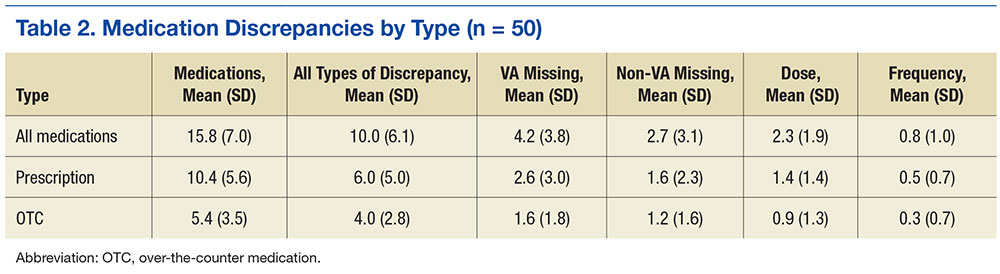
Twelve therapeutic duplications were identified in the sample.Ten were between-list duplications, that is, “provider A” thought the patient was on a particular medication and “provider B” thought that the patient was on a different medication (Table 4). In 6 instances, within-list duplications were identified (ie, a provider had 2 medications on the list that should not be taken together because they were in the same drug class). In 4 cases, both between- and within-list duplications were present.
Interview Summaries
Veterans and medication. Multiple non-VA providers said that the primary reason veteran patients were going to a VA provider was to obtain discounted medications. The use of the VA for medications also was a way for the non-VA provider to discover that the patient was a veteran. One non-VA provider was particularly concerned about the impact of new or different medications from VA prescribers on efforts to stabilize the patient’s chronic condition.
Several non-VA providers reported that veterans often brought a medication list to the appointment, and several providers recommended the practice to their patients. Non-VA providers preferred to have patients transfer information from VA, sometimes requesting that veterans bring in their records from recent appointments rather than the non-VA provider obtain the information directly from the VA.
Information sharing. Non-VA providers generally preferred hard copies of medication lists and other documents rather than scans because they were more likely to be included in decision making if the documents were presented during the visit. Also, document scans may be buried in the electronic medical record. Some providers mentioned their interest in electronic transfer of medical information like medication lists if the technology were more developed and better integrated.
“I think the long-term vision would be that it should be electronic… it wouldn’t necessarily be feasible at this time. Our system scans paper documents in to an e-version. … but when the patient comes to their encounter 10 days later, you don’t realize the stuff’s there… Having the patient bring them in is probably a more certain way to make sure that it’s actually included in your decision making as a provider.”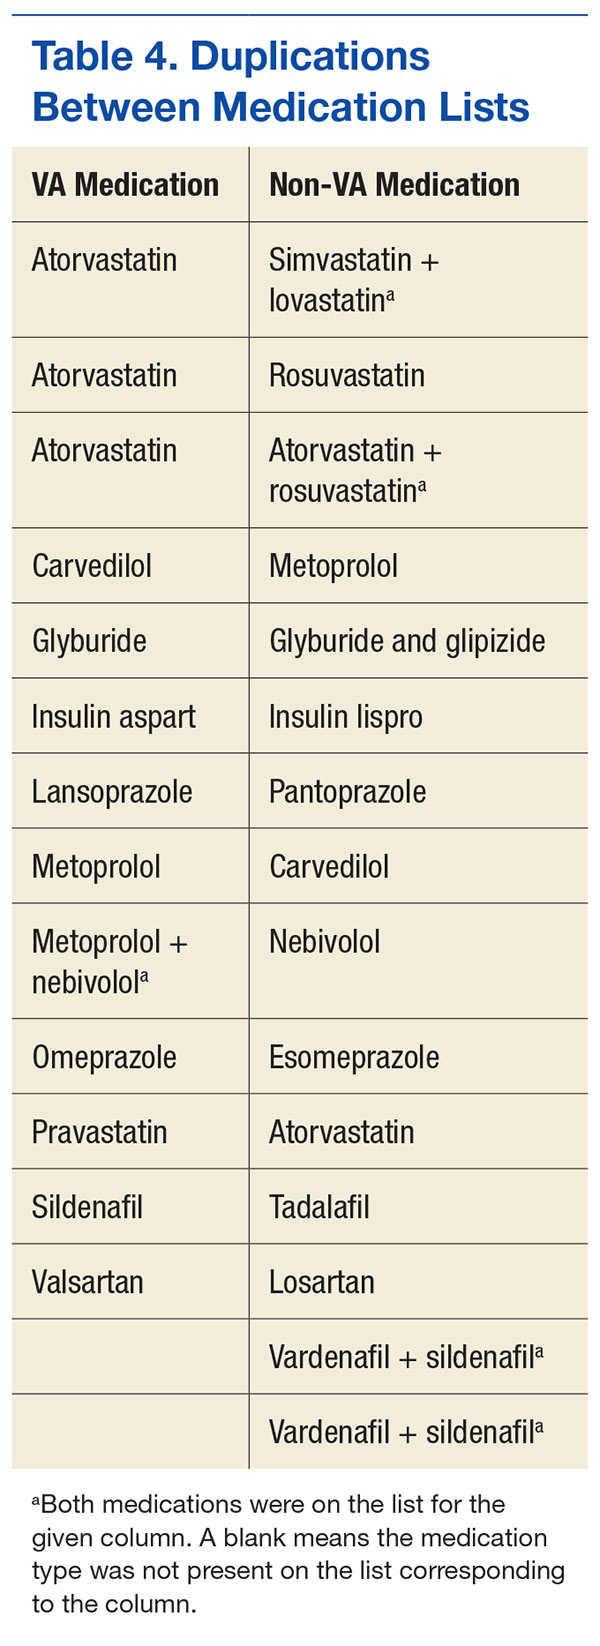
Most non-VA providers welcomed more information such as imaging studies because they reported rarely receiving this information from the VA system. Two mentioned the potential for too much information and wanted concise reports should the flow of information increase. Providers had little interest in logging in to a patient’s online health record portal as a delegate for reasons related to complexity, time, privacy, and lack of mechanism to document the information accessed.
Medication reconciliation. Non-VA providers generally reported that patients bringing their own or an outside medication list would prompt a process of medication reconciliation. The providers were interested in making changes to their records based on other lists, but outside data were verified against a patient self-report of actual use before adopting changes.
“I print out my med list of what I have in the computer and then I just check off my list against their list. And then whatever’s remaining, we talk about what the differences are, when they were changed, what they were changed for, if they were taken off of something, and if I don’t agree, then I’ll tell the patient, ‘look, there’s a disagreement here, they’ve told you not to be on this. I want you on this.”
Should a discrepancy arise, non-VA providers generally had a negative view of attempting to contact VA providers. Other mechanisms such as calling a local pharmacy would be done first.
Discussion
This study provided initial evidence that medication list discrepancies exist for dual use veterans. Other studies of medication list discrepancies have linked such inconsistencies to medication-related problems and negative outcomes for patients.27 Although efforts to increase access to care for veterans have advantages related to expediency, consequences to fragmenting care exist. More robust mechanisms for establishing and maintaining medication list consistency are needed, especially given the lack of a universally accepted medical record format or repository. A multifaceted approach, including patient engagement, seems necessary.
This study also showed that discrepancies of high-risk medications are common for veteran participants, placing them at risk for medication-related problems and harm. These risks included dose and frequency discrepancies that could result in over- or underdosing of medications and in medication omissions, which could cause duplicative therapies and unnecessary risks. For example, aspirin frequently was listed on non-VA lists but was omitted from VA medication lists. This could be problematic for patients who present to the VA for a procedure in which no information about aspirin could jeopardize their safety. Insulin doses also were commonly discrepant, which could impact glycemic control.
Many providers also had incomplete prescribing information for opiates. Those prescriptions are particularly relevant given the link between veterans, posttraumatic stress disorder, depression, and substance abuse.28-30 However, it was beyond the scope of this pilot study to link these discrepancies to ADRs, such as emergency department visits or hospital admissions. Other studies have demonstrated that discrepancies at hospital discharge can result in these types of negative outcomes.27,31 Subsequent research should determine the clinical significance of discrepancies that occur when veterans are dual users.
The qualitative interviews provided some initial context on prescriber perspectives about the role of veterans participating in the medication list sharing process and personal health records. It seemed that for the portion of patients who brought a list to their non-VA provider appointment, the information was welcomed but fell outside the usual visit workflow. Many provider visits are dominated by current patient symptoms, and issues of reconciling medications may be a lower priority.32 Also, some providers may delegate medication reconciliation functions to a nurse or other support staff. One physician offered that he delegated logging in to a patient’s online medication information to a health coach on staff. These findings were consistent with perspectives shared by non-VA family practice physicians about personal health records.33
The most common way to integrate outside medication lists into the non-VA provider’s medical record seemed to be scanning the document. Scanning had its limitations because the provider might be unaware of the scanned document, and there were no mechanisms to import medication names and doses. However, the process may improve only the non-VA providers’ records, as they reported that they had no easy or consistent way to transmit medication changes to notes to the VA.
In general, communicating with VA providers was seen as not feasible and not worth their time or effort. It may be beneficial to address this non-VA provider concern because it seems to inhibit the transfer of important health information and the maintenance of a concordant medication record. Information transfer is particularly relevant for veterans who are primarily cared for by non-VA providers and use the VA only to get prescription medications.
In the current approach, non-VA providers have no simple, direct way to update the VA medication list. Transmitting updates carries the risk of inappropriate changes and is concerning if neither or both prescribers consider themselves to be responsible for the patient’s medications. Also, the potential exists for all medication lists to be inaccurate if the lists do not reflect the medications patients take when left on their own. Patient nonadherence rates can exceed 50%, depending on the medication.34,35 Several interviewed non-VA physicians stressed the importance of asking patients to list the medications they were using during the medication reconciliation process.
This study offers several areas for additional inquiry, including understanding how providers make sense of medication lists from other sources and what technologies can be applied to increase list consistency without increasing the burden on providers.
Practice Implications
Although patient involvement in medication list sharing has the potential to improve information consistency, health systems, providers, and other stakeholders should be cautious in assuming that other prescribers will work to combat medication list entropy, especially if no systems exist to seamlessly incorporate this information into clinic workflow. Devising standardized procedures when patients bring in their records from other providers increases the likelihood that this information will be incorporated into clinical decision making and maintaining up-to-date medication information for patients who use multiple prescribers.
Limitations
These analyses are based on a small sample size (n = 50 for chart review) and (n = 8 for the semistructured interviews) from a single Midwestern state. These findings should be used as evidence for further inquiry.
Conclusion
This study illuminates the level of discrepancies between the medication lists of veteran dual users, including high rates of discrepancies for high-risk medications, such as anticoagulants and opiates. This study also provides evidence of deficiencies in the health care system to decrease medication list entropy that may place veterans at an elevated risk for adverse medication events.
1. Sarkar U, López A, Maselli JH, Gonzales R. Adverse drug events in US adult ambulatory medical care. Health Serv Res. 2011;46(5):1517-1533.
2. Kohn LT, Corrigan JM, Donaldson MS. To Err Is Human:Building a Safer Health System. Washington, DC: Institute of Medicine, National Academy Press; 1999.
3. Gandhi TK, Weingart SN, Borus J, et al. Adverse drug events in ambulatory care. N Eng J Med. 2003;348(16):1556-1564.
4. Tamblyn RM, McLeod PJ, Abrahamowicz M, Laprise R. Do too many cooks spoil the broth? Multiple physician involvement in medical management of elderly patients and potentially inappropriate drug combinations. CMAJ. 1996;154(8):1177-1184.
5. Wong JD, Bajcar JM, Wong GG, et al. Medication reconciliation at hospital discharge: evaluating discrepancies. Ann Pharmacother. 2008;42(10):1373-1379.
6. Kripalani S, LeFevre F, Phillips CO, Williams MV, Basaviah P, Baker DW. Deficits in communication and information transfer between hospital-based and primary care physicians: implications for patient safety and continuity of care. JAMA. 2007;297(8):831-841.
7. McMillan A, Trompeter J, Havrda D, Fox J. Continuity of care between family practice physicians and hospitalist services. J Healthare Qual. 2013;35(1):41-49.
8. Liu CF, Manning WG, Burgess JF Jr, et al. Reliance on Veterans Affairs outpatient care by Medicare-eligible veterans. Med Care. 2011;49(10):911-917.
9. U.S. Department of Veterans Affairs, Veterans Health Administration. VHA Office of the ADUSH for Policy and Planning. 2011 survey of veteran enrollees’ health and reliance upon VA. http://www.va.gov/healthpolicyplanning/soe2011/soe2011_report.pdf. Published March 2012. Accessed August 2, 2016.
10. Nayar P, Apenteng B, Yu F, Woodbridge P, Fetrick A. Rural veterans’ perspectives of dual care. J Community Health. 2013;38(1):70-77.
11. Chae SY, Chae MH, Isaacson N, James TS. The patient medication list: can we get patients more involved in their medical care? J Am Board Fam Med. 2009;22(6):677-685.
12. Tang PC, Ash JS, Bates DW, Overhage JM, Sands DZ. Personal health records: definitions, benefits, and strategies for overcoming barriers to adoption. J Am Med Informatics Assoc. 2006;13(2):121-126.
13. Stroupe KT, Smith BM, Hogan TP, et al. Medication acquisition across systems of care and patient–provider communication among older veterans. Am J Health Syst Pharm. 2013;70(9):804-813.
14. Shoemaker SJ, Ramalho de Oliveira D, Alves M, Ekstrand M. The medication experience: preliminary evidence of its value for patient education and counseling on chronic medications. Patient Educ Couns. 2011;83(3):443-450.
15. Chewning B, Boh L, Wiederholt J, et al. Does the concordance concept serve patient medication management? Int J Pharm Pract. 2001;9(2):71-79.
16. Irizarry T, DeVito Dabbs A, Curran CR. Patient portals and patient engagement: a state of the science review. J Med Internet Res. 2015;17(6):e148.
17. Schnipper JL, Gandhi TK, Wald JS, et al. Effects of an online personal health record on medication accuracy and safety: a cluster-randomized trial. J Am Med Inform Assoc. 2012;19(5):728-734.
18. Turvey C, Klein D, Fix G, et al. Blue Button use by patients to access and share health record information using the Department of Veterans Affairs’ online patient portal. J Am Med Inform Assoc. 2014;21(4):657-663.
19. Hogan TP, Nazi KM, Luger TM, et al. Technology-assisted patient access to clinical information: an evaluation framework for Blue Button. JMIR Res Protoc. 2014;3(1):e18.
20. Steinman MA, Handler SM, Gurwitz JH, Schiff GD, Covinsky KE. Beyond the prescription: medication monitoring and adverse drug events in older adults. J Am Geriatr Soc. 2011;59(8):1520-1530.
21. Turvey CL, Klein DM, Witry M, et al. Patient education for consumer-mediated HIE. A pilot randomized controlled trial of the Department of Veterans Affairs Blue Button. Appl Clin Inform. 2016;7(3):765-776.
22. Polnaszek B, Gilmore-Bykovskyi A, Hovanes M, et al. Overcoming the challenges of unstructured data in multisite, electronic medical record-based abstraction [published online ahead of print June 25, 2014]. Med Care. doi: 10.1097/MLR.0000000000000108.
23. Kennelty K, Witry MJ, Gehring M, M D, Pulia N. A four-phase approach for systematically collecting data and measuring medication discrepancies when patients transition between health care settings. Res Social Adm Pharm. 2016;12(4):548-558.
24. American Geriatrics Society 2012 Beers Criteria Update Expert Panel. American Geriatrics Society updated Beers criteria for potentially inappropriate medication use in older adults. J Am Geriatr Soc. 2012;60(4):616-631.
25. Gurwitz JH, Field TS, Harrold LR, et al. Incidence and preventability of adverse drug events among older persons in the ambulatory setting. JAMA. 2003;289(9):1107-1116.
26. Gurwitz JH, Field TS, Avorn J, et al. Incidence and preventability of adverse drug events in nursing homes. Am J Med. 2000;109(2):87-94.
27. Boockvar KS, Liu S, Goldstein N, Nebeker J, Siu A, Fried T. Prescribing discrepancies likely to cause adverse drug events after patient transfer. Qual Saf Health Care. 2009;18(1):32-36.
28. Shipherd JC, Stafford J, Tanner LR. Predicting alcohol and drug abuse in Persian Gulf War veterans: what role do PTSD symptoms play? Addict Behav. 2005;30(3):595-599.
29. Markou A, Kosten TR, Koob GF. Neurobiological similarities in depression and drug dependence: a self-medication hypothesis. Neuropsychopharmacology. 1998;18(3):135-174.
30. McFall ME, Mackay PW, Donovan DM. Combat-related posttraumatic stress disorder and severity of substance abuse in Vietnam veterans. J Stud Alcohol. 1992;53(4):357-363.
31. Kwan JL, Lo L, Sampson M, Shojania KG. Medication reconciliation during transitions of care as a patient safety strategy: a systematic review. Ann Intern Med. 2013;158(5, pt 2):397-403.
32. Richard C, Lussier MT. Nature and frequency of exchanges on medications during primary care encounters. Patient Educ Couns. 2006;64(1-3):207-216.
33. Witry MJ, Doucette WR, Daly JM, Levy BT, Chrischilles EA. Family physician perceptions of personal health records. Perspect Health Inf Manag. 2010;7.
34. Horne R, Weinman J. Patients’ beliefs about prescribed medicines and their role in adherence to treatment in chronic physical illness. J Psychosom Res. 1999;47(6):555-567.
35. Osterberg L, Blaschke T. Adherence to medication. N Eng J Med. 2005;353(5):487-497.
In the U.S., 4.5 million ambulatory care visits occur annually due to adverse drug reactions (ADRs) of prescription medications.1 Many ADRs are severe, and they result in more than 100,000 death per year.2 A significant number of these ADRs are preventable and are a result of inappropriate prescribing.3 It is well-documented that inappropriate prescribing is exacerbated by the number of patients who see multiple prescribers and use many different prescription medications.4 This situation results in many versions of a patient’s medication list and in discrepancies across data sources.5
Medication list discrepancies have been researched in the context of care transitions between the hospital and home.6,7 However, less attention has been given to community-dwelling adults who use multiple outpatient prescribers, a practice common among older adults with chronic conditions who see a primary care provider and several specialists.4 Also, veterans are a growing patient population who use providers from multiple health care systems.8 Up to 70% of veterans enrolled in VA health care use both VA and non-VA providers. These patients are referred to as dual users.9,10
There has been an increasing push for patients to be more actively engaged in their own health care, including maintenance of their medication list and other personal health information.11-13 Providers have realized that patients have important experiences and preferences to share about how they use medications at home.14,15 Research suggests that patient interest and ability to use patient portals is variable and dependent on age, technical abilities, health literacy, and endorsement by their providers.16 Greater patient engagement in the medication management process is potentially advantageous, especially because providers from different health care systems often lack the capability to share medication list information.12,17
My HealtheVet, the VA’s patient portal, offers veterans several features. For example, users can securely message providers, refill prescriptions, check appointments, self-enter information, and download their VA health record (including medication history) using the Blue Button (BB) feature. The BB is managed by the HHS to provide consistency across electronic health record platforms.18,19
This BB medication list gives VA patients the tool they need to inform their providers about the medications they take, particularly dual users. VA patients that use multiple prescribers are subject to medication list discrepancies because of the fragmentation of information.4,20
Objectives
The objectives of this study were to (1) describe discrepancies between VA medication lists and non-VA provider medication lists for a group of veteran dual users; (2) identify therapeutic duplications in these lists; and (3) contextualize discrepancies by interviewing non-VA providers about their medication reconciliation processes and management of dual use patients.
Methods
This analysis is based on data collected as part of a pilot randomized controlled trial by Turvey and colleagues.21 Veterans with a diagnosis of ≥ 1 chronic health condition (eg, diabetes, hypertension) were invited by letter to participate in a study about using online management of their health information. Interested patients were screened to meet additional inclusion criteria, such as taking ≥ 5 medications, receiving care from a non-VA provider, an appointment with a non-VA provider within the study time frame, and access to a computer, online access, and printer.
Eligible veterans were randomized to receive either (1) BB training (intervention group) instructing patients to download the Continuity of Care Document and bring it to their non-VA provider visit; or (2) a training evaluating medical information online (control group). Training information was mailed, including written materials and phone support, to both groups. The intervention group could also access an online training link.
One of the objectives was to test whether downloading and bringing the health information to a non-VA appointment decreased medication list discrepancies. The sample was small, and differences in discrepancy rates between groups were not significant. Therefore, groups were combined for the present analysis. Visits occurred between December 2013 and December 2014. Greater detail about study design and primary results are available in the study by Turvey and colleagues.21
Study procedures were approved by the University of Iowa Institutional Review Board and the Iowa City VA Health Care System Research and Development Committee. All participants provided consent.
Identifying Discrepancies
A 4-phase process was used to address medication discrepancies.22,23 The first phase defined medication discrepancy categories. The mutually exclusive categories were dose, frequency, and missing discrepancies. In cases where a medication was both dose and frequency discrepant, only dose discrepancy was applied. For missing medications, entities on only the VA list were marked as “non-VA missing” and medications appearing on only the non-VA list would be denoted as “VA missing.” Medications with no discrepancy were marked as such.
Phase 2 involved collecting medication data. Medication lists from the VA medical record were printed at the time of the non-VA provider appointment. Non-VA medication lists were obtained by sending a medical record request for the visit note, medication list, and any associated visit test results to the non-VA provider office within 2 to 3 weeks of the appointment. Patient names from both lists were replaced with unique patient identifiers.
In phase 3, a research assistant abstracted the hard copy medication lists into a database and identified discrepancies. Variables included medication name, dose, frequency, and administration route. Although administration routes were collected, discrepancies were not assessed because this information commonly was not specified. Medications also were coded as prescription or over-the-counter (OTC). Durable medical equipment often was present on VA lists (eg, syringes, test strips) and was excluded from all analyses. Medications also were not coded as discrepant if they were referenced in a visit note as being changed by the non-VA provider. These combined lists were evaluated by the research assistant based on the discrepancy categories specified in phase 1 and were verified by a pharmacist.
Phase 4 involved counting medication discrepancies. Medication discrepancy rates were calculated at the patient level, both descriptively (mean number of discrepancies per patient) and as a proportion of medications discrepant (number of discrepancies divided by total medications).
Identifying Duplications and High-Risk Medications
A pharmacist examined each combined medication list to identify therapeutic duplications, defined as a patient using ≥ 2 medications from the same medication class (eg, patient taking 2 statin drugs) but not 2 drugs for the same condition (eg, fish oil and atorvastatin for dyslipidemia). High-risk medications also were noted, including anticoagulants, certain nonsteroidal anti-inflammatory drugs, oral and injectable hypoglycemics, opioids, sedatives, and hypnotics.24-26 These medications received special focus because of their link to a high risk for ADRs.27
Descriptive statistics were calculated for patient characteristics and for each discrepancy type, both overall and according to prescription OTC, and high-risk medications. The proportion of discrepant medications was calculated for each category. Bivariate correlations were calculated for select variables to understand potential relationships.
Interviews With Non-VA Providers
All patients were instructed to bring a consent letter and the 1-page questionnaire to their non-VA provider appointment. The questionnaire contained an item asking whether non-VA providers could be contacted for a 15- to 30-minute follow-up interview. The semistructured, qualitative interviews assessed their experiences working with VA providers and VA patients, experiences with VA documents or records, preferences for receiving information from the VA, experience with personal health records, and sharing information with the VA. Eight interviews were conducted, audio-recorded, and transcribed. The goal of the interviews was to explore and understand provider perspectives on managing dual use veterans, including medication reconciliation processes to add context to the interpretation of medication list analysis. Because the data set was relatively small, summaries of each interview were created to highlight main points. These main points were sorted into topics, summarized, and representative quotes were selected.
Results
Fifty veterans were included in the analysis (Table 1). The mean age was 68.5 (SD 6.2); 90% were men. On average, they reported having 6 chronic health conditions and a fair-to-good health status. Based on the combined medication lists from VA and non-VA providers, veterans took an average of 15.8 (SD 7.0) unique medications (combined prescription and OTC/vitamins) and had an average of 10.0 (SD 6.1) all-type discrepancies (Table 2).
Overall, 58% of the prescription medications were discrepant: The most common discrepancy between the 2 lists was medication missing on one of the lists, which occurred 3.9 times per patient on average for prescription medications and 2.8 times per patient for OTCs. Frequency or dose discrepancies also were common between the lists at a rate of 1.9 discrepancies per patient for prescription medications and 1.2 discrepancies per patient for OTCs.
For high-risk medications, opiates and sedative medications had the most discrepancies between the lists because the VA practitioner may not have known that the patient was taking an opiate, although other discrepancies were present (Table 3). Anticoagulant discrepancies were the most consistent, most of these occurring with aspirin. Last, insulin commonly was dose discrepant between the 2 lists, although it also was missing from one list for a number of patients. Overall, high-risk medications shared a discrepancy rate (46.9%) similar to the overall rate.
Twelve therapeutic duplications were identified in the sample.Ten were between-list duplications, that is, “provider A” thought the patient was on a particular medication and “provider B” thought that the patient was on a different medication (Table 4). In 6 instances, within-list duplications were identified (ie, a provider had 2 medications on the list that should not be taken together because they were in the same drug class). In 4 cases, both between- and within-list duplications were present.
Interview Summaries
Veterans and medication. Multiple non-VA providers said that the primary reason veteran patients were going to a VA provider was to obtain discounted medications. The use of the VA for medications also was a way for the non-VA provider to discover that the patient was a veteran. One non-VA provider was particularly concerned about the impact of new or different medications from VA prescribers on efforts to stabilize the patient’s chronic condition.
Several non-VA providers reported that veterans often brought a medication list to the appointment, and several providers recommended the practice to their patients. Non-VA providers preferred to have patients transfer information from VA, sometimes requesting that veterans bring in their records from recent appointments rather than the non-VA provider obtain the information directly from the VA.
Information sharing. Non-VA providers generally preferred hard copies of medication lists and other documents rather than scans because they were more likely to be included in decision making if the documents were presented during the visit. Also, document scans may be buried in the electronic medical record. Some providers mentioned their interest in electronic transfer of medical information like medication lists if the technology were more developed and better integrated.
“I think the long-term vision would be that it should be electronic… it wouldn’t necessarily be feasible at this time. Our system scans paper documents in to an e-version. … but when the patient comes to their encounter 10 days later, you don’t realize the stuff’s there… Having the patient bring them in is probably a more certain way to make sure that it’s actually included in your decision making as a provider.”
Most non-VA providers welcomed more information such as imaging studies because they reported rarely receiving this information from the VA system. Two mentioned the potential for too much information and wanted concise reports should the flow of information increase. Providers had little interest in logging in to a patient’s online health record portal as a delegate for reasons related to complexity, time, privacy, and lack of mechanism to document the information accessed.
Medication reconciliation. Non-VA providers generally reported that patients bringing their own or an outside medication list would prompt a process of medication reconciliation. The providers were interested in making changes to their records based on other lists, but outside data were verified against a patient self-report of actual use before adopting changes.
“I print out my med list of what I have in the computer and then I just check off my list against their list. And then whatever’s remaining, we talk about what the differences are, when they were changed, what they were changed for, if they were taken off of something, and if I don’t agree, then I’ll tell the patient, ‘look, there’s a disagreement here, they’ve told you not to be on this. I want you on this.”
Should a discrepancy arise, non-VA providers generally had a negative view of attempting to contact VA providers. Other mechanisms such as calling a local pharmacy would be done first.
Discussion
This study provided initial evidence that medication list discrepancies exist for dual use veterans. Other studies of medication list discrepancies have linked such inconsistencies to medication-related problems and negative outcomes for patients.27 Although efforts to increase access to care for veterans have advantages related to expediency, consequences to fragmenting care exist. More robust mechanisms for establishing and maintaining medication list consistency are needed, especially given the lack of a universally accepted medical record format or repository. A multifaceted approach, including patient engagement, seems necessary.
This study also showed that discrepancies of high-risk medications are common for veteran participants, placing them at risk for medication-related problems and harm. These risks included dose and frequency discrepancies that could result in over- or underdosing of medications and in medication omissions, which could cause duplicative therapies and unnecessary risks. For example, aspirin frequently was listed on non-VA lists but was omitted from VA medication lists. This could be problematic for patients who present to the VA for a procedure in which no information about aspirin could jeopardize their safety. Insulin doses also were commonly discrepant, which could impact glycemic control.
Many providers also had incomplete prescribing information for opiates. Those prescriptions are particularly relevant given the link between veterans, posttraumatic stress disorder, depression, and substance abuse.28-30 However, it was beyond the scope of this pilot study to link these discrepancies to ADRs, such as emergency department visits or hospital admissions. Other studies have demonstrated that discrepancies at hospital discharge can result in these types of negative outcomes.27,31 Subsequent research should determine the clinical significance of discrepancies that occur when veterans are dual users.
The qualitative interviews provided some initial context on prescriber perspectives about the role of veterans participating in the medication list sharing process and personal health records. It seemed that for the portion of patients who brought a list to their non-VA provider appointment, the information was welcomed but fell outside the usual visit workflow. Many provider visits are dominated by current patient symptoms, and issues of reconciling medications may be a lower priority.32 Also, some providers may delegate medication reconciliation functions to a nurse or other support staff. One physician offered that he delegated logging in to a patient’s online medication information to a health coach on staff. These findings were consistent with perspectives shared by non-VA family practice physicians about personal health records.33
The most common way to integrate outside medication lists into the non-VA provider’s medical record seemed to be scanning the document. Scanning had its limitations because the provider might be unaware of the scanned document, and there were no mechanisms to import medication names and doses. However, the process may improve only the non-VA providers’ records, as they reported that they had no easy or consistent way to transmit medication changes to notes to the VA.
In general, communicating with VA providers was seen as not feasible and not worth their time or effort. It may be beneficial to address this non-VA provider concern because it seems to inhibit the transfer of important health information and the maintenance of a concordant medication record. Information transfer is particularly relevant for veterans who are primarily cared for by non-VA providers and use the VA only to get prescription medications.
In the current approach, non-VA providers have no simple, direct way to update the VA medication list. Transmitting updates carries the risk of inappropriate changes and is concerning if neither or both prescribers consider themselves to be responsible for the patient’s medications. Also, the potential exists for all medication lists to be inaccurate if the lists do not reflect the medications patients take when left on their own. Patient nonadherence rates can exceed 50%, depending on the medication.34,35 Several interviewed non-VA physicians stressed the importance of asking patients to list the medications they were using during the medication reconciliation process.
This study offers several areas for additional inquiry, including understanding how providers make sense of medication lists from other sources and what technologies can be applied to increase list consistency without increasing the burden on providers.
Practice Implications
Although patient involvement in medication list sharing has the potential to improve information consistency, health systems, providers, and other stakeholders should be cautious in assuming that other prescribers will work to combat medication list entropy, especially if no systems exist to seamlessly incorporate this information into clinic workflow. Devising standardized procedures when patients bring in their records from other providers increases the likelihood that this information will be incorporated into clinical decision making and maintaining up-to-date medication information for patients who use multiple prescribers.
Limitations
These analyses are based on a small sample size (n = 50 for chart review) and (n = 8 for the semistructured interviews) from a single Midwestern state. These findings should be used as evidence for further inquiry.
Conclusion
This study illuminates the level of discrepancies between the medication lists of veteran dual users, including high rates of discrepancies for high-risk medications, such as anticoagulants and opiates. This study also provides evidence of deficiencies in the health care system to decrease medication list entropy that may place veterans at an elevated risk for adverse medication events.
1. Sarkar U, López A, Maselli JH, Gonzales R. Adverse drug events in US adult ambulatory medical care. Health Serv Res. 2011;46(5):1517-1533.
2. Kohn LT, Corrigan JM, Donaldson MS. To Err Is Human:Building a Safer Health System. Washington, DC: Institute of Medicine, National Academy Press; 1999.
3. Gandhi TK, Weingart SN, Borus J, et al. Adverse drug events in ambulatory care. N Eng J Med. 2003;348(16):1556-1564.
4. Tamblyn RM, McLeod PJ, Abrahamowicz M, Laprise R. Do too many cooks spoil the broth? Multiple physician involvement in medical management of elderly patients and potentially inappropriate drug combinations. CMAJ. 1996;154(8):1177-1184.
5. Wong JD, Bajcar JM, Wong GG, et al. Medication reconciliation at hospital discharge: evaluating discrepancies. Ann Pharmacother. 2008;42(10):1373-1379.
6. Kripalani S, LeFevre F, Phillips CO, Williams MV, Basaviah P, Baker DW. Deficits in communication and information transfer between hospital-based and primary care physicians: implications for patient safety and continuity of care. JAMA. 2007;297(8):831-841.
7. McMillan A, Trompeter J, Havrda D, Fox J. Continuity of care between family practice physicians and hospitalist services. J Healthare Qual. 2013;35(1):41-49.
8. Liu CF, Manning WG, Burgess JF Jr, et al. Reliance on Veterans Affairs outpatient care by Medicare-eligible veterans. Med Care. 2011;49(10):911-917.
9. U.S. Department of Veterans Affairs, Veterans Health Administration. VHA Office of the ADUSH for Policy and Planning. 2011 survey of veteran enrollees’ health and reliance upon VA. http://www.va.gov/healthpolicyplanning/soe2011/soe2011_report.pdf. Published March 2012. Accessed August 2, 2016.
10. Nayar P, Apenteng B, Yu F, Woodbridge P, Fetrick A. Rural veterans’ perspectives of dual care. J Community Health. 2013;38(1):70-77.
11. Chae SY, Chae MH, Isaacson N, James TS. The patient medication list: can we get patients more involved in their medical care? J Am Board Fam Med. 2009;22(6):677-685.
12. Tang PC, Ash JS, Bates DW, Overhage JM, Sands DZ. Personal health records: definitions, benefits, and strategies for overcoming barriers to adoption. J Am Med Informatics Assoc. 2006;13(2):121-126.
13. Stroupe KT, Smith BM, Hogan TP, et al. Medication acquisition across systems of care and patient–provider communication among older veterans. Am J Health Syst Pharm. 2013;70(9):804-813.
14. Shoemaker SJ, Ramalho de Oliveira D, Alves M, Ekstrand M. The medication experience: preliminary evidence of its value for patient education and counseling on chronic medications. Patient Educ Couns. 2011;83(3):443-450.
15. Chewning B, Boh L, Wiederholt J, et al. Does the concordance concept serve patient medication management? Int J Pharm Pract. 2001;9(2):71-79.
16. Irizarry T, DeVito Dabbs A, Curran CR. Patient portals and patient engagement: a state of the science review. J Med Internet Res. 2015;17(6):e148.
17. Schnipper JL, Gandhi TK, Wald JS, et al. Effects of an online personal health record on medication accuracy and safety: a cluster-randomized trial. J Am Med Inform Assoc. 2012;19(5):728-734.
18. Turvey C, Klein D, Fix G, et al. Blue Button use by patients to access and share health record information using the Department of Veterans Affairs’ online patient portal. J Am Med Inform Assoc. 2014;21(4):657-663.
19. Hogan TP, Nazi KM, Luger TM, et al. Technology-assisted patient access to clinical information: an evaluation framework for Blue Button. JMIR Res Protoc. 2014;3(1):e18.
20. Steinman MA, Handler SM, Gurwitz JH, Schiff GD, Covinsky KE. Beyond the prescription: medication monitoring and adverse drug events in older adults. J Am Geriatr Soc. 2011;59(8):1520-1530.
21. Turvey CL, Klein DM, Witry M, et al. Patient education for consumer-mediated HIE. A pilot randomized controlled trial of the Department of Veterans Affairs Blue Button. Appl Clin Inform. 2016;7(3):765-776.
22. Polnaszek B, Gilmore-Bykovskyi A, Hovanes M, et al. Overcoming the challenges of unstructured data in multisite, electronic medical record-based abstraction [published online ahead of print June 25, 2014]. Med Care. doi: 10.1097/MLR.0000000000000108.
23. Kennelty K, Witry MJ, Gehring M, M D, Pulia N. A four-phase approach for systematically collecting data and measuring medication discrepancies when patients transition between health care settings. Res Social Adm Pharm. 2016;12(4):548-558.
24. American Geriatrics Society 2012 Beers Criteria Update Expert Panel. American Geriatrics Society updated Beers criteria for potentially inappropriate medication use in older adults. J Am Geriatr Soc. 2012;60(4):616-631.
25. Gurwitz JH, Field TS, Harrold LR, et al. Incidence and preventability of adverse drug events among older persons in the ambulatory setting. JAMA. 2003;289(9):1107-1116.
26. Gurwitz JH, Field TS, Avorn J, et al. Incidence and preventability of adverse drug events in nursing homes. Am J Med. 2000;109(2):87-94.
27. Boockvar KS, Liu S, Goldstein N, Nebeker J, Siu A, Fried T. Prescribing discrepancies likely to cause adverse drug events after patient transfer. Qual Saf Health Care. 2009;18(1):32-36.
28. Shipherd JC, Stafford J, Tanner LR. Predicting alcohol and drug abuse in Persian Gulf War veterans: what role do PTSD symptoms play? Addict Behav. 2005;30(3):595-599.
29. Markou A, Kosten TR, Koob GF. Neurobiological similarities in depression and drug dependence: a self-medication hypothesis. Neuropsychopharmacology. 1998;18(3):135-174.
30. McFall ME, Mackay PW, Donovan DM. Combat-related posttraumatic stress disorder and severity of substance abuse in Vietnam veterans. J Stud Alcohol. 1992;53(4):357-363.
31. Kwan JL, Lo L, Sampson M, Shojania KG. Medication reconciliation during transitions of care as a patient safety strategy: a systematic review. Ann Intern Med. 2013;158(5, pt 2):397-403.
32. Richard C, Lussier MT. Nature and frequency of exchanges on medications during primary care encounters. Patient Educ Couns. 2006;64(1-3):207-216.
33. Witry MJ, Doucette WR, Daly JM, Levy BT, Chrischilles EA. Family physician perceptions of personal health records. Perspect Health Inf Manag. 2010;7.
34. Horne R, Weinman J. Patients’ beliefs about prescribed medicines and their role in adherence to treatment in chronic physical illness. J Psychosom Res. 1999;47(6):555-567.
35. Osterberg L, Blaschke T. Adherence to medication. N Eng J Med. 2005;353(5):487-497.
Impact of Acne Vulgaris on Quality of Life and Self-esteem
Acne vulgaris predominantly occurs during puberty and can persist beyond 25 years of age, most commonly in women.1,2 Although acne does not cause physical impairment, it can be associated with a considerable psychosocial burden including increased levels of anxiety, anger, depression, and frustration, which in turn can affect vocational and academic performance, quality of life (QOL), and self-esteem.3
Quality of life measures provide valuable insight into the debilitating effects of acne.1 It has been suggested that acne patients may experience poor body image and low self-esteem as well as social isolation and constriction of activities.4 Self-esteem is a favorable and unfavorable attitude toward oneself.5 A marked emphasis has been placed on body image in society, fueled by external cues such as the media.3,6 This study was carried out to assess QOL and self-esteem in acne patients.
Methods
This prospective, hospital-based, cross-sectional, case-control study was conducted at The Oxford Medical College, Hospital & Research Center (Bangalore, India), over a period of 3 months. One hundred consecutive acne cases (age range, 12–45 years) and 100 age- and gender-matched controls who did not have any skin disease provided consent and were included in the analysis. Guardians gave consent for individuals who were younger than 18 years. Exclusion criteria for cases included a medical disorder (eg, epilepsy, diabetes mellitus, hypertension) or medications that would likely interfere with acne assessment.
The cases and controls were administered a semistructured questionnaire to collect sociodemographic details. Acne was graded for the predominant lesions, QOL was assessed using the Cardiff Acne Disability Index (CADI) and World Health Organization Quality of Life–BREF (WHOQOL-BREF) scale, and self-esteem was measured using the Rosenberg self-esteem scale (RSES). The study was approved by the institutional review board.
Acne Grading
Acne was graded according to the predominant lesions using the following criteria: grade 1=comedones and occasional papules; grade 2=papules, comedones, and few pustules; grade 3=predominant pustules, nodules, and abscesses; and grade 4=mainly cysts, abscesses, and widespread scarring.1
Quality of Life Assessment
The CADI questionnaire was used to assess the level of disability caused by acne.6 It is a 5-item questionnaire with scores ranging from 0 to 3 for a total maximum score of 15 and minimum score of 0. Total scores were classified as low (0–4), medium (5–9), and high (10–15).7
The WHOQOL-BREF is a self-reported questionnaire containing 26 items that make up the 4 domains of physical health (7 items), psychological health (6 items), social relationships (3 items), and environment (8 items); there also are 2 single questions regarding the overall perception of QOL and health. Questions were scored on aseries of 5-point scales with higher scores denoting better QOL.8
Self-esteem Assessment
The RSES uses a 5-point Likert scale from strongly agree to strongly disagree to rate a series of 10 statements. The total score ranges from 0 to 30. Scores less than 15 suggest low self-esteem, while scores of 15 and greater indicate high self-esteem.5
Statistical Analysis
Results were analyzed using descriptive and inferential statistical methods. A χ2 test was used for categorical data, and a Student t test and an analysis of variance were used for continuous data.
Results
The study consisted of 100 cases and 100 controls. The mean age was 21 years. The majority of cases reported an age of onset of acne of 11 to 20 years (66%), were predominantly female (58%) from rural backgrounds, and had a family history of acne (68%). The majority of lesions ceased within 24 months (60%). The face was the most commonly involved area (80%) and papules were the most prevalent lesion type (62%).
Cases predominantly had grade 2 acne (46%), and there was medium to high impairment in QOL according to CADI scores.
The scores for all the domains of the WHOQOL-BREF as well as the total score were lower in cases compared to controls (Table). There was a statistically significant difference between the 2 groups in the psychological (P=.0402) and environment (P=.006) domains.
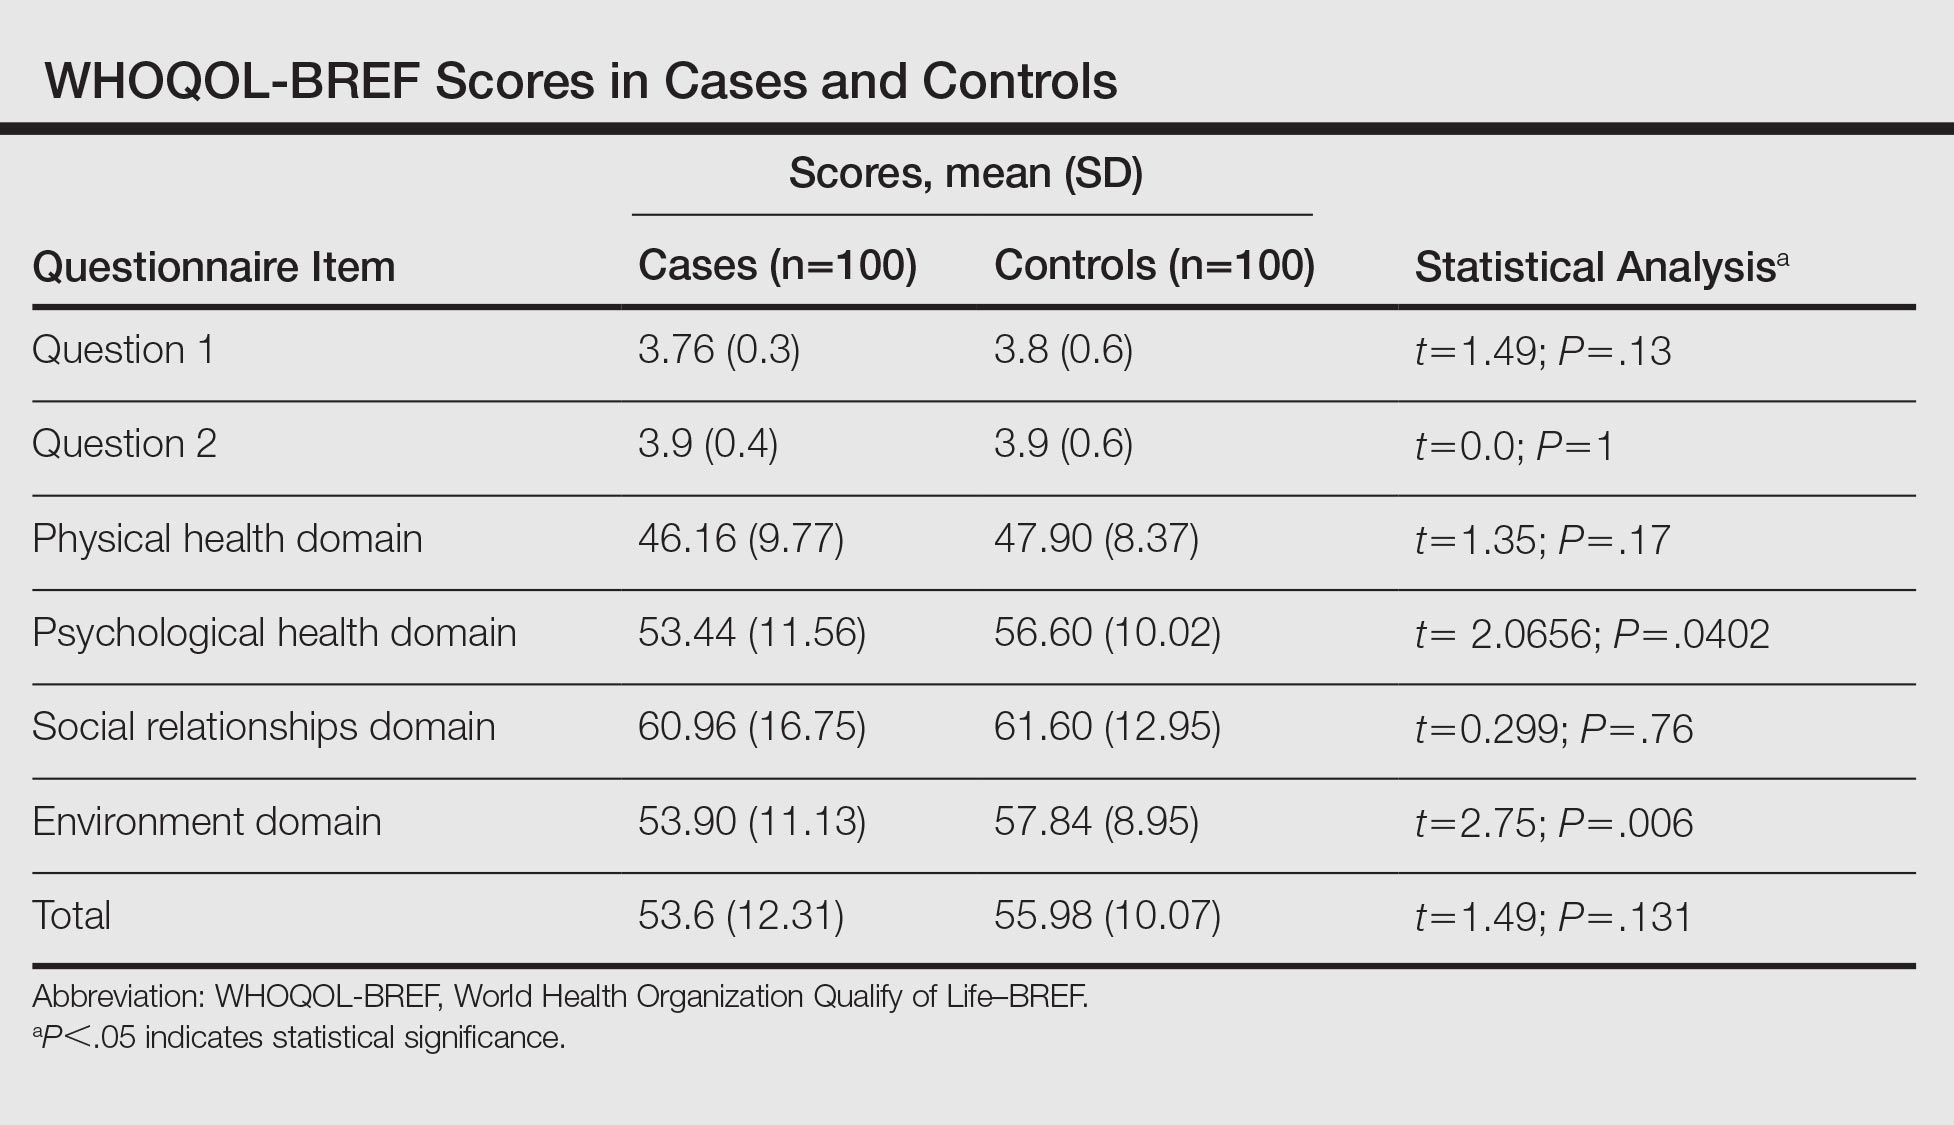
The RSES mean (SD) score was higher in controls (19.74 [4.23]) than in cases (15.72 [5.06]) and was statistically significant (P<.0001). Low self-esteem was noted in 38% of cases and 16% of controls, and high self-esteem was noted in 62% and 84%, respectively.
In reviewing the correlation between acne severity, CADI, WHOQOL-BREF, and RSES scores, we found a positive correlation between acne severity and CADI scores (R=0.51), which implies that as the severity of acne worsens, the QOL impairment increases. There was a negative correlation between acne severity, WHOQOL-BREF score (R=–0.13), and RSES score (R=–0.18), which showed that as the severity of acne increases, QOL and self-esteem decrease. We observed that as the grade of acne increases, there is a statistically significant impairment in the QOL according to CADI (P<.001), while there is a reduction in QOL and self-esteem according to WHOQOL-BREF and RSES, respectively (P>.05).
Comment
Patients are more likely to develop acne than any other skin disease in their lifetime. Only in recent years has the psychodermatologic literature begun to address the possibility of acne having a psychological and emotional impact.4 Although the cause-and-effect relationship between acne and psychological trauma has been debated for decades, only recently has the measurement focus shifted from psychological correlates (eg, personality) and emotional triggers (eg, stress) to the effect of acne on patients’ QOL and self-esteem. This shift occurred as validated instruments for measuring disability, QOL, and self-esteem, specifically in patients with skin diseases, became available.9
In our study, the age of onset of acne was 11 to 20 years and it affected predominantly females (58%), which is in concordance with other studies, as acne develops in adolescence and subsides in adulthood.1,10 Acne is more common in females due to hormonal factors and use of cosmetics. We observed that the face (80%) was most frequently affected, followed by the back (14%) and chest (6%), which is similar to prior studies.1,10 Because the face plays an important role in body image, the presence of facial lesions may be unacceptable for patients and therefore they may present more frequently to dermatologists.
In our study, 68% of cases and 22% of controls had a family history of acne. A similar correlation also was noted in other studies, which suggests acne has an inherited predisposition due to involvement of the cytochrome P450-1A1 gene, CYP1A1, and steroid 21-hydroxylase, P-450-c21.1,11 We found 46% of cases had grade 2 acne and 36% had grade 1 acne, which was congruent with prior studies.12,13 Patients with severe acne are more likely to seek medical intervention in hospitals.
In our study, 58% of the cases had medium to high impairment in QOL according to CADI scores. We noticed as the severity of acne increased there was severe impairment in QOL. Similar findings have been found in studies that used other scales to assess QOL.1,6,9
In our study, 38% of cases and 16% of controls had low self-esteem, which was statistically significant (P<.0001). There was a negative correlation between the severity of acne and self-esteem. In a prior study of 240 professional college students, 53% had feelings of low self-esteem and 40% revealed they avoided social gatherings and interactions with the opposite sex because of their acne.14 In a questionnaire-based survey of 3775 students, it was observed that the presence of acne correlated with poor self-attitude in boys and poor self-worth in girls.3 We found patients with grade 1 acne had higher self-esteem as compared to other grades of acne. Similarly, a cross-sectional study by Uslu et al15 found a direct correlation between acne severity and lower self-esteem using the RSES questionnaire. Although acne may be viewed as a minor cosmetic issue, it can have a negative impact on self-esteem and interpersonal relationships. Many of the studies had not used a validated structured questionnaire to assess self-esteem and there is a paucity of literature in relation to acne and self-esteem.3,16,17
According to the WHOQOL-BREF, the psychological domain was affected more in cases than in controls, which was a statistically significant difference. One study observed that patients experience immediate psychological consequences of acne such as reduced self-esteem, poor self-image, self-consciousness, and embarrassment.3 These effects are exacerbated by taunting, stigmatization, and perceptions of scrutiny and being judged, causing patients to avoid interaction and social situations. Similarly, Pruthi and Babu18 observed that acne had an impact on the psychosocial aspects of adult females using the Dermatology Life Quality Index and CADI.
Financial resources, health and social care accessibility, and opportunities for acquiring new information and skills were the factors that were considered in the environment domain of the WHOQOL-BREF.8 We noted that the environment domain scores were significantly lower in cases than in controls. The cases could have had a detrimental effect on the latest opportunities in occupational functioning due to acne, and as most of the population was from a rural area, they were having less favorable circumstances in acquiring new information about the management of acne.
There was no statistically significant difference between cases and controls in the social and physical domains of the WHOQOL-BREF, which suggests that these fields do not influence QOL. Similarly, patients in Sarawak, Malaysia, were least affected in the domain of social functioning, which was likely attributed to the upbringing of this population encouraging stoicism.19
In the current study, QOL impairment showed a positive correlation with acne severity according to CADI scores; however, there was no significant difference between WHOQOL-BREF score and acne grading, which suggests that QOL impairment does not depend on severity of acne alone. Physical, psychological, social, and environment domains play an important role in impaired QOL. Hence, by using the WHOQOL-BREF we can evaluate the actual domain that is adversely affected by acne and can be treated with a holistic approach. This point must be stressed in the training of medical faculty, as the treatment of acne should not be based on acne severity alone but also on the degree of QOL impairment.19
These results indicate that more data are required and there is a need to consider other variables that could play a role. This study was a hospital-based, cross-sectional study with a small sample group that cannot be generalized, which are limitations. Longitudinal follow-up of the cases before and after treatment was not done. The questionnaires helped us to detect psychosocial aspects but were insufficient to diagnose psychiatric comorbidity.
The strengths of this study include the use of a specific scale for the assessment of self-esteem. The usage of comprehensive (WHOQOL-BREF) and specific (CADI) scales to evaluate QOL has mutual advantage.
Conclusion
Acne vulgaris is a disease that can adversely affect an individual’s QOL and self-esteem. This study suggested the importance of screening for psychosocial problems in those who present for management of acne. It is important for dermatologists to be cautious about psychological problems in acne patients and be aware of the importance of basic psychosomatic treatment in conjunction with medical treatment in the management of acne.
- Durai PC, Nair DG. Acne vulgaris and quality of life among young adults in South India. Indian J Dermatol. 2015;60:33-40.
- Karciauskiene J, Valiukeviciene S, Gollnick H, et al. The prevalence and risk factors of adolescent acne among schoolchildren in Lithuania: a cross-sectional study. J Eur Acad Dermatol Venereol. 2014;28:733-740.
- Dunn LK, O’Neill JL, Feldman SR. Acne in adolescents: quality of life, self-esteem, mood, and psychological disorders. Dermatol Online J. 2011;17:1.
- Do JE, Cho SM, In SI, et al. Psychosocial aspects of acne vulgaris: a community-based study with Korean adolescents. Ann Dermatol. 2009;21:125-129.
- Rosenberg M. Society and the Adolescent Self-Image. Princeton, NJ: Princeton University Press; 1965.
- Ogedegbe EE, Henshaw EB. Severity and impact of acne vulgaris on the quality of life of adolescents in Nigeria. Clin Cosmet Investig Dermatol. 2014;7:329-334.
- Cardiff Acne Disability Index (CADI). Cardiff University website. sites.cardiff.ac.uk/dermatology/…of…/Cardiff-acne-disability-index-cadi/. Accessed July 21, 2016.
- WHO QOL-BREF: Introduction, administration, scoring and generic version of the assessment. World Health Organization website. http://www.who.int/mental_health/media/en/76.pdf. Published December 1996. Accessed June 6, 2016.
- Lasek RJ, Chren MM. Acne vulgaris and the quality of life of adult dermatology patients. Arch Dermatol. 1998;134:454-458.
- Adityan B, Thappa DM. Profile of acne vulgaris—a hospital-based study from South India. Indian J Dermatol Venereol Leprol. 2009;75:272-278.
- Tasoula E, Gregoriou S, Chalikias J, et al. The impact of acne vulgaris on quality of life and psychic health in young adolescents in Greece. results of a population survey. An Bras Dermatol. 2012;87:862-869.
- Agheai S, Mazaharinia N, Jafari P, et al. The Persian version of the Cardiff Acne Disability Index. reliability and validity study. Saudi Med J. 2006;27:80-82.
- Mallon E, Newton JN, Klassen A, et al. The quality of life in acne: a comparison with general medical conditions using generic questionnaires. Br J Dermatol. 1999;140:672-676.
- Goel S, Goel S. Clinico-psychological profile of acne vulgaris among professional students. Indian J Public Health Res Dev. 2012;3:175-178.
- Uslu G, Sendur N, Uslu M, et al. Acne: prevalence, perceptions and effects on psychological health among adolescents in Aydin, Turkey. J Eur Acad Dermatol Venereol. 2008;22:462-469.
- Ayer J, Burrows N. Acne: more than skin deep. Postgrad Med J. 2006;82:500-506.
- Fried RG, Gupta MA, Gupta AK. Depression and skin disease. Dermatol Clin. 2005;23:657-664.
- Pruthi GK, Babu N. Physical and psychosocial impact of acne in adult females. Indian J Dermatol. 2012;57:26-29.
- Yap FB. Cardiff Acne Disability Index in Sarawak, Malaysia. Ann Dermatol. 2012;24:158-161.
Acne vulgaris predominantly occurs during puberty and can persist beyond 25 years of age, most commonly in women.1,2 Although acne does not cause physical impairment, it can be associated with a considerable psychosocial burden including increased levels of anxiety, anger, depression, and frustration, which in turn can affect vocational and academic performance, quality of life (QOL), and self-esteem.3
Quality of life measures provide valuable insight into the debilitating effects of acne.1 It has been suggested that acne patients may experience poor body image and low self-esteem as well as social isolation and constriction of activities.4 Self-esteem is a favorable and unfavorable attitude toward oneself.5 A marked emphasis has been placed on body image in society, fueled by external cues such as the media.3,6 This study was carried out to assess QOL and self-esteem in acne patients.
Methods
This prospective, hospital-based, cross-sectional, case-control study was conducted at The Oxford Medical College, Hospital & Research Center (Bangalore, India), over a period of 3 months. One hundred consecutive acne cases (age range, 12–45 years) and 100 age- and gender-matched controls who did not have any skin disease provided consent and were included in the analysis. Guardians gave consent for individuals who were younger than 18 years. Exclusion criteria for cases included a medical disorder (eg, epilepsy, diabetes mellitus, hypertension) or medications that would likely interfere with acne assessment.
The cases and controls were administered a semistructured questionnaire to collect sociodemographic details. Acne was graded for the predominant lesions, QOL was assessed using the Cardiff Acne Disability Index (CADI) and World Health Organization Quality of Life–BREF (WHOQOL-BREF) scale, and self-esteem was measured using the Rosenberg self-esteem scale (RSES). The study was approved by the institutional review board.
Acne Grading
Acne was graded according to the predominant lesions using the following criteria: grade 1=comedones and occasional papules; grade 2=papules, comedones, and few pustules; grade 3=predominant pustules, nodules, and abscesses; and grade 4=mainly cysts, abscesses, and widespread scarring.1
Quality of Life Assessment
The CADI questionnaire was used to assess the level of disability caused by acne.6 It is a 5-item questionnaire with scores ranging from 0 to 3 for a total maximum score of 15 and minimum score of 0. Total scores were classified as low (0–4), medium (5–9), and high (10–15).7
The WHOQOL-BREF is a self-reported questionnaire containing 26 items that make up the 4 domains of physical health (7 items), psychological health (6 items), social relationships (3 items), and environment (8 items); there also are 2 single questions regarding the overall perception of QOL and health. Questions were scored on aseries of 5-point scales with higher scores denoting better QOL.8
Self-esteem Assessment
The RSES uses a 5-point Likert scale from strongly agree to strongly disagree to rate a series of 10 statements. The total score ranges from 0 to 30. Scores less than 15 suggest low self-esteem, while scores of 15 and greater indicate high self-esteem.5
Statistical Analysis
Results were analyzed using descriptive and inferential statistical methods. A χ2 test was used for categorical data, and a Student t test and an analysis of variance were used for continuous data.
Results
The study consisted of 100 cases and 100 controls. The mean age was 21 years. The majority of cases reported an age of onset of acne of 11 to 20 years (66%), were predominantly female (58%) from rural backgrounds, and had a family history of acne (68%). The majority of lesions ceased within 24 months (60%). The face was the most commonly involved area (80%) and papules were the most prevalent lesion type (62%).
Cases predominantly had grade 2 acne (46%), and there was medium to high impairment in QOL according to CADI scores.
The scores for all the domains of the WHOQOL-BREF as well as the total score were lower in cases compared to controls (Table). There was a statistically significant difference between the 2 groups in the psychological (P=.0402) and environment (P=.006) domains.
The RSES mean (SD) score was higher in controls (19.74 [4.23]) than in cases (15.72 [5.06]) and was statistically significant (P<.0001). Low self-esteem was noted in 38% of cases and 16% of controls, and high self-esteem was noted in 62% and 84%, respectively.
In reviewing the correlation between acne severity, CADI, WHOQOL-BREF, and RSES scores, we found a positive correlation between acne severity and CADI scores (R=0.51), which implies that as the severity of acne worsens, the QOL impairment increases. There was a negative correlation between acne severity, WHOQOL-BREF score (R=–0.13), and RSES score (R=–0.18), which showed that as the severity of acne increases, QOL and self-esteem decrease. We observed that as the grade of acne increases, there is a statistically significant impairment in the QOL according to CADI (P<.001), while there is a reduction in QOL and self-esteem according to WHOQOL-BREF and RSES, respectively (P>.05).
Comment
Patients are more likely to develop acne than any other skin disease in their lifetime. Only in recent years has the psychodermatologic literature begun to address the possibility of acne having a psychological and emotional impact.4 Although the cause-and-effect relationship between acne and psychological trauma has been debated for decades, only recently has the measurement focus shifted from psychological correlates (eg, personality) and emotional triggers (eg, stress) to the effect of acne on patients’ QOL and self-esteem. This shift occurred as validated instruments for measuring disability, QOL, and self-esteem, specifically in patients with skin diseases, became available.9
In our study, the age of onset of acne was 11 to 20 years and it affected predominantly females (58%), which is in concordance with other studies, as acne develops in adolescence and subsides in adulthood.1,10 Acne is more common in females due to hormonal factors and use of cosmetics. We observed that the face (80%) was most frequently affected, followed by the back (14%) and chest (6%), which is similar to prior studies.1,10 Because the face plays an important role in body image, the presence of facial lesions may be unacceptable for patients and therefore they may present more frequently to dermatologists.
In our study, 68% of cases and 22% of controls had a family history of acne. A similar correlation also was noted in other studies, which suggests acne has an inherited predisposition due to involvement of the cytochrome P450-1A1 gene, CYP1A1, and steroid 21-hydroxylase, P-450-c21.1,11 We found 46% of cases had grade 2 acne and 36% had grade 1 acne, which was congruent with prior studies.12,13 Patients with severe acne are more likely to seek medical intervention in hospitals.
In our study, 58% of the cases had medium to high impairment in QOL according to CADI scores. We noticed as the severity of acne increased there was severe impairment in QOL. Similar findings have been found in studies that used other scales to assess QOL.1,6,9
In our study, 38% of cases and 16% of controls had low self-esteem, which was statistically significant (P<.0001). There was a negative correlation between the severity of acne and self-esteem. In a prior study of 240 professional college students, 53% had feelings of low self-esteem and 40% revealed they avoided social gatherings and interactions with the opposite sex because of their acne.14 In a questionnaire-based survey of 3775 students, it was observed that the presence of acne correlated with poor self-attitude in boys and poor self-worth in girls.3 We found patients with grade 1 acne had higher self-esteem as compared to other grades of acne. Similarly, a cross-sectional study by Uslu et al15 found a direct correlation between acne severity and lower self-esteem using the RSES questionnaire. Although acne may be viewed as a minor cosmetic issue, it can have a negative impact on self-esteem and interpersonal relationships. Many of the studies had not used a validated structured questionnaire to assess self-esteem and there is a paucity of literature in relation to acne and self-esteem.3,16,17
According to the WHOQOL-BREF, the psychological domain was affected more in cases than in controls, which was a statistically significant difference. One study observed that patients experience immediate psychological consequences of acne such as reduced self-esteem, poor self-image, self-consciousness, and embarrassment.3 These effects are exacerbated by taunting, stigmatization, and perceptions of scrutiny and being judged, causing patients to avoid interaction and social situations. Similarly, Pruthi and Babu18 observed that acne had an impact on the psychosocial aspects of adult females using the Dermatology Life Quality Index and CADI.
Financial resources, health and social care accessibility, and opportunities for acquiring new information and skills were the factors that were considered in the environment domain of the WHOQOL-BREF.8 We noted that the environment domain scores were significantly lower in cases than in controls. The cases could have had a detrimental effect on the latest opportunities in occupational functioning due to acne, and as most of the population was from a rural area, they were having less favorable circumstances in acquiring new information about the management of acne.
There was no statistically significant difference between cases and controls in the social and physical domains of the WHOQOL-BREF, which suggests that these fields do not influence QOL. Similarly, patients in Sarawak, Malaysia, were least affected in the domain of social functioning, which was likely attributed to the upbringing of this population encouraging stoicism.19
In the current study, QOL impairment showed a positive correlation with acne severity according to CADI scores; however, there was no significant difference between WHOQOL-BREF score and acne grading, which suggests that QOL impairment does not depend on severity of acne alone. Physical, psychological, social, and environment domains play an important role in impaired QOL. Hence, by using the WHOQOL-BREF we can evaluate the actual domain that is adversely affected by acne and can be treated with a holistic approach. This point must be stressed in the training of medical faculty, as the treatment of acne should not be based on acne severity alone but also on the degree of QOL impairment.19
These results indicate that more data are required and there is a need to consider other variables that could play a role. This study was a hospital-based, cross-sectional study with a small sample group that cannot be generalized, which are limitations. Longitudinal follow-up of the cases before and after treatment was not done. The questionnaires helped us to detect psychosocial aspects but were insufficient to diagnose psychiatric comorbidity.
The strengths of this study include the use of a specific scale for the assessment of self-esteem. The usage of comprehensive (WHOQOL-BREF) and specific (CADI) scales to evaluate QOL has mutual advantage.
Conclusion
Acne vulgaris is a disease that can adversely affect an individual’s QOL and self-esteem. This study suggested the importance of screening for psychosocial problems in those who present for management of acne. It is important for dermatologists to be cautious about psychological problems in acne patients and be aware of the importance of basic psychosomatic treatment in conjunction with medical treatment in the management of acne.
- Durai PC, Nair DG. Acne vulgaris and quality of life among young adults in South India. Indian J Dermatol. 2015;60:33-40.
- Karciauskiene J, Valiukeviciene S, Gollnick H, et al. The prevalence and risk factors of adolescent acne among schoolchildren in Lithuania: a cross-sectional study. J Eur Acad Dermatol Venereol. 2014;28:733-740.
- Dunn LK, O’Neill JL, Feldman SR. Acne in adolescents: quality of life, self-esteem, mood, and psychological disorders. Dermatol Online J. 2011;17:1.
- Do JE, Cho SM, In SI, et al. Psychosocial aspects of acne vulgaris: a community-based study with Korean adolescents. Ann Dermatol. 2009;21:125-129.
- Rosenberg M. Society and the Adolescent Self-Image. Princeton, NJ: Princeton University Press; 1965.
- Ogedegbe EE, Henshaw EB. Severity and impact of acne vulgaris on the quality of life of adolescents in Nigeria. Clin Cosmet Investig Dermatol. 2014;7:329-334.
- Cardiff Acne Disability Index (CADI). Cardiff University website. sites.cardiff.ac.uk/dermatology/…of…/Cardiff-acne-disability-index-cadi/. Accessed July 21, 2016.
- WHO QOL-BREF: Introduction, administration, scoring and generic version of the assessment. World Health Organization website. http://www.who.int/mental_health/media/en/76.pdf. Published December 1996. Accessed June 6, 2016.
- Lasek RJ, Chren MM. Acne vulgaris and the quality of life of adult dermatology patients. Arch Dermatol. 1998;134:454-458.
- Adityan B, Thappa DM. Profile of acne vulgaris—a hospital-based study from South India. Indian J Dermatol Venereol Leprol. 2009;75:272-278.
- Tasoula E, Gregoriou S, Chalikias J, et al. The impact of acne vulgaris on quality of life and psychic health in young adolescents in Greece. results of a population survey. An Bras Dermatol. 2012;87:862-869.
- Agheai S, Mazaharinia N, Jafari P, et al. The Persian version of the Cardiff Acne Disability Index. reliability and validity study. Saudi Med J. 2006;27:80-82.
- Mallon E, Newton JN, Klassen A, et al. The quality of life in acne: a comparison with general medical conditions using generic questionnaires. Br J Dermatol. 1999;140:672-676.
- Goel S, Goel S. Clinico-psychological profile of acne vulgaris among professional students. Indian J Public Health Res Dev. 2012;3:175-178.
- Uslu G, Sendur N, Uslu M, et al. Acne: prevalence, perceptions and effects on psychological health among adolescents in Aydin, Turkey. J Eur Acad Dermatol Venereol. 2008;22:462-469.
- Ayer J, Burrows N. Acne: more than skin deep. Postgrad Med J. 2006;82:500-506.
- Fried RG, Gupta MA, Gupta AK. Depression and skin disease. Dermatol Clin. 2005;23:657-664.
- Pruthi GK, Babu N. Physical and psychosocial impact of acne in adult females. Indian J Dermatol. 2012;57:26-29.
- Yap FB. Cardiff Acne Disability Index in Sarawak, Malaysia. Ann Dermatol. 2012;24:158-161.
Practice Points
- Grading of acne will help with appropriate treatment, thus reducing the adverse psychological effects of the condition.
- Acne severity has a negative impact on quality of life and self-esteem.
- A sympathetic approach and basic psychosomatic treatment are necessary in the management of acne.

Effectiveness of an Employee Skin Cancer Screening Program for Secondary Prevention
The incidence of skin cancer, along with its effects on patients and the economy, has continued to increase and therefore requires particular attention from dermatologists. UV light has been shown to be of etiopathologic importance in the development of various types of skin cancer.1-3 Studies have shown that there is a direct correlation between the incidence of skin cancer and average annual amounts of UV radiation exposure.3 Accordingly, in 2009 the International Agency for Research on Cancer classified UV light as carcinogenic to humans.4 Therefore, the general public must be made aware of the danger of exposure to UV radiation.
In Australia, government initiatives to educate the population on causes of skin cancer development and its relationship to UV radiation have already caused the public to change their way of thinking and to deal with sunlight in a conscious and responsible manner.5 A large proportion of the Australian population with light skin is at a particularly high risk for developing skin cancer due to intense exposure to UV radiation. Numerous campaigns in Germany and other countries have attempted to sensitize the public to this issue by emphasizing a reduction in UV exposure (primary prevention) or highlighting the importance of early diagnosis (secondary prevention).6,7
For a good prognosis, it is crucial that skin cancer, particularly melanoma, is discovered at an early or precancerous stage.8 For this reason, self-examination of the skin and skin cancer screening are important factors that can contribute to ensuring early and curative treatment.9-11 Since July 1, 2008, skin cancer screenings have been included in the preventative health care program by statutory health insurance providers in Germany. As part of this program, the cost of screening once every 2 years for individuals 35 years and older is covered by statutory health insurance.12 Several studies have shown a decline in the melanoma mortality rate since the introduction of skin cancer screening programs in Germany.11,13,14
Employee skin cancer screening programs are an important method of examining high numbers of individuals quickly and effectively. These programs have been carried out in Germany and other countries.15,16 Studies have shown that skin cancer screening carried out selectively on defined groups can be an effective form of secondary prevention, particularly for those who work outdoors.17
An employee skin cancer screening program was carried out as part of this study. The findings are interpreted and discussed in relation to other employee screening programs that have been reported as well as those introduced by statutory health insurance providers in Germany. The aim of this study was to determine the importance and effectiveness of employee skin cancer screening programs and the role they play in secondary prevention of skin cancer.
Methods
Study Population
Employees of a technical company in Bavaria, Germany, were offered a skin cancer screening program by the employer’s occupational health service and health insurance provider in collaboration with the Department of Dermatology at the University Hospital Erlangen (Erlangen, Germany). Skin examinations were performed exclusively by 5 trained dermatologists. Only direct employees of the company at 3 of its locations in the Erlangen area were eligible to participate. The total number of employees varied by location (1072–5126 employees). The majority of employees had a university education or had completed technical training. Family members and other individuals who were not members of the company were excluded. There were no further inclusion or exclusion criteria. Over a period of 13 days, 783 of 7823 total employees (10.0%) were examined and included in the study. The study was approved by the Responsible Ethics Commission of the Faculty of Medicine at Friedrich-Alexander-University Erlangen-Nürnberg, Germany.
Study Design
Employees signed a consent form for participation in the study and completed a standardized questionnaire. The questionnaire was based on surveys used in a prior study18 and collected information on current and prior skin lesions, prior dermatological screening, personal and family history of skin tumors, frequency of UV exposure, and type of UV protection used. For the question on measures taken for protection from UV radiation, possible answers included with sunscreen cream, with suitable sun-protective clothing, and by staying in the shade, or no measures were taken. In contrast to the other questions, multiple answers were accepted for this question. Answering no automatically excluded other possible answers. Participants also were asked to assess their own Fitzpatrick skin type19; the questionnaire included explanations of each skin type (I–IV).
The participants were then called in for examination by the dermatologist at 15-minute intervals. All clothing was removed and the skin was examined. Dermatoscopes were used for closer examination of suspicious skin lesions. The clinical results of the examinations were recorded on a standardized form.
An estimation of the number of melanocytic nevi—≤20, 21–49, or ≥50—was recorded for each patient. Suspicious skin lesions were assigned to one of the following categories: nevus requiring future checkup (Nc), nevus requiring excision (Ne), suspected malignant melanoma (MM), suspected squamous cell carcinoma, suspected basal cell carcinoma (BCC), suspected other skin tumor, and precancerous lesion. Fitzpatrick skin type also was assessed for all participants and recorded by the dermatologist carrying out the examination. Each participant was assigned to a risk group—low, moderate, or high risk—based on their individual risk for developing a skin tumor. Factors that were considered when determining participants’ risk for developing skin cancer included Fitzpatrick skin type, number of melanocytic nevi, personal and family history, leisure activities, UV protection used, and current clinical diagnosis of skin lesions.
After the skin examination, participants were informed of recommended treatment but were not given any additional dermatologic advice. Participants could arrange an appointment at the Department of Dermatology, University Hospital Erlangen, for the excision and histological analysis of the skin lesions. All recorded data were collected in a computerized spreadsheet program. When evaluating the questionnaires, questions that were not answered or were answered incorrectly (participant chose more than 1 answer) were ignored.
Statistical Analysis
Statistical analysis was carried out using SPSS software version 16.0. The majority of the data were nominal or ordinal. Metric data were checked for normal distribution using the Shapiro-Wilk test before carrying out parametric tests. Statistical tests were carried out using the χ2 test and the t test for independent samples. Non-nominal distributed data were checked using the Mann-Whitney U test. P<.05 was considered statistically significant in the exploratory data analysis.
Results
Of 783 employees included in the study, 288 (36.8%) were female and 495 (63.2%) were male (Table 1). In comparison with the total workforce, a significantly higher proportion of women than men took part in the cross-sectional study (P<.01). The average age (SD) was 42.3 (9.5) years (range, 18–64 years). Female participants (average age [SD], 39.8 [10.2] years) were significantly younger than male participants (average age [SD], 43.8 [8.8] years; P<.01). Forty-one percent of participants had a prior skin cancer screening. One percent of participants had a personal history of skin cancer, with 1 participant reporting a history of MM; 6.5% had a family history of skin cancer, of which 39.2% had a family history of MM.
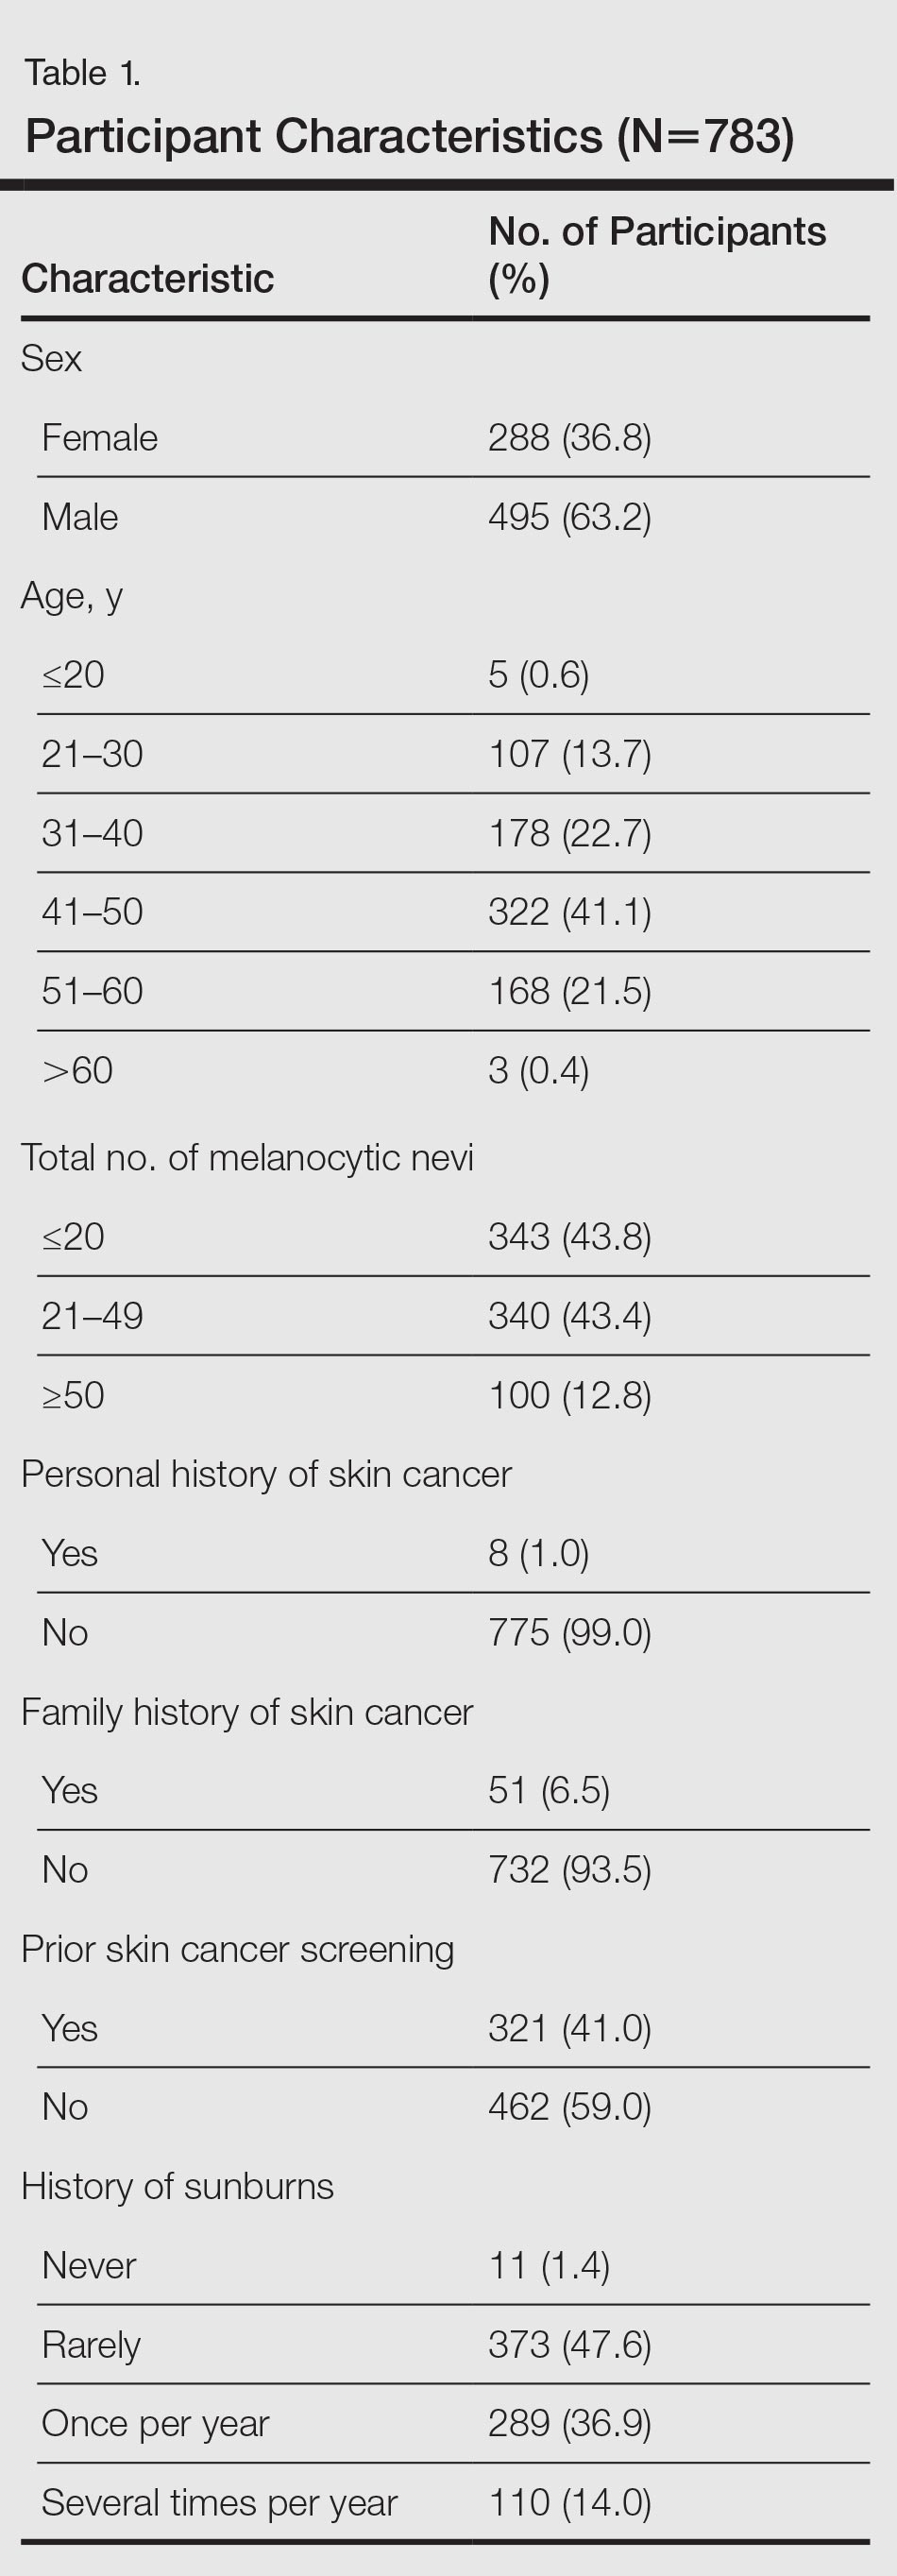
The results of the clinical examinations showed that 43.8% of participants had 20 or fewer melanocytic nevi, 43.4% had 21 to 49 melanocytic nevi, and 12.8% had 50 or more melanocytic nevi. Significantly more women than men had 20 or fewer melanocytic nevi (P<.05).
Approximately 92% of participants assessed themselves as having Fitzpatrick skin types II (35.2%) or III (56.7%), while only approximately 3.6% and 4.5% assessed themselves as having skin types I and IV, respectively. The results of the Fitzpatrick skin type assessments made by dermatologists were similar: 96.9% of participants were assessed as having Fitzpatrick skin types II (43.0%) and III (53.8%); approximately 1.9% and 1.3% were assessed as having Fitzpatrick skin types I and IV, respectively. Results showed that 80.2% of all participants assessed their skin type in the same way as the dermatologist; 13.5% assessed their skin type as darker and 6.3% (49/783) assessed it as lighter. A quantitative analysis of Fitzpatrick skin type and sex showed that significantly more male participants than female participants assessed their Fitzpatrick skin type darker than their actual skin type (P<.01).
Overall, 47.6% of participants reported having had sunburn rarely in the past, while 36.9% and 14.0% had experienced sunburn once per year and several times per year, respectively. Approximately 1.4% of participants reported never having a sunburn. More of the male participants made use of comprehensive sun protection using all methods listed (34.5%; P<.05) or a combination of sunscreen and sun-protective clothing (14.9%; P<.01) than the female participants who relied more frequently on sunscreen alone (29.5%; P<.01) or a combination of sunscreen and staying in the shade (29.5%; P<.01)
In general it was clear that sunscreen, either alone or in combination with other sun-protection methods, was used most frequently (88.0%); 58.0% protected themselves by staying in the shade, while 48.0% used suitable sun-protective clothing. Only 3.6% of participants did not protect themselves using any of the suggested methods.
A total of 661 categorized skin lesions were found in 377 participants. Of these lesions, 491 were Nc and 121 were Ne. Twenty-four of the skin lesions were suspected precancerous lesions, 13 were suspected BCC, 2 were suspected MM, and 10 were suspected other skin tumor (Table 2). Overall, male participants who were diagnosed with at least 1 skin lesion (average age, 44.0 years) were significantly older than the women (average age, 39.3 years)(P<.01). Similar findings were observed in participants with at least 1 Nc (men, 43.3 years; women, 38.7 years; P<.01) and at least 1 Ne (men, 44.2 years; women, 38.0 years; P<.05). With regard to the individual risk for developing skin cancer, 32.6% of participants were considered to be at low risk, 64.9% were at moderate risk, and 2.6% were at high risk.
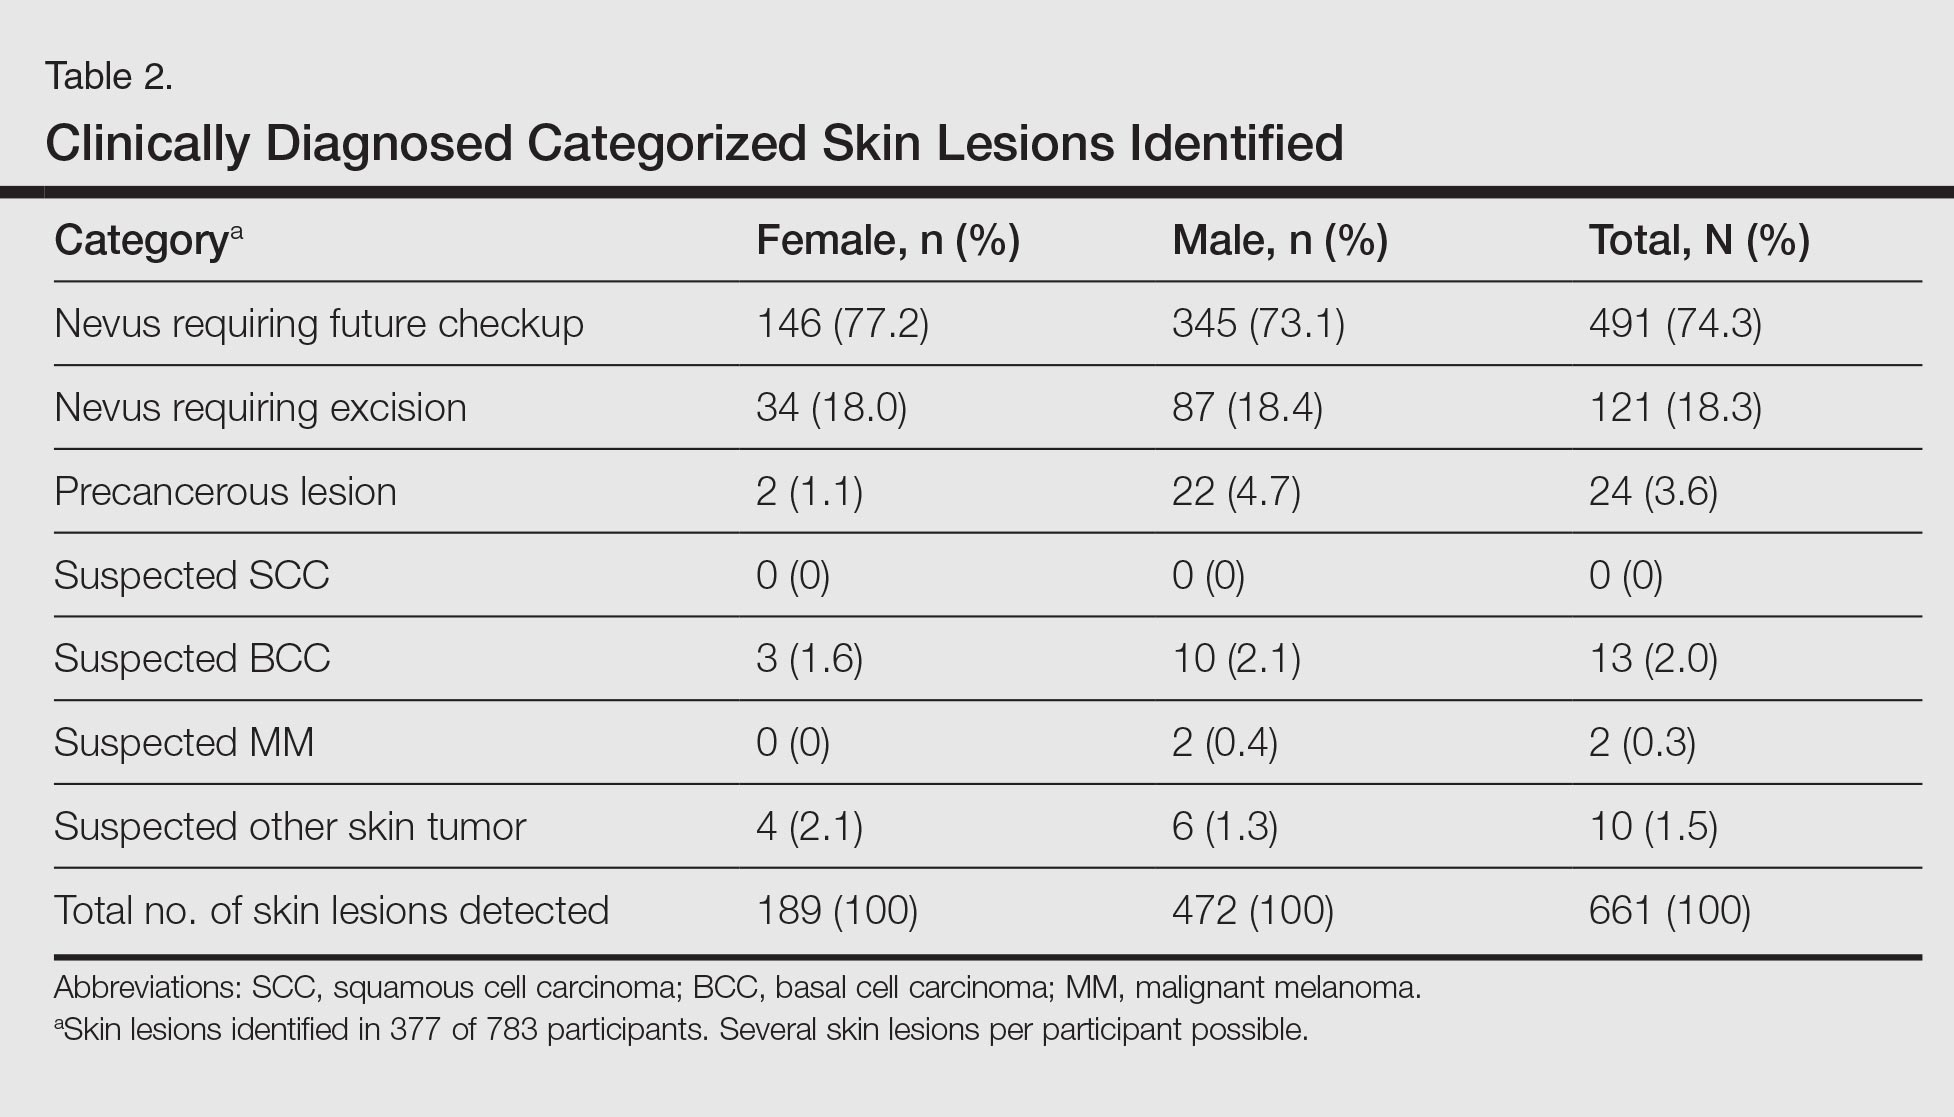
Approximately 61.5% of 377 participants who were diagnosed with at least 1 categorized skin lesion were advised to have a specific skin lesion checked by a dermatologist or to have a full examination for skin cancer once every 12 months. Furthermore, 22.5% were advised to follow-up biannually and 11.7% were advised to follow-up once every 2 years. Of the remaining participants who were advised to have follow-ups, 0.3% were advised to have a skin examination once every 3 months after having had MM, and 4.0% were advised to have follow-up once every 18 months. Overall, follow-up was recommended within 1 year in 84.4% of cases and within 1 to 2 years in 15.6% (Table 3).
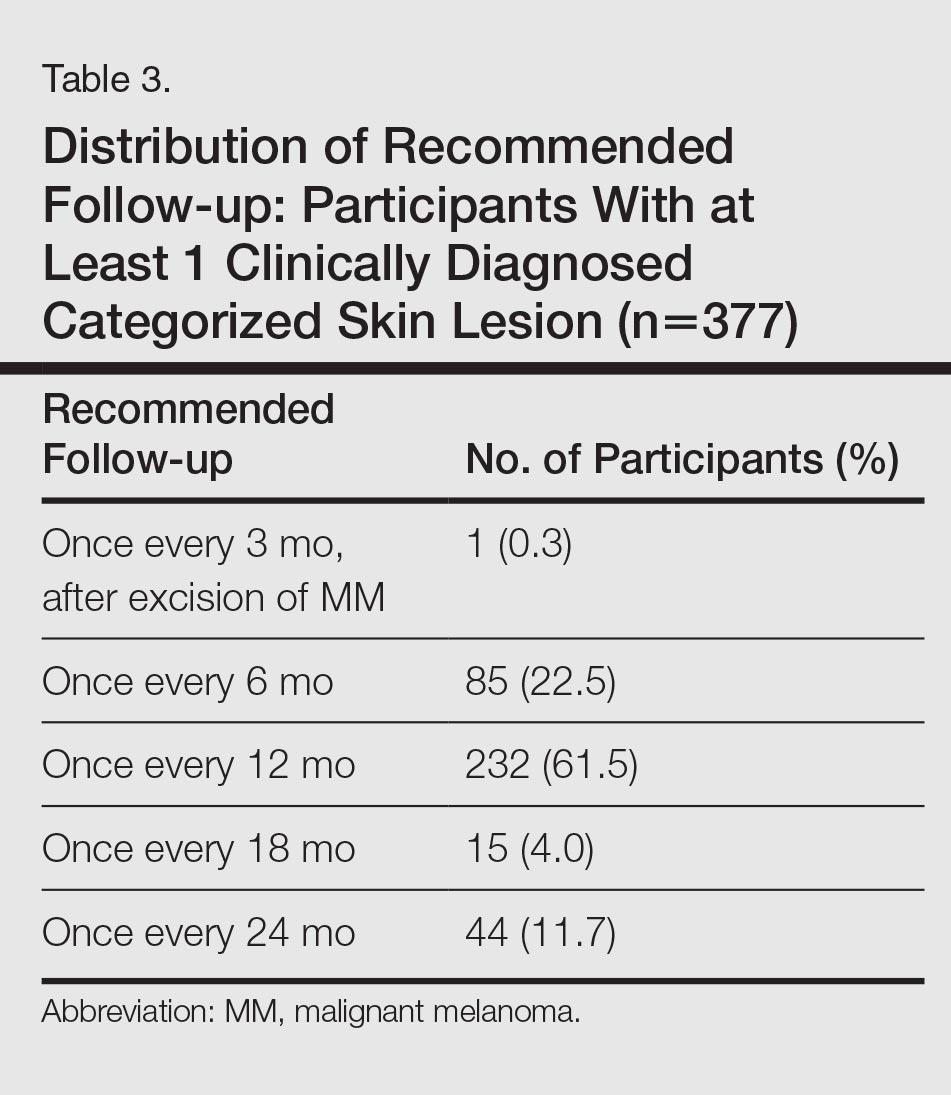
Subsequent histological analysis of the excised tissue resulted in a diagnosis of only 21 clinically significant skin conditions. One case of Bowen disease and 1 case of BCC was confirmed. Histological analysis identified the remaining 19 excised skin lesions, which included the 2 suspected MMs, as dysplastic nevi.
Comment
The aim of this cross-sectional study was to examine the importance and effectiveness of employee skin cancer screening programs. In comparison with the total workforce, significantly more women took part than men. Female participants were significantly younger than male participants, which mirrors the findings of prior studies showing that screening programs reach women more frequently than men and that women who participate in screenings are also younger on average in comparison to men.7-13 Men and older individuals usually are underrepresented.7,13 The average age of participants in our study was 42.3 years, which is lower than in the SCREEN (Skin Cancer Research to Provide Evidence for Effectiveness of Screening in Northern Germany) study (average age, 49.7 years).13 The average age in our study also is likely to be lower than patients who undergo skin cancer screenings offered by statutory health insurance providers in Germany, which has a minimum age restriction of 35 years; however, it is comparable to the average age of participants in other employee screening programs and therefore represents the average age of individuals employed in Germany.15,16
The employee skin cancer screening program in this study generated a high level of interest, indicated by the fact that all available appointments had been booked just 36 hours after the screening was announced. Furthermore, there was a waiting list of approximately 300 employees who were not able to undergo a skin examination. For logistical reasons, the number of participants was limited to 10% of the workforce. The high level of interest is an indication of increased awareness of the importance of recognizing skin tumors early and the associated need for information as well as the need to undergo screening for skin cancer as a precaution. This observation also can be made with regard to the skin cancer screening introduced by statutory health insurance providers in Germany. Studies published by Augustin et al20 and Kornek et al21,22 confirm that skin cancer screenings have gained wide acceptance in Germany because they were introduced by statutory health insurance providers in 2008. The number of skin cancer screenings carried out by dermatologists in Germany also is increasing.20-22 Although approximately 19% of those eligible to participate took part in the SCREEN pilot project,13 approximately 31% of individuals who were eligible to participate took part in skin cancer screenings offered by statutory health insurance providers in Germany in 2012, and the percentage is rising.23 Two important factors affecting the high level of interest in the employee screening program used in our study were undoubtedly the advantages of the examination taking place during working hours and being held on the occupational health services’ premises in the workplace, which helped participants avoid the cost of travel and wait times associated with visiting a medical practice.
Of 783 participants included in this study, 377 displayed at least 1 categorized skin lesion; the majority were suspicious melanocytic nevi. This high incidence rate suggested that regular skin cancer screenings are useful, as it has been shown that there is a correlation between higher numbers of melanocytic nevi and increased risk for developing melanoma.24
In a study by Winkler et al,25 a skin cancer screening of 1658 bank and insurance employees found that 33.8% of those examined displayed at least 1 atypical melanocytic nevus and 27.2% displayed more than 50 melanocytic nevi (compared to 12.8% with ≥50 melanocytic nevi in the current study). The risk for developing skin cancer was classified as intermediate or high in 54.5% (compared to 67.5% at moderate or high risk in the current study).25 Therefore, the rate of suspicious skin lesions was lower in the population of the study by Winkler et al25 in comparison to the population of the current study. As the overall number of melanocytic nevi and the individual risk for skin cancer, however, was underestimated by the majority of the bank and insurance employees,25 employee skin cancer screening programs can be used as a potentially effective tool to make employees aware of the issue and sensitizing them to it. Employee screening in addition to a final diagnosis can contribute to ensuring suitable treatment is started. For example, in the large-scale employee screening published by Schaefer et al15 and Augustin et al,16 48,665 and 90,880 employees, respectively, were screened for inflammatory and noninflammatory skin diseases, and 19% and 27% of participants, respectively, were diagnosed with skin lesions that required treatment.
Participants in the current study were given no further treatment or advice. Recommendations were made that participants monitor suspicious skin lesions or have them removed. With regard to future screening, 84.4% of participants with at least 1 categorized skin lesion were advised to have a regular follow-up within 1 year, while 15.6% were advised to follow-up within 1 to 2 years. Therefore, a period of 2 years before the next checkup, the period between screenings offered by statutory health insurance providers in Germany,12 was considered too long for the majority of participants, according to the dermatologists involved with our study.
Conclusion
The high rate of suspicious skin lesions diagnosed demonstrated the effectiveness of skin cancer screenings organized in the workplace, which should be recommended for all employees, not only those who are at high risk for developing skin cancer due to the nature of their work, such as those who work outdoors. It should be noted that the study group examined in the current study was a homogeneous group of employees of a technical company only and is therefore relatively selective. Nevertheless, despite the comparatively selective and young participant group, these examinations provide evidence of the importance of skin cancer screening programs for a wider population.
Acknowledgments
The authors thank Heidi Seybold, MD; Petra Wörl, MD; Sybille Thoma-Uszynski, MD; and Jens Bussmann, MD (all from Erlangen, Germany), for their support and active assistance in the practical implementation of this study.
- Boniol M, Autier P, Boyle P, et al. Cutaneous melanoma attributable to sunbed use: systematic review and meta-analysis. BMJ. 2012;345:e4757.
- Gilchrest BA, Eller MS, Geller AC, et al. The pathogenesis of melanoma induced by ultraviolet radiation. N Engl J Med. 1999;340:1341-1348.
- Rigel DS. Cutaneous ultraviolet exposure and its relationship to the development of skin cancer. J Am Acad Dermatol. 2008;58:129-132.
- El Ghissassi F, Baan R, Straif K, et al; WHO International Agency for Research on Cancer Monograph Working Group. A review of human carcinogens—part D: radiation. Lancet Oncol. 2009;10:751-752.
- MacLennan R, Green AC, McLeod GR, et al. Increasing incidence of cutaneous melanoma in Queensland, Australia. J Natl Cancer Inst. 1992;84:1427-1432.
- Heinzerling LM, Dummer R, Panizzon RG, et al. Prevention campaign against skin cancer. Dermatology. 2002;205:229-233.
- Stratigos A, Nikolaou V, Kedicoglou S, et al. Melanoma/skin cancer screening in a Mediterranean country: results of the Euromelanoma Screening Day Campaign in Greece. J Eur Acad Dermatol Venereol. 2007;21:56-62.
- Garbe C, Hauschild A, Volkenandt M, et al. Evidence and interdisciplinary consense-based German guidelines: diagnosis and surveillance of melanoma. Melanoma Res. 2007;17:393-399.
- Choudhury K, Volkmer B, Greinert R, et al. Effectiveness of skin cancer screening programmes. Br J Dermatol. 2012;167:94-98.
- Eisemann N, Waldmann A, Geller AC, et al. Non-melanoma skin cancer incidence and impact of skin cancer screening on incidence. J Invest Dermatol. 2014;134:43-50.
- Katalinic A, Waldmann A, Weinstock MA, et al. Does skin cancer screening save lives? an observational study comparing trends in melanoma mortality in regions with and without screening. Cancer. 2012;118:5395-5402.
- Bekanntmachung (1430 A) eines Beschlusses des Gemeinsamen Bundeausschusses über eine Änderung der Krebsfrüherkennungs-Richtlinien: Hautkrebs-Screening [press release]. Berlin, Germany: Bundesministerium für Gesundheit (Federal Ministry of Health, Germany); vom 15. November 2007.
- Breitbart EW, Waldmann A, Nolte S, et al. Systematic skin cancer screening in Northern Germany. J Am Acad Dermatol. 2012;66:201-211.
- Waldmann A, Nolte S, Weinstock MA, et al. Skin cancer screening participation and impact on melanoma incidence in Germany—an observational study on incidence trends in regions with and without population-based screening. Br J Cancer. 2012;106:970-974.
- Schaefer I, Rustenbach SJ, Zimmer L, et al. Prevalence of skin diseases in a cohort of 48,665 employees in Germany. Dermatology. 2008;217:169-172.
- Augustin M, Herberger K, Hintzen S, et al. Prevalence of skin lesions and need for treatment in a cohort of 90880 workers. Br J Dermatol. 2011;165:865-873.
- LeBlanc WG, Vidal L, Kirsner RS, et al. Reported skin cancer screening of US adult workers. J Am Acad Dermatol. 2008;59:55-63.
- Harbauer A, Binder M, Pehamberger H, et al. Validity of an unsupervised self-administered questionnaire for self-assessment of melanoma risk. Melanoma Res. 2003;13:537-542.
- Fitzpatrick TB. The validity and practicality of sun-reactive skin types I through VI. Arch Dermatol. 1988;124:869-871.
- Augustin M, Stadler R, Reusch M, et al. Skin cancer screening in Germany—perception by the public. J Dtsch Dermatol Ges. 2012;10:42-49.
- Kornek T, Augustin M. Skin cancer prevention. J Dtsch Dermatol Ges. 2013;11:283-296.
- Kornek T, Schäfer I, Reusch M, et al. Routine skin cancer screening in Germany: four years of experience from the dermatologists’ perspective. Dermatology. 2012;225:289-293.
- Barmer GEK Arztreport 2014 [press release]. Berlin, Germany: Barmer GEK; February 4, 2014.
- Bauer J, Garbe C. Acquired melanocytic nevi as riskfactor for melanoma development. a comprehensive review of epidemiological data. Pigment Cell Res. 2003;16:297-306.
- Winkler A, Plugfelder A, Weide B, et al. Screening for skin cancer in bank and insurance employees: risk profile and correlation of self and physician’s assessment. Int J Dermatol. 2015;54:419-423.
The incidence of skin cancer, along with its effects on patients and the economy, has continued to increase and therefore requires particular attention from dermatologists. UV light has been shown to be of etiopathologic importance in the development of various types of skin cancer.1-3 Studies have shown that there is a direct correlation between the incidence of skin cancer and average annual amounts of UV radiation exposure.3 Accordingly, in 2009 the International Agency for Research on Cancer classified UV light as carcinogenic to humans.4 Therefore, the general public must be made aware of the danger of exposure to UV radiation.
In Australia, government initiatives to educate the population on causes of skin cancer development and its relationship to UV radiation have already caused the public to change their way of thinking and to deal with sunlight in a conscious and responsible manner.5 A large proportion of the Australian population with light skin is at a particularly high risk for developing skin cancer due to intense exposure to UV radiation. Numerous campaigns in Germany and other countries have attempted to sensitize the public to this issue by emphasizing a reduction in UV exposure (primary prevention) or highlighting the importance of early diagnosis (secondary prevention).6,7
For a good prognosis, it is crucial that skin cancer, particularly melanoma, is discovered at an early or precancerous stage.8 For this reason, self-examination of the skin and skin cancer screening are important factors that can contribute to ensuring early and curative treatment.9-11 Since July 1, 2008, skin cancer screenings have been included in the preventative health care program by statutory health insurance providers in Germany. As part of this program, the cost of screening once every 2 years for individuals 35 years and older is covered by statutory health insurance.12 Several studies have shown a decline in the melanoma mortality rate since the introduction of skin cancer screening programs in Germany.11,13,14
Employee skin cancer screening programs are an important method of examining high numbers of individuals quickly and effectively. These programs have been carried out in Germany and other countries.15,16 Studies have shown that skin cancer screening carried out selectively on defined groups can be an effective form of secondary prevention, particularly for those who work outdoors.17
An employee skin cancer screening program was carried out as part of this study. The findings are interpreted and discussed in relation to other employee screening programs that have been reported as well as those introduced by statutory health insurance providers in Germany. The aim of this study was to determine the importance and effectiveness of employee skin cancer screening programs and the role they play in secondary prevention of skin cancer.
Methods
Study Population
Employees of a technical company in Bavaria, Germany, were offered a skin cancer screening program by the employer’s occupational health service and health insurance provider in collaboration with the Department of Dermatology at the University Hospital Erlangen (Erlangen, Germany). Skin examinations were performed exclusively by 5 trained dermatologists. Only direct employees of the company at 3 of its locations in the Erlangen area were eligible to participate. The total number of employees varied by location (1072–5126 employees). The majority of employees had a university education or had completed technical training. Family members and other individuals who were not members of the company were excluded. There were no further inclusion or exclusion criteria. Over a period of 13 days, 783 of 7823 total employees (10.0%) were examined and included in the study. The study was approved by the Responsible Ethics Commission of the Faculty of Medicine at Friedrich-Alexander-University Erlangen-Nürnberg, Germany.
Study Design
Employees signed a consent form for participation in the study and completed a standardized questionnaire. The questionnaire was based on surveys used in a prior study18 and collected information on current and prior skin lesions, prior dermatological screening, personal and family history of skin tumors, frequency of UV exposure, and type of UV protection used. For the question on measures taken for protection from UV radiation, possible answers included with sunscreen cream, with suitable sun-protective clothing, and by staying in the shade, or no measures were taken. In contrast to the other questions, multiple answers were accepted for this question. Answering no automatically excluded other possible answers. Participants also were asked to assess their own Fitzpatrick skin type19; the questionnaire included explanations of each skin type (I–IV).
The participants were then called in for examination by the dermatologist at 15-minute intervals. All clothing was removed and the skin was examined. Dermatoscopes were used for closer examination of suspicious skin lesions. The clinical results of the examinations were recorded on a standardized form.
An estimation of the number of melanocytic nevi—≤20, 21–49, or ≥50—was recorded for each patient. Suspicious skin lesions were assigned to one of the following categories: nevus requiring future checkup (Nc), nevus requiring excision (Ne), suspected malignant melanoma (MM), suspected squamous cell carcinoma, suspected basal cell carcinoma (BCC), suspected other skin tumor, and precancerous lesion. Fitzpatrick skin type also was assessed for all participants and recorded by the dermatologist carrying out the examination. Each participant was assigned to a risk group—low, moderate, or high risk—based on their individual risk for developing a skin tumor. Factors that were considered when determining participants’ risk for developing skin cancer included Fitzpatrick skin type, number of melanocytic nevi, personal and family history, leisure activities, UV protection used, and current clinical diagnosis of skin lesions.
After the skin examination, participants were informed of recommended treatment but were not given any additional dermatologic advice. Participants could arrange an appointment at the Department of Dermatology, University Hospital Erlangen, for the excision and histological analysis of the skin lesions. All recorded data were collected in a computerized spreadsheet program. When evaluating the questionnaires, questions that were not answered or were answered incorrectly (participant chose more than 1 answer) were ignored.
Statistical Analysis
Statistical analysis was carried out using SPSS software version 16.0. The majority of the data were nominal or ordinal. Metric data were checked for normal distribution using the Shapiro-Wilk test before carrying out parametric tests. Statistical tests were carried out using the χ2 test and the t test for independent samples. Non-nominal distributed data were checked using the Mann-Whitney U test. P<.05 was considered statistically significant in the exploratory data analysis.
Results
Of 783 employees included in the study, 288 (36.8%) were female and 495 (63.2%) were male (Table 1). In comparison with the total workforce, a significantly higher proportion of women than men took part in the cross-sectional study (P<.01). The average age (SD) was 42.3 (9.5) years (range, 18–64 years). Female participants (average age [SD], 39.8 [10.2] years) were significantly younger than male participants (average age [SD], 43.8 [8.8] years; P<.01). Forty-one percent of participants had a prior skin cancer screening. One percent of participants had a personal history of skin cancer, with 1 participant reporting a history of MM; 6.5% had a family history of skin cancer, of which 39.2% had a family history of MM.
The results of the clinical examinations showed that 43.8% of participants had 20 or fewer melanocytic nevi, 43.4% had 21 to 49 melanocytic nevi, and 12.8% had 50 or more melanocytic nevi. Significantly more women than men had 20 or fewer melanocytic nevi (P<.05).
Approximately 92% of participants assessed themselves as having Fitzpatrick skin types II (35.2%) or III (56.7%), while only approximately 3.6% and 4.5% assessed themselves as having skin types I and IV, respectively. The results of the Fitzpatrick skin type assessments made by dermatologists were similar: 96.9% of participants were assessed as having Fitzpatrick skin types II (43.0%) and III (53.8%); approximately 1.9% and 1.3% were assessed as having Fitzpatrick skin types I and IV, respectively. Results showed that 80.2% of all participants assessed their skin type in the same way as the dermatologist; 13.5% assessed their skin type as darker and 6.3% (49/783) assessed it as lighter. A quantitative analysis of Fitzpatrick skin type and sex showed that significantly more male participants than female participants assessed their Fitzpatrick skin type darker than their actual skin type (P<.01).
Overall, 47.6% of participants reported having had sunburn rarely in the past, while 36.9% and 14.0% had experienced sunburn once per year and several times per year, respectively. Approximately 1.4% of participants reported never having a sunburn. More of the male participants made use of comprehensive sun protection using all methods listed (34.5%; P<.05) or a combination of sunscreen and sun-protective clothing (14.9%; P<.01) than the female participants who relied more frequently on sunscreen alone (29.5%; P<.01) or a combination of sunscreen and staying in the shade (29.5%; P<.01)
In general it was clear that sunscreen, either alone or in combination with other sun-protection methods, was used most frequently (88.0%); 58.0% protected themselves by staying in the shade, while 48.0% used suitable sun-protective clothing. Only 3.6% of participants did not protect themselves using any of the suggested methods.
A total of 661 categorized skin lesions were found in 377 participants. Of these lesions, 491 were Nc and 121 were Ne. Twenty-four of the skin lesions were suspected precancerous lesions, 13 were suspected BCC, 2 were suspected MM, and 10 were suspected other skin tumor (Table 2). Overall, male participants who were diagnosed with at least 1 skin lesion (average age, 44.0 years) were significantly older than the women (average age, 39.3 years)(P<.01). Similar findings were observed in participants with at least 1 Nc (men, 43.3 years; women, 38.7 years; P<.01) and at least 1 Ne (men, 44.2 years; women, 38.0 years; P<.05). With regard to the individual risk for developing skin cancer, 32.6% of participants were considered to be at low risk, 64.9% were at moderate risk, and 2.6% were at high risk.
Approximately 61.5% of 377 participants who were diagnosed with at least 1 categorized skin lesion were advised to have a specific skin lesion checked by a dermatologist or to have a full examination for skin cancer once every 12 months. Furthermore, 22.5% were advised to follow-up biannually and 11.7% were advised to follow-up once every 2 years. Of the remaining participants who were advised to have follow-ups, 0.3% were advised to have a skin examination once every 3 months after having had MM, and 4.0% were advised to have follow-up once every 18 months. Overall, follow-up was recommended within 1 year in 84.4% of cases and within 1 to 2 years in 15.6% (Table 3).
Subsequent histological analysis of the excised tissue resulted in a diagnosis of only 21 clinically significant skin conditions. One case of Bowen disease and 1 case of BCC was confirmed. Histological analysis identified the remaining 19 excised skin lesions, which included the 2 suspected MMs, as dysplastic nevi.
Comment
The aim of this cross-sectional study was to examine the importance and effectiveness of employee skin cancer screening programs. In comparison with the total workforce, significantly more women took part than men. Female participants were significantly younger than male participants, which mirrors the findings of prior studies showing that screening programs reach women more frequently than men and that women who participate in screenings are also younger on average in comparison to men.7-13 Men and older individuals usually are underrepresented.7,13 The average age of participants in our study was 42.3 years, which is lower than in the SCREEN (Skin Cancer Research to Provide Evidence for Effectiveness of Screening in Northern Germany) study (average age, 49.7 years).13 The average age in our study also is likely to be lower than patients who undergo skin cancer screenings offered by statutory health insurance providers in Germany, which has a minimum age restriction of 35 years; however, it is comparable to the average age of participants in other employee screening programs and therefore represents the average age of individuals employed in Germany.15,16
The employee skin cancer screening program in this study generated a high level of interest, indicated by the fact that all available appointments had been booked just 36 hours after the screening was announced. Furthermore, there was a waiting list of approximately 300 employees who were not able to undergo a skin examination. For logistical reasons, the number of participants was limited to 10% of the workforce. The high level of interest is an indication of increased awareness of the importance of recognizing skin tumors early and the associated need for information as well as the need to undergo screening for skin cancer as a precaution. This observation also can be made with regard to the skin cancer screening introduced by statutory health insurance providers in Germany. Studies published by Augustin et al20 and Kornek et al21,22 confirm that skin cancer screenings have gained wide acceptance in Germany because they were introduced by statutory health insurance providers in 2008. The number of skin cancer screenings carried out by dermatologists in Germany also is increasing.20-22 Although approximately 19% of those eligible to participate took part in the SCREEN pilot project,13 approximately 31% of individuals who were eligible to participate took part in skin cancer screenings offered by statutory health insurance providers in Germany in 2012, and the percentage is rising.23 Two important factors affecting the high level of interest in the employee screening program used in our study were undoubtedly the advantages of the examination taking place during working hours and being held on the occupational health services’ premises in the workplace, which helped participants avoid the cost of travel and wait times associated with visiting a medical practice.
Of 783 participants included in this study, 377 displayed at least 1 categorized skin lesion; the majority were suspicious melanocytic nevi. This high incidence rate suggested that regular skin cancer screenings are useful, as it has been shown that there is a correlation between higher numbers of melanocytic nevi and increased risk for developing melanoma.24
In a study by Winkler et al,25 a skin cancer screening of 1658 bank and insurance employees found that 33.8% of those examined displayed at least 1 atypical melanocytic nevus and 27.2% displayed more than 50 melanocytic nevi (compared to 12.8% with ≥50 melanocytic nevi in the current study). The risk for developing skin cancer was classified as intermediate or high in 54.5% (compared to 67.5% at moderate or high risk in the current study).25 Therefore, the rate of suspicious skin lesions was lower in the population of the study by Winkler et al25 in comparison to the population of the current study. As the overall number of melanocytic nevi and the individual risk for skin cancer, however, was underestimated by the majority of the bank and insurance employees,25 employee skin cancer screening programs can be used as a potentially effective tool to make employees aware of the issue and sensitizing them to it. Employee screening in addition to a final diagnosis can contribute to ensuring suitable treatment is started. For example, in the large-scale employee screening published by Schaefer et al15 and Augustin et al,16 48,665 and 90,880 employees, respectively, were screened for inflammatory and noninflammatory skin diseases, and 19% and 27% of participants, respectively, were diagnosed with skin lesions that required treatment.
Participants in the current study were given no further treatment or advice. Recommendations were made that participants monitor suspicious skin lesions or have them removed. With regard to future screening, 84.4% of participants with at least 1 categorized skin lesion were advised to have a regular follow-up within 1 year, while 15.6% were advised to follow-up within 1 to 2 years. Therefore, a period of 2 years before the next checkup, the period between screenings offered by statutory health insurance providers in Germany,12 was considered too long for the majority of participants, according to the dermatologists involved with our study.
Conclusion
The high rate of suspicious skin lesions diagnosed demonstrated the effectiveness of skin cancer screenings organized in the workplace, which should be recommended for all employees, not only those who are at high risk for developing skin cancer due to the nature of their work, such as those who work outdoors. It should be noted that the study group examined in the current study was a homogeneous group of employees of a technical company only and is therefore relatively selective. Nevertheless, despite the comparatively selective and young participant group, these examinations provide evidence of the importance of skin cancer screening programs for a wider population.
Acknowledgments
The authors thank Heidi Seybold, MD; Petra Wörl, MD; Sybille Thoma-Uszynski, MD; and Jens Bussmann, MD (all from Erlangen, Germany), for their support and active assistance in the practical implementation of this study.
- Boniol M, Autier P, Boyle P, et al. Cutaneous melanoma attributable to sunbed use: systematic review and meta-analysis. BMJ. 2012;345:e4757.
- Gilchrest BA, Eller MS, Geller AC, et al. The pathogenesis of melanoma induced by ultraviolet radiation. N Engl J Med. 1999;340:1341-1348.
- Rigel DS. Cutaneous ultraviolet exposure and its relationship to the development of skin cancer. J Am Acad Dermatol. 2008;58:129-132.
- El Ghissassi F, Baan R, Straif K, et al; WHO International Agency for Research on Cancer Monograph Working Group. A review of human carcinogens—part D: radiation. Lancet Oncol. 2009;10:751-752.
- MacLennan R, Green AC, McLeod GR, et al. Increasing incidence of cutaneous melanoma in Queensland, Australia. J Natl Cancer Inst. 1992;84:1427-1432.
- Heinzerling LM, Dummer R, Panizzon RG, et al. Prevention campaign against skin cancer. Dermatology. 2002;205:229-233.
- Stratigos A, Nikolaou V, Kedicoglou S, et al. Melanoma/skin cancer screening in a Mediterranean country: results of the Euromelanoma Screening Day Campaign in Greece. J Eur Acad Dermatol Venereol. 2007;21:56-62.
- Garbe C, Hauschild A, Volkenandt M, et al. Evidence and interdisciplinary consense-based German guidelines: diagnosis and surveillance of melanoma. Melanoma Res. 2007;17:393-399.
- Choudhury K, Volkmer B, Greinert R, et al. Effectiveness of skin cancer screening programmes. Br J Dermatol. 2012;167:94-98.
- Eisemann N, Waldmann A, Geller AC, et al. Non-melanoma skin cancer incidence and impact of skin cancer screening on incidence. J Invest Dermatol. 2014;134:43-50.
- Katalinic A, Waldmann A, Weinstock MA, et al. Does skin cancer screening save lives? an observational study comparing trends in melanoma mortality in regions with and without screening. Cancer. 2012;118:5395-5402.
- Bekanntmachung (1430 A) eines Beschlusses des Gemeinsamen Bundeausschusses über eine Änderung der Krebsfrüherkennungs-Richtlinien: Hautkrebs-Screening [press release]. Berlin, Germany: Bundesministerium für Gesundheit (Federal Ministry of Health, Germany); vom 15. November 2007.
- Breitbart EW, Waldmann A, Nolte S, et al. Systematic skin cancer screening in Northern Germany. J Am Acad Dermatol. 2012;66:201-211.
- Waldmann A, Nolte S, Weinstock MA, et al. Skin cancer screening participation and impact on melanoma incidence in Germany—an observational study on incidence trends in regions with and without population-based screening. Br J Cancer. 2012;106:970-974.
- Schaefer I, Rustenbach SJ, Zimmer L, et al. Prevalence of skin diseases in a cohort of 48,665 employees in Germany. Dermatology. 2008;217:169-172.
- Augustin M, Herberger K, Hintzen S, et al. Prevalence of skin lesions and need for treatment in a cohort of 90880 workers. Br J Dermatol. 2011;165:865-873.
- LeBlanc WG, Vidal L, Kirsner RS, et al. Reported skin cancer screening of US adult workers. J Am Acad Dermatol. 2008;59:55-63.
- Harbauer A, Binder M, Pehamberger H, et al. Validity of an unsupervised self-administered questionnaire for self-assessment of melanoma risk. Melanoma Res. 2003;13:537-542.
- Fitzpatrick TB. The validity and practicality of sun-reactive skin types I through VI. Arch Dermatol. 1988;124:869-871.
- Augustin M, Stadler R, Reusch M, et al. Skin cancer screening in Germany—perception by the public. J Dtsch Dermatol Ges. 2012;10:42-49.
- Kornek T, Augustin M. Skin cancer prevention. J Dtsch Dermatol Ges. 2013;11:283-296.
- Kornek T, Schäfer I, Reusch M, et al. Routine skin cancer screening in Germany: four years of experience from the dermatologists’ perspective. Dermatology. 2012;225:289-293.
- Barmer GEK Arztreport 2014 [press release]. Berlin, Germany: Barmer GEK; February 4, 2014.
- Bauer J, Garbe C. Acquired melanocytic nevi as riskfactor for melanoma development. a comprehensive review of epidemiological data. Pigment Cell Res. 2003;16:297-306.
- Winkler A, Plugfelder A, Weide B, et al. Screening for skin cancer in bank and insurance employees: risk profile and correlation of self and physician’s assessment. Int J Dermatol. 2015;54:419-423.
Practice Points
- Employee skin cancer screening programs are an important method of examining high numbers of individuals quickly and efficiently and should be used as an important tool for secondary skin cancer prevention.
- The high rate of suspicious skin lesions diagnosed in this study demonstrates the effectiveness of skin cancer screenings organized in the workplace and provides evidence of the importance of skin cancer screening programs for a wider population.
- Employee skin cancer screening programs should be recommended for all employees, not only those who are at high risk for developing skin cancer due to the nature of their work, such as those who work outdoors.

Biomechanical Consequences of Anterior Femoral Notching in Cruciate-Retaining Versus Posterior-Stabilized Total Knee Arthroplasty
Although rare, periprosthetic fractures remain a significant complication after total knee arthroplasty (TKA), occurring in 0.3% to 2.5% of cases.1-4 Hirsh and colleagues5 were among the first to suggest that anterior femoral notching during TKA was a potential risk factor for postoperative periprosthetic femoral fracture because notching may weaken the anterior femoral cortex. Anterior femoral notching, a cortex violation occurring during an anterior bone cut, occurs in up to 30% of cases.6 Using a theoretical biomechanical model, Culp and colleagues1 found that increasing the depth of the notch defect into the cortex led to reduced torsional strength. In more recent, cadaveric biomechanical studies, notching of the anterior femoral cortex decreased torsional strength by up to 39%.7,8 Contrary to these biomechanical studies, a retrospective study evaluating 1089 TKAs using 2 implant designs (Anatomic Graduated Component, Biomet and Legacy, Zimmer) demonstrated no significant effect of anterior femoral notching with respect to incidence of supracondylar femur fractures.6 That study, however, did not address whether implant design is associated with a differential risk for fracture in the presence of anterior notching.
Previous biomechanical studies have primarily investigated cruciate-retaining (CR) femoral components and properties with respect to anterior notching, even though the posterior-stabilized (PS) design is used more often in the United States.1,7 According to a Mayo Clinic survey, TKAs with a PS design increased from <10% in 1990 to almost 75% by 1997.9 Today, there is little to no consensus about which implant is better, and use of one or the other depends largely on the surgeon and varies widely between countries and regions.10 PS designs require more bone resection and demonstrate prosthesis-controlled rollback during flexion, whereas CR designs preserve more bone and achieve posterior stabilization via the posterior cruciate ligament.11 Despite these differences in design and mechanics, a 2013 Cochrane review of TKA design found no clinically significant differences between CR and PS with respect to pain, range of motion, or clinical and radiologic outcomes.10 The reviewers did not specifically address periprosthetic fractures associated with either femoral notching or TKA design, as they could not quantitatively analyze postoperative complications because of the diversity of reports. Given the limited number of reported cases, a review of radiographic findings pertaining to the characteristics of supracondylar fractures in anterior femoral notching was unsuccessful.12 As the previous biomechanical studies of anterior notching used primarily CR models or no prostheses at all, a study of biomechanical differences between CR and PS designs in the presence of anterior notching is warranted.1,7,8 Therefore, we conducted a study to assess the effect of anterior femoral notching on torsional strength and load to failure in CR and PS femoral components.
Materials and Methods
Twelve fourth-generation composite adult left femur synthetic sawbones (Sawbones; Pacific Research Laboratories) were selected for their consistent biomechanical properties, vs those of cadaveric specimens; in addition, low intersample variability made them preferable to cadaveric bones given the small sample used in this study.13,14 All bones were from the same lot. All were visually inspected for defects and found to be acceptable. In each sample, an anterior cortical defect was created by making an anterior cut with an undersized (size 4) posterior referencing guide. In addition, the distance from the proximal end of the notch to the implant fell within 15 mm, as that is the maximum distance from the implant a notch can be placed using a standard femoral cutting jig.15 Six femora were instrumented with CR implants and 6 with PS implants (DePuy Synthes). Implants were placed using standardized cuts. Before testing, each implant was inspected for proper fit and found to be securely fastened to the femur. In addition, precision calipers were used to measure notch depth and distance from notch to implant before loading. A custom polymethylmethacrylate torsion jig was used to fix each instrumented femur proximally and distally on the femoral implant (Figure 1). Care was taken to ensure the distal jig engaged only the implant, thus isolating the notch as a stress riser. Each femur was loaded in external rotation through the proximal femoral jig along the anatomical axis. Use of external rotation was based on study findings implicating external rotation of the tibia as the most likely mechanism for generating a fracture in the event of a fall.12 Furthermore, distal femur fractures are predominantly spiral as opposed to butterfly or bending—an indication that torsion is the most likely mechanism of failure.16 With no axial rotation possible within the prosthesis, increased torsional stress is undoubtedly generated within adjacent bone. Each specimen underwent torsional stiffness testing and then load to failure. Torsional stiffness was measured by slowly loading each femur in external rotation, from 1 to 18 Nm for 3 cycles at a displacement rate of 0.5° per second. Each specimen then underwent torsional load-to-failure testing on an Instron 5800R machine at a rate of 0.5° per second. Failure was defined as the moment of fracture and subsequent decrease in torsional load—determined graphically by the peak torsional load followed immediately by a sharp decrease in load. Stiffness was determined as the slope of torque to the displacement curve for each cycle, and torque to failure was the highest recorded torque before fracture. Fracture pattern was noted after failure. A sample size of 6 specimens per group provided 80% power to detect a between-group difference of 1 Nm per degree in stiffness, using an estimated SD of 0.7 Nm per degree. In our statistical analysis, continuous variables are reported as means and SDs. Data from our torsional stiffness and load-to-failure testing were analyzed with unpaired 2-sample t tests, and P < .05 was considered statistically significant.
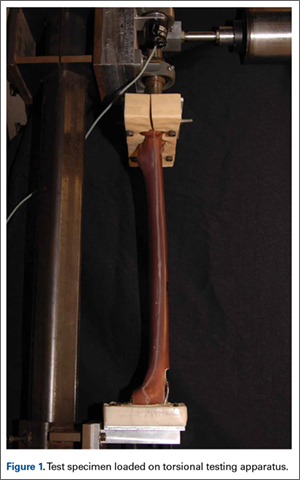
Results
We did not detect a statistical difference in notch depth, notch-to-implant distance, or femoral length between the CR and PS groups. Mean (SD) notch depth was 6.0 (1.3) mm for CR and 4.9 (1.0) mm for PS (P = .13); mean (SD) distance from the proximal end of the notch to the implant was 13.8 (1.7) mm for CR and 11.1 (3.2) mm for PS (P = .08); and mean (SD) femoral length was 46.2 (0.1) cm for CR and 46.2 (0.1) cm for PS (P = .60).
Mean (SD) torsional stiffness for the first 3 precycles was 6.2 (1.2), 8.7 (1.5), and 8.8 (1.4) Nm per degree for the CR group and 6.0 (0.7), 8.4 (1.4), and 8.6 (1.4) Nm per degree for the PS group; the differences were not statistically significant (Figure 2A). In addition, there were no statistically significant differences in mean (SD) stiffness at failure between CR, 6.5 (0.7) Nm per degree, and PS, 7.1 (0.9) Nm per degree (P = .24; Figure 2B) or in mean (SD) final torque at failure between CR, 62.4 (9.4) Nm, and PS, 62.7 (12.2) Nm (P = .95; Figure 2C).
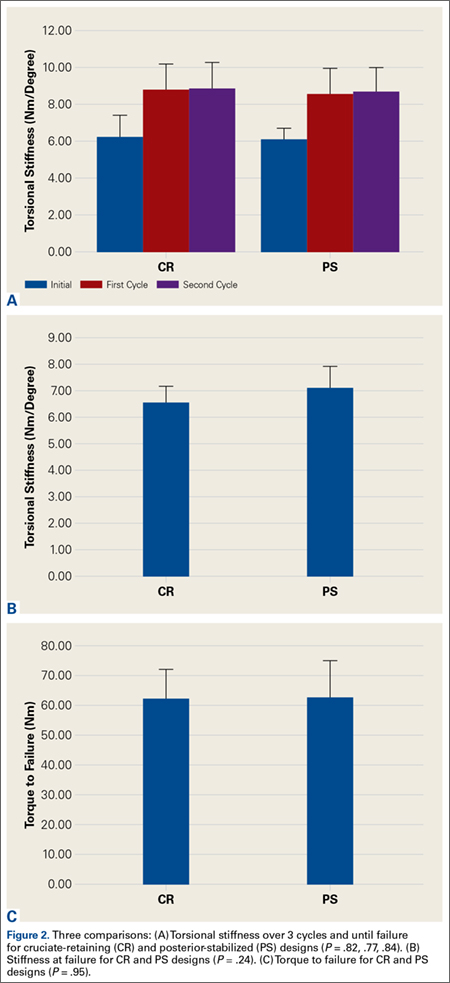
All fractures in both groups were oblique fractures originating at the proximal angle of the notch and extended proximally. None extended distally into the box. Fracture locations and patterns were identical in the CR and PS groups of femurs (Figure 3).

Discussion
Periprosthetic fractures after TKA remain rare. However, these fractures can significantly increase morbidity and complications. Anterior femoral notching occurs inadvertently in 30% to 40% of TKAs.6,17 The impact of femoral notching on supracondylar femur fracture is inconsistent between biomechanical and retrospective clinical studies. Retrospective studies failed to find a significant correlation between anterior femoral notching and supracondylar femur fractures.6,17 However, findings of biomechanical studies have suggested that a notch 3 mm deep will reduce the torsional strength of the femur by 29%.7 Another study, using 3-dimensional finite element analysis, showed a significant increase in local stress with a notch deeper than 3 mm.15
To our knowledge, no clinical studies, including the aforementioned Cochrane review,10 have specifically evaluated the difference in risk for periprosthetic fracture between different TKA models in the presence of notching.11 The biomechanical differences between implant designs could be a confounding factor in the results of past studies. More bone resection is required in PS designs than in CR designs. The position of the PS intercondylar cutout, much lower than the top of the patella flange, should not increase susceptibility to fractures more than in CR designs, but this hypothesis, though accepted, has not been validated biomechanically or addressed specifically in prospective or retrospective clinical analysis. In the present study, we used a biomechanical model to replicate an external rotation failure mechanism and quantify the differences in torsional strength and load to failure between CR TKA and PS TKA models in the presence of anterior femoral notching. Our results showed no significant differences in torsional stiffness, stiffness at failure, or torque at failure between the CR and PS design groups in the presence of anterior femoral notching.
In this study, all femoral fractures were oblique, and they all originated at the site of the cortical defect, not the notch—a situation markedly different from having bending forces applied to the femur. Previous biomechanical data indicated that bending forces applied to a notched femur cause fractures originating at the notch, whereas torsional forces applied to a notched femur cause fractures originating at the anterior aspect of the bone–component interface.7 The difference is attributable to study design. Our femurs were held fixed at their proximal end, which may have exacerbated any bending forces applied during external rotation, but we thought constraining the proximal femur would better replicate a fall involving external rotation.
More important for our study, an oblique fracture pattern was noted for both design groups (CR and PS), indicating the fracture pattern was unrelated to the area from which bone was resected for the PS design. All femur fractures in both design groups occurred proximal to a well-fixed prosthesis, indicating they should be classified as Vancouver C fractures. This is significant because intercondylar fossa resection (PS group) did not convert the fractures into Vancouver B2 fractures, which involve prosthesis loosening caused by pericomponent fracture.18 This simple observation validated our hypothesis that there would be no biomechanical differences between CR and PS designs with respect to the effects of anterior femoral notching. This lack of a significant difference may be attributed to the PS intercondylar cutout being much lower than the top of the anterior flange shielding the resected bone deep to the anterior flange.7 In addition, given the rarity of supracondylar fractures and the lack of sufficient relevant clinical data, it is difficult to speculate on the fracture patterns observed in clinical cases versus biomechanical studies.12
The use of synthetic bone models instead of cadaveric specimens could be seen as a limitation. Although synthetic bones may not reproduce the mechanism of failure in living and cadaveric femurs, the mechanical properties of synthetic bones have previously been found to fall within the range of those of cadaveric bones under axial loading, bending, and torsion testing.13,14 As a uniform testing material, synthetic bones allow removal of the confounding variations in bone size and quality that plague biomechanical studies in cadaveric bones.13,14 Interfemoral variability was 20 to 200 times higher in cadaveric femurs than in synthetic bones, which makes synthetic femurs preferable to cadaveric femurs, especially in studies with a small sample size.13,14 In addition, a uniform specimen provides consistent, reproducible osteotomies, which were crucial for consistent mechanical evaluation of each configuration in this study.
The long-term clinical significance of anterior femoral notching in periprosthetic fractures is equivocal, possibly because most studies predominantly use CR implants.6 This may not be an issue if it is shown that CR and PS implants have the same mechanical properties. Despite the differences between clinical studies and our biomechanical study, reevaluation of clinical data is not warranted given the biomechanical data we present here. Results of biomechanical studies like ours still suggest an increased immediate postoperative risk for supracondylar fracture after anterior cortical notching of the femur.5,7 Ultimately, this study found that, compared with a CR design, a PS design did not alter the torsional biomechanical properties or fracture pattern of an anteriorly notched femur.
1. Culp RW, Schmidt RG, Hanks G, Mak A, Esterhai JL Jr, Heppenstall RB. Supracondylar fracture of the femur following prosthetic knee arthroplasty. Clin Orthop Relat Res. 1987;(222):212-222.
2. Delport PH, Van Audekercke R, Martens M, Mulier JC. Conservative treatment of ipsilateral supracondylar femoral fracture after total knee arthroplasty. J Trauma. 1984;24(9):846-849.
3. Figgie MP, Goldberg VM, Figgie HE 3rd, Sobel M. The results of treatment of supracondylar fracture above total knee arthroplasty. J Arthroplasty. 1990;5(3):267-276.
4. Rorabeck CH, Taylor JW. Periprosthetic fractures of the femur complicating total knee arthroplasty. Orthop Clin North Am. 1999;30(2):265-277.
5. Hirsh DM, Bhalla S, Roffman M. Supracondylar fracture of the femur following total knee replacement. Report of four cases. J Bone Joint Surg Am. 1981;63(1):162-163.
6. Ritter MA, Thong AE, Keating EM, et al. The effect of femoral notching during total knee arthroplasty on the prevalence of postoperative femoral fractures and on clinical outcome. J Bone Joint Surg Am. 2005;87(11):2411-2414.
7. Lesh ML, Schneider DJ, Deol G, Davis B, Jacobs CR, Pellegrini VD Jr. The consequences of anterior femoral notching in total knee arthroplasty. A biomechanical study. J Bone Joint Surg Am. 2000;82(8):1096-1101.
8. Shawen SB, Belmont PJ Jr, Klemme WR, Topoleski LD, Xenos JS, Orchowski JR. Osteoporosis and anterior femoral notching in periprosthetic supracondylar femoral fractures: a biomechanical analysis. J Bone Joint Surg Am. 2003;85(1):115-121.
9. Scuderi GR, Pagnano MW. Review article: the rationale for posterior cruciate substituting total knee arthroplasty. J Orthop Surg (Hong Kong). 2001;9(2):81-88.
10. Verra WC, van den Boom LG, Jacobs W, Clement DJ, Wymenga AA, Nelissen RG. Retention versus sacrifice of the posterior cruciate ligament in total knee arthroplasty for treating osteoarthritis. Cochrane Database Syst Rev. 2013;10:CD004803.
11. Kolisek FR, McGrath MS, Marker DR, et al. Posterior-stabilized versus posterior cruciate ligament-retaining total knee arthroplasty. Iowa Orthop J. 2009;29:23-27.
12. Dennis DA. Periprosthetic fractures following total knee arthroplasty. Instr Course Lect. 2001;50:379-389.
13. Cristofolini L, Viceconti M, Cappello A, Toni A. Mechanical validation of whole bone composite femur models. J Biomech. 1996;29(4):525-535.
14. Heiner AD, Brown TD. Structural properties of a new design of composite replicate femurs and tibias. J Biomech. 2001;34(6):773-781.
15. Beals RK, Tower SS. Periprosthetic fractures of the femur. An analysis of 93 fractures. Clin Orthop Relat Res. 1996;(327):238-246.
16. Gujarathi N, Putti AB, Abboud RJ, MacLean JG, Espley AJ, Kellett CF. Risk of periprosthetic fracture after anterior femoral notching. Acta Orthop. 2009;80(5):553-556.
17. Zalzal P, Backstein D, Gross AE, Papini M. Notching of the anterior femoral cortex during total knee arthroplasty: characteristics that increase local stresses. J Arthroplasty. 2006;21(5):737-743.
18. Gaski GE, Scully SP. In brief: classifications in brief: Vancouver classification of postoperative periprosthetic femur fractures. Clin Orthop Relat Res. 2011;469(5):1507-1510.
Although rare, periprosthetic fractures remain a significant complication after total knee arthroplasty (TKA), occurring in 0.3% to 2.5% of cases.1-4 Hirsh and colleagues5 were among the first to suggest that anterior femoral notching during TKA was a potential risk factor for postoperative periprosthetic femoral fracture because notching may weaken the anterior femoral cortex. Anterior femoral notching, a cortex violation occurring during an anterior bone cut, occurs in up to 30% of cases.6 Using a theoretical biomechanical model, Culp and colleagues1 found that increasing the depth of the notch defect into the cortex led to reduced torsional strength. In more recent, cadaveric biomechanical studies, notching of the anterior femoral cortex decreased torsional strength by up to 39%.7,8 Contrary to these biomechanical studies, a retrospective study evaluating 1089 TKAs using 2 implant designs (Anatomic Graduated Component, Biomet and Legacy, Zimmer) demonstrated no significant effect of anterior femoral notching with respect to incidence of supracondylar femur fractures.6 That study, however, did not address whether implant design is associated with a differential risk for fracture in the presence of anterior notching.
Previous biomechanical studies have primarily investigated cruciate-retaining (CR) femoral components and properties with respect to anterior notching, even though the posterior-stabilized (PS) design is used more often in the United States.1,7 According to a Mayo Clinic survey, TKAs with a PS design increased from <10% in 1990 to almost 75% by 1997.9 Today, there is little to no consensus about which implant is better, and use of one or the other depends largely on the surgeon and varies widely between countries and regions.10 PS designs require more bone resection and demonstrate prosthesis-controlled rollback during flexion, whereas CR designs preserve more bone and achieve posterior stabilization via the posterior cruciate ligament.11 Despite these differences in design and mechanics, a 2013 Cochrane review of TKA design found no clinically significant differences between CR and PS with respect to pain, range of motion, or clinical and radiologic outcomes.10 The reviewers did not specifically address periprosthetic fractures associated with either femoral notching or TKA design, as they could not quantitatively analyze postoperative complications because of the diversity of reports. Given the limited number of reported cases, a review of radiographic findings pertaining to the characteristics of supracondylar fractures in anterior femoral notching was unsuccessful.12 As the previous biomechanical studies of anterior notching used primarily CR models or no prostheses at all, a study of biomechanical differences between CR and PS designs in the presence of anterior notching is warranted.1,7,8 Therefore, we conducted a study to assess the effect of anterior femoral notching on torsional strength and load to failure in CR and PS femoral components.
Materials and Methods
Twelve fourth-generation composite adult left femur synthetic sawbones (Sawbones; Pacific Research Laboratories) were selected for their consistent biomechanical properties, vs those of cadaveric specimens; in addition, low intersample variability made them preferable to cadaveric bones given the small sample used in this study.13,14 All bones were from the same lot. All were visually inspected for defects and found to be acceptable. In each sample, an anterior cortical defect was created by making an anterior cut with an undersized (size 4) posterior referencing guide. In addition, the distance from the proximal end of the notch to the implant fell within 15 mm, as that is the maximum distance from the implant a notch can be placed using a standard femoral cutting jig.15 Six femora were instrumented with CR implants and 6 with PS implants (DePuy Synthes). Implants were placed using standardized cuts. Before testing, each implant was inspected for proper fit and found to be securely fastened to the femur. In addition, precision calipers were used to measure notch depth and distance from notch to implant before loading. A custom polymethylmethacrylate torsion jig was used to fix each instrumented femur proximally and distally on the femoral implant (Figure 1). Care was taken to ensure the distal jig engaged only the implant, thus isolating the notch as a stress riser. Each femur was loaded in external rotation through the proximal femoral jig along the anatomical axis. Use of external rotation was based on study findings implicating external rotation of the tibia as the most likely mechanism for generating a fracture in the event of a fall.12 Furthermore, distal femur fractures are predominantly spiral as opposed to butterfly or bending—an indication that torsion is the most likely mechanism of failure.16 With no axial rotation possible within the prosthesis, increased torsional stress is undoubtedly generated within adjacent bone. Each specimen underwent torsional stiffness testing and then load to failure. Torsional stiffness was measured by slowly loading each femur in external rotation, from 1 to 18 Nm for 3 cycles at a displacement rate of 0.5° per second. Each specimen then underwent torsional load-to-failure testing on an Instron 5800R machine at a rate of 0.5° per second. Failure was defined as the moment of fracture and subsequent decrease in torsional load—determined graphically by the peak torsional load followed immediately by a sharp decrease in load. Stiffness was determined as the slope of torque to the displacement curve for each cycle, and torque to failure was the highest recorded torque before fracture. Fracture pattern was noted after failure. A sample size of 6 specimens per group provided 80% power to detect a between-group difference of 1 Nm per degree in stiffness, using an estimated SD of 0.7 Nm per degree. In our statistical analysis, continuous variables are reported as means and SDs. Data from our torsional stiffness and load-to-failure testing were analyzed with unpaired 2-sample t tests, and P < .05 was considered statistically significant.
Results
We did not detect a statistical difference in notch depth, notch-to-implant distance, or femoral length between the CR and PS groups. Mean (SD) notch depth was 6.0 (1.3) mm for CR and 4.9 (1.0) mm for PS (P = .13); mean (SD) distance from the proximal end of the notch to the implant was 13.8 (1.7) mm for CR and 11.1 (3.2) mm for PS (P = .08); and mean (SD) femoral length was 46.2 (0.1) cm for CR and 46.2 (0.1) cm for PS (P = .60).
Mean (SD) torsional stiffness for the first 3 precycles was 6.2 (1.2), 8.7 (1.5), and 8.8 (1.4) Nm per degree for the CR group and 6.0 (0.7), 8.4 (1.4), and 8.6 (1.4) Nm per degree for the PS group; the differences were not statistically significant (Figure 2A). In addition, there were no statistically significant differences in mean (SD) stiffness at failure between CR, 6.5 (0.7) Nm per degree, and PS, 7.1 (0.9) Nm per degree (P = .24; Figure 2B) or in mean (SD) final torque at failure between CR, 62.4 (9.4) Nm, and PS, 62.7 (12.2) Nm (P = .95; Figure 2C).
All fractures in both groups were oblique fractures originating at the proximal angle of the notch and extended proximally. None extended distally into the box. Fracture locations and patterns were identical in the CR and PS groups of femurs (Figure 3).
Discussion
Periprosthetic fractures after TKA remain rare. However, these fractures can significantly increase morbidity and complications. Anterior femoral notching occurs inadvertently in 30% to 40% of TKAs.6,17 The impact of femoral notching on supracondylar femur fracture is inconsistent between biomechanical and retrospective clinical studies. Retrospective studies failed to find a significant correlation between anterior femoral notching and supracondylar femur fractures.6,17 However, findings of biomechanical studies have suggested that a notch 3 mm deep will reduce the torsional strength of the femur by 29%.7 Another study, using 3-dimensional finite element analysis, showed a significant increase in local stress with a notch deeper than 3 mm.15
To our knowledge, no clinical studies, including the aforementioned Cochrane review,10 have specifically evaluated the difference in risk for periprosthetic fracture between different TKA models in the presence of notching.11 The biomechanical differences between implant designs could be a confounding factor in the results of past studies. More bone resection is required in PS designs than in CR designs. The position of the PS intercondylar cutout, much lower than the top of the patella flange, should not increase susceptibility to fractures more than in CR designs, but this hypothesis, though accepted, has not been validated biomechanically or addressed specifically in prospective or retrospective clinical analysis. In the present study, we used a biomechanical model to replicate an external rotation failure mechanism and quantify the differences in torsional strength and load to failure between CR TKA and PS TKA models in the presence of anterior femoral notching. Our results showed no significant differences in torsional stiffness, stiffness at failure, or torque at failure between the CR and PS design groups in the presence of anterior femoral notching.
In this study, all femoral fractures were oblique, and they all originated at the site of the cortical defect, not the notch—a situation markedly different from having bending forces applied to the femur. Previous biomechanical data indicated that bending forces applied to a notched femur cause fractures originating at the notch, whereas torsional forces applied to a notched femur cause fractures originating at the anterior aspect of the bone–component interface.7 The difference is attributable to study design. Our femurs were held fixed at their proximal end, which may have exacerbated any bending forces applied during external rotation, but we thought constraining the proximal femur would better replicate a fall involving external rotation.
More important for our study, an oblique fracture pattern was noted for both design groups (CR and PS), indicating the fracture pattern was unrelated to the area from which bone was resected for the PS design. All femur fractures in both design groups occurred proximal to a well-fixed prosthesis, indicating they should be classified as Vancouver C fractures. This is significant because intercondylar fossa resection (PS group) did not convert the fractures into Vancouver B2 fractures, which involve prosthesis loosening caused by pericomponent fracture.18 This simple observation validated our hypothesis that there would be no biomechanical differences between CR and PS designs with respect to the effects of anterior femoral notching. This lack of a significant difference may be attributed to the PS intercondylar cutout being much lower than the top of the anterior flange shielding the resected bone deep to the anterior flange.7 In addition, given the rarity of supracondylar fractures and the lack of sufficient relevant clinical data, it is difficult to speculate on the fracture patterns observed in clinical cases versus biomechanical studies.12
The use of synthetic bone models instead of cadaveric specimens could be seen as a limitation. Although synthetic bones may not reproduce the mechanism of failure in living and cadaveric femurs, the mechanical properties of synthetic bones have previously been found to fall within the range of those of cadaveric bones under axial loading, bending, and torsion testing.13,14 As a uniform testing material, synthetic bones allow removal of the confounding variations in bone size and quality that plague biomechanical studies in cadaveric bones.13,14 Interfemoral variability was 20 to 200 times higher in cadaveric femurs than in synthetic bones, which makes synthetic femurs preferable to cadaveric femurs, especially in studies with a small sample size.13,14 In addition, a uniform specimen provides consistent, reproducible osteotomies, which were crucial for consistent mechanical evaluation of each configuration in this study.
The long-term clinical significance of anterior femoral notching in periprosthetic fractures is equivocal, possibly because most studies predominantly use CR implants.6 This may not be an issue if it is shown that CR and PS implants have the same mechanical properties. Despite the differences between clinical studies and our biomechanical study, reevaluation of clinical data is not warranted given the biomechanical data we present here. Results of biomechanical studies like ours still suggest an increased immediate postoperative risk for supracondylar fracture after anterior cortical notching of the femur.5,7 Ultimately, this study found that, compared with a CR design, a PS design did not alter the torsional biomechanical properties or fracture pattern of an anteriorly notched femur.
1. Culp RW, Schmidt RG, Hanks G, Mak A, Esterhai JL Jr, Heppenstall RB. Supracondylar fracture of the femur following prosthetic knee arthroplasty. Clin Orthop Relat Res. 1987;(222):212-222.
2. Delport PH, Van Audekercke R, Martens M, Mulier JC. Conservative treatment of ipsilateral supracondylar femoral fracture after total knee arthroplasty. J Trauma. 1984;24(9):846-849.
3. Figgie MP, Goldberg VM, Figgie HE 3rd, Sobel M. The results of treatment of supracondylar fracture above total knee arthroplasty. J Arthroplasty. 1990;5(3):267-276.
4. Rorabeck CH, Taylor JW. Periprosthetic fractures of the femur complicating total knee arthroplasty. Orthop Clin North Am. 1999;30(2):265-277.
5. Hirsh DM, Bhalla S, Roffman M. Supracondylar fracture of the femur following total knee replacement. Report of four cases. J Bone Joint Surg Am. 1981;63(1):162-163.
6. Ritter MA, Thong AE, Keating EM, et al. The effect of femoral notching during total knee arthroplasty on the prevalence of postoperative femoral fractures and on clinical outcome. J Bone Joint Surg Am. 2005;87(11):2411-2414.
7. Lesh ML, Schneider DJ, Deol G, Davis B, Jacobs CR, Pellegrini VD Jr. The consequences of anterior femoral notching in total knee arthroplasty. A biomechanical study. J Bone Joint Surg Am. 2000;82(8):1096-1101.
8. Shawen SB, Belmont PJ Jr, Klemme WR, Topoleski LD, Xenos JS, Orchowski JR. Osteoporosis and anterior femoral notching in periprosthetic supracondylar femoral fractures: a biomechanical analysis. J Bone Joint Surg Am. 2003;85(1):115-121.
9. Scuderi GR, Pagnano MW. Review article: the rationale for posterior cruciate substituting total knee arthroplasty. J Orthop Surg (Hong Kong). 2001;9(2):81-88.
10. Verra WC, van den Boom LG, Jacobs W, Clement DJ, Wymenga AA, Nelissen RG. Retention versus sacrifice of the posterior cruciate ligament in total knee arthroplasty for treating osteoarthritis. Cochrane Database Syst Rev. 2013;10:CD004803.
11. Kolisek FR, McGrath MS, Marker DR, et al. Posterior-stabilized versus posterior cruciate ligament-retaining total knee arthroplasty. Iowa Orthop J. 2009;29:23-27.
12. Dennis DA. Periprosthetic fractures following total knee arthroplasty. Instr Course Lect. 2001;50:379-389.
13. Cristofolini L, Viceconti M, Cappello A, Toni A. Mechanical validation of whole bone composite femur models. J Biomech. 1996;29(4):525-535.
14. Heiner AD, Brown TD. Structural properties of a new design of composite replicate femurs and tibias. J Biomech. 2001;34(6):773-781.
15. Beals RK, Tower SS. Periprosthetic fractures of the femur. An analysis of 93 fractures. Clin Orthop Relat Res. 1996;(327):238-246.
16. Gujarathi N, Putti AB, Abboud RJ, MacLean JG, Espley AJ, Kellett CF. Risk of periprosthetic fracture after anterior femoral notching. Acta Orthop. 2009;80(5):553-556.
17. Zalzal P, Backstein D, Gross AE, Papini M. Notching of the anterior femoral cortex during total knee arthroplasty: characteristics that increase local stresses. J Arthroplasty. 2006;21(5):737-743.
18. Gaski GE, Scully SP. In brief: classifications in brief: Vancouver classification of postoperative periprosthetic femur fractures. Clin Orthop Relat Res. 2011;469(5):1507-1510.

State Medicaid Expansion Status
On January 1, 2014, several major provisions of the Affordable Care Act (ACA) took effect, including introduction of the individual mandate for health insurance coverage, opening of the Health Insurance Marketplace, and expansion of Medicaid eligibility to Americans earning up to 133% of the federal poverty level.[1] Nearly 9 million US adults have enrolled in Medicaid since that time, primarily in the 31 states and Washington, DC that have opted into Medicaid expansion.[2, 3] ACA implementation has also had a significant impact on hospital payer mix, primarily by reducing the volume of uncompensated care in Medicaid‐expansion states.[4, 5]
The differential shift in payer mix in Medicaid‐expansion versus nonexpansion states may be relevant to hospitals beyond reimbursement. Medicaid insurance has historically been associated with longer hospitalizations and higher in‐hospital mortality in diverse patient populations, more so than commercial insurance and often even uninsured payer status.[6, 7, 8, 9, 10, 11, 12, 13, 14, 15] The disparity in outcomes between patients with Medicaid versus other insurance persists even after adjustment for disease severity and baseline comorbidities. Insurance type may influence the delivery of inpatient care through variation in access to invasive procedures and adherence to guideline‐concordant medical therapies.[9, 10, 11, 12] Medicaid patients may be more likely than uninsured patients to remain hospitalized pending postacute care placement rather than be discharged home with family support.[16] Medicaid patients are also less likely to leave against medical advice than uninsured patients.[17]
Currently, little is known about the impact of state Medicaid expansion status on length of stay (LOS) or mortality nationally. It is possible that hospitals in Medicaid‐expansion states have experienced relative worsening in LOS and mortality as their share of Medicaid patients has grown. Determining the impact of ACA implementation on payer mix and patient outcomes is particularly important for academic medical centers (AMCs), as they traditionally care for the greatest percentage of both Medicaid and uninsured patients.[18] We sought to characterize the impact of state Medicaid expansion status on payer mix, LOS, and in‐hospital mortality for general medicine patients at AMCs in the United States.
METHODS
The University HealthSystem Consortium (UHC) is an alliance of 117 AMCs and 310 affiliated hospitals, representing >90% of such institutions in the US. We queried the online UHC Clinical Data Base/Resource Manager (CDB/RM) to obtain hospital‐level insurance, LOS, and mortality data for inpatients discharged from a general medicine service between October 1, 2012 and September 30, 2015. We excluded hospitals that were missing data for any month within the study period. No patient‐level data were accessed.
Our outcomes of interest were the proportion of discharges by primary payer (Medicare, commercial, Medicaid, uninsured, or other [eg, Tri‐Care or Workers' Compensation]), as well as the LOS index and mortality index. Both indices were defined as the ratio of the observed to expected values. To determine the expected LOS and mortality, the UHC 2015 risk adjustment models were applied to all cases, adjusting for variables such as patient demographics, low socioeconomic status, admit source and status, severity of illness, and comorbid conditions, as described by International Classification of Diseases, Ninth Revision codes. These models have been validated and are used for research and quality benchmarking for member institutions.[19]
We next stratified hospitals according to state Medicaid expansion status. We defined Medicaid‐expansion states as those that had expanded Medicaid by the end of the study period: Arizona, Arkansas, California, Colorado, Connecticut, Illinois, Indiana, Iowa, Kentucky, Maryland, Massachusetts, Michigan, Minnesota, Nevada, New Hampshire, New Jersey, New Mexico, New York, Ohio, Oregon, Pennsylvania, Rhode Island, Washington, Washington DC, and West Virginia. Nonexpansion states included Alabama, Florida, Georgia, Kansas, Louisiana, Missouri, Nebraska, North Carolina, South Carolina, Tennessee, Texas, Utah, Virginia, and Wisconsin. We excluded 12 states due to incomplete data: Alaska, Delaware, Hawaii, Idaho, North Dakota, Maine, Mississippi, Montana, Oklahoma, South Dakota, Vermont, and Wyoming.
We then identified our pre‐ and post‐ACA implementation periods. Medicaid coverage expansion took effect in all expansion states on January 1, 2014, with the exception of Michigan (April 1, 2014), New Hampshire (August 15, 2014), Pennsylvania (January 1, 2015), and Indiana (February 1, 2015).[3] We therefore defined October 1, 2012 to December 31, 2013 as the pre‐ACA implementation period and January 1, 2014 to September 30, 2015 as the post‐ACA implementation period for all states except for Michigan, New Hampshire, Pennsylvania, and Indiana. For these 4 states, we customized the pre‐ and post‐ACA implementation periods to their respective dates of Medicaid expansion; for New Hampshire, we designated October 1, 2012 to July 31, 2014 as the pre‐ACA implementation period and September 1, 2014 to September 30, 2015 as the post‐ACA implementation period, as we were unable to distinguish before versus after data in August 2014 based on the midmonth expansion of Medicaid.
After stratifying hospitals into groups based on whether they were located in Medicaid‐expansion or nonexpansion states, the proportion of discharges by payer was compared between pre‐ and post‐ACA implementation periods both graphically by quarter and using linear regression models weighted for the number of cases from each hospital. Next, for both Medicaid‐expansion and nonexpansion hospitals, LOS index and mortality index were compared before and after ACA implementation using linear regression models weighted for the number of cases from each hospital, both overall and by payer. Difference‐in‐differences estimations were then completed to compare the proportion of discharges by payer, LOS index, and mortality index between Medicaid‐expansion and nonexpansion hospitals before and after ACA implementation. Post hoc linear regression analyses were completed to evaluate the effect of clustering by state level strata on payer mix and LOS and mortality indices. A 2‐sided P value of 0.05 was considered statistically significant. Data analyses were performed using Stata 12.0 (StataCorp, College Station, TX).
RESULTS
We identified 4,258,952 discharges among general medicine patients from 211 hospitals in 38 states and Washington, DC between October 1, 2012, and September 30, 2015. This included 3,144,488 discharges from 156 hospitals in 24 Medicaid‐expansion states and Washington, DC and 1,114,464 discharges from 55 hospitals in 14 nonexpansion states.
Figure 1 shows the trends in payer mix over time for hospitals in both Medicaid‐expansion and nonexpansion states. As summarized in Table 1, hospitals in Medicaid‐expansion states experienced a significant 3.7‐percentage point increase in Medicaid discharges (P = 0.013) and 2.9‐percentage point decrease in uninsured discharges (P 0.001) after ACA implementation. This represented an approximately 19% jump and 60% drop in Medicaid and uninsured discharges, respectively. Hospitals in nonexpansion states saw no significant change in the proportion of discharges by payer after ACA implementation. In the difference‐in‐differences analysis, there was a trend toward a greater change in the proportion of Medicaid discharges pre‐ to post‐ACA implementation among hospitals in Medicaid‐expansion states compared to hospitals in nonexpansion states (mean difference‐in‐differences 4.1%, 95% confidence interval [CI]: 0.3%, 8.6%, P = 0.070).
| Medicaid‐expansion n=156 hospitals; 3,144,488 cases | Non‐expansion n=55 hospitals; 1,114,464 cases | |||||||||
|---|---|---|---|---|---|---|---|---|---|---|
| Pre‐ACA Implementation (1,453,090 Cases) | Post‐ACA Implementation (1,691,398 Cases) | Mean Difference | P Value | Pre‐ACA Implementation (455,440 Cases) | Post‐ACA Implementation (659,024 Cases) | Mean Difference | P Value | Mean Difference‐in‐Differences | P Value | |
| ||||||||||
| Payer mix, % (95% CI) | ||||||||||
| Medicare | 48.6 (46.2, 51.0)* | 48.3 (45.9, 50.7) | 0.3 (3.6, 3.1) | 0.865 | 44.3 (40.7, 47.7)* | 45.3 (41.9, 48.6) | 1.0 (3.8, 5.8) | 0.671 | 1.3 (7.1, 4.5) | 0.655 |
| Commercial | 23.1 (21.4, 24.7) | 23.2 (21.8, 24.6) | 0.2 (2.0, 2.3) | 0.882 | 21.5 (18.5, 24.6) | 22.7 (19.7, 25.8) | 1.2 (3.0, 5.4) | 0.574 | 1.0 (5.7, 3.6) | 0.662 |
| Medicaid | 19.6 (17.6, 21.6) | 23.3 (21.2, 25.5) | 3.7 (0.8, 6.6) | 0.013 | 19.4 (16.9, 21.9) | 19.0 (16.5, 21.4) | 0.4 (3.8, 3.0) | 0.812 | 4.1 (0.3, 8.6) | 0.070 |
| Uninsured | 5.0 (4.0, 5.9) | 2.0 (1.7, 2.3) | 2.9 (3.9, 2.0) | 0.001 | 10.9 (8.1, 13.7) | 9.4 (7.0, 11.7) | 1.5 (5.1, 2.1) | 0.407 | 1.4 (5.1, 2.2) | 0.442 |
| Other | 3.8 (2.6, 4.9) | 3.1 (2.0, 4.3) | 0.7 (2.3, 1.0) | 0.435 | 4.0 (2.9, 5.0) | 3.7 (2.6, 4.7) | 0.3 (1.7, 1.1) | 0.662 | 0.3 (2.5, 1.8) | 0.762 |
| LOS index, mean (95% CI) | ||||||||||
| Overall | 1.017 (0.996, 1.038) | 1.006 (0.981, 1.031) | 0.011 (0.044, 0.021) | 0.488 | 1.008 (0.974, 1.042) | 0.995 (0.961, 1.029) | 0.013 (0.061, 0.034) | 0.574 | 0.002 (0.055, 0.059) | 0.943 |
| Medicare | 1.012 (0.989, 1.035) | 0.999 (0.971, 1.027) | 0.013 (0.049, 0.023) | 0.488 | 0.982 (0.946, 1.017) | 0.979 (0.944, 1.013) | 0.003 (0.052, 0.046) | 0.899 | 0.010 (0.070, 0.051) | 0.754 |
| Commercial | 0.993 (0.974, 1.012) | 0.977 (0.955, 0.998) | 0.016 (0.045, 0.013) | 0.271 | 1.009 (0.978, 1.039) | 0.986 (0.956, 1.016) | 0.022 (0.065, 0.020) | 0.298 | 0.006 (0.044, 0.057) | 0.809 |
| Medicaid | 1.059 (1.036, 1.082) | 1.043 (1.018, 1.067) | 0.016 (0.049, 0.017) | 0.349 | 1.064 (1.020, 1.108) | 1.060 (1.015, 1.106) | 0.004 (0.066, 0.059) | 0.911 | 0.012 (0.082, 0.057) | 0.727 |
| Uninsured | 0.960 (0.933, 0.988) | 0.925 (0.890, 0.961) | 0.035 (0.080, 0.010) | 0.126 | 0.972 (0.935, 1.009) | 0.944 (0.909, 0.979) | 0.028 (0.078, 0.022) | 0.273 | 0.007 (0.074, 0.060) | 0.835 |
| Other | 0.988 (0.960, 1.017) | 0.984 (0.952, 1.015) | 0.005 (0.047, 0.037) | 0.822 | 1.022 (0.973, 1.071) | 0.984 (0.944, 1.024) | 0.038 (0.100, 0.024) | 0.232 | 0.033 (0.042, 0.107) | 0.386 |
| Mortality index, mean (95% CI) | ||||||||||
| Overall | 1.000 (0.955, 1.045) | 0.878 (0.836, 0.921) | 0.122 (0.183, 0.061) | 0.001 | 0.997 (0.931, 1.062) | 0.850 (0.800, 0.900) | 0.147 (0.227, 0.066) | 0.001 | 0.025 (0.076, 0.125) | 0.628 |
| Medicare | 0.990 (0.942, 1.038) | 0.871 (0.826, 0.917) | 0.119 (0.185, 0.053) | 0.001 | 1.000 (0.925, 1.076) | 0.844 (0.788, 0.900) | 0.156 (0.249, 0.064) | 0.001 | 0.038 (0.075, 0.150) | 0.513 |
| Commercial | 1.045 (0.934, 1.155) | 0.908 (0.842, 0.975) | 0.136 (0.264, 0.008) | 0.037 | 1.023 (0.935, 1.111) | 0.820 (0.758, 0.883) | 0.203 (0.309, 0.096) | 0.001 | 0.067 (0.099, 0.232) | 0.430 |
| Medicaid | 0.894 (0.845, 0.942) | 0.786 (0.748, 0.824) | 0.107 (0.168, 0.046) | 0.001 | 0.937 (0.861, 1.013) | 0.789 (0.733, 0.844) | 0.148 (0.242, 0.055) | 0.002 | 0.041 (0.069, 0.151) | 0.464 |
| Uninsured | 1.172 (1.007, 1.337)∥ | 1.136 (0.968, 1.303) | 0.037 (0.271, 0.197) | 0.758 | 0.868 (0.768, 0.968)∥ | 0.850 (0.761, 0.939) | 0.017 (0.149, 0.115) | 0.795 | 0.019 (0.287, 0.248) | 0.887 |
| Other | 1.376 (1.052, 1.700)# | 1.156 (0.910, 1.402) | 0.220 (0.624, 0.184) | 0.285 | 1.009 (0.868, 1.150) # | 0.874 (0.682, 1.066) | 0.135 (0.369, 0.099) | 0.254 | 0.085 (0.555, 0.380) | 0.720 |

Table 1 shows that the overall LOS index remained unchanged pre‐ to post‐ACA implementation for both Medicaid‐expansion (1.017 to 1.006, P = 0.488) and nonexpansion hospitals (1.008 to 0.995, P = 0.574). LOS indices for each payer type also remained unchanged. The overall mortality index significantly improved pre‐ to post‐ACA implementation for both Medicaid‐expansion (1.000 to 0.878, P 0.001) and nonexpansion hospitals (0.997 to 0.850, P = 0.001). Among both Medicaid‐expansion and nonexpansion hospitals, the mortality index significantly improved for Medicare, commercial, and Medicaid discharges but not for uninsured or other discharges. In the difference‐in‐differences analysis, the changes in LOS indices and mortality indices pre‐ to post‐ACA implementation did not differ significantly between hospitals in Medicaid‐expansion versus nonexpansion states.
In post hoc linear regression analyses of payer mix and LOS and mortality indices clustered by state‐level strata, point estimates were minimally changed. Although 95% CIs were slightly wider, statistical significance was unchanged from our primary analyses (data not shown).
DISCUSSION
We found that ACA implementation had a significant impact on payer mix for general medicine patients at AMCs in the United States, primarily by increasing the number of Medicaid beneficiaries and by decreasing the number of uninsured patients in Medicaid‐expansion states. State Medicaid expansion status did not appear to influence either LOS or in‐hospital mortality.
Our study offers some of the longest‐term data currently available on the impact of ACA implementation on payer mix trends and encompasses more states than others have previously. Although we uniquely focused on general medicine patients at AMCs, our results are similar to those seen for US hospitals overall. Nikpay and colleagues evaluated payer mix trends for non‐Medicare adult inpatient stays in 16 states through the second quarter of 2014 using the Healthcare Cost and Utilization Project database through the Agency for Healthcare Research and Quality.[4] They found a relative 20% increase and 50% decrease in Medicaid and uninsured discharges in Medicaid‐expansion states, along with nonsignificant changes in nonexpansion states. Hempstead and Cantor assessed payer mix for non‐Medicare discharges using state hospital association data from 21 states through the fourth quarter of 2014 and found a significant increase in Medicaid patients as well as a nearly significant decrease in uninsured patients in expansion states relative to nonexpansion states.[5] The Department of Health and Human Services also reported that uninsured/self‐pay discharges fell substantially (65%73%) in Medicaid‐expansion states by the end of 2014, with slight decreases in nonexpansion states.[20]
In contrast to our hypothesis, the overall LOS and in‐hospital mortality indices were not influenced by state Medicaid expansion status. From a purely mathematical standpoint, the contribution of Medicaid patients to the overall LOS and mortality indices may have been eclipsed by Medicare and commercially insured patients, who represented a higher proportion of total discharges. The lack of impact of state Medicaid expansion status on overall LOS and mortality indices did not appear to occur as a result of indices for Medicaid patients trending toward the mean. As predicted based on observational studies, Medicaid patients in our study tended to have a higher LOS index than those with other insurance types. Medicaid patients actually tended to have a lower mortality index in our analysis; the reason for this latter finding is unclear and in contrast to other published studies.[6, 7, 8, 9, 10, 11, 12, 13, 14, 15, 21]
To our knowledge, no other studies have evaluated the effect of payer mix changes under the ACA on inpatient outcomes. However, new evidence is emerging on outpatient outcomes. Low‐income adults in Medicaid‐expansion states have reported greater gains in access to primary care services and in the diagnosis of certain chronic health conditions than those in nonexpansion states as a result of ACA implementation.[22, 23] Such improvements in the outpatient setting might be expected to reduce patient acuity on admission. However, they would not necessarily translate to relative improvements in LOS or mortality indices for Medicaid‐expansion hospitals, as the UHC risk adjustment models controlled for disease severity on admission.
Similarly, few studies have assessed the impact of payer mix changes under previous state Medicaid expansions on inpatient outcomes. After Massachusetts expanded Medicaid and enacted near‐universal healthcare coverage in 2006, a minimal LOS reduction of just 0.05 days was observed.[24] New York expanded Medicaid eligibility to nondisabled childless adults with incomes below 100% of the federal poverty level in September 2001, whereas Arizona did so in November 2001 and Maine in October 2002. A study comparing outcomes in these states to 4 neighboring nonexpansion states found a relative reduction in annual all‐cause mortality of 6.1% population wide; however, it did not assess in‐hospital mortality.[25] The Oregon Health Insurance Experiment that randomized low‐income adults to expanded Medicaid coverage or not in 2008 has also reported on outpatient rather than inpatient outcomes.[26]
Our findings have potential implications for health policymakers. That Medicaid expansion status had a neutral effect on both LOS and mortality indices in our analysis should be reassuring for states contemplating Medicaid expansion in the future. Our results also highlight the need for further efforts to reduce disparities in inpatient care based on payer status. For example, although Medicare, commercially insured, and Medicaid patients witnessed significant improvements in mortality indices pre‐ to post‐ACA implementation in hospitals in both Medicaid‐expansion and nonexpansion states, uninsured patients did not.
This study has several limitations. First, our analysis of the impact of ACA implementation on payer mix did not account for concurrent socioeconomic trends that may have influenced insurance coverage across the United States. However, the main goal of this analysis was to demonstrate that changes in payer mix did in fact occur over time, to provide rationale for our subsequent LOS and mortality analyses. Second, we could not control for variation in the design and implementation of Medicaid expansions across states as permitted under the federal Section 1115 waiver process. Third, we only had access to hospital‐level data through the UHC CDB/RM, rather than individual patient data. We attempted to mitigate this limitation by weighting data according to the number of cases per hospital. Lastly, additional patient‐level factors that may influence LOS or mortality may not be included in the UHC risk adjustment models.
In summary, the differential shift in payer mix between Medicaid‐expansion and nonexpansion states did not influence overall LOS or in‐hospital mortality for general medicine patients at AMCs in the United States. Additional research could help to determine the impact of ACA implementation on other patient outcomes that may be dependent on insurance status, such as readmissions or hospital‐acquired complications.
Disclosures: M.E.A. conceived of the study concept and design, assisted with data acquisition, and drafted the manuscript. J.J.G. assisted with study design and made critical revisions to the manuscript. D.A. assisted with study design and made critical revisions to the manuscript. R.P. assisted with study design and made critical revisions to the manuscript. M.L. assisted with study design and data acquisition and made critical revisions to the manuscript. C.D.J. assisted with study design, performed data analyses, and made critical revisions to the manuscript. A modified abstract was presented in poster format at the University HealthSystem Consortium Annual Conference held September 30 to October 2, 2015 in Orlando, Florida, as well as at the Society of Hospital Medicine Research, Innovations, and Vignettes 2016 Annual Meeting held March 69, 2016, in San Diego, California. The authors report no conflicts of interest.
- Department of Health and Human Services. Key features of the Affordable Care Act by year. Available at: http://www.hhs.gov/healthcare/facts‐and‐features/key‐features‐of‐aca‐by‐year/index.html#2014. Accessed April 4, 2016.
- Centers for Medicare and Medicaid Services. Medicaid enrollment data collected through MBES. Available at: https://www.medicaid.gov/medicaid‐chip‐program‐information/program‐information/medicaid‐and‐chip‐enrollment‐data/medicaid‐enrollment‐data‐collected‐through‐mbes.html. Accessed April 4, 2016.
- The Henry J. Kaiser Family Foundation. Status of state action on the Medicaid expansion decision. Available at: http://kff.org/health‐reform/state‐indicator/state‐activity‐around‐expanding‐medicaid‐under‐the‐affordable‐care‐act. Accessed April 4, 2016.
- , , . Affordable Care Act Medicaid expansion reduced uninsured hospital stays in 2014. Health Aff (Millwood). 2016;35(1):106–110.
- , . State Medicaid expansion and changes in hospital volume according to payer. N Engl J Med. 2016;374(2):196–198.
- , , , , , . Understanding predictors of prolonged hospitalizations among general medicine patients: a guide and preliminary analysis. J Hosp Med. 2015;10(9):623–626.
- , , , . Impact of insurance and hospital ownership on hospital length of stay among patients with ambulatory care‐sensitive conditions. Ann Fam Med. 2011;9:489–495.
- , , . Insurance status and hospital care for myocardial infarction, stroke, and pneumonia. J Hosp Med. 2010;5:452–459.
- , , , , , . Payment source, quality of care, and outcomes in patients hospitalized with heart failure. J Am Coll Cardiol. 2011;58(14):1465–1471.
- , , , , . The inpatient experience and predictors of length of stay for patients hospitalized with systolic heart failure: comparison by commercial, Medicaid, and Medicare payer type. J Med Econ. 2013;16(1):43–54.
- , , et al. Insurance coverage and care of patients with non‐ST‐segment elevation acute coronary syndromes. Ann Intern Med. 2006;145:739–748.
- , , , et al. Association of insurance status with inpatient treatment for coronary artery disease: findings from the Get with the Guidelines Program. Am Heart J. 2010;159:1026–1036.
- , , , et al. Primary payer status affects mortality for major surgical operations. Ann Surg. 2010;252:544–551.
- , , . Medicaid payer status is associated with in‐hospital morbidity and resource utilization following primary total joint arthroplasty. J Bone Joint Surg Am. 2014;96(21):e180.
- , , . The quality of care delivered to patients within the same hospital varies by insurance type. Health Aff (Millwood). 2013;32(10):1731–1739.
- , , , , . Effect of insurance status on postacute care among working age stroke survivors. Neurology. 2012;78(20):1590–1595.
- , , , . Hospitalizations in which patients leave the hospital against medical advice (AMA), 2007. HCUP statistical brief #78. August 2009. Rockville, MD: Agency for Healthcare Research and Quality; 2009. Available at: http://www.hcup‐us.ahrq.gov/reports/statbriefs/sb78.pdf. Accessed May 12, 2016.
- , , , . Characteristics of Medicaid and uninsured hospitalizations, 2012. HCUP statistical brief #182. Rockville, MD: Agency for Healthcare Research and Quality; 2014. Available at: http://www.hcup‐us.ahrq.gov/reports/statbriefs/sb182‐Medicaid‐Uninsured‐Hospitalizations‐2012.pdf. Accessed March 9, 2016.
- Agency for Healthcare Research and Quality. Mortality measurement: mortality risk adjustment methodology for University HealthSystem Consortium. Available at: http://archive.ahrq.gov/professionals/quality‐patient‐safety/quality‐resources/tools/mortality/Meurer.pdf. Accessed May 10, 2016.
- Department of Health and Human Services. Insurance expansion, hospital uncompensated care, and the Affordable Care Act. Available at: https://aspe.hhs.gov/pdf‐report/insurance‐expansion‐hospital‐uncompensated‐care‐and‐affordable‐care‐act. Accessed May 27, 2016.
- , , , . Our flawed but beneficial Medicaid program. N Engl J Med. 2011;364(16):e31.
- , , , . Changes in self‐reported insurance coverage, access to care, and health under the Affordable Care Act. JAMA. 2015;314(4):366–374.
- , . Early coverage, access, utilization, and health effects associated with the Affordable Care Act Medicaid Expansions: a quasi‐experimental study. Ann Intern Med. 2016;164(12):795–803.
- , . The impact of health care reform on hospital and preventive care: evidence from Massachusetts. J Public Econ. 2012;96(11–12):909–929.
- , , . Mortality and access to care among adults after state Medicaid expansions. N Engl J Med. 2012;367:1025–1034.
- , , , et al. The Oregon Experiment—effects of Medicaid on clinical outcomes. N Engl J Med. 2013;368(18):1713–1722.
On January 1, 2014, several major provisions of the Affordable Care Act (ACA) took effect, including introduction of the individual mandate for health insurance coverage, opening of the Health Insurance Marketplace, and expansion of Medicaid eligibility to Americans earning up to 133% of the federal poverty level.[1] Nearly 9 million US adults have enrolled in Medicaid since that time, primarily in the 31 states and Washington, DC that have opted into Medicaid expansion.[2, 3] ACA implementation has also had a significant impact on hospital payer mix, primarily by reducing the volume of uncompensated care in Medicaid‐expansion states.[4, 5]
The differential shift in payer mix in Medicaid‐expansion versus nonexpansion states may be relevant to hospitals beyond reimbursement. Medicaid insurance has historically been associated with longer hospitalizations and higher in‐hospital mortality in diverse patient populations, more so than commercial insurance and often even uninsured payer status.[6, 7, 8, 9, 10, 11, 12, 13, 14, 15] The disparity in outcomes between patients with Medicaid versus other insurance persists even after adjustment for disease severity and baseline comorbidities. Insurance type may influence the delivery of inpatient care through variation in access to invasive procedures and adherence to guideline‐concordant medical therapies.[9, 10, 11, 12] Medicaid patients may be more likely than uninsured patients to remain hospitalized pending postacute care placement rather than be discharged home with family support.[16] Medicaid patients are also less likely to leave against medical advice than uninsured patients.[17]
Currently, little is known about the impact of state Medicaid expansion status on length of stay (LOS) or mortality nationally. It is possible that hospitals in Medicaid‐expansion states have experienced relative worsening in LOS and mortality as their share of Medicaid patients has grown. Determining the impact of ACA implementation on payer mix and patient outcomes is particularly important for academic medical centers (AMCs), as they traditionally care for the greatest percentage of both Medicaid and uninsured patients.[18] We sought to characterize the impact of state Medicaid expansion status on payer mix, LOS, and in‐hospital mortality for general medicine patients at AMCs in the United States.
METHODS
The University HealthSystem Consortium (UHC) is an alliance of 117 AMCs and 310 affiliated hospitals, representing >90% of such institutions in the US. We queried the online UHC Clinical Data Base/Resource Manager (CDB/RM) to obtain hospital‐level insurance, LOS, and mortality data for inpatients discharged from a general medicine service between October 1, 2012 and September 30, 2015. We excluded hospitals that were missing data for any month within the study period. No patient‐level data were accessed.
Our outcomes of interest were the proportion of discharges by primary payer (Medicare, commercial, Medicaid, uninsured, or other [eg, Tri‐Care or Workers' Compensation]), as well as the LOS index and mortality index. Both indices were defined as the ratio of the observed to expected values. To determine the expected LOS and mortality, the UHC 2015 risk adjustment models were applied to all cases, adjusting for variables such as patient demographics, low socioeconomic status, admit source and status, severity of illness, and comorbid conditions, as described by International Classification of Diseases, Ninth Revision codes. These models have been validated and are used for research and quality benchmarking for member institutions.[19]
We next stratified hospitals according to state Medicaid expansion status. We defined Medicaid‐expansion states as those that had expanded Medicaid by the end of the study period: Arizona, Arkansas, California, Colorado, Connecticut, Illinois, Indiana, Iowa, Kentucky, Maryland, Massachusetts, Michigan, Minnesota, Nevada, New Hampshire, New Jersey, New Mexico, New York, Ohio, Oregon, Pennsylvania, Rhode Island, Washington, Washington DC, and West Virginia. Nonexpansion states included Alabama, Florida, Georgia, Kansas, Louisiana, Missouri, Nebraska, North Carolina, South Carolina, Tennessee, Texas, Utah, Virginia, and Wisconsin. We excluded 12 states due to incomplete data: Alaska, Delaware, Hawaii, Idaho, North Dakota, Maine, Mississippi, Montana, Oklahoma, South Dakota, Vermont, and Wyoming.
We then identified our pre‐ and post‐ACA implementation periods. Medicaid coverage expansion took effect in all expansion states on January 1, 2014, with the exception of Michigan (April 1, 2014), New Hampshire (August 15, 2014), Pennsylvania (January 1, 2015), and Indiana (February 1, 2015).[3] We therefore defined October 1, 2012 to December 31, 2013 as the pre‐ACA implementation period and January 1, 2014 to September 30, 2015 as the post‐ACA implementation period for all states except for Michigan, New Hampshire, Pennsylvania, and Indiana. For these 4 states, we customized the pre‐ and post‐ACA implementation periods to their respective dates of Medicaid expansion; for New Hampshire, we designated October 1, 2012 to July 31, 2014 as the pre‐ACA implementation period and September 1, 2014 to September 30, 2015 as the post‐ACA implementation period, as we were unable to distinguish before versus after data in August 2014 based on the midmonth expansion of Medicaid.
After stratifying hospitals into groups based on whether they were located in Medicaid‐expansion or nonexpansion states, the proportion of discharges by payer was compared between pre‐ and post‐ACA implementation periods both graphically by quarter and using linear regression models weighted for the number of cases from each hospital. Next, for both Medicaid‐expansion and nonexpansion hospitals, LOS index and mortality index were compared before and after ACA implementation using linear regression models weighted for the number of cases from each hospital, both overall and by payer. Difference‐in‐differences estimations were then completed to compare the proportion of discharges by payer, LOS index, and mortality index between Medicaid‐expansion and nonexpansion hospitals before and after ACA implementation. Post hoc linear regression analyses were completed to evaluate the effect of clustering by state level strata on payer mix and LOS and mortality indices. A 2‐sided P value of 0.05 was considered statistically significant. Data analyses were performed using Stata 12.0 (StataCorp, College Station, TX).
RESULTS
We identified 4,258,952 discharges among general medicine patients from 211 hospitals in 38 states and Washington, DC between October 1, 2012, and September 30, 2015. This included 3,144,488 discharges from 156 hospitals in 24 Medicaid‐expansion states and Washington, DC and 1,114,464 discharges from 55 hospitals in 14 nonexpansion states.
Figure 1 shows the trends in payer mix over time for hospitals in both Medicaid‐expansion and nonexpansion states. As summarized in Table 1, hospitals in Medicaid‐expansion states experienced a significant 3.7‐percentage point increase in Medicaid discharges (P = 0.013) and 2.9‐percentage point decrease in uninsured discharges (P 0.001) after ACA implementation. This represented an approximately 19% jump and 60% drop in Medicaid and uninsured discharges, respectively. Hospitals in nonexpansion states saw no significant change in the proportion of discharges by payer after ACA implementation. In the difference‐in‐differences analysis, there was a trend toward a greater change in the proportion of Medicaid discharges pre‐ to post‐ACA implementation among hospitals in Medicaid‐expansion states compared to hospitals in nonexpansion states (mean difference‐in‐differences 4.1%, 95% confidence interval [CI]: 0.3%, 8.6%, P = 0.070).
| Medicaid‐expansion n=156 hospitals; 3,144,488 cases | Non‐expansion n=55 hospitals; 1,114,464 cases | |||||||||
|---|---|---|---|---|---|---|---|---|---|---|
| Pre‐ACA Implementation (1,453,090 Cases) | Post‐ACA Implementation (1,691,398 Cases) | Mean Difference | P Value | Pre‐ACA Implementation (455,440 Cases) | Post‐ACA Implementation (659,024 Cases) | Mean Difference | P Value | Mean Difference‐in‐Differences | P Value | |
| ||||||||||
| Payer mix, % (95% CI) | ||||||||||
| Medicare | 48.6 (46.2, 51.0)* | 48.3 (45.9, 50.7) | 0.3 (3.6, 3.1) | 0.865 | 44.3 (40.7, 47.7)* | 45.3 (41.9, 48.6) | 1.0 (3.8, 5.8) | 0.671 | 1.3 (7.1, 4.5) | 0.655 |
| Commercial | 23.1 (21.4, 24.7) | 23.2 (21.8, 24.6) | 0.2 (2.0, 2.3) | 0.882 | 21.5 (18.5, 24.6) | 22.7 (19.7, 25.8) | 1.2 (3.0, 5.4) | 0.574 | 1.0 (5.7, 3.6) | 0.662 |
| Medicaid | 19.6 (17.6, 21.6) | 23.3 (21.2, 25.5) | 3.7 (0.8, 6.6) | 0.013 | 19.4 (16.9, 21.9) | 19.0 (16.5, 21.4) | 0.4 (3.8, 3.0) | 0.812 | 4.1 (0.3, 8.6) | 0.070 |
| Uninsured | 5.0 (4.0, 5.9) | 2.0 (1.7, 2.3) | 2.9 (3.9, 2.0) | 0.001 | 10.9 (8.1, 13.7) | 9.4 (7.0, 11.7) | 1.5 (5.1, 2.1) | 0.407 | 1.4 (5.1, 2.2) | 0.442 |
| Other | 3.8 (2.6, 4.9) | 3.1 (2.0, 4.3) | 0.7 (2.3, 1.0) | 0.435 | 4.0 (2.9, 5.0) | 3.7 (2.6, 4.7) | 0.3 (1.7, 1.1) | 0.662 | 0.3 (2.5, 1.8) | 0.762 |
| LOS index, mean (95% CI) | ||||||||||
| Overall | 1.017 (0.996, 1.038) | 1.006 (0.981, 1.031) | 0.011 (0.044, 0.021) | 0.488 | 1.008 (0.974, 1.042) | 0.995 (0.961, 1.029) | 0.013 (0.061, 0.034) | 0.574 | 0.002 (0.055, 0.059) | 0.943 |
| Medicare | 1.012 (0.989, 1.035) | 0.999 (0.971, 1.027) | 0.013 (0.049, 0.023) | 0.488 | 0.982 (0.946, 1.017) | 0.979 (0.944, 1.013) | 0.003 (0.052, 0.046) | 0.899 | 0.010 (0.070, 0.051) | 0.754 |
| Commercial | 0.993 (0.974, 1.012) | 0.977 (0.955, 0.998) | 0.016 (0.045, 0.013) | 0.271 | 1.009 (0.978, 1.039) | 0.986 (0.956, 1.016) | 0.022 (0.065, 0.020) | 0.298 | 0.006 (0.044, 0.057) | 0.809 |
| Medicaid | 1.059 (1.036, 1.082) | 1.043 (1.018, 1.067) | 0.016 (0.049, 0.017) | 0.349 | 1.064 (1.020, 1.108) | 1.060 (1.015, 1.106) | 0.004 (0.066, 0.059) | 0.911 | 0.012 (0.082, 0.057) | 0.727 |
| Uninsured | 0.960 (0.933, 0.988) | 0.925 (0.890, 0.961) | 0.035 (0.080, 0.010) | 0.126 | 0.972 (0.935, 1.009) | 0.944 (0.909, 0.979) | 0.028 (0.078, 0.022) | 0.273 | 0.007 (0.074, 0.060) | 0.835 |
| Other | 0.988 (0.960, 1.017) | 0.984 (0.952, 1.015) | 0.005 (0.047, 0.037) | 0.822 | 1.022 (0.973, 1.071) | 0.984 (0.944, 1.024) | 0.038 (0.100, 0.024) | 0.232 | 0.033 (0.042, 0.107) | 0.386 |
| Mortality index, mean (95% CI) | ||||||||||
| Overall | 1.000 (0.955, 1.045) | 0.878 (0.836, 0.921) | 0.122 (0.183, 0.061) | 0.001 | 0.997 (0.931, 1.062) | 0.850 (0.800, 0.900) | 0.147 (0.227, 0.066) | 0.001 | 0.025 (0.076, 0.125) | 0.628 |
| Medicare | 0.990 (0.942, 1.038) | 0.871 (0.826, 0.917) | 0.119 (0.185, 0.053) | 0.001 | 1.000 (0.925, 1.076) | 0.844 (0.788, 0.900) | 0.156 (0.249, 0.064) | 0.001 | 0.038 (0.075, 0.150) | 0.513 |
| Commercial | 1.045 (0.934, 1.155) | 0.908 (0.842, 0.975) | 0.136 (0.264, 0.008) | 0.037 | 1.023 (0.935, 1.111) | 0.820 (0.758, 0.883) | 0.203 (0.309, 0.096) | 0.001 | 0.067 (0.099, 0.232) | 0.430 |
| Medicaid | 0.894 (0.845, 0.942) | 0.786 (0.748, 0.824) | 0.107 (0.168, 0.046) | 0.001 | 0.937 (0.861, 1.013) | 0.789 (0.733, 0.844) | 0.148 (0.242, 0.055) | 0.002 | 0.041 (0.069, 0.151) | 0.464 |
| Uninsured | 1.172 (1.007, 1.337)∥ | 1.136 (0.968, 1.303) | 0.037 (0.271, 0.197) | 0.758 | 0.868 (0.768, 0.968)∥ | 0.850 (0.761, 0.939) | 0.017 (0.149, 0.115) | 0.795 | 0.019 (0.287, 0.248) | 0.887 |
| Other | 1.376 (1.052, 1.700)# | 1.156 (0.910, 1.402) | 0.220 (0.624, 0.184) | 0.285 | 1.009 (0.868, 1.150) # | 0.874 (0.682, 1.066) | 0.135 (0.369, 0.099) | 0.254 | 0.085 (0.555, 0.380) | 0.720 |
Table 1 shows that the overall LOS index remained unchanged pre‐ to post‐ACA implementation for both Medicaid‐expansion (1.017 to 1.006, P = 0.488) and nonexpansion hospitals (1.008 to 0.995, P = 0.574). LOS indices for each payer type also remained unchanged. The overall mortality index significantly improved pre‐ to post‐ACA implementation for both Medicaid‐expansion (1.000 to 0.878, P 0.001) and nonexpansion hospitals (0.997 to 0.850, P = 0.001). Among both Medicaid‐expansion and nonexpansion hospitals, the mortality index significantly improved for Medicare, commercial, and Medicaid discharges but not for uninsured or other discharges. In the difference‐in‐differences analysis, the changes in LOS indices and mortality indices pre‐ to post‐ACA implementation did not differ significantly between hospitals in Medicaid‐expansion versus nonexpansion states.
In post hoc linear regression analyses of payer mix and LOS and mortality indices clustered by state‐level strata, point estimates were minimally changed. Although 95% CIs were slightly wider, statistical significance was unchanged from our primary analyses (data not shown).
DISCUSSION
We found that ACA implementation had a significant impact on payer mix for general medicine patients at AMCs in the United States, primarily by increasing the number of Medicaid beneficiaries and by decreasing the number of uninsured patients in Medicaid‐expansion states. State Medicaid expansion status did not appear to influence either LOS or in‐hospital mortality.
Our study offers some of the longest‐term data currently available on the impact of ACA implementation on payer mix trends and encompasses more states than others have previously. Although we uniquely focused on general medicine patients at AMCs, our results are similar to those seen for US hospitals overall. Nikpay and colleagues evaluated payer mix trends for non‐Medicare adult inpatient stays in 16 states through the second quarter of 2014 using the Healthcare Cost and Utilization Project database through the Agency for Healthcare Research and Quality.[4] They found a relative 20% increase and 50% decrease in Medicaid and uninsured discharges in Medicaid‐expansion states, along with nonsignificant changes in nonexpansion states. Hempstead and Cantor assessed payer mix for non‐Medicare discharges using state hospital association data from 21 states through the fourth quarter of 2014 and found a significant increase in Medicaid patients as well as a nearly significant decrease in uninsured patients in expansion states relative to nonexpansion states.[5] The Department of Health and Human Services also reported that uninsured/self‐pay discharges fell substantially (65%73%) in Medicaid‐expansion states by the end of 2014, with slight decreases in nonexpansion states.[20]
In contrast to our hypothesis, the overall LOS and in‐hospital mortality indices were not influenced by state Medicaid expansion status. From a purely mathematical standpoint, the contribution of Medicaid patients to the overall LOS and mortality indices may have been eclipsed by Medicare and commercially insured patients, who represented a higher proportion of total discharges. The lack of impact of state Medicaid expansion status on overall LOS and mortality indices did not appear to occur as a result of indices for Medicaid patients trending toward the mean. As predicted based on observational studies, Medicaid patients in our study tended to have a higher LOS index than those with other insurance types. Medicaid patients actually tended to have a lower mortality index in our analysis; the reason for this latter finding is unclear and in contrast to other published studies.[6, 7, 8, 9, 10, 11, 12, 13, 14, 15, 21]
To our knowledge, no other studies have evaluated the effect of payer mix changes under the ACA on inpatient outcomes. However, new evidence is emerging on outpatient outcomes. Low‐income adults in Medicaid‐expansion states have reported greater gains in access to primary care services and in the diagnosis of certain chronic health conditions than those in nonexpansion states as a result of ACA implementation.[22, 23] Such improvements in the outpatient setting might be expected to reduce patient acuity on admission. However, they would not necessarily translate to relative improvements in LOS or mortality indices for Medicaid‐expansion hospitals, as the UHC risk adjustment models controlled for disease severity on admission.
Similarly, few studies have assessed the impact of payer mix changes under previous state Medicaid expansions on inpatient outcomes. After Massachusetts expanded Medicaid and enacted near‐universal healthcare coverage in 2006, a minimal LOS reduction of just 0.05 days was observed.[24] New York expanded Medicaid eligibility to nondisabled childless adults with incomes below 100% of the federal poverty level in September 2001, whereas Arizona did so in November 2001 and Maine in October 2002. A study comparing outcomes in these states to 4 neighboring nonexpansion states found a relative reduction in annual all‐cause mortality of 6.1% population wide; however, it did not assess in‐hospital mortality.[25] The Oregon Health Insurance Experiment that randomized low‐income adults to expanded Medicaid coverage or not in 2008 has also reported on outpatient rather than inpatient outcomes.[26]
Our findings have potential implications for health policymakers. That Medicaid expansion status had a neutral effect on both LOS and mortality indices in our analysis should be reassuring for states contemplating Medicaid expansion in the future. Our results also highlight the need for further efforts to reduce disparities in inpatient care based on payer status. For example, although Medicare, commercially insured, and Medicaid patients witnessed significant improvements in mortality indices pre‐ to post‐ACA implementation in hospitals in both Medicaid‐expansion and nonexpansion states, uninsured patients did not.
This study has several limitations. First, our analysis of the impact of ACA implementation on payer mix did not account for concurrent socioeconomic trends that may have influenced insurance coverage across the United States. However, the main goal of this analysis was to demonstrate that changes in payer mix did in fact occur over time, to provide rationale for our subsequent LOS and mortality analyses. Second, we could not control for variation in the design and implementation of Medicaid expansions across states as permitted under the federal Section 1115 waiver process. Third, we only had access to hospital‐level data through the UHC CDB/RM, rather than individual patient data. We attempted to mitigate this limitation by weighting data according to the number of cases per hospital. Lastly, additional patient‐level factors that may influence LOS or mortality may not be included in the UHC risk adjustment models.
In summary, the differential shift in payer mix between Medicaid‐expansion and nonexpansion states did not influence overall LOS or in‐hospital mortality for general medicine patients at AMCs in the United States. Additional research could help to determine the impact of ACA implementation on other patient outcomes that may be dependent on insurance status, such as readmissions or hospital‐acquired complications.
Disclosures: M.E.A. conceived of the study concept and design, assisted with data acquisition, and drafted the manuscript. J.J.G. assisted with study design and made critical revisions to the manuscript. D.A. assisted with study design and made critical revisions to the manuscript. R.P. assisted with study design and made critical revisions to the manuscript. M.L. assisted with study design and data acquisition and made critical revisions to the manuscript. C.D.J. assisted with study design, performed data analyses, and made critical revisions to the manuscript. A modified abstract was presented in poster format at the University HealthSystem Consortium Annual Conference held September 30 to October 2, 2015 in Orlando, Florida, as well as at the Society of Hospital Medicine Research, Innovations, and Vignettes 2016 Annual Meeting held March 69, 2016, in San Diego, California. The authors report no conflicts of interest.
- Department of Health and Human Services. Key features of the Affordable Care Act by year. Available at: http://www.hhs.gov/healthcare/facts‐and‐features/key‐features‐of‐aca‐by‐year/index.html#2014. Accessed April 4, 2016.
- Centers for Medicare and Medicaid Services. Medicaid enrollment data collected through MBES. Available at: https://www.medicaid.gov/medicaid‐chip‐program‐information/program‐information/medicaid‐and‐chip‐enrollment‐data/medicaid‐enrollment‐data‐collected‐through‐mbes.html. Accessed April 4, 2016.
- The Henry J. Kaiser Family Foundation. Status of state action on the Medicaid expansion decision. Available at: http://kff.org/health‐reform/state‐indicator/state‐activity‐around‐expanding‐medicaid‐under‐the‐affordable‐care‐act. Accessed April 4, 2016.
- , , . Affordable Care Act Medicaid expansion reduced uninsured hospital stays in 2014. Health Aff (Millwood). 2016;35(1):106–110.
- , . State Medicaid expansion and changes in hospital volume according to payer. N Engl J Med. 2016;374(2):196–198.
- , , , , , . Understanding predictors of prolonged hospitalizations among general medicine patients: a guide and preliminary analysis. J Hosp Med. 2015;10(9):623–626.
- , , , . Impact of insurance and hospital ownership on hospital length of stay among patients with ambulatory care‐sensitive conditions. Ann Fam Med. 2011;9:489–495.
- , , . Insurance status and hospital care for myocardial infarction, stroke, and pneumonia. J Hosp Med. 2010;5:452–459.
- , , , , , . Payment source, quality of care, and outcomes in patients hospitalized with heart failure. J Am Coll Cardiol. 2011;58(14):1465–1471.
- , , , , . The inpatient experience and predictors of length of stay for patients hospitalized with systolic heart failure: comparison by commercial, Medicaid, and Medicare payer type. J Med Econ. 2013;16(1):43–54.
- , , et al. Insurance coverage and care of patients with non‐ST‐segment elevation acute coronary syndromes. Ann Intern Med. 2006;145:739–748.
- , , , et al. Association of insurance status with inpatient treatment for coronary artery disease: findings from the Get with the Guidelines Program. Am Heart J. 2010;159:1026–1036.
- , , , et al. Primary payer status affects mortality for major surgical operations. Ann Surg. 2010;252:544–551.
- , , . Medicaid payer status is associated with in‐hospital morbidity and resource utilization following primary total joint arthroplasty. J Bone Joint Surg Am. 2014;96(21):e180.
- , , . The quality of care delivered to patients within the same hospital varies by insurance type. Health Aff (Millwood). 2013;32(10):1731–1739.
- , , , , . Effect of insurance status on postacute care among working age stroke survivors. Neurology. 2012;78(20):1590–1595.
- , , , . Hospitalizations in which patients leave the hospital against medical advice (AMA), 2007. HCUP statistical brief #78. August 2009. Rockville, MD: Agency for Healthcare Research and Quality; 2009. Available at: http://www.hcup‐us.ahrq.gov/reports/statbriefs/sb78.pdf. Accessed May 12, 2016.
- , , , . Characteristics of Medicaid and uninsured hospitalizations, 2012. HCUP statistical brief #182. Rockville, MD: Agency for Healthcare Research and Quality; 2014. Available at: http://www.hcup‐us.ahrq.gov/reports/statbriefs/sb182‐Medicaid‐Uninsured‐Hospitalizations‐2012.pdf. Accessed March 9, 2016.
- Agency for Healthcare Research and Quality. Mortality measurement: mortality risk adjustment methodology for University HealthSystem Consortium. Available at: http://archive.ahrq.gov/professionals/quality‐patient‐safety/quality‐resources/tools/mortality/Meurer.pdf. Accessed May 10, 2016.
- Department of Health and Human Services. Insurance expansion, hospital uncompensated care, and the Affordable Care Act. Available at: https://aspe.hhs.gov/pdf‐report/insurance‐expansion‐hospital‐uncompensated‐care‐and‐affordable‐care‐act. Accessed May 27, 2016.
- , , , . Our flawed but beneficial Medicaid program. N Engl J Med. 2011;364(16):e31.
- , , , . Changes in self‐reported insurance coverage, access to care, and health under the Affordable Care Act. JAMA. 2015;314(4):366–374.
- , . Early coverage, access, utilization, and health effects associated with the Affordable Care Act Medicaid Expansions: a quasi‐experimental study. Ann Intern Med. 2016;164(12):795–803.
- , . The impact of health care reform on hospital and preventive care: evidence from Massachusetts. J Public Econ. 2012;96(11–12):909–929.
- , , . Mortality and access to care among adults after state Medicaid expansions. N Engl J Med. 2012;367:1025–1034.
- , , , et al. The Oregon Experiment—effects of Medicaid on clinical outcomes. N Engl J Med. 2013;368(18):1713–1722.
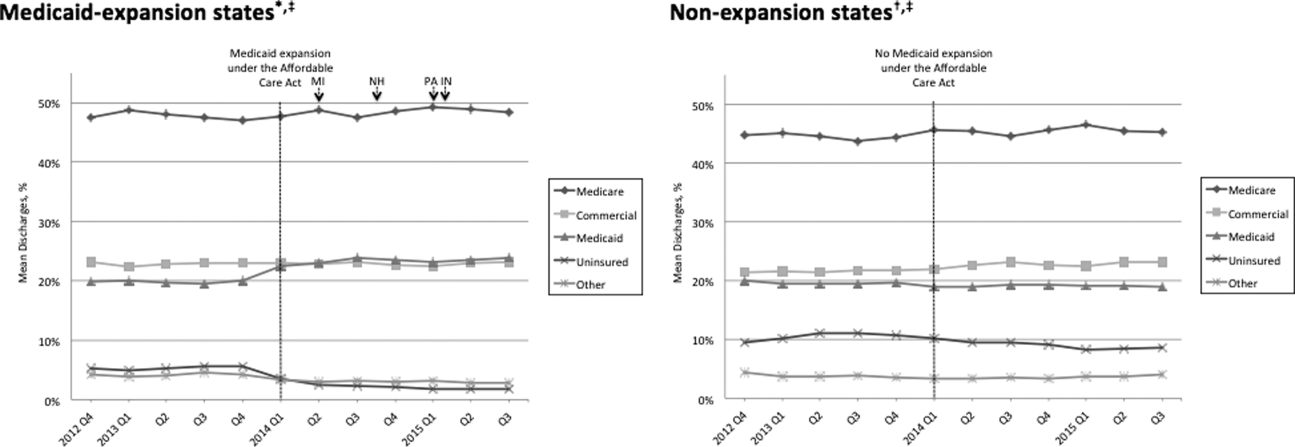
Postpartum Depression Screening
Maternal postpartum depression occurs in 5% to 25% of all mothers, and up to 40% to 60% in high‐risk populations such as low‐income women.[1, 2, 3, 4] Children of affected mothers suffer negative health consequences such as decreased physical growth, poor maternalchild bond, problem behavior, and child abuse.[5, 6, 7] Timely recognition of symptoms and treatment may improve child outcomes.[8] Published guidelines recommend pediatricians screen for postpartum depression at infant 1‐, 2‐, 4‐, and 6‐month outpatient visits.[9] There are no current guidelines for or studies of screening in general inpatient settings, although emergency rooms[10] and neonatal intensive care units (NICUs)[11] have been examined. Pediatric hospitalization may offer an additional opportunity for expanding screening and intervention.
Augmenting outpatient screening practices with additional inpatient screening would have several benefits. Infant health problems have been associated with postpartum depression, and therefore mothers in the hospital may be at higher risk.[12] Inpatient screening would also improve access to mothers not screened as outpatients. Missed screening could occur due to physician discomfort with screening, time constraints during busy office visits, or noncompliance with recommended visit schedules.[13, 14, 15, 16] Finally, inpatient providers would benefit from understanding the psychosocial milieu of children now under their care. Recent studies note hospital discharges may be improved and readmissions reduced by assessing socioeconomic risk factors during hospitalization.[17] The evidence‐based Peds Effective Discharge: Better Handoff to Home through Safer Transitions Better Outcomes by Optimizing Safe Transitions (Pedi‐BOOST) toolkit specifically recommends an assessment of parental psychiatric issues.[18] Postpartum depression strongly correlates with impaired maternalchild bonding,[19] which in turn negatively affects mothers' engagement with healthcare providers.[20] This could impact patient education and recommendations provided during hospitalization.
Therefore, we sought to perform postpartum depression screening during infant hospitalizations. Our primary goal was to determine rate of postpartum depression in our population and proportion of women previously unscreened who could be captured by inpatient screening. We additionally aimed to determine the proportion of women with poor maternalinfant bond. Our next goal was to identify maternal or infant factors associated with positive postpartum depression screening. Finally, we performed follow‐up calls to determine if in‐hospital interventions resulted in formal postpartum depression diagnosis, use of recommended referrals, improved maternalchild bond, and decreased symptoms of depression over time.
METHODS
Patient Selection
We conducted a prospective observational study on a convenience sample of mothers at Children's Hospital Los Angeles (CHLA), a large, urban, tertiary care hospital. Biological mothers of infants 1 year of age admitted to medicalsurgical floors and assigned to pediatric hospitalist teams between April 1, 2013 and July 30, 2014 were eligible for inclusion. Mothers were required to be age 18 years or older and able to speak and read English or Spanish. Mothers of infants aged 2 weeks were excluded to avoid confusing postpartum depression with maternal baby blues, a distinct entity causing milder symptoms of depression that should resolve by 2 weeks.[21] In an effort to reduce the impact of stress associated with prolonged hospitalization on Edinburgh Postpartum Depression Scale (EPDS) scores, we excluded mothers of children already hospitalized >72 hours. Visits from participants who were readmitted or previously enrolled in the study were excluded. All study procedures were approved by the CHLA Institutional Review Board.
Measures
After giving informed consent, mothers completed demographic forms about themselves and their infants. A 4‐item Likert scale assessed self‐perceived support from family and friends. Past mental health problems were assessed via 10‐item checklist. Self‐reported infant comorbidities and reason for hospitalization were confirmed by chart review for International Classification of Diseases, Ninth Revision diagnoses present on admission and reason for discharge. Next, mothers filled out a maternalinfant bonding scale (MIB)[22] and the EPDS,[23, 24] which has been validated in both English and Spanish.[25] There are no formal cutoffs for the MIB; higher scores indicate worse bonding. Out of a possible 30, a score of 10 or higher on the EPDS was considered a positive screen, indicating risk for postpartum depression. Scores less than 10 were negative screens, and those mothers were determined not at risk.[24] The last EPDS question asks, The thought of harming myself has occurred to me. Any mothers answering yes, quite often, sometimes, or hardly ever were further interviewed and treated per a suicidality operating protocol.
Counseling and Referral
All EPDS mothers were informed of results and did not receive further intervention during hospitalization. For EPDS+ mothers, individual social workers responded to referrals placed by the study team into infant charts and delivered 1‐on‐1 counseling. Social workers received study education prior to initiation and midway through patient recruitment and provided mothers with an educational handout, referral sheet listing online resources of local mental health clinics accepting postpartum depression patients, and help‐line numbers. Mothers who identified a primary doctor were encouraged to follow up with them.
Follow‐up
In order to assess intervention effect over time, all mothers (both EPDS+ and EPDS) were called 3 and 6 months ( 1 week) postenrollment and rescreened with the EPDS and MIB. They also answered a short survey assessing whether they spoke further to a doctor about postpartum depression; used a referral resource; received a formal postpartum depression diagnosis; and if their children visited the ER, urgent care, or hospital again since discharge. Mothers who again screened EPDS+ or newly converted to EPDS+ were provided counseling and referral via phone.
Sample Size Calculation
A priori power analysis determined a sample size of 310 mothers was required to estimate the rate of postpartum depression at CHLA with 5% precision and a 95% confidence level, assuming an estimated prevalence of 27.9% based on prior studies.[26] At this prevalence rate, screening 310 mothers was also predicted to yield at least 77 positive screens on the EPDS, yielding an appropriate sample to detect EPDS score improvements over time. This number was based on previous studies showing reduction in EPDS of 35% following appropriate referral,[26, 27] assuming 15% attrition at both the 3‐month and 6‐month follow‐up sampling points.
Statistical Analysis
After data collection was complete, characteristics between EPDS+ and EPDS groups were compared using 2 tests for dichotomous outcomes and t tests for continuous variables. Multiple logistic regression was then used to compare specific factors associated with positive EPDS screens (P 0.05). Linear regression assessed the relationship between EPDS and MIB scores. Change in average EPDS and MIB scores at the time of first successful follow‐up call between women who did and did not seek further postpartum depression evaluation were compared via 2‐way repeated measures analysis of variance. Statistical analyses were performed using R software.[28]
RESULTS
Out of 366 motherinfant pairs, 56 (15%) refused, and 310 (85%) mothers were fully enrolled (Figure 1A). Mothers had an average age of 28.17 years, were 68.3% Hispanic/Latina by self‐report, and 45.2% were married. Infants were an average of 4.24 months old, 81.9% were born term (>37 weeks), and 64.8% were previously healthy (Table 1).
| Characteristic | All Participants, n = 310 |
|---|---|
| |
| Maternal characteristics | |
| Age, y* | 28.17 6.18 |
| Race/ethnicity | |
| White | 48 (15.5%) |
| Black | 25 (8.1%) |
| Hispanic | 211(68.3%) |
| Other | 25 (8.1%) |
| EPDS language | |
| English | 231 (74.5%) |
| Spanish | 79 (25.5%) |
| People in home | 5 (4, 6) |
| No. of children | 2 (1, 3) |
| Relationship | |
| Married | 140 (45.2%) |
| In a relationship | 105 (33.9%) |
| Single | 62 (20%) |
| Any breastfeeding | 142 (45.8%) |
| Unsupportive social network | 54 (17.4%) |
| Some psychiatric disorder | 47 (15.2%) |
| MIB score | 6 (3, 10) |
| Infant characteristics | |
| Age, mo* | 4.24 3.19 |
| Gestational age, wk | 39 (37, 40) |
| Prior admission | 113 (36.5%) |
| Any comorbidity | 109 (35.2%) |
| Congenital heart disease | 27 (8.7%) |
| Neurodevelopmental | 22 (7.1%) |
| Any medical device needed | 38 (12.3%) |

(B) Postenrollment change in mean Edinburgh Postpartum Depression Scale (EPDS) score of all initially EPDS mothers who completed at least 1 follow‐up phone call, separated by if they did or did not seek referral. Mothers using referral (either spoke with physician or used resource sheet) had significantly larger reduction in score. Statistical analysis by analysis of variance, P < 0.05.
Eighty‐seven (28%) mothers were EPDS+; 223 (72%) were EPDS. Only 42 mothers reported previous postpartum depression screening since the birth of their most recent child. However, 30 infants were 1 month in age, thus outside recommended screening range. Eliminating these infants revealed a 14.6% rate of appropriate prior screening. Higher EPDS scores were associated with higher (worse) MIB scores by linear regression ( = 0.11, P 0.001). The vast majority (77%) of mothers scored a 0 or 1 on the MIB scale, indicating good bonding; further statistical comparison using the MIB scale as a secondary outcome was therefore inappropriate.
On bivariate logistic regression, Hispanic/Latina women were less likely to be EPDS+ (odds ratio [OR]: 0.43; 95% CI: 0.23‐0.84) compared to white/Caucasian women. Mothers who identified Spanish as their primary language and took the Spanish EPDS had lower odds of a positive screen (OR: 0.47; 95% CI: 0.25‐0.88). The racial differences did not persist on multivariate analysis (OR: 0.64; 95% CI: 0.30‐1.38) (Table 2). Maternal characteristics identified as potential risk factors for positive screens were poor social support (OR: 3.58; 95% CI: 1.95‐6.59) and history of a prior psychiatric diagnosis (OR: 5.07; 95% CI: 2.65‐9.72). There were no differences in age, number of children or people living in the home, relationship status, or breastfeeding rates by EPDS score.
| OR | 95% CI | P Value | |
|---|---|---|---|
| |||
| Maternal characteristics | |||
| Maternal age | 0.99 | 0.95‐1.03 | 0.660 |
| Race | |||
| White | Reference | ||
| Black | 0.93 | 0.35‐2.50 | 0.891 |
| Hispanic | 0.43 | 0.23‐0.84 | 0.013 |
| Other | 0.54 | 0.19‐1.55 | 0.254 |
| EPDS language | 0.47 | 0.25‐0.88 | 0.020 |
| People in home | 1.02 | 0.89‐1.16 | 0.799 |
| No. of children | 1.02 | 0.85‐1.23 | 0.819 |
| Relationship | |||
| Married | Reference | ||
| In a relationship | 0.93 | 0.52‐1.65 | 0.802 |
| Single | 1.37 | 0.72‐2.62 | 0.333 |
| Unsupportive social network | 3.58 | 1.95‐6.59 | 0.0001 |
| Some psychiatric disorder | 5.07 | 2.65‐9.72 | 0.0001 |
| Infant characteristics | |||
| Gestational age | 0.96 | 0.87‐1.04 | 0.316 |
| Prior admission | 0.83 | 0.49‐1.39 | 0.476 |
| Any comorbidity | 1.03 | 0.92‐1.18 | 0.551 |
| Congenital heart disease | 1.87 | 0.83‐4.22 | 0.130 |
| Neurodevelopmental | 3.41 | 1.41‐8.21 | 0.006 |
| Any medical device needed | 1.59 | 0.78‐3.24 | 0.201 |
| Multivariate logistic regression | |||
| Race | |||
| White | Reference | ||
| Black | 0.87 | 0.28‐2.70 | 0.812 |
| Hispanic | 0.64 | 0.30‐1.38 | 0.258 |
| Other | 0.88 | 0.29‐2.74 | 0.831 |
| Unsupportive social network | 4.40 | 2.27‐8.53 | 0.0001 |
| Psychiatric disorder | 5.02 | 2.49‐10.15 | 0.0001 |
| Neurodevelopmental comorbidity | 2.78 | 1.03‐7.52 | 0.004 |
Infant characteristics were next examined. Children of EPDS+ and EPDS mothers were similar in age, number of prior hospital admissions, gestational age at birth, and overall use of medical equipment (Table 2). To examine the effect of illness leading to hospitalization on EPDS+ risk, discharge diagnoses were collected and grouped into categories. Infants of EPDS+ mothers were more likely hospitalized for neurologic illness (P = 0.008) (see Supporting Table 1 in the online version of this article), but otherwise similar.
We next compared differences in long‐term infant comorbidities. The rate of having any comorbidity was similar between children of EPDS+ and EPDS mothers (39.1% vs 33.6%; P = 0.551). However, children of EPDS+ mothers were more likely to have mental retardation, hydrocephalus, or require ventriculoperitoneal shunt (VPS); however, the overall number of infants with each comorbidity was low. A neurodevelopmental comorbidity variable was created combining mental retardation, cerebral palsy, epilepsy, hydrocephalus, craniosynostosis, and VPS, resulting in 22 (7.1%) unique infants with 1 or more of these conditions. Having an infant with a neurodevelopmental comorbidity was a risk factor for positive postpartum depression screen (OR: 3.41; 95% CI: 1.41‐8.21). This continued to be significant (OR: 2.78; 95% CI: 1.03‐7.52) (Table 2) when controlling for maternal race/ethnicity, psychiatric history, and social support in multivariate logistic regression.
To determine if women screened followed through with recommendations, participants were called 3 and 6 months postenrollment. We attempted to call all women and successfully reached 120; 19 (16%) refused the call. One hundred one of the original 310 enrolled (33%) completed at least 1 follow‐up call; 47 at 3 months, 40 at 6 months, and only 14 (14%) responded at both time points. Due to this response rate, the first call at either 3 or 6 months was used as a single follow‐up time point for statistical analysis. A slightly higher proportion of EPDS‐ mothers (80/223, 36%) completed calls compared to EPDS+ mothers (21/87, 24%; P = 0.047).
Of 21 mothers initially EPDS+ who completed a follow‐up call, 10 (48%) later screened negative. Seven of these 10 (70%) reported discussing postpartum depression with their physician or using provided referral resources in the interim; 1 woman both spoke to a doctor and used a referral resource. One additional woman used resources, but repeat EPDS was still positive (Table 3). Reasons cited for not seeking evaluation included too busy (n = 4) and lost paperwork (n = 1), or no reason was given (n = 2). Mothers utilizing appropriate follow‐up had reduction in scores compared to those not (F(1,19) = 5.743, P = 0.027), although all scores decreased over time (F(1,19) = 11.54, P = 0.0030) (Figure 1B).
| Changes in Characteristics Following Enrollment | Positive EPDS, N = 21 | Negative EPDS, N = 80 | P Value |
|---|---|---|---|
| |||
| Repeat EPDS negative | 10 (47.6%) | 73 (91.3%) | 0.001 |
| Spoke to a doctor about PD | 6 (28.6%) | 27 (33.7%) | 0.360 |
| Used a study referral resource | 3 (14.3%) | NA | |
| Received a formal diagnosis of PD | 1 (4.7%) | 1 (1.3%) | 0.325 |
| Healthcare utilization* | |||
| No. of ER visits | 0 (00.5) | 0 (02) | 0.074 |
| No. of urgent care visits | 0 (00.5) | 0 (00) | 0.136 |
| No. of hospitalizations | 0 (00) | 0 (01) | 0.021 |
| Repeat MIB score | 1.09 0.38 | 0.69 0.17 | 0.357 |
Of 80 women initially EPDS, most stayed negative (73/80, 91%), but 7 (9%) became EPDS+. These mothers received education and referral information over the phone, but none completed a subsequent call. Infants of mothers initially EPDS had a higher frequency of hospitalization postenrollment compared to EPDS+ mothers (P = 0.021) (Table 3). Two (33%) mothers who converted from EPDS to EPDS+ had infants readmitted in the follow‐up period.
DISCUSSION
This study demonstrated almost a third of mothers of hospitalized infants are at risk for postpartum depression and most had not been previously screened. Stress due to hospitalization did not seem to falsely elevate EPDS scores; the proportion of EPDS+ mothers matched our prestudy prediction (28% vs 27.9%). Follow‐up calls indicated that EPDS+ mothers not pursuing further evaluation tended to remain EPDS+. Higher (worse) MIB score was strongly correlated to increased EPDS score as expected, supporting screening accuracy. Our results suggest that postpartum depression screening in hospital settings can be used to complement outpatient practice and capture mothers who would otherwise be missed.
Although we were able to screen, it is difficult to know whether this correctly identified mothers with postpartum depression. Only 2 mothers reported subsequent official diagnosis of postpartum depression, and 1 of these was EPDS originally. This reflects weakness of our survey‐based design; we only know if the mother self‐reported a formal diagnosis of postpartum depression, because we do not have access to their medical charts. We also had higher than expected loss to follow up (67%), leaving 66 initially EPDS+ mothers with unknown eventual diagnoses. The EPDS has been validated in multiple populations and has a positive predictive value ranging from 23% to 93%.[23] Therefore, somewhere between 20 and 80 women in our study should meet diagnostic criteria for postpartum depression. A limitation of children's hospital‐based screening with the EPDS is lack of adult‐trained psychiatrists who could immediately follow screening with diagnosis. Such integration may already be possible at community or hospital‐within‐a‐hospital models, and could be trialed at children's hospitals. Regardless, participation in the study seemed to increase mothers' awareness of postpartum depression. Prior to enrollment, only 14.6% of subjects reported discussing postpartum depression with a physician, although recall bias likely contributed to some mothers not remembering a screen. Promisingly, on follow‐up, 37% of called participants reported they discussed postpartum depression with a doctor following their child's hospital discharge.
Our study identified low social support and history of past psychiatric diagnosis as maternal risk factors for EPDS+ screens, which is consistent with previous reports.[29] There was a slight increase in subsequent infant hospitalizations in the EPDS group, which is contrary to reports stating that increased healthcare utilization is associated with postpartum depression.[30] However, most studies have shown an increase in only acute or emergency room care visits[30, 31] and no association between maternal depression and infant hospitalization.[30, 32] In our study, the median number of hospitalizations for both groups was 0, indicating overall low utilization. Because 2 of the mothers who converted from EPDS to EPDS+ had children readmitted, this underscores the benefit of reassessment at each medical encounter. A large proportion of mothers (36.5%) reported that the infant had been previously hospitalized, adding another potential missed screening opportunity. Our study supports others advocating repeated screenings and suggests mothers should be screened at any medical encounter that occurs in the first postpartum year.
We identified neurodevelopmental illness as the major infant characteristic associated with postpartum depression risk. Conversely, Garfield et al. did not find correlation between poorer Neurobiologic Risk Score and increased maternal depression risk in a NICU setting.[11] Perhaps our population of older and mainly full‐term infants makes consequences of neurologic insult more obvious and affects mothers more significantly. Cheng et al. reported that 26.9% of mothers of children with cognitive delay reported high depressive symptoms, compared with 17.4% of mothers of typically developing children at 4 years of age.[33] Another body of evidence suggests maternal emotional state during pregnancy influences neurodevelopmental outcome in the child. Maternal anxiety or depression has been associated with altered placental function, reduced infant gray matter density, and worse cognitive function.[34, 35] Therefore, future research may focus on mothers of infants with neurodevelopmental disease to better understand this relationship.
There were several limitations to this study. Some data collected by a survey are subject to information bias. Women may report a more supportive social network than actually exists or omit history of mental health diagnoses. We attempted to control for this by using validated measures where possible and performing chart review to verify reported infant characteristics. Our population was overwhelmingly Hispanic/Latina, and a third of infants were not previously healthy, which limits applicability to other settings. We used a convenience method that could introduce sampling bias. Our hospital's overall patient demographic is 65% Hispanic, which is similar to the 68% sampled in our study. In addition, the proportions of infant diagnoses approximate the overall rates at CHLA, so we feel our sample was fairly representative. There is a general consensus that depression studies have recruitment difficulties.[36] In the unlikely event that all 56 of women who declined to participate were EPDS+, overall proportion of at‐risk mothers would rise to 39%. If our study does show slight underestimation of risk, that would only mean more potential for intervention if screening were mandatory. Another weakness was high loss to follow‐up, which led us to combine the 3‐ and 6‐month follow‐up calls into 1 outcome. Sixty percent of calls used in analysis occurred at 3 months, so long‐term maintenance of improved EPDS scores remains unclear. Although conducting repeat EPDS via phone may affect honest answering of sensitive questions, other studies have used this technique successfully.[4]
CONCLUSION
This is the first study evaluating a screening program for maternal postpartum depression during infant hospitalizations. In our population, risk factors for positive postpartum depression screening were low social support, history of maternal psychiatric diagnosis, and having an infant with neurodevelopmental disease. We believe mothers should receive postpartum depression screening at all medical encounters during the child's first year.
Acknowledgements
The authors thank the CHLA Department of Social Work and the USC Required Scholarly Projects program, and specifically Joseph DeSena and Humberto Avila, for project assistance.
Disclosures: Dr. Trost is an Institutional Career Development Program Scholar through the Southern California Clinical and Translational Science Institute (SC‐CTSI) at the University of Southern California Keck School of Medicine. The content is solely the responsibility of the author(s) and does not represent the official view of the SC‐CTSI. Dr. Trost conceptualized and designed the study, drafted the initial manuscript, and approved the final manuscript as submitted. Dr. Molas‐Torreblanca co‐designed the study, reviewed and revised the manuscript, and approved the final manuscript as submitted. Ms. Man coordinated and supervised hospital data collection, critically reviewed the manuscript, and approved the final manuscript as submitted. Mr. Casillas coordinated and supervised the phone call data collection, critically reviewed the manuscript, and approved the final manuscript as submitted. Ms. Sapir coordinated the referral process for enrolled patients, supervised the design of patient handouts, and critically reviewed and approved the final manuscript as submitted. Dr. Schrager guided study design, supervised the statistical analysis of the final data, critically reviewed and revised the manuscript, and approved the final manuscript as submitted. The authors report no conflicts of interest.
- , , , , . Maternal depressive symptoms and infant health practices among low‐income women. Pediatrics. 2004;113(6):e523–e529.
- , , , et al.; Duke University Evidence‐based Practice Center. Effective Health Care Program. Efficacy and safety of screening for postpartum depression. Comparative effectiveness review number 106. Rockville, MD: Agency for Healthcare Research and Quality, U.S. Department of Health and Human Services; 2013: Available at: https://www.effectivehealthcare.ahrq.gov/ehc/products/379/1437/postpartum‐screening‐report‐130409.pdf. Date accessed Jan 10 2016.
- , , , , . Prevalence rates and demographic characteristics associated with depression in pregnancy and the postpartum. J Consult Clin Psychol. 1989;57(2):269–274.
- , , , , . Screening for depression in the postpartum period: a comparison of three instruments. J Womens Health (Larchmt). 2008;17(4):585–596.
- , , , . Are maternal depression or symptom severity associated with breastfeeding intention or outcomes? J Clin Psychiatry. 2010;71(8):1069–1078.
- , , , , . Impact of maternal depressive symptoms on growth of preschool‐ and school‐aged children. Pediatrics. 2012;130(4):e847–e855.
- , , , , . The timing of maternal depressive symptoms and mothers' parenting practices with young children: implications for pediatric practice. Pediatrics. 2006;118(1):e174–e182.
- , , , , . Improvements in maternal depression as a mediator of intervention effects on early childhood problem behavior. Dev Psychopathol. 2009;21(2):417–439.
- ; Committee on Psychosocial Aspects of Child and Family Health American Academy of Pediatrics. Incorporating recognition and management of perinatal and postpartum depression into pediatric practice. Pediatrics. 2010;126(5):1032–1039.
- , , . Screening for postpartum depression in a pediatric emergency department. Pediatr Emerg Care. 2011;27(9):795–800.
- , , , et al. Risk factors for postpartum depressive symptoms in low‐income women with very low‐birth‐weight infants. Adv Neonatal Care. 2015;15(1):E3–E8.
- , , . Impact of infant health problems on postnatal depression: pilot study to evaluate a health visiting system. Psychiatry Clin Neurosci. 2006;60(2):182–189.
- , , , , , . Primary care pediatricians' roles and perceived responsibilities in the identification and management of maternal depression. Pediatrics. 2002;110(6):1169–1176.
- , , , et al. Does education influence pediatricians' perceptions of physician‐specific barriers for maternal depression? Clin Pediatr (Phila). 2008;47(7):670–678.
- , , , . Pediatricians' views of postpartum depression: a self‐administered survey. Arch Womens Ment Health. 2004;7(4):231–236.
- . Compliance with well‐child visit recommendations: evidence from the Medical Expenditure Panel Survey, 2000–2002. Pediatrics. 2006;118(6):e1766–e1778.
- , , , et al. A framework of pediatric hospital discharge care informed by legislation, research, and practice. JAMA Pediatr. 2014;168(10):955–962; quiz 965–966.
- , , . Pedi‐BOOST. Peds Effective Discharge: Better Handoff to Home through Safer Transitions. 2013. https://www.hospitalmedicine.org/Web/Quality___Innovation/Implementation_Toolkit/pediBoost/Best_Practices/Best_Practices.aspx Accessed Jan 10 2016.
- , , , et al. Effects of maternal depressive symptomatology during pregnancy and the postpartum period on infant‐mother attachment. Psychiatry Clin Neurosci. 2014;68(8):631–639.
- , , , , . Examining maternal depression and attachment insecurity as moderators of the impacts of home visiting for at‐risk mothers and infants. J Consult Clin Psychol. 2009;77(4):788–799.
- , . Postpartum mood disorders: diagnosis and treatment guidelines. J Clin Psychiatry. 1998;59(suppl 2):34–40.
- , , , , . A new Mother‐to‐Infant Bonding Scale: links with early maternal mood. Arch Womens Ment Health. 2005;8(1):45–51.
- , , , , . A systematic review of studies validating the Edinburgh Postnatal Depression Scale in antepartum and postpartum women. Acta Psychiatr Scand. 2009;119(5):350–364.
- , , . Detection of postnatal depression. Development of the 10‐item Edinburgh Postnatal Depression Scale. Br J Psychiatry. 1987;150:782–786.
- , , , . Validation of the Edinburgh Postnatal Depression Scale (EPDS) in Spanish mothers. J Affect Disord. 2003;75(1):71–76.
- , , , et al. TRIPPD: a practice‐based network effectiveness study of postpartum depression screening and management. Ann Fam Med. 2012;10(4):320–329.
- , , , , . Detection of postpartum depressive symptoms by screening at well‐child visits. Pediatrics. 2004;113(3 pt 1):551–558.
- R Core Team. R: A language and environment for statistical computing. Vienna, Austria: R Foundation for Statistical Computing: 2013. Available at: http://www.R‐project.org. Accessed Jan 10 2016.
- , , , , . Biological and psychosocial predictors of postpartum depression: systematic review and call for integration. Annu Rev Clin Psychol. 2015;11:99–137.
- , , , et al. Maternal depressive symptoms and children's receipt of health care in the first 3 years of life. Pediatrics. 2005;115(2):306–314.
- , . Maternal factors and child's health care use. Soc Sci Med. 1995;40(5):623–628.
- , , , , . Women's health after pregnancy and child outcomes at age 3 years: a prospective cohort study. Am J Public Health. 2002;92(8):1312–1318.
- , , , . The influence of children's cognitive delay and behavior problems on maternal depression. J Pediatr. 2015;167(3):679–686.
- , , , , . Maternal prenatal symptoms of depression and down regulation of placental monoamine oxidase A expression. J Psychosom Res. 2013;75(4):341–345.
- , , , , . High pregnancy anxiety during mid‐gestation is associated with decreased gray matter density in 6–9‐year‐old children. Psychoneuroendocrinology. 2010;35(1):141–153.
- , , , , . Factors affecting recruitment into depression trials: Systematic review, meta‐synthesis and conceptual framework. J Affect Disord. 2015;172:274–290.
Maternal postpartum depression occurs in 5% to 25% of all mothers, and up to 40% to 60% in high‐risk populations such as low‐income women.[1, 2, 3, 4] Children of affected mothers suffer negative health consequences such as decreased physical growth, poor maternalchild bond, problem behavior, and child abuse.[5, 6, 7] Timely recognition of symptoms and treatment may improve child outcomes.[8] Published guidelines recommend pediatricians screen for postpartum depression at infant 1‐, 2‐, 4‐, and 6‐month outpatient visits.[9] There are no current guidelines for or studies of screening in general inpatient settings, although emergency rooms[10] and neonatal intensive care units (NICUs)[11] have been examined. Pediatric hospitalization may offer an additional opportunity for expanding screening and intervention.
Augmenting outpatient screening practices with additional inpatient screening would have several benefits. Infant health problems have been associated with postpartum depression, and therefore mothers in the hospital may be at higher risk.[12] Inpatient screening would also improve access to mothers not screened as outpatients. Missed screening could occur due to physician discomfort with screening, time constraints during busy office visits, or noncompliance with recommended visit schedules.[13, 14, 15, 16] Finally, inpatient providers would benefit from understanding the psychosocial milieu of children now under their care. Recent studies note hospital discharges may be improved and readmissions reduced by assessing socioeconomic risk factors during hospitalization.[17] The evidence‐based Peds Effective Discharge: Better Handoff to Home through Safer Transitions Better Outcomes by Optimizing Safe Transitions (Pedi‐BOOST) toolkit specifically recommends an assessment of parental psychiatric issues.[18] Postpartum depression strongly correlates with impaired maternalchild bonding,[19] which in turn negatively affects mothers' engagement with healthcare providers.[20] This could impact patient education and recommendations provided during hospitalization.
Therefore, we sought to perform postpartum depression screening during infant hospitalizations. Our primary goal was to determine rate of postpartum depression in our population and proportion of women previously unscreened who could be captured by inpatient screening. We additionally aimed to determine the proportion of women with poor maternalinfant bond. Our next goal was to identify maternal or infant factors associated with positive postpartum depression screening. Finally, we performed follow‐up calls to determine if in‐hospital interventions resulted in formal postpartum depression diagnosis, use of recommended referrals, improved maternalchild bond, and decreased symptoms of depression over time.
METHODS
Patient Selection
We conducted a prospective observational study on a convenience sample of mothers at Children's Hospital Los Angeles (CHLA), a large, urban, tertiary care hospital. Biological mothers of infants 1 year of age admitted to medicalsurgical floors and assigned to pediatric hospitalist teams between April 1, 2013 and July 30, 2014 were eligible for inclusion. Mothers were required to be age 18 years or older and able to speak and read English or Spanish. Mothers of infants aged 2 weeks were excluded to avoid confusing postpartum depression with maternal baby blues, a distinct entity causing milder symptoms of depression that should resolve by 2 weeks.[21] In an effort to reduce the impact of stress associated with prolonged hospitalization on Edinburgh Postpartum Depression Scale (EPDS) scores, we excluded mothers of children already hospitalized >72 hours. Visits from participants who were readmitted or previously enrolled in the study were excluded. All study procedures were approved by the CHLA Institutional Review Board.
Measures
After giving informed consent, mothers completed demographic forms about themselves and their infants. A 4‐item Likert scale assessed self‐perceived support from family and friends. Past mental health problems were assessed via 10‐item checklist. Self‐reported infant comorbidities and reason for hospitalization were confirmed by chart review for International Classification of Diseases, Ninth Revision diagnoses present on admission and reason for discharge. Next, mothers filled out a maternalinfant bonding scale (MIB)[22] and the EPDS,[23, 24] which has been validated in both English and Spanish.[25] There are no formal cutoffs for the MIB; higher scores indicate worse bonding. Out of a possible 30, a score of 10 or higher on the EPDS was considered a positive screen, indicating risk for postpartum depression. Scores less than 10 were negative screens, and those mothers were determined not at risk.[24] The last EPDS question asks, The thought of harming myself has occurred to me. Any mothers answering yes, quite often, sometimes, or hardly ever were further interviewed and treated per a suicidality operating protocol.
Counseling and Referral
All EPDS mothers were informed of results and did not receive further intervention during hospitalization. For EPDS+ mothers, individual social workers responded to referrals placed by the study team into infant charts and delivered 1‐on‐1 counseling. Social workers received study education prior to initiation and midway through patient recruitment and provided mothers with an educational handout, referral sheet listing online resources of local mental health clinics accepting postpartum depression patients, and help‐line numbers. Mothers who identified a primary doctor were encouraged to follow up with them.
Follow‐up
In order to assess intervention effect over time, all mothers (both EPDS+ and EPDS) were called 3 and 6 months ( 1 week) postenrollment and rescreened with the EPDS and MIB. They also answered a short survey assessing whether they spoke further to a doctor about postpartum depression; used a referral resource; received a formal postpartum depression diagnosis; and if their children visited the ER, urgent care, or hospital again since discharge. Mothers who again screened EPDS+ or newly converted to EPDS+ were provided counseling and referral via phone.
Sample Size Calculation
A priori power analysis determined a sample size of 310 mothers was required to estimate the rate of postpartum depression at CHLA with 5% precision and a 95% confidence level, assuming an estimated prevalence of 27.9% based on prior studies.[26] At this prevalence rate, screening 310 mothers was also predicted to yield at least 77 positive screens on the EPDS, yielding an appropriate sample to detect EPDS score improvements over time. This number was based on previous studies showing reduction in EPDS of 35% following appropriate referral,[26, 27] assuming 15% attrition at both the 3‐month and 6‐month follow‐up sampling points.
Statistical Analysis
After data collection was complete, characteristics between EPDS+ and EPDS groups were compared using 2 tests for dichotomous outcomes and t tests for continuous variables. Multiple logistic regression was then used to compare specific factors associated with positive EPDS screens (P 0.05). Linear regression assessed the relationship between EPDS and MIB scores. Change in average EPDS and MIB scores at the time of first successful follow‐up call between women who did and did not seek further postpartum depression evaluation were compared via 2‐way repeated measures analysis of variance. Statistical analyses were performed using R software.[28]
RESULTS
Out of 366 motherinfant pairs, 56 (15%) refused, and 310 (85%) mothers were fully enrolled (Figure 1A). Mothers had an average age of 28.17 years, were 68.3% Hispanic/Latina by self‐report, and 45.2% were married. Infants were an average of 4.24 months old, 81.9% were born term (>37 weeks), and 64.8% were previously healthy (Table 1).
| Characteristic | All Participants, n = 310 |
|---|---|
| |
| Maternal characteristics | |
| Age, y* | 28.17 6.18 |
| Race/ethnicity | |
| White | 48 (15.5%) |
| Black | 25 (8.1%) |
| Hispanic | 211(68.3%) |
| Other | 25 (8.1%) |
| EPDS language | |
| English | 231 (74.5%) |
| Spanish | 79 (25.5%) |
| People in home | 5 (4, 6) |
| No. of children | 2 (1, 3) |
| Relationship | |
| Married | 140 (45.2%) |
| In a relationship | 105 (33.9%) |
| Single | 62 (20%) |
| Any breastfeeding | 142 (45.8%) |
| Unsupportive social network | 54 (17.4%) |
| Some psychiatric disorder | 47 (15.2%) |
| MIB score | 6 (3, 10) |
| Infant characteristics | |
| Age, mo* | 4.24 3.19 |
| Gestational age, wk | 39 (37, 40) |
| Prior admission | 113 (36.5%) |
| Any comorbidity | 109 (35.2%) |
| Congenital heart disease | 27 (8.7%) |
| Neurodevelopmental | 22 (7.1%) |
| Any medical device needed | 38 (12.3%) |
(B) Postenrollment change in mean Edinburgh Postpartum Depression Scale (EPDS) score of all initially EPDS mothers who completed at least 1 follow‐up phone call, separated by if they did or did not seek referral. Mothers using referral (either spoke with physician or used resource sheet) had significantly larger reduction in score. Statistical analysis by analysis of variance, P < 0.05.
Eighty‐seven (28%) mothers were EPDS+; 223 (72%) were EPDS. Only 42 mothers reported previous postpartum depression screening since the birth of their most recent child. However, 30 infants were 1 month in age, thus outside recommended screening range. Eliminating these infants revealed a 14.6% rate of appropriate prior screening. Higher EPDS scores were associated with higher (worse) MIB scores by linear regression ( = 0.11, P 0.001). The vast majority (77%) of mothers scored a 0 or 1 on the MIB scale, indicating good bonding; further statistical comparison using the MIB scale as a secondary outcome was therefore inappropriate.
On bivariate logistic regression, Hispanic/Latina women were less likely to be EPDS+ (odds ratio [OR]: 0.43; 95% CI: 0.23‐0.84) compared to white/Caucasian women. Mothers who identified Spanish as their primary language and took the Spanish EPDS had lower odds of a positive screen (OR: 0.47; 95% CI: 0.25‐0.88). The racial differences did not persist on multivariate analysis (OR: 0.64; 95% CI: 0.30‐1.38) (Table 2). Maternal characteristics identified as potential risk factors for positive screens were poor social support (OR: 3.58; 95% CI: 1.95‐6.59) and history of a prior psychiatric diagnosis (OR: 5.07; 95% CI: 2.65‐9.72). There were no differences in age, number of children or people living in the home, relationship status, or breastfeeding rates by EPDS score.
| OR | 95% CI | P Value | |
|---|---|---|---|
| |||
| Maternal characteristics | |||
| Maternal age | 0.99 | 0.95‐1.03 | 0.660 |
| Race | |||
| White | Reference | ||
| Black | 0.93 | 0.35‐2.50 | 0.891 |
| Hispanic | 0.43 | 0.23‐0.84 | 0.013 |
| Other | 0.54 | 0.19‐1.55 | 0.254 |
| EPDS language | 0.47 | 0.25‐0.88 | 0.020 |
| People in home | 1.02 | 0.89‐1.16 | 0.799 |
| No. of children | 1.02 | 0.85‐1.23 | 0.819 |
| Relationship | |||
| Married | Reference | ||
| In a relationship | 0.93 | 0.52‐1.65 | 0.802 |
| Single | 1.37 | 0.72‐2.62 | 0.333 |
| Unsupportive social network | 3.58 | 1.95‐6.59 | 0.0001 |
| Some psychiatric disorder | 5.07 | 2.65‐9.72 | 0.0001 |
| Infant characteristics | |||
| Gestational age | 0.96 | 0.87‐1.04 | 0.316 |
| Prior admission | 0.83 | 0.49‐1.39 | 0.476 |
| Any comorbidity | 1.03 | 0.92‐1.18 | 0.551 |
| Congenital heart disease | 1.87 | 0.83‐4.22 | 0.130 |
| Neurodevelopmental | 3.41 | 1.41‐8.21 | 0.006 |
| Any medical device needed | 1.59 | 0.78‐3.24 | 0.201 |
| Multivariate logistic regression | |||
| Race | |||
| White | Reference | ||
| Black | 0.87 | 0.28‐2.70 | 0.812 |
| Hispanic | 0.64 | 0.30‐1.38 | 0.258 |
| Other | 0.88 | 0.29‐2.74 | 0.831 |
| Unsupportive social network | 4.40 | 2.27‐8.53 | 0.0001 |
| Psychiatric disorder | 5.02 | 2.49‐10.15 | 0.0001 |
| Neurodevelopmental comorbidity | 2.78 | 1.03‐7.52 | 0.004 |
Infant characteristics were next examined. Children of EPDS+ and EPDS mothers were similar in age, number of prior hospital admissions, gestational age at birth, and overall use of medical equipment (Table 2). To examine the effect of illness leading to hospitalization on EPDS+ risk, discharge diagnoses were collected and grouped into categories. Infants of EPDS+ mothers were more likely hospitalized for neurologic illness (P = 0.008) (see Supporting Table 1 in the online version of this article), but otherwise similar.
We next compared differences in long‐term infant comorbidities. The rate of having any comorbidity was similar between children of EPDS+ and EPDS mothers (39.1% vs 33.6%; P = 0.551). However, children of EPDS+ mothers were more likely to have mental retardation, hydrocephalus, or require ventriculoperitoneal shunt (VPS); however, the overall number of infants with each comorbidity was low. A neurodevelopmental comorbidity variable was created combining mental retardation, cerebral palsy, epilepsy, hydrocephalus, craniosynostosis, and VPS, resulting in 22 (7.1%) unique infants with 1 or more of these conditions. Having an infant with a neurodevelopmental comorbidity was a risk factor for positive postpartum depression screen (OR: 3.41; 95% CI: 1.41‐8.21). This continued to be significant (OR: 2.78; 95% CI: 1.03‐7.52) (Table 2) when controlling for maternal race/ethnicity, psychiatric history, and social support in multivariate logistic regression.
To determine if women screened followed through with recommendations, participants were called 3 and 6 months postenrollment. We attempted to call all women and successfully reached 120; 19 (16%) refused the call. One hundred one of the original 310 enrolled (33%) completed at least 1 follow‐up call; 47 at 3 months, 40 at 6 months, and only 14 (14%) responded at both time points. Due to this response rate, the first call at either 3 or 6 months was used as a single follow‐up time point for statistical analysis. A slightly higher proportion of EPDS‐ mothers (80/223, 36%) completed calls compared to EPDS+ mothers (21/87, 24%; P = 0.047).
Of 21 mothers initially EPDS+ who completed a follow‐up call, 10 (48%) later screened negative. Seven of these 10 (70%) reported discussing postpartum depression with their physician or using provided referral resources in the interim; 1 woman both spoke to a doctor and used a referral resource. One additional woman used resources, but repeat EPDS was still positive (Table 3). Reasons cited for not seeking evaluation included too busy (n = 4) and lost paperwork (n = 1), or no reason was given (n = 2). Mothers utilizing appropriate follow‐up had reduction in scores compared to those not (F(1,19) = 5.743, P = 0.027), although all scores decreased over time (F(1,19) = 11.54, P = 0.0030) (Figure 1B).
| Changes in Characteristics Following Enrollment | Positive EPDS, N = 21 | Negative EPDS, N = 80 | P Value |
|---|---|---|---|
| |||
| Repeat EPDS negative | 10 (47.6%) | 73 (91.3%) | 0.001 |
| Spoke to a doctor about PD | 6 (28.6%) | 27 (33.7%) | 0.360 |
| Used a study referral resource | 3 (14.3%) | NA | |
| Received a formal diagnosis of PD | 1 (4.7%) | 1 (1.3%) | 0.325 |
| Healthcare utilization* | |||
| No. of ER visits | 0 (00.5) | 0 (02) | 0.074 |
| No. of urgent care visits | 0 (00.5) | 0 (00) | 0.136 |
| No. of hospitalizations | 0 (00) | 0 (01) | 0.021 |
| Repeat MIB score | 1.09 0.38 | 0.69 0.17 | 0.357 |
Of 80 women initially EPDS, most stayed negative (73/80, 91%), but 7 (9%) became EPDS+. These mothers received education and referral information over the phone, but none completed a subsequent call. Infants of mothers initially EPDS had a higher frequency of hospitalization postenrollment compared to EPDS+ mothers (P = 0.021) (Table 3). Two (33%) mothers who converted from EPDS to EPDS+ had infants readmitted in the follow‐up period.
DISCUSSION
This study demonstrated almost a third of mothers of hospitalized infants are at risk for postpartum depression and most had not been previously screened. Stress due to hospitalization did not seem to falsely elevate EPDS scores; the proportion of EPDS+ mothers matched our prestudy prediction (28% vs 27.9%). Follow‐up calls indicated that EPDS+ mothers not pursuing further evaluation tended to remain EPDS+. Higher (worse) MIB score was strongly correlated to increased EPDS score as expected, supporting screening accuracy. Our results suggest that postpartum depression screening in hospital settings can be used to complement outpatient practice and capture mothers who would otherwise be missed.
Although we were able to screen, it is difficult to know whether this correctly identified mothers with postpartum depression. Only 2 mothers reported subsequent official diagnosis of postpartum depression, and 1 of these was EPDS originally. This reflects weakness of our survey‐based design; we only know if the mother self‐reported a formal diagnosis of postpartum depression, because we do not have access to their medical charts. We also had higher than expected loss to follow up (67%), leaving 66 initially EPDS+ mothers with unknown eventual diagnoses. The EPDS has been validated in multiple populations and has a positive predictive value ranging from 23% to 93%.[23] Therefore, somewhere between 20 and 80 women in our study should meet diagnostic criteria for postpartum depression. A limitation of children's hospital‐based screening with the EPDS is lack of adult‐trained psychiatrists who could immediately follow screening with diagnosis. Such integration may already be possible at community or hospital‐within‐a‐hospital models, and could be trialed at children's hospitals. Regardless, participation in the study seemed to increase mothers' awareness of postpartum depression. Prior to enrollment, only 14.6% of subjects reported discussing postpartum depression with a physician, although recall bias likely contributed to some mothers not remembering a screen. Promisingly, on follow‐up, 37% of called participants reported they discussed postpartum depression with a doctor following their child's hospital discharge.
Our study identified low social support and history of past psychiatric diagnosis as maternal risk factors for EPDS+ screens, which is consistent with previous reports.[29] There was a slight increase in subsequent infant hospitalizations in the EPDS group, which is contrary to reports stating that increased healthcare utilization is associated with postpartum depression.[30] However, most studies have shown an increase in only acute or emergency room care visits[30, 31] and no association between maternal depression and infant hospitalization.[30, 32] In our study, the median number of hospitalizations for both groups was 0, indicating overall low utilization. Because 2 of the mothers who converted from EPDS to EPDS+ had children readmitted, this underscores the benefit of reassessment at each medical encounter. A large proportion of mothers (36.5%) reported that the infant had been previously hospitalized, adding another potential missed screening opportunity. Our study supports others advocating repeated screenings and suggests mothers should be screened at any medical encounter that occurs in the first postpartum year.
We identified neurodevelopmental illness as the major infant characteristic associated with postpartum depression risk. Conversely, Garfield et al. did not find correlation between poorer Neurobiologic Risk Score and increased maternal depression risk in a NICU setting.[11] Perhaps our population of older and mainly full‐term infants makes consequences of neurologic insult more obvious and affects mothers more significantly. Cheng et al. reported that 26.9% of mothers of children with cognitive delay reported high depressive symptoms, compared with 17.4% of mothers of typically developing children at 4 years of age.[33] Another body of evidence suggests maternal emotional state during pregnancy influences neurodevelopmental outcome in the child. Maternal anxiety or depression has been associated with altered placental function, reduced infant gray matter density, and worse cognitive function.[34, 35] Therefore, future research may focus on mothers of infants with neurodevelopmental disease to better understand this relationship.
There were several limitations to this study. Some data collected by a survey are subject to information bias. Women may report a more supportive social network than actually exists or omit history of mental health diagnoses. We attempted to control for this by using validated measures where possible and performing chart review to verify reported infant characteristics. Our population was overwhelmingly Hispanic/Latina, and a third of infants were not previously healthy, which limits applicability to other settings. We used a convenience method that could introduce sampling bias. Our hospital's overall patient demographic is 65% Hispanic, which is similar to the 68% sampled in our study. In addition, the proportions of infant diagnoses approximate the overall rates at CHLA, so we feel our sample was fairly representative. There is a general consensus that depression studies have recruitment difficulties.[36] In the unlikely event that all 56 of women who declined to participate were EPDS+, overall proportion of at‐risk mothers would rise to 39%. If our study does show slight underestimation of risk, that would only mean more potential for intervention if screening were mandatory. Another weakness was high loss to follow‐up, which led us to combine the 3‐ and 6‐month follow‐up calls into 1 outcome. Sixty percent of calls used in analysis occurred at 3 months, so long‐term maintenance of improved EPDS scores remains unclear. Although conducting repeat EPDS via phone may affect honest answering of sensitive questions, other studies have used this technique successfully.[4]
CONCLUSION
This is the first study evaluating a screening program for maternal postpartum depression during infant hospitalizations. In our population, risk factors for positive postpartum depression screening were low social support, history of maternal psychiatric diagnosis, and having an infant with neurodevelopmental disease. We believe mothers should receive postpartum depression screening at all medical encounters during the child's first year.
Acknowledgements
The authors thank the CHLA Department of Social Work and the USC Required Scholarly Projects program, and specifically Joseph DeSena and Humberto Avila, for project assistance.
Disclosures: Dr. Trost is an Institutional Career Development Program Scholar through the Southern California Clinical and Translational Science Institute (SC‐CTSI) at the University of Southern California Keck School of Medicine. The content is solely the responsibility of the author(s) and does not represent the official view of the SC‐CTSI. Dr. Trost conceptualized and designed the study, drafted the initial manuscript, and approved the final manuscript as submitted. Dr. Molas‐Torreblanca co‐designed the study, reviewed and revised the manuscript, and approved the final manuscript as submitted. Ms. Man coordinated and supervised hospital data collection, critically reviewed the manuscript, and approved the final manuscript as submitted. Mr. Casillas coordinated and supervised the phone call data collection, critically reviewed the manuscript, and approved the final manuscript as submitted. Ms. Sapir coordinated the referral process for enrolled patients, supervised the design of patient handouts, and critically reviewed and approved the final manuscript as submitted. Dr. Schrager guided study design, supervised the statistical analysis of the final data, critically reviewed and revised the manuscript, and approved the final manuscript as submitted. The authors report no conflicts of interest.
- , , , , . Maternal depressive symptoms and infant health practices among low‐income women. Pediatrics. 2004;113(6):e523–e529.
- , , , et al.; Duke University Evidence‐based Practice Center. Effective Health Care Program. Efficacy and safety of screening for postpartum depression. Comparative effectiveness review number 106. Rockville, MD: Agency for Healthcare Research and Quality, U.S. Department of Health and Human Services; 2013: Available at: https://www.effectivehealthcare.ahrq.gov/ehc/products/379/1437/postpartum‐screening‐report‐130409.pdf. Date accessed Jan 10 2016.
- , , , , . Prevalence rates and demographic characteristics associated with depression in pregnancy and the postpartum. J Consult Clin Psychol. 1989;57(2):269–274.
- , , , , . Screening for depression in the postpartum period: a comparison of three instruments. J Womens Health (Larchmt). 2008;17(4):585–596.
- , , , . Are maternal depression or symptom severity associated with breastfeeding intention or outcomes? J Clin Psychiatry. 2010;71(8):1069–1078.
- , , , , . Impact of maternal depressive symptoms on growth of preschool‐ and school‐aged children. Pediatrics. 2012;130(4):e847–e855.
- , , , , . The timing of maternal depressive symptoms and mothers' parenting practices with young children: implications for pediatric practice. Pediatrics. 2006;118(1):e174–e182.
- , , , , . Improvements in maternal depression as a mediator of intervention effects on early childhood problem behavior. Dev Psychopathol. 2009;21(2):417–439.
- ; Committee on Psychosocial Aspects of Child and Family Health American Academy of Pediatrics. Incorporating recognition and management of perinatal and postpartum depression into pediatric practice. Pediatrics. 2010;126(5):1032–1039.
- , , . Screening for postpartum depression in a pediatric emergency department. Pediatr Emerg Care. 2011;27(9):795–800.
- , , , et al. Risk factors for postpartum depressive symptoms in low‐income women with very low‐birth‐weight infants. Adv Neonatal Care. 2015;15(1):E3–E8.
- , , . Impact of infant health problems on postnatal depression: pilot study to evaluate a health visiting system. Psychiatry Clin Neurosci. 2006;60(2):182–189.
- , , , , , . Primary care pediatricians' roles and perceived responsibilities in the identification and management of maternal depression. Pediatrics. 2002;110(6):1169–1176.
- , , , et al. Does education influence pediatricians' perceptions of physician‐specific barriers for maternal depression? Clin Pediatr (Phila). 2008;47(7):670–678.
- , , , . Pediatricians' views of postpartum depression: a self‐administered survey. Arch Womens Ment Health. 2004;7(4):231–236.
- . Compliance with well‐child visit recommendations: evidence from the Medical Expenditure Panel Survey, 2000–2002. Pediatrics. 2006;118(6):e1766–e1778.
- , , , et al. A framework of pediatric hospital discharge care informed by legislation, research, and practice. JAMA Pediatr. 2014;168(10):955–962; quiz 965–966.
- , , . Pedi‐BOOST. Peds Effective Discharge: Better Handoff to Home through Safer Transitions. 2013. https://www.hospitalmedicine.org/Web/Quality___Innovation/Implementation_Toolkit/pediBoost/Best_Practices/Best_Practices.aspx Accessed Jan 10 2016.
- , , , et al. Effects of maternal depressive symptomatology during pregnancy and the postpartum period on infant‐mother attachment. Psychiatry Clin Neurosci. 2014;68(8):631–639.
- , , , , . Examining maternal depression and attachment insecurity as moderators of the impacts of home visiting for at‐risk mothers and infants. J Consult Clin Psychol. 2009;77(4):788–799.
- , . Postpartum mood disorders: diagnosis and treatment guidelines. J Clin Psychiatry. 1998;59(suppl 2):34–40.
- , , , , . A new Mother‐to‐Infant Bonding Scale: links with early maternal mood. Arch Womens Ment Health. 2005;8(1):45–51.
- , , , , . A systematic review of studies validating the Edinburgh Postnatal Depression Scale in antepartum and postpartum women. Acta Psychiatr Scand. 2009;119(5):350–364.
- , , . Detection of postnatal depression. Development of the 10‐item Edinburgh Postnatal Depression Scale. Br J Psychiatry. 1987;150:782–786.
- , , , . Validation of the Edinburgh Postnatal Depression Scale (EPDS) in Spanish mothers. J Affect Disord. 2003;75(1):71–76.
- , , , et al. TRIPPD: a practice‐based network effectiveness study of postpartum depression screening and management. Ann Fam Med. 2012;10(4):320–329.
- , , , , . Detection of postpartum depressive symptoms by screening at well‐child visits. Pediatrics. 2004;113(3 pt 1):551–558.
- R Core Team. R: A language and environment for statistical computing. Vienna, Austria: R Foundation for Statistical Computing: 2013. Available at: http://www.R‐project.org. Accessed Jan 10 2016.
- , , , , . Biological and psychosocial predictors of postpartum depression: systematic review and call for integration. Annu Rev Clin Psychol. 2015;11:99–137.
- , , , et al. Maternal depressive symptoms and children's receipt of health care in the first 3 years of life. Pediatrics. 2005;115(2):306–314.
- , . Maternal factors and child's health care use. Soc Sci Med. 1995;40(5):623–628.
- , , , , . Women's health after pregnancy and child outcomes at age 3 years: a prospective cohort study. Am J Public Health. 2002;92(8):1312–1318.
- , , , . The influence of children's cognitive delay and behavior problems on maternal depression. J Pediatr. 2015;167(3):679–686.
- , , , , . Maternal prenatal symptoms of depression and down regulation of placental monoamine oxidase A expression. J Psychosom Res. 2013;75(4):341–345.
- , , , , . High pregnancy anxiety during mid‐gestation is associated with decreased gray matter density in 6–9‐year‐old children. Psychoneuroendocrinology. 2010;35(1):141–153.
- , , , , . Factors affecting recruitment into depression trials: Systematic review, meta‐synthesis and conceptual framework. J Affect Disord. 2015;172:274–290.
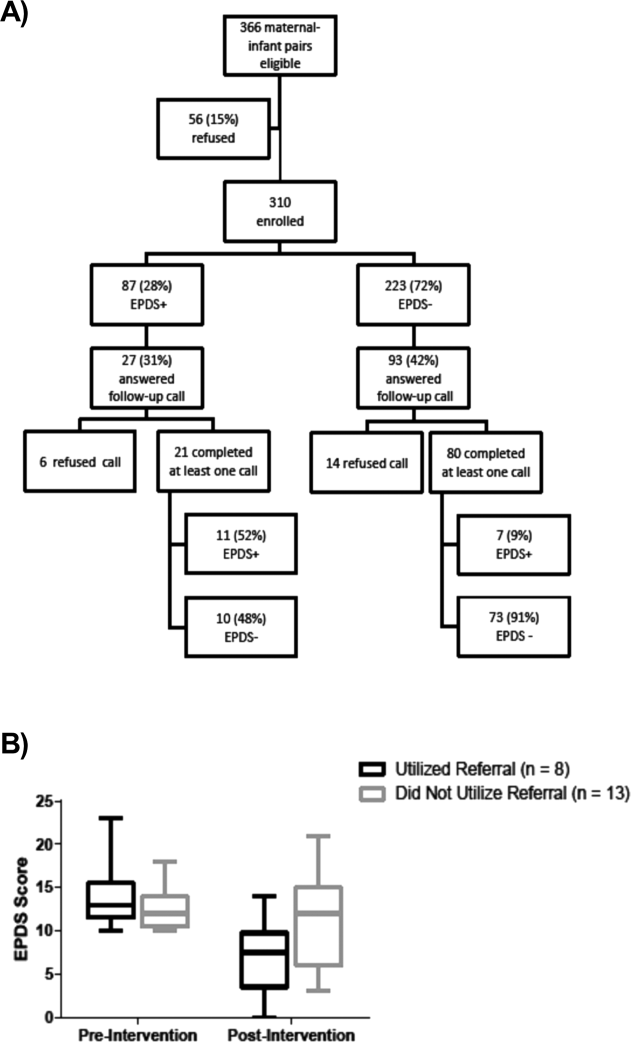
Pneumonia Treatment Duration
Pneumonia is the leading inpatient infectious diagnosis for which antimicrobials are prescribed in the United States.[1] Supported by moderate‐ to high‐quality evidence, guidelines produced jointly by the Infectious Diseases Society of America (IDSA) and American Thoracic Society (ATS) recommend treating pneumonia with the shortest appropriate duration of antimicrobial therapy to minimize risk for antimicrobial‐related adverse events.[2, 3, 4]
Evidence supports short duration of therapy for treatment of uncomplicated pneumonia.[3, 4, 5, 6, 7, 8, 9, 10, 11, 12] IDSA/ATS guidelines state, patients with CAP [community‐acquired pneumonia] should be treated for a minimum of 5 days (level 1 evidence), should be afebrile for 4872 hours, and should have no more than 1 CAP‐associated sign of clinical instabilitybefore discontinuation of therapy (level II evidence). (Moderate recommendation.) A longer duration of therapy may be warranted if initial therapy was not active against the identified pathogen or if it was complicated by [abscess, empyema, severe immunosuppression, or] extra‐pulmonary infection such as meningitis or endocarditis. (Weak recommendation; level III evidence).[3] Recommended therapy duration for patients with uncomplicated healthcare‐associated pneumonia (HCAP) who respond to initial therapy is 7 to 8 days unless gram‐negative nonfermenting rods or complications are identified (level I evidence).[4]
Within the Veterans Health Administration (VHA), the Antimicrobial Stewardship Taskforce (ASTF) was created to optimize care by developing, deploying, and monitoring a national‐level strategic plan for antimicrobial therapy management improvements.[13, 14] Although single‐center studies have found antimicrobial therapy for CAP being frequently prescribed for longer than recommended, the reproducibility of this finding across different facilities has not been assessed.[15, 16] The ASTF collaborated with the VHA Center for Medication Safety to assess total duration of antimicrobial therapy prescribed for veterans hospitalized with uncomplicated pneumonia.[17]
METHODS
This retrospective multicenter evaluation was conducted in 30 VHA facilities that volunteered to participate in this project. Inpatients discharged with a primary International Classification of Diseases, Ninth Revision, Clinical Modification (ICD‐9‐CM) diagnosis code for pneumonia (or pneumonia diagnosis secondary to primary sepsis diagnosis) during 2013 were evaluated.[18] Diagnoses, admissions, and patient demographics were identified using Veterans Affairs (VA) integrated databases through the Austin Integrated Technology Center. Up to 200 admissions per facility were randomly selected for review. Clinical pharmacists at each facility performed manual record reviews utilizing a standardized protocol and collection form. Completed cases were uploaded to a central database for analysis. Standardized chart abstraction was facilitated by detailed instructions, a data dictionary, and monthly conference calls.
Inclusion criteria required patient admission to any medical ward including intensive care unit (ICU) wards for 48 hours, receipt of >24 hours inpatient antimicrobial therapy (eg, at least 2 doses of a once‐daily antibiotic), documentation of pneumonia discharge diagnosis, and survival until discharge. Exclusion criteria were: complicated pneumonia (lung abscess, necrotizing pneumonia, thoracentesis performed), significant immunosuppression (cancer chemotherapy or absolute neutrophil count 1500 cell/mm3 within 28 days, organ transplantation, human immunodeficiency virus infection); or extrapulmonary infection (eg, meningitis, endocarditis).[3] Patients were also excluded if directly transferred from another inpatient facility, pneumonia occurred >48 hours after admission, index hospitalization was >14 days, previously hospitalized within 28 days prior to index admission, or discharged without documentation of completing a full course of therapy. In addition, patients who received initial therapy discordant with culture and susceptibility findings, were not clinically stable by discharge, or had gram‐negative nonfermentative bacilli cultured were excluded from analysis because according to the guidelines, either data are lacking to support a short duration of therapy such as initial discordant therapy, or a longer duration of therapy may be warranted such as gram‐negative nonfermentative bacilli and clinical instability at discharge.[4] Our intent for these exclusions was to minimize bias against clinician decision making for cases where a longer duration of therapy may have been appropriate.
Patients meeting all criteria had the following abstracted: demographics; prior healthcare exposures, admitting location (ICU or non‐ICU ward), parameters for calculation of Pneumonia Severity Index (PSI), culture results obtained 48 hours of admission, duration of antimicrobials administered during hospitalization and prescribed upon discharge (or recommendations for outpatient duration in the discharge summary for patients receiving medications from non‐VA sources), daily clinical stability assessment, Clostridium difficile infection (CDI) test results, and readmission or death within 28 days of discharge.[19]
Guideline‐similar CAP therapy duration was defined as a minimum of 5 days of antimicrobials, up to a maximum of 3 additional days beginning the first day the patient was afebrile and exhibited 1 sign of clinical instability (heart rate > 100 beats/minute, respiratory rate >24 breaths/minute, systolic blood pressure 90, oxygen saturation 90% or partial pressure of oxygen 60 mm Hg on room air or baseline O2 requirements, or not returned to baseline mental status).[3] This definition was made by consensus decision of the investigators and was necessary to operationalize the relationship between clinical stability and appropriate duration of therapy. Guideline‐similar HCAP therapy duration was defined as 8 days.[4] CDI was defined in accordance with VA criteria for hospital onset and community‐onset healthcare‐facilityassociated CDI.[20] All‐cause hospital readmission and all‐cause death were defined as inpatient readmission or any death, respectively, within 28 days after discharge for the pneumonia admission.
Demographics, comorbidities, microbiology results, antimicrobial utilization, CDI, readmission, and death rates between guideline‐similar and guideline‐excessive duration of antimicrobial therapy groups were characterized with descriptive statistics, Mann‐Whitney U test, or 2 test as indicated (significance defined as P 0.05). Multivariable logistic regression (SAS version 9.3 [SAS Institute, Cary, NC]) was used to assess association between duration of therapy exceeding recommended guidelines with all‐cause readmission and all‐cause death after adjustment for pertinent covariates. Odds ratios (OR) with 95% confidence intervals ( 95% CI) were reported. This medication utilization evaluation (MUE) was reviewed by the Hines VHA Institutional Review Board for Human Subjects Protection. Based on VHA Policy Handbook 1058.05, which defines operations activities that may constitute research, the board determined that the evaluation constituted quality improvement rather than research, and thus was exempt from VHA Human Subjects Research requirements.
RESULTS
There were 3881 admissions eligible for chart review. After manual chart review of inclusion and exclusion criteria, 1739 (44.8%) patients were available for duration of therapy analysis. (Figure 1). Only 1 admission for each patient was analyzed.

The cohort was comprised primarily of elderly male patients (96.6%) of whom more than two‐thirds were hospitalized for CAP (Table 1). Most patients had significant disease severity as indicated by PSI score; however, only 12% were directly admitted to the ICU. Blood cultures were collected in >95% of cases; lower respiratory cultures were obtained in 39.9% of cases.
| Characteristic | Value |
|---|---|
| |
| Age, y, mean SD | 71.8 (12.7) |
| Gender, male, n (%) | 1,680 (96.6) |
| Living environment at time of index admission, n (%) | |
| Home | 1,416 (81.4) |
| VA community‐based living center | 88 (5.1) |
| Non‐VA long‐term skilled care facility | 95 (5.5) |
| Assisted living facility | 52 (2.9) |
| Not documented | 46 (2.7) |
| Other | 29 (1.7) |
| Prior healthcare exposures, n (%) | |
| Prior hospitalization within last 90 days | 310 (17.8) |
| Residence in a long‐term skilled care facility in last 90 days | 209 (12.0) |
| Chronic dialysis within last 28 days | 52 (3.0) |
| Intravenous antimicrobials within last 28 days | 76 (4.4) |
| Wound, tracheostomy, or ventilator care in last 28 days | 37 (2.1) |
| Community‐acquired pneumonia, n (%) | 1,195 (68.7) |
| Healthcare‐associated pneumonia, n (%) | 544 (31.3) |
| Comorbidities, n (%) | |
| Renal disease | 438 (25.2) |
| Liver disease | 39 (2.2) |
| Congestive heart failure | 436 (25.1) |
| Cerebrovascular disease | 356 (20.4) |
| Neoplastic disease (excluding skin) | 384 (22.1) |
| Severity of illness, n (%) | |
| Pneumonia Severity Index | |
| Class I | 30 (1.8) |
| Class II | 198 (11.4) |
| Class III | 349 (20.1) |
| Class IV | 759 (43.6) |
| Class V | 403 (23.2) |
| Intensive care upon admission | 212 (12.2) |
| Culture collection 48 hours of admission, n (%) | 1,687 (97.0) |
| Blood | 1,631 (96.7) |
| Lower respiratory tract (sputum) | 673 (39.9) |
| Bronchoalveolar lavage | 20 (1.2) |
| Urine | 632 (37.5) |
| Skin/wound | 3 (0.2) |
| Other | 158 (9.4) |
| Facility complexity, n (%) | |
| Level 1a‐c | 1,286 (74.0) |
| Level 2 | 437 (25.1) |
| Level 3 | 16 (0.9) |
Commonly administered antimicrobials during hospitalization and at discharge are summarized in Table 2. Anti‐pseudomonal ‐lactams and antimethicillin‐resistant Staphylococcus aureus antimicrobials were more frequently administered to patients with HCAP, whereas third‐generation cephalosporins and macrolides were more likely to be administered to patients with CAP. Fluoroquinolones were prescribed to 55.3% of patients upon discharge.
| Inpatient Antimicrobials Administered* | ||||
|---|---|---|---|---|
| Portion of Cohort Receiving Antimicrobial, n (%), n = 1,739 |
Therapy Duration Similar With Guidelines, n (%), n = 241 |
Therapy Duration Exceeding Guidelines, n (%), n = 1,498 | Significance | |
| Antimicrobials Dispensed or Recommended at Discharge | ||||
| Portion of Cohort Receiving Antimicrobial, n (%), n = 1,471 |
Therapy Duration Similar With Guidelines, n (%), n = 151 |
Therapy Duration Exceeding Guidelines, n (%), n = 1,320 | Significance | |
| ||||
| Third‐generation cephalosporins | 809 (46.5) | 75 (31.1) | 734 (49.0) | 0.001 |
| Fluoroquinolones | 836 (48.1) | 114 (47.3) | 722 (48.2) | 0.80 |
| Macrolides | 788 (45.3) | 90 (37.3) | 698 (46.6) | 0.01 |
| Pseudomonal ‐lactams | 692 (39.8) | 138 (57.3) | 554 (37.0) | 0.01 |
| Anti‐MRSA antimicrobials | 663 (38.1) | 135 (56.0) | 528 (35.3) | 0.01 |
| Other ‐lactams | 139 (8.0) | 10 (4.2) | 129 (8.6) | 0.02 |
| Tetracyclines | 119 (6.8) | 14 (5.8) | 105 (7.0) | 0.49 |
| Other | 97 (5.6) | 15 (6.2) | 82 (5.5) | 0.64 |
| Third‐generation cephalosporins | 285 (19.4) | 27 (17.9) | 258 (19.6) | 0.62 |
| Fluoroquinolones | 813 (55.3) | 95 (62.9) | 718 (54.4) | 0.05 |
| Macrolides | 203 (13.8) | 20 (13.3) | 183 (13.9) | 0.83 |
| Pseudomonal ‐lactams | 31 (2.1) | 4 (2.7) | 27 (2.1) | 0.62 |
| Anti‐MRSA antimicrobials | 45 (3.1) | 6 (4.0) | 39 (3.0) | 0.49 |
| Other ‐lactams | 239 (16.3) | 13 (8.6) | 226 (17.1) | 0.01 |
| Tetracyclines | 95 (6.5) | 10 (6.6) | 85 (6.4) | 0.93 |
| Other | 44 (3.0) | 5 (3.3) | 39 (3.0) | 0.81 |
Overall, 13.9% of patients with uncomplicated pneumonia received guideline‐similar duration of therapy (Table 3). A greater proportion of HCAP patients (29.0%) received guideline‐similar therapy duration as compared to CAP patients (6.9%) (P 0.01 (Table 3). Median duration of therapy was 7 days (interquartile range [IQR] = 78 days) for guideline‐similar therapy compared to 10 days (913 days) for therapy duration in excess of guideline recommendations. Overall, 97.1 % of patients met clinical stability criteria before day 4 of therapy, yet 50% received 4 days of intravenous (IV) therapy (median was 4 days, IQR = 36 days). Antimicrobial therapy was generally completed after discharge, as only 17.3% received their entire treatment course during hospitalization. Median duration of outpatient oral (PO) antimicrobial therapy was twice as long for guideline‐excessive therapy compared to guideline‐similar therapy (6 vs 3 days), whereas duration of inpatient IV and PO antimicrobial therapy was similar. Patients discharged on a fluoroquinolone were more likely to receive guideline‐similar duration of therapy. The VHA classifies facilities into 3 levels of complexity, with lower scores indicating more complex facilities.[21] Guideline‐similar therapy duration occurred in 10.4% of cases in lower complexity facilities (levels 2 and 3),and 15.1% in more complex facilities (level 1) (P = 0.01). The median duration of therapy was similar for more and less complex facilities, respectively (10 days, IQR = 812 days vs 10 days, IQR = 813 days).
| Outcome |
Therapy Duration Similar With IDSA/ATS Guidelines |
Therapy Duration in Excess of IDSA/ATS Guideline Recommendations | Significance |
|---|---|---|---|
| |||
| Antimicrobial duration consistent with guideline recommendations, n (%) | 241 (13.9) | 1,498 (86.1) | NR |
| CAP* | 83 (6.9) | 1,112 (93.1) | NR |
| HCAP* | 158 (29.0) | 386 (71.0) | NR |
| Total days of therapy for pneumonia, median (IQR) | 7 (78) | 10 (913) | NR |
| CAP | 6 (59) | 10 (812) | 0.01 |
| HCAP | 7 (78) | 11 (1014) | 0.01 |
| Days of IV therapy administered for pneumonia, median (IQR) | 4 (37) | 4 (36) | 0.50 |
| Days of PO inpatient therapy administered, median (IQR) | 1 (03) | 1 (03) | 0.78 |
| Days of PO outpatient therapy dispensed at discharge, median (IQR) | 3 (25) | 6 (47) | 0.01 |
| Days of PO outpatient therapy recommended in Discharge Summary for patients without a VA prescription, median (IQR) | 3 (24) | 5 (47) | 0.01 |
| Aggregate 28‐day hospital readmission, n (%) | 42 (17.4) | 183 (12.2) | 0.03 |
| CAP∥# | 7 (8.4) | 112 (10.1) | 0.58 |
| HCAP∥# | 35 (22.2) | 71 (18.4) | 0.28 |
| Aggregate 28‐day CDI rate, n (%) | 6 (2.5) | 9 (0.6) | 0.03 |
| CAP∥** | 1 (1.2) | 6 (0.5) | 0.44 |
| HCAP∥** | 5 (3.2) | 3 (0.8) | 0.04 |
| Aggregate 28‐day death after discharge, n (%) | 6 (2.5) | 52 (3.5) | 0.43 |
| CAP∥** | 1 (1.2) | 33 (3.0) | 0.35 |
| HCAP∥** | 5 (3.2) | 19 (4.9) | 0.37 |
The 28‐day postdischarge all‐cause readmission rate for patients who received guideline‐similar therapy duration was higher (17.4%) than for patients who received therapy duration in excess of guideline recommendations (12.2%) (P = 0.03). After adjustment for covariates associated with readmission (HCAP, age, prior skilled nursing facility residence, PSI score comorbidity elements), we found no evidence that patients who received guideline‐similar therapy duration were more likely to be readmitted than were patients who received guideline‐excessive duration (OR: 1.1 [95% CI: 0.8, 1.7]) (Table 3). Likewise, no difference in 28‐day all‐cause postdischarge mortality was identified between guideline‐similar and guideline‐excessive duration after adjustment for the same covariates (adjusted OR: 0.5 [95% CI: 0.2, 1.2]) (Table 4).
| Model Variables | Odds Ratio | 95% Confidence Interval | P Value |
|---|---|---|---|
| |||
| Readmission model | |||
| Duration of antibiotics | 1.11 | 0.75, 1.64 | 0.62 |
| HCAP | 1.94 | 1.38, 2.72 | 0.01 |
| Age | 1.01 | 1.00, 1.03 | 0.04 |
| Prior skilled nursing facility residence | 0.91 | 0.59, 1.40 | 0.67 |
| PSI score comorbidity elements | |||
| Neoplastic disease | 1.20 | 0.86, 1.67 | 0.29 |
| Liver disease | 1.55 | 0.66, 3.64 | 0.31 |
| CHF | 1.15 | 0.83, 1.59 | 0.41 |
| Cerebrovascular disease | 1.06 | 0.75, 1.50 | 0.75 |
| Renal disease | 1.51 | 1.09, 2.08 | 0.01 |
| Mortality model | |||
| Duration of antibiotics | 0.53 | 0.23, 1.22 | 0.14 |
| HCAP | 2.53 | 1.38, 4.65 | 0.01 |
| Age | 1.06 | 1.03, 1.09 | 0.01 |
| Prior skilled nursing facility residence | 0.79 | 0.38, 1.66 | 0.53 |
| PSI score comorbidity elements | |||
| Neoplastic disease | 1.03 | 0.57, 1.87 | 0.91 |
| Liver disease | 0.001 | 0.001, >999.9 | 0.98 |
| CHF | 0.73 | 0.39, 1.38 | 0.34 |
| Cerebrovascular disease | 0.82 | 0.43, 1.56 | 0.55 |
| Renal disease | 0.72 | 0.39, 1.35 | 0.31 |
CDI cases (n = 15) were too sparse to adequately perform multivariable logistic regression analysis; however, a higher percentage of patients who received guideline‐similar duration of therapy developed CDI compared to patients who received guideline‐excessive duration of therapy (40.0% vs 13.6%, P 0.01). The median duration of therapy for patients who did and did not develop CDI was similar (8 days, IQR = 714 days vs 10 days, IQR = 812 days, P = 0.85, respectively). Patients who developed CDI had a higher rate of HCAP diagnosis (1.5% vs 0.6%; P = 0.06), were more likely to have concomitant non‐pneumonia infection (40.0% vs 9.5%, P 0.01), have chronic comorbidity (86.7% vs 59.1%, P = 0.03), and to have been admitted to the ICU (26.7% vs 12.1%, P = 0.09).
DISCUSSION
IDSA/ATS guidelines for pneumonia duration of therapy generally agree with other professional society guidelines including the British Thoracic Society and National Institute for Health and Care Excellence.[22, 23] In contrast to existing evidence and guideline recommendations, this multi‐centered evaluation identified prolonged durations of antimicrobial therapy prescribed in 93% and 71% of patients with uncomplicated CAP and HCAP (Table 3), respectively.[3, 4, 5, 6, 7, 8, 9, 10, 11, 12] Almost all (97.1%) uncomplicated CAP and HCAP patients met clinical stability criteria before day 4 of hospitalization, yet the median duration of IV therapy was 4 days. Because criteria for IV to PO conversion and the clinical stability definition utilized in this analysis were similar, many patients may have been eligible for PO therapy earlier, favorably impacting length of stay, cost, and adverse effects.[3, 12, 24, 25, 26] Although median days of inpatient PO therapy administered was 1 day (IQR = 03 days), inpatient observation after PO conversion may not be necessary. The duration of PO therapy was based on calendar days, where if a patient received 1 dose of a once daily antibiotic (ie, levofloxacin), they were considered to have received 1 day of inpatient PO antibiotics even if discharged the same day.
Approximately half of all days of therapy occurred after discharge. Although the median therapy duration for inpatients was similar, the median duration of antimicrobials administered upon hospital discharge was twice as long for patients receiving guideline‐excessive compared to guideline‐similar duration of therapy. The median excess in antibiotic duration is almost entirely accounted for by excess outpatient days of therapy. This is an important consideration for antimicrobial stewardship programs that tend to focus on inpatient antimicrobial use.
Noteworthy observations include the low rate of respiratory tract culture collection (41%) and frequent use of fluoroquinolones upon discharge. Collection of respiratory tract cultures is recommended for all patients with HCAP and patients with CAP who have risk factors for resistant pathogens, characteristics that were common in this cohort.[3, 4] Recently, we identified that respiratory culture collection is associated with increased de‐escalation rates in HCAP, and that culture‐negative patients frequently receive fluoroquinolones.[27] IDSA/ATS CAP guidelines discourage empirically switching to PO fluoroquinolone therapy based on bioavailability considerations alone.[3] Further, fluoroquinolones are considered to be associated with high risk of CDI.[28, 29] Prescription of fluoroquinolone upon discharge was associated with guideline‐similar duration of therapy and was not shown to be associated with CDI; however, power to detect differences between exposures to specific antimicrobials and CDI was low.
CDI was more common in patients with CAP (1.2% vs 0.5%) and HCAP (3.2% vs 0.8%) who received duration of therapy similar with guideline recommendations. This observation is confounded, as patients with CDI had significantly greater comorbidity as well as secondary infections and tended to more frequently receive ICU care. There were no differences in adjusted rates of readmission or death between patients receiving guideline‐similar and guideline‐excessive duration of therapy.
Evaluation strengths included exclusion of patients with complicating conditions possibly requiring prolonged antimicrobial treatment courses, which allowed the evaluation to focus on patients most likely to benefit from shorter course therapy. The definition of appropriate therapy duration was based upon daily assessment of clinical stability criteria that paralleled the CAP guidelines. The definition utilized objective parameters while accounting for patient variability in achieving clinical stability criteria. Finally, the analyses of clinical end points suggest that shorter duration of therapy may be as safe and effective as longer duration of therapy in uncomplicated pneumonia.
Limitations include those common to other analyses conducted within the VHA, including a predominantly elderly male cohort.[30] Only ICD‐9‐CM codes consistent with a discharge diagnosis of pneumonia were used to identify the cohort, and clinical impressions not documented in the medical record may have impacted the clinician's treatment duration decisions. The upper limit of appropriate duration of therapy for CAP was arbitrarily set at up to 3 days beyond meeting clinical stability criteria to provide a reasonable duration of appropriate therapy beyond clinical stability to operationalize the duration of therapy recommendations within the context of the IDSA/ATS guidelines. Additionally, CIs for the ORs of readmission and mortality were broad, and thus too imprecise to determine whether guideline‐similar durations increased or decreased readmission or mortality in comparison with therapy that exceeded guideline recommendations. We could not fully assess the potential for association between guideline‐excessive therapy duration and risk for CDI due to sparse cases. Finally, non‐VA prescription data were not available for all patients, and we relied on intended duration of therapy as recommended by the discharging provider in 4.1% of cases.
Most quality assessments of pneumonia treatment have focused on antimicrobial selection and timely administration or conversion from IV to PO therapy.[31, 32] This evaluation identified potential opportunities for expansion of antimicrobial stewardship activities during the transition of care setting. The efficacy of short‐course ‐lactam, macrolide, or fluoroquinolone therapy for CAP appears equivalent to longer treatment regimens with no difference in adverse event rates, suggesting that optimal duration of therapy may be a rational target for quality improvement.[5, 6, 7, 8, 9, 10, 11, 12, 15, 31] Recommendations for HCAP duration of therapy are extrapolated from a prospective multicentered study, which randomized patients with hospital‐acquired pneumonia to receive 8 versus 15 days of therapy, that identified similar outcomes to ours.[4, 12]
Single‐center studies have identified that antimicrobial therapy for pneumonia is frequently prescribed for longer than recommended by guidelines, which found a similar median duration of therapy as our evaluation.[15, 16] Similar to Jenkins et al., we observed a high rate of fluoroquinolone prescriptions upon discharge.[16]
There are few published examples of interventions designed to limit excessive duration of therapy, particularly for antimicrobials prescribed upon hospital discharge.[15, 33, 34] Serial procalcitonin measurements have been used to guide duration of therapy for pneumonia; however, the costbenefit ratio of procalcitonin measurement is unclear.[35, 36] Procalcitonin use was uncommon, and none of the participating facilities in our evaluation utilized a specific algorithm to guide therapy duration. Limited data suggest that patient‐level prospective audit with feedback may be effective. Advic et al. evaluated management of presumed CAP before and after education and prospective feedback to medical teams concerning antimicrobial selection and duration of therapy.[15] The intervention led to a decrease in median duration of therapy from 10 days (IQR = 813 days) to 7 days (IQR = 78 days) without increasing clinical failure or readmission rates. We recently reported a single‐center evaluation in which pharmacists utilizing a decision support tool while performing discharge medication reconciliation were able to reduce excessive mean duration of therapy from 9.5 days ( 2.4 days) to 8.3 days ( 2.9 days) in patients without complicated pneumonia, with a 19.2% reduction in duration of therapy prescribed at discharge.[37] A similar approach utilizing pharmacists performing discharge review has recently been reported in a community hospital.[38]
Future work should recognize that few patients complete their entire course of therapy as inpatients, and the majority of treatment is prescribed upon discharge. Pivotal time points for antimicrobial stewardship intervention include day 2 to 3 of hospitalization when conveying suggestions for antimicrobial de‐escalation and/or IV to PO conversion, and toward the end of hospitalization during discharge planning. Although it may not be feasible for antimicrobial stewards to review all uncomplicated cases of pneumonia during hospitalization, most facilities have a systematic process for reviewing medications during transitions of care. We believe that interventions intended to assess and recommend shortened courses of therapy are appropriate. These interventions should include a mechanism for support by stewardship personnel or other infectious diseases specialists. Based on our evaluation, the ASTF produced and disseminated clinical guidance documents and tools to triage pneumonia case severity and assess response to therapy. Qualified personnel are encouraged to use this information to make recommendations to providers regarding excessive duration of therapy for uncomplicated cases where appropriate. Other work should include an in‐depth assessment of clinical outcomes related to treatment duration, investigation of provider rationale for prolonged treatment, and duration of antimicrobial therapy prescribed upon discharge for other common disease states. Finally, manual chart review to classify uncomplicated cases and related outcomes was laborious, and automated case identification is technologically plausible and should be explored.[39]
In conclusion, this national VHA MUE found that patients with uncomplicated pneumonia were commonly prescribed antimicrobials for the duration of therapy in excess of guideline recommendations. Patients with uncomplicated pneumonia who received therapy duration consistent with guideline recommendations did not have significantly different all‐cause readmission and death rates compared to patients receiving prolonged treatment. Approximately half of all therapy was prescribed upon hospital discharge, and clinicians as well as antimicrobial stewardship programs should consider these findings to address excessive duration of antimicrobial therapy upon hospital discharge.
Acknowledgements
The authors acknowledge Dr. Michael Fine for his assistance with utilization of the Pneumonia Severity Index, Kenneth Bukowski for assisting with development of data collection tools and data management, and members of the Antimicrobial Stewardship Taskforce Implementation Sub‐Committee. Collaborators in the Pneumonia Duration of Therapy Medication Utilization Evaluation Group include: Biloxi VA (VA Gulf Coast): Cheryl Hankins, PharmD, BCPS; Central Alabama VAMC: Lauren Rass, PharmD, BCPS, Kelly Mooney, PharmD, BCPS; Central Arkansas: Nicholas Tinsley, MS, PharmD; Chillicothe VA: Stephen Hanson, PharmD, BCPS, Beth Gallaugher, BSN, RN, Elizabeth Baltenberger, PharmD; Cincinnati VA: Jason Hiett, PharmD, BCPS, Victoria Tate, PharmD, BCPS, Brian Salzman, PharmD; Dorn Medical Center: MaryAnne Maurer, PharmD, BCPS, BCACP, Rebekah Sipes, PharmD, BCACP, Ginger Ervin, PharmD; Dwight D. Eisenhower VAMC: Emily Potter, PharmD; Hudson Valley: Rita Lee Bodine, PharmD, Clement Chen, PharmD, Cristina Fantino, PharmD; James H. Quillen VAMC: Marty Vannoy, PharmD, BCPS, Erin Harshbarger, PharmD, Kristen Nelsen, PharmD; Jesse Brown VAMC: Lisa Young, PharmD, BCPS, AQ‐ID, Andrea Bidlencik, PharmD, BCPS; Kansas City VA: Jamie Guyear, PharmD, AQ‐ID, Ann Ungerman, PharmD, BCPS, Lauri Witt, PharmD, BCACP; Louis Stokes Cleveland VAMC: Amy Hirsch, PharmD, BCPS, Steven Adoryan, PharmD, BCP‐CC, Amanda Miller, PharmD, BCPS; Maine VAMC: Joel Coon, PharmD, Rachel Naida, PharmD, Kelly Grossman, PharmD; Martinsburg VAMC: Kelly Li, PharmD, Sarah Mickanis, PharmD, BCPS; Miami VA Medical Center: Mara Carrasquillo, BS, PharmD, Maribel Toro, PharmD; North Florida/South Georgia Veterans Health System: Nora Morgan, PharmD, Hugh Frank, PharmD, BCPS, BCPP, Sarah Onofrio, PharmD, BCPS; North Texas HCS: Susan Duquaine, PharmD, BCPS, AQ‐ID, Ruben Villaneuva, PharmD, BCPS, Jaela Dahl, PharmD, BCPS; Ozarks: Andrew Siler, PharmD, BCPS, Michele Walker, PharmD, CGP, Jennifer Cole, PharmD, BCPS, BCCCP; Providence VAMC: Kerry LaPlante, PharmD, FCCP, Lindsey Williamson, PharmD; Richmond VA: Daniel Tassone, PharmD, BCPS; Salisbury VAMC: Brett Norem, PharmD, Marrisa Ragonesi, PharmD; San Juan VA: Monica Sanabria‐Seda, PharmD, BCPS, Jaime Velez‐Fores, PharmD, BCPS, AQ‐ID, Norma Ayala‐Burgos, PharmD; Sioux Falls VA: Andrea Aylward, PharmD, BCPS; South Texas HCS: Kelly Echevarria, PharmD, BCPS, AQ‐ID, Manuel Escobar, PharmD; Tennessee Valley HCS: Casey Ryals, PharmD, BCACP, Molly Hurst, PharmD, Jonathan Hale, PharmD; VA Central Iowa Health Care System: Jenny Phabmixay, PharmD, BCPS, Mackenzie Brown, PharmD, BCPS, Cynthia Muthusi, PharmD, BCPS; VA Loma Linda: Tony Chau, PharmD; VA Sierra Nevada: Scott Mambourg, PharmD, BCPS, AAHIVP, Matthew Han, PharmD, Nathan Mihoch, PharmD; VA WNY Healthcare System: Kari Mergenhagen, PharmD, BCPS, AQ‐ID, Christine Ruh, PharmD, BCPS; Veterans Affairs Salt Lake City Health System: Emily Spivak, MD, MHS, Patricia Orlando, PharmD
Disclosures: Karl Madaras‐Kelly is employed full time by Idaho State University and has a without compensation appointment as a clinical pharmacist at the Boise VA Medical Center. He receives grant support unrelated to this work through the Department of Veterans Affairs subcontracted to Idaho State University. Muriel Burk is employed full time through the Department of Veterans Affairs as clinical pharmacy specialist in outcomes and medication safety evaluation. Christina Caplinger was employed by the Department of Veterans Affairs as an infectious diseases fellow at the time this work was completed. She is currently employed by Micromedex. Jefferson Bohan is employed full time by the Department of Veterans Affairs as an infectious diseases fellow. Melinda Neuhauser is employed full time through the Department of Veterans Affairs as a clinical pharmacy specialistinfectious diseases. Matthew Goetz is employed full time through the Department of Veterans Affairs as an infectious diseases physician. Rhongping Zhang is employed full time through the Department of Veterans Affairs as a data analyst. Francesca Cunningham is employed full time through the Department of Veterans Affairs as the director of the VA Center for Medication Safety. This work was supported with resources and use of the Department of Veterans Affairs healthcare system. The views expressed in this article are solely those of the authors and do not necessarily reflect the position or policy of the Department of Veterans Affairs. The authors report no conflicts of interest.
- Centers for Disease Control and Prevention. National hospital discharge survey 2010. Available at: http://www.cdc.gov/nchs/fastats/pneumonia.htm. Accessed December 1, 2014.
- , , , et al. Implementing an antibiotic stewardship program: guidelines by the Infectious Diseases Society of America and the Society for Healthcare Epidemiology of America. Clin Infect Dis. 2016;62(10):e51–e77.
- , , , et al. Infectious Diseases Society of America/American Thoracic Society consensus guidelines on the management of community‐acquired pneumonia in adults. Clin Infect Dis. 2007;44(suppl 2):S27–S72.
- American Thoracic Society; Infectious Diseases Society of America. Guidelines for the management of adults with hospital‐acquired, ventilator‐associated, and healthcare‐associated pneumonia. Am J Respir Crit Care Med. 2005;171(4):388–416.
- , , , et al. Short‐ versus long‐course antibacterial therapy for community‐acquired pneumonia: a meta‐analysis. Drugs. 2008;68(13):1841–1854.
- , , , et al. Efficacy of short‐course antibiotic regimens for community‐acquired pneumonia: a meta‐analysis. Am J Med. 2007;120:783–790.
- , , , et al. High‐dose, short‐course levofloxacin for community‐acquired pneumonia: a new treatment paradigm. Clin Infect Dis. 2003;37:752–760.
- , , , et al. Comparison of 7 versus 10 days of antibiotic therapy for hospitalized patients with uncomplicated community‐acquired pneumonia: a prospective. Am J Ther. 1999;6(4):217–222.
- , , , et al. Effectiveness of discontinuing antibiotic treatment after three days versus eight days in mild to moderate‐severe community acquired pneumonia: randomised, double blind trial. BMJ. 2006;332(7554):1355.
- , , , et al. Efficacy of a three day course of azithromycin in moderately severe community‐acquired pneumonia. Eur Respir J. 1995;8(3):398–402.
- , , , et al. Comparison of 8 vs 15 days of antibiotic therapy for ventilator‐associated pneumonia in adults: a randomized trial. JAMA. 2003;290(19):2588–2598.
- , , , et al. Effectiveness of early switch from intravenous to oral antibiotics in severe community acquired pneumonia: multicentre randomized trial. BMJ. 2006;333(7580):1193.
- , , , , . Unnecessary antimicrobial use in the context of Clostridium difficile infection: a call to arms for the Veterans Affairs Antimicrobial Stewardship Task Force. Infect Control Hosp Epidemiol. 2013;34(6):651–653.
- VHA Directive 1031. Antimicrobial stewardship programs. Available at: https://www1.va.gov/vhapublications/ViewPublication.asp?pub_ID=2964. Accessed December 1, 2014.
- , , , et al. Impact of an antimicrobial stewardship intervention on shortening the duration of therapy for community‐acquired pneumonia. Clin Infect Dis. 2012;54:1581–1587.
- , , , et al. Targets for antibiotic and healthcare resource stewardship in inpatient community‐acquired pneumonia: a comparison of management practices with National Guideline Recommendations. Infection. 2013;41(1):135–144.
- , , , , . Pharmacy benefits management in the Veterans Health Administration: 1995 to 2003. Am J Manag Care. 2005;11(2):104–112.
- , , , . Accuracy of administrative data for identifying patients with pneumonia. Am J Med Qual. 2005;20(6):319–328.
- , , , et al. A prediction rule to identify low‐risk patients with community‐acquired pneumonia. N Engl J Med. 1997;336:243–250.
- , , , , . Clostridium difficile infections in Veterans Health Administration acute care facilities. Infect Control Hosp Epidemiol. 2014;35(8):1037–1042.
- , , , , . Organization complexity and primary care providers' perceptions of quality improvement culture within the Veterans Health Administration. Am J Med Qual. 2016;31(2):139–146.
- , , , et al. BTS guidelines for the management of community acquired pneumonia in adults: update 2009. Thorax. 2009;64(suppl 3):iii1–iii55.
- National Institute for Health and Care Excellence. Pneumonia in adults: diagnosis and management. Available at: http://www.nice.org.uk/guidance/cg191. Published December 2014. Accessed May 9, 2016.
- , , , , , . A prospective randomized study of inpatient IV antibiotics for community‐acquired pneumonia: the optimal duration of therapy. Chest. 1996;110(4):965–971.
- , , , et al. Early switch from intravenous to oral antibiotics and early hospital discharge: a prospective observational study of 200 consecutive patients with community‐acquired pneumonia. Arch Intern Med. 1999;159(20):2449–2454.
- , , , . Correlates and economic and clinical outcomes of an adult IV to PO antimicrobial conversion program at an academic medical center in Midwest United States. J Pharm Pract. 2015;28(3):238–248.
- , , , et al. Antimicrobial De‐escalation of treatment for healthcare‐associated pneumonia within the Veterans Healthcare Administration. J Antimicrob Chemother. 2016;71(2):539–546.
- , , , et al. Community‐associated Clostridium difficile infection and antibiotics: a meta‐analysis. J Antimicrob Chemother. 2013;68(9):1951.
- , , , . Meta‐analysis of antibiotics and the risk of community‐associated Clostridium difficle infection. Antimicrob Agents Chemother. 2013;57(5):2326–2332.
- , , , et al. Evaluating diagnosis‐based case‐mix measures: how well do they apply to the VA population? Med Care. 2001;39:692–704.
- , , . What is the role of antimicrobial stewardship in improving outcomes of patients with CAP? Infect Dis Clin North Am. 2013;27(1):211–228.
- , , , et al. Quality of care for elderly patients hospitalized for pneumonia in the United States, 2006 to 2010. JAMA Intern Med. 2014;174(11):1806–1814.
- , , , et al. An evaluation of the impact of antibiotic stewardship on reducing the use of high‐risk antibiotics and its effect on the incidence of Clostridium difficile infection in hospital settings. J Antimicrob Chemother. 2012;67(12):2988–2996.
- , , , et al.; Centers for Disease Control and Prevention. Vital signs: improving antibiotic use among hospitalized patients. MMWR Morb Mortal Wkly Rep. 2014;63(9):194–200.
- , , et al. Effect of procalcitonin‐based guidelines vs standard guidelines on antibiotic use in lower respiratory tract infections: the ProHOSP randomized controlled trial. JAMA. 2009;302(10):1059–1066.
- , , , et al. Cost‐effectiveness of procalcitonin‐guided antibiotic use in community acquired pneumonia. J Gen Intern Med. 2013;28(9):1157–1164.
- , , , , , . Interim evaluation of a Protocol to Optimize the Duration of Pneumonia Therapy at Hospital Discharge. Open Forum Infect Dis. 2015;2(suppl 1):S379.
- , , , et al. Intervention to improve antibiotic selection and shorten treatment durations at the time of hospital discharge. Open Forum Infect Dis. 2015;2(suppl 1):S1.
- , , , et al. Using the electronic medical record to identify community‐acquired pneumonia: toward a replicable automated strategy. PLoS One. 2013;8(8):e70944.
Pneumonia is the leading inpatient infectious diagnosis for which antimicrobials are prescribed in the United States.[1] Supported by moderate‐ to high‐quality evidence, guidelines produced jointly by the Infectious Diseases Society of America (IDSA) and American Thoracic Society (ATS) recommend treating pneumonia with the shortest appropriate duration of antimicrobial therapy to minimize risk for antimicrobial‐related adverse events.[2, 3, 4]
Evidence supports short duration of therapy for treatment of uncomplicated pneumonia.[3, 4, 5, 6, 7, 8, 9, 10, 11, 12] IDSA/ATS guidelines state, patients with CAP [community‐acquired pneumonia] should be treated for a minimum of 5 days (level 1 evidence), should be afebrile for 4872 hours, and should have no more than 1 CAP‐associated sign of clinical instabilitybefore discontinuation of therapy (level II evidence). (Moderate recommendation.) A longer duration of therapy may be warranted if initial therapy was not active against the identified pathogen or if it was complicated by [abscess, empyema, severe immunosuppression, or] extra‐pulmonary infection such as meningitis or endocarditis. (Weak recommendation; level III evidence).[3] Recommended therapy duration for patients with uncomplicated healthcare‐associated pneumonia (HCAP) who respond to initial therapy is 7 to 8 days unless gram‐negative nonfermenting rods or complications are identified (level I evidence).[4]
Within the Veterans Health Administration (VHA), the Antimicrobial Stewardship Taskforce (ASTF) was created to optimize care by developing, deploying, and monitoring a national‐level strategic plan for antimicrobial therapy management improvements.[13, 14] Although single‐center studies have found antimicrobial therapy for CAP being frequently prescribed for longer than recommended, the reproducibility of this finding across different facilities has not been assessed.[15, 16] The ASTF collaborated with the VHA Center for Medication Safety to assess total duration of antimicrobial therapy prescribed for veterans hospitalized with uncomplicated pneumonia.[17]
METHODS
This retrospective multicenter evaluation was conducted in 30 VHA facilities that volunteered to participate in this project. Inpatients discharged with a primary International Classification of Diseases, Ninth Revision, Clinical Modification (ICD‐9‐CM) diagnosis code for pneumonia (or pneumonia diagnosis secondary to primary sepsis diagnosis) during 2013 were evaluated.[18] Diagnoses, admissions, and patient demographics were identified using Veterans Affairs (VA) integrated databases through the Austin Integrated Technology Center. Up to 200 admissions per facility were randomly selected for review. Clinical pharmacists at each facility performed manual record reviews utilizing a standardized protocol and collection form. Completed cases were uploaded to a central database for analysis. Standardized chart abstraction was facilitated by detailed instructions, a data dictionary, and monthly conference calls.
Inclusion criteria required patient admission to any medical ward including intensive care unit (ICU) wards for 48 hours, receipt of >24 hours inpatient antimicrobial therapy (eg, at least 2 doses of a once‐daily antibiotic), documentation of pneumonia discharge diagnosis, and survival until discharge. Exclusion criteria were: complicated pneumonia (lung abscess, necrotizing pneumonia, thoracentesis performed), significant immunosuppression (cancer chemotherapy or absolute neutrophil count 1500 cell/mm3 within 28 days, organ transplantation, human immunodeficiency virus infection); or extrapulmonary infection (eg, meningitis, endocarditis).[3] Patients were also excluded if directly transferred from another inpatient facility, pneumonia occurred >48 hours after admission, index hospitalization was >14 days, previously hospitalized within 28 days prior to index admission, or discharged without documentation of completing a full course of therapy. In addition, patients who received initial therapy discordant with culture and susceptibility findings, were not clinically stable by discharge, or had gram‐negative nonfermentative bacilli cultured were excluded from analysis because according to the guidelines, either data are lacking to support a short duration of therapy such as initial discordant therapy, or a longer duration of therapy may be warranted such as gram‐negative nonfermentative bacilli and clinical instability at discharge.[4] Our intent for these exclusions was to minimize bias against clinician decision making for cases where a longer duration of therapy may have been appropriate.
Patients meeting all criteria had the following abstracted: demographics; prior healthcare exposures, admitting location (ICU or non‐ICU ward), parameters for calculation of Pneumonia Severity Index (PSI), culture results obtained 48 hours of admission, duration of antimicrobials administered during hospitalization and prescribed upon discharge (or recommendations for outpatient duration in the discharge summary for patients receiving medications from non‐VA sources), daily clinical stability assessment, Clostridium difficile infection (CDI) test results, and readmission or death within 28 days of discharge.[19]
Guideline‐similar CAP therapy duration was defined as a minimum of 5 days of antimicrobials, up to a maximum of 3 additional days beginning the first day the patient was afebrile and exhibited 1 sign of clinical instability (heart rate > 100 beats/minute, respiratory rate >24 breaths/minute, systolic blood pressure 90, oxygen saturation 90% or partial pressure of oxygen 60 mm Hg on room air or baseline O2 requirements, or not returned to baseline mental status).[3] This definition was made by consensus decision of the investigators and was necessary to operationalize the relationship between clinical stability and appropriate duration of therapy. Guideline‐similar HCAP therapy duration was defined as 8 days.[4] CDI was defined in accordance with VA criteria for hospital onset and community‐onset healthcare‐facilityassociated CDI.[20] All‐cause hospital readmission and all‐cause death were defined as inpatient readmission or any death, respectively, within 28 days after discharge for the pneumonia admission.
Demographics, comorbidities, microbiology results, antimicrobial utilization, CDI, readmission, and death rates between guideline‐similar and guideline‐excessive duration of antimicrobial therapy groups were characterized with descriptive statistics, Mann‐Whitney U test, or 2 test as indicated (significance defined as P 0.05). Multivariable logistic regression (SAS version 9.3 [SAS Institute, Cary, NC]) was used to assess association between duration of therapy exceeding recommended guidelines with all‐cause readmission and all‐cause death after adjustment for pertinent covariates. Odds ratios (OR) with 95% confidence intervals ( 95% CI) were reported. This medication utilization evaluation (MUE) was reviewed by the Hines VHA Institutional Review Board for Human Subjects Protection. Based on VHA Policy Handbook 1058.05, which defines operations activities that may constitute research, the board determined that the evaluation constituted quality improvement rather than research, and thus was exempt from VHA Human Subjects Research requirements.
RESULTS
There were 3881 admissions eligible for chart review. After manual chart review of inclusion and exclusion criteria, 1739 (44.8%) patients were available for duration of therapy analysis. (Figure 1). Only 1 admission for each patient was analyzed.
The cohort was comprised primarily of elderly male patients (96.6%) of whom more than two‐thirds were hospitalized for CAP (Table 1). Most patients had significant disease severity as indicated by PSI score; however, only 12% were directly admitted to the ICU. Blood cultures were collected in >95% of cases; lower respiratory cultures were obtained in 39.9% of cases.
| Characteristic | Value |
|---|---|
| |
| Age, y, mean SD | 71.8 (12.7) |
| Gender, male, n (%) | 1,680 (96.6) |
| Living environment at time of index admission, n (%) | |
| Home | 1,416 (81.4) |
| VA community‐based living center | 88 (5.1) |
| Non‐VA long‐term skilled care facility | 95 (5.5) |
| Assisted living facility | 52 (2.9) |
| Not documented | 46 (2.7) |
| Other | 29 (1.7) |
| Prior healthcare exposures, n (%) | |
| Prior hospitalization within last 90 days | 310 (17.8) |
| Residence in a long‐term skilled care facility in last 90 days | 209 (12.0) |
| Chronic dialysis within last 28 days | 52 (3.0) |
| Intravenous antimicrobials within last 28 days | 76 (4.4) |
| Wound, tracheostomy, or ventilator care in last 28 days | 37 (2.1) |
| Community‐acquired pneumonia, n (%) | 1,195 (68.7) |
| Healthcare‐associated pneumonia, n (%) | 544 (31.3) |
| Comorbidities, n (%) | |
| Renal disease | 438 (25.2) |
| Liver disease | 39 (2.2) |
| Congestive heart failure | 436 (25.1) |
| Cerebrovascular disease | 356 (20.4) |
| Neoplastic disease (excluding skin) | 384 (22.1) |
| Severity of illness, n (%) | |
| Pneumonia Severity Index | |
| Class I | 30 (1.8) |
| Class II | 198 (11.4) |
| Class III | 349 (20.1) |
| Class IV | 759 (43.6) |
| Class V | 403 (23.2) |
| Intensive care upon admission | 212 (12.2) |
| Culture collection 48 hours of admission, n (%) | 1,687 (97.0) |
| Blood | 1,631 (96.7) |
| Lower respiratory tract (sputum) | 673 (39.9) |
| Bronchoalveolar lavage | 20 (1.2) |
| Urine | 632 (37.5) |
| Skin/wound | 3 (0.2) |
| Other | 158 (9.4) |
| Facility complexity, n (%) | |
| Level 1a‐c | 1,286 (74.0) |
| Level 2 | 437 (25.1) |
| Level 3 | 16 (0.9) |
Commonly administered antimicrobials during hospitalization and at discharge are summarized in Table 2. Anti‐pseudomonal ‐lactams and antimethicillin‐resistant Staphylococcus aureus antimicrobials were more frequently administered to patients with HCAP, whereas third‐generation cephalosporins and macrolides were more likely to be administered to patients with CAP. Fluoroquinolones were prescribed to 55.3% of patients upon discharge.
| Inpatient Antimicrobials Administered* | ||||
|---|---|---|---|---|
| Portion of Cohort Receiving Antimicrobial, n (%), n = 1,739 |
Therapy Duration Similar With Guidelines, n (%), n = 241 |
Therapy Duration Exceeding Guidelines, n (%), n = 1,498 | Significance | |
| Antimicrobials Dispensed or Recommended at Discharge | ||||
| Portion of Cohort Receiving Antimicrobial, n (%), n = 1,471 |
Therapy Duration Similar With Guidelines, n (%), n = 151 |
Therapy Duration Exceeding Guidelines, n (%), n = 1,320 | Significance | |
| ||||
| Third‐generation cephalosporins | 809 (46.5) | 75 (31.1) | 734 (49.0) | 0.001 |
| Fluoroquinolones | 836 (48.1) | 114 (47.3) | 722 (48.2) | 0.80 |
| Macrolides | 788 (45.3) | 90 (37.3) | 698 (46.6) | 0.01 |
| Pseudomonal ‐lactams | 692 (39.8) | 138 (57.3) | 554 (37.0) | 0.01 |
| Anti‐MRSA antimicrobials | 663 (38.1) | 135 (56.0) | 528 (35.3) | 0.01 |
| Other ‐lactams | 139 (8.0) | 10 (4.2) | 129 (8.6) | 0.02 |
| Tetracyclines | 119 (6.8) | 14 (5.8) | 105 (7.0) | 0.49 |
| Other | 97 (5.6) | 15 (6.2) | 82 (5.5) | 0.64 |
| Third‐generation cephalosporins | 285 (19.4) | 27 (17.9) | 258 (19.6) | 0.62 |
| Fluoroquinolones | 813 (55.3) | 95 (62.9) | 718 (54.4) | 0.05 |
| Macrolides | 203 (13.8) | 20 (13.3) | 183 (13.9) | 0.83 |
| Pseudomonal ‐lactams | 31 (2.1) | 4 (2.7) | 27 (2.1) | 0.62 |
| Anti‐MRSA antimicrobials | 45 (3.1) | 6 (4.0) | 39 (3.0) | 0.49 |
| Other ‐lactams | 239 (16.3) | 13 (8.6) | 226 (17.1) | 0.01 |
| Tetracyclines | 95 (6.5) | 10 (6.6) | 85 (6.4) | 0.93 |
| Other | 44 (3.0) | 5 (3.3) | 39 (3.0) | 0.81 |
Overall, 13.9% of patients with uncomplicated pneumonia received guideline‐similar duration of therapy (Table 3). A greater proportion of HCAP patients (29.0%) received guideline‐similar therapy duration as compared to CAP patients (6.9%) (P 0.01 (Table 3). Median duration of therapy was 7 days (interquartile range [IQR] = 78 days) for guideline‐similar therapy compared to 10 days (913 days) for therapy duration in excess of guideline recommendations. Overall, 97.1 % of patients met clinical stability criteria before day 4 of therapy, yet 50% received 4 days of intravenous (IV) therapy (median was 4 days, IQR = 36 days). Antimicrobial therapy was generally completed after discharge, as only 17.3% received their entire treatment course during hospitalization. Median duration of outpatient oral (PO) antimicrobial therapy was twice as long for guideline‐excessive therapy compared to guideline‐similar therapy (6 vs 3 days), whereas duration of inpatient IV and PO antimicrobial therapy was similar. Patients discharged on a fluoroquinolone were more likely to receive guideline‐similar duration of therapy. The VHA classifies facilities into 3 levels of complexity, with lower scores indicating more complex facilities.[21] Guideline‐similar therapy duration occurred in 10.4% of cases in lower complexity facilities (levels 2 and 3),and 15.1% in more complex facilities (level 1) (P = 0.01). The median duration of therapy was similar for more and less complex facilities, respectively (10 days, IQR = 812 days vs 10 days, IQR = 813 days).
| Outcome |
Therapy Duration Similar With IDSA/ATS Guidelines |
Therapy Duration in Excess of IDSA/ATS Guideline Recommendations | Significance |
|---|---|---|---|
| |||
| Antimicrobial duration consistent with guideline recommendations, n (%) | 241 (13.9) | 1,498 (86.1) | NR |
| CAP* | 83 (6.9) | 1,112 (93.1) | NR |
| HCAP* | 158 (29.0) | 386 (71.0) | NR |
| Total days of therapy for pneumonia, median (IQR) | 7 (78) | 10 (913) | NR |
| CAP | 6 (59) | 10 (812) | 0.01 |
| HCAP | 7 (78) | 11 (1014) | 0.01 |
| Days of IV therapy administered for pneumonia, median (IQR) | 4 (37) | 4 (36) | 0.50 |
| Days of PO inpatient therapy administered, median (IQR) | 1 (03) | 1 (03) | 0.78 |
| Days of PO outpatient therapy dispensed at discharge, median (IQR) | 3 (25) | 6 (47) | 0.01 |
| Days of PO outpatient therapy recommended in Discharge Summary for patients without a VA prescription, median (IQR) | 3 (24) | 5 (47) | 0.01 |
| Aggregate 28‐day hospital readmission, n (%) | 42 (17.4) | 183 (12.2) | 0.03 |
| CAP∥# | 7 (8.4) | 112 (10.1) | 0.58 |
| HCAP∥# | 35 (22.2) | 71 (18.4) | 0.28 |
| Aggregate 28‐day CDI rate, n (%) | 6 (2.5) | 9 (0.6) | 0.03 |
| CAP∥** | 1 (1.2) | 6 (0.5) | 0.44 |
| HCAP∥** | 5 (3.2) | 3 (0.8) | 0.04 |
| Aggregate 28‐day death after discharge, n (%) | 6 (2.5) | 52 (3.5) | 0.43 |
| CAP∥** | 1 (1.2) | 33 (3.0) | 0.35 |
| HCAP∥** | 5 (3.2) | 19 (4.9) | 0.37 |
The 28‐day postdischarge all‐cause readmission rate for patients who received guideline‐similar therapy duration was higher (17.4%) than for patients who received therapy duration in excess of guideline recommendations (12.2%) (P = 0.03). After adjustment for covariates associated with readmission (HCAP, age, prior skilled nursing facility residence, PSI score comorbidity elements), we found no evidence that patients who received guideline‐similar therapy duration were more likely to be readmitted than were patients who received guideline‐excessive duration (OR: 1.1 [95% CI: 0.8, 1.7]) (Table 3). Likewise, no difference in 28‐day all‐cause postdischarge mortality was identified between guideline‐similar and guideline‐excessive duration after adjustment for the same covariates (adjusted OR: 0.5 [95% CI: 0.2, 1.2]) (Table 4).
| Model Variables | Odds Ratio | 95% Confidence Interval | P Value |
|---|---|---|---|
| |||
| Readmission model | |||
| Duration of antibiotics | 1.11 | 0.75, 1.64 | 0.62 |
| HCAP | 1.94 | 1.38, 2.72 | 0.01 |
| Age | 1.01 | 1.00, 1.03 | 0.04 |
| Prior skilled nursing facility residence | 0.91 | 0.59, 1.40 | 0.67 |
| PSI score comorbidity elements | |||
| Neoplastic disease | 1.20 | 0.86, 1.67 | 0.29 |
| Liver disease | 1.55 | 0.66, 3.64 | 0.31 |
| CHF | 1.15 | 0.83, 1.59 | 0.41 |
| Cerebrovascular disease | 1.06 | 0.75, 1.50 | 0.75 |
| Renal disease | 1.51 | 1.09, 2.08 | 0.01 |
| Mortality model | |||
| Duration of antibiotics | 0.53 | 0.23, 1.22 | 0.14 |
| HCAP | 2.53 | 1.38, 4.65 | 0.01 |
| Age | 1.06 | 1.03, 1.09 | 0.01 |
| Prior skilled nursing facility residence | 0.79 | 0.38, 1.66 | 0.53 |
| PSI score comorbidity elements | |||
| Neoplastic disease | 1.03 | 0.57, 1.87 | 0.91 |
| Liver disease | 0.001 | 0.001, >999.9 | 0.98 |
| CHF | 0.73 | 0.39, 1.38 | 0.34 |
| Cerebrovascular disease | 0.82 | 0.43, 1.56 | 0.55 |
| Renal disease | 0.72 | 0.39, 1.35 | 0.31 |
CDI cases (n = 15) were too sparse to adequately perform multivariable logistic regression analysis; however, a higher percentage of patients who received guideline‐similar duration of therapy developed CDI compared to patients who received guideline‐excessive duration of therapy (40.0% vs 13.6%, P 0.01). The median duration of therapy for patients who did and did not develop CDI was similar (8 days, IQR = 714 days vs 10 days, IQR = 812 days, P = 0.85, respectively). Patients who developed CDI had a higher rate of HCAP diagnosis (1.5% vs 0.6%; P = 0.06), were more likely to have concomitant non‐pneumonia infection (40.0% vs 9.5%, P 0.01), have chronic comorbidity (86.7% vs 59.1%, P = 0.03), and to have been admitted to the ICU (26.7% vs 12.1%, P = 0.09).
DISCUSSION
IDSA/ATS guidelines for pneumonia duration of therapy generally agree with other professional society guidelines including the British Thoracic Society and National Institute for Health and Care Excellence.[22, 23] In contrast to existing evidence and guideline recommendations, this multi‐centered evaluation identified prolonged durations of antimicrobial therapy prescribed in 93% and 71% of patients with uncomplicated CAP and HCAP (Table 3), respectively.[3, 4, 5, 6, 7, 8, 9, 10, 11, 12] Almost all (97.1%) uncomplicated CAP and HCAP patients met clinical stability criteria before day 4 of hospitalization, yet the median duration of IV therapy was 4 days. Because criteria for IV to PO conversion and the clinical stability definition utilized in this analysis were similar, many patients may have been eligible for PO therapy earlier, favorably impacting length of stay, cost, and adverse effects.[3, 12, 24, 25, 26] Although median days of inpatient PO therapy administered was 1 day (IQR = 03 days), inpatient observation after PO conversion may not be necessary. The duration of PO therapy was based on calendar days, where if a patient received 1 dose of a once daily antibiotic (ie, levofloxacin), they were considered to have received 1 day of inpatient PO antibiotics even if discharged the same day.
Approximately half of all days of therapy occurred after discharge. Although the median therapy duration for inpatients was similar, the median duration of antimicrobials administered upon hospital discharge was twice as long for patients receiving guideline‐excessive compared to guideline‐similar duration of therapy. The median excess in antibiotic duration is almost entirely accounted for by excess outpatient days of therapy. This is an important consideration for antimicrobial stewardship programs that tend to focus on inpatient antimicrobial use.
Noteworthy observations include the low rate of respiratory tract culture collection (41%) and frequent use of fluoroquinolones upon discharge. Collection of respiratory tract cultures is recommended for all patients with HCAP and patients with CAP who have risk factors for resistant pathogens, characteristics that were common in this cohort.[3, 4] Recently, we identified that respiratory culture collection is associated with increased de‐escalation rates in HCAP, and that culture‐negative patients frequently receive fluoroquinolones.[27] IDSA/ATS CAP guidelines discourage empirically switching to PO fluoroquinolone therapy based on bioavailability considerations alone.[3] Further, fluoroquinolones are considered to be associated with high risk of CDI.[28, 29] Prescription of fluoroquinolone upon discharge was associated with guideline‐similar duration of therapy and was not shown to be associated with CDI; however, power to detect differences between exposures to specific antimicrobials and CDI was low.
CDI was more common in patients with CAP (1.2% vs 0.5%) and HCAP (3.2% vs 0.8%) who received duration of therapy similar with guideline recommendations. This observation is confounded, as patients with CDI had significantly greater comorbidity as well as secondary infections and tended to more frequently receive ICU care. There were no differences in adjusted rates of readmission or death between patients receiving guideline‐similar and guideline‐excessive duration of therapy.
Evaluation strengths included exclusion of patients with complicating conditions possibly requiring prolonged antimicrobial treatment courses, which allowed the evaluation to focus on patients most likely to benefit from shorter course therapy. The definition of appropriate therapy duration was based upon daily assessment of clinical stability criteria that paralleled the CAP guidelines. The definition utilized objective parameters while accounting for patient variability in achieving clinical stability criteria. Finally, the analyses of clinical end points suggest that shorter duration of therapy may be as safe and effective as longer duration of therapy in uncomplicated pneumonia.
Limitations include those common to other analyses conducted within the VHA, including a predominantly elderly male cohort.[30] Only ICD‐9‐CM codes consistent with a discharge diagnosis of pneumonia were used to identify the cohort, and clinical impressions not documented in the medical record may have impacted the clinician's treatment duration decisions. The upper limit of appropriate duration of therapy for CAP was arbitrarily set at up to 3 days beyond meeting clinical stability criteria to provide a reasonable duration of appropriate therapy beyond clinical stability to operationalize the duration of therapy recommendations within the context of the IDSA/ATS guidelines. Additionally, CIs for the ORs of readmission and mortality were broad, and thus too imprecise to determine whether guideline‐similar durations increased or decreased readmission or mortality in comparison with therapy that exceeded guideline recommendations. We could not fully assess the potential for association between guideline‐excessive therapy duration and risk for CDI due to sparse cases. Finally, non‐VA prescription data were not available for all patients, and we relied on intended duration of therapy as recommended by the discharging provider in 4.1% of cases.
Most quality assessments of pneumonia treatment have focused on antimicrobial selection and timely administration or conversion from IV to PO therapy.[31, 32] This evaluation identified potential opportunities for expansion of antimicrobial stewardship activities during the transition of care setting. The efficacy of short‐course ‐lactam, macrolide, or fluoroquinolone therapy for CAP appears equivalent to longer treatment regimens with no difference in adverse event rates, suggesting that optimal duration of therapy may be a rational target for quality improvement.[5, 6, 7, 8, 9, 10, 11, 12, 15, 31] Recommendations for HCAP duration of therapy are extrapolated from a prospective multicentered study, which randomized patients with hospital‐acquired pneumonia to receive 8 versus 15 days of therapy, that identified similar outcomes to ours.[4, 12]
Single‐center studies have identified that antimicrobial therapy for pneumonia is frequently prescribed for longer than recommended by guidelines, which found a similar median duration of therapy as our evaluation.[15, 16] Similar to Jenkins et al., we observed a high rate of fluoroquinolone prescriptions upon discharge.[16]
There are few published examples of interventions designed to limit excessive duration of therapy, particularly for antimicrobials prescribed upon hospital discharge.[15, 33, 34] Serial procalcitonin measurements have been used to guide duration of therapy for pneumonia; however, the costbenefit ratio of procalcitonin measurement is unclear.[35, 36] Procalcitonin use was uncommon, and none of the participating facilities in our evaluation utilized a specific algorithm to guide therapy duration. Limited data suggest that patient‐level prospective audit with feedback may be effective. Advic et al. evaluated management of presumed CAP before and after education and prospective feedback to medical teams concerning antimicrobial selection and duration of therapy.[15] The intervention led to a decrease in median duration of therapy from 10 days (IQR = 813 days) to 7 days (IQR = 78 days) without increasing clinical failure or readmission rates. We recently reported a single‐center evaluation in which pharmacists utilizing a decision support tool while performing discharge medication reconciliation were able to reduce excessive mean duration of therapy from 9.5 days ( 2.4 days) to 8.3 days ( 2.9 days) in patients without complicated pneumonia, with a 19.2% reduction in duration of therapy prescribed at discharge.[37] A similar approach utilizing pharmacists performing discharge review has recently been reported in a community hospital.[38]
Future work should recognize that few patients complete their entire course of therapy as inpatients, and the majority of treatment is prescribed upon discharge. Pivotal time points for antimicrobial stewardship intervention include day 2 to 3 of hospitalization when conveying suggestions for antimicrobial de‐escalation and/or IV to PO conversion, and toward the end of hospitalization during discharge planning. Although it may not be feasible for antimicrobial stewards to review all uncomplicated cases of pneumonia during hospitalization, most facilities have a systematic process for reviewing medications during transitions of care. We believe that interventions intended to assess and recommend shortened courses of therapy are appropriate. These interventions should include a mechanism for support by stewardship personnel or other infectious diseases specialists. Based on our evaluation, the ASTF produced and disseminated clinical guidance documents and tools to triage pneumonia case severity and assess response to therapy. Qualified personnel are encouraged to use this information to make recommendations to providers regarding excessive duration of therapy for uncomplicated cases where appropriate. Other work should include an in‐depth assessment of clinical outcomes related to treatment duration, investigation of provider rationale for prolonged treatment, and duration of antimicrobial therapy prescribed upon discharge for other common disease states. Finally, manual chart review to classify uncomplicated cases and related outcomes was laborious, and automated case identification is technologically plausible and should be explored.[39]
In conclusion, this national VHA MUE found that patients with uncomplicated pneumonia were commonly prescribed antimicrobials for the duration of therapy in excess of guideline recommendations. Patients with uncomplicated pneumonia who received therapy duration consistent with guideline recommendations did not have significantly different all‐cause readmission and death rates compared to patients receiving prolonged treatment. Approximately half of all therapy was prescribed upon hospital discharge, and clinicians as well as antimicrobial stewardship programs should consider these findings to address excessive duration of antimicrobial therapy upon hospital discharge.
Acknowledgements
The authors acknowledge Dr. Michael Fine for his assistance with utilization of the Pneumonia Severity Index, Kenneth Bukowski for assisting with development of data collection tools and data management, and members of the Antimicrobial Stewardship Taskforce Implementation Sub‐Committee. Collaborators in the Pneumonia Duration of Therapy Medication Utilization Evaluation Group include: Biloxi VA (VA Gulf Coast): Cheryl Hankins, PharmD, BCPS; Central Alabama VAMC: Lauren Rass, PharmD, BCPS, Kelly Mooney, PharmD, BCPS; Central Arkansas: Nicholas Tinsley, MS, PharmD; Chillicothe VA: Stephen Hanson, PharmD, BCPS, Beth Gallaugher, BSN, RN, Elizabeth Baltenberger, PharmD; Cincinnati VA: Jason Hiett, PharmD, BCPS, Victoria Tate, PharmD, BCPS, Brian Salzman, PharmD; Dorn Medical Center: MaryAnne Maurer, PharmD, BCPS, BCACP, Rebekah Sipes, PharmD, BCACP, Ginger Ervin, PharmD; Dwight D. Eisenhower VAMC: Emily Potter, PharmD; Hudson Valley: Rita Lee Bodine, PharmD, Clement Chen, PharmD, Cristina Fantino, PharmD; James H. Quillen VAMC: Marty Vannoy, PharmD, BCPS, Erin Harshbarger, PharmD, Kristen Nelsen, PharmD; Jesse Brown VAMC: Lisa Young, PharmD, BCPS, AQ‐ID, Andrea Bidlencik, PharmD, BCPS; Kansas City VA: Jamie Guyear, PharmD, AQ‐ID, Ann Ungerman, PharmD, BCPS, Lauri Witt, PharmD, BCACP; Louis Stokes Cleveland VAMC: Amy Hirsch, PharmD, BCPS, Steven Adoryan, PharmD, BCP‐CC, Amanda Miller, PharmD, BCPS; Maine VAMC: Joel Coon, PharmD, Rachel Naida, PharmD, Kelly Grossman, PharmD; Martinsburg VAMC: Kelly Li, PharmD, Sarah Mickanis, PharmD, BCPS; Miami VA Medical Center: Mara Carrasquillo, BS, PharmD, Maribel Toro, PharmD; North Florida/South Georgia Veterans Health System: Nora Morgan, PharmD, Hugh Frank, PharmD, BCPS, BCPP, Sarah Onofrio, PharmD, BCPS; North Texas HCS: Susan Duquaine, PharmD, BCPS, AQ‐ID, Ruben Villaneuva, PharmD, BCPS, Jaela Dahl, PharmD, BCPS; Ozarks: Andrew Siler, PharmD, BCPS, Michele Walker, PharmD, CGP, Jennifer Cole, PharmD, BCPS, BCCCP; Providence VAMC: Kerry LaPlante, PharmD, FCCP, Lindsey Williamson, PharmD; Richmond VA: Daniel Tassone, PharmD, BCPS; Salisbury VAMC: Brett Norem, PharmD, Marrisa Ragonesi, PharmD; San Juan VA: Monica Sanabria‐Seda, PharmD, BCPS, Jaime Velez‐Fores, PharmD, BCPS, AQ‐ID, Norma Ayala‐Burgos, PharmD; Sioux Falls VA: Andrea Aylward, PharmD, BCPS; South Texas HCS: Kelly Echevarria, PharmD, BCPS, AQ‐ID, Manuel Escobar, PharmD; Tennessee Valley HCS: Casey Ryals, PharmD, BCACP, Molly Hurst, PharmD, Jonathan Hale, PharmD; VA Central Iowa Health Care System: Jenny Phabmixay, PharmD, BCPS, Mackenzie Brown, PharmD, BCPS, Cynthia Muthusi, PharmD, BCPS; VA Loma Linda: Tony Chau, PharmD; VA Sierra Nevada: Scott Mambourg, PharmD, BCPS, AAHIVP, Matthew Han, PharmD, Nathan Mihoch, PharmD; VA WNY Healthcare System: Kari Mergenhagen, PharmD, BCPS, AQ‐ID, Christine Ruh, PharmD, BCPS; Veterans Affairs Salt Lake City Health System: Emily Spivak, MD, MHS, Patricia Orlando, PharmD
Disclosures: Karl Madaras‐Kelly is employed full time by Idaho State University and has a without compensation appointment as a clinical pharmacist at the Boise VA Medical Center. He receives grant support unrelated to this work through the Department of Veterans Affairs subcontracted to Idaho State University. Muriel Burk is employed full time through the Department of Veterans Affairs as clinical pharmacy specialist in outcomes and medication safety evaluation. Christina Caplinger was employed by the Department of Veterans Affairs as an infectious diseases fellow at the time this work was completed. She is currently employed by Micromedex. Jefferson Bohan is employed full time by the Department of Veterans Affairs as an infectious diseases fellow. Melinda Neuhauser is employed full time through the Department of Veterans Affairs as a clinical pharmacy specialistinfectious diseases. Matthew Goetz is employed full time through the Department of Veterans Affairs as an infectious diseases physician. Rhongping Zhang is employed full time through the Department of Veterans Affairs as a data analyst. Francesca Cunningham is employed full time through the Department of Veterans Affairs as the director of the VA Center for Medication Safety. This work was supported with resources and use of the Department of Veterans Affairs healthcare system. The views expressed in this article are solely those of the authors and do not necessarily reflect the position or policy of the Department of Veterans Affairs. The authors report no conflicts of interest.
- Centers for Disease Control and Prevention. National hospital discharge survey 2010. Available at: http://www.cdc.gov/nchs/fastats/pneumonia.htm. Accessed December 1, 2014.
- , , , et al. Implementing an antibiotic stewardship program: guidelines by the Infectious Diseases Society of America and the Society for Healthcare Epidemiology of America. Clin Infect Dis. 2016;62(10):e51–e77.
- , , , et al. Infectious Diseases Society of America/American Thoracic Society consensus guidelines on the management of community‐acquired pneumonia in adults. Clin Infect Dis. 2007;44(suppl 2):S27–S72.
- American Thoracic Society; Infectious Diseases Society of America. Guidelines for the management of adults with hospital‐acquired, ventilator‐associated, and healthcare‐associated pneumonia. Am J Respir Crit Care Med. 2005;171(4):388–416.
- , , , et al. Short‐ versus long‐course antibacterial therapy for community‐acquired pneumonia: a meta‐analysis. Drugs. 2008;68(13):1841–1854.
- , , , et al. Efficacy of short‐course antibiotic regimens for community‐acquired pneumonia: a meta‐analysis. Am J Med. 2007;120:783–790.
- , , , et al. High‐dose, short‐course levofloxacin for community‐acquired pneumonia: a new treatment paradigm. Clin Infect Dis. 2003;37:752–760.
- , , , et al. Comparison of 7 versus 10 days of antibiotic therapy for hospitalized patients with uncomplicated community‐acquired pneumonia: a prospective. Am J Ther. 1999;6(4):217–222.
- , , , et al. Effectiveness of discontinuing antibiotic treatment after three days versus eight days in mild to moderate‐severe community acquired pneumonia: randomised, double blind trial. BMJ. 2006;332(7554):1355.
- , , , et al. Efficacy of a three day course of azithromycin in moderately severe community‐acquired pneumonia. Eur Respir J. 1995;8(3):398–402.
- , , , et al. Comparison of 8 vs 15 days of antibiotic therapy for ventilator‐associated pneumonia in adults: a randomized trial. JAMA. 2003;290(19):2588–2598.
- , , , et al. Effectiveness of early switch from intravenous to oral antibiotics in severe community acquired pneumonia: multicentre randomized trial. BMJ. 2006;333(7580):1193.
- , , , , . Unnecessary antimicrobial use in the context of Clostridium difficile infection: a call to arms for the Veterans Affairs Antimicrobial Stewardship Task Force. Infect Control Hosp Epidemiol. 2013;34(6):651–653.
- VHA Directive 1031. Antimicrobial stewardship programs. Available at: https://www1.va.gov/vhapublications/ViewPublication.asp?pub_ID=2964. Accessed December 1, 2014.
- , , , et al. Impact of an antimicrobial stewardship intervention on shortening the duration of therapy for community‐acquired pneumonia. Clin Infect Dis. 2012;54:1581–1587.
- , , , et al. Targets for antibiotic and healthcare resource stewardship in inpatient community‐acquired pneumonia: a comparison of management practices with National Guideline Recommendations. Infection. 2013;41(1):135–144.
- , , , , . Pharmacy benefits management in the Veterans Health Administration: 1995 to 2003. Am J Manag Care. 2005;11(2):104–112.
- , , , . Accuracy of administrative data for identifying patients with pneumonia. Am J Med Qual. 2005;20(6):319–328.
- , , , et al. A prediction rule to identify low‐risk patients with community‐acquired pneumonia. N Engl J Med. 1997;336:243–250.
- , , , , . Clostridium difficile infections in Veterans Health Administration acute care facilities. Infect Control Hosp Epidemiol. 2014;35(8):1037–1042.
- , , , , . Organization complexity and primary care providers' perceptions of quality improvement culture within the Veterans Health Administration. Am J Med Qual. 2016;31(2):139–146.
- , , , et al. BTS guidelines for the management of community acquired pneumonia in adults: update 2009. Thorax. 2009;64(suppl 3):iii1–iii55.
- National Institute for Health and Care Excellence. Pneumonia in adults: diagnosis and management. Available at: http://www.nice.org.uk/guidance/cg191. Published December 2014. Accessed May 9, 2016.
- , , , , , . A prospective randomized study of inpatient IV antibiotics for community‐acquired pneumonia: the optimal duration of therapy. Chest. 1996;110(4):965–971.
- , , , et al. Early switch from intravenous to oral antibiotics and early hospital discharge: a prospective observational study of 200 consecutive patients with community‐acquired pneumonia. Arch Intern Med. 1999;159(20):2449–2454.
- , , , . Correlates and economic and clinical outcomes of an adult IV to PO antimicrobial conversion program at an academic medical center in Midwest United States. J Pharm Pract. 2015;28(3):238–248.
- , , , et al. Antimicrobial De‐escalation of treatment for healthcare‐associated pneumonia within the Veterans Healthcare Administration. J Antimicrob Chemother. 2016;71(2):539–546.
- , , , et al. Community‐associated Clostridium difficile infection and antibiotics: a meta‐analysis. J Antimicrob Chemother. 2013;68(9):1951.
- , , , . Meta‐analysis of antibiotics and the risk of community‐associated Clostridium difficle infection. Antimicrob Agents Chemother. 2013;57(5):2326–2332.
- , , , et al. Evaluating diagnosis‐based case‐mix measures: how well do they apply to the VA population? Med Care. 2001;39:692–704.
- , , . What is the role of antimicrobial stewardship in improving outcomes of patients with CAP? Infect Dis Clin North Am. 2013;27(1):211–228.
- , , , et al. Quality of care for elderly patients hospitalized for pneumonia in the United States, 2006 to 2010. JAMA Intern Med. 2014;174(11):1806–1814.
- , , , et al. An evaluation of the impact of antibiotic stewardship on reducing the use of high‐risk antibiotics and its effect on the incidence of Clostridium difficile infection in hospital settings. J Antimicrob Chemother. 2012;67(12):2988–2996.
- , , , et al.; Centers for Disease Control and Prevention. Vital signs: improving antibiotic use among hospitalized patients. MMWR Morb Mortal Wkly Rep. 2014;63(9):194–200.
- , , et al. Effect of procalcitonin‐based guidelines vs standard guidelines on antibiotic use in lower respiratory tract infections: the ProHOSP randomized controlled trial. JAMA. 2009;302(10):1059–1066.
- , , , et al. Cost‐effectiveness of procalcitonin‐guided antibiotic use in community acquired pneumonia. J Gen Intern Med. 2013;28(9):1157–1164.
- , , , , , . Interim evaluation of a Protocol to Optimize the Duration of Pneumonia Therapy at Hospital Discharge. Open Forum Infect Dis. 2015;2(suppl 1):S379.
- , , , et al. Intervention to improve antibiotic selection and shorten treatment durations at the time of hospital discharge. Open Forum Infect Dis. 2015;2(suppl 1):S1.
- , , , et al. Using the electronic medical record to identify community‐acquired pneumonia: toward a replicable automated strategy. PLoS One. 2013;8(8):e70944.
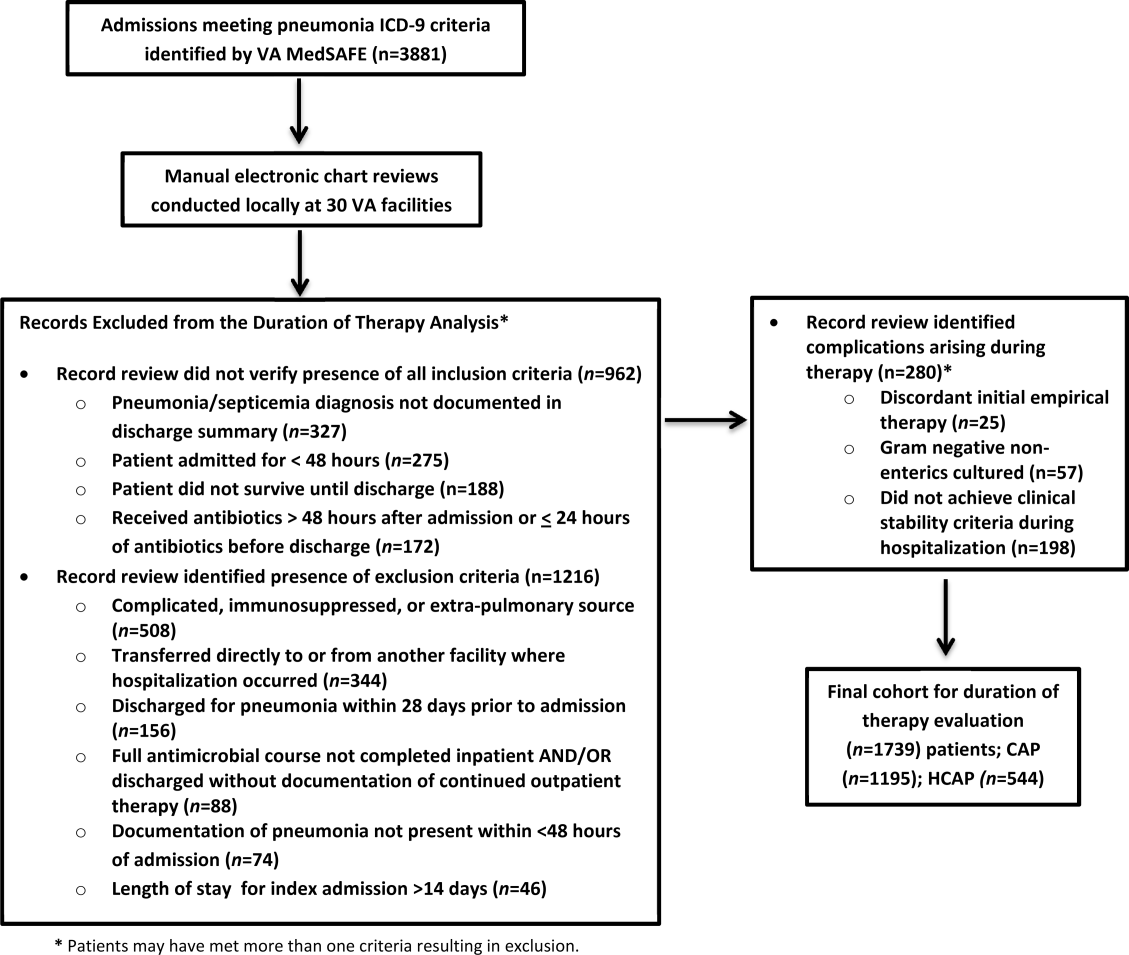
Comportment and Communication Score
In 2014, there were more than 40,000 hospitalists in the United States, and approximately 20% were employed by academic medical centers.[1] Hospitalist physicians groups are committed to delivering excellent patient care. However, the published literature is limited with respect to defining optimal care in hospital medicine.
Patient satisfaction surveys, such as Press Ganey (PG)[2] and Hospital Consumer Assessment of Healthcare Providers and Systems,[3] are being used to assess patients' contentment with the quality of care they receive while hospitalized. The Society of Hospital Medicine, the largest professional medical society representing hospitalists, encourages the use of patient satisfaction surveys to measure hospitalist providers' quality of patient care.[4] There are, however, several problems with the current methods. First, the attribution to specific providers is questionable. Second, recall about the provider by the patients may be poor because surveys are sent to patients days after they return home. Third, the patients' recovery and health outcomes are likely to influence their assessment of the doctor. Finally, feedback is known to be most valuable and transformative when it is specific and given in real time. Thus, a tool that is able to provide feedback at the encounter level should be more helpful than a tool that offers assessment at the level of the admission, particularly when it can be also delivered immediately after the data are collected.
Comportment has been used to describe both the way a person behaves and also the way she carries herself (ie, her general manner).[5] Excellent comportment and communication can serve as the foundation for delivering patient‐centered care.[6, 7, 8] Patient centeredness has been shown to improve the patient experience and clinical outcomes, including compliance with therapeutic plans.[9, 10, 11] Respectful behavior, etiquette‐based medicine, and effective communication also lay the foundation upon which the therapeutic alliance between a doctor and patient can be built.
The goal of this study was to establish a metric that could comprehensively assess a hospitalist provider's comportment and communication skills during an encounter with a hospitalized patient.
METHODS
Study Design and Setting
An observational study of hospitalist physicians was conducted between June 2013 and December 2013 at 5 hospitals in Maryland and Washington DC. Two are academic medical centers (Johns Hopkins Hospital and Johns Hopkins Bayview Medical Center [JHBMC]), and the others are community hospitals (Howard County General Hospital [HCGH], Sibley Memorial Hospital [SMC], and Suburban Hospital). These 5 hospitals, across 2 large cities, have distinct culture and leadership, each serving different populations.
Subjects
In developing a tool to measure communication and comportment, we needed to observe physicianpatient encounters wherein there would be a good deal of variability in performance. During pilot testing, when following a few of the most senior and respected hospitalists, we noted encounters during which they excelled and others where they performed less optimally. Further, in following some less‐experienced providers, their skills were less developed and they were uniformly missing most of the behaviors on the tool that were believed to be associated with optimal communication and comportment. Because of this, we decided to purposively sample the strongest clinicians at each of the 5 hospitals in hopes of seeing a range of scores on the tool.
The chiefs of hospital medicine at the 5 hospitals were contacted and asked to identify their most clinically excellent hospitalists, namely those who they thought were most clinically skilled within their groups. Because our goal was to observe the top tier (approximately 20%) of the hospitalists within each group, we asked each chief to name a specific number of physicians (eg, 3 names for 1 group with 15 hospitalists, and 8 from another group with 40 physicians). No precise definition of most clinically excellent hospitalists was provided to the chiefs. It was believed that they were well positioned to select their best clinicians because of both subjective feedback and objective data that flow to them. This postulate may have been corroborated by the fact that each of them efficiently sent a list of their top choices without any questions being asked.
The 29 hospitalists (named by their chiefs) were in turn emailed and invited to participate in the study. All but 3 hospitalists consented to participate in the study; this resulted in a cohort of 26 who would be observed.
Tool Development
A team was assembled to develop the hospital medicine comportment and communication observation tool (HMCCOT). All team members had extensive clinical experience, several had published articles on clinical excellence, had won clinical awards, and all had been teaching clinical skills for many years. The team's development of the HMCCOT was extensively informed by a review of the literature. Two articles that most heavily influenced the HMCCOT's development were Christmas et al.'s paper describing 7 core domains of excellence, 2 of which are intimately linked to communication and comportment,[12] and Kahn's text that delineates behaviors to be performed upon entering the patient's room, termed etiquette‐based medicine.[6] The team also considered the work from prior timemotion studies in hospital medicine,[7, 13] which led to the inclusion of temporal measurements during the observations. The tool was also presented at academic conferences in the Division of General Internal Medicine at Johns Hopkins and iteratively revised based on the feedback. Feedback was sought from people who have spent their entire career studying physicianpatient relationships and who are members of the American Academy on Communication in Healthcare. These methods established content validity evidence for the tool under development. The goal of the HMCCOT was to assess behaviors believed to be associated with optimal comportment and communication in hospital medicine.
The HMCCOT was pilot tested by observing different JHBMC hospitalists patient encounters and it was iteratively revised. On multiple occasions, 2 authors/emnvestigators spent time observing JHBMC hospitalists together and compared data capture and levels of agreement across all elements. Then, for formal assessment of inter‐rater reliability, 2 authors observed 5 different hospitalists across 25 patient encounters; the coefficient was 0.91 (standard error = 0.04). This step helped to establish internal structure validity evidence for the tool.
The initial version of the HMCCOT contained 36 elements, and it was organized sequentially to allow the observer to document behaviors in the order that they were likely to occur so as to facilitate the process and to minimize oversight. A few examples of the elements were as follows: open‐ended versus a close‐ended statement at the beginning of the encounter, hospitalist introduces himself/herself, and whether the provider smiles at any point during the patient encounter.
Data Collection
One author scheduled a time to observe each hospitalist physician during their routine clinical care of patients when they were not working with medical learners. Hospitalists were naturally aware that they were being observed but were not aware of the specific data elements or behaviors that were being recorded.
The study was approved by the institutional review board at the Johns Hopkins University School of Medicine, and by each of the research review committees at HCGH, SMC, and Suburban hospitals.
Data Analysis
After data collection, all data were deidentified so that the researchers were blinded to the identities of the physicians. Respondent characteristics are presented as proportions and means. Unpaired t test and 2 tests were used to compare demographic information, and stratified by mean HMCCOT score. The survey data were analyzed using Stata statistical software version 12.1 (StataCorp LP, College Station, TX).
Further Validation of the HMCCOT
Upon reviewing the distribution of data after observing the 26 physicians with their patients, we excluded 13 variables from the initial version of the tool that lacked discriminatory value (eg, 100% or 0% of physicians performed the observed behavior during the encounters); this left 23 variables that were judged to be most clinically relevant in the final version of the HMCCOT. Two examples of the variables that were excluded were: uses technology/literature to educate patients (not witnessed in any encounter), and obeys posted contact precautions (done uniformly by all). The HMCCOT score represents the proportion of observed behaviors (out of the 23 behaviors). It was computed for each hospitalist for every patient encounter. Finally, relation to other variables validity evidence would be established by comparing the mean HMCCOT scores of the physicians to their PG scores from the same time period to evaluate the correlation between the 2 scores. This association was assessed using Pearson correlations.
RESULTS
The average clinical experience of the 26 hospitalist physicians studied was 6 years (Table 1). Their mean age was 38 years, 13 (50%) were female, and 16 (62%) were of nonwhite race. Fourteen hospitalists (54%) worked at 1 of the nonacademic hospitals. In terms of clinical workload, most physicians (n = 17, 65%) devoted more than 70% of their time working in direct patient care. Mean time spent observing each physician was 280 minutes. During this time, the 26 physicians were observed for 181 separate clinical encounters; 54% of these patients were new encounters, patients who were not previously known to the physician. The average time each physician spent in a patient room was 10.8 minutes. Mean number of observed patient encounters per hospitalist was 7.
| Total Study Population, n = 26 | HMCCOT Score 60, n = 14 | HMCCOT Score >60, n = 12 | P Value* | |
|---|---|---|---|---|
| ||||
| Age, mean (SD) | 38 (5.6) | 37.9 (5.6) | 38.1 (5.7) | 0.95 |
| Female, n (%) | 13 (50) | 6 (43) | 7 (58) | 0.43 |
| Race, n (%) | ||||
| Caucasian | 10 (38) | 5 (36) | 5 (41) | 0.31 |
| Asian | 13 (50) | 8 (57) | 5 (41) | |
| African/African American | 2 (8) | 0 (0) | 2 (17) | |
| Other | 1 (4) | 1 (7) | 0 (0) | |
| Clinical experience >6 years, n (%) | 12 (46) | 6 (43) | 6 (50) | 0.72 |
| Clinical workload >70% | 17 (65) | 10 (71) | 7 (58) | 0.48 |
| Academic hospitalist, n (%) | 12 (46) | 5 (36) | 7 (58) | 0.25 |
| Hospital | 0.47 | |||
| JHBMC | 8 (31) | 3 (21.4) | 5 (41) | |
| JHH | 4 (15) | 2 (14.3) | 2 (17) | |
| HCGH | 5 (19) | 3 (21.4) | 2 (17) | |
| Suburban | 6 (23) | 3 (21.4) | 3 (25) | |
| SMC | 3 (12) | 3 (21.4) | 0 (0) | |
| Minutes spent observing hospitalist per shift, mean (SD) | 280 (104.5) | 280.4 (115.5) | 281.4 (95.3) | 0.98 |
| Average time spent per patient encounter in minutes, mean (SD) | 10.8 (8.9) | 8.7 (9.1) | 13 (8.1) | 0.001 |
| Proportion of observed patients who were new to provider, % | 97 (53.5) | 37 (39.7) | 60 (68.1) | 0.001 |
The distribution of HMCCOT scores was not statistically significantly different when analyzed by age, gender, race, amount of clinical experience, clinical workload of the hospitalist, hospital, time spent observing the hospitalist (all P > 0.05). The distribution of HMCCOT scores was statistically different in new patient encounters compared to follow‐ups (68.1% vs 39.7%, P 0.001). Encounters with patients that generated HMCCOT scores above versus below the mean were longer (13 minutes vs 8.7 minutes, P 0.001).
The mean HMCCOT score was 61 (standard deviation [SD] = 10.6), and it was normally distributed (Figure 1). Table 2 shows the data for the 23 behaviors that were objectively assessed as part of the HMCCOT for the 181 patient encounters. The most frequently observed behaviors were physicians washing hands after leaving the patient's room in 170 (94%) of the encounters and smiling (83%). The behaviors that were observed with the least regularity were using an empathic statement (26% of encounters), and employing teach‐back (13% of encounters). A common method of demonstrating interest in the patient as a person, seen in 41% of encounters, involved physicians asking about patients' personal histories and their interests.
| Variables | All Visits Combined, n = 181 | HMCCOT Score 60, n = 93 | HMCCOT Score >60, n = 88 | P Value* |
|---|---|---|---|---|
| ||||
| Objective observations, n (%) | ||||
| Washes hands after leaving room | 170 (94) | 83 (89) | 87 (99) | 0.007 |
| Discusses plan for the day | 163 (91) | 78 (84) | 85 (99) | 0.001 |
| Does not interrupt the patient | 159 (88) | 79 (85) | 80 (91) | 0.21 |
| Smiles | 149 (83) | 71 (77) | 78 (89) | 0.04 |
| Washes hands before entering | 139 (77) | 64 (69) | 75 (85) | 0.009 |
| Begins with open‐ended question | 134 (77) | 68 (76) | 66 (78) | 0.74 |
| Knocks before entering the room | 127 (76) | 57 (65) | 70 (89) | 0.001 |
| Introduces him/herself to the patient | 122 (67) | 45 (48) | 77 (88) | 0.001 |
| Explains his/her role | 120 (66) | 44 (47) | 76 (86) | 0.001 |
| Asks about pain | 110 (61) | 45 (49) | 65 (74) | 0.001 |
| Asks permission prior to examining | 106 (61) | 43 (50) | 63 (72) | 0.002 |
| Uncovers body area for the physical exam | 100 (57) | 34 (38) | 66 (77) | 0.001 |
| Discusses discharge plan | 99 (55) | 38 (41) | 61 (71) | 0.001 |
| Sits down in the patient room | 74 (41) | 24 (26) | 50 (57) | 0.001 |
| Asks about patient's feelings | 58 (33) | 17 (19) | 41 (47) | 0.001 |
| Shakes hands with the patient | 57 (32) | 17 (18) | 40 (46) | 0.001 |
| Uses teach‐back | 24 (13) | 4 (4.3) | 20 (24) | 0.001 |
| Subjective observations, n (%) | ||||
| Avoids medical jargon | 160 (89) | 85 (91) | 83 (95) | 0.28 |
| Demonstrates interest in patient as a person | 72 (41) | 16 (18) | 56 (66) | 0.001 |
| Touches appropriately | 62 (34) | 21 (23) | 41 (47) | 0.001 |
| Shows sensitivity to patient modesty | 57 (93) | 15 (79) | 42 (100) | 0.002 |
| Engages in nonmedical conversation | 54 (30) | 10 (11) | 44 (51) | 0.001 |
| Uses empathic statement | 47 (26) | 9 (10) | 38 (43) | 0.001 |

The average composite PG scores for the physician sample was 38.95 (SD=39.64). A moderate correlation was found between the HMCCOT score and PG score (adjusted Pearson correlation: 0.45, P = 0.047).
DISCUSSION
In this study, we followed 26 hospitalist physicians during routine clinical care, and we focused intently on their communication and their comportment with patients at the bedside. Even among clinically respected hospitalists, the results reveal that there is wide variability in comportment and communication practices and behaviors at the bedside. The physicians' HMCCOT scores were associated with their PG scores. These findings suggest that improved bedside communication and comportment with patients might translate into enhanced patient satisfaction.
This is the first study that honed in on hospitalist communication and comportment. With validity evidence established for the HMCCOT, some may elect to more explicitly perform these behaviors themselves, and others may wish to watch other hospitalists to give them feedback that is tied to specific behaviors. Beginning with the basics, the hospitalists we studied introduced themselves to their patients at the initial encounter 78% of the time, less frequently than is done by primary care clinicians (89%) but more consistently than do emergency department providers (64%).[7] Other variables that stood out in the HMCCOT was that teach‐back was employed in only 13% of the encounters. Previous studies have shown that teach‐back corroborates patient comprehension and can be used to engage patients (and caregivers) in realistic goal setting and optimal health service utilization.[14] Further, patients who clearly understand their postdischarge plan are 30% less likely to be readmitted or visit the emergency department.[14] The data for our group have helped us to see areas of strengths, such as hand washing, where we are above compliance rates across hospitals in the United States,[15] as well as those matters that represent opportunities for improvement such as connecting more deeply with our patients.
Tackett et al. have looked at encounter length and its association with performance of etiquette‐based medicine behaviors.[7] Similar to their study, we found a positive correlation between spending more time with patients and higher HMCCOT scores. We also found that HMCCOT scores were higher when providers were caring for new patients. Patients' complaints about doctors often relate to feeling rushed, that their physicians did not listen to them, or that information was not conveyed in a clear manner.[16] Such challenges in physicianpatient communication are ubiquitous across clinical settings.[16] When successfully achieved, patient‐centered communication has been associated with improved clinical outcomes, including adherence to recommended treatment and better self‐management of chronic disease.[17, 18, 19, 20, 21, 22, 23, 24, 25, 26] Many of the components of the HMCCOT described in this article are at the heart of patient‐centered care.
Several limitations of the study should be considered. First, physicians may have behaved differently while they were being observed, which is known as the Hawthorne effect. We observed them for many hours and across multiple patient encounters, and the physicians were not aware of the specific types of data that we were collecting. These factors may have limited the biases along such lines. Second, there may be elements of optimal comportment and communication that were not captured by the HMCCOT. Hopefully, there are not big gaps, as we used multiple methods and an iterative process in the refinement of the HMCCOT metric. Third, one investigator did all of the observing, and it is possible that he might have missed certain behaviors. Through extensive pilot testing and comparisons with other raters, the observer became very skilled and facile with such data collection and the tool. Fourth, we did not survey the same patients that were cared for to compare their perspectives to the HMCCOT scores following the clinical encounters. For patient perspectives, we relied only on PG scores. Fifth, quality of care is a broad and multidimensional construct. The HMCCOT focuses exclusively on hospitalists' comportment and communication at the bedside; therefore, it does not comprehensively assess care quality. Sixth, with our goal to optimally validate the HMCCOT, we tested it on the top tier of hospitalists within each group. We may have observed different results had we randomly selected hospitalists from each hospital or had we conducted the study at hospitals in other geographic regions. Finally, all of the doctors observed worked at hospitals in the Mid‐Atlantic region. However, these five distinct hospitals each have their own cultures, and they are led by different administrators. We purposively chose to sample both academic as well as community settings.
In conclusion, this study reports on the development of a comportment and communication tool that was established and validated by following clinically excellent hospitalists at the bedside. Future studies are necessary to determine whether hospitalists of all levels of experience and clinical skill can improve when given data and feedback using the HMCCOT. Larger studies will then be needed to assess whether enhancing comportment and communication can truly improve patient satisfaction and clinical outcomes in the hospital.
Disclosures: Dr. Wright is a Miller‐Coulson Family Scholar and is supported through the Johns Hopkins Center for Innovative Medicine. Susrutha Kotwal, MD, and Waseem Khaliq, MD, contributed equally to this work. The authors report no conflicts of interest.
- 2014 state of hospital medicine report. Society of Hospital Medicine website. Available at: http://www.hospitalmedicine.org/Web/Practice_Management/State_of_HM_Surveys/2014.aspx. Accessed January 10, 2015.
- Press Ganey website. Available at: http://www.pressganey.com/home. Accessed December 15, 2015.
- Hospital Consumer Assessment of Healthcare Providers and Systems website. Available at: http://www.hcahpsonline.org/home.aspx. Accessed February 2, 2016.
- Membership committee guidelines for hospitalists patient satisfaction surveys. Society of Hospital Medicine website. Available at: http://www.hospitalmedicine.org. Accessed February 2, 2016.
- Definition of comportment. Available at: http://www.vocabulary.com/dictionary/comportment. Accessed December 15, 2015.
- . Etiquette‐based medicine. N Engl J Med. 2008;358(19):1988–1989.
- , , , , . Appraising the practice of etiquette‐based medicine in the inpatient setting. J Gen Intern Med. 2013;28(7):908–913.
- , , . Developing physician communication skills for patient‐centered care. Health Aff (Millwood). 2010;29(7):1310–1318.
- . The impact on patient health outcomes of interventions targeting the patient–physician relationship. Patient. 2009;2(2):77–84.
- , , , , , . Effect on health‐related outcomes of interventions to alter the interaction between patients and practitioners: a systematic review of trials. Ann Fam Med. 2004;2(6):595–608.
- , , , . How does communication heal? Pathways linking clinician–patient communication to health outcomes. Patient Educ Couns. 2009;74(3):295–301.
- , , , . Clinical excellence in academia: perspectives from masterful academic clinicians. Mayo Clin Proc. 2008;83(9):989–994.
- , , , et al. Where did the day go?—a time‐motion study of hospitalists. J Hosp Med. 2010;5(6):323–328.
- , , , et al. Reducing readmissions using teach‐back: enhancing patient and family education. J Nurs Adm. 2015;45(1):35–42.
- , , . Hand hygiene compliance rates in the United States—a one‐year multicenter collaboration using product/volume usage measurement and feedback. Am J Med Qual. 2009;24(3):205–213.
- , , , et al. Obstetricians' prior malpractice experience and patients' satisfaction with care. JAMA. 1994;272(20):1583–1587.
- , . Patient‐Centered Communication in Cancer Care: Promoting Healing and Reducing Suffering. NIH publication no. 07–6225. Bethesda, MD: National Cancer Institute; 2007.
- . Interacting with cancer patients: the significance of physicians' communication behavior. Soc Sci Med. 2003;57(5):791–806.
- , , . Expanding patient involvement in care: effects on patient outcomes. Ann Intern Med. 1985;102(4):520–528.
- , . Measuring patient‐centeredness: a comparison of three observation‐based instruments. Patient Educ Couns. 2000;39(1):71–80.
- , , , . Doctor‐patient communication: a review of the literature. Soc Sci Med. 1995;40(7):903–918.
- , , , , , . Linking primary care performance to outcomes of care. J Fam Pract. 1998;47(3):213–220.
- , , , et al. The impact of patient‐centered care on outcomes. J Fam Pract. 2000;49(9):796–804.
- , , , et al. Measuring patient‐centered communication in patient‐physician consultations: theoretical and practical issues. Soc Sci Med. 2005;61(7):1516–1528.
- , . Patient‐centered consultations and outcomes in primary care: a review of the literature. Patient Educ Couns. 2002;48(1):51–61.
- , , . Doctor‐patient communication and satisfaction with care in oncology. Curr Opin Oncol. 2005;17(4):351–354.
In 2014, there were more than 40,000 hospitalists in the United States, and approximately 20% were employed by academic medical centers.[1] Hospitalist physicians groups are committed to delivering excellent patient care. However, the published literature is limited with respect to defining optimal care in hospital medicine.
Patient satisfaction surveys, such as Press Ganey (PG)[2] and Hospital Consumer Assessment of Healthcare Providers and Systems,[3] are being used to assess patients' contentment with the quality of care they receive while hospitalized. The Society of Hospital Medicine, the largest professional medical society representing hospitalists, encourages the use of patient satisfaction surveys to measure hospitalist providers' quality of patient care.[4] There are, however, several problems with the current methods. First, the attribution to specific providers is questionable. Second, recall about the provider by the patients may be poor because surveys are sent to patients days after they return home. Third, the patients' recovery and health outcomes are likely to influence their assessment of the doctor. Finally, feedback is known to be most valuable and transformative when it is specific and given in real time. Thus, a tool that is able to provide feedback at the encounter level should be more helpful than a tool that offers assessment at the level of the admission, particularly when it can be also delivered immediately after the data are collected.
Comportment has been used to describe both the way a person behaves and also the way she carries herself (ie, her general manner).[5] Excellent comportment and communication can serve as the foundation for delivering patient‐centered care.[6, 7, 8] Patient centeredness has been shown to improve the patient experience and clinical outcomes, including compliance with therapeutic plans.[9, 10, 11] Respectful behavior, etiquette‐based medicine, and effective communication also lay the foundation upon which the therapeutic alliance between a doctor and patient can be built.
The goal of this study was to establish a metric that could comprehensively assess a hospitalist provider's comportment and communication skills during an encounter with a hospitalized patient.
METHODS
Study Design and Setting
An observational study of hospitalist physicians was conducted between June 2013 and December 2013 at 5 hospitals in Maryland and Washington DC. Two are academic medical centers (Johns Hopkins Hospital and Johns Hopkins Bayview Medical Center [JHBMC]), and the others are community hospitals (Howard County General Hospital [HCGH], Sibley Memorial Hospital [SMC], and Suburban Hospital). These 5 hospitals, across 2 large cities, have distinct culture and leadership, each serving different populations.
Subjects
In developing a tool to measure communication and comportment, we needed to observe physicianpatient encounters wherein there would be a good deal of variability in performance. During pilot testing, when following a few of the most senior and respected hospitalists, we noted encounters during which they excelled and others where they performed less optimally. Further, in following some less‐experienced providers, their skills were less developed and they were uniformly missing most of the behaviors on the tool that were believed to be associated with optimal communication and comportment. Because of this, we decided to purposively sample the strongest clinicians at each of the 5 hospitals in hopes of seeing a range of scores on the tool.
The chiefs of hospital medicine at the 5 hospitals were contacted and asked to identify their most clinically excellent hospitalists, namely those who they thought were most clinically skilled within their groups. Because our goal was to observe the top tier (approximately 20%) of the hospitalists within each group, we asked each chief to name a specific number of physicians (eg, 3 names for 1 group with 15 hospitalists, and 8 from another group with 40 physicians). No precise definition of most clinically excellent hospitalists was provided to the chiefs. It was believed that they were well positioned to select their best clinicians because of both subjective feedback and objective data that flow to them. This postulate may have been corroborated by the fact that each of them efficiently sent a list of their top choices without any questions being asked.
The 29 hospitalists (named by their chiefs) were in turn emailed and invited to participate in the study. All but 3 hospitalists consented to participate in the study; this resulted in a cohort of 26 who would be observed.
Tool Development
A team was assembled to develop the hospital medicine comportment and communication observation tool (HMCCOT). All team members had extensive clinical experience, several had published articles on clinical excellence, had won clinical awards, and all had been teaching clinical skills for many years. The team's development of the HMCCOT was extensively informed by a review of the literature. Two articles that most heavily influenced the HMCCOT's development were Christmas et al.'s paper describing 7 core domains of excellence, 2 of which are intimately linked to communication and comportment,[12] and Kahn's text that delineates behaviors to be performed upon entering the patient's room, termed etiquette‐based medicine.[6] The team also considered the work from prior timemotion studies in hospital medicine,[7, 13] which led to the inclusion of temporal measurements during the observations. The tool was also presented at academic conferences in the Division of General Internal Medicine at Johns Hopkins and iteratively revised based on the feedback. Feedback was sought from people who have spent their entire career studying physicianpatient relationships and who are members of the American Academy on Communication in Healthcare. These methods established content validity evidence for the tool under development. The goal of the HMCCOT was to assess behaviors believed to be associated with optimal comportment and communication in hospital medicine.
The HMCCOT was pilot tested by observing different JHBMC hospitalists patient encounters and it was iteratively revised. On multiple occasions, 2 authors/emnvestigators spent time observing JHBMC hospitalists together and compared data capture and levels of agreement across all elements. Then, for formal assessment of inter‐rater reliability, 2 authors observed 5 different hospitalists across 25 patient encounters; the coefficient was 0.91 (standard error = 0.04). This step helped to establish internal structure validity evidence for the tool.
The initial version of the HMCCOT contained 36 elements, and it was organized sequentially to allow the observer to document behaviors in the order that they were likely to occur so as to facilitate the process and to minimize oversight. A few examples of the elements were as follows: open‐ended versus a close‐ended statement at the beginning of the encounter, hospitalist introduces himself/herself, and whether the provider smiles at any point during the patient encounter.
Data Collection
One author scheduled a time to observe each hospitalist physician during their routine clinical care of patients when they were not working with medical learners. Hospitalists were naturally aware that they were being observed but were not aware of the specific data elements or behaviors that were being recorded.
The study was approved by the institutional review board at the Johns Hopkins University School of Medicine, and by each of the research review committees at HCGH, SMC, and Suburban hospitals.
Data Analysis
After data collection, all data were deidentified so that the researchers were blinded to the identities of the physicians. Respondent characteristics are presented as proportions and means. Unpaired t test and 2 tests were used to compare demographic information, and stratified by mean HMCCOT score. The survey data were analyzed using Stata statistical software version 12.1 (StataCorp LP, College Station, TX).
Further Validation of the HMCCOT
Upon reviewing the distribution of data after observing the 26 physicians with their patients, we excluded 13 variables from the initial version of the tool that lacked discriminatory value (eg, 100% or 0% of physicians performed the observed behavior during the encounters); this left 23 variables that were judged to be most clinically relevant in the final version of the HMCCOT. Two examples of the variables that were excluded were: uses technology/literature to educate patients (not witnessed in any encounter), and obeys posted contact precautions (done uniformly by all). The HMCCOT score represents the proportion of observed behaviors (out of the 23 behaviors). It was computed for each hospitalist for every patient encounter. Finally, relation to other variables validity evidence would be established by comparing the mean HMCCOT scores of the physicians to their PG scores from the same time period to evaluate the correlation between the 2 scores. This association was assessed using Pearson correlations.
RESULTS
The average clinical experience of the 26 hospitalist physicians studied was 6 years (Table 1). Their mean age was 38 years, 13 (50%) were female, and 16 (62%) were of nonwhite race. Fourteen hospitalists (54%) worked at 1 of the nonacademic hospitals. In terms of clinical workload, most physicians (n = 17, 65%) devoted more than 70% of their time working in direct patient care. Mean time spent observing each physician was 280 minutes. During this time, the 26 physicians were observed for 181 separate clinical encounters; 54% of these patients were new encounters, patients who were not previously known to the physician. The average time each physician spent in a patient room was 10.8 minutes. Mean number of observed patient encounters per hospitalist was 7.
| Total Study Population, n = 26 | HMCCOT Score 60, n = 14 | HMCCOT Score >60, n = 12 | P Value* | |
|---|---|---|---|---|
| ||||
| Age, mean (SD) | 38 (5.6) | 37.9 (5.6) | 38.1 (5.7) | 0.95 |
| Female, n (%) | 13 (50) | 6 (43) | 7 (58) | 0.43 |
| Race, n (%) | ||||
| Caucasian | 10 (38) | 5 (36) | 5 (41) | 0.31 |
| Asian | 13 (50) | 8 (57) | 5 (41) | |
| African/African American | 2 (8) | 0 (0) | 2 (17) | |
| Other | 1 (4) | 1 (7) | 0 (0) | |
| Clinical experience >6 years, n (%) | 12 (46) | 6 (43) | 6 (50) | 0.72 |
| Clinical workload >70% | 17 (65) | 10 (71) | 7 (58) | 0.48 |
| Academic hospitalist, n (%) | 12 (46) | 5 (36) | 7 (58) | 0.25 |
| Hospital | 0.47 | |||
| JHBMC | 8 (31) | 3 (21.4) | 5 (41) | |
| JHH | 4 (15) | 2 (14.3) | 2 (17) | |
| HCGH | 5 (19) | 3 (21.4) | 2 (17) | |
| Suburban | 6 (23) | 3 (21.4) | 3 (25) | |
| SMC | 3 (12) | 3 (21.4) | 0 (0) | |
| Minutes spent observing hospitalist per shift, mean (SD) | 280 (104.5) | 280.4 (115.5) | 281.4 (95.3) | 0.98 |
| Average time spent per patient encounter in minutes, mean (SD) | 10.8 (8.9) | 8.7 (9.1) | 13 (8.1) | 0.001 |
| Proportion of observed patients who were new to provider, % | 97 (53.5) | 37 (39.7) | 60 (68.1) | 0.001 |
The distribution of HMCCOT scores was not statistically significantly different when analyzed by age, gender, race, amount of clinical experience, clinical workload of the hospitalist, hospital, time spent observing the hospitalist (all P > 0.05). The distribution of HMCCOT scores was statistically different in new patient encounters compared to follow‐ups (68.1% vs 39.7%, P 0.001). Encounters with patients that generated HMCCOT scores above versus below the mean were longer (13 minutes vs 8.7 minutes, P 0.001).
The mean HMCCOT score was 61 (standard deviation [SD] = 10.6), and it was normally distributed (Figure 1). Table 2 shows the data for the 23 behaviors that were objectively assessed as part of the HMCCOT for the 181 patient encounters. The most frequently observed behaviors were physicians washing hands after leaving the patient's room in 170 (94%) of the encounters and smiling (83%). The behaviors that were observed with the least regularity were using an empathic statement (26% of encounters), and employing teach‐back (13% of encounters). A common method of demonstrating interest in the patient as a person, seen in 41% of encounters, involved physicians asking about patients' personal histories and their interests.
| Variables | All Visits Combined, n = 181 | HMCCOT Score 60, n = 93 | HMCCOT Score >60, n = 88 | P Value* |
|---|---|---|---|---|
| ||||
| Objective observations, n (%) | ||||
| Washes hands after leaving room | 170 (94) | 83 (89) | 87 (99) | 0.007 |
| Discusses plan for the day | 163 (91) | 78 (84) | 85 (99) | 0.001 |
| Does not interrupt the patient | 159 (88) | 79 (85) | 80 (91) | 0.21 |
| Smiles | 149 (83) | 71 (77) | 78 (89) | 0.04 |
| Washes hands before entering | 139 (77) | 64 (69) | 75 (85) | 0.009 |
| Begins with open‐ended question | 134 (77) | 68 (76) | 66 (78) | 0.74 |
| Knocks before entering the room | 127 (76) | 57 (65) | 70 (89) | 0.001 |
| Introduces him/herself to the patient | 122 (67) | 45 (48) | 77 (88) | 0.001 |
| Explains his/her role | 120 (66) | 44 (47) | 76 (86) | 0.001 |
| Asks about pain | 110 (61) | 45 (49) | 65 (74) | 0.001 |
| Asks permission prior to examining | 106 (61) | 43 (50) | 63 (72) | 0.002 |
| Uncovers body area for the physical exam | 100 (57) | 34 (38) | 66 (77) | 0.001 |
| Discusses discharge plan | 99 (55) | 38 (41) | 61 (71) | 0.001 |
| Sits down in the patient room | 74 (41) | 24 (26) | 50 (57) | 0.001 |
| Asks about patient's feelings | 58 (33) | 17 (19) | 41 (47) | 0.001 |
| Shakes hands with the patient | 57 (32) | 17 (18) | 40 (46) | 0.001 |
| Uses teach‐back | 24 (13) | 4 (4.3) | 20 (24) | 0.001 |
| Subjective observations, n (%) | ||||
| Avoids medical jargon | 160 (89) | 85 (91) | 83 (95) | 0.28 |
| Demonstrates interest in patient as a person | 72 (41) | 16 (18) | 56 (66) | 0.001 |
| Touches appropriately | 62 (34) | 21 (23) | 41 (47) | 0.001 |
| Shows sensitivity to patient modesty | 57 (93) | 15 (79) | 42 (100) | 0.002 |
| Engages in nonmedical conversation | 54 (30) | 10 (11) | 44 (51) | 0.001 |
| Uses empathic statement | 47 (26) | 9 (10) | 38 (43) | 0.001 |
The average composite PG scores for the physician sample was 38.95 (SD=39.64). A moderate correlation was found between the HMCCOT score and PG score (adjusted Pearson correlation: 0.45, P = 0.047).
DISCUSSION
In this study, we followed 26 hospitalist physicians during routine clinical care, and we focused intently on their communication and their comportment with patients at the bedside. Even among clinically respected hospitalists, the results reveal that there is wide variability in comportment and communication practices and behaviors at the bedside. The physicians' HMCCOT scores were associated with their PG scores. These findings suggest that improved bedside communication and comportment with patients might translate into enhanced patient satisfaction.
This is the first study that honed in on hospitalist communication and comportment. With validity evidence established for the HMCCOT, some may elect to more explicitly perform these behaviors themselves, and others may wish to watch other hospitalists to give them feedback that is tied to specific behaviors. Beginning with the basics, the hospitalists we studied introduced themselves to their patients at the initial encounter 78% of the time, less frequently than is done by primary care clinicians (89%) but more consistently than do emergency department providers (64%).[7] Other variables that stood out in the HMCCOT was that teach‐back was employed in only 13% of the encounters. Previous studies have shown that teach‐back corroborates patient comprehension and can be used to engage patients (and caregivers) in realistic goal setting and optimal health service utilization.[14] Further, patients who clearly understand their postdischarge plan are 30% less likely to be readmitted or visit the emergency department.[14] The data for our group have helped us to see areas of strengths, such as hand washing, where we are above compliance rates across hospitals in the United States,[15] as well as those matters that represent opportunities for improvement such as connecting more deeply with our patients.
Tackett et al. have looked at encounter length and its association with performance of etiquette‐based medicine behaviors.[7] Similar to their study, we found a positive correlation between spending more time with patients and higher HMCCOT scores. We also found that HMCCOT scores were higher when providers were caring for new patients. Patients' complaints about doctors often relate to feeling rushed, that their physicians did not listen to them, or that information was not conveyed in a clear manner.[16] Such challenges in physicianpatient communication are ubiquitous across clinical settings.[16] When successfully achieved, patient‐centered communication has been associated with improved clinical outcomes, including adherence to recommended treatment and better self‐management of chronic disease.[17, 18, 19, 20, 21, 22, 23, 24, 25, 26] Many of the components of the HMCCOT described in this article are at the heart of patient‐centered care.
Several limitations of the study should be considered. First, physicians may have behaved differently while they were being observed, which is known as the Hawthorne effect. We observed them for many hours and across multiple patient encounters, and the physicians were not aware of the specific types of data that we were collecting. These factors may have limited the biases along such lines. Second, there may be elements of optimal comportment and communication that were not captured by the HMCCOT. Hopefully, there are not big gaps, as we used multiple methods and an iterative process in the refinement of the HMCCOT metric. Third, one investigator did all of the observing, and it is possible that he might have missed certain behaviors. Through extensive pilot testing and comparisons with other raters, the observer became very skilled and facile with such data collection and the tool. Fourth, we did not survey the same patients that were cared for to compare their perspectives to the HMCCOT scores following the clinical encounters. For patient perspectives, we relied only on PG scores. Fifth, quality of care is a broad and multidimensional construct. The HMCCOT focuses exclusively on hospitalists' comportment and communication at the bedside; therefore, it does not comprehensively assess care quality. Sixth, with our goal to optimally validate the HMCCOT, we tested it on the top tier of hospitalists within each group. We may have observed different results had we randomly selected hospitalists from each hospital or had we conducted the study at hospitals in other geographic regions. Finally, all of the doctors observed worked at hospitals in the Mid‐Atlantic region. However, these five distinct hospitals each have their own cultures, and they are led by different administrators. We purposively chose to sample both academic as well as community settings.
In conclusion, this study reports on the development of a comportment and communication tool that was established and validated by following clinically excellent hospitalists at the bedside. Future studies are necessary to determine whether hospitalists of all levels of experience and clinical skill can improve when given data and feedback using the HMCCOT. Larger studies will then be needed to assess whether enhancing comportment and communication can truly improve patient satisfaction and clinical outcomes in the hospital.
Disclosures: Dr. Wright is a Miller‐Coulson Family Scholar and is supported through the Johns Hopkins Center for Innovative Medicine. Susrutha Kotwal, MD, and Waseem Khaliq, MD, contributed equally to this work. The authors report no conflicts of interest.
- 2014 state of hospital medicine report. Society of Hospital Medicine website. Available at: http://www.hospitalmedicine.org/Web/Practice_Management/State_of_HM_Surveys/2014.aspx. Accessed January 10, 2015.
- Press Ganey website. Available at: http://www.pressganey.com/home. Accessed December 15, 2015.
- Hospital Consumer Assessment of Healthcare Providers and Systems website. Available at: http://www.hcahpsonline.org/home.aspx. Accessed February 2, 2016.
- Membership committee guidelines for hospitalists patient satisfaction surveys. Society of Hospital Medicine website. Available at: http://www.hospitalmedicine.org. Accessed February 2, 2016.
- Definition of comportment. Available at: http://www.vocabulary.com/dictionary/comportment. Accessed December 15, 2015.
- . Etiquette‐based medicine. N Engl J Med. 2008;358(19):1988–1989.
- , , , , . Appraising the practice of etiquette‐based medicine in the inpatient setting. J Gen Intern Med. 2013;28(7):908–913.
- , , . Developing physician communication skills for patient‐centered care. Health Aff (Millwood). 2010;29(7):1310–1318.
- . The impact on patient health outcomes of interventions targeting the patient–physician relationship. Patient. 2009;2(2):77–84.
- , , , , , . Effect on health‐related outcomes of interventions to alter the interaction between patients and practitioners: a systematic review of trials. Ann Fam Med. 2004;2(6):595–608.
- , , , . How does communication heal? Pathways linking clinician–patient communication to health outcomes. Patient Educ Couns. 2009;74(3):295–301.
- , , , . Clinical excellence in academia: perspectives from masterful academic clinicians. Mayo Clin Proc. 2008;83(9):989–994.
- , , , et al. Where did the day go?—a time‐motion study of hospitalists. J Hosp Med. 2010;5(6):323–328.
- , , , et al. Reducing readmissions using teach‐back: enhancing patient and family education. J Nurs Adm. 2015;45(1):35–42.
- , , . Hand hygiene compliance rates in the United States—a one‐year multicenter collaboration using product/volume usage measurement and feedback. Am J Med Qual. 2009;24(3):205–213.
- , , , et al. Obstetricians' prior malpractice experience and patients' satisfaction with care. JAMA. 1994;272(20):1583–1587.
- , . Patient‐Centered Communication in Cancer Care: Promoting Healing and Reducing Suffering. NIH publication no. 07–6225. Bethesda, MD: National Cancer Institute; 2007.
- . Interacting with cancer patients: the significance of physicians' communication behavior. Soc Sci Med. 2003;57(5):791–806.
- , , . Expanding patient involvement in care: effects on patient outcomes. Ann Intern Med. 1985;102(4):520–528.
- , . Measuring patient‐centeredness: a comparison of three observation‐based instruments. Patient Educ Couns. 2000;39(1):71–80.
- , , , . Doctor‐patient communication: a review of the literature. Soc Sci Med. 1995;40(7):903–918.
- , , , , , . Linking primary care performance to outcomes of care. J Fam Pract. 1998;47(3):213–220.
- , , , et al. The impact of patient‐centered care on outcomes. J Fam Pract. 2000;49(9):796–804.
- , , , et al. Measuring patient‐centered communication in patient‐physician consultations: theoretical and practical issues. Soc Sci Med. 2005;61(7):1516–1528.
- , . Patient‐centered consultations and outcomes in primary care: a review of the literature. Patient Educ Couns. 2002;48(1):51–61.
- , , . Doctor‐patient communication and satisfaction with care in oncology. Curr Opin Oncol. 2005;17(4):351–354.