User login
Hospital Admission Service Structure
Hospital admission represents a time period during which patients are at risk for poor clinical outcomes. Although some risk is directly generated by illness pathophysiology, some additive risk is generated by the emergency department (ED)inpatient service handover inherent in the admission process.[1] Increased risk of suboptimal outcomes can result from ED overcrowding, which has been associated with increased mortality, difficulty in patient disposition, and delays in provision of care.[2] Inpatient bed occupancy, as well as availability and organization of accepting inpatient service healthcare staff, can affect ED overcrowding as well.[3, 4]
The overwhelming majority of hospitalist groups accept a significant portion of their admissions via the ED.[5] Hospitalist services must balance their daily group workload between ongoing care and discharge of inpatients and the activity of admitting new patients to their service. Two major models of admission processing exist for hospitalist groups to accomplish these competing tasks. One model, called the general model, employs the use of individual hospitalists to simultaneously perform admission activity as well as ongoing ward‐based care for inpatients during their workday. In the general model, a hospitalist who admits patients on their first hospital day will generally continue to see them on their second hospital day. The other model, called the admitter‐rounder model, divides the hospitalist daily group workflow between hospitalists who are assigned to perform only admission activity (admitters), and hospitalists who are assigned to perform only ongoing care for patients who are already admitted (rounders). In the admitter‐rounder model, the admitter on a patient's first hospital day will generally not serve as the patient's rounder on subsequent hospital days.
Limited evidence exists to guide hospitalist groups on which model their service design should adopt. Conflicting evidence exists as to whether the fragmentation of care generated by an admitter‐rounder admission model is beneficial or harmful.[6, 7, 8, 9] Increased availability of attending inpatient physicians during the EDinpatient admission process has been associated with improved hospital mortality and decreased readmissions in hospital settings outside the United States, where attending availability may otherwise be limited.[10, 11, 12] Separation of admission and rounding activity within a hospitalist workforce may allow each group of hospitalists to provide more timely and effective care related to their respective tasks. Our division implemented a change from a general model to an admitter‐rounder model of care on January 2, 2012. We hypothesized that changing from a general admission model to an admitter‐rounder model of care would be associated with a decreased rate of transfer to the intensive care unit (ICU) 24 hours after floor arrival and shortened ED length of stay (LOS), due to improved availability of hospitalists during the admission process. Due to the introduction of discontinuity, we hypothesized that adoption of the admitter‐rounder model would be associated with a prolongation of hospital LOS and no overall effect on 30 day postdischarge readmission rate. We sought to examine the relationship between our division's service design change and our hypothesized variables of interest.
METHODS
Setting and Study Design
We retrospectively evaluated electronic medical records of patients admitted between July 1, 2010 and June 30, 2013 from the ED to medical floor beds at Northwestern Memorial Hospital, an academic tertiary care teaching hospital located in Chicago, Illinois, under care of either a hospital medicine independent service or a medical teaching service. Admissions for care in observation units, service intake via interhospital or intrahospital transfers of care, or direct admissions from outpatient clinics that bypassed the ED were excluded, as was any patient with incomplete data, leaving 19,270 hospitalizations available for analysis. Each hospital medicine service was comprised of a single hospitalist with only clinical care responsibilities for the workday and no ICU or outpatient clinic responsibilities, with routine handover of the service to a hospitalist colleague every 7 days. Each medical teaching service was comprised of a supervising attending (often a hospitalist), a resident, 1 to 2 interns, and 1 to 3 medical students; the residents and interns maintained outpatient clinic responsibilities of 1 to 2 half days per service week. Inpatients on all teams were localized to hospital beds assigned to their care team. Regardless of hospitalist service design, 3 or more hospitalists were available each day to perform daytime admissions. Throughout the study period, both the hospital medicine and medicine teaching services utilized a group of physicians separate from the day teams to perform admissions and cross‐coverage at night, and the teaching services maintained a generalist model of daytime admission practice. All teams accepted new admissions every day. All ED admissions involved a phone‐based signout of transfer of care to the person admitting for the accepting ward team, followed by transfer of the patient to the floor, independent of whether the accepting team met the patient in the ED prior to transfer. None of the accepting inpatient services in the study had a formal right to refuse acceptance of patients referred for admission by the ED. The time period evaluated was constrained to avoid the effect of other service changes that took place before or after the study period. The Northwestern University Institutional Review Board approved the study (STU00087387).
Data Acquisition and Measures
Data were obtained from the Northwestern Memorial Hospital Enterprise Data Warehouse, an integrated repository of all clinical and research data for patients receiving care in the system. For analysis, the patients were separated into 4 groups: a prechange general admission hospitalist group (group 1), a postchange admitter‐rounder hospitalist group (group 2), and 2 teaching service control groups separated according to the prechange or postchange time period (groups 3 and 4, respectively). The primary outcome variable for the study was transfer of the patient to the ICU within 24 hours of inpatient floor arrival, which has been previously reported as an adverse outcome related to the admission process due to its association with increased inpatient mortality.[13] Secondary outcome variables included ED LOS, total hospital LOS, and readmission to Northwestern Memorial Hospital within 30 days of hospital discharge. Data on unexpected transfer to the operating room, discharge against medical advice (all within 24 hours of arrival to the ward), as well as mortality during the hospital stay were collected but not further analyzed due to the extremely low incidence of each. Covariables measured included each admitted patient's age, sex, race, Elixhauser composite score (a patient comorbidity score associated with inpatient mortality, described by van Walraven et al.[14]), case mix, insurance payer status, patient census on the accepting service for day 2 of the admitted patient's hospitalization, and hospital occupancy on the day of admission.[7, 14, 15, 16] Hospital occupancy was calculated as the sum of the number of beds occupied at midnight plus the number of patients discharged during the previous 24 hours, divided by the number of hospital beds, as defined by Forster et al.[16]
Statistical Analysis
Prestudy sample size calculation using an value of 0.05 and value of 0.2 to detect a 1.5% absolute difference in ICU transfer rate between postchange study groups, with a patient distribution ratio of 3.3:1 or higher between the admitter‐rounder and teaching postchange groups, and an assumed higher transfer rate in the teaching postchange group, revealed a requirement of at least 1068 hospitalizations in the teaching postchange group for our evaluation. Descriptive statistics were calculated for each patient group. Firth's logistic regressions were used to model the odds of patient being transfer to ICU within 24 hours after arrival and the odds of hospital readmission within 30 days after discharge, adjusting for confounders.[17] Quantile regressions were used to model the change in the median of ED LOS and the median of hospital LOS due to the right‐skewed distributions of LOS. Based on the clinical relevance to the outcomes, models were adjusted for patients' measured covariates. All covariates that were significant at = 0.05 level were considered significant. All statistical analyses were performed in SAS version 9.4 (SAS Institute Inc., Cary, NC).
RESULTS
Patient Characteristics
The characteristics of the 4 patient populations are listed in Table 1. Compared to the general admission hospitalist group, the admitter‐rounder hospitalist group was more likely to be older (admitter‐rounder 61.9 19.0 vs 61.2 18.4, P = 0.03), a Medicare beneficiary (56.0% vs 52.9%, P 0.001), have a higher Elixhauser composite score (6.6 7.3 vs 5.3 6.7, P 0.001), and less likely to be white (46.5% vs 48.4%, P = 0.03). The teaching service patient characteristics changed over time only with regard to Elixhauser composite score (teaching postchange 6.4 7.3 vs 5.6 7.0, P 0.001); except for case mix, all other covariates did not change significantly between prechange and postchange teaching services. There was no significant difference in Elixhauser composite score between hospitalist and teaching services during the study period. Hospitalist groups were more likely than teaching service groups to have older patients, both before (hospitalist 61.2 18.4 vs teaching 60.1 19.1, P = 0.009) and after (hospitalist 61.9 18.0 vs teaching 60.0 18.6, P 0.001) the hospitalist admission system change. Compared to teaching groups, hospitalist groups were less likely to have female patients before the system change (hospitalist 52.3% vs 54.6%, P = 0.03), and more likely to have Medicare beneficiaries after the system change (hospitalist 56.0% vs 51.1%, P 0.001). Significant differences in case mix existed in all comparisons among all 4 study groups.
| Group 1 Hospitalist General, N = 8,465 | Group 2 Hospitalist Admitter‐Rounder, N = 6,291 | Group 3 Teaching Prechange, N = 2,636 | Group 4 Teaching Postchange, N = 1,878 | Group 2 vs Group 1, P Value | Group 4 vs Group 3, P Value | Group 1 vs Group 3, P Value | Group 2 vs Group 4, P Value | |
|---|---|---|---|---|---|---|---|---|
| ||||||||
| Age, y, mean (SD) | 61.2 (18.4) | 61.9 (19.0) | 60.1 (19.1) | 60.0 (18.6) | 0.03 | 0.88 | 0.009 | 0.001 |
| Female sex, n (%) | 4,423 (52.3) | 3,298 (52.4) | 1,440 (54.6) | 1,031 (54.9) | 0.83 | 0.86 | 0.03 | 0.06 |
| White race, n (%) | 4,096 (48.4) | 2,927 (46.5) | 1,261 (47.8) | 880 (46.9) | 0.03 | 0.52 | 0.62 | 0.80 |
| Payer status | 0.001 | 0.001 | 0.07 | 0.001 | ||||
| Medicaid, n (%) | 1,121 (13.2) | 811 (12.9) | 393 (14.9) | 222 (11.8) | ||||
| Medicare, n (%) | 4,475 (52.9) | 3,521 (56.0) | 1,394 (52.9) | 961 (51.2) | ||||
| Private, n (%) | 2,218 (26.2) | 1,442 (22.9) | 674 (25.6) | 525 (28.0) | ||||
| Self‐pay, n (%) | 299 (3.5) | 273 (4.3) | 72 (2.7) | 88 (4.7) | ||||
| Other, n (%) | 352 (4.2) | 244 (3.9) | 103 (3.9) | 82 (4.4) | ||||
| Elixhauser composite score, mean (SD) | 5.3 (6.7) | 6.6 (7.3) | 5.6 (7.0) | 6.4 (7.3) | 0.001 | 0.007 | 0.05 | 0.30 |
| Inpatient mortality, n (%) | 74 (0.9) | 70 (1.1) | 31 (1.2) | 18 (1.0) | 0.14 | 0.51 | 0.15 | 0.62 |
| No. of patients seen by accepting service, mean (SD) | 10.2 (3.8) | 12.0 (3.1) | 6.3 (3.2) | 7.0 (3.3) | 0.001 | 0.001 | 0.001 | 0.001 |
| Hospital % occupancy at admission, mean (SD) | 1.23 (0.18) | 1.20 (0.17) | 1.23 (0.18) | 1.20 (0.17) | 0.001 | 0.001 | 0.61 | 0.43 |
| Case mix, n (%) | 0.001 | 0.001 | 0.001 | 0.001 | ||||
| Diseases of the circulatory system | 2,695 (31.8) | 1,173 (18.9) | 396 (15.0) | 292 (15.6) | ||||
| Other | 1,139 (13.5) | 1,151 (18.3) | 423 (16.1) | 292 (15.6) | ||||
| Diseases of the respiratory system | 883 (10.4) | 612 (9.7) | 314 (11.9) | 541 (28.9) | ||||
| Diseases of the digestive system | 923 (10.9) | 889 (14.1) | 420 (15.9) | 196 (10.4) | ||||
| Diseases of the genitourinary system | 492 (5.8) | 525 (8.4) | 230 (8.7) | 122 (6.5) | ||||
| Injury and poisoning | 517 (6.1) | 451 (7.2) | 182 (6.9) | 80 (4.3) | ||||
| Endocrine, nutritional, and metabolic diseases and immunity disorders | 473 (5.6) | 357 (5.7) | 194 (7.4) | 76 (4.1) | ||||
| Symptoms, signs, and ill‐defined conditions and factors influencing health status | 470 (5.6) | 267 (4.2) | 141 (5.4) | 63 (3.4) | ||||
| Diseases of the musculoskeletal system and connective tissue | 371 (4.4) | 281 (4.5) | 136 (5.1) | 58 (3.1) | ||||
| Infectious and parasitic diseases | 234 (2.8) | 288 (4.6) | 108 (4.1) | 98 (5.2) | ||||
| Diseases of the blood and blood‐forming organs | 268 (3.2) | 297 (4.7) | 92 (3.5) | 60 (3.2) | ||||
Impact of the Admission System on Outcomes
Measured unadjusted primary and secondary outcomes for the 4 study groups, as well as inpatient mortality, are listed in Table 2. Comparative odds ratios (ORs) for the outcomes of transfer to ICU 24 hours of floor arrival and readmission to hospital 30 days after discharge, median (50% quantile) regression results for the outcomes of ED and hospital LOS, each adjusted by all study covariates, as well as associated difference‐in‐difference parameter estimates with associated standard error (SE) ranges and P values, are listed in Table 3. Difference‐in‐difference analysis of outcomes associated with adoption of the hospitalist admitter‐rounder system compared to the time‐matched teaching service revealed no statistically significant difference in associated ICU transfer outcome between hospitalist or teaching services (admitter‐rounder OR difference of +0.22, SE 0.22, P = 0.32). A significant decrease in associated odds for hospital readmission 30 days postdischarge was noted when adoption of the hospitalist admitter‐rounder system was compared to the time‐matched teaching service (admitter‐rounder OR difference of 0.21, SE 0.08, P = 0.01). Adoption of the hospitalist admitter‐rounder system, compared to the time‐matched teaching service, was associated with a significant increase in ED LOS (admitter‐rounder difference of +0.49 hours, SE 0.09, P 0.001). Difference‐in‐difference analysis revealed no significant difference in associated hospital LOS between the hospitalist and time‐matched teaching services over the study period (admitter‐rounder difference of 0.39 hours, SE 2.44, P = 0.87).
|
Group 1, Hospitalist General, N = 8,465 |
Group 2, Hospitalist Admitter‐Rounder, N = 6,291 |
Group 3, Teaching Prechange, N = 2,636 |
Group 4. Teaching Postchange, N = 1,878 |
|
|---|---|---|---|---|
| ||||
| Transfer to ICU 24 hours after ward arrival, n (%) | 235 (2.8) | 139 (2.2) | 75 (2.9) | 59 (3.1) |
| Hospital readmission 30 days after discharge, n (%) | 1,924 (22.7) | 1,546 (24.6) | 608 (23.1) | 504 (26.8) |
| Emergency department length of stay, h | ||||
| Mean (SD) | 6.9 (3.36) | 7.39 (3.9) | 7.05 (2.98) | 6.89 (3.03) |
| Median [range] | 6.22 [0.2262.47] | 6.68 [0.62149.52] | 6.53 [1.9833.63] | 6.3 [2.0224.17] |
| Hospital length of stay, h | ||||
| Mean (SD) | 102.46 (120.14) | 125.94 (153.41) | 114.07 (165.62) | 122.89 (125.55) |
| Median [range] | 67.37 [0.521,964.07] | 88.18 [0.285,801.28] | 71.5 [4.575,131.37] | 88.08 [4.731,262.58] |
| Hospitalist Admitter‐Rounder vs Hospitalist General | Teaching Postchange vs Teaching Prechange | Difference‐in‐Difference Value Parameter Estimate [Standard Error], P Value | |
|---|---|---|---|
| |||
| Transfer to ICU 24 hours after floor arrival, OR (95% confidence interval) | 1.292 (1.0261.629) | 1.029 (0.7211.468) | OR: +0.22 [ 0.22], 0.32 |
| Hospital readmission 30 days after discharge, OR (95% confidence interval) | 1.048 (0.9661.136) | 1.298 (1.1271.495) | OR: 0.21 [ 0.08], 0.01 |
| Emergency department length of stay, median hours | +0.40 | 0.09 | +0.49 [ 0.09], 0.001 |
| Hospital length of stay, median hours | +12.96 | +13.36 | 0.39 [ 2.44], 0.87 |
DISCUSSION
Our observations were revealing for a statistically nonsignificant trend toward increased ICU transfers 24 hours after floor arrival after adoption of the admitter‐rounder model by the hospital medicine service. Despite prior publication of early transfer to the ICU being associated with adverse outcomes, including increased inpatient mortality, we observed no difference in mortality in our study groups.[13] We suspect that earlier transfer to the ICU in our study cohort may instead represent a protective action taken more frequently by admitting hospitalists in the admitter‐rounder model in response to provider discontinuity risks embedded in the admission process. Requests for transfer to the ICU at our institution require approval by the ICU team, and requests from attending hospitalists may be responded to differently from requests enacted by teaching team members, which as a factor also may account for some of the adjusted differences in transfer incidence. Taken together, increased availability of hospitalists during the admission process may result in earlier implementation of an overall lower threshold for implementation of ICU transfer. Our conclusion is limited by our study cohort's overall inpatient mortality rate, which is sufficiently low to preclude further assessment of the relationship of adverse outcomes with ICU transfer rate in our study groups. Therefore, clinical significance of our primary outcome findings, as well as the workload factors that impact ICU transfers initiated by hospitalist and teaching services, require further examination.
Despite a hypothesized increase in hospital LOS caused by additional discontinuity of hospitalist care in the admitter‐rounder model, adoption of the admitter‐rounder model was not associated with an increased hospital LOS. We suspect this finding may represent the presence of action(s) proximal to the admission process, on the part of either admission and/or rounding hospitalists, which decrease hospital LOS to a degree offsetting the expected LOS increase generated by provider discontinuity. Examples of such actions include more efficient testing or consultation, or improved detection of diagnostic errors.
Adoption of the admitter‐rounder model by the hospital medicine service was also associated with decreased hospital readmission rates compared to the time‐matched teaching service. We suspect that assignment of daily discharge and admission service activity to separate hospitalists in the admitter‐rounder model may allow more opportunity for rounder hospitalists to engage in activity protective against readmissions, such as greater direct engagement with postdischarge resources, or improved hospitalist availability for multidisciplinary inpatient efforts focused on discharge planning.
Adoption of the admitter‐rounder model was found to be associated with a median 29‐minute increase in ED LOS compared to the time‐matched teaching service. As a floor team member's physical presence in the ED was not required for ED‐floor transfer during the study period, increased physical availability of admitting hospitalists in the admitter‐rounder model may allow for increased opportunity for a hospitalist to disrupt ED‐specific workflows related to patient transfer (eg, disruption of transportation service activity by an earlier bedside visit from the admitting hospitalist). Hospitalists in the general model were allowed to leave after performing their daily duties, whereas admitting hospitalists in the admitter‐rounder model were assigned to stay for a timed shift, regardless of the completion of admissions; the difference in duty assignment may be associated with different hospitalist behaviors during the admission process. Improved ease for ED staff to contact hospitalist staff in the admitter‐rounder model may have led ED staff to prioritize other tasks more demanding of their continuous engagement at the expense of initiating admissions, thereby paradoxically delaying admissions to hospital medicine.
Other studies exist that attempt to describe changes in admission service structure, particularly with regard to housestaff admission activity in relation to changes in resident work hours. Many of these studies vary with regard to implementation of separate physician teams for day and night coverage, or are focused on a specific medical condition, thereby limiting their applicability to a hospital medicine service free of work‐hour restrictions and engaged in care of a wide variety of medical conditions.[18, 19, 20] In contrast, our study is an attempt to examine, in isolation, outcomes associated with adoption of an admitter‐rounder model of care as a specific discontinuity risk during the admission process, within the context of a stable system of night coverage in place for all medical teams engaged in admission activity of undifferentiated medical patients.
Limitations of our study include the inability to ascertain causality of observed outcomes, due to our observational study design. Our study was of a single hospital, which may limit applicability of our results to other hospital environments. However, the admission models examined in our study are common among hospital medicine groups. Clinically relevant outcome metrics, such as mortality and unexpected transfer to the operating room, were measured but of too low incidence to allow for further meaningful analysis. The clinical consequences and workflow practices that correlate with our study's findings likely require case review and time‐motion analyses, respectively, to further delineate the relevance of our findings; these analyses were outside of the scope of our study, and further investigation is required. In summary, our observations suggest that adoption by hospitalist services of an admitter‐rounder model of care for admissions is associated with a decreased rate of hospital readmission 30 days after discharge, with no effect on median hospital LOS, a statistically nonsignificant trend toward more ICU transfers in the first 24 hours of a patient's hospital stay, and a slight increase in median ED LOS.
Acknowledgements
This study was conducted with logistical support, software, and computer hardware provided by the Division of Hospital Medicine, Department of Medicine, Northwestern University Feinberg School of Medicine, and by the Biostatistics Collaboration Center, Northwestern University Feinberg School of Medicine.
Disclosure: Nothing to report.
- , , , et al. Residents' and attending physicians' handoffs: a systematic review of the literature. Acad Med. 2009;84(12):1775–1787.
- , , , et al. The effect of emergency department crowding on clinically oriented outcomes. Acad Emerg Med. 2009;16:1–10.
- , , , et al. Time series analysis of variables associated with daily mean emergency department length of stay. Ann Emerg Med. 2007;49:265–271.
- , , , et al. Active bed management by hospitalists and emergency department throughput. Ann Intern Med. 2008;149:804–810.
- Society of Hospital Medicine. 2014 state of hospital medicine report. 2014:22.
- , , , , . The impact of fragmentation of hospitalist care on length of stay. J Hosp Med. 2010;5:335–338.
- , , , et al. The effect of hospitalist discontinuity on adverse events. J Hosp Med. 2015;10:147–151.
- , , , . Liability impact of the hospitalist model of care. J Hosp Med. 2014;9:750–755.
- . Does continuity of care matter? No: discontinuity can improve patient care. West J Med. 2001;175(1):5.
- , , , , . Consultant input in acute medical admissions and patient outcomes in hospitals in England: a multivariate analysis. PLoS One. 2013;8(4):e61476.
- , , . Effectiveness of acute medical units in hospitals: a systematic review. Int J Qual Health Care. 2009;21(6):397–407.
- , , . Acute medicine in the United Kingdom: first‐hand perspectives on a parallel evolution of inpatient medical care. J Hosp Med. 2012:7(3);254–257.
- , , , et al. Adverse outcomes associated with delayed intensive care unit transfers in an integrated healthcare system. J Hosp Med. 2012;7(3):224–230.
- , , , , . A modification of the Elixhauser comorbidity measures into a point system for hospital death using administrative data. Med Care. 2009;47(6):626–633.
- , , , , . Effect of hospitalist workload on the quality and efficiency of care. JAMA Intern Med. 2014;174(5):786–793.
- , , , , . The effect of hospital occupancy on emergency department length of stay and patient disposition. Acad Emerg Med. 2003;10(2):127–133.
- . Bias reduction of maximum likelihood estimates. Biometrika. 1993;80(1):27–38.
- , , , et al. Effect of the 2011 vs 2003 duty hour regulation‐compliant models on sleep duration, trainee education, and continuity of patient care among internal medicine house staff. JAMA Intern Med. 2013;173(8):649–655.
- , , , . Post‐call transfer of resident responsibility: Its effect on patient care. J Gen Intern Med. 1990;5:501–505.
- , , , et al. Effect of short call admission on length of stay and quality of care for acute decompensated heart failure. Circulation. 2008;117:2637–2644.
Hospital admission represents a time period during which patients are at risk for poor clinical outcomes. Although some risk is directly generated by illness pathophysiology, some additive risk is generated by the emergency department (ED)inpatient service handover inherent in the admission process.[1] Increased risk of suboptimal outcomes can result from ED overcrowding, which has been associated with increased mortality, difficulty in patient disposition, and delays in provision of care.[2] Inpatient bed occupancy, as well as availability and organization of accepting inpatient service healthcare staff, can affect ED overcrowding as well.[3, 4]
The overwhelming majority of hospitalist groups accept a significant portion of their admissions via the ED.[5] Hospitalist services must balance their daily group workload between ongoing care and discharge of inpatients and the activity of admitting new patients to their service. Two major models of admission processing exist for hospitalist groups to accomplish these competing tasks. One model, called the general model, employs the use of individual hospitalists to simultaneously perform admission activity as well as ongoing ward‐based care for inpatients during their workday. In the general model, a hospitalist who admits patients on their first hospital day will generally continue to see them on their second hospital day. The other model, called the admitter‐rounder model, divides the hospitalist daily group workflow between hospitalists who are assigned to perform only admission activity (admitters), and hospitalists who are assigned to perform only ongoing care for patients who are already admitted (rounders). In the admitter‐rounder model, the admitter on a patient's first hospital day will generally not serve as the patient's rounder on subsequent hospital days.
Limited evidence exists to guide hospitalist groups on which model their service design should adopt. Conflicting evidence exists as to whether the fragmentation of care generated by an admitter‐rounder admission model is beneficial or harmful.[6, 7, 8, 9] Increased availability of attending inpatient physicians during the EDinpatient admission process has been associated with improved hospital mortality and decreased readmissions in hospital settings outside the United States, where attending availability may otherwise be limited.[10, 11, 12] Separation of admission and rounding activity within a hospitalist workforce may allow each group of hospitalists to provide more timely and effective care related to their respective tasks. Our division implemented a change from a general model to an admitter‐rounder model of care on January 2, 2012. We hypothesized that changing from a general admission model to an admitter‐rounder model of care would be associated with a decreased rate of transfer to the intensive care unit (ICU) 24 hours after floor arrival and shortened ED length of stay (LOS), due to improved availability of hospitalists during the admission process. Due to the introduction of discontinuity, we hypothesized that adoption of the admitter‐rounder model would be associated with a prolongation of hospital LOS and no overall effect on 30 day postdischarge readmission rate. We sought to examine the relationship between our division's service design change and our hypothesized variables of interest.
METHODS
Setting and Study Design
We retrospectively evaluated electronic medical records of patients admitted between July 1, 2010 and June 30, 2013 from the ED to medical floor beds at Northwestern Memorial Hospital, an academic tertiary care teaching hospital located in Chicago, Illinois, under care of either a hospital medicine independent service or a medical teaching service. Admissions for care in observation units, service intake via interhospital or intrahospital transfers of care, or direct admissions from outpatient clinics that bypassed the ED were excluded, as was any patient with incomplete data, leaving 19,270 hospitalizations available for analysis. Each hospital medicine service was comprised of a single hospitalist with only clinical care responsibilities for the workday and no ICU or outpatient clinic responsibilities, with routine handover of the service to a hospitalist colleague every 7 days. Each medical teaching service was comprised of a supervising attending (often a hospitalist), a resident, 1 to 2 interns, and 1 to 3 medical students; the residents and interns maintained outpatient clinic responsibilities of 1 to 2 half days per service week. Inpatients on all teams were localized to hospital beds assigned to their care team. Regardless of hospitalist service design, 3 or more hospitalists were available each day to perform daytime admissions. Throughout the study period, both the hospital medicine and medicine teaching services utilized a group of physicians separate from the day teams to perform admissions and cross‐coverage at night, and the teaching services maintained a generalist model of daytime admission practice. All teams accepted new admissions every day. All ED admissions involved a phone‐based signout of transfer of care to the person admitting for the accepting ward team, followed by transfer of the patient to the floor, independent of whether the accepting team met the patient in the ED prior to transfer. None of the accepting inpatient services in the study had a formal right to refuse acceptance of patients referred for admission by the ED. The time period evaluated was constrained to avoid the effect of other service changes that took place before or after the study period. The Northwestern University Institutional Review Board approved the study (STU00087387).
Data Acquisition and Measures
Data were obtained from the Northwestern Memorial Hospital Enterprise Data Warehouse, an integrated repository of all clinical and research data for patients receiving care in the system. For analysis, the patients were separated into 4 groups: a prechange general admission hospitalist group (group 1), a postchange admitter‐rounder hospitalist group (group 2), and 2 teaching service control groups separated according to the prechange or postchange time period (groups 3 and 4, respectively). The primary outcome variable for the study was transfer of the patient to the ICU within 24 hours of inpatient floor arrival, which has been previously reported as an adverse outcome related to the admission process due to its association with increased inpatient mortality.[13] Secondary outcome variables included ED LOS, total hospital LOS, and readmission to Northwestern Memorial Hospital within 30 days of hospital discharge. Data on unexpected transfer to the operating room, discharge against medical advice (all within 24 hours of arrival to the ward), as well as mortality during the hospital stay were collected but not further analyzed due to the extremely low incidence of each. Covariables measured included each admitted patient's age, sex, race, Elixhauser composite score (a patient comorbidity score associated with inpatient mortality, described by van Walraven et al.[14]), case mix, insurance payer status, patient census on the accepting service for day 2 of the admitted patient's hospitalization, and hospital occupancy on the day of admission.[7, 14, 15, 16] Hospital occupancy was calculated as the sum of the number of beds occupied at midnight plus the number of patients discharged during the previous 24 hours, divided by the number of hospital beds, as defined by Forster et al.[16]
Statistical Analysis
Prestudy sample size calculation using an value of 0.05 and value of 0.2 to detect a 1.5% absolute difference in ICU transfer rate between postchange study groups, with a patient distribution ratio of 3.3:1 or higher between the admitter‐rounder and teaching postchange groups, and an assumed higher transfer rate in the teaching postchange group, revealed a requirement of at least 1068 hospitalizations in the teaching postchange group for our evaluation. Descriptive statistics were calculated for each patient group. Firth's logistic regressions were used to model the odds of patient being transfer to ICU within 24 hours after arrival and the odds of hospital readmission within 30 days after discharge, adjusting for confounders.[17] Quantile regressions were used to model the change in the median of ED LOS and the median of hospital LOS due to the right‐skewed distributions of LOS. Based on the clinical relevance to the outcomes, models were adjusted for patients' measured covariates. All covariates that were significant at = 0.05 level were considered significant. All statistical analyses were performed in SAS version 9.4 (SAS Institute Inc., Cary, NC).
RESULTS
Patient Characteristics
The characteristics of the 4 patient populations are listed in Table 1. Compared to the general admission hospitalist group, the admitter‐rounder hospitalist group was more likely to be older (admitter‐rounder 61.9 19.0 vs 61.2 18.4, P = 0.03), a Medicare beneficiary (56.0% vs 52.9%, P 0.001), have a higher Elixhauser composite score (6.6 7.3 vs 5.3 6.7, P 0.001), and less likely to be white (46.5% vs 48.4%, P = 0.03). The teaching service patient characteristics changed over time only with regard to Elixhauser composite score (teaching postchange 6.4 7.3 vs 5.6 7.0, P 0.001); except for case mix, all other covariates did not change significantly between prechange and postchange teaching services. There was no significant difference in Elixhauser composite score between hospitalist and teaching services during the study period. Hospitalist groups were more likely than teaching service groups to have older patients, both before (hospitalist 61.2 18.4 vs teaching 60.1 19.1, P = 0.009) and after (hospitalist 61.9 18.0 vs teaching 60.0 18.6, P 0.001) the hospitalist admission system change. Compared to teaching groups, hospitalist groups were less likely to have female patients before the system change (hospitalist 52.3% vs 54.6%, P = 0.03), and more likely to have Medicare beneficiaries after the system change (hospitalist 56.0% vs 51.1%, P 0.001). Significant differences in case mix existed in all comparisons among all 4 study groups.
| Group 1 Hospitalist General, N = 8,465 | Group 2 Hospitalist Admitter‐Rounder, N = 6,291 | Group 3 Teaching Prechange, N = 2,636 | Group 4 Teaching Postchange, N = 1,878 | Group 2 vs Group 1, P Value | Group 4 vs Group 3, P Value | Group 1 vs Group 3, P Value | Group 2 vs Group 4, P Value | |
|---|---|---|---|---|---|---|---|---|
| ||||||||
| Age, y, mean (SD) | 61.2 (18.4) | 61.9 (19.0) | 60.1 (19.1) | 60.0 (18.6) | 0.03 | 0.88 | 0.009 | 0.001 |
| Female sex, n (%) | 4,423 (52.3) | 3,298 (52.4) | 1,440 (54.6) | 1,031 (54.9) | 0.83 | 0.86 | 0.03 | 0.06 |
| White race, n (%) | 4,096 (48.4) | 2,927 (46.5) | 1,261 (47.8) | 880 (46.9) | 0.03 | 0.52 | 0.62 | 0.80 |
| Payer status | 0.001 | 0.001 | 0.07 | 0.001 | ||||
| Medicaid, n (%) | 1,121 (13.2) | 811 (12.9) | 393 (14.9) | 222 (11.8) | ||||
| Medicare, n (%) | 4,475 (52.9) | 3,521 (56.0) | 1,394 (52.9) | 961 (51.2) | ||||
| Private, n (%) | 2,218 (26.2) | 1,442 (22.9) | 674 (25.6) | 525 (28.0) | ||||
| Self‐pay, n (%) | 299 (3.5) | 273 (4.3) | 72 (2.7) | 88 (4.7) | ||||
| Other, n (%) | 352 (4.2) | 244 (3.9) | 103 (3.9) | 82 (4.4) | ||||
| Elixhauser composite score, mean (SD) | 5.3 (6.7) | 6.6 (7.3) | 5.6 (7.0) | 6.4 (7.3) | 0.001 | 0.007 | 0.05 | 0.30 |
| Inpatient mortality, n (%) | 74 (0.9) | 70 (1.1) | 31 (1.2) | 18 (1.0) | 0.14 | 0.51 | 0.15 | 0.62 |
| No. of patients seen by accepting service, mean (SD) | 10.2 (3.8) | 12.0 (3.1) | 6.3 (3.2) | 7.0 (3.3) | 0.001 | 0.001 | 0.001 | 0.001 |
| Hospital % occupancy at admission, mean (SD) | 1.23 (0.18) | 1.20 (0.17) | 1.23 (0.18) | 1.20 (0.17) | 0.001 | 0.001 | 0.61 | 0.43 |
| Case mix, n (%) | 0.001 | 0.001 | 0.001 | 0.001 | ||||
| Diseases of the circulatory system | 2,695 (31.8) | 1,173 (18.9) | 396 (15.0) | 292 (15.6) | ||||
| Other | 1,139 (13.5) | 1,151 (18.3) | 423 (16.1) | 292 (15.6) | ||||
| Diseases of the respiratory system | 883 (10.4) | 612 (9.7) | 314 (11.9) | 541 (28.9) | ||||
| Diseases of the digestive system | 923 (10.9) | 889 (14.1) | 420 (15.9) | 196 (10.4) | ||||
| Diseases of the genitourinary system | 492 (5.8) | 525 (8.4) | 230 (8.7) | 122 (6.5) | ||||
| Injury and poisoning | 517 (6.1) | 451 (7.2) | 182 (6.9) | 80 (4.3) | ||||
| Endocrine, nutritional, and metabolic diseases and immunity disorders | 473 (5.6) | 357 (5.7) | 194 (7.4) | 76 (4.1) | ||||
| Symptoms, signs, and ill‐defined conditions and factors influencing health status | 470 (5.6) | 267 (4.2) | 141 (5.4) | 63 (3.4) | ||||
| Diseases of the musculoskeletal system and connective tissue | 371 (4.4) | 281 (4.5) | 136 (5.1) | 58 (3.1) | ||||
| Infectious and parasitic diseases | 234 (2.8) | 288 (4.6) | 108 (4.1) | 98 (5.2) | ||||
| Diseases of the blood and blood‐forming organs | 268 (3.2) | 297 (4.7) | 92 (3.5) | 60 (3.2) | ||||
Impact of the Admission System on Outcomes
Measured unadjusted primary and secondary outcomes for the 4 study groups, as well as inpatient mortality, are listed in Table 2. Comparative odds ratios (ORs) for the outcomes of transfer to ICU 24 hours of floor arrival and readmission to hospital 30 days after discharge, median (50% quantile) regression results for the outcomes of ED and hospital LOS, each adjusted by all study covariates, as well as associated difference‐in‐difference parameter estimates with associated standard error (SE) ranges and P values, are listed in Table 3. Difference‐in‐difference analysis of outcomes associated with adoption of the hospitalist admitter‐rounder system compared to the time‐matched teaching service revealed no statistically significant difference in associated ICU transfer outcome between hospitalist or teaching services (admitter‐rounder OR difference of +0.22, SE 0.22, P = 0.32). A significant decrease in associated odds for hospital readmission 30 days postdischarge was noted when adoption of the hospitalist admitter‐rounder system was compared to the time‐matched teaching service (admitter‐rounder OR difference of 0.21, SE 0.08, P = 0.01). Adoption of the hospitalist admitter‐rounder system, compared to the time‐matched teaching service, was associated with a significant increase in ED LOS (admitter‐rounder difference of +0.49 hours, SE 0.09, P 0.001). Difference‐in‐difference analysis revealed no significant difference in associated hospital LOS between the hospitalist and time‐matched teaching services over the study period (admitter‐rounder difference of 0.39 hours, SE 2.44, P = 0.87).
|
Group 1, Hospitalist General, N = 8,465 |
Group 2, Hospitalist Admitter‐Rounder, N = 6,291 |
Group 3, Teaching Prechange, N = 2,636 |
Group 4. Teaching Postchange, N = 1,878 |
|
|---|---|---|---|---|
| ||||
| Transfer to ICU 24 hours after ward arrival, n (%) | 235 (2.8) | 139 (2.2) | 75 (2.9) | 59 (3.1) |
| Hospital readmission 30 days after discharge, n (%) | 1,924 (22.7) | 1,546 (24.6) | 608 (23.1) | 504 (26.8) |
| Emergency department length of stay, h | ||||
| Mean (SD) | 6.9 (3.36) | 7.39 (3.9) | 7.05 (2.98) | 6.89 (3.03) |
| Median [range] | 6.22 [0.2262.47] | 6.68 [0.62149.52] | 6.53 [1.9833.63] | 6.3 [2.0224.17] |
| Hospital length of stay, h | ||||
| Mean (SD) | 102.46 (120.14) | 125.94 (153.41) | 114.07 (165.62) | 122.89 (125.55) |
| Median [range] | 67.37 [0.521,964.07] | 88.18 [0.285,801.28] | 71.5 [4.575,131.37] | 88.08 [4.731,262.58] |
| Hospitalist Admitter‐Rounder vs Hospitalist General | Teaching Postchange vs Teaching Prechange | Difference‐in‐Difference Value Parameter Estimate [Standard Error], P Value | |
|---|---|---|---|
| |||
| Transfer to ICU 24 hours after floor arrival, OR (95% confidence interval) | 1.292 (1.0261.629) | 1.029 (0.7211.468) | OR: +0.22 [ 0.22], 0.32 |
| Hospital readmission 30 days after discharge, OR (95% confidence interval) | 1.048 (0.9661.136) | 1.298 (1.1271.495) | OR: 0.21 [ 0.08], 0.01 |
| Emergency department length of stay, median hours | +0.40 | 0.09 | +0.49 [ 0.09], 0.001 |
| Hospital length of stay, median hours | +12.96 | +13.36 | 0.39 [ 2.44], 0.87 |
DISCUSSION
Our observations were revealing for a statistically nonsignificant trend toward increased ICU transfers 24 hours after floor arrival after adoption of the admitter‐rounder model by the hospital medicine service. Despite prior publication of early transfer to the ICU being associated with adverse outcomes, including increased inpatient mortality, we observed no difference in mortality in our study groups.[13] We suspect that earlier transfer to the ICU in our study cohort may instead represent a protective action taken more frequently by admitting hospitalists in the admitter‐rounder model in response to provider discontinuity risks embedded in the admission process. Requests for transfer to the ICU at our institution require approval by the ICU team, and requests from attending hospitalists may be responded to differently from requests enacted by teaching team members, which as a factor also may account for some of the adjusted differences in transfer incidence. Taken together, increased availability of hospitalists during the admission process may result in earlier implementation of an overall lower threshold for implementation of ICU transfer. Our conclusion is limited by our study cohort's overall inpatient mortality rate, which is sufficiently low to preclude further assessment of the relationship of adverse outcomes with ICU transfer rate in our study groups. Therefore, clinical significance of our primary outcome findings, as well as the workload factors that impact ICU transfers initiated by hospitalist and teaching services, require further examination.
Despite a hypothesized increase in hospital LOS caused by additional discontinuity of hospitalist care in the admitter‐rounder model, adoption of the admitter‐rounder model was not associated with an increased hospital LOS. We suspect this finding may represent the presence of action(s) proximal to the admission process, on the part of either admission and/or rounding hospitalists, which decrease hospital LOS to a degree offsetting the expected LOS increase generated by provider discontinuity. Examples of such actions include more efficient testing or consultation, or improved detection of diagnostic errors.
Adoption of the admitter‐rounder model by the hospital medicine service was also associated with decreased hospital readmission rates compared to the time‐matched teaching service. We suspect that assignment of daily discharge and admission service activity to separate hospitalists in the admitter‐rounder model may allow more opportunity for rounder hospitalists to engage in activity protective against readmissions, such as greater direct engagement with postdischarge resources, or improved hospitalist availability for multidisciplinary inpatient efforts focused on discharge planning.
Adoption of the admitter‐rounder model was found to be associated with a median 29‐minute increase in ED LOS compared to the time‐matched teaching service. As a floor team member's physical presence in the ED was not required for ED‐floor transfer during the study period, increased physical availability of admitting hospitalists in the admitter‐rounder model may allow for increased opportunity for a hospitalist to disrupt ED‐specific workflows related to patient transfer (eg, disruption of transportation service activity by an earlier bedside visit from the admitting hospitalist). Hospitalists in the general model were allowed to leave after performing their daily duties, whereas admitting hospitalists in the admitter‐rounder model were assigned to stay for a timed shift, regardless of the completion of admissions; the difference in duty assignment may be associated with different hospitalist behaviors during the admission process. Improved ease for ED staff to contact hospitalist staff in the admitter‐rounder model may have led ED staff to prioritize other tasks more demanding of their continuous engagement at the expense of initiating admissions, thereby paradoxically delaying admissions to hospital medicine.
Other studies exist that attempt to describe changes in admission service structure, particularly with regard to housestaff admission activity in relation to changes in resident work hours. Many of these studies vary with regard to implementation of separate physician teams for day and night coverage, or are focused on a specific medical condition, thereby limiting their applicability to a hospital medicine service free of work‐hour restrictions and engaged in care of a wide variety of medical conditions.[18, 19, 20] In contrast, our study is an attempt to examine, in isolation, outcomes associated with adoption of an admitter‐rounder model of care as a specific discontinuity risk during the admission process, within the context of a stable system of night coverage in place for all medical teams engaged in admission activity of undifferentiated medical patients.
Limitations of our study include the inability to ascertain causality of observed outcomes, due to our observational study design. Our study was of a single hospital, which may limit applicability of our results to other hospital environments. However, the admission models examined in our study are common among hospital medicine groups. Clinically relevant outcome metrics, such as mortality and unexpected transfer to the operating room, were measured but of too low incidence to allow for further meaningful analysis. The clinical consequences and workflow practices that correlate with our study's findings likely require case review and time‐motion analyses, respectively, to further delineate the relevance of our findings; these analyses were outside of the scope of our study, and further investigation is required. In summary, our observations suggest that adoption by hospitalist services of an admitter‐rounder model of care for admissions is associated with a decreased rate of hospital readmission 30 days after discharge, with no effect on median hospital LOS, a statistically nonsignificant trend toward more ICU transfers in the first 24 hours of a patient's hospital stay, and a slight increase in median ED LOS.
Acknowledgements
This study was conducted with logistical support, software, and computer hardware provided by the Division of Hospital Medicine, Department of Medicine, Northwestern University Feinberg School of Medicine, and by the Biostatistics Collaboration Center, Northwestern University Feinberg School of Medicine.
Disclosure: Nothing to report.
- , , , et al. Residents' and attending physicians' handoffs: a systematic review of the literature. Acad Med. 2009;84(12):1775–1787.
- , , , et al. The effect of emergency department crowding on clinically oriented outcomes. Acad Emerg Med. 2009;16:1–10.
- , , , et al. Time series analysis of variables associated with daily mean emergency department length of stay. Ann Emerg Med. 2007;49:265–271.
- , , , et al. Active bed management by hospitalists and emergency department throughput. Ann Intern Med. 2008;149:804–810.
- Society of Hospital Medicine. 2014 state of hospital medicine report. 2014:22.
- , , , , . The impact of fragmentation of hospitalist care on length of stay. J Hosp Med. 2010;5:335–338.
- , , , et al. The effect of hospitalist discontinuity on adverse events. J Hosp Med. 2015;10:147–151.
- , , , . Liability impact of the hospitalist model of care. J Hosp Med. 2014;9:750–755.
- . Does continuity of care matter? No: discontinuity can improve patient care. West J Med. 2001;175(1):5.
- , , , , . Consultant input in acute medical admissions and patient outcomes in hospitals in England: a multivariate analysis. PLoS One. 2013;8(4):e61476.
- , , . Effectiveness of acute medical units in hospitals: a systematic review. Int J Qual Health Care. 2009;21(6):397–407.
- , , . Acute medicine in the United Kingdom: first‐hand perspectives on a parallel evolution of inpatient medical care. J Hosp Med. 2012:7(3);254–257.
- , , , et al. Adverse outcomes associated with delayed intensive care unit transfers in an integrated healthcare system. J Hosp Med. 2012;7(3):224–230.
- , , , , . A modification of the Elixhauser comorbidity measures into a point system for hospital death using administrative data. Med Care. 2009;47(6):626–633.
- , , , , . Effect of hospitalist workload on the quality and efficiency of care. JAMA Intern Med. 2014;174(5):786–793.
- , , , , . The effect of hospital occupancy on emergency department length of stay and patient disposition. Acad Emerg Med. 2003;10(2):127–133.
- . Bias reduction of maximum likelihood estimates. Biometrika. 1993;80(1):27–38.
- , , , et al. Effect of the 2011 vs 2003 duty hour regulation‐compliant models on sleep duration, trainee education, and continuity of patient care among internal medicine house staff. JAMA Intern Med. 2013;173(8):649–655.
- , , , . Post‐call transfer of resident responsibility: Its effect on patient care. J Gen Intern Med. 1990;5:501–505.
- , , , et al. Effect of short call admission on length of stay and quality of care for acute decompensated heart failure. Circulation. 2008;117:2637–2644.
Landscape of Business Models in Teledermatology
Teledermatology remains relatively limited in practice despite strong evidence supporting its use.1 A major impediment to its adoption is nonreimbursement.2,3 We sought to characterize business models that currently are in use for teledermatology through interviews with private and academic dermatologists.
Methods
The institutional review board at the University of Pennsylvania (Philadelphia, Pennsylvania) exempted this study from review. We contacted the email lists of the American Academy of Dermatology’s Telemedicine Task Force, the American Telemedicine Association’s Teledermatology Special Interest Group, and the Association of Professors of Dermatology to identify dermatologists who have been reimbursed for teledermatology services. Inclusion criteria were dermatologists who were currently receiving payment for teledermatology services and members of teledermatology-related professional groups. Interviews were conducted by telephone and/or email using an interview guide, which included questions on teledermatology platforms and workflow models, reimbursement structures and amounts, and referrers. Individuals, institutions, and teledermatology platforms were anonymized to encourage candid disclosure of business practices.
Results
Nineteen dermatologists participated in the study. Most participants described business models fitting into 4 categories: (1) standard fee-for-service reimbursement from insurance (n=4), (2) capitated service contracts (n=6), (3) per-case service contracts (n=3), and (4) direct to consumer (n=5)(Table). There were other business models reported at Veterans Affairs hospitals and accountable care organizations (n=4).
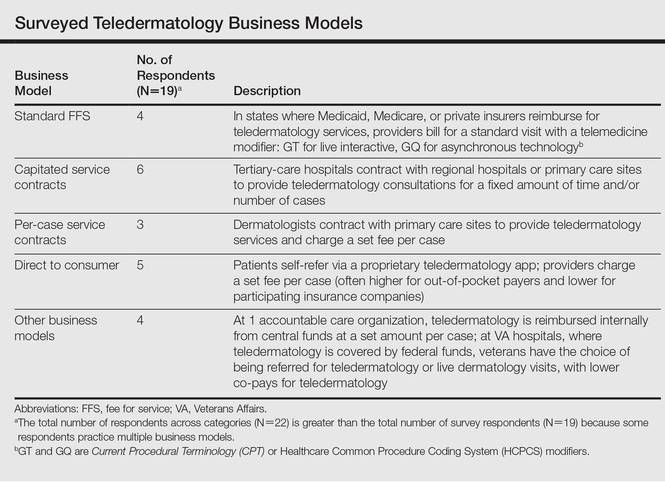
Standard fee-for-service (FFS) teledermatology business models were frequently represented among respondents at academic institutions. With this model, providers used live interactive or store-and-forward teledermatology platforms to conduct virtual clinic visits and bill patients’ insurance companies directly. At some institutions, providers conducted live interactive teledermatology visits and also used store-and-forward teledermatology for initial screening before the patient encounter. Physician extenders at some referring sites (eg, physician assistants, nurse practitioners) were trained to photograph lesions, set up live interactive teledermatology equipment, and perform certain procedures such as skin biopsies. Referrers—often Federally Qualified Health centers, rural health clinics, or state facilities—contracted with the teledermatology site and sometimes paid a fee to join the referral network.
In another business model, teledermatology centers did not bill patients directly and instead received payment only from the centers’ participating referrers through service contracts. The subscribing institutions then could bill patients’ insurance companies appropriately. Service contracts among respondents were structured either to be capitated or reimbursed on a per-case basis. Capitated service contracts typically required subscribing institutions to pay weekly stipends of several hundred dollars or a percentage of an individual dermatologist’s salary (eg, 0.1 full-time equivalents) for consultations. Sometimes the number of consultations per time period was capped. In contrast, per-case service contracts involved per-case payments from referrers to dermatologists for teledermatology consultations. In one hybrid model, the subscribing institution paid an annual fee for a certain number of consultations per month with any additional consultations exceeding that number covered at a set fee per case.
Direct-to-consumer models, which were more common among private dermatologist respondents, used proprietary asynchronous teledermatology platforms to connect with patients. Patients generally paid out of pocket to participate, with fees ranging from $30 to $100 per case or less if the patient had participating insurance. One respondent contracted with a large private insurer to reimburse this service at a reduced fee.
Comment
Our study was limited by a small sample size; however, our goal was to detect and report different types of teledermatology business models that currently are in practice. The small number of respondents likely does not indicate poor participation; rather, it is probably reflective of our strict inclusion criteria. We sought to interview only dermatologists who were currently receiving payment for teledermatology services and members of teledermatology-related professional groups. Our strategy in this study was to cast a wide net to capture some of the few dermatologists who currently fit this requirement.
We anticipate that the standard FFS business model for teledermatology will expand slightly as more legislation incentivizing telemedicine is enacted. Currently, Medicaid reimburses for live interactive teledermatology in 47 states and for asynchronous consultations in 9 states, whereas Medicare nationally reimburses only for live interactive services in low-access areas.4 Additionally, 29 states and the District of Columbia have private insurance parity laws mandating that private plans cover and reimburse for telemedicine comparable to in-person care. Seven of those states just passed their legislation in 2015, with 8 more states currently considering proposed parity laws.5
On the other hand, the FFS model in general may actually limit the rate of adoption of teledermatology. Several of our study’s respondents pointed to dermatologists’ opportunity costs under the FFS reimbursement environment as a barrier to widespread adoption of teledermatology; providers may prefer in-person visits to teledermatology because they can perform procedures, which are more highly reimbursed. For that reason, a major driver of teledermatology adoption in the future may be the emergence of new, quality-based practice models, such as accountable care organizations.6
Because most states require that providers hold a medical license in the jurisdiction where their patient is physically located, physicians providing teledermatology services across state lines could face additional licensure requirements. However, these requirements would not be a barrier for physicians providing teledermatology services within the context of an in-state referral network. Licensure requirements generally do not restrict physician-to-physician consultations.7
Conclusion
As reimbursement models across medicine evolve and telemedicine continues to enhance delivery of care, we anticipate that quality-based reimbursement ultimately will drive successful utilization of teledermatology services. Telemedicine has been noted to be a cost-effective tool for coordinating care, maintaining quality, and improving patient satisfaction.8 Although none of the teledermatology business models surveyed currently incorporate incentives for faster case turnaround or higher patient satisfaction, we expect models to adjust as quality measures become more prevalent in the reimbursement landscape. Effective business models must be implemented to make teledermatology a feasible option for dermatologists to deliver care and patients to access care.
1. Armstrong AW, Wu J, Kovarik CL, et al. State of teledermatology programs in the United States. J Am Acad Dermatol. 2012;67:939-944.
2. Armstrong AW, Kwong MW, Ledo L, et al. Practice models and challenges in teledermatology: a study of collective experiences from teledermatologists. PLOS One. 2011;6:e28687.
3. Thomas L, Capistrant G. State telemedicine gaps analysis: coverage & reimbursement. American Telemedicine Association website. http://www.americantelemed.org/docs/default-source/policy/50-state-telemedicine-gaps-analysis---coverage-and-reimbursement.pdf. Published May 2015. Accessed February 19, 2016.
4. State telehealth laws and reimbursement policies: a comprehensive scan of the 50 states and District of Columbia. Center for Connected Health Policy website. http://cchpca.org/sites/default/files/resources/State%20Laws%20and%20Reimbursement%20Policies%20Report%20Feb%20%202015.pdf. Published June 2015. Accessed February 19, 2016.
5. 2015 State telemedicine legislation tracking. American Telemedicine Association website. http://www.america telemed.org/docs/default-source/policy/state-legislation-matrix_2016147931CF25A6.pdf?sfvrsn=2. Updated January 11, 2016. Accessed March 23, 2016.
6. Telehealth and ACO’s–a match made in heaven. Hands on Telehealth website. http://www.handsontelehealth.com/past-issues/159-infographic-telehealth-and-acosa-match-made-in-heaven. Accessed February 19, 2016.
7. Thomas L, Capistrant G. State telemedicine gaps analysis: physician practice standards & licensure. American Telemedicine Association website. http://www.american telemed.org/docs/default-source/policy/50-state-telemedicine-gaps-analysis--physician-practice-standards-licensure.pdf. Published May 2015. Accessed February 19, 2016.
8. Telemedicine’s impact on healthcare cost and quality. American Telemedicine Association website. http://www.americantelemed.org/docs/default-source/policy/examples-of-research-outcomes---telemedicine’s-impact-on-healthcare-cost-and-quality.pdf. Published April 2015. Accessed February 19, 2016.
Teledermatology remains relatively limited in practice despite strong evidence supporting its use.1 A major impediment to its adoption is nonreimbursement.2,3 We sought to characterize business models that currently are in use for teledermatology through interviews with private and academic dermatologists.
Methods
The institutional review board at the University of Pennsylvania (Philadelphia, Pennsylvania) exempted this study from review. We contacted the email lists of the American Academy of Dermatology’s Telemedicine Task Force, the American Telemedicine Association’s Teledermatology Special Interest Group, and the Association of Professors of Dermatology to identify dermatologists who have been reimbursed for teledermatology services. Inclusion criteria were dermatologists who were currently receiving payment for teledermatology services and members of teledermatology-related professional groups. Interviews were conducted by telephone and/or email using an interview guide, which included questions on teledermatology platforms and workflow models, reimbursement structures and amounts, and referrers. Individuals, institutions, and teledermatology platforms were anonymized to encourage candid disclosure of business practices.
Results
Nineteen dermatologists participated in the study. Most participants described business models fitting into 4 categories: (1) standard fee-for-service reimbursement from insurance (n=4), (2) capitated service contracts (n=6), (3) per-case service contracts (n=3), and (4) direct to consumer (n=5)(Table). There were other business models reported at Veterans Affairs hospitals and accountable care organizations (n=4).
Standard fee-for-service (FFS) teledermatology business models were frequently represented among respondents at academic institutions. With this model, providers used live interactive or store-and-forward teledermatology platforms to conduct virtual clinic visits and bill patients’ insurance companies directly. At some institutions, providers conducted live interactive teledermatology visits and also used store-and-forward teledermatology for initial screening before the patient encounter. Physician extenders at some referring sites (eg, physician assistants, nurse practitioners) were trained to photograph lesions, set up live interactive teledermatology equipment, and perform certain procedures such as skin biopsies. Referrers—often Federally Qualified Health centers, rural health clinics, or state facilities—contracted with the teledermatology site and sometimes paid a fee to join the referral network.
In another business model, teledermatology centers did not bill patients directly and instead received payment only from the centers’ participating referrers through service contracts. The subscribing institutions then could bill patients’ insurance companies appropriately. Service contracts among respondents were structured either to be capitated or reimbursed on a per-case basis. Capitated service contracts typically required subscribing institutions to pay weekly stipends of several hundred dollars or a percentage of an individual dermatologist’s salary (eg, 0.1 full-time equivalents) for consultations. Sometimes the number of consultations per time period was capped. In contrast, per-case service contracts involved per-case payments from referrers to dermatologists for teledermatology consultations. In one hybrid model, the subscribing institution paid an annual fee for a certain number of consultations per month with any additional consultations exceeding that number covered at a set fee per case.
Direct-to-consumer models, which were more common among private dermatologist respondents, used proprietary asynchronous teledermatology platforms to connect with patients. Patients generally paid out of pocket to participate, with fees ranging from $30 to $100 per case or less if the patient had participating insurance. One respondent contracted with a large private insurer to reimburse this service at a reduced fee.
Comment
Our study was limited by a small sample size; however, our goal was to detect and report different types of teledermatology business models that currently are in practice. The small number of respondents likely does not indicate poor participation; rather, it is probably reflective of our strict inclusion criteria. We sought to interview only dermatologists who were currently receiving payment for teledermatology services and members of teledermatology-related professional groups. Our strategy in this study was to cast a wide net to capture some of the few dermatologists who currently fit this requirement.
We anticipate that the standard FFS business model for teledermatology will expand slightly as more legislation incentivizing telemedicine is enacted. Currently, Medicaid reimburses for live interactive teledermatology in 47 states and for asynchronous consultations in 9 states, whereas Medicare nationally reimburses only for live interactive services in low-access areas.4 Additionally, 29 states and the District of Columbia have private insurance parity laws mandating that private plans cover and reimburse for telemedicine comparable to in-person care. Seven of those states just passed their legislation in 2015, with 8 more states currently considering proposed parity laws.5
On the other hand, the FFS model in general may actually limit the rate of adoption of teledermatology. Several of our study’s respondents pointed to dermatologists’ opportunity costs under the FFS reimbursement environment as a barrier to widespread adoption of teledermatology; providers may prefer in-person visits to teledermatology because they can perform procedures, which are more highly reimbursed. For that reason, a major driver of teledermatology adoption in the future may be the emergence of new, quality-based practice models, such as accountable care organizations.6
Because most states require that providers hold a medical license in the jurisdiction where their patient is physically located, physicians providing teledermatology services across state lines could face additional licensure requirements. However, these requirements would not be a barrier for physicians providing teledermatology services within the context of an in-state referral network. Licensure requirements generally do not restrict physician-to-physician consultations.7
Conclusion
As reimbursement models across medicine evolve and telemedicine continues to enhance delivery of care, we anticipate that quality-based reimbursement ultimately will drive successful utilization of teledermatology services. Telemedicine has been noted to be a cost-effective tool for coordinating care, maintaining quality, and improving patient satisfaction.8 Although none of the teledermatology business models surveyed currently incorporate incentives for faster case turnaround or higher patient satisfaction, we expect models to adjust as quality measures become more prevalent in the reimbursement landscape. Effective business models must be implemented to make teledermatology a feasible option for dermatologists to deliver care and patients to access care.
1. Armstrong AW, Wu J, Kovarik CL, et al. State of teledermatology programs in the United States. J Am Acad Dermatol. 2012;67:939-944.
2. Armstrong AW, Kwong MW, Ledo L, et al. Practice models and challenges in teledermatology: a study of collective experiences from teledermatologists. PLOS One. 2011;6:e28687.
3. Thomas L, Capistrant G. State telemedicine gaps analysis: coverage & reimbursement. American Telemedicine Association website. http://www.americantelemed.org/docs/default-source/policy/50-state-telemedicine-gaps-analysis---coverage-and-reimbursement.pdf. Published May 2015. Accessed February 19, 2016.
4. State telehealth laws and reimbursement policies: a comprehensive scan of the 50 states and District of Columbia. Center for Connected Health Policy website. http://cchpca.org/sites/default/files/resources/State%20Laws%20and%20Reimbursement%20Policies%20Report%20Feb%20%202015.pdf. Published June 2015. Accessed February 19, 2016.
5. 2015 State telemedicine legislation tracking. American Telemedicine Association website. http://www.america telemed.org/docs/default-source/policy/state-legislation-matrix_2016147931CF25A6.pdf?sfvrsn=2. Updated January 11, 2016. Accessed March 23, 2016.
6. Telehealth and ACO’s–a match made in heaven. Hands on Telehealth website. http://www.handsontelehealth.com/past-issues/159-infographic-telehealth-and-acosa-match-made-in-heaven. Accessed February 19, 2016.
7. Thomas L, Capistrant G. State telemedicine gaps analysis: physician practice standards & licensure. American Telemedicine Association website. http://www.american telemed.org/docs/default-source/policy/50-state-telemedicine-gaps-analysis--physician-practice-standards-licensure.pdf. Published May 2015. Accessed February 19, 2016.
8. Telemedicine’s impact on healthcare cost and quality. American Telemedicine Association website. http://www.americantelemed.org/docs/default-source/policy/examples-of-research-outcomes---telemedicine’s-impact-on-healthcare-cost-and-quality.pdf. Published April 2015. Accessed February 19, 2016.
Practice Points
- Teledermatology services may improve access to dermatology care but are limited by lack of reimbursement.
- Different business models have been successfully implemented for use of teledermatology in different care settings.
- As more legislation incentivizing telemedicine is enacted, the standard fee-for-service business model for teledermatology likely will expand.

Patient‐Reported Barriers to Discharge
Thirty‐six million adults were discharged from US hospitals in 2012, with approximately 45% from medicine service lines.[1, 2] Discharge planning, a key aspect of care for hospitalized patients,[3] should involve the development of a plan to enable the patient to be discharged at the appropriate time and with provision of sufficient postdischarge support and services.[4]
Central to the discharge planning process is an assessment of a patient's readiness for discharge. Readiness is often a provider‐driven process, based on specific clinical and health system benchmarks.[5] However, providers' perception of readiness for discharge does not always correlate with patients' self‐assessments or objective measures of understanding.[6] For example, nurses overestimate patients' readiness for discharge compared to patients' own self‐report.[7] As a result, the need to include the patient perspective is increasingly recognized as an important contributing factor in the discharge planning process.[8, 9]
Current approaches to assessing discharge readiness are typically single assessments. However, these assessments do not take into account the complexity of discharge planning or patients' understanding, or their ability to carry out postacute care tasks.[8] In addition, few models have included assessments of physical stability and functional ability along with measures such as ability to manage self‐care activities at home, coping and social support, or access to health system and community resources.[10, 11]
To address these gaps in the existing literature, we carried out a prospective observational study of daily, patient‐reported, assessments of discharge readiness to better understand patients' perspectives on issues that could impede the transition to home. Using these data, we then sought to determine the prevalence of patient‐reported discharge barriers and the frequency with which they were resolved prior to the day of discharge. We also explored whether problems identified at discharge were associated with 30‐day readmission.
METHODS
Study Design, Setting, and Participants
We carried out a prospective observational study at the University of California San Francisco (UCSF) Medical Center, a 600‐bed tertiary care academic hospital in San Francisco, California. The UCSF Committee on Human Research approved this study. We recruited patients between November 2013 and April 2014. Patients were eligible to participate if they were admitted to the General Medicine Service; over 18 years old; English speaking; cognitively able to provide informed consent; and not under contact, droplet, airborne, or radiation isolation. Patients were eligible to participate regardless of where they were admitted from or expected to be discharged (eg, home, skilled nursing facility). Patients were excluded if they were acutely unwell or symptomatic resulting in them being unable to complete the surveys. Caregivers were not able to participate in the study on behalf of patients. We screened daily admission charts for eligibility and approached consecutive patients to consent them into the study on their first or second day of hospitalization. An enrollment tracker was used to documented reasons for patients' exclusion or refusal.
Survey Development
We adapted an existing and validated Readiness for Hospital Discharge Survey (RHDS) previously used in obstetric, surgical, and medicine patients for our study.[10, 11, 12] This initial list was culled from 23 to 12 items, based on input from patients and physicians. This feedback step also prompted a change in the response scale from a 0 to 10 scale to a simpler yes, no, or I would like to talk with someone about this scale intended to encourage discussion between patients and providers. After this revision step, we further pretested the survey among physicians and a small set of general medical patients to assess comprehension. Thus, our final question set included 12 items in 4 domains; personal status (ie, pain, mobility), knowledge (ie, medications, problems to watch for, recovery plan), coping ability (ie, emotional support, who to call with problems), and expected support (ie, related to activities and instrumental activities of daily living).
Data Collection
We collected data from interviews of patients as well as chart abstraction. Trained research assistants approached patients to complete our revised RHDS at admission, which was either on their first or second day of hospitalization. We collected data via an intake admission survey, which asked patients about their readiness for discharge, followed by a daily readiness for discharge survey until the day of discharge. A research assistant read the survey items to patients and recorded responses on a paper version of the survey. We abstracted demographic, clinical, and 30‐day readmission information from each participant's electronic medical record.
Analytic Approach
A barrier to discharge readiness was confirmed when a patient responded no' to an item (except for presence of catheter and pain or discomfort where yes was used) and/or they stated they wanted to talk to someone about the issue. We then used descriptive statistics to summarize patients' responses by survey administration number. Multilevel mixed effect regression was used to investigate any patterns in barriers to discharge over the course of hospitalization. We described the frequency of identified barriers to discharge on the intake admission and final (48 hours of discharge) surveys. McNemar's tests compared the proportion of patients reporting each barrier, and paired t tests the mean number of barriers at these 2 survey time points. We also assessed whether persistent barriers to discharge readiness on the final survey were associated with readmission to our hospital within 30‐days using t tests, 2, or Fisher exact test. Analysis was conducted in SPSS 22.0 (IBM Corp., Armonk, NY) and Stata (StataCorp, College Station, TX).
RESULTS
Patients
There were 2045 patients admitted to the general medicine service during the study period. Medical record screening resulted in 1350 exclusions. Of the remaining 695 patients, 113 refused and 419 were further found to be unable to participate. After all exclusions were applied and following direct screening, 163 patients agreed to participate in our study (Table 1). Mean length of stay among our cohort was 5.42 days (standard deviation [SD], 11.49) and the majority of patients were admitted from and discharged to home (Table 1).
| |
| Mean age, y (SD) | 56.4 (17) |
| Female gender, no. (%) | 86 (53) |
| Race, no. (%) | |
| Asian | 13 (8) |
| African American | 27 (16) |
| White | 96 (59) |
| Other | 24 (25) |
| Declined to say | 3 (1) |
| Married, no. (%) | 78 (48) |
| Insurance, no. (%) | |
| Medicare | 59 (36) |
| Medicaid | 22 (14) |
| Private | 73 (45) |
| Self‐pay | 2 (1) |
| Other | 7 (4) |
| Patient admitted from, no. (%) | |
| Home | 118 (72) |
| Outpatient clinic | 17 (10) |
| Procedural area | 6 (4) |
| Another facility | 12 (7) |
| Other | 9 (6) |
| Patient discharged to, no. (%) | |
| Home without services | 107 (66) |
| Home with services | 40 (25) |
| Home hospice | 2 (1) |
| Skilled nursing facility | 8 (5) |
| Patient deceased | 3 (2) |
| Other | 3 (2) |
Barriers to Discharge Readiness
Patients completed on average 1.82 surveys (SD 1.10; range, 18), and in total 296 surveys were administered. Only 5% of patients were captured on their admission day, whereas 77% of patients were surveyed on their second hospital day (Table 2). Between the first and second survey administration, 51% of patients were lost to follow‐up, and then by the third survey administration a further 37% were lost to follow‐up (Table 3). Patients were unable to be reinterviewed most often because they had been (1) discharged, (2) were unavailable or having a procedure at time of recruitment, or (3) became too sick and symptomatic.
| Hospital Day | ||||||||||
|---|---|---|---|---|---|---|---|---|---|---|
| 1 | 2 | 3 | 4 | 5 | 6 | 7 | 8 | 9 | 10 | |
| No. of eligible patients hospitalized | 163 | 161 | 138 | 102 | 70 | 50 | 35 | 24 | 19 | 17 |
| No. of patients surveyed | 8 | 124 | 70 | 30 | 22 | 13 | 7 | 6 | 2 | 0 |
| % of eligible patients surveyed | 4.9 | 77.0 | 50.7 | 29.4 | 31.4 | 26.0 | 20.0 | 25.0 | 10.5 | 0 |
| Survey No. | ||||||
|---|---|---|---|---|---|---|
| 1 | 2 | 3 | 4 | 5 | 6+ | |
| ||||||
| No. of patients surveyed | 163 | 83 | 31 | 11 | 3 | 5 |
| Total barriers (all patients) | 533 | 235 | 84 | 22 | 7 | 8 |
| No. of barriers per patient, mean (SD) | 3.27(2.35) | 2.83 (2.11) | 2.71 (2.49) | 2.00 (1.73) | 2.33 (2.51) | 1.60 (2.30) |
| Median no. of barriers per patient | 3.0 | 3.0 | 2.0 | 1.0 | 2.0 | 0 |
| Median hospital day of survey administration | 2.0 | 3.0 | 5.0 | 6.0 | 8.0 | 13.0 |
| Initial admission survey, no. (%) | 163 (100.0) | 0 | 0 | 0 | 0 | 0 |
| Follow‐up survey, no. (%) | 0 | 38 (45.8) | 16 (51.6) | 4 (36.4) | 0 | 1 (20.0) |
| Survey 48 hours before discharge, no. (%) | 59 (36.2) | 45 (54.2) | 15 (48.4) | 7 (63.6) | 3 (100.0) | 4 (80.0) |
In total, over 889 individual barriers to discharge readiness were reported across all surveys. The total and mean numbers of barriers were highest on the admission intake survey, and numbers continued to decrease until the fourth survey. On average, the total number of barriers to discharge patients reported decreased by 0.15 (95% confidence interval: 0.01‐0.30) per day (P = 0.047).
Change in Barriers to Discharge
Sixty‐eight patients (42%) completed an admission intake survey as well as final survey 48 hours before discharge (Table 4). We observed a significant reduction in mean number of barriers reported between admission and discharge surveys (3.19 vs 2.53, P = 0.01). Sixty‐one patients (90%) left the hospital with 1 or more persistent barrier to a safe discharge. However, the 3 most common barriers to discharge readiness on the admission and final survey remained the same: unresolved pain, lack of understanding of plan for recovery, and daily living activities (eg, cooking, cleaning, and shopping). The number of patients with unresolved pain appeared to increase slightly, though this rise was not statistically significant. In contrast, there were significant reductions in patients reporting they were unaware of problems to watch out for postdischarge (28% vs 16%; P = 0.04) or did not understand their recovery plan (52% vs 40%; P = 0.03).
| Barrier to Discharge | Survey | |
|---|---|---|
| Admission, No. (%) | Final Survey, No. (%) | |
| ||
| Catheter is present? | 6 (7.2) | 6 (7.2) |
| Not out of bed, sitting in a chair, or walking? | 17 (20.5) | 13 (15.7) |
| Pain or discomfort? | 50 (60.2) | 52 (62.7) |
| Unable to get to the bathroom for toilet or to shower? | 15 (18.1) | 12 (14.5) |
| Unable to self‐care without help from others? | 27 (32.5) | 23 (27.7) |
| Unable to get your own medications? | 11 (13.3) | 14 (16.9) |
| Know what problems to watch for?* | 23 (27.7) | 13 (15.7) |
| Know where to call if you had problems? | 10 (12.0) | 8 (9.6) |
| Inability for personal care such as bathing, toileting, and eating? | 8 (9.6) | 11 (13.3) |
| Lack of support for emotional needs? | 16 (19.3) | 9 (10.8) |
| Unable to cook, clean, or do shopping? | 33 (39.8) | 25 (30.1) |
| Do not understand the overall plan for your recovery?* | 43 (51.8) | 33 (39.8) |
DISCUSSION
Assessing discharge readiness highlights an opportunity to engage patients directly in their discharge planning process. However, our prospective study of 163 hospitalized adults revealed that unresolved discharge barriers were common; 90% of patients were discharged with at least 1 issue that might inhibit an effective transition home. The majority of these patients were also discharged home without any support services. In addition, many of the major barriers patients reportedpain, lack of understanding around plans, and ability to provide self‐carewere consistent from admission to discharge, suggesting a missed opportunity to address problems present early in a patient's stay.
Some of the issues our patients described, such as pain; lack of understanding of a recovery plan; and functional, social, and environmental vulnerabilities that impede recovery, have been described in studies using data collected in the postacute time period.[13, 14, 15] Focus on postacute barriers is likely to be of limited clinical utility to assist in any real‐time discharge planning, particularly planning that assesses individual patients' needs and tailors programs and education appropriately. Having said this, consistency between our results and data collected from postdischarge patients again supports broad areas of improvement for health systems.
Persistent gaps in care at discharge may be a result of limited standardization of discharge processes and a lack of engagement in obtaining patient‐reported concerns. Lack of a framework for preparing individual patients for discharge has been recognized as a significant obstacle to effective discharge planning. For example, Hesselink et al.'s qualitative study with almost 200 patients and providers across multiple institutions described how lack of a standard approach to providing discharge planning resulted in gaps in information provision.[16] Similarly, Horwitz et al. described wide variation in discharge practices at a US academic medical center, suggesting lack of a standard approach to identifying patient needs.[14]
Although many transitions of care programs have supported implementation of specific care interventions at a hospital or health system level, there have been surprisingly few studies describing efforts to standardize the assessment of discharge barriers and prospectively engage individual patients.[17] One emblematic study used stakeholder interviews and process mapping to develop a readiness report within their electronic medical record (EMR).[17] Aggregate data from the EMR including orders and discharge plans were coded, extracted, and summarized into a report. The overall goal of the report was to identify progress toward completion of discharge tasks; however, a limitation was that it did not explicitly include patient self‐assessments. Another study by Grimmer et al. describes the development of a patient‐centered discharge checklist that incorporated patients and care concerns.[18] The themes incorporated into this checklist cover many transitional issues; however, outside of the checklist's development, few publications or Web resources describe it in actual use.
Our approach may represent an advance in approaches to engaging patients in discharge planning and preparing patients for leaving the hospital. Although our data do not support efficacy of our daily surveys in terms of improving discharge planning, this initial evaluation provides the framework upon which providers can develop discharge plans that are both standardized in terms of using a structured multidomain communication tool to elicit barriers, as well as patient‐centered and patient‐directed, by using the information collected in the survey tool to initiate tailored discharge planning earlier in the hospital stay. However, our program points out an important limitation of an entirely patient‐initiated program, which is difficulty obtaining truly daily assessments. During this study, we had a single research assistant visit patients as frequently as possible during hospitalization, but even daily visits did not yield complete information on all patients. Although this limitation may in part be due to the fact that our study was a focused pilot of an approach we hope to expand, it also represents the complexity of patient experience in the hospital, where patients are often out of their room for tests, are unable to complete a survey because of problematic symptoms, or simply are unwilling or unable to participate in regular surveys.
Our study has a number of limitations. First, the number of patients in our study overall, and the number who completed at least 2 surveys, was relatively small, limiting the generalizability of the study and our ability to determine the true prevalence of unresolved barriers at discharge. In addition, our selection criteria and response rates have limited our sample in that our final group may not be representative of all patients admitted to our medicine service. The broad exclusion of patients who had physical or psychosocial barriers, and those who were acutely unwell and symptomatic, has the potential to introduce selection bias given the excluded populations are those most at risk of readmission. We also acknowledge that some of the issues that patients' are reporting may be chronic ones. However, given the fact that patients feel these issues, even if chronic, are unaddressed or that they want to talk with their doctor about them, is still a very large potential gap in care and patient engagement.
However, despite these limitations, which seem most likely to produce a cohort that is more likely to be able to participate in our survey, and in turn more likely to participate in their care more broadly, we still observed disappointing resolution of discharge barriers. In addition, our adapted survey instrument, though based on well‐supported conceptual frameworks,[19] has not been extensively tested outside of our hospital setting. Finally, as a single‐center study, our results cannot be generalized to other settings.
Assessing discharge readiness highlights an opportunity to obtain patient self‐reported barriers to discharge. This can facilitate discharge planning that targets individual patient needs. This information also emphasizes potentially fruitful opportunities for improved communication and education activities, potentially if these data are fed back to providers in real time, potentially as part of team‐based dashboards or the context of interdisciplinary team models.
Acknowledgements
The authors thank all of the patients who participated in this project, and Yimdriuska Magan Gigi for her assistance with chart abstractions. The authors also acknowledge and thank John Boscardin for his statistical and analytic support.
Disclosures: James D. Harrison, and Drs. Ryan S. Greysen and Andrew D. Auerbach contributed to the concept, design, analysis, interpretation of data, drafting of the manuscript, critical revisions to the manuscript, and final approval of manuscript. Ronald Jacolbia and Alice Nguyen contributed to the acquisition of data, drafting and final approval of manuscript and project, and administrative and technical support. Dr. Auerbach was supported by National Heart, Lung, and Blood Institute grant K24 K24HL098372. Dr. Greysen is supported by the National Institutes of Health (NIH), National Institute of Aging (NIA) through the Claude D. Pepper Older Americans Independence Center (P30AG021342 NIH/NIA and K23AG045338‐01). The authors have no financial or other conflicts of interest to declare.
- , , . Trends and projections in inpatient hospital costs and utilization 2003–2013. HCUP statistical brief #175. July 2014. Rockville, MD: Agency for Healthcare Research and Quality; 2014.
- , . Overview of hospital stays in the United States 2012. HCUP statistical brief #180. October 2014. Rockville, MD: Agency for Healthcare Research and Quality; 2014.
- Joint Commision. The Joint Commission Comprehensive Accreditation Manual for Hospitals. Oak Brook, IL: The Joint Commission; 2015.
- , , . Hospital discharge and readmission. In: Post TW, ed. UpToDate website: Available at: http://www.uptodate.com/contents/hospital‐discharge‐and‐readmission. Accessed August 14, 2015.
- , . A patient centered model of care for hospital discharge. Clin Nurse Res. 2004;13:117–136.
- , , , , , . Which reasons do doctors, nurses and patients have for hospital discharge? A mixed methods study. PLoS One. 2014;9:e91333.
- , , . Nurse and patient perceptions of discharge readiness in relation to postdischarge utilization. Med Care. 2010;48:482–486.
- , . Older people's perception of their readiness for discharge and postdischarge use of community support and services. Int J Older People Nurs. 2013;8:104–115.
- , , , . The care transitions intervention: Results of a randomized controlled trial. Arch Intern Med. 2006;166:1822–1828.
- , . Psychometric properties of the Readiness for Hospital Discharge Scale. J Nurs Meas. 2006;14:163–180.
- , , , et al. Perceived readiness for hospital discharge in adult medical‐surgical patients. Clin Nurse Spec. 2007;21:31–42.
- , , , . Validation of patient and nurse short forms of the Readiness for Hospital Discharge Scale and their relationship to return to the hospital. Health Serv Res. 2014;49:304–317.
- , , , et al. “Missing Pieces”—functional, social and environmental barriers to recovery for vulnerable older adults transitioning from hospital to home. J Am Geriatr Soc. 2014;62:1556–1561.
- , , , et al. Quality of discharge practices and patient understanding at an academic medical center. JAMA Intern Med. 2013;173:1715–1722.
- , , . Brief scale measuring patient prepardeness for hospital discharge to home: Psychometric properties. J Hosp Med. 2008;3:446–454.
- , , , et al. Improving patient discharge and reducing hospital readmission by using intervention mapping. BMC Health Serv Res. 2014;14:389.
- , , , , , . Development of a discharge readiness report within the electronic health record: a discharge planning tool. J Hosp Med. 2014;9:533–539.
- , , , . Incorporating Patient and Carer Concerns in Discharge Plans: The Development of a Practical Patient‐Centred Checklist. The Internet Journal of Allied Health Sciences and Practice. 2006;4: Article 5.
- , , , . Identifying keys to success in reducing readmissions using the ideal transitions in care framework. BMC Health Serv Res. 2014;14:423.
Thirty‐six million adults were discharged from US hospitals in 2012, with approximately 45% from medicine service lines.[1, 2] Discharge planning, a key aspect of care for hospitalized patients,[3] should involve the development of a plan to enable the patient to be discharged at the appropriate time and with provision of sufficient postdischarge support and services.[4]
Central to the discharge planning process is an assessment of a patient's readiness for discharge. Readiness is often a provider‐driven process, based on specific clinical and health system benchmarks.[5] However, providers' perception of readiness for discharge does not always correlate with patients' self‐assessments or objective measures of understanding.[6] For example, nurses overestimate patients' readiness for discharge compared to patients' own self‐report.[7] As a result, the need to include the patient perspective is increasingly recognized as an important contributing factor in the discharge planning process.[8, 9]
Current approaches to assessing discharge readiness are typically single assessments. However, these assessments do not take into account the complexity of discharge planning or patients' understanding, or their ability to carry out postacute care tasks.[8] In addition, few models have included assessments of physical stability and functional ability along with measures such as ability to manage self‐care activities at home, coping and social support, or access to health system and community resources.[10, 11]
To address these gaps in the existing literature, we carried out a prospective observational study of daily, patient‐reported, assessments of discharge readiness to better understand patients' perspectives on issues that could impede the transition to home. Using these data, we then sought to determine the prevalence of patient‐reported discharge barriers and the frequency with which they were resolved prior to the day of discharge. We also explored whether problems identified at discharge were associated with 30‐day readmission.
METHODS
Study Design, Setting, and Participants
We carried out a prospective observational study at the University of California San Francisco (UCSF) Medical Center, a 600‐bed tertiary care academic hospital in San Francisco, California. The UCSF Committee on Human Research approved this study. We recruited patients between November 2013 and April 2014. Patients were eligible to participate if they were admitted to the General Medicine Service; over 18 years old; English speaking; cognitively able to provide informed consent; and not under contact, droplet, airborne, or radiation isolation. Patients were eligible to participate regardless of where they were admitted from or expected to be discharged (eg, home, skilled nursing facility). Patients were excluded if they were acutely unwell or symptomatic resulting in them being unable to complete the surveys. Caregivers were not able to participate in the study on behalf of patients. We screened daily admission charts for eligibility and approached consecutive patients to consent them into the study on their first or second day of hospitalization. An enrollment tracker was used to documented reasons for patients' exclusion or refusal.
Survey Development
We adapted an existing and validated Readiness for Hospital Discharge Survey (RHDS) previously used in obstetric, surgical, and medicine patients for our study.[10, 11, 12] This initial list was culled from 23 to 12 items, based on input from patients and physicians. This feedback step also prompted a change in the response scale from a 0 to 10 scale to a simpler yes, no, or I would like to talk with someone about this scale intended to encourage discussion between patients and providers. After this revision step, we further pretested the survey among physicians and a small set of general medical patients to assess comprehension. Thus, our final question set included 12 items in 4 domains; personal status (ie, pain, mobility), knowledge (ie, medications, problems to watch for, recovery plan), coping ability (ie, emotional support, who to call with problems), and expected support (ie, related to activities and instrumental activities of daily living).
Data Collection
We collected data from interviews of patients as well as chart abstraction. Trained research assistants approached patients to complete our revised RHDS at admission, which was either on their first or second day of hospitalization. We collected data via an intake admission survey, which asked patients about their readiness for discharge, followed by a daily readiness for discharge survey until the day of discharge. A research assistant read the survey items to patients and recorded responses on a paper version of the survey. We abstracted demographic, clinical, and 30‐day readmission information from each participant's electronic medical record.
Analytic Approach
A barrier to discharge readiness was confirmed when a patient responded no' to an item (except for presence of catheter and pain or discomfort where yes was used) and/or they stated they wanted to talk to someone about the issue. We then used descriptive statistics to summarize patients' responses by survey administration number. Multilevel mixed effect regression was used to investigate any patterns in barriers to discharge over the course of hospitalization. We described the frequency of identified barriers to discharge on the intake admission and final (48 hours of discharge) surveys. McNemar's tests compared the proportion of patients reporting each barrier, and paired t tests the mean number of barriers at these 2 survey time points. We also assessed whether persistent barriers to discharge readiness on the final survey were associated with readmission to our hospital within 30‐days using t tests, 2, or Fisher exact test. Analysis was conducted in SPSS 22.0 (IBM Corp., Armonk, NY) and Stata (StataCorp, College Station, TX).
RESULTS
Patients
There were 2045 patients admitted to the general medicine service during the study period. Medical record screening resulted in 1350 exclusions. Of the remaining 695 patients, 113 refused and 419 were further found to be unable to participate. After all exclusions were applied and following direct screening, 163 patients agreed to participate in our study (Table 1). Mean length of stay among our cohort was 5.42 days (standard deviation [SD], 11.49) and the majority of patients were admitted from and discharged to home (Table 1).
| |
| Mean age, y (SD) | 56.4 (17) |
| Female gender, no. (%) | 86 (53) |
| Race, no. (%) | |
| Asian | 13 (8) |
| African American | 27 (16) |
| White | 96 (59) |
| Other | 24 (25) |
| Declined to say | 3 (1) |
| Married, no. (%) | 78 (48) |
| Insurance, no. (%) | |
| Medicare | 59 (36) |
| Medicaid | 22 (14) |
| Private | 73 (45) |
| Self‐pay | 2 (1) |
| Other | 7 (4) |
| Patient admitted from, no. (%) | |
| Home | 118 (72) |
| Outpatient clinic | 17 (10) |
| Procedural area | 6 (4) |
| Another facility | 12 (7) |
| Other | 9 (6) |
| Patient discharged to, no. (%) | |
| Home without services | 107 (66) |
| Home with services | 40 (25) |
| Home hospice | 2 (1) |
| Skilled nursing facility | 8 (5) |
| Patient deceased | 3 (2) |
| Other | 3 (2) |
Barriers to Discharge Readiness
Patients completed on average 1.82 surveys (SD 1.10; range, 18), and in total 296 surveys were administered. Only 5% of patients were captured on their admission day, whereas 77% of patients were surveyed on their second hospital day (Table 2). Between the first and second survey administration, 51% of patients were lost to follow‐up, and then by the third survey administration a further 37% were lost to follow‐up (Table 3). Patients were unable to be reinterviewed most often because they had been (1) discharged, (2) were unavailable or having a procedure at time of recruitment, or (3) became too sick and symptomatic.
| Hospital Day | ||||||||||
|---|---|---|---|---|---|---|---|---|---|---|
| 1 | 2 | 3 | 4 | 5 | 6 | 7 | 8 | 9 | 10 | |
| No. of eligible patients hospitalized | 163 | 161 | 138 | 102 | 70 | 50 | 35 | 24 | 19 | 17 |
| No. of patients surveyed | 8 | 124 | 70 | 30 | 22 | 13 | 7 | 6 | 2 | 0 |
| % of eligible patients surveyed | 4.9 | 77.0 | 50.7 | 29.4 | 31.4 | 26.0 | 20.0 | 25.0 | 10.5 | 0 |
| Survey No. | ||||||
|---|---|---|---|---|---|---|
| 1 | 2 | 3 | 4 | 5 | 6+ | |
| ||||||
| No. of patients surveyed | 163 | 83 | 31 | 11 | 3 | 5 |
| Total barriers (all patients) | 533 | 235 | 84 | 22 | 7 | 8 |
| No. of barriers per patient, mean (SD) | 3.27(2.35) | 2.83 (2.11) | 2.71 (2.49) | 2.00 (1.73) | 2.33 (2.51) | 1.60 (2.30) |
| Median no. of barriers per patient | 3.0 | 3.0 | 2.0 | 1.0 | 2.0 | 0 |
| Median hospital day of survey administration | 2.0 | 3.0 | 5.0 | 6.0 | 8.0 | 13.0 |
| Initial admission survey, no. (%) | 163 (100.0) | 0 | 0 | 0 | 0 | 0 |
| Follow‐up survey, no. (%) | 0 | 38 (45.8) | 16 (51.6) | 4 (36.4) | 0 | 1 (20.0) |
| Survey 48 hours before discharge, no. (%) | 59 (36.2) | 45 (54.2) | 15 (48.4) | 7 (63.6) | 3 (100.0) | 4 (80.0) |
In total, over 889 individual barriers to discharge readiness were reported across all surveys. The total and mean numbers of barriers were highest on the admission intake survey, and numbers continued to decrease until the fourth survey. On average, the total number of barriers to discharge patients reported decreased by 0.15 (95% confidence interval: 0.01‐0.30) per day (P = 0.047).
Change in Barriers to Discharge
Sixty‐eight patients (42%) completed an admission intake survey as well as final survey 48 hours before discharge (Table 4). We observed a significant reduction in mean number of barriers reported between admission and discharge surveys (3.19 vs 2.53, P = 0.01). Sixty‐one patients (90%) left the hospital with 1 or more persistent barrier to a safe discharge. However, the 3 most common barriers to discharge readiness on the admission and final survey remained the same: unresolved pain, lack of understanding of plan for recovery, and daily living activities (eg, cooking, cleaning, and shopping). The number of patients with unresolved pain appeared to increase slightly, though this rise was not statistically significant. In contrast, there were significant reductions in patients reporting they were unaware of problems to watch out for postdischarge (28% vs 16%; P = 0.04) or did not understand their recovery plan (52% vs 40%; P = 0.03).
| Barrier to Discharge | Survey | |
|---|---|---|
| Admission, No. (%) | Final Survey, No. (%) | |
| ||
| Catheter is present? | 6 (7.2) | 6 (7.2) |
| Not out of bed, sitting in a chair, or walking? | 17 (20.5) | 13 (15.7) |
| Pain or discomfort? | 50 (60.2) | 52 (62.7) |
| Unable to get to the bathroom for toilet or to shower? | 15 (18.1) | 12 (14.5) |
| Unable to self‐care without help from others? | 27 (32.5) | 23 (27.7) |
| Unable to get your own medications? | 11 (13.3) | 14 (16.9) |
| Know what problems to watch for?* | 23 (27.7) | 13 (15.7) |
| Know where to call if you had problems? | 10 (12.0) | 8 (9.6) |
| Inability for personal care such as bathing, toileting, and eating? | 8 (9.6) | 11 (13.3) |
| Lack of support for emotional needs? | 16 (19.3) | 9 (10.8) |
| Unable to cook, clean, or do shopping? | 33 (39.8) | 25 (30.1) |
| Do not understand the overall plan for your recovery?* | 43 (51.8) | 33 (39.8) |
DISCUSSION
Assessing discharge readiness highlights an opportunity to engage patients directly in their discharge planning process. However, our prospective study of 163 hospitalized adults revealed that unresolved discharge barriers were common; 90% of patients were discharged with at least 1 issue that might inhibit an effective transition home. The majority of these patients were also discharged home without any support services. In addition, many of the major barriers patients reportedpain, lack of understanding around plans, and ability to provide self‐carewere consistent from admission to discharge, suggesting a missed opportunity to address problems present early in a patient's stay.
Some of the issues our patients described, such as pain; lack of understanding of a recovery plan; and functional, social, and environmental vulnerabilities that impede recovery, have been described in studies using data collected in the postacute time period.[13, 14, 15] Focus on postacute barriers is likely to be of limited clinical utility to assist in any real‐time discharge planning, particularly planning that assesses individual patients' needs and tailors programs and education appropriately. Having said this, consistency between our results and data collected from postdischarge patients again supports broad areas of improvement for health systems.
Persistent gaps in care at discharge may be a result of limited standardization of discharge processes and a lack of engagement in obtaining patient‐reported concerns. Lack of a framework for preparing individual patients for discharge has been recognized as a significant obstacle to effective discharge planning. For example, Hesselink et al.'s qualitative study with almost 200 patients and providers across multiple institutions described how lack of a standard approach to providing discharge planning resulted in gaps in information provision.[16] Similarly, Horwitz et al. described wide variation in discharge practices at a US academic medical center, suggesting lack of a standard approach to identifying patient needs.[14]
Although many transitions of care programs have supported implementation of specific care interventions at a hospital or health system level, there have been surprisingly few studies describing efforts to standardize the assessment of discharge barriers and prospectively engage individual patients.[17] One emblematic study used stakeholder interviews and process mapping to develop a readiness report within their electronic medical record (EMR).[17] Aggregate data from the EMR including orders and discharge plans were coded, extracted, and summarized into a report. The overall goal of the report was to identify progress toward completion of discharge tasks; however, a limitation was that it did not explicitly include patient self‐assessments. Another study by Grimmer et al. describes the development of a patient‐centered discharge checklist that incorporated patients and care concerns.[18] The themes incorporated into this checklist cover many transitional issues; however, outside of the checklist's development, few publications or Web resources describe it in actual use.
Our approach may represent an advance in approaches to engaging patients in discharge planning and preparing patients for leaving the hospital. Although our data do not support efficacy of our daily surveys in terms of improving discharge planning, this initial evaluation provides the framework upon which providers can develop discharge plans that are both standardized in terms of using a structured multidomain communication tool to elicit barriers, as well as patient‐centered and patient‐directed, by using the information collected in the survey tool to initiate tailored discharge planning earlier in the hospital stay. However, our program points out an important limitation of an entirely patient‐initiated program, which is difficulty obtaining truly daily assessments. During this study, we had a single research assistant visit patients as frequently as possible during hospitalization, but even daily visits did not yield complete information on all patients. Although this limitation may in part be due to the fact that our study was a focused pilot of an approach we hope to expand, it also represents the complexity of patient experience in the hospital, where patients are often out of their room for tests, are unable to complete a survey because of problematic symptoms, or simply are unwilling or unable to participate in regular surveys.
Our study has a number of limitations. First, the number of patients in our study overall, and the number who completed at least 2 surveys, was relatively small, limiting the generalizability of the study and our ability to determine the true prevalence of unresolved barriers at discharge. In addition, our selection criteria and response rates have limited our sample in that our final group may not be representative of all patients admitted to our medicine service. The broad exclusion of patients who had physical or psychosocial barriers, and those who were acutely unwell and symptomatic, has the potential to introduce selection bias given the excluded populations are those most at risk of readmission. We also acknowledge that some of the issues that patients' are reporting may be chronic ones. However, given the fact that patients feel these issues, even if chronic, are unaddressed or that they want to talk with their doctor about them, is still a very large potential gap in care and patient engagement.
However, despite these limitations, which seem most likely to produce a cohort that is more likely to be able to participate in our survey, and in turn more likely to participate in their care more broadly, we still observed disappointing resolution of discharge barriers. In addition, our adapted survey instrument, though based on well‐supported conceptual frameworks,[19] has not been extensively tested outside of our hospital setting. Finally, as a single‐center study, our results cannot be generalized to other settings.
Assessing discharge readiness highlights an opportunity to obtain patient self‐reported barriers to discharge. This can facilitate discharge planning that targets individual patient needs. This information also emphasizes potentially fruitful opportunities for improved communication and education activities, potentially if these data are fed back to providers in real time, potentially as part of team‐based dashboards or the context of interdisciplinary team models.
Acknowledgements
The authors thank all of the patients who participated in this project, and Yimdriuska Magan Gigi for her assistance with chart abstractions. The authors also acknowledge and thank John Boscardin for his statistical and analytic support.
Disclosures: James D. Harrison, and Drs. Ryan S. Greysen and Andrew D. Auerbach contributed to the concept, design, analysis, interpretation of data, drafting of the manuscript, critical revisions to the manuscript, and final approval of manuscript. Ronald Jacolbia and Alice Nguyen contributed to the acquisition of data, drafting and final approval of manuscript and project, and administrative and technical support. Dr. Auerbach was supported by National Heart, Lung, and Blood Institute grant K24 K24HL098372. Dr. Greysen is supported by the National Institutes of Health (NIH), National Institute of Aging (NIA) through the Claude D. Pepper Older Americans Independence Center (P30AG021342 NIH/NIA and K23AG045338‐01). The authors have no financial or other conflicts of interest to declare.
- , , . Trends and projections in inpatient hospital costs and utilization 2003–2013. HCUP statistical brief #175. July 2014. Rockville, MD: Agency for Healthcare Research and Quality; 2014.
- , . Overview of hospital stays in the United States 2012. HCUP statistical brief #180. October 2014. Rockville, MD: Agency for Healthcare Research and Quality; 2014.
- Joint Commision. The Joint Commission Comprehensive Accreditation Manual for Hospitals. Oak Brook, IL: The Joint Commission; 2015.
- , , . Hospital discharge and readmission. In: Post TW, ed. UpToDate website: Available at: http://www.uptodate.com/contents/hospital‐discharge‐and‐readmission. Accessed August 14, 2015.
- , . A patient centered model of care for hospital discharge. Clin Nurse Res. 2004;13:117–136.
- , , , , , . Which reasons do doctors, nurses and patients have for hospital discharge? A mixed methods study. PLoS One. 2014;9:e91333.
- , , . Nurse and patient perceptions of discharge readiness in relation to postdischarge utilization. Med Care. 2010;48:482–486.
- , . Older people's perception of their readiness for discharge and postdischarge use of community support and services. Int J Older People Nurs. 2013;8:104–115.
- , , , . The care transitions intervention: Results of a randomized controlled trial. Arch Intern Med. 2006;166:1822–1828.
- , . Psychometric properties of the Readiness for Hospital Discharge Scale. J Nurs Meas. 2006;14:163–180.
- , , , et al. Perceived readiness for hospital discharge in adult medical‐surgical patients. Clin Nurse Spec. 2007;21:31–42.
- , , , . Validation of patient and nurse short forms of the Readiness for Hospital Discharge Scale and their relationship to return to the hospital. Health Serv Res. 2014;49:304–317.
- , , , et al. “Missing Pieces”—functional, social and environmental barriers to recovery for vulnerable older adults transitioning from hospital to home. J Am Geriatr Soc. 2014;62:1556–1561.
- , , , et al. Quality of discharge practices and patient understanding at an academic medical center. JAMA Intern Med. 2013;173:1715–1722.
- , , . Brief scale measuring patient prepardeness for hospital discharge to home: Psychometric properties. J Hosp Med. 2008;3:446–454.
- , , , et al. Improving patient discharge and reducing hospital readmission by using intervention mapping. BMC Health Serv Res. 2014;14:389.
- , , , , , . Development of a discharge readiness report within the electronic health record: a discharge planning tool. J Hosp Med. 2014;9:533–539.
- , , , . Incorporating Patient and Carer Concerns in Discharge Plans: The Development of a Practical Patient‐Centred Checklist. The Internet Journal of Allied Health Sciences and Practice. 2006;4: Article 5.
- , , , . Identifying keys to success in reducing readmissions using the ideal transitions in care framework. BMC Health Serv Res. 2014;14:423.
Calcium-Containing Crystal-Associated Arthropathies in the Elderly
Calcium pyrophosphate (CPP) crystals may deposit in both articular tissues (predominantly hyaline cartilage and fibrocartilage) and periarticular soft tissues.1,2 Calcium pyrophosphate deposition disease (CPPD) may be asymptomatic or be associated with a spectrum of clinical syndromes, including both acute and chronic inflammatory arthritis.2
The European League Against Rheumatism (EULAR) recently suggested changes in CPPD terminology.2 According to the new EULAR classification, pseudogout, or CPPD, has been reclassified based on new key terms that include several of the previously described disease phenotypes: asymptomatic CPPD; acute CPP crystal arthritis (previously known as pseudogout); osteoarthritis (OA) with CPPD (previously, pseudo-OA); and the chronic CCP crystal inflammatory arthritis (previously, pseudorheumatoid arthritis). In similar fashion, chondrocalcinosis (CC) refers to calcification of the fibrocartilage and/or hyaline cartilage identified by imaging or histologic analysis. Although CC is most commonly seen in CPPD, it is not exclusive to this disease, as it can be seen in other crystal diseases (oxalosis, basic calcium phosphate [BCP]) and can appear as casual finding or coexist with OA.2
Clinical Manifestations
In clinical practice, CPPD may present with several phenotypic forms. In asymptomatic CPPD, CC is a common radiographic finding without clinical symptoms. Acute CPP arthritis always should be suspected in any patient aged > 65 years presenting with acute monoarticular or oligoarticular, migratory or additive, symmetrical, or polyarticular arthritis.3 Acute CCP arthritis is characterized by self-limited acute or subacute attacks of arthritis involving 1 or several extremity joints (knees, wrists, ankles; rarely affects large toe). Typically, the acute attacks last 7 to 10 days. Several unusual sites (eg, the hip joints, trochanteric bursa, and deep spinal joints) also may be affected. However, differences in pattern of joint involvement are insufficient to permit definitive diagnosis without demonstration of the specific crystal type in the inflammatory joint fluid.
Pseudogout attacks closely resemble gouty arthritis; CPPD presents as intermittent flares and often is asymptomatic between flares. Trauma, surgery, or severe medical illness frequently provokes attacks of monosodium urate (MSU) as well as acute CPP arthritis. Systemic findings, such as fever; leukocytosis with a left shift in the differential count; inflammatory markers, such as elevated sedimentation rate (ESR); or C-reactive protein, also can occur, resembling pyogenic arthritis, osteomyelitis, and/or systemic sepsis in the elderly patient.
Diagnosis must be confirmed with aspiration, Gram stain and cultures of the synovial fluid, and evaluation for the presence of CPP crystals under polarized light microscopy.2 The diagnosis can be difficult to confirm secondary to the weakly birefringent nature of CPP crystals.4 Coexistence of MSU and CPP crystals in a single inflammatory effusion is neither uncommon nor unexplained given increased frequencies of both hyperuricemia/gout and CC among elderly patients.5
Chronic CPP crystal inflammatory arthritis may present as a chronic, symmetrical, bilateral, and deforming polyarthritis. It frequently affects the wrists and metacarpophalangeal joints and tendon sheaths. Chronic CPP may resemble rheumatoid arthritis (RA) and produce wrist tenosynovitis, which may manifest as carpal tunnel syndrome and/or cubital tunnel syndrome. Calcium pyrophosphate deposition disease should be on the differential diagnosis in the elderly patient presenting with a clinical picture that resembles “seronegative” RA, with morning stiffness, synovial thickening, localized edema, and restricted motion due to active inflammation or flexion contracture of the hands/wrist. It may present with prominent systemic features, such as leukocytosis, fevers, mental confusion, and inflammatory oligoarthritis or polyarthritis. The diagnosis of CPPD still may be possible even though the rheumatoid factor (RF) is positive, given the increasing likelihood of elevated RF in the older population. In this setting, aspiration of joint fluid and radiography will assist in clarification of the diagnosis. Furthermore, CPPD typically does not cause the type of erosive disease that is often seen in RA.
Calcium pyrophosphate deposition disease also can mimic polymyalgia rheumatica (PMR). A direct comparison of a cohort of patients with pseudo-PMR (PMR/CPPD) with actual PMR patients found that increased age at diagnosis, presence of knee osteoarthritis, tendinous calcifications, and ankle arthritis carried the highest predictive value in patients with CPPD presenting with PMR-like symptoms.6 However, the PMR/CPPD variant can be difficult to distinguish, because both conditions can have elevated systemic inflammatory markers, and both are steroid responsive.
Calcium pyrophosphate deposition disease involving a single joint can rarely lead to extensive destruction—as with neuropathic joints in the absence of any neurologic deficits—and is extremely debilitating. This presentation is not well understood and does not have good treatment alternatives. Calcium pyrophosphate crystals often are associated with manifestations of OA.1,2 Indeed, up to 20% of OA joints have been found to be positive for CPP crystals in various studies. Given the extensive evidence supporting treatment of OA, usually they are treated in a similar fashion with good results. Occasionally, these will have unusual manifestations for typical OA, such as involvement of wrists and metacarpophalangeal joints; however, the presentation is often indolent like OA.
Calcium pyrophosphate crystal deposition involving the spine has been associated with a number of clinical manifestations. Spine stiffness, sometimes associated with bony ankylosis, can resemble ankylosing spondylitis or diffuse idiopathic skeletal hyperostosis. Such symptoms are seen more commonly in familial CPPD rather than in the elderly. However, crystal deposition in the ligamentum flavum at the cervical spine levels has been associated with a condition called crowned dens syndrome.7 Although mostly asymptomatic, it may be present with acute neck pain, fever, and an increased ESR, sometimes mimicking PMR or giant cell arteritis or neurologic symptoms. Similarly, CPP crystal deposition in the posterior longitudinal ligament at the lower levels of the spine may lead to spinal cord compression syndromes or symptoms of either acute nerve compression or chronic spinal stenosis.8,9 Calcium pyrophosphate crystal deposition also can occur in other soft tissues, such as bursae, ligaments, and tendons and may be sufficient to cause local nerve compression, such as carpal or cubital tunnel syndrome.
Epidemiology
Radiographic surveys of the knees, hands, wrists, and pelvis and epidemiologic studies have demonstrated an age-related increase in the prevalence of CPPD: 15% prevalence in patients aged 65 to 74 years, 36% prevalence in patients aged 75 to 84 years, and 50% prevalence in patients aged > 84 years.10 In a recent radiographic study, 40% of patients with CPPD did not present with CC of the knee, and the study’s authors recommended additional radiographs of pelvis, wrists, or hands for accurate diagnosis of radiographic CC.11
Diagnosis
Accurate diagnosis should be achieved on the basis of the clinical picture and demonstration of CPP crystals in synovial fluid or tissue by compensated polarized light microscopy (Figures 1A and 1B).2 The sensitivity and specificity for CPP crystal detection has been shown to be 95.9% and 86.5%, respectively.12 However, the CPP crystal is more readily identified by a rheumatologist rather than in a standard hospital laboratory, which misses 30% of CPP crystals.13
Findings of CC on radiograph strengthens a CPPD diagnosis, but its absence does not rule it out (Figure 2A).2 More recently, the use of new imaging modalities, such as musculoskeletal ultrasound, provides the capacity to visualize crystal deposits within the joint structures, the hyaline cartilage, and/or fibrocartilage (Figure 2B and 2C).14 The presence of hyperechoic bands within the intermediate layer hyaline cartilage and hyperechoic spots in fibrocartilage are consistent with CPP crystal deposits.2,14 The use of computed tomography is the gold standard imaging modality for the identification of CPPD of the spine.15 There is not enough evidence to support the use of magnetic resonance imaging in CPPD, but it may play a role in rare complications.2
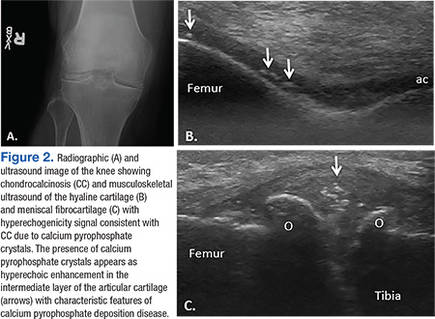
Treatment
The EULAR recently defined new guidelines for the management of CPPD.16 Asymptomatic CPPD needs no treatment.In other CPPD phenotypes, the goals are to attempt prompt resolution of the acute synovitis, reduction in chronic damage, and management of associated conditions.In acute attacks, treatment modalities used in gout are often required; however, data for CPPD treatment are limited (Table). Treatment relies on the use of colchicine and nonsteroidal anti-inflammatory drugs (NSAIDs), but toxicity and comorbidities in the elderly limit the usage of these drugs.
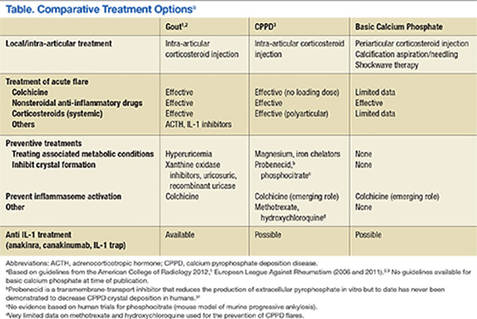
Given increased renal impairment, the loading dose of colchicine is not recommended.16 Colchicine has recently been shown to completely block crystal-induced maturation of IL-1β in vitro, indicating that the drug acts upstream of inflammasome activation.17 This is in addition to the well-known role of colchicine in inhibition of micro-tubule formation, which likely leads to prevention of cell migration, phagocytosis, and activation of inflammasome.18-20
Intra-articular injection of corticosteroid is an efficient and well-tolerated treatment alternative for monoarticular CPP flares. Oral or parenteral corticosteroids are frequently used for polyarticular flares in particular for those patients in which NSAIDs and colchicine are contraindicated.16 Parenteral adrenocorticotropic hormone has been used in patients with congestive heart failure, renal insufficiency, gastrointestinal bleeding, or resistance to NSAIDs.21 For prophylaxis of acute CPP crystal arthritis, a low dose of oral NSAIDs, oral colchicine, or prednisone may be used with good results.16 In chronic CPP arthritis, continuous use of colchicine, NSAIDs, or low-dose prednisone is often appropriate. If these interventions are ineffective or contraindicated, using hydroxychloroquine (HCQ) and methotrexate (MTX) have been successfully used to control chronic CPP crystal inflammation.22,23 Recent trials have raised questions about MTX, and further trials on HCQ usage are underway.24 Biologic agents targeting IL-1 are not currently approved for the treatment of CPPD, but there are suggestions that it may be effective in refractory cases and induce rapid stable remissions after 3 days of therapy.25
In contrast to gout, there is no specific target therapy for lowering CPP crystal load in the elderly. Crucial in the management of CPPD in the elderly is the search for associated diseases, such as hyperparathyroidism, hemochromatosis, hypomagnesemia, and hypophosphatemia, as well as avoidance of tacrolimus, which facilitates or causes CC.16 Correction of the underlying metabolic disorder, especially when undertaken early, may reduce the severity of CPPD. However, there is little evidence to suggest that treatment of associated disease results in resolution of CPPD—most famously, although therapeutic phlebotomy does not help in hemochromatosis for prevention of crystal disease, chelating agents do seem to be moderately effective.26 Only oral administration of magnesium has shown a reduction in meniscal CC in a patient with CPPD arthropathy.27 In addition, this was in the setting of familial hypomagnesemia associated CPPD. However, unlike uricosuric agents for gout, no pharmacologic treatments can prevent CPPD crystal formation and deposition in tissues.
Therapeutic Agents
Magnesium
Magnesium is a cofactor for the activity of pyrophosphatases that converts inorganic pyrophosphates (PPis) into orthophosphates. In addition, magnesium can increase the solubility of CPP crystals. Early detection and management of hypomagnesemia are recommended, because it occurs in patients who have well-defined conditions and situations: Gitelman syndrome, thiazide and loop diuretics use, tacrolimus use, familial forms of renal magnesium wasting or use of proton pump inhibitors, short bowel syndrome, and intestinal failure in patients receiving home parenteral nutrition. Long-term administration of magnesium in some patients with chronic hypomagnesemia decreased meniscal calcification.27-29
Dietary Calcium
Epidemiologic studies showed a lower incidence of CC in Chinese subjects. The authors of the study speculate that this lower prevalence of CPPD could result from high levels of calcium found in the drinking water in Beijing, which may affect parathyroid hormone secretion.30 Further studies are needed to confirm this hypothesis, as it could be a cheaper approach to pseudogout prevention.
Probenecid
Probenecid is an in vitro inhibitor of the transmembrane PPi transporter thought to possibly prevent extracellular PPi elaboration. However, this observation has not been confirmed by either case reports or clinical trials.31
Phosphocitrate
Phosphocitrate acts directly on preventing crystal deposition in tissues in CPPD as well as BCP based on in vitro evidence and mouse models.32,33
Hyaluronan
An amelioration of pain and increased range of motion were observed in radiographic CC with OA.34 However, it is associated with increased acute CPP arthritis.35
Radiosynovectomy
In a double-blind study of 15 patients with symmetrical CPPD arthropathy, the knee that underwent intra-articular injection of yttrium-90 (5 mCi) plus steroid had less pain, stiffness, joint line tenderness, and effusion compared with the contralateral control knee injected with saline and steroids.36
Precipitators of Acute Pseudogout
Diuretics are known to exacerbate gout, but they also can exacerbate pseudogout. A recent case-control study nested within a United Kingdom general practice database found that loop diuretics rather than hydrochlorothiazide was associated with increased risk of CPPD mediated primarily by magnesium reabsorption in the loop of Henle.28 Chronic kidney disease associated with secondary and tertiary hyperparathyroidism increases calcium or PPi concentration, which leads to CPP-crystal deposition.
In addition, multiple case reports have described acute pseudogout caused by bisphosphonate administration for osteoporosis or Paget disease—more likely in the elderly population. Intravenous pamidronate, oral etidronate, and alendronate therapy have all been described in the elderly.37 The overall mechanism behind this link is not completely understood, but bisphosphonates are structurally similar to PPi. Pseudogout attacks also have been described in neutropenic patients undergoing treatment with granulocyte-colony stimulating factor.38 In addition to pharmaceutical exacerbation of pseudogout, surgical procedures and trauma can precipitate attacks. Joint lavage has been described to increase the incidence of pseudogout.39 It was hypothesized that joint lavage with fluid induced “crystal shedding” from CPPD crystals imbedded in the joint tissue. Patients who underwent meniscectomy of the knee 20 years ago had a 20% incidence of CC in the knee that was operated compared with 4% CC in the contralateral nonoperated knee.40 Overall, the surgery most linked with a pseudogout attack, however, is parathyroidectomy.41
Basic Calcium Phosphate Crystals
Basic calcium phosphate crystals are common but rarely diagnosed due to the cumbersome and expensive methods required to identify these crystals.42 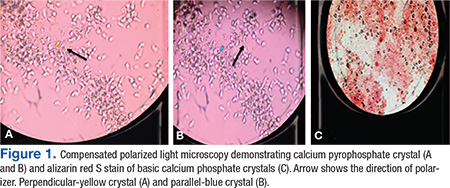
Basic calcium phosphate and CPPD crystals may coexist in synovial fluid. Similar to CPPD, BCP crystal disease is often concurrent with OA and can cause calcification of articular cartilage. Basic calcium phosphate is more common than CPP crystals with occurrence of 30% to 50% in OA synovial fluid.42 Additionally, BCP crystal disease has been linked to increased severity of OA. Basic calcium phosphate crystals in knee joints were found to have radiographically more severe arthritis with larger effusions.44,45 Similarly, BCP crystals in OA synovial fluid correlated with higher Kellgreen-Lawrence grade scores by radiography.42,46
It is currently believed that BCP crystals are continuously formed in the extracellular matrix, and their deposition is actively prevented by PPi present in the matrix.47 Elevated PPi levels, on the other hand, favor the formation of CPP crystals.48 The clinical upshot seems to be that although CPP crystals are almost universally intra-articular and released by chondrocytes, BCD crystals and deposits are more frequently present in soft tissues.
Acute Calcific Tendinitis
Typically, this type of tendinitis involves the shoulder joint and is extra-articular. Common treatments help, including NSAIDs, intra-articular steroids, ice, and rest. In addition, high-energy extracorporeal shock wave therapy has been shown to be effective when used with conscious sedation.49,50 Needling or barbotage in association with lavage and steroid injections also is effective and has occasionally been shown to reduce the size of the calcium deposit as well, often in combination with IV drugs like ethylenediaminetetraacetic acid.51-53
Acute calcific periarthritis of the hand presents similar to gout or pseudogout, affecting the wrist, usually in postmenopausal women.54 Basic calcium phosphate crystals are aspirated from the joint, and periarticular crystals may be subtle. Local steroid injections are beneficial.Milwaukee shoulder syndrome is an arthropathy associated with BCP crystals in the joint fluid and results in extensive destruction of shoulder articular cartilage and surrounding tissues. It is commonly bilateral and occurs in elderly women more often than it does in men.55 Aspiration of the shoulder joint typically reveals a serosanginous fluid. Fluid samples can be assessed for hydroxyapatite crystals by staining with alizarin red dye, which produces a characteristic “halo” or orange-red stain by light microscopy.43 Surgical treatment of Milwaukee shoulder syndrome is difficult due to increased age of the population affected and the severity of the shoulder destruction. Usually a conservative approach of analgesics, recurrent shoulder aspirations, and steroid injections is the best treatment option.
Conclusions
Calcium-containing crystal-associated arthropathies are a complex array of entities that target the veteran elderly population with increasing frequency. Challenges still remain in the diagnosis, crystal identification, and treatment due to coexisting comorbid conditions and polypharmacy commonly seen in veterans. Overall morbidity associated with calcium-containing crystal-associated arthropathies and the coexisting osteoarthritis is great, and focused identification of the disease process with tailored treatment can achieve the goal of decreasing symptoms and improving quality of life.
Acknowledgements
This work was supported by grant P20GM104937 (A.M.R.).
1. Guerne PA, Terkeltaub R. Clinical Features, Diagnosis, and Treatment of CPPD Crystal Arthropathy. In: Terkeltaub R, ed. Gout and Other Crystal Arthropathies. Philadelphia, PA: Saunders/Elsevier; 2012:249-265.
2. Zhang W, Doherty M, Bardin T, et al. European League Against Rheumatism recommendations for calcium pyrophosphate deposition. Part I: terminology and diagnosis. Ann Rheum Dis. 2011;70(4):563-570.
3. McCarty DJ. Calcium pyrophosphate dihydrate crystal deposition disease—1975. Arthritis Rheum. 1976;19(S3):275-285.
4. Ivorra J, Rosas J, Pascual E. Most calcium pyrophosphate crystals appear as non-birefringent. Ann Rheum Dis. 1999;58(9):582-584.
5. Lawrence RC, Felson DT, Helmick CG, et al; National Arthritis Data Workgroup. Estimates of the prevalence of arthritis and other rheumatic conditions in the United States. Part II. Arthritis Rheum. 2008;58(1):26-35.
6. Pego-Reigosa JM, Rodriguez-Rodriguez M, Hurtado-Hernandez Z, et al. Calcium pyrophosphate deposition disease mimicking polymyalgia rheumatica: a prospective followup study of predictive factors for this condition in patients presenting with polymyalgia symptoms. Arthritis Rheum. 2005;53(6):931-938.
7. Bouvet JP, le Parc JM, Michalski B, Benlahrache C, Auquier L. Acute neck pain due to calcifications surrounding the odontoid process: the crowned dens syndrome. Arthritis Rheum. 1985;28(12):1417-1420.
8. Muthukumar N, Karuppaswamy U. Tumoral calcium pyrophosphate dihydrate deposition disease of the ligamentum flavum. Neurosurgery. 2003;53(1):103-109.
9. Armas JB, Couto AR, Bettencourt BF. Spondyloarthritis, diffuse idiopathic skeletal hyperostosis (DISH) and chondrocalcinosis. Adv in Exp Med Biol. 2009;649:37-56.
10. Abhishek A, Doherty M. Epidemiology of calcium pyrophosphate crystal arthritis and basic calcium phosphate crystal arthropathy. Rheum Dis Clin North Am. 2014;40(2):177-191.
11. Abhishek A, Doherty S, Maciewicz R, Muir K, Zhang W, Doherty M. Chondrocalcinosis is common in the absence of knee involvement. Arthritis Res Ther. 2012;14(5):R205.
12. Lumbreras B, Pascual E, Frasquet J, González-Salinas J, Rodríguez E, Hernández-Aguado I. Analysis for crystals in synovial fluid: training of the analysts results in high consistency. Ann Rheum Dis. 2005;64(4):612-615.
13. Szscygiel J, Reginato AM SS. Quality improvements in the identification of crystals from synovial fluid: hospital laboratory versus rheumatology department evaluation. Poster presented at: 2014 ACR/ARHP Annual Meeting; November 15, 2014; Boston, MA.
14. Grassi W, Meenagh G, Pascual E, Filippucci E. “Crystal clear”-sonographic assessment of gout and calcium pyrophosphate deposition disease. Semin Arthritis Rheum. 2006;36(3):197-202.
15. Scutellari PN, Galeotti R, Leprotti S, Ridolfi M, Franciosi R, Antinolfi G. The crowned dens syndrome. Evaluation with CT imaging. Radiol Med. 2007;112(2):195-207.
16. Zhang W, Doherty M, Pascual E, et al. EULAR recommendations for calcium pyrophosphate deposition. Part II: management. Ann Rheum Dis. 2011;70(4):571-575.
17. Martinon F, Pétrilli V, Mayor A, Tardivel A, Tschopp J. Gout-associated uric acid crystals activate the NALP3 inflammasome. Nature. 2006;440(7081):237-241.
18. Nuki G. Colchicine: its mechanism of action and efficacy in crystal-induced inflammation. Curr Rheumatol Rep. 2008;10(3):218-227.
19. Borisy GG, Taylor EW. The mechanism of action of colchicine. Colchicine binding to sea urchin eggs and the mitotic apparatus. J Cell Biol. 1967;34(2):535-548.
20. Borisy GG, Taylor EW. The mechanism of action of colchicine. Binding of colchincine-3H to cellular protein. J Cell Biol. 1967;34(2):525-533.
21. Daoussis D, Antonopoulos I, Andonopoulos AP. ACTH as a treatment for acute crystal-induced arthritis: update on clinical evidence and mechanisms of action. Semin Arthritis Rheum. 2014;43(5):648-653.
22. Rothschild B, Yakubov LE. Prospective 6-month, double-blind trial of hydroxychloroquine treatment of CPDD. Compr Ther. 1997;23(5):327-331.
23. Chollet-Janin A, Finckh A, Dudler J, Guerne PA. Methotrexate as an alternative therapy for chronic calcium pyrophosphate deposition disease: an exploratory analysis. Arthritis Rheum. 2007;56(2):688-692.
24. Finckh A, Mc Carthy GM, Madigan A, et al. Methotrexate in chronic-recurrent calcium pyrophosphate deposition disease: no significant effect in a randomized crossover trial. Arthritis Res Ther. 2014;16(5):458.
25. Moltó A, Ea HK, Richette P, Bardin T, Lioté F. Efficacy of anakinra for refractory acute calcium pyrophosphate crystal arthritis. Joint Bone Spine. 2012;79(6):621-623.
26. Harty LC, Lai D, Connor S, et al. Prevalence and progress of joint symptoms in hereditary hemochromatosis and symptomatic response to venesection. J Clin Rheumatol. 2011;17(4):220-222.
27. Doherty M, Dieppe PA. Double blind, placebo controlled trial of magnesium carbonate in chronic pyrophosphate arthropathy. Ann Rheum Dis. 1983;42(suppl 1):106-107.
28. Rho YH, Zhu Y, Zhang Y, Reginato AM, Choi HK. Risk factors for pseudogout in the general population. Rheumatology (Oxford). 2012;51(11):2070-2074.
29. Park CH, Kim EH, Roh YH, Kim HY, Lee SK. The association between the use of proton pump inhibitors and the risk of hypomagnesemia: a systematic review and meta-analysis. PLoS One. 2014;9(11):e112558.
30. Zhang Y, Terkeltaub R, Nevitt M, et al. Lower prevalence of chondrocalcinosis in Chinese subjects in Beijing than in white subjects in the United States: the Beijing Osteoarthritis Study. Arthritis Rheum. 2006;54(11):3508-3512.
31. Rosenthal AK, Ryan LM. Probenecid inhibits transforming growth factor-beta 1 induced pyrophosphate elaboration by chondrocytes. J Rheumatol. 1994;21(5):896-900.
32. Cheung HS, Sallis JD, Demadis KD, Wierzbicki A. Phosphocitrate blocks calcification-induced articular joint degeneration in a guinea pig model. Arthritis Rheum. 2006;54(8):2452-2461.
33. Sun Y, Mauerhan DR, Honeycutt PR, et al. Calcium deposition in osteoarthritic meniscus and meniscal cell culture. Arthritis Res Ther. 2010;12(2):R56.
34. Daumen-Legre V, Pham T, Acquaviva PC, Lafforgue P. Evaluation of safety and efficacy of viscosupplementation in knee osteoarthritis with chondrocalcinosis. In: Arthritis and Rheumatism.Vol. 42. Lippincott Williams and Wilkins; 1999:S158-S158.
35. Disla E, Infante R, Fahmy A, Karten I, Cuppari GG. Recurrent acute calcium pyrophosphate dihydrate arthritis following intraarticular hyaluronate injection. Arthritis Rheum. 1999;42(6):1302-1303.
36. Doherty M, Dieppe PA. Effect of intra-articularYttrium-90 on chronic pyrophosphate arthropathy of the knee. Lancet. 1981;2(8258):1243-1246.
37. Wendling D, Tisserand G, Griffond V, Saccomani C, Toussirot E. Acute pseudogout after pamidronate infusion. Clin Rheumatol. 2008;27(9):1205-1206.
38. Ames PRJ, Rainey MG. Consecutive pseudogout attacks after repetitive granulocyte colony-stimulating factor administration for neutropenia. Mod Rheumatol. 2007;17(5):445-446.
39. Pasquetti P, Selvi E, Righeschi K, et al. Joint lavage and pseudogout. Ann Rheum Dis. 2004;63(11):1529-1530.
40. Doherty M, Watt I, Dieppe P. Localised chondrocalcinosis in post-meniscectomy knees. Lancet. 1982;1(8283):1207-1210.
41. Rubin MR, Silverberg SJ. Rheumatic manifestations of primary hyperparathyroidism and parathyroid hormone therapy. Curr Rheumatol Rep. 2002;4(2):179-185.
42. Ea HK, Lioté F. Diagnosis and clinical manifestations of calcium pyrophosphate and basic calcium phosphate crystal deposition diseases. Rheum Dis Clin North Am. 2014;40(2):207-229.
43. Paul H, Reginato AJ, Ralph Schumacher HR. Alizarin red s staining as a screening test to detect calcium compounds in synovial fluid. Arthritis Rheum. 1983;26(2):191-200.
44. Molloy ES, McCarthy GM. Basic calcium phosphate crystals: pathways to joint degeneration. Curr Opin Rheumatol. 2006;18(2):187-192.
45. Carroll GJ, Stuart RA, Armstrong JA, Breidahl PD, Laing BA. Hydroxyapatite crystals are a frequent finding in osteoarthritic synovial fluid, but are not related to increased concentrations of keratan sulfate or interleukin 1 beta. J Rheumatol. 1991;18(6):861-866.
46. Derfus BA, Kurian JB, Butler JJ, et al. The high prevalence of pathologic calcium crystals in pre-operative knees. J Rheumatol. 2002;29(3):570-574.
47. Ho AM, Johnson MD, Kingsley DM. Role of the mouse ank gene in control of tissue calcification and arthritis. Science. 2000;289(5477):265-270.
48. Macmullan P, McCarthy G. Treatment and management of pseudogout: insights for the clinician. Ther Adv Musculoskelet Dis. 2012;4(2):121-131.
49. Gerdesmeyer L, Wagenpfeil S, Haake M, et al. Extracorporeal shock wave therapy for the treatment of chronic calcifying tendonitis of the rotator cuff: a randomized controlled trial. JAMA. 2003;290(19):2573-2580.
50. Lee SY, Cheng B, Grimmer-Somers K. The midterm effectiveness of extracorporeal shockwave therapy in the management of chronic calcific shoulder tendinitis. J Shoulder Elbow Surg. 2011;20(5):845-854.
51. Pfister J, Gerber H. Chronic calcifying tendinitis of the shoulder-therapy by percutaneous needle aspiration and lavage: a prospective open study of 62 shoulders. Clin Rheumatol. 1997;16(3):269-274.
52. del Cura JL, Torre I, Zabala R, Legórburu A. Sonographically guided percutaneous needle lavage in calcific tendinitis of the shoulder: short- and long-term results. AJR Am J Roentgenol. 2007;189(3):W128-W134.
53. Yoo JC, Koh KH, Park WH, Park JC, Kim SM, Yoon YC. The outcome of ultrasound-guided needle decompression and steroid injection in calcific tendinitis. J Shoulder Elbow Surg. 2010;19(4):596-600.
54. Wiper JD, Garrido A. Images in clinical medicine. Acute calcific tendinitis. N Engl J Med. 2008;359(23):2477.
55. Halverson PB, Carrera GF, McCarty DJ. Milwaukee shoulder syndrome. Arch Intern Med. 1990;150(3):677-682.
Calcium pyrophosphate (CPP) crystals may deposit in both articular tissues (predominantly hyaline cartilage and fibrocartilage) and periarticular soft tissues.1,2 Calcium pyrophosphate deposition disease (CPPD) may be asymptomatic or be associated with a spectrum of clinical syndromes, including both acute and chronic inflammatory arthritis.2
The European League Against Rheumatism (EULAR) recently suggested changes in CPPD terminology.2 According to the new EULAR classification, pseudogout, or CPPD, has been reclassified based on new key terms that include several of the previously described disease phenotypes: asymptomatic CPPD; acute CPP crystal arthritis (previously known as pseudogout); osteoarthritis (OA) with CPPD (previously, pseudo-OA); and the chronic CCP crystal inflammatory arthritis (previously, pseudorheumatoid arthritis). In similar fashion, chondrocalcinosis (CC) refers to calcification of the fibrocartilage and/or hyaline cartilage identified by imaging or histologic analysis. Although CC is most commonly seen in CPPD, it is not exclusive to this disease, as it can be seen in other crystal diseases (oxalosis, basic calcium phosphate [BCP]) and can appear as casual finding or coexist with OA.2
Clinical Manifestations
In clinical practice, CPPD may present with several phenotypic forms. In asymptomatic CPPD, CC is a common radiographic finding without clinical symptoms. Acute CPP arthritis always should be suspected in any patient aged > 65 years presenting with acute monoarticular or oligoarticular, migratory or additive, symmetrical, or polyarticular arthritis.3 Acute CCP arthritis is characterized by self-limited acute or subacute attacks of arthritis involving 1 or several extremity joints (knees, wrists, ankles; rarely affects large toe). Typically, the acute attacks last 7 to 10 days. Several unusual sites (eg, the hip joints, trochanteric bursa, and deep spinal joints) also may be affected. However, differences in pattern of joint involvement are insufficient to permit definitive diagnosis without demonstration of the specific crystal type in the inflammatory joint fluid.
Pseudogout attacks closely resemble gouty arthritis; CPPD presents as intermittent flares and often is asymptomatic between flares. Trauma, surgery, or severe medical illness frequently provokes attacks of monosodium urate (MSU) as well as acute CPP arthritis. Systemic findings, such as fever; leukocytosis with a left shift in the differential count; inflammatory markers, such as elevated sedimentation rate (ESR); or C-reactive protein, also can occur, resembling pyogenic arthritis, osteomyelitis, and/or systemic sepsis in the elderly patient.
Diagnosis must be confirmed with aspiration, Gram stain and cultures of the synovial fluid, and evaluation for the presence of CPP crystals under polarized light microscopy.2 The diagnosis can be difficult to confirm secondary to the weakly birefringent nature of CPP crystals.4 Coexistence of MSU and CPP crystals in a single inflammatory effusion is neither uncommon nor unexplained given increased frequencies of both hyperuricemia/gout and CC among elderly patients.5
Chronic CPP crystal inflammatory arthritis may present as a chronic, symmetrical, bilateral, and deforming polyarthritis. It frequently affects the wrists and metacarpophalangeal joints and tendon sheaths. Chronic CPP may resemble rheumatoid arthritis (RA) and produce wrist tenosynovitis, which may manifest as carpal tunnel syndrome and/or cubital tunnel syndrome. Calcium pyrophosphate deposition disease should be on the differential diagnosis in the elderly patient presenting with a clinical picture that resembles “seronegative” RA, with morning stiffness, synovial thickening, localized edema, and restricted motion due to active inflammation or flexion contracture of the hands/wrist. It may present with prominent systemic features, such as leukocytosis, fevers, mental confusion, and inflammatory oligoarthritis or polyarthritis. The diagnosis of CPPD still may be possible even though the rheumatoid factor (RF) is positive, given the increasing likelihood of elevated RF in the older population. In this setting, aspiration of joint fluid and radiography will assist in clarification of the diagnosis. Furthermore, CPPD typically does not cause the type of erosive disease that is often seen in RA.
Calcium pyrophosphate deposition disease also can mimic polymyalgia rheumatica (PMR). A direct comparison of a cohort of patients with pseudo-PMR (PMR/CPPD) with actual PMR patients found that increased age at diagnosis, presence of knee osteoarthritis, tendinous calcifications, and ankle arthritis carried the highest predictive value in patients with CPPD presenting with PMR-like symptoms.6 However, the PMR/CPPD variant can be difficult to distinguish, because both conditions can have elevated systemic inflammatory markers, and both are steroid responsive.
Calcium pyrophosphate deposition disease involving a single joint can rarely lead to extensive destruction—as with neuropathic joints in the absence of any neurologic deficits—and is extremely debilitating. This presentation is not well understood and does not have good treatment alternatives. Calcium pyrophosphate crystals often are associated with manifestations of OA.1,2 Indeed, up to 20% of OA joints have been found to be positive for CPP crystals in various studies. Given the extensive evidence supporting treatment of OA, usually they are treated in a similar fashion with good results. Occasionally, these will have unusual manifestations for typical OA, such as involvement of wrists and metacarpophalangeal joints; however, the presentation is often indolent like OA.
Calcium pyrophosphate crystal deposition involving the spine has been associated with a number of clinical manifestations. Spine stiffness, sometimes associated with bony ankylosis, can resemble ankylosing spondylitis or diffuse idiopathic skeletal hyperostosis. Such symptoms are seen more commonly in familial CPPD rather than in the elderly. However, crystal deposition in the ligamentum flavum at the cervical spine levels has been associated with a condition called crowned dens syndrome.7 Although mostly asymptomatic, it may be present with acute neck pain, fever, and an increased ESR, sometimes mimicking PMR or giant cell arteritis or neurologic symptoms. Similarly, CPP crystal deposition in the posterior longitudinal ligament at the lower levels of the spine may lead to spinal cord compression syndromes or symptoms of either acute nerve compression or chronic spinal stenosis.8,9 Calcium pyrophosphate crystal deposition also can occur in other soft tissues, such as bursae, ligaments, and tendons and may be sufficient to cause local nerve compression, such as carpal or cubital tunnel syndrome.
Epidemiology
Radiographic surveys of the knees, hands, wrists, and pelvis and epidemiologic studies have demonstrated an age-related increase in the prevalence of CPPD: 15% prevalence in patients aged 65 to 74 years, 36% prevalence in patients aged 75 to 84 years, and 50% prevalence in patients aged > 84 years.10 In a recent radiographic study, 40% of patients with CPPD did not present with CC of the knee, and the study’s authors recommended additional radiographs of pelvis, wrists, or hands for accurate diagnosis of radiographic CC.11
Diagnosis
Accurate diagnosis should be achieved on the basis of the clinical picture and demonstration of CPP crystals in synovial fluid or tissue by compensated polarized light microscopy (Figures 1A and 1B).2 The sensitivity and specificity for CPP crystal detection has been shown to be 95.9% and 86.5%, respectively.12 However, the CPP crystal is more readily identified by a rheumatologist rather than in a standard hospital laboratory, which misses 30% of CPP crystals.13
Findings of CC on radiograph strengthens a CPPD diagnosis, but its absence does not rule it out (Figure 2A).2 More recently, the use of new imaging modalities, such as musculoskeletal ultrasound, provides the capacity to visualize crystal deposits within the joint structures, the hyaline cartilage, and/or fibrocartilage (Figure 2B and 2C).14 The presence of hyperechoic bands within the intermediate layer hyaline cartilage and hyperechoic spots in fibrocartilage are consistent with CPP crystal deposits.2,14 The use of computed tomography is the gold standard imaging modality for the identification of CPPD of the spine.15 There is not enough evidence to support the use of magnetic resonance imaging in CPPD, but it may play a role in rare complications.2
Treatment
The EULAR recently defined new guidelines for the management of CPPD.16 Asymptomatic CPPD needs no treatment.In other CPPD phenotypes, the goals are to attempt prompt resolution of the acute synovitis, reduction in chronic damage, and management of associated conditions.In acute attacks, treatment modalities used in gout are often required; however, data for CPPD treatment are limited (Table). Treatment relies on the use of colchicine and nonsteroidal anti-inflammatory drugs (NSAIDs), but toxicity and comorbidities in the elderly limit the usage of these drugs.
Given increased renal impairment, the loading dose of colchicine is not recommended.16 Colchicine has recently been shown to completely block crystal-induced maturation of IL-1β in vitro, indicating that the drug acts upstream of inflammasome activation.17 This is in addition to the well-known role of colchicine in inhibition of micro-tubule formation, which likely leads to prevention of cell migration, phagocytosis, and activation of inflammasome.18-20
Intra-articular injection of corticosteroid is an efficient and well-tolerated treatment alternative for monoarticular CPP flares. Oral or parenteral corticosteroids are frequently used for polyarticular flares in particular for those patients in which NSAIDs and colchicine are contraindicated.16 Parenteral adrenocorticotropic hormone has been used in patients with congestive heart failure, renal insufficiency, gastrointestinal bleeding, or resistance to NSAIDs.21 For prophylaxis of acute CPP crystal arthritis, a low dose of oral NSAIDs, oral colchicine, or prednisone may be used with good results.16 In chronic CPP arthritis, continuous use of colchicine, NSAIDs, or low-dose prednisone is often appropriate. If these interventions are ineffective or contraindicated, using hydroxychloroquine (HCQ) and methotrexate (MTX) have been successfully used to control chronic CPP crystal inflammation.22,23 Recent trials have raised questions about MTX, and further trials on HCQ usage are underway.24 Biologic agents targeting IL-1 are not currently approved for the treatment of CPPD, but there are suggestions that it may be effective in refractory cases and induce rapid stable remissions after 3 days of therapy.25
In contrast to gout, there is no specific target therapy for lowering CPP crystal load in the elderly. Crucial in the management of CPPD in the elderly is the search for associated diseases, such as hyperparathyroidism, hemochromatosis, hypomagnesemia, and hypophosphatemia, as well as avoidance of tacrolimus, which facilitates or causes CC.16 Correction of the underlying metabolic disorder, especially when undertaken early, may reduce the severity of CPPD. However, there is little evidence to suggest that treatment of associated disease results in resolution of CPPD—most famously, although therapeutic phlebotomy does not help in hemochromatosis for prevention of crystal disease, chelating agents do seem to be moderately effective.26 Only oral administration of magnesium has shown a reduction in meniscal CC in a patient with CPPD arthropathy.27 In addition, this was in the setting of familial hypomagnesemia associated CPPD. However, unlike uricosuric agents for gout, no pharmacologic treatments can prevent CPPD crystal formation and deposition in tissues.
Therapeutic Agents
Magnesium
Magnesium is a cofactor for the activity of pyrophosphatases that converts inorganic pyrophosphates (PPis) into orthophosphates. In addition, magnesium can increase the solubility of CPP crystals. Early detection and management of hypomagnesemia are recommended, because it occurs in patients who have well-defined conditions and situations: Gitelman syndrome, thiazide and loop diuretics use, tacrolimus use, familial forms of renal magnesium wasting or use of proton pump inhibitors, short bowel syndrome, and intestinal failure in patients receiving home parenteral nutrition. Long-term administration of magnesium in some patients with chronic hypomagnesemia decreased meniscal calcification.27-29
Dietary Calcium
Epidemiologic studies showed a lower incidence of CC in Chinese subjects. The authors of the study speculate that this lower prevalence of CPPD could result from high levels of calcium found in the drinking water in Beijing, which may affect parathyroid hormone secretion.30 Further studies are needed to confirm this hypothesis, as it could be a cheaper approach to pseudogout prevention.
Probenecid
Probenecid is an in vitro inhibitor of the transmembrane PPi transporter thought to possibly prevent extracellular PPi elaboration. However, this observation has not been confirmed by either case reports or clinical trials.31
Phosphocitrate
Phosphocitrate acts directly on preventing crystal deposition in tissues in CPPD as well as BCP based on in vitro evidence and mouse models.32,33
Hyaluronan
An amelioration of pain and increased range of motion were observed in radiographic CC with OA.34 However, it is associated with increased acute CPP arthritis.35
Radiosynovectomy
In a double-blind study of 15 patients with symmetrical CPPD arthropathy, the knee that underwent intra-articular injection of yttrium-90 (5 mCi) plus steroid had less pain, stiffness, joint line tenderness, and effusion compared with the contralateral control knee injected with saline and steroids.36
Precipitators of Acute Pseudogout
Diuretics are known to exacerbate gout, but they also can exacerbate pseudogout. A recent case-control study nested within a United Kingdom general practice database found that loop diuretics rather than hydrochlorothiazide was associated with increased risk of CPPD mediated primarily by magnesium reabsorption in the loop of Henle.28 Chronic kidney disease associated with secondary and tertiary hyperparathyroidism increases calcium or PPi concentration, which leads to CPP-crystal deposition.
In addition, multiple case reports have described acute pseudogout caused by bisphosphonate administration for osteoporosis or Paget disease—more likely in the elderly population. Intravenous pamidronate, oral etidronate, and alendronate therapy have all been described in the elderly.37 The overall mechanism behind this link is not completely understood, but bisphosphonates are structurally similar to PPi. Pseudogout attacks also have been described in neutropenic patients undergoing treatment with granulocyte-colony stimulating factor.38 In addition to pharmaceutical exacerbation of pseudogout, surgical procedures and trauma can precipitate attacks. Joint lavage has been described to increase the incidence of pseudogout.39 It was hypothesized that joint lavage with fluid induced “crystal shedding” from CPPD crystals imbedded in the joint tissue. Patients who underwent meniscectomy of the knee 20 years ago had a 20% incidence of CC in the knee that was operated compared with 4% CC in the contralateral nonoperated knee.40 Overall, the surgery most linked with a pseudogout attack, however, is parathyroidectomy.41
Basic Calcium Phosphate Crystals
Basic calcium phosphate crystals are common but rarely diagnosed due to the cumbersome and expensive methods required to identify these crystals.42
Basic calcium phosphate and CPPD crystals may coexist in synovial fluid. Similar to CPPD, BCP crystal disease is often concurrent with OA and can cause calcification of articular cartilage. Basic calcium phosphate is more common than CPP crystals with occurrence of 30% to 50% in OA synovial fluid.42 Additionally, BCP crystal disease has been linked to increased severity of OA. Basic calcium phosphate crystals in knee joints were found to have radiographically more severe arthritis with larger effusions.44,45 Similarly, BCP crystals in OA synovial fluid correlated with higher Kellgreen-Lawrence grade scores by radiography.42,46
It is currently believed that BCP crystals are continuously formed in the extracellular matrix, and their deposition is actively prevented by PPi present in the matrix.47 Elevated PPi levels, on the other hand, favor the formation of CPP crystals.48 The clinical upshot seems to be that although CPP crystals are almost universally intra-articular and released by chondrocytes, BCD crystals and deposits are more frequently present in soft tissues.
Acute Calcific Tendinitis
Typically, this type of tendinitis involves the shoulder joint and is extra-articular. Common treatments help, including NSAIDs, intra-articular steroids, ice, and rest. In addition, high-energy extracorporeal shock wave therapy has been shown to be effective when used with conscious sedation.49,50 Needling or barbotage in association with lavage and steroid injections also is effective and has occasionally been shown to reduce the size of the calcium deposit as well, often in combination with IV drugs like ethylenediaminetetraacetic acid.51-53
Acute calcific periarthritis of the hand presents similar to gout or pseudogout, affecting the wrist, usually in postmenopausal women.54 Basic calcium phosphate crystals are aspirated from the joint, and periarticular crystals may be subtle. Local steroid injections are beneficial.Milwaukee shoulder syndrome is an arthropathy associated with BCP crystals in the joint fluid and results in extensive destruction of shoulder articular cartilage and surrounding tissues. It is commonly bilateral and occurs in elderly women more often than it does in men.55 Aspiration of the shoulder joint typically reveals a serosanginous fluid. Fluid samples can be assessed for hydroxyapatite crystals by staining with alizarin red dye, which produces a characteristic “halo” or orange-red stain by light microscopy.43 Surgical treatment of Milwaukee shoulder syndrome is difficult due to increased age of the population affected and the severity of the shoulder destruction. Usually a conservative approach of analgesics, recurrent shoulder aspirations, and steroid injections is the best treatment option.
Conclusions
Calcium-containing crystal-associated arthropathies are a complex array of entities that target the veteran elderly population with increasing frequency. Challenges still remain in the diagnosis, crystal identification, and treatment due to coexisting comorbid conditions and polypharmacy commonly seen in veterans. Overall morbidity associated with calcium-containing crystal-associated arthropathies and the coexisting osteoarthritis is great, and focused identification of the disease process with tailored treatment can achieve the goal of decreasing symptoms and improving quality of life.
Acknowledgements
This work was supported by grant P20GM104937 (A.M.R.).
1. Guerne PA, Terkeltaub R. Clinical Features, Diagnosis, and Treatment of CPPD Crystal Arthropathy. In: Terkeltaub R, ed. Gout and Other Crystal Arthropathies. Philadelphia, PA: Saunders/Elsevier; 2012:249-265.
2. Zhang W, Doherty M, Bardin T, et al. European League Against Rheumatism recommendations for calcium pyrophosphate deposition. Part I: terminology and diagnosis. Ann Rheum Dis. 2011;70(4):563-570.
3. McCarty DJ. Calcium pyrophosphate dihydrate crystal deposition disease—1975. Arthritis Rheum. 1976;19(S3):275-285.
4. Ivorra J, Rosas J, Pascual E. Most calcium pyrophosphate crystals appear as non-birefringent. Ann Rheum Dis. 1999;58(9):582-584.
5. Lawrence RC, Felson DT, Helmick CG, et al; National Arthritis Data Workgroup. Estimates of the prevalence of arthritis and other rheumatic conditions in the United States. Part II. Arthritis Rheum. 2008;58(1):26-35.
6. Pego-Reigosa JM, Rodriguez-Rodriguez M, Hurtado-Hernandez Z, et al. Calcium pyrophosphate deposition disease mimicking polymyalgia rheumatica: a prospective followup study of predictive factors for this condition in patients presenting with polymyalgia symptoms. Arthritis Rheum. 2005;53(6):931-938.
7. Bouvet JP, le Parc JM, Michalski B, Benlahrache C, Auquier L. Acute neck pain due to calcifications surrounding the odontoid process: the crowned dens syndrome. Arthritis Rheum. 1985;28(12):1417-1420.
8. Muthukumar N, Karuppaswamy U. Tumoral calcium pyrophosphate dihydrate deposition disease of the ligamentum flavum. Neurosurgery. 2003;53(1):103-109.
9. Armas JB, Couto AR, Bettencourt BF. Spondyloarthritis, diffuse idiopathic skeletal hyperostosis (DISH) and chondrocalcinosis. Adv in Exp Med Biol. 2009;649:37-56.
10. Abhishek A, Doherty M. Epidemiology of calcium pyrophosphate crystal arthritis and basic calcium phosphate crystal arthropathy. Rheum Dis Clin North Am. 2014;40(2):177-191.
11. Abhishek A, Doherty S, Maciewicz R, Muir K, Zhang W, Doherty M. Chondrocalcinosis is common in the absence of knee involvement. Arthritis Res Ther. 2012;14(5):R205.
12. Lumbreras B, Pascual E, Frasquet J, González-Salinas J, Rodríguez E, Hernández-Aguado I. Analysis for crystals in synovial fluid: training of the analysts results in high consistency. Ann Rheum Dis. 2005;64(4):612-615.
13. Szscygiel J, Reginato AM SS. Quality improvements in the identification of crystals from synovial fluid: hospital laboratory versus rheumatology department evaluation. Poster presented at: 2014 ACR/ARHP Annual Meeting; November 15, 2014; Boston, MA.
14. Grassi W, Meenagh G, Pascual E, Filippucci E. “Crystal clear”-sonographic assessment of gout and calcium pyrophosphate deposition disease. Semin Arthritis Rheum. 2006;36(3):197-202.
15. Scutellari PN, Galeotti R, Leprotti S, Ridolfi M, Franciosi R, Antinolfi G. The crowned dens syndrome. Evaluation with CT imaging. Radiol Med. 2007;112(2):195-207.
16. Zhang W, Doherty M, Pascual E, et al. EULAR recommendations for calcium pyrophosphate deposition. Part II: management. Ann Rheum Dis. 2011;70(4):571-575.
17. Martinon F, Pétrilli V, Mayor A, Tardivel A, Tschopp J. Gout-associated uric acid crystals activate the NALP3 inflammasome. Nature. 2006;440(7081):237-241.
18. Nuki G. Colchicine: its mechanism of action and efficacy in crystal-induced inflammation. Curr Rheumatol Rep. 2008;10(3):218-227.
19. Borisy GG, Taylor EW. The mechanism of action of colchicine. Colchicine binding to sea urchin eggs and the mitotic apparatus. J Cell Biol. 1967;34(2):535-548.
20. Borisy GG, Taylor EW. The mechanism of action of colchicine. Binding of colchincine-3H to cellular protein. J Cell Biol. 1967;34(2):525-533.
21. Daoussis D, Antonopoulos I, Andonopoulos AP. ACTH as a treatment for acute crystal-induced arthritis: update on clinical evidence and mechanisms of action. Semin Arthritis Rheum. 2014;43(5):648-653.
22. Rothschild B, Yakubov LE. Prospective 6-month, double-blind trial of hydroxychloroquine treatment of CPDD. Compr Ther. 1997;23(5):327-331.
23. Chollet-Janin A, Finckh A, Dudler J, Guerne PA. Methotrexate as an alternative therapy for chronic calcium pyrophosphate deposition disease: an exploratory analysis. Arthritis Rheum. 2007;56(2):688-692.
24. Finckh A, Mc Carthy GM, Madigan A, et al. Methotrexate in chronic-recurrent calcium pyrophosphate deposition disease: no significant effect in a randomized crossover trial. Arthritis Res Ther. 2014;16(5):458.
25. Moltó A, Ea HK, Richette P, Bardin T, Lioté F. Efficacy of anakinra for refractory acute calcium pyrophosphate crystal arthritis. Joint Bone Spine. 2012;79(6):621-623.
26. Harty LC, Lai D, Connor S, et al. Prevalence and progress of joint symptoms in hereditary hemochromatosis and symptomatic response to venesection. J Clin Rheumatol. 2011;17(4):220-222.
27. Doherty M, Dieppe PA. Double blind, placebo controlled trial of magnesium carbonate in chronic pyrophosphate arthropathy. Ann Rheum Dis. 1983;42(suppl 1):106-107.
28. Rho YH, Zhu Y, Zhang Y, Reginato AM, Choi HK. Risk factors for pseudogout in the general population. Rheumatology (Oxford). 2012;51(11):2070-2074.
29. Park CH, Kim EH, Roh YH, Kim HY, Lee SK. The association between the use of proton pump inhibitors and the risk of hypomagnesemia: a systematic review and meta-analysis. PLoS One. 2014;9(11):e112558.
30. Zhang Y, Terkeltaub R, Nevitt M, et al. Lower prevalence of chondrocalcinosis in Chinese subjects in Beijing than in white subjects in the United States: the Beijing Osteoarthritis Study. Arthritis Rheum. 2006;54(11):3508-3512.
31. Rosenthal AK, Ryan LM. Probenecid inhibits transforming growth factor-beta 1 induced pyrophosphate elaboration by chondrocytes. J Rheumatol. 1994;21(5):896-900.
32. Cheung HS, Sallis JD, Demadis KD, Wierzbicki A. Phosphocitrate blocks calcification-induced articular joint degeneration in a guinea pig model. Arthritis Rheum. 2006;54(8):2452-2461.
33. Sun Y, Mauerhan DR, Honeycutt PR, et al. Calcium deposition in osteoarthritic meniscus and meniscal cell culture. Arthritis Res Ther. 2010;12(2):R56.
34. Daumen-Legre V, Pham T, Acquaviva PC, Lafforgue P. Evaluation of safety and efficacy of viscosupplementation in knee osteoarthritis with chondrocalcinosis. In: Arthritis and Rheumatism.Vol. 42. Lippincott Williams and Wilkins; 1999:S158-S158.
35. Disla E, Infante R, Fahmy A, Karten I, Cuppari GG. Recurrent acute calcium pyrophosphate dihydrate arthritis following intraarticular hyaluronate injection. Arthritis Rheum. 1999;42(6):1302-1303.
36. Doherty M, Dieppe PA. Effect of intra-articularYttrium-90 on chronic pyrophosphate arthropathy of the knee. Lancet. 1981;2(8258):1243-1246.
37. Wendling D, Tisserand G, Griffond V, Saccomani C, Toussirot E. Acute pseudogout after pamidronate infusion. Clin Rheumatol. 2008;27(9):1205-1206.
38. Ames PRJ, Rainey MG. Consecutive pseudogout attacks after repetitive granulocyte colony-stimulating factor administration for neutropenia. Mod Rheumatol. 2007;17(5):445-446.
39. Pasquetti P, Selvi E, Righeschi K, et al. Joint lavage and pseudogout. Ann Rheum Dis. 2004;63(11):1529-1530.
40. Doherty M, Watt I, Dieppe P. Localised chondrocalcinosis in post-meniscectomy knees. Lancet. 1982;1(8283):1207-1210.
41. Rubin MR, Silverberg SJ. Rheumatic manifestations of primary hyperparathyroidism and parathyroid hormone therapy. Curr Rheumatol Rep. 2002;4(2):179-185.
42. Ea HK, Lioté F. Diagnosis and clinical manifestations of calcium pyrophosphate and basic calcium phosphate crystal deposition diseases. Rheum Dis Clin North Am. 2014;40(2):207-229.
43. Paul H, Reginato AJ, Ralph Schumacher HR. Alizarin red s staining as a screening test to detect calcium compounds in synovial fluid. Arthritis Rheum. 1983;26(2):191-200.
44. Molloy ES, McCarthy GM. Basic calcium phosphate crystals: pathways to joint degeneration. Curr Opin Rheumatol. 2006;18(2):187-192.
45. Carroll GJ, Stuart RA, Armstrong JA, Breidahl PD, Laing BA. Hydroxyapatite crystals are a frequent finding in osteoarthritic synovial fluid, but are not related to increased concentrations of keratan sulfate or interleukin 1 beta. J Rheumatol. 1991;18(6):861-866.
46. Derfus BA, Kurian JB, Butler JJ, et al. The high prevalence of pathologic calcium crystals in pre-operative knees. J Rheumatol. 2002;29(3):570-574.
47. Ho AM, Johnson MD, Kingsley DM. Role of the mouse ank gene in control of tissue calcification and arthritis. Science. 2000;289(5477):265-270.
48. Macmullan P, McCarthy G. Treatment and management of pseudogout: insights for the clinician. Ther Adv Musculoskelet Dis. 2012;4(2):121-131.
49. Gerdesmeyer L, Wagenpfeil S, Haake M, et al. Extracorporeal shock wave therapy for the treatment of chronic calcifying tendonitis of the rotator cuff: a randomized controlled trial. JAMA. 2003;290(19):2573-2580.
50. Lee SY, Cheng B, Grimmer-Somers K. The midterm effectiveness of extracorporeal shockwave therapy in the management of chronic calcific shoulder tendinitis. J Shoulder Elbow Surg. 2011;20(5):845-854.
51. Pfister J, Gerber H. Chronic calcifying tendinitis of the shoulder-therapy by percutaneous needle aspiration and lavage: a prospective open study of 62 shoulders. Clin Rheumatol. 1997;16(3):269-274.
52. del Cura JL, Torre I, Zabala R, Legórburu A. Sonographically guided percutaneous needle lavage in calcific tendinitis of the shoulder: short- and long-term results. AJR Am J Roentgenol. 2007;189(3):W128-W134.
53. Yoo JC, Koh KH, Park WH, Park JC, Kim SM, Yoon YC. The outcome of ultrasound-guided needle decompression and steroid injection in calcific tendinitis. J Shoulder Elbow Surg. 2010;19(4):596-600.
54. Wiper JD, Garrido A. Images in clinical medicine. Acute calcific tendinitis. N Engl J Med. 2008;359(23):2477.
55. Halverson PB, Carrera GF, McCarty DJ. Milwaukee shoulder syndrome. Arch Intern Med. 1990;150(3):677-682.

Long‐term Antipsychotics in Elders
Delirium, a clinical syndrome characterized by inattention and acute cognitive dysfunction, is very common in older hospitalized patients, with a reported incidence of 18% to 35% at time of admission and overall occurrence rates of 29% to 64%.[1] Previous studies have reported that a diagnosis of delirium is not benign and is associated with other adverse outcomes including prolonged hospitalization, institutionalization, increased cost, and mortality. These outcomes occurred independent of age, prior cognitive functioning, and comorbidities.[2] Guidelines recommend that management of inpatient delirium should be focused on addressing the underlying etiology and managed with nonpharmacological interventions whenever possible.[3, 4, 5] However, implementing these recommendations can prove to be very challenging in hospital settings. Providers frequently have to resort to medical therapies, including antipsychotics (APs). Although these medications are commonly used to treat delirium in elderly patients, there is limited evidence to support their efficacy, and there are currently no proven pharmacological alternatives to these medications.[6] Furthermore, previous studies have demonstrated an increased risk of stroke, infection, cognitive impairment, and mortality in elders with dementia who receive long‐term AP therapy.[7, 8, 9] Yet as many as 48% of hospitalized elders who were newly started on APs had these drugs continued at time of discharge.[10]
There have been few studies describing the long‐term outcomes of elderly patient who are started on APs in the hospital. Most information on outcomes comes from patients with dementia. Therefore, we studied the 1‐year outcomes of a cohort of patients with and without dementia who were started on APs in the hospital and then discharged on these medications. In this cohort, we aimed to describe the number of readmissions, reasons for readmissions, duration of AP therapy, use of other sedating medications such as anxiolytics, hypnotics, and antihistamines as well as the incidence of readmission and death 1 year after the index hospital discharge.
METHODS
We previously described a retrospective cohort of 300 elders (65 years old) admitted to a tertiary care hospital between October 1, 2012 and September 31, 2013 who were newly prescribed APs while hospitalized.[10] Of patients alive at the time of discharge (260), 56% (146 patients) were discharged on APs. Two investigators extracted these 148 patient charts independently to identify and quantify the number of readmissions to the index hospital. We then limited the sample to only the first readmission per patient following the index admission and extracted this readmission for each patient. We first determined if APs were present on the admission medication reconciliation. If APs were not present on admission, we examined whether they were resumed during the hospitalization using the electronic medication administration summary. If they were present on admission, we looked to see if they were discontinued during the readmission and if additional new APs were started during the hospitalizations. We documented the circumstances around APs use and identified patients who died during their hospitalizations. We identified delirium using the same terms that were described in our prior study on the same cohort of patients.[10] We determined if patients were delirious using a predetermined algorithm (Figure 1). Briefly, we first determined delirium was documented. We then examined whether there was a Confusion Assessment Method (CAM) instrument included in the record. If a CAM instrument was not documented, we then looked for documentation using specific terms (eg, disorientation, confusions). We identified patients with dementia by determining whether dementia was documented along with other admission medical comorbidities. If it was not, we determined whether dementia was newly diagnosed during the hospital stay using progress notes or consultation notes. We did not objectively define criteria for diagnosis of dementia. We used the National Death Index (NDI) to determine mortality for all patients 1 year after discharge from the index hospitalization. The NDI is a national database of death records maintained by the National Center for Health Statistics. It has shown consistently high sensitivity and specificity for detection of death.[11]

We used descriptive statistics (means, standard deviations, range, and percents as appropriate to the scale of measurement) to describe the patient sample. We then used multiple logistic regression to identify significant predictors of death within 1 year of discharge.[12] Univariate analysis was used to select candidates for the logistic model (t tests for continuous factors and 2 for discrete factors). All factors with a significance level 0.2 on univariate analysis were included in the logistic regression, in addition to age and sex (regardless of significance). A maximum likelihood procedure was used to calculate the regression coefficients for the logistic model. The likelihood ratio criterion was used to determine the significance of individual factors in the regression model.[13] Factors with a significance level of 0.15 or less were retained in the final model, in addition to age and sex.
RESULTS
The 260 patients discharged alive from their index admissions had a 1‐year mortality rate of 29% (75/260). Of the 146/260 patients discharged on APs, 60 (41%) patients experienced at least 1 readmission (mean = 2 readmissions per patient; range, 18, with 111 total readmissions for 60 patients) within 1 year from discharge (Figure 2). Most common diagnoses at the time of readmissions were related neurological and psychiatric disorders (14%), cardiovascular and circulation disorders (13%), renal injury and electrolyte disorders (11%), and infections (6%). Among patients with at least 1 readmission, the mean age was 81.3 (range, 65.599.7), 60% were male, and 45% were admitted from a skilled nursing facility or rehabilitation facility (Table 1). Median time to readmission was 43.5 days (range, 1343 days), and 79% were readmitted to a medical service. The remaining 20% were admitted to a surgical service. Inpatient mortality during first readmissions was 8% (5/60). At the time of first readmission, 39/60 (65%) of patients were still on the same APs on which they had been discharged, and the APs were continued during the hospitalization in 79% of the patients (61% quetiapine, 19% olanzapine, and 13% risperidone). About half of patients whose APs were discontinued prior to readmission received a new AP during their hospital stays (9/20; 45%). One patient had been started on quetiapine in the outpatient setting. No patients were found to have new benzodiazepines, nonbenzodiazepine hypnotic, or antihistamines on their admission medication list.
| Variables | Value* |
|---|---|
| |
| Age, mean (range), yr | 81.3 (65.599.7) |
| Gender, no. (%) | |
| Male | 36 (60) |
| Female | 24 (40) |
| Admitted from, no. (%) | |
| Home | 33 (55) |
| Rehabilitation facilities | 5 (8) |
| SNF | 22 (37) |
| Services, no. (%) | |
| Medicine | 48 (80) |
| Surgery | 12 (20) |
| Types of APs continued on readmission (from index admission), no. (%) | |
| Quetiapine | 19 (61) |
| Olanzapine | 6 (19) |
| Risperidone | 4 (13) |
| Haloperidol | 2 (7) |
| Types of APs started during readmission, no. (%) | |
| Quetiapine | 7 (39) |
| Risperidone | 2 (11) |
| Haloperidol | 16 (89) |
| Indications for AP use, no. (%) | |
| Delirium | 14 (77) |
| Undocumented | 3 (17) |
| Other | 1 (6) |
| ECG, no. (%) | |
| Prior to APs administration | 17 (94) |
| After APs administration | 4 (22) |
| QTc prolongation >500 ms, no. (%) | |
| Prior to APs administration | 3 (18) |
| After APs administration∥ | 2 (50) |
| Discharge destination, no. (%) | |
| Home | 23 (38) |
| Rehabilitation facilities | 4 (7) |
| SNF | 28 (47) |
| Death | 5 (8) |
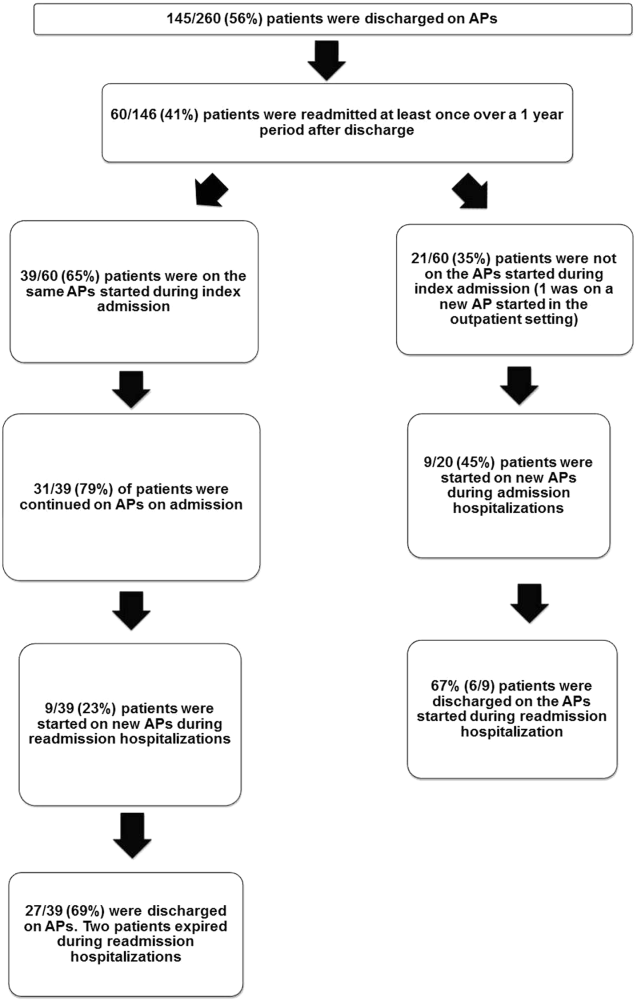
Eighteen patients received 1 or more new APs during the readmission hospitalizations. These included haloperidol (89%) and quetiapine (39%). Delirium was the main reported indication for starting APs (78%), but in 17% of cases no indication was documented. An electrocardiogram (ECG) was performed in 94% prior to APs administration and for 22% after APs administration. Corrected QT interval (QTc) of >500 ms was present in 18% of patients in pretreatment ECG and 50% of patients in post‐AP ECG. Of patients who survived readmission, 58% (32/55) were discharged to postacute facilities. Of the 39 patients who were on the same APs from index admission, 27 (69%) patients were eventually discharged on the same APs or new APs started during the readmission.
In the multivariable model (Table 2), predictors of death at 1 year included discharge to postacute facilities after index admission (odds ratio [OR]: 2.28; 95% confidence interval [CI]: 1.10‐4.73, P = 0.03) and QTc prolongation >500 ms during index admission (OR: 3.41; 95% CI: 1.34‐8.67, P = 0.01). Age and gender were not associated with 1‐year mortality.
| Odds Ratio | 95% Confidence Interval | P Value | |
|---|---|---|---|
| |||
| Age | 1.03 | 0.991.06 | 0.13 |
| Male sex | 0.87 | 0.501.52 | 0.63 |
| Risperdal | 3.53 | 0.6419.40 | 0.15 |
| QTc prolongation after AP administration* | 3.41 | 1.348.67 | 0.01 |
| Presence of geriatric psychiatry consult | 0.30 | 0.091.04 | 0.06 |
| Discharged to postacute facilities vs home | 2.28 | 1.104.73 | 0.03 |
DISCUSSION
In a cohort of elderly patients who were discharged on APs, nearly one‐third (29%) died within 1 year of the hospitalization in which APs were initiated. Nearly half of the survivors from the index admission (41%) experienced at least 1 admission within 1 year from discharge. Of readmitted patients, two‐thirds were taking the same APs that had been started during the index hospitalization. Half of the patients not on APs on readmission were started on an AP during the hospitalization, most often because they became delirious on return to the acute care setting. Compared to patients discharged home after an index admission, patients who were discharged to postacute facilities were almost 4 times as likely to die during the year subsequent to the admission. These data suggest that once patients are started on APs, most are continued on them until the next admission or are restarted during that readmission. Moreover, hospitalized elders who require an AP are at high risk for mortality in the coming year.
Prior studies have reported that patients with delirium have elevated 1‐year mortality rates.[14, 15, 16, 17, 18, 19] A secondary analysis of the Delirium Prevention Trial, which included 437 hospitalized older patients, revealed a 1‐year mortality rate of 20% in those who were never delirious during hospitalization, compared to 26% to 38% in patients with delirium.[19] Additionally, 1‐year mortality in hospitalized older patients with delirium (36%) was shown to be higher than patients with dementia (29%) or depression (26%).[17] Unlike these studies, not all of the patients in our study had documented delirium, but all received an AP. Still, it is notable that the 1‐year mortality rate for delirium in general is similar to what we found in this study.
The literature has also reported that long‐term AP use is associated with excess mortality in elder patients, especially those with dementia.[20, 21, 22] In a retrospective cohort study, older patients with dementia who were taking antipsychotics had significantly higher 1‐year mortality rates (23%29%) than patients not taking antipsychotic medications (15%). In a large Canadian propensity score‐matched cohort study that included over 13,000 demented older adults, the mortality was higher in the community‐dwelling elders who received atypical APs compared to no APs, with a difference of 1.1% in 180‐day mortality rate after initiation of APs.[21] The absolute mortality rate was 2.6% higher in patients who received typical compared to atypical APs. Unlike these studies, not every patient in our cohort had a diagnosis of dementia, but again, mortality rates in these studies appear similar to our cohort.
In contrast, other observational studies have not found an increased risk associated with receipt of APs. For example, a prospective study that enrolled approximately 950 patients with probable dementia showed that AP use was not associated with time to death after adjustment for comorbidities, demographic and cognitive variables.[23] These conflicting results highlight the difficulties of attributing outcomes in high‐risk populations. Although the excess mortality observed in patients taking APs may be related to the risks of APs, it is quite possible that patients who require APs (most often for delirium or agitated dementia) are at higher risk of death. This confounding by indication may be nearly impossible to adjust for retrospectively, even using techniques such as propensity matching.
Our report adds to the literature; we know of no studies to date describing a cohort of patients, most with delirium, who were started on APs in the hospital. We also attempted to identify the reasons that patients were started on APs, which have been infrequently reported. As noted above, our 1‐year mortality rate of 29% among older patients prescribed APs in the hospital was quite similar to mortality rates both for patients with delirium who were not necessarily treated with APs and patients with dementia who were treated with APs. This finding further supports the argument that risk factors for mortality, including dementia, delirium, and AP use are very difficult to tease apart. It is possible that the reasons that APs are prescribed (agitated delirium or dementia) have as much to do with the excess mortality reported in observational studies of APs as the use of APs themselves.
The high rate of continued AP use we observed (two‐thirds of readmitted patients) may reflect limited pharmacological alternatives to these medications with little evidence to support treating the symptoms of delirium with other drug classes, along with suboptimal environmental and behavioral modifications in postacute facilities and hospitals. This is unfortunate given that delirium is often preventable. Systematic implementation of well‐documented strategies to decrease delirium in hospitals and postacute facilities would likely reduce the prescription of APs and has the potential to slow the decline in this vulnerable population. A meta‐analysis incorporating both randomized and nonrandomized trials of medical and surgical patients showed that multicomponent nonpharmacologic interventions decreased delirium by 50%.[24] Thus, simple interventions such as reorientation, early mobilization, optimizing vision and hearing, sleepwake cycle preservation, and hydration might avoid roughly 1 million cases of delirium in hospitalized older adults annually.[24] The Hospital Elder Life Program and Acute Care for Elders units are examples of programs that have been shown to decrease the incidence of delirium.[25, 26]
Despite vigorous efforts to prevent delirium, a subgroup of patients still will become delirious. These patients are at high risk for death. Our mortality prediction model revealed that patients who were discharged to postacute facilities were 4 times more likely to die during the subsequent year compared to patients who were discharged home. Patients discharged to postacute facilities are likely to have a higher burden of disease, greater functional and cognitive impairment, and more frailty than those who are able to return to the community. Very ill and/or frail patients receiving APs in the hospital and requiring APs on discharge to postacute care facilities have limited survival and may benefit from expedited palliative care interventions to clarify prognosis and goals, and relieve suffering. At a minimum, our study identifies a need for further study to identify this very high‐risk group of elders. It is notable that 50% of patients were found to have a post‐treatment ECG with a QTc of >500 ms, a finding that has not been previously described. This would put these patients at higher risk of mortality, and as such we suggest that current guidelines should continue to emphasize the importance of post‐treatment ECGs and set clear criteria for discontinuation in elderly patients.
Our study is limited by its retrospective, single‐center design and small sample size, therefore limiting the interpretation and generalizability of the results to other hospitals. Quetiapine was the most common AP medication used in our hospital; therefore, our findings cannot be generalized to hospitals that utilize other AP agents. Future studies should examine antipsychotic use across hospitals to determine variation in prescribing patterns and outcomes. Nevertheless, the care of these patients were transitioned to a large number of geriatricians and primary care and nursing home physicians after discharge, and the reflected practice patterns extended beyond our hospital. Additionally, we were unable to determine when and why APs were discontinued or started in the outpatient setting. We were only able to detect readmissions to the 3 hospitals within our health system and therefore may have missed some readmissions to other institutions, although the majority of patients in our region tend to return to the same hospital. For patients who were not readmitted, we were also unable to identify whether they remained on the APs initiated during their index hospitalizations. Any retrospective study is limited by the difficulty of distinguishing delirium from the behavioral and psychiatric symptoms of dementia, but we identified delirium using standard terms described in previous literature.[10] We were unable to determine the types of delirium (hyperactive vs hypoactive) given that the documentations on behavioral symptoms were largely missing from the charts. The number of patients with preexisting diagnosis of dementia was likely underestimated, as we were only able to verify the diagnosis from the medical history. Additionally, the retrospective design based on chart review limited the factors that we could detect and grade accurately for inclusion in our mortality prediction model. Of note, our model did not contain objective measures of cognition, agitation, function, and markers for frailty such as walking speed, weak grip strength, weight loss, and low physical activity.
CONCLUSION
Initiating an AP (eg, haloperidol, quetiapine, olanzapine, and risperidone) in the hospital is likely to result in long‐term use of these medications despite the fact that AP use has been associated with multiple risks including falls, fractures, stroke, cardiovascular disease, and increased mortality in those with underlying dementia.[27] When possible, behavioral interventions to prevent delirium and slow the trajectory of decline should be implemented to reduce AP use. If patients with delirium are started on antipsychotics, it is important to monitor for prolonged QTc given the associated risk of mortality. In a subgroup of patients at high risk for death in the upcoming year, occurrence of delirium or use of APs during a hospitalization should both be considered triggers for early advance care planning and possibly palliative care and end‐of‐life discussions, with an emphasis on quality of life.
Disclosures: The research was supported by the Department of Medicine, Baystate Medical Center/Tufts University School of Medicine. Dr. Lagu is supported by the National Heart, Lung, and Blood Institute of the National Institutes of Health under award number K01HL114745. Drs. Lagu and Loh had full access to all of the data in the study. They take responsibility for the integrity of the data and the accuracy of the analysis. Drs. Loh, Brennan, Lindenauer, and Lagu conceived of the study. Drs. Loh, Ramdass, and Ms. Garb acquired the data. Ms Garb analyzed and interpreted the data. Drs. Loh, Ramdass, and Thim drafted the manuscript. Drs. Brennan, Lindenauer, and Lagu and Ms. Garb critically reviewed the manuscript for important intellectual content. Dr. Lagu has received consulting fees from the Institute for Healthcare Improvement, under contract to the Centers for Medicare and Medicaid Services, for her work on a project to help health systems achieve disability competence. Dr. Brennan is supported by a Geriatric Work Force Enhancement Grant from the US Department of Health and Human Services award number 1 U1QHP287020100. The authors report no conflicts of interest.
- , , . Delirium in elderly people. Lancet. 2014;383:911–922.
- , , , et al. Adverse outcomes after hospitalization and delirium in persons with Alzheimer disease. Ann Intern Med. 2012;156:848–856, W296.
- American Geriatrics Society Expert Panel on Postoperative Delirium in Older Adults. American Geriatrics Society abstracted clinical practice guideline for postoperative delirium in older adults. J Am Geriatr Soc. 2015;63:142–150.
- Practice guideline for the treatment of patients with delirium. American Psychiatric Association. Am J Psychiatry. 1999;156:1–20.
- , ; Guideline Development Group. The prevention, diagnosis and management of delirium in older people: concise guidelines. Clin Med (Lond). 2006;6:303–308.
- , , . Antipsychotics in the treatment of delirium: a systematic review. J Clin Psychiatry. 2007;68:11–21.
- , , , et al. Antipsychotics, other psychotropics, and the risk of death in patients with dementia: number needed to harm. JAMA Psychiatry. 2015;72:438–445.
- , . Safety and efficacy of antipsychotic drugs for the behavioral and psychological symptoms of dementia. Indian J Psychiatry. 2009;51(suppl 1):S87–S92.
- , , , . Use and safety of antipsychotics in behavioral disorders in elderly people with dementia. J Clin Psychopharmacol. 2014;34:109–123.
- , , , , , . From hospital to community: use of antipsychotics in hospitalized elders. J Hosp Med. 2014;9:802–804.
- , , . Comparison of National Death Index and World Wide Web Death Searches. Am J Epidemiol. 2000;152:107–111.
- . Analysis of Binary Data. London, United Kingdom: Methuen; 1970:76–99.
- . Statistical Methods for Survival Data Analysis. New York, NY: John Wiley 1992:233–236.
- , , , . The risk of adverse outcomes in hospitalized older patients in relation to a frailty index based on a comprehensive geriatric assessment. Age Ageing. 2014;43:127–132.
- , , , et al. Risk factors for delirium and inpatient mortality with delirium. J Postgrad Med. 2013;59:263–270.
- , , , , , . Comprehensive geriatric assessment predicts mortality and adverse outcomes in hospitalized older adults. BMC Geriatr. 2014;14:129.
- , , , , , . One‐year mortality of elderly inpatients with delirium, dementia, or depression seen by a consultation‐liaison service. Psychosomatics. 2012;53:433–438.
- , , , . Excess mortality in general hospital patients with delirium: a 5‐year follow‐up of 519 patients seen in psychiatric consultation. J Psychosom Res. 1994;38:339–346.
- , , , et al. Older adults discharged from the hospital with delirium: 1‐year outcomes. J Am Geriatr Soc. 2006;54:1245–1250.
- , , , et al. The dementia antipsychotic withdrawal trial (DART‐AD): long‐term follow‐up of a randomised placebo‐controlled trial. Lancet Neurol. 2009;8:151–157.
- , , , et al. Antipsychotic drug use and mortality in older adults with dementia. Ann Intern Med. 2007;146:775–786.
- , , , et al. Risk of death in elderly users of conventional vs. atypical antipsychotic medications. N Engl J Med. 2005;353:2335–2341.
- , , , et al. The long‐term effects of conventional and atypical antipsychotics in patients with probable Alzheimer's disease. Am J Psychiatry. 2013;170:1051–1058.
- , , , et al. Effectiveness of multicomponent nonpharmacological delirium interventions: a meta‐analysis. JAMA Intern Med. 2015;175:512–520.
- , , , , . Sustainability and scalability of the hospital elder life program at a community hospital. J Am Geriatr Soc. 2011;59:359–365.
- , , , et al. Effectiveness of acute geriatric unit care using acute care for elders components: a systematic review and meta‐analysis. J Am Geriatr Soc. 2012;60:2237–2245.
- , . Adverse effects of antipsychotic medications. Am Fam Physician. 2010;81:617–622.
Delirium, a clinical syndrome characterized by inattention and acute cognitive dysfunction, is very common in older hospitalized patients, with a reported incidence of 18% to 35% at time of admission and overall occurrence rates of 29% to 64%.[1] Previous studies have reported that a diagnosis of delirium is not benign and is associated with other adverse outcomes including prolonged hospitalization, institutionalization, increased cost, and mortality. These outcomes occurred independent of age, prior cognitive functioning, and comorbidities.[2] Guidelines recommend that management of inpatient delirium should be focused on addressing the underlying etiology and managed with nonpharmacological interventions whenever possible.[3, 4, 5] However, implementing these recommendations can prove to be very challenging in hospital settings. Providers frequently have to resort to medical therapies, including antipsychotics (APs). Although these medications are commonly used to treat delirium in elderly patients, there is limited evidence to support their efficacy, and there are currently no proven pharmacological alternatives to these medications.[6] Furthermore, previous studies have demonstrated an increased risk of stroke, infection, cognitive impairment, and mortality in elders with dementia who receive long‐term AP therapy.[7, 8, 9] Yet as many as 48% of hospitalized elders who were newly started on APs had these drugs continued at time of discharge.[10]
There have been few studies describing the long‐term outcomes of elderly patient who are started on APs in the hospital. Most information on outcomes comes from patients with dementia. Therefore, we studied the 1‐year outcomes of a cohort of patients with and without dementia who were started on APs in the hospital and then discharged on these medications. In this cohort, we aimed to describe the number of readmissions, reasons for readmissions, duration of AP therapy, use of other sedating medications such as anxiolytics, hypnotics, and antihistamines as well as the incidence of readmission and death 1 year after the index hospital discharge.
METHODS
We previously described a retrospective cohort of 300 elders (65 years old) admitted to a tertiary care hospital between October 1, 2012 and September 31, 2013 who were newly prescribed APs while hospitalized.[10] Of patients alive at the time of discharge (260), 56% (146 patients) were discharged on APs. Two investigators extracted these 148 patient charts independently to identify and quantify the number of readmissions to the index hospital. We then limited the sample to only the first readmission per patient following the index admission and extracted this readmission for each patient. We first determined if APs were present on the admission medication reconciliation. If APs were not present on admission, we examined whether they were resumed during the hospitalization using the electronic medication administration summary. If they were present on admission, we looked to see if they were discontinued during the readmission and if additional new APs were started during the hospitalizations. We documented the circumstances around APs use and identified patients who died during their hospitalizations. We identified delirium using the same terms that were described in our prior study on the same cohort of patients.[10] We determined if patients were delirious using a predetermined algorithm (Figure 1). Briefly, we first determined delirium was documented. We then examined whether there was a Confusion Assessment Method (CAM) instrument included in the record. If a CAM instrument was not documented, we then looked for documentation using specific terms (eg, disorientation, confusions). We identified patients with dementia by determining whether dementia was documented along with other admission medical comorbidities. If it was not, we determined whether dementia was newly diagnosed during the hospital stay using progress notes or consultation notes. We did not objectively define criteria for diagnosis of dementia. We used the National Death Index (NDI) to determine mortality for all patients 1 year after discharge from the index hospitalization. The NDI is a national database of death records maintained by the National Center for Health Statistics. It has shown consistently high sensitivity and specificity for detection of death.[11]
We used descriptive statistics (means, standard deviations, range, and percents as appropriate to the scale of measurement) to describe the patient sample. We then used multiple logistic regression to identify significant predictors of death within 1 year of discharge.[12] Univariate analysis was used to select candidates for the logistic model (t tests for continuous factors and 2 for discrete factors). All factors with a significance level 0.2 on univariate analysis were included in the logistic regression, in addition to age and sex (regardless of significance). A maximum likelihood procedure was used to calculate the regression coefficients for the logistic model. The likelihood ratio criterion was used to determine the significance of individual factors in the regression model.[13] Factors with a significance level of 0.15 or less were retained in the final model, in addition to age and sex.
RESULTS
The 260 patients discharged alive from their index admissions had a 1‐year mortality rate of 29% (75/260). Of the 146/260 patients discharged on APs, 60 (41%) patients experienced at least 1 readmission (mean = 2 readmissions per patient; range, 18, with 111 total readmissions for 60 patients) within 1 year from discharge (Figure 2). Most common diagnoses at the time of readmissions were related neurological and psychiatric disorders (14%), cardiovascular and circulation disorders (13%), renal injury and electrolyte disorders (11%), and infections (6%). Among patients with at least 1 readmission, the mean age was 81.3 (range, 65.599.7), 60% were male, and 45% were admitted from a skilled nursing facility or rehabilitation facility (Table 1). Median time to readmission was 43.5 days (range, 1343 days), and 79% were readmitted to a medical service. The remaining 20% were admitted to a surgical service. Inpatient mortality during first readmissions was 8% (5/60). At the time of first readmission, 39/60 (65%) of patients were still on the same APs on which they had been discharged, and the APs were continued during the hospitalization in 79% of the patients (61% quetiapine, 19% olanzapine, and 13% risperidone). About half of patients whose APs were discontinued prior to readmission received a new AP during their hospital stays (9/20; 45%). One patient had been started on quetiapine in the outpatient setting. No patients were found to have new benzodiazepines, nonbenzodiazepine hypnotic, or antihistamines on their admission medication list.
| Variables | Value* |
|---|---|
| |
| Age, mean (range), yr | 81.3 (65.599.7) |
| Gender, no. (%) | |
| Male | 36 (60) |
| Female | 24 (40) |
| Admitted from, no. (%) | |
| Home | 33 (55) |
| Rehabilitation facilities | 5 (8) |
| SNF | 22 (37) |
| Services, no. (%) | |
| Medicine | 48 (80) |
| Surgery | 12 (20) |
| Types of APs continued on readmission (from index admission), no. (%) | |
| Quetiapine | 19 (61) |
| Olanzapine | 6 (19) |
| Risperidone | 4 (13) |
| Haloperidol | 2 (7) |
| Types of APs started during readmission, no. (%) | |
| Quetiapine | 7 (39) |
| Risperidone | 2 (11) |
| Haloperidol | 16 (89) |
| Indications for AP use, no. (%) | |
| Delirium | 14 (77) |
| Undocumented | 3 (17) |
| Other | 1 (6) |
| ECG, no. (%) | |
| Prior to APs administration | 17 (94) |
| After APs administration | 4 (22) |
| QTc prolongation >500 ms, no. (%) | |
| Prior to APs administration | 3 (18) |
| After APs administration∥ | 2 (50) |
| Discharge destination, no. (%) | |
| Home | 23 (38) |
| Rehabilitation facilities | 4 (7) |
| SNF | 28 (47) |
| Death | 5 (8) |
Eighteen patients received 1 or more new APs during the readmission hospitalizations. These included haloperidol (89%) and quetiapine (39%). Delirium was the main reported indication for starting APs (78%), but in 17% of cases no indication was documented. An electrocardiogram (ECG) was performed in 94% prior to APs administration and for 22% after APs administration. Corrected QT interval (QTc) of >500 ms was present in 18% of patients in pretreatment ECG and 50% of patients in post‐AP ECG. Of patients who survived readmission, 58% (32/55) were discharged to postacute facilities. Of the 39 patients who were on the same APs from index admission, 27 (69%) patients were eventually discharged on the same APs or new APs started during the readmission.
In the multivariable model (Table 2), predictors of death at 1 year included discharge to postacute facilities after index admission (odds ratio [OR]: 2.28; 95% confidence interval [CI]: 1.10‐4.73, P = 0.03) and QTc prolongation >500 ms during index admission (OR: 3.41; 95% CI: 1.34‐8.67, P = 0.01). Age and gender were not associated with 1‐year mortality.
| Odds Ratio | 95% Confidence Interval | P Value | |
|---|---|---|---|
| |||
| Age | 1.03 | 0.991.06 | 0.13 |
| Male sex | 0.87 | 0.501.52 | 0.63 |
| Risperdal | 3.53 | 0.6419.40 | 0.15 |
| QTc prolongation after AP administration* | 3.41 | 1.348.67 | 0.01 |
| Presence of geriatric psychiatry consult | 0.30 | 0.091.04 | 0.06 |
| Discharged to postacute facilities vs home | 2.28 | 1.104.73 | 0.03 |
DISCUSSION
In a cohort of elderly patients who were discharged on APs, nearly one‐third (29%) died within 1 year of the hospitalization in which APs were initiated. Nearly half of the survivors from the index admission (41%) experienced at least 1 admission within 1 year from discharge. Of readmitted patients, two‐thirds were taking the same APs that had been started during the index hospitalization. Half of the patients not on APs on readmission were started on an AP during the hospitalization, most often because they became delirious on return to the acute care setting. Compared to patients discharged home after an index admission, patients who were discharged to postacute facilities were almost 4 times as likely to die during the year subsequent to the admission. These data suggest that once patients are started on APs, most are continued on them until the next admission or are restarted during that readmission. Moreover, hospitalized elders who require an AP are at high risk for mortality in the coming year.
Prior studies have reported that patients with delirium have elevated 1‐year mortality rates.[14, 15, 16, 17, 18, 19] A secondary analysis of the Delirium Prevention Trial, which included 437 hospitalized older patients, revealed a 1‐year mortality rate of 20% in those who were never delirious during hospitalization, compared to 26% to 38% in patients with delirium.[19] Additionally, 1‐year mortality in hospitalized older patients with delirium (36%) was shown to be higher than patients with dementia (29%) or depression (26%).[17] Unlike these studies, not all of the patients in our study had documented delirium, but all received an AP. Still, it is notable that the 1‐year mortality rate for delirium in general is similar to what we found in this study.
The literature has also reported that long‐term AP use is associated with excess mortality in elder patients, especially those with dementia.[20, 21, 22] In a retrospective cohort study, older patients with dementia who were taking antipsychotics had significantly higher 1‐year mortality rates (23%29%) than patients not taking antipsychotic medications (15%). In a large Canadian propensity score‐matched cohort study that included over 13,000 demented older adults, the mortality was higher in the community‐dwelling elders who received atypical APs compared to no APs, with a difference of 1.1% in 180‐day mortality rate after initiation of APs.[21] The absolute mortality rate was 2.6% higher in patients who received typical compared to atypical APs. Unlike these studies, not every patient in our cohort had a diagnosis of dementia, but again, mortality rates in these studies appear similar to our cohort.
In contrast, other observational studies have not found an increased risk associated with receipt of APs. For example, a prospective study that enrolled approximately 950 patients with probable dementia showed that AP use was not associated with time to death after adjustment for comorbidities, demographic and cognitive variables.[23] These conflicting results highlight the difficulties of attributing outcomes in high‐risk populations. Although the excess mortality observed in patients taking APs may be related to the risks of APs, it is quite possible that patients who require APs (most often for delirium or agitated dementia) are at higher risk of death. This confounding by indication may be nearly impossible to adjust for retrospectively, even using techniques such as propensity matching.
Our report adds to the literature; we know of no studies to date describing a cohort of patients, most with delirium, who were started on APs in the hospital. We also attempted to identify the reasons that patients were started on APs, which have been infrequently reported. As noted above, our 1‐year mortality rate of 29% among older patients prescribed APs in the hospital was quite similar to mortality rates both for patients with delirium who were not necessarily treated with APs and patients with dementia who were treated with APs. This finding further supports the argument that risk factors for mortality, including dementia, delirium, and AP use are very difficult to tease apart. It is possible that the reasons that APs are prescribed (agitated delirium or dementia) have as much to do with the excess mortality reported in observational studies of APs as the use of APs themselves.
The high rate of continued AP use we observed (two‐thirds of readmitted patients) may reflect limited pharmacological alternatives to these medications with little evidence to support treating the symptoms of delirium with other drug classes, along with suboptimal environmental and behavioral modifications in postacute facilities and hospitals. This is unfortunate given that delirium is often preventable. Systematic implementation of well‐documented strategies to decrease delirium in hospitals and postacute facilities would likely reduce the prescription of APs and has the potential to slow the decline in this vulnerable population. A meta‐analysis incorporating both randomized and nonrandomized trials of medical and surgical patients showed that multicomponent nonpharmacologic interventions decreased delirium by 50%.[24] Thus, simple interventions such as reorientation, early mobilization, optimizing vision and hearing, sleepwake cycle preservation, and hydration might avoid roughly 1 million cases of delirium in hospitalized older adults annually.[24] The Hospital Elder Life Program and Acute Care for Elders units are examples of programs that have been shown to decrease the incidence of delirium.[25, 26]
Despite vigorous efforts to prevent delirium, a subgroup of patients still will become delirious. These patients are at high risk for death. Our mortality prediction model revealed that patients who were discharged to postacute facilities were 4 times more likely to die during the subsequent year compared to patients who were discharged home. Patients discharged to postacute facilities are likely to have a higher burden of disease, greater functional and cognitive impairment, and more frailty than those who are able to return to the community. Very ill and/or frail patients receiving APs in the hospital and requiring APs on discharge to postacute care facilities have limited survival and may benefit from expedited palliative care interventions to clarify prognosis and goals, and relieve suffering. At a minimum, our study identifies a need for further study to identify this very high‐risk group of elders. It is notable that 50% of patients were found to have a post‐treatment ECG with a QTc of >500 ms, a finding that has not been previously described. This would put these patients at higher risk of mortality, and as such we suggest that current guidelines should continue to emphasize the importance of post‐treatment ECGs and set clear criteria for discontinuation in elderly patients.
Our study is limited by its retrospective, single‐center design and small sample size, therefore limiting the interpretation and generalizability of the results to other hospitals. Quetiapine was the most common AP medication used in our hospital; therefore, our findings cannot be generalized to hospitals that utilize other AP agents. Future studies should examine antipsychotic use across hospitals to determine variation in prescribing patterns and outcomes. Nevertheless, the care of these patients were transitioned to a large number of geriatricians and primary care and nursing home physicians after discharge, and the reflected practice patterns extended beyond our hospital. Additionally, we were unable to determine when and why APs were discontinued or started in the outpatient setting. We were only able to detect readmissions to the 3 hospitals within our health system and therefore may have missed some readmissions to other institutions, although the majority of patients in our region tend to return to the same hospital. For patients who were not readmitted, we were also unable to identify whether they remained on the APs initiated during their index hospitalizations. Any retrospective study is limited by the difficulty of distinguishing delirium from the behavioral and psychiatric symptoms of dementia, but we identified delirium using standard terms described in previous literature.[10] We were unable to determine the types of delirium (hyperactive vs hypoactive) given that the documentations on behavioral symptoms were largely missing from the charts. The number of patients with preexisting diagnosis of dementia was likely underestimated, as we were only able to verify the diagnosis from the medical history. Additionally, the retrospective design based on chart review limited the factors that we could detect and grade accurately for inclusion in our mortality prediction model. Of note, our model did not contain objective measures of cognition, agitation, function, and markers for frailty such as walking speed, weak grip strength, weight loss, and low physical activity.
CONCLUSION
Initiating an AP (eg, haloperidol, quetiapine, olanzapine, and risperidone) in the hospital is likely to result in long‐term use of these medications despite the fact that AP use has been associated with multiple risks including falls, fractures, stroke, cardiovascular disease, and increased mortality in those with underlying dementia.[27] When possible, behavioral interventions to prevent delirium and slow the trajectory of decline should be implemented to reduce AP use. If patients with delirium are started on antipsychotics, it is important to monitor for prolonged QTc given the associated risk of mortality. In a subgroup of patients at high risk for death in the upcoming year, occurrence of delirium or use of APs during a hospitalization should both be considered triggers for early advance care planning and possibly palliative care and end‐of‐life discussions, with an emphasis on quality of life.
Disclosures: The research was supported by the Department of Medicine, Baystate Medical Center/Tufts University School of Medicine. Dr. Lagu is supported by the National Heart, Lung, and Blood Institute of the National Institutes of Health under award number K01HL114745. Drs. Lagu and Loh had full access to all of the data in the study. They take responsibility for the integrity of the data and the accuracy of the analysis. Drs. Loh, Brennan, Lindenauer, and Lagu conceived of the study. Drs. Loh, Ramdass, and Ms. Garb acquired the data. Ms Garb analyzed and interpreted the data. Drs. Loh, Ramdass, and Thim drafted the manuscript. Drs. Brennan, Lindenauer, and Lagu and Ms. Garb critically reviewed the manuscript for important intellectual content. Dr. Lagu has received consulting fees from the Institute for Healthcare Improvement, under contract to the Centers for Medicare and Medicaid Services, for her work on a project to help health systems achieve disability competence. Dr. Brennan is supported by a Geriatric Work Force Enhancement Grant from the US Department of Health and Human Services award number 1 U1QHP287020100. The authors report no conflicts of interest.
- , , . Delirium in elderly people. Lancet. 2014;383:911–922.
- , , , et al. Adverse outcomes after hospitalization and delirium in persons with Alzheimer disease. Ann Intern Med. 2012;156:848–856, W296.
- American Geriatrics Society Expert Panel on Postoperative Delirium in Older Adults. American Geriatrics Society abstracted clinical practice guideline for postoperative delirium in older adults. J Am Geriatr Soc. 2015;63:142–150.
- Practice guideline for the treatment of patients with delirium. American Psychiatric Association. Am J Psychiatry. 1999;156:1–20.
- , ; Guideline Development Group. The prevention, diagnosis and management of delirium in older people: concise guidelines. Clin Med (Lond). 2006;6:303–308.
- , , . Antipsychotics in the treatment of delirium: a systematic review. J Clin Psychiatry. 2007;68:11–21.
- , , , et al. Antipsychotics, other psychotropics, and the risk of death in patients with dementia: number needed to harm. JAMA Psychiatry. 2015;72:438–445.
- , . Safety and efficacy of antipsychotic drugs for the behavioral and psychological symptoms of dementia. Indian J Psychiatry. 2009;51(suppl 1):S87–S92.
- , , , . Use and safety of antipsychotics in behavioral disorders in elderly people with dementia. J Clin Psychopharmacol. 2014;34:109–123.
- , , , , , . From hospital to community: use of antipsychotics in hospitalized elders. J Hosp Med. 2014;9:802–804.
- , , . Comparison of National Death Index and World Wide Web Death Searches. Am J Epidemiol. 2000;152:107–111.
- . Analysis of Binary Data. London, United Kingdom: Methuen; 1970:76–99.
- . Statistical Methods for Survival Data Analysis. New York, NY: John Wiley 1992:233–236.
- , , , . The risk of adverse outcomes in hospitalized older patients in relation to a frailty index based on a comprehensive geriatric assessment. Age Ageing. 2014;43:127–132.
- , , , et al. Risk factors for delirium and inpatient mortality with delirium. J Postgrad Med. 2013;59:263–270.
- , , , , , . Comprehensive geriatric assessment predicts mortality and adverse outcomes in hospitalized older adults. BMC Geriatr. 2014;14:129.
- , , , , , . One‐year mortality of elderly inpatients with delirium, dementia, or depression seen by a consultation‐liaison service. Psychosomatics. 2012;53:433–438.
- , , , . Excess mortality in general hospital patients with delirium: a 5‐year follow‐up of 519 patients seen in psychiatric consultation. J Psychosom Res. 1994;38:339–346.
- , , , et al. Older adults discharged from the hospital with delirium: 1‐year outcomes. J Am Geriatr Soc. 2006;54:1245–1250.
- , , , et al. The dementia antipsychotic withdrawal trial (DART‐AD): long‐term follow‐up of a randomised placebo‐controlled trial. Lancet Neurol. 2009;8:151–157.
- , , , et al. Antipsychotic drug use and mortality in older adults with dementia. Ann Intern Med. 2007;146:775–786.
- , , , et al. Risk of death in elderly users of conventional vs. atypical antipsychotic medications. N Engl J Med. 2005;353:2335–2341.
- , , , et al. The long‐term effects of conventional and atypical antipsychotics in patients with probable Alzheimer's disease. Am J Psychiatry. 2013;170:1051–1058.
- , , , et al. Effectiveness of multicomponent nonpharmacological delirium interventions: a meta‐analysis. JAMA Intern Med. 2015;175:512–520.
- , , , , . Sustainability and scalability of the hospital elder life program at a community hospital. J Am Geriatr Soc. 2011;59:359–365.
- , , , et al. Effectiveness of acute geriatric unit care using acute care for elders components: a systematic review and meta‐analysis. J Am Geriatr Soc. 2012;60:2237–2245.
- , . Adverse effects of antipsychotic medications. Am Fam Physician. 2010;81:617–622.
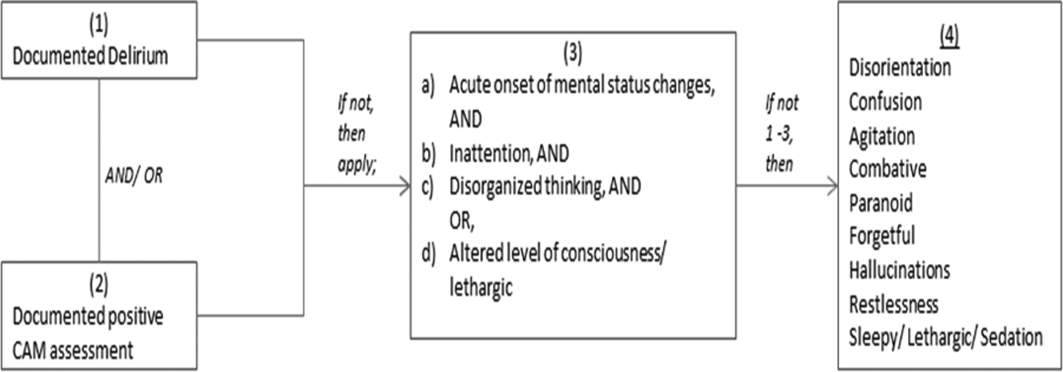
The Current State of PHM Fellowships
Pediatric hospital medicine (PHM) fellowship programs came into existence approximately 20 years ago in Canada,[1] and since that time the number of programs in North America has grown dramatically. The first 3 PHM fellowship programs in the United States were initiated in 2003, and by 2008 there were 7 active programs. Just 5 years later in 2013, there were 20 fellowship programs in existence. Now, in 2015, there are over 30 programs, with several more in development. The goal of postresidency training in PHM is to improve the care of hospitalized children by training future hospitalists to provide high‐quality, evidence‐based clinical care and to generate new knowledge and scholarship in areas such as clinical research, patient safety and quality improvement, medical education, practice management, and patient outcomes.[2] Many pediatric hospitalists want to be able to perform research or quality improvement, but feel that they lack the time, skills, resources, and mentorship to do so.[3] To date, fellowship‐trained hospitalists have a demonstrated track record of contributing to the body of literature that is shaping the care of hospitalized children.[4, 5]
At present, PHM is not a recognized subspecialty of the American Board of Pediatrics (ABP) and therefore does not fall under the purview of the Accreditation Council of Graduate Medical Education (ACGME), leading to concern from some about the variability in depth and breadth of training across programs.[1] The development and publication of the PHM Core Competencies in 2010 helped define the scope of practice of pediatric hospitalists and provide guidelines for training programs, specifically with respect to clinical and nonclinical areas for assessment of competency.[6] Furthermore, studies of early career hospitalists have identified areas for future fellowship curriculum development, such as core procedural skills, quality improvement, and practice management.[7]
In an effort to address training variability across programs, PHM fellowship directors (FDs) have come together as an organized group, first meeting in 2008, with the primary goal of defining training standards and sharing curricular resources. Annual meetings of the FDs, sponsored by the American Academy of Pediatrics Section on Hospital Medicine (AAP‐SOHM), began in 2012. A key objective of this annual meeting has been to develop a standardized fellowship curriculum for use across programs as well as to determine gaps in training that need to be addressed. During this process, we have received input from key stakeholders including community hospitalists, internal medicine‐pediatrics hospitalists, and the PHM Certification Steering Committee, which organized the application for subspecialty certification to the ABP. To inform this process of curriculum standardization, we fielded a survey of PHM fellowship directors. The purpose of this article is to summarize the current curricula, operations, and logistics of PHM fellowship programs.
METHODS
This was a cross‐sectional study of 31 PHM fellowship programs across the United States and Canada in April 2014. Inclusion criteria included all pediatric fellowships that were self‐identified to the AAP‐SOHM as providing a hospital medicine fellowship option. This included both PHM fellowships as well as academic general pediatric fellowships with a hospitalist track. A web‐based survey (SurveyMonkey, Inc.) was distributed by e‐mail to the FDs at the 31 training programs (see Supporting Information in the online version of this article). To enhance content validity of survey responses, survey questions were designed using an iterative consensus process among the authors, who included junior and senior FDs and represented the 2014 annual FD meeting planning committee. Items were created to gather feedback on the following key areas of PHM fellowships: program demographics, types of required and elective clinical rotations, graduate coursework offerings, amount of time spent in clinical activities, fellow billing practices, and description of fellows' research activities. The survey consisted of 30 multiple‐choice and short‐answer questions. Follow‐up e‐mail reminders were sent to all FDs 2 weeks and 4 weeks after the initial request was sent. Survey completion was voluntary, and no incentives were offered. The study was determined to be exempt by the Stanford University Institutional Review Board. Data were summarized using frequency distributions. No subgroup comparisons were made.
RESULTS
Program directors from 27/31 (87%) PHM fellowship programs responded to the survey; 25 were active programs, and 2 were under development. Responding programs represented all 4 major regions of the country and Canada, with varying program initiation dates, ranging from 1997 to 2013.
Program Demographics
The duration of most programs (17/27) was 2 years (63%), with 6 (22%) 1‐year programs and 4 (15%) 3‐year programs making up the remainder. Four programs described variable lengths, which could be tailored based on the fellow's individual interest. Two of the programs are 2 years in length, but offer a 1‐year option for fellows who wish to focus on enhancing clinical skills without an academic focus. The other 2 programs are 2 years in length, but will offer an extension to a third year for those pursuing a graduate degree.
Fellow Clinical Activities
The average amount of total clinical time (weeks on service) across responding programs was 50% (range, 20%65%). When looking specifically at time on the inpatient general pediatric service, number of weeks varied by year of training and by institution, with 12 to 41 weeks in the first year of fellowship, 6 to 41 weeks in the second year of fellowship, and 6 to 28 weeks in the third year of fellowship (Figure 1). Though the range is large, on average, fellows spend 17 weeks on inpatient general pediatrics service during each year of training. Of note, the median number of weeks on inpatient general pediatrics service by year of training was 15 weeks, 16 weeks, and 16.5 weeks, respectively. In addition to inpatient general pediatrics service time, most programs require other clinical rotations, with sedation, complex care, and inpatient pediatrics at community sites being the most frequent (Figure 2). Of the 6 responding 1‐year programs, 5 (83%) allow fellows to bill/generate clinical revenue at some point during their training. Of the 15 responding 2‐year programs, 11 (73%) allow fellows to bill/generate clinical revenue at some point during their training. Of the 4 responding 3‐year programs, 2 (50%) allow their fellows to bill/generate clinical revenue at some point during their training.
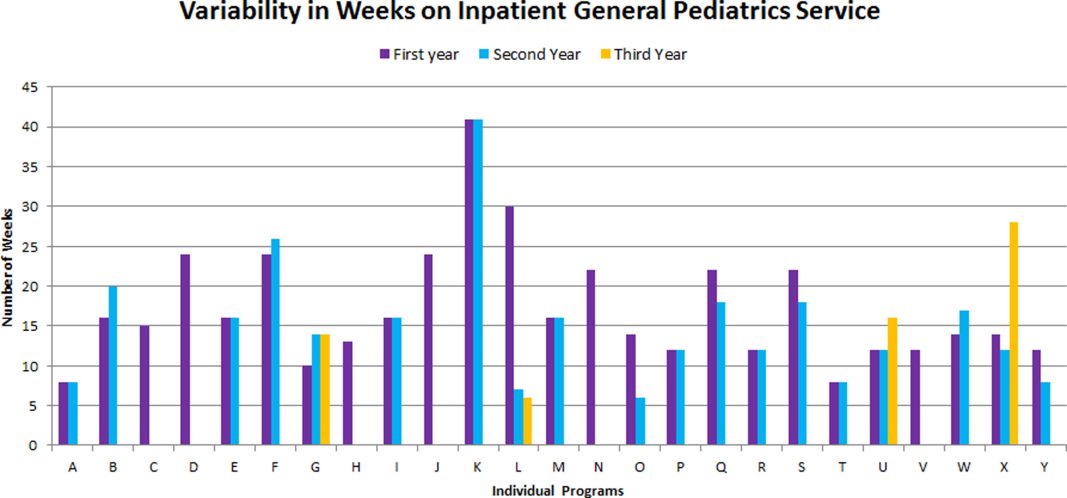
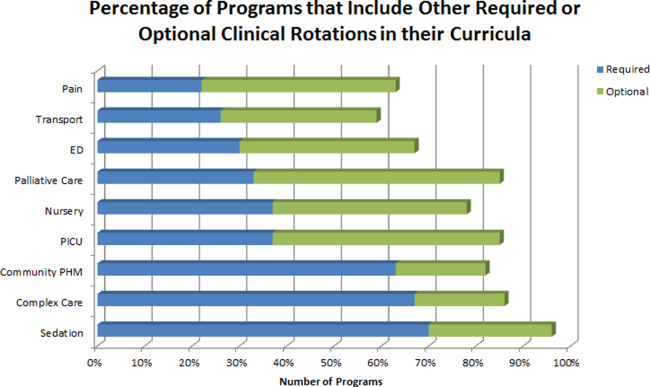
Fellow Scholarly Activities
With respect to time dedicated to research, the majority of programs offer coursework such as courses for credit, noncredit courses, or certificate courses. In addition, 11 programs offer fellows a masters' degree in areas including public health, clinical science, epidemiology, education, academic sciences, healthcare quality, clinical and translational research, or health services administration. The majority of these degrees are paid for by departmental funds, with tuition reimbursement, university support, training grants, and personal funds making up the remainder. Twenty‐one (81%) programs provide a scholarship oversight committee for their fellows. Current fellows' (n = 63) primary areas of research are varied and include clinical research (36%), quality‐improvement research (22%), medical education research (20%), health services research (16%), and other areas (6%).
DISCUSSION
This is the most comprehensive description of pediatric hospital medicine fellowship curricula to date. Understanding the scope of these programs is an important first step in developing a standardized curriculum that can be used by all. The results of this survey indicate that although there is variability among PHM fellowship curricular content, several common themes exist.
The number of clinical weeks on the inpatient general pediatrics service varied from program to program, though the majority of programs require fellows to spend 15 to 16 weeks each year of training. The variability may be due in part to the way in which respondents defined the term week on clinical service. For example, if the fellow is primarily on a shift schedule, then he/she may only work 2 to 3 shifts in 1 week, which may have been viewed similarly to daily presence on a more traditional inpatient teaching service with 5 to 7 consecutive days of service. The current study did not explore the details of inpatient general pediatric clinical activities or exposure to opportunities to hone procedural skills, areas that are worth investigating as we move forward to better understand the needs of trainees.
Most residency training programs in general pediatrics require a significant amount of inpatient clinical time, specifically a minimum of 10 units or months, though only half of this time is required to be in inpatient general pediatrics.[8] Although nonfellowship trained early career hospitalists may feel adequately prepared to manage the clinical care of some hospitalized children, perceived competency is significantly lower than their fellowship‐trained colleagues with regard to care of the child with medical complexity and technology‐dependence, and with regard to provision of sedation for procedures.[7] The majority of FDs surveyed in our study indicated that additional clinical experience with sedation, complex care, and inpatient pediatrics at community sites were required of their fellows. Of note, many of these rotations are not commonly required in pediatric residency training programs; however, the PHM core competencies suggest that hospitalists should demonstrate proficiency in these areas to provide optimal care for hospitalized children. Our results suggest that current PHM fellowship curricula help address these clinical gaps. The requirement of these particular specialized experiences may reflect the clinical scope of practice that is expected from potential employers or may be related to staffing needs. It is well documented that the inpatient demographic of large pediatric tertiary care referral centers has changed over the past decade, with an increasing prevalence of children with medical complexity.[9, 10] In both tertiary referral centers and community hospitals, the expansion of the role of the hospitalist in providing specialized clinical services, such as sedation or surgical comanagement, has been significantly driven by financial factors, though a more recent focus on improvement of efficiency and quality of care within the hospital system has relied heavily on hospitalist input.[11, 12, 13] Important next steps in curriculum standardization include ensuring that training programs allow for adequate clinical exposure and proper assessment of competency in these areas, and determining the full complement of clinical training experiences that will produce hospitalists with a well‐defined scope of practice that adequately addresses the needs of hospitalized children.
Most fellowship‐trained hospitalists work primarily in university‐affiliated institutions with expectations for scholarly productivity.[5, 7] Fellowship‐trained hospitalists have made large contributions to the growing body of PHM literature, specifically in the realms of medical education, healthcare quality, clinical pediatrics, and healthcare outcomes.[4] Many PHM fellowship‐trained hospitalists have educational or administrative leadership roles.[2] Our results indicate that current PHM fellows continue to be active in a variety of research activities. In addition, FDs reported that the vast majority of programs included scholarship oversight committees, which ensure a mentored and structured research experience. Finally, most programs require or offer additional coursework, and many programs with university affiliations allow for attainment of graduate degrees. Inclusion of robust research training and infrastructure in all programs is a paramount goal of PHM fellowship training. This will allow graduates to be successful researchers, generating new knowledge and supporting the provision of high‐quality, evidence‐based, and value‐driven care for hospitalized children.
A unique feature of several PHM fellowship programs is that fellows are allowed to bill for clinical encounters. Many programs rely on clinical revenue to support fellow salaries.[14] For some programs, a portion of this clinical revenue comes from fellows billing for clinical encounters.[15] Programs that allow fellows to bill/generate clinical revenue have fellows working in attending roles without direct supervision, whereas nonbilling fellows have direct supervision by an attending.[15] In the current ABP training model, subspecialty fellows cannot independently bill for clinical encounters within their own subspecialty, though they can moonlight as long as they meet the duty hour requirements set forth by the ACGME.[16] FDs will need to consider the impact of this requirement on fellow autonomy and on financial revenue for funding fellow salaries if the field achieves ABP subspecialty status.
Regardless of whether or not PHM becomes a designated subspecialty of the ABP, FDs will continue to work together to develop a standard core curriculum that incorporates elements of clinical and nonclinical training to ensure that graduates not only provide high‐quality care for hospitalized children, but also generate new knowledge that advances the field in care delivery and quality of care in any setting. The results of this study will not only help to inform curriculum standardization, but also assessment and evaluation methods. Currently, PHM FDs meet annually and are nearing consensus on a standard 2‐year curriculum based on the PHM Core Competencies that incorporates core clinical, systems, and scholarly domains. We continue to solicit the input of stakeholders, including new FDs, community hospitalist leaders, internal medicine‐pediatrics hospitalist leaders, the Joint Council of Pediatric Hospital Medicine, and leaders of national organizations, such as the American Academy of Pediatrics, Academic Pediatrics Association, and Society of Hospital Medicine. Additional work around standardizing the fellowship application and recruitment process has resulted in our recent acceptance into the Fall Subspecialty Match through the National Residency Match Program, as well as development and implementation of a common fellowship application form. The FD group has recently formalized, voting into place an executive steering committee, which is responsible for the development and execution of long‐term goals that include finalizing a standardized curriculum, refining program and fellow assessment methods through critical evaluation of fellow metrics and outcomes, and standardization of evaluation methods.
Adopting a standard 2‐year curriculum may affect some programs, specifically those that are currently 1 year in duration. These programs would need to extend the length of their fellowship to allow for the breadth of experiences expected with a standardized 2‐year curriculum. This could result in significant financial challenges, effectively increasing the cost to administer the program. In addition, at present, programs have the flexibility to highlight individual areas of strength to attract candidates, allowing fellows to gain an in‐depth experience in domains such as clinical research, quality improvement, medical education, or health services research. With a standardized curriculum, some programs may have to assemble specific clinical and nonclinical experiences to meet the agreed‐upon expectations for PHM fellowship training. If these resources are not available, programs may need to seek relationships with other institutions to complete their offerings, a possibility that is being actively explored by this group. FDs continue to work with each other to share resources, identify training opportunities, and partner with each other to ensure that the requirements of a standard curriculum can be met.
This study has several limitations. First, it was a voluntary survey of program directors, and though we captured over 80% of programs at the time of the survey, there are currently more programs that have come into existence and more still that are in the development stage, leading to potential sampling error. Second, variable effort or accuracy by participants may have led to some degree of response error, such as content error or nonreporting error. Third, the survey questions focused on high‐level information, making it difficult to make nuanced comparisons between curricular elements or determine best curricular practice. In addition, this survey did not explore medical education and quality improvement activities of fellows, 2 major areas in which hospitalists play a major role in the inpatient setting.[1, 17, 18, 19, 20]
CONCLUSION
PHM fellowship programs have grown and continue to grow at a rapid rate. Variability in training is evident, both in clinical experiences and research experiences, though several common elements were identified in this study. The majority of programs are 2 years, and clinical experience comprises approximately 50% of training time, often including key rotations such as sedation, complex care, and rotations at community hospitals. Future directions include standardizing clinical training and expectations for scholarship, formulating appropriate methods for assessment of competency that can be used across programs, and seeking sustainable sources of funding.
Disclosure
Nothing to report.
- , . Characteristics of pediatric hospital medicine fellowships and training programs. J Hosp Med. 2009;4(3):157–163.
- , . Pediatric hospitalists in medical education: current roles and future directions. Curr Probl Pediatr Adolesc Health Care. 2012;42(5):120–126.
- , , . Research needs of pediatric hospitalists. Hosp Pediatr. 2011;1(1):38–44.
- , , , . Pediatric hospital medicine fellowships: outcomes and future directions. Paper presented at: Pediatric Hospital Medicine 2014; July 26, 2014; Orlando, FL.
- , , . Pediatric hospitalist research productivity: predictors of success at presenting abstracts and publishing peer‐reviewed manuscripts among pediatric hospitalists. Hosp Pediatr. 2012;2(3):149–160.
- , , . Pediatric hospital medicine core competencies: development and methodology. J Hosp Med. 2010;5:339–343.
- , , , . Perceived core competency achievements of fellowship and non‐fellowship early career pediatric hospitalists. J Hosp Med. 2015;10(6):373–389.
- Accreditation Council of Graduate Medical Education. ACGME program requirements for graduate medical education in pediatrics. Available at: https://www.acgme.org/acgmeweb/Portals/0/PFAssets/2013‐PR‐FAQ‐PIF/320_pediatrics_07012013.pdf. Published September 30, 2012. Accessed July 7, 2015.
- , , , , , . Increasing prevalence of medically complex children in US hospitals. Pediatrics. 2010;126(4):638–646.
- , , , et al. Children with complex chronic conditions in inpatient hospital settings in the United States. Pediatrics. 2010;126(4):647–655.
- , . The expanding role of hospitalists in the United States. Swiss Med Wkly. 2006;136:591–596.
- , , , , , . Pediatric hospitalist comanagement of spinal fusion surgery patients. J Hosp Med. 2007;2(1):23–30.
- , , , , . Development of a pediatric hospitalist sedation service: training and implementation. J Hosp Med. 2012;7(4):335–339.
- , . Sources of funding and support for pediatric hospital medicine fellowship programs. Poster presented at: Pediatric Hospital Medicine 2014; July 27, 2014; Orlando, FL.
- Council of Pediatric Hospital Medicine Fellowship Directors. Pediatric Hospital Medicine Fellowship Directors Annual Meeting: funding and return on investment. July 24, 2014.
- Accreditation Council of Graduate Medical Education. Frequently asked questions: ACGME common duty hour requirements. Available at: https://www.acgme.org/acgmeweb/Portals/0/PDFs/dh‐faqs2011.pdf. Updated June 18, 2014. Accessed July 7, 2015.
- , . Pediatric hospitalists: training, current practice and career goals. J Hosp Med. 2009;4(3):179–186.
- , . The hospitalist movement and its implications for the care of hospitalized children. Pediatrics. 1999;103:473–477.
- . Pediatric hospitalists and medical education. Pediatr Ann. 2014;43(7):e151–e156
- , , , et al. Quality improvement research in pediatric hospital medicine and the role of the Pediatric Research in Inpatient Settings (PRIS) network. Acad Pediatr. 2013;13(6):S54–S60.
Pediatric hospital medicine (PHM) fellowship programs came into existence approximately 20 years ago in Canada,[1] and since that time the number of programs in North America has grown dramatically. The first 3 PHM fellowship programs in the United States were initiated in 2003, and by 2008 there were 7 active programs. Just 5 years later in 2013, there were 20 fellowship programs in existence. Now, in 2015, there are over 30 programs, with several more in development. The goal of postresidency training in PHM is to improve the care of hospitalized children by training future hospitalists to provide high‐quality, evidence‐based clinical care and to generate new knowledge and scholarship in areas such as clinical research, patient safety and quality improvement, medical education, practice management, and patient outcomes.[2] Many pediatric hospitalists want to be able to perform research or quality improvement, but feel that they lack the time, skills, resources, and mentorship to do so.[3] To date, fellowship‐trained hospitalists have a demonstrated track record of contributing to the body of literature that is shaping the care of hospitalized children.[4, 5]
At present, PHM is not a recognized subspecialty of the American Board of Pediatrics (ABP) and therefore does not fall under the purview of the Accreditation Council of Graduate Medical Education (ACGME), leading to concern from some about the variability in depth and breadth of training across programs.[1] The development and publication of the PHM Core Competencies in 2010 helped define the scope of practice of pediatric hospitalists and provide guidelines for training programs, specifically with respect to clinical and nonclinical areas for assessment of competency.[6] Furthermore, studies of early career hospitalists have identified areas for future fellowship curriculum development, such as core procedural skills, quality improvement, and practice management.[7]
In an effort to address training variability across programs, PHM fellowship directors (FDs) have come together as an organized group, first meeting in 2008, with the primary goal of defining training standards and sharing curricular resources. Annual meetings of the FDs, sponsored by the American Academy of Pediatrics Section on Hospital Medicine (AAP‐SOHM), began in 2012. A key objective of this annual meeting has been to develop a standardized fellowship curriculum for use across programs as well as to determine gaps in training that need to be addressed. During this process, we have received input from key stakeholders including community hospitalists, internal medicine‐pediatrics hospitalists, and the PHM Certification Steering Committee, which organized the application for subspecialty certification to the ABP. To inform this process of curriculum standardization, we fielded a survey of PHM fellowship directors. The purpose of this article is to summarize the current curricula, operations, and logistics of PHM fellowship programs.
METHODS
This was a cross‐sectional study of 31 PHM fellowship programs across the United States and Canada in April 2014. Inclusion criteria included all pediatric fellowships that were self‐identified to the AAP‐SOHM as providing a hospital medicine fellowship option. This included both PHM fellowships as well as academic general pediatric fellowships with a hospitalist track. A web‐based survey (SurveyMonkey, Inc.) was distributed by e‐mail to the FDs at the 31 training programs (see Supporting Information in the online version of this article). To enhance content validity of survey responses, survey questions were designed using an iterative consensus process among the authors, who included junior and senior FDs and represented the 2014 annual FD meeting planning committee. Items were created to gather feedback on the following key areas of PHM fellowships: program demographics, types of required and elective clinical rotations, graduate coursework offerings, amount of time spent in clinical activities, fellow billing practices, and description of fellows' research activities. The survey consisted of 30 multiple‐choice and short‐answer questions. Follow‐up e‐mail reminders were sent to all FDs 2 weeks and 4 weeks after the initial request was sent. Survey completion was voluntary, and no incentives were offered. The study was determined to be exempt by the Stanford University Institutional Review Board. Data were summarized using frequency distributions. No subgroup comparisons were made.
RESULTS
Program directors from 27/31 (87%) PHM fellowship programs responded to the survey; 25 were active programs, and 2 were under development. Responding programs represented all 4 major regions of the country and Canada, with varying program initiation dates, ranging from 1997 to 2013.
Program Demographics
The duration of most programs (17/27) was 2 years (63%), with 6 (22%) 1‐year programs and 4 (15%) 3‐year programs making up the remainder. Four programs described variable lengths, which could be tailored based on the fellow's individual interest. Two of the programs are 2 years in length, but offer a 1‐year option for fellows who wish to focus on enhancing clinical skills without an academic focus. The other 2 programs are 2 years in length, but will offer an extension to a third year for those pursuing a graduate degree.
Fellow Clinical Activities
The average amount of total clinical time (weeks on service) across responding programs was 50% (range, 20%65%). When looking specifically at time on the inpatient general pediatric service, number of weeks varied by year of training and by institution, with 12 to 41 weeks in the first year of fellowship, 6 to 41 weeks in the second year of fellowship, and 6 to 28 weeks in the third year of fellowship (Figure 1). Though the range is large, on average, fellows spend 17 weeks on inpatient general pediatrics service during each year of training. Of note, the median number of weeks on inpatient general pediatrics service by year of training was 15 weeks, 16 weeks, and 16.5 weeks, respectively. In addition to inpatient general pediatrics service time, most programs require other clinical rotations, with sedation, complex care, and inpatient pediatrics at community sites being the most frequent (Figure 2). Of the 6 responding 1‐year programs, 5 (83%) allow fellows to bill/generate clinical revenue at some point during their training. Of the 15 responding 2‐year programs, 11 (73%) allow fellows to bill/generate clinical revenue at some point during their training. Of the 4 responding 3‐year programs, 2 (50%) allow their fellows to bill/generate clinical revenue at some point during their training.
Fellow Scholarly Activities
With respect to time dedicated to research, the majority of programs offer coursework such as courses for credit, noncredit courses, or certificate courses. In addition, 11 programs offer fellows a masters' degree in areas including public health, clinical science, epidemiology, education, academic sciences, healthcare quality, clinical and translational research, or health services administration. The majority of these degrees are paid for by departmental funds, with tuition reimbursement, university support, training grants, and personal funds making up the remainder. Twenty‐one (81%) programs provide a scholarship oversight committee for their fellows. Current fellows' (n = 63) primary areas of research are varied and include clinical research (36%), quality‐improvement research (22%), medical education research (20%), health services research (16%), and other areas (6%).
DISCUSSION
This is the most comprehensive description of pediatric hospital medicine fellowship curricula to date. Understanding the scope of these programs is an important first step in developing a standardized curriculum that can be used by all. The results of this survey indicate that although there is variability among PHM fellowship curricular content, several common themes exist.
The number of clinical weeks on the inpatient general pediatrics service varied from program to program, though the majority of programs require fellows to spend 15 to 16 weeks each year of training. The variability may be due in part to the way in which respondents defined the term week on clinical service. For example, if the fellow is primarily on a shift schedule, then he/she may only work 2 to 3 shifts in 1 week, which may have been viewed similarly to daily presence on a more traditional inpatient teaching service with 5 to 7 consecutive days of service. The current study did not explore the details of inpatient general pediatric clinical activities or exposure to opportunities to hone procedural skills, areas that are worth investigating as we move forward to better understand the needs of trainees.
Most residency training programs in general pediatrics require a significant amount of inpatient clinical time, specifically a minimum of 10 units or months, though only half of this time is required to be in inpatient general pediatrics.[8] Although nonfellowship trained early career hospitalists may feel adequately prepared to manage the clinical care of some hospitalized children, perceived competency is significantly lower than their fellowship‐trained colleagues with regard to care of the child with medical complexity and technology‐dependence, and with regard to provision of sedation for procedures.[7] The majority of FDs surveyed in our study indicated that additional clinical experience with sedation, complex care, and inpatient pediatrics at community sites were required of their fellows. Of note, many of these rotations are not commonly required in pediatric residency training programs; however, the PHM core competencies suggest that hospitalists should demonstrate proficiency in these areas to provide optimal care for hospitalized children. Our results suggest that current PHM fellowship curricula help address these clinical gaps. The requirement of these particular specialized experiences may reflect the clinical scope of practice that is expected from potential employers or may be related to staffing needs. It is well documented that the inpatient demographic of large pediatric tertiary care referral centers has changed over the past decade, with an increasing prevalence of children with medical complexity.[9, 10] In both tertiary referral centers and community hospitals, the expansion of the role of the hospitalist in providing specialized clinical services, such as sedation or surgical comanagement, has been significantly driven by financial factors, though a more recent focus on improvement of efficiency and quality of care within the hospital system has relied heavily on hospitalist input.[11, 12, 13] Important next steps in curriculum standardization include ensuring that training programs allow for adequate clinical exposure and proper assessment of competency in these areas, and determining the full complement of clinical training experiences that will produce hospitalists with a well‐defined scope of practice that adequately addresses the needs of hospitalized children.
Most fellowship‐trained hospitalists work primarily in university‐affiliated institutions with expectations for scholarly productivity.[5, 7] Fellowship‐trained hospitalists have made large contributions to the growing body of PHM literature, specifically in the realms of medical education, healthcare quality, clinical pediatrics, and healthcare outcomes.[4] Many PHM fellowship‐trained hospitalists have educational or administrative leadership roles.[2] Our results indicate that current PHM fellows continue to be active in a variety of research activities. In addition, FDs reported that the vast majority of programs included scholarship oversight committees, which ensure a mentored and structured research experience. Finally, most programs require or offer additional coursework, and many programs with university affiliations allow for attainment of graduate degrees. Inclusion of robust research training and infrastructure in all programs is a paramount goal of PHM fellowship training. This will allow graduates to be successful researchers, generating new knowledge and supporting the provision of high‐quality, evidence‐based, and value‐driven care for hospitalized children.
A unique feature of several PHM fellowship programs is that fellows are allowed to bill for clinical encounters. Many programs rely on clinical revenue to support fellow salaries.[14] For some programs, a portion of this clinical revenue comes from fellows billing for clinical encounters.[15] Programs that allow fellows to bill/generate clinical revenue have fellows working in attending roles without direct supervision, whereas nonbilling fellows have direct supervision by an attending.[15] In the current ABP training model, subspecialty fellows cannot independently bill for clinical encounters within their own subspecialty, though they can moonlight as long as they meet the duty hour requirements set forth by the ACGME.[16] FDs will need to consider the impact of this requirement on fellow autonomy and on financial revenue for funding fellow salaries if the field achieves ABP subspecialty status.
Regardless of whether or not PHM becomes a designated subspecialty of the ABP, FDs will continue to work together to develop a standard core curriculum that incorporates elements of clinical and nonclinical training to ensure that graduates not only provide high‐quality care for hospitalized children, but also generate new knowledge that advances the field in care delivery and quality of care in any setting. The results of this study will not only help to inform curriculum standardization, but also assessment and evaluation methods. Currently, PHM FDs meet annually and are nearing consensus on a standard 2‐year curriculum based on the PHM Core Competencies that incorporates core clinical, systems, and scholarly domains. We continue to solicit the input of stakeholders, including new FDs, community hospitalist leaders, internal medicine‐pediatrics hospitalist leaders, the Joint Council of Pediatric Hospital Medicine, and leaders of national organizations, such as the American Academy of Pediatrics, Academic Pediatrics Association, and Society of Hospital Medicine. Additional work around standardizing the fellowship application and recruitment process has resulted in our recent acceptance into the Fall Subspecialty Match through the National Residency Match Program, as well as development and implementation of a common fellowship application form. The FD group has recently formalized, voting into place an executive steering committee, which is responsible for the development and execution of long‐term goals that include finalizing a standardized curriculum, refining program and fellow assessment methods through critical evaluation of fellow metrics and outcomes, and standardization of evaluation methods.
Adopting a standard 2‐year curriculum may affect some programs, specifically those that are currently 1 year in duration. These programs would need to extend the length of their fellowship to allow for the breadth of experiences expected with a standardized 2‐year curriculum. This could result in significant financial challenges, effectively increasing the cost to administer the program. In addition, at present, programs have the flexibility to highlight individual areas of strength to attract candidates, allowing fellows to gain an in‐depth experience in domains such as clinical research, quality improvement, medical education, or health services research. With a standardized curriculum, some programs may have to assemble specific clinical and nonclinical experiences to meet the agreed‐upon expectations for PHM fellowship training. If these resources are not available, programs may need to seek relationships with other institutions to complete their offerings, a possibility that is being actively explored by this group. FDs continue to work with each other to share resources, identify training opportunities, and partner with each other to ensure that the requirements of a standard curriculum can be met.
This study has several limitations. First, it was a voluntary survey of program directors, and though we captured over 80% of programs at the time of the survey, there are currently more programs that have come into existence and more still that are in the development stage, leading to potential sampling error. Second, variable effort or accuracy by participants may have led to some degree of response error, such as content error or nonreporting error. Third, the survey questions focused on high‐level information, making it difficult to make nuanced comparisons between curricular elements or determine best curricular practice. In addition, this survey did not explore medical education and quality improvement activities of fellows, 2 major areas in which hospitalists play a major role in the inpatient setting.[1, 17, 18, 19, 20]
CONCLUSION
PHM fellowship programs have grown and continue to grow at a rapid rate. Variability in training is evident, both in clinical experiences and research experiences, though several common elements were identified in this study. The majority of programs are 2 years, and clinical experience comprises approximately 50% of training time, often including key rotations such as sedation, complex care, and rotations at community hospitals. Future directions include standardizing clinical training and expectations for scholarship, formulating appropriate methods for assessment of competency that can be used across programs, and seeking sustainable sources of funding.
Disclosure
Nothing to report.
- , . Characteristics of pediatric hospital medicine fellowships and training programs. J Hosp Med. 2009;4(3):157–163.
- , . Pediatric hospitalists in medical education: current roles and future directions. Curr Probl Pediatr Adolesc Health Care. 2012;42(5):120–126.
- , , . Research needs of pediatric hospitalists. Hosp Pediatr. 2011;1(1):38–44.
- , , , . Pediatric hospital medicine fellowships: outcomes and future directions. Paper presented at: Pediatric Hospital Medicine 2014; July 26, 2014; Orlando, FL.
- , , . Pediatric hospitalist research productivity: predictors of success at presenting abstracts and publishing peer‐reviewed manuscripts among pediatric hospitalists. Hosp Pediatr. 2012;2(3):149–160.
- , , . Pediatric hospital medicine core competencies: development and methodology. J Hosp Med. 2010;5:339–343.
- , , , . Perceived core competency achievements of fellowship and non‐fellowship early career pediatric hospitalists. J Hosp Med. 2015;10(6):373–389.
- Accreditation Council of Graduate Medical Education. ACGME program requirements for graduate medical education in pediatrics. Available at: https://www.acgme.org/acgmeweb/Portals/0/PFAssets/2013‐PR‐FAQ‐PIF/320_pediatrics_07012013.pdf. Published September 30, 2012. Accessed July 7, 2015.
- , , , , , . Increasing prevalence of medically complex children in US hospitals. Pediatrics. 2010;126(4):638–646.
- , , , et al. Children with complex chronic conditions in inpatient hospital settings in the United States. Pediatrics. 2010;126(4):647–655.
- , . The expanding role of hospitalists in the United States. Swiss Med Wkly. 2006;136:591–596.
- , , , , , . Pediatric hospitalist comanagement of spinal fusion surgery patients. J Hosp Med. 2007;2(1):23–30.
- , , , , . Development of a pediatric hospitalist sedation service: training and implementation. J Hosp Med. 2012;7(4):335–339.
- , . Sources of funding and support for pediatric hospital medicine fellowship programs. Poster presented at: Pediatric Hospital Medicine 2014; July 27, 2014; Orlando, FL.
- Council of Pediatric Hospital Medicine Fellowship Directors. Pediatric Hospital Medicine Fellowship Directors Annual Meeting: funding and return on investment. July 24, 2014.
- Accreditation Council of Graduate Medical Education. Frequently asked questions: ACGME common duty hour requirements. Available at: https://www.acgme.org/acgmeweb/Portals/0/PDFs/dh‐faqs2011.pdf. Updated June 18, 2014. Accessed July 7, 2015.
- , . Pediatric hospitalists: training, current practice and career goals. J Hosp Med. 2009;4(3):179–186.
- , . The hospitalist movement and its implications for the care of hospitalized children. Pediatrics. 1999;103:473–477.
- . Pediatric hospitalists and medical education. Pediatr Ann. 2014;43(7):e151–e156
- , , , et al. Quality improvement research in pediatric hospital medicine and the role of the Pediatric Research in Inpatient Settings (PRIS) network. Acad Pediatr. 2013;13(6):S54–S60.
© 2016 Society of Hospital Medicine

AMI and Heavy Drinking
Moderate alcohol consumption has been associated with lower risk of coronary heart disease death.[1, 2, 3] This benefit has been shown across all age groups, both sexes, in low‐risk patients (without prior cardiovascular disease [CVD], diabetics and even in patients with established CVD.[3, 4, 5, 6, 7, 8, 9, 10, 11, 12] The relationship between the dose of alcohol and total mortality has been depicted in many observational studies as a J‐shaped curve, attributed to a combined effect of both benefits and harms.[3, 4, 13] Unlike moderate drinking, heavy drinking and particularly binge drinking may have net negative cardiovascular effects. For example, higher levels of intake of alcohol were associated with increased mortality in men with previous myocardial infarction,[14] whereas some reports suggest a continued beneficial association with acute myocardial infarction (AMI).[15, 16, 17] In other studies, the association between AMI and binge or chronic heavy drinking is inconsistent or lacks enough power to report the risk/benefit estimates.[3] Data are sparse on the effects of alcoholism on outcomes in patients hospitalized due to an AMI. Therefore, we sought to investigate the prevalence and association of alcohol‐related diagnoses with in‐hospital mortality in patients presenting with AMI in the United States.
METHODS
This study was a cross‐sectional analysis of the 2011 Nationwide Inpatient Sample (NIS). The NIS is a publicly available deidentified database of hospital discharges in the United States.[18] It contains data from approximately 8 million hospital stays that were selected using a complex probability sampling design and weighting scheme intended to represent all discharges from nonfederal hospitals in the United States. Each record includes 1 primary diagnosis and up to 24 secondary diagnoses.
Analysis was conducted for all patients aged 21 years and greater with a primary discharge diagnosis of AMI based on International Classification of Diseases, 9th Revision (ICD‐9) codes. ST‐elevation myocardial infarction (STEMI) and nonST‐elevation myocardial infarction (NSTEMI) were recorded when the principal diagnosis included the appropriate ICD‐9 codes (see Supporting Table 1 in the online version of this article). Alcohol‐related diagnosis was categorized as the presence of alcohol use disorders or other chronic conditions caused by heavy drinking such as alcoholic cardiomyopathy and alcoholic liver disease among others. Variables reflecting acute effects and chronic effects of alcohol use were created for analytic purposes. Acute effects that increase the risk for acute withdrawal syndrome and hemodynamic instability (and may thereby effect mortality) were characterized by alcohol withdrawal, acute alcoholic hepatitis, alcoholic gastritis, or acute alcohol intoxication. Chronic effects of alcohol were characterized by alcohol dependence, alcoholic polyneuropathy, alcoholic cardiomyopathy, or alcoholic liver damage other than acute hepatitis. A number of comorbidities were generated from ICD‐9 codes including smoking, chronic liver disease, peripheral vascular disease, hypertension, diabetes, renal failure, drug abuse, arrhythmia, and gastrointestinal bleeding using Clinical Classification Software codes provided by the Healthcare Cost and Utilization Project, Agency for Healthcare Research and Quality[19] (see Supporting Table 1 in the online version of this article).
The risk for alcohol‐related diagnoses in AMI patients adjusting for age and sex was estimated using all adult discharge records. All other analyses included only AMI discharges. The principal outcome measure was in‐hospital mortality. Secondary outcomes included having a cardiac procedure (diagnostic catheterization, percutaneous coronary angioplasty, or coronary bypass grafting), and length of stay.
All statistical analyses were performed using Statistical Analysis Software version 9.4 (SAS Inc., Cary, NC). Logistic regression methods appropriate for the NIS sample design were utilized to predict AMI mortality risk associated with alcohol‐related diagnoses (overall and separately for acute and chronic alcohol‐related diagnoses). Mortality risk was evaluated in all AMI discharges and again for STEMI and NSTEMI discharges. To control for factors frequently associated with alcoholism, adjustment was made for age, sex, liver disease, hypertension, diabetes, renal failure, peripheral vascular disease, arrhythmias, drug abuse, gastrointestinal bleed, and smoking. For secondary outcomes, odds ratios were calculated for having a cardiac procedure performed during the hospital admission and length of stay above the median.
RESULTS
Table 1 lists characteristics of AMI patients stratified by in‐hospital mortality. In 2011, AMI accounted for 610,963 (1.9%) of overall adult hospital admissions, with an in‐hospital mortality of 5.3%. Thirty‐two percent were STEMI admissions and 68% were NSTEMI admissions with in‐hospital mortality of 8.5% and 3.8%, respectively. Patients with alcohol‐related diagnoses comprised 18,684 (3.1%) of all AMI admissions. This prevalence was significantly lower relative to non‐AMI admissions (4.9%), even after age and sex adjustment (adjusted odds ratio [OR]: 0.7, 95% confidence interval [CI]: 0.6‐0.7, P 0.001).
| Variables | AMI, In‐hospital Death | AMI, Alive at Discharge | P Value |
|---|---|---|---|
| |||
| No. | 32,399 (5.3) | 578,564 (94.7) | 0.0001 |
| Age, y (SD) | 76 (7577) | 67 (6668) | |
| Sex | |||
| Males | 17,483 (54) | 352,943 (61) | 0.0001 |
| Females | 14,916 (46) | 225,621 (39) | 0.0001 |
| Race | |||
| White | 22,517 (70) | 387,816 (67) | 0.0001 |
| Black | 2,580 (7.9) | 56,735 (9.8) | 0.0001 |
| Hispanic | 2,002 (6.1) | 41,399 (7.2) | 0.0001 |
| Asian | 685 (2) | 11,160 (1.9) | 0.0001 |
| Native American | 146 (0.3) | 2,240 (0.4) | 0.0001 |
| Others | 991 (3) | 17,711 (3.2) | 0.0001 |
| Unspecified | 3,478 (10.7) | 61,503 (10.5) | 0.0001 |
| STEMI | 16,437 (50.7) | 177,240 (30.6) | 0.0001 |
| NSTEMI | 15,962 (49.3) | 401,324 (69.4) | 0.0001 |
| Alcohol diagnoses | |||
| Acute drinking | 110 (0.3) | 2,615 (0.5) | 0.1389 |
| Chronic drinking | 816 (2.5) | 15,143 (2.6) | 0.2473 |
| Comorbidities | |||
| Diabetes mellitus | 11,497 (35.5) | 211,321 (36.5) | 0.5963 |
| Hypertension | 20,068 (61.9) | 411,853 (71.2) | 0.0001 |
| Peripheral vascular disease | 4,962 (15.3) | 70,024 (12.1) | 0.0001 |
| Renal failure | 9,929 (30.6) | 113,714 (19.7) | 0.0001 |
| Drug abuse | 330 (1.0) | 13,263 (2.3) | 0.0001 |
| Arrhythmias | 14,977 (46.2) | 167,286 (28.9) | 0.0001 |
| Liver disease | 442 (1.4) | 6,493 (1.1) | 0.0753 |
| Smoking history | 6,736 (20.8) | 210,205 (36.3) | 0.0001 |
| Gastrointestinal bleed | 1,982 (6.1) | 12,086 (2.1) | 0.0001 |
Table 2 lists the characteristics of AMI patients stratified by alcohol status. Patients with alcohol‐related disorders presenting with AMI were younger, overwhelmingly male, and had a higher prevalence of the following comorbid conditions: drug abuse, liver disease, gastrointestinal bleeding, and smoking history. They had a lower prevalence of diabetes, hypertension, and renal failure.
| Variables | Alcohol‐Related Diagnoses | No Alcohol‐Related Diagnoses | P Value |
|---|---|---|---|
| |||
| No. | 18,684 (3.1) | 592,279 (96.9) | 0.0001 |
| Age, y, mean | 59 (5860) | 68 (6769) | 0.0001 |
| Sex | |||
| Males | 16,315 (87.3) | 354,051 (59.8) | 0.0001 |
| Females | 2,369 (12.7) | 238,228 (40.2) | 0.0001 |
| Race | |||
| White | 11,917 (63.8) | 398,766 (67.2) | 0.0001 |
| Black | 2,613 (13.9) | 56,723 (9.6) | 0.0001 |
| Hispanic | 1,400 (7.5) | 42,052 (7.1) | 0.0001 |
| Asian | 125 (0.7) | 11,724 (1.9) | 0.0001 |
| Native American | 165 (0.9) | 2,221 (0.4) | 0.0001 |
| Others | 570 (2.9) | 18,139 (3.2) | 0.0001 |
| Unspecified | 1,894 (10.1) | 62,654 (10.6) | 0.0001 |
| STEMI | 6,541 (35.1) | 187,136 (31.2) | 0.0001 |
| NSTEMI | 12,143 (64.9) | 405,143 (68.8) | 0.0001 |
| Died | 881 (4.7) | 31,518 (5.3) | 0.1312 |
| Comorbidities | |||
| Diabetes mellitus | 4,663 (24.9) | 218,446 (36.8) | 0.0001 |
| Hypertension | 12,501 (66.8) | 420,001 (70.8) | 0.0001 |
| Peripheral vascular disease | 2,269 (12.1) | 72,773 (12.3) | 0.7987 |
| Renal failure | 1,937 (10.4) | 121,925 (20.6) | 0.0001 |
| Drug abuse | 2,894 (15.5) | 10,708 (1.8) | 0.0001 |
| Arrhythmias | 5,476 (29.3) | 177,088 (29.9) | 0.4076 |
| Liver disease | 887 (4.7) | 6,053 (1.0) | 0.0001 |
| Smoking history | 12,771 (68.3) | 204,390 (34.5) | 0.0001 |
| Gastrointestinal bleed | 730 (3.9) | 13,347 (2.3) | 0.0001 |
Among AMI patients, unadjusted in‐hospital mortality was observed to be similar in the alcohol use disorder group (4.7% vs 5.3%, P = 0.131), STEMI hospitalizations (7.9% vs 8.5%, P = 0.475), and lower in NSTEMI hospitalizations (3% vs 3.9%, P = 0.035). However, as shown in Table 2, there were a number of factors that may have influenced death in AMI patients that differed between those with and without alcohol diagnoses. Table 3 shows the adjusted risk for death and each secondary outcome. After adjusting for factors associated with alcoholism, including age, sex, liver disease, hypertension, diabetes, renal failure, drug abuse, gastrointestinal bleed, and smoking, alcohol‐related diagnoses were associated with increased mortality in AMI hospitalizations (adjusted OR: 1.5, 95% CI: 1.2‐1.7, P 0.001). Contrary to our expectations, however, acute alcohol‐related diagnoses were not independently associated with mortality. The association with alcohol‐related diagnoses was significant in both STEMI (adjusted OR: 1.7, 95% CI: 1.4‐2.2, P 0.001) and NSTEMI patients (adjusted OR: 1.3, 95% CI: 1.0‐1.7, P = 0.025).
| Adjusted Odds Ratio* | 95% Confidence Intervals | P Value | |
|---|---|---|---|
| |||
| Primary outcome: death | |||
| AMI | |||
| Alcohol diagnoses | 1.5 | 1.21.7 | 0.001 |
| Acute alcohol diagnoses | 1.0 | 0.71.5 | 0.886 |
| Chronic alcohol diagnoses | 1.5 | 1.21.8 | 0.001 |
| STEMI | |||
| Alcohol diagnoses | 1.7 | 1.42.2 | 0.001 |
| Acute alcohol diagnoses | 1.1 | 0.61.9 | 0.835 |
| Chronic alcohol diagnoses | 1.6 | 1.22.1 | 0.001 |
| NSTEMI | |||
| Alcohol diagnoses | 1.3 | 1.01.7 | 0.025 |
| Acute alcohol diagnoses | 1.2 | 0.72.1 | 0.581 |
| Chronic alcohol diagnoses | 1.4 | 1.11.9 | 0.022 |
| Secondary outcomes | |||
| AMI | |||
| Length of stay | 1.5 | 1.31.6 | 0.001 |
| All cardiac procedures | 0.6 | 0.60.7 | 0.001 |
| CABG | 1.2 | 1.01.3 | 0.008 |
| Angioplasty | 0.6 | 0.60.7 | 0.001 |
| Diagnostic angiogram | 0.7 | 0.60.8 | 0.001 |
| STEMI | |||
| Length of stay | 1.2 | 1.11.4 | 0.001 |
| All cardiac procedures | 0.6 | 0.50.7 | 0.001 |
| CABG | 1.2 | 0.91.5 | 0.125 |
| Angioplasty | 0.6 | 0.50.7 | 0.001 |
| Diagnostic angiogram | 0.7 | 0.60.9 | 0.001 |
| NSTEMI | |||
| Length of stay | 1.6 | 1.51.8 | 0.001 |
| All cardiac procedures | 0.7 | 0.60.8 | 0.001 |
| CABG | 1.1 | 0.91.5 | 0.125 |
| Angioplasty | 0.6 | 0.60.7 | 0.001 |
| Diagnostic angiogram | 0.7 | 0.60.8 | 0.001 |
Regarding secondary outcomes, alcohol‐related diagnoses were associated with an increased length of stay, fewer diagnostic catheterizations and angioplasties, but higher coronary artery bypass grafting (CABG) procedures (Table 3).
DISCUSSION
In this analysis of AMI discharges, a modestly increased risk of in‐hospital mortality was found for patients with alcohol‐related diagnoses, although AMI patients were less likely to have a diagnosis related to alcohol. This increased risk of in‐hospital mortality was present in both STEMI and NSTEMI patients with alcohol‐related diagnoses, and was present in patients with chronic alcohol‐related diagnoses but not with withdrawal or intoxication. In addition to mortality differences, AMI patients with alcohol‐related diagnoses had a higher length of stay, but were less likely to have a cardiac procedure.
The association of alcohol‐related diagnoses with cardiovascular outcomes is not as well defined as the beneficial association between coronary heart disease and moderate alcohol use. Heavy drinking has been associated with greater risk of sudden cardiac death in subjects with preexisting coronary heart disease.[20, 21] Data from the Nurses Health Study demonstrated a U‐shaped curve between alcohol use and sudden cardiac death, but with limited power for assessing heavy drinking patterns.[22] In the Physicians Health Study, there was no significant increase in the risk of sudden cardiac death in men with higher intake of alcohol (2 drinks/day), but again with limited power for evaluating truly heavy drinking.[23] More recently, as shown by Mukamal et al., there was a trend toward higher overall cardiovascular deaths (OR: 1.07, 95% CI: 0.94‐1.22) but lower coronary heart disease mortality (OR: 0.80, 95% CI: 0.61‐1.05) in heavy drinkers, but results were not statistically significant even after adjusting for age, sex, and race.[3] One study demonstrated that heavy episodic drinking within the preceding 24 hours was associated with an increased risk of myocardial infarction (OR: 1.4, 95% confidence interval: 1.1‐1.9), particularly in the elderly (>65 years old) (OR: 5.3, 95% CI: 1.6‐18),[24] but the study did not consider mortality. The more recent study done by Mostofsky et al. has shown higher incidence of AMI onset within 1 hour after alcohol consumption among people who are not daily drinkers,[25] but the study did not consider mortality outcomes.
As an extension of knowledge regarding the association of alcohol‐related diagnoses with cardiovascular outcomes, we believe that our analysis of the NIS is the first to show a statistically significant positive age‐adjusted association of in‐hospital mortality with alcohol‐related diagnoses in AMI patients. Episodic or binge drinking has been noted to have proarrhythmogenic effects leading to sudden cardiac death.[26] This would often occur prior to hospitalization, but once hospitalized the presence of rhythm abnormalities was not associated with alcohol diagnoses. Alcohol effects might also be expected to lead to increased AMI mortality due to autonomic instability, gastrointestinal bleeding, or liver disease, but intoxication, withdrawal, gastrointestinal bleeding, liver disease, or comorbid tobacco or drug abuse did not account for excess alcohol‐associated AMI mortality in this study. Additional research will be required to determine the reasons underlying the increased age‐adjusted mortality.
The important strength of the present study includes the use of a large national database that allowed us to link alcohol‐related diagnoses to AMI death in the hospital, and to explore potential confounders of this association (eg, gastrointestinal bleeding, withdrawal, liver disease). However, a number of limitations merit consideration. The NIS sampling frame is limited to hospital discharges. As such, we have no data on prehospital AMI death and alcohol use pattern immediately preceding hospitalization. Similarly, we were unable to consider mortality immediately beyond the hospital discharge. Other important predictors that are not recorded in the NIS are details regarding a patient's physical activity and medications such as statins and ‐blockers that could affect survivorship in AMI patients. Another potential limitation of our analysis is the lack of differentiating between type 2 myocardial infarction, occurring from sepsis or acute kidney injury, from a true NSTEMI. However, we included only primary discharge diagnoses of AMI, and results for STEMI and NSTEMI discharges were similar. Regarding the cross‐sectional study design, we are unable to establish a cause and effect relationship between in‐hospital AMI mortality and alcohol‐related diagnoses. The NIS data were abstracted from administrative databases that may lack important details on alcohol‐related problems. In particular, it seems likely that heavy drinkers with less obvious alcohol‐related problems would be underidentified in clinical settings, and this may have biased our results toward an overestimation of the alcohol‐associated risk. Due to these limitations, AMI mortality will need to be evaluated in other samples to definitively evaluate associations with diagnoses related to heavy drinking and determine the reasons underlying the association. The increased death and CABG despite decreased angiography and angioplasty suggests that these patients presentations may be with more severe coronary heart disease, which is a question requiring further study. Finally, an alcohol user who presents with an AMI is less likely to have cardiac risk factors like diabetes, renal failure, and possibly hypertension. Rather, alcohol diagnoses in AMI patients associate with tobacco and drug abuse, liver disease, and higher age‐adjusted risk for death. It is important for a practicing hospitalist to have a high index of suspicion for these atypical AMI patients.
CONCLUSION
Although alcohol‐related diagnoses are less commonly documented in AMI patients relative to other admission diagnoses, results of this study suggest that they independently predict in‐hospital mortality. More research is needed to definitively measure the risk of such death attributable to alcohol and determine the mechanisms underlying the association.
Disclosure
Nothing to report.
- , , , , . Alcohol and coronary heart disease: a meta‐analysis. Addiction. 2000;95(10):1505–1523.
- , , , et al. Forecasting the future of cardiovascular disease in the United States: a policy statement from the American Heart Association. Circulation. 2011;123(8):933–944.
- , , , . Alcohol consumption and cardiovascular mortality among U.S. adults, 1987 to 2002. J Am Coll Cardiol. 2010;55(13):1328–1335.
- , , , , , . Alcohol dosing and total mortality in men and women: an updated meta‐analysis of 34 prospective studies. Arch Intern Med. 2006;166(22):2437–2445.
- , , , et al. Alcohol intake and risk of coronary heart disease in younger, middle‐aged, and older adults. Circulation. 2010;121(14):1589–1597.
- , , , . Binge drinking and mortality after acute myocardial infarction. Circulation. 2005;112(25):3839–3845.
- , , , et al. Comparison of outcomes among moderate alcohol drinkers before acute myocardial infarction to effect of continued versus discontinuing alcohol intake after the infarct. Am J Cardiol. 2010;105(12):1651–1654.
- , , , , . Alcohol consumption and mortality in patients with cardiovascular disease: a meta‐analysis. J Am Coll Cardiol. 2010;55(13):1339–1347.
- , , , , . Prior alcohol consumption and mortality following acute myocardial infarction. JAMA. 2001;285(15):1965–1970.
- , , , , . Lifestyle, social factors, and survival after age 75: population based study. BMJ. 2012;345:e5568.
- , , , et al. Effect of moderate red wine intake on cardiac prognosis after recent acute myocardial infarction of subjects with Type 2 diabetes mellitus. Diabet Med. 2006;23(9):974–981.
- , , , , . Meta‐analysis of the relationship between alcohol consumption and coronary heart disease and mortality in type 2 diabetic patients. Diabetologia. 2006;49(4):648–652.
- , , , , . Alcohol and cardiovascular health: the dose makes the poison…or the remedy. Mayo Clin Proc. 2014;89(3):382–393.
- , . Alcohol intake and mortality in middle aged men with diagnosed coronary heart disease. Heart. 2000;83(4):394–399.
- , , , et al. Alcohol intake and the risk of coronary heart disease in the Spanish EPIC cohort study. Heart. 2010;96(2):124–130.
- , , . Does recent alcohol consumption reduce the risk of acute myocardial infarction and coronary death in regular drinkers? Am J Epidemiol. 1992;136(7):819–824.
- , . How much alcohol and how often? Population based case‐control study of alcohol consumption and risk of a major coronary event. BMJ. 1997;314(7088):1159–1164.
- HCUP Nationwide Inpatient Sample. Healthcare Cost and Utilization Project. Rockville, MD; Agency for Healthcare Research and Quality, 2011. Available at: http://www.hcup‐us.ahrq.gov/nisoverview.jsp.
- HCUP Clinical Classifications Software for Services and Procedures. Healthcare Cost and Utilization Project. Rockville, MD: Agency for Healthcare Research and Quality; 2008. Available at: http://www.hcup‐us.ahrq.gov/toolssoftware/ccs_svcsproc/ccssvcproc.jsp. Accessed May 10th, 2014.
- , . Drinking habits and cardiovascular disease: the Framingham Study. Am Heart J. 1983;105(4):667–673.
- , . Alcohol and sudden cardiac death. Br Heart J. 1992;68(5):443–448.
- , , , et al. Light‐to‐moderate alcohol consumption and risk of sudden cardiac death in women. Heart Rhythm. 2010;7(10):1374–1380.
- , , , , , . Moderate alcohol consumption and the risk of sudden cardiac death among US male physicians. Circulation. 1999;100(9):944–950.
- , , , et al. Patterns of alcohol consumption and myocardial infarction risk: observations from 52 countries in the INTERHEART case‐control study. Circulation. 2014;130(5):390–398.
- , , , et al. Risk of myocardial infarction immediately after alcohol consumption. Epidemiology. 2015;26(2):143–150.
- , , , , , . Drinking habits and coronary heart disease: the Yugoslavia cardiovascular disease study. Am J Epidemiol. 1982;116(5):748–758.
Moderate alcohol consumption has been associated with lower risk of coronary heart disease death.[1, 2, 3] This benefit has been shown across all age groups, both sexes, in low‐risk patients (without prior cardiovascular disease [CVD], diabetics and even in patients with established CVD.[3, 4, 5, 6, 7, 8, 9, 10, 11, 12] The relationship between the dose of alcohol and total mortality has been depicted in many observational studies as a J‐shaped curve, attributed to a combined effect of both benefits and harms.[3, 4, 13] Unlike moderate drinking, heavy drinking and particularly binge drinking may have net negative cardiovascular effects. For example, higher levels of intake of alcohol were associated with increased mortality in men with previous myocardial infarction,[14] whereas some reports suggest a continued beneficial association with acute myocardial infarction (AMI).[15, 16, 17] In other studies, the association between AMI and binge or chronic heavy drinking is inconsistent or lacks enough power to report the risk/benefit estimates.[3] Data are sparse on the effects of alcoholism on outcomes in patients hospitalized due to an AMI. Therefore, we sought to investigate the prevalence and association of alcohol‐related diagnoses with in‐hospital mortality in patients presenting with AMI in the United States.
METHODS
This study was a cross‐sectional analysis of the 2011 Nationwide Inpatient Sample (NIS). The NIS is a publicly available deidentified database of hospital discharges in the United States.[18] It contains data from approximately 8 million hospital stays that were selected using a complex probability sampling design and weighting scheme intended to represent all discharges from nonfederal hospitals in the United States. Each record includes 1 primary diagnosis and up to 24 secondary diagnoses.
Analysis was conducted for all patients aged 21 years and greater with a primary discharge diagnosis of AMI based on International Classification of Diseases, 9th Revision (ICD‐9) codes. ST‐elevation myocardial infarction (STEMI) and nonST‐elevation myocardial infarction (NSTEMI) were recorded when the principal diagnosis included the appropriate ICD‐9 codes (see Supporting Table 1 in the online version of this article). Alcohol‐related diagnosis was categorized as the presence of alcohol use disorders or other chronic conditions caused by heavy drinking such as alcoholic cardiomyopathy and alcoholic liver disease among others. Variables reflecting acute effects and chronic effects of alcohol use were created for analytic purposes. Acute effects that increase the risk for acute withdrawal syndrome and hemodynamic instability (and may thereby effect mortality) were characterized by alcohol withdrawal, acute alcoholic hepatitis, alcoholic gastritis, or acute alcohol intoxication. Chronic effects of alcohol were characterized by alcohol dependence, alcoholic polyneuropathy, alcoholic cardiomyopathy, or alcoholic liver damage other than acute hepatitis. A number of comorbidities were generated from ICD‐9 codes including smoking, chronic liver disease, peripheral vascular disease, hypertension, diabetes, renal failure, drug abuse, arrhythmia, and gastrointestinal bleeding using Clinical Classification Software codes provided by the Healthcare Cost and Utilization Project, Agency for Healthcare Research and Quality[19] (see Supporting Table 1 in the online version of this article).
The risk for alcohol‐related diagnoses in AMI patients adjusting for age and sex was estimated using all adult discharge records. All other analyses included only AMI discharges. The principal outcome measure was in‐hospital mortality. Secondary outcomes included having a cardiac procedure (diagnostic catheterization, percutaneous coronary angioplasty, or coronary bypass grafting), and length of stay.
All statistical analyses were performed using Statistical Analysis Software version 9.4 (SAS Inc., Cary, NC). Logistic regression methods appropriate for the NIS sample design were utilized to predict AMI mortality risk associated with alcohol‐related diagnoses (overall and separately for acute and chronic alcohol‐related diagnoses). Mortality risk was evaluated in all AMI discharges and again for STEMI and NSTEMI discharges. To control for factors frequently associated with alcoholism, adjustment was made for age, sex, liver disease, hypertension, diabetes, renal failure, peripheral vascular disease, arrhythmias, drug abuse, gastrointestinal bleed, and smoking. For secondary outcomes, odds ratios were calculated for having a cardiac procedure performed during the hospital admission and length of stay above the median.
RESULTS
Table 1 lists characteristics of AMI patients stratified by in‐hospital mortality. In 2011, AMI accounted for 610,963 (1.9%) of overall adult hospital admissions, with an in‐hospital mortality of 5.3%. Thirty‐two percent were STEMI admissions and 68% were NSTEMI admissions with in‐hospital mortality of 8.5% and 3.8%, respectively. Patients with alcohol‐related diagnoses comprised 18,684 (3.1%) of all AMI admissions. This prevalence was significantly lower relative to non‐AMI admissions (4.9%), even after age and sex adjustment (adjusted odds ratio [OR]: 0.7, 95% confidence interval [CI]: 0.6‐0.7, P 0.001).
| Variables | AMI, In‐hospital Death | AMI, Alive at Discharge | P Value |
|---|---|---|---|
| |||
| No. | 32,399 (5.3) | 578,564 (94.7) | 0.0001 |
| Age, y (SD) | 76 (7577) | 67 (6668) | |
| Sex | |||
| Males | 17,483 (54) | 352,943 (61) | 0.0001 |
| Females | 14,916 (46) | 225,621 (39) | 0.0001 |
| Race | |||
| White | 22,517 (70) | 387,816 (67) | 0.0001 |
| Black | 2,580 (7.9) | 56,735 (9.8) | 0.0001 |
| Hispanic | 2,002 (6.1) | 41,399 (7.2) | 0.0001 |
| Asian | 685 (2) | 11,160 (1.9) | 0.0001 |
| Native American | 146 (0.3) | 2,240 (0.4) | 0.0001 |
| Others | 991 (3) | 17,711 (3.2) | 0.0001 |
| Unspecified | 3,478 (10.7) | 61,503 (10.5) | 0.0001 |
| STEMI | 16,437 (50.7) | 177,240 (30.6) | 0.0001 |
| NSTEMI | 15,962 (49.3) | 401,324 (69.4) | 0.0001 |
| Alcohol diagnoses | |||
| Acute drinking | 110 (0.3) | 2,615 (0.5) | 0.1389 |
| Chronic drinking | 816 (2.5) | 15,143 (2.6) | 0.2473 |
| Comorbidities | |||
| Diabetes mellitus | 11,497 (35.5) | 211,321 (36.5) | 0.5963 |
| Hypertension | 20,068 (61.9) | 411,853 (71.2) | 0.0001 |
| Peripheral vascular disease | 4,962 (15.3) | 70,024 (12.1) | 0.0001 |
| Renal failure | 9,929 (30.6) | 113,714 (19.7) | 0.0001 |
| Drug abuse | 330 (1.0) | 13,263 (2.3) | 0.0001 |
| Arrhythmias | 14,977 (46.2) | 167,286 (28.9) | 0.0001 |
| Liver disease | 442 (1.4) | 6,493 (1.1) | 0.0753 |
| Smoking history | 6,736 (20.8) | 210,205 (36.3) | 0.0001 |
| Gastrointestinal bleed | 1,982 (6.1) | 12,086 (2.1) | 0.0001 |
Table 2 lists the characteristics of AMI patients stratified by alcohol status. Patients with alcohol‐related disorders presenting with AMI were younger, overwhelmingly male, and had a higher prevalence of the following comorbid conditions: drug abuse, liver disease, gastrointestinal bleeding, and smoking history. They had a lower prevalence of diabetes, hypertension, and renal failure.
| Variables | Alcohol‐Related Diagnoses | No Alcohol‐Related Diagnoses | P Value |
|---|---|---|---|
| |||
| No. | 18,684 (3.1) | 592,279 (96.9) | 0.0001 |
| Age, y, mean | 59 (5860) | 68 (6769) | 0.0001 |
| Sex | |||
| Males | 16,315 (87.3) | 354,051 (59.8) | 0.0001 |
| Females | 2,369 (12.7) | 238,228 (40.2) | 0.0001 |
| Race | |||
| White | 11,917 (63.8) | 398,766 (67.2) | 0.0001 |
| Black | 2,613 (13.9) | 56,723 (9.6) | 0.0001 |
| Hispanic | 1,400 (7.5) | 42,052 (7.1) | 0.0001 |
| Asian | 125 (0.7) | 11,724 (1.9) | 0.0001 |
| Native American | 165 (0.9) | 2,221 (0.4) | 0.0001 |
| Others | 570 (2.9) | 18,139 (3.2) | 0.0001 |
| Unspecified | 1,894 (10.1) | 62,654 (10.6) | 0.0001 |
| STEMI | 6,541 (35.1) | 187,136 (31.2) | 0.0001 |
| NSTEMI | 12,143 (64.9) | 405,143 (68.8) | 0.0001 |
| Died | 881 (4.7) | 31,518 (5.3) | 0.1312 |
| Comorbidities | |||
| Diabetes mellitus | 4,663 (24.9) | 218,446 (36.8) | 0.0001 |
| Hypertension | 12,501 (66.8) | 420,001 (70.8) | 0.0001 |
| Peripheral vascular disease | 2,269 (12.1) | 72,773 (12.3) | 0.7987 |
| Renal failure | 1,937 (10.4) | 121,925 (20.6) | 0.0001 |
| Drug abuse | 2,894 (15.5) | 10,708 (1.8) | 0.0001 |
| Arrhythmias | 5,476 (29.3) | 177,088 (29.9) | 0.4076 |
| Liver disease | 887 (4.7) | 6,053 (1.0) | 0.0001 |
| Smoking history | 12,771 (68.3) | 204,390 (34.5) | 0.0001 |
| Gastrointestinal bleed | 730 (3.9) | 13,347 (2.3) | 0.0001 |
Among AMI patients, unadjusted in‐hospital mortality was observed to be similar in the alcohol use disorder group (4.7% vs 5.3%, P = 0.131), STEMI hospitalizations (7.9% vs 8.5%, P = 0.475), and lower in NSTEMI hospitalizations (3% vs 3.9%, P = 0.035). However, as shown in Table 2, there were a number of factors that may have influenced death in AMI patients that differed between those with and without alcohol diagnoses. Table 3 shows the adjusted risk for death and each secondary outcome. After adjusting for factors associated with alcoholism, including age, sex, liver disease, hypertension, diabetes, renal failure, drug abuse, gastrointestinal bleed, and smoking, alcohol‐related diagnoses were associated with increased mortality in AMI hospitalizations (adjusted OR: 1.5, 95% CI: 1.2‐1.7, P 0.001). Contrary to our expectations, however, acute alcohol‐related diagnoses were not independently associated with mortality. The association with alcohol‐related diagnoses was significant in both STEMI (adjusted OR: 1.7, 95% CI: 1.4‐2.2, P 0.001) and NSTEMI patients (adjusted OR: 1.3, 95% CI: 1.0‐1.7, P = 0.025).
| Adjusted Odds Ratio* | 95% Confidence Intervals | P Value | |
|---|---|---|---|
| |||
| Primary outcome: death | |||
| AMI | |||
| Alcohol diagnoses | 1.5 | 1.21.7 | 0.001 |
| Acute alcohol diagnoses | 1.0 | 0.71.5 | 0.886 |
| Chronic alcohol diagnoses | 1.5 | 1.21.8 | 0.001 |
| STEMI | |||
| Alcohol diagnoses | 1.7 | 1.42.2 | 0.001 |
| Acute alcohol diagnoses | 1.1 | 0.61.9 | 0.835 |
| Chronic alcohol diagnoses | 1.6 | 1.22.1 | 0.001 |
| NSTEMI | |||
| Alcohol diagnoses | 1.3 | 1.01.7 | 0.025 |
| Acute alcohol diagnoses | 1.2 | 0.72.1 | 0.581 |
| Chronic alcohol diagnoses | 1.4 | 1.11.9 | 0.022 |
| Secondary outcomes | |||
| AMI | |||
| Length of stay | 1.5 | 1.31.6 | 0.001 |
| All cardiac procedures | 0.6 | 0.60.7 | 0.001 |
| CABG | 1.2 | 1.01.3 | 0.008 |
| Angioplasty | 0.6 | 0.60.7 | 0.001 |
| Diagnostic angiogram | 0.7 | 0.60.8 | 0.001 |
| STEMI | |||
| Length of stay | 1.2 | 1.11.4 | 0.001 |
| All cardiac procedures | 0.6 | 0.50.7 | 0.001 |
| CABG | 1.2 | 0.91.5 | 0.125 |
| Angioplasty | 0.6 | 0.50.7 | 0.001 |
| Diagnostic angiogram | 0.7 | 0.60.9 | 0.001 |
| NSTEMI | |||
| Length of stay | 1.6 | 1.51.8 | 0.001 |
| All cardiac procedures | 0.7 | 0.60.8 | 0.001 |
| CABG | 1.1 | 0.91.5 | 0.125 |
| Angioplasty | 0.6 | 0.60.7 | 0.001 |
| Diagnostic angiogram | 0.7 | 0.60.8 | 0.001 |
Regarding secondary outcomes, alcohol‐related diagnoses were associated with an increased length of stay, fewer diagnostic catheterizations and angioplasties, but higher coronary artery bypass grafting (CABG) procedures (Table 3).
DISCUSSION
In this analysis of AMI discharges, a modestly increased risk of in‐hospital mortality was found for patients with alcohol‐related diagnoses, although AMI patients were less likely to have a diagnosis related to alcohol. This increased risk of in‐hospital mortality was present in both STEMI and NSTEMI patients with alcohol‐related diagnoses, and was present in patients with chronic alcohol‐related diagnoses but not with withdrawal or intoxication. In addition to mortality differences, AMI patients with alcohol‐related diagnoses had a higher length of stay, but were less likely to have a cardiac procedure.
The association of alcohol‐related diagnoses with cardiovascular outcomes is not as well defined as the beneficial association between coronary heart disease and moderate alcohol use. Heavy drinking has been associated with greater risk of sudden cardiac death in subjects with preexisting coronary heart disease.[20, 21] Data from the Nurses Health Study demonstrated a U‐shaped curve between alcohol use and sudden cardiac death, but with limited power for assessing heavy drinking patterns.[22] In the Physicians Health Study, there was no significant increase in the risk of sudden cardiac death in men with higher intake of alcohol (2 drinks/day), but again with limited power for evaluating truly heavy drinking.[23] More recently, as shown by Mukamal et al., there was a trend toward higher overall cardiovascular deaths (OR: 1.07, 95% CI: 0.94‐1.22) but lower coronary heart disease mortality (OR: 0.80, 95% CI: 0.61‐1.05) in heavy drinkers, but results were not statistically significant even after adjusting for age, sex, and race.[3] One study demonstrated that heavy episodic drinking within the preceding 24 hours was associated with an increased risk of myocardial infarction (OR: 1.4, 95% confidence interval: 1.1‐1.9), particularly in the elderly (>65 years old) (OR: 5.3, 95% CI: 1.6‐18),[24] but the study did not consider mortality. The more recent study done by Mostofsky et al. has shown higher incidence of AMI onset within 1 hour after alcohol consumption among people who are not daily drinkers,[25] but the study did not consider mortality outcomes.
As an extension of knowledge regarding the association of alcohol‐related diagnoses with cardiovascular outcomes, we believe that our analysis of the NIS is the first to show a statistically significant positive age‐adjusted association of in‐hospital mortality with alcohol‐related diagnoses in AMI patients. Episodic or binge drinking has been noted to have proarrhythmogenic effects leading to sudden cardiac death.[26] This would often occur prior to hospitalization, but once hospitalized the presence of rhythm abnormalities was not associated with alcohol diagnoses. Alcohol effects might also be expected to lead to increased AMI mortality due to autonomic instability, gastrointestinal bleeding, or liver disease, but intoxication, withdrawal, gastrointestinal bleeding, liver disease, or comorbid tobacco or drug abuse did not account for excess alcohol‐associated AMI mortality in this study. Additional research will be required to determine the reasons underlying the increased age‐adjusted mortality.
The important strength of the present study includes the use of a large national database that allowed us to link alcohol‐related diagnoses to AMI death in the hospital, and to explore potential confounders of this association (eg, gastrointestinal bleeding, withdrawal, liver disease). However, a number of limitations merit consideration. The NIS sampling frame is limited to hospital discharges. As such, we have no data on prehospital AMI death and alcohol use pattern immediately preceding hospitalization. Similarly, we were unable to consider mortality immediately beyond the hospital discharge. Other important predictors that are not recorded in the NIS are details regarding a patient's physical activity and medications such as statins and ‐blockers that could affect survivorship in AMI patients. Another potential limitation of our analysis is the lack of differentiating between type 2 myocardial infarction, occurring from sepsis or acute kidney injury, from a true NSTEMI. However, we included only primary discharge diagnoses of AMI, and results for STEMI and NSTEMI discharges were similar. Regarding the cross‐sectional study design, we are unable to establish a cause and effect relationship between in‐hospital AMI mortality and alcohol‐related diagnoses. The NIS data were abstracted from administrative databases that may lack important details on alcohol‐related problems. In particular, it seems likely that heavy drinkers with less obvious alcohol‐related problems would be underidentified in clinical settings, and this may have biased our results toward an overestimation of the alcohol‐associated risk. Due to these limitations, AMI mortality will need to be evaluated in other samples to definitively evaluate associations with diagnoses related to heavy drinking and determine the reasons underlying the association. The increased death and CABG despite decreased angiography and angioplasty suggests that these patients presentations may be with more severe coronary heart disease, which is a question requiring further study. Finally, an alcohol user who presents with an AMI is less likely to have cardiac risk factors like diabetes, renal failure, and possibly hypertension. Rather, alcohol diagnoses in AMI patients associate with tobacco and drug abuse, liver disease, and higher age‐adjusted risk for death. It is important for a practicing hospitalist to have a high index of suspicion for these atypical AMI patients.
CONCLUSION
Although alcohol‐related diagnoses are less commonly documented in AMI patients relative to other admission diagnoses, results of this study suggest that they independently predict in‐hospital mortality. More research is needed to definitively measure the risk of such death attributable to alcohol and determine the mechanisms underlying the association.
Disclosure
Nothing to report.
- , , , , . Alcohol and coronary heart disease: a meta‐analysis. Addiction. 2000;95(10):1505–1523.
- , , , et al. Forecasting the future of cardiovascular disease in the United States: a policy statement from the American Heart Association. Circulation. 2011;123(8):933–944.
- , , , . Alcohol consumption and cardiovascular mortality among U.S. adults, 1987 to 2002. J Am Coll Cardiol. 2010;55(13):1328–1335.
- , , , , , . Alcohol dosing and total mortality in men and women: an updated meta‐analysis of 34 prospective studies. Arch Intern Med. 2006;166(22):2437–2445.
- , , , et al. Alcohol intake and risk of coronary heart disease in younger, middle‐aged, and older adults. Circulation. 2010;121(14):1589–1597.
- , , , . Binge drinking and mortality after acute myocardial infarction. Circulation. 2005;112(25):3839–3845.
- , , , et al. Comparison of outcomes among moderate alcohol drinkers before acute myocardial infarction to effect of continued versus discontinuing alcohol intake after the infarct. Am J Cardiol. 2010;105(12):1651–1654.
- , , , , . Alcohol consumption and mortality in patients with cardiovascular disease: a meta‐analysis. J Am Coll Cardiol. 2010;55(13):1339–1347.
- , , , , . Prior alcohol consumption and mortality following acute myocardial infarction. JAMA. 2001;285(15):1965–1970.
- , , , , . Lifestyle, social factors, and survival after age 75: population based study. BMJ. 2012;345:e5568.
- , , , et al. Effect of moderate red wine intake on cardiac prognosis after recent acute myocardial infarction of subjects with Type 2 diabetes mellitus. Diabet Med. 2006;23(9):974–981.
- , , , , . Meta‐analysis of the relationship between alcohol consumption and coronary heart disease and mortality in type 2 diabetic patients. Diabetologia. 2006;49(4):648–652.
- , , , , . Alcohol and cardiovascular health: the dose makes the poison…or the remedy. Mayo Clin Proc. 2014;89(3):382–393.
- , . Alcohol intake and mortality in middle aged men with diagnosed coronary heart disease. Heart. 2000;83(4):394–399.
- , , , et al. Alcohol intake and the risk of coronary heart disease in the Spanish EPIC cohort study. Heart. 2010;96(2):124–130.
- , , . Does recent alcohol consumption reduce the risk of acute myocardial infarction and coronary death in regular drinkers? Am J Epidemiol. 1992;136(7):819–824.
- , . How much alcohol and how often? Population based case‐control study of alcohol consumption and risk of a major coronary event. BMJ. 1997;314(7088):1159–1164.
- HCUP Nationwide Inpatient Sample. Healthcare Cost and Utilization Project. Rockville, MD; Agency for Healthcare Research and Quality, 2011. Available at: http://www.hcup‐us.ahrq.gov/nisoverview.jsp.
- HCUP Clinical Classifications Software for Services and Procedures. Healthcare Cost and Utilization Project. Rockville, MD: Agency for Healthcare Research and Quality; 2008. Available at: http://www.hcup‐us.ahrq.gov/toolssoftware/ccs_svcsproc/ccssvcproc.jsp. Accessed May 10th, 2014.
- , . Drinking habits and cardiovascular disease: the Framingham Study. Am Heart J. 1983;105(4):667–673.
- , . Alcohol and sudden cardiac death. Br Heart J. 1992;68(5):443–448.
- , , , et al. Light‐to‐moderate alcohol consumption and risk of sudden cardiac death in women. Heart Rhythm. 2010;7(10):1374–1380.
- , , , , , . Moderate alcohol consumption and the risk of sudden cardiac death among US male physicians. Circulation. 1999;100(9):944–950.
- , , , et al. Patterns of alcohol consumption and myocardial infarction risk: observations from 52 countries in the INTERHEART case‐control study. Circulation. 2014;130(5):390–398.
- , , , et al. Risk of myocardial infarction immediately after alcohol consumption. Epidemiology. 2015;26(2):143–150.
- , , , , , . Drinking habits and coronary heart disease: the Yugoslavia cardiovascular disease study. Am J Epidemiol. 1982;116(5):748–758.
Interhospital Transfer Handoff Practices
Transitions of care are major sources of preventable medical errors. Incomplete or inaccurate communication during handoffs is the root cause of many adverse events.[1] In a prospective study, adverse events were found to occur during interhospital transfer up to 30% of the time.[2] Furthermore, patients subject to interhospital transfer have longer length of stay and higher inpatient mortality, even after adjusting for mortality risk predictors.[3] Standardizing intrahospital handoff structures and communication practices has been shown to reduce medical errors.[4, 5, 6] Interhospital transfer is an understudied area among the transitions of care literature. Little is known about institutional variations in the process of information transfer and its association with patient outcomes. Although it is challenging to ascertain the total burden of transferred patients, it has been estimated that 1.6 million inpatients originated at another facility.[7] Additionally, approximately 5.9% of admissions to a representative sample of US intensive care units (ICU) originated from other hospitals.[8] Patients are transferred between hospitals for multiple reasons beyond medical necessity, for example, to adjust for patient preferences, bed availability, and hospital staffing patterns. This creates a setting in which complex and often critically ill patients are subject to variable and sometimes ambiguous handoff processes.[9]
This survey of 32 tertiary care centers in the United States was undertaken to identify common practices in communication and documentation during interhospital patient transfers. Additional goals were to understand the structure of the handoff process, the role of the transfer center, and how electronic medical records (EMR) and interhospital communication play a role in this care transition. Subsequently, common challenges in coordinating interhospital transfers were identified to provide a conceptual framework for process improvement.
METHODS
Survey Process
The survey was initiated in September 2013 and concluded in September 2015, and was designed to quantify patient volume and identify common as well as unique practices to improve communication across the transfer process. The respondents were transfer center directors or managers, typically with a nursing background. Mass e‐mail generated a very poor response rate and did not allow for discussion and clarification of responses. The strategy was then modified to contact individual institutions directly. The survey was performed via phone whenever possible. Figure 1 represents purposeful sampling conducted on 2 different groups of hospitals. These hospitals represent a convenience sample of institutions from a nationally ranked list of hospitals as well as others comparable to our own institutions. Hospitals were selected based on status as academic tertiary care centers with roughly similar bed sizes (600). Several were selected based on similar EMR capabilities. Geographic diversity was also taken into account. Thirty‐two academic tertiary care centers were ultimately included in the survey. Data were entered into a survey form and deidentified. The RutgersRobert Wood Johnson Medical School Institutional Review Board approved this study.

Survey Content
Qualitative and quantitative data were collected by the study team. Data included number and origin of transfers (including those from inpatient facilities and emergency departments), staff characteristics, transfer process, documentation received prior to transfer, EMR access and type, outcomes, and clinical status tracking (see Supporting Figure 1 in the online version of this article for the complete survey tool).
Measurement and Data Analysis
Descriptive statistics are presented in unweighted fashion as a number and percentage for dichotomous variables, or a numeric range for ordinal variables. When a range was given by survey participants, the lower end of the range was used to calculate the population median. Several institutions surveyed were unable to provide specific numeric values, but instead cited how many requests for transfer they received either daily or monthly; these were omitted from the demographics analysis.
Respondents also provided a description of their overall triage and acceptance process for qualitative analysis. Unique strategies were identified by the study personnel at the time of each interview and amassed at the end of the interview period. These strategies were then discussed by the study team, and separated into categories that addressed the main challenges associated with interhospital transfers. Five general tenants of the transfer process were identified: acceptance and transport, need for clinical updates, provider handoffs and coordination of care, information availability, and feedback.
RESULTS
Based on a survey question asking respondents to estimate the total number of interhospital transfers received per month, the annual burden of patients transferred into these 32 hospitals represented approximately 247,000 patients yearly. The median number of patients transferred per month, based on a point estimate if given or the lower end of the range if a range was provided, was 700 (range, 2502500). On average, 28% (range, 10%50%) were transferred directly to an ICU, representing approximately 69,000 critically ill patients. A majority of hospitals polled (65%) received patients from more than 100 referring institutions, and a minority (23%) identified EMR interoperability for more than a quarter of the sending facilities. The overall acceptance rate ranged from 50% to 95%.
Table 1 represents common transition elements of participating institutions. Thirty‐eight percent of hospitals utilize a critical caretrained registered nurse as the initial triage point of contact. The process and quality controls for coordinating transfers from outside hospitals were highly variable. Although clinical updates from acceptance to arrival were required in a majority of hospitals (81%), the acceptable time interval was inconsistent, varying from 2 to 4 hours (13%) to 24 hours (38%). A mandatory 3‐way recorded discussion (between transfer center staff, and referring and accepting physician) was nearly uniform. Objective clinical information to assist the handoff (ie, current labs, radiology images, history and physical, progress notes, or discharge summary) was available in only 29% of hospitals. Only 23% of hospitals also recorded a 3‐way nursing handoff (bedside‐to‐bedside nursing report). A minority of hospitals utilized their principal EMR to document the transfer process and share incoming clinical information among providers (32%).
| Survey Question | Survey Response | N (%) |
|---|---|---|
| ||
| What is the training background of the staff member who takes the initial call and triages patients in your transfer center? | Critical care experienced RN | 12/32 (38%) |
| Other clinical background (EMT, RN) | 13/32 (41%) | |
| Nonclinical personnel | 7/32 (22%) | |
| Prior to the patient's arrival, do you require any documentation to be transmitted from the transferring institution? | Objective clinical data required | 9/32 (28%) |
| Objective clinical data not required | 23/32 (72%) | |
| Is a 3‐way recorded conversation facilitated by the transfer center required? | Initial physician‐to‐physician acceptance discussion | 27/32 (84%) |
| RN‐to‐RN report | 6/26 (23%) | |
| Are clinical status updates required? | Updates required every 24 hours | 12/32 (38%) |
| Updates required every 812 hours | 7/32 (22%) | |
| Updates required every 24 hours | 4/32 (13%) | |
| Updates required but timing not specified | 3/32 (9%) | |
| Clinical status updates not required | 6/32 (19%) | |
| Is any clinical information obtained by the transfer center available to the patient's providers in real time on your EMR system? | Yes | 10/31 (32%) |
| No | 21/31 (68%) | |
| Do you track the outcomes of patients you accept from outside hospitals? | Yes | 14/24 (58%) |
| No | 10/24 (42%) | |
Descriptions of the transfer process were conceptually evaluated by the study team, then divided into 5 common themes: acceptance and transport, clinical updates, coordination of care, information availability, and quality improvement (Table 2). Institutions devised novel approaches including providing high bed priority to expedite transit, a dedicated quarterback physician to coordinate safe transfer and uninterrupted communication, electronic transfer notes to share communication with all providers, and a standardized system of feedback to referring hospitals. Several institutions relied on an expect note, which could be a free‐text document or a form document in the EMR. This preserves verbal handoff information that may otherwise be lost if the accepting physician at the time of transfer is not the physician receiving the handoff.
| Challenges | Innovative Practices |
|---|---|
| |
| Expedited acceptance and transport | Automatic acceptance for certain diagnoses (ie, neurosurgical indication for transfer) |
| Transferred patients prioritized for hospital beds over all patients except codes | |
| Hospital controls transportation units, allowing for immediate dispatch and patient retrieval | |
| Outsourcing of transfer center and interfacility transfer to third party | |
| Timeliness of clinical updates | Transfer center communicates with bedside RN for clinical updates at the time of transfer |
| Clinical status updates every 24 hours for critical patients | |
| Daily reevaluation of clinical status | |
| Accepting physician alerted of changes in clinical status | |
| Handoff and coordination of care | Physician accept tool in EMR |
| Quarterback physician who triages and accepts all patients during a given time period | |
| Critical patients are accepted into a critical care resuscitation unit, an all‐purpose intensive care unit staffed by an intensivist who shares decision making with the referring provider and is involved in all communications regarding the transferred patient | |
| Availability of protected clinical information | Scribed physician handoff imported into EMR |
| Expect note in EMR: summary of clinical information documented by accepting physician | |
| PACS radiology cloud networks for hospital systems or statewide | |
| EMR interoperability: Care Everywhere module in Epic EMR | |
| Health and information management department responsible for obtaining and scanning outside records into EMR | |
| Feedback and quality improvement | Automatic review if patient upgraded to ICU within 4 hours of arrival |
| Departmental chair review of physician verbal handoff if poor outcome or difficulty with transfer | |
| Outcomes and quality of handoff reported back to referring hospital | |
| Discharge summary sent to referring hospital | |
| Referring hospital able to view patient's chart for 1 year | |
Quality improvement occurred via both internal and external feedback at several institutions. There were two notable mechanisms of internal feedback. Review of recorded physician verbal handoff by department chair occurred if an adverse event involved a transferred patient. An automatic internal review was triggered if a patient was upgraded to a higher level of care within 4 hours of arrival. These advanced mechanisms require vigilance and dedication on the part of the transfer center and physicians involved in the transfer process. External feedback was provided to referring hospitals through both active and passive mechanisms. One advanced health system allowed referring providers to access the patient's inpatient medical record for 1 year and sent a discharge summary to all referring hospitals. Another hospital maintained a sophisticated scorecard, with key measures shared with internal stakeholders and referring hospitals. Some of the metrics tracked included: denials due to insufficient bed capacity, change in bed status within 12 hours of transfer, and duration of stay in the postanesthesia care unit or emergency department awaiting an inpatient bed. This organization also performed site visits to referring hospitals, addressing handoff quality improvement.
DISCUSSION
Standardizing intrahospital handoffs has been shown to decrease preventable medical errors and reduce possible near‐miss events.[6, 10] Interhospital care transitions are inherently more complex due to increased acuity and decreased continuity; yet, there is no universal standardization of these handovers. We found that practices vary widely among tertiary care centers, and the level of transfer center involvement in the verbal and written handoff is inconsistent.
Evidence‐based frameworks to improve healthcare delivery, such as TeamSTEPPS (Team Strategies and Tools to Enhance Performance and Patient Safety), first require an organizational assessment to identify barriers to effective communication.[11] Interhospital transfers offer multiple unique barriers to continuity: physical distance, uncertainty in timing, incongruent treatment goals, disparate information sources, and distractions. This study provides the first step in conceptualizing the unique aspects of interhospital transfers, as well as highlights strategies to improve care coordination (Table 2).
A tailored intervention needs not only to overcome the typical barriers to handoffs such as time constraints, information sharing, and ambiguity in provider roles, but also to overcome multiple systems barriers. Bed management systems add another time‐related variable due to fixed and frequently overburdened bed capacity. Prioritization of transfers depends upon an accurate clinical depiction of patient acuity as well as organizational strategies. For example, neurologic diagnoses are commonly a top priority and are triaged as such, sometimes instead of higher‐acuity patients with other principal diagnoses. The complexity of this process may lead to delays in high‐acuity transfers, and is contingent upon accurate and updated clinical information. Coordinating handovers amidst complex provider schedules is another systems barrier. The commonly adopted 7 on, 7 off model for hospitalists, and shift work for intensivists, may increase the possibility that a transfer occurs across multiple provider changes. Patient follow‐up and closed‐loop feedback are important components of intrahospital handovers, but are much more challenging to implement for interhospital handovers with incongruent information systems and providers.
Programs to improve intrahospital handovers (eg, IPASS) emphasize creating an accurate clinical depiction of a patient using both verbal and written handoffs.[12] This is arguably more difficult over the phone without a concurrent written handoff. Recording of 3‐way physician and nurse handoffs is common, but reviews of recorded conversations are often unavailable or cumbersome in real time. EMR documentation of verbal information exchanged during the handoff is a possible solution. However, there may be legal implications for a transcribed verbal handoff. Furthermore, transfer centers often work with a software program separate from the principal EMR, and documentation in real time is challenging. EMR integration could help reinforce a patient‐centered shared mental model by allowing visualization of lab trends, radiology, vitals, and other documentation during and after the verbal handoff.
Physician‐driven checklist accept tools are another solution. Usually the responsibility of the accepting attending or fellow, this type of document is most useful as a modifiable document in the EMR. Accept tools, such as the one created by Malpass et al., have demonstrated successful shared decision making, and have resulted in fewer emergent procedures and fewer antibiotic changes on arrival.[13] One of the challenges with this approach is the frequency of utilization. In the aforementioned study, the adoption rate of the accept tool was about 70% in a closed university medical ICU, where these types of interventions may be viewed favorably by providers instead of burdensome.[13]
The most consistent finding of this survey was the lack of common processes to improve outcomes. Simple interventions, such as regular clinical updates, documentation of the handoff process, and obtaining objective information early in the process, were inconsistently adopted. Outcomes tracking and feedback are necessary components of team‐based quality improvement. Approximately half of the hospitals surveyed specifically tracked outcomes of transferred patients, and a minority had systems in place to provide feedback to referring centers.
Improving care delivery requires buy‐in from all participants, necessitating engagement of referring hospitals. Interventions such as frequent status updates and providing early documentation have the potential to increase the burden on referring providers when feedback or incentives are not commonplace. Moreover, the referring provider has the option of transferring a patient to a hospital with reduced handoff requirements, creating a disincentive for quality improvement. Quality metrics that incorporate outcomes of transferred patients may be necessary to better align the goals of sending and receiving physicians.
This study was intended to be a qualitative investigation and has some limitations. Any verbal qualitative study has the possibility of misinterpretation of information given by transfer center personnel. A single investigator performed most of the discussions and was able to clarify when needed, providing a degree of consistency, but may also be a source of bias. Categorical answers and a team‐based approach to conceptualizing responses likely minimized this potential bias.
We selected hospitals from the U.S. News and World Report Honor Roll plus additional hospitals chosen based on similarity to our home institutions. This may be a skewed sample and may not represent other major US hospitals and networks. However, we chose to interview large academic tertiary care centers, many accepting more than 1000 patients monthly, as these are likely to be the most proficient at performing transfers, and responses may be generalizable.
CONCLUSIONS
Standardization of information exchange during interhospital transfers does not currently exist. Practices vary widely amongst academic tertiary care centers. There is a paucity of data to support the association of specific processes with patient outcomes. Ultimately, a multicenter study examining the impact of improved information transfer on patient outcomes is warranted, utilizing tracking resources already in place. Optimizing and aligning practices between sending and receiving hospitals may improve interhospital handover efficiency and patient safety.
Disclosures
Dr. Usher is supported by a National Institutes of Health Clinical and Translational Science Award at the University of Minnesota: UL1TR000114. Dr. Steinberg has received support from Arena Pharmaceuticals and Major League Baseball. Drs. Herrigel, Parikh, Fanning, and Carroll have no disclosures. A prior version of this article was presented as an abstract at the Society of General Internal Medicine Mid‐Atlantic Regional Meeting in April 2014 in New York, New York.
- , , , . Doctors' handovers in hospitals: a literature review. BMJ Qual Saf. 2011;20(2):128–133.
- , , , et al. Quality of inter‐hospital transport of critically ill patients: a prospective audit. Crit Care. 2005;9(4):R446–R451.
- , , , , . Interhospital transfer patients discharged by academic hospitalists and general internists: characteristics and outcomes [published online November 20, 2015]. J Hosp Med. doi: 10.1002/jhm.2515.
- , , , et al. Evaluation of postoperative handover using a tool to assess information transfer and teamwork. Ann Surg. 2011;253(4):831–837.
- , , , et al. Rates of medical errors and preventable adverse events among hospitalized children following implementation of a resident handoff bundle. JAMA. 2013;310(21):2262–2270.
- , , , et al. Changes in medical errors after implementation of a handoff program. N Engl J Med. 2014;371(19):1803–1812.
- HCUP National Inpatient Sample (NIS). Healthcare Cost and Utilization Project (HCUP). 2012. Agency for Healthcare Research and Quality, Rockville, MD. Available at: www.hcup‐us.ahrq.gov/nisoverview.jsp. Accessed 26 May 2015.
- , , , , , . Outcomes among patients discharged from busy intensive care units. Ann Intern Med. 2013;159(7):447–455.
- , , . Reasons underlying inter‐hospital transfers to an academic medical intensive care unit. J Crit Care. 2013;28(2):202–208.
- , , , . Avoiding handover fumbles: a controlled trial of a structured handover tool versus traditional handover methods. BMJ Qual Saf. 2012;21(11):925–932.
- , , , et al. Validation of a teamwork perceptions measure to increase patient safety. BMJ Qual Saf. 2014;23(9):718–726.
- , , , et al. Development, implementation, and dissemination of the I‐PASS handoff curriculum: a multisite educational intervention to improve patient handoffs. Acad Med. 2014;89(6):876–884.
- , , , . The interhospital medical intensive care unit transfer instrument facilitates early implementation of critical therapies and is associated with fewer emergent procedures upon arrival. J Intensive Care Med. 2015;30(6):351–357.
Transitions of care are major sources of preventable medical errors. Incomplete or inaccurate communication during handoffs is the root cause of many adverse events.[1] In a prospective study, adverse events were found to occur during interhospital transfer up to 30% of the time.[2] Furthermore, patients subject to interhospital transfer have longer length of stay and higher inpatient mortality, even after adjusting for mortality risk predictors.[3] Standardizing intrahospital handoff structures and communication practices has been shown to reduce medical errors.[4, 5, 6] Interhospital transfer is an understudied area among the transitions of care literature. Little is known about institutional variations in the process of information transfer and its association with patient outcomes. Although it is challenging to ascertain the total burden of transferred patients, it has been estimated that 1.6 million inpatients originated at another facility.[7] Additionally, approximately 5.9% of admissions to a representative sample of US intensive care units (ICU) originated from other hospitals.[8] Patients are transferred between hospitals for multiple reasons beyond medical necessity, for example, to adjust for patient preferences, bed availability, and hospital staffing patterns. This creates a setting in which complex and often critically ill patients are subject to variable and sometimes ambiguous handoff processes.[9]
This survey of 32 tertiary care centers in the United States was undertaken to identify common practices in communication and documentation during interhospital patient transfers. Additional goals were to understand the structure of the handoff process, the role of the transfer center, and how electronic medical records (EMR) and interhospital communication play a role in this care transition. Subsequently, common challenges in coordinating interhospital transfers were identified to provide a conceptual framework for process improvement.
METHODS
Survey Process
The survey was initiated in September 2013 and concluded in September 2015, and was designed to quantify patient volume and identify common as well as unique practices to improve communication across the transfer process. The respondents were transfer center directors or managers, typically with a nursing background. Mass e‐mail generated a very poor response rate and did not allow for discussion and clarification of responses. The strategy was then modified to contact individual institutions directly. The survey was performed via phone whenever possible. Figure 1 represents purposeful sampling conducted on 2 different groups of hospitals. These hospitals represent a convenience sample of institutions from a nationally ranked list of hospitals as well as others comparable to our own institutions. Hospitals were selected based on status as academic tertiary care centers with roughly similar bed sizes (600). Several were selected based on similar EMR capabilities. Geographic diversity was also taken into account. Thirty‐two academic tertiary care centers were ultimately included in the survey. Data were entered into a survey form and deidentified. The RutgersRobert Wood Johnson Medical School Institutional Review Board approved this study.
Survey Content
Qualitative and quantitative data were collected by the study team. Data included number and origin of transfers (including those from inpatient facilities and emergency departments), staff characteristics, transfer process, documentation received prior to transfer, EMR access and type, outcomes, and clinical status tracking (see Supporting Figure 1 in the online version of this article for the complete survey tool).
Measurement and Data Analysis
Descriptive statistics are presented in unweighted fashion as a number and percentage for dichotomous variables, or a numeric range for ordinal variables. When a range was given by survey participants, the lower end of the range was used to calculate the population median. Several institutions surveyed were unable to provide specific numeric values, but instead cited how many requests for transfer they received either daily or monthly; these were omitted from the demographics analysis.
Respondents also provided a description of their overall triage and acceptance process for qualitative analysis. Unique strategies were identified by the study personnel at the time of each interview and amassed at the end of the interview period. These strategies were then discussed by the study team, and separated into categories that addressed the main challenges associated with interhospital transfers. Five general tenants of the transfer process were identified: acceptance and transport, need for clinical updates, provider handoffs and coordination of care, information availability, and feedback.
RESULTS
Based on a survey question asking respondents to estimate the total number of interhospital transfers received per month, the annual burden of patients transferred into these 32 hospitals represented approximately 247,000 patients yearly. The median number of patients transferred per month, based on a point estimate if given or the lower end of the range if a range was provided, was 700 (range, 2502500). On average, 28% (range, 10%50%) were transferred directly to an ICU, representing approximately 69,000 critically ill patients. A majority of hospitals polled (65%) received patients from more than 100 referring institutions, and a minority (23%) identified EMR interoperability for more than a quarter of the sending facilities. The overall acceptance rate ranged from 50% to 95%.
Table 1 represents common transition elements of participating institutions. Thirty‐eight percent of hospitals utilize a critical caretrained registered nurse as the initial triage point of contact. The process and quality controls for coordinating transfers from outside hospitals were highly variable. Although clinical updates from acceptance to arrival were required in a majority of hospitals (81%), the acceptable time interval was inconsistent, varying from 2 to 4 hours (13%) to 24 hours (38%). A mandatory 3‐way recorded discussion (between transfer center staff, and referring and accepting physician) was nearly uniform. Objective clinical information to assist the handoff (ie, current labs, radiology images, history and physical, progress notes, or discharge summary) was available in only 29% of hospitals. Only 23% of hospitals also recorded a 3‐way nursing handoff (bedside‐to‐bedside nursing report). A minority of hospitals utilized their principal EMR to document the transfer process and share incoming clinical information among providers (32%).
| Survey Question | Survey Response | N (%) |
|---|---|---|
| ||
| What is the training background of the staff member who takes the initial call and triages patients in your transfer center? | Critical care experienced RN | 12/32 (38%) |
| Other clinical background (EMT, RN) | 13/32 (41%) | |
| Nonclinical personnel | 7/32 (22%) | |
| Prior to the patient's arrival, do you require any documentation to be transmitted from the transferring institution? | Objective clinical data required | 9/32 (28%) |
| Objective clinical data not required | 23/32 (72%) | |
| Is a 3‐way recorded conversation facilitated by the transfer center required? | Initial physician‐to‐physician acceptance discussion | 27/32 (84%) |
| RN‐to‐RN report | 6/26 (23%) | |
| Are clinical status updates required? | Updates required every 24 hours | 12/32 (38%) |
| Updates required every 812 hours | 7/32 (22%) | |
| Updates required every 24 hours | 4/32 (13%) | |
| Updates required but timing not specified | 3/32 (9%) | |
| Clinical status updates not required | 6/32 (19%) | |
| Is any clinical information obtained by the transfer center available to the patient's providers in real time on your EMR system? | Yes | 10/31 (32%) |
| No | 21/31 (68%) | |
| Do you track the outcomes of patients you accept from outside hospitals? | Yes | 14/24 (58%) |
| No | 10/24 (42%) | |
Descriptions of the transfer process were conceptually evaluated by the study team, then divided into 5 common themes: acceptance and transport, clinical updates, coordination of care, information availability, and quality improvement (Table 2). Institutions devised novel approaches including providing high bed priority to expedite transit, a dedicated quarterback physician to coordinate safe transfer and uninterrupted communication, electronic transfer notes to share communication with all providers, and a standardized system of feedback to referring hospitals. Several institutions relied on an expect note, which could be a free‐text document or a form document in the EMR. This preserves verbal handoff information that may otherwise be lost if the accepting physician at the time of transfer is not the physician receiving the handoff.
| Challenges | Innovative Practices |
|---|---|
| |
| Expedited acceptance and transport | Automatic acceptance for certain diagnoses (ie, neurosurgical indication for transfer) |
| Transferred patients prioritized for hospital beds over all patients except codes | |
| Hospital controls transportation units, allowing for immediate dispatch and patient retrieval | |
| Outsourcing of transfer center and interfacility transfer to third party | |
| Timeliness of clinical updates | Transfer center communicates with bedside RN for clinical updates at the time of transfer |
| Clinical status updates every 24 hours for critical patients | |
| Daily reevaluation of clinical status | |
| Accepting physician alerted of changes in clinical status | |
| Handoff and coordination of care | Physician accept tool in EMR |
| Quarterback physician who triages and accepts all patients during a given time period | |
| Critical patients are accepted into a critical care resuscitation unit, an all‐purpose intensive care unit staffed by an intensivist who shares decision making with the referring provider and is involved in all communications regarding the transferred patient | |
| Availability of protected clinical information | Scribed physician handoff imported into EMR |
| Expect note in EMR: summary of clinical information documented by accepting physician | |
| PACS radiology cloud networks for hospital systems or statewide | |
| EMR interoperability: Care Everywhere module in Epic EMR | |
| Health and information management department responsible for obtaining and scanning outside records into EMR | |
| Feedback and quality improvement | Automatic review if patient upgraded to ICU within 4 hours of arrival |
| Departmental chair review of physician verbal handoff if poor outcome or difficulty with transfer | |
| Outcomes and quality of handoff reported back to referring hospital | |
| Discharge summary sent to referring hospital | |
| Referring hospital able to view patient's chart for 1 year | |
Quality improvement occurred via both internal and external feedback at several institutions. There were two notable mechanisms of internal feedback. Review of recorded physician verbal handoff by department chair occurred if an adverse event involved a transferred patient. An automatic internal review was triggered if a patient was upgraded to a higher level of care within 4 hours of arrival. These advanced mechanisms require vigilance and dedication on the part of the transfer center and physicians involved in the transfer process. External feedback was provided to referring hospitals through both active and passive mechanisms. One advanced health system allowed referring providers to access the patient's inpatient medical record for 1 year and sent a discharge summary to all referring hospitals. Another hospital maintained a sophisticated scorecard, with key measures shared with internal stakeholders and referring hospitals. Some of the metrics tracked included: denials due to insufficient bed capacity, change in bed status within 12 hours of transfer, and duration of stay in the postanesthesia care unit or emergency department awaiting an inpatient bed. This organization also performed site visits to referring hospitals, addressing handoff quality improvement.
DISCUSSION
Standardizing intrahospital handoffs has been shown to decrease preventable medical errors and reduce possible near‐miss events.[6, 10] Interhospital care transitions are inherently more complex due to increased acuity and decreased continuity; yet, there is no universal standardization of these handovers. We found that practices vary widely among tertiary care centers, and the level of transfer center involvement in the verbal and written handoff is inconsistent.
Evidence‐based frameworks to improve healthcare delivery, such as TeamSTEPPS (Team Strategies and Tools to Enhance Performance and Patient Safety), first require an organizational assessment to identify barriers to effective communication.[11] Interhospital transfers offer multiple unique barriers to continuity: physical distance, uncertainty in timing, incongruent treatment goals, disparate information sources, and distractions. This study provides the first step in conceptualizing the unique aspects of interhospital transfers, as well as highlights strategies to improve care coordination (Table 2).
A tailored intervention needs not only to overcome the typical barriers to handoffs such as time constraints, information sharing, and ambiguity in provider roles, but also to overcome multiple systems barriers. Bed management systems add another time‐related variable due to fixed and frequently overburdened bed capacity. Prioritization of transfers depends upon an accurate clinical depiction of patient acuity as well as organizational strategies. For example, neurologic diagnoses are commonly a top priority and are triaged as such, sometimes instead of higher‐acuity patients with other principal diagnoses. The complexity of this process may lead to delays in high‐acuity transfers, and is contingent upon accurate and updated clinical information. Coordinating handovers amidst complex provider schedules is another systems barrier. The commonly adopted 7 on, 7 off model for hospitalists, and shift work for intensivists, may increase the possibility that a transfer occurs across multiple provider changes. Patient follow‐up and closed‐loop feedback are important components of intrahospital handovers, but are much more challenging to implement for interhospital handovers with incongruent information systems and providers.
Programs to improve intrahospital handovers (eg, IPASS) emphasize creating an accurate clinical depiction of a patient using both verbal and written handoffs.[12] This is arguably more difficult over the phone without a concurrent written handoff. Recording of 3‐way physician and nurse handoffs is common, but reviews of recorded conversations are often unavailable or cumbersome in real time. EMR documentation of verbal information exchanged during the handoff is a possible solution. However, there may be legal implications for a transcribed verbal handoff. Furthermore, transfer centers often work with a software program separate from the principal EMR, and documentation in real time is challenging. EMR integration could help reinforce a patient‐centered shared mental model by allowing visualization of lab trends, radiology, vitals, and other documentation during and after the verbal handoff.
Physician‐driven checklist accept tools are another solution. Usually the responsibility of the accepting attending or fellow, this type of document is most useful as a modifiable document in the EMR. Accept tools, such as the one created by Malpass et al., have demonstrated successful shared decision making, and have resulted in fewer emergent procedures and fewer antibiotic changes on arrival.[13] One of the challenges with this approach is the frequency of utilization. In the aforementioned study, the adoption rate of the accept tool was about 70% in a closed university medical ICU, where these types of interventions may be viewed favorably by providers instead of burdensome.[13]
The most consistent finding of this survey was the lack of common processes to improve outcomes. Simple interventions, such as regular clinical updates, documentation of the handoff process, and obtaining objective information early in the process, were inconsistently adopted. Outcomes tracking and feedback are necessary components of team‐based quality improvement. Approximately half of the hospitals surveyed specifically tracked outcomes of transferred patients, and a minority had systems in place to provide feedback to referring centers.
Improving care delivery requires buy‐in from all participants, necessitating engagement of referring hospitals. Interventions such as frequent status updates and providing early documentation have the potential to increase the burden on referring providers when feedback or incentives are not commonplace. Moreover, the referring provider has the option of transferring a patient to a hospital with reduced handoff requirements, creating a disincentive for quality improvement. Quality metrics that incorporate outcomes of transferred patients may be necessary to better align the goals of sending and receiving physicians.
This study was intended to be a qualitative investigation and has some limitations. Any verbal qualitative study has the possibility of misinterpretation of information given by transfer center personnel. A single investigator performed most of the discussions and was able to clarify when needed, providing a degree of consistency, but may also be a source of bias. Categorical answers and a team‐based approach to conceptualizing responses likely minimized this potential bias.
We selected hospitals from the U.S. News and World Report Honor Roll plus additional hospitals chosen based on similarity to our home institutions. This may be a skewed sample and may not represent other major US hospitals and networks. However, we chose to interview large academic tertiary care centers, many accepting more than 1000 patients monthly, as these are likely to be the most proficient at performing transfers, and responses may be generalizable.
CONCLUSIONS
Standardization of information exchange during interhospital transfers does not currently exist. Practices vary widely amongst academic tertiary care centers. There is a paucity of data to support the association of specific processes with patient outcomes. Ultimately, a multicenter study examining the impact of improved information transfer on patient outcomes is warranted, utilizing tracking resources already in place. Optimizing and aligning practices between sending and receiving hospitals may improve interhospital handover efficiency and patient safety.
Disclosures
Dr. Usher is supported by a National Institutes of Health Clinical and Translational Science Award at the University of Minnesota: UL1TR000114. Dr. Steinberg has received support from Arena Pharmaceuticals and Major League Baseball. Drs. Herrigel, Parikh, Fanning, and Carroll have no disclosures. A prior version of this article was presented as an abstract at the Society of General Internal Medicine Mid‐Atlantic Regional Meeting in April 2014 in New York, New York.
- , , , . Doctors' handovers in hospitals: a literature review. BMJ Qual Saf. 2011;20(2):128–133.
- , , , et al. Quality of inter‐hospital transport of critically ill patients: a prospective audit. Crit Care. 2005;9(4):R446–R451.
- , , , , . Interhospital transfer patients discharged by academic hospitalists and general internists: characteristics and outcomes [published online November 20, 2015]. J Hosp Med. doi: 10.1002/jhm.2515.
- , , , et al. Evaluation of postoperative handover using a tool to assess information transfer and teamwork. Ann Surg. 2011;253(4):831–837.
- , , , et al. Rates of medical errors and preventable adverse events among hospitalized children following implementation of a resident handoff bundle. JAMA. 2013;310(21):2262–2270.
- , , , et al. Changes in medical errors after implementation of a handoff program. N Engl J Med. 2014;371(19):1803–1812.
- HCUP National Inpatient Sample (NIS). Healthcare Cost and Utilization Project (HCUP). 2012. Agency for Healthcare Research and Quality, Rockville, MD. Available at: www.hcup‐us.ahrq.gov/nisoverview.jsp. Accessed 26 May 2015.
- , , , , , . Outcomes among patients discharged from busy intensive care units. Ann Intern Med. 2013;159(7):447–455.
- , , . Reasons underlying inter‐hospital transfers to an academic medical intensive care unit. J Crit Care. 2013;28(2):202–208.
- , , , . Avoiding handover fumbles: a controlled trial of a structured handover tool versus traditional handover methods. BMJ Qual Saf. 2012;21(11):925–932.
- , , , et al. Validation of a teamwork perceptions measure to increase patient safety. BMJ Qual Saf. 2014;23(9):718–726.
- , , , et al. Development, implementation, and dissemination of the I‐PASS handoff curriculum: a multisite educational intervention to improve patient handoffs. Acad Med. 2014;89(6):876–884.
- , , , . The interhospital medical intensive care unit transfer instrument facilitates early implementation of critical therapies and is associated with fewer emergent procedures upon arrival. J Intensive Care Med. 2015;30(6):351–357.
© 2016 Society of Hospital Medicine
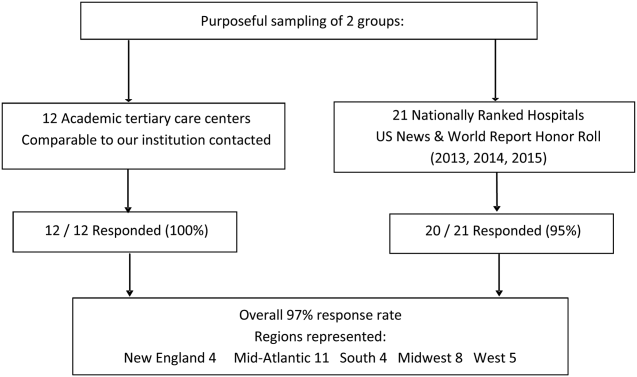
Evaluation of Internet Information About Rotator Cuff Repair
Patients are learning about health and disease more independently than before, but such self-education may pose a unique challenge for practicing physicians. Although educated patients can assist in the critical appraisal of treatment options,1 misinformed patients may have preconceived treatment biases and unrealistic expectations. More than 66 million Americans use the Internet daily, and recent surveys have shown 86% have used the Internet for health-related information.2,3 With Internet use increasing, the number of patients turning to the web for medical information is increasing as well.4 For many patients, this information can be useful in making decisions about their health and health care.5
Although accessing medical information from the Internet has grown exponentially, analysis of information quality has grown considerably slower.6 With no regulatory body monitoring content, there is easy circumvention of the peer review process, an essential feature of academic publishing.7 With no external regulation, the information retrieved may be incorrect, outdated, or misleading. Many orthopedic studies have analyzed Internet content about numerous diagnoses.3-6,8-18 Most of these studies have found this information highly variable and of poor quality.
We conducted a study to evaluate and analyze rotator cuff repair information available to the general public through the Internet; to assess changes in the quality of information over time; to determine if sites sponsored by academic institutions offered higher-quality information; and to assess whether the readability of the material varied according to DISCERN scores.
Rotator cuff repairs are among the most common surgeries performed by orthopedic surgeons. To our knowledge, this is the first study to assess the quality of web information about rotator cuff repairs. We hypothesized that the quality of information would positively correlate with the reading level of the material presented, that academic institutions would present the highest-quality information, and that the type of information presented would change over time.
Materials and Methods
We used the search phrase rotator cuff repair on the 3 most popular search engines: Google, Yahoo!, and Bing. Google is the dominant engine, taking 83.06% of total market share, followed by Yahoo! (6.86%) and Bing (4.27%).5 The first 50 websites identified by each search engine were selected for evaluation, excluding duplicates or overlapping websites. Similarly, advertisements and strictly video results lacking text were excluded. After each engine was queried, a master list of 150 websites was created for individual evaluation and assessment. To assess changes in results over time, we performed 2 searches, on November 16, 2011, and May 18, 2014.
The content of each website was analyzed for authorship, ability to contact the author, discussion of disorder, surgical treatment, complications, surgical eligibility, rehabilitation, other treatment options, and use of peer-reviewed sources. Authorship was placed in 1 of 6 categories:
1. Academic—university-affiliated physician or research group.
2. Private—physician or group without stated affiliation to an academic organization.
3. Industry—manufacturing or marketing company advertising a product or service for profit.
4. News source—bulletin or article without affiliation to a hospital or an academic institution.
5. Public education—individual or organization with noncommercial website providing third-party information (eg, Wikipedia, About.com).
6. Blog—website publishing an individual’s personal experiences in diary or journal form.
Websites were also assessed for accuracy and validity based on presence or absence of Health On the Net code (HONcode) certification and DISCERN score. Designed by the Health On the Net Foundation in 1996, HONcode provides a framework for disseminating high-quality medical information over the web.19 Website owners can request that their sites be evaluated for HONcode certification; a site that qualifies can display the HONcode seal.20 The DISCERN project, initially funded by the National Health Service in the United Kingdom, judges the quality of written information available on health-related websites.21 It determines the quality of a publication on the basis of 16 questions: The first 8 address the publication’s reliability, the next 7 involve specific details of treatment choices, and the last is an overall rating of the website.
Website readability was assessed with the Flesch-Kincaid test. This test, designed under contract with the US Navy in 1975, has been used in other orthopedic studies.19 Regression analysis was performed to check for correlation between website readability and DISCERN score. Analysis of variance was used to analyze differences between scores.
Results
We performed a comprehensive analysis of the top 50 websites from each of the 3 search engines (N = 150 websites) (Figures 1–5, Table). Regarding authorship, our 2 searches demonstrated similar values (Figure 1). In 2011, 21% of websites were associated with an academic institution, 38% were authored by private physicians or hospital or physician groups not associated with an academic institution, 11.5% were industry-sponsored, 5% were news bulletins or media reports, 21.5% were public education websites, and 3% were personal blogs. Our 2014 search found a similar distribution of contributors. Between 2011 and 2014, the largest change was in academic authors, which decreased by 7%, from 21% to 14%. Percentage of websites authored by private physicians remained constant from the first to the second search: 38%.
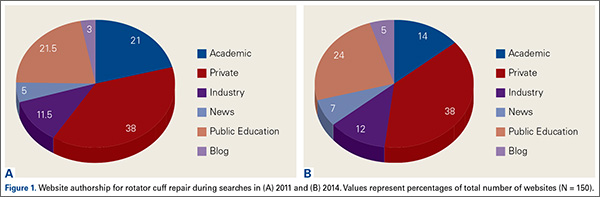
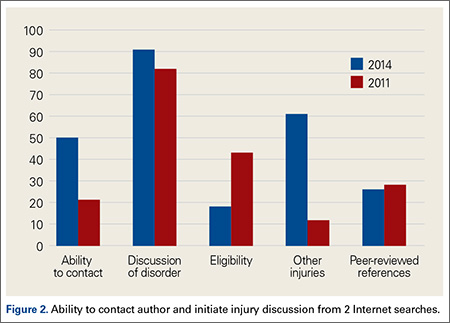
When the 2011 and 2014 website content was compared, several changes were noted. Percentage of websites providing an author contact method increased from 21% to 50% (Figure 2), percentage detailing rotator cuff repairs increased from 82% to 91%, and percentage introducing treatment options in addition to surgical management increased from 11.5% to 61%. Percentage discussing surgical eligibility, however, decreased from 43% to 18%. Percentage citing peer-reviewed sources remained relatively constant (28%, 26%), as did percentage discussing surgical technique for rotator cuff repair (55%, 59%) (Figure 3). A major decrease was found in percentage of websites discussing surgical complications, 42% in 2011 down to 25% in 2014, whereas a major increase was found in percentage discussing rehabilitation, from 39% in 2011 up to 73% in 2014. In 2014, no websites discussed double- versus single-row surgery—compared with 6% in 2011. False claims remained low between 2011 and 2014. In both searches, no website guaranteed a return to sport, and few made claims of painless or bloodless surgery.
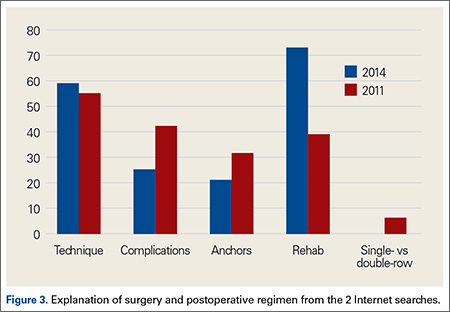
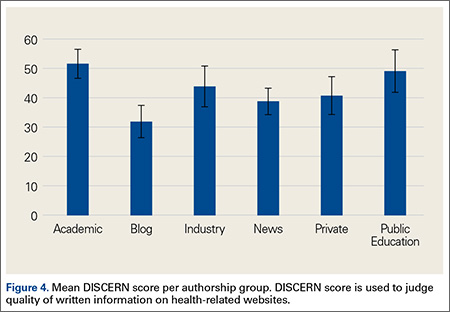
DISCERN scores for websites found during the 2014 search were averaged for each of the 6 authorship groups (Figure 4). The highest DISCERN scores were given to academic institution websites (51.6) and public education websites (49). For the academic websites, this difference was significant relative to news, blog, and private physician websites (Ps = .012, .001, .001) The lowest DISCERN scores were given to news organization websites and personal blogs. DISCERN scores were 43.8 for industry sources and 40.7 for private physician groups; the difference was not significant (P = .229). Overall mean DISCERN score for all websites was 44. Eleven percent of websites were HONcode-certified.
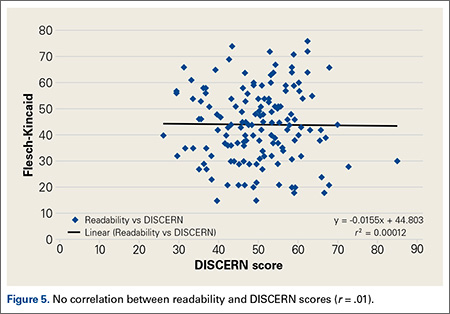
No correlation was found between website readability and DISCERN score; correlation coefficient r was .01 (Figure 5). For the websites in 2014, mean Flesch-Kincaid readability score was 50.17, and mean grade level was 10.98; coefficient of determination r2 was 0.00012.
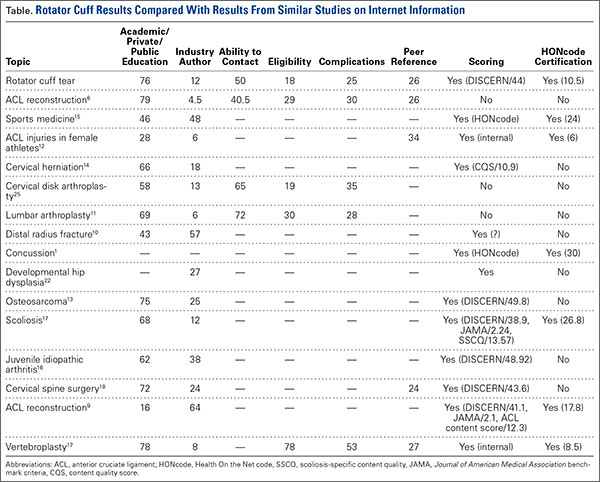
The Table compares our data with data from other orthopedic studies that have analyzed the quality of Internet information about various orthopedic injuries, diseases, and procedures.3-6,8,9,11-18 With its mean DISCERN score of 44, the present rotator cuff tear study was ranked third of 6 studies that have used this scoring system to analyze website content. Of these 6 studies, those reviewing osteosarcoma and juvenile idiopathic arthritis were ranked highest (mean scores, 49.8 and 48.9, respectively), and the study reviewing scoliosis surgery was ranked lowest (38.9). Bruce-Brand and colleagues9 recently found a mean DISCERN score of 41 for anterior cruciate ligament (ACL) reconstruction. When considering HONcode-certified websites, our Internet search for rotator cuff tears found the third lowest percentage, 10.5%, compared with the other studies (Table); the highest percentage, 30%, was found for websites discussing concussions in athletes. When considering authorship, our rotator cuff study found the third highest percentage, 76%, authored by academic centers, physicians, and public education websites; the highest percentage was found in websites discussing ACL reconstruction. Websites discussing ACL reconstruction also had the highest percentage of websites authored by industry.9
Discussion
To our knowledge, this is the first study specifically analyzing the quality of Internet information about rotator cuff repairs. A similar study, conducted by Starman and colleagues15 in 2010, addressed the quality of web information about 10 common sports medicine diagnoses, one of which was rotator cuff tears. In that study, only 16 of the websites included discussed rotator cuff tears. In addition, the authors used a customized, HONcode-based grading system to analyze each website, making their data difficult to compare across studies.
Ideally, a high-quality medical website should be written by a credible source and should cover a disorder, treatment options, eligibility, rehabilitation, and complications. As there is no standard grading system for analyzing web content about rotator cuff repairs, we analyzed the websites for specific information we thought should be included in a high-quality website (Figures 2, 3). When considering authorship, we found academic centers, private physicians, and educational sources comprised 76% of the sources; industry sources made up only 12%. Similar findings were noted by investigators analyzing Internet information about other orthopedic topics, including ACL reconstruction, lumbar arthroplasty, osteosarcoma, and cervical spine surgery.5,11,22 Studies analyzing websites for information on ACL tears and distal radius fractures found have a higher percentage of industry-sponsored websites.9,10
DISCERN showed that the highest-quality information came from websites with academic affiliations, consistent with previous studies,3,9,17 and its mean score (51.6) was significantly higher than the scores for private physician websites, news sites, and blogs (Ps = .001, .016, .001); the least reliable information was from personal blogs and news outlets. Of note, mean DISCERN score was higher for the industry websites we found than for private physician websites (43.8 vs 40.7), though the difference was not significant (P = .229). Previous investigators considered number of industry-sponsored websites as a marker of poor quality of information relating to a given topic; however, given the DISCERN scores in our study, this might not necessarily be true.6 Based on the present study’s data, websites affiliated with academic institutions would be recommended for patients searching for high-quality information about rotator cuff tears.
Given DISCERN scores across studies, information about rotator cuff tears ranked below information about osteosarcoma and juvenile idiopathic arthritis but above information about scoliosis, cervical spine surgery, and ACL reconstruction (Table). DISCERN scores must be compared across studies, as there are no definitions for good and poor DISCERN scores.
Of the 4 studies that analyzed percentage of websites citing peer-reviewed sources, only our study and the study of cervical spine surgery18 analyzed that percentage as well as DISCERN score. Percentage citing peer-reviewed sources was 26% for rotator cuff tears and 24% for cervical spine surgery; the respective DISCERN scores were 44 and 43.6. As only these 2 studies could be compared, no real correlation between percentage of websites citing peer-reviewed sources and the quality of the content on a given topic can be assessed. More research into this relationship is needed. One already delineated association is the correlation between HONcode-certified sites and high DISCERN scores.21 For high-quality medical information, physicians can direct their patients both to academic institution websites and to HONcode-certified websites.
When we compared the present study with previous investigations, we found a large difference between search results for a given topic. In 2013, Duncan and colleagues6 and Bruce-Brand and colleagues9 used similar study designs (eg, search terms, search engines) for their investigations of quality of web information. Their results, however, were widely different. For example, percentages of industry authorship were 4.5% (Duncan and colleagues6) and 64% (Bruce-Brand and colleagues9). This inconsistency between studies conducted during similar periods might be related to what appears at the top of the results queue for a search. Duncan and colleagues6 analyzed 200 websites, Bruce-Brand and colleagues9 only 45. Industries may have made financial arrangements and used search engine optimization techniques to have their websites listed first in search results.
In our study, we also analyzed how web information has changed over time. On the Internet, information changes daily, and we hypothesized that the content found during our 2 searches (2011, 2014) would yield different results. Surprisingly, the data were similar, particularly concerning authorship (Figures 1, 2). In both searches, the largest authorship source was private physician or physician groups (38% in 2011 and 2014). Other authorship sources showed little change in percentage between searches. As for content, we found both increases and decreases in specific web information. Ability to contact authors increased from 21% (2011) to 50% (2014). We think it is important that websites offer a communication channel to people who read the medical information the sites provide. Percentage of websites discussing nonoperative treatment options increased from 11.5% to 61%. Therefore, patients in 2014 were being introduced to more options (in addition to surgery) for managing shoulder pain—an improvement in quality of information between the searches. Percentage of websites discussing surgical eligibility, however, decreased from 43% to 18%—a negative development in information quality. Another decrease, from 42% to 25%, was found for websites discussing surgical complications. Given the data as a whole, and our finding both negative and positive changes, it appears the quality of web content has not improved significantly. Interestingly, no websites discussed double- versus single-row surgery in 2014, but 6% did so in 2011.
Lost in the discussion of quality and reliability of information is whether patients comprehend what they are reading.23 Yi and colleagues19 recentlyassessed the readability level of arthroscopy information in articles published online by the American Academy of Orthopaedic Surgeons (AAOS) and the Arthroscopy Association of North America (AANA). The investigators used the Flesch-Kincaid readability test to determine readability level in terms of grade level. They found that the majority of the patient education articles on the AAOS and AANA sites had a readability level far above the national average; only 4 articles were written at or below the eighth-grade level, the current average reading level in the United States.24 Information that is not comprehensible is of no use to patients, and information that physicians and researchers consider high-quality might not be what patients consider high-quality. As we pursue higher-quality web content, we need to consider that its audience includes nonmedical readers, our patients. In the present study, we found that the readability of a website had no correlation with the site’s DISCERN score (Figure 5). Therefore, for information about rotator cuff repairs, higher-quality websites are no harder than lower-quality sites for patients to comprehend. The Flesch-Kincaid readability test is flawed in that it considers only total number of syllables per word and words per sentence, not nontextual elements of patient education materials, such as illustrations on a website. The 10.98 mean grade level found in our study is higher than the levels found for most studies reviewed by Yi and colleagues.19
This study had several limitations. During an Internet search, the number of websites a user visits drops precipitously after the first page of results. Studies have shown the top 20 sites in a given search receive 97% of the views, and the top 3 receive 58.4%. Whether patients visit websites far down in the list of 150 we found in our given search is unknown. Last, the Flesch-Kincaid readability test is flawed in several ways but nevertheless is used extensively in research. Grading is based on number of words and syllables used in a given sentence; it does not take into account the complexity or common usage of a given word or definition. Therefore, websites may receive low Flesch-Kincaid scores—indicating ease of reading—despite their use of complex medical terminology and jargon that complicate patients’ comprehension of the material.
Conclusion
Numerous authors have evaluated orthopedic patients’ accessing of medical information from the Internet. Although the Internet makes access easier, unreliable content can lead patients to develop certain notions about the direction of their care and certain expectations regarding their clinical outcomes. With there being no regulatory body monitoring content, the peer review process, an essential feature of academic publishing, can be easily circumvented.25
In this study, the highest-quality websites had academic affiliations. Quality of information about rotator cuff repairs was similar to what was found for other orthopedic topics in comparable studies. Surprisingly, there was little change in authorship and content of web information between our 2 search periods (2011, 2014). Although there has been a rapid increase in the number of medical websites, quality of content seems not to have changed significantly. Patients look to physicians for guidance but increasingly are accessing the Internet for additional information. It is essential that physicians understand the quality of information available on the Internet when counseling patients regarding surgery.
1. Brunnekreef JJ, Schreurs BW. Total hip arthroplasty: what information do we offer patients on websites of hospitals? BMC Health Serv Res. 2011;11:83.
2. Koh HS, In Y, Kong CG, Won HY, Kim KH, Lee JH. Factors affecting patients’ graft choice in anterior cruciate ligament reconstruction. Clin Orthop Surg. 2010;2(2):69-75.
3. Nason GJ, Baker JF, Byrne DP, Noel J, Moore D, Kiely PJ. Scoliosis-specific information on the Internet: has the “information highway” led to better information provision? Spine. 2012;37(21):E1364-E1369.
4. Groves ND, Humphreys HW, Williams AJ, Jones A. Effect of informational Internet web pages on patients’ decision making: randomised controlled trial regarding choice of spinal or general anaesthesia for orthopaedic surgery. Anaesthesia. 2010;65(3):277-282.
5. Purcell K, Brenner J, Rainie L. Search Engine Use 2012. Washington, DC: Pew Internet & American Life Project; 2012.
6. Duncan IC, Kane PW, Lawson KA, Cohen SB, Ciccotti MG, Dodson CC. Evaluation of information available on the Internet regarding anterior cruciate ligament reconstruction. Arthroscopy. 2013;29(6):1101-1107.
7. Lichtenfeld LJ. Can the beast be tamed? The woeful tale of accurate health information on the Internet. Ann Surg Oncol. 2012;19(3):701-702.
8. Ahmed OH, Sullivan SJ, Schneiders AG, McCrory PR. Concussion information online: evaluation of information quality, content and readability of concussion-related websites. Br J Sports Med. 2012;46(9):675-683.
9. Bruce-Brand RA, Baker JF, Byrne DP, Hogan NA, McCarthy T. Assessment of the quality and content of information on anterior cruciate ligament reconstruction on the Internet. Arthroscopy. 2013;29(6):1095-1100.
10. Dy JC, Taylor SA, Patel RM, Kitay A, Roberts TR, Daluiski A. The effect of search term on the quality and accuracy of online information regarding distal radius fractures. J Hand Surg Am. 2012;37(9):1881-1887.
11. Garcia RM, Messerschmitt PJ, Ahn NU. An evaluation of information on the Internet of a new device: the lumbar artificial disc replacement. J Spinal Disord Tech. 2009;22(1):52-57.
12. Gosselin MM, Mulcahey MK, Feller E, Hulstyn MJ. Examining Internet resources on gender differences in ACL injuries: what patients are reading. Knee. 2013;20(3):196-202.
13. Lam CG, Roter DL, Cohen KJ. Survey of quality, readability, and social reach of websites on osteosarcoma in adolescents. Patient Educ Couns. 2013;90(1):82-87.
14. Morr S, Shanti N, Carrer A, Kubeck J, Gerling MC. Quality of information concerning cervical disc herniation on the Internet. Spine J. 2010;10(4):350-354.
15. Starman JS, Gettys FK, Capo JA, Fleischli JE, Norton HJ, Karunakar MA. Quality and content of Internet-based information for ten common orthopaedic sports medicine diagnoses. J Bone Joint Surg Am. 2010;92(7):1612-1618.
16. Stinson JN, Tucker L, Huber A, et al. Surfing for juvenile idiopathic arthritis: perspectives on quality and content of information on the Internet. J Rheumatol. 2009;36(8):1755-1762.
17. Sullivan TB, Anderson JS, Ahn UM, Ahn NU. Can Internet information on vertebroplasty be a reliable means of patient self-education? Clin Orthop Relat Res. 2014;472(5):1597-1604.
18. Weil AG, Bojanowski MW, Jamart J, Gustin T, Lévêque M. Evaluation of the quality of information on the Internet available to patients undergoing cervical spine surgery. World Neurosurg. 2014;82(1-2):e31-e39.
19. Yi PH, Ganta A, Hussein KI, Frank RM, Jawa A. Readability of arthroscopy-related patient education materials from the American Academy of Orthopaedic Surgeons and Arthroscopy Association of North America web sites. Arthroscopy. 2013;29(6):1108-1112.
20. Boyer C, Selby M, Scherrer JR, Appel RD. The Health On the Net code of conduct for medical and health websites. Comput Biol Med. 1998;28(5):603-610.
21. Silberg WM, Lundberg GD, Musacchio RA. Assessing, controlling, and assuring the quality of medical information on the Internet: Caveant lector et viewor—Let the reader and viewer beware. JAMA. 1997;277(15):1244-1245.
22. Fabricant PD, Dy CJ, Patel RM, Blanco JS, Doyle SM. Internet search term affects the quality and accuracy of online information about developmental hip dysplasia. J Pediatr Orthop. 2013;33(4):361-365.
23. Aslam N, Bowyer D, Wainwright A, Theologis T, Benson M. Evaluation of Internet use by paediatric orthopaedic outpatients and the quality of information available. J Pediatr Orthop B. 2005;14(2):129-133.
24. Wetzler MJ. “I found it on the Internet”: how reliable and readable is patient information? Arthroscopy. 2013;29(6):967-968.
25. Qureshi SA, Koehler SM, Lin JD, Bird J, Garcia RM, Hecht AC. An evaluation of information on the Internet about a new device: the cervical artificial disc replacement. Spine. 2012;37(10):881-883.
Patients are learning about health and disease more independently than before, but such self-education may pose a unique challenge for practicing physicians. Although educated patients can assist in the critical appraisal of treatment options,1 misinformed patients may have preconceived treatment biases and unrealistic expectations. More than 66 million Americans use the Internet daily, and recent surveys have shown 86% have used the Internet for health-related information.2,3 With Internet use increasing, the number of patients turning to the web for medical information is increasing as well.4 For many patients, this information can be useful in making decisions about their health and health care.5
Although accessing medical information from the Internet has grown exponentially, analysis of information quality has grown considerably slower.6 With no regulatory body monitoring content, there is easy circumvention of the peer review process, an essential feature of academic publishing.7 With no external regulation, the information retrieved may be incorrect, outdated, or misleading. Many orthopedic studies have analyzed Internet content about numerous diagnoses.3-6,8-18 Most of these studies have found this information highly variable and of poor quality.
We conducted a study to evaluate and analyze rotator cuff repair information available to the general public through the Internet; to assess changes in the quality of information over time; to determine if sites sponsored by academic institutions offered higher-quality information; and to assess whether the readability of the material varied according to DISCERN scores.
Rotator cuff repairs are among the most common surgeries performed by orthopedic surgeons. To our knowledge, this is the first study to assess the quality of web information about rotator cuff repairs. We hypothesized that the quality of information would positively correlate with the reading level of the material presented, that academic institutions would present the highest-quality information, and that the type of information presented would change over time.
Materials and Methods
We used the search phrase rotator cuff repair on the 3 most popular search engines: Google, Yahoo!, and Bing. Google is the dominant engine, taking 83.06% of total market share, followed by Yahoo! (6.86%) and Bing (4.27%).5 The first 50 websites identified by each search engine were selected for evaluation, excluding duplicates or overlapping websites. Similarly, advertisements and strictly video results lacking text were excluded. After each engine was queried, a master list of 150 websites was created for individual evaluation and assessment. To assess changes in results over time, we performed 2 searches, on November 16, 2011, and May 18, 2014.
The content of each website was analyzed for authorship, ability to contact the author, discussion of disorder, surgical treatment, complications, surgical eligibility, rehabilitation, other treatment options, and use of peer-reviewed sources. Authorship was placed in 1 of 6 categories:
1. Academic—university-affiliated physician or research group.
2. Private—physician or group without stated affiliation to an academic organization.
3. Industry—manufacturing or marketing company advertising a product or service for profit.
4. News source—bulletin or article without affiliation to a hospital or an academic institution.
5. Public education—individual or organization with noncommercial website providing third-party information (eg, Wikipedia, About.com).
6. Blog—website publishing an individual’s personal experiences in diary or journal form.
Websites were also assessed for accuracy and validity based on presence or absence of Health On the Net code (HONcode) certification and DISCERN score. Designed by the Health On the Net Foundation in 1996, HONcode provides a framework for disseminating high-quality medical information over the web.19 Website owners can request that their sites be evaluated for HONcode certification; a site that qualifies can display the HONcode seal.20 The DISCERN project, initially funded by the National Health Service in the United Kingdom, judges the quality of written information available on health-related websites.21 It determines the quality of a publication on the basis of 16 questions: The first 8 address the publication’s reliability, the next 7 involve specific details of treatment choices, and the last is an overall rating of the website.
Website readability was assessed with the Flesch-Kincaid test. This test, designed under contract with the US Navy in 1975, has been used in other orthopedic studies.19 Regression analysis was performed to check for correlation between website readability and DISCERN score. Analysis of variance was used to analyze differences between scores.
Results
We performed a comprehensive analysis of the top 50 websites from each of the 3 search engines (N = 150 websites) (Figures 1–5, Table). Regarding authorship, our 2 searches demonstrated similar values (Figure 1). In 2011, 21% of websites were associated with an academic institution, 38% were authored by private physicians or hospital or physician groups not associated with an academic institution, 11.5% were industry-sponsored, 5% were news bulletins or media reports, 21.5% were public education websites, and 3% were personal blogs. Our 2014 search found a similar distribution of contributors. Between 2011 and 2014, the largest change was in academic authors, which decreased by 7%, from 21% to 14%. Percentage of websites authored by private physicians remained constant from the first to the second search: 38%.
When the 2011 and 2014 website content was compared, several changes were noted. Percentage of websites providing an author contact method increased from 21% to 50% (Figure 2), percentage detailing rotator cuff repairs increased from 82% to 91%, and percentage introducing treatment options in addition to surgical management increased from 11.5% to 61%. Percentage discussing surgical eligibility, however, decreased from 43% to 18%. Percentage citing peer-reviewed sources remained relatively constant (28%, 26%), as did percentage discussing surgical technique for rotator cuff repair (55%, 59%) (Figure 3). A major decrease was found in percentage of websites discussing surgical complications, 42% in 2011 down to 25% in 2014, whereas a major increase was found in percentage discussing rehabilitation, from 39% in 2011 up to 73% in 2014. In 2014, no websites discussed double- versus single-row surgery—compared with 6% in 2011. False claims remained low between 2011 and 2014. In both searches, no website guaranteed a return to sport, and few made claims of painless or bloodless surgery.
DISCERN scores for websites found during the 2014 search were averaged for each of the 6 authorship groups (Figure 4). The highest DISCERN scores were given to academic institution websites (51.6) and public education websites (49). For the academic websites, this difference was significant relative to news, blog, and private physician websites (Ps = .012, .001, .001) The lowest DISCERN scores were given to news organization websites and personal blogs. DISCERN scores were 43.8 for industry sources and 40.7 for private physician groups; the difference was not significant (P = .229). Overall mean DISCERN score for all websites was 44. Eleven percent of websites were HONcode-certified.
No correlation was found between website readability and DISCERN score; correlation coefficient r was .01 (Figure 5). For the websites in 2014, mean Flesch-Kincaid readability score was 50.17, and mean grade level was 10.98; coefficient of determination r2 was 0.00012.
The Table compares our data with data from other orthopedic studies that have analyzed the quality of Internet information about various orthopedic injuries, diseases, and procedures.3-6,8,9,11-18 With its mean DISCERN score of 44, the present rotator cuff tear study was ranked third of 6 studies that have used this scoring system to analyze website content. Of these 6 studies, those reviewing osteosarcoma and juvenile idiopathic arthritis were ranked highest (mean scores, 49.8 and 48.9, respectively), and the study reviewing scoliosis surgery was ranked lowest (38.9). Bruce-Brand and colleagues9 recently found a mean DISCERN score of 41 for anterior cruciate ligament (ACL) reconstruction. When considering HONcode-certified websites, our Internet search for rotator cuff tears found the third lowest percentage, 10.5%, compared with the other studies (Table); the highest percentage, 30%, was found for websites discussing concussions in athletes. When considering authorship, our rotator cuff study found the third highest percentage, 76%, authored by academic centers, physicians, and public education websites; the highest percentage was found in websites discussing ACL reconstruction. Websites discussing ACL reconstruction also had the highest percentage of websites authored by industry.9
Discussion
To our knowledge, this is the first study specifically analyzing the quality of Internet information about rotator cuff repairs. A similar study, conducted by Starman and colleagues15 in 2010, addressed the quality of web information about 10 common sports medicine diagnoses, one of which was rotator cuff tears. In that study, only 16 of the websites included discussed rotator cuff tears. In addition, the authors used a customized, HONcode-based grading system to analyze each website, making their data difficult to compare across studies.
Ideally, a high-quality medical website should be written by a credible source and should cover a disorder, treatment options, eligibility, rehabilitation, and complications. As there is no standard grading system for analyzing web content about rotator cuff repairs, we analyzed the websites for specific information we thought should be included in a high-quality website (Figures 2, 3). When considering authorship, we found academic centers, private physicians, and educational sources comprised 76% of the sources; industry sources made up only 12%. Similar findings were noted by investigators analyzing Internet information about other orthopedic topics, including ACL reconstruction, lumbar arthroplasty, osteosarcoma, and cervical spine surgery.5,11,22 Studies analyzing websites for information on ACL tears and distal radius fractures found have a higher percentage of industry-sponsored websites.9,10
DISCERN showed that the highest-quality information came from websites with academic affiliations, consistent with previous studies,3,9,17 and its mean score (51.6) was significantly higher than the scores for private physician websites, news sites, and blogs (Ps = .001, .016, .001); the least reliable information was from personal blogs and news outlets. Of note, mean DISCERN score was higher for the industry websites we found than for private physician websites (43.8 vs 40.7), though the difference was not significant (P = .229). Previous investigators considered number of industry-sponsored websites as a marker of poor quality of information relating to a given topic; however, given the DISCERN scores in our study, this might not necessarily be true.6 Based on the present study’s data, websites affiliated with academic institutions would be recommended for patients searching for high-quality information about rotator cuff tears.
Given DISCERN scores across studies, information about rotator cuff tears ranked below information about osteosarcoma and juvenile idiopathic arthritis but above information about scoliosis, cervical spine surgery, and ACL reconstruction (Table). DISCERN scores must be compared across studies, as there are no definitions for good and poor DISCERN scores.
Of the 4 studies that analyzed percentage of websites citing peer-reviewed sources, only our study and the study of cervical spine surgery18 analyzed that percentage as well as DISCERN score. Percentage citing peer-reviewed sources was 26% for rotator cuff tears and 24% for cervical spine surgery; the respective DISCERN scores were 44 and 43.6. As only these 2 studies could be compared, no real correlation between percentage of websites citing peer-reviewed sources and the quality of the content on a given topic can be assessed. More research into this relationship is needed. One already delineated association is the correlation between HONcode-certified sites and high DISCERN scores.21 For high-quality medical information, physicians can direct their patients both to academic institution websites and to HONcode-certified websites.
When we compared the present study with previous investigations, we found a large difference between search results for a given topic. In 2013, Duncan and colleagues6 and Bruce-Brand and colleagues9 used similar study designs (eg, search terms, search engines) for their investigations of quality of web information. Their results, however, were widely different. For example, percentages of industry authorship were 4.5% (Duncan and colleagues6) and 64% (Bruce-Brand and colleagues9). This inconsistency between studies conducted during similar periods might be related to what appears at the top of the results queue for a search. Duncan and colleagues6 analyzed 200 websites, Bruce-Brand and colleagues9 only 45. Industries may have made financial arrangements and used search engine optimization techniques to have their websites listed first in search results.
In our study, we also analyzed how web information has changed over time. On the Internet, information changes daily, and we hypothesized that the content found during our 2 searches (2011, 2014) would yield different results. Surprisingly, the data were similar, particularly concerning authorship (Figures 1, 2). In both searches, the largest authorship source was private physician or physician groups (38% in 2011 and 2014). Other authorship sources showed little change in percentage between searches. As for content, we found both increases and decreases in specific web information. Ability to contact authors increased from 21% (2011) to 50% (2014). We think it is important that websites offer a communication channel to people who read the medical information the sites provide. Percentage of websites discussing nonoperative treatment options increased from 11.5% to 61%. Therefore, patients in 2014 were being introduced to more options (in addition to surgery) for managing shoulder pain—an improvement in quality of information between the searches. Percentage of websites discussing surgical eligibility, however, decreased from 43% to 18%—a negative development in information quality. Another decrease, from 42% to 25%, was found for websites discussing surgical complications. Given the data as a whole, and our finding both negative and positive changes, it appears the quality of web content has not improved significantly. Interestingly, no websites discussed double- versus single-row surgery in 2014, but 6% did so in 2011.
Lost in the discussion of quality and reliability of information is whether patients comprehend what they are reading.23 Yi and colleagues19 recentlyassessed the readability level of arthroscopy information in articles published online by the American Academy of Orthopaedic Surgeons (AAOS) and the Arthroscopy Association of North America (AANA). The investigators used the Flesch-Kincaid readability test to determine readability level in terms of grade level. They found that the majority of the patient education articles on the AAOS and AANA sites had a readability level far above the national average; only 4 articles were written at or below the eighth-grade level, the current average reading level in the United States.24 Information that is not comprehensible is of no use to patients, and information that physicians and researchers consider high-quality might not be what patients consider high-quality. As we pursue higher-quality web content, we need to consider that its audience includes nonmedical readers, our patients. In the present study, we found that the readability of a website had no correlation with the site’s DISCERN score (Figure 5). Therefore, for information about rotator cuff repairs, higher-quality websites are no harder than lower-quality sites for patients to comprehend. The Flesch-Kincaid readability test is flawed in that it considers only total number of syllables per word and words per sentence, not nontextual elements of patient education materials, such as illustrations on a website. The 10.98 mean grade level found in our study is higher than the levels found for most studies reviewed by Yi and colleagues.19
This study had several limitations. During an Internet search, the number of websites a user visits drops precipitously after the first page of results. Studies have shown the top 20 sites in a given search receive 97% of the views, and the top 3 receive 58.4%. Whether patients visit websites far down in the list of 150 we found in our given search is unknown. Last, the Flesch-Kincaid readability test is flawed in several ways but nevertheless is used extensively in research. Grading is based on number of words and syllables used in a given sentence; it does not take into account the complexity or common usage of a given word or definition. Therefore, websites may receive low Flesch-Kincaid scores—indicating ease of reading—despite their use of complex medical terminology and jargon that complicate patients’ comprehension of the material.
Conclusion
Numerous authors have evaluated orthopedic patients’ accessing of medical information from the Internet. Although the Internet makes access easier, unreliable content can lead patients to develop certain notions about the direction of their care and certain expectations regarding their clinical outcomes. With there being no regulatory body monitoring content, the peer review process, an essential feature of academic publishing, can be easily circumvented.25
In this study, the highest-quality websites had academic affiliations. Quality of information about rotator cuff repairs was similar to what was found for other orthopedic topics in comparable studies. Surprisingly, there was little change in authorship and content of web information between our 2 search periods (2011, 2014). Although there has been a rapid increase in the number of medical websites, quality of content seems not to have changed significantly. Patients look to physicians for guidance but increasingly are accessing the Internet for additional information. It is essential that physicians understand the quality of information available on the Internet when counseling patients regarding surgery.
1. Brunnekreef JJ, Schreurs BW. Total hip arthroplasty: what information do we offer patients on websites of hospitals? BMC Health Serv Res. 2011;11:83.
2. Koh HS, In Y, Kong CG, Won HY, Kim KH, Lee JH. Factors affecting patients’ graft choice in anterior cruciate ligament reconstruction. Clin Orthop Surg. 2010;2(2):69-75.
3. Nason GJ, Baker JF, Byrne DP, Noel J, Moore D, Kiely PJ. Scoliosis-specific information on the Internet: has the “information highway” led to better information provision? Spine. 2012;37(21):E1364-E1369.
4. Groves ND, Humphreys HW, Williams AJ, Jones A. Effect of informational Internet web pages on patients’ decision making: randomised controlled trial regarding choice of spinal or general anaesthesia for orthopaedic surgery. Anaesthesia. 2010;65(3):277-282.
5. Purcell K, Brenner J, Rainie L. Search Engine Use 2012. Washington, DC: Pew Internet & American Life Project; 2012.
6. Duncan IC, Kane PW, Lawson KA, Cohen SB, Ciccotti MG, Dodson CC. Evaluation of information available on the Internet regarding anterior cruciate ligament reconstruction. Arthroscopy. 2013;29(6):1101-1107.
7. Lichtenfeld LJ. Can the beast be tamed? The woeful tale of accurate health information on the Internet. Ann Surg Oncol. 2012;19(3):701-702.
8. Ahmed OH, Sullivan SJ, Schneiders AG, McCrory PR. Concussion information online: evaluation of information quality, content and readability of concussion-related websites. Br J Sports Med. 2012;46(9):675-683.
9. Bruce-Brand RA, Baker JF, Byrne DP, Hogan NA, McCarthy T. Assessment of the quality and content of information on anterior cruciate ligament reconstruction on the Internet. Arthroscopy. 2013;29(6):1095-1100.
10. Dy JC, Taylor SA, Patel RM, Kitay A, Roberts TR, Daluiski A. The effect of search term on the quality and accuracy of online information regarding distal radius fractures. J Hand Surg Am. 2012;37(9):1881-1887.
11. Garcia RM, Messerschmitt PJ, Ahn NU. An evaluation of information on the Internet of a new device: the lumbar artificial disc replacement. J Spinal Disord Tech. 2009;22(1):52-57.
12. Gosselin MM, Mulcahey MK, Feller E, Hulstyn MJ. Examining Internet resources on gender differences in ACL injuries: what patients are reading. Knee. 2013;20(3):196-202.
13. Lam CG, Roter DL, Cohen KJ. Survey of quality, readability, and social reach of websites on osteosarcoma in adolescents. Patient Educ Couns. 2013;90(1):82-87.
14. Morr S, Shanti N, Carrer A, Kubeck J, Gerling MC. Quality of information concerning cervical disc herniation on the Internet. Spine J. 2010;10(4):350-354.
15. Starman JS, Gettys FK, Capo JA, Fleischli JE, Norton HJ, Karunakar MA. Quality and content of Internet-based information for ten common orthopaedic sports medicine diagnoses. J Bone Joint Surg Am. 2010;92(7):1612-1618.
16. Stinson JN, Tucker L, Huber A, et al. Surfing for juvenile idiopathic arthritis: perspectives on quality and content of information on the Internet. J Rheumatol. 2009;36(8):1755-1762.
17. Sullivan TB, Anderson JS, Ahn UM, Ahn NU. Can Internet information on vertebroplasty be a reliable means of patient self-education? Clin Orthop Relat Res. 2014;472(5):1597-1604.
18. Weil AG, Bojanowski MW, Jamart J, Gustin T, Lévêque M. Evaluation of the quality of information on the Internet available to patients undergoing cervical spine surgery. World Neurosurg. 2014;82(1-2):e31-e39.
19. Yi PH, Ganta A, Hussein KI, Frank RM, Jawa A. Readability of arthroscopy-related patient education materials from the American Academy of Orthopaedic Surgeons and Arthroscopy Association of North America web sites. Arthroscopy. 2013;29(6):1108-1112.
20. Boyer C, Selby M, Scherrer JR, Appel RD. The Health On the Net code of conduct for medical and health websites. Comput Biol Med. 1998;28(5):603-610.
21. Silberg WM, Lundberg GD, Musacchio RA. Assessing, controlling, and assuring the quality of medical information on the Internet: Caveant lector et viewor—Let the reader and viewer beware. JAMA. 1997;277(15):1244-1245.
22. Fabricant PD, Dy CJ, Patel RM, Blanco JS, Doyle SM. Internet search term affects the quality and accuracy of online information about developmental hip dysplasia. J Pediatr Orthop. 2013;33(4):361-365.
23. Aslam N, Bowyer D, Wainwright A, Theologis T, Benson M. Evaluation of Internet use by paediatric orthopaedic outpatients and the quality of information available. J Pediatr Orthop B. 2005;14(2):129-133.
24. Wetzler MJ. “I found it on the Internet”: how reliable and readable is patient information? Arthroscopy. 2013;29(6):967-968.
25. Qureshi SA, Koehler SM, Lin JD, Bird J, Garcia RM, Hecht AC. An evaluation of information on the Internet about a new device: the cervical artificial disc replacement. Spine. 2012;37(10):881-883.
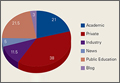
How to Make Your Patient With Sleep Apnea a Super User of Positive Airway Pressure Therapy
Adherence to positive airway pressure (PAP) therapy is a difficult patient management issue. Clinicians at the John D. Dingell VA Medical Center in Detroit (VAMC Detroit) developed the O’Brien criteria and extensive patient education materials to increase patient adherence. The importance of PAP therapy and the reasons veterans should sleep with a PAP machine for 7 to 9 hours each night are stressed (many sleep only 4 to 5 hours). Several recent studies have confirmed widely varying PAP therapy adherence rates (30%-84%).1-13 A majority of patients indicated that mask discomfort is the primary reason for nonadherence.1
Adherence is affected by many factors, including heated humidity, patient education, mask type, and type of PAP machine (eg, continuous PAP [CPAP] vs bilevel PAP [BPAP]; auto-PAP vs CPAP). Other factors, such as race and economic status, also affect adherence.14 The Wisconsin Sleep Cohort Study found that patients with moderate-to-severe untreated obstructive sleep apnea (OSA) were 4 to 5 times more likely to die of a cardiovascular event and 3 times more likely to die of any cause.15 The morbidity and mortality associated with severe untreated OSA led the clinicians to intensify treatment efforts.16In this article, the authors summarize the initiative at the VAMC Detroit to enhance PAP therapy adherence in patients with sleep apnea. The goal was to motivate patients to maximize PAP machine use. This article is a guide that federal health care providers and their civilian counterparts in the private sector can use to maximize PAP machine use. Working toward that goal, a set of PAP “super user” criteria was developed and used to create a 5-point method for encouraging patients to maximize adherence to PAP therapy.
Background
Positive airway pressure is the room air pressure, measured in centimeters of H2O, which splints open the airway to prevent snoring, apneas, and hypopneas. An apnea is a 90%-plus airway obstruction that lasts longer than 10 seconds and is seen with sleep study polysomnography. A hypopnea is a 30%-plus airway obstruction that lasts longer than 10 seconds and is accompanied by a 3% drop in pulse oximetry (SpO2).
A CPAP device delivers pressure continuously through a medical air compressor or flow generator called a PAP machine. The BPAP machine has separate inspiratory pressure and expiratory pressure. Auto-PAP machines give minimum pressure and maximum pressure usually between the range of 4 cm H2O to 20 cm H2O. This machine finds the user’s median pressure (90th percentile) and maximum pressure and averages pressure over a specified period of use. The auto-PAP can then be set to CPAP mode and the pressure fixed or set to the 90th percentile.
O’Brien Criteria
The O’Brien criteria for PAP super-user status (Table 1) were developed for maximizing PAP machine use and presented at the 2013 John D. Dingell Sleep and Wake Disorders Center Symposium. There is no other published reference or criteria proposed for maximizing PAP machine adherence. A recent study on sleep time criteria suggested that a higher percentage of patients achieved normal functioning with longer duration nightly CPAP therapy, which is in line with the authors’ recommended PAP machine use duration.17
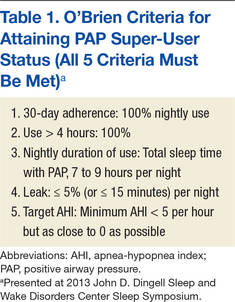
Positive airway pressure therapy is eligible for insurance reimbursement by Medicare and third-party payers for adult patients who have OSA and achieve 4 hours of nightly use for 70% of nights over 30 days. Coverage for CPAP therapy is initially limited to 12 weeks during which beneficiaries with an OSA diagnosis can be identified and any therapy benefits documented. Subsequent CPAP therapy is covered only for those OSA patients who benefit during the 12-week period.18At VAMC Detroit, the data covering the previous 30 days of use is downloaded. Medicare allows for the best 30-day period out of the 12-week window. The hospital, along with Harper Hospital and the Detroit Medical Centers in conjunction with the Wayne State University sleep program, is an Academic Center of Distinction, which follows the sleep guidelines and practice parameters for Medicare, third-party insurance companies, and the American Academy of Sleep Medicine.
The sleep clinic clinicians follow the clinical guidelines for evaluation, management, and long-term care of adults with OSA.19,20 Follow-up visits are scheduled and made on a consultation basis up to 90 days for the required download or as necessary for PAP therapy. In this initiative, practitioners offer veteran-specific patient care with PAP therapy that exceeds Medicare guidelines. The success of this process yielded a growing cohort of PAP super users at VAMC Detroit. These patients exceed the Medicare criterion of 4 hours of nightly use for 70% of nights over 30 days. Thus, 4 hours of nightly use for 100% of nights over the same period was proposed as another criterion.
The super-user criteria, which provide motivation to reach the top, stimulate many patients to achieve the Medicare criteria. All 5 criteria must be satisfied to attain super-user status, and becoming a super user is not easy. In fact, the expectation is that, if an adherence data study is conducted, it will show that only a small percentage of all users meet the criteria. Maximum adherence is expected to be the tail (3%-4%) of a bell-shaped curve.
PAP Super-User Status
At the initial evaluation, practitioners create a self-fulfilling prophecy that, as first described by Merton, sets expectations.21 A self-fulfilling prophecy is a prediction that directly or indirectly causes the prediction to become true as a result of the positive feedback between belief and behavior.21 The personnel at VAMC Detroit sleep clinic set a tone that enables patients to meet and exceed the Medicare sleep guidelines and their expectations. Patients are encouraged to make it their personal mission to achieve the goal of becoming a PAP super user. The patients receive the O’Brien criteria for PAP super-user status—guidelines thought to contribute to higher quality of life.
The Medicare criterion emphasized is the minimum required for full adherence. The goal is to reduce sleepiness and increase well-being. The literature shows that increasing duration of sleep results in lower daytime sleepiness.22 Inadequate sleep has many detrimental effects. According to a recent study, insufficient sleep contributes to weight gain.22 Desired patient outcomes are increased sleep time without arousals, increased slow-wave sleep (SWS), consolidation of memories and rapid eye movement (REM), and improvement in emotional and procedural skill memories.23 Patients are informed that using a PAP machine for 7 to 9 hours can reduce excessive daytime sleepiness and allow for more SWS and REM sleep, which help improve memory, judgment, and concentration. Many other studies have shown how 7 to 9 hours of sleep benefit adults. Thus, 7 to 9 hours became the criterion for maximizing PAP sleep time.
Initial Evaluation and Sleep Study
A primary care provider can enroll a patient into the clinic for a sleep study by requesting an evaluation. The consultation is then triaged using the STOP-BANG (Snoring, Tiredness, Observed apnea, high blood Pressure–Body mass index > 35, Age > 50, Neck circumference > 40 cm, Gender male) questionnaire. The STOP-BANG has a high sensitivity for predicting moderate-to-severe (87.0%) and severe (70.4%) sleep-disordered breathing.24 More than 3 affirmative answers indicate a high risk for sleep-disordered breathing and is cause for ordering a sleep study.
CPAP Group Class
Patients with a diagnosis of sleep apnea subsequently receive their CPAP machines when they attend a 2-hour group class taught by a respiratory therapist. Group education sessions increase the chance of issuing more machines and providing better education.25 One study found that “attendance in a group clinic designed to encourage compliance with CPAP therapy provided a simple and effective means of improving treatment of OSA.”25
In class, the respiratory therapist briefly assesses each patient’s CPAP prescription, describes the patient’s type of sleep apnea and final diagnosis, and reviews the CPAP machine’s features. Veterans are then instructed to take their CPAP machines home to use all night, every night for 4 weeks. All night is defined as a period of 7.5 to 8 hours, as population-based study results have shown that sleep of this duration is associated with lowest cardiovascular morbidity and mortality. After the initial 4-plus weeks of machine use, patients with all their CPAP equipment are seen in the sleep clinic.
First Sleep Clinic Follow-Up Visit
At first follow-up, patients are asked for a subjective evaluation of their sleep. Most state they are “better” with PAP therapy. Each patient’s mask is checked and refitted with the patient’s prescribed pressure.
Patients are informed of their PAP settings and requirements from the sleep study and told their particular “magic pressure.” Patients understand that a person’s magic pressure, determined in the laboratory, is the pressure of room air blown into the nose, mouth, or both that eliminates not only snoring, but also partial and complete airway obstructions (hypopneas, apneas). Patients are asked to remember their particular magic pressure and their AHI and told their OSA status (mild, moderate, or severe) as assessed by the laboratory study.26 Extensive education on sleep apnea and treatment are also addressed. Education and training are among the most important tenets of PAP therapy, and these are incorporated into all encounters.25,26
PAP Data Report and Leak
The CPAP data are downloaded and printed. If adherence is suboptimal, clinician and patient discuss increasing adherence and possibly becoming a super user. The patient receives a copy of the report, which can be compared with the patient’s adherence statistics and with the adherence statistics of similar patients who are super users. A few blacked-out names are posted on the board in front of the provider’s computer station. Patients can thus easily see that attaining super-user status is very difficult but possible. Some patients maximize their therapy and are designated PAP super users. These patients are proud to receive this designation, and they strive to keep it.
Data downloads are crucial for adherence. In a recent study, the American Thoracic Society stated, “Providers need to be able to interpret adherence systems.”27
The clinic provides a summary report on each patient’s adherence. A provider interpretation is added, and the report is copied into the Computer Patient Record System.
After the report is downloaded, the provider checks for correct pressure and then for a large leak. A large leak is an unintentional leak (the total amount that leaks but not including leak from the mask) > 5% of the night. A leak of > 15 minutes was added to the super-user criteria, because some software provides the average time of a large leak per day in minutes.28 Many veterans sleep only 4 to 5 hours nightly (300 minutes × 5% = 15 minutes). Therefore, the leak should not be more than 5% or 15 minutes for a veteran sleeping 5 hours.
The machine indicates a percentage of leak on the patient self-check LED screen for adherence. There is no standardized leak criterion used by all flow-generator manufacturers. Every mask has venting designed to leak intentionally so that the patient does not rebreathe air CO2. The main concern is unintentional leaks above the intentional leak or venting threshold.
The ResMed CPAP (ResMed Corp, San Diego, CA) maximum intentional leak is 24 L/min.29 Above that level is large leak. The exact leak amount varies by interface (mask) based on pressure and mask type.2,12
The larger the interface surface area, the larger the leak. Unintentional leak is higher with the full-face mask than with the nasal mask, most likely because there is more opportunity for leakage with the larger surface area of the full-face mask. Nasal pillows seem to leak less because of their smaller surface area, but more studies on mask interfaces are needed to validate this finding.
Chin Strap
Adding a chin strap improved patient adherence, nightly duration of use, residual AHI, and leak in patients with sleep apnea.30 Other investigators reported reduced OSA, confirmed by polysomnography and nasopharyngolaryngoscopy, with use of only a chin strap.31 When a nasal mask with chin strap is used, the strap should be made to fit properly over the chin, not on the throat. Properly used chin straps significantly reduce leakage and residual AHI.30
A chin strap most likely reduces large leak and dry mouth.30 Dry mouth can result from mouth leak, which is commonly caused by nasal congestion or high pressure and mouth breathing. The nasal turbinates help humidify, warm, and cool the air. Heated humidification of PAP can help prevent dry mouth.
Asking the Right Questions
The clinician should ask several key questions at the first follow-up: How is it going with your PAP machine? Do you feel PAP therapy is helping you sleep? Do you feel better with PAP therapy? To a patient who states he or she is not doing well with therapy, the clinician should ask, What type of problems are you having? In many cases, poor adherence is attributable to a large leak from a poorly fitting mask. A large leak can also increase residual AHI and cause frequent arousals.30
Some machines cannot maintain the pressure of a large leak and will shut off and trigger an alarm that wakes the patient to readjust the mask. This situation causes some patients to discontinue CPAP/BPAP use. The mask leak must be adjusted. Another common complaint is morning dry mouth. This extreme dryness—a significant clue pointing to mouth leak caused in part by the mouth dropping open during sleep with PAP—should be addressed by fitting the patient with a chin strap.30 Dry mouth also can be caused by low humidity; increasing the humidity setting usually resolves the problem. However, as one study found, use of controlled heated humidification did not improve adherence or quality of life.32 In the same study, the nasopharyngeal dryness that resulted from CPAP therapy without humidification was reduced immediately and during the first weeks of treatment.All current PAP machines feature heated humidification.
Mouth breathing can also result from nasal congestion, allergic or vasomotor rhinitis, nasal turbinate hypertrophy, obstruction from a deviated septum, polyps, or air hunger/insufficient PAP pressure. Chronic rhinosinusitis is a problem that affects up to 12.5% of the U.S. population.33
Adherence is also increased with the elimination of leak and associated arousals. Patients are shown how to use their PAP machine’s heated humidity settings to obtain desired comfort levels. The clinician explains that the nasal turbinates heat and cool the air and that they can become swollen and irritated with PAP therapy. A heated hose may be prescribed to provide optimal humidification without condensation or water dripping into the hose (rainout).
A full-face mask is used only when the patient cannot breathe out the nose adequately or when PAP becomes too high. A 2013 study found no significant differences among ResMed, Respironics, and Fisher & Paykel CPAP interfaces (Fisher & Paykel Healthcare, Irvine, CA).34 The clinician determines which mask is comfortable for a patient and tries to stay with that mask for that patient.
Adherence Report
A therapy data summary is downloaded and reviewed with the patient.28 A pattern of use report that shows daily use with times over the month is also reviewed.28 The software’s sleep therapy long-term trend report lists important statistics. The adherence data summary and the CPAP summary are also reviewed (Table 2).28 This page is printed and given to patients to reieiw their progress. For some it represents a reward for using the CPAP/BPAP machine as well as a congratulatory note.
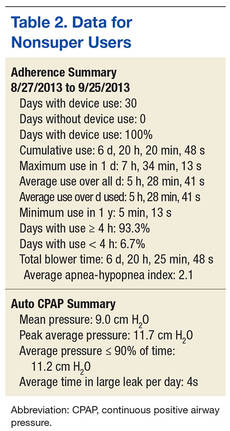
In the Example 1 summary download (Table 2), a patient used a PAP machine 4 hours or more on 93.3% of the 30 days the machine was used.28 Residual AHI was low, 2.1, and there was no appreciable leak. The PAP of 11.2 cm H2O was in the 90th percentile. The patient was fixed to 12 cm H2O with expiratory pressure relief (EPR) of 1. The EPR is a comfort feature that reduces pressure from 1 cm H2O to 3 cm H2O to make it easier for the patient to exhale. (A flow generator that produces EPR of > 3 cm H2O is a BPAP machine.)
This patient was not a super user. Overall use was low—5 hours, 28 minutes—which could indicate behaviorally insufficient sleep syndrome. Sleep time is controversial, but the National Sleep Foundation recommends 7 to 9 hours of sleep per night.
A different patient used a PAP machine 4 hours or more on 100% (28/28) of the days when the machine was used (Table 3).29 Residual AHI was low (0.6), median use was 8 hours, 47 minutes, and there was no appreciable leak. The patient was using autoset mode with a minimum pressure of 13 cm H2O and maximum pressure of 18 cm H2O. The 95th percentile pressure was 13.6 cm H2O. The patient’s pressure was changed to 14 cm H2O with EPR of 3. This patient was a super user.
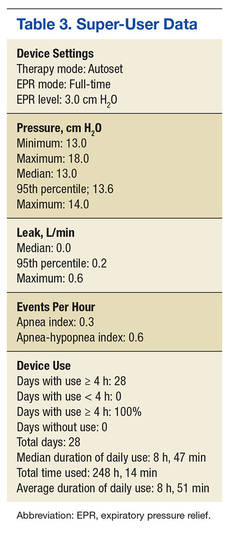
Sleep Hygiene Discussion
Providers must discuss sleep hygiene (good sleep habits) with veterans. If needed, AASM pamphlets on sleep hygiene and other educational materials can be provided. The bedroom should be cool, comfortable, quiet, and dark and should not include a television or computer. Exposure to room light before bedtime suppresses melatonin onset and shortens melatonin duration and tells the brain it is time to wake up.34
Patients are asked about the number of arousals they have per night. At first follow-up, providers must determine what is causing a patient to arouse while on CPAP/BPAP therapy. Some causes are air leak resulting in unresolved OSA, nocturia (may be triggered by unresolved OSA), dry mouth (indicating need for chin strap), nightmares (suggestive of unresolved OSA in REM sleep), posttraumatic stress disorder (PTSD), environmental noise, and claustrophobia. The provider should have thought-out answers to these problems in advance.
Epworth Sleepiness Scale
The Epworth Sleepiness Scale (ESS) is administered as part of the baseline comprehensive examination and at every sleep clinic follow-up after issuing a CPAP/BPAP machine.35 The first evaluation after the machine is issued should show a reduction in ESS. No reduction in ESS indicates that a problem needs to be addressed. The most common reason for insufficient reduction in ESS is suboptimal PAP therapy adherence, usually because of a large leak. Some cases of poor adherence may be attributable to restless legs syndrome, periodic limb movement disorder, chronic musculoskeletal pain, and sleep fragmentation caused by alcohol, smoking, caffeine, or cocaine. Excessive daytime sleepiness may persist from use of pain medications or other sedating medications. One study found a correlation between sleep duration with CPAP therapy and reduction in ESS.36 In addition to administering the ESS, patients are asked how they doing with PAP therapy, and the answer is documented. Treatment changes are made if needed to reduce excessive daytime sleepiness.
Ear-Nose-Throat Examination
A quick look into the nose with a nasal speculum is a crucial component of a thorough examination. The clinician looks for a deviated septum, swollen turbinates, obstruction, polyps, bleeding, infection, septal perforation, and discharge. In addition, the patient is checked for airflow amount, nasal congestion, and obstruction; if necessary a nasal steroid spray or a nasal saline spray is prescribed. In some cases, saline spray can be added to the steroid spray to help reduce or eliminate nasal congestion.37
Treatment of congestion requires education, as many patients improperly use these sprays. The steroid spray is not an instant vasoconstrictor; a week of regular use is needed to reduce inflammation and congestion. Saline spray and saline irrigation can be used as a treatment adjunct for symptoms of chronic rhinosinusitis.37If the steroid and saline sprays fail after a 2-month trial, consider an ear-nose-throat (ENT) consultation. A recent study found that adherence rates increased after septoplasty in patients with nasal obstruction.38 The throat is examined for macroglossia or scalloping of the tongue.39 Macroglossic Mallampati IV tongues are platterlike. They are big, long, and wide and often have impressions or scalloping along the outside from a molding of the teeth. The patient is shown a Mallampati diagram and given a Mallampati score.
Creating a Sense of Mission
The sleep physician assistant (PA)at the Detroit VAMC is a retired U.S. Army colonel who ensures that the language the physician uses aligns with the language veterans use. Behavioral techniques are used to create a common culture that helps overcome obstacles—allowing patients to understand the benefits of and need for full CPAP/BPAP therapy adherence. One technique reinforces their sense of mission accomplishment, their military pride, and their interservice rivalry to increase adherence. The mission with each patient is to “work until success is achieved...but the patient can’t quit.” The mantra given to a patient with a difficult case is, “We will not let you fail with CPAP/BPAP therapy,” which echoes a familiar military motto, “We will not leave you behind.” Also, the goal of the physician is: Never give up on the patient.
Behavioral and Psychological Principles
The behavioral and psychological principles for success with PAP super users should be studied to validate better outcomes with longer duration PAP machine use. Patients who are motivated to succeed and to participate in their care can make great strides in changing their behavior to get more and better sleep. Obese patients can get referrals to the MOVE! weight loss program. Some veterans simply follow instructions, pay attention to detail, and do what they are told regarding sleep, PAP education, and good sleep hygiene. Many veterans have poor sleep hygiene and insomnia because they watch television or play games on electronic devices right before bedtime. Many patients develop behaviorally insufficient sleep syndrome. Their behavior prevents them from going to bed at a time that will allow sufficient sleep. Some veterans smoke or drink caffeinated beverages or al cohol immediately before sleep time and then wonder why they have insomnia.
Veterans with insomnia may be referred to the insomnia clinic psychologist for cognitive behavioral therapy for insomnia.40 Referral to this psychologist can be very helpful in the treatment of insomnia after the patient’s OSA has been treated. Veterans are encouraged to follow good sleep hygiene principles and permanently discontinue detrimental sleep behaviors.
For veterans with PTSD, imagery rehearsal before sleep has been effective in resolving disturbing nightmares and excluding their violent details.41 Clinicians recommend that these veterans rehearse a pleasant dream before sleep time. Cartwright and Lamberg performed extensive research on dreams and nightmares, and their book may provide insight into reducing nightmares for veterans with severe PTSD.42 Persistent nightmares associated with PTSD also can be reduced with use of prazosin. 43
Sleep Clinic Economics
The economic impact of OSA is substantial because of increased risk of cardiovascular disease and risk of motor vehicle accidents and decreased quality of life and productivity. Results of cost-effectiveness analyses support the value of diagnosing and treating OSA. Studies have provided estimates from a payer perspective, ranging from $2,000 to $11,000 per quality-adjusted life year over 5 years for treating moderate-to-severe OSA. The Sleep Heart Health Study showed that OSA was associated with an 18% increase in predicted health care utilization based on medication use.44,45 Moreover, CPAP therapy was found to be clinically more effective than no treatment: Therapy increased life expectancy in males and females, and effective treatment of OSA was associated with lower health care and disability costs and fewer missed workdays.
The authors’ initiatives to improve PAP therapy adherence required adding a PA and a registered respiratory therapist (RT) to the staff of 2 full-time equivalent (FTE) board-certified sleep physicians. The sleep physicians trained the PA to initiate and complete all the recommendations described, and the PA attended an AASM-sponsored review course for additional training. The PA is responsible for performing comprehensive face-to-face clinical evaluations in 4 half-day clinic sessions each week, as well as providing follow-up care in 4 additional half-day clinic sessions each week.
During these sessions, the PA provides education about sleep apnea and treatment. Thirty-minute follow-up clinic appointments are reserved for downloading CPAP data, providing interpretation, and educating patients to maximize PAP therapy and become super users. The remaining clinic sessions are run by 3 sleep fellows under the supervision of the sleep physicians. During all visits, providers encourage patients to maintain good sleep hygiene. Nonadherent patients are scheduled to be seen in a separate clinic session during which the RT troubleshoots and corrects PAP machine and mask-related problems.
Setting up the CPAP group classes and follow-up clinics required adding an FTE RT at a cost of $44,000 to $48,000 per year. By recruiting an FTE PA starting at GS-12 and $75,542 instead of another board-certified sleep physician, VAMC Detroit was able to provide increased access to patient care (8 clinics) at sizable financial savings (estimate, $75,000/y). A 0.5 FTE clinical psychologist provided cognitive behavioral therapy for insomnia and PAP therapy nonadherence and helped achieve the initiative’s goals.
The sleep center projects that the overall cost-effectiveness of these initiatives in terms of admission rates, life expectancy, and productivity would not be dissimilar to that reported in the peer-reviewed literature, as noted earlier. The center’s upcoming research projects will provide more data specific to its population. Educating patients requires that only motivated providers give patients instructions during a 30-minute follow-up clinic visit—there is no additional expense. This model of intensive care can be adopted at other VAMCs.
Conclusion
Maximizing PAP machine use is a unique approach that stimulates veterans to attain the highest level of adherence. This approach is based on clinical observation and patient encounters, and treatment recommendations over 8 years.
Showing enthusiasm with patients is crucial. Enthusiasm is contagious. Clinicians who are also PAP machine users should let patients know of their PAP super-user status and add that many others have attained this status, too. The benefits of optimal treatment are reviewed with patients: increased energy, lower risk of cardiovascular disease, lower blood pressure, better insulin sensitivity, and overall reduced mortality. Some patients have difficulty using the nasal mask and chin strap and understanding and adhering to PAP therapy. These impediments can be overcome with further education and follow-up. Sleep clinic clinicians take the time to show patients how to use the machine’s self-adherence check and leak functions. Patients can then monitor their progress daily.
To motivate patients, clinicians should set expectations early, invest time in providing education at follow-up; be diligent with respect to mask fitting and download evaluation. Sleep clinic providers should also speak the veterans’ language, create a self-fulfilling prophesy for success, and schedule a follow-up sleep clinic appointment if a patient is not fulfilling the Medicare adherence criterion of 4 hours’ nightly use for 70% of nights over 30 days.
PAP therapy coaching and persistent education with provider contact and enthusiasm can improve adherence. Encouragement and praise can help patients exceed Medicare’s minimum PAP therapy criterion and improve their overall PAP experience. The sleep team should tell patients they are proud of their accomplishments with such a difficult treatment. Being genuine and caring and showing concern about their evaluation, treatment, and follow-up is important. This helps reduce their OSA-related morbidity, lessen their depression, and improves their daily well-being and quality of life.
“The variation in responses to CPAP and acceptance of CPAP suggest that focused interventions, rather than one-size-fits-all interventions, may have a greater effect on the overall outcome of CPAP adherence,” wrote Weaver and Sawyer.46
Finally, one cannot equate spending on veteran care with spending in other areas of the national budget. The real cost of not giving veterans appropriate care will be a loss of trust, given that the overarching mission is “to care for him who shall have borne the battle and for his widow and his orphan.”
1. Boyaci H, Gacar K, Baris SA, Basyigit I, Yildiz F. Positive airway pressure device compliance of patients with obstructive sleep apnea syndrome. Adv Clin Exp Med. 2013;22(6):809-815.
2. Bachour A, Vitikainen P, Virkkula P, Maasilta P. CPAP interface: satisfaction and side effects. Sleep Breath. 2013;17(2):667-672.
3. Wimms AJ, Richards GN, Genjafield AV. Assessment of the impact on compliance of a new CPAP system in obstructive sleep apnea. Sleep Breath. 2013;17(1):69-76.
4. Smith I, Nadig V, Lasserson TJ. Educational, supportive and behavioral interventions to improve usage of continuous positive airway pressure machines for adults with obstructive sleep apnea. Cochrane Database Syst Rev. 2009;(2):CD007736.
5. Beecroft J, Zanon S, Lukic D, Hanly P. Oral continuous positive airway pressure for sleep apnea: effectiveness, patient preference, and adherence. Chest. 2003;124(6):2200-2208.
6. Chai CL, Pathinathan A, Smith B. Continuous positive airway pressure delivery interfaces for obstructive sleep apnoea. Cochrane Database Syst Rev. 2006;(4):CD005308.
7. Nilius G, Happel A, Domanski U, Ruhle KH. Pressure-relief continuous positive airway pressure vs constant continuous positive airway pressure: a comparison of efficacy and compliance. Chest. 2006;130(4):1018-1024.
8. Ballard RD, Gay PC, Strollo PJ. Interventions to improve compliance in sleep apnea patients previously non-compliant with continuous positive airway pressure. J Clin Sleep Med. 2007;3(7):706-712.
9. Sin DD, Mayers I, Man GC, Pawluk L. Long-term compliance rates to continuous positive airway pressure in obstructive sleep apnea: a population-based study. Chest. 2002;121(2):430-435.
10. Mortimore IL, Whittle AT, Douglas NJ. Comparison of nose and face mask CPAP therapy for sleep apnoea. Thorax. 1998;53(4):290-292.
11. Haniffa M, Lasserson TJ, Smith I. Interventions to improve compliance with continuous positive airway pressure for obstructive sleep apnoea. Cochrane Database Syst Rev. 2004;(4):CD003531.
12. Kushida CA, Berry RB, Blau, A, et al. Positive airway pressure initiation: a randomized controlled trial to assess the impact of therapy mode and titration process on efficacy, adherence, and outcomes. Sleep. 2011;34(8):1083-1092.
13. Gentina T, Fortin F, Douay B, et al. Auto bi-level with pressure relief during exhalation as a rescue therapy for optimally treated obstructive sleep apnoea patients with poor compliance to continuous positive airways pressure therapy--a pilot study. Sleep Breath. 2011;15(1):21-27.
14. Billings, ME, Auckley D, Benca R, et al. Race and residential socioeconomics as predictors of CPAP adherence. Sleep. 2011;34(12):1653-1658.
15. Young T, Finn L, Peppard PE, et al. Sleep disordered breathing and mortality: eighteen-year follow-up of the Wisconsin Sleep Cohort. Sleep. 2008;31(8):1071-1078.
16. Centers for Disease Control and Prevention. Effect of short sleep duration on daily activities--United States, 2005-2008. MMWR Morb Mortal Wkly Rep. 2011;60(8):239-242.
17. Antic NA, Catcheside P, Buchan C, et al. The effect of CPAP in normalizing daytime sleepiness, quality of life, and neurocognitive function in patients with moderate to severe OSA. Sleep. 2011;34(1):111-119.
18. Phurrough S, Jacques L, Spencer F, Stiller J, Brechner R. Coverage decision memorandum for continuous positive airway pressure (CPAP) therapy for obstructive sleep apnea (OSA) (CAG-00093R2). Centers for Medicare & Medicaid Services Website. https://www.cms.gov/medicare-coverage-database/details/nca-decision-memo.aspx?NCAId=204&fromdb=true. Accessed February 5, 2016.
19. Epstein LJ, Kristo D, Strollo PJ Jr, et al; Adult Obstructive Sleep Apnea Task Force of the American Academy of Sleep Medicine. J Clin Sleep Med. 2009;5(3):263-276.
20. Berry RB, Chediak A, Brown LK, et al; NPPV Titration Task Force of the American Academy of Sleep Medicine. Best clinical practices for the sleep center adjustment of noninvasive positive pressure ventilation (NPPV) in stable chronic alveolar hypoventilation syndromes. J Clin Sleep Med. 2010;6(5):491-509.
21. Merton RK. Social Theory and Social Structure. New York, NY: Free Press; 1968.
22. Chaput JP, McNeil J, Després JP, Bouchard C, Tremblay A. Seven to eight hours of sleep a night is associated with a lower prevalence of the metabolic syndrome and reduced overall cardiometabolic risk in adults. PLoS One. 2013;8(9):e72832.
23. Born J, Wagner U. Sleep, hormones, and memory. Obstet Gynecol Clin North Am. 2009;36(4):809-829, x.
24. Silva GE, Vana KD, Goodwin JL, Sherrill DL, Quan SF. Identification of patients with sleep disordered breathing: comparing the four-variable screening tool, STOP, STOP-Bang, and Epworth Sleepiness Scales. J Clin Sleep Med. 2011;7(5):467-472.
25. Soares Pires F, Drummond M, Marinho A, et al. Effectiveness of a group education session on adherence with APAP in obstructive sleep apnea--a randomized controlled study. Sleep Breath. 2013;17(3):993-1001.
26. Berry RB, Budhiraja R, Gottlieb DJ, et al; American Academy of Sleep Medicine. Rules for scoring respiratory events in sleep: update of the 2007 AASM Manual for the Scoring of Sleep and Associated Events. Deliberations of the Sleep Apnea Definitions Task Force of the American Academy of Sleep Medicine. J Clin Sleep Med. 2012;8(5):597-619.
27. Schwab RJ, Badr SM, Epstein LJ, et al; ATS Subcommittee on CPAP Adherence Tracking Systems. An official American Thoracic Society statement: continuous positive airway pressure adherence tracking systems. The optimal monitoring strategies and outcome measures in adults. Am J Respir Crit Care Med. 2013;188(5):613-620.
28. Respironics Encore Pro and Encore Pro 2 [computer program]. Philips, Inc; May 12, 2013.
29. ResMed. Version 04.01.013. San Diego, CA.
30. Knowles SR, O'Brien DT, Zhang S, Devara A, Rowley JA. Effect of addition of chin strap on PAP compliance, nightly duration of use, and other factors. J Clin Sleep Med. 2014;10(4):377-383.
31. Vorona RD, Ware JC, Sinacori JT, Ford ML 3rd, Cross JP. Treatment of severe obstructive sleep apnea syndrome with a chinstrap. J Clin Sleep Med. 2007;3(7):729-730.
32. Ruhle KH, Franke KJ, Domanski U, Nilius G. Quality of life, compliance, sleep and nasopharyngeal side effects during CPAP therapy with and without controlled heated humidification. Sleep Breath. 2011;15(3):479-485.
33. Hamilos DL. Chronic rhinosinusitis: epidemiology and medical management. J Allergy Clin Immunol. 2011;128(4):693-707.
34. Gooley JJ, Chamberlain K, Smith KA, et al. Exposure to room light before bedtime suppresses melatonin onset and shortens melatonin duration in humans. J Clin Endocrinol Metab. 2011;96(3):E463-E472.
35. Johns MW. A new method for measuring daytime sleepiness: the Epworth Sleepiness Scale. Sleep. 1991;14(6):540-545.
36. Bednarek M, Zgierska A, Pływaczewski R, Zielinski J. The effect of CPAP treatment on excessive daytime somnolence in patients with obstructive sleep apnea [in Polish]. Pneumonol Alergol Pol. 1999;67(5-6):237-244.
37. Harvey R, Hannan SA, Badia L, Scadding G. Nasal saline irrigations for the symptoms of chronic rhinosinusitis. Cochrane Database Syst Rev. 2007;(3):CD006394.
38. Poirier J, George C, Rotenberg B. The effect of nasal surgery on nasal continuous positive airway pressure compliance. Laryngoscope. 2014;124(1):317-319.
39. Law JA. From the journal archives: Mallampati in two millennia: its impact then and implications now. Can J Anaesth. 2014;61(5):480-484.
40. Hood HK, Rogojanski J, Moss TG. Cognitive-behavioral therapy for chronic insomnia. Curr Treat Options Neurol. 2014;16(12):321.
41. Harb GC, Thompson R, Ross RJ, Cook JM. Combat-related PTSD nightmares and imagery rehearsal: nightmare characteristics and relation to treatment outcome. J Trauma Stress. 2012;25(5):511-518.
42. Cartwright R, Lamberg L. Crisis Dreaming: Using Your Dreams to Solve Your Problems.. New York, NY: HarperCollins;1992.
43.Writer BW, Meyer EG, Schillerstrom JE. Prazosin for military combat-related PTSD nightmares: a critical review. J Neuropsychiatry Clin Neurosci. 2014;26(1):24-33.
44. Park JG, Ramar K, Olson EJ. Updates on definition, consequences, and management of obstructive sleep apnea. Mayo Clin Proc. 2011;86(6):549-554.
45. Kapur V, Blough DK, Sandblom RE, et al. The medical cost of undiagnosed sleep apnea. Sleep. 1999;22(6):749-755.
46. Weaver TE, Sawyer AM. Adherence to continuous positive airway pressure treatment for obstructive sleep apnoea: implications for future interventions. Indian J Med Res. 2010;131:245-258.
Adherence to positive airway pressure (PAP) therapy is a difficult patient management issue. Clinicians at the John D. Dingell VA Medical Center in Detroit (VAMC Detroit) developed the O’Brien criteria and extensive patient education materials to increase patient adherence. The importance of PAP therapy and the reasons veterans should sleep with a PAP machine for 7 to 9 hours each night are stressed (many sleep only 4 to 5 hours). Several recent studies have confirmed widely varying PAP therapy adherence rates (30%-84%).1-13 A majority of patients indicated that mask discomfort is the primary reason for nonadherence.1
Adherence is affected by many factors, including heated humidity, patient education, mask type, and type of PAP machine (eg, continuous PAP [CPAP] vs bilevel PAP [BPAP]; auto-PAP vs CPAP). Other factors, such as race and economic status, also affect adherence.14 The Wisconsin Sleep Cohort Study found that patients with moderate-to-severe untreated obstructive sleep apnea (OSA) were 4 to 5 times more likely to die of a cardiovascular event and 3 times more likely to die of any cause.15 The morbidity and mortality associated with severe untreated OSA led the clinicians to intensify treatment efforts.16In this article, the authors summarize the initiative at the VAMC Detroit to enhance PAP therapy adherence in patients with sleep apnea. The goal was to motivate patients to maximize PAP machine use. This article is a guide that federal health care providers and their civilian counterparts in the private sector can use to maximize PAP machine use. Working toward that goal, a set of PAP “super user” criteria was developed and used to create a 5-point method for encouraging patients to maximize adherence to PAP therapy.
Background
Positive airway pressure is the room air pressure, measured in centimeters of H2O, which splints open the airway to prevent snoring, apneas, and hypopneas. An apnea is a 90%-plus airway obstruction that lasts longer than 10 seconds and is seen with sleep study polysomnography. A hypopnea is a 30%-plus airway obstruction that lasts longer than 10 seconds and is accompanied by a 3% drop in pulse oximetry (SpO2).
A CPAP device delivers pressure continuously through a medical air compressor or flow generator called a PAP machine. The BPAP machine has separate inspiratory pressure and expiratory pressure. Auto-PAP machines give minimum pressure and maximum pressure usually between the range of 4 cm H2O to 20 cm H2O. This machine finds the user’s median pressure (90th percentile) and maximum pressure and averages pressure over a specified period of use. The auto-PAP can then be set to CPAP mode and the pressure fixed or set to the 90th percentile.
O’Brien Criteria
The O’Brien criteria for PAP super-user status (Table 1) were developed for maximizing PAP machine use and presented at the 2013 John D. Dingell Sleep and Wake Disorders Center Symposium. There is no other published reference or criteria proposed for maximizing PAP machine adherence. A recent study on sleep time criteria suggested that a higher percentage of patients achieved normal functioning with longer duration nightly CPAP therapy, which is in line with the authors’ recommended PAP machine use duration.17
Positive airway pressure therapy is eligible for insurance reimbursement by Medicare and third-party payers for adult patients who have OSA and achieve 4 hours of nightly use for 70% of nights over 30 days. Coverage for CPAP therapy is initially limited to 12 weeks during which beneficiaries with an OSA diagnosis can be identified and any therapy benefits documented. Subsequent CPAP therapy is covered only for those OSA patients who benefit during the 12-week period.18At VAMC Detroit, the data covering the previous 30 days of use is downloaded. Medicare allows for the best 30-day period out of the 12-week window. The hospital, along with Harper Hospital and the Detroit Medical Centers in conjunction with the Wayne State University sleep program, is an Academic Center of Distinction, which follows the sleep guidelines and practice parameters for Medicare, third-party insurance companies, and the American Academy of Sleep Medicine.
The sleep clinic clinicians follow the clinical guidelines for evaluation, management, and long-term care of adults with OSA.19,20 Follow-up visits are scheduled and made on a consultation basis up to 90 days for the required download or as necessary for PAP therapy. In this initiative, practitioners offer veteran-specific patient care with PAP therapy that exceeds Medicare guidelines. The success of this process yielded a growing cohort of PAP super users at VAMC Detroit. These patients exceed the Medicare criterion of 4 hours of nightly use for 70% of nights over 30 days. Thus, 4 hours of nightly use for 100% of nights over the same period was proposed as another criterion.
The super-user criteria, which provide motivation to reach the top, stimulate many patients to achieve the Medicare criteria. All 5 criteria must be satisfied to attain super-user status, and becoming a super user is not easy. In fact, the expectation is that, if an adherence data study is conducted, it will show that only a small percentage of all users meet the criteria. Maximum adherence is expected to be the tail (3%-4%) of a bell-shaped curve.
PAP Super-User Status
At the initial evaluation, practitioners create a self-fulfilling prophecy that, as first described by Merton, sets expectations.21 A self-fulfilling prophecy is a prediction that directly or indirectly causes the prediction to become true as a result of the positive feedback between belief and behavior.21 The personnel at VAMC Detroit sleep clinic set a tone that enables patients to meet and exceed the Medicare sleep guidelines and their expectations. Patients are encouraged to make it their personal mission to achieve the goal of becoming a PAP super user. The patients receive the O’Brien criteria for PAP super-user status—guidelines thought to contribute to higher quality of life.
The Medicare criterion emphasized is the minimum required for full adherence. The goal is to reduce sleepiness and increase well-being. The literature shows that increasing duration of sleep results in lower daytime sleepiness.22 Inadequate sleep has many detrimental effects. According to a recent study, insufficient sleep contributes to weight gain.22 Desired patient outcomes are increased sleep time without arousals, increased slow-wave sleep (SWS), consolidation of memories and rapid eye movement (REM), and improvement in emotional and procedural skill memories.23 Patients are informed that using a PAP machine for 7 to 9 hours can reduce excessive daytime sleepiness and allow for more SWS and REM sleep, which help improve memory, judgment, and concentration. Many other studies have shown how 7 to 9 hours of sleep benefit adults. Thus, 7 to 9 hours became the criterion for maximizing PAP sleep time.
Initial Evaluation and Sleep Study
A primary care provider can enroll a patient into the clinic for a sleep study by requesting an evaluation. The consultation is then triaged using the STOP-BANG (Snoring, Tiredness, Observed apnea, high blood Pressure–Body mass index > 35, Age > 50, Neck circumference > 40 cm, Gender male) questionnaire. The STOP-BANG has a high sensitivity for predicting moderate-to-severe (87.0%) and severe (70.4%) sleep-disordered breathing.24 More than 3 affirmative answers indicate a high risk for sleep-disordered breathing and is cause for ordering a sleep study.
CPAP Group Class
Patients with a diagnosis of sleep apnea subsequently receive their CPAP machines when they attend a 2-hour group class taught by a respiratory therapist. Group education sessions increase the chance of issuing more machines and providing better education.25 One study found that “attendance in a group clinic designed to encourage compliance with CPAP therapy provided a simple and effective means of improving treatment of OSA.”25
In class, the respiratory therapist briefly assesses each patient’s CPAP prescription, describes the patient’s type of sleep apnea and final diagnosis, and reviews the CPAP machine’s features. Veterans are then instructed to take their CPAP machines home to use all night, every night for 4 weeks. All night is defined as a period of 7.5 to 8 hours, as population-based study results have shown that sleep of this duration is associated with lowest cardiovascular morbidity and mortality. After the initial 4-plus weeks of machine use, patients with all their CPAP equipment are seen in the sleep clinic.
First Sleep Clinic Follow-Up Visit
At first follow-up, patients are asked for a subjective evaluation of their sleep. Most state they are “better” with PAP therapy. Each patient’s mask is checked and refitted with the patient’s prescribed pressure.
Patients are informed of their PAP settings and requirements from the sleep study and told their particular “magic pressure.” Patients understand that a person’s magic pressure, determined in the laboratory, is the pressure of room air blown into the nose, mouth, or both that eliminates not only snoring, but also partial and complete airway obstructions (hypopneas, apneas). Patients are asked to remember their particular magic pressure and their AHI and told their OSA status (mild, moderate, or severe) as assessed by the laboratory study.26 Extensive education on sleep apnea and treatment are also addressed. Education and training are among the most important tenets of PAP therapy, and these are incorporated into all encounters.25,26
PAP Data Report and Leak
The CPAP data are downloaded and printed. If adherence is suboptimal, clinician and patient discuss increasing adherence and possibly becoming a super user. The patient receives a copy of the report, which can be compared with the patient’s adherence statistics and with the adherence statistics of similar patients who are super users. A few blacked-out names are posted on the board in front of the provider’s computer station. Patients can thus easily see that attaining super-user status is very difficult but possible. Some patients maximize their therapy and are designated PAP super users. These patients are proud to receive this designation, and they strive to keep it.
Data downloads are crucial for adherence. In a recent study, the American Thoracic Society stated, “Providers need to be able to interpret adherence systems.”27
The clinic provides a summary report on each patient’s adherence. A provider interpretation is added, and the report is copied into the Computer Patient Record System.
After the report is downloaded, the provider checks for correct pressure and then for a large leak. A large leak is an unintentional leak (the total amount that leaks but not including leak from the mask) > 5% of the night. A leak of > 15 minutes was added to the super-user criteria, because some software provides the average time of a large leak per day in minutes.28 Many veterans sleep only 4 to 5 hours nightly (300 minutes × 5% = 15 minutes). Therefore, the leak should not be more than 5% or 15 minutes for a veteran sleeping 5 hours.
The machine indicates a percentage of leak on the patient self-check LED screen for adherence. There is no standardized leak criterion used by all flow-generator manufacturers. Every mask has venting designed to leak intentionally so that the patient does not rebreathe air CO2. The main concern is unintentional leaks above the intentional leak or venting threshold.
The ResMed CPAP (ResMed Corp, San Diego, CA) maximum intentional leak is 24 L/min.29 Above that level is large leak. The exact leak amount varies by interface (mask) based on pressure and mask type.2,12
The larger the interface surface area, the larger the leak. Unintentional leak is higher with the full-face mask than with the nasal mask, most likely because there is more opportunity for leakage with the larger surface area of the full-face mask. Nasal pillows seem to leak less because of their smaller surface area, but more studies on mask interfaces are needed to validate this finding.
Chin Strap
Adding a chin strap improved patient adherence, nightly duration of use, residual AHI, and leak in patients with sleep apnea.30 Other investigators reported reduced OSA, confirmed by polysomnography and nasopharyngolaryngoscopy, with use of only a chin strap.31 When a nasal mask with chin strap is used, the strap should be made to fit properly over the chin, not on the throat. Properly used chin straps significantly reduce leakage and residual AHI.30
A chin strap most likely reduces large leak and dry mouth.30 Dry mouth can result from mouth leak, which is commonly caused by nasal congestion or high pressure and mouth breathing. The nasal turbinates help humidify, warm, and cool the air. Heated humidification of PAP can help prevent dry mouth.
Asking the Right Questions
The clinician should ask several key questions at the first follow-up: How is it going with your PAP machine? Do you feel PAP therapy is helping you sleep? Do you feel better with PAP therapy? To a patient who states he or she is not doing well with therapy, the clinician should ask, What type of problems are you having? In many cases, poor adherence is attributable to a large leak from a poorly fitting mask. A large leak can also increase residual AHI and cause frequent arousals.30
Some machines cannot maintain the pressure of a large leak and will shut off and trigger an alarm that wakes the patient to readjust the mask. This situation causes some patients to discontinue CPAP/BPAP use. The mask leak must be adjusted. Another common complaint is morning dry mouth. This extreme dryness—a significant clue pointing to mouth leak caused in part by the mouth dropping open during sleep with PAP—should be addressed by fitting the patient with a chin strap.30 Dry mouth also can be caused by low humidity; increasing the humidity setting usually resolves the problem. However, as one study found, use of controlled heated humidification did not improve adherence or quality of life.32 In the same study, the nasopharyngeal dryness that resulted from CPAP therapy without humidification was reduced immediately and during the first weeks of treatment.All current PAP machines feature heated humidification.
Mouth breathing can also result from nasal congestion, allergic or vasomotor rhinitis, nasal turbinate hypertrophy, obstruction from a deviated septum, polyps, or air hunger/insufficient PAP pressure. Chronic rhinosinusitis is a problem that affects up to 12.5% of the U.S. population.33
Adherence is also increased with the elimination of leak and associated arousals. Patients are shown how to use their PAP machine’s heated humidity settings to obtain desired comfort levels. The clinician explains that the nasal turbinates heat and cool the air and that they can become swollen and irritated with PAP therapy. A heated hose may be prescribed to provide optimal humidification without condensation or water dripping into the hose (rainout).
A full-face mask is used only when the patient cannot breathe out the nose adequately or when PAP becomes too high. A 2013 study found no significant differences among ResMed, Respironics, and Fisher & Paykel CPAP interfaces (Fisher & Paykel Healthcare, Irvine, CA).34 The clinician determines which mask is comfortable for a patient and tries to stay with that mask for that patient.
Adherence Report
A therapy data summary is downloaded and reviewed with the patient.28 A pattern of use report that shows daily use with times over the month is also reviewed.28 The software’s sleep therapy long-term trend report lists important statistics. The adherence data summary and the CPAP summary are also reviewed (Table 2).28 This page is printed and given to patients to reieiw their progress. For some it represents a reward for using the CPAP/BPAP machine as well as a congratulatory note.
In the Example 1 summary download (Table 2), a patient used a PAP machine 4 hours or more on 93.3% of the 30 days the machine was used.28 Residual AHI was low, 2.1, and there was no appreciable leak. The PAP of 11.2 cm H2O was in the 90th percentile. The patient was fixed to 12 cm H2O with expiratory pressure relief (EPR) of 1. The EPR is a comfort feature that reduces pressure from 1 cm H2O to 3 cm H2O to make it easier for the patient to exhale. (A flow generator that produces EPR of > 3 cm H2O is a BPAP machine.)
This patient was not a super user. Overall use was low—5 hours, 28 minutes—which could indicate behaviorally insufficient sleep syndrome. Sleep time is controversial, but the National Sleep Foundation recommends 7 to 9 hours of sleep per night.
A different patient used a PAP machine 4 hours or more on 100% (28/28) of the days when the machine was used (Table 3).29 Residual AHI was low (0.6), median use was 8 hours, 47 minutes, and there was no appreciable leak. The patient was using autoset mode with a minimum pressure of 13 cm H2O and maximum pressure of 18 cm H2O. The 95th percentile pressure was 13.6 cm H2O. The patient’s pressure was changed to 14 cm H2O with EPR of 3. This patient was a super user.
Sleep Hygiene Discussion
Providers must discuss sleep hygiene (good sleep habits) with veterans. If needed, AASM pamphlets on sleep hygiene and other educational materials can be provided. The bedroom should be cool, comfortable, quiet, and dark and should not include a television or computer. Exposure to room light before bedtime suppresses melatonin onset and shortens melatonin duration and tells the brain it is time to wake up.34
Patients are asked about the number of arousals they have per night. At first follow-up, providers must determine what is causing a patient to arouse while on CPAP/BPAP therapy. Some causes are air leak resulting in unresolved OSA, nocturia (may be triggered by unresolved OSA), dry mouth (indicating need for chin strap), nightmares (suggestive of unresolved OSA in REM sleep), posttraumatic stress disorder (PTSD), environmental noise, and claustrophobia. The provider should have thought-out answers to these problems in advance.
Epworth Sleepiness Scale
The Epworth Sleepiness Scale (ESS) is administered as part of the baseline comprehensive examination and at every sleep clinic follow-up after issuing a CPAP/BPAP machine.35 The first evaluation after the machine is issued should show a reduction in ESS. No reduction in ESS indicates that a problem needs to be addressed. The most common reason for insufficient reduction in ESS is suboptimal PAP therapy adherence, usually because of a large leak. Some cases of poor adherence may be attributable to restless legs syndrome, periodic limb movement disorder, chronic musculoskeletal pain, and sleep fragmentation caused by alcohol, smoking, caffeine, or cocaine. Excessive daytime sleepiness may persist from use of pain medications or other sedating medications. One study found a correlation between sleep duration with CPAP therapy and reduction in ESS.36 In addition to administering the ESS, patients are asked how they doing with PAP therapy, and the answer is documented. Treatment changes are made if needed to reduce excessive daytime sleepiness.
Ear-Nose-Throat Examination
A quick look into the nose with a nasal speculum is a crucial component of a thorough examination. The clinician looks for a deviated septum, swollen turbinates, obstruction, polyps, bleeding, infection, septal perforation, and discharge. In addition, the patient is checked for airflow amount, nasal congestion, and obstruction; if necessary a nasal steroid spray or a nasal saline spray is prescribed. In some cases, saline spray can be added to the steroid spray to help reduce or eliminate nasal congestion.37
Treatment of congestion requires education, as many patients improperly use these sprays. The steroid spray is not an instant vasoconstrictor; a week of regular use is needed to reduce inflammation and congestion. Saline spray and saline irrigation can be used as a treatment adjunct for symptoms of chronic rhinosinusitis.37If the steroid and saline sprays fail after a 2-month trial, consider an ear-nose-throat (ENT) consultation. A recent study found that adherence rates increased after septoplasty in patients with nasal obstruction.38 The throat is examined for macroglossia or scalloping of the tongue.39 Macroglossic Mallampati IV tongues are platterlike. They are big, long, and wide and often have impressions or scalloping along the outside from a molding of the teeth. The patient is shown a Mallampati diagram and given a Mallampati score.
Creating a Sense of Mission
The sleep physician assistant (PA)at the Detroit VAMC is a retired U.S. Army colonel who ensures that the language the physician uses aligns with the language veterans use. Behavioral techniques are used to create a common culture that helps overcome obstacles—allowing patients to understand the benefits of and need for full CPAP/BPAP therapy adherence. One technique reinforces their sense of mission accomplishment, their military pride, and their interservice rivalry to increase adherence. The mission with each patient is to “work until success is achieved...but the patient can’t quit.” The mantra given to a patient with a difficult case is, “We will not let you fail with CPAP/BPAP therapy,” which echoes a familiar military motto, “We will not leave you behind.” Also, the goal of the physician is: Never give up on the patient.
Behavioral and Psychological Principles
The behavioral and psychological principles for success with PAP super users should be studied to validate better outcomes with longer duration PAP machine use. Patients who are motivated to succeed and to participate in their care can make great strides in changing their behavior to get more and better sleep. Obese patients can get referrals to the MOVE! weight loss program. Some veterans simply follow instructions, pay attention to detail, and do what they are told regarding sleep, PAP education, and good sleep hygiene. Many veterans have poor sleep hygiene and insomnia because they watch television or play games on electronic devices right before bedtime. Many patients develop behaviorally insufficient sleep syndrome. Their behavior prevents them from going to bed at a time that will allow sufficient sleep. Some veterans smoke or drink caffeinated beverages or al cohol immediately before sleep time and then wonder why they have insomnia.
Veterans with insomnia may be referred to the insomnia clinic psychologist for cognitive behavioral therapy for insomnia.40 Referral to this psychologist can be very helpful in the treatment of insomnia after the patient’s OSA has been treated. Veterans are encouraged to follow good sleep hygiene principles and permanently discontinue detrimental sleep behaviors.
For veterans with PTSD, imagery rehearsal before sleep has been effective in resolving disturbing nightmares and excluding their violent details.41 Clinicians recommend that these veterans rehearse a pleasant dream before sleep time. Cartwright and Lamberg performed extensive research on dreams and nightmares, and their book may provide insight into reducing nightmares for veterans with severe PTSD.42 Persistent nightmares associated with PTSD also can be reduced with use of prazosin. 43
Sleep Clinic Economics
The economic impact of OSA is substantial because of increased risk of cardiovascular disease and risk of motor vehicle accidents and decreased quality of life and productivity. Results of cost-effectiveness analyses support the value of diagnosing and treating OSA. Studies have provided estimates from a payer perspective, ranging from $2,000 to $11,000 per quality-adjusted life year over 5 years for treating moderate-to-severe OSA. The Sleep Heart Health Study showed that OSA was associated with an 18% increase in predicted health care utilization based on medication use.44,45 Moreover, CPAP therapy was found to be clinically more effective than no treatment: Therapy increased life expectancy in males and females, and effective treatment of OSA was associated with lower health care and disability costs and fewer missed workdays.
The authors’ initiatives to improve PAP therapy adherence required adding a PA and a registered respiratory therapist (RT) to the staff of 2 full-time equivalent (FTE) board-certified sleep physicians. The sleep physicians trained the PA to initiate and complete all the recommendations described, and the PA attended an AASM-sponsored review course for additional training. The PA is responsible for performing comprehensive face-to-face clinical evaluations in 4 half-day clinic sessions each week, as well as providing follow-up care in 4 additional half-day clinic sessions each week.
During these sessions, the PA provides education about sleep apnea and treatment. Thirty-minute follow-up clinic appointments are reserved for downloading CPAP data, providing interpretation, and educating patients to maximize PAP therapy and become super users. The remaining clinic sessions are run by 3 sleep fellows under the supervision of the sleep physicians. During all visits, providers encourage patients to maintain good sleep hygiene. Nonadherent patients are scheduled to be seen in a separate clinic session during which the RT troubleshoots and corrects PAP machine and mask-related problems.
Setting up the CPAP group classes and follow-up clinics required adding an FTE RT at a cost of $44,000 to $48,000 per year. By recruiting an FTE PA starting at GS-12 and $75,542 instead of another board-certified sleep physician, VAMC Detroit was able to provide increased access to patient care (8 clinics) at sizable financial savings (estimate, $75,000/y). A 0.5 FTE clinical psychologist provided cognitive behavioral therapy for insomnia and PAP therapy nonadherence and helped achieve the initiative’s goals.
The sleep center projects that the overall cost-effectiveness of these initiatives in terms of admission rates, life expectancy, and productivity would not be dissimilar to that reported in the peer-reviewed literature, as noted earlier. The center’s upcoming research projects will provide more data specific to its population. Educating patients requires that only motivated providers give patients instructions during a 30-minute follow-up clinic visit—there is no additional expense. This model of intensive care can be adopted at other VAMCs.
Conclusion
Maximizing PAP machine use is a unique approach that stimulates veterans to attain the highest level of adherence. This approach is based on clinical observation and patient encounters, and treatment recommendations over 8 years.
Showing enthusiasm with patients is crucial. Enthusiasm is contagious. Clinicians who are also PAP machine users should let patients know of their PAP super-user status and add that many others have attained this status, too. The benefits of optimal treatment are reviewed with patients: increased energy, lower risk of cardiovascular disease, lower blood pressure, better insulin sensitivity, and overall reduced mortality. Some patients have difficulty using the nasal mask and chin strap and understanding and adhering to PAP therapy. These impediments can be overcome with further education and follow-up. Sleep clinic clinicians take the time to show patients how to use the machine’s self-adherence check and leak functions. Patients can then monitor their progress daily.
To motivate patients, clinicians should set expectations early, invest time in providing education at follow-up; be diligent with respect to mask fitting and download evaluation. Sleep clinic providers should also speak the veterans’ language, create a self-fulfilling prophesy for success, and schedule a follow-up sleep clinic appointment if a patient is not fulfilling the Medicare adherence criterion of 4 hours’ nightly use for 70% of nights over 30 days.
PAP therapy coaching and persistent education with provider contact and enthusiasm can improve adherence. Encouragement and praise can help patients exceed Medicare’s minimum PAP therapy criterion and improve their overall PAP experience. The sleep team should tell patients they are proud of their accomplishments with such a difficult treatment. Being genuine and caring and showing concern about their evaluation, treatment, and follow-up is important. This helps reduce their OSA-related morbidity, lessen their depression, and improves their daily well-being and quality of life.
“The variation in responses to CPAP and acceptance of CPAP suggest that focused interventions, rather than one-size-fits-all interventions, may have a greater effect on the overall outcome of CPAP adherence,” wrote Weaver and Sawyer.46
Finally, one cannot equate spending on veteran care with spending in other areas of the national budget. The real cost of not giving veterans appropriate care will be a loss of trust, given that the overarching mission is “to care for him who shall have borne the battle and for his widow and his orphan.”
1. Boyaci H, Gacar K, Baris SA, Basyigit I, Yildiz F. Positive airway pressure device compliance of patients with obstructive sleep apnea syndrome. Adv Clin Exp Med. 2013;22(6):809-815.
2. Bachour A, Vitikainen P, Virkkula P, Maasilta P. CPAP interface: satisfaction and side effects. Sleep Breath. 2013;17(2):667-672.
3. Wimms AJ, Richards GN, Genjafield AV. Assessment of the impact on compliance of a new CPAP system in obstructive sleep apnea. Sleep Breath. 2013;17(1):69-76.
4. Smith I, Nadig V, Lasserson TJ. Educational, supportive and behavioral interventions to improve usage of continuous positive airway pressure machines for adults with obstructive sleep apnea. Cochrane Database Syst Rev. 2009;(2):CD007736.
5. Beecroft J, Zanon S, Lukic D, Hanly P. Oral continuous positive airway pressure for sleep apnea: effectiveness, patient preference, and adherence. Chest. 2003;124(6):2200-2208.
6. Chai CL, Pathinathan A, Smith B. Continuous positive airway pressure delivery interfaces for obstructive sleep apnoea. Cochrane Database Syst Rev. 2006;(4):CD005308.
7. Nilius G, Happel A, Domanski U, Ruhle KH. Pressure-relief continuous positive airway pressure vs constant continuous positive airway pressure: a comparison of efficacy and compliance. Chest. 2006;130(4):1018-1024.
8. Ballard RD, Gay PC, Strollo PJ. Interventions to improve compliance in sleep apnea patients previously non-compliant with continuous positive airway pressure. J Clin Sleep Med. 2007;3(7):706-712.
9. Sin DD, Mayers I, Man GC, Pawluk L. Long-term compliance rates to continuous positive airway pressure in obstructive sleep apnea: a population-based study. Chest. 2002;121(2):430-435.
10. Mortimore IL, Whittle AT, Douglas NJ. Comparison of nose and face mask CPAP therapy for sleep apnoea. Thorax. 1998;53(4):290-292.
11. Haniffa M, Lasserson TJ, Smith I. Interventions to improve compliance with continuous positive airway pressure for obstructive sleep apnoea. Cochrane Database Syst Rev. 2004;(4):CD003531.
12. Kushida CA, Berry RB, Blau, A, et al. Positive airway pressure initiation: a randomized controlled trial to assess the impact of therapy mode and titration process on efficacy, adherence, and outcomes. Sleep. 2011;34(8):1083-1092.
13. Gentina T, Fortin F, Douay B, et al. Auto bi-level with pressure relief during exhalation as a rescue therapy for optimally treated obstructive sleep apnoea patients with poor compliance to continuous positive airways pressure therapy--a pilot study. Sleep Breath. 2011;15(1):21-27.
14. Billings, ME, Auckley D, Benca R, et al. Race and residential socioeconomics as predictors of CPAP adherence. Sleep. 2011;34(12):1653-1658.
15. Young T, Finn L, Peppard PE, et al. Sleep disordered breathing and mortality: eighteen-year follow-up of the Wisconsin Sleep Cohort. Sleep. 2008;31(8):1071-1078.
16. Centers for Disease Control and Prevention. Effect of short sleep duration on daily activities--United States, 2005-2008. MMWR Morb Mortal Wkly Rep. 2011;60(8):239-242.
17. Antic NA, Catcheside P, Buchan C, et al. The effect of CPAP in normalizing daytime sleepiness, quality of life, and neurocognitive function in patients with moderate to severe OSA. Sleep. 2011;34(1):111-119.
18. Phurrough S, Jacques L, Spencer F, Stiller J, Brechner R. Coverage decision memorandum for continuous positive airway pressure (CPAP) therapy for obstructive sleep apnea (OSA) (CAG-00093R2). Centers for Medicare & Medicaid Services Website. https://www.cms.gov/medicare-coverage-database/details/nca-decision-memo.aspx?NCAId=204&fromdb=true. Accessed February 5, 2016.
19. Epstein LJ, Kristo D, Strollo PJ Jr, et al; Adult Obstructive Sleep Apnea Task Force of the American Academy of Sleep Medicine. J Clin Sleep Med. 2009;5(3):263-276.
20. Berry RB, Chediak A, Brown LK, et al; NPPV Titration Task Force of the American Academy of Sleep Medicine. Best clinical practices for the sleep center adjustment of noninvasive positive pressure ventilation (NPPV) in stable chronic alveolar hypoventilation syndromes. J Clin Sleep Med. 2010;6(5):491-509.
21. Merton RK. Social Theory and Social Structure. New York, NY: Free Press; 1968.
22. Chaput JP, McNeil J, Després JP, Bouchard C, Tremblay A. Seven to eight hours of sleep a night is associated with a lower prevalence of the metabolic syndrome and reduced overall cardiometabolic risk in adults. PLoS One. 2013;8(9):e72832.
23. Born J, Wagner U. Sleep, hormones, and memory. Obstet Gynecol Clin North Am. 2009;36(4):809-829, x.
24. Silva GE, Vana KD, Goodwin JL, Sherrill DL, Quan SF. Identification of patients with sleep disordered breathing: comparing the four-variable screening tool, STOP, STOP-Bang, and Epworth Sleepiness Scales. J Clin Sleep Med. 2011;7(5):467-472.
25. Soares Pires F, Drummond M, Marinho A, et al. Effectiveness of a group education session on adherence with APAP in obstructive sleep apnea--a randomized controlled study. Sleep Breath. 2013;17(3):993-1001.
26. Berry RB, Budhiraja R, Gottlieb DJ, et al; American Academy of Sleep Medicine. Rules for scoring respiratory events in sleep: update of the 2007 AASM Manual for the Scoring of Sleep and Associated Events. Deliberations of the Sleep Apnea Definitions Task Force of the American Academy of Sleep Medicine. J Clin Sleep Med. 2012;8(5):597-619.
27. Schwab RJ, Badr SM, Epstein LJ, et al; ATS Subcommittee on CPAP Adherence Tracking Systems. An official American Thoracic Society statement: continuous positive airway pressure adherence tracking systems. The optimal monitoring strategies and outcome measures in adults. Am J Respir Crit Care Med. 2013;188(5):613-620.
28. Respironics Encore Pro and Encore Pro 2 [computer program]. Philips, Inc; May 12, 2013.
29. ResMed. Version 04.01.013. San Diego, CA.
30. Knowles SR, O'Brien DT, Zhang S, Devara A, Rowley JA. Effect of addition of chin strap on PAP compliance, nightly duration of use, and other factors. J Clin Sleep Med. 2014;10(4):377-383.
31. Vorona RD, Ware JC, Sinacori JT, Ford ML 3rd, Cross JP. Treatment of severe obstructive sleep apnea syndrome with a chinstrap. J Clin Sleep Med. 2007;3(7):729-730.
32. Ruhle KH, Franke KJ, Domanski U, Nilius G. Quality of life, compliance, sleep and nasopharyngeal side effects during CPAP therapy with and without controlled heated humidification. Sleep Breath. 2011;15(3):479-485.
33. Hamilos DL. Chronic rhinosinusitis: epidemiology and medical management. J Allergy Clin Immunol. 2011;128(4):693-707.
34. Gooley JJ, Chamberlain K, Smith KA, et al. Exposure to room light before bedtime suppresses melatonin onset and shortens melatonin duration in humans. J Clin Endocrinol Metab. 2011;96(3):E463-E472.
35. Johns MW. A new method for measuring daytime sleepiness: the Epworth Sleepiness Scale. Sleep. 1991;14(6):540-545.
36. Bednarek M, Zgierska A, Pływaczewski R, Zielinski J. The effect of CPAP treatment on excessive daytime somnolence in patients with obstructive sleep apnea [in Polish]. Pneumonol Alergol Pol. 1999;67(5-6):237-244.
37. Harvey R, Hannan SA, Badia L, Scadding G. Nasal saline irrigations for the symptoms of chronic rhinosinusitis. Cochrane Database Syst Rev. 2007;(3):CD006394.
38. Poirier J, George C, Rotenberg B. The effect of nasal surgery on nasal continuous positive airway pressure compliance. Laryngoscope. 2014;124(1):317-319.
39. Law JA. From the journal archives: Mallampati in two millennia: its impact then and implications now. Can J Anaesth. 2014;61(5):480-484.
40. Hood HK, Rogojanski J, Moss TG. Cognitive-behavioral therapy for chronic insomnia. Curr Treat Options Neurol. 2014;16(12):321.
41. Harb GC, Thompson R, Ross RJ, Cook JM. Combat-related PTSD nightmares and imagery rehearsal: nightmare characteristics and relation to treatment outcome. J Trauma Stress. 2012;25(5):511-518.
42. Cartwright R, Lamberg L. Crisis Dreaming: Using Your Dreams to Solve Your Problems.. New York, NY: HarperCollins;1992.
43.Writer BW, Meyer EG, Schillerstrom JE. Prazosin for military combat-related PTSD nightmares: a critical review. J Neuropsychiatry Clin Neurosci. 2014;26(1):24-33.
44. Park JG, Ramar K, Olson EJ. Updates on definition, consequences, and management of obstructive sleep apnea. Mayo Clin Proc. 2011;86(6):549-554.
45. Kapur V, Blough DK, Sandblom RE, et al. The medical cost of undiagnosed sleep apnea. Sleep. 1999;22(6):749-755.
46. Weaver TE, Sawyer AM. Adherence to continuous positive airway pressure treatment for obstructive sleep apnoea: implications for future interventions. Indian J Med Res. 2010;131:245-258.