User login
Clinical guidelines on depression: A qualitative study of GPs’ views
Health planners may help enhance guideline use if resources are available for implementation, recommendations are consistent across multiple guidelines, and audit and feedback mechanisms are developed (C).
Background: Clinical guidelines have become an increasingly familiar component of health care, although their passive dissemination does not ensure implementation. This study is concerned with general practitioners’ (GPs) views of guideline implementation in general practice. It focuses specifically on their views about guidelines for the management of patients with depression.
Objective: To elicit and explore GPs’ views about clinical guidelines for the management of depression, their use in practice, barriers to their use, and how best to implement guidelines.
Design: Qualitative study using in-depth interviews with a purposive sample of GPs.
Setting: General Practices across the Scottish Grampian region, and Northeast England.
Methods: Eleven GPs who had participated in a previous questionnaire based depression study were interviewed. Interviews were transcribed and analyzed using the “framework technique.”
Results: Several participating GPs did not agree with recommendations of the current depression guidelines; some thought they were insufficiently flexible to use with the variety of patients they see. The volume of guidelines received, lack of time and resources (particularly mental health professionals for referrals) were seen as the main barriers to guideline use.
Conclusions: A range of factors contributes to variability in compliance with guidelines for the management of depression. For guideline use to increase, GPs in this study said they would like to see more resources put in place; a reduction in the number of guidelines they receive; incorporation of guideline recommendations onto computer decision support systems; and regular audit and feedback to allow them to monitor their practice.
Clinical practice guidelines have become a common aspect of clinical care.1 Guidelines have been defined as “systematically developed statements to assist practitioner and patient decisions about appropriate health care.”2 Clinical practice guidelines have been seen as the remedy to at least 3 problems facing healthcare systems3 : wide variation in the health care people receive4 ; rising health care costs5 ; and health professionals’ difficulty in keeping abreast of research evidence.6 Despite increasing numbers of clinical practice guidelines, clinicians often do not change their practice accordingly.7 The reasons for this have not been fully explained.1
At least 45 different depression guidelines have been published for use in primary care since 1991. However, a review concluded that they all make essentially the same recommendations.8 Thus, whichever guidelines GPs used, the recommendations were similar and were based on the 1992 joint consensus statement,9 which advises that that 4 depressive symptoms must have been present for at least 2 weeks before prescribing antidepressants. In this study, in-depth interviews explored GPs’ views on guidelines for the management of depression, how they used these in practice, barriers to using the guidelines, and how best to implement guidelines.
Barriers to effective treatment
Successful implementation of a depression guideline (by the US Agency for Healthcare Research and Quality) increases the quality of care and improves clinical outcomes.10 However, a widely acknowledged gap exists between research findings and their clinical implementation.11 In the UK, GPs tend to overprescribe relative to recommendations12 —antidepressant prescribing has increased for all age and sex groups over the last 20 years13 ; prescribing no drugs is rare.14 Nevertheless, depressed persons are often under-diagnosed and undertreated13,15 ; only about 10% receive appropriate treatment.16
Barriers preventing effective treatment for depression include service provision17 ; patients’ attitudes and beliefs about depression and its care18 ; lack of access to care; treatment preference; and concerns about confidentiality and stigma.19-21 Physicians have sometimes overruled guidelines when patients have complex illness patterns.18 Physician factors, including lack of time22 and poor awareness of guidelines,22,23 may also contribute.
Asking questions about guidelines in practice
This study sought GPs’ views about the gap between depression guideline recommendations and practice, and examined how best to implement clinical guidelines from the GPs’ perspective. Specifically, the following research questions were addressed:
- Do GPs agree with the recommendations made by depression guidelines?
- Do GPs feel that guidelines are flexible enough to manage depression in all patients?
- What barriers do GPs perceive to following the recommendations?
- What do GPs perceive to be the most fruitful method to promote guideline use?
Methods
Participants’ characteristics
GPs eligible for this study (n=102) participated in 1 of 2 postal questionnaires, wherein they were asked to make treatment decisions in 20 systematically varied case vignettes of patients with symptoms that might indicate depression. Fifteen GPs were invited to participate, of whom 11 (73%) agreed to be interviewed.
Potential participants were sampled to reflect the range of compliance in response to the previous study’s vignettes (5 exhibited high levels of compliance, 3 medium, and 3 low), and to ensure the sample included GPs from different-sized practices (5 GPs worked in small practices, 5 in medium, and 1 in a large practice) and different locations (7 from the Scottish Grampian region, 4 from the Northeast of England). Eight GPs were male, 3 were female. GPs were interviewed during April 2002 at their practice premises by LS. Previous questionnaires did not reveal that analyses took guideline compliance into account; thus it was deemed that participants would not be affected by social desirability characteristics.
Interview procedure
A topic guide was designed to guide interviews and included the research design showing who was to be interviewed and key questions to be addressed. Questions were open-ended, semi-structured, and followed research questions. GPs’ permission was sought to record interviews, and confidentiality was assured. GPs were encouraged to talk freely. Interviews lasted between 45 and 75 minutes; they were tape-recorded and transcribed with all identifying text removed.
Data analysis
Two researchers (LS & AW) analyzed transcripts using the Framework Technique,24 chosen because it is grounded in and driven by participating GPs’ original accounts and observations. Abstraction began after the full data set was reviewed. Emergent themes and issues were noted and given a code, and an index was constructed. This was revised several times as new issues emerged and was systematically reapplied to all the interview transcripts. Interviews were analyzed independently and any differences of interpretation were resolved through discussion.
Results
Of the 7 GPs who knew which was their latest depression guideline, 2 had no problems with recommendations. However, several GPs disagreed with some recommendations, possibly explaining variable compliance.12
Disagreements
One area of disagreement was the recommendation to refer patients, as specialists were not always available or waiting times were too long. Criteria for referring patients to secondary care include diagnostic uncertainty, treatment failure, suicidal tendencies, and psychotic or disturbed behavior. (This recurring issue of referral is discussed below.)
Another area of disagreement was the dura-tion-of-symptoms criterion, as heard in the follow-ing observation:
It stipulates they have to have these features and for at least 2 weeks … and if they only have them for a week why should I wait … why should they be miserable for a week, when I am pretty certain they are depressed? (GP3)
Guidelines’ flexibility
Evidence-based recommendations are usually expressed in terms of typical clinical situations. Perhaps such recommendations are particularly difficult to apply to individuals who can present with varying combinations of pre-existing illness, beliefs about depression, treatment preferences, concerns about confidentiality and stigma, as well as varying degrees of access to care. We therefore asked GPs whether they believed the available depression guidelines are sufficiently flexible to use with all their patients in managing depression.
Many of the GPs thought the guidelines were not flexible. For instance, GP4 said he worried about lawyers becoming involved in guideline compliance, which could result in defensive practice rather than the best treatment for patients. Similarly GP2 said that guidelines should not be used in all situations because they vary so much. GP7 reported that depression guidelines made invalid assumptions about patients presenting with only one illness (and GPs having plenty of time), resulting in the guidelines not being useful for some patients with certain illness combinations.
Barriers to following guidelines
Number of guidelines. The most common perceived barrier preventing these GPs from follow-ing guidelines was the volume of guidelines they receive. They thought they received too many guidelines and had too little time to read them all. The GPs sometimes felt confused about which one to follow. Although they could not quantify how many new guidelines they received in a month, or from how many sources, GPs appeared to feel overwhelmed and despondent.
…There’s a bit of numbing as well: oh no, not another guideline. (GP11)
We get flooded with stuff.… With a lot of stuff I bin it or file it. (GP5)
Time constraints. Lack of time was consistently viewed by participating GPs as a major barrier to guideline use. This is not surprising considering patients are booked in every 5–10 minutes,25 with GPs seeing around 140 patients a week.26 Furthermore, GPs viewed guideline accessibility, style, and presentation as barriers.
SIGN guidelines are always very good because they come on clear to follow laminated cards which are kind of summary versions of them. Many other guidelines are not so good … much longer and difficult to follow.… (GP6)
Lack of resources. Lack of resources re-emerged as a major barrier to following guideline recommendations. Problems of patient referral included having no specialist to refer them to, patients being misled about specialists’ qualifications, and patient confidentiality issues. Several GPs reported that by the time patients received appointments, they reported their problems had disappeared and they no longer wanted appointments.
…a guideline might come through and I’ve followed the protocol … and arranged a referral … then the reply has come back from the hospital that they don’t have the resources for this at the moment. So it [the guideline] has fallen flat on its face and that is extremely disappointing when we in primary care are trying our best. (GP2)
Waiting times reported were between 2 to 26 weeks for psychiatrists or community psychiatric nurses and 9 to 12 months for psychologists. Perceived delays or deficiencies in specialist services may partially explain GPs’ tendency to over prescribe relative to recommendations.12
Increasing guideline use
For guideline use to increase, GPs in this study thought that more resources needed to be put in place (particularly mental health professionals); the number of guidelines issued should be reduced; and guidelines should be produced and sent from a central body with a multidisciplinary team including some GPs, to reduce problems of perceived unrealistic assumptions. Incorporation of guideline recommendations onto computer systems with prompts and flow charts was also suggested by several GPs as method to promote guideline use. The majority of interviewed GPs also said they would like some form of audit and feedback.
We really need some kind of measure.… We’re all meant to audit our work, but again its time and we audit what we have to. If someone could demonstrate that I’m not managing depression well, then I might sit up and think I need that guideline there. We need all the feedback we can get really. (GP9)
Discussion
In this study, GPs perceived barriers to implementation of current depression guidelines matched other research findings on this subject—eg, lack of time,22 lack of resources,17 variability among patients,19-21 lack of awareness,22,23,27 lack of agreement with guideline recommendations,28 and poor accessibility to guidelines.11
The relatively small group of participants in this study cannot be generalized to all GPs. Additionally, there are always difficulties with self-reporting—participants may not do what they say they do. However, “purposive” sampling is consistent with qualitative approaches and allows a wide range of GPs’ views to be explored in depth. This study could be replicated elsewhere to assess how representative these views are.
Interviewed GPs did not always agree with depression guidelines. To address disagreement, some sort of educational intervention may be useful. Previous research has shown educational interventions to enable guideline implementation: an educational program was reportedly one of the most important elements in the successful implementation of cervical screening guidelines28 ; and large group meetings were effective in modifying drug use in coronary artery disease.29
An important theme in this study was the issue of referring patients and the availability of specialist services. GPs disagreed with the recommendations about referring, and saw lack of mental health professionals as a main barrier to following depression guidelines. This problem needs to be addressed, and interviewed GPs believed certain recommendations would be followed if resources were put into place. Their views have important implications for clinical guideline development. Resources must be considered before recommendations are made. Alternatively, those involved in guideline production may be demonstrating the case for more mental health professionals.
The volume of guidelines and lack of time and accessibility to guidelines were also perceived barriers. Both barriers could be addressed by introducing computerized decision support systems. Indeed, several GPs suggested the incorporation of guidelines onto computer systems as a way of promoting guideline use. However, the effect of computerized evidence-based guidelines has been variable,1,30 and further study is needed.
The GPs thought depression guidelines were insufficiently flexible to use with the spectrum of depressed patients they see. However, some expected this, believing there would always be certain patients to whom guidelines do not apply. Greater involvement of GPs in guideline development was seen as a means to addressing this problem as well as reducing unrealistic assumptions made about general practice.
Audit and feedback emerged as a potential method for assessing and improving compliance. This matches the evidence. A review of 12 studies using audit and feedback as implementation strategies concluded these activities change behavior modestly, but all studies reported improvements in the process of care.1
If we are serious about closing the gap between research evidence and practice, possibly a new system of guideline development is needed, with a national clearinghouse for guidelines. Here a multidisciplinary team including some GPs would be responsible for evaluating guidelines, incorporating them onto computer systems, auditing performance, and giving feedback to GPs. This study has opened up possibilities for further exploration.
Acknowledgments
This study was carried out from the Health Services Research Unit, which is funded by the Chief Scientist Office of the Scottish Executive Health Department. LS was supported by the Medical Research Council Health Services Research Collaboration. We would like to thank the GPs who participated in this study, and Vikki Entwistle and Steve Ratcliff for their helpful comments on earlier drafts of this paper. The opinions expressed in this paper are those of the authors, and may not be shared by the funding bodies.
Corresponding author
Liz Smith, MA, PhD, Manchester Centre for Healthcare Management, University of Manchester, Devonshire House, University Precinct Centre, Oxford Road, Manchester, UK, M13 9PL. E-mail: [email protected].
1. Grimshaw JM, Thomas RE, Mac Lennan G, et al. Effectiveness and efficiency of guideline dissemination and implementation strategies. Health Technol Assess 2003 (in press).
2. Institute of Medicine. Guidelines for Clinical Practice: From Development to Use. Washington, DC: National Academic Press; 1992.
3. Thornsen T, Makela M. Changing Professional Practice: Theory and Practice of Clinical Guideline Implementation. Copenhagen, Denmark: Danish Institute for Health Services Research and Development; 1999.
4. Woolf FH, Grol R, Hutchinson A, Eccles M, Grimshaw J. Potential benefits, limitations, and harms of clinical guidelines. BMJ 1999;318:527-530.
5. Stephenson A. A Textbook of General Practice. London: Arnold; 1999.
6. Sackett DL, Rosenberg WMC, Muir Gray JA, Haynes RB, Richardson WS. Evidence based medicine: what it is and what it is n’t. BMJ 1996;312:71-72.
7. Oxman AD, Thomson MA, Davis DA, Haynes RB. No magic bullets: a systematic review of 102 trials of interventions to improve professional practice. CMAJ 1995;153:1423-1431.
8. Littlejohns P, Cluzeau F, , Bale R, Grimshaw J, Feder G, Moran S. The quantity and quality of clinical practice guidelines for the management of depression in primary care in the UK. Br J Gen Pract 1999;49:205-210.
9. Paykel ES, Priest RG. Recognition and Management of depression in general practice: consensus statement. BMJ 1992;305:1998-1202.
10. Katon W, Von Korff M, Lin E, et al. Collaborative management to achieve treatment guidelines: impact on depression in primary care. JAMA 1995;273:1026-1031.
11. Cranney M, Warren E, Barton S, Gardner K, Walley T. Why do GPs not implement evidence-based guidelines? A descriptive study. Fam Pract 2001;18:359-363.
12. Smith L, Gilhooly K, Walker AE. Factors influencing prescribing decisions in the treatment of depression: a social judgement theory approach. Applied Cognitive Psychology 2003;17:51-63.
13. Hirschfeld RM, Keller MB, Panico S, et al. National Depressive and Manic-Depressive Association consensus statement on the undertreatment of depression. JAMA 1997;277:333-340.
14. Fisch HU, Hammond KR, Joyce CRB, O’Reilly M. An Experimental study of the Clinical Judgement of General Physicians in evaluating and prescribing for Depression. Br J Psychiatry 1981;138:100-109.
15. Davidson JR, Meltzer-Brody SE. The underrecognition and undertreatment of depression: what is the breadth and depth of the problem? J Clin Psychiatry 1999;60:4-9.
16. Robins LN, Regier DA, Eds. Psychiatric Disorders in America: The Epidemiologic Catchment Area Study. New York, NY: The Free Press; 1991.
17. Telford R, Hutchinson A, Jones R, Rix S, Howe A. Obstacles to the effective treatment of depression: A general practice perspective. Fam Pract 2002;19:45-52.
18. Nutting PA, Rost K, Dickinson M, et al. Barriers to initiating depression treatment in primary care practice. J Gen Intern Med 2002;17:103-111.
19. Cabana MD, Rushton JL, Rush AJ. Implementing practice guidelines for depression: Applying a new framework to an old problem. Gen Hosp Psychiatry 2002;24:35-42.
20. Kaddam UT, Croft P, McLeod J, Hutchinson M. A qualitative study of patients’ view on anxiety, and depression. Br J Gen Pract 2001;51:375-380.
21. Cooper-Patrick L, Powe NR, Jenckes MW, Gonzales JJ, Levin DM, Ford DE. Identification of patient attitudes and p regarding treatment of depression. J Gen Int Med 1997;12:431-438.
22. Feldman EL, Jaffe A, Galambos N, Robbins A, Kelly RB, Froom J. Clinical practice guidelines on depression: awareness, attitudes, and content knowledge among family physicians in New York. Arch Fam Med 1998;7:58-62.
23. Betz-Brown J, Shye D, McFarland B. The paradox of guideline implementation: how AHCPR’s depression guideline was adapted at Kaiser Permanente Northwest Region. J Qual Improv 1995;21:5-21.
24. Ritchie J, Spencer L. Qualitative data analysis for applied policy research. In Bryman A, Burgess R (Eds): Analysing Qualitative Data. London: Routledge; 1994;173-194.
25. Waller J, Hodgkin P. General Practice, Demanding Work. Oxford: Radcliffe Medical Press; 2000.
26. Audit Commission A Prescription for Improvement: Towards More Rational Prescribing in General Practice. London: HMSO; 1994.
27. Cabana MD, Ebel BE, Cooper-Patrick L, et al. Barriers that pediatricians face when using asthma practice guidelines. Arch Ped Adol Med 2000;154:685-693.
28. Hermens RP, Hak E, Hulscher ME, Braspenning JC, Grol RP. Adherence to guidelines on cervical cancer screening in general practice: programme elements of successful implementation. Br J Gen Pract, 2001;51:897-903.
29. Sarasin FP, Maschiangelo ML, Schaller MD, Heliot C, Mischler S, Gaspoz JM. Successful implementation of guidelines for encouraging the use of beta blockers in patients after acute myocardial infarction [comment]. Am J Med 1999;106:499-505.
30. Eccles M, McColl E, Steen N, et al. Effect of computerised evidence based guidelines on management of asthma and angina in adults in primary care: cluster randomised controlled trial. BMJ 2002;325:941-946.
Health planners may help enhance guideline use if resources are available for implementation, recommendations are consistent across multiple guidelines, and audit and feedback mechanisms are developed (C).
Background: Clinical guidelines have become an increasingly familiar component of health care, although their passive dissemination does not ensure implementation. This study is concerned with general practitioners’ (GPs) views of guideline implementation in general practice. It focuses specifically on their views about guidelines for the management of patients with depression.
Objective: To elicit and explore GPs’ views about clinical guidelines for the management of depression, their use in practice, barriers to their use, and how best to implement guidelines.
Design: Qualitative study using in-depth interviews with a purposive sample of GPs.
Setting: General Practices across the Scottish Grampian region, and Northeast England.
Methods: Eleven GPs who had participated in a previous questionnaire based depression study were interviewed. Interviews were transcribed and analyzed using the “framework technique.”
Results: Several participating GPs did not agree with recommendations of the current depression guidelines; some thought they were insufficiently flexible to use with the variety of patients they see. The volume of guidelines received, lack of time and resources (particularly mental health professionals for referrals) were seen as the main barriers to guideline use.
Conclusions: A range of factors contributes to variability in compliance with guidelines for the management of depression. For guideline use to increase, GPs in this study said they would like to see more resources put in place; a reduction in the number of guidelines they receive; incorporation of guideline recommendations onto computer decision support systems; and regular audit and feedback to allow them to monitor their practice.
Clinical practice guidelines have become a common aspect of clinical care.1 Guidelines have been defined as “systematically developed statements to assist practitioner and patient decisions about appropriate health care.”2 Clinical practice guidelines have been seen as the remedy to at least 3 problems facing healthcare systems3 : wide variation in the health care people receive4 ; rising health care costs5 ; and health professionals’ difficulty in keeping abreast of research evidence.6 Despite increasing numbers of clinical practice guidelines, clinicians often do not change their practice accordingly.7 The reasons for this have not been fully explained.1
At least 45 different depression guidelines have been published for use in primary care since 1991. However, a review concluded that they all make essentially the same recommendations.8 Thus, whichever guidelines GPs used, the recommendations were similar and were based on the 1992 joint consensus statement,9 which advises that that 4 depressive symptoms must have been present for at least 2 weeks before prescribing antidepressants. In this study, in-depth interviews explored GPs’ views on guidelines for the management of depression, how they used these in practice, barriers to using the guidelines, and how best to implement guidelines.
Barriers to effective treatment
Successful implementation of a depression guideline (by the US Agency for Healthcare Research and Quality) increases the quality of care and improves clinical outcomes.10 However, a widely acknowledged gap exists between research findings and their clinical implementation.11 In the UK, GPs tend to overprescribe relative to recommendations12 —antidepressant prescribing has increased for all age and sex groups over the last 20 years13 ; prescribing no drugs is rare.14 Nevertheless, depressed persons are often under-diagnosed and undertreated13,15 ; only about 10% receive appropriate treatment.16
Barriers preventing effective treatment for depression include service provision17 ; patients’ attitudes and beliefs about depression and its care18 ; lack of access to care; treatment preference; and concerns about confidentiality and stigma.19-21 Physicians have sometimes overruled guidelines when patients have complex illness patterns.18 Physician factors, including lack of time22 and poor awareness of guidelines,22,23 may also contribute.
Asking questions about guidelines in practice
This study sought GPs’ views about the gap between depression guideline recommendations and practice, and examined how best to implement clinical guidelines from the GPs’ perspective. Specifically, the following research questions were addressed:
- Do GPs agree with the recommendations made by depression guidelines?
- Do GPs feel that guidelines are flexible enough to manage depression in all patients?
- What barriers do GPs perceive to following the recommendations?
- What do GPs perceive to be the most fruitful method to promote guideline use?
Methods
Participants’ characteristics
GPs eligible for this study (n=102) participated in 1 of 2 postal questionnaires, wherein they were asked to make treatment decisions in 20 systematically varied case vignettes of patients with symptoms that might indicate depression. Fifteen GPs were invited to participate, of whom 11 (73%) agreed to be interviewed.
Potential participants were sampled to reflect the range of compliance in response to the previous study’s vignettes (5 exhibited high levels of compliance, 3 medium, and 3 low), and to ensure the sample included GPs from different-sized practices (5 GPs worked in small practices, 5 in medium, and 1 in a large practice) and different locations (7 from the Scottish Grampian region, 4 from the Northeast of England). Eight GPs were male, 3 were female. GPs were interviewed during April 2002 at their practice premises by LS. Previous questionnaires did not reveal that analyses took guideline compliance into account; thus it was deemed that participants would not be affected by social desirability characteristics.
Interview procedure
A topic guide was designed to guide interviews and included the research design showing who was to be interviewed and key questions to be addressed. Questions were open-ended, semi-structured, and followed research questions. GPs’ permission was sought to record interviews, and confidentiality was assured. GPs were encouraged to talk freely. Interviews lasted between 45 and 75 minutes; they were tape-recorded and transcribed with all identifying text removed.
Data analysis
Two researchers (LS & AW) analyzed transcripts using the Framework Technique,24 chosen because it is grounded in and driven by participating GPs’ original accounts and observations. Abstraction began after the full data set was reviewed. Emergent themes and issues were noted and given a code, and an index was constructed. This was revised several times as new issues emerged and was systematically reapplied to all the interview transcripts. Interviews were analyzed independently and any differences of interpretation were resolved through discussion.
Results
Of the 7 GPs who knew which was their latest depression guideline, 2 had no problems with recommendations. However, several GPs disagreed with some recommendations, possibly explaining variable compliance.12
Disagreements
One area of disagreement was the recommendation to refer patients, as specialists were not always available or waiting times were too long. Criteria for referring patients to secondary care include diagnostic uncertainty, treatment failure, suicidal tendencies, and psychotic or disturbed behavior. (This recurring issue of referral is discussed below.)
Another area of disagreement was the dura-tion-of-symptoms criterion, as heard in the follow-ing observation:
It stipulates they have to have these features and for at least 2 weeks … and if they only have them for a week why should I wait … why should they be miserable for a week, when I am pretty certain they are depressed? (GP3)
Guidelines’ flexibility
Evidence-based recommendations are usually expressed in terms of typical clinical situations. Perhaps such recommendations are particularly difficult to apply to individuals who can present with varying combinations of pre-existing illness, beliefs about depression, treatment preferences, concerns about confidentiality and stigma, as well as varying degrees of access to care. We therefore asked GPs whether they believed the available depression guidelines are sufficiently flexible to use with all their patients in managing depression.
Many of the GPs thought the guidelines were not flexible. For instance, GP4 said he worried about lawyers becoming involved in guideline compliance, which could result in defensive practice rather than the best treatment for patients. Similarly GP2 said that guidelines should not be used in all situations because they vary so much. GP7 reported that depression guidelines made invalid assumptions about patients presenting with only one illness (and GPs having plenty of time), resulting in the guidelines not being useful for some patients with certain illness combinations.
Barriers to following guidelines
Number of guidelines. The most common perceived barrier preventing these GPs from follow-ing guidelines was the volume of guidelines they receive. They thought they received too many guidelines and had too little time to read them all. The GPs sometimes felt confused about which one to follow. Although they could not quantify how many new guidelines they received in a month, or from how many sources, GPs appeared to feel overwhelmed and despondent.
…There’s a bit of numbing as well: oh no, not another guideline. (GP11)
We get flooded with stuff.… With a lot of stuff I bin it or file it. (GP5)
Time constraints. Lack of time was consistently viewed by participating GPs as a major barrier to guideline use. This is not surprising considering patients are booked in every 5–10 minutes,25 with GPs seeing around 140 patients a week.26 Furthermore, GPs viewed guideline accessibility, style, and presentation as barriers.
SIGN guidelines are always very good because they come on clear to follow laminated cards which are kind of summary versions of them. Many other guidelines are not so good … much longer and difficult to follow.… (GP6)
Lack of resources. Lack of resources re-emerged as a major barrier to following guideline recommendations. Problems of patient referral included having no specialist to refer them to, patients being misled about specialists’ qualifications, and patient confidentiality issues. Several GPs reported that by the time patients received appointments, they reported their problems had disappeared and they no longer wanted appointments.
…a guideline might come through and I’ve followed the protocol … and arranged a referral … then the reply has come back from the hospital that they don’t have the resources for this at the moment. So it [the guideline] has fallen flat on its face and that is extremely disappointing when we in primary care are trying our best. (GP2)
Waiting times reported were between 2 to 26 weeks for psychiatrists or community psychiatric nurses and 9 to 12 months for psychologists. Perceived delays or deficiencies in specialist services may partially explain GPs’ tendency to over prescribe relative to recommendations.12
Increasing guideline use
For guideline use to increase, GPs in this study thought that more resources needed to be put in place (particularly mental health professionals); the number of guidelines issued should be reduced; and guidelines should be produced and sent from a central body with a multidisciplinary team including some GPs, to reduce problems of perceived unrealistic assumptions. Incorporation of guideline recommendations onto computer systems with prompts and flow charts was also suggested by several GPs as method to promote guideline use. The majority of interviewed GPs also said they would like some form of audit and feedback.
We really need some kind of measure.… We’re all meant to audit our work, but again its time and we audit what we have to. If someone could demonstrate that I’m not managing depression well, then I might sit up and think I need that guideline there. We need all the feedback we can get really. (GP9)
Discussion
In this study, GPs perceived barriers to implementation of current depression guidelines matched other research findings on this subject—eg, lack of time,22 lack of resources,17 variability among patients,19-21 lack of awareness,22,23,27 lack of agreement with guideline recommendations,28 and poor accessibility to guidelines.11
The relatively small group of participants in this study cannot be generalized to all GPs. Additionally, there are always difficulties with self-reporting—participants may not do what they say they do. However, “purposive” sampling is consistent with qualitative approaches and allows a wide range of GPs’ views to be explored in depth. This study could be replicated elsewhere to assess how representative these views are.
Interviewed GPs did not always agree with depression guidelines. To address disagreement, some sort of educational intervention may be useful. Previous research has shown educational interventions to enable guideline implementation: an educational program was reportedly one of the most important elements in the successful implementation of cervical screening guidelines28 ; and large group meetings were effective in modifying drug use in coronary artery disease.29
An important theme in this study was the issue of referring patients and the availability of specialist services. GPs disagreed with the recommendations about referring, and saw lack of mental health professionals as a main barrier to following depression guidelines. This problem needs to be addressed, and interviewed GPs believed certain recommendations would be followed if resources were put into place. Their views have important implications for clinical guideline development. Resources must be considered before recommendations are made. Alternatively, those involved in guideline production may be demonstrating the case for more mental health professionals.
The volume of guidelines and lack of time and accessibility to guidelines were also perceived barriers. Both barriers could be addressed by introducing computerized decision support systems. Indeed, several GPs suggested the incorporation of guidelines onto computer systems as a way of promoting guideline use. However, the effect of computerized evidence-based guidelines has been variable,1,30 and further study is needed.
The GPs thought depression guidelines were insufficiently flexible to use with the spectrum of depressed patients they see. However, some expected this, believing there would always be certain patients to whom guidelines do not apply. Greater involvement of GPs in guideline development was seen as a means to addressing this problem as well as reducing unrealistic assumptions made about general practice.
Audit and feedback emerged as a potential method for assessing and improving compliance. This matches the evidence. A review of 12 studies using audit and feedback as implementation strategies concluded these activities change behavior modestly, but all studies reported improvements in the process of care.1
If we are serious about closing the gap between research evidence and practice, possibly a new system of guideline development is needed, with a national clearinghouse for guidelines. Here a multidisciplinary team including some GPs would be responsible for evaluating guidelines, incorporating them onto computer systems, auditing performance, and giving feedback to GPs. This study has opened up possibilities for further exploration.
Acknowledgments
This study was carried out from the Health Services Research Unit, which is funded by the Chief Scientist Office of the Scottish Executive Health Department. LS was supported by the Medical Research Council Health Services Research Collaboration. We would like to thank the GPs who participated in this study, and Vikki Entwistle and Steve Ratcliff for their helpful comments on earlier drafts of this paper. The opinions expressed in this paper are those of the authors, and may not be shared by the funding bodies.
Corresponding author
Liz Smith, MA, PhD, Manchester Centre for Healthcare Management, University of Manchester, Devonshire House, University Precinct Centre, Oxford Road, Manchester, UK, M13 9PL. E-mail: [email protected].
1. Grimshaw JM, Thomas RE, Mac Lennan G, et al. Effectiveness and efficiency of guideline dissemination and implementation strategies. Health Technol Assess 2003 (in press).
2. Institute of Medicine. Guidelines for Clinical Practice: From Development to Use. Washington, DC: National Academic Press; 1992.
3. Thornsen T, Makela M. Changing Professional Practice: Theory and Practice of Clinical Guideline Implementation. Copenhagen, Denmark: Danish Institute for Health Services Research and Development; 1999.
4. Woolf FH, Grol R, Hutchinson A, Eccles M, Grimshaw J. Potential benefits, limitations, and harms of clinical guidelines. BMJ 1999;318:527-530.
5. Stephenson A. A Textbook of General Practice. London: Arnold; 1999.
6. Sackett DL, Rosenberg WMC, Muir Gray JA, Haynes RB, Richardson WS. Evidence based medicine: what it is and what it is n’t. BMJ 1996;312:71-72.
7. Oxman AD, Thomson MA, Davis DA, Haynes RB. No magic bullets: a systematic review of 102 trials of interventions to improve professional practice. CMAJ 1995;153:1423-1431.
8. Littlejohns P, Cluzeau F, , Bale R, Grimshaw J, Feder G, Moran S. The quantity and quality of clinical practice guidelines for the management of depression in primary care in the UK. Br J Gen Pract 1999;49:205-210.
9. Paykel ES, Priest RG. Recognition and Management of depression in general practice: consensus statement. BMJ 1992;305:1998-1202.
10. Katon W, Von Korff M, Lin E, et al. Collaborative management to achieve treatment guidelines: impact on depression in primary care. JAMA 1995;273:1026-1031.
11. Cranney M, Warren E, Barton S, Gardner K, Walley T. Why do GPs not implement evidence-based guidelines? A descriptive study. Fam Pract 2001;18:359-363.
12. Smith L, Gilhooly K, Walker AE. Factors influencing prescribing decisions in the treatment of depression: a social judgement theory approach. Applied Cognitive Psychology 2003;17:51-63.
13. Hirschfeld RM, Keller MB, Panico S, et al. National Depressive and Manic-Depressive Association consensus statement on the undertreatment of depression. JAMA 1997;277:333-340.
14. Fisch HU, Hammond KR, Joyce CRB, O’Reilly M. An Experimental study of the Clinical Judgement of General Physicians in evaluating and prescribing for Depression. Br J Psychiatry 1981;138:100-109.
15. Davidson JR, Meltzer-Brody SE. The underrecognition and undertreatment of depression: what is the breadth and depth of the problem? J Clin Psychiatry 1999;60:4-9.
16. Robins LN, Regier DA, Eds. Psychiatric Disorders in America: The Epidemiologic Catchment Area Study. New York, NY: The Free Press; 1991.
17. Telford R, Hutchinson A, Jones R, Rix S, Howe A. Obstacles to the effective treatment of depression: A general practice perspective. Fam Pract 2002;19:45-52.
18. Nutting PA, Rost K, Dickinson M, et al. Barriers to initiating depression treatment in primary care practice. J Gen Intern Med 2002;17:103-111.
19. Cabana MD, Rushton JL, Rush AJ. Implementing practice guidelines for depression: Applying a new framework to an old problem. Gen Hosp Psychiatry 2002;24:35-42.
20. Kaddam UT, Croft P, McLeod J, Hutchinson M. A qualitative study of patients’ view on anxiety, and depression. Br J Gen Pract 2001;51:375-380.
21. Cooper-Patrick L, Powe NR, Jenckes MW, Gonzales JJ, Levin DM, Ford DE. Identification of patient attitudes and p regarding treatment of depression. J Gen Int Med 1997;12:431-438.
22. Feldman EL, Jaffe A, Galambos N, Robbins A, Kelly RB, Froom J. Clinical practice guidelines on depression: awareness, attitudes, and content knowledge among family physicians in New York. Arch Fam Med 1998;7:58-62.
23. Betz-Brown J, Shye D, McFarland B. The paradox of guideline implementation: how AHCPR’s depression guideline was adapted at Kaiser Permanente Northwest Region. J Qual Improv 1995;21:5-21.
24. Ritchie J, Spencer L. Qualitative data analysis for applied policy research. In Bryman A, Burgess R (Eds): Analysing Qualitative Data. London: Routledge; 1994;173-194.
25. Waller J, Hodgkin P. General Practice, Demanding Work. Oxford: Radcliffe Medical Press; 2000.
26. Audit Commission A Prescription for Improvement: Towards More Rational Prescribing in General Practice. London: HMSO; 1994.
27. Cabana MD, Ebel BE, Cooper-Patrick L, et al. Barriers that pediatricians face when using asthma practice guidelines. Arch Ped Adol Med 2000;154:685-693.
28. Hermens RP, Hak E, Hulscher ME, Braspenning JC, Grol RP. Adherence to guidelines on cervical cancer screening in general practice: programme elements of successful implementation. Br J Gen Pract, 2001;51:897-903.
29. Sarasin FP, Maschiangelo ML, Schaller MD, Heliot C, Mischler S, Gaspoz JM. Successful implementation of guidelines for encouraging the use of beta blockers in patients after acute myocardial infarction [comment]. Am J Med 1999;106:499-505.
30. Eccles M, McColl E, Steen N, et al. Effect of computerised evidence based guidelines on management of asthma and angina in adults in primary care: cluster randomised controlled trial. BMJ 2002;325:941-946.
The power of power
The first trial of beta-blockers in myocardial infarction was entitled “The lack of prophylactic effect of propranolol in myocardial infarction”1—a conclusion inconsistent with our current understanding of beta-blocker therapy. The reason has to do with “statistical power”—a statistic that tells us the chance of finding a significant difference between treatments.2
Type 1 and type 2 errors
We draw conclusions based on the results of clinical trials. No trial is perfect. Trials are designed with the knowledge that there is a probability of drawing a conclusion based on the results that does not represent the truth about 2 or more therapies.
If we conclude from the results of a trial that 2 therapies are of different effectiveness, when in reality they are the same, we have committed what is known as a type 1 error. The probability of making a type 1 error is termed the alpha. Trials are usually designed with an a of 0.05 (5%).
On the other hand, if we conclude that the 2 therapies are the same when they are actually different, we have committed a type 2 error. The probability of making a type 2 error is known as the beta.
Perhaps a bit more intuitively, we are often interested in knowing the probability of finding a difference when there really is one. This probability is called power and may be expressed as 1-β .
Power in study design
In designing a study, the power of a study to detect differences between 2 groups depends upon the number of subjects in each group, whether the groups are equal in size, the variability of responses among subjects, the magnitude of difference one is trying to detect, and the probability of making a type 1 error.3 Researchers can make some educated assumptions to determine the number of subjects to include in a study to assure that clinically relevant differences are found between 2 groups if they exist.
Practicing clinicians should use power to determine the impact of a negative study. For example, the propranolol study1 was designed with a power of only 23%, meaning that there was only a 23% chance of detecting a difference. Drawing conclusions about the lack of effectiveness of propranolol based on this study, therefore, would be a mistake. In clinical trials of an active drug vs a placebo, 100 subjects in each group or more are often needed to detect clinically relevant results—so beware of negative results with small numbers of patients.
Correspondence
Goutham Rao, MD, 3518 Fifth Avenue, Pittsburgh, PA 15261. E-mail: [email protected].
1. Clausen J, Felski M, Jorgensen FS. The lack of prophylactic effect of propranolol in myocardial infarction. Lancet 1966;2:920-924.
2. Freiman JA, Chalmers TC, Smith H. The importance of beta, the Type II error, and sample size in the design and interpretation of the randomized control trial. N Engl J Med 1978;299:690-694.
3. Cohen J. A power primer. Psychological Bulletin 1992;112:155-159.
The first trial of beta-blockers in myocardial infarction was entitled “The lack of prophylactic effect of propranolol in myocardial infarction”1—a conclusion inconsistent with our current understanding of beta-blocker therapy. The reason has to do with “statistical power”—a statistic that tells us the chance of finding a significant difference between treatments.2
Type 1 and type 2 errors
We draw conclusions based on the results of clinical trials. No trial is perfect. Trials are designed with the knowledge that there is a probability of drawing a conclusion based on the results that does not represent the truth about 2 or more therapies.
If we conclude from the results of a trial that 2 therapies are of different effectiveness, when in reality they are the same, we have committed what is known as a type 1 error. The probability of making a type 1 error is termed the alpha. Trials are usually designed with an a of 0.05 (5%).
On the other hand, if we conclude that the 2 therapies are the same when they are actually different, we have committed a type 2 error. The probability of making a type 2 error is known as the beta.
Perhaps a bit more intuitively, we are often interested in knowing the probability of finding a difference when there really is one. This probability is called power and may be expressed as 1-β .
Power in study design
In designing a study, the power of a study to detect differences between 2 groups depends upon the number of subjects in each group, whether the groups are equal in size, the variability of responses among subjects, the magnitude of difference one is trying to detect, and the probability of making a type 1 error.3 Researchers can make some educated assumptions to determine the number of subjects to include in a study to assure that clinically relevant differences are found between 2 groups if they exist.
Practicing clinicians should use power to determine the impact of a negative study. For example, the propranolol study1 was designed with a power of only 23%, meaning that there was only a 23% chance of detecting a difference. Drawing conclusions about the lack of effectiveness of propranolol based on this study, therefore, would be a mistake. In clinical trials of an active drug vs a placebo, 100 subjects in each group or more are often needed to detect clinically relevant results—so beware of negative results with small numbers of patients.
Correspondence
Goutham Rao, MD, 3518 Fifth Avenue, Pittsburgh, PA 15261. E-mail: [email protected].
1. Clausen J, Felski M, Jorgensen FS. The lack of prophylactic effect of propranolol in myocardial infarction. Lancet 1966;2:920-924.
2. Freiman JA, Chalmers TC, Smith H. The importance of beta, the Type II error, and sample size in the design and interpretation of the randomized control trial. N Engl J Med 1978;299:690-694.
3. Cohen J. A power primer. Psychological Bulletin 1992;112:155-159.
A Double-Blind Comparative Study of Sodium Sulfacetamide Lotion 10% Versus Selenium Sulfide Lotion 2.5% in the Treatment of Pityriasis (Tinea) Versicolor
Hospitalists and family physicians: Understanding opportunities and risks
Family physicians can leverage relationships with hospitalists by ensuring strong, ongoing communication to reduce risks to patients associated with lost information, miscommunications, and gaps in continuity of care.
Family physicians will be well served by supporting new research on the influence of the hospitalist model on family practice; especially research that demonstrates the value of continuity of care, alternative compensation models, and longitudinal studies that assess qualitative and quantitative outcomes of hospitalist systems from the perspective of family physicians.
Background: Emergence of the hospitalist as a specialist in inpatient medicine provides an opportunity to examine a new provider type and its relation to family physicians.
Objectives: To review the hospitalist literature to understand the hospitalist role, identify benefits and risks of the hospitalist model to family physicians, and discuss future opportunities to study and work with hospitalists.
Methods: An integrative review of published literature about the hospitalist model focused on the influence of hospitalists on family practice.
Results: Three main themes were identified as interest areas for family physicians: descriptions of the hospitalist role and responsibilities; hypothesized benefits and risks of the hospitalist model; and reported research results evaluating the effect of the hospitalist model. Two major opportunities related to hospitalists and family physicians were also uncovered: opportunities to conduct future research to study the influence of hospitalists on family physicians; and opportunities to create workable relationships with these new practitioners.
Conclusions: Despite some opposition to hospitalist programs, the economic climate and increasing productivity standards suggest that these programs are here for the foreseeable future, and it is in family physicians’ best interests to understand the opportunities and risks of the hospitalist model. Family physicians can work proactively with this new patient care model by participating in the development of standardized and efficient ways to communicate and to partner with hospitalists. Meanwhile, future research studies can help inform the debate by investigating the specific influence of hospitalist models on family practice.
The hospitalist model has spread relatively rapidly throughout hospitals in the United States. Family physicians can proactively work with this new patient care model by developing standardized and efficient ways to communicate and to partner with hospitalists.
Advances in electronic data exchange can help facilitate these communications, and can reduce the risks associated with discontinuity of care inherent in the hospitalist model. Developing communications protocols involving transfer of patient information and maintaining contact with hospitalists while patients are under their care can help family physicians best serve the needs of their patients and ensure continuity of care and compliance with patient wishes.
Hospitalists in the US
Rarely in medicine does the opportunity arise to examine a newly developed area of medical specialization and its effect on other providers. The emergence of the hospitalist, a specialist in inpatient medicine, provides this opportunity. Although dedicated inpatient physicians have been in practice in Canada and overseas for some time,1-6 attention to, and experimentation with, this role in the US has been relatively new.
Hospitalists were first described in 1996 by Robert Wachter and Lee Goldman,7 who coined the term and have widely studied and promoted the model. Presently, approximately 6000 US hospitalists are practicing inpatient medicine in diverse organizations, including adult and children’s hospitals and skilled nursing facilities. The number of hospitalists in practice in the US has been projected to increase to around 19,000 within the next 10 years, making the size of hospitalist physician practice similar to that of the specialty of cardiology,1 but far smaller than that of family practice.
Yet the introduction and spread of hospitalists throughout the US has not occurred without controversy. Given substantial debate about the changing role of family practitioners with respect to such issues as scope of practice, professional identity, and care and service to patients, the emergence of hospitalists has been perceived by many as a potential threat on all fronts.
Responses to the hospitalist movement
Responses to the hospitalist movement vary. To many, a specialty in hospital medicine appears to threaten the role of generalists in health care practice, and risks such as a reduced practice scope or the loss of hospital privileges are real concerns.8-11 For others, the introduction of hospitalists has increased flexibility for family practitioners who are interested in working with or becoming hospitalists themselves.
As of 2001, 1 in 5 members of the American Academy of Family Physicians reported using hospitalists. Further, reasons such as economics, lifestyle choices, and concern about maintaining competence in caring for hospitalized patients have contributed to the decision of as many as 1 in 5 family practitioners who have chosen not to be involved in hospital care.12 Yet, as noted by Edsall,13 for family practitioners who choose not to practice inpatient medicine, the philosophical, professional, and financial risks of that decision should not be trivialized.
Despite the debate in the literature and the media, it appears this inpatient care model is here to stay.1,13,16 Major medical organizations, including the American Academy of Family Physicians and the American College of Physicians–American Society of Internal Medicine, now note that hospitalist programs are acceptable as long as they are well designed and implemented voluntarily, and this consensus has helped spark program growth.17
However, the increasing presence of hospitalists in hospitals and academic medical centers is forcing many family physicians to choose how involved they want to be in inpatient medicine. The goal of this study was to synthesize available information in the literature regarding the practice of hospitalists and their effect on family physicians, and to provide a discussion about future research opportunities to further evaluate the hospitalist model and its influence on family practice.
Methods
A comprehensive review of the literature was conducted by database searches, by hand, and the Internet. Medline, Lexis-Nexis, and Academic Universe were used as the primary databases for the literature search. Key words such as hospitalists, inpatient physicians, hospital medicine, primary care physicians, and family practice were used to focus a search. Furthermore, references in each article were reviewed to find related literature.
Literature was largely concentrated within the past 5 years and included both peer-reviewed and descriptive articles on hospitalists and their effect. Internet searches used Google as the primary search engine; results supplemented findings in other published material.
This literature review continued until saturation was achieved with respect to considering the possible issues and implications of the expansion of hospitalists, with special attention paid to the risks and opportunities to family physicians.
Findings
This integrative literature review revealed 3 major themes of interest to family physicians regarding the emergence and expansion of hospitalists in the US: descriptions of the hospitalist role and responsibilities; hypothesized benefits and risks of the hospitalist model; and reported research results evaluating the effect of the hospitalist model. Synthesis of this literature also uncovered 2 major opportunities related to hospitalist practice: opportunities to conduct future research to study the impact of hospitalists on family physicians; and opportunities to leverage relationships with these new practitioners.
Hospitalist roles and responsibilities
A hospitalist physician is a new type of medical specialist who combines the roles of acute care subspecialist and medical generalist in the hospital care setting.18 Hospitalists do not replace primary care physicians, surgeons, or specialists, but, instead, are concerned with managing hospital inpatients, from admission until discharge. They act somewhat as a case manager for a patient’s hospital stay, working and communicating closely with other physicians involved in the patient’s care.
Patients are assigned to hospitalists upon admission, either when an outpatient provider such as a family practitioner transfers inpatient care responsibilities to the hospitalist, or when patients arrive at the hospital unassigned to any other provider. The clinical and organizational responsibilities of hospitalists are in Table 1.
TABLE 1
Typical responsibilities of hospitalist physicians
| Clinical |
| Patient admissions, daily inpatient rounds, and medical care attention |
| Ordering consultations, requesting tests, managing medications |
| Assisting other physicians with medical consultations |
| Helping with preoperative care and evaluations |
| Providing coverage of unassigned Emergency Department patients |
| Communicating with other involved physicians about patient conditions |
| Managing patient and family communications |
| Working with discharge planning, overseeing transfers from hospital, and post-hospital follow-up care |
| Organizational |
| Service on committees, involvement in administrative roles |
| Involvement in hospital quality assurance and utilization review activities |
| Involvement in disease management, care innovations |
| Teaching of medical students, residents, fellows |
| Involvement in hospital operations and systems improvement |
| Involvement in practice guideline and protocol development |
| Involvement in clinical information system development |
| Administrative involvement in hospitalist program including physician recruitment, scheduling, program development |
| Research responsibilities |
| Sources: Lurie et al 1999,1 Wachter et al 1996,7 Wachter 1999,19 and Geehr and Nelson 2002.20 |
Hypothesized benefits and risks of the hospitalist model
Persuasive arguments have been raised about the advantages and disadvantages of the hospitalist model.18,19,21,22 A variety of these potential advantages and disadvantages are summarized in Table 2, representing perspectives of 3 different stakeholder groups: hospitals, patients and families, and hospitalist physicians. Each of the listed advantages or disadvantages was discussed in 3 or more independent articles that were reviewed.
For family physicians specifically, the introduction of a hospitalist program at a local hospital has numerous associated potential benefits and risks. Table 3 presents a summary of the issues that were raised in 3 or more articles or studies.
Benefit: focus on ambulatory care. One widely discussed advantage in using hospitalists is the option for family practitioners, who so desire, to limit practice to outpatient medicine because of their interest in ambulatory care or because they feel overtaxed by the demands of the health care system.12,21 Willing family physicians can relinquish care of their hospitalized patients to a hospitalist so they do not have to travel to the hospital for daily rounds or more frequent patient contact; upon hospital discharge, family practitioners subsequently resume care for their patients.
Given the pressures of managed care to increase office productivity,48 this delegation of responsibilities can create an important practice advantage.15 Even for those family physicians who choose to visit their hospitalized patients, shifting overall responsibility for inpatient care to hospitalists can make hospital visits more efficient and thereby free office time for outpatient practices.49
Risk: lack of patient familiarity. Research has shown that a lack of familiarity with patients can increase the risk of errors and poor outcomes in medicine, and the use of a hospitalist as a new provider indeed introduces this risk.50,51
Without dedicated effort on the part of the family physician, the treating hospitalist may have limited appreciation of a patient’s situation. Hospitalists focused only on inpatient care may not know where patients come from or where they return to, and are less likely to be knowledgeable about needs for psychosocial support or for such patient preferences as end-of-life care.14,21
Risk: reduced political leverage. In addition, a political issue for family physicians may arise if hospitalists become providers of choice for inpatient internal medicine, thereby defining a smaller role for community-based family practitioners.21
Risk: communication problems. Another major risk of hospitalist programs is poor communication, an issue raised in nearly every article discussing the hospitalist model. The involvement of a new physician provider and the process of patient care transfers between outpatient family physicians and inpatient hospitalists can lead to missed information, gaps in communication, and misunderstandings.19,22,35,37
Recent studies of discontinuity of care when patients are hospitalized reported that inpatients specifically wanted both contact with their primary care physicians and good communication between their established primary care physician and hospital-based physicians.49 Guidelines created by the American Academy of Family Physicians (www.aafp.org/x6873.xml) support communication and interaction between community-based physicians and hospitalists for excellent patient care,12 but the burden may fall on family physicians to ensure communication.
TABLE 2
Stakeholder perspectives of hospitalist model: Advantages and disadvantages
| Stakeholder perspective | Potential advantages | Potential disadvantages |
|---|---|---|
| Hospital |
|
|
| Patients and families | ||
| Hospitalist physicians | ||
| PCP, primary care physician. | ||
TABLE 3
Potential benefits and risks of the hospitalist model for family physicians
| Potential benefits for family physicians15,33,47-49 |
| Increased office productivity, less disruption of office schedules |
| Career development option limited to outpatient care setting may be desired lifestyle hoice |
| Extra time for outpatients |
| Reduced travel time, especially for physicians in distant practice areas |
| Improved outpatient satisfaction |
| Increased provider satisfaction with ability to specialize in outpatient care |
| Can offset lost inpatient revenues with increases in office volume |
| Reduction in life stress and potential burnout |
| Potential risks for family physicians12,32,50,51 |
| Discontinuity in care for patients |
| Communication problems regarding patient care |
| Loss of information about patient wishes |
| Reduced contact with hospital-based professionals, specialists |
| Loss of influence at admitting hospitals, loss of hospital privileges |
| Decline in acute care skills, changes in continuing medical education |
| Shift in professional identity |
| Loss of status for outpatient practice |
| Reduced variety in medical education |
| Loss of variety in scope of family practice |
Assessing the effect of the hospitalist model
Research evaluating the impact of hospitalists has largely focused on hospital-based outcomes. Recently, Wachter and Goldman’s review of 19 published studies showed that hospital costs decreased 13.4% on average and hospital lengths of stay decreased 16.6% on average after a hospitalist program was initiated.23 These efficiency improvements were apparently gained while patient satisfaction was preserved.
However, results indicating improved outcomes, such as mortality and readmissions, were reportedly inconsistent among the studies evaluated.23 Additional studies3,24,52 of hospitalist programs have shown similar reductions in hospital costs and lengths of stay, and have also reported preservation or improvement of quality of care as measured by reductions in mortality3,24 and constancy of readmission rates.52
Study of the effect of hospitalists specifically on family practice has been limited. As noted by Smith and colleagues,53 methodologic constraints limit the reliability of many reported results, and the focus of most studies does not extend beyond the hospital setting.
This study additionally questioned whether hospitalist care is truly of better quality and lowers costs. Findings of higher costs associated with subspecialist vs generalist hospitalist care also warrant further investigation in larger studies. Also, because many recent studies have examined only length of stay and in-hospital costs, it is still unknown whether the hospitalist model produces costs savings for the health system overall.12
Opportunities to further study hospitalists and their impact
Research has focused largely on quantitative values related to hospitalist care. Yet the emergence of this new provider type introduces issues to be studied that encompass more than effects on length of stay and mortality.
In particular, questions remain about issues surrounding the patient–physician relationship, including patient perceptions of how hospitalists affect communication, continuity of care, and trust.16 Similarly, studies have investigated primary care physicians’ attitudes regarding desired communication with hospitalists,14 but none have studied the changing role of primary care hysicians who no longer perform inpatient care, or have questioned family physicians about career satisfaction.
Further, published studies have not been large enough to consider the influence of multiple independent variables such as hospital type, hospital location, or patient factors such as insurance status, disease classification, or psychosocial issues. Table 4 shows some of the many opportunities to formally study the effect of hospitalists on family practice, considering both the areas of existing research focus and new areas that can be explored.
TABLE 4
Opportunities to study impact of hospitalists on family practice
| Existing research focus on hospitalists |
| Satisfaction of patient, hospitalist, primary care provider |
| Quality of hospital care |
| Effects on hospital length of stay |
| In-hospital mortality |
| Readmission rates |
| Hospital cost savings opportunities |
| Hospitalist productivity, workload |
| New areas for family practice-focused research |
| Family practitioner experience, satisfaction |
| Perceptions of family practitioners, other primary care providers regarding disruption of patient care relationships,40 continuity of care issues |
| Outpatient costs, follow-up care costs |
| Economic impact of alternative compensation arrangements |
| Evaluation of economic and noneconomic benefits of continuity of care |
| Integration with nonhospitalist physicians, nonphysician workers |
| Qualitative perspectives of different stakeholders |
| Distinction between urban and rural practice settings |
| Distinction between community-based and academic practices |
| Family practitioner productivity, workload |
Conclusions
Given that the goal of hospitalists is to affect the hospital sector of the US market—associated with around $430 billion in expenditures for 200054,55 —the potential to decrease costs while preserving quality of care is undeniably attractive. However, research evidence does not show uniformly positive results from the introduction of hospitalist programs.
A primary concern is that the purposeful discontinuity of care introduced by the hospitalist can affect quality of care, resulting in medical errors and poor outcomes for patients.32 In addition, more attention must be given to compensation and reimbursement so that family physicians are not discouraged from providing inpatient care for purely financial reasons.
Although a number of publications have discussed the implications of hospitalists, the specific effect of the hospitalist model on family practice remains largely unknown. Knowledge of such effects can be increased by performing well-designed research involving family physicians and by including both qualitative and quantitative approaches. Answers to clinical and managerial questions such as how to best manage communications, how to facilitate the crucial transitions between outpatient and inpatient care, and how to maintain clinical relationships given the introduction of a new provider type can help family physicians preserve and enhance relationships with hospitals, inpatient providers, and patients.
Acknowledgments
The author is very grateful to Kelly Kelleher, MD, MPH, and to the editors of this Journal for thoughtful review and suggestions to improve this report. The author has no conflict of interest to report.
Correspondence
Ann Scheck McAlearney, ScD, Division of Health Services Management and Policy, Ohio State University, School of Public Health, 1583 Perry Street, Atwell Hall 246, Columbus, OH 43210-1234. E-mail:[email protected].
1. Lurie JD, Miller DP, Lindenauer PK, Wachter RM, Sox HC. The potential size of the hospitalist workforce in the United States. Am J Med 1999;106:441-445.
2. Redelmeier DA. A Canadian perspective on the American hospitalist movement. Arch Intern Med 1999;159:1665-1668.
3. Meltzer D, Manning WG, Morrison J, et al. Effects of physician experience on costs and outcomes on an academic general medicine service: results of a trial of hospitalists. Ann Intern Med 2002;137:866-874.
4. Ikegami N, Campbell JC. Medical care in Japan. N Engl J Med 1995;333:1295-1299.
5. Peabody JW, Bickel SR, Lawson JS. The Australian health care system. Are the incentives down under right side up? JAMA 1996;276:1944-1950.
6. Grumbach K, Fry J. Managing primary care in the United States and in the United Kingdom. N Engl J Med 1993;328:940-945.
7. Wachter RM, Goldman L. The emerging role of “hospitalists” in the American health care system. N Engl J Med 1996;335:514-517.
8. Rosser WW. Approach to diagnosis by primary care clinicians and specialists: is there a difference? J Fam Pract 1996;42:139-144.
9. St Peter RF, Reed MC, Kemper P, Blumenthal D. Changes in the scope of care provided by primary care physicians. N Engl J Med 1999;341:1980-1985.
10. White B. Are the edges of family practice being worn away? Fam Pract Manag 2000;7(2):35-40.
11. Henry L. What the hospitalist movement means to family physicians. Fam Pract Manag 1998;5(10):54-62.
12. Bagley B. The hospitalist movement and family practice—an uneasy fit. J Fam Pract 2002;51:1028-1029.
13. Edsall RL. Family practice without hospital practice. Fam Pract Manag 1997;4(7).:
14. Pantilat SZ, Lindenauer PK, Katz PP, Wachter RM. Primary care physician attitudes regarding communication with hospitalists. Am J Med 2001;111:15S-20S.
15. Auerbach AD, Nelson EA, Lindenauer PK, Pantilat SZ, Katz PP, Wachter RM. Physician attitudes toward and prevalence of the hospitalist model of care: results of a national survey. Am J Med 2000;109:648-653.
16. The who what when where whom andhow of hospitalist care. Ann Intern Med 2002;137:930-931.
17. Hruby M, Pantilat SZ, Lo B. How do patients view the role of the primary care physician in inpatient care? Am J Med 2001;111:21S-25S.
18. Schroeder S, Shapiro R. The hospitalist: new boon for internal medicine or retreat from primary care? Ann Intern Med 1999;130:382-387.
19. Wachter RM. An introduction to the hospitalist model. Ann Intern Med 1999;130:338-342.
20. Geehr EC, Nelson JR. Hospitalists: who they are and what they do. Physician Exec 2002;28:26-31.
21. Sox HC. The hospitalist model: perspectives of the patient, the internist, and internal medicine. Ann Intern Med 1999;130:368-372.
22. Lo B. Ethical and policy implications of hospitalist systems. Am J Med 2001;111:48S-52S.
23. Wachter RM, Goldman L. The hospitalist movement 5 years later. JAMA 2002;287:487-494.
24. Auerbach AD, Wachter RM, Katz P, Showstack J, Baron RB, Goldman L. Implementation of a voluntary hospitalist service at a community teaching hospital: improved clinical efficiency and patient outcomes. Ann Intern Med 2002;137:859-865.
25. Alpers A. Key legal principles for hospitalists. Am J Med 2001;111:5S-9S.
26. Hoff T, Whitcomb WF, Nelson JR. Thriving and surviving in a new medical career: the case of hospitalist physicians. J Health Soc Behav 2002;43:72-91.
27. Noyes BJ, Healy SA. The hospitalist: the new addition to the inpatient management team. J Nurs Adm 1999;29(2):21-24.
28. Frank GD, Gonzales D. Developing a successful hospitalist program. Physician Exec 2002;28:32-36.
29. Edlich RF, Hill LG, Heather CL. A national epidemic of unassigned patients: is the hospitalist the solution? J Emerg Med 2002;23:297-300.
30. Goldman L. The impact of hospitalists on medical education and the academic health system. Ann Intern Med 1999;130:364-367.
31. Chaty B. Hospitalists: an efficient, new breed of inpatient caregivers. Healthc Financ Manage 1998;52(9):47-49.
32. Goldmann DR. The hospitalist movement in the United States: what does it mean for internists? Ann Intern Med 1999;130:326-327.
33. Hardy T. Group practice management: the evolution of hospitalist programs. Healthc Financ Manage 2000;54(9):63-70.
34. Wachter RM, Pantilat SZ. The “continuity visit” and the hospitalist model of care. Am J Med 2001;111:40S-42S.
35. Wachter RM, Goldman L. The role of “hospitalists” in the health care system [author reply]. N Engl J Med 1997;336:445-446.
36. Pantilat SZ. End-of-life care for the hospitalized patient. Med Clin North Am 2002;86:749-770.
37. Auerbach AD, Davis RB, Phillips RS. Physician views on caring for hospitalized patients and the hospitalist model of inpatient care. J Gen Intern Med 2001;16:116-119.
38. Wachter RM. The hospitalist movement: ten issues to consider. Hosp Pract (Off Ed) 1999;34:95-98,104-106, 111.
39. Lindenauer PK, Pantilat SZ, Katz PP, Wachter RM. Hospitalists and the practice of inpatient medicine: results of a survey of the National Association of Inpatient Physicians. Ann Intern Med 1999;130:343-349.
40. Hoff TH, Whitcomb WF, Williams K, Nelson JR, Cheesman RA. Characteristics and work experiences of hospitalists in the United States. Arch Intern Med 2001;161:851-858.
41. Manian FA. Whither continuity of care? N Engl J Med 1999;340:1362-1363.
42. Armour BS, Pitts MM, Maclean R, et al. The effect of explicit financial incentives on physician behavior. Arch Intern Med 2001;161:1261-1266.
43. Davis KM, Koch KE, Harvey JK, Wilson R, Englert J, Gerard PD. Effects of hospitalists on cost, outcomes, and patient satisfaction in a rural health system. Am J Med 2000;108:621-626.
44. Freese RB. The Park Nicollet experience in establishing a hospitalist system. Ann Intern Med 1999;130:350-354.
45. Saint S, Zemencuk JK, Hayward RA, Golin CE, Konrad TR, Linzer M. SGIM Career Satisfaction Group. What effect does increasing inpatient time have on outpatient-oriented internist satisfaction? J Gen Intern Med 2003;18:725-729.
46. Guttler S. The role of “hospitalists” in the health care system [letter]. N Engl J Med 1997;336:444-445.
47. Bagley B. Hospitalists and the family physician. Am Fam Physician 1998;58:336-339.
48. Grumbach K, Osmond D, Vranizan K, Jaffe D, Bindman AB. Primary care physicians’ experience of financial incentives in managed care systems. N Engl J Med 1998;339:1516-1521.
49. Edlin M. Talking it out: busy doctors struggle to improve relationships with patients. Modern Physician. 1999 April 1.
50. Petersen LA, Brennan TA, O’Neil AC, Cook EF, Lee TH. Does housestaff discontinuity of care increase the risk for preventable adverse events? Ann Intern Med 1994;121:866-872.
51. Petersen LA, Orav EJ, Teich JM, O’Neil AC, Brennan TA. Using a computerized sign-out program to improve continuity of inpatient care and prevent adverse events. Jt Comm J Qual Improv 1998;24:77-87.
52. Gregory D, Baigelman W, Wilson IB. Hospital economics of the hospitalist. Health Serv Res 2003;38:905-918.
53. Smith PC, Westfall JM, Nicholas RA. Primary care family physicians and 2 hospitalist models: comparison of outcomes, processes, and costs. J Fam Pract 2002;51:1021-1027.
54. Ginzberg E. The changing US health care agenda. JAMA 1998;279:501-504.
55. Heffler S, Smith S, Won G, Clemens MK, Keehan S, Zezza M. Health spending projections for 2001—2011: the latest outlook. Faster health spending growth and a slowing economy drive the health spending projection for 2001 up sharply. Health Aff (Millwood). 2002;21(2):207-218
Family physicians can leverage relationships with hospitalists by ensuring strong, ongoing communication to reduce risks to patients associated with lost information, miscommunications, and gaps in continuity of care.
Family physicians will be well served by supporting new research on the influence of the hospitalist model on family practice; especially research that demonstrates the value of continuity of care, alternative compensation models, and longitudinal studies that assess qualitative and quantitative outcomes of hospitalist systems from the perspective of family physicians.
Background: Emergence of the hospitalist as a specialist in inpatient medicine provides an opportunity to examine a new provider type and its relation to family physicians.
Objectives: To review the hospitalist literature to understand the hospitalist role, identify benefits and risks of the hospitalist model to family physicians, and discuss future opportunities to study and work with hospitalists.
Methods: An integrative review of published literature about the hospitalist model focused on the influence of hospitalists on family practice.
Results: Three main themes were identified as interest areas for family physicians: descriptions of the hospitalist role and responsibilities; hypothesized benefits and risks of the hospitalist model; and reported research results evaluating the effect of the hospitalist model. Two major opportunities related to hospitalists and family physicians were also uncovered: opportunities to conduct future research to study the influence of hospitalists on family physicians; and opportunities to create workable relationships with these new practitioners.
Conclusions: Despite some opposition to hospitalist programs, the economic climate and increasing productivity standards suggest that these programs are here for the foreseeable future, and it is in family physicians’ best interests to understand the opportunities and risks of the hospitalist model. Family physicians can work proactively with this new patient care model by participating in the development of standardized and efficient ways to communicate and to partner with hospitalists. Meanwhile, future research studies can help inform the debate by investigating the specific influence of hospitalist models on family practice.
The hospitalist model has spread relatively rapidly throughout hospitals in the United States. Family physicians can proactively work with this new patient care model by developing standardized and efficient ways to communicate and to partner with hospitalists.
Advances in electronic data exchange can help facilitate these communications, and can reduce the risks associated with discontinuity of care inherent in the hospitalist model. Developing communications protocols involving transfer of patient information and maintaining contact with hospitalists while patients are under their care can help family physicians best serve the needs of their patients and ensure continuity of care and compliance with patient wishes.
Hospitalists in the US
Rarely in medicine does the opportunity arise to examine a newly developed area of medical specialization and its effect on other providers. The emergence of the hospitalist, a specialist in inpatient medicine, provides this opportunity. Although dedicated inpatient physicians have been in practice in Canada and overseas for some time,1-6 attention to, and experimentation with, this role in the US has been relatively new.
Hospitalists were first described in 1996 by Robert Wachter and Lee Goldman,7 who coined the term and have widely studied and promoted the model. Presently, approximately 6000 US hospitalists are practicing inpatient medicine in diverse organizations, including adult and children’s hospitals and skilled nursing facilities. The number of hospitalists in practice in the US has been projected to increase to around 19,000 within the next 10 years, making the size of hospitalist physician practice similar to that of the specialty of cardiology,1 but far smaller than that of family practice.
Yet the introduction and spread of hospitalists throughout the US has not occurred without controversy. Given substantial debate about the changing role of family practitioners with respect to such issues as scope of practice, professional identity, and care and service to patients, the emergence of hospitalists has been perceived by many as a potential threat on all fronts.
Responses to the hospitalist movement
Responses to the hospitalist movement vary. To many, a specialty in hospital medicine appears to threaten the role of generalists in health care practice, and risks such as a reduced practice scope or the loss of hospital privileges are real concerns.8-11 For others, the introduction of hospitalists has increased flexibility for family practitioners who are interested in working with or becoming hospitalists themselves.
As of 2001, 1 in 5 members of the American Academy of Family Physicians reported using hospitalists. Further, reasons such as economics, lifestyle choices, and concern about maintaining competence in caring for hospitalized patients have contributed to the decision of as many as 1 in 5 family practitioners who have chosen not to be involved in hospital care.12 Yet, as noted by Edsall,13 for family practitioners who choose not to practice inpatient medicine, the philosophical, professional, and financial risks of that decision should not be trivialized.
Despite the debate in the literature and the media, it appears this inpatient care model is here to stay.1,13,16 Major medical organizations, including the American Academy of Family Physicians and the American College of Physicians–American Society of Internal Medicine, now note that hospitalist programs are acceptable as long as they are well designed and implemented voluntarily, and this consensus has helped spark program growth.17
However, the increasing presence of hospitalists in hospitals and academic medical centers is forcing many family physicians to choose how involved they want to be in inpatient medicine. The goal of this study was to synthesize available information in the literature regarding the practice of hospitalists and their effect on family physicians, and to provide a discussion about future research opportunities to further evaluate the hospitalist model and its influence on family practice.
Methods
A comprehensive review of the literature was conducted by database searches, by hand, and the Internet. Medline, Lexis-Nexis, and Academic Universe were used as the primary databases for the literature search. Key words such as hospitalists, inpatient physicians, hospital medicine, primary care physicians, and family practice were used to focus a search. Furthermore, references in each article were reviewed to find related literature.
Literature was largely concentrated within the past 5 years and included both peer-reviewed and descriptive articles on hospitalists and their effect. Internet searches used Google as the primary search engine; results supplemented findings in other published material.
This literature review continued until saturation was achieved with respect to considering the possible issues and implications of the expansion of hospitalists, with special attention paid to the risks and opportunities to family physicians.
Findings
This integrative literature review revealed 3 major themes of interest to family physicians regarding the emergence and expansion of hospitalists in the US: descriptions of the hospitalist role and responsibilities; hypothesized benefits and risks of the hospitalist model; and reported research results evaluating the effect of the hospitalist model. Synthesis of this literature also uncovered 2 major opportunities related to hospitalist practice: opportunities to conduct future research to study the impact of hospitalists on family physicians; and opportunities to leverage relationships with these new practitioners.
Hospitalist roles and responsibilities
A hospitalist physician is a new type of medical specialist who combines the roles of acute care subspecialist and medical generalist in the hospital care setting.18 Hospitalists do not replace primary care physicians, surgeons, or specialists, but, instead, are concerned with managing hospital inpatients, from admission until discharge. They act somewhat as a case manager for a patient’s hospital stay, working and communicating closely with other physicians involved in the patient’s care.
Patients are assigned to hospitalists upon admission, either when an outpatient provider such as a family practitioner transfers inpatient care responsibilities to the hospitalist, or when patients arrive at the hospital unassigned to any other provider. The clinical and organizational responsibilities of hospitalists are in Table 1.
TABLE 1
Typical responsibilities of hospitalist physicians
| Clinical |
| Patient admissions, daily inpatient rounds, and medical care attention |
| Ordering consultations, requesting tests, managing medications |
| Assisting other physicians with medical consultations |
| Helping with preoperative care and evaluations |
| Providing coverage of unassigned Emergency Department patients |
| Communicating with other involved physicians about patient conditions |
| Managing patient and family communications |
| Working with discharge planning, overseeing transfers from hospital, and post-hospital follow-up care |
| Organizational |
| Service on committees, involvement in administrative roles |
| Involvement in hospital quality assurance and utilization review activities |
| Involvement in disease management, care innovations |
| Teaching of medical students, residents, fellows |
| Involvement in hospital operations and systems improvement |
| Involvement in practice guideline and protocol development |
| Involvement in clinical information system development |
| Administrative involvement in hospitalist program including physician recruitment, scheduling, program development |
| Research responsibilities |
| Sources: Lurie et al 1999,1 Wachter et al 1996,7 Wachter 1999,19 and Geehr and Nelson 2002.20 |
Hypothesized benefits and risks of the hospitalist model
Persuasive arguments have been raised about the advantages and disadvantages of the hospitalist model.18,19,21,22 A variety of these potential advantages and disadvantages are summarized in Table 2, representing perspectives of 3 different stakeholder groups: hospitals, patients and families, and hospitalist physicians. Each of the listed advantages or disadvantages was discussed in 3 or more independent articles that were reviewed.
For family physicians specifically, the introduction of a hospitalist program at a local hospital has numerous associated potential benefits and risks. Table 3 presents a summary of the issues that were raised in 3 or more articles or studies.
Benefit: focus on ambulatory care. One widely discussed advantage in using hospitalists is the option for family practitioners, who so desire, to limit practice to outpatient medicine because of their interest in ambulatory care or because they feel overtaxed by the demands of the health care system.12,21 Willing family physicians can relinquish care of their hospitalized patients to a hospitalist so they do not have to travel to the hospital for daily rounds or more frequent patient contact; upon hospital discharge, family practitioners subsequently resume care for their patients.
Given the pressures of managed care to increase office productivity,48 this delegation of responsibilities can create an important practice advantage.15 Even for those family physicians who choose to visit their hospitalized patients, shifting overall responsibility for inpatient care to hospitalists can make hospital visits more efficient and thereby free office time for outpatient practices.49
Risk: lack of patient familiarity. Research has shown that a lack of familiarity with patients can increase the risk of errors and poor outcomes in medicine, and the use of a hospitalist as a new provider indeed introduces this risk.50,51
Without dedicated effort on the part of the family physician, the treating hospitalist may have limited appreciation of a patient’s situation. Hospitalists focused only on inpatient care may not know where patients come from or where they return to, and are less likely to be knowledgeable about needs for psychosocial support or for such patient preferences as end-of-life care.14,21
Risk: reduced political leverage. In addition, a political issue for family physicians may arise if hospitalists become providers of choice for inpatient internal medicine, thereby defining a smaller role for community-based family practitioners.21
Risk: communication problems. Another major risk of hospitalist programs is poor communication, an issue raised in nearly every article discussing the hospitalist model. The involvement of a new physician provider and the process of patient care transfers between outpatient family physicians and inpatient hospitalists can lead to missed information, gaps in communication, and misunderstandings.19,22,35,37
Recent studies of discontinuity of care when patients are hospitalized reported that inpatients specifically wanted both contact with their primary care physicians and good communication between their established primary care physician and hospital-based physicians.49 Guidelines created by the American Academy of Family Physicians (www.aafp.org/x6873.xml) support communication and interaction between community-based physicians and hospitalists for excellent patient care,12 but the burden may fall on family physicians to ensure communication.
TABLE 2
Stakeholder perspectives of hospitalist model: Advantages and disadvantages
| Stakeholder perspective | Potential advantages | Potential disadvantages |
|---|---|---|
| Hospital |
|
|
| Patients and families | ||
| Hospitalist physicians | ||
| PCP, primary care physician. | ||
TABLE 3
Potential benefits and risks of the hospitalist model for family physicians
| Potential benefits for family physicians15,33,47-49 |
| Increased office productivity, less disruption of office schedules |
| Career development option limited to outpatient care setting may be desired lifestyle hoice |
| Extra time for outpatients |
| Reduced travel time, especially for physicians in distant practice areas |
| Improved outpatient satisfaction |
| Increased provider satisfaction with ability to specialize in outpatient care |
| Can offset lost inpatient revenues with increases in office volume |
| Reduction in life stress and potential burnout |
| Potential risks for family physicians12,32,50,51 |
| Discontinuity in care for patients |
| Communication problems regarding patient care |
| Loss of information about patient wishes |
| Reduced contact with hospital-based professionals, specialists |
| Loss of influence at admitting hospitals, loss of hospital privileges |
| Decline in acute care skills, changes in continuing medical education |
| Shift in professional identity |
| Loss of status for outpatient practice |
| Reduced variety in medical education |
| Loss of variety in scope of family practice |
Assessing the effect of the hospitalist model
Research evaluating the impact of hospitalists has largely focused on hospital-based outcomes. Recently, Wachter and Goldman’s review of 19 published studies showed that hospital costs decreased 13.4% on average and hospital lengths of stay decreased 16.6% on average after a hospitalist program was initiated.23 These efficiency improvements were apparently gained while patient satisfaction was preserved.
However, results indicating improved outcomes, such as mortality and readmissions, were reportedly inconsistent among the studies evaluated.23 Additional studies3,24,52 of hospitalist programs have shown similar reductions in hospital costs and lengths of stay, and have also reported preservation or improvement of quality of care as measured by reductions in mortality3,24 and constancy of readmission rates.52
Study of the effect of hospitalists specifically on family practice has been limited. As noted by Smith and colleagues,53 methodologic constraints limit the reliability of many reported results, and the focus of most studies does not extend beyond the hospital setting.
This study additionally questioned whether hospitalist care is truly of better quality and lowers costs. Findings of higher costs associated with subspecialist vs generalist hospitalist care also warrant further investigation in larger studies. Also, because many recent studies have examined only length of stay and in-hospital costs, it is still unknown whether the hospitalist model produces costs savings for the health system overall.12
Opportunities to further study hospitalists and their impact
Research has focused largely on quantitative values related to hospitalist care. Yet the emergence of this new provider type introduces issues to be studied that encompass more than effects on length of stay and mortality.
In particular, questions remain about issues surrounding the patient–physician relationship, including patient perceptions of how hospitalists affect communication, continuity of care, and trust.16 Similarly, studies have investigated primary care physicians’ attitudes regarding desired communication with hospitalists,14 but none have studied the changing role of primary care hysicians who no longer perform inpatient care, or have questioned family physicians about career satisfaction.
Further, published studies have not been large enough to consider the influence of multiple independent variables such as hospital type, hospital location, or patient factors such as insurance status, disease classification, or psychosocial issues. Table 4 shows some of the many opportunities to formally study the effect of hospitalists on family practice, considering both the areas of existing research focus and new areas that can be explored.
TABLE 4
Opportunities to study impact of hospitalists on family practice
| Existing research focus on hospitalists |
| Satisfaction of patient, hospitalist, primary care provider |
| Quality of hospital care |
| Effects on hospital length of stay |
| In-hospital mortality |
| Readmission rates |
| Hospital cost savings opportunities |
| Hospitalist productivity, workload |
| New areas for family practice-focused research |
| Family practitioner experience, satisfaction |
| Perceptions of family practitioners, other primary care providers regarding disruption of patient care relationships,40 continuity of care issues |
| Outpatient costs, follow-up care costs |
| Economic impact of alternative compensation arrangements |
| Evaluation of economic and noneconomic benefits of continuity of care |
| Integration with nonhospitalist physicians, nonphysician workers |
| Qualitative perspectives of different stakeholders |
| Distinction between urban and rural practice settings |
| Distinction between community-based and academic practices |
| Family practitioner productivity, workload |
Conclusions
Given that the goal of hospitalists is to affect the hospital sector of the US market—associated with around $430 billion in expenditures for 200054,55 —the potential to decrease costs while preserving quality of care is undeniably attractive. However, research evidence does not show uniformly positive results from the introduction of hospitalist programs.
A primary concern is that the purposeful discontinuity of care introduced by the hospitalist can affect quality of care, resulting in medical errors and poor outcomes for patients.32 In addition, more attention must be given to compensation and reimbursement so that family physicians are not discouraged from providing inpatient care for purely financial reasons.
Although a number of publications have discussed the implications of hospitalists, the specific effect of the hospitalist model on family practice remains largely unknown. Knowledge of such effects can be increased by performing well-designed research involving family physicians and by including both qualitative and quantitative approaches. Answers to clinical and managerial questions such as how to best manage communications, how to facilitate the crucial transitions between outpatient and inpatient care, and how to maintain clinical relationships given the introduction of a new provider type can help family physicians preserve and enhance relationships with hospitals, inpatient providers, and patients.
Acknowledgments
The author is very grateful to Kelly Kelleher, MD, MPH, and to the editors of this Journal for thoughtful review and suggestions to improve this report. The author has no conflict of interest to report.
Correspondence
Ann Scheck McAlearney, ScD, Division of Health Services Management and Policy, Ohio State University, School of Public Health, 1583 Perry Street, Atwell Hall 246, Columbus, OH 43210-1234. E-mail:[email protected].
1. Lurie JD, Miller DP, Lindenauer PK, Wachter RM, Sox HC. The potential size of the hospitalist workforce in the United States. Am J Med 1999;106:441-445.
2. Redelmeier DA. A Canadian perspective on the American hospitalist movement. Arch Intern Med 1999;159:1665-1668.
3. Meltzer D, Manning WG, Morrison J, et al. Effects of physician experience on costs and outcomes on an academic general medicine service: results of a trial of hospitalists. Ann Intern Med 2002;137:866-874.
4. Ikegami N, Campbell JC. Medical care in Japan. N Engl J Med 1995;333:1295-1299.
5. Peabody JW, Bickel SR, Lawson JS. The Australian health care system. Are the incentives down under right side up? JAMA 1996;276:1944-1950.
6. Grumbach K, Fry J. Managing primary care in the United States and in the United Kingdom. N Engl J Med 1993;328:940-945.
7. Wachter RM, Goldman L. The emerging role of “hospitalists” in the American health care system. N Engl J Med 1996;335:514-517.
8. Rosser WW. Approach to diagnosis by primary care clinicians and specialists: is there a difference? J Fam Pract 1996;42:139-144.
9. St Peter RF, Reed MC, Kemper P, Blumenthal D. Changes in the scope of care provided by primary care physicians. N Engl J Med 1999;341:1980-1985.
10. White B. Are the edges of family practice being worn away? Fam Pract Manag 2000;7(2):35-40.
11. Henry L. What the hospitalist movement means to family physicians. Fam Pract Manag 1998;5(10):54-62.
12. Bagley B. The hospitalist movement and family practice—an uneasy fit. J Fam Pract 2002;51:1028-1029.
13. Edsall RL. Family practice without hospital practice. Fam Pract Manag 1997;4(7).:
14. Pantilat SZ, Lindenauer PK, Katz PP, Wachter RM. Primary care physician attitudes regarding communication with hospitalists. Am J Med 2001;111:15S-20S.
15. Auerbach AD, Nelson EA, Lindenauer PK, Pantilat SZ, Katz PP, Wachter RM. Physician attitudes toward and prevalence of the hospitalist model of care: results of a national survey. Am J Med 2000;109:648-653.
16. The who what when where whom andhow of hospitalist care. Ann Intern Med 2002;137:930-931.
17. Hruby M, Pantilat SZ, Lo B. How do patients view the role of the primary care physician in inpatient care? Am J Med 2001;111:21S-25S.
18. Schroeder S, Shapiro R. The hospitalist: new boon for internal medicine or retreat from primary care? Ann Intern Med 1999;130:382-387.
19. Wachter RM. An introduction to the hospitalist model. Ann Intern Med 1999;130:338-342.
20. Geehr EC, Nelson JR. Hospitalists: who they are and what they do. Physician Exec 2002;28:26-31.
21. Sox HC. The hospitalist model: perspectives of the patient, the internist, and internal medicine. Ann Intern Med 1999;130:368-372.
22. Lo B. Ethical and policy implications of hospitalist systems. Am J Med 2001;111:48S-52S.
23. Wachter RM, Goldman L. The hospitalist movement 5 years later. JAMA 2002;287:487-494.
24. Auerbach AD, Wachter RM, Katz P, Showstack J, Baron RB, Goldman L. Implementation of a voluntary hospitalist service at a community teaching hospital: improved clinical efficiency and patient outcomes. Ann Intern Med 2002;137:859-865.
25. Alpers A. Key legal principles for hospitalists. Am J Med 2001;111:5S-9S.
26. Hoff T, Whitcomb WF, Nelson JR. Thriving and surviving in a new medical career: the case of hospitalist physicians. J Health Soc Behav 2002;43:72-91.
27. Noyes BJ, Healy SA. The hospitalist: the new addition to the inpatient management team. J Nurs Adm 1999;29(2):21-24.
28. Frank GD, Gonzales D. Developing a successful hospitalist program. Physician Exec 2002;28:32-36.
29. Edlich RF, Hill LG, Heather CL. A national epidemic of unassigned patients: is the hospitalist the solution? J Emerg Med 2002;23:297-300.
30. Goldman L. The impact of hospitalists on medical education and the academic health system. Ann Intern Med 1999;130:364-367.
31. Chaty B. Hospitalists: an efficient, new breed of inpatient caregivers. Healthc Financ Manage 1998;52(9):47-49.
32. Goldmann DR. The hospitalist movement in the United States: what does it mean for internists? Ann Intern Med 1999;130:326-327.
33. Hardy T. Group practice management: the evolution of hospitalist programs. Healthc Financ Manage 2000;54(9):63-70.
34. Wachter RM, Pantilat SZ. The “continuity visit” and the hospitalist model of care. Am J Med 2001;111:40S-42S.
35. Wachter RM, Goldman L. The role of “hospitalists” in the health care system [author reply]. N Engl J Med 1997;336:445-446.
36. Pantilat SZ. End-of-life care for the hospitalized patient. Med Clin North Am 2002;86:749-770.
37. Auerbach AD, Davis RB, Phillips RS. Physician views on caring for hospitalized patients and the hospitalist model of inpatient care. J Gen Intern Med 2001;16:116-119.
38. Wachter RM. The hospitalist movement: ten issues to consider. Hosp Pract (Off Ed) 1999;34:95-98,104-106, 111.
39. Lindenauer PK, Pantilat SZ, Katz PP, Wachter RM. Hospitalists and the practice of inpatient medicine: results of a survey of the National Association of Inpatient Physicians. Ann Intern Med 1999;130:343-349.
40. Hoff TH, Whitcomb WF, Williams K, Nelson JR, Cheesman RA. Characteristics and work experiences of hospitalists in the United States. Arch Intern Med 2001;161:851-858.
41. Manian FA. Whither continuity of care? N Engl J Med 1999;340:1362-1363.
42. Armour BS, Pitts MM, Maclean R, et al. The effect of explicit financial incentives on physician behavior. Arch Intern Med 2001;161:1261-1266.
43. Davis KM, Koch KE, Harvey JK, Wilson R, Englert J, Gerard PD. Effects of hospitalists on cost, outcomes, and patient satisfaction in a rural health system. Am J Med 2000;108:621-626.
44. Freese RB. The Park Nicollet experience in establishing a hospitalist system. Ann Intern Med 1999;130:350-354.
45. Saint S, Zemencuk JK, Hayward RA, Golin CE, Konrad TR, Linzer M. SGIM Career Satisfaction Group. What effect does increasing inpatient time have on outpatient-oriented internist satisfaction? J Gen Intern Med 2003;18:725-729.
46. Guttler S. The role of “hospitalists” in the health care system [letter]. N Engl J Med 1997;336:444-445.
47. Bagley B. Hospitalists and the family physician. Am Fam Physician 1998;58:336-339.
48. Grumbach K, Osmond D, Vranizan K, Jaffe D, Bindman AB. Primary care physicians’ experience of financial incentives in managed care systems. N Engl J Med 1998;339:1516-1521.
49. Edlin M. Talking it out: busy doctors struggle to improve relationships with patients. Modern Physician. 1999 April 1.
50. Petersen LA, Brennan TA, O’Neil AC, Cook EF, Lee TH. Does housestaff discontinuity of care increase the risk for preventable adverse events? Ann Intern Med 1994;121:866-872.
51. Petersen LA, Orav EJ, Teich JM, O’Neil AC, Brennan TA. Using a computerized sign-out program to improve continuity of inpatient care and prevent adverse events. Jt Comm J Qual Improv 1998;24:77-87.
52. Gregory D, Baigelman W, Wilson IB. Hospital economics of the hospitalist. Health Serv Res 2003;38:905-918.
53. Smith PC, Westfall JM, Nicholas RA. Primary care family physicians and 2 hospitalist models: comparison of outcomes, processes, and costs. J Fam Pract 2002;51:1021-1027.
54. Ginzberg E. The changing US health care agenda. JAMA 1998;279:501-504.
55. Heffler S, Smith S, Won G, Clemens MK, Keehan S, Zezza M. Health spending projections for 2001—2011: the latest outlook. Faster health spending growth and a slowing economy drive the health spending projection for 2001 up sharply. Health Aff (Millwood). 2002;21(2):207-218
The Use of 40% Urea Cream in the Treatment of Moccasin Tinea Pedis
Starting insulin in type 2 diabetes: Continue oral hypoglycemic agents?
- Consider adding bedtime NPH insulin to maximal oral therapy—a simple, safe, and well-tolerated regimen that lowers HbA1c on average by 1 percentage point.
- Expect this regimen to fail for about 25% of patients within 1 year.
Objective: To evaluate the effects of insulin 30/70 twice daily or bedtime isophane (NPH) insulin plus continued sulfonylurea and metformin in patients with type 2 diabetes in primary care.
Study Design: Open-label, randomized trial.
Population: Persons younger than 76 years with type 2 diabetes whose disease had not been controlled with oral hypoglycemic agents alone. A total of 64 insulinnaïve patients treated with maximal feasible dosages of sulfonylurea and metformin (baseline glycosylated hemoglobin [HbA1c]=8.5%) were randomly assigned to insulin monotherapy (IM group; n=31) or insulin in addition to unchanged oral hypoglycemic medication (IC group; n=33) for 12 months. Insulin doses were adjusted to obtain fasting glucose <7.0 mmol/L and postprandial glucose <10.0 mmol/L.
Outcomes Measured: Outcome measures included HbA1c, treatment failure, weight, hypoglycemic events and symptoms, satisfaction with treatment, general well-being, and fear of injecting insulin and testing.
Results: HbA1c improved from 8.3% to 7.6% in the IC group, and from 8.8% to 7.6% in the IM group (P=NS). The IC group had 24% treatment failures, compared with 2% in the IM group (P=.09). Patients in the IC group had less weight gain than those in the IM group (1.3 vs 4.2 kg; P=.01), and they reported fewer hypoglycemic events (2.7 vs 4.3; P=.02). Increased satisfaction with treatment was equal in the 2 groups, and general well-being improved by 3.0 points more in the IC group (P=.05). Fear of self-injecting and self-testing did not differ.
Conclusions: Bedtime NPH insulin added to maximal therapy with sulfonylurea and metformin is an effective, simple, well-tolerated approach for patients with uncontrolled type 2 diabetes.
The goal for glycemic control in current guidelines on type 2 diabetes is a glycosylated hemoglobin (HbA1c) value of <7.0%.1 If this target is not achieved or maintained with sulfonylurea and metformin at maximally tolerated dosages, insulin therapy is recommended as the next step for patients without advanced diabetes complications and with a reasonably long life expectancy.2
There is little doubt that exogenous insulin aids in glycemic control at this stage of disease. It is still debated, though, whether insulin should be used as monotherapy or be added to a regimen of 1 or 2 oral agents (combination therapy).3, 4
Guidelines on type 2 diabetes conflict with one another about indications for treatment and preferred regimens, and most recommendations are based on less-than-sufficient evidence.1 For example, it is unclear in the case of combination therapy whether sulfonylurea or metformin or both should be continued. Moreover, the Dutch guideline on type 2 diabetes recommends that in combination therapy, the dose of isophane (neutral protamine Hagedorn or NPH) insulin be taken to a maximum of 40 IU, after which one should switch to a regimen of twice-daily insulin only. This recommendation is not based on published evidence.5
A number of randomized controlled trials have investigated the efficacy of different insulin regimens in patients whose diabetes was not controlled with oral agents. Few studies, though, have included patients using both sulfonylurea and metformin.6 In addition, studies that have measured treatment satisfaction, general wellbeing, fear of injections, and hypoglycemic complaints are sparse. Although we know from observational studies that insulin therapy is usually well accepted,7,8 little is known as to what extent patient satisfaction and quality of life are influenced by either treatment schemes.
The purpose of this study was to compare insulin monotherapy with insulin combination therapy in patients whose diabetes was inadequately controlled (HbA1c ≥7.0%) despite maximally tolerated dosages of sulfonylurea and metformin. Endpoints included glycemic control, insulin dosage, body weight, number of treatment failures, number of hypoglycemic events and symptoms, treatment satisfaction, general well-being, and fear of injections and self testing.
Methods
Design
This was an open-label, parallel group trial of 12 months duration. Patients were randomly assigned to receive NPH insulin at bedtime (Insulatard; Novo Nordisk, Copenhagen, Denmark) in addition to current treatment with sulfonylurea and metformin (insulin combination [IC] group) or to receive a mixture of 30% soluble and 70% NPH insulin (Mixtard 30/70; Novo Nordisk, Copenhagen, Denmark), twice daily before breakfast and dinner (insulin monotherapy [IM] group). Randomization was performed by a telephone call to an independent trial center that used a computer-generated random assignment.
The medical ethics committee of the University Medical Centre of Utrecht approved the study. All patients gave written informed consent.
Patients
Patients were recruited from family practices in and around the city of Utrecht, the Netherlands. Patients were asked to participate if they were younger than 76 years, had HbA1c ≥7.0% despite treatment with both sulfonylurea and metformin in maximally tolerated dosages, were willing to start insulin therapy, and were deemed by their family physician to be candidates for more tight glycemic control.
Exclusion criteria were severe comorbidity (ie, an illness that surpasses the impact of diabetes or was associated with a short life expectancy) and insufficient understanding of spoken Dutch to follow instructions. The final study population was 64 patients.
Study protocol
After randomization, patients were referred to the diabetes nurse of their family practice to receive usual education for patients starting on insulin therapy. This included information on diabetes (eg, symptoms of hypoglycemia) and dietary counseling as well as instructions on how to inject insulin and how to monitor blood glucose levels before breakfast, after meals, and before bedtime twice weekly.
Patients were also instructed to register any symptomatic hypoglycemic event, along with accompanying measurement of the blood glucose value if possible, and to report whether assistance from a third party was required. Blood glucose values and hypoglycemic events were to be recorded in a personal diabetes diary.
Insulin therapy was initiated with 8 IU before bedtime in the IC group, and with 12 and 6 IU before breakfast and dinner in the IM group, respectively. Insulin dosages were adjusted twice weekly by telephone contact with the diabetes nurse (adjusting phase), aiming for a target fasting blood glucose of 4.0–7.0 mmol/L and a target postprandial glucose of 4.0–10.0 mmol/L. When these targets were achieved and had proved stable, the insulin dose was fixed and telephone contacts were decreased to once monthly (stable phase).
Treatment failure was declared for patients in the IC group if glucose targets were not reached with a maximum daily dose of 40 IU NPH insulin. In the IM group, no ceiling was set for the insulin dose, but treatment was declared a failure when patients were switched to other treatment regimens due to unsatisfactory diurnal blood glucose profiles. Practice visits with the diabetes nurse or the family physician (according to local policy) were scheduled for 3, 6, 9, and 12 months after start of treatment.
Outcome measures
HbA1c —measured by turbidimetric inhibition immunoassay (Hitachi 917; Roche Diagnostics, Basel, Switzerland; normal range 4%–6%)—and body weight were documented at randomization and at 3, 6, 9, and 12 months.
Frequency and severity of hypoglycemic events were monitored during telephone contacts and by checking patients’ diaries. At 3 and 12 months, patients completed a hypoglycemic symptoms checklist—including 18 autonomic, neuroglycopenic, and malaise symptoms—the severity of which was scored on a 7-point scale, ranging from 0 (not at all) to 6 (very intense), providing a potential range of 0 to 108.
Treatment satisfaction was measured at baseline and at 3 and 12 months, using the Dutch version of the Diabetes Treatment Satisfaction Questionnaire (DTSQ).9 The DTSQ is a validated self-report questionnaire; it consists of 8 questions, 6 of which refer to satisfaction with treatment. The answers were scored on a 0-to-6 Likert scale and added to produce a measure of satisfaction with diabetes treatment, providing a potential range of 0 (very dissatisfied) to 36 (very satisfied).
Well-being was measured at baseline and at 3 and 12 months with the Dutch version of the 12-item Well-Being Questionnaire (WBQ-12).10 The WBQ-12 consists of 12 assertions about the patients’ feelings, and is divided into 3 subscales from which a General Well-Being score is calculated, providing a potential range of 0 (low) to 36 (high).
Fear of self-injecting with insulin (FSI) and fear of self-testing for blood glucose levels (FST) was assessed at 3 and 12 months by the short version of the Diabetes Fear of Injecting and Self-Testing Questionnaire (D-FISQ), which has proved useful for research in insulin-treated diabetes patients.11 This self-report questionnaire consists of a 6-item subscale for FSI, and a 9-item subscale for FST. The items were scored on a 4-point Likert scale, ranging from 0 (almost never) to 3 (almost always), referring to the past month.
Statistical methods
The primary outcome of the study was the difference in HbA1c between the interventions. To detect a difference of at least 0.8%, 32 patients were needed in each group (standard deviation [SD]=1.1, α=0.05, power=80%). Data were expressed as means ± SD unless indicated otherwise. Analyses were based on intention to treat, and missing data were fitted by the last-observation-carried-forward principle. Last available measurements were used for patients reaching a study end point before 12 months of follow-up. Outcome measurements were compared between the 2 intervention groups by either analyses of covariance (ANCOVA) adjusting for baseline values,12 unpaired t tests, or Mann-Whitney U test. The probability of treatment success was analyzed using Kaplan-Meier plots with the log-rank test. P<.05 was considered statistically significant. Data analyses were performed with SPSS release 11 (SPSS Inc, Chicago, Ill, USA).
Results
In total, 69 patients were randomized, 5 of whom did not initiate the intervention. Baseline characteristics of included patients are summarized in Table 1. Except for weight and body mass index, no significant differences were found between the groups.
TABLE 1
Characteristics at baseline (n=64)
| IC | IM | |
|---|---|---|
| Number of patients | 33 | 31 |
| Age, years | 58.6 (8.6) | 58.3 (11.3) |
| Sex, % male/female | 54 / 46 | 42 / 58 |
| Duration of diabetes, years | 7.2 (3.9) | 7.7 (4.8) |
| Body weight, kg | 96.3 (19.4) | 81.0 (14.3) |
| Body mass index, kg/m2 | 33.2 (6.4) | 28.5 (3.8)* |
| HbA1c,% | 8.3 (0.9) | 8.8 (1.5) |
| Satisfaction with treatment | 28.0 (8.2) | 26.1 (8.1) |
| General well-being | 21.7 (8.1) | 22.7 (6.9) |
| Results are means (SD), numbers, or percentages; * P<.01. IC, insulin combination therapy; IM, insulin monotherapy. | ||
Glycemic control and insulin dosage
In both groups, HbA1c improved, mainly during the first months (Figure 1). In the IC group, mean decrease was 0.8 ± 1.3%, vs 1.2 ± 1.2 in the IM group. Adjusted for baseline values, HbA1c for IM fell by 0.14% more than for IC (95% confidential interval [CI], –0.72 to 0.44; P=NS). In the IC group, 36% of the patients reached HbA1c levels <7.0%, compared with 42% in the IM group (P = NS).
When treatment failures (see below) were omitted, mean decrease of Hb A1c for IC was 1.0 ± 1.2% (Figure 2). Mean daily insulin dosages at endpoint were 25.8 ± 12.2 IU for IC vs 68.3 ± 27.5 for IM. Mean daily dosages adjusted for body weight were 0.27 ± 0.13 IU/kg for IC vs 0.86 ± 0.37 for IM.
FIGURE 1
Course of HbA1c values (SD)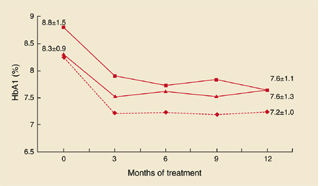
HbA1c values and standard deviations during the study. Squares: IM group; triangles: IC group; diamonds: IC group without treatment failures.
FIGURE 2
Combination vs monotherapy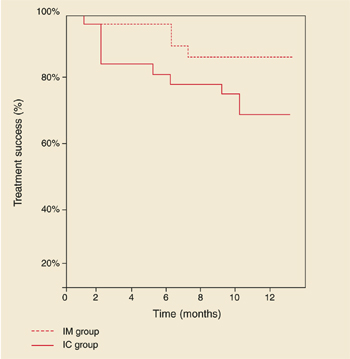
Kaplan-Meier curves showing treatment success of insulin combination therapy (IC) and insulin monotherapy (IM).
Treatment failures
In the IC group, 8 patients (24%) experienced a treatment failure because glucose targets were not reached with a daily dose of 40 IU NPH insulin. The mean time for reaching this study endpoint was 4.6 months (range, 1–10). HbA1c deteriorated in this period from 8.5 ± 1.3 % to 8.6 ± 1.5%.
Age, sex, duration of diabetes, and baseline values for HbA1c, body mass index, treatment satisfaction, and general well-being of these patients did not significantly differ from those who completed the study on IC therapy (data not shown). Mean daily insulin dosages at endpoint, adjusted for body weight, were 0.41 ± 0.13 IU/kg for treatment failures vs 0.23 ± 0.11 for non-treatment failures (95 % CI, 0.10 to 0.28; P<.001). In the IM group, 2 patients (6%) were switched to another insulin regimen due to unsatisfactory diurnal glucose profiles. Figure 2 shows the Kaplan-Meier curves of probability of treatment success. Log-rank test showed a borderline significant difference between the groups (P=.09).
Weight gain
In the IC group, body weight increased with 1.3 ± 3.9 kg, compared with 4.2 ± 4.3 kg in the IM group. Adjusted for baseline values, body weight in the IM group increased by 3.0 kg more than in the IC group (95% CI, 0.68 to 5.25; P=.01).
Hypoglycemic events and symptoms
The average number of hypoglycemic events per patient was 2.7 ± 5.2 in the IC group, and 4.3 ± 4.3 for the IM group (P=.02). For events accompanied by documented blood glucose values <4.0 mmol/L, the results were 2.4 ± 5.2 and 2.7 ± 3.5, respectively (P=.1). All events were mild, expect for 1 patient in the IM group who experienced 2 severe events (unconsciousness and support needed from a third party). At 3 and 12 months, hypoglycemic symptoms scores were 17.2 ± 13.3 and 16.3 ± 16.0 for IC, vs 19.1 ± 15.6 and 22.4 ± 15.7 for IM (P=NS).
Diabetes treatment satisfaction and general well-being
Satisfaction with treatment improved in the IC group from 28.0 ± 8.2 to 30.9 ± 5.1, and in the IM group from 26.1 ± 8.1 to 28.4 ± 7.4. Adjusted for baseline values, the difference between the mean change scores was not significant (95% CI, –5.0 to 1.0; P=NS). Well-being scores increased from 21.7 ± 8.1 to 25.1 ± 6.8 in the IC group, vs 22.7 ± 6.9 to 22.8 ± 7.6 in the IM group. Adjusted for baseline scores, wellbeing for IC improved by 3.0 points more than for IM (95 % CI, 0.02 to 5.8; P=.05).
Fear of self-injecting and self-testing
At 3 and 12 months, FSI scores were 0.6 ± 1.3 and 0.5 ± 1.1 in the IC group, vs 2.1 ± 4.1 and 1.0 ± 2.1 in the IM group. For FST, these scores were 0.6 ± 1.9 and 2.3 ± 4.8 in the IC group, and 2.5 ± 4.4 and 1.7 ± 3.6 in the IM group. At neither 3 nor 12 months were statistical differences found between the groups. Approximately 70% of the patients in both groups had scores of 0 (no fear at all) on both subscales.
Discussion
In this practice-based study of insulin-naïve patients, HbA1c improved ~1 percentage point with both insulin combination therapy and insulin monotherapy. However, with both strategies, around 40% of patients reached HbA1c levels <7%, which forces us to be realistic regarding the glycemic target that can be achieved in the current family practice setting. Despite systematic titration of the insulin dosage, 24% of the patients in the IC group did not reach the titration targets. In addition, HbA1c levels for those patients did not change from baseline, in contrast with patients in the IC group who did reach the targets (Figure 1). So it is doubtful if lower HbA1c levels could have been achieved if the study design had allowed for increasing the daily insulin dose over 40 IU.
Treatment failure rate in this study was considerably lower compared with 66% failures reported in another trial in which insulin NPH or glargine was added to oral therapy.13 However, this difference could probably be explained by a difference in target for fasting blood glucose: ≤5.6 mmol/L vs ≤7.0 in our study. So it might be relevant in future research to seek factors that could predict failure on oral agent/insulin combinations.14
With insulin monotherapy, body weight increased significantly, and patients experienced more hypoglycemic events. Treatment satisfaction did not differ, whereas general well-being improved more with combination therapy. For most patients, the injection- and test-activities appeared to be well tolerated, with no differences between treatment groups.
Though several trials have been conducted to compare insulin combination therapies with insulin monotherapy in insulin-naïve patients,6,15-17 studies with follow-up >6 months, and including patients taking maximum dosages of two oral agents, are sparse. Moreover, no studies have been conducted in a primary care setting. Chow et al compared a regimen of bedtime NPH insulin and 1 or 2 oral agents with a regimen of premixed insulin 30/70 in 53 mostly lean patients during 6 months.18 The effects on HbA1c, body weight, and number of hypoglycemic events were comparable to our results, and a similar treatment failure rate in the combination group was found.
Yki-Järvinen et al studied the effects of 4 insulin regimens including the addition of bedtime NPH insulin to either morning NPH, glyburide, metformin, or glyburide plus metformin in patients previously treated with maximal dosage sulfonylurea.19 The greatest decrease in HbA1c accompanied by the lowest number of hypoglycemic events was observed in the insulin/metformin group.
However, the impact of these results might be limited, since current guidelines recommend treatment with maximum doses of both sulfonylurea and metformin before introducing insulin therapy.2,8 Nevertheless, the results underline the favorable influence on relevant outcomes of insulin combination therapy compared with insulin monotherapy, provided that at least metformin is used.
Patients in our study were recruited during regular appointments with their own care provider, and insulin treatment was established under “usual care” conditions. So it is likely that this study group represents the type 2 diabetes patients in primary care that, sooner or later, should start insulin therapy, and that the results of this study are highly applicable to them.
Our results suggest that an evening injection with NPH insulin in addition to an existing maximal therapy with sulfonylurea and metformin can be recommended as an effective, simple, and well-tolerated first-choice approach with patients who are willing to continue oral medication. Since both family physicians and patients are inclined to delay starting insulin,20 such a strategy might encourage the timely use of insulin.14
Acknowledgments
We thank Rianne Maillé for her expert contribution concerning the questionnaires. In particular we would like to thank the patients, diabetes nurses, and family physicians for their participation.
Corresponding author
Alex N. Goudswaard, Koperslagersgilde 5, 3994 CH Houten, Netherlands. E-mail: [email protected].
1. Burgers JS, Bailey JV, Klazinga NS, Van der Bij AK, Grol R, Feder G. Inside guidelines: comparative analysis of recommendations and evidence in diabetes guidelines from 13 countries. Diabetes Care 2002;25:1933-1939.
2. American Diabetes Association. Standards of medical care for patients with diabetes mellitus. Diabetes Care 2002;25:S33-S49.
3. Garber AJ. Benefits of combination therapy of insulin and oral hypoglycemic agents. Arch Intern Med 2003;163:1781-1782.
4. Westphal SA, Palumbo PJ. Insulin and oral hypoglycemic agents should not be used in combination in the treatment of type 2 diabetes. Arch Intern Med 2003;163:1783-1785.
5. Rutten GEHM, Verhoeven S, Heine RJ, et al. Diabetes mellitus type 2. NHG-standaard (eerste herziening) (in Dutch). Huisarts Wet 1999;42:67-84.
6. Yki-Järvinen H. Combination therapies with insulin in type 2 diabetes. Diabetes Care 2001;24:758-767.
7. De Sonnaville JJ, Snoek FJ, Colly LP, Deville W, Wijkel D, Heine RJ. Well-being and symptoms in relation to insulin therapy in type 2 diabetes. Diabetes Care 1998;21:919-924.
8. De Grauw WJ, Van de Lisdonk EH, Van Gerwen WH, Van Den Hoogen HJ, Van Weel C. Insulin therapy in poorly controlled type 2 diabetic patients: does it affect quality of life? Br J Gen Pract 2001;51:527-532.
9. Bradley C. Handbook of Psychology and Diabetes. A Guide to Psychological Measurement in Diabetes Research and Practice. Amsterdam: Harwood Academic Publishers; 1994.
10. Pouwer F, Snoek FJ, Van der Ploeg HM, Ader HJ, Heine RJ. The well-being questionnaire: evidence for a three-factor structure with 12 items (W-BQ12). Psychol Med 2000;30:455-462.
11. Mollema ED, Snoek FJ, Pouwer F, Heine RJ, Van der Ploeg HM. Diabetes Fear of Injecting and Self-Testing Questionnaire: a psychometric evaluation. Diabetes Care 2000;23:765-769.
12. Vickers AJ, Altman DG. Statistics notes: Analysing controlled trials with baseline and follow up measurements. BMJ 2001;323:1123-1124.
13. Riddle MC, Rosenstock J, Gerich JL. The treat-to-target trial. Diabetes Care 2003;26:3080-086.
14. Riddle MC. Timely addition of insulin to oral therapy for type 2 diabetes. Diabetes Care 2002;25:395-396.
15. Peters AL, Davidson MB. Insulin plus a sulfonylurea agent for treating type 2 diabetes. Ann Intern Med 1991;115:45-53.
16. Pugh JA, Wagner ML, Sawyer J, Ramirez G, Tuley M, Friedberg SJ. Is combination sulfonylurea and insulin therapy useful in NIDDM patients? A meta-analysis. Diabetes Care 1992;15:953-959.
17. Johnson JL, Wolf SL, Kabadi UM. Efficacy of insulin and sulfonylurea combination therapy in type II diabetes. A meta-analysis of the randomized placebo-controlled trials. Arch Intern Med 1996;156:259-264.
18. Chow CC, Tsang LW, Sorensen JP, Cockram CS. Comparison of insulin with or without continuation of oral hypoglycemic agents in the treatment of secondary failure in NIDDM patients. Diabetes Care 1995;18:307-314.
19. Yki-Jarvinen H, Ryysy L, Nikkila K, Tulokas T, Vanamo R, Heikkila M. Comparison of bedtime insulin regimens in patients with type 2 diabetes mellitus. A randomized, controlled trial. Ann Intern Med 1999;130:389-396.
20. Veltmaat LJ, Miedema K, Reenders K. Overschakeling op insuline bij NIADM-patiënten. Een literatuurstudie naar criteria, voorkomen en belemmerende factoren (in Dutch). Huisarts Wet 1995;38:608-613.
- Consider adding bedtime NPH insulin to maximal oral therapy—a simple, safe, and well-tolerated regimen that lowers HbA1c on average by 1 percentage point.
- Expect this regimen to fail for about 25% of patients within 1 year.
Objective: To evaluate the effects of insulin 30/70 twice daily or bedtime isophane (NPH) insulin plus continued sulfonylurea and metformin in patients with type 2 diabetes in primary care.
Study Design: Open-label, randomized trial.
Population: Persons younger than 76 years with type 2 diabetes whose disease had not been controlled with oral hypoglycemic agents alone. A total of 64 insulinnaïve patients treated with maximal feasible dosages of sulfonylurea and metformin (baseline glycosylated hemoglobin [HbA1c]=8.5%) were randomly assigned to insulin monotherapy (IM group; n=31) or insulin in addition to unchanged oral hypoglycemic medication (IC group; n=33) for 12 months. Insulin doses were adjusted to obtain fasting glucose <7.0 mmol/L and postprandial glucose <10.0 mmol/L.
Outcomes Measured: Outcome measures included HbA1c, treatment failure, weight, hypoglycemic events and symptoms, satisfaction with treatment, general well-being, and fear of injecting insulin and testing.
Results: HbA1c improved from 8.3% to 7.6% in the IC group, and from 8.8% to 7.6% in the IM group (P=NS). The IC group had 24% treatment failures, compared with 2% in the IM group (P=.09). Patients in the IC group had less weight gain than those in the IM group (1.3 vs 4.2 kg; P=.01), and they reported fewer hypoglycemic events (2.7 vs 4.3; P=.02). Increased satisfaction with treatment was equal in the 2 groups, and general well-being improved by 3.0 points more in the IC group (P=.05). Fear of self-injecting and self-testing did not differ.
Conclusions: Bedtime NPH insulin added to maximal therapy with sulfonylurea and metformin is an effective, simple, well-tolerated approach for patients with uncontrolled type 2 diabetes.
The goal for glycemic control in current guidelines on type 2 diabetes is a glycosylated hemoglobin (HbA1c) value of <7.0%.1 If this target is not achieved or maintained with sulfonylurea and metformin at maximally tolerated dosages, insulin therapy is recommended as the next step for patients without advanced diabetes complications and with a reasonably long life expectancy.2
There is little doubt that exogenous insulin aids in glycemic control at this stage of disease. It is still debated, though, whether insulin should be used as monotherapy or be added to a regimen of 1 or 2 oral agents (combination therapy).3, 4
Guidelines on type 2 diabetes conflict with one another about indications for treatment and preferred regimens, and most recommendations are based on less-than-sufficient evidence.1 For example, it is unclear in the case of combination therapy whether sulfonylurea or metformin or both should be continued. Moreover, the Dutch guideline on type 2 diabetes recommends that in combination therapy, the dose of isophane (neutral protamine Hagedorn or NPH) insulin be taken to a maximum of 40 IU, after which one should switch to a regimen of twice-daily insulin only. This recommendation is not based on published evidence.5
A number of randomized controlled trials have investigated the efficacy of different insulin regimens in patients whose diabetes was not controlled with oral agents. Few studies, though, have included patients using both sulfonylurea and metformin.6 In addition, studies that have measured treatment satisfaction, general wellbeing, fear of injections, and hypoglycemic complaints are sparse. Although we know from observational studies that insulin therapy is usually well accepted,7,8 little is known as to what extent patient satisfaction and quality of life are influenced by either treatment schemes.
The purpose of this study was to compare insulin monotherapy with insulin combination therapy in patients whose diabetes was inadequately controlled (HbA1c ≥7.0%) despite maximally tolerated dosages of sulfonylurea and metformin. Endpoints included glycemic control, insulin dosage, body weight, number of treatment failures, number of hypoglycemic events and symptoms, treatment satisfaction, general well-being, and fear of injections and self testing.
Methods
Design
This was an open-label, parallel group trial of 12 months duration. Patients were randomly assigned to receive NPH insulin at bedtime (Insulatard; Novo Nordisk, Copenhagen, Denmark) in addition to current treatment with sulfonylurea and metformin (insulin combination [IC] group) or to receive a mixture of 30% soluble and 70% NPH insulin (Mixtard 30/70; Novo Nordisk, Copenhagen, Denmark), twice daily before breakfast and dinner (insulin monotherapy [IM] group). Randomization was performed by a telephone call to an independent trial center that used a computer-generated random assignment.
The medical ethics committee of the University Medical Centre of Utrecht approved the study. All patients gave written informed consent.
Patients
Patients were recruited from family practices in and around the city of Utrecht, the Netherlands. Patients were asked to participate if they were younger than 76 years, had HbA1c ≥7.0% despite treatment with both sulfonylurea and metformin in maximally tolerated dosages, were willing to start insulin therapy, and were deemed by their family physician to be candidates for more tight glycemic control.
Exclusion criteria were severe comorbidity (ie, an illness that surpasses the impact of diabetes or was associated with a short life expectancy) and insufficient understanding of spoken Dutch to follow instructions. The final study population was 64 patients.
Study protocol
After randomization, patients were referred to the diabetes nurse of their family practice to receive usual education for patients starting on insulin therapy. This included information on diabetes (eg, symptoms of hypoglycemia) and dietary counseling as well as instructions on how to inject insulin and how to monitor blood glucose levels before breakfast, after meals, and before bedtime twice weekly.
Patients were also instructed to register any symptomatic hypoglycemic event, along with accompanying measurement of the blood glucose value if possible, and to report whether assistance from a third party was required. Blood glucose values and hypoglycemic events were to be recorded in a personal diabetes diary.
Insulin therapy was initiated with 8 IU before bedtime in the IC group, and with 12 and 6 IU before breakfast and dinner in the IM group, respectively. Insulin dosages were adjusted twice weekly by telephone contact with the diabetes nurse (adjusting phase), aiming for a target fasting blood glucose of 4.0–7.0 mmol/L and a target postprandial glucose of 4.0–10.0 mmol/L. When these targets were achieved and had proved stable, the insulin dose was fixed and telephone contacts were decreased to once monthly (stable phase).
Treatment failure was declared for patients in the IC group if glucose targets were not reached with a maximum daily dose of 40 IU NPH insulin. In the IM group, no ceiling was set for the insulin dose, but treatment was declared a failure when patients were switched to other treatment regimens due to unsatisfactory diurnal blood glucose profiles. Practice visits with the diabetes nurse or the family physician (according to local policy) were scheduled for 3, 6, 9, and 12 months after start of treatment.
Outcome measures
HbA1c —measured by turbidimetric inhibition immunoassay (Hitachi 917; Roche Diagnostics, Basel, Switzerland; normal range 4%–6%)—and body weight were documented at randomization and at 3, 6, 9, and 12 months.
Frequency and severity of hypoglycemic events were monitored during telephone contacts and by checking patients’ diaries. At 3 and 12 months, patients completed a hypoglycemic symptoms checklist—including 18 autonomic, neuroglycopenic, and malaise symptoms—the severity of which was scored on a 7-point scale, ranging from 0 (not at all) to 6 (very intense), providing a potential range of 0 to 108.
Treatment satisfaction was measured at baseline and at 3 and 12 months, using the Dutch version of the Diabetes Treatment Satisfaction Questionnaire (DTSQ).9 The DTSQ is a validated self-report questionnaire; it consists of 8 questions, 6 of which refer to satisfaction with treatment. The answers were scored on a 0-to-6 Likert scale and added to produce a measure of satisfaction with diabetes treatment, providing a potential range of 0 (very dissatisfied) to 36 (very satisfied).
Well-being was measured at baseline and at 3 and 12 months with the Dutch version of the 12-item Well-Being Questionnaire (WBQ-12).10 The WBQ-12 consists of 12 assertions about the patients’ feelings, and is divided into 3 subscales from which a General Well-Being score is calculated, providing a potential range of 0 (low) to 36 (high).
Fear of self-injecting with insulin (FSI) and fear of self-testing for blood glucose levels (FST) was assessed at 3 and 12 months by the short version of the Diabetes Fear of Injecting and Self-Testing Questionnaire (D-FISQ), which has proved useful for research in insulin-treated diabetes patients.11 This self-report questionnaire consists of a 6-item subscale for FSI, and a 9-item subscale for FST. The items were scored on a 4-point Likert scale, ranging from 0 (almost never) to 3 (almost always), referring to the past month.
Statistical methods
The primary outcome of the study was the difference in HbA1c between the interventions. To detect a difference of at least 0.8%, 32 patients were needed in each group (standard deviation [SD]=1.1, α=0.05, power=80%). Data were expressed as means ± SD unless indicated otherwise. Analyses were based on intention to treat, and missing data were fitted by the last-observation-carried-forward principle. Last available measurements were used for patients reaching a study end point before 12 months of follow-up. Outcome measurements were compared between the 2 intervention groups by either analyses of covariance (ANCOVA) adjusting for baseline values,12 unpaired t tests, or Mann-Whitney U test. The probability of treatment success was analyzed using Kaplan-Meier plots with the log-rank test. P<.05 was considered statistically significant. Data analyses were performed with SPSS release 11 (SPSS Inc, Chicago, Ill, USA).
Results
In total, 69 patients were randomized, 5 of whom did not initiate the intervention. Baseline characteristics of included patients are summarized in Table 1. Except for weight and body mass index, no significant differences were found between the groups.
TABLE 1
Characteristics at baseline (n=64)
| IC | IM | |
|---|---|---|
| Number of patients | 33 | 31 |
| Age, years | 58.6 (8.6) | 58.3 (11.3) |
| Sex, % male/female | 54 / 46 | 42 / 58 |
| Duration of diabetes, years | 7.2 (3.9) | 7.7 (4.8) |
| Body weight, kg | 96.3 (19.4) | 81.0 (14.3) |
| Body mass index, kg/m2 | 33.2 (6.4) | 28.5 (3.8)* |
| HbA1c,% | 8.3 (0.9) | 8.8 (1.5) |
| Satisfaction with treatment | 28.0 (8.2) | 26.1 (8.1) |
| General well-being | 21.7 (8.1) | 22.7 (6.9) |
| Results are means (SD), numbers, or percentages; * P<.01. IC, insulin combination therapy; IM, insulin monotherapy. | ||
Glycemic control and insulin dosage
In both groups, HbA1c improved, mainly during the first months (Figure 1). In the IC group, mean decrease was 0.8 ± 1.3%, vs 1.2 ± 1.2 in the IM group. Adjusted for baseline values, HbA1c for IM fell by 0.14% more than for IC (95% confidential interval [CI], –0.72 to 0.44; P=NS). In the IC group, 36% of the patients reached HbA1c levels <7.0%, compared with 42% in the IM group (P = NS).
When treatment failures (see below) were omitted, mean decrease of Hb A1c for IC was 1.0 ± 1.2% (Figure 2). Mean daily insulin dosages at endpoint were 25.8 ± 12.2 IU for IC vs 68.3 ± 27.5 for IM. Mean daily dosages adjusted for body weight were 0.27 ± 0.13 IU/kg for IC vs 0.86 ± 0.37 for IM.
FIGURE 1
Course of HbA1c values (SD)
HbA1c values and standard deviations during the study. Squares: IM group; triangles: IC group; diamonds: IC group without treatment failures.
FIGURE 2
Combination vs monotherapy
Kaplan-Meier curves showing treatment success of insulin combination therapy (IC) and insulin monotherapy (IM).
Treatment failures
In the IC group, 8 patients (24%) experienced a treatment failure because glucose targets were not reached with a daily dose of 40 IU NPH insulin. The mean time for reaching this study endpoint was 4.6 months (range, 1–10). HbA1c deteriorated in this period from 8.5 ± 1.3 % to 8.6 ± 1.5%.
Age, sex, duration of diabetes, and baseline values for HbA1c, body mass index, treatment satisfaction, and general well-being of these patients did not significantly differ from those who completed the study on IC therapy (data not shown). Mean daily insulin dosages at endpoint, adjusted for body weight, were 0.41 ± 0.13 IU/kg for treatment failures vs 0.23 ± 0.11 for non-treatment failures (95 % CI, 0.10 to 0.28; P<.001). In the IM group, 2 patients (6%) were switched to another insulin regimen due to unsatisfactory diurnal glucose profiles. Figure 2 shows the Kaplan-Meier curves of probability of treatment success. Log-rank test showed a borderline significant difference between the groups (P=.09).
Weight gain
In the IC group, body weight increased with 1.3 ± 3.9 kg, compared with 4.2 ± 4.3 kg in the IM group. Adjusted for baseline values, body weight in the IM group increased by 3.0 kg more than in the IC group (95% CI, 0.68 to 5.25; P=.01).
Hypoglycemic events and symptoms
The average number of hypoglycemic events per patient was 2.7 ± 5.2 in the IC group, and 4.3 ± 4.3 for the IM group (P=.02). For events accompanied by documented blood glucose values <4.0 mmol/L, the results were 2.4 ± 5.2 and 2.7 ± 3.5, respectively (P=.1). All events were mild, expect for 1 patient in the IM group who experienced 2 severe events (unconsciousness and support needed from a third party). At 3 and 12 months, hypoglycemic symptoms scores were 17.2 ± 13.3 and 16.3 ± 16.0 for IC, vs 19.1 ± 15.6 and 22.4 ± 15.7 for IM (P=NS).
Diabetes treatment satisfaction and general well-being
Satisfaction with treatment improved in the IC group from 28.0 ± 8.2 to 30.9 ± 5.1, and in the IM group from 26.1 ± 8.1 to 28.4 ± 7.4. Adjusted for baseline values, the difference between the mean change scores was not significant (95% CI, –5.0 to 1.0; P=NS). Well-being scores increased from 21.7 ± 8.1 to 25.1 ± 6.8 in the IC group, vs 22.7 ± 6.9 to 22.8 ± 7.6 in the IM group. Adjusted for baseline scores, wellbeing for IC improved by 3.0 points more than for IM (95 % CI, 0.02 to 5.8; P=.05).
Fear of self-injecting and self-testing
At 3 and 12 months, FSI scores were 0.6 ± 1.3 and 0.5 ± 1.1 in the IC group, vs 2.1 ± 4.1 and 1.0 ± 2.1 in the IM group. For FST, these scores were 0.6 ± 1.9 and 2.3 ± 4.8 in the IC group, and 2.5 ± 4.4 and 1.7 ± 3.6 in the IM group. At neither 3 nor 12 months were statistical differences found between the groups. Approximately 70% of the patients in both groups had scores of 0 (no fear at all) on both subscales.
Discussion
In this practice-based study of insulin-naïve patients, HbA1c improved ~1 percentage point with both insulin combination therapy and insulin monotherapy. However, with both strategies, around 40% of patients reached HbA1c levels <7%, which forces us to be realistic regarding the glycemic target that can be achieved in the current family practice setting. Despite systematic titration of the insulin dosage, 24% of the patients in the IC group did not reach the titration targets. In addition, HbA1c levels for those patients did not change from baseline, in contrast with patients in the IC group who did reach the targets (Figure 1). So it is doubtful if lower HbA1c levels could have been achieved if the study design had allowed for increasing the daily insulin dose over 40 IU.
Treatment failure rate in this study was considerably lower compared with 66% failures reported in another trial in which insulin NPH or glargine was added to oral therapy.13 However, this difference could probably be explained by a difference in target for fasting blood glucose: ≤5.6 mmol/L vs ≤7.0 in our study. So it might be relevant in future research to seek factors that could predict failure on oral agent/insulin combinations.14
With insulin monotherapy, body weight increased significantly, and patients experienced more hypoglycemic events. Treatment satisfaction did not differ, whereas general well-being improved more with combination therapy. For most patients, the injection- and test-activities appeared to be well tolerated, with no differences between treatment groups.
Though several trials have been conducted to compare insulin combination therapies with insulin monotherapy in insulin-naïve patients,6,15-17 studies with follow-up >6 months, and including patients taking maximum dosages of two oral agents, are sparse. Moreover, no studies have been conducted in a primary care setting. Chow et al compared a regimen of bedtime NPH insulin and 1 or 2 oral agents with a regimen of premixed insulin 30/70 in 53 mostly lean patients during 6 months.18 The effects on HbA1c, body weight, and number of hypoglycemic events were comparable to our results, and a similar treatment failure rate in the combination group was found.
Yki-Järvinen et al studied the effects of 4 insulin regimens including the addition of bedtime NPH insulin to either morning NPH, glyburide, metformin, or glyburide plus metformin in patients previously treated with maximal dosage sulfonylurea.19 The greatest decrease in HbA1c accompanied by the lowest number of hypoglycemic events was observed in the insulin/metformin group.
However, the impact of these results might be limited, since current guidelines recommend treatment with maximum doses of both sulfonylurea and metformin before introducing insulin therapy.2,8 Nevertheless, the results underline the favorable influence on relevant outcomes of insulin combination therapy compared with insulin monotherapy, provided that at least metformin is used.
Patients in our study were recruited during regular appointments with their own care provider, and insulin treatment was established under “usual care” conditions. So it is likely that this study group represents the type 2 diabetes patients in primary care that, sooner or later, should start insulin therapy, and that the results of this study are highly applicable to them.
Our results suggest that an evening injection with NPH insulin in addition to an existing maximal therapy with sulfonylurea and metformin can be recommended as an effective, simple, and well-tolerated first-choice approach with patients who are willing to continue oral medication. Since both family physicians and patients are inclined to delay starting insulin,20 such a strategy might encourage the timely use of insulin.14
Acknowledgments
We thank Rianne Maillé for her expert contribution concerning the questionnaires. In particular we would like to thank the patients, diabetes nurses, and family physicians for their participation.
Corresponding author
Alex N. Goudswaard, Koperslagersgilde 5, 3994 CH Houten, Netherlands. E-mail: [email protected].
1. Burgers JS, Bailey JV, Klazinga NS, Van der Bij AK, Grol R, Feder G. Inside guidelines: comparative analysis of recommendations and evidence in diabetes guidelines from 13 countries. Diabetes Care 2002;25:1933-1939.
2. American Diabetes Association. Standards of medical care for patients with diabetes mellitus. Diabetes Care 2002;25:S33-S49.
3. Garber AJ. Benefits of combination therapy of insulin and oral hypoglycemic agents. Arch Intern Med 2003;163:1781-1782.
4. Westphal SA, Palumbo PJ. Insulin and oral hypoglycemic agents should not be used in combination in the treatment of type 2 diabetes. Arch Intern Med 2003;163:1783-1785.
5. Rutten GEHM, Verhoeven S, Heine RJ, et al. Diabetes mellitus type 2. NHG-standaard (eerste herziening) (in Dutch). Huisarts Wet 1999;42:67-84.
6. Yki-Järvinen H. Combination therapies with insulin in type 2 diabetes. Diabetes Care 2001;24:758-767.
7. De Sonnaville JJ, Snoek FJ, Colly LP, Deville W, Wijkel D, Heine RJ. Well-being and symptoms in relation to insulin therapy in type 2 diabetes. Diabetes Care 1998;21:919-924.
8. De Grauw WJ, Van de Lisdonk EH, Van Gerwen WH, Van Den Hoogen HJ, Van Weel C. Insulin therapy in poorly controlled type 2 diabetic patients: does it affect quality of life? Br J Gen Pract 2001;51:527-532.
9. Bradley C. Handbook of Psychology and Diabetes. A Guide to Psychological Measurement in Diabetes Research and Practice. Amsterdam: Harwood Academic Publishers; 1994.
10. Pouwer F, Snoek FJ, Van der Ploeg HM, Ader HJ, Heine RJ. The well-being questionnaire: evidence for a three-factor structure with 12 items (W-BQ12). Psychol Med 2000;30:455-462.
11. Mollema ED, Snoek FJ, Pouwer F, Heine RJ, Van der Ploeg HM. Diabetes Fear of Injecting and Self-Testing Questionnaire: a psychometric evaluation. Diabetes Care 2000;23:765-769.
12. Vickers AJ, Altman DG. Statistics notes: Analysing controlled trials with baseline and follow up measurements. BMJ 2001;323:1123-1124.
13. Riddle MC, Rosenstock J, Gerich JL. The treat-to-target trial. Diabetes Care 2003;26:3080-086.
14. Riddle MC. Timely addition of insulin to oral therapy for type 2 diabetes. Diabetes Care 2002;25:395-396.
15. Peters AL, Davidson MB. Insulin plus a sulfonylurea agent for treating type 2 diabetes. Ann Intern Med 1991;115:45-53.
16. Pugh JA, Wagner ML, Sawyer J, Ramirez G, Tuley M, Friedberg SJ. Is combination sulfonylurea and insulin therapy useful in NIDDM patients? A meta-analysis. Diabetes Care 1992;15:953-959.
17. Johnson JL, Wolf SL, Kabadi UM. Efficacy of insulin and sulfonylurea combination therapy in type II diabetes. A meta-analysis of the randomized placebo-controlled trials. Arch Intern Med 1996;156:259-264.
18. Chow CC, Tsang LW, Sorensen JP, Cockram CS. Comparison of insulin with or without continuation of oral hypoglycemic agents in the treatment of secondary failure in NIDDM patients. Diabetes Care 1995;18:307-314.
19. Yki-Jarvinen H, Ryysy L, Nikkila K, Tulokas T, Vanamo R, Heikkila M. Comparison of bedtime insulin regimens in patients with type 2 diabetes mellitus. A randomized, controlled trial. Ann Intern Med 1999;130:389-396.
20. Veltmaat LJ, Miedema K, Reenders K. Overschakeling op insuline bij NIADM-patiënten. Een literatuurstudie naar criteria, voorkomen en belemmerende factoren (in Dutch). Huisarts Wet 1995;38:608-613.
Tacrolimus Ointment in the Treatment of Eyelid Dermatitis
Self-doctoring: A qualitative study of physicians with cancer
- Physician “self-doctoring” may have benefits, but it may also cause unanticipated psychological and medical problems. When faced with a serious medical problem, carefully assess both the potential positive and negative aspects of such behavior.
Background: Self-doctoring is providing oneself care normally delivered by a professional caregiver. Expert authors warn physicians not to self-doctor, yet cross-sectional studies document that physicians frequently do. Explanations for this disparity remain speculative.
Objective: To better understand the circumstances when physicians did and did not doctor themselves and the reasoning behind their actions.
Design: Qualitative semistructured interview study of 23 physician-patients currently or previously treated for cancer.
Results: Participants had multiple opportunities to doctor themselves (or not) at each stage of illness. Only 1 physician recommended self-doctoring, although most reported having done so, sometimes without realizing it. Participants’ approaches to their own health care created a continuum ranging between typical physician and patient roles. Participants emphasizing their physician role approached their health care as they would approach the care of their own patients, preferring convenience and control of their care to support from professional caregivers. Participants emphasizing their role as patient approached their health care as they thought a patient should, preferring to rely less on their own abilities and more on their providers, whose support they valued. Most participants balanced both roles depending on their experiences and basic issues of trust and control. Importantly, subjects at both ends of the continuum reported unanticipated pitfalls of their approach.
Conclusion: Our findings showed that participants’ health care-seeking strategies fell on a continuum that ranged from a purely patient role to one that centered on physician activities. Participants identified problems associated with overdependence on either role, suggesting that a balanced approach, one that uses the advantages of both physician and patient roles, has merit.
The physician who doctors himself has a fool for a patient.
—Sir William Osler
The consistent message in the medical literature, beginning with Osler, has been that physicians should not doctor themselves.1-9 Despite this belief, a number of cross-sectional studies suggest that at best only 50% of physicians even have a personal physician1,8-13 and that between 42% and 82% of physicians doctor themselves in some fashion.1,6,8,12
Becoming a competent physician does not automatically make one a competent patient.14,15 In fact, physicians are allegedly the “very worst patients.”15 Physicians are expected to understand and empathize with the patient’s perspective, yet most authors have maintained that physicians tend to avoid, deny, or reject patient-hood,2,3,5,11,13,14,16-22 and even the susceptibility to illness.23
Given the high prevalence of self-doctoring behavior among physician-patients, we sought to further explore seriously ill physicians’ experiences with self-doctoring. Specifically, we wanted to know if they doctored themselves and, if so, when, why, and with what outcome.
Methods
Design
For this qualitative study, approved by the Johns Hopkins Institutional Review Board, we used semistructured in-depth interviews.
Study population and sampling
A convenience sample of physicians who had been treated for cancer during or after their medical training was identified by clinicians in the divisions of oncology and radiation oncology at our institution. Of 38 physicians contacted, 25 agreed to participate; however, 2 subjects died before their interview could be arranged. Enrollment continued until no new concepts were identified, also called the point of theoretical saturation.24
Data collection
We based the interview questions on themes extracted from a literature search that identified 5 books, 26 articles, and 3 videotapes. (These references are available online as Table W1.) Interviews lasted approximately 1.5 hours. The interviewer (E.F.) started by asking subjects to tell the story of how they learned of their cancer and progressed to more focused questions about whether they acted as their own doctor and why. All interviews were taped and transcribed, and their accuracy was verified by listening to the audiotape.
Analysis. Two coders (E.F. and R.H.) independently coded all 23 transcripts. In case of disagreement, the coders achieved consensus through discussion and used this information to refine the boundaries of each theme.
Working together, we created a comprehensive coding scheme by arranging data into logical categories of themes using the strategies of textual analysis and codebook development described by Crabtree and Miller.25 The work by Crabtree and Miller addressed the theme “health care-seeking behaviors and strategies” and its associated codes developed using an “editing-style analysis” consistent with the constant comparative method in the Grounded Theory tradition.26
Trustworthiness. To ensure trustworthiness, we mailed an 11-item summary of the main points to the 21 surviving participants as the analysis neared completion. We asked them to review the main points of our study, indicate whether they agreed or disagreed (with no response indicating agreement), and add any clarifying comments they felt appropriate. This information was used to clarify and further develop themes.
RESULTS
Our sample was predominately Caucasian and represented a diversity of gender, specialty, and participant characteristics (Table 1).
TABLE 1
Participant characteristics (N=23)
| Characteristic | ||
|---|---|---|
| Age (years) | Mean and median=55, range=28–83 | |
| Years in practice | Mean=22.4, median=19, range=0–56 (1 resident, 1 fellow, 2 retired) | |
| Sex (n/N) | Male 13/23 | |
| Ethnicity (n) | 19 Caucasian, 3 Asian, 1 African American | |
| Specialty | Family practice/internal medicine: 5 | |
| Adult subspecialist: 4 | ||
| Pediatrics/child subspecialist: 6 | ||
| Surgical specialty: 3 | ||
| Neurology/anesthesia/emergency medicine/radiation oncology: 5 | ||
| Practice type | Clinician: 10 | Clinician/researcher: 5 |
| Clinician/educator: 5 | Clinician/administrator: 3 | |
| Practice location | University hospital: 11 | |
| Community hospital: 2 | ||
| Private practice: 9 | ||
| Research/nonpracticing: 1 | ||
| Tumor type | Breast: 5; renal: 4; prostate: 5; lymphoma: 3; colon: 2 (1 participant had 2 cancers) | |
| Bone/brain/larynx/head & neck/thyroid: 1 each | ||
| Illness stage | Disease-free >5 years: 9 | |
| Disease-free >6 months: 5 | ||
| Disease-free <6 months: 4 | ||
| In treatment: 2 | ||
| Metastatic/rapidly progressive disease: 3 | ||
The nature of self-doctoring What is self-doctoring and when does it occur?
The participants did not identify a discrete activity or group of activities that constituted self-doctoring (Table 2). Some activities were obvious because they required privileges restricted to medical personnel—for example, ordering one’s own abdominal computed tomography scan. Other activities were less obvious because they could be performed by any patient—such as treating oneself for a minor illness like low back pain.
Should you doctor yourself? Whereas only 1 participant recommended self-doctoring, the rest were more or less strongly opposed to the practice. Despite this stance, most participants were able to identify instances during which they did doctor themselves. Sometimes they doctored themselves without acknowledging this activity as doctoring.
EF: Do you ever feel like you do anything where you doctor yourself?
PARTICIPANT: No I don’t think so . . . I’ve never had a primary care physician, which is probably a mistake because I tell all my patients they should have one.
EF: How did you get your PSAs [prostate-specific antigen]?
PARTICIPANT: I would just go down and get my blood done myself.
EF: So would you say that is an example of being your own doctor?
PARTICIPANT: Yeah, I suppose it is to some degree!
Reframing the question: from self-doctoring to health care-seeking strategies. Although our questions were about self-doctoring, participants spoke less about self-doctoring and more about their strategy for obtaining health care. This concept of health care-seeking strategies accounted for all of the various methods that participants used to obtain health care, of which self-doctoring was one.
TABLE 2
Subtle ways in which participants doctored themselves
| Decide when to seek or not seek care |
| Did not get alarmed about neck mass because she knew what cancer felt like |
| Did not call physician with most things because they are “silly” |
| Did not go to physician until family member insisted |
| Establish a diagnosis |
| Broke own bad news by going into the hospital computer on a weekend |
| Diagnosed self as depressed but that it was subclinical |
| Went directly to a gastroenterologist to evaluate abdominal pain |
| Called physician with a diagnosis, not a problem |
| Learn about illness |
| Became an expert in own disease |
| Called an expert colleague at another institution to critique care |
| Influence care decisions |
| Rejected a recommendation that did not coincide with medical training |
| Decided on a specific surgical procedure, then found an oncologist |
| Chose a physician who she knew would go along with whatever she wanted |
| Assumed he didn’t need a second opinion because he was a physician |
| Get treatment |
| Managed only illnesses in her own specialty |
| Followed own Dilantin levels |
The continuum of health care-seeking strategies
The following examples illustrate 3 health care-seeking strategies. When viewed together, these strategies create a continuum ranging between the roles of physician and patient. The following categories are not intended to be mutually exclusive, but to indicate an individual participant’s emphasized role. We referred to strategies that emphasized the physician role as PHYSICIAN-patient, here exemplified by this internist who had more than 40 years of experience in clinical practice.
One evening I felt a mass in my right lower quadrant. I figured I had a little hematoma—I couldn’t see anything, but I was pretty asymptomatic and by chance felt [the mass]. I watched it for maybe a week or so and it didn’t seem to change. I did a couple of routine blood tests and my CBC and Chem-20 profile were okay. But then when [the mass] didn’t go down, I asked one of my partners to feel it. He said “yes, I can feel a mass—you’d better look into it.” I didn’t see a doctor—just a curbside-type thing. So then I set up a CT scan, I got a CE antigen, and I just did this on my own, and the CT scan showed a mass in the appendiceal area and the CE antigen was up a little bit. I guess I went right to my surgeon!
At the other end of the continuum, this middleaged pediatric subspecialist represents those physicians whose health care-seeking strategies were based on their roles as patients. We labeled this strategy physician-PATIENT, emphasizing the patient role.
You know, I think that a physician diagnosed with cancer is like any person diagnosed with cancer. Their first concern has nothing to do with their careers. I think the hardest thing about being a physician-patient is that you hate to bother your doctors. Or you want to sort of “call your doctor with the answer” instead of just asking questions. I think you sort of feel like sometimes that you should be able to somehow know whether [your] symptom is related to metastatic disease without having to ask, “Should I be worried about this or not?” Physicians have the same fears and difficulties as anyone else does and need to give themselves permission to act like a normal patient.
This next physician, a medical subspecialist who had recently undergone bilateral mastectomy for stage I breast cancer, falls somewhere in the middle of this continuum. We labeled this approach Physician-Patient, signifying the incorporation of both roles into her health care-seeking strategy.
This breast mass was discovered by my gynecologist but he told me, don’t worry—it’s a fibroadenoma. It was small, not really moveable, so I didn’t listen to him. I went to a surgeon. I wouldn’t say I doctored myself just because I didn’t necessarily listen to my physician. It didn’t make sense from my medical training, so I did what made sense—I can listen to those doctors’ advice, but I use my own judgment.
Advantages of being a physician-patient: convenience and control. Physicians recognized definite advantages afforded by their status, mostly related to added convenience in navigating through the system and scheduling appointments, and being able to control many aspects of their care. This specialist in infectious disease with metastatic cancer illustrates the importance of convenience and control in explaining why she often relied on self-doctoring.
I think idealistically you should never be your own doctor, but realistically I think I can accomplish more faster without interrupting the doctor’s schedule. A couple of weeks ago I started spiking fevers but I had no symptoms of any kind…. After the third day I thought, “I bet this is tumor fever!” So I went out and bought Naprosyn and I was afebrile the next morning…. Now I guess there is a small chance I have an abscess somewhere, but I think I can obviate a lot of workup that my physician is more obligated to do than I am, medico-legally … I am sure there are control issues because we all like control and I am sure I like the control and the convenience.
Disadvantages of being a physician-patient: denying yourself the opportunity to receive support; lack of objectivity; delaying care. In talking about the disadvantages of their strategies, physicians invariably referred to a previous negative experience. This young pediatrician with a large retroperitoneal mass described how she learned of her computed tomography scan results.
More insidious is the potential loss of objectivity that can occur when one’s own health is at stake. For example, a pediatric subspecialist with lymphoma described how she rationalized not bringing the enlarged lymph nodes in her neck to medical attention by telling herself that she “knew what cancer felt like.”
Advantages of being a physician-patient: trusting one’s care to others; relinquishing control; benefiting from the expertise and support of other physicians. Physicians who relied more on their physicians and less on self-doctoring approached control from the perspective of “letting go.” This emergency medicine specialist explains why he would rather trust his physician’s expertise than his own.
Find doctors you trust and listen to them because they’re the experts. The same way you’re the expert to your patients, the patients you care for. In some real sense, relinquish control. Give control to somebody else and even for nonphysician patients it’s very difficult but for physician-patients I think it’s one of the most difficult things but you have to do this. You have to trust yourself to someone else.
Disadvantages of being a physician-patient: being too trusting. This physician-patient describes adopting a more passive stance toward his health care in order to “be a good patient.” The result was that his Hodgkin’s disease was not diagnosed until 18 months after his initial biopsy.
By adopting that stance, I might have done myself a disservice. Our lives would have been very different had I questioned more aggressively the use of a needle biopsy because the pathologist here said, “You know, that’s an absolutely foolish inept way to look for lymphoma.” So in some ways the strategy backfired a bit.… But I really trusted their judgment.
Discussion
The attitudes and experiences of the study participants paralleled the medical literature: all but 1 recommended against self-doctoring, yet almost all were able to identify situations in which they did doctor themselves. Our findings show that participants’ health care-seeking strategies can be identified along a continuum ranging between the roles of physician and patient ( Figure 1 ). Whereas previous literature on physician-patients has characterized their situation as “role-reversal,”16,19,27 our findings suggest that physicians assume both roles depending on circumstances, influenced by their desire for control and degree of trust.
Trusting health care may be particularly difficult for physician-patients.2,3,27 In our study, participants at the “physician” end of the continuum were reluctant to “let go” of control over care, especially care they did not trust. They valued the convenience and time saved when they did things themselves and felt less need for support from their professional caregivers. These physicians did not consciously set out to doctor themselves. Instead, they simply used the expertise and status of their physician role to take care of themselves in the same way they might take care of a patient.
At the “patient” end of the health care-seeking continuum, participants approached their own health care as they thought a patient should. They tended not to be as involved with the details of their care, felt less pressure to be an expert in their own illness, and wanted their doctor to play an active role in medical decisions. They frequently emphasized the importance of being able to trust their care to another person and letting go of the need to be in control of their care. They valued the relationships with their physicians and appreciated the support these relationships provided.
Negative experiences invariably changed participants’ attitudes and where they were identified on the continuum. Both roles included unanticipated pitfalls, particularly for participants who adhered rigidly to either end of the continuum.
This study had important limitations. We recruited only physician-patients with cancer from a single institution and our sample was skewed toward survivors and presumably toward individuals who were comfortable talking about their experiences. Moreover, we replied on a convenience sample of patient-physicians identified by their specialists. Thus, the transferability of out findings ma be limited. Finally, our data captured the perspective of only the “physician-patient”—we did not interview their physicians. Nonetheless, we believe this provides robust new insights into physicians self-doctoring behaviors in the face of a serious, life-threatening illness.
Our findings make sense of the apparent mismatch between expert recommendations and physicians’ stated beliefs on one side, and physicians’ reported activities on the other. Rather than warning physicians not to doctor themselves, we advocate trying to focus on what is important: obtaining and providing good care ( Table 3 ). These questions are derived from 1 or more participating physician-patients’ experiences. In this way, we hope that readers might benefit from our participants’ experiences.
TABLE 3
Questions for physicians to ask themselves when seeking health care
| Are you responding more like a patient or more like a physician? Why? |
| If you are responding more like a physician: |
| Is it out of habit or convenience? |
| Is it because you don’t trust your doctors or health system (or because they are untrustworthy)? |
| Are you using your role as physician to shield yourself from painful or overwhelming realities? |
| Was an error made, or were you not getting the care you thought necessary? |
| AND |
| Do you have, or can you get, the necessary expertise to deal with your illness? |
| Are you too emotionally involved to be objective (and how would you recognize this problem)? |
| Do you, at minimum, have a physician you can trust and collaborate with—one with whom you would feel comfortable being a patient? |
| Are you getting the psychosocial support that may help you? |
| Are your nonmedical needs (rest, recreation, time off, decreased responsibilities at work) being met? |
| Are you getting the care you would want a patient in your position to receive? |
| If you are responding more like a patient: |
| Is it because you want to be “a good patient”? |
| Is it because you want someone else to make your decisions for you? |
| AND |
| Do you trust your professional caregivers and health care system? (And is that trust well founded?) |
| Are you ignoring your medical training or instincts because you do not want to offend? |
| Are you getting the information that you need (especially informed consent)? |
| Are you getting the psychosocial support you need? |
| Are your nonmedical needs (rest, recreation, time off, decreased responsibilities at work) being met? |
| Is the care you are getting consistent with the standard of care? |
| If it is not, do you understand why? |
| Are you getting the respect you would want a patient in your position to receive? |
| In either case: Would you be better off responding more like a patient, or more like a physician? |
FIGURE 1
Physician-patient continuum
Acknowledgments
Dr Carrese was a Robert Wood Johnson Generalist Physician Faculty Scholar when this work was conducted. This work was largely completed while Drs Fromme and Hebert were fellows in the Division of General Internal Medicine, The Johns Hopkins University School of Medicine and Johns Hopkins Bayview Medical Center. It was presented in abstract form at the 24th Annual Meeting of the Society of General Internal Medicine, San Diego, California in May 2001 and was funded by a grant from the Kenneth B. Schwartz Center, Boston, Mass.
Corresponding author
Erik K. Fromme, MD, Division of General Medicine and Geriatrics, L475, Oregon Health and Science University, 3181 SW Sam Jackson Park Road, Portland, OR 97239-3098. E-mail: [email protected].
1. Toyry S, Rasanen K, Kujala S, et al. Self-reported health, illness and self-care among Finnish physicians: a national survey. Arch Fam Med. 2000;9:1079-1085.
2. Allibone A. Who treats the doctor? Practitioner. 1990;234:984-987.
3. Miller MN, McGowen KR. The painful truth: physicians are not invincible. South Med J. 2000;93:966-973.
4. Budge A, Dickstein E. The doctor as patient: bioethical dilemmas reflected in literary narratives. Lit Med. 1988;7:132-137.
5. Rogers T. Barriers to the doctor as patient role. A cultural construct. Aust Fam Physician. 1998;27:1009-1013.
6. Waldron HA. Sickness in the medical profession. Ann Occup Hyg. 1996;40:391-396.
7. Waldron HA. Medical advice for sick physicians. Lancet. 1996;347:1558-1559.
8. Wines AP, Khadra MH, Wines RD. Surgeon, don’t heal thyself: a study of the health of Australian urologists. Aust N Z J Psychiatry. 1998;68:778-781.
9. Pullen D, Lonie CE, Lyle DM, Cam DE, Doughty MV. Medical care of doctors. Med J Aust. 1995;162:481,-484.
10. Allibone A, Oakes D, Shannon HS. The health and health care of doctors. J R Coll Gen Pract. 1981;31:728-734.
11. Schwartz JS, Lewis CE, Clancy C, Kinosian MS, Radany MH, Koplan JP. Internists’ practices in health promotion and disease prevention. A survey. Ann Intern Med. 1991;114:46-53.
12. Rosen IM, Christie JD, Bellini LM, Asch DA. Health and health care among housestaff in four U.S. internal medicine residency programs. J Gen Intern Med. 2000;15:116-121.
13. Kahn KL, Goldberg RJ, DeCosimo D, Dalen JE. Health maintenance activities of physicians and nonphysicians. Arch Intern Med. 1988;148:2433-2436.
14. Robbins GF, MacDonald MC, Pack GT. Delay in the diagnosis and treatment of physicians with cancer. Cancer 1953;6:624-626.
15. Anonymous [proverb] Strauss’ Familiar Medical Quotations. New York, NY: Little, Brown; 1968;415b.-
16. Spiro HM, Mandell H. When doctors get sick. Ann Intern Med. 1998;128:152-154.
17. Bittker TE. Reaching out to the depressed physician. JAMA. 1976;236:1713-1716.
18. Lampert PH. On the other side of the bed sheets. When the doctor is the patient. Minn Med. 1991;74(11):14-19.
19. Glass GS. Incomplete role reversal: the dilemma of hospitalization for the professional peer. Psychiatry. 1975;38:132-144.
20. Ellard J. The disease of being a doctor. Med J Aust. 1974;2:318-323.
21. Vaillant GE, Sobowale NC, McArthur C. Some psychologic vulnerabilities of physicians. N Engl J Med. 1972;287:372-375.
22. Thompson WT, Cupples ME, Sibbett CH, Skan DI, Bradley T. Challenge of culture, conscience, and contract to general practitioners’ care of their own health: qualitative study. BMJ. 2001;323:728-731.
23. Gold N. The doctor, his illness and the patient. Aust N Z J Psychiatry. 1972;6:209-213.
24. Kuzel A. Sampling in qualitative inquiry. In: Crabtree B, Miller W, eds. Doing Qualitative Research. 2nd ed. Thousand Oaks, Calif: Sage Publications; 1992;31-44.
25. Crabtree B, Miller W. A template approach to text analysis: developing and using codebooks. In: Crabtree B, Miller W, eds. Doing Qualitative Research. 2nd ed. Thousand Oaks, Calif: Sage Publications; 1992;93-109.
26. Glaser B, Strauss A. Discovery of Grounded Theory: Strategies for Qualitative Research. Hawthorne, NY: Aldine De Gruyter; 1967;101-115.
27. Edelstein EL, Baider L. Role reversal: when doctors become patients. Psychiatria Clin (Basel). 1982;15:177-183.
- Physician “self-doctoring” may have benefits, but it may also cause unanticipated psychological and medical problems. When faced with a serious medical problem, carefully assess both the potential positive and negative aspects of such behavior.
Background: Self-doctoring is providing oneself care normally delivered by a professional caregiver. Expert authors warn physicians not to self-doctor, yet cross-sectional studies document that physicians frequently do. Explanations for this disparity remain speculative.
Objective: To better understand the circumstances when physicians did and did not doctor themselves and the reasoning behind their actions.
Design: Qualitative semistructured interview study of 23 physician-patients currently or previously treated for cancer.
Results: Participants had multiple opportunities to doctor themselves (or not) at each stage of illness. Only 1 physician recommended self-doctoring, although most reported having done so, sometimes without realizing it. Participants’ approaches to their own health care created a continuum ranging between typical physician and patient roles. Participants emphasizing their physician role approached their health care as they would approach the care of their own patients, preferring convenience and control of their care to support from professional caregivers. Participants emphasizing their role as patient approached their health care as they thought a patient should, preferring to rely less on their own abilities and more on their providers, whose support they valued. Most participants balanced both roles depending on their experiences and basic issues of trust and control. Importantly, subjects at both ends of the continuum reported unanticipated pitfalls of their approach.
Conclusion: Our findings showed that participants’ health care-seeking strategies fell on a continuum that ranged from a purely patient role to one that centered on physician activities. Participants identified problems associated with overdependence on either role, suggesting that a balanced approach, one that uses the advantages of both physician and patient roles, has merit.
The physician who doctors himself has a fool for a patient.
—Sir William Osler
The consistent message in the medical literature, beginning with Osler, has been that physicians should not doctor themselves.1-9 Despite this belief, a number of cross-sectional studies suggest that at best only 50% of physicians even have a personal physician1,8-13 and that between 42% and 82% of physicians doctor themselves in some fashion.1,6,8,12
Becoming a competent physician does not automatically make one a competent patient.14,15 In fact, physicians are allegedly the “very worst patients.”15 Physicians are expected to understand and empathize with the patient’s perspective, yet most authors have maintained that physicians tend to avoid, deny, or reject patient-hood,2,3,5,11,13,14,16-22 and even the susceptibility to illness.23
Given the high prevalence of self-doctoring behavior among physician-patients, we sought to further explore seriously ill physicians’ experiences with self-doctoring. Specifically, we wanted to know if they doctored themselves and, if so, when, why, and with what outcome.
Methods
Design
For this qualitative study, approved by the Johns Hopkins Institutional Review Board, we used semistructured in-depth interviews.
Study population and sampling
A convenience sample of physicians who had been treated for cancer during or after their medical training was identified by clinicians in the divisions of oncology and radiation oncology at our institution. Of 38 physicians contacted, 25 agreed to participate; however, 2 subjects died before their interview could be arranged. Enrollment continued until no new concepts were identified, also called the point of theoretical saturation.24
Data collection
We based the interview questions on themes extracted from a literature search that identified 5 books, 26 articles, and 3 videotapes. (These references are available online as Table W1.) Interviews lasted approximately 1.5 hours. The interviewer (E.F.) started by asking subjects to tell the story of how they learned of their cancer and progressed to more focused questions about whether they acted as their own doctor and why. All interviews were taped and transcribed, and their accuracy was verified by listening to the audiotape.
Analysis. Two coders (E.F. and R.H.) independently coded all 23 transcripts. In case of disagreement, the coders achieved consensus through discussion and used this information to refine the boundaries of each theme.
Working together, we created a comprehensive coding scheme by arranging data into logical categories of themes using the strategies of textual analysis and codebook development described by Crabtree and Miller.25 The work by Crabtree and Miller addressed the theme “health care-seeking behaviors and strategies” and its associated codes developed using an “editing-style analysis” consistent with the constant comparative method in the Grounded Theory tradition.26
Trustworthiness. To ensure trustworthiness, we mailed an 11-item summary of the main points to the 21 surviving participants as the analysis neared completion. We asked them to review the main points of our study, indicate whether they agreed or disagreed (with no response indicating agreement), and add any clarifying comments they felt appropriate. This information was used to clarify and further develop themes.
RESULTS
Our sample was predominately Caucasian and represented a diversity of gender, specialty, and participant characteristics (Table 1).
TABLE 1
Participant characteristics (N=23)
| Characteristic | ||
|---|---|---|
| Age (years) | Mean and median=55, range=28–83 | |
| Years in practice | Mean=22.4, median=19, range=0–56 (1 resident, 1 fellow, 2 retired) | |
| Sex (n/N) | Male 13/23 | |
| Ethnicity (n) | 19 Caucasian, 3 Asian, 1 African American | |
| Specialty | Family practice/internal medicine: 5 | |
| Adult subspecialist: 4 | ||
| Pediatrics/child subspecialist: 6 | ||
| Surgical specialty: 3 | ||
| Neurology/anesthesia/emergency medicine/radiation oncology: 5 | ||
| Practice type | Clinician: 10 | Clinician/researcher: 5 |
| Clinician/educator: 5 | Clinician/administrator: 3 | |
| Practice location | University hospital: 11 | |
| Community hospital: 2 | ||
| Private practice: 9 | ||
| Research/nonpracticing: 1 | ||
| Tumor type | Breast: 5; renal: 4; prostate: 5; lymphoma: 3; colon: 2 (1 participant had 2 cancers) | |
| Bone/brain/larynx/head & neck/thyroid: 1 each | ||
| Illness stage | Disease-free >5 years: 9 | |
| Disease-free >6 months: 5 | ||
| Disease-free <6 months: 4 | ||
| In treatment: 2 | ||
| Metastatic/rapidly progressive disease: 3 | ||
The nature of self-doctoring What is self-doctoring and when does it occur?
The participants did not identify a discrete activity or group of activities that constituted self-doctoring (Table 2). Some activities were obvious because they required privileges restricted to medical personnel—for example, ordering one’s own abdominal computed tomography scan. Other activities were less obvious because they could be performed by any patient—such as treating oneself for a minor illness like low back pain.
Should you doctor yourself? Whereas only 1 participant recommended self-doctoring, the rest were more or less strongly opposed to the practice. Despite this stance, most participants were able to identify instances during which they did doctor themselves. Sometimes they doctored themselves without acknowledging this activity as doctoring.
EF: Do you ever feel like you do anything where you doctor yourself?
PARTICIPANT: No I don’t think so . . . I’ve never had a primary care physician, which is probably a mistake because I tell all my patients they should have one.
EF: How did you get your PSAs [prostate-specific antigen]?
PARTICIPANT: I would just go down and get my blood done myself.
EF: So would you say that is an example of being your own doctor?
PARTICIPANT: Yeah, I suppose it is to some degree!
Reframing the question: from self-doctoring to health care-seeking strategies. Although our questions were about self-doctoring, participants spoke less about self-doctoring and more about their strategy for obtaining health care. This concept of health care-seeking strategies accounted for all of the various methods that participants used to obtain health care, of which self-doctoring was one.
TABLE 2
Subtle ways in which participants doctored themselves
| Decide when to seek or not seek care |
| Did not get alarmed about neck mass because she knew what cancer felt like |
| Did not call physician with most things because they are “silly” |
| Did not go to physician until family member insisted |
| Establish a diagnosis |
| Broke own bad news by going into the hospital computer on a weekend |
| Diagnosed self as depressed but that it was subclinical |
| Went directly to a gastroenterologist to evaluate abdominal pain |
| Called physician with a diagnosis, not a problem |
| Learn about illness |
| Became an expert in own disease |
| Called an expert colleague at another institution to critique care |
| Influence care decisions |
| Rejected a recommendation that did not coincide with medical training |
| Decided on a specific surgical procedure, then found an oncologist |
| Chose a physician who she knew would go along with whatever she wanted |
| Assumed he didn’t need a second opinion because he was a physician |
| Get treatment |
| Managed only illnesses in her own specialty |
| Followed own Dilantin levels |
The continuum of health care-seeking strategies
The following examples illustrate 3 health care-seeking strategies. When viewed together, these strategies create a continuum ranging between the roles of physician and patient. The following categories are not intended to be mutually exclusive, but to indicate an individual participant’s emphasized role. We referred to strategies that emphasized the physician role as PHYSICIAN-patient, here exemplified by this internist who had more than 40 years of experience in clinical practice.
One evening I felt a mass in my right lower quadrant. I figured I had a little hematoma—I couldn’t see anything, but I was pretty asymptomatic and by chance felt [the mass]. I watched it for maybe a week or so and it didn’t seem to change. I did a couple of routine blood tests and my CBC and Chem-20 profile were okay. But then when [the mass] didn’t go down, I asked one of my partners to feel it. He said “yes, I can feel a mass—you’d better look into it.” I didn’t see a doctor—just a curbside-type thing. So then I set up a CT scan, I got a CE antigen, and I just did this on my own, and the CT scan showed a mass in the appendiceal area and the CE antigen was up a little bit. I guess I went right to my surgeon!
At the other end of the continuum, this middleaged pediatric subspecialist represents those physicians whose health care-seeking strategies were based on their roles as patients. We labeled this strategy physician-PATIENT, emphasizing the patient role.
You know, I think that a physician diagnosed with cancer is like any person diagnosed with cancer. Their first concern has nothing to do with their careers. I think the hardest thing about being a physician-patient is that you hate to bother your doctors. Or you want to sort of “call your doctor with the answer” instead of just asking questions. I think you sort of feel like sometimes that you should be able to somehow know whether [your] symptom is related to metastatic disease without having to ask, “Should I be worried about this or not?” Physicians have the same fears and difficulties as anyone else does and need to give themselves permission to act like a normal patient.
This next physician, a medical subspecialist who had recently undergone bilateral mastectomy for stage I breast cancer, falls somewhere in the middle of this continuum. We labeled this approach Physician-Patient, signifying the incorporation of both roles into her health care-seeking strategy.
This breast mass was discovered by my gynecologist but he told me, don’t worry—it’s a fibroadenoma. It was small, not really moveable, so I didn’t listen to him. I went to a surgeon. I wouldn’t say I doctored myself just because I didn’t necessarily listen to my physician. It didn’t make sense from my medical training, so I did what made sense—I can listen to those doctors’ advice, but I use my own judgment.
Advantages of being a physician-patient: convenience and control. Physicians recognized definite advantages afforded by their status, mostly related to added convenience in navigating through the system and scheduling appointments, and being able to control many aspects of their care. This specialist in infectious disease with metastatic cancer illustrates the importance of convenience and control in explaining why she often relied on self-doctoring.
I think idealistically you should never be your own doctor, but realistically I think I can accomplish more faster without interrupting the doctor’s schedule. A couple of weeks ago I started spiking fevers but I had no symptoms of any kind…. After the third day I thought, “I bet this is tumor fever!” So I went out and bought Naprosyn and I was afebrile the next morning…. Now I guess there is a small chance I have an abscess somewhere, but I think I can obviate a lot of workup that my physician is more obligated to do than I am, medico-legally … I am sure there are control issues because we all like control and I am sure I like the control and the convenience.
Disadvantages of being a physician-patient: denying yourself the opportunity to receive support; lack of objectivity; delaying care. In talking about the disadvantages of their strategies, physicians invariably referred to a previous negative experience. This young pediatrician with a large retroperitoneal mass described how she learned of her computed tomography scan results.
More insidious is the potential loss of objectivity that can occur when one’s own health is at stake. For example, a pediatric subspecialist with lymphoma described how she rationalized not bringing the enlarged lymph nodes in her neck to medical attention by telling herself that she “knew what cancer felt like.”
Advantages of being a physician-patient: trusting one’s care to others; relinquishing control; benefiting from the expertise and support of other physicians. Physicians who relied more on their physicians and less on self-doctoring approached control from the perspective of “letting go.” This emergency medicine specialist explains why he would rather trust his physician’s expertise than his own.
Find doctors you trust and listen to them because they’re the experts. The same way you’re the expert to your patients, the patients you care for. In some real sense, relinquish control. Give control to somebody else and even for nonphysician patients it’s very difficult but for physician-patients I think it’s one of the most difficult things but you have to do this. You have to trust yourself to someone else.
Disadvantages of being a physician-patient: being too trusting. This physician-patient describes adopting a more passive stance toward his health care in order to “be a good patient.” The result was that his Hodgkin’s disease was not diagnosed until 18 months after his initial biopsy.
By adopting that stance, I might have done myself a disservice. Our lives would have been very different had I questioned more aggressively the use of a needle biopsy because the pathologist here said, “You know, that’s an absolutely foolish inept way to look for lymphoma.” So in some ways the strategy backfired a bit.… But I really trusted their judgment.
Discussion
The attitudes and experiences of the study participants paralleled the medical literature: all but 1 recommended against self-doctoring, yet almost all were able to identify situations in which they did doctor themselves. Our findings show that participants’ health care-seeking strategies can be identified along a continuum ranging between the roles of physician and patient ( Figure 1 ). Whereas previous literature on physician-patients has characterized their situation as “role-reversal,”16,19,27 our findings suggest that physicians assume both roles depending on circumstances, influenced by their desire for control and degree of trust.
Trusting health care may be particularly difficult for physician-patients.2,3,27 In our study, participants at the “physician” end of the continuum were reluctant to “let go” of control over care, especially care they did not trust. They valued the convenience and time saved when they did things themselves and felt less need for support from their professional caregivers. These physicians did not consciously set out to doctor themselves. Instead, they simply used the expertise and status of their physician role to take care of themselves in the same way they might take care of a patient.
At the “patient” end of the health care-seeking continuum, participants approached their own health care as they thought a patient should. They tended not to be as involved with the details of their care, felt less pressure to be an expert in their own illness, and wanted their doctor to play an active role in medical decisions. They frequently emphasized the importance of being able to trust their care to another person and letting go of the need to be in control of their care. They valued the relationships with their physicians and appreciated the support these relationships provided.
Negative experiences invariably changed participants’ attitudes and where they were identified on the continuum. Both roles included unanticipated pitfalls, particularly for participants who adhered rigidly to either end of the continuum.
This study had important limitations. We recruited only physician-patients with cancer from a single institution and our sample was skewed toward survivors and presumably toward individuals who were comfortable talking about their experiences. Moreover, we replied on a convenience sample of patient-physicians identified by their specialists. Thus, the transferability of out findings ma be limited. Finally, our data captured the perspective of only the “physician-patient”—we did not interview their physicians. Nonetheless, we believe this provides robust new insights into physicians self-doctoring behaviors in the face of a serious, life-threatening illness.
Our findings make sense of the apparent mismatch between expert recommendations and physicians’ stated beliefs on one side, and physicians’ reported activities on the other. Rather than warning physicians not to doctor themselves, we advocate trying to focus on what is important: obtaining and providing good care ( Table 3 ). These questions are derived from 1 or more participating physician-patients’ experiences. In this way, we hope that readers might benefit from our participants’ experiences.
TABLE 3
Questions for physicians to ask themselves when seeking health care
| Are you responding more like a patient or more like a physician? Why? |
| If you are responding more like a physician: |
| Is it out of habit or convenience? |
| Is it because you don’t trust your doctors or health system (or because they are untrustworthy)? |
| Are you using your role as physician to shield yourself from painful or overwhelming realities? |
| Was an error made, or were you not getting the care you thought necessary? |
| AND |
| Do you have, or can you get, the necessary expertise to deal with your illness? |
| Are you too emotionally involved to be objective (and how would you recognize this problem)? |
| Do you, at minimum, have a physician you can trust and collaborate with—one with whom you would feel comfortable being a patient? |
| Are you getting the psychosocial support that may help you? |
| Are your nonmedical needs (rest, recreation, time off, decreased responsibilities at work) being met? |
| Are you getting the care you would want a patient in your position to receive? |
| If you are responding more like a patient: |
| Is it because you want to be “a good patient”? |
| Is it because you want someone else to make your decisions for you? |
| AND |
| Do you trust your professional caregivers and health care system? (And is that trust well founded?) |
| Are you ignoring your medical training or instincts because you do not want to offend? |
| Are you getting the information that you need (especially informed consent)? |
| Are you getting the psychosocial support you need? |
| Are your nonmedical needs (rest, recreation, time off, decreased responsibilities at work) being met? |
| Is the care you are getting consistent with the standard of care? |
| If it is not, do you understand why? |
| Are you getting the respect you would want a patient in your position to receive? |
| In either case: Would you be better off responding more like a patient, or more like a physician? |
FIGURE 1
Physician-patient continuum
Acknowledgments
Dr Carrese was a Robert Wood Johnson Generalist Physician Faculty Scholar when this work was conducted. This work was largely completed while Drs Fromme and Hebert were fellows in the Division of General Internal Medicine, The Johns Hopkins University School of Medicine and Johns Hopkins Bayview Medical Center. It was presented in abstract form at the 24th Annual Meeting of the Society of General Internal Medicine, San Diego, California in May 2001 and was funded by a grant from the Kenneth B. Schwartz Center, Boston, Mass.
Corresponding author
Erik K. Fromme, MD, Division of General Medicine and Geriatrics, L475, Oregon Health and Science University, 3181 SW Sam Jackson Park Road, Portland, OR 97239-3098. E-mail: [email protected].
1. Toyry S, Rasanen K, Kujala S, et al. Self-reported health, illness and self-care among Finnish physicians: a national survey. Arch Fam Med. 2000;9:1079-1085.
2. Allibone A. Who treats the doctor? Practitioner. 1990;234:984-987.
3. Miller MN, McGowen KR. The painful truth: physicians are not invincible. South Med J. 2000;93:966-973.
4. Budge A, Dickstein E. The doctor as patient: bioethical dilemmas reflected in literary narratives. Lit Med. 1988;7:132-137.
5. Rogers T. Barriers to the doctor as patient role. A cultural construct. Aust Fam Physician. 1998;27:1009-1013.
6. Waldron HA. Sickness in the medical profession. Ann Occup Hyg. 1996;40:391-396.
7. Waldron HA. Medical advice for sick physicians. Lancet. 1996;347:1558-1559.
8. Wines AP, Khadra MH, Wines RD. Surgeon, don’t heal thyself: a study of the health of Australian urologists. Aust N Z J Psychiatry. 1998;68:778-781.
9. Pullen D, Lonie CE, Lyle DM, Cam DE, Doughty MV. Medical care of doctors. Med J Aust. 1995;162:481,-484.
10. Allibone A, Oakes D, Shannon HS. The health and health care of doctors. J R Coll Gen Pract. 1981;31:728-734.
11. Schwartz JS, Lewis CE, Clancy C, Kinosian MS, Radany MH, Koplan JP. Internists’ practices in health promotion and disease prevention. A survey. Ann Intern Med. 1991;114:46-53.
12. Rosen IM, Christie JD, Bellini LM, Asch DA. Health and health care among housestaff in four U.S. internal medicine residency programs. J Gen Intern Med. 2000;15:116-121.
13. Kahn KL, Goldberg RJ, DeCosimo D, Dalen JE. Health maintenance activities of physicians and nonphysicians. Arch Intern Med. 1988;148:2433-2436.
14. Robbins GF, MacDonald MC, Pack GT. Delay in the diagnosis and treatment of physicians with cancer. Cancer 1953;6:624-626.
15. Anonymous [proverb] Strauss’ Familiar Medical Quotations. New York, NY: Little, Brown; 1968;415b.-
16. Spiro HM, Mandell H. When doctors get sick. Ann Intern Med. 1998;128:152-154.
17. Bittker TE. Reaching out to the depressed physician. JAMA. 1976;236:1713-1716.
18. Lampert PH. On the other side of the bed sheets. When the doctor is the patient. Minn Med. 1991;74(11):14-19.
19. Glass GS. Incomplete role reversal: the dilemma of hospitalization for the professional peer. Psychiatry. 1975;38:132-144.
20. Ellard J. The disease of being a doctor. Med J Aust. 1974;2:318-323.
21. Vaillant GE, Sobowale NC, McArthur C. Some psychologic vulnerabilities of physicians. N Engl J Med. 1972;287:372-375.
22. Thompson WT, Cupples ME, Sibbett CH, Skan DI, Bradley T. Challenge of culture, conscience, and contract to general practitioners’ care of their own health: qualitative study. BMJ. 2001;323:728-731.
23. Gold N. The doctor, his illness and the patient. Aust N Z J Psychiatry. 1972;6:209-213.
24. Kuzel A. Sampling in qualitative inquiry. In: Crabtree B, Miller W, eds. Doing Qualitative Research. 2nd ed. Thousand Oaks, Calif: Sage Publications; 1992;31-44.
25. Crabtree B, Miller W. A template approach to text analysis: developing and using codebooks. In: Crabtree B, Miller W, eds. Doing Qualitative Research. 2nd ed. Thousand Oaks, Calif: Sage Publications; 1992;93-109.
26. Glaser B, Strauss A. Discovery of Grounded Theory: Strategies for Qualitative Research. Hawthorne, NY: Aldine De Gruyter; 1967;101-115.
27. Edelstein EL, Baider L. Role reversal: when doctors become patients. Psychiatria Clin (Basel). 1982;15:177-183.
Molluscum Contagiosum: The Need for Physician Intervention and New Treatment Options
Laparoscopic cholecystectomy in a rural family practice: The Vivian, LA, experience
- Laparoscopic cholecystectomy can be performed safely and effectively by a trained family physician (C).
- Family physicians with expanded surgical skills can enhance access to procedures in rural and underserved populations (C).
- This focused review of outcomes and comparison to published case series, serves as a model for continuous practice assessment and improvement (C).
Laparoscopic cholecystectomy was first performed in France in 1987. In 1989, Reddick1 popularized this procedure in the United States. Laparoscopic cholecystectomy was a natural outgrowth of laparoscopic surgery done by gynecologists in pelvic surgery and orthopedic surgeons doing endoscopic joint surgery for many decades before 1989. By late 1990 and early 1991, laparoscopic cholecystectomy had become widespread.
Large series of laparoscopic cholecystectomy were reported with few complications,2-6 and most surgeons and patients prefer laparoscopic cholecystectomy to open cholecystectomy. Unfortunately, access to laparoscopic surgery and other procedures is limited in more rural areas. In this article, we report the first series of laparoscopic cholecystectomies performed by family physicians in a small rural community hospital.
Methods
From June 1992 to June 2001, the medical records of all patients with cholecystitis or cholelithiasis requiring surgical treatment at North Caddo Medical Center (NCMC), in Vivian, Louisiana, were reviewed. This group of patients was self-referred and consisted of consecutive individuals who presented to 2 family practitioners (1 primary surgeon and 1 partner) at the NCMC.
Patient selection for surgery was made preop-eratively on the basis of history, physical, and laboratory diagnostic evidence of gall bladder disease. No patients were referred to other facilities.
Surgical technique
Laparoscopic cholecystectomy was performed using the surgical technique advocated by Dr. Reddick1 using 4 ports. All surgery was performed by the lead author after he completed the course taught by Dr Reddick. The first 9 operations were performed in a tertiary hospital (Willis-Knighton Hospital, Shreveport, La) for credentialing purposes. Case-by-case modifications of the technique were sometimes necessary for successful outcomes.
Results
This series involved 108 patients from ages 18 to 89 years (17 were 18–34 years, 46 were 35–64 years, and 45 were 65 years), all of whom presented to NCMC for cholecystectomy. Patients were about 60% white and 40% African American; about 75% were female. Patients lived in a 450-square-mile service area. Forty-one percent of patients possessed private insurance, 44% had Medicare, and 23% had Medicaid.
About 30% of patients had significant medical morbidity and about 30% had previous abdominal or pelvic surgery. Accordingly, the insertion point of the Veress needle was adjusted to avoid the risk of perforations or injury to the bowel. Occasionally, a cut down was performed to directly visualize the peritoneum and the contents underneath before the ports were introduced. Other ports were then introduced under direct visualization.
The average operating-room time was 130 minutes, and the length of postoperative hospital stay was approximately 14 hours. Each patient was diagnosed conclusively to have gall bladder disease, confirmed by histopathological diagnosis.
The outcomes of this series are reported in Table 1 . There were no deaths; 2 cases were converted to open cholecystectomy after failed laparoscopic technique. There were no common bile duct injuries or postoperative complications. Six patients had postoperative fever for a short duration. No evidence of systemic or local infection was seen.
TABLE 1
Comparison of major series in laparoscopic cholecystectomy
| Important observations (%) | ||||||
|---|---|---|---|---|---|---|
| Study* | Study design | Mortality | Re-op | Complications | CBD injury | Conversion |
| Haynes JH et al | Single-center, 1 surgeon, retrospective, consecutive, and without bias (N=108) | 0 | 0 | 0 | 0 | 0.018 |
| ANDEM 7 | Meta-analysis of 4 studies: ANDEM’91, ANDEM’94, NIH, Strasberg (N=363) | 0.07 | 8 | 9.5 | 2 | 8 |
| Karauchi et al 8 | Meta-analysis: Multicenter (25) community hospitals (N=1408) | 0.07 | 6 | 7.5 | 0.9 | 6 |
| Z’graggen et al9 | Multicenter meta-analysis (N=10,174) | 0.2 | 1.66 | 10.38 | 0.31 | 8.2 |
| Wherry DC et al 6 | Multicenter study, 94 US 0.13 NA 6.09 0.41 9.85 military centers (N=9054) | 0.13 | NA | 6.09 | 0.41 | 9.85 |
| * All other reports are from tertiary/specialist surgical services. | ||||||
| CBD, common bile duct; ANDEM, Agence Nationale pour le Développement de l’Evaluation Médicale; NIH, National Institutes of Health. | ||||||
Discussion
The outcomes of this unique case series of laparo-scopic cholecystectomies performed by family physicians in a rural community hospital were equivalent to those in the surgical literature from tertiary care settings.2-6
The low rate of morbidity and nosocomial infections may be due to the smaller facility, favorable staff-to-patient ratio, lower perceived stress, attention to aseptic technique, and environmental sanitation. Because surgeons and patients prefer laparoscopic cholecystectomy to open cholecystectomy, and because this procedure is cost-effective, cosmetically superior, and produces far less morbidity, access to laparoscopic cholecystectomy is important even in rural communities.
While the Society of American Gastrointestinal Endoscopic Surgeons (SAGES)10 has introduced proposals to implement dedicated endoscopic surgical training, including telesurgery and robotic techniques, access to such services in rural communities will likely remain limited.
Nonetheless, several limitations are worth noting. Successful performance of this procedure requires focused training, discipline, skills and technology, and ongoing maintenance of competency. More sophisticated technology may become available and transportation and physical barriers to access may ease. But we believe this series demonstrates that procedural training and ongoing practice assessment can provide timely, safe, and appropriate access to the latest surgical techniques.
Since we closed this study, we have performed another 30 cases with similar excellent results and a substantial decrease in procedure and post-operative recovery time (90 minutes and 7 hours, respectively). Our ongoing assessment of our practice and performance improvement are integral to procedural excellence.
Conclusion
The authors have successfully delivered this well-defined surgical service in their community without any compromise in quality of care. The resources are unique, including training, team selection, and collaboration within a rural community hospital setting.
This experience suggests that an alternative model of practice and surgical training in family medicine may be feasible and offer effective, and perhaps superior results in rural communities. The inclusion of procedural skills in the scope of family medicine should be considered as a viable solution to the healthcare access and quality concerns of rural Americans.
· Acknowledgements ·
The authors thankfully acknowledge the advice and help received from: David Driggers, MD, Providence Family Practice Center, Anchorage, Alaska; Frank Kurzwez, MD, formerly Chairman, Department of Surgery, Louisiana State University Health Science Center, Shreveport; Debi P. Mukherjee, Sc.D, Associate Professor, Department of Orthopedic Surgery and Coordinator of Bio-Engineering, Louisiana State University Health Science Center, Shreveport; W. Norwood, MD, Chief, Department of Surgery, WK Hospital Health System, Shreveport; James Elrod, President, Willis-Knighton Hospital Health System, Shreveport; John Harlan Haynes III, MD, FABFP, MScMM (UT SWHSC), Med Alliance Health Center, Fort Worth, Tex; Jishnu Guha; and Indranil Guha.
1. Reddick EJ. Laparoscopic cholecystectomy in freestanding outpatient centers. J Laparoendosc Surg 1992;2:65-67.
2. Morlang T, Umscheid T, Shelter WJ. Laparoscopic cholecystectomy: a prospective study of 1,755 unselected patients. Zentralbl Chir 1995;120:353-359.
3. Hobling N, Pitz E, Feil W, Schiessel R. Laparoscopic cholecystectomy—a meta-analysis of 23,700 cases and status of a personal patient sample. Wein Klin Wochenschr 1995;107:158-162.
4. Schlumpf R, Klotz HP, Wehrli H, Herzog U. A nation’s experience in laparoscopic cholecystectomy. Prospective multicenter analysis of 3722 cases. Surg Endosc 1994;8:35-41.
5. Taylor OM, Sedman PC, Jones BM, Royston CM, Arulampalam T, Wellwood J. Laparoscopic cholecystectomy without operative cholangiogram: 2038 cases over 5-year period in two district general hospitals. Ann R Coll Surg Engl 1997;79:376-380.
6. Wherry DC, Marohn MR, Malanoski MP, Hetz SP, Rich NM. An external audit of laparoscopic cholecystectomy in the steady state performed in medical treatment facilities of the Department of Defense. Ann Surg 1996;224:145-154.
7. Indications and modalities of cholecystectomy in cholelithiasis. Study Group of Cholecystectomy, under the aegis of the National Agency for the Development of Medical Evaluation [in French]. Gastroenterol Clin Biol 1995;19:707-717.
8. Kurauchi N, Kamii N, Kazui K, Saji Y, Uchino J. Laparoscopic cholecystectomy: a report on the community hospital experience in Hokkaido. Surg Today 1998;28:714-718.
9. Z’graggen K, Wehrli H, Metzger A, Buehler M, Frei E, Klaiber C. Complications of laparoscopic cholecystectomy in Switzerland. A prospective 3-year study of 10,174 patients. Swiss Association of Laparoscopic and Thoracoscopic Surgery. Surg Endosc 1998;12:1303-1310.
10. Framework for post-residency surgical education and training: the Society of American Gastrointestinal Endoscopic Surgeons. Surg Endosc 1994;8:1137-1142.
Corresponding author: John H. Haynes, Jr., MD, FABFP, WK Medical and Surgical Clinic, 1003 South Spruce, Vivian, LA 71082. E-mail: [email protected] .
- Laparoscopic cholecystectomy can be performed safely and effectively by a trained family physician (C).
- Family physicians with expanded surgical skills can enhance access to procedures in rural and underserved populations (C).
- This focused review of outcomes and comparison to published case series, serves as a model for continuous practice assessment and improvement (C).
Laparoscopic cholecystectomy was first performed in France in 1987. In 1989, Reddick1 popularized this procedure in the United States. Laparoscopic cholecystectomy was a natural outgrowth of laparoscopic surgery done by gynecologists in pelvic surgery and orthopedic surgeons doing endoscopic joint surgery for many decades before 1989. By late 1990 and early 1991, laparoscopic cholecystectomy had become widespread.
Large series of laparoscopic cholecystectomy were reported with few complications,2-6 and most surgeons and patients prefer laparoscopic cholecystectomy to open cholecystectomy. Unfortunately, access to laparoscopic surgery and other procedures is limited in more rural areas. In this article, we report the first series of laparoscopic cholecystectomies performed by family physicians in a small rural community hospital.
Methods
From June 1992 to June 2001, the medical records of all patients with cholecystitis or cholelithiasis requiring surgical treatment at North Caddo Medical Center (NCMC), in Vivian, Louisiana, were reviewed. This group of patients was self-referred and consisted of consecutive individuals who presented to 2 family practitioners (1 primary surgeon and 1 partner) at the NCMC.
Patient selection for surgery was made preop-eratively on the basis of history, physical, and laboratory diagnostic evidence of gall bladder disease. No patients were referred to other facilities.
Surgical technique
Laparoscopic cholecystectomy was performed using the surgical technique advocated by Dr. Reddick1 using 4 ports. All surgery was performed by the lead author after he completed the course taught by Dr Reddick. The first 9 operations were performed in a tertiary hospital (Willis-Knighton Hospital, Shreveport, La) for credentialing purposes. Case-by-case modifications of the technique were sometimes necessary for successful outcomes.
Results
This series involved 108 patients from ages 18 to 89 years (17 were 18–34 years, 46 were 35–64 years, and 45 were 65 years), all of whom presented to NCMC for cholecystectomy. Patients were about 60% white and 40% African American; about 75% were female. Patients lived in a 450-square-mile service area. Forty-one percent of patients possessed private insurance, 44% had Medicare, and 23% had Medicaid.
About 30% of patients had significant medical morbidity and about 30% had previous abdominal or pelvic surgery. Accordingly, the insertion point of the Veress needle was adjusted to avoid the risk of perforations or injury to the bowel. Occasionally, a cut down was performed to directly visualize the peritoneum and the contents underneath before the ports were introduced. Other ports were then introduced under direct visualization.
The average operating-room time was 130 minutes, and the length of postoperative hospital stay was approximately 14 hours. Each patient was diagnosed conclusively to have gall bladder disease, confirmed by histopathological diagnosis.
The outcomes of this series are reported in Table 1 . There were no deaths; 2 cases were converted to open cholecystectomy after failed laparoscopic technique. There were no common bile duct injuries or postoperative complications. Six patients had postoperative fever for a short duration. No evidence of systemic or local infection was seen.
TABLE 1
Comparison of major series in laparoscopic cholecystectomy
| Important observations (%) | ||||||
|---|---|---|---|---|---|---|
| Study* | Study design | Mortality | Re-op | Complications | CBD injury | Conversion |
| Haynes JH et al | Single-center, 1 surgeon, retrospective, consecutive, and without bias (N=108) | 0 | 0 | 0 | 0 | 0.018 |
| ANDEM 7 | Meta-analysis of 4 studies: ANDEM’91, ANDEM’94, NIH, Strasberg (N=363) | 0.07 | 8 | 9.5 | 2 | 8 |
| Karauchi et al 8 | Meta-analysis: Multicenter (25) community hospitals (N=1408) | 0.07 | 6 | 7.5 | 0.9 | 6 |
| Z’graggen et al9 | Multicenter meta-analysis (N=10,174) | 0.2 | 1.66 | 10.38 | 0.31 | 8.2 |
| Wherry DC et al 6 | Multicenter study, 94 US 0.13 NA 6.09 0.41 9.85 military centers (N=9054) | 0.13 | NA | 6.09 | 0.41 | 9.85 |
| * All other reports are from tertiary/specialist surgical services. | ||||||
| CBD, common bile duct; ANDEM, Agence Nationale pour le Développement de l’Evaluation Médicale; NIH, National Institutes of Health. | ||||||
Discussion
The outcomes of this unique case series of laparo-scopic cholecystectomies performed by family physicians in a rural community hospital were equivalent to those in the surgical literature from tertiary care settings.2-6
The low rate of morbidity and nosocomial infections may be due to the smaller facility, favorable staff-to-patient ratio, lower perceived stress, attention to aseptic technique, and environmental sanitation. Because surgeons and patients prefer laparoscopic cholecystectomy to open cholecystectomy, and because this procedure is cost-effective, cosmetically superior, and produces far less morbidity, access to laparoscopic cholecystectomy is important even in rural communities.
While the Society of American Gastrointestinal Endoscopic Surgeons (SAGES)10 has introduced proposals to implement dedicated endoscopic surgical training, including telesurgery and robotic techniques, access to such services in rural communities will likely remain limited.
Nonetheless, several limitations are worth noting. Successful performance of this procedure requires focused training, discipline, skills and technology, and ongoing maintenance of competency. More sophisticated technology may become available and transportation and physical barriers to access may ease. But we believe this series demonstrates that procedural training and ongoing practice assessment can provide timely, safe, and appropriate access to the latest surgical techniques.
Since we closed this study, we have performed another 30 cases with similar excellent results and a substantial decrease in procedure and post-operative recovery time (90 minutes and 7 hours, respectively). Our ongoing assessment of our practice and performance improvement are integral to procedural excellence.
Conclusion
The authors have successfully delivered this well-defined surgical service in their community without any compromise in quality of care. The resources are unique, including training, team selection, and collaboration within a rural community hospital setting.
This experience suggests that an alternative model of practice and surgical training in family medicine may be feasible and offer effective, and perhaps superior results in rural communities. The inclusion of procedural skills in the scope of family medicine should be considered as a viable solution to the healthcare access and quality concerns of rural Americans.
· Acknowledgements ·
The authors thankfully acknowledge the advice and help received from: David Driggers, MD, Providence Family Practice Center, Anchorage, Alaska; Frank Kurzwez, MD, formerly Chairman, Department of Surgery, Louisiana State University Health Science Center, Shreveport; Debi P. Mukherjee, Sc.D, Associate Professor, Department of Orthopedic Surgery and Coordinator of Bio-Engineering, Louisiana State University Health Science Center, Shreveport; W. Norwood, MD, Chief, Department of Surgery, WK Hospital Health System, Shreveport; James Elrod, President, Willis-Knighton Hospital Health System, Shreveport; John Harlan Haynes III, MD, FABFP, MScMM (UT SWHSC), Med Alliance Health Center, Fort Worth, Tex; Jishnu Guha; and Indranil Guha.
1. Reddick EJ. Laparoscopic cholecystectomy in freestanding outpatient centers. J Laparoendosc Surg 1992;2:65-67.
2. Morlang T, Umscheid T, Shelter WJ. Laparoscopic cholecystectomy: a prospective study of 1,755 unselected patients. Zentralbl Chir 1995;120:353-359.
3. Hobling N, Pitz E, Feil W, Schiessel R. Laparoscopic cholecystectomy—a meta-analysis of 23,700 cases and status of a personal patient sample. Wein Klin Wochenschr 1995;107:158-162.
4. Schlumpf R, Klotz HP, Wehrli H, Herzog U. A nation’s experience in laparoscopic cholecystectomy. Prospective multicenter analysis of 3722 cases. Surg Endosc 1994;8:35-41.
5. Taylor OM, Sedman PC, Jones BM, Royston CM, Arulampalam T, Wellwood J. Laparoscopic cholecystectomy without operative cholangiogram: 2038 cases over 5-year period in two district general hospitals. Ann R Coll Surg Engl 1997;79:376-380.
6. Wherry DC, Marohn MR, Malanoski MP, Hetz SP, Rich NM. An external audit of laparoscopic cholecystectomy in the steady state performed in medical treatment facilities of the Department of Defense. Ann Surg 1996;224:145-154.
7. Indications and modalities of cholecystectomy in cholelithiasis. Study Group of Cholecystectomy, under the aegis of the National Agency for the Development of Medical Evaluation [in French]. Gastroenterol Clin Biol 1995;19:707-717.
8. Kurauchi N, Kamii N, Kazui K, Saji Y, Uchino J. Laparoscopic cholecystectomy: a report on the community hospital experience in Hokkaido. Surg Today 1998;28:714-718.
9. Z’graggen K, Wehrli H, Metzger A, Buehler M, Frei E, Klaiber C. Complications of laparoscopic cholecystectomy in Switzerland. A prospective 3-year study of 10,174 patients. Swiss Association of Laparoscopic and Thoracoscopic Surgery. Surg Endosc 1998;12:1303-1310.
10. Framework for post-residency surgical education and training: the Society of American Gastrointestinal Endoscopic Surgeons. Surg Endosc 1994;8:1137-1142.
Corresponding author: John H. Haynes, Jr., MD, FABFP, WK Medical and Surgical Clinic, 1003 South Spruce, Vivian, LA 71082. E-mail: [email protected] .