User login
Traditional Medicare Spending on Inpatient Episodes as Hospitalizations Decline
The rate of inpatient admissions among adults aged 65 years and older has decreased by approximately 25% since 2000.1,2 This long-term trend raises important questions about inpatient-related spending in the traditional Medicare program for hospitals and providers who treat beneficiaries after a hospitalization. As traditional Medicare’s most expensive sector (accounting for 21% of all Medicare spending3), reducing hospitalizations is often championed as an opportunity to moderate Medicare spending growth.
Medicare’s ability to achieve significant savings from declining inpatient use may be tempered by a shift toward more expensive hospitalizations. If marginal hospitalizations among healthier beneficiaries are avoided, then the remaining inpatient users may be sicker and have greater spending per hospitalization and greater need for follow-up services. This study examines trends in Medicare spending related to episodes initiated by an inpatient stay because of its importance to overall Medicare spending and the implications for several Medicare value-based payment initiatives. In care models seeking to contain spending at a population level, such as accountable care organizations and managed care plans, reducing inpatient use and associated services may have the largest impact in curbing overall spending growth per beneficiary. Other models focused on spending at an episode level, including bundled payment initiatives, may face challenges if inpatient episodes become more expensive over time.
As Medicare shifts toward value-based payments, hospitalists and other hospital leaders are often involved in redesigning care delivery models for the hospital or accountable care organization (eg, through readmission reduction initiatives, post–acute care coordination, and bundled-care delivery programs). Not all savings strategies rely on providers to change how services are delivered; Medicare can modify payment rates, such as Affordable Care Act provisions that slowed how quickly Medicare payment rates increased.4 For clinicians to navigate the shift toward new payment models, it is important to recognize how each of these elements—declining hospital admissions, spending per inpatient episode, and payment rates—affect spending trends for inpatient services and associated care. Previous articles on overall Medicare inpatient spending have examined inpatient stays alone5 or focused mainly on spending per episode6,7 without quantifying how these elements contributed to overall episode-related Medicare spending per beneficiary. This article addresses this gap by demonstrating how inpatient-related spending trends reflect each component.
This study examined trends in Medicare’s spending on inpatient episodes during the years 2009 to 2017. We described changes in the volume and spending on inpatient-initiated episodes across several dimensions, including beneficiary-level and hospitalization-level factors. We examined whether declines in spending associated with fewer inpatient-initiated episodes have been offset by increased spending per episode and how spending would have differed without changes in Medicare payment rates.
Episode Definition
We constructed an episode measure that captured traditional Medicare spending for 30 days prior to hospital admission, hospitalization duration, and 90 days following hospital discharge (additional details in the Appendix).
Any acute hospitalization triggered a new episode, with one exception: if a beneficiary was discharged and readmitted within 90 days for the same diagnosis-related group (DRG), then the readmission did not trigger a new episode. The spending for that readmission was attributed to the prior hospital stay. In effect, the annual number of episodes is equivalent to the annual number of hospital admissions minus subsequent rehospitalizations for the same DRG. Neither observation stays nor hospitalizations in inpatient rehabilitation, psychiatric, or long-term facilities were considered acute hospital admissions.
We assigned claims from noninpatient sectors to an episode based on whether the claim start date fell within the episode window. All traditional Medicare sectors were measured, including outpatient services, physician claims, post–acute care services, and Medicare Part D prescription drug events.
Our analysis aimed to measure all spending related to inpatient episodes without double-counting spending for overlapping episodes. If episodes overlapped, then spending for overlapping days was weighted to be evenly divided across episodes.
Outcome Measures
The study’s main outcomes summarized episode trends across the entire traditional Medicare population, including beneficiaries without an episode, in annual mean number of episodes per beneficiary and annual mean episode-related spending per beneficiary. The denominator of these measures is person-years, or total number of beneficiary months with Medicare Part A and B coverage divided by 12. The annual mean number of episodes per beneficiary is the total number of episodes initiated in a calendar year divided by person-years. The annual mean episode-related spending per beneficiary is the total amount of spending attributed to episodes divided by person-years. We also measured annual mean spending per episode, or total amount of spending attributed to episodes divided by the total number of episodes.
Medicare annually updates each sector’s payment rates for several factors, including inflation. We constructed an index for each sector to adjust for these annual payment rate changes. We also accounted for sequestration measures in effect since April 2013 that reduced Medicare payments to all sectors by 2%. We report our spending measures twice, with and without adjusting for changes in payment rates. Adjusted numbers reflect payment rates in effect in 2015.
Analysis Approach
We present annual trends on changes in the number of inpatient episodes per beneficiary, mean episode-related spending per beneficiary, and mean spending per episode. To quantify how changes in episode-related spending per beneficiary reflect changes in the number of episodes per beneficiary vs changes in spending per episode, we modified an approach implemented by Rosen and colleagues.8
To better understand which beneficiaries have declining inpatient use, we performed stratified analyses describing changes in the number of episodes per beneficiary between 2009 and 2017, spending per episode, and total episode-related spending per beneficiary. We report these measures for several subpopulations defined by age, sex, race, dual-eligible status, and whether the beneficiary used long-term nursing home services during the episode’s calendar year. Descriptive statistics also detail how these measures changed between 2009 and 2017 for episodes stratified by characteristics of the index hospital stay: planned vs unplanned, medical vs surgical, and any use of intensive care unit (ICU) or coronary care unit services. We also stratify study measures by whether an episode included any use of post–acute care services (skilled nursing facility, home health, or inpatient rehabilitation facility use). Finally, we aggregate the episodes into major diagnostic categories (MDCs) based on the index hospital stay’s DRG to report study outcomes by condition. Because of a shift in coding hospitalizations for pneumonia as sepsis,9,10 we exclude these two diseases from their respective MDCs and analyze them jointly as a unique category.
RESULTS
Changes in Number of Inpatient Episodes and Related Spending
From 2009 to 2017, the number of inpatient episodes per 1000 traditional Medicare beneficiaries declined from 326 to 267 (Table 1), or a relative decline of 18.2% (Figure 1). The total volume of inpatient episodes declined by only 13.4%, from 10.2 million to 8.8 million, reflecting that the size of the traditional Medicare population grew during these years. Over the same years, mean payment-rate–adjusted spending per episode increased 11.4% from $20,891 to $23,273.

When considering overall episode-related spending, the large decline in the volume of episodes outweighed increased spending per episode: the mean amount of episode-related Medicare spending per beneficiary decreased 8.9% from $6810 to $6206 (Table 1), or a net change of $604 (Figure 2). This net change reflects decreased spending due to fewer episodes per beneficiary ($1239 reduction in episode-related spending) offset by increased spending per episode (translating to a $776 increase in episode-related spending per beneficiary).

When these estimates are calculated separately for the inpatient sector and all other sectors, the inpatient sector experienced small increases in spending associated with greater spending per episode ($304) compared with noninpatient sectors ($472). Accordingly, the inpatient sector had a larger net decline in episode-related spending per beneficiary ($420) than noninpatient sectors ($184) after taking into account declining episode volume.
As expected, episode-related spending increased more when measures were not adjusted for annual payment rate increases. Without such adjustment, mean spending per episode increased 25.5%, and episode-related spending per beneficiary was nearly flat (2.6% between 2009 and 2017 [Figure 1]). The decline in unadjusted spending associated with fewer episodes ($1138) was offset by the spending increase associated with higher spending per episode ($1592) (Figure 2).

Analyses Stratified by Beneficiary Characteristics
Every population examined had declines in the number of inpatient episodes, even beneficiaries with more frequent inpatient use (Table 2). Among Medicare beneficiaries aged 85 years and older, the mean number of episodes per 1000 beneficiaries declined by 12.7%, from 524 to 457. Populations with less frequent inpatient use often experienced larger relative declines in number of episodes than populations with more frequent inpatient use. For example, the mean number of episodes per 1000 beneficiaries decreased by 17.7% for beneficiaries without nursing home use (306 to 252), as compared with an 8.1% decline for beneficiaries with nursing home use (from 888 to 816). In contrast, populations with less frequent inpatient use had larger relative increases in spending per episode with adjustment for payment rate changes. For example, spending per episode increased by 13.1% for beneficiaries aged 65 to 74 years ($20,904 to $23,644), but only by 8.6% for beneficiaries 85 years and older ($20,384 to $22,138).

Analyses Stratified by Service Use Characteristics
Some types of inpatient episodes had larger declines in the number of episodes, including episodes with planned admissions for the index hospital stay (28.8% decline from 68 to 48 episodes per 1000 beneficiaries) and episodes without post–acute care use (23.9% decline from 169 to 129 episodes per 1000 beneficiaries) (Appendix Table). In contrast, declines in the number of episodes were similar for index hospital admissions that did or did not involve ICU use (17.8% and 18.3% reduction in mean number of episodes per 1000 beneficiaries, respectively) or that included a surgical procedure or not (17.1% versus 18.6%, respectively). Several types of inpatient episodes had larger increases in spending per episode, such as a 15.1% increase for planned admissions and a 13.2% increase for hospitalizations without ICU use.
According to diagnosis information for an episode’s index hospital stay, inpatient episodes related to conditions affecting the circulatory system had the largest decline in mean number of episodes, decreasing by 31.8% from 78 to 53 episodes per 1000 beneficiaries (Appendix Table). Episodes for other diseases had much smaller declines in volume. Admissions for diagnoses of pneumonia or sepsis had notable increases in the volume of episodes, increasing by 20.7% from 25 to 30 admissions per 1000 beneficiaries.
DISCUSSION
Medicare spending per beneficiary on inpatient episodes, including services provided pre- and post hospitalization, declined by 8.9% from 2009 to 2017 after adjusting for payment rate changes. This decline reflects two components. First, the number of episodes per 1000 beneficiaries declined by 18.2%. Although the extent of this decrease varied across populations, every group examined had declines in inpatient use. In particular, hospitalizations for conditions affecting the circulatory system, such as heart attacks and cardiac procedures, decreased. Second, as inpatient volume declined, spending per episode increased by 11.4% to an average of $23,273 in 2017. This increase in spending per episode offset how much overall Medicare spending on episode-related care declined.
Medicare is increasingly challenging hospitals to demonstrate the value of inpatient services and associated treatment, which requires hospital leaders to recognize how their facilities’ spending trends relate to these national patterns. Understanding how much national episode-related spending has decreased over time with declining inpatient volume can help an accountable care organization evaluate whether it is feasible to achieve significant savings by reducing hospitalizations. Bundled payment providers focused on managing spending per episode can benefit from identifying which types of hospitalizations have increased spending per episode, especially for certain diagnoses.
These results also highlight the continued importance of a perennial factor in Medicare spending: payment rates. If Medicare payment rates had not increased over our study period, Medicare spending per inpatient episode would have increased by only 11%. Actual Medicare spending per episode increased by 25%, demonstrating that over half of the relative increase in spending per episode reflected increases in Medicare’s payment rates.
Increased spending per episode, even after adjustment for payment rate changes, suggests that services provided during an episode have increased in intensity or shifted toward higher-cost treatments.
When interpreting these trends, several points are notable. The underlying health of the Medicare population may contribute to declining inpatient use but is difficult to quantify. The observed decline in cardiac-related hospitalizations is consistent with evidence that the impact of ischemic heart disease, the leading source of disease or injury in the US population, has dramatically declined over recent decades15 and that the Medicare program has experienced large declines in overall spending and use related to cardiac conditions.16-18
Other potential factors include a shift toward hospitals treating Medicare beneficiaries as outpatients during an observation stay instead of admitting them as inpatients. Observation stays have increased as traditional Medicare implemented measures to penalize readmissions and limit payments for short inpatient stays.19-21 Even so, the increase in observation stays would have to be at least three times as large as described in other work to fully substitute for the decrease in inpatient stays: between the years 2007 and 2018, the number of observation stays per 1000 beneficiaries increased by only 26 stays, whereas the number of hospitalizations per 1000 beneficiaries decreased by 83 hospitalizations.20
Outpatient services may also broaden treatment availability in alternative settings or enable beneficiaries to avoid inpatient treatment with appropriate preventative care.22-27 These considerations are even more relevant as the COVID-19 pandemic spurred reduced admissions and shifted acute services outside of hospitals.28,29 Some services, such as elective surgeries, have probably shifted from an inpatient to an outpatient setting, which would be consistent with our finding that there are larger relative declines in planned hospitalizations. Although this analysis does not capture spending for outpatient services that are not linked to an inpatient admission, prior work demonstrates that annual growth in total Medicare spending per beneficiary (episode related or not) has recently declined for the inpatient sector but increased for outpatient and physician sectors.30 By offering other outpatient services, hospitals may be able to recoup some declining inpatient revenues. However, outpatient services are reimbursed at a lower rate than inpatient services, suggesting these trends may create financial pressure for hospitals.
There are several limitations to our analysis. First, our analysis is not designed to uncover the reason for the shift away from inpatient services nor to analyze how it has affected beneficiaries’ overall quality of care.
CONCLUSION
Over an 8-year period, Medicare spending per beneficiary on inpatient episodes, including all services immediately preceding and following hospitalizations, declined by 8.9% after taking into account payment rate increases. This broad shift away from inpatient services among all Medicare beneficiaries suggests policymakers should aim for payment policies that balance financial sustainability for hospitals and associated facilities with more efficient use of inpatient and related services.
Acknowledgments
The authors thank Sunita Thapa, Lucas Stewart, Christine Lai, and Liliana Podczerwinski for contributions in data analysis and manuscript preparation.
1. Sun R, Karaca Z, Wong HS. Trends in hospital inpatient stays by age and payer, 2000-2015: Statistical Brief #235. In: Healthcare Cost and Utilization Project (HCUP) Statistical Briefs. Agency for Healthcare Research and Quality; 2006.
2. HCUP Fast Stats - trends in inpatient stays. Healthcare Cost and Utilization Project (HCUP). April 2021. Accessed August 29, 2021. www.hcup-us.ahrq.gov/faststats/national/inpatienttrends.jsp
3. The Medicare Payment Advisory Commission. Section 1: National health care and Medicare spending. In: A Data Book: Health Care Spending and the Medicare Program. June 2018. Accessed August 13, 2021. http://www.medpac.gov/docs/default-source/data-book/jun18_databooksec1_sec.pdf
4. Buntin MB, Graves JA. How the ACA dented the cost curve. Health Aff (Millwood). 2020;39(3):403-412. https://doi.org/10.1377/hlthaff.2019.01478
5. Krumholz HM, Nuti SV, Downing NS, Normand SLT, Wang Y. Mortality, hospitalizations, and expenditures for the Medicare population aged 65 years or older, 1999-2013. JAMA. 2015;314(4):355-365. https://doi.org/10.1001/jama.2015.8035
6. Chen LM, Norton EC, Banerjee M, Regenbogen SE, Cain-Nielsen AH, Birkmeyer JD. Spending on care after surgery driven by choice of care settings instead of intensity of services. Health Aff (Millwood). 2017;36(1):83-90. https://doi.org/10.1377/hlthaff.2016.0668
7. Ibrahim AM, Nuliyalu U, Lawton EJ, et al. Evaluation of US hospital episode spending for acute inpatient conditions after the Patient Protection and Affordable Care Act. JAMA Netw Open. 2020;3(11):e2023926. https://doi.org/10.1001/jamanetworkopen.2020.23926
8. Rosen A, Aizcorbe A, Ryu AJ, Nestoriak N, Cutler DM, Chernew ME. Policy makers will need a way to update bundled payments that reflects highly skewed spending growth of various care episodes. Health Aff (Millwood). 2013;32(5):944-951. https://doi.org/10.1377/hlthaff.2012.1246
9. Lindenauer PK, Lagu T, Shieh MS, Pekow PS, Rothberg MB. Association of diagnostic coding with trends in hospitalizations and mortality of patients with pneumonia, 2003-2009. JAMA. 2012;307(13):1405-1413. https://doi.org/10.1001/jama.2012.384
10. Buntin MB, Lai C, Podczerwinski L, Poon S, Wallis C. Changing diagnosis patterns are increasing Medicare spending for inpatient hospital services. The Commonwealth Fund. April 28, 2021. Accessed August 13, 2021. https://www.commonwealthfund.org/publications/2021/apr/changing-diagnosis-patterns-are-increasing-medicare-spending-inpatient
11. The Medicare Payment Advisory Commission. Hospital inpatient and outpatient services. In: Report to the Congress: Medicare Payment Policy. . March 2018. Accessed August 13, 2021. http://www.medpac.gov/docs/default-source/reports/mar18_medpac_ch3_sec.pdf?sfvrsn=0
12. Ody C, Msall L, Dafny LS, Grabowski DC, Cutler DM. Decreases In readmissions credited to Medicare’s program to reduce hospital readmissions have been overstated. Health Aff (Millwood). 2019;38(1):36-43. https://doi.org/10.1377/hlthaff.2018.05178
13. Dharmarajan K, Qin L, Lin Z, et al. Declining admission rates and thirty-day readmission rates positively associated even though patients grew sicker over time. Health Aff (Millwood). 2016;35(7):1294-1302. https://doi.org/10.1377/hlthaff.2015.1614
14. Sjoding MW, Prescott HC, Wunsch H, Iwashyna TJ, Cooke CR. Longitudinal changes in ICU admissions among elderly patients in the United States. Crit Care Med. 2016;44(7):1353-1360. https://doi.org/10.1097/CCM.0000000000001664
15. Murray CJ, Atkinson C, Bhalla K, et al. The state of US health, 1990-2010: burden of diseases, injuries, and risk factors. JAMA. 2013;310(6):591-608. https://doi.org/10.1001/jama.2013.13805
16. Cutler DM, Ghosh K, Messer KL, Raghunathan TE, Stewart ST, Rosen AB. Explaining the slowdown in medical spending growth among the elderly, 1999-2012. Health Aff (Millwood). 2019;38(2):222-229. https://doi.org/10.1377/hlthaff.2018.05372
17. Ward MJ, Kripalani S, Zhu Y, et al. Incidence of emergency department visits for ST-elevation myocardial infarction in a recent six-year period in the United States. Am J Cardiol. 2015;115(2):167-170. https://doi.org/10.1016/j.amjcard.2014.10.020
18. Keohane LM, Gambrel RJ, Freed SS, Stevenson D, Buntin MB. Understanding trends in Medicare spending, 2007-2014. Health Serv Res. 2018;53(5):3507-3527. https://doi.org/10.1111/1475-6773.12845
19. Nuckols TK, Fingar KR, Barrett M, Steiner CA, Stocks C, Owens PL. The shifting landscape in utilization of inpatient, observation, and emergency department services across payers. J Hosp Med. 2017;12(6):443-446. https://doi.org/10.12788/jhm.2751
20. Poon SJ, Wallis CJ, Lai P, Podczerwinski L, Buntin MB. Medicare two-midnight rule accelerated shift to observation stays. Health Affairs. In press.
21. Sheehy AM, Kaiksow F, Powell WR, et al. The Hospital Readmissions Reduction Program and observation hospitalizations. J Hosp Med. 2021;16(7):409-411. https://doi.org/10.12788/jhm.3634
22. Culler SD, Parchman ML, Przybylski M. Factors related to potentially preventable hospitalizations among the elderly. Med Care. 1998;36(6):804-817. https://doi.org/10.1097/00005650-199806000-00004
23. Kozak LJ, Hall MJ, Owings MF. Trends in avoidable hospitalizations, 1980-1998. Health Aff (Millwood). 2001;20(2):225-232. https://doi.org/10.1377/hlthaff.20.2.225
24. Ouslander JG, Lamb G, Perloe M, et al. Potentially avoidable hospitalizations of nursing home residents: frequency, causes, and costs. J Am Geriatr Soc. 2010;58(4):627-635. https://doi.org/10.1111/j.1532-5415.2010.02768.x
25. Konetzka RT, Karon SL, Potter DEB. Users of Medicaid home and community-based services are especially vulnerable to costly avoidable hospital admissions. Health Aff (Millwood). 2012;31(6):1167-1175. https://doi.org/10.1377/hlthaff.2011.0902
26. Nyweide DJ, Anthony DL, Bynum JPW, et al. Continuity of care and the risk of preventable hospitalization in older adults. JAMA Intern Med. 2013;173(20):1879-1885. https://doi.org/10.1001/jamainternmed.2013.10059
27. Auerbach AD, Kripalani S, Vasilevskis EE, et al. Preventability and causes of readmissions in a national cohort of general medicine patients. JAMA Intern Med. 2016;176(4):484-493. https://doi.org/10.1001/jamainternmed.2015.7863
28. Birkmeyer JD, Barnato A, Birkmeyer N, Bessler R, Skinner J. The impact of the COVID-19 pandemic on hospital admissions in the United States. Health Aff (Millwood). 2020;39(11):2010-2017. https://doi.org/10.1377/hlthaff.2020.00980
29. Nundy S, Patel KK. Hospital-at-home to support COVID-19 surge—time to bring down the walls? JAMA Health Forum. 2020;1(5):e200504. https://doi.org/10.1001/jamahealthforum.2020.0504
30. Keohane LM, Stevenson DG, Freed S, Thapa S, Stewart L, Buntin MB. Trends in Medicare fee-for-service spending growth for dual-eligible beneficiaries, 2007–15. Health Aff (Millwood). 2018;37(8):1265-1273. https://doi.org/10.1377/hlthaff.2018.0143
31. Freed M, Biniek JF, Damico A, Neuman T. Medicare Advantage in 2021: enrollment update and key trends. June 21, 2021. Accessed August 13, 2021. https://www.kff.org/medicare/issue-brief/medicare-advantage-in-2021-enrollment-update-and-key-trends/
32. Li Q, Rahman M, Gozalo P, Keohane LM, Gold MR, Trivedi AN. Regional variations: the use of hospitals, home health, and skilled nursing in traditional Medicare and Medicare Advantage. Health Aff (Millwood). 2018;37(8):1274-1281. https://doi.org/10.1377/hlthaff.2018.0147
The rate of inpatient admissions among adults aged 65 years and older has decreased by approximately 25% since 2000.1,2 This long-term trend raises important questions about inpatient-related spending in the traditional Medicare program for hospitals and providers who treat beneficiaries after a hospitalization. As traditional Medicare’s most expensive sector (accounting for 21% of all Medicare spending3), reducing hospitalizations is often championed as an opportunity to moderate Medicare spending growth.
Medicare’s ability to achieve significant savings from declining inpatient use may be tempered by a shift toward more expensive hospitalizations. If marginal hospitalizations among healthier beneficiaries are avoided, then the remaining inpatient users may be sicker and have greater spending per hospitalization and greater need for follow-up services. This study examines trends in Medicare spending related to episodes initiated by an inpatient stay because of its importance to overall Medicare spending and the implications for several Medicare value-based payment initiatives. In care models seeking to contain spending at a population level, such as accountable care organizations and managed care plans, reducing inpatient use and associated services may have the largest impact in curbing overall spending growth per beneficiary. Other models focused on spending at an episode level, including bundled payment initiatives, may face challenges if inpatient episodes become more expensive over time.
As Medicare shifts toward value-based payments, hospitalists and other hospital leaders are often involved in redesigning care delivery models for the hospital or accountable care organization (eg, through readmission reduction initiatives, post–acute care coordination, and bundled-care delivery programs). Not all savings strategies rely on providers to change how services are delivered; Medicare can modify payment rates, such as Affordable Care Act provisions that slowed how quickly Medicare payment rates increased.4 For clinicians to navigate the shift toward new payment models, it is important to recognize how each of these elements—declining hospital admissions, spending per inpatient episode, and payment rates—affect spending trends for inpatient services and associated care. Previous articles on overall Medicare inpatient spending have examined inpatient stays alone5 or focused mainly on spending per episode6,7 without quantifying how these elements contributed to overall episode-related Medicare spending per beneficiary. This article addresses this gap by demonstrating how inpatient-related spending trends reflect each component.
This study examined trends in Medicare’s spending on inpatient episodes during the years 2009 to 2017. We described changes in the volume and spending on inpatient-initiated episodes across several dimensions, including beneficiary-level and hospitalization-level factors. We examined whether declines in spending associated with fewer inpatient-initiated episodes have been offset by increased spending per episode and how spending would have differed without changes in Medicare payment rates.
Episode Definition
We constructed an episode measure that captured traditional Medicare spending for 30 days prior to hospital admission, hospitalization duration, and 90 days following hospital discharge (additional details in the Appendix).
Any acute hospitalization triggered a new episode, with one exception: if a beneficiary was discharged and readmitted within 90 days for the same diagnosis-related group (DRG), then the readmission did not trigger a new episode. The spending for that readmission was attributed to the prior hospital stay. In effect, the annual number of episodes is equivalent to the annual number of hospital admissions minus subsequent rehospitalizations for the same DRG. Neither observation stays nor hospitalizations in inpatient rehabilitation, psychiatric, or long-term facilities were considered acute hospital admissions.
We assigned claims from noninpatient sectors to an episode based on whether the claim start date fell within the episode window. All traditional Medicare sectors were measured, including outpatient services, physician claims, post–acute care services, and Medicare Part D prescription drug events.
Our analysis aimed to measure all spending related to inpatient episodes without double-counting spending for overlapping episodes. If episodes overlapped, then spending for overlapping days was weighted to be evenly divided across episodes.
Outcome Measures
The study’s main outcomes summarized episode trends across the entire traditional Medicare population, including beneficiaries without an episode, in annual mean number of episodes per beneficiary and annual mean episode-related spending per beneficiary. The denominator of these measures is person-years, or total number of beneficiary months with Medicare Part A and B coverage divided by 12. The annual mean number of episodes per beneficiary is the total number of episodes initiated in a calendar year divided by person-years. The annual mean episode-related spending per beneficiary is the total amount of spending attributed to episodes divided by person-years. We also measured annual mean spending per episode, or total amount of spending attributed to episodes divided by the total number of episodes.
Medicare annually updates each sector’s payment rates for several factors, including inflation. We constructed an index for each sector to adjust for these annual payment rate changes. We also accounted for sequestration measures in effect since April 2013 that reduced Medicare payments to all sectors by 2%. We report our spending measures twice, with and without adjusting for changes in payment rates. Adjusted numbers reflect payment rates in effect in 2015.
Analysis Approach
We present annual trends on changes in the number of inpatient episodes per beneficiary, mean episode-related spending per beneficiary, and mean spending per episode. To quantify how changes in episode-related spending per beneficiary reflect changes in the number of episodes per beneficiary vs changes in spending per episode, we modified an approach implemented by Rosen and colleagues.8
To better understand which beneficiaries have declining inpatient use, we performed stratified analyses describing changes in the number of episodes per beneficiary between 2009 and 2017, spending per episode, and total episode-related spending per beneficiary. We report these measures for several subpopulations defined by age, sex, race, dual-eligible status, and whether the beneficiary used long-term nursing home services during the episode’s calendar year. Descriptive statistics also detail how these measures changed between 2009 and 2017 for episodes stratified by characteristics of the index hospital stay: planned vs unplanned, medical vs surgical, and any use of intensive care unit (ICU) or coronary care unit services. We also stratify study measures by whether an episode included any use of post–acute care services (skilled nursing facility, home health, or inpatient rehabilitation facility use). Finally, we aggregate the episodes into major diagnostic categories (MDCs) based on the index hospital stay’s DRG to report study outcomes by condition. Because of a shift in coding hospitalizations for pneumonia as sepsis,9,10 we exclude these two diseases from their respective MDCs and analyze them jointly as a unique category.
RESULTS
Changes in Number of Inpatient Episodes and Related Spending
From 2009 to 2017, the number of inpatient episodes per 1000 traditional Medicare beneficiaries declined from 326 to 267 (Table 1), or a relative decline of 18.2% (Figure 1). The total volume of inpatient episodes declined by only 13.4%, from 10.2 million to 8.8 million, reflecting that the size of the traditional Medicare population grew during these years. Over the same years, mean payment-rate–adjusted spending per episode increased 11.4% from $20,891 to $23,273.
When considering overall episode-related spending, the large decline in the volume of episodes outweighed increased spending per episode: the mean amount of episode-related Medicare spending per beneficiary decreased 8.9% from $6810 to $6206 (Table 1), or a net change of $604 (Figure 2). This net change reflects decreased spending due to fewer episodes per beneficiary ($1239 reduction in episode-related spending) offset by increased spending per episode (translating to a $776 increase in episode-related spending per beneficiary).
When these estimates are calculated separately for the inpatient sector and all other sectors, the inpatient sector experienced small increases in spending associated with greater spending per episode ($304) compared with noninpatient sectors ($472). Accordingly, the inpatient sector had a larger net decline in episode-related spending per beneficiary ($420) than noninpatient sectors ($184) after taking into account declining episode volume.
As expected, episode-related spending increased more when measures were not adjusted for annual payment rate increases. Without such adjustment, mean spending per episode increased 25.5%, and episode-related spending per beneficiary was nearly flat (2.6% between 2009 and 2017 [Figure 1]). The decline in unadjusted spending associated with fewer episodes ($1138) was offset by the spending increase associated with higher spending per episode ($1592) (Figure 2).
Analyses Stratified by Beneficiary Characteristics
Every population examined had declines in the number of inpatient episodes, even beneficiaries with more frequent inpatient use (Table 2). Among Medicare beneficiaries aged 85 years and older, the mean number of episodes per 1000 beneficiaries declined by 12.7%, from 524 to 457. Populations with less frequent inpatient use often experienced larger relative declines in number of episodes than populations with more frequent inpatient use. For example, the mean number of episodes per 1000 beneficiaries decreased by 17.7% for beneficiaries without nursing home use (306 to 252), as compared with an 8.1% decline for beneficiaries with nursing home use (from 888 to 816). In contrast, populations with less frequent inpatient use had larger relative increases in spending per episode with adjustment for payment rate changes. For example, spending per episode increased by 13.1% for beneficiaries aged 65 to 74 years ($20,904 to $23,644), but only by 8.6% for beneficiaries 85 years and older ($20,384 to $22,138).
Analyses Stratified by Service Use Characteristics
Some types of inpatient episodes had larger declines in the number of episodes, including episodes with planned admissions for the index hospital stay (28.8% decline from 68 to 48 episodes per 1000 beneficiaries) and episodes without post–acute care use (23.9% decline from 169 to 129 episodes per 1000 beneficiaries) (Appendix Table). In contrast, declines in the number of episodes were similar for index hospital admissions that did or did not involve ICU use (17.8% and 18.3% reduction in mean number of episodes per 1000 beneficiaries, respectively) or that included a surgical procedure or not (17.1% versus 18.6%, respectively). Several types of inpatient episodes had larger increases in spending per episode, such as a 15.1% increase for planned admissions and a 13.2% increase for hospitalizations without ICU use.
According to diagnosis information for an episode’s index hospital stay, inpatient episodes related to conditions affecting the circulatory system had the largest decline in mean number of episodes, decreasing by 31.8% from 78 to 53 episodes per 1000 beneficiaries (Appendix Table). Episodes for other diseases had much smaller declines in volume. Admissions for diagnoses of pneumonia or sepsis had notable increases in the volume of episodes, increasing by 20.7% from 25 to 30 admissions per 1000 beneficiaries.
DISCUSSION
Medicare spending per beneficiary on inpatient episodes, including services provided pre- and post hospitalization, declined by 8.9% from 2009 to 2017 after adjusting for payment rate changes. This decline reflects two components. First, the number of episodes per 1000 beneficiaries declined by 18.2%. Although the extent of this decrease varied across populations, every group examined had declines in inpatient use. In particular, hospitalizations for conditions affecting the circulatory system, such as heart attacks and cardiac procedures, decreased. Second, as inpatient volume declined, spending per episode increased by 11.4% to an average of $23,273 in 2017. This increase in spending per episode offset how much overall Medicare spending on episode-related care declined.
Medicare is increasingly challenging hospitals to demonstrate the value of inpatient services and associated treatment, which requires hospital leaders to recognize how their facilities’ spending trends relate to these national patterns. Understanding how much national episode-related spending has decreased over time with declining inpatient volume can help an accountable care organization evaluate whether it is feasible to achieve significant savings by reducing hospitalizations. Bundled payment providers focused on managing spending per episode can benefit from identifying which types of hospitalizations have increased spending per episode, especially for certain diagnoses.
These results also highlight the continued importance of a perennial factor in Medicare spending: payment rates. If Medicare payment rates had not increased over our study period, Medicare spending per inpatient episode would have increased by only 11%. Actual Medicare spending per episode increased by 25%, demonstrating that over half of the relative increase in spending per episode reflected increases in Medicare’s payment rates.
Increased spending per episode, even after adjustment for payment rate changes, suggests that services provided during an episode have increased in intensity or shifted toward higher-cost treatments.
When interpreting these trends, several points are notable. The underlying health of the Medicare population may contribute to declining inpatient use but is difficult to quantify. The observed decline in cardiac-related hospitalizations is consistent with evidence that the impact of ischemic heart disease, the leading source of disease or injury in the US population, has dramatically declined over recent decades15 and that the Medicare program has experienced large declines in overall spending and use related to cardiac conditions.16-18
Other potential factors include a shift toward hospitals treating Medicare beneficiaries as outpatients during an observation stay instead of admitting them as inpatients. Observation stays have increased as traditional Medicare implemented measures to penalize readmissions and limit payments for short inpatient stays.19-21 Even so, the increase in observation stays would have to be at least three times as large as described in other work to fully substitute for the decrease in inpatient stays: between the years 2007 and 2018, the number of observation stays per 1000 beneficiaries increased by only 26 stays, whereas the number of hospitalizations per 1000 beneficiaries decreased by 83 hospitalizations.20
Outpatient services may also broaden treatment availability in alternative settings or enable beneficiaries to avoid inpatient treatment with appropriate preventative care.22-27 These considerations are even more relevant as the COVID-19 pandemic spurred reduced admissions and shifted acute services outside of hospitals.28,29 Some services, such as elective surgeries, have probably shifted from an inpatient to an outpatient setting, which would be consistent with our finding that there are larger relative declines in planned hospitalizations. Although this analysis does not capture spending for outpatient services that are not linked to an inpatient admission, prior work demonstrates that annual growth in total Medicare spending per beneficiary (episode related or not) has recently declined for the inpatient sector but increased for outpatient and physician sectors.30 By offering other outpatient services, hospitals may be able to recoup some declining inpatient revenues. However, outpatient services are reimbursed at a lower rate than inpatient services, suggesting these trends may create financial pressure for hospitals.
There are several limitations to our analysis. First, our analysis is not designed to uncover the reason for the shift away from inpatient services nor to analyze how it has affected beneficiaries’ overall quality of care.
CONCLUSION
Over an 8-year period, Medicare spending per beneficiary on inpatient episodes, including all services immediately preceding and following hospitalizations, declined by 8.9% after taking into account payment rate increases. This broad shift away from inpatient services among all Medicare beneficiaries suggests policymakers should aim for payment policies that balance financial sustainability for hospitals and associated facilities with more efficient use of inpatient and related services.
Acknowledgments
The authors thank Sunita Thapa, Lucas Stewart, Christine Lai, and Liliana Podczerwinski for contributions in data analysis and manuscript preparation.
1. Sun R, Karaca Z, Wong HS. Trends in hospital inpatient stays by age and payer, 2000-2015: Statistical Brief #235. In: Healthcare Cost and Utilization Project (HCUP) Statistical Briefs. Agency for Healthcare Research and Quality; 2006.
2. HCUP Fast Stats - trends in inpatient stays. Healthcare Cost and Utilization Project (HCUP). April 2021. Accessed August 29, 2021. www.hcup-us.ahrq.gov/faststats/national/inpatienttrends.jsp
3. The Medicare Payment Advisory Commission. Section 1: National health care and Medicare spending. In: A Data Book: Health Care Spending and the Medicare Program. June 2018. Accessed August 13, 2021. http://www.medpac.gov/docs/default-source/data-book/jun18_databooksec1_sec.pdf
4. Buntin MB, Graves JA. How the ACA dented the cost curve. Health Aff (Millwood). 2020;39(3):403-412. https://doi.org/10.1377/hlthaff.2019.01478
5. Krumholz HM, Nuti SV, Downing NS, Normand SLT, Wang Y. Mortality, hospitalizations, and expenditures for the Medicare population aged 65 years or older, 1999-2013. JAMA. 2015;314(4):355-365. https://doi.org/10.1001/jama.2015.8035
6. Chen LM, Norton EC, Banerjee M, Regenbogen SE, Cain-Nielsen AH, Birkmeyer JD. Spending on care after surgery driven by choice of care settings instead of intensity of services. Health Aff (Millwood). 2017;36(1):83-90. https://doi.org/10.1377/hlthaff.2016.0668
7. Ibrahim AM, Nuliyalu U, Lawton EJ, et al. Evaluation of US hospital episode spending for acute inpatient conditions after the Patient Protection and Affordable Care Act. JAMA Netw Open. 2020;3(11):e2023926. https://doi.org/10.1001/jamanetworkopen.2020.23926
8. Rosen A, Aizcorbe A, Ryu AJ, Nestoriak N, Cutler DM, Chernew ME. Policy makers will need a way to update bundled payments that reflects highly skewed spending growth of various care episodes. Health Aff (Millwood). 2013;32(5):944-951. https://doi.org/10.1377/hlthaff.2012.1246
9. Lindenauer PK, Lagu T, Shieh MS, Pekow PS, Rothberg MB. Association of diagnostic coding with trends in hospitalizations and mortality of patients with pneumonia, 2003-2009. JAMA. 2012;307(13):1405-1413. https://doi.org/10.1001/jama.2012.384
10. Buntin MB, Lai C, Podczerwinski L, Poon S, Wallis C. Changing diagnosis patterns are increasing Medicare spending for inpatient hospital services. The Commonwealth Fund. April 28, 2021. Accessed August 13, 2021. https://www.commonwealthfund.org/publications/2021/apr/changing-diagnosis-patterns-are-increasing-medicare-spending-inpatient
11. The Medicare Payment Advisory Commission. Hospital inpatient and outpatient services. In: Report to the Congress: Medicare Payment Policy. . March 2018. Accessed August 13, 2021. http://www.medpac.gov/docs/default-source/reports/mar18_medpac_ch3_sec.pdf?sfvrsn=0
12. Ody C, Msall L, Dafny LS, Grabowski DC, Cutler DM. Decreases In readmissions credited to Medicare’s program to reduce hospital readmissions have been overstated. Health Aff (Millwood). 2019;38(1):36-43. https://doi.org/10.1377/hlthaff.2018.05178
13. Dharmarajan K, Qin L, Lin Z, et al. Declining admission rates and thirty-day readmission rates positively associated even though patients grew sicker over time. Health Aff (Millwood). 2016;35(7):1294-1302. https://doi.org/10.1377/hlthaff.2015.1614
14. Sjoding MW, Prescott HC, Wunsch H, Iwashyna TJ, Cooke CR. Longitudinal changes in ICU admissions among elderly patients in the United States. Crit Care Med. 2016;44(7):1353-1360. https://doi.org/10.1097/CCM.0000000000001664
15. Murray CJ, Atkinson C, Bhalla K, et al. The state of US health, 1990-2010: burden of diseases, injuries, and risk factors. JAMA. 2013;310(6):591-608. https://doi.org/10.1001/jama.2013.13805
16. Cutler DM, Ghosh K, Messer KL, Raghunathan TE, Stewart ST, Rosen AB. Explaining the slowdown in medical spending growth among the elderly, 1999-2012. Health Aff (Millwood). 2019;38(2):222-229. https://doi.org/10.1377/hlthaff.2018.05372
17. Ward MJ, Kripalani S, Zhu Y, et al. Incidence of emergency department visits for ST-elevation myocardial infarction in a recent six-year period in the United States. Am J Cardiol. 2015;115(2):167-170. https://doi.org/10.1016/j.amjcard.2014.10.020
18. Keohane LM, Gambrel RJ, Freed SS, Stevenson D, Buntin MB. Understanding trends in Medicare spending, 2007-2014. Health Serv Res. 2018;53(5):3507-3527. https://doi.org/10.1111/1475-6773.12845
19. Nuckols TK, Fingar KR, Barrett M, Steiner CA, Stocks C, Owens PL. The shifting landscape in utilization of inpatient, observation, and emergency department services across payers. J Hosp Med. 2017;12(6):443-446. https://doi.org/10.12788/jhm.2751
20. Poon SJ, Wallis CJ, Lai P, Podczerwinski L, Buntin MB. Medicare two-midnight rule accelerated shift to observation stays. Health Affairs. In press.
21. Sheehy AM, Kaiksow F, Powell WR, et al. The Hospital Readmissions Reduction Program and observation hospitalizations. J Hosp Med. 2021;16(7):409-411. https://doi.org/10.12788/jhm.3634
22. Culler SD, Parchman ML, Przybylski M. Factors related to potentially preventable hospitalizations among the elderly. Med Care. 1998;36(6):804-817. https://doi.org/10.1097/00005650-199806000-00004
23. Kozak LJ, Hall MJ, Owings MF. Trends in avoidable hospitalizations, 1980-1998. Health Aff (Millwood). 2001;20(2):225-232. https://doi.org/10.1377/hlthaff.20.2.225
24. Ouslander JG, Lamb G, Perloe M, et al. Potentially avoidable hospitalizations of nursing home residents: frequency, causes, and costs. J Am Geriatr Soc. 2010;58(4):627-635. https://doi.org/10.1111/j.1532-5415.2010.02768.x
25. Konetzka RT, Karon SL, Potter DEB. Users of Medicaid home and community-based services are especially vulnerable to costly avoidable hospital admissions. Health Aff (Millwood). 2012;31(6):1167-1175. https://doi.org/10.1377/hlthaff.2011.0902
26. Nyweide DJ, Anthony DL, Bynum JPW, et al. Continuity of care and the risk of preventable hospitalization in older adults. JAMA Intern Med. 2013;173(20):1879-1885. https://doi.org/10.1001/jamainternmed.2013.10059
27. Auerbach AD, Kripalani S, Vasilevskis EE, et al. Preventability and causes of readmissions in a national cohort of general medicine patients. JAMA Intern Med. 2016;176(4):484-493. https://doi.org/10.1001/jamainternmed.2015.7863
28. Birkmeyer JD, Barnato A, Birkmeyer N, Bessler R, Skinner J. The impact of the COVID-19 pandemic on hospital admissions in the United States. Health Aff (Millwood). 2020;39(11):2010-2017. https://doi.org/10.1377/hlthaff.2020.00980
29. Nundy S, Patel KK. Hospital-at-home to support COVID-19 surge—time to bring down the walls? JAMA Health Forum. 2020;1(5):e200504. https://doi.org/10.1001/jamahealthforum.2020.0504
30. Keohane LM, Stevenson DG, Freed S, Thapa S, Stewart L, Buntin MB. Trends in Medicare fee-for-service spending growth for dual-eligible beneficiaries, 2007–15. Health Aff (Millwood). 2018;37(8):1265-1273. https://doi.org/10.1377/hlthaff.2018.0143
31. Freed M, Biniek JF, Damico A, Neuman T. Medicare Advantage in 2021: enrollment update and key trends. June 21, 2021. Accessed August 13, 2021. https://www.kff.org/medicare/issue-brief/medicare-advantage-in-2021-enrollment-update-and-key-trends/
32. Li Q, Rahman M, Gozalo P, Keohane LM, Gold MR, Trivedi AN. Regional variations: the use of hospitals, home health, and skilled nursing in traditional Medicare and Medicare Advantage. Health Aff (Millwood). 2018;37(8):1274-1281. https://doi.org/10.1377/hlthaff.2018.0147
© 2021 Society of Hospital Medicine
Duration of Adalimumab Therapy in Hidradenitis Suppurativa With and Without Oral Immunosuppressants
To the Editor:
The tumor necrosis factor α inhibitor adalimumab is the only US Food and Drug Administration–approved treatment of hidradenitis suppurativa (HS). Although 50.6% of patients fulfilled Hidradenitis Suppurativa Clinical Response criteria with adalimumab at 12 weeks, many responders were not satisfied with their disease control, and secondary loss of Hidradenitis Suppurativa Clinical Response fulfillment occurred in 15.9% of patients within approximately 3 years.1 Without other US Food and Drug Administration–approved HS treatments, some dermatologists have combined adalimumab with methotrexate (MTX) and/or mycophenolate mofetil (MMF) to attempt to increase the duration of satisfactory disease control while on adalimumab. Combining tumor necrosis factor α inhibitors with oral immunosuppressants is a well-established approach in psoriasis, psoriatic arthritis, and inflammatory bowel disease; however, to the best of our knowledge, this approach has not been studied for HS.2,3
To assess whether there is a role for combining adalimumab with MTX and/or MMF in the treatment of HS, we performed a single-institution retrospective chart review at the University of Connecticut Department of Dermatology to determine whether patients receiving combination therapy stayed on adalimumab longer than those who received adalimumab monotherapy. All patients receiving adalimumab for the treatment of HS with at least 1 follow-up visit 3 or more months after treatment initiation were included. Duration of treatment with adalimumab was defined as the length of time between initiation and termination of adalimumab, regardless of flares, adverse events, or addition of adjuvant therapy that occurred during this time span. Because standardized rating scales measuring the severity of HS at this time are not recorded routinely at our institution, treatment duration with adalimumab was used as a surrogate for measuring therapeutic success. Additionally, treatment duration is a meaningful end point, as patients with HS may require indefinite treatment. Patients were eligible for inclusion if they were receiving adalimumab for the treatment of HS. Patients were excluded if they were lost to follow-up or had received adalimumab for less than 6 months, as data suggest that biologics do not reach peak effect for up to 6 months in HS.4
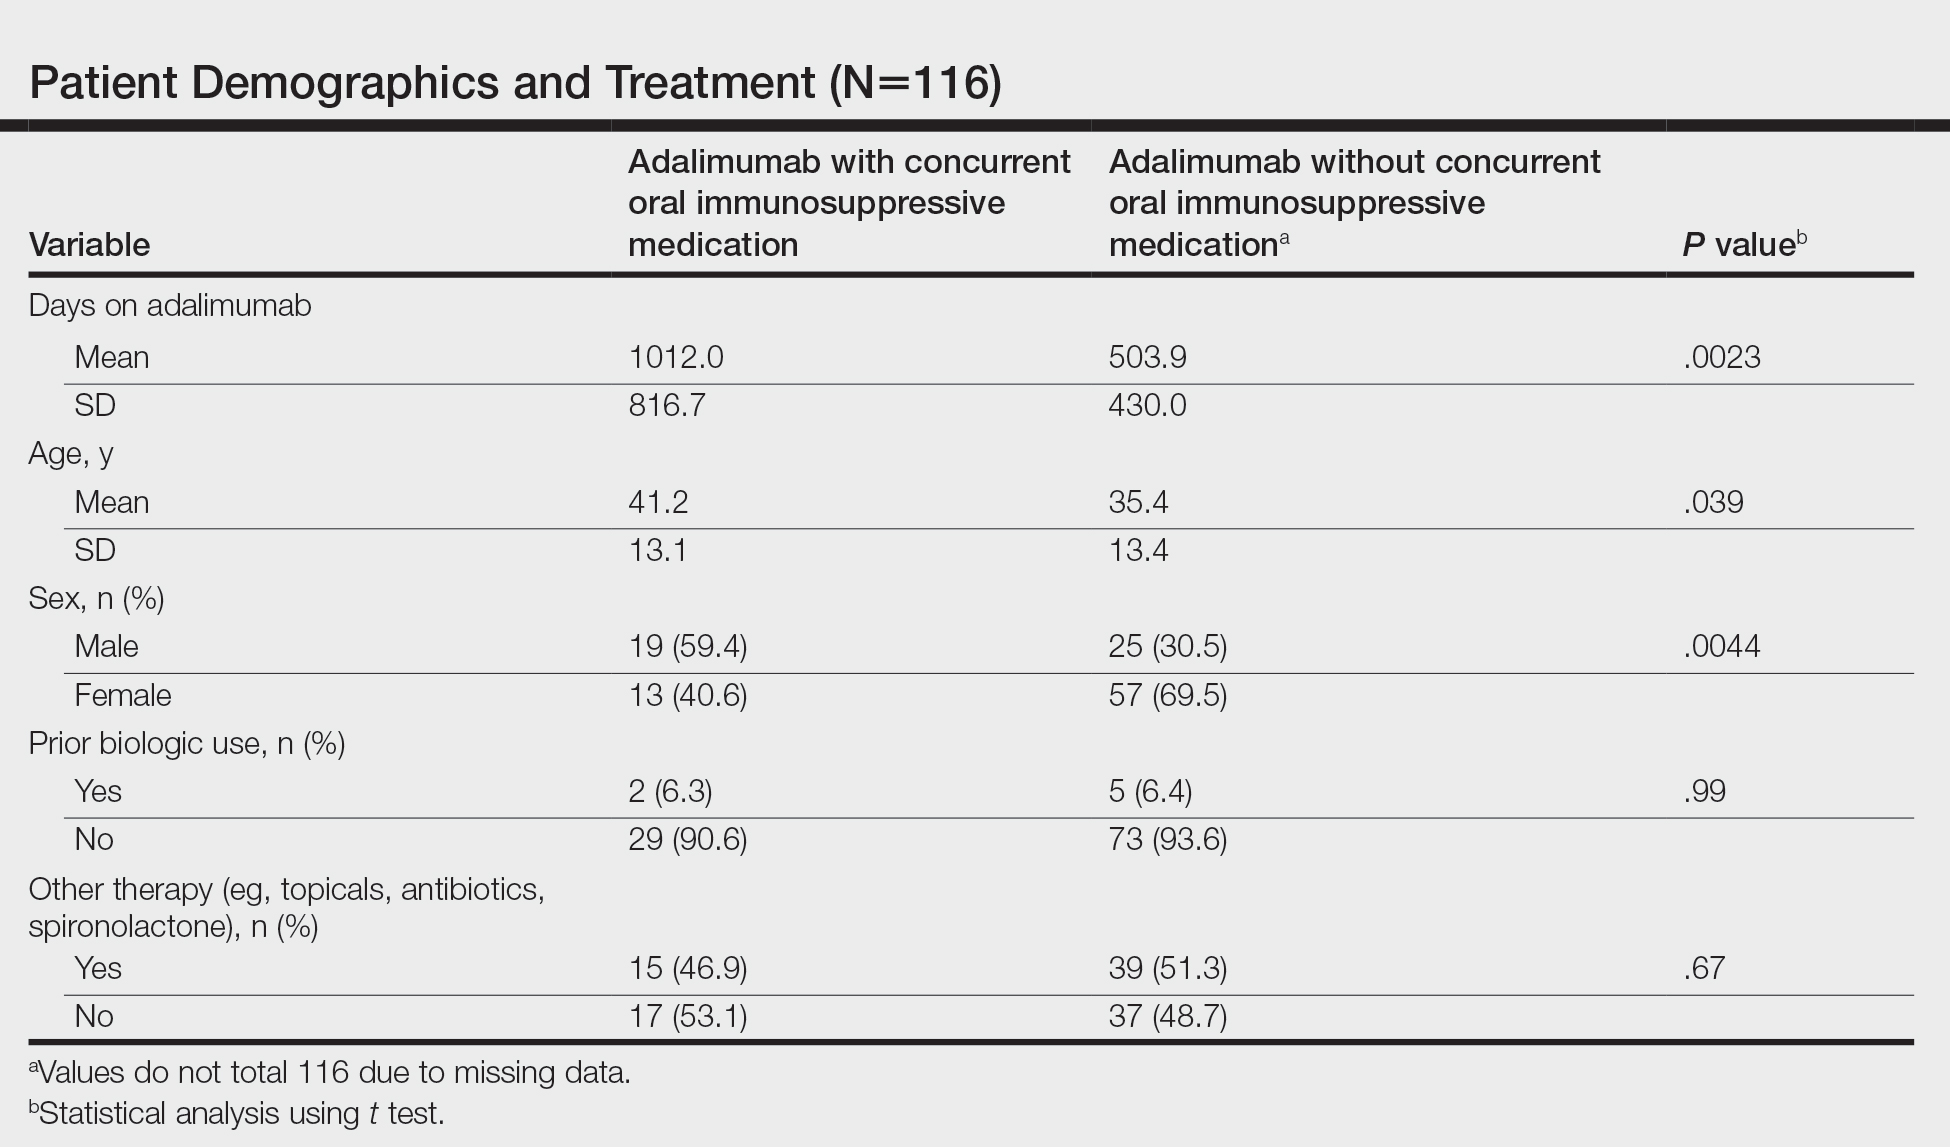
We identified 116 eligible patients with HS, 32 of whom received combination therapy. Five patients received 40 mg of adalimumab every other week, and 111 patients received 40 mg of adalimumab each week. Patients receiving oral immunosuppressants were more likely to be male and as likely to be biologic naïve compared to patients on monotherapy (Table). The average weekly dose of MTX was 14.63 mg, and the average daily dose of MMF was 1000 mg. The average number of days between starting adalimumab and starting an oral immunosuppressant was 114.5 (SD, 217; median, 0) days. Reasons for discontinuation of adalimumab included insufficient response, noncompliance, dislike of injections, adverse events, fear of adverse events, other medical issues unrelated to HS, and insurance coverage issues. Patients who ended treatment with adalimumab owing to insurance coverage issues were still included in our study because insurance coverage remains a major determinant of treatment choice in HS and is relevant to the dynamics of medical decision-making.
Statistical analysis was conducted on all patients inclusive of any reason for discontinuation to avoid bias in the calculation of treatment duration. Cox regression analysis was conducted for all independent variables and was noncontributory. Kaplan-Meier methodology was used to assess the duration of treatment of adalimumab with and without concomitant oral immunosuppressants, and quartile survival times were calculated. Quartile survival time is the time point after adalimumab initiation at which 25% of patients have discontinued adalimumab. We chose quartile survival time instead of average treatment duration to adequately power this study, given our small patient pool.
Although patients receiving adalimumab with oral immunosuppressants had a longer quartile treatment duration (450 days; 95% CI, 185-1800) than the group without oral immunosuppressants (360 days; 95% CI, 200-700), neither MTX nor MMF was shown to significantly prolong duration of therapy with adalimumab (log-rank test: P=.12). Additionally, patients receiving combination therapy were just as likely to discontinue adalimumab as those on monotherapy (χ2 test: P=.93). Patients who took both MTX and MMF at different times did show a statistically significant increase in adalimumab quartile treatment duration (1710 days; 95% CI, 1620 [upper limit not calculable]), but this is likely because these patients were kept on adalimumab while trialing adjunctive medications.
The results of our study indicate that MTX and MMF do not prolong duration of adalimumab therapy, which suggests that adalimumab combination therapy with MTX and MMF may not improve HS more than adalimumab alone, and/or partial responders to adalimumab monotherapy are unlikely to be converted to satisfactory responders with the addition of oral immunosuppressants. Limitations of our study include that it was retrospective, used treatment duration as a surrogate for objective efficacy measures, and relied on a single-institution data source. Additionally, owing to our small sample size, we were unable to account for certain potential confounders, including patient weight and insurance status. Future controlled prospective studies using objective end points are needed to further elucidate whether oral immunosuppressants have a role as an adjunct in the treatment of HS.
- Zouboulis CC, Okun MM, Prens EP, et al. Long-term adalimumab efficacy in patients with moderate-to-severe hidradenitis suppurativa/acne inversa: 3-year results of a phase 3 open-label extension study. J Am Acad Dermatol. 2019;80:60-69.e2. doi:10.1016/j.jaad.2018.05.040
- Menter A, Strober BE, Kaplan DH, et al. Joint AAD-NPF guidelines of care for the management and treatment of psoriasis with biologics. J Am Acad Dermatol. 2019;80:1029-1072. doi:10.1016/j.jaad.2018.11.057
- Sultan KS, Berkowitz JC, Khan S. Combination therapy for inflammatory bowel disease. World J Gastrointest Pharmacol Ther. 2017;8:103-113. doi:10.4292/wjgpt.v8.i2.103
- Prussick L, Rothstein B, Joshipura D, et al. Open-label, investigator-initiated, single-site exploratory trial evaluating secukinumab, an anti-interleukin-17A monoclonal antibody, for patients with moderate-to-severe hidradenitis suppurativa. Br J Dermatol. 2019;181:609-611.
To the Editor:
The tumor necrosis factor α inhibitor adalimumab is the only US Food and Drug Administration–approved treatment of hidradenitis suppurativa (HS). Although 50.6% of patients fulfilled Hidradenitis Suppurativa Clinical Response criteria with adalimumab at 12 weeks, many responders were not satisfied with their disease control, and secondary loss of Hidradenitis Suppurativa Clinical Response fulfillment occurred in 15.9% of patients within approximately 3 years.1 Without other US Food and Drug Administration–approved HS treatments, some dermatologists have combined adalimumab with methotrexate (MTX) and/or mycophenolate mofetil (MMF) to attempt to increase the duration of satisfactory disease control while on adalimumab. Combining tumor necrosis factor α inhibitors with oral immunosuppressants is a well-established approach in psoriasis, psoriatic arthritis, and inflammatory bowel disease; however, to the best of our knowledge, this approach has not been studied for HS.2,3
To assess whether there is a role for combining adalimumab with MTX and/or MMF in the treatment of HS, we performed a single-institution retrospective chart review at the University of Connecticut Department of Dermatology to determine whether patients receiving combination therapy stayed on adalimumab longer than those who received adalimumab monotherapy. All patients receiving adalimumab for the treatment of HS with at least 1 follow-up visit 3 or more months after treatment initiation were included. Duration of treatment with adalimumab was defined as the length of time between initiation and termination of adalimumab, regardless of flares, adverse events, or addition of adjuvant therapy that occurred during this time span. Because standardized rating scales measuring the severity of HS at this time are not recorded routinely at our institution, treatment duration with adalimumab was used as a surrogate for measuring therapeutic success. Additionally, treatment duration is a meaningful end point, as patients with HS may require indefinite treatment. Patients were eligible for inclusion if they were receiving adalimumab for the treatment of HS. Patients were excluded if they were lost to follow-up or had received adalimumab for less than 6 months, as data suggest that biologics do not reach peak effect for up to 6 months in HS.4
We identified 116 eligible patients with HS, 32 of whom received combination therapy. Five patients received 40 mg of adalimumab every other week, and 111 patients received 40 mg of adalimumab each week. Patients receiving oral immunosuppressants were more likely to be male and as likely to be biologic naïve compared to patients on monotherapy (Table). The average weekly dose of MTX was 14.63 mg, and the average daily dose of MMF was 1000 mg. The average number of days between starting adalimumab and starting an oral immunosuppressant was 114.5 (SD, 217; median, 0) days. Reasons for discontinuation of adalimumab included insufficient response, noncompliance, dislike of injections, adverse events, fear of adverse events, other medical issues unrelated to HS, and insurance coverage issues. Patients who ended treatment with adalimumab owing to insurance coverage issues were still included in our study because insurance coverage remains a major determinant of treatment choice in HS and is relevant to the dynamics of medical decision-making.
Statistical analysis was conducted on all patients inclusive of any reason for discontinuation to avoid bias in the calculation of treatment duration. Cox regression analysis was conducted for all independent variables and was noncontributory. Kaplan-Meier methodology was used to assess the duration of treatment of adalimumab with and without concomitant oral immunosuppressants, and quartile survival times were calculated. Quartile survival time is the time point after adalimumab initiation at which 25% of patients have discontinued adalimumab. We chose quartile survival time instead of average treatment duration to adequately power this study, given our small patient pool.
Although patients receiving adalimumab with oral immunosuppressants had a longer quartile treatment duration (450 days; 95% CI, 185-1800) than the group without oral immunosuppressants (360 days; 95% CI, 200-700), neither MTX nor MMF was shown to significantly prolong duration of therapy with adalimumab (log-rank test: P=.12). Additionally, patients receiving combination therapy were just as likely to discontinue adalimumab as those on monotherapy (χ2 test: P=.93). Patients who took both MTX and MMF at different times did show a statistically significant increase in adalimumab quartile treatment duration (1710 days; 95% CI, 1620 [upper limit not calculable]), but this is likely because these patients were kept on adalimumab while trialing adjunctive medications.
The results of our study indicate that MTX and MMF do not prolong duration of adalimumab therapy, which suggests that adalimumab combination therapy with MTX and MMF may not improve HS more than adalimumab alone, and/or partial responders to adalimumab monotherapy are unlikely to be converted to satisfactory responders with the addition of oral immunosuppressants. Limitations of our study include that it was retrospective, used treatment duration as a surrogate for objective efficacy measures, and relied on a single-institution data source. Additionally, owing to our small sample size, we were unable to account for certain potential confounders, including patient weight and insurance status. Future controlled prospective studies using objective end points are needed to further elucidate whether oral immunosuppressants have a role as an adjunct in the treatment of HS.
- Zouboulis CC, Okun MM, Prens EP, et al. Long-term adalimumab efficacy in patients with moderate-to-severe hidradenitis suppurativa/acne inversa: 3-year results of a phase 3 open-label extension study. J Am Acad Dermatol. 2019;80:60-69.e2. doi:10.1016/j.jaad.2018.05.040
- Menter A, Strober BE, Kaplan DH, et al. Joint AAD-NPF guidelines of care for the management and treatment of psoriasis with biologics. J Am Acad Dermatol. 2019;80:1029-1072. doi:10.1016/j.jaad.2018.11.057
- Sultan KS, Berkowitz JC, Khan S. Combination therapy for inflammatory bowel disease. World J Gastrointest Pharmacol Ther. 2017;8:103-113. doi:10.4292/wjgpt.v8.i2.103
- Prussick L, Rothstein B, Joshipura D, et al. Open-label, investigator-initiated, single-site exploratory trial evaluating secukinumab, an anti-interleukin-17A monoclonal antibody, for patients with moderate-to-severe hidradenitis suppurativa. Br J Dermatol. 2019;181:609-611.
Practice Points
- Adalimumab is the only medication approved by the US Food and Drug Administration for treatment of hidradenitis suppurativa (HS), yet many patients on adalimumab do not achieve satisfactory results. New treatment options are in demand for patients affected by HS.
- Although combining tumor necrosis factor α inhibitors with oral immunosuppressants such as methotrexate and mycophenolate mofetil appears to be beneficial in treating other conditions such as psoriasis, these treatments may not have as great a benefit for patients with HS.
Cutaneous Manifestations and Clinical Disparities in Patients Without Housing
More than half a million individuals are without housing (NWH) on any given night in the United States, as estimated by the US Department of Housing and Urban Development. 1 Lack of hygiene, increased risk of infection and infestation due to living conditions, and barriers to health care put these individuals at increased risk for disease. 2 Skin disease, including fungal infection and acne, are within the top 10 most prevalent diseases worldwide and can cause major psychologic impairment, yet dermatologic concerns and clinical outcomes in NWH patients have not been well characterized. 2-5 Further, because this vulnerable demographic tends to be underinsured, they frequently present to the emergency department (ED) for management of disease. 1,6 Survey of common concerns in NWH patients is of utility to consulting dermatologists and nondermatologist providers in the ED, who can familiarize themselves with management of diseases they are more likely to encounter. Few studies examine dermatologic conditions in the ED, and a thorough literature review indicates none have included homelessness as a variable. 6,7 Additionally, comparison with a matched control group of patients with housing (WH) is limited. 5,8 We present one of the largest comparisons of cutaneous disease in NWH vs WH patients in a single hospital system to elucidate the types of cutaneous disease that motivate patients to seek care, the location of skin disease, and differences in clinical care.
Methods
A retrospective medical record review of patients seen for an inclusive list of dermatologic diagnoses in the ED or while admitted at University Medical Center New Orleans, Louisiana (UMC), between January 1, 2018, and April 21, 2020, was conducted. This study was qualified as exempt from the institutional review board by Louisiana State University because it proposed zero risk to the patients and remained completely anonymous. Eight hundred forty-two total medical records were reviewed (NWH, 421; WH, 421)(Table 1). Patients with housing were matched based on self-identified race and ethnicity, sex, and age. Disease categories were constructed based on fundamental pathophysiology adapted from Dermatology9: infectious, noninfectious inflammatory, neoplasm, trauma and wounds, drug-related eruptions, vascular, pruritic, pigmented, bullous, neuropsychiatric, and other. Other included unspecified eruptions as well as miscellaneous lesions such as calluses. The current chief concern, anatomic location, and configuration were recorded, as well as biopsied lesions and outpatient referrals or inpatient consultations to dermatology or other specialties, including wound care, infectious disease, podiatry, and surgery. χ2 analysis was used to analyze significance of cutaneous categories, body location, and referrals. Groups smaller than 5 defaulted to the Fisher exact test.

Results
The total diagnoses (including both chief concerns and secondary diagnoses) are shown in Table 2. Chief concerns were more frequently cutaneous or dermatologic for WH (NWH, 209; WH, 307; P<.001). In both groups, cutaneous infectious etiologies were more likely to be a patient’s presenting chief concern (58% NWH, P=.002; 42% WH, P<.001). Noninfectious inflammatory etiologies and pigmented lesions were more likely to be secondary diagnoses with an unrelated noncutaneous concern; noninfectious inflammatory etiologies were only 16% of the total cutaneous chief concerns (11% NWH, P=.04; 20% WH, P=.03), and no pigmented lesions were chief concerns.
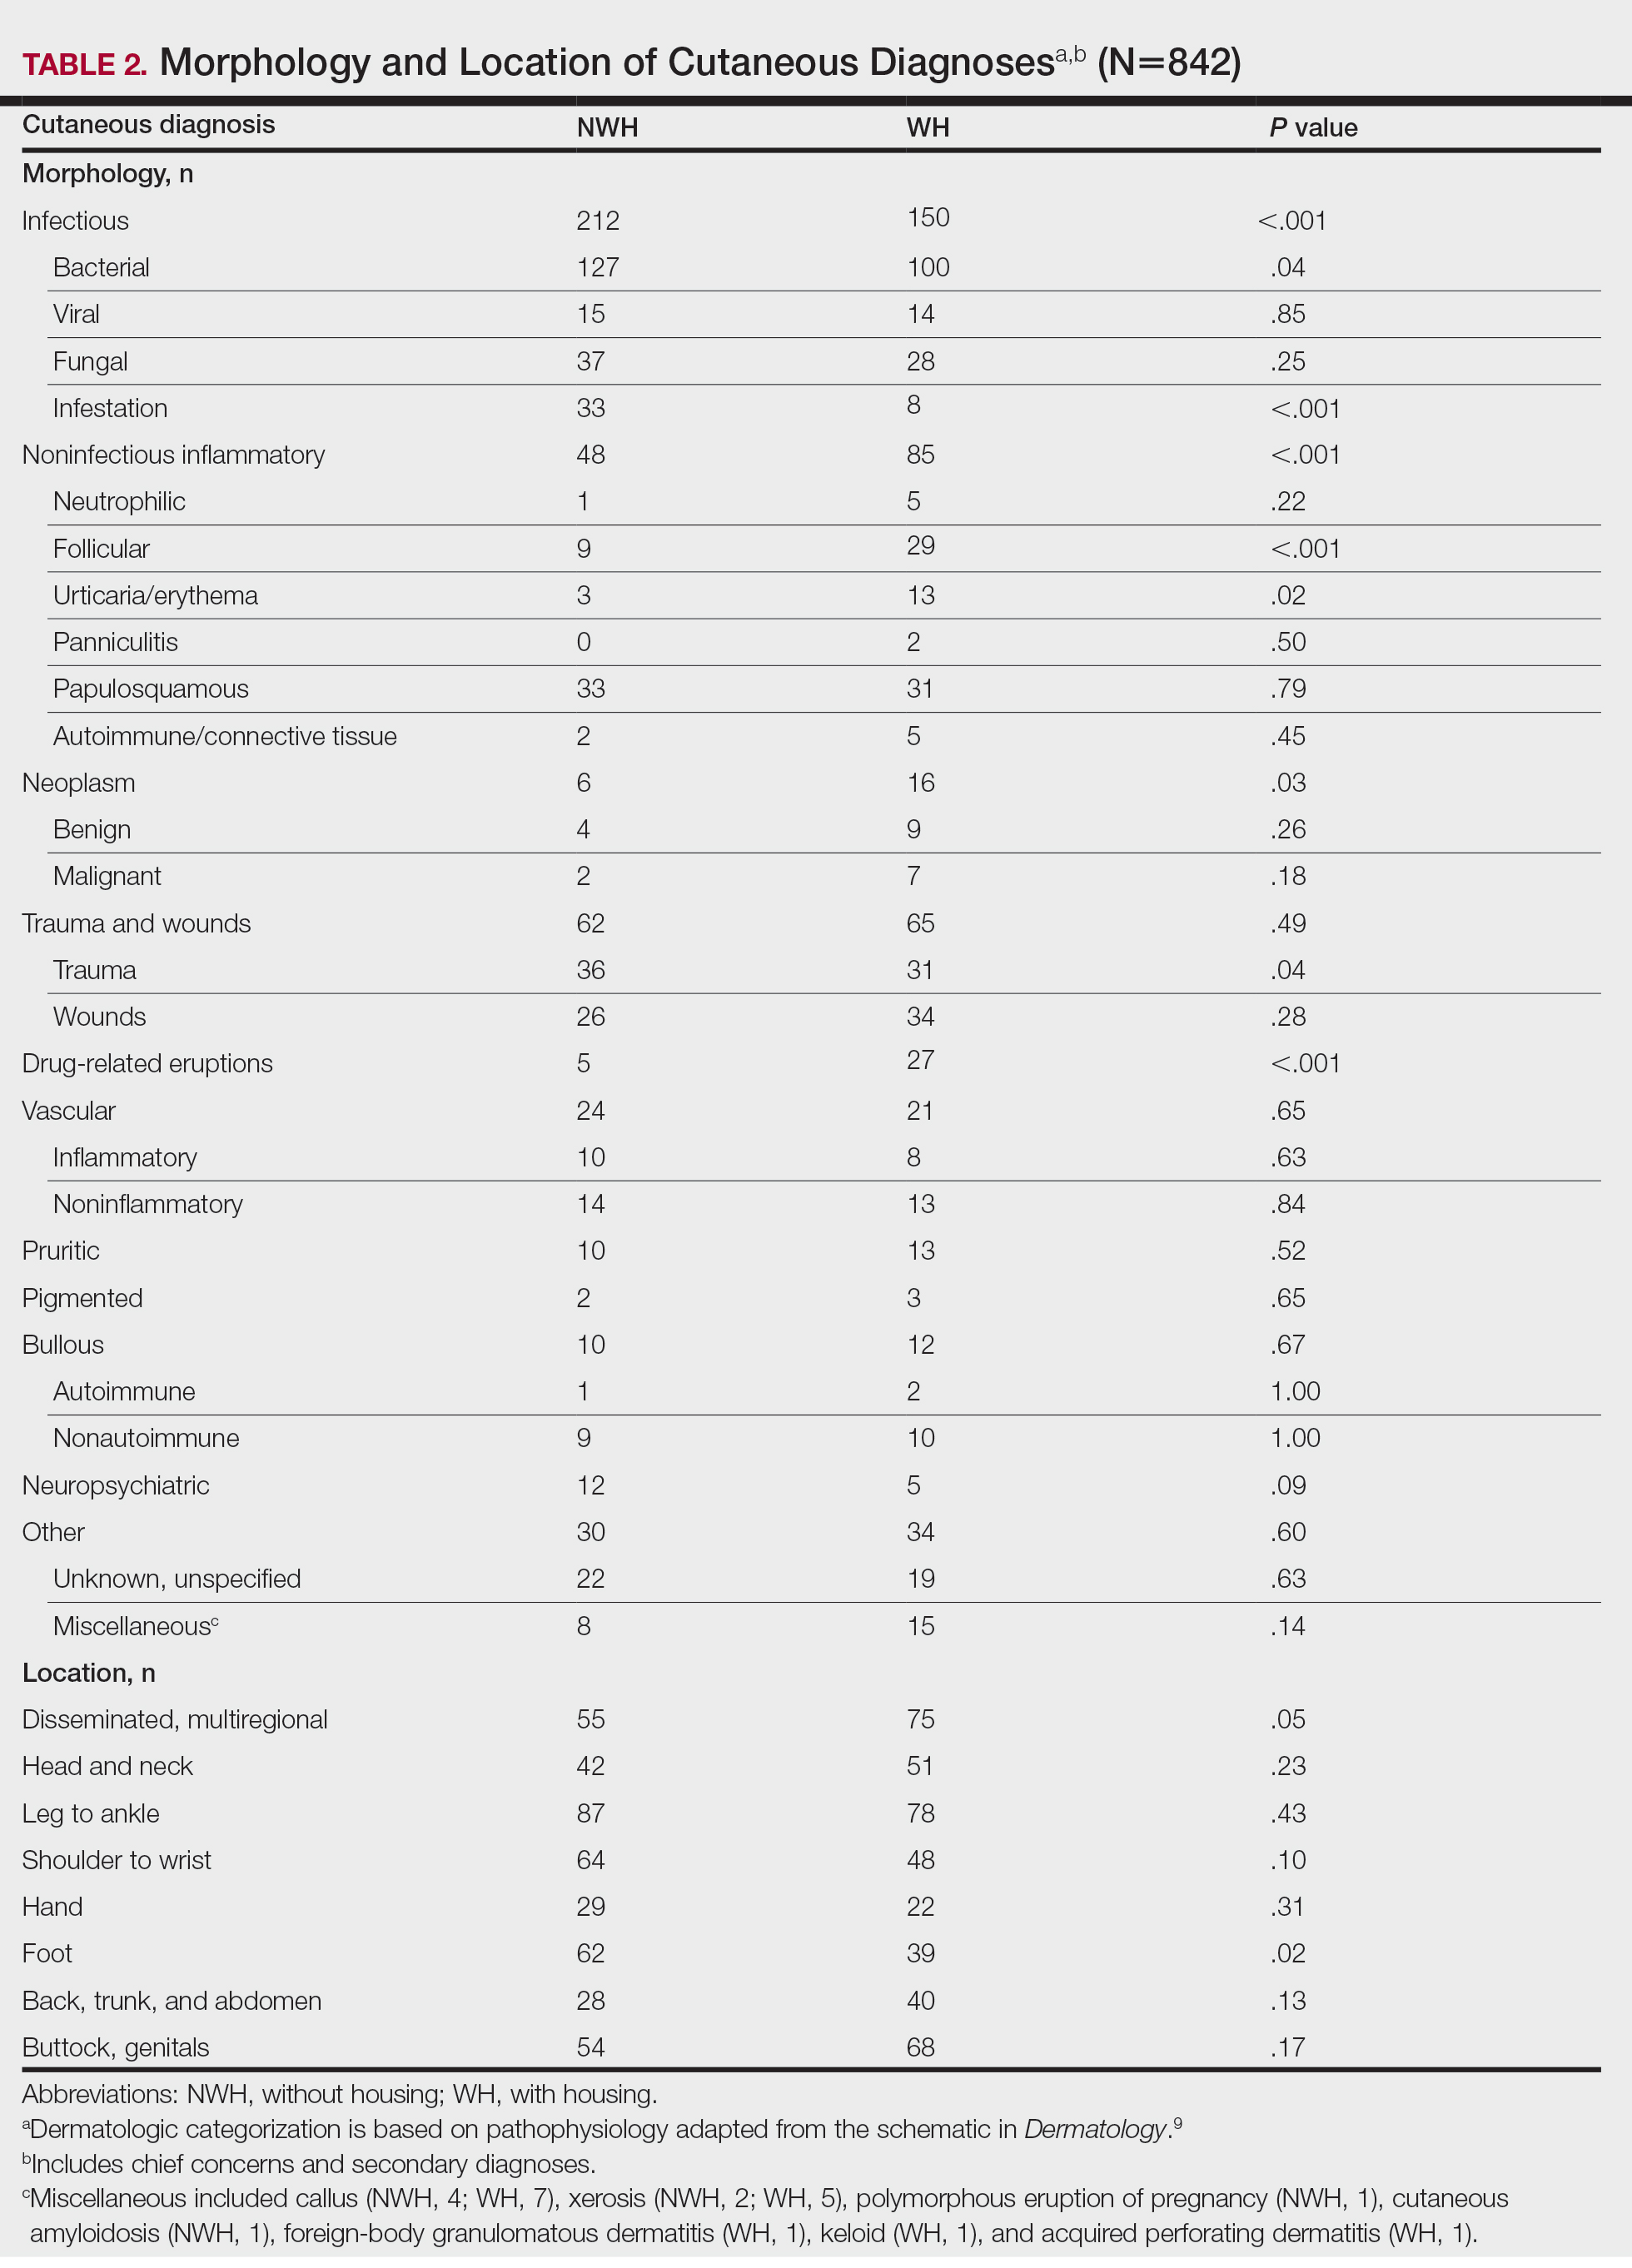
Infection was the most common chief concern, though NWH patients presented with significantly more infectious concerns (NWH, 212; WH, 150; P<.001), particularly infestations (NWH, 33; WH, 8; P<.001) and bacterial etiologies (NWH, 127; WH, 100; P=.04). The majority of bacterial etiologies were either an abscess or cellulitis (NWH, 106; WH, 83), though infected chronic wounds were categorized as bacterial infection when treated definitively as such (eg, in the case of sacral ulcers causing osteomyelitis)(NWH, 21; WH, 17). Of note, infectious etiology was associated with intravenous drug use (IVDU) in both NWH and WH patients. Of 184 NWH who reported IVDU, 127 had an infectious diagnosis (P<.001). Similarly, 43 of 56 total WH patients who reported IVDU had an infectious diagnosis (P<.001). Infestation (within the infectious category) included scabies (NWH, 20; WH, 3) and insect or arthropod bites (NWH, 12; WH, 5). Two NWH patients also presented with swelling of the lower extremities and were subsequently diagnosed with maggot infestations. Fungal and viral etiologies were not significantly increased in either group; however, NWH did have a higher incidence of tinea pedis (NWH, 14; WH, 4; P=.03).
More neoplasms (NWH, 6; WH, 16; P=.03), noninfectious inflammatory eruptions (NWH, 48; WH, 85; P<.001), and cutaneous drug eruptions (NWH, 5; WH, 27; P<.001) were reported in WH patients. There was no significant difference in benign vs malignant neoplastic processes between groups. More noninfectious inflammatory eruptions in WH were specifically driven by a markedly increased incidence of follicular (NWH, 9; WH, 29; P<.001) and urticarial/erythematous (NWH, 3; WH, 13; P=.02) lesions. Follicular etiologies included acne (NWH, 1; WH, 6; P=.12), folliculitis (NWH, 5; WH, 2; P=.45), hidradenitis suppurativa (NWH, 2; WH, 11; P=.02), and pilonidal and sebaceous cysts (NWH, 1; WH, 10; P=.01). Allergic urticaria dominated the urticarial/erythematous category (NWH, 3; WH, 11; P=.06), though there were 2 WH presentations of diffuse erythema and skin peeling.
Another substantial proportion of cutaneous etiologies were due to trauma or chronic wounds. Significantly more traumatic injuries presented in NWH patients vs WH patients (36 vs 31; P=.04). Trauma included human or dog bites (NWH, 5; WH, 4), sunburns (NWH, 3; WH, 0), other burns (NWH, 11; WH, 13), abrasions and lacerations (NWH, 16; WH, 3; P=.004), and foreign bodies (NWH, 1; WH, 1). Wounds consisted of chronic wounds such as those due to diabetes mellitus (foot ulcers) or immobility (sacral ulcers); numbers were similar between groups.
Looking at location, NWH patients had more pathology on the feet (NWH, 62; WH, 39; P=.02), whereas WH patients had more disseminated multiregional concerns (NWH, 55; WH, 75; P=.05). No one body location was notably more likely to warrant a chief concern.
For clinical outcomes, more WH patients received a consultation of any kind (NWH, 171; WH, 217; P<.001), consultation to dermatology (NWH, 49; WH, 87; P<.001), and consultation to surgery (NWH, 64; WH, 110; P<.001)(Table 3 and Figure). More outpatient referrals to dermatology were made for WH patients (NWH, 61; WH, 82; P=.05). Notably, NWH patients presented for 80% fewer hospital follow-up appointments (NWH, 11; WH, 55; P<.001). It is essential to note that these findings were not affected by self-reported race or ethnicity. Results remained significant when broken into cohorts consisting of patients with and without skin of color.
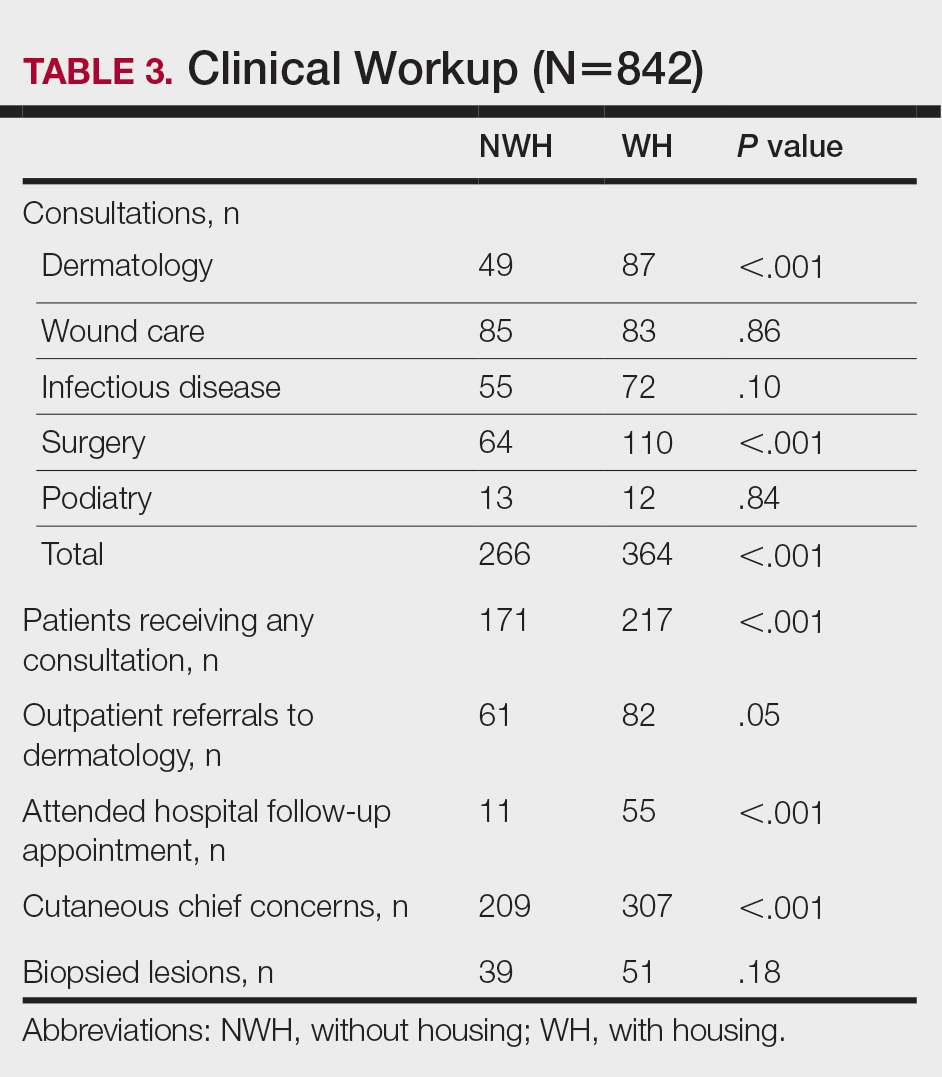
Comment
Cutaneous Concerns in NWH Patients—Although cutaneous disease has been reported to disproportionately affect NWH patients,10 in our cohort, NWH patients had fewer cutaneous chief concerns than WH patients. However, without comparing with all patients entering the ED at UMC, we cannot make a statement on this claim. We do present a few reasons why NWH patients do not have more cutaneous concerns. First, they may wait to present with cutaneous disease until it becomes more severe (eg, until chronic wounds have progressed to infections). Second, as discussed in depth by Hollestein and Nijsten,3 dermatologic disease may be a major contributor to the overall count of disability-adjusted life years but may play a minor role in individual disability. Therefore, skin disease often is considered less important on an individual basis, despite substantial psychosocial burden, leading to further stigmatization of this vulnerable population and discouraged care-seeking behavior, particularly for noninfectious inflammatory eruptions, which were notably more present in WH individuals. Third, fewer dermatologic lesions were reported on NWH patients, which may explain why all 3 WH pigmented lesions were diagnosed after presentation with a noncutaneous concern (eg, headache, anemia, nausea).
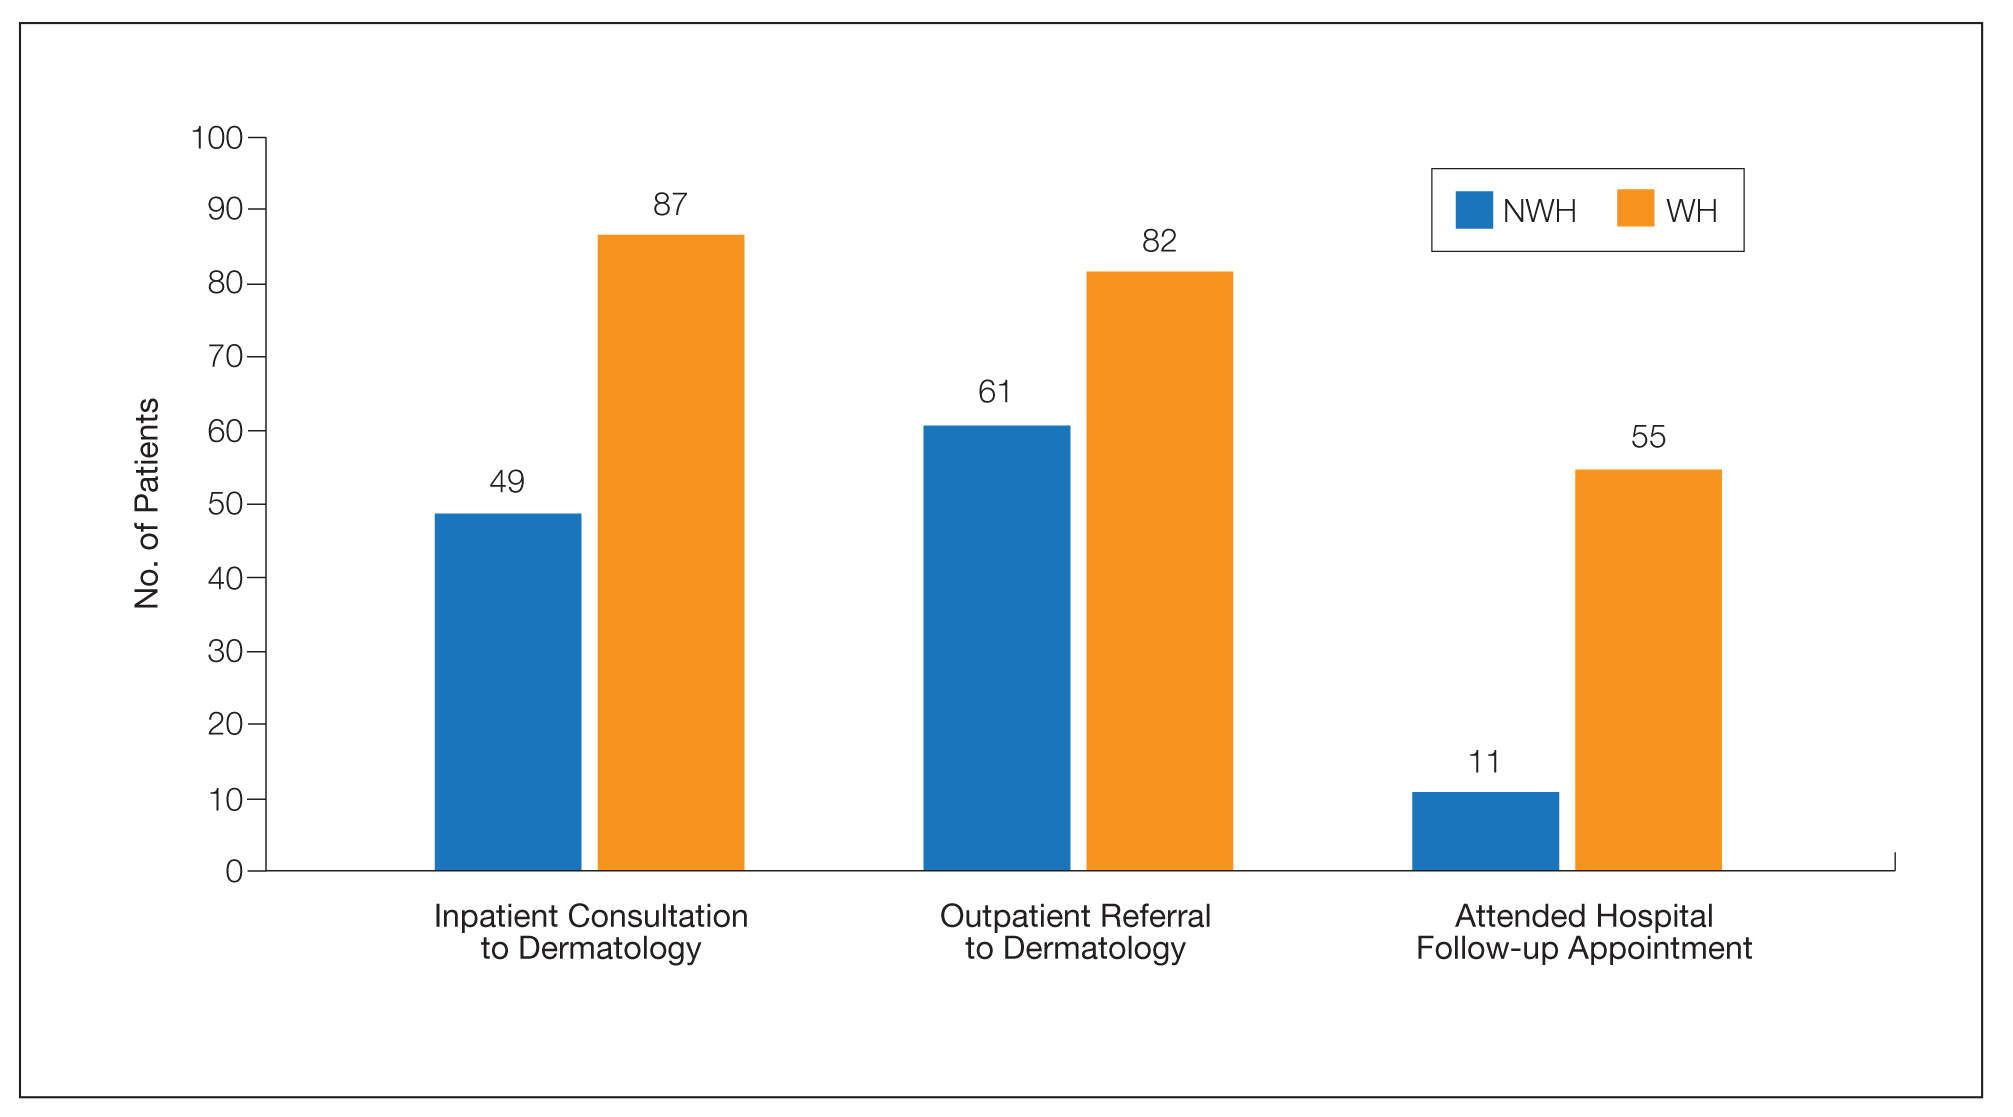
Infectious Cutaneous Diagnoses—The increased presentation of infectious etiologies, especially bacterial, is linked to the increased numbers of IVDUs reported in NWH individuals as well as increased exposure and decreased access to basic hygienic supplies. Intravenous drug use acted as an effect modifier of infectious etiology diagnoses, playing a major role in both NWH and WH cohorts. Although Black and Hispanic individuals as well as individuals with low socioeconomic status have increased proportions of skin cancer, there are inadequate data on the prevalence in NWH individuals.4 We found no increase in malignant dermatologic processes in NWH individuals; however, this may be secondary to inadequate screening with a total body skin examination.
Clinical Workup of NWH Patients—Because most NWH individuals present to the ED to receive care, their care compared with WH patients should be considered. In this cohort, WH patients received a less extensive clinical workup. They received almost half as many dermatologic consultations and fewer outpatient referrals to dermatology. Major communication barriers may affect NWH presentation to follow-up, which was drastically lower than WH individuals, as scheduling typically occurs well after discharge from the ED or inpatient unit. We suggest a few alterations to improve dermatologic care for NWH individuals:
• Consider inpatient consultation for serious dermatologic conditions—even if chronic—to improve disease control, considering that many barriers inhibit follow-up in clinic.
• Involve outreach teams, such as the Assertive Community Treatment teams, that assist individuals by delivering medicine for psychiatric disorders, conducting total-body skin examinations, assisting with wound care, providing basic skin barrier creams or medicaments, and carrying information regarding outpatient follow-up.
• Educate ED providers on the most common skin concerns, especially those that fall within the noninfectious inflammatory category, such as hidradenitis suppurativa, which could easily be misdiagnosed as an abscess.
Future Directions—Owing to limitations of a retrospective cohort study, we present several opportunities for further research on this vulnerable population. The severity of disease, especially infectious etiologies, should be graded to determine if NWH patients truly present later in the disease course. The duration and quality of housing for NWH patients could be categorized based on living conditions (eg, on the street vs in a shelter). Although the findings of our NWH cohort presenting to the ED at UMC provide helpful insight into dermatologic disease, these findings may be disparate from those conducted at other locations in the United States. University Medical Center provides care to mostly subsidized insurance plans in a racially diverse community. Improved outcomes for the NWH individuals living in New Orleans start with obtaining a greater understanding of their diseases and where disparities exist that can be bridged with better care.
Acknowledgment—The dataset generated during this study and used for analysis is not publicly available to protect public health information but is available from the corresponding author on reasonable request.
- Fazel S, Geddes JR, Kushel M. The health of homeless people in high-income countries: descriptive epidemiology, health consequences, and clinical and policy recommendations. Lancet. 2014;384:1529-1540. doi:10.1016/S0140-6736(14)61132-6
- Contag C, Lowenstein SE, Jain S, et al. Survey of symptomatic dermatologic disease in homeless patients at a shelter-based clinic. Our Dermatol Online. 2017;8:133-137. doi:10.7241/ourd.20172.37
- Hollestein LM, Nijsten T. An insight into the global burden of skin diseases. J Invest Dermatol. 2014;134:1499-1501. doi:10.1038/jid.2013.513
- Buster KJ, Stevens EI, Elmets CA. Dermatologic health disparities. Dermatol Clin. 2012;30:53-59. doi:10.1016/j.det.2011.08.002
- Grossberg AL, Carranza D, Lamp K, et al. Dermatologic care in the homeless and underserved populations: observations from the Venice Family Clinic. Cutis. 2012;89:25-32.
- Mackelprang JL, Graves JM, Rivara FP. Homeless in America: injuries treated in US emergency departments, 2007-2011. Int J Inj Contr Saf Promot. 2014;21:289-297. doi:10.1038/jid.2014.371
- Chen CL, Fitzpatrick L, Kamel H. Who uses the emergency department for dermatologic care? a statewide analysis. J Am Acad Dermatol. 2014;71:308-313. doi:10.1016/j.jaad.2014.03.013
- Stratigos AJ, Stern R, Gonzalez E, et al. Prevalence of skin disease in a cohort of shelter-based homeless men. J Am Acad Dermatol. 1999;41:197-202. doi:10.1016/S0190-9622(99)70048-4
- Bolognia JL, Jorizzo JL, Schaffer JV, eds. Dermatology. 3rd ed. Elsevier; 2012.
- Badiaga S, Menard A, Tissot Dupont H, et al. Prevalence of skin infections in sheltered homeless. Eur J Dermatol. 2005;15:382-386.
More than half a million individuals are without housing (NWH) on any given night in the United States, as estimated by the US Department of Housing and Urban Development. 1 Lack of hygiene, increased risk of infection and infestation due to living conditions, and barriers to health care put these individuals at increased risk for disease. 2 Skin disease, including fungal infection and acne, are within the top 10 most prevalent diseases worldwide and can cause major psychologic impairment, yet dermatologic concerns and clinical outcomes in NWH patients have not been well characterized. 2-5 Further, because this vulnerable demographic tends to be underinsured, they frequently present to the emergency department (ED) for management of disease. 1,6 Survey of common concerns in NWH patients is of utility to consulting dermatologists and nondermatologist providers in the ED, who can familiarize themselves with management of diseases they are more likely to encounter. Few studies examine dermatologic conditions in the ED, and a thorough literature review indicates none have included homelessness as a variable. 6,7 Additionally, comparison with a matched control group of patients with housing (WH) is limited. 5,8 We present one of the largest comparisons of cutaneous disease in NWH vs WH patients in a single hospital system to elucidate the types of cutaneous disease that motivate patients to seek care, the location of skin disease, and differences in clinical care.
Methods
A retrospective medical record review of patients seen for an inclusive list of dermatologic diagnoses in the ED or while admitted at University Medical Center New Orleans, Louisiana (UMC), between January 1, 2018, and April 21, 2020, was conducted. This study was qualified as exempt from the institutional review board by Louisiana State University because it proposed zero risk to the patients and remained completely anonymous. Eight hundred forty-two total medical records were reviewed (NWH, 421; WH, 421)(Table 1). Patients with housing were matched based on self-identified race and ethnicity, sex, and age. Disease categories were constructed based on fundamental pathophysiology adapted from Dermatology9: infectious, noninfectious inflammatory, neoplasm, trauma and wounds, drug-related eruptions, vascular, pruritic, pigmented, bullous, neuropsychiatric, and other. Other included unspecified eruptions as well as miscellaneous lesions such as calluses. The current chief concern, anatomic location, and configuration were recorded, as well as biopsied lesions and outpatient referrals or inpatient consultations to dermatology or other specialties, including wound care, infectious disease, podiatry, and surgery. χ2 analysis was used to analyze significance of cutaneous categories, body location, and referrals. Groups smaller than 5 defaulted to the Fisher exact test.
Results
The total diagnoses (including both chief concerns and secondary diagnoses) are shown in Table 2. Chief concerns were more frequently cutaneous or dermatologic for WH (NWH, 209; WH, 307; P<.001). In both groups, cutaneous infectious etiologies were more likely to be a patient’s presenting chief concern (58% NWH, P=.002; 42% WH, P<.001). Noninfectious inflammatory etiologies and pigmented lesions were more likely to be secondary diagnoses with an unrelated noncutaneous concern; noninfectious inflammatory etiologies were only 16% of the total cutaneous chief concerns (11% NWH, P=.04; 20% WH, P=.03), and no pigmented lesions were chief concerns.
Infection was the most common chief concern, though NWH patients presented with significantly more infectious concerns (NWH, 212; WH, 150; P<.001), particularly infestations (NWH, 33; WH, 8; P<.001) and bacterial etiologies (NWH, 127; WH, 100; P=.04). The majority of bacterial etiologies were either an abscess or cellulitis (NWH, 106; WH, 83), though infected chronic wounds were categorized as bacterial infection when treated definitively as such (eg, in the case of sacral ulcers causing osteomyelitis)(NWH, 21; WH, 17). Of note, infectious etiology was associated with intravenous drug use (IVDU) in both NWH and WH patients. Of 184 NWH who reported IVDU, 127 had an infectious diagnosis (P<.001). Similarly, 43 of 56 total WH patients who reported IVDU had an infectious diagnosis (P<.001). Infestation (within the infectious category) included scabies (NWH, 20; WH, 3) and insect or arthropod bites (NWH, 12; WH, 5). Two NWH patients also presented with swelling of the lower extremities and were subsequently diagnosed with maggot infestations. Fungal and viral etiologies were not significantly increased in either group; however, NWH did have a higher incidence of tinea pedis (NWH, 14; WH, 4; P=.03).
More neoplasms (NWH, 6; WH, 16; P=.03), noninfectious inflammatory eruptions (NWH, 48; WH, 85; P<.001), and cutaneous drug eruptions (NWH, 5; WH, 27; P<.001) were reported in WH patients. There was no significant difference in benign vs malignant neoplastic processes between groups. More noninfectious inflammatory eruptions in WH were specifically driven by a markedly increased incidence of follicular (NWH, 9; WH, 29; P<.001) and urticarial/erythematous (NWH, 3; WH, 13; P=.02) lesions. Follicular etiologies included acne (NWH, 1; WH, 6; P=.12), folliculitis (NWH, 5; WH, 2; P=.45), hidradenitis suppurativa (NWH, 2; WH, 11; P=.02), and pilonidal and sebaceous cysts (NWH, 1; WH, 10; P=.01). Allergic urticaria dominated the urticarial/erythematous category (NWH, 3; WH, 11; P=.06), though there were 2 WH presentations of diffuse erythema and skin peeling.
Another substantial proportion of cutaneous etiologies were due to trauma or chronic wounds. Significantly more traumatic injuries presented in NWH patients vs WH patients (36 vs 31; P=.04). Trauma included human or dog bites (NWH, 5; WH, 4), sunburns (NWH, 3; WH, 0), other burns (NWH, 11; WH, 13), abrasions and lacerations (NWH, 16; WH, 3; P=.004), and foreign bodies (NWH, 1; WH, 1). Wounds consisted of chronic wounds such as those due to diabetes mellitus (foot ulcers) or immobility (sacral ulcers); numbers were similar between groups.
Looking at location, NWH patients had more pathology on the feet (NWH, 62; WH, 39; P=.02), whereas WH patients had more disseminated multiregional concerns (NWH, 55; WH, 75; P=.05). No one body location was notably more likely to warrant a chief concern.
For clinical outcomes, more WH patients received a consultation of any kind (NWH, 171; WH, 217; P<.001), consultation to dermatology (NWH, 49; WH, 87; P<.001), and consultation to surgery (NWH, 64; WH, 110; P<.001)(Table 3 and Figure). More outpatient referrals to dermatology were made for WH patients (NWH, 61; WH, 82; P=.05). Notably, NWH patients presented for 80% fewer hospital follow-up appointments (NWH, 11; WH, 55; P<.001). It is essential to note that these findings were not affected by self-reported race or ethnicity. Results remained significant when broken into cohorts consisting of patients with and without skin of color.
Comment
Cutaneous Concerns in NWH Patients—Although cutaneous disease has been reported to disproportionately affect NWH patients,10 in our cohort, NWH patients had fewer cutaneous chief concerns than WH patients. However, without comparing with all patients entering the ED at UMC, we cannot make a statement on this claim. We do present a few reasons why NWH patients do not have more cutaneous concerns. First, they may wait to present with cutaneous disease until it becomes more severe (eg, until chronic wounds have progressed to infections). Second, as discussed in depth by Hollestein and Nijsten,3 dermatologic disease may be a major contributor to the overall count of disability-adjusted life years but may play a minor role in individual disability. Therefore, skin disease often is considered less important on an individual basis, despite substantial psychosocial burden, leading to further stigmatization of this vulnerable population and discouraged care-seeking behavior, particularly for noninfectious inflammatory eruptions, which were notably more present in WH individuals. Third, fewer dermatologic lesions were reported on NWH patients, which may explain why all 3 WH pigmented lesions were diagnosed after presentation with a noncutaneous concern (eg, headache, anemia, nausea).
Infectious Cutaneous Diagnoses—The increased presentation of infectious etiologies, especially bacterial, is linked to the increased numbers of IVDUs reported in NWH individuals as well as increased exposure and decreased access to basic hygienic supplies. Intravenous drug use acted as an effect modifier of infectious etiology diagnoses, playing a major role in both NWH and WH cohorts. Although Black and Hispanic individuals as well as individuals with low socioeconomic status have increased proportions of skin cancer, there are inadequate data on the prevalence in NWH individuals.4 We found no increase in malignant dermatologic processes in NWH individuals; however, this may be secondary to inadequate screening with a total body skin examination.
Clinical Workup of NWH Patients—Because most NWH individuals present to the ED to receive care, their care compared with WH patients should be considered. In this cohort, WH patients received a less extensive clinical workup. They received almost half as many dermatologic consultations and fewer outpatient referrals to dermatology. Major communication barriers may affect NWH presentation to follow-up, which was drastically lower than WH individuals, as scheduling typically occurs well after discharge from the ED or inpatient unit. We suggest a few alterations to improve dermatologic care for NWH individuals:
• Consider inpatient consultation for serious dermatologic conditions—even if chronic—to improve disease control, considering that many barriers inhibit follow-up in clinic.
• Involve outreach teams, such as the Assertive Community Treatment teams, that assist individuals by delivering medicine for psychiatric disorders, conducting total-body skin examinations, assisting with wound care, providing basic skin barrier creams or medicaments, and carrying information regarding outpatient follow-up.
• Educate ED providers on the most common skin concerns, especially those that fall within the noninfectious inflammatory category, such as hidradenitis suppurativa, which could easily be misdiagnosed as an abscess.
Future Directions—Owing to limitations of a retrospective cohort study, we present several opportunities for further research on this vulnerable population. The severity of disease, especially infectious etiologies, should be graded to determine if NWH patients truly present later in the disease course. The duration and quality of housing for NWH patients could be categorized based on living conditions (eg, on the street vs in a shelter). Although the findings of our NWH cohort presenting to the ED at UMC provide helpful insight into dermatologic disease, these findings may be disparate from those conducted at other locations in the United States. University Medical Center provides care to mostly subsidized insurance plans in a racially diverse community. Improved outcomes for the NWH individuals living in New Orleans start with obtaining a greater understanding of their diseases and where disparities exist that can be bridged with better care.
Acknowledgment—The dataset generated during this study and used for analysis is not publicly available to protect public health information but is available from the corresponding author on reasonable request.
- Fazel S, Geddes JR, Kushel M. The health of homeless people in high-income countries: descriptive epidemiology, health consequences, and clinical and policy recommendations. Lancet. 2014;384:1529-1540. doi:10.1016/S0140-6736(14)61132-6
- Contag C, Lowenstein SE, Jain S, et al. Survey of symptomatic dermatologic disease in homeless patients at a shelter-based clinic. Our Dermatol Online. 2017;8:133-137. doi:10.7241/ourd.20172.37
- Hollestein LM, Nijsten T. An insight into the global burden of skin diseases. J Invest Dermatol. 2014;134:1499-1501. doi:10.1038/jid.2013.513
- Buster KJ, Stevens EI, Elmets CA. Dermatologic health disparities. Dermatol Clin. 2012;30:53-59. doi:10.1016/j.det.2011.08.002
- Grossberg AL, Carranza D, Lamp K, et al. Dermatologic care in the homeless and underserved populations: observations from the Venice Family Clinic. Cutis. 2012;89:25-32.
- Mackelprang JL, Graves JM, Rivara FP. Homeless in America: injuries treated in US emergency departments, 2007-2011. Int J Inj Contr Saf Promot. 2014;21:289-297. doi:10.1038/jid.2014.371
- Chen CL, Fitzpatrick L, Kamel H. Who uses the emergency department for dermatologic care? a statewide analysis. J Am Acad Dermatol. 2014;71:308-313. doi:10.1016/j.jaad.2014.03.013
- Stratigos AJ, Stern R, Gonzalez E, et al. Prevalence of skin disease in a cohort of shelter-based homeless men. J Am Acad Dermatol. 1999;41:197-202. doi:10.1016/S0190-9622(99)70048-4
- Bolognia JL, Jorizzo JL, Schaffer JV, eds. Dermatology. 3rd ed. Elsevier; 2012.
- Badiaga S, Menard A, Tissot Dupont H, et al. Prevalence of skin infections in sheltered homeless. Eur J Dermatol. 2005;15:382-386.
Practice Points
- Dermatologic disease in patients without housing (NWH) is characterized by more infectious concerns and fewer follicular and urticarial noninfectious inflammatory eruptions compared with matched controls of those with housing.
- Patients with housing more frequently presented with cutaneous chief concerns and received more consultations while in the hospital.
- This study uncovered notable pathological and clinical differences in treating dermatologic conditions in NWH patients.
Comparison of Adverse Events With Vancomycin Diluted in Normal Saline vs Dextrose 5%
Vancomycin is a widely used IV antibiotic due to its broad-spectrum of activity, bactericidal nature, and low rates of resistance; however, adverse effects (AEs), including nephrotoxicity, are commonly associated with its use.1 The vancomycin therapeutic monitoring guidelines recognize the incidence of nephrotoxicity and suggest strategies for reducing the risk, including area under the curve/mean inhibitory concentration (AUC/MIC) monitoring rather than trough-only monitoring. Vancomycin-associated acute kidney injury (AKI) has been defined as an increase in serum creatinine (SCr) over a 48-hour period of ≥ 0.3 mg/dL or a percentage increase of ≥ 50%, which is consistent with the Acute Kidney Injury Network (AKIN) guidelines.2,3 Vancomycin-associated AKI is a common AE, with its incidence reported in previous studies ranging from 10 to 20%.4,5
The most common crystalloid fluid administered to patients in the United States is 0.9% sodium chloride (NaCl), also known as normal saline (NS), and recent trials have explored its potential to cause AEs.6-8 Balanced crystalloid solutions, such as Plasma-Lyte and lactated Ringer’s solution (LR), contain buffering agents and lower concentrations of sodium and chloride compared with that of NS. Trials in the intensive care unit (ICU) and emergency department, such as the SMART-MED, SMART-SURG, and SALT-ED have reported a significantly lower rate of AKI when using balanced crystalloids compared with NS due to the concentration of sodium and chloride in NS being supraphysiologic to normal serum concentrations.6,7 Alternatively, the SPLIT trial evaluated the use of NS compared with Plasma-Lyte for ICU fluid therapy and did not find a statistically significant difference in AKI.8 Furthermore, some studies have reported increased risk for hyperchloremia when using NS compared with dextrose 5% in water (D5W) or balanced crystalloids, which can result in metabolic acidosis.6,7,9,10 These studies have shown how the choice of fluid can have a large effect on the incidence of AEs; bringing into question whether these effects could be additive when combined with the nephrotoxicity associated with vancomycin.6-9
Vancomycin is physically and chemically stable if diluted in D5W, NS, 5% dextrose in NS, LR, or 5% dextrose in LR.1 It is not known whether the selection of diluent has an effect on nephrotoxicity or other AEs of vancomycin therapy. Furthermore, clinicians may be unaware or unable to specify which diluent to use. There are currently no practice guidelines that favor one diluent over another for vancomycin; however, trials showing higher rates of AKI and hyperchloremia using NS for fluid resuscitation may indicate an increased potential for vancomycin-associated AKI when using NS as a diluent.6,7,9 This study was performed to evaluate whether the type of crystalloid used (D5W vs NS) can influence adverse outcomes for patients. While many factors may contribute to these AEs, the potential to reduce the risk of negative adverse outcomes for hospitalized patients is a significant area of exploration.
The primary outcome of this study was the incidence of AKI, defined using AKIN guidelines where the increase in SCr occurred at least 24 hours after starting vancomycin and within 36 hours of receiving the last vancomycin dose.3 AKI was staged using the AKIN guidelines (stage 1: increase in SCr of ≥ 0.3 mg/dL or by 50 to 99%; stage 2: increase in SCr by 100 to 199%; stage 3: increase in SCr by > 200%) based on changes in SCr from baseline during vancomycin therapy or within 36 hours of stopping vancomycin therapy.3 Secondary outcomes included the incidence of hyperglycemia, hyperchloremia, metabolic acidosis, hypernatremia, mortality in hospital, and mortality within 30 days from hospital discharge.
Methods
This single-center, retrospective study of veterans who received IV vancomycin within the North Florida/South Georgia Veterans Health System (NF/SGVHS) in Gainesville, Florida, from July 1, 2015 to June 30, 2020, compared veterans who received vancomycin diluted in NS with those who received vancomycin diluted in D5W to assess for differences in AEs, including AKI, metabolic acidosis (serum bicarbonate level < 23 mmol/L), hyperchloremia (serum chloride levels > 108 mmol/L), hypernatremia (serum sodium > 145 mmol/L), and hyperglycemia (blood glucose > 180 mg/dL). The endpoint values were defined using the reference ranges determined by the local laboratory. At NF/SGVHS, vancomycin is diluted in D5W or NS based primarily on factors such as product availability and cost.
Study Criteria
Veterans were included if they received IV vancomycin between July 1, 2015 and June 30, 2020. The cohorts were grouped into those receiving vancomycin doses diluted in NS and those receiving vancomycin doses diluted in D5W. Veterans were excluded if they received < 80% of vancomycin doses diluted in their respective fluid, if they were on vancomycin for < 48 hours, or if they did not have laboratory results collected both before and after vancomycin therapy to assess a change. There were more patients receiving vancomycin in D5W, so a random sample was selected to have an equal size comparison group with those receiving NS. A sample size calculation was performed with an anticipated AKI incidence of 14%.5 To detect a 10% difference in the primary outcome with an α of 0.05 and 75% power, 226 patients (113 in each cohort) were needed for inclusion.
Data were collected using the Data Access Request Tracker tool through the US Department of Veterans Affairs (VA) Informatics and Computing Infrastructure. Data collected included demographics, laboratory data at baseline and during vancomycin therapy, characteristics of antibiotic therapy, and mortality data. Of note, all laboratory values assessed in this study were obtained while the veteran was receiving vancomycin or within 36 hours of receiving the last vancomycin dose to appropriately assess any changes.
Statistical analysis of categorical data were analyzed using a χ2 test on the GraphPad online program. This study received institutional review board approval from the University of Florida and was conducted in accordance with protections for human subjects.
Results
A total of 792 veterans received IV vancomycin NF/SGVHS in the defined study period. Of these, 381 veterans were excluded, including having < 80% of doses in a single solution (213 veterans), receiving IV vancomycin for < 48 hours (149 veterans), and not having necessary laboratory data available to assess a change in kidney function (19 veterans). An additional 165 veterans were randomly excluded from the D5W cohort in order to have an equal comparison group to the NS cohort; therefore, a total of 246 veterans were included in the final assessment (123 veterans in each cohort). The median patient age was 73 years (IQR, 68.0, 80.5) in the D5W group and 66 years (IQR, 60.0, 74.0) in the NS group; 83.7% of veterans in the D5W group and 74% veterans in the NS group were white; 94.3% of the D5W group and 100% of the NS group were male (Table 1).
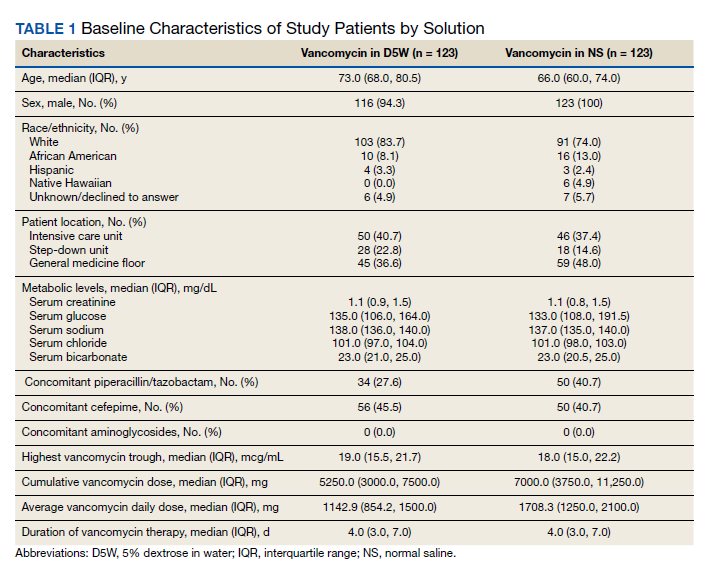
The percentage of AKI in the D5W group was 22.8% compared with 14.6% in the NS group (P = .14), and all cases were classified as stage 1 AKI. Baseline cases of hyperglycemia, hypernatremia, hyperchloremia, or metabolic acidosis were not included in the reported rates of each in order to determine a change during vancomycin therapy (Table 2).
The percentage of patients with hyperglycemia in the D5W group was 32.5% compared with 39.8% in the NS group (P = .29). The percentage of patients with hypernatremia in the D5W group was 15.4% compared with 10.6% in the NS group (P = .34). The percentage of patients with hyperchloremia in the D5W group was 22.8% compared with 17.9% in the NS group (P = .43). The percentage of patients with metabolic acidosis in the D5W group was 48.0% compared with 49.6% in the NS group (P = .90).
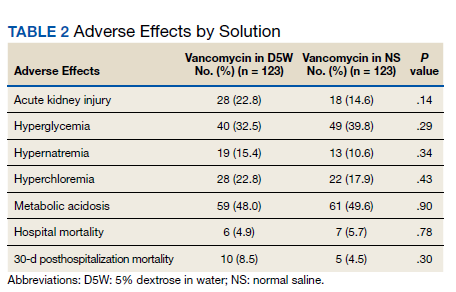
There were no significant differences in either in-hospital or posthospital mortality between the D5W and NS groups (in-hospital: 4.9% vs 5.7%, respectively; P = .78; 30-day posthospitalization: 8.5% vs 4.5%, respectively; P = .30).
Discussion
This retrospective cohort study comparing the AEs of vancomycin diluted in NS and vancomycin diluted with D5W showed no statistically significant differences in the incidence of AKI or any metabolic AEs. Although these results did not show an association between the incidence of AEs and the dilution fluid for vancomycin, other factors may contribute to the overall incidence of AEs. Factors such as cumulative vancomycin dose, duration of therapy, and presence of concomitant nephrotoxins have been known to increase the incidence of AKI and may have a greater impact on this incidence than the fluid used in administering the vancomycin.
These results specifically the incidence of AKI were not consistent with previous trials evaluating the AEs of NS. Based on previous trials, we expected the vancomycin in the NS cohort to have a significantly higher incidence of hypernatremia, hyperchloremia, and AKI. Our results may indicate that the volume of crystalloid received played a greater role on the incidence of AEs. Our study assessed the effect of a diluent for one IV medication that may have been only a few hundred milliliters of fluid per day. The total volume of IV fluid received from vancomycin was not assessed; thus, it is not known how the volume of fluid may have impacted the results.
One consideration with this study is the method used for monitoring vancomycin levels. Most of the patients included in this study were admitted prior to the release of the updated vancomycin guidelines, which advocated for the transition from traditional trough-only monitoring to AUC/MIC. In September 2019, NF/SGVHS ICUs made the transition to this new method of monitoring with a hospital-wide transition following the study end date. The D5W group had a slightly higher percentage of patients admitted to the ICU, thus were more likely to be monitored using AUC/MIC during this period. Literature has shown the AUC/MIC method of monitoring can result in a decreased daily dose, decreased trough levels, and decreased incidence of nephrotoxicity.11-14 Although the method for monitoring vancomycin has the potential to affect the incidence of AKI, the majority of patients were monitored using the traditional trough-only method with similar trough levels reported in both groups.
Limitations
This study is limited by its retrospective nature, the potential introduction of biases, and the inability to control for confounders that may have influenced the incidence of AEs. Potential confounders present in this study included the use of concomitant nephrotoxic medications, vancomycin dose, and underlying conditions, as these could have impacted the overall incidence of AEs.
The combination of piperacillin/tazobactam plus vancomycin has commonly been associated with an increased risk of nephrotoxicity. Previous studies have identified this nephrotoxic combination to have a significantly increased risk of AKI compared with vancomycin alone or when used in combination with alternative antibiotics such as cefepime or meropenem.15,16 In our study, there was a higher percentage of patients in the NS group with concomitant piperacillin/tazobactam, so this difference between the groups may have influenced the incidence of AKI. Nephrotoxic medications other than antibiotics were not assessed in this study; however, these also could have impacted our results significantly. While the vancomycin duration of therapy and highest trough levels were similar between groups, the NS group had a larger average daily dose and overall cumulative dose. Studies have identified the risk of nephrotoxicity increases with a vancomycin daily dose of 4 g, troughs > 15 mg/mL, and a duration of therapy > 7 days.15,16 In our study, the daily doses in both groups were < 4 g, so it is likely the average daily vancomycin dose had little impact on the incidence of AKI.
Another potential confounder identified was assessment of underlying conditions in the patients. Due to the limitations associated with the data extraction method, we could not assess for underlying conditions that may have impacted the results. Notably, the potential nephrotoxicity of NS has mostly been shown in critically ill patients. Therefore, the mixed acutely ill patient sample in this study may have been less likely to develop AKI from NS compared with an exclusively critically ill patient sample.
Selection bias and information bias are common with observational studies. In our study, selection bias may have been present since prospective randomization of patient samples was not possible. Since all data were extracted from the medical health record, information bias may have been present with the potential to impact the results. Due to the single-center nature of this study with a predominantly older, white male veteran patient sample, generalizability to other patient populations may be limited. We would expect the results of this study to be similar among other patient populations of a similar age and demographic; however, the external validity of this study may be weak among other populations. Although this study included enough patients based on sample size estimate, a larger sample size could have allowed for detection of smaller differences between groups and decreased the chance for type II error.
Conclusions
Overall, the results of this study do not suggest that the crystalloid used to dilute IV vancomycin is associated with differences in nephrotoxicity or other relevant AEs. Future studies evaluating the potential for AEs from medication diluent are warranted and would benefit from a prospective, randomized design. Further studies are both necessary and crucial for enhancing the quality of care to minimize the rates of AEs of commonly used medications.
Acknowledgment
This material is the result of work supported with resources and the use of facilities at the North Florida/South Georgia Veterans Health System in Gainesville, Florida.
1. Vancomycin hydrochloride intravenous injection, pharmacy bulk package. Package insert. Schaumburg, IL: APP Pharmaceuticals, LLC; 2011.
2. Rybak MJ, Le J, Lodise TP, et al. Therapeutic monitoring of vancomycin for serious methicillin-resistant Staphylococcus aureus infections: a revised consensus guideline and review by the American Society of Health-System Pharmacists, the Infectious Diseases Society of America, the Pediatric Infectious Diseases Society, and the Society of Infectious Diseases Pharmacists. Am J Health-System Pharm. 2020;77(11):835-864. doi:10.1093/ajhp/zxaa036
3. Mehta RL, Kellum JA, Shah SV, et al; Acute Kidney Injury Network. Acute Kidney Injury Network: report of an initiative to improve outcomes in acute kidney injury. Crit Care. 2007;11(2):R31. doi:10.1186/cc5713
4. Elaysi S, Khalili H, Dashti-Khavidaki S, Mohammadpour A. Vancomycin-induced nephrotoxicity: mechanism, incidence, risk factors and special populations–a literature review. Eur J Clin Pharmacol. 2012;68(9):1243-1255. doi:10.1007/s00228-012-1259-9
5. Gyamlani G, Potukuchi PK, Thomas F, et al. Vancomycin-associated acute kidney injury in a large veteran population. Am J Nephrol. 2019;49(2):133-142. doi:10.1159/000496484
6. Semler MW, Self WH, Wanderer JB, et al; SMART Investigators and the Pragmatic Critical Care Research Group. Balanced crystalloids versus saline in critically ill adults. N Engl Med. 2018;378(9):829-839. doi:10.1056/NEJMoa1711584
7. Self WH, Semler MW, Wanderer JP, et al; SMART Investigators and the Pragmatic Critical Care Research Group. Balanced crystalloids versus saline in noncritically ill adults. N Engl J Med. 2018;378(20):819-828. doi:10.1056/NEJMc1804294
8. Young P, Bailey M, Beasley R, et al; SPLIT Investigators; ANZICS CTG. Effect of a buffered crystalloid solution vs saline on acute kidney injury among patients in the intensive care unit: the SPLIT Randomized Clinical Trial. JAMA. 2015;314(16):1701-1710. doi:10.1001/jama.2015.12334
9. Magee CA, Bastin ML, Bastin T, et al. Insidious harm of medication diluents as a contributor to cumulative volume and hyperchloremia: a prospective, open-label, sequential period pilot study. Crit Care Med. 2018;46(8):1217-1223. doi:10.1097/CCM.0000000000003191
10. Adeva-Andany MM, Fernández-Fernández C, Mouriño-Bayolo D, Castro-Quintela E, Domínguez-Montero A. Sodium bicarbonate therapy in patients with metabolic acidosis. ScientificWorldJournal. 2014;2014:627673. doi:10.1155/2014/627673
11. Mcgrady KA, Benton M, Tart S, Bowers R. Evaluation of traditional vancomycin dosing versus utilizing an electronic AUC/MIC dosing program. Pharm Pract (Granada). 2020;18(3):2024. doi:10.18549/PharmPract.2020.3.2024
12. Clark L, Skrupky LP, Servais R, Brummitt CF, Dilworth TJ. Examining the relationship between vancomycin area under the concentration time curve and serum trough levels in adults with presumed or documented staphylococcal infections. Ther Drug Monit. 2019;41(4):483-488. doi:10.1097/FTD.0000000000000622
13. Neely MN, Kato L, Youn G, et al. Prospective trial on the use of trough concentration versus area under the curve to determine therapeutic vancomycin dosing. Antimicrob Agents Chemother. 2018;62(2):e02042-17. doi:10.1128/AAC.02042-17
14. Aljefri DM, Avedissian SN, Youn G, et al. Vancomycin area under the curve and acute kidney injury: a meta-analysis. Clin Infect Dis. 2019;69(11):1881-1887. doi:10.1128/AAC.02042-17
15. Molina KC, Barletta JF, Hall ST, Yazdani C, Huang V. The risk of acute kidney injury in critically ill patients receiving concomitant vancomycin with piperacillin-tazobactam or cefepime. J Intensive Care Med. 2019;35(12):1434-1438. doi:10.1177/0885066619828290
16. Burgess LD, Drew RH. Comparison of the incidence of vancomycin-induced nephrotoxicity in hospitalized patients with and without concomitant piperacillin-tazobactam. Pharmacotherapy. 2014; 34(7):670-676. doi:10.1002/phar.1442
Vancomycin is a widely used IV antibiotic due to its broad-spectrum of activity, bactericidal nature, and low rates of resistance; however, adverse effects (AEs), including nephrotoxicity, are commonly associated with its use.1 The vancomycin therapeutic monitoring guidelines recognize the incidence of nephrotoxicity and suggest strategies for reducing the risk, including area under the curve/mean inhibitory concentration (AUC/MIC) monitoring rather than trough-only monitoring. Vancomycin-associated acute kidney injury (AKI) has been defined as an increase in serum creatinine (SCr) over a 48-hour period of ≥ 0.3 mg/dL or a percentage increase of ≥ 50%, which is consistent with the Acute Kidney Injury Network (AKIN) guidelines.2,3 Vancomycin-associated AKI is a common AE, with its incidence reported in previous studies ranging from 10 to 20%.4,5
The most common crystalloid fluid administered to patients in the United States is 0.9% sodium chloride (NaCl), also known as normal saline (NS), and recent trials have explored its potential to cause AEs.6-8 Balanced crystalloid solutions, such as Plasma-Lyte and lactated Ringer’s solution (LR), contain buffering agents and lower concentrations of sodium and chloride compared with that of NS. Trials in the intensive care unit (ICU) and emergency department, such as the SMART-MED, SMART-SURG, and SALT-ED have reported a significantly lower rate of AKI when using balanced crystalloids compared with NS due to the concentration of sodium and chloride in NS being supraphysiologic to normal serum concentrations.6,7 Alternatively, the SPLIT trial evaluated the use of NS compared with Plasma-Lyte for ICU fluid therapy and did not find a statistically significant difference in AKI.8 Furthermore, some studies have reported increased risk for hyperchloremia when using NS compared with dextrose 5% in water (D5W) or balanced crystalloids, which can result in metabolic acidosis.6,7,9,10 These studies have shown how the choice of fluid can have a large effect on the incidence of AEs; bringing into question whether these effects could be additive when combined with the nephrotoxicity associated with vancomycin.6-9
Vancomycin is physically and chemically stable if diluted in D5W, NS, 5% dextrose in NS, LR, or 5% dextrose in LR.1 It is not known whether the selection of diluent has an effect on nephrotoxicity or other AEs of vancomycin therapy. Furthermore, clinicians may be unaware or unable to specify which diluent to use. There are currently no practice guidelines that favor one diluent over another for vancomycin; however, trials showing higher rates of AKI and hyperchloremia using NS for fluid resuscitation may indicate an increased potential for vancomycin-associated AKI when using NS as a diluent.6,7,9 This study was performed to evaluate whether the type of crystalloid used (D5W vs NS) can influence adverse outcomes for patients. While many factors may contribute to these AEs, the potential to reduce the risk of negative adverse outcomes for hospitalized patients is a significant area of exploration.
The primary outcome of this study was the incidence of AKI, defined using AKIN guidelines where the increase in SCr occurred at least 24 hours after starting vancomycin and within 36 hours of receiving the last vancomycin dose.3 AKI was staged using the AKIN guidelines (stage 1: increase in SCr of ≥ 0.3 mg/dL or by 50 to 99%; stage 2: increase in SCr by 100 to 199%; stage 3: increase in SCr by > 200%) based on changes in SCr from baseline during vancomycin therapy or within 36 hours of stopping vancomycin therapy.3 Secondary outcomes included the incidence of hyperglycemia, hyperchloremia, metabolic acidosis, hypernatremia, mortality in hospital, and mortality within 30 days from hospital discharge.
Methods
This single-center, retrospective study of veterans who received IV vancomycin within the North Florida/South Georgia Veterans Health System (NF/SGVHS) in Gainesville, Florida, from July 1, 2015 to June 30, 2020, compared veterans who received vancomycin diluted in NS with those who received vancomycin diluted in D5W to assess for differences in AEs, including AKI, metabolic acidosis (serum bicarbonate level < 23 mmol/L), hyperchloremia (serum chloride levels > 108 mmol/L), hypernatremia (serum sodium > 145 mmol/L), and hyperglycemia (blood glucose > 180 mg/dL). The endpoint values were defined using the reference ranges determined by the local laboratory. At NF/SGVHS, vancomycin is diluted in D5W or NS based primarily on factors such as product availability and cost.
Study Criteria
Veterans were included if they received IV vancomycin between July 1, 2015 and June 30, 2020. The cohorts were grouped into those receiving vancomycin doses diluted in NS and those receiving vancomycin doses diluted in D5W. Veterans were excluded if they received < 80% of vancomycin doses diluted in their respective fluid, if they were on vancomycin for < 48 hours, or if they did not have laboratory results collected both before and after vancomycin therapy to assess a change. There were more patients receiving vancomycin in D5W, so a random sample was selected to have an equal size comparison group with those receiving NS. A sample size calculation was performed with an anticipated AKI incidence of 14%.5 To detect a 10% difference in the primary outcome with an α of 0.05 and 75% power, 226 patients (113 in each cohort) were needed for inclusion.
Data were collected using the Data Access Request Tracker tool through the US Department of Veterans Affairs (VA) Informatics and Computing Infrastructure. Data collected included demographics, laboratory data at baseline and during vancomycin therapy, characteristics of antibiotic therapy, and mortality data. Of note, all laboratory values assessed in this study were obtained while the veteran was receiving vancomycin or within 36 hours of receiving the last vancomycin dose to appropriately assess any changes.
Statistical analysis of categorical data were analyzed using a χ2 test on the GraphPad online program. This study received institutional review board approval from the University of Florida and was conducted in accordance with protections for human subjects.
Results
A total of 792 veterans received IV vancomycin NF/SGVHS in the defined study period. Of these, 381 veterans were excluded, including having < 80% of doses in a single solution (213 veterans), receiving IV vancomycin for < 48 hours (149 veterans), and not having necessary laboratory data available to assess a change in kidney function (19 veterans). An additional 165 veterans were randomly excluded from the D5W cohort in order to have an equal comparison group to the NS cohort; therefore, a total of 246 veterans were included in the final assessment (123 veterans in each cohort). The median patient age was 73 years (IQR, 68.0, 80.5) in the D5W group and 66 years (IQR, 60.0, 74.0) in the NS group; 83.7% of veterans in the D5W group and 74% veterans in the NS group were white; 94.3% of the D5W group and 100% of the NS group were male (Table 1).
The percentage of AKI in the D5W group was 22.8% compared with 14.6% in the NS group (P = .14), and all cases were classified as stage 1 AKI. Baseline cases of hyperglycemia, hypernatremia, hyperchloremia, or metabolic acidosis were not included in the reported rates of each in order to determine a change during vancomycin therapy (Table 2).
The percentage of patients with hyperglycemia in the D5W group was 32.5% compared with 39.8% in the NS group (P = .29). The percentage of patients with hypernatremia in the D5W group was 15.4% compared with 10.6% in the NS group (P = .34). The percentage of patients with hyperchloremia in the D5W group was 22.8% compared with 17.9% in the NS group (P = .43). The percentage of patients with metabolic acidosis in the D5W group was 48.0% compared with 49.6% in the NS group (P = .90).
There were no significant differences in either in-hospital or posthospital mortality between the D5W and NS groups (in-hospital: 4.9% vs 5.7%, respectively; P = .78; 30-day posthospitalization: 8.5% vs 4.5%, respectively; P = .30).
Discussion
This retrospective cohort study comparing the AEs of vancomycin diluted in NS and vancomycin diluted with D5W showed no statistically significant differences in the incidence of AKI or any metabolic AEs. Although these results did not show an association between the incidence of AEs and the dilution fluid for vancomycin, other factors may contribute to the overall incidence of AEs. Factors such as cumulative vancomycin dose, duration of therapy, and presence of concomitant nephrotoxins have been known to increase the incidence of AKI and may have a greater impact on this incidence than the fluid used in administering the vancomycin.
These results specifically the incidence of AKI were not consistent with previous trials evaluating the AEs of NS. Based on previous trials, we expected the vancomycin in the NS cohort to have a significantly higher incidence of hypernatremia, hyperchloremia, and AKI. Our results may indicate that the volume of crystalloid received played a greater role on the incidence of AEs. Our study assessed the effect of a diluent for one IV medication that may have been only a few hundred milliliters of fluid per day. The total volume of IV fluid received from vancomycin was not assessed; thus, it is not known how the volume of fluid may have impacted the results.
One consideration with this study is the method used for monitoring vancomycin levels. Most of the patients included in this study were admitted prior to the release of the updated vancomycin guidelines, which advocated for the transition from traditional trough-only monitoring to AUC/MIC. In September 2019, NF/SGVHS ICUs made the transition to this new method of monitoring with a hospital-wide transition following the study end date. The D5W group had a slightly higher percentage of patients admitted to the ICU, thus were more likely to be monitored using AUC/MIC during this period. Literature has shown the AUC/MIC method of monitoring can result in a decreased daily dose, decreased trough levels, and decreased incidence of nephrotoxicity.11-14 Although the method for monitoring vancomycin has the potential to affect the incidence of AKI, the majority of patients were monitored using the traditional trough-only method with similar trough levels reported in both groups.
Limitations
This study is limited by its retrospective nature, the potential introduction of biases, and the inability to control for confounders that may have influenced the incidence of AEs. Potential confounders present in this study included the use of concomitant nephrotoxic medications, vancomycin dose, and underlying conditions, as these could have impacted the overall incidence of AEs.
The combination of piperacillin/tazobactam plus vancomycin has commonly been associated with an increased risk of nephrotoxicity. Previous studies have identified this nephrotoxic combination to have a significantly increased risk of AKI compared with vancomycin alone or when used in combination with alternative antibiotics such as cefepime or meropenem.15,16 In our study, there was a higher percentage of patients in the NS group with concomitant piperacillin/tazobactam, so this difference between the groups may have influenced the incidence of AKI. Nephrotoxic medications other than antibiotics were not assessed in this study; however, these also could have impacted our results significantly. While the vancomycin duration of therapy and highest trough levels were similar between groups, the NS group had a larger average daily dose and overall cumulative dose. Studies have identified the risk of nephrotoxicity increases with a vancomycin daily dose of 4 g, troughs > 15 mg/mL, and a duration of therapy > 7 days.15,16 In our study, the daily doses in both groups were < 4 g, so it is likely the average daily vancomycin dose had little impact on the incidence of AKI.
Another potential confounder identified was assessment of underlying conditions in the patients. Due to the limitations associated with the data extraction method, we could not assess for underlying conditions that may have impacted the results. Notably, the potential nephrotoxicity of NS has mostly been shown in critically ill patients. Therefore, the mixed acutely ill patient sample in this study may have been less likely to develop AKI from NS compared with an exclusively critically ill patient sample.
Selection bias and information bias are common with observational studies. In our study, selection bias may have been present since prospective randomization of patient samples was not possible. Since all data were extracted from the medical health record, information bias may have been present with the potential to impact the results. Due to the single-center nature of this study with a predominantly older, white male veteran patient sample, generalizability to other patient populations may be limited. We would expect the results of this study to be similar among other patient populations of a similar age and demographic; however, the external validity of this study may be weak among other populations. Although this study included enough patients based on sample size estimate, a larger sample size could have allowed for detection of smaller differences between groups and decreased the chance for type II error.
Conclusions
Overall, the results of this study do not suggest that the crystalloid used to dilute IV vancomycin is associated with differences in nephrotoxicity or other relevant AEs. Future studies evaluating the potential for AEs from medication diluent are warranted and would benefit from a prospective, randomized design. Further studies are both necessary and crucial for enhancing the quality of care to minimize the rates of AEs of commonly used medications.
Acknowledgment
This material is the result of work supported with resources and the use of facilities at the North Florida/South Georgia Veterans Health System in Gainesville, Florida.
1. Vancomycin hydrochloride intravenous injection, pharmacy bulk package. Package insert. Schaumburg, IL: APP Pharmaceuticals, LLC; 2011.
2. Rybak MJ, Le J, Lodise TP, et al. Therapeutic monitoring of vancomycin for serious methicillin-resistant Staphylococcus aureus infections: a revised consensus guideline and review by the American Society of Health-System Pharmacists, the Infectious Diseases Society of America, the Pediatric Infectious Diseases Society, and the Society of Infectious Diseases Pharmacists. Am J Health-System Pharm. 2020;77(11):835-864. doi:10.1093/ajhp/zxaa036
3. Mehta RL, Kellum JA, Shah SV, et al; Acute Kidney Injury Network. Acute Kidney Injury Network: report of an initiative to improve outcomes in acute kidney injury. Crit Care. 2007;11(2):R31. doi:10.1186/cc5713
4. Elaysi S, Khalili H, Dashti-Khavidaki S, Mohammadpour A. Vancomycin-induced nephrotoxicity: mechanism, incidence, risk factors and special populations–a literature review. Eur J Clin Pharmacol. 2012;68(9):1243-1255. doi:10.1007/s00228-012-1259-9
5. Gyamlani G, Potukuchi PK, Thomas F, et al. Vancomycin-associated acute kidney injury in a large veteran population. Am J Nephrol. 2019;49(2):133-142. doi:10.1159/000496484
6. Semler MW, Self WH, Wanderer JB, et al; SMART Investigators and the Pragmatic Critical Care Research Group. Balanced crystalloids versus saline in critically ill adults. N Engl Med. 2018;378(9):829-839. doi:10.1056/NEJMoa1711584
7. Self WH, Semler MW, Wanderer JP, et al; SMART Investigators and the Pragmatic Critical Care Research Group. Balanced crystalloids versus saline in noncritically ill adults. N Engl J Med. 2018;378(20):819-828. doi:10.1056/NEJMc1804294
8. Young P, Bailey M, Beasley R, et al; SPLIT Investigators; ANZICS CTG. Effect of a buffered crystalloid solution vs saline on acute kidney injury among patients in the intensive care unit: the SPLIT Randomized Clinical Trial. JAMA. 2015;314(16):1701-1710. doi:10.1001/jama.2015.12334
9. Magee CA, Bastin ML, Bastin T, et al. Insidious harm of medication diluents as a contributor to cumulative volume and hyperchloremia: a prospective, open-label, sequential period pilot study. Crit Care Med. 2018;46(8):1217-1223. doi:10.1097/CCM.0000000000003191
10. Adeva-Andany MM, Fernández-Fernández C, Mouriño-Bayolo D, Castro-Quintela E, Domínguez-Montero A. Sodium bicarbonate therapy in patients with metabolic acidosis. ScientificWorldJournal. 2014;2014:627673. doi:10.1155/2014/627673
11. Mcgrady KA, Benton M, Tart S, Bowers R. Evaluation of traditional vancomycin dosing versus utilizing an electronic AUC/MIC dosing program. Pharm Pract (Granada). 2020;18(3):2024. doi:10.18549/PharmPract.2020.3.2024
12. Clark L, Skrupky LP, Servais R, Brummitt CF, Dilworth TJ. Examining the relationship between vancomycin area under the concentration time curve and serum trough levels in adults with presumed or documented staphylococcal infections. Ther Drug Monit. 2019;41(4):483-488. doi:10.1097/FTD.0000000000000622
13. Neely MN, Kato L, Youn G, et al. Prospective trial on the use of trough concentration versus area under the curve to determine therapeutic vancomycin dosing. Antimicrob Agents Chemother. 2018;62(2):e02042-17. doi:10.1128/AAC.02042-17
14. Aljefri DM, Avedissian SN, Youn G, et al. Vancomycin area under the curve and acute kidney injury: a meta-analysis. Clin Infect Dis. 2019;69(11):1881-1887. doi:10.1128/AAC.02042-17
15. Molina KC, Barletta JF, Hall ST, Yazdani C, Huang V. The risk of acute kidney injury in critically ill patients receiving concomitant vancomycin with piperacillin-tazobactam or cefepime. J Intensive Care Med. 2019;35(12):1434-1438. doi:10.1177/0885066619828290
16. Burgess LD, Drew RH. Comparison of the incidence of vancomycin-induced nephrotoxicity in hospitalized patients with and without concomitant piperacillin-tazobactam. Pharmacotherapy. 2014; 34(7):670-676. doi:10.1002/phar.1442
Enhancing Access to Yoga for Older Male Veterans After Cancer: Examining Beliefs About Yoga
Yoga is an effective clinical intervention for cancer survivors. Studies indicate a wide range of benefits, including improvements in physical functioning, emotional well-being and overall quality of life.1-7 Two-thirds of National Cancer Institute designated comprehensive cancer centers offer yoga on-site.8 Yoga is endorsed by the National Comprehensive Cancer Network and American Society of Clinical Oncology for managing symptoms, such as cancer-related anxiety and depression and for improving overall quality of life.9,10
Although the positive effects of yoga on cancer patients are well studied, most published research in this area reports on predominantly middle-aged women with breast cancer.11,12 Less is known about the use of yoga in other groups of cancer patients, such as older adults, veterans, and those from diverse racial or ethnic backgrounds. This gap in the literature is concerning considering that the majority of cancer survivors are aged 60 years or older, and veterans face unique risk factors for cancer associated with herbicide exposure (eg, Agent Orange) and other military-related noxious exposures.13,14 Older cancer survivors may have more difficulty recovering from treatment-related adverse effects, making it especially important to target recovery efforts to older adults.15 Yoga can be adapted for older cancer survivors with age-related comorbidities, similar to adaptations made for older adults who are not cancer survivors but require accommodations for physical limitations.16-20 Similarly, yoga programs targeted to racially diverse cancer survivors are associated with improved mood and well-being in racially diverse cancer survivors, but studies suggest community engagement and cultural adaptation may be important to address the needs of culturally diverse cancer survivors.21-23
Yoga has been increasingly studied within the Veterans Health Administration (VHA) for treatment of posttraumatic stress disorder (PTSD) and has been found effective in reducing symptoms through the use of trauma-informed and military-relevant instruction as well as a military veteran yoga teacher.24-26 This work has not targeted older veterans or cancer survivors who may be more difficult to recruit into such programs, but who would nevertheless benefit.
Clinically, the VHA whole health model is providing increased opportunities for veterans to engage in holistic care including yoga.27 Resources include in-person yoga classes (varies by facility), videos, and handouts with practices uniquely designed for veterans or wounded warriors. As clinicians increasingly refer veterans to these programs, it will be important to develop strategies to engage older veterans in these services.
One important strategy to enhancing access to yoga for older veterans is to consider beliefs about yoga. Beliefs about yoga or general expectations about the outcomes of yoga may be critical to consider in expanding access to yoga in underrepresented groups. Beliefs about yoga may include beliefs about yoga improving health, yoga being difficult or producing discomfort, and yoga involving specific social norms.28 For example, confidence in one’s ability to perform yoga despite discomfort predicted class attendance and practice in a sample of 32 breast cancer survivors.29 Relatedly, positive beliefs about the impact of yoga on health were associated with improvements in mood and quality of life in a sample of 66 cancer survivors.30
The aim of this study was to examine avenues to enhance access to yoga for older veterans, including those from diverse backgrounds, with a focus on the role of beliefs. In the first study we investigate the association between beliefs about and barriers to yoga in a group of older cancer survivors, and we consider the role of demographic and clinical variables in such beliefs and how education may alter beliefs. In alignment with the whole health model of holistic health, we posit that yoga educational materials and resources may contribute to yoga beliefs and work to decrease these barriers. We apply these findings in a second study that enrolled older veterans in yoga and examining the impact of program participation on beliefs and the role of beliefs in program outcomes. In the discussion we return to consider how to increase access to yoga to older veterans based on these findings.
Methods
Study 1 participants were identified from VHA tumor registries. Eligible patients had head and neck, esophageal, gastric, or colorectal cancers and were excluded if they were in hospice care, had dementia, or had a psychotic spectrum disorder. Participants completed a face-to-face semistructured interview at 6, 12, and 18 months after their cancer diagnosis with a trained interviewer. Complete protocol methods, including nonresponder information, are described elsewhere.31
Questions about yoga were asked at the 12 month postdiagnosis interview. Participants were read the following: “Here is a list of services some patients use to recover from cancer. Please tell me if you have used any of these.” The list included yoga, physical therapy, occupational therapy, exercise, meditation, or massage therapy. Next participants were provided education about yoga via the following description: “Yoga is a practice of stress reduction and exercise with stretching, holding positions and deep breathing. For some, it may improve your sleep, energy, flexibility, anxiety, and pain. The postures are done standing, sitting, or lying down. If needed, it can be done all from a chair.” We then asked whether they would attend if yoga was offered at the VHA hospital (yes, no, maybe). Participants provided brief responses to 2 open-ended questions: (“If I came to a yoga class, I …”; and “Is there anything that might make you more likely to come to a yoga class?”) Responses were transcribed verbatim and entered into a database for qualitative analysis. Subsequently, participants completed standardized measures of health-related quality of life and beliefs about yoga as described below.
Study 2 participants were identified from VHA tumor registries and a cancer support group. Eligible patients had a diagnosis of cancer (any type except basil cell carcinoma) within the previous 3 years and were excluded if they were in hospice care, had dementia, or had a psychotic spectrum disorder. Participants completed face-to-face semistructured interviews with a trained interviewer before and after participation in an 8-week yoga group that met twice per week. Complete protocol methods are described elsewhere.16 This paper focuses on 28 of the 37 enrolled patients for whom we have complete pre- and postclass interview data. We previously reported on adaptations made to yoga in our pilot group of 14 individuals, who in this small sample did not show statistically significant changes in their quality of life from before to after the class.16 This analysis includes those 14 individuals and 14 who participated in additional classes, focusing on beliefs, which were not previously reported.
Measures
Participants reported their age, gender, ethnicity (Hispanic/Latino or not), race, and level of education. Information about the cancer diagnosis, American Joint Committee on Cancer (AJCC) cancer stage, and treatments was obtained from the medical record. The Physical Function and Anxiety Subscales from the Patient-Reported Outcomes Measurement Information System were used to measure health-related quality of life (HRQoL).32-34 Items are rated on a Likert scale from 1 (not at all) to 5 (very much).
The Beliefs About Yoga Scale (BAYS) was used to measure beliefs about the outcomes of engaging in yoga.28 The 11-item scale has 3 factors: expected health benefits (5 items), expected discomfort (3 items), and expected social norms (3 items). Items from the expected discomfort and expected social norms are reverse scored so that a higher score indicates more positive beliefs. To reduce participant burden, in study 1 we selected 1 item from each factor with high factor loadings in the original cross-validation sample.28 It would improve my overall health (Benefit, factor loading = .89); I would have to be more flexible to take a class (Discomfort, factor loading = .67); I would be embarrassed in a class (Social norms, factor loading = .75). Participants in study 2 completed the entire 11-item scale. Items were summed to create subscales and total scales.
Analysis
Descriptive statistics were used in study 1 to characterize participants’ yoga experience and interest. Changes in interest pre- and posteducation were evaluated with χ2 comparison of distribution. The association of beliefs about yoga with 3 levels of interest (yes, no, maybe) was evaluated through analysis of variance (ANOVA) comparing the mean score on the summed BAYS items among the 3 groups. The association of demographic (age, education, race) and clinical factors (AJCC stage, physical function) with BAYS was determined through multivariate linear regression.
For analytic purposes, due to small subgroup sample sizes we compared those who identified as non-Hispanic White adults to those who identified as African American/Hispanic/other persons. To further evaluate the relationship of age to yoga beliefs, we examined beliefs about yoga in 3 age groups (40-59 years [n = 24]; 60-69 years [n = 58]; 70-89 years [n = 28]) using ANOVA comparing the mean score on the summed BAYS items among the 3 groups. In study 2, changes in interest before and after the yoga program were evaluated with paired t tests and repeated ANOVA, with beliefs about yoga prior to class as a covariate. The association of demographic and clinical factors with BAYS was determined as in the first sample through multivariate linear regression, except the variable of race was not included due to small sample size (ie, only 3 individuals identified as persons of color).
Thematic analysis in which content-related codes were developed and subsequently grouped together was applied to the data of 110 participants who responded to the open-ended survey questions in study 1 to further illuminate responses to closed-ended questions.35 Transcribed responses to the open-ended questions were transferred to a spreadsheet. An initial code book with code names, definitions, and examples was developed based on an inductive method by one team member (EA).35 Initially, coding and tabulation were conducted separately for each question but it was noted that content extended across response prompts (eg, responses to question 2 “What might make you more likely to come?” were spontaneously provided when answering question 1), thus coding was collapsed across questions. Next, 2 team members (EA, KD) coded the same responses, meeting weekly to discuss discrepancies. The code book was revised following each meeting to reflect refinements in code names and definitions, adding newly generated codes as needed. The process continued until consensus and data saturation was obtained, with 90% intercoder agreement. Next, these codes were subjected to thematic analysis by 2 team members (EA, KD) combining codes into 6 overarching themes. The entire team reviewed the codes and identified 2 supra themes: positive beliefs or facilitators and negative beliefs or barriers.
Consistent with the concept of reflexivity in qualitative research, we acknowledge the influence of the research team members on the qualitative process.36 The primary coding team (EA, KD) are both researchers and employees of Veterans Affairs Boston Healthcare System who have participated in other research projects involving veterans and qualitative analyses but are not yoga instructors or yoga researchers.
Results
Study 1
The sample of 110 military veterans was mostly male (99.1%) with a mean (SD) age of 64.9 (9.4) years (range, 41-88)(Table 1). The majority (70.9%) described their race/ethnicity as White, non-Hispanic followed by Black/African American (18.2%) and Hispanic (8.2%) persons; 50.0% had no more than a high school education. The most common cancer diagnoses were colorectal (50.9%), head and neck (39.1%), and esophageal and gastric (10.0%) and ranged from AJCC stages I to IV.
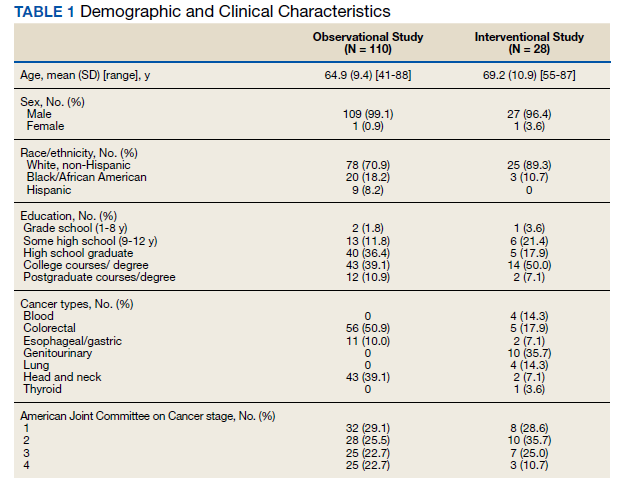
When first asked, the majority of participants (78.2%) reported that they were not interested in yoga, 16.4% reported they might be interested, and 5.5% reported they had tried a yoga class since their cancer diagnosis. In contrast, 40.9% used exercise, 32.7% used meditation, 14.5% used physical or occupational therapy, and 11.8% used massage therapy since their cancer diagnosis.
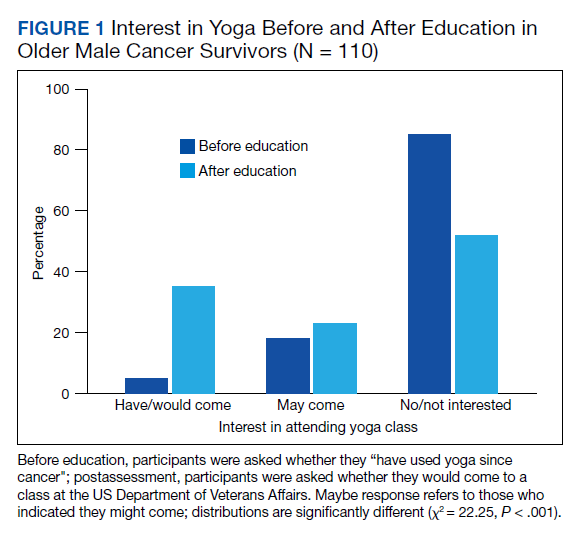
After participants were provided the brief scripted education about yoga, the level of interest shifted: 46.4% not interested, 21.8% interested, and 31.8% definitely interested, demonstrating a statistically significant shift in interest following education (χ2 = 22.25, P < .001) (Figure 1). Those with the most positive beliefs about yoga were most likely to indicate interest. Using the BAYS 3-item survey, the mean (SD) for the definitely interested, might be interested, and not interested groups was 15.1 (3.2), 14.1 (3.2), and 12.3 (2.5), respectively (F = 10.63, P < .001).
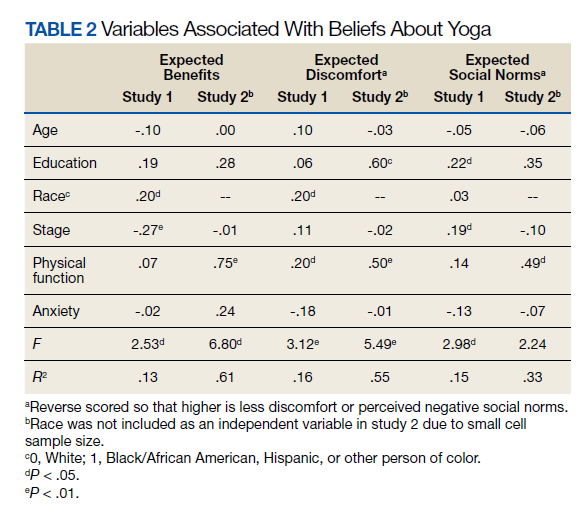
A multivariable regression was run to examine possible associations between participants’ demographic characteristics, clinical characteristics, and beliefs about yoga as measured by the 3 BAYS items (Table 2). Higher expected health benefits of yoga was associated with identifying as
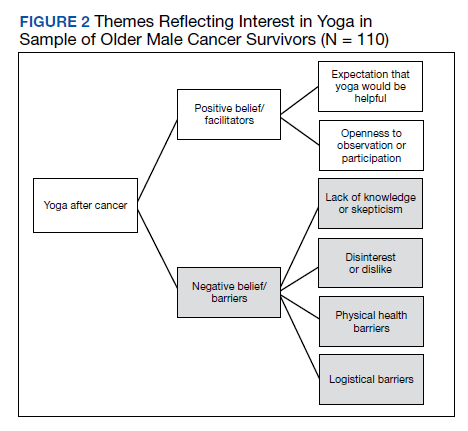
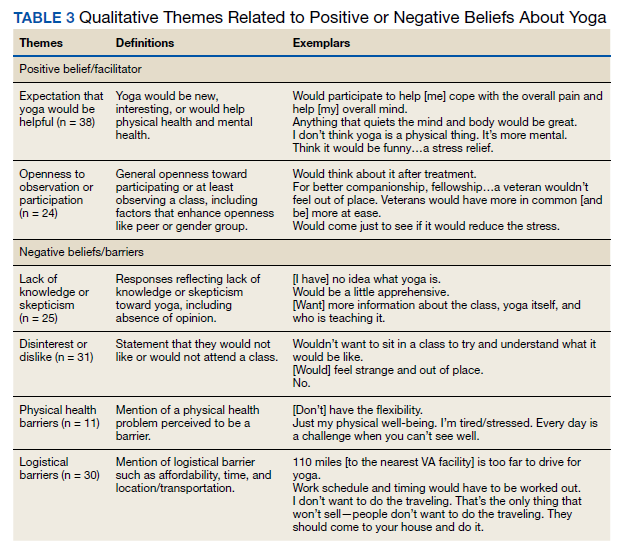
Six themes were identified in qualitative analysis of semistructured interviews reflecting older veterans’ beliefs about yoga, which were grouped into the following suprathemes of positive vs negative beliefs (Figure 2). Exemplar responses appear in Table 3.
Study 2 Intervention Sample
This sample of 28 veterans was mostly male (96.4%) with a mean (SD) age of 69.2 (10.9) years (range, 57-87). The majority (89.3%) described their race as White, followed by Black/African American (10.7%); no participants self-identified in other categories for race/ethnicity. Twelve veterans (42.9%) had no more than a high school education. The most common cancer diagnosis was genitourinary (35.7%) and the AJCC stage ranged from I to IV.
We employed information learned in study 1 to enhance access in study 2. We mailed letters to 278 veterans diagnosed with cancer in the previous 3 years that provided education about yoga based on study 1 findings. Of 207 veterans reached by phone, 133 (64%) stated they were not interested in coming to a yoga class; 74 (36%) were interested, but 30 felt they were unable to attend due to obstacles such as illness or travel. Ultimately 37 (18%) veterans agreed and consented to the class, and 28 (14%) completed postclass surveys.
In multivariate regression, higher expected health benefits of yoga were associated with higher physical function, lower concern about expected discomfort was also associated with higher physical function as well as higher education; similarly, lower concern about expected social norms was associated with higher physical function. Age was not associated with any of the BAYS factors.
Beliefs about yoga improved from before to after class for all 3 domains with greater expected benefit and lower concerns about discomfort or social norms:
Discussion
Yoga is an effective clinical intervention for addressing some long-term adverse effects in cancer survivors, although the body of research focuses predominantly on middle aged, female, White, college-educated breast cancer survivors. There is no evidence to suggest yoga would be less effective in other groups, but it has not been extensively studied in survivors from diverse subgroups. Beliefs about yoga are a factor that may enhance interest in yoga interventions and research, and measures aimed at addressing potential beliefs and fears may capture information that can be used to support older cancer survivors in holistic health. The aims of this study were to examine beliefs about yoga in 2 samples of older cancer survivors who received VHA care. The main findings are (1) interest in yoga was initially low and lower than that of other complementary or exercise-based interventions, but increased when participants were provided brief education about yoga; (2) interest in yoga was associated with beliefs about yoga with qualitative comments illuminating these beliefs; (3) demographic characteristics (education, race) and physical function were associated with beliefs about yoga; and (4) positive beliefs about yoga increased following a brief yoga intervention and was associated with improvements in physical function.
Willingness to consider a class appeared to shift for some older veterans when they were presented brief information about yoga that explained what is involved, how it might help, and that it could be done from a chair if needed. These findings clearly indicated that when trying to enhance participation in yoga in clinical or research programs, it will be important that recruitment materials provide such information. This finding is consistent with the qualitative findings that reflected a lack of knowledge or skepticism about benefits of yoga among some participants. Given the finding that physical function was associated with beliefs about yoga and was also a prominent theme in qualitative analyses,
Age was not associated with beliefs about yoga in either study. Importantly, in a more detailed study 1 follow-up analysis, beliefs about yoga were equivalent for aged > 70 years compared with those aged 40 to 69 years. It is not entirely clear why older adults have been underrepresented in studies of yoga in cancer survivors. However, older adults are vastly underrepresented in clinical trials for many health conditions, even though they are more likely to experience many diseases, including cancer.37 A new National Institutes of Health policy requires that individuals of all ages, including older adults, must be included in all human subjects research unless there are scientific reasons not to include them.38 It is therefore imperative to consider strategies to address underrepresentation of older adults.
Qualitative findings here suggest it will be important to consider logistical barriers including transportation and affordability as well as adaptations requested by older adults (eg, preferences for older teachers).18
Although our sample was small, we also found that adults from diverse racial and ethnic backgrounds had more positive beliefs about yoga, such that this finding should be interpreted with caution. Similar to older adults, individuals from diverse racial and ethnic groups are also underrepresented in clinical trials and may have lower access to complementary treatments. Cultural and linguistic adaptations and building community partnerships should be considered in both recruitment and intervention delivery strategies.40We learned that education about yoga may increase interest and that it is possible to recruit older veterans to yoga class. Nevertheless, in study 2, our rate of full participation was low, with only about 1 in 10 participating. Additional efforts to enhance beliefs about yoga and to addresslogistical barriers (offering telehealth yoga) are needed to best reach older veterans.
Limitations
These findings have several limitations. First, participants were homogeneous in age, gender, race/ethnicity and veteran status, which provides a window into this understudied population but limits generalizability and our ability to control across populations. Second, the sample size limited the ability to conduct subgroup and interaction analyses, such as examining potential differential effects of cancer type, treatment, and PTSD on yoga beliefs or to consider the relationship of yoga beliefs with changes in quality of life before and after the yoga intervention in study 2. Additionally, age was not associated with beliefs about yoga in these samples that of mostly older adults. We were able to compare middle-aged and older adults but could not compare beliefs about yoga to adults aged in their 20s and 30s. Last, our study excluded people with dementia and psychotic disorders. Further research is needed to examine yoga for older cancer survivors who have these conditions.
Conclusions
Education that specifically informs potential participants about yoga practice, potential modifications, and potential benefits, as well as adaptations to programs that address physical and logistical barriers may be useful in increasing access to and participation in yoga for older Veterans who are cancer survivors.
Acknowledgments/Funding
The authors have no financial or personal relationships to disclose. This work was supported by the US Department of Veterans Affairs (VA) Rehabilitation Research and Development Service. This material is the result of work supported with resources and the use of facilities at the VA Boston Healthcare System, Bedford VA Medical Center, and Michael E. DeBakey VA Medical Center in Houston, Texas. We thank the members of the Veterans Cancer Rehabilitation Study (Vetcares) Research teams in Boston and in Houston and the veterans who have participated in our research studies and allow us to contribute to their health care.
1. Mustian KM, Sprod LK, Janelsins M, et al. Multicenter, randomized controlled trial of yoga for sleep quality among cancer survivors. J Clin Oncol. 2013;31(26):3233-3241. doi:10.1200/JCO.2012.43.7707
2. Chandwani KD, Thornton B, Perkins GH, et al. Yoga improves quality of life and benefit finding in women undergoing radiotherapy for breast cancer. J Soc Integr Oncol. 2010;8(2):43-55.
3. Erratum: Primary follicular lymphoma of disguised as multiple miliary like lesions: A case report and review of literature. Indian J Pathol Microbiol. 2018;61(4):643. doi:10.4103/0377-4929.243009
4. Eyigor S, Uslu R, Apaydın S, Caramat I, Yesil H. Can yoga have any effect on shoulder and arm pain and quality of life in patients with breast cancer? A randomized, controlled, single-blind trial. Complement Ther Clin Pract. 2018;32:40-45. doi:10.1016/j.ctcp.2018.04.010
5. Loudon A, Barnett T, Piller N, Immink MA, Williams AD. Yoga management of breast cancer-related lymphoedema: a randomised controlled pilot-trial. BMC Complement Altern Med. 2014;14:214. Published 2014 Jul 1. doi:10.1186/1472-6882-14-214
6. Browning KK, Kue J, Lyons F, Overcash J. Feasibility of mind-body movement programs for cancer survivors. Oncol Nurs Forum. 2017;44(4):446-456. doi:10.1188/17.ONF.446-456
7. Rosenbaum MS, Velde J. The effects of yoga, massage, and reiki on patient well-being at a cancer resource center. Clin J Oncol Nurs. 2016;20(3):E77-E81. doi:10.1188/16.CJON.E77-E81
8. Yun H, Sun L, Mao JJ. Growth of integrative medicine at leading cancer centers between 2009 and 2016: a systematic analysis of NCI-designated comprehensive cancer center websites. J Natl Cancer Inst Monogr. 2017;2017(52):lgx004. doi:10.1093/jncimonographs/lgx004
9. Sanft T, Denlinger CS, Armenian S, et al. NCCN guidelines insights: survivorship, version 2.2019. J Natl Compr Canc Netw. 2019;17(7):784-794. doi:10.6004/jnccn.2019.0034
10. Lyman GH, Greenlee H, Bohlke K, et al. Integrative therapies during and after breast cancer treatment: ASCO endorsement of the SIO clinical practice guideline. J Clin Oncol. 2018;36(25):2647-2655. doi:10.1200/JCO.2018.79.2721
11. Culos-Reed SN, Mackenzie MJ, Sohl SJ, Jesse MT, Zahavich AN, Danhauer SC. Yoga & cancer interventions: a review of the clinical significance of patient reported outcomes for cancer survivors. Evid Based Complement Alternat Med. 2012;2012:642576. doi:10.1155/2012/642576
12. Danhauer SC, Addington EL, Cohen L, et al. Yoga for symptom management in oncology: a review of the evidence base and future directions for research. Cancer. 2019;125(12):1979-1989. doi:10.1002/cncr.31979
13. Siegel RL, Miller KD, Jemal A. Cancer statistics, 2019. CA Cancer J Clin. 2019;69(1):7-34. doi:10.3322/caac.21551
14. US Department of Veterans Affairs. Veterans’ diseases associated with Agent Orange. Updated June 16, 2021. Accessed September 22, 2021. https://www.publichealth.va.gov/exposures/agentorange/conditions
15. Deimling GT, Arendt JA, Kypriotakis G, Bowman KF. Functioning of older, long-term cancer survivors: the role of cancer and comorbidities. J Am Geriatr Soc. 2009;57(suppl 2):S289-S292. doi:10.1111/j.1532-5415.2009.02515.x
16. King K, Gosian J, Doherty K, et al. Implementing yoga therapy adapted for older veterans who are cancer survivors. Int J Yoga Therap. 2014;24:87-96.
17. Wertman A, Wister AV, Mitchell BA. On and off the mat: yoga experiences of middle-aged and older adults. Can J Aging. 2016;35(2):190-205. doi:10.1017/S0714980816000155
18. Chen KM, Wang HH, Li CH, Chen MH. Community vs. institutional elders’ evaluations of and preferences for yoga exercises. J Clin Nurs. 2011;20(7-8):1000-1007. doi:10.1111/j.1365-2702.2010.03337.x
19. Saravanakumar P, Higgins IJ, Van Der Riet PJ, Sibbritt D. Tai chi and yoga in residential aged care: perspectives of participants: A qualitative study. J Clin Nurs. 2018;27(23-24):4390-4399. doi:10.1111/jocn.14590
20. Fan JT, Chen KM. Using silver yoga exercises to promote physical and mental health of elders with dementia in long-term care facilities. Int Psychogeriatr. 2011;23(8):1222-1230. doi:10.1017/S1041610211000287
21. Taylor TR, Barrow J, Makambi K, et al. A restorative yoga intervention for African-American breast cancer survivors: a pilot study. J Racial Ethn Health Disparities. 2018;5(1):62-72. doi:10.1007/s40615-017-0342-4
22. Moadel AB, Shah C, Wylie-Rosett J, et al. Randomized controlled trial of yoga among a multiethnic sample of breast cancer patients: effects on quality of life. J Clin Oncol. 2007;25(28):4387-4395. doi:10.1200/JCO.2006.06.6027
23. Smith SA, Whitehead MS, Sheats JQ, Chubb B, Alema-Mensah E, Ansa BE. Community engagement to address socio-ecological barriers to physical activity among African American breast cancer survivors. J Ga Public Health Assoc. 2017;6(3):393-397. doi:10.21633/jgpha.6.312
24. Cushing RE, Braun KL, Alden C-Iayt SW, Katz AR. Military-Tailored Yoga for Veterans with Post-traumatic Stress Disorder. Mil Med. 2018;183(5-6):e223-e231. doi:10.1093/milmed/usx071
25. Davis LW, Schmid AA, Daggy JK, et al. Symptoms improve after a yoga program designed for PTSD in a randomized controlled trial with veterans and civilians. Psychol Trauma. 2020;12(8):904-912. doi:10.1037/tra0000564
26. Chopin SM, Sheerin CM, Meyer BL. Yoga for warriors: An intervention for veterans with comorbid chronic pain and PTSD. Psychol Trauma. 2020;12(8):888-896. doi:10.1037/tra0000649
27. US Department of Veterans Affairs. Whole health. Updated September 13, 2021. Accessed September 22, 2021. https://www.va.gov/wholehealth
28. Sohl SJ, Schnur JB, Daly L, Suslov K, Montgomery GH. Development of the beliefs about yoga scale. Int J Yoga Therap. 2011;(21):85-91.
29. Cadmus-Bertram L, Littman AJ, Ulrich CM, et al. Predictors of adherence to a 26-week viniyoga intervention among post-treatment breast cancer survivors. J Altern Complement Med. 2013;19(9):751-758. doi:10.1089/acm.2012.0118
30. Mackenzie MJ, Carlson LE, Ekkekakis P, Paskevich DM, Culos-Reed SN. Affect and mindfulness as predictors of change in mood disturbance, stress symptoms, and quality of life in a community-based yoga program for cancer survivors. Evid Based Complement Alternat Med. 2013;2013:419496. doi:10.1155/2013/419496
31. Naik AD, Martin LA, Karel M, et al. Cancer survivor rehabilitation and recovery: protocol for the Veterans Cancer Rehabilitation Study (Vet-CaRes). BMC Health Serv Res. 2013;13:93. Published 2013 Mar 11. doi:10.1186/1472-6963-13-93
32. Northwestern University. PROMIS Health Organization and the PROMIS Cooperative Group. PROMIS Short Form v2.0 - Physical Function 6b. Accessed September 24, 2021. https://www.healthmeasures.net/index.php?option=com_instruments&view=measure&id=793&Itemid=992
33. Northwestern University. PROMIS Health Organization and the PROMIS Cooperative Group. PROMIS Short Form v1.0 - Anxiety 6a. Accessed September 24, 2021. https://www.healthmeasures.net/index.php?option=com_instruments&view=measure&id=145&Itemid=992
34. Northwestern University. PROMIS Health Organization and the PROMIS Cooperative Group. PROMIS-43 Profile v2.1. Accessed September 24, 2021. https://www.healthmeasures.net/index.php?option=com_instruments&view=measure&id=858&Itemid=992
35. Todd NJ, Jones SH, Lobban FA. “Recovery” in bipolar disorder: how can service users be supported through a self-management intervention? A qualitative focus group study. J Ment Health. 2012;21(2):114-126. doi:10.3109/09638237.2011.621471
36. Finlay L. “Outing” the researcher: the provenance, process, and practice of reflexivity. Qual Health Res. 2002;12(4):531-545. doi:10.1177/104973202129120052
37. Herrera AP, Snipes SA, King DW, Torres-Vigil I, Goldberg DS, Weinberg AD. Disparate inclusion of older adults in clinical trials: priorities and opportunities for policy and practice change. Am J Public Health. 2010;10(suppl 1):S105-S112. doi:10.2105/AJPH.2009.162982
38. National Institutes of Health. Revision: NIH policy and guidelines on the inclusion of individuals across the lifespan as participants in research involving human subjects. Published December 19, 2017. Accessed September 22, 2021. https://grants.nih.gov/grants/guide/notice-files/NOT-OD-18-116.html
39. Townsley CA, Selby R, Siu LL. Systematic review of barriers to the recruitment of older patients with cancer onto clinical trials. J Clin Oncol. 2005;23(13):3112-3124. doi:10.1200/JCO.2005.00.141
40. Vuong I, Wright J, Nolan MB, et al. Overcoming barriers: evidence-based strategies to increase enrollment of underrepresented populations in cancer therapeutic clinical trials-a narrative review. J Cancer Educ. 2020;35(5):841-849. doi:10.1007/s13187-019-01650-y
Yoga is an effective clinical intervention for cancer survivors. Studies indicate a wide range of benefits, including improvements in physical functioning, emotional well-being and overall quality of life.1-7 Two-thirds of National Cancer Institute designated comprehensive cancer centers offer yoga on-site.8 Yoga is endorsed by the National Comprehensive Cancer Network and American Society of Clinical Oncology for managing symptoms, such as cancer-related anxiety and depression and for improving overall quality of life.9,10
Although the positive effects of yoga on cancer patients are well studied, most published research in this area reports on predominantly middle-aged women with breast cancer.11,12 Less is known about the use of yoga in other groups of cancer patients, such as older adults, veterans, and those from diverse racial or ethnic backgrounds. This gap in the literature is concerning considering that the majority of cancer survivors are aged 60 years or older, and veterans face unique risk factors for cancer associated with herbicide exposure (eg, Agent Orange) and other military-related noxious exposures.13,14 Older cancer survivors may have more difficulty recovering from treatment-related adverse effects, making it especially important to target recovery efforts to older adults.15 Yoga can be adapted for older cancer survivors with age-related comorbidities, similar to adaptations made for older adults who are not cancer survivors but require accommodations for physical limitations.16-20 Similarly, yoga programs targeted to racially diverse cancer survivors are associated with improved mood and well-being in racially diverse cancer survivors, but studies suggest community engagement and cultural adaptation may be important to address the needs of culturally diverse cancer survivors.21-23
Yoga has been increasingly studied within the Veterans Health Administration (VHA) for treatment of posttraumatic stress disorder (PTSD) and has been found effective in reducing symptoms through the use of trauma-informed and military-relevant instruction as well as a military veteran yoga teacher.24-26 This work has not targeted older veterans or cancer survivors who may be more difficult to recruit into such programs, but who would nevertheless benefit.
Clinically, the VHA whole health model is providing increased opportunities for veterans to engage in holistic care including yoga.27 Resources include in-person yoga classes (varies by facility), videos, and handouts with practices uniquely designed for veterans or wounded warriors. As clinicians increasingly refer veterans to these programs, it will be important to develop strategies to engage older veterans in these services.
One important strategy to enhancing access to yoga for older veterans is to consider beliefs about yoga. Beliefs about yoga or general expectations about the outcomes of yoga may be critical to consider in expanding access to yoga in underrepresented groups. Beliefs about yoga may include beliefs about yoga improving health, yoga being difficult or producing discomfort, and yoga involving specific social norms.28 For example, confidence in one’s ability to perform yoga despite discomfort predicted class attendance and practice in a sample of 32 breast cancer survivors.29 Relatedly, positive beliefs about the impact of yoga on health were associated with improvements in mood and quality of life in a sample of 66 cancer survivors.30
The aim of this study was to examine avenues to enhance access to yoga for older veterans, including those from diverse backgrounds, with a focus on the role of beliefs. In the first study we investigate the association between beliefs about and barriers to yoga in a group of older cancer survivors, and we consider the role of demographic and clinical variables in such beliefs and how education may alter beliefs. In alignment with the whole health model of holistic health, we posit that yoga educational materials and resources may contribute to yoga beliefs and work to decrease these barriers. We apply these findings in a second study that enrolled older veterans in yoga and examining the impact of program participation on beliefs and the role of beliefs in program outcomes. In the discussion we return to consider how to increase access to yoga to older veterans based on these findings.
Methods
Study 1 participants were identified from VHA tumor registries. Eligible patients had head and neck, esophageal, gastric, or colorectal cancers and were excluded if they were in hospice care, had dementia, or had a psychotic spectrum disorder. Participants completed a face-to-face semistructured interview at 6, 12, and 18 months after their cancer diagnosis with a trained interviewer. Complete protocol methods, including nonresponder information, are described elsewhere.31
Questions about yoga were asked at the 12 month postdiagnosis interview. Participants were read the following: “Here is a list of services some patients use to recover from cancer. Please tell me if you have used any of these.” The list included yoga, physical therapy, occupational therapy, exercise, meditation, or massage therapy. Next participants were provided education about yoga via the following description: “Yoga is a practice of stress reduction and exercise with stretching, holding positions and deep breathing. For some, it may improve your sleep, energy, flexibility, anxiety, and pain. The postures are done standing, sitting, or lying down. If needed, it can be done all from a chair.” We then asked whether they would attend if yoga was offered at the VHA hospital (yes, no, maybe). Participants provided brief responses to 2 open-ended questions: (“If I came to a yoga class, I …”; and “Is there anything that might make you more likely to come to a yoga class?”) Responses were transcribed verbatim and entered into a database for qualitative analysis. Subsequently, participants completed standardized measures of health-related quality of life and beliefs about yoga as described below.
Study 2 participants were identified from VHA tumor registries and a cancer support group. Eligible patients had a diagnosis of cancer (any type except basil cell carcinoma) within the previous 3 years and were excluded if they were in hospice care, had dementia, or had a psychotic spectrum disorder. Participants completed face-to-face semistructured interviews with a trained interviewer before and after participation in an 8-week yoga group that met twice per week. Complete protocol methods are described elsewhere.16 This paper focuses on 28 of the 37 enrolled patients for whom we have complete pre- and postclass interview data. We previously reported on adaptations made to yoga in our pilot group of 14 individuals, who in this small sample did not show statistically significant changes in their quality of life from before to after the class.16 This analysis includes those 14 individuals and 14 who participated in additional classes, focusing on beliefs, which were not previously reported.
Measures
Participants reported their age, gender, ethnicity (Hispanic/Latino or not), race, and level of education. Information about the cancer diagnosis, American Joint Committee on Cancer (AJCC) cancer stage, and treatments was obtained from the medical record. The Physical Function and Anxiety Subscales from the Patient-Reported Outcomes Measurement Information System were used to measure health-related quality of life (HRQoL).32-34 Items are rated on a Likert scale from 1 (not at all) to 5 (very much).
The Beliefs About Yoga Scale (BAYS) was used to measure beliefs about the outcomes of engaging in yoga.28 The 11-item scale has 3 factors: expected health benefits (5 items), expected discomfort (3 items), and expected social norms (3 items). Items from the expected discomfort and expected social norms are reverse scored so that a higher score indicates more positive beliefs. To reduce participant burden, in study 1 we selected 1 item from each factor with high factor loadings in the original cross-validation sample.28 It would improve my overall health (Benefit, factor loading = .89); I would have to be more flexible to take a class (Discomfort, factor loading = .67); I would be embarrassed in a class (Social norms, factor loading = .75). Participants in study 2 completed the entire 11-item scale. Items were summed to create subscales and total scales.
Analysis
Descriptive statistics were used in study 1 to characterize participants’ yoga experience and interest. Changes in interest pre- and posteducation were evaluated with χ2 comparison of distribution. The association of beliefs about yoga with 3 levels of interest (yes, no, maybe) was evaluated through analysis of variance (ANOVA) comparing the mean score on the summed BAYS items among the 3 groups. The association of demographic (age, education, race) and clinical factors (AJCC stage, physical function) with BAYS was determined through multivariate linear regression.
For analytic purposes, due to small subgroup sample sizes we compared those who identified as non-Hispanic White adults to those who identified as African American/Hispanic/other persons. To further evaluate the relationship of age to yoga beliefs, we examined beliefs about yoga in 3 age groups (40-59 years [n = 24]; 60-69 years [n = 58]; 70-89 years [n = 28]) using ANOVA comparing the mean score on the summed BAYS items among the 3 groups. In study 2, changes in interest before and after the yoga program were evaluated with paired t tests and repeated ANOVA, with beliefs about yoga prior to class as a covariate. The association of demographic and clinical factors with BAYS was determined as in the first sample through multivariate linear regression, except the variable of race was not included due to small sample size (ie, only 3 individuals identified as persons of color).
Thematic analysis in which content-related codes were developed and subsequently grouped together was applied to the data of 110 participants who responded to the open-ended survey questions in study 1 to further illuminate responses to closed-ended questions.35 Transcribed responses to the open-ended questions were transferred to a spreadsheet. An initial code book with code names, definitions, and examples was developed based on an inductive method by one team member (EA).35 Initially, coding and tabulation were conducted separately for each question but it was noted that content extended across response prompts (eg, responses to question 2 “What might make you more likely to come?” were spontaneously provided when answering question 1), thus coding was collapsed across questions. Next, 2 team members (EA, KD) coded the same responses, meeting weekly to discuss discrepancies. The code book was revised following each meeting to reflect refinements in code names and definitions, adding newly generated codes as needed. The process continued until consensus and data saturation was obtained, with 90% intercoder agreement. Next, these codes were subjected to thematic analysis by 2 team members (EA, KD) combining codes into 6 overarching themes. The entire team reviewed the codes and identified 2 supra themes: positive beliefs or facilitators and negative beliefs or barriers.
Consistent with the concept of reflexivity in qualitative research, we acknowledge the influence of the research team members on the qualitative process.36 The primary coding team (EA, KD) are both researchers and employees of Veterans Affairs Boston Healthcare System who have participated in other research projects involving veterans and qualitative analyses but are not yoga instructors or yoga researchers.
Results
Study 1
The sample of 110 military veterans was mostly male (99.1%) with a mean (SD) age of 64.9 (9.4) years (range, 41-88)(Table 1). The majority (70.9%) described their race/ethnicity as White, non-Hispanic followed by Black/African American (18.2%) and Hispanic (8.2%) persons; 50.0% had no more than a high school education. The most common cancer diagnoses were colorectal (50.9%), head and neck (39.1%), and esophageal and gastric (10.0%) and ranged from AJCC stages I to IV.
When first asked, the majority of participants (78.2%) reported that they were not interested in yoga, 16.4% reported they might be interested, and 5.5% reported they had tried a yoga class since their cancer diagnosis. In contrast, 40.9% used exercise, 32.7% used meditation, 14.5% used physical or occupational therapy, and 11.8% used massage therapy since their cancer diagnosis.
After participants were provided the brief scripted education about yoga, the level of interest shifted: 46.4% not interested, 21.8% interested, and 31.8% definitely interested, demonstrating a statistically significant shift in interest following education (χ2 = 22.25, P < .001) (Figure 1). Those with the most positive beliefs about yoga were most likely to indicate interest. Using the BAYS 3-item survey, the mean (SD) for the definitely interested, might be interested, and not interested groups was 15.1 (3.2), 14.1 (3.2), and 12.3 (2.5), respectively (F = 10.63, P < .001).
A multivariable regression was run to examine possible associations between participants’ demographic characteristics, clinical characteristics, and beliefs about yoga as measured by the 3 BAYS items (Table 2). Higher expected health benefits of yoga was associated with identifying as
Six themes were identified in qualitative analysis of semistructured interviews reflecting older veterans’ beliefs about yoga, which were grouped into the following suprathemes of positive vs negative beliefs (Figure 2). Exemplar responses appear in Table 3.
Study 2 Intervention Sample
This sample of 28 veterans was mostly male (96.4%) with a mean (SD) age of 69.2 (10.9) years (range, 57-87). The majority (89.3%) described their race as White, followed by Black/African American (10.7%); no participants self-identified in other categories for race/ethnicity. Twelve veterans (42.9%) had no more than a high school education. The most common cancer diagnosis was genitourinary (35.7%) and the AJCC stage ranged from I to IV.
We employed information learned in study 1 to enhance access in study 2. We mailed letters to 278 veterans diagnosed with cancer in the previous 3 years that provided education about yoga based on study 1 findings. Of 207 veterans reached by phone, 133 (64%) stated they were not interested in coming to a yoga class; 74 (36%) were interested, but 30 felt they were unable to attend due to obstacles such as illness or travel. Ultimately 37 (18%) veterans agreed and consented to the class, and 28 (14%) completed postclass surveys.
In multivariate regression, higher expected health benefits of yoga were associated with higher physical function, lower concern about expected discomfort was also associated with higher physical function as well as higher education; similarly, lower concern about expected social norms was associated with higher physical function. Age was not associated with any of the BAYS factors.
Beliefs about yoga improved from before to after class for all 3 domains with greater expected benefit and lower concerns about discomfort or social norms:
Discussion
Yoga is an effective clinical intervention for addressing some long-term adverse effects in cancer survivors, although the body of research focuses predominantly on middle aged, female, White, college-educated breast cancer survivors. There is no evidence to suggest yoga would be less effective in other groups, but it has not been extensively studied in survivors from diverse subgroups. Beliefs about yoga are a factor that may enhance interest in yoga interventions and research, and measures aimed at addressing potential beliefs and fears may capture information that can be used to support older cancer survivors in holistic health. The aims of this study were to examine beliefs about yoga in 2 samples of older cancer survivors who received VHA care. The main findings are (1) interest in yoga was initially low and lower than that of other complementary or exercise-based interventions, but increased when participants were provided brief education about yoga; (2) interest in yoga was associated with beliefs about yoga with qualitative comments illuminating these beliefs; (3) demographic characteristics (education, race) and physical function were associated with beliefs about yoga; and (4) positive beliefs about yoga increased following a brief yoga intervention and was associated with improvements in physical function.
Willingness to consider a class appeared to shift for some older veterans when they were presented brief information about yoga that explained what is involved, how it might help, and that it could be done from a chair if needed. These findings clearly indicated that when trying to enhance participation in yoga in clinical or research programs, it will be important that recruitment materials provide such information. This finding is consistent with the qualitative findings that reflected a lack of knowledge or skepticism about benefits of yoga among some participants. Given the finding that physical function was associated with beliefs about yoga and was also a prominent theme in qualitative analyses,
Age was not associated with beliefs about yoga in either study. Importantly, in a more detailed study 1 follow-up analysis, beliefs about yoga were equivalent for aged > 70 years compared with those aged 40 to 69 years. It is not entirely clear why older adults have been underrepresented in studies of yoga in cancer survivors. However, older adults are vastly underrepresented in clinical trials for many health conditions, even though they are more likely to experience many diseases, including cancer.37 A new National Institutes of Health policy requires that individuals of all ages, including older adults, must be included in all human subjects research unless there are scientific reasons not to include them.38 It is therefore imperative to consider strategies to address underrepresentation of older adults.
Qualitative findings here suggest it will be important to consider logistical barriers including transportation and affordability as well as adaptations requested by older adults (eg, preferences for older teachers).18
Although our sample was small, we also found that adults from diverse racial and ethnic backgrounds had more positive beliefs about yoga, such that this finding should be interpreted with caution. Similar to older adults, individuals from diverse racial and ethnic groups are also underrepresented in clinical trials and may have lower access to complementary treatments. Cultural and linguistic adaptations and building community partnerships should be considered in both recruitment and intervention delivery strategies.40We learned that education about yoga may increase interest and that it is possible to recruit older veterans to yoga class. Nevertheless, in study 2, our rate of full participation was low, with only about 1 in 10 participating. Additional efforts to enhance beliefs about yoga and to addresslogistical barriers (offering telehealth yoga) are needed to best reach older veterans.
Limitations
These findings have several limitations. First, participants were homogeneous in age, gender, race/ethnicity and veteran status, which provides a window into this understudied population but limits generalizability and our ability to control across populations. Second, the sample size limited the ability to conduct subgroup and interaction analyses, such as examining potential differential effects of cancer type, treatment, and PTSD on yoga beliefs or to consider the relationship of yoga beliefs with changes in quality of life before and after the yoga intervention in study 2. Additionally, age was not associated with beliefs about yoga in these samples that of mostly older adults. We were able to compare middle-aged and older adults but could not compare beliefs about yoga to adults aged in their 20s and 30s. Last, our study excluded people with dementia and psychotic disorders. Further research is needed to examine yoga for older cancer survivors who have these conditions.
Conclusions
Education that specifically informs potential participants about yoga practice, potential modifications, and potential benefits, as well as adaptations to programs that address physical and logistical barriers may be useful in increasing access to and participation in yoga for older Veterans who are cancer survivors.
Acknowledgments/Funding
The authors have no financial or personal relationships to disclose. This work was supported by the US Department of Veterans Affairs (VA) Rehabilitation Research and Development Service. This material is the result of work supported with resources and the use of facilities at the VA Boston Healthcare System, Bedford VA Medical Center, and Michael E. DeBakey VA Medical Center in Houston, Texas. We thank the members of the Veterans Cancer Rehabilitation Study (Vetcares) Research teams in Boston and in Houston and the veterans who have participated in our research studies and allow us to contribute to their health care.
1. Mustian KM, Sprod LK, Janelsins M, et al. Multicenter, randomized controlled trial of yoga for sleep quality among cancer survivors. J Clin Oncol. 2013;31(26):3233-3241. doi:10.1200/JCO.2012.43.7707
2. Chandwani KD, Thornton B, Perkins GH, et al. Yoga improves quality of life and benefit finding in women undergoing radiotherapy for breast cancer. J Soc Integr Oncol. 2010;8(2):43-55.
3. Erratum: Primary follicular lymphoma of disguised as multiple miliary like lesions: A case report and review of literature. Indian J Pathol Microbiol. 2018;61(4):643. doi:10.4103/0377-4929.243009
4. Eyigor S, Uslu R, Apaydın S, Caramat I, Yesil H. Can yoga have any effect on shoulder and arm pain and quality of life in patients with breast cancer? A randomized, controlled, single-blind trial. Complement Ther Clin Pract. 2018;32:40-45. doi:10.1016/j.ctcp.2018.04.010
5. Loudon A, Barnett T, Piller N, Immink MA, Williams AD. Yoga management of breast cancer-related lymphoedema: a randomised controlled pilot-trial. BMC Complement Altern Med. 2014;14:214. Published 2014 Jul 1. doi:10.1186/1472-6882-14-214
6. Browning KK, Kue J, Lyons F, Overcash J. Feasibility of mind-body movement programs for cancer survivors. Oncol Nurs Forum. 2017;44(4):446-456. doi:10.1188/17.ONF.446-456
7. Rosenbaum MS, Velde J. The effects of yoga, massage, and reiki on patient well-being at a cancer resource center. Clin J Oncol Nurs. 2016;20(3):E77-E81. doi:10.1188/16.CJON.E77-E81
8. Yun H, Sun L, Mao JJ. Growth of integrative medicine at leading cancer centers between 2009 and 2016: a systematic analysis of NCI-designated comprehensive cancer center websites. J Natl Cancer Inst Monogr. 2017;2017(52):lgx004. doi:10.1093/jncimonographs/lgx004
9. Sanft T, Denlinger CS, Armenian S, et al. NCCN guidelines insights: survivorship, version 2.2019. J Natl Compr Canc Netw. 2019;17(7):784-794. doi:10.6004/jnccn.2019.0034
10. Lyman GH, Greenlee H, Bohlke K, et al. Integrative therapies during and after breast cancer treatment: ASCO endorsement of the SIO clinical practice guideline. J Clin Oncol. 2018;36(25):2647-2655. doi:10.1200/JCO.2018.79.2721
11. Culos-Reed SN, Mackenzie MJ, Sohl SJ, Jesse MT, Zahavich AN, Danhauer SC. Yoga & cancer interventions: a review of the clinical significance of patient reported outcomes for cancer survivors. Evid Based Complement Alternat Med. 2012;2012:642576. doi:10.1155/2012/642576
12. Danhauer SC, Addington EL, Cohen L, et al. Yoga for symptom management in oncology: a review of the evidence base and future directions for research. Cancer. 2019;125(12):1979-1989. doi:10.1002/cncr.31979
13. Siegel RL, Miller KD, Jemal A. Cancer statistics, 2019. CA Cancer J Clin. 2019;69(1):7-34. doi:10.3322/caac.21551
14. US Department of Veterans Affairs. Veterans’ diseases associated with Agent Orange. Updated June 16, 2021. Accessed September 22, 2021. https://www.publichealth.va.gov/exposures/agentorange/conditions
15. Deimling GT, Arendt JA, Kypriotakis G, Bowman KF. Functioning of older, long-term cancer survivors: the role of cancer and comorbidities. J Am Geriatr Soc. 2009;57(suppl 2):S289-S292. doi:10.1111/j.1532-5415.2009.02515.x
16. King K, Gosian J, Doherty K, et al. Implementing yoga therapy adapted for older veterans who are cancer survivors. Int J Yoga Therap. 2014;24:87-96.
17. Wertman A, Wister AV, Mitchell BA. On and off the mat: yoga experiences of middle-aged and older adults. Can J Aging. 2016;35(2):190-205. doi:10.1017/S0714980816000155
18. Chen KM, Wang HH, Li CH, Chen MH. Community vs. institutional elders’ evaluations of and preferences for yoga exercises. J Clin Nurs. 2011;20(7-8):1000-1007. doi:10.1111/j.1365-2702.2010.03337.x
19. Saravanakumar P, Higgins IJ, Van Der Riet PJ, Sibbritt D. Tai chi and yoga in residential aged care: perspectives of participants: A qualitative study. J Clin Nurs. 2018;27(23-24):4390-4399. doi:10.1111/jocn.14590
20. Fan JT, Chen KM. Using silver yoga exercises to promote physical and mental health of elders with dementia in long-term care facilities. Int Psychogeriatr. 2011;23(8):1222-1230. doi:10.1017/S1041610211000287
21. Taylor TR, Barrow J, Makambi K, et al. A restorative yoga intervention for African-American breast cancer survivors: a pilot study. J Racial Ethn Health Disparities. 2018;5(1):62-72. doi:10.1007/s40615-017-0342-4
22. Moadel AB, Shah C, Wylie-Rosett J, et al. Randomized controlled trial of yoga among a multiethnic sample of breast cancer patients: effects on quality of life. J Clin Oncol. 2007;25(28):4387-4395. doi:10.1200/JCO.2006.06.6027
23. Smith SA, Whitehead MS, Sheats JQ, Chubb B, Alema-Mensah E, Ansa BE. Community engagement to address socio-ecological barriers to physical activity among African American breast cancer survivors. J Ga Public Health Assoc. 2017;6(3):393-397. doi:10.21633/jgpha.6.312
24. Cushing RE, Braun KL, Alden C-Iayt SW, Katz AR. Military-Tailored Yoga for Veterans with Post-traumatic Stress Disorder. Mil Med. 2018;183(5-6):e223-e231. doi:10.1093/milmed/usx071
25. Davis LW, Schmid AA, Daggy JK, et al. Symptoms improve after a yoga program designed for PTSD in a randomized controlled trial with veterans and civilians. Psychol Trauma. 2020;12(8):904-912. doi:10.1037/tra0000564
26. Chopin SM, Sheerin CM, Meyer BL. Yoga for warriors: An intervention for veterans with comorbid chronic pain and PTSD. Psychol Trauma. 2020;12(8):888-896. doi:10.1037/tra0000649
27. US Department of Veterans Affairs. Whole health. Updated September 13, 2021. Accessed September 22, 2021. https://www.va.gov/wholehealth
28. Sohl SJ, Schnur JB, Daly L, Suslov K, Montgomery GH. Development of the beliefs about yoga scale. Int J Yoga Therap. 2011;(21):85-91.
29. Cadmus-Bertram L, Littman AJ, Ulrich CM, et al. Predictors of adherence to a 26-week viniyoga intervention among post-treatment breast cancer survivors. J Altern Complement Med. 2013;19(9):751-758. doi:10.1089/acm.2012.0118
30. Mackenzie MJ, Carlson LE, Ekkekakis P, Paskevich DM, Culos-Reed SN. Affect and mindfulness as predictors of change in mood disturbance, stress symptoms, and quality of life in a community-based yoga program for cancer survivors. Evid Based Complement Alternat Med. 2013;2013:419496. doi:10.1155/2013/419496
31. Naik AD, Martin LA, Karel M, et al. Cancer survivor rehabilitation and recovery: protocol for the Veterans Cancer Rehabilitation Study (Vet-CaRes). BMC Health Serv Res. 2013;13:93. Published 2013 Mar 11. doi:10.1186/1472-6963-13-93
32. Northwestern University. PROMIS Health Organization and the PROMIS Cooperative Group. PROMIS Short Form v2.0 - Physical Function 6b. Accessed September 24, 2021. https://www.healthmeasures.net/index.php?option=com_instruments&view=measure&id=793&Itemid=992
33. Northwestern University. PROMIS Health Organization and the PROMIS Cooperative Group. PROMIS Short Form v1.0 - Anxiety 6a. Accessed September 24, 2021. https://www.healthmeasures.net/index.php?option=com_instruments&view=measure&id=145&Itemid=992
34. Northwestern University. PROMIS Health Organization and the PROMIS Cooperative Group. PROMIS-43 Profile v2.1. Accessed September 24, 2021. https://www.healthmeasures.net/index.php?option=com_instruments&view=measure&id=858&Itemid=992
35. Todd NJ, Jones SH, Lobban FA. “Recovery” in bipolar disorder: how can service users be supported through a self-management intervention? A qualitative focus group study. J Ment Health. 2012;21(2):114-126. doi:10.3109/09638237.2011.621471
36. Finlay L. “Outing” the researcher: the provenance, process, and practice of reflexivity. Qual Health Res. 2002;12(4):531-545. doi:10.1177/104973202129120052
37. Herrera AP, Snipes SA, King DW, Torres-Vigil I, Goldberg DS, Weinberg AD. Disparate inclusion of older adults in clinical trials: priorities and opportunities for policy and practice change. Am J Public Health. 2010;10(suppl 1):S105-S112. doi:10.2105/AJPH.2009.162982
38. National Institutes of Health. Revision: NIH policy and guidelines on the inclusion of individuals across the lifespan as participants in research involving human subjects. Published December 19, 2017. Accessed September 22, 2021. https://grants.nih.gov/grants/guide/notice-files/NOT-OD-18-116.html
39. Townsley CA, Selby R, Siu LL. Systematic review of barriers to the recruitment of older patients with cancer onto clinical trials. J Clin Oncol. 2005;23(13):3112-3124. doi:10.1200/JCO.2005.00.141
40. Vuong I, Wright J, Nolan MB, et al. Overcoming barriers: evidence-based strategies to increase enrollment of underrepresented populations in cancer therapeutic clinical trials-a narrative review. J Cancer Educ. 2020;35(5):841-849. doi:10.1007/s13187-019-01650-y
Treatment Stacking: Optimizing Therapeutic Regimens for Hidradenitis Suppurativa
Hidradenitis suppurativa (HS) is a debilitating chronic condition that often is recalcitrant to first-line treatments, and mechanisms underlying its pathology remain unclear. Existing data suggest a multifactorial etiology with different pathophysiologic contributors, including genetic, hormonal, and immune dysregulation factors. At this time, only one medication (adalimumab) is US Food and Drug Administration approved for HS, but multiple medical and procedural therapies are available.1 Herein, we discuss the concept of treatment stacking, or the combination of unique therapeutic modalities—an approach we believe is key to optimizing management of HS patients.
Stacking Treatments for HS
Unlike psoriasis, in which a single biologic agent may provide 100% clearance (psoriasis area and severity index 100 [PASI 100]) without adjuvant treatment,2,3 the field of HS currently lacks medications that are efficacious to that degree of success as monotherapy. In HS, the benchmark for a positive treatment outcome is Hidradenitis Suppurativa Clinical Response 50 (HiSCR50),4 a 50% reduction in inflammatory lesion count—a far less stringent marker for disease improvement. Thus, providers should design HS treatment regimens with a model of combining therapies and shift away from monotherapy. Targeting different pathophysiologic pathways by stacking multiple treatments may provide synergistic benefits for HS patients. Treatment stacking is a familiar concept in acne; for instance, patients who benefit tremendously from isotretinoin may still require a hormone-modulating treatment (eg, spironolactone) to attain optimal results.
Adherence to a rigid treatment algorithm based on disease severity limits the potential to create comprehensive regimens that account for unique patient characteristics and clinical manifestations. When evaluating an HS patient, providers should systematically consider each pathophysiologic factor and target the ones that appear to be most involved in that particular patient. The North American HS guidelines illustrate this point by supporting use of several treatments across different Hurley stages, such as recommending hormonal treatment in patients with Hurley stages 1, 2, or 3.1 Of note, treatment stacking also includes procedural therapies. Surgeons typically prefer a patient’s disease management to be optimized prior to surgery, including reduced drainage and inflammation. In addition, even after surgery, patients often still require medical management to prevent continued disease worsening.
Treatment Pathways for HS
A multimodal approach with treatment stacking (Figure) can be useful to all HS patients, from those with the mildest to the most severe disease. Modifiable pathophysiologic factors and examples of their targeted treatments include (1) follicular occlusion (eg, oral retinoids), (2) metabolic dysfunction (eg, metformin), (3) hormones (eg, oral contraceptive pills, spironolactone, finasteride), (4) dysbiosis (eg, antibiotics such as clindamycin and rifampin combination therapy), (5) immune dysregulation (eg, biologic agents), and (6) friction/irritation (eg, weight loss, clothing recommendations).

Combining treatments from different pathways enables potentiation of individual treatment efficacies. A female patient with only a few HS nodules that flare with menses may be well controlled with spironolactone as her only systemic agent; however, she still may benefit from use of an antiseptic wash, topical clindamycin, and lifestyle changes such as weight loss and reduction of mechanical irritation. A patient with severe recalcitrant HS could notably benefit from concomitant biologic, systemic antibiotic, and hormonal/metabolic treatments. If disease control is still inadequate, agents within the same class can be switched (eg, choosing a different biologic) or other disease-modifying agents such as colchicine also can be added. The goal is to create an effective treatment toolbox with therapies targeting different pathophysiologic arms of HS and working together in synergy. Each tool can be refined by modifying dosing frequency and duration of use to strive for optimal response. At this time, the literature on HS combination therapy is sparse. A retrospective study of 31 patients reported promising combinations, including isotretinoin with spironolactone for mild disease, isotretinoin or doxycycline with adalimumab for moderate disease, and cyclosporine with adalimumab for severe disease.5 Larger prospective studies on clinical response to different combination regimens are warranted.
Optimizing Therapy for HS and Its Comorbidities
Additional considerations may further optimize treatment plans. Some therapies benefit all patients; for example, providers should counsel all HS patients on healthy weight management, optimized clothing choices,6 and friction reduction in the intertriginous folds. Providers also may consider adding therapies with faster onset of efficacy as a bridge to long-term, slower-onset therapies. For instance, female HS patients with menstrual flares who are prescribed spironolactone also may benefit from a course of systemic antibiotics, which typically provides more prompt relief. Treatment regimens also can concomitantly treat HS and its comorbidities.7 For example, metformin serves a dual purpose in HS patients with diabetes mellitus, and adalimumab in patients with both HS and inflammatory bowel disease.
Final Thoughts
The last decade has seen tremendous growth in HS research8 coupled with a remarkable expansion in the therapeutic pipeline.9 However, currently no single therapy for HS can guarantee satisfactory disease remission or durability of remission. The contrast between clinical trials and real-world practice should be acknowledged; the former often is restrictive in design with monotherapy and allowance of very limited concomitant treatments, such as topical or oral antibiotics. This limits our ability to draw conclusions regarding the additive synergistic potential of different therapeutics in combination. In clinical practice, we are not restricted by monotherapy trial protocols. As we await new tools, treatment stacking allows for creating a framework to best utilize the tools that are available to us.
Although HS has continued to affect the lives of many patients, improved understanding of underlying pathophysiology and a well-placed sense of urgency from all stakeholders (ie, patients, clinicians, researchers, industry partners) has pushed this field forward. Until our therapeutic armamentarium has expanded to include highly efficacious monotherapy options, providers should consider treatment stacking for every HS patient.
- Alikhan A, Sayed C, Alavi A, et al. North American clinical management guidelines for hidradenitis suppurativa: a publication from the United States and Canadian Hidradenitis Suppurativa Foundations: part II: topical, intralesional, and systemic medical management. J Am Acad Dermatol. 2019;81:91-101. doi:10.1016/j.jaad.2019.02.068
- Reich K, Warren RB, Lebwohl M, et al. Bimekizumab versus secukinumab in plaque psoriasis. N Engl J Med. 2021;385:142-152. doi:10.1056/NEJMoa2102383
- Imafuku S, Nakagawa H, Igarashi A, et al. Long-term efficacy and safety of tildrakizumab in Japanese patients with moderate to severe plaque psoriasis: results from a 5-year extension of a phase 3 study (reSURFACE 1). J Dermatol. 2021;48:844-852. doi:10.1111/1346-8138.15763
- Kimball AB, Okun MM, Williams DA, et al. Two phase 3 trials of adalimumab for hidradenitis suppurativa. N Engl J Med. 2016;375:422-434. doi:10.1056/NEJMoa1504370
- McPhie ML, Bridgman AC, Kirchhof MG. Combination therapies for hidradenitis suppurativa: a retrospective chart review of 31 patients. J Cutan Med Surg. 2019;23:270-276. doi:10.1177/1203475418823529
- Loh TY, Hendricks AJ, Hsiao JL, et al. Undergarment and fabric selection in the management of hidradenitis suppurativa. Dermatol Basel Switz. 2021;237:119-124. doi:10.1159/000501611
- Garg A, Malviya N, Strunk A, et al. Comorbidity screening in hidradenitis suppurativa: evidence-based recommendations from the US and Canadian Hidradenitis Suppurativa Foundations [published online January 23, 2021]. J Am Acad Dermatol. doi:10.1016/j.jaad.2021.01.059
- Savage KT, Brant EG, Flood KS, et al. Publication trends in hidradenitis suppurativa from 2008 to 2018. J Eur Acad Dermatol Venereol. 2020;34:1885-1889. doi:10.1111/jdv.16213
- van Straalen KR, Schneider-Burrus S, Prens EP. Current and future treatment of hidradenitis suppurativa. Br J Dermatol. 2020;183:E178-E187. doi:10.1111/bjd.16768
Hidradenitis suppurativa (HS) is a debilitating chronic condition that often is recalcitrant to first-line treatments, and mechanisms underlying its pathology remain unclear. Existing data suggest a multifactorial etiology with different pathophysiologic contributors, including genetic, hormonal, and immune dysregulation factors. At this time, only one medication (adalimumab) is US Food and Drug Administration approved for HS, but multiple medical and procedural therapies are available.1 Herein, we discuss the concept of treatment stacking, or the combination of unique therapeutic modalities—an approach we believe is key to optimizing management of HS patients.
Stacking Treatments for HS
Unlike psoriasis, in which a single biologic agent may provide 100% clearance (psoriasis area and severity index 100 [PASI 100]) without adjuvant treatment,2,3 the field of HS currently lacks medications that are efficacious to that degree of success as monotherapy. In HS, the benchmark for a positive treatment outcome is Hidradenitis Suppurativa Clinical Response 50 (HiSCR50),4 a 50% reduction in inflammatory lesion count—a far less stringent marker for disease improvement. Thus, providers should design HS treatment regimens with a model of combining therapies and shift away from monotherapy. Targeting different pathophysiologic pathways by stacking multiple treatments may provide synergistic benefits for HS patients. Treatment stacking is a familiar concept in acne; for instance, patients who benefit tremendously from isotretinoin may still require a hormone-modulating treatment (eg, spironolactone) to attain optimal results.
Adherence to a rigid treatment algorithm based on disease severity limits the potential to create comprehensive regimens that account for unique patient characteristics and clinical manifestations. When evaluating an HS patient, providers should systematically consider each pathophysiologic factor and target the ones that appear to be most involved in that particular patient. The North American HS guidelines illustrate this point by supporting use of several treatments across different Hurley stages, such as recommending hormonal treatment in patients with Hurley stages 1, 2, or 3.1 Of note, treatment stacking also includes procedural therapies. Surgeons typically prefer a patient’s disease management to be optimized prior to surgery, including reduced drainage and inflammation. In addition, even after surgery, patients often still require medical management to prevent continued disease worsening.
Treatment Pathways for HS
A multimodal approach with treatment stacking (Figure) can be useful to all HS patients, from those with the mildest to the most severe disease. Modifiable pathophysiologic factors and examples of their targeted treatments include (1) follicular occlusion (eg, oral retinoids), (2) metabolic dysfunction (eg, metformin), (3) hormones (eg, oral contraceptive pills, spironolactone, finasteride), (4) dysbiosis (eg, antibiotics such as clindamycin and rifampin combination therapy), (5) immune dysregulation (eg, biologic agents), and (6) friction/irritation (eg, weight loss, clothing recommendations).
Combining treatments from different pathways enables potentiation of individual treatment efficacies. A female patient with only a few HS nodules that flare with menses may be well controlled with spironolactone as her only systemic agent; however, she still may benefit from use of an antiseptic wash, topical clindamycin, and lifestyle changes such as weight loss and reduction of mechanical irritation. A patient with severe recalcitrant HS could notably benefit from concomitant biologic, systemic antibiotic, and hormonal/metabolic treatments. If disease control is still inadequate, agents within the same class can be switched (eg, choosing a different biologic) or other disease-modifying agents such as colchicine also can be added. The goal is to create an effective treatment toolbox with therapies targeting different pathophysiologic arms of HS and working together in synergy. Each tool can be refined by modifying dosing frequency and duration of use to strive for optimal response. At this time, the literature on HS combination therapy is sparse. A retrospective study of 31 patients reported promising combinations, including isotretinoin with spironolactone for mild disease, isotretinoin or doxycycline with adalimumab for moderate disease, and cyclosporine with adalimumab for severe disease.5 Larger prospective studies on clinical response to different combination regimens are warranted.
Optimizing Therapy for HS and Its Comorbidities
Additional considerations may further optimize treatment plans. Some therapies benefit all patients; for example, providers should counsel all HS patients on healthy weight management, optimized clothing choices,6 and friction reduction in the intertriginous folds. Providers also may consider adding therapies with faster onset of efficacy as a bridge to long-term, slower-onset therapies. For instance, female HS patients with menstrual flares who are prescribed spironolactone also may benefit from a course of systemic antibiotics, which typically provides more prompt relief. Treatment regimens also can concomitantly treat HS and its comorbidities.7 For example, metformin serves a dual purpose in HS patients with diabetes mellitus, and adalimumab in patients with both HS and inflammatory bowel disease.
Final Thoughts
The last decade has seen tremendous growth in HS research8 coupled with a remarkable expansion in the therapeutic pipeline.9 However, currently no single therapy for HS can guarantee satisfactory disease remission or durability of remission. The contrast between clinical trials and real-world practice should be acknowledged; the former often is restrictive in design with monotherapy and allowance of very limited concomitant treatments, such as topical or oral antibiotics. This limits our ability to draw conclusions regarding the additive synergistic potential of different therapeutics in combination. In clinical practice, we are not restricted by monotherapy trial protocols. As we await new tools, treatment stacking allows for creating a framework to best utilize the tools that are available to us.
Although HS has continued to affect the lives of many patients, improved understanding of underlying pathophysiology and a well-placed sense of urgency from all stakeholders (ie, patients, clinicians, researchers, industry partners) has pushed this field forward. Until our therapeutic armamentarium has expanded to include highly efficacious monotherapy options, providers should consider treatment stacking for every HS patient.
- Alikhan A, Sayed C, Alavi A, et al. North American clinical management guidelines for hidradenitis suppurativa: a publication from the United States and Canadian Hidradenitis Suppurativa Foundations: part II: topical, intralesional, and systemic medical management. J Am Acad Dermatol. 2019;81:91-101. doi:10.1016/j.jaad.2019.02.068
- Reich K, Warren RB, Lebwohl M, et al. Bimekizumab versus secukinumab in plaque psoriasis. N Engl J Med. 2021;385:142-152. doi:10.1056/NEJMoa2102383
- Imafuku S, Nakagawa H, Igarashi A, et al. Long-term efficacy and safety of tildrakizumab in Japanese patients with moderate to severe plaque psoriasis: results from a 5-year extension of a phase 3 study (reSURFACE 1). J Dermatol. 2021;48:844-852. doi:10.1111/1346-8138.15763
- Kimball AB, Okun MM, Williams DA, et al. Two phase 3 trials of adalimumab for hidradenitis suppurativa. N Engl J Med. 2016;375:422-434. doi:10.1056/NEJMoa1504370
- McPhie ML, Bridgman AC, Kirchhof MG. Combination therapies for hidradenitis suppurativa: a retrospective chart review of 31 patients. J Cutan Med Surg. 2019;23:270-276. doi:10.1177/1203475418823529
- Loh TY, Hendricks AJ, Hsiao JL, et al. Undergarment and fabric selection in the management of hidradenitis suppurativa. Dermatol Basel Switz. 2021;237:119-124. doi:10.1159/000501611
- Garg A, Malviya N, Strunk A, et al. Comorbidity screening in hidradenitis suppurativa: evidence-based recommendations from the US and Canadian Hidradenitis Suppurativa Foundations [published online January 23, 2021]. J Am Acad Dermatol. doi:10.1016/j.jaad.2021.01.059
- Savage KT, Brant EG, Flood KS, et al. Publication trends in hidradenitis suppurativa from 2008 to 2018. J Eur Acad Dermatol Venereol. 2020;34:1885-1889. doi:10.1111/jdv.16213
- van Straalen KR, Schneider-Burrus S, Prens EP. Current and future treatment of hidradenitis suppurativa. Br J Dermatol. 2020;183:E178-E187. doi:10.1111/bjd.16768

Pembrolizumab Dose Conversion Adoption and Immune-Mediated Adverse Events
Background/Purpose
On April 28, 2020, the Food and Drug Administration approved pembrolizumab 400mg intravenous (IV) every 6 weeks. This dosing update was rapidly adopted by VA Northeast Ohio Healthcare System (VANEOHS) hematology/oncology providers to minimize infusion appointments, for patient convenience and COVID precautions. On May 1, 2020, pembrolizumab order set templates were updated to reflect the extended interval dosing, however providers are still able to change orders to 200mg IV every 3 weeks if needed. Due to administration of higher pembrolizumab doses, there could be increased development of immune-mediated adverse events (IrAEs). This review quantified the clinic visits saved at VANEOHS by adoption of pembrolizumab 400mg dosing and report adverse events that resulted in pembrolizumab dose reduction.
Methods
A report of all pembrolizumab orders from May 1, 2020 to May 1, 2021 was obtained. All pembrolizumab 200mg orders were reviewed to evaluate reasoning for the use of the 200mg dose. A retrospective chart review was performed for patients who required a pembrolizumab dose reduction to evaluate safety. Descriptive statistics were used.
Results
There was a total of 277 pembrolizumab orders from May 1, 2020 to May 1, 2021. Of these orders, 211 (76%) were converted to pembrolizumab 400mg IV every 6 weeks, while 66 (24%) orders remained at pembrolizumab 200mg IV every 3 weeks. It is estimated that there were 211 infusion appointments avoided due to the conversion to pembrolizumab 400mg IV every 6-week dosing. The 277 pembrolizumab orders were used to treat 77 unique patients. Eighteen patients continued to receive pembrolizumab 200mg following the conversion. Sixteen of these patients were maintained on pembrolizumab 200mg due to concomitant chemotherapy schedules. One patient was receiving pembrolizumab 200mg based on clinical trial dosing. One patient returned to pembrolizumab 200mg due to an increase in drainage from pleurx catheter while receiving 400mg dose.
Implications
The conversion from pembrolizumab 200mg every 3 weeks to pembrolizumab 400mg every 6 weeks avoided approximately 200 infusion appointments without an increase in safety concerns. This supporting data may aid in supporting extended interval dosing of other immunotherapy agents.
A Single-Center Experience of Cardiac-related Adverse Events from Immune Checkpoint Inhibitors
Introduction
There have been incident reports of cardiac-related adverse events (CrAE) from immune checkpoint inhibitors (ICPI); however, the true incidence and subsequent management of these potential side effects have not been defined. It is therefore important to study ICPI related cardiac dysfunction to assist in monitoring and surveillance of these patients.
Methods
63 patients who received nivolumab and pembrolizumab at Stratton VAMC Albany between January 2015 to December 2018 were studied. Retrospective chart review was done to identify the CrAE up to two-year post-therapy completion or discontinuation. Naranjo score was used to assess drug-related side effect. IRB approval was obtained.
Results
CrAE were defined as new onset arrythmia identified on electrocardiogram, evidence of cardiomyopathy on echocardiogram, an acute coronary event, and hospitalizations from primary cardiac disorder following ICPI administration. Of the 63 patients, 6 patients developed CrAE. Our review showed 3 patients developed new arrythmias including 1 with atrial fibrillation, and 2 with atrial flutter. There was 1 case each of new heart failure with reduced ejection fraction and pericarditis with pericardial tamponade. 1 patient developed acute coronary syndrome in addition to complete heart block. Of the 6 patients, 2 had elevated brain natriuretic peptide (BNP) prior to onset of CrAE. Elevated markers including BNP and troponin-I were also seen in 13 patients with preexisting heart conditions without CrAE. Duration of therapy was variable for all patients with CrAE. Therapy was continued for 3 patients without recurrence of CrAE. Therapy was permanently discontinued in the patient who developed pericardial effusion (grade IV toxicity). The remaining 2 patients had additional concurrent immune-related toxicities that required discontinuation of therapy. Our analysis showed 25/63 patients with pre-existing cardiac conditions (including arrhythmia, heart failure or coronary artery disease) who did not develop new CrAE; however 6 of these patients required hospitalization for exacerbation related to these pre-existing conditions.
Conclusions
CrAE can occur with ICPIs, and vigilance is required in high-risk patient including those with pre-existing cardiac comorbidity. Further studies are required to establish if baseline screening EKG and echocardiogram should be obtained for all patients starting ICPI.
Immunotherapy Experience in Nonagenarian Veterans with Cancer
Background
Immune checkpoint inhibitors [cytotoxic T-lymphocyte antigen 4 (CTLA-4), programmed cell death 1 receptor/ programmed death ligand-1 (PD1/ PD-L1)] have received broad FDA approval in most cancers. As clinical use of these agents proliferates, data for their efficacy and safety in elderly populations, particularly nonagenarians, is sparse [1]. Nonagenarians are commonly excluded from or underrepresented in clinical trials. This occurs despite the fact that the elderly embody the fastest growing portion of the population worldwide [2]. The purpose of this project was to describe the experience of treating veterans >/= 90 years of age with immune checkpoint inhibitors (IPI) for cancer.
Methods
We reviewed drug exposure in Nonagenarians who received IPI within the VA system nationwide between 2016-2017 using CAPRI. We identified 48 veterans and reviewed each patient’s treatment, duration of immunotherapy exposure, response, and toxicity to generate a global review on how those nonagenarians tolerated treatment. Demographic data of study participants and all endpoints have been analyzed using descriptive statistics.
Results
We obtained the record data for 48 veterans who received CPI in the VA health system between 2016 and 2017. Baseline characteristics revealed that the majority of patients (N=26) were ECOG 0-1 at the time of treatment initiation. The most commonly treated malignancies included melanoma (N=19) and NSCLC (N=15) with the majority of cancers being stage IV (N=42). The primary outcome measures are duration of therapy (average 12.2 cycles) and overall survival (average 1.59 years). The secondary outcome is adverse events, with a total rate of 27.1% and grade III/IV events occurring at a rate of 6.3%
Implications
These cases and data points illustrate that immunotherapy is being used in nonagenarians. With close monitoring of toxicities, nonagenarians with acceptable performance status can be treated with immunotherapy with their consent. Future aims will focus on the addition of more data points by expanding to include 2018.
References
1. Lewis JH, Kilgore ML, Goldman DP, Trimble EL, Kaplan R,Montello MJ, et al. Participation of patients 65 years of age or older in cancer clinical trials. J Clin Oncol. 2003;21(7):1383–9. 2. Sgambato S, Casaluce F, Gridelli C. The role of checkpoint inhibitors immunotherapy in advanced non-small cell lung cancer in the elderly. Expert Opin Biol Ther. 2017;17(5):565-571.
Evaluation of the Impact of the VHA National Precision Oncology Program (NPOP) on Prior Authorization Adjudication of Targeted Anti-Cancer Agents
Purpose
To evaluate the impact of the VHA NPOP on prescribing and prior authorization approval of targeted anti-cancer therapies.
Background
Comprehensive genomic profiling (CGP) next-generation sequencing (NGS) panels have seen increased use to guide oncology therapeutic decision making. In-line with the White House Cancer Moonshot initiative, the VHA established the National Precision Oncology Program (NPOP) in July of 2016 to provide veterans with easier access to CGP and help match patients with commercially available targeted oncology therapies based on their tumor molecular profile.
Methods/Data Analysis
A retrospective review within the VHA was conducted on patients who underwent CGP testing through the VHA NPOP from July 2016 through December 2020. Prior authorization drug request (PADR) consults for targeted oncology therapies for which CGP is a companion diagnostic for use were queried and approval outcomes were determined. NPOP interfacility consult (IFC) data was queried and matched to PADR and prescription data to determine if the IFC therapy recommendation was accepted and prescribed. Descriptive statistics were used to describe patient demographics and characterize PADR and IFC outcomes.
Results
From July 2016 to December 2020, 16,312 tumor and blood samples from 130 unique VA medical centers representing 15,467 veterans were analyzed. Approximately 15% of veterans were prescribed targeted oncology therapies that required a PADR with a 95% approval rate. Targeted therapy recommendations with corresponding level of evidence was seen in 160 of 425 IFCs. Among 160 IFCs with targeted therapy recommendations, 75 had the recommendations accepted with two denied by PADR after local review. Recommended therapies were ultimately received by 72 patients as one patient did not have an active drug order.
Implications
Implementation of the VHA NPOP has increased access to CGP for more than 15,000 veterans. Availability of CGP results may have affected PADR approval outcomes of targeted therapies in approximately 15% of veterans. Approximately 50% of IFCs led to approval and subsequent prescribing of recommended therapies. Further analysis of these data and trends may help guide future prescribing practices and aid with development of clinical pathways involving molecularly targeted anti-cancer therapies.