User login
Improving the Efficiency of Ordering Next Generation Sequencing During New Patient Triage: A Quality Improvement Project
Objective
To decrease the time to treatment by streamlining ordering of next generation sequencing (NGS) during new patient triage utilizing a centralized document of indications for testing.
Background
Use of NGS in management of patients with cancer is rapidly expanding. In 2017, over 75% of oncologists reported using NGS to guide treatment decisions (1). NGS testing is also now incorporated into 67% of NCCN guidelines (2). However, due to the wide variety and changing indications for NGS, integrating testing into routine clinical care can be challenging.
Results
A total of 118 new patients were seen at the SLC VA Oncology Clinic between 2020-2021 of which 21 met criteria for NGS testing at time of triage consult, 10 before and 11 after the intervention. Median time from triage to treatment initiation was 30 days (30-33) after the incorporation of the document into clinic workflow compared to 63 days (47-66). Median time from biopsy to NGS results was similar between pre- and post-intervention groups, 28 (25-49) vs 26 days (18.5-26.5).
Conclusion
Our centralized summary of NGS indications is easily updated and accessible to staff. To date, shorter times from triage to treatment have been seen after integrating this document into clinic workflow. As our sample size is small, further evaluation of this trend is required. However, our data suggests that additional improvement may be achieved through incorporating this document into the Pathology department’s workflow.
References
(1) Freedman A et al. Use of NGS sequencing tests to guide cancer treatment: results from a nationally representative survey of oncologists in the United States. JCO Precis Oncol. 2018;2:1-13. (2) Conway J et al. NGS and the clinical oncology workflow: data challenges, proposed solutions and a call to action. JCO Precis Oncol. 2019;3:1-10.
Successful Recruitment of VA Patients in Precision Medicine Research Through Passive Recruitment Efforts
Background
We sought to evaluate passive recruitment efforts of VA patients into a precision medicine research program. Access to clinical trials and other research opportunities is important to discovering new disease treatments and better ways to detect, diagnose, and reduce disease risk. The WISDOM (Women Informed to Screen Depending on Measures of risk) Study is a multi-site, pragmatic trial with webbased participation based at the University of California at San Francisco (UCSF) that aims to move breast cancer screening away from its current one-size-fitsall approach to one that is personalized based on each woman’s individual risk.
Methods
We created a hub and spoke recruitment model with the San Francisco VA Medical Center (SFVAMC) serving as the central hub of passive recruitment activities and eligible VA facilities that agreed to participate serving as the spoke recruitment sites. Eligible facilities had at least 3,000 women patients, VA clinical genetic services available, a site lead from the VA Women’s Health-Practice-Based Research Network, and mammography on site. Site participation involved permission for the research team to email eligible patients (women aged 40-74 without prior breast cancer diagnosis) about the WISDOM Study. We evaluated the effectiveness of the recruitment by assessing trends in enrollment and monitoring participation of VA patients in the WISDOM Study. Analysis: Pre/post frequencies of women consenting to participate in the WISDOM Study.
Results
From 5/24/2021 through 6/21/2021, we emailed 27,061 eligible VA patients from six participating VA facilities. Prior to the VA emailing, an average of 22 women per week consented to participating in the WISDOM Study and none were Veterans. After the first month of the VA emailing, an average of 186 women per week consented – a 7.5-fold increase. Additionally, during the first month of VA emailing, 81% of women registering with the WISDOM Study said they heard about the study from the VA.
Implications
The VA has recently approved of emailing as a method for recruiting research subjects. Our results demonstrate this is a feasible approach for precision medicine research, a growing area of research in VA and at academic affiliates.
Racial and Ethnic Disparities in Discharge Opioid Prescribing From a Hospital Medicine Service
Within the nationwide effort to combat the opioid epidemic and reduce opioid prescribing, researchers have described different prescribing patterns for non-White racial and ethnic groups, including Black and LatinX populations. This remains a largely unexplored area within hospital medicine. Earlier studies of racial disparities demonstrate how some patients are assessed less often for pain and prescribed fewer opioids from the emergency department, surgical settings, and outpatient primary care practices. Researchers also have documented racial and ethnic disparities in analgesia for cancer pain and chronic noncancer pain.1-11 Studies have demonstrated that White patients are more likely to receive opioid prescriptions compared with Black patients. Even with similar documented pain scores, there is evidence that Black patients receive fewer analgesics compared with White patients. For example, a recent study found that Black and Hispanic patients presenting to the emergency room for renal colic received less opioid medication compared with White patients.3 A study across 22 sites in Northern California found that racial minorities with long-bone fractures received fewer opioids at discharge than White patients.1
It is unknown whether differential prescribing patterns by race exist among patients hospitalized on general medicine services. The objective of our study was to assess whether race and ethnicity were associated with the likelihood of opioids being prescribed and the duration of opioids prescribed when these patients are discharged from the hospital. Quantifying and seeking to understand these differences are the first steps toward ensuring racial and ethnic health equity in patient care.
METHODS
Study Population and Data Sources
We identified all adults (age ≥18 years) discharged from the acute care inpatient general medicine services between June 1, 2012, and November 30, 2018, at the University of California, San Francisco (UCSF) Helen Diller Medical Center at Parnassus Heights, a 785-bed urban academic teaching hospital. All data were obtained from the hospital’s Epic-based electronic medical record (Epic Systems Corporation). Data elements were extracted from Clarity, the relationship database that stores Epic inpatient data. Patients discharged from the inpatient cardiology or bone marrow transplant services were not included. We excluded patients who did not receive opioids in the last 24 hours of their hospitalization. Patients with cancer-related pain diagnoses or sickle cell disease pain crises and patients who were discharged to hospice or followed by palliative care were excluded from the study based on International Classification of Diseases, Tenth Revision (ICD-10) codes (available on request) or service codes, when available, or admitting provider electronic health record documentation (Appendix Figure 1). Palliative care and hospice patients have significantly different pain needs, with management often directed by specialists. Patients with sickle cell disease are disproportionately Black and have distinct opioid prescribing patterns.12,13 We also excluded discharge opioid prescriptions that were a resumption of the patient’s opioid prescription before admission based on medication documentation. Only new prescriptions signed by the discharging hospitalist, including different doses and formulations, were included in this study.
We performed a subgroup analysis of patients who were not prescribed opioids before their admission based on medication reconciliation but were started on opioids while hospitalized.
Primary Outcomes
We examined two primary outcomes: whether a patient received an opioid prescription at discharge, and, for patients prescribed opioids, the number of days prescribed. Days of opioids at discharge were calculated as total morphine milligram equivalents (MMEs) prescribed divided by MMEs administered during the final 24 hours of hospitalization. This metric was used as a patient-specific approach to calculating how long an opioid prescription will last after discharge, standardized according to the actual opioid requirements from hospitalization.14 If a patient was discharged with prescriptions for several opioids, the longest single prescription duration was used.
Primary Predictors
The primary predictor was the patient’s primary self-reported race/ethnicity, categorized as White, Black, LatinX, Asian, Native Hawaiian or other Pacific Islander, American Indian or Alaska Native, and other/unknown. Other/unknown included patients who were listed as other, declined, or who were otherwise unspecified. Self-reported race/ethnicity is obtained through reporting to the registrar. These race/ethnicity groupings were done in concordance with US Census Bureau definitions. Researchers classified patients as LatinX if they had Hispanic documented as their ethnicity, no matter their racial identification. These categorizations were chosen to be consistent with the existing literature, recognizing the role of a combined race/ethnicity definition for Hispanic or LatinX populations.15 These definitions of race/ethnicity are self-reported and reflect socially—not genetically defined—groupings.16 This variable serves as a surrogate for the structural factors that contribute to racism, the determining factor for racially disparate outcomes.17
Covariate Data Collection
Additional data were obtained regarding patient demographics, hospitalization factors, and medical diagnoses. Demographic factors included age, sex, and limited English proficiency (LEP) status. LEP was defined as having a primary language other than English and requiring an interpreter. Hospitalization factors included length of stay, whether they required intensive care unit (ICU) management, average daily MMEs administered during their entire hospitalization, MMEs administered during the final 24 hours of their hospitalization, whether the patient was on a teaching service or direct-care hospitalist service, their disposition on discharge, and year. Medical diagnosis variables included the adjusted Elixhauser Comorbidity Index based on ICD-10 codes; whether the patient was taking opioids at admission; and specific diagnoses of cancer, posttraumatic stress disorder (PTSD), and mood, anxiety, or psychotic disorder based on ICD-10 documentation.18
Statistical Analysis
All statistical analyses were performed using Stata software version 16 (StataCorp LP). Baseline demographic variables, hospitalization factors, and medical diagnosis variables were stratified by race/ethnicity. Within group comparisons were performed using chi-square or analysis of varianace (ANOVA) testing. For regression analyses, we fit two models. First, we fit a multivariable logistic regression model on all patients who received opioids during the last 24 hours of their hospitalization to examine the association between patient race/ethnicity and whether a patient received opioids at discharge, adjusting for additional patient, hospitalization, and medical covariates. Then we fit a negative binomial regression model on patients who were prescribed opioids at discharge to examine the association between patient race/ethnicity and the amount of opioids prescribed at discharge, adjusting for covariates. We used a negative binomial model because of the overdispersed distribution of discharge opioid prescriptions and only examined patients with an opioid prescription at discharge. We included the listed variables in our model because they were all found a priori to be associated with discharge opioid prescriptions.19 Instead of using days of opioids based on the last 24 hours, we performed a secondary analysis using the actual days of opioids supplied as the outcome. For example, a prescription of 12 tablets with every 6 hours dosing would be 3 days’ duration.
For both models, subgroup analyses were performed using the adjusted models restricted to patients newly prescribed opioids during their hospitalization and who were not previously taking opioids based on admission medication reconciliation. After testing for effect modification, this subgroup analysis was performed to reduce selection bias associated with earlier opioid use.
For all models, we reported predicted population opioid prescribing rates from the average marginal effects (AME).20 Marginal effects were used because ours was a population level study and the outcome of interest was relatively common, limiting the effective interpretation of odds ratios.21 Marginal effects allow us to observe the instantaneous effect a given independent variable has on a dependent variable, while holding all other variables constant. It is implemented using the margins command in Stata. Marginal effects enable us to present our results as differences in probabilities, which is a more accurate way to describe the differences found among patient groups. Further, marginal effects are less sensitive to changes in model specifications.22The UCSF Institutional Review Board for Human Subjects Research approved this study with a waiver of informed consent.
RESULTS
Unadjusted Results
We identified 10,953 patients who received opioids during the last 24 hours of hospitalization (see Appendix Figure 1 for study consort diagram). The patient population was 52.2% White, 18.4% Black, 11.5% Latinx, 10.1% Asian, 6.2% other/unknown, 0.9% Native Hawaiian/Other Pacific Islander, and 0.8% American Indian/Alaska Native (Table 1, Appendix Table 1). Black patients had fewer cancer diagnoses and the highest rate of prescribed opioids on admission. Asian patients were older and more likely to be female, and had higher rates of cancer, the highest median comorbidity index, and the smallest median daily MME during both the last 24 hours and total duration of hospitalization. Representative of general medicine patients, the most common principal discharge diagnoses in our dataset were pneumonia, cellulitis, altered mental status, sepsis, and abdominal pain.

Overall, 5541 (50.6%) patients who received opioids in the last 24 hours of their hospitalization received an opioid prescription at discharge. There were significant differences among racial/ethnic groups receiving an opioid prescription at discharge. Black patients were less likely to be discharged with an opioid compared with White patients (47.7% vs 50.3%; P < .001) (Table 2). The median discharge prescription duration for all patients was 9.3 days (interquartile range [IQR], 3.8-20.0). Black patients received the fewest median days of opioids at 7.5 days (IQR, 3.2-16.7) compared with White patients at 8.8 days (IQR, 3.7-20.0; P < .001) (Table 2).

Adjusted Regression Results
Demographic, clinical, and diagnosis specific factors were significantly associated with opioid prescriptions, including previous opioid use, sex, and a concurrent cancer diagnosis. There were fewer opioid prescriptions over time (Figure).
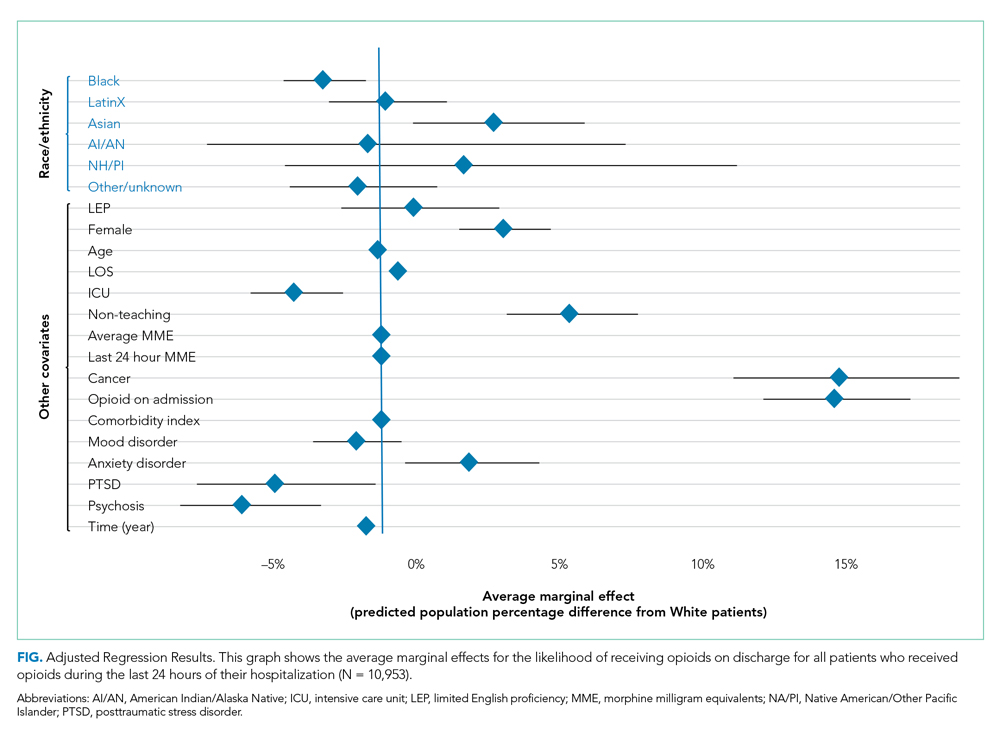
Following multivariable logistic regression for the association between race/ethnicity and opioid on discharge and controlling for covariates, we found that Black patients were less likely to receive an opioid prescription on discharge compared with White patients (predicted population rate, 47.6% vs 50.7%; AME −3.1%; 95% CI, −5.5% to −0.8%). Asian patients were more likely to receive a prescription on discharge compared with White patients (predicted population rate, 55.6% vs 50.7%; AME +4.9; 95% CI, 1.5%-8.3%).
Following multivariable negative binomial regression for the association between race/ethnicity and the number of opioid days on discharge, we found that Black patients received a shorter duration of opioid days compared with White patients (predicted days of opioids on discharge, 15.7 days vs 17.8 days; AME −2.1 days; 95% CI, −3.3 to −0.87) (Table 3). There were no significant differences among patients and the other racial/ethnic groups.
 and Multivariable Negative Binomial Regression between Race/Ethnicity and Days of Opioids Prescribed on Discharge (n = 5541)")
Our secondary analysis from the negative binomial regression with the days of opioids supplied metric yielded similar results to our primary analysis showing that Black patients received statically significantly fewer days of opioid therapy compared with White patients (Appendix Table 2).
Subgroup Regression Results
After testing for effect modification, which was negative, we examined the relationships for patients started on opioids during their hospitalization (Appendix Table 3 and Appendix Table 4). There were 5101 patients with newly prescribed opioids during their hospitalization. Adjusting for covariates, we found that Black patients were less likely to receive opioids at discharge compared with White patients (predicted population rate, 34.9% vs 40.4%; AME −5.5%; 95% CI, −9.2% to −1.9%). American Indian or Alaska Native patients were more likely to receive opioids on discharge (predicted population rate, 58.3% vs 40.4%; AME +17.9%; 95% CI, 1.0%-34.8%). We also found that Asian patients received more days of opioids on discharge (predicted days of opioid on discharge, 16.7 vs 13.7 days; AME +3.0 days; 95% CI, 0.6-5.3 days) (Appendix Table 4, Appendix Figure 2).
DISCUSSION
We found that Black patients discharged from the general medicine service were less likely to receive opioids and received shorter courses on discharge compared with White patients, adjusting for demographic, hospitalization, and medical diagnosis variables. Asian patients were more likely to receive an opioid prescription at discharge—a finding not reported in the literature on opioid prescribing disparities in most other practice settings.1
Previous studies have shown racial disparities in pain management in emergency and surgical settings, but these relationships have not been characterized in an inpatient medicine population. Medicine patients comprise the majority of admitted patients in the United States and reflect a wide diversity of medical conditions, many requiring opioids for pain management. Determining the etiology of these differential prescribing patterns was not within the scope of our study, but earlier studies demonstrate a number of reasons why these patterns exist across racial and ethnic groups in other practice settings.23,24 These reports give us insight into potential mechanisms for our study population.
Differences in pain management likely represent the multiple structural mechanisms by which racism operates.17 Drawing from the existing literature and the socioecological model, we hypothesize the ways that individual, interpersonal relationships, organizations, communities, and public policy impact opioid prescribing.25,26 Using this model and considering the framework of Critical Race Theory (CRT), we can work towards understanding how race and ethnicity stand in as surrogates for racism and how this manifests in different outcomes and identify areas for intervention. CRT draws attention to race consciousness, contemporary orientation, centering in the margins, and praxis. In the context of this analysis, we recognize race consciousness and the interactions among factors such as race/ethnicity, language, and diagnoses such as PTSD.27 This approach is necessary because racism is a multilevel construct influenced by macrolevel factors.28
Individually and interpersonally, there is clinician-driven bias in pain assessment, which is activated under times of stress and diagnostic uncertainty and is amplified by a lack of clear guidelines for pain management prescriptions.23,29-32 Institutional and organizational culture contribute to disparities through ingrained culture, practice patterns, and resource allocation.29,33 Last, public policy and the larger sociopolitical environment worsen disparities through nondiverse workforces, state and federal guidelines, criminal justice policy, supply chain regulation, and access to care.
As individual clinicians, departments, and health systems leaders, we must identify areas for intervention. At the individual and interpersonal levels, there is evidence that taking implicit association tests could help clinicians become more aware of their negative associations, and empathy-inducing, perspective-taking interventions can reduce pain treatment bias.31,34 At the institutional level, we must report data on disparities, create guidelines for pain management, and reevaluate the educational curriculum and culture to assess how certain biases could be propagated. The lack of straightforward guidelines leads to unclear indications for opioid prescriptions, exacerbating provider-level differences in prescribing. At the policy level, legislation that promotes workplace diversity, increases training for and access to pain specialists, and incentivizes data collection and reporting could help reduce disparities.35 Equitable access to prescriptions and care is essential. Pharmacies often understock opioids in minority neighborhoods, meaning that even if a patient is prescribed an opioid on discharge, he or she might have difficulty filling the prescription.36
One could question whether fewer opioid prescriptions for Black patients protects against the harms of opioid overprescribing, and therefore is not reflective of harmful inequity.37 Ongoing national programs aim to reduce the harmful effects of opioids, which is reflected in the reduction in opioid prescribing over time in our institution. Our point is that differences in prescribing could reflect practices that do result in patient harm, such as less adequately controlled pain among Black patients.1,3 Undertreated pain has negative health and social consequences and further contributes to substance-use stigma within minority communities.38 Moreover, Black people who describe more discrimination in medical settings were more likely to report subsequent opioid misuse.39
Although the above mechanisms might partially explain our findings among Black patients, the higher rate of prescribing for Asian patients is more challenging to explain. Our models adjusted for clinical factors. Notably, our Asian patients had the highest baseline comorbidity index, oldest mean age, and highest cancer rates, and it is possible that we were unable to fully account for illness severity or related pain needs (Table 1). It also is possible—although speculative—that factors such as language, provider concordance, and the type of disease process all contribute.40 Some researchers have proposed a “stereotype content model” that seeks to establish a pathway among social structure (status of a patient) to clinician stereotypes (is this patient warm and/or competent) to emotional prejudices (envy, pride) and ultimately to discrimination (active/passive, help/harm).23Our study has limitations. Our model was limited by the available data collected on our patients. Covariates including primary care follow-up, pain scores, and overdose history were not available. Furthermore, our categorization of race/ethnicity was based on self-reported data. We had 676 patients with race/ethnicity specified as other/unknown. We recognize the heterogeneity within these racial/ethnic categorizations. For example, within the LatinX or Asian communities, there are large differences based on region, country, ethnic, or cultural groups. Our study only included patients presenting to a hospital in San Francisco, which is different from the racial/ethnic makeup of other cities across the nation. Our electronic health record capture of history of opioid use disorder and mood disorders is contingent on individual clinician documentation. We did not account for provider-level differences, which is an important part of variation in prescribing differences. We also did not examine differences at the diagnosis-specific level. Finally, we could not determine the indication or appropriateness of opioid prescriptions.
Future studies will be necessary to characterize this relationship at a diagnosis-specific level and to describe causal pathways. Within our own institution, these findings present an opportunity for positive change. We hope to continue to explore the etiology of these disparities and identify areas where differences could impact patient outcomes, such as pain control. It is essential to develop appropriate recommendations for inpatient and discharge opioid prescribing to help minimize disparities and to mitigate potential harms of overprescribing. All health systems should continue to collect data on their own disparities in opioid prescribing and educate clinicians on promoting more equitable practices.
Acknowledgments
The authors thank Sneha Daya, MD, Sachin Shah, MD, MPH, and the UCSF Division of Hospital Medicine Data Core.
1. Romanelli RJ, Shen Z, Szwerinski N, Scott A, Lockhart S, Pressman AR. Racial and ethnic disparities in opioid prescribing for long bone fractures at discharge from the emergency department: a cross-sectional analysis of 22 centers from a health care delivery system in northern California. Ann Emerg Med. 2019;74(5):622-631. https://doi.org/10.1016/j.annemergmed.2019.05.018
2. Tamayo-Sarver JH, Hinze SW, Cydulka RK, Baker DW. Racial and ethnic disparities in emergency department analgesic prescription. Am J Public Health. 2003;93(12):2067-2073. https://doi.org/10.2105/ajph.93.12.2067
3. Berger AJ, Wang Y, Rowe C, Chung B, Chang S, Haleblian G. Racial disparities in analgesic use amongst patients presenting to the emergency department for kidney stones in the United States. Am J Emerg Med. 2021;39:71-74. https://doi.org/10.1016/j.ajem.2020.01.017
4. Dickason RM, Chauhan V, Mor A, et al. Racial differences in opiate administration for pain relief at an academic emergency department. West J Emerg Med. 2015;16(3):372-380. https://doi.org/10.5811/westjem.2015.3.23893
5. Singhal A, Tien Y-Y, Hsia RY. Racial-ethnic disparities in opioid prescriptions at emergency department visits for conditions commonly associated with prescription drug abuse. PloS One. 2016;11(8):e0159224. https://doi.org/10.1371/journal.pone.0159224
6. Green CR, Anderson KO, Baker TA, et al. The unequal burden of pain: confronting racial and ethnic disparities in pain. Pain Med Malden Mass. 2003;4(3):277-294. https://doi.org/10.1046/j.1526-4637.2003.03034.x
7. Hoffman KM, Trawalter S, Axt JR, Oliver MN. Racial bias in pain assessment and treatment recommendations, and false beliefs about biological differences between blacks and whites. Proc Natl Acad Sci U S A. 2016;113(16):4296-4301. https://doi.org/10.1073/pnas.1516047113
8. Anderson KO, Green CR, Payne R. Racial and ethnic disparities in pain: causes and consequences of unequal care. J Pain. 2009;10(12):1187-1204. https://doi.org/10.1016/j.jpain.2009.10.002
9. Cintron A, Morrison RS. Pain and ethnicity in the United States: a systematic review. J Palliat Med. 2006;9(6):1454-1473. https://doi.org/10.1089/jpm.2006.9.1454
10. Pletcher MJ, Kertesz SG, Kohn MA, Gonzales R. Trends in opioid prescribing by race/ethnicity for patients seeking care in US emergency departments. JAMA. 2008;299(1):70-78. https://doi.org/10.1001/jama.2007.64
11. Campbell CM, Edwards RR. Ethnic differences in pain and pain management. Pain Manag. 2012;2(3):219-230. https://doi.org/10.2217/pmt.12.7
12. Yawn BP, Buchanan GR, Afenyi-Annan AN, et al. Management of sickle cell disease: summary of the 2014 evidence-based report by expert panel members. JAMA. 2014;312(10):1033-1048. https://doi.org/10.1001/jama.2014.10517
13. Brown W. Opioid use in dying patients in hospice and hospital, with and without specialist palliative care team involvement. Eur J Cancer Care (Engl). 2008;17(1):65-71. https://doi.org/10.1111/j.1365-2354.2007.00810.x
14. Iverson N, Lau CY, Abe-Jones Y, et al. Evaluating a novel metric for personalized opioid prescribing after hospitalization: a retrospective cohort study. PloS One. 2020;15(12):e0244735. https://doi.org/ 10.1371/journal.pone.0244735
15. Howell J, Emerson MO. So what “ should ” we use? Evaluating the impact of five racial measures on markers of social inequality. Sociol Race Ethn (Thousand Oaks). 2017;3(1):14-30. https://doi.org/10.1177/2332649216648465
16. Kaplan JB, Bennett T. Use of race and ethnicity in biomedical publication. JAMA. 2003;289(20):2709-2716. https://doi.org/10.1001/jama.289.20.2709
17. Boyd RW, Lindo EG, Weeks LD, McLemore MR. On racism: a new standard for publishing on racial health inequities. Health Affairs. Published July 2, 2020. Accessed August 20, 2021. https://www.healthaffairs.org/do/10.1377/hblog20200630.939347/full
18. van Walraven C, Austin PC, Jennings A, Quan H, Forster AJ. A modification of the Elixhauser comorbidity measures into a point system for hospital death using administrative data. Med Care. 2009;47(6):626-633. https://doi.org/10.1097/MLR.0b013e31819432e5
19. Sun GW, Shook TL, Kay GL. Inappropriate use of bivariable analysis to screen risk factors for use in multivariable analysis. J Clin Epidemiol. 1996;49(8):907-916. https://doi.org/10.1016/0895-4356(96)00025-x
20. Norton EC, Dowd BE, Maciejewski ML. Marginal effects-quantifying the effect of changes in risk factors in logistic regression models. JAMA. 2019;321(13):1304-1305. https://doi.org/10.1001/jama.2019.1954
21. Zhang J, Yu KF. What’s the relative risk? A method of correcting the odds ratio in cohort studies of common outcomes. JAMA. 1998;280(19):1690-1691. https://doi.org/10.1001/jama.280.19.1690
22. Norton EC, Dowd BE. Log odds and the interpretation of logit models. Health Serv Res. 2018;53(2):859-878. https://doi.org/10.1111/1475-6773.12712
23. Dovidio JF, Fiske ST. Under the radar: how unexamined biases in decision-making processes in clinical interactions can contribute to health care disparities. Am J Public Health. 2012;102(5):945-952. https://doi.org/10.2105/AJPH.2011.300601
24. van Ryn M. Research on the provider contribution to race/ethnicity disparities in medical care. Med Care. 2002;40(1 Suppl):I140-151. https://doi.org/10.1097/00005650-200201001-00015
25. Krieger N. Theories for social epidemiology in the 21st century: an ecosocial perspective. Int J Epidemiol. 2001;30(4):668-677. https://doi.org/10.1093/ije/30.4.668
26. Golden SD, Earp JAL. Social ecological approaches to individuals and their contexts: twenty years of health education & behavior health promotion interventions. Health Educ Behav Off Publ Soc Public Health Educ. 2012;39(3):364-372. https://doi.org/10.1177/1090198111418634
27. Ford CL, Airhihenbuwa CO. Critical race theory, race equity, and public health: toward antiracism praxis. Am J Public Health. 2010;100 Suppl 1(Suppl 1):S30-5. https://doi.org/10.2105/AJPH.2009.171058
28. Ford CL, Daniel M, Earp JAL, Kaufman JS, Golin CE, Miller WC. Perceived everyday racism, residential segregation, and HIV testing among patients at a sexually transmitted disease clinic. Am J Public Health. 2009;99 Suppl 1:S137-143. https://doi.org/10.2105/AJPH.2007.120865
29. Hall WJ, Chapman MV, Lee KM, et al. Implicit racial/ethnic bias among health care professionals and its influence on health care outcomes: a systematic review. Am J Public Health. 2015;105(12):e60-76. https://doi.org/10.2105/AJPH.2015.302903
30. Staton LJ, Panda M, Chen I, et al. When race matters: disagreement in pain perception between patients and their physicians in primary care. J Natl Med Assoc. 2007;99(5):532-538.
31. Drwecki BB, Moore CF, Ward SE, Prkachin KM. Reducing racial disparities in pain treatment: the role of empathy and perspective-taking. Pain. 2011;152(5):1001-1006. https://doi.org/10.1016/j.pain.2010.12.005
32. Mende-Siedlecki P, Qu-Lee J, Backer R, Van Bavel JJ. Perceptual contributions to racial bias in pain recognition. J Exp Psychol Gen. 2019;148(5):863-889. https://doi.org/10.1037/xge0000600
33. King G. Institutional racism and the medical/health complex: a conceptual analysis. Ethn Dis. 1996;6(1-2):30-46.
34. Maina IW, Belton TD, Ginzberg S, Singh A, Johnson TJ. A decade of studying implicit racial/ethnic bias in healthcare providers using the implicit association test. Soc Sci Med. 2018;199:219-229. https://doi.org/10.1016/j.socscimed.2017.05.009
35. Meghani SH, Byun E, Gallagher RM. Time to take stock: a meta-analysis and systematic review of analgesic treatment disparities for pain in the United States. Pain Med. 2012;13(2):150-174. https://doi.org/10.1111/j.1526-4637.2011.01310.x
36. Morrison RS, Wallenstein S, Natale DK, Senzel RS, Huang LL. “We don’t carry that”—failure of pharmacies in predominantly nonwhite neighborhoods to stock opioid analgesics. N Engl J Med. 2000;342(14):1023-1026. https://doi.org/10.1056/NEJM200004063421406
37. Frakt A, Monkovic T. A ‘rare case where racial biases’ protected African-Americans. The New York Times. November 25, 2019. Updated December 2, 2019. Accessed July 5, 2021. https://www.nytimes.com/2019/11/25/upshot/opioid-epidemic-blacks.html
38. Khatri U, Shoshana Aronowitz S, South E. The opioid crisis shows why racism in health care is always harmful, never ‘protective’. The Philadelphia Inquirer. Updated December 26, 2019. Accessed July 5, 2021. https://www.inquirer.com/health/expert-opinions/opioid-crisis-racism-healthcare-buprenorphine-20191223.html
39. Swift SL, Glymour MM, Elfassy T, et al. Racial discrimination in medical care settings and opioid pain reliever misuse in a U.S. cohort: 1992 to 2015. PloS One. 2019;14(12):e0226490. https://journals.plos.org/plosone/article?id=10.1371/journal.pone.0226490
40. Hsieh AY, Tripp DA, Ji L-J. The influence of ethnic concordance and discordance on verbal reports and nonverbal behaviours of pain. Pain. 2011;152(9):2016-2022. https://doi.org/10.1016/j.pain.2011.04.023
Within the nationwide effort to combat the opioid epidemic and reduce opioid prescribing, researchers have described different prescribing patterns for non-White racial and ethnic groups, including Black and LatinX populations. This remains a largely unexplored area within hospital medicine. Earlier studies of racial disparities demonstrate how some patients are assessed less often for pain and prescribed fewer opioids from the emergency department, surgical settings, and outpatient primary care practices. Researchers also have documented racial and ethnic disparities in analgesia for cancer pain and chronic noncancer pain.1-11 Studies have demonstrated that White patients are more likely to receive opioid prescriptions compared with Black patients. Even with similar documented pain scores, there is evidence that Black patients receive fewer analgesics compared with White patients. For example, a recent study found that Black and Hispanic patients presenting to the emergency room for renal colic received less opioid medication compared with White patients.3 A study across 22 sites in Northern California found that racial minorities with long-bone fractures received fewer opioids at discharge than White patients.1
It is unknown whether differential prescribing patterns by race exist among patients hospitalized on general medicine services. The objective of our study was to assess whether race and ethnicity were associated with the likelihood of opioids being prescribed and the duration of opioids prescribed when these patients are discharged from the hospital. Quantifying and seeking to understand these differences are the first steps toward ensuring racial and ethnic health equity in patient care.
METHODS
Study Population and Data Sources
We identified all adults (age ≥18 years) discharged from the acute care inpatient general medicine services between June 1, 2012, and November 30, 2018, at the University of California, San Francisco (UCSF) Helen Diller Medical Center at Parnassus Heights, a 785-bed urban academic teaching hospital. All data were obtained from the hospital’s Epic-based electronic medical record (Epic Systems Corporation). Data elements were extracted from Clarity, the relationship database that stores Epic inpatient data. Patients discharged from the inpatient cardiology or bone marrow transplant services were not included. We excluded patients who did not receive opioids in the last 24 hours of their hospitalization. Patients with cancer-related pain diagnoses or sickle cell disease pain crises and patients who were discharged to hospice or followed by palliative care were excluded from the study based on International Classification of Diseases, Tenth Revision (ICD-10) codes (available on request) or service codes, when available, or admitting provider electronic health record documentation (Appendix Figure 1). Palliative care and hospice patients have significantly different pain needs, with management often directed by specialists. Patients with sickle cell disease are disproportionately Black and have distinct opioid prescribing patterns.12,13 We also excluded discharge opioid prescriptions that were a resumption of the patient’s opioid prescription before admission based on medication documentation. Only new prescriptions signed by the discharging hospitalist, including different doses and formulations, were included in this study.
We performed a subgroup analysis of patients who were not prescribed opioids before their admission based on medication reconciliation but were started on opioids while hospitalized.
Primary Outcomes
We examined two primary outcomes: whether a patient received an opioid prescription at discharge, and, for patients prescribed opioids, the number of days prescribed. Days of opioids at discharge were calculated as total morphine milligram equivalents (MMEs) prescribed divided by MMEs administered during the final 24 hours of hospitalization. This metric was used as a patient-specific approach to calculating how long an opioid prescription will last after discharge, standardized according to the actual opioid requirements from hospitalization.14 If a patient was discharged with prescriptions for several opioids, the longest single prescription duration was used.
Primary Predictors
The primary predictor was the patient’s primary self-reported race/ethnicity, categorized as White, Black, LatinX, Asian, Native Hawaiian or other Pacific Islander, American Indian or Alaska Native, and other/unknown. Other/unknown included patients who were listed as other, declined, or who were otherwise unspecified. Self-reported race/ethnicity is obtained through reporting to the registrar. These race/ethnicity groupings were done in concordance with US Census Bureau definitions. Researchers classified patients as LatinX if they had Hispanic documented as their ethnicity, no matter their racial identification. These categorizations were chosen to be consistent with the existing literature, recognizing the role of a combined race/ethnicity definition for Hispanic or LatinX populations.15 These definitions of race/ethnicity are self-reported and reflect socially—not genetically defined—groupings.16 This variable serves as a surrogate for the structural factors that contribute to racism, the determining factor for racially disparate outcomes.17
Covariate Data Collection
Additional data were obtained regarding patient demographics, hospitalization factors, and medical diagnoses. Demographic factors included age, sex, and limited English proficiency (LEP) status. LEP was defined as having a primary language other than English and requiring an interpreter. Hospitalization factors included length of stay, whether they required intensive care unit (ICU) management, average daily MMEs administered during their entire hospitalization, MMEs administered during the final 24 hours of their hospitalization, whether the patient was on a teaching service or direct-care hospitalist service, their disposition on discharge, and year. Medical diagnosis variables included the adjusted Elixhauser Comorbidity Index based on ICD-10 codes; whether the patient was taking opioids at admission; and specific diagnoses of cancer, posttraumatic stress disorder (PTSD), and mood, anxiety, or psychotic disorder based on ICD-10 documentation.18
Statistical Analysis
All statistical analyses were performed using Stata software version 16 (StataCorp LP). Baseline demographic variables, hospitalization factors, and medical diagnosis variables were stratified by race/ethnicity. Within group comparisons were performed using chi-square or analysis of varianace (ANOVA) testing. For regression analyses, we fit two models. First, we fit a multivariable logistic regression model on all patients who received opioids during the last 24 hours of their hospitalization to examine the association between patient race/ethnicity and whether a patient received opioids at discharge, adjusting for additional patient, hospitalization, and medical covariates. Then we fit a negative binomial regression model on patients who were prescribed opioids at discharge to examine the association between patient race/ethnicity and the amount of opioids prescribed at discharge, adjusting for covariates. We used a negative binomial model because of the overdispersed distribution of discharge opioid prescriptions and only examined patients with an opioid prescription at discharge. We included the listed variables in our model because they were all found a priori to be associated with discharge opioid prescriptions.19 Instead of using days of opioids based on the last 24 hours, we performed a secondary analysis using the actual days of opioids supplied as the outcome. For example, a prescription of 12 tablets with every 6 hours dosing would be 3 days’ duration.
For both models, subgroup analyses were performed using the adjusted models restricted to patients newly prescribed opioids during their hospitalization and who were not previously taking opioids based on admission medication reconciliation. After testing for effect modification, this subgroup analysis was performed to reduce selection bias associated with earlier opioid use.
For all models, we reported predicted population opioid prescribing rates from the average marginal effects (AME).20 Marginal effects were used because ours was a population level study and the outcome of interest was relatively common, limiting the effective interpretation of odds ratios.21 Marginal effects allow us to observe the instantaneous effect a given independent variable has on a dependent variable, while holding all other variables constant. It is implemented using the margins command in Stata. Marginal effects enable us to present our results as differences in probabilities, which is a more accurate way to describe the differences found among patient groups. Further, marginal effects are less sensitive to changes in model specifications.22The UCSF Institutional Review Board for Human Subjects Research approved this study with a waiver of informed consent.
RESULTS
Unadjusted Results
We identified 10,953 patients who received opioids during the last 24 hours of hospitalization (see Appendix Figure 1 for study consort diagram). The patient population was 52.2% White, 18.4% Black, 11.5% Latinx, 10.1% Asian, 6.2% other/unknown, 0.9% Native Hawaiian/Other Pacific Islander, and 0.8% American Indian/Alaska Native (Table 1, Appendix Table 1). Black patients had fewer cancer diagnoses and the highest rate of prescribed opioids on admission. Asian patients were older and more likely to be female, and had higher rates of cancer, the highest median comorbidity index, and the smallest median daily MME during both the last 24 hours and total duration of hospitalization. Representative of general medicine patients, the most common principal discharge diagnoses in our dataset were pneumonia, cellulitis, altered mental status, sepsis, and abdominal pain.
Overall, 5541 (50.6%) patients who received opioids in the last 24 hours of their hospitalization received an opioid prescription at discharge. There were significant differences among racial/ethnic groups receiving an opioid prescription at discharge. Black patients were less likely to be discharged with an opioid compared with White patients (47.7% vs 50.3%; P < .001) (Table 2). The median discharge prescription duration for all patients was 9.3 days (interquartile range [IQR], 3.8-20.0). Black patients received the fewest median days of opioids at 7.5 days (IQR, 3.2-16.7) compared with White patients at 8.8 days (IQR, 3.7-20.0; P < .001) (Table 2).
Adjusted Regression Results
Demographic, clinical, and diagnosis specific factors were significantly associated with opioid prescriptions, including previous opioid use, sex, and a concurrent cancer diagnosis. There were fewer opioid prescriptions over time (Figure).
Following multivariable logistic regression for the association between race/ethnicity and opioid on discharge and controlling for covariates, we found that Black patients were less likely to receive an opioid prescription on discharge compared with White patients (predicted population rate, 47.6% vs 50.7%; AME −3.1%; 95% CI, −5.5% to −0.8%). Asian patients were more likely to receive a prescription on discharge compared with White patients (predicted population rate, 55.6% vs 50.7%; AME +4.9; 95% CI, 1.5%-8.3%).
Following multivariable negative binomial regression for the association between race/ethnicity and the number of opioid days on discharge, we found that Black patients received a shorter duration of opioid days compared with White patients (predicted days of opioids on discharge, 15.7 days vs 17.8 days; AME −2.1 days; 95% CI, −3.3 to −0.87) (Table 3). There were no significant differences among patients and the other racial/ethnic groups.
Our secondary analysis from the negative binomial regression with the days of opioids supplied metric yielded similar results to our primary analysis showing that Black patients received statically significantly fewer days of opioid therapy compared with White patients (Appendix Table 2).
Subgroup Regression Results
After testing for effect modification, which was negative, we examined the relationships for patients started on opioids during their hospitalization (Appendix Table 3 and Appendix Table 4). There were 5101 patients with newly prescribed opioids during their hospitalization. Adjusting for covariates, we found that Black patients were less likely to receive opioids at discharge compared with White patients (predicted population rate, 34.9% vs 40.4%; AME −5.5%; 95% CI, −9.2% to −1.9%). American Indian or Alaska Native patients were more likely to receive opioids on discharge (predicted population rate, 58.3% vs 40.4%; AME +17.9%; 95% CI, 1.0%-34.8%). We also found that Asian patients received more days of opioids on discharge (predicted days of opioid on discharge, 16.7 vs 13.7 days; AME +3.0 days; 95% CI, 0.6-5.3 days) (Appendix Table 4, Appendix Figure 2).
DISCUSSION
We found that Black patients discharged from the general medicine service were less likely to receive opioids and received shorter courses on discharge compared with White patients, adjusting for demographic, hospitalization, and medical diagnosis variables. Asian patients were more likely to receive an opioid prescription at discharge—a finding not reported in the literature on opioid prescribing disparities in most other practice settings.1
Previous studies have shown racial disparities in pain management in emergency and surgical settings, but these relationships have not been characterized in an inpatient medicine population. Medicine patients comprise the majority of admitted patients in the United States and reflect a wide diversity of medical conditions, many requiring opioids for pain management. Determining the etiology of these differential prescribing patterns was not within the scope of our study, but earlier studies demonstrate a number of reasons why these patterns exist across racial and ethnic groups in other practice settings.23,24 These reports give us insight into potential mechanisms for our study population.
Differences in pain management likely represent the multiple structural mechanisms by which racism operates.17 Drawing from the existing literature and the socioecological model, we hypothesize the ways that individual, interpersonal relationships, organizations, communities, and public policy impact opioid prescribing.25,26 Using this model and considering the framework of Critical Race Theory (CRT), we can work towards understanding how race and ethnicity stand in as surrogates for racism and how this manifests in different outcomes and identify areas for intervention. CRT draws attention to race consciousness, contemporary orientation, centering in the margins, and praxis. In the context of this analysis, we recognize race consciousness and the interactions among factors such as race/ethnicity, language, and diagnoses such as PTSD.27 This approach is necessary because racism is a multilevel construct influenced by macrolevel factors.28
Individually and interpersonally, there is clinician-driven bias in pain assessment, which is activated under times of stress and diagnostic uncertainty and is amplified by a lack of clear guidelines for pain management prescriptions.23,29-32 Institutional and organizational culture contribute to disparities through ingrained culture, practice patterns, and resource allocation.29,33 Last, public policy and the larger sociopolitical environment worsen disparities through nondiverse workforces, state and federal guidelines, criminal justice policy, supply chain regulation, and access to care.
As individual clinicians, departments, and health systems leaders, we must identify areas for intervention. At the individual and interpersonal levels, there is evidence that taking implicit association tests could help clinicians become more aware of their negative associations, and empathy-inducing, perspective-taking interventions can reduce pain treatment bias.31,34 At the institutional level, we must report data on disparities, create guidelines for pain management, and reevaluate the educational curriculum and culture to assess how certain biases could be propagated. The lack of straightforward guidelines leads to unclear indications for opioid prescriptions, exacerbating provider-level differences in prescribing. At the policy level, legislation that promotes workplace diversity, increases training for and access to pain specialists, and incentivizes data collection and reporting could help reduce disparities.35 Equitable access to prescriptions and care is essential. Pharmacies often understock opioids in minority neighborhoods, meaning that even if a patient is prescribed an opioid on discharge, he or she might have difficulty filling the prescription.36
One could question whether fewer opioid prescriptions for Black patients protects against the harms of opioid overprescribing, and therefore is not reflective of harmful inequity.37 Ongoing national programs aim to reduce the harmful effects of opioids, which is reflected in the reduction in opioid prescribing over time in our institution. Our point is that differences in prescribing could reflect practices that do result in patient harm, such as less adequately controlled pain among Black patients.1,3 Undertreated pain has negative health and social consequences and further contributes to substance-use stigma within minority communities.38 Moreover, Black people who describe more discrimination in medical settings were more likely to report subsequent opioid misuse.39
Although the above mechanisms might partially explain our findings among Black patients, the higher rate of prescribing for Asian patients is more challenging to explain. Our models adjusted for clinical factors. Notably, our Asian patients had the highest baseline comorbidity index, oldest mean age, and highest cancer rates, and it is possible that we were unable to fully account for illness severity or related pain needs (Table 1). It also is possible—although speculative—that factors such as language, provider concordance, and the type of disease process all contribute.40 Some researchers have proposed a “stereotype content model” that seeks to establish a pathway among social structure (status of a patient) to clinician stereotypes (is this patient warm and/or competent) to emotional prejudices (envy, pride) and ultimately to discrimination (active/passive, help/harm).23Our study has limitations. Our model was limited by the available data collected on our patients. Covariates including primary care follow-up, pain scores, and overdose history were not available. Furthermore, our categorization of race/ethnicity was based on self-reported data. We had 676 patients with race/ethnicity specified as other/unknown. We recognize the heterogeneity within these racial/ethnic categorizations. For example, within the LatinX or Asian communities, there are large differences based on region, country, ethnic, or cultural groups. Our study only included patients presenting to a hospital in San Francisco, which is different from the racial/ethnic makeup of other cities across the nation. Our electronic health record capture of history of opioid use disorder and mood disorders is contingent on individual clinician documentation. We did not account for provider-level differences, which is an important part of variation in prescribing differences. We also did not examine differences at the diagnosis-specific level. Finally, we could not determine the indication or appropriateness of opioid prescriptions.
Future studies will be necessary to characterize this relationship at a diagnosis-specific level and to describe causal pathways. Within our own institution, these findings present an opportunity for positive change. We hope to continue to explore the etiology of these disparities and identify areas where differences could impact patient outcomes, such as pain control. It is essential to develop appropriate recommendations for inpatient and discharge opioid prescribing to help minimize disparities and to mitigate potential harms of overprescribing. All health systems should continue to collect data on their own disparities in opioid prescribing and educate clinicians on promoting more equitable practices.
Acknowledgments
The authors thank Sneha Daya, MD, Sachin Shah, MD, MPH, and the UCSF Division of Hospital Medicine Data Core.
1. Romanelli RJ, Shen Z, Szwerinski N, Scott A, Lockhart S, Pressman AR. Racial and ethnic disparities in opioid prescribing for long bone fractures at discharge from the emergency department: a cross-sectional analysis of 22 centers from a health care delivery system in northern California. Ann Emerg Med. 2019;74(5):622-631. https://doi.org/10.1016/j.annemergmed.2019.05.018
2. Tamayo-Sarver JH, Hinze SW, Cydulka RK, Baker DW. Racial and ethnic disparities in emergency department analgesic prescription. Am J Public Health. 2003;93(12):2067-2073. https://doi.org/10.2105/ajph.93.12.2067
3. Berger AJ, Wang Y, Rowe C, Chung B, Chang S, Haleblian G. Racial disparities in analgesic use amongst patients presenting to the emergency department for kidney stones in the United States. Am J Emerg Med. 2021;39:71-74. https://doi.org/10.1016/j.ajem.2020.01.017
4. Dickason RM, Chauhan V, Mor A, et al. Racial differences in opiate administration for pain relief at an academic emergency department. West J Emerg Med. 2015;16(3):372-380. https://doi.org/10.5811/westjem.2015.3.23893
5. Singhal A, Tien Y-Y, Hsia RY. Racial-ethnic disparities in opioid prescriptions at emergency department visits for conditions commonly associated with prescription drug abuse. PloS One. 2016;11(8):e0159224. https://doi.org/10.1371/journal.pone.0159224
6. Green CR, Anderson KO, Baker TA, et al. The unequal burden of pain: confronting racial and ethnic disparities in pain. Pain Med Malden Mass. 2003;4(3):277-294. https://doi.org/10.1046/j.1526-4637.2003.03034.x
7. Hoffman KM, Trawalter S, Axt JR, Oliver MN. Racial bias in pain assessment and treatment recommendations, and false beliefs about biological differences between blacks and whites. Proc Natl Acad Sci U S A. 2016;113(16):4296-4301. https://doi.org/10.1073/pnas.1516047113
8. Anderson KO, Green CR, Payne R. Racial and ethnic disparities in pain: causes and consequences of unequal care. J Pain. 2009;10(12):1187-1204. https://doi.org/10.1016/j.jpain.2009.10.002
9. Cintron A, Morrison RS. Pain and ethnicity in the United States: a systematic review. J Palliat Med. 2006;9(6):1454-1473. https://doi.org/10.1089/jpm.2006.9.1454
10. Pletcher MJ, Kertesz SG, Kohn MA, Gonzales R. Trends in opioid prescribing by race/ethnicity for patients seeking care in US emergency departments. JAMA. 2008;299(1):70-78. https://doi.org/10.1001/jama.2007.64
11. Campbell CM, Edwards RR. Ethnic differences in pain and pain management. Pain Manag. 2012;2(3):219-230. https://doi.org/10.2217/pmt.12.7
12. Yawn BP, Buchanan GR, Afenyi-Annan AN, et al. Management of sickle cell disease: summary of the 2014 evidence-based report by expert panel members. JAMA. 2014;312(10):1033-1048. https://doi.org/10.1001/jama.2014.10517
13. Brown W. Opioid use in dying patients in hospice and hospital, with and without specialist palliative care team involvement. Eur J Cancer Care (Engl). 2008;17(1):65-71. https://doi.org/10.1111/j.1365-2354.2007.00810.x
14. Iverson N, Lau CY, Abe-Jones Y, et al. Evaluating a novel metric for personalized opioid prescribing after hospitalization: a retrospective cohort study. PloS One. 2020;15(12):e0244735. https://doi.org/ 10.1371/journal.pone.0244735
15. Howell J, Emerson MO. So what “ should ” we use? Evaluating the impact of five racial measures on markers of social inequality. Sociol Race Ethn (Thousand Oaks). 2017;3(1):14-30. https://doi.org/10.1177/2332649216648465
16. Kaplan JB, Bennett T. Use of race and ethnicity in biomedical publication. JAMA. 2003;289(20):2709-2716. https://doi.org/10.1001/jama.289.20.2709
17. Boyd RW, Lindo EG, Weeks LD, McLemore MR. On racism: a new standard for publishing on racial health inequities. Health Affairs. Published July 2, 2020. Accessed August 20, 2021. https://www.healthaffairs.org/do/10.1377/hblog20200630.939347/full
18. van Walraven C, Austin PC, Jennings A, Quan H, Forster AJ. A modification of the Elixhauser comorbidity measures into a point system for hospital death using administrative data. Med Care. 2009;47(6):626-633. https://doi.org/10.1097/MLR.0b013e31819432e5
19. Sun GW, Shook TL, Kay GL. Inappropriate use of bivariable analysis to screen risk factors for use in multivariable analysis. J Clin Epidemiol. 1996;49(8):907-916. https://doi.org/10.1016/0895-4356(96)00025-x
20. Norton EC, Dowd BE, Maciejewski ML. Marginal effects-quantifying the effect of changes in risk factors in logistic regression models. JAMA. 2019;321(13):1304-1305. https://doi.org/10.1001/jama.2019.1954
21. Zhang J, Yu KF. What’s the relative risk? A method of correcting the odds ratio in cohort studies of common outcomes. JAMA. 1998;280(19):1690-1691. https://doi.org/10.1001/jama.280.19.1690
22. Norton EC, Dowd BE. Log odds and the interpretation of logit models. Health Serv Res. 2018;53(2):859-878. https://doi.org/10.1111/1475-6773.12712
23. Dovidio JF, Fiske ST. Under the radar: how unexamined biases in decision-making processes in clinical interactions can contribute to health care disparities. Am J Public Health. 2012;102(5):945-952. https://doi.org/10.2105/AJPH.2011.300601
24. van Ryn M. Research on the provider contribution to race/ethnicity disparities in medical care. Med Care. 2002;40(1 Suppl):I140-151. https://doi.org/10.1097/00005650-200201001-00015
25. Krieger N. Theories for social epidemiology in the 21st century: an ecosocial perspective. Int J Epidemiol. 2001;30(4):668-677. https://doi.org/10.1093/ije/30.4.668
26. Golden SD, Earp JAL. Social ecological approaches to individuals and their contexts: twenty years of health education & behavior health promotion interventions. Health Educ Behav Off Publ Soc Public Health Educ. 2012;39(3):364-372. https://doi.org/10.1177/1090198111418634
27. Ford CL, Airhihenbuwa CO. Critical race theory, race equity, and public health: toward antiracism praxis. Am J Public Health. 2010;100 Suppl 1(Suppl 1):S30-5. https://doi.org/10.2105/AJPH.2009.171058
28. Ford CL, Daniel M, Earp JAL, Kaufman JS, Golin CE, Miller WC. Perceived everyday racism, residential segregation, and HIV testing among patients at a sexually transmitted disease clinic. Am J Public Health. 2009;99 Suppl 1:S137-143. https://doi.org/10.2105/AJPH.2007.120865
29. Hall WJ, Chapman MV, Lee KM, et al. Implicit racial/ethnic bias among health care professionals and its influence on health care outcomes: a systematic review. Am J Public Health. 2015;105(12):e60-76. https://doi.org/10.2105/AJPH.2015.302903
30. Staton LJ, Panda M, Chen I, et al. When race matters: disagreement in pain perception between patients and their physicians in primary care. J Natl Med Assoc. 2007;99(5):532-538.
31. Drwecki BB, Moore CF, Ward SE, Prkachin KM. Reducing racial disparities in pain treatment: the role of empathy and perspective-taking. Pain. 2011;152(5):1001-1006. https://doi.org/10.1016/j.pain.2010.12.005
32. Mende-Siedlecki P, Qu-Lee J, Backer R, Van Bavel JJ. Perceptual contributions to racial bias in pain recognition. J Exp Psychol Gen. 2019;148(5):863-889. https://doi.org/10.1037/xge0000600
33. King G. Institutional racism and the medical/health complex: a conceptual analysis. Ethn Dis. 1996;6(1-2):30-46.
34. Maina IW, Belton TD, Ginzberg S, Singh A, Johnson TJ. A decade of studying implicit racial/ethnic bias in healthcare providers using the implicit association test. Soc Sci Med. 2018;199:219-229. https://doi.org/10.1016/j.socscimed.2017.05.009
35. Meghani SH, Byun E, Gallagher RM. Time to take stock: a meta-analysis and systematic review of analgesic treatment disparities for pain in the United States. Pain Med. 2012;13(2):150-174. https://doi.org/10.1111/j.1526-4637.2011.01310.x
36. Morrison RS, Wallenstein S, Natale DK, Senzel RS, Huang LL. “We don’t carry that”—failure of pharmacies in predominantly nonwhite neighborhoods to stock opioid analgesics. N Engl J Med. 2000;342(14):1023-1026. https://doi.org/10.1056/NEJM200004063421406
37. Frakt A, Monkovic T. A ‘rare case where racial biases’ protected African-Americans. The New York Times. November 25, 2019. Updated December 2, 2019. Accessed July 5, 2021. https://www.nytimes.com/2019/11/25/upshot/opioid-epidemic-blacks.html
38. Khatri U, Shoshana Aronowitz S, South E. The opioid crisis shows why racism in health care is always harmful, never ‘protective’. The Philadelphia Inquirer. Updated December 26, 2019. Accessed July 5, 2021. https://www.inquirer.com/health/expert-opinions/opioid-crisis-racism-healthcare-buprenorphine-20191223.html
39. Swift SL, Glymour MM, Elfassy T, et al. Racial discrimination in medical care settings and opioid pain reliever misuse in a U.S. cohort: 1992 to 2015. PloS One. 2019;14(12):e0226490. https://journals.plos.org/plosone/article?id=10.1371/journal.pone.0226490
40. Hsieh AY, Tripp DA, Ji L-J. The influence of ethnic concordance and discordance on verbal reports and nonverbal behaviours of pain. Pain. 2011;152(9):2016-2022. https://doi.org/10.1016/j.pain.2011.04.023
© 2021 Society of Hospital Medicine
Factors Associated With COVID-19 Disease Severity in US Children and Adolescents
The COVID-19 pandemic has led to more than 40 million infections and more than 650,000 deaths in the United States alone.1 Morbidity and mortality have disproportionately affected older adults.2-4 However, acute infection and delayed effects, such as multisystem inflammatory syndrome in children (MIS-C), occur and can lead to severe complications, hospitalization, and death in pediatric patients.5,6 Due to higher clinical disease prevalence and morbidity in the adult population, we have learned much about the clinical factors associated with severe adult COVID-19 disease.5,7-9 Such clinical factors include older age, concurrent comorbidities, smoke exposure, and Black race or Hispanic ethnicity, among others.5,7-10 However, there is a paucity of data on severe COVID-19 disease in pediatric patients.5,11,12 In addition, most immunization strategies and pharmacologic treatments for COVID-19 have not been evaluated or approved for use in children.13 To guide targeted prevention and treatment strategies, there is a critical need to identify children and adolescents—who are among the most vulnerable patient populations—at high risk for severe disease.
Identifying the clinical factors associated with severe COVID-19 disease will help with prioritizing and allocating vaccines when they are approved for use in patients younger than 12 years.
METHODS
Study Design
We conducted a multicenter retrospective cohort study of patients presenting for care at pediatric hospitals that report data to the Pediatric Health Information System (PHIS) database. The PHIS administrative database includes billing and utilization data from 45 US tertiary care hospitals affiliated with the Children’s Hospital Association (Lenexa, Kansas). Data quality and reliability are ensured through a joint validation effort between the Children’s Hospital Association and participating hospitals. Hospitals submit discharge data, including demographics, diagnoses, and procedures using International Classification of Diseases, 10th Revision (ICD-10) codes, along with daily detailed information on pharmacy, location of care, and other services.
Study Population
Patients 30 days to 18 years of age discharged from the emergency department (ED) or inpatient setting with a primary diagnosis of COVID-19 (ICD-10 codes U.071 and U.072) between April 1, 2020, and September 30, 2020, were eligible for inclusion.14 In a prior study, the positive predictive value of an ICD-10–coded diagnosis of COVID-19 among hospitalized pediatric patients was 95.5%, compared with reverse transcription polymerase reaction results or presence of MIS-C.15 The diagnostic code for COVID-19 (ICD-10-CM) also had a high sensitivity (98.0%) in the hospitalized population.16 Acknowledging the increasing practice of screening patients upon admission, and in an attempt to minimize potential misclassification, we did not include encounters with secondary diagnoses of COVID-19 in our primary analyses. Pediatric patients with surgical diagnoses and neonates who never left the hospital were also excluded.
Factors Associated With Severe COVID-19 Disease
Exposures of interest were determined a priori based on current evidence in the literature and included patient age (0-4 years, 5-11 years, and 12-18 years), sex, race and ethnicity (non-Hispanic White, non-Hispanic Black, Hispanic, Asian, other non-White race [defined as Pacific Islander, Native American, or other]), payor type, cardiovascular complex chronic conditions (CCC), neuromuscular CCC, obesity/type 2 diabetes mellitus (DM), pulmonary CCC, asthma (defined using ICD-10 codes17), and immunocompromised CCC
Pediatric Complications and Conditions Associated With COVID-19
Based on current evidence and expert opinion of study members, associated diagnoses and complications co-occurring with a COVID-19 diagnosis were defined a priori and identified through ICD-10 codes (Appendix Table 1). These included acute kidney injury, acute liver injury, aseptic meningitis, asthma exacerbation, bronchiolitis, cerebral infarction, croup, encephalitis, encephalopathy, infant fever, febrile seizure, gastroenteritis/dehydration, Kawasaki disease/MIS-C, myocarditis/pericarditis, pneumonia, lung effusion or empyema, respiratory failure, sepsis, nonfebrile seizure, pancreatitis, sickle cell complications, and thrombotic complications.
Outcomes
COVID-19 severity outcomes were assessed as follows: (1) mild = ED discharge; (2) moderate = inpatient admission; (3) severe = intensive care unit (ICU) admission without mechanical ventilation, shock, or death; and (4) very severe = ICU admission with mechanical ventilation, shock, or death.19 This ordinal ranking system did not violate the proportional odds assumption. Potential reasons for admission to the ICU without mechanical ventilation, shock, or death include, but are not limited to, need for noninvasive ventilation, vital sign instability, dysrhythmias, respiratory insufficiency, or complications arising from concurrent conditions (eg, thrombotic events, need for continuous albuterol therapy). We examined several secondary, hospital-based outcomes, including associated diagnoses and complications, all-cause 30-day healthcare reutilization (ED visit or rehospitalization), length of stay (LOS), and ICU LOS.
Statistical Analysis
Demographic characteristics were summarized using frequencies and percentages for categorical variables and geometric means with SD and medians with interquartile ranges (IQR) for continuous variables, as appropriate. Factors associated with hospitalization (encompassing severity levels 2-4) vs ED discharge (severity level 1) were assessed using logistic regression. Factors associated with increasing severity among hospitalized pediatric patients (severity levels 2, 3, and 4) were assessed using ordinal logistic regression. Covariates in these analyses included race and ethnicity, age, sex, payor, cardiovascular CCC, neurologic/neuromuscular CCC, obesity/type 2 DM, pulmonary CCC, asthma, and immunocompromised CCC. Adjusted odds ratios (aOR) and corresponding 95% CI for each risk factor were generated using generalized linear mixed effects models and random intercepts for each hospital. Given the potential for diagnostic misclassification of pediatric patients with COVID-19 based on primary vs secondary diagnoses, we performed sensitivity analyses defining the study population as those with a primary diagnosis of COVID-19 and those with a secondary diagnosis of COVID-19 plus a concurrent primary diagnosis of a condition associated with COVID-19 (Appendix Table 1).
All analyses were performed using SAS version 9.4 (SAS Institute, Inc), and P < .05 was considered statistically significant. The Institutional Review Board at Vanderbilt University Medical Center determined that this study of de-identified data did not meet the criteria for human subjects research.
RESULTS
Study Population
A total of 19,976 encounters were included in the study. Of those, 15,913 (79.7%) were discharged from the ED and 4063 (20.3%) were hospitalized (Table 1). The most common race/ethnicity was Hispanic (9741, 48.8%), followed by non-Hispanic White (4217, 21.1%). Reference race/ethnicity data for the overall 2019 PHIS population can be found in Appendix Table 2.

The severity distribution among the hospitalized population was moderate (3222, 79.3%), severe (431, 11.3%), and very severe (380, 9.4%). The frequency of COVID-19 diagnoses increased late in the study period (Figure). Among those hospitalized, the median LOS for the index admission was 2 days (IQR, 1-4), while among those admitted to the ICU, the median LOS was 3 days (IQR, 2-5).

Overall, 10.1% (n = 2020) of the study population had an all-cause repeat encounter (ie, subsequent ED encounter or hospitalization) within 30 days following the index discharge. Repeat encounters were more frequent among patients hospitalized than among those discharged from the ED (Appendix Table 3).
Prevalence of Conditions and Complications Associated With COVID-19
Overall, 3257 (16.3%) patients had one or more co-occurring diagnoses categorized as a COVID-19–associated condition or complication. The most frequent diagnoses included lower respiratory tract disease (pneumonia, lung effusion, or empyema; n = 1415, 7.1%), gastroenteritis/dehydration (n = 1068, 5.3%), respiratory failure (n = 731, 3.7%), febrile infant (n = 413, 2.1%), and nonfebrile seizure (n = 425, 2.1%). Aside from nonfebrile seizure, neurological complications were less frequent and included febrile seizure (n = 155, 0.8%), encephalopathy (n = 63, 0.3%), aseptic meningitis (n = 16, 0.1%), encephalitis (n = 11, 0.1%), and cerebral infarction (n = 6, <0.1%). Kawasaki disease and MIS-C comprised 1.7% (n = 346) of diagnoses. Thrombotic complications occurred in 0.1% (n = 13) of patients. Overall, these conditions and complications associated with COVID-19 were more frequent in hospitalized patients than in those discharged from the ED (P < .001) (Table 2).

Factors Associated With COVID-19 Disease Severity
Compared to pediatric patients with COVID-19 discharged from the ED, factors associated with increased odds of hospitalization included private payor insurance; obesity/type 2 DM; asthma; and cardiovascular, immunocompromised, neurologic/neuromuscular, and pulmonary CCCs (Table 3). Factors associated with decreased risk of hospitalization included Black race or Hispanic ethnicity compared with White race; female sex; and age 5 to 11 years and age 12 to 17 years (vs age 0-4 years). Among children and adolescents hospitalized with COVID-19, factors associated with greater disease severity included Black or other non-White race; age 5 to 11 years; age 12 to 17 years; obesity/type 2 DM; immunocompromised conditions; and cardiovascular, neurologic/neuromuscular, and pulmonary CCCs (Table 3).

Sensitivity Analysis
We performed a sensitivity analysis that expanded the study population to include those with a secondary diagnosis of COVID-19 plus a diagnosis of a COVID-19–associated condition or complication. Analyses using the expanded population (N = 21,247) were similar to the primary analyses (Appendix Table 4 and Appendix Table 5).
DISCUSSION
In this large multicenter study evaluating COVID-19 disease severity in more than 19,000 patients presenting for emergency care at US pediatric hospitals, approximately 20% were hospitalized, and among those hospitalized almost a quarter required ICU care. Clinical risk factors associated with increased risk of hospitalization include private payor status and selected comorbidities (obesity/type 2 DM; asthma; and cardiovascular, pulmonary, immunocompromised, neurologic/neuromuscular CCCs), while those associated with decreased risk of hospitalization include older age, female sex, and Black race or Hispanic ethnicity. Factors associated with severe disease among hospitalized pediatric patients include Black or other non-White race, school age (≥5 years), and certain chronic conditions (cardiovascular disease, obesity/type 2 DM, neurologic or neuromuscular disease). Sixteen percent of patients had a concurrent diagnosis for a condition or complication associated with COVID-19.
While the study population (ie, children and adolescents presenting to the ED) represents a small fraction of children and adolescents in the community with SARS-CoV-2 infection, the results provide important insight into factors of severe COVID-19 in the pediatric population. A report from France suggested ventilatory or hemodynamic support or death were independently associated with older age (≥10 years), elevated C-reactive protein, and hypoxemia.12 An Italian study found that younger age (0-4 years) was associated with less severe disease, while preexisting conditions were more likely in patients with severe disease.11 A single-center case series of 50 patients (aged ≤21 years) hospitalized at a children’s hospital in New York City found respiratory failure (n = 9) was more common in children older than 1 year, patients with elevated inflammatory markers, and patients with obesity.20
Our study confirms several factors for severe COVID-19 found in these studies, including older age,11,12,20 obesity,20 and preexisting conditions.11 Our findings also expand on these reports, including identification of factors associated with hospitalization. Given the rate of 30-day re-encounters among pediatric patients with COVID-19 (10.1%), identifying risk factors for hospitalization may aid ED providers in determining optimal disposition (eg, home, hospital admission, ICU). We also identified specific comorbidities associated with more severe disease in those hospitalized with COVID-19, such as cardiovascular disease, obesity/type 2 DM, and pulmonary, neurologic, or neuromuscular conditions. We also found that asthma increased the risk for hospitalization but not more severe disease among those hospitalized. This latter finding also aligns with recent single-center studies,21,22 whereas a Turkish study of pediatric patients aged 0 to 18 years found no association between asthma and COVID-19 hospitalizations.23We also examined payor type and racial/ethnic factors in our analysis. In 2019, patients who identified as Black or Hispanic comprised 52.3% of all encounters and 40.7% of hospitalizations recorded in the PHIS database. During the same year, encounters for influenza among Black or Hispanic pediatric patients comprised 58.7% of all influenza diagnoses and 47.0% of pediatric influenza hospitalizations (Appendix Table 2). In this study, patients who identified as Black or Hispanic race represented a disproportionately large share of patients presenting to children’s hospitals (68.5%) and of those hospitalized (60.8%). Hispanic ethnicity, in particular, represented a disproportionate share of patients seeking care for COVID-19 compared to the overall PHIS population (47.7% and 27.1%, respectively). After accounting for other factors, we found Black and other non-White race—but not of Hispanic ethnicity—were independently associated with more disease severity among those hospitalized. This contrasts with findings from a recent adult study by Yehia et al,24 who found (after adjusting for other clinical factors) no significant difference in mortality between Black patients and White patients among adults hospitalized due to COVID-19. It also contrasts with a recent large population-based UK study wherein pediatric patients identifying as Asian, but not Black or mixed race or ethnicity, had an increased risk of hospital admission and admission to the ICU compared to children identifying as White. Children identifying as Black or mixed race had longer hospital admissions.25 However, as the authors of the study note, residual confounders and ascertainment bias due to differences in COVID testing may have influenced these findings.
Our findings of differences in hospitalization and disease severity among those hospitalized by race and ethnicity should be interpreted carefully. These may reflect a constellation of factors that are difficult to measure, including differences in healthcare access, inequalities in care (including hospital admission inequalities), and implicit bias—all of which may reflect structural racism. For example, it is possible that children who identify as Black or Hispanic have different access to care compared to children who identify as White, and this may affect disease severity on presentation.2 Alternatively, it is possible that White pediatric patients are more likely to be hospitalized as compared to non-White pediatric patients with similar illness severity. Our finding that pediatric patients who identify as Hispanic or Black had a lower risk of hospitalization should be also interpreted carefully, as this may reflect higher utilization of the ED for SARS-CoV-2 testing, increased use of nonemergency services among those without access to primary care, or systematic differences in provider decision-making among this segment of the population.2 Further study is needed to determine specific drivers for racial and ethnic differences in healthcare utilization in children and adolescents with COVID-19.26
Complications and co-occurring diagnoses in adults with COVID-19 are well documented.27-30 However, there is little information to date on the co-occurring diagnoses and complications associated with COVID-19 in children and adolescents. We found that complications and co-occurring conditions occurred in 16.3% of the study population, with the most frequent conditions including known complications of viral infections such as pneumonia, respiratory failure, and seizures. Acute kidney and liver injury, as well as thrombotic complications, occurred less commonly than in adults.26-29 Interestingly, neurologic complications were also uncommon compared to adult reports8,31 and less frequent than in other viral illnesses in children and adolescents. For example, neurologic complications occur in approximately 7.5% of children and adolescents hospitalized with influenza.32
Limitations of the present study include the retrospective design, as well as incomplete patient-level clinical data in the PHIS database. The PHIS database only includes children’s hospitals, which may limit the generalizability of findings to community hospitals. We also excluded newborns, and our findings may not be generalizable to this population. We only included children and adolescents with a primary diagnosis of COVID-19, which has the potential for misclassification in cases where COVID-19 was a secondary diagnosis. However, results of our sensitivity analysis, which incorporated secondary diagnoses of COVID-19, were consistent with findings from our main analyses. Our study was designed to examine associations between certain prespecified factors and COVID-19 severity among pediatric patients who visited the ED or were admitted to the hospital during the COVID-19 pandemic. Thus, our findings must be interpreted in light of these considerations and may not be generalizable outside the ED or hospital setting. For example, it could be that some segments of the population utilized ED resources for testing, whereas others avoided the ED and other healthcare settings for fear of exposure to SARS-CoV-2. We also relied on diagnosis codes to identify concurrent diagnoses, as well as mechanical ventilation in our very severe outcome cohort, which resulted in this classification for some of these diagnoses. Despite these limitations, our findings represent an important step in understanding the risk factors associated with severe clinical COVID-19 disease in pediatric patients.
Our findings may inform future research and clinical interventions. Future studies on antiviral therapies and immune modulators targeting SARS-CoV-2 infection in children and adolescents should focus on high-risk populations, such as those identified in the study, as these patients are most likely to benefit from therapeutic interventions. Similarly, vaccine-development efforts may benefit from additional evaluation in high-risk populations, some of which may have altered immune responses. Furthermore, with increasing vaccination among adults and changes in recommendations, societal mitigation efforts (eg, masking, physical distancing) will diminish. Continued vigilance and COVID-19–mitigation efforts among high-risk children, for whom vaccines are not yet available, are critical during this transition.
CONCLUSION
Among children with COVID-19 who received care at children’s hospitals and EDs, 20% were hospitalized, and, of those, 21% were admitted to the ICU. Older children and adolescent patients had a lower risk of hospitalization; however, when hospitalized, they had greater illness severity. Those with selected comorbidities (eg, cardiovascular, obesity/type 2 DM, pulmonary and neurologic or neuromuscular disease) had both increased odds of hospitalization and in-hospital illness severity. While there were observed differences in COVID-19 severity by race and ethnicity, additional research is needed to clarify the drivers of such disparities. These factors should be considered when prioritizing mitigation strategies to prevent infection (eg, remote learning, avoidance of group activities, prioritization of COVID-19 vaccine when approved for children aged <12 years).
1. Centers for Disease Control and Prevention. COVID data tracker. Accessed September 9, 2021. https://covid.cdc.gov/covid-data-tracker/#datatracker-home
2. Levy C, Basmaci R, Bensaid P, et al. Changes in reverse transcription polymerase chain reaction-positive severe acute respiratory syndrome coronavirus 2 rates in adults and children according to the epidemic stages. Pediatr Infect Dis J. 2020;39(11):e369-e372. https://doi.org/10.1097/inf.0000000000002861
3. Gudbjartsson DF, Helgason A, Jonsson H, et al. Spread of SARS-CoV-2 in the Icelandic population. N Engl J Med. 2020;382(24):2302-2315. https://doi.org/10.1056/nejmoa2006100
4. Garg S, Kim L, Whitaker M, et al. Hospitalization rates and characteristics of patients hospitalized with laboratory-confirmed coronavirus disease 2019 - COVID-NET, 14 States, March 1-30, 2020. MMWR Morb Mortal Wkly Rep. 2020;69(15):458-464. https://doi.org/10.15585/mmwr.mm6915e3
5. Castagnoli R, Votto M, Licari A, et al. Severe acute respiratory syndrome coronavirus 2 (SARS-CoV-2) infection in children and adolescents: a systematic review. JAMA Pediatr. 2020;174(9):882-889. https://doi.org/10.1001/jamapediatrics.2020.1467
6. Feldstein LR, Rose EB, Horwitz SM, et al; Overcoming COVID-19 Investigators; CDC COVID-19 Response Team. Multisystem inflammatory syndrome in U.S. children and adolescents. N Engl J Med. 2020;383(4):334-346. https://doi.org/10.1056/nejmoa2021680
7. Magro B, Zuccaro V, Novelli L, et al. Predicting in-hospital mortality from coronavirus disease 2019: a simple validated app for clinical use. PLoS One. 2021;16(1):e0245281. https://doi.org/10.1371/journal.pone.0245281
8. Helms J, Kremer S, Merdji H, et al. Neurologic features in severe SARS-CoV-2 infection. N Engl J Med. 2020;382(23):2268-2270. https://doi.org/10.1056/nejmc2008597
9. Severe Covid GWAS Group; Ellinghaus D, Degenhardt F, Bujanda L, et al. Genomewide association study of severe Covid-19 with respiratory failure. N Engl J Med. 2020;383(16):1522-1534.
10. Kabarriti R, Brodin NP, Maron MI, et al. association of race and ethnicity with comorbidities and survival among patients with COVID-19 at an urban medical center in New York. JAMA Netw Open. 2020;3(9):e2019795. https://doi.org/10.1001/jamanetworkopen.2020.19795
11. Bellino S, Punzo O, Rota MC, et al; COVID-19 Working Group. COVID-19 disease severity risk factors for pediatric patients in Italy. Pediatrics. 2020;146(4):e2020009399. https://doi.org/10.1542/peds.2020-009399
12. Ouldali N, Yang DD, Madhi F, et al; investigator group of the PANDOR study. Factors associated with severe SARS-CoV-2 infection. Pediatrics. 2020;147(3):e2020023432. https://doi.org/10.1542/peds.2020-023432
13. Castells MC, Phillips EJ. Maintaining safety with SARS-CoV-2 vaccines. N Engl J Med. 2021;384(7):643-649. https://doi.org/10.1056/nejmra2035343
14. Antoon JW, Williams DJ, Thurm C, et al. The COVID-19 pandemic and changes in healthcare utilization for pediatric respiratory and nonrespiratory illnesses in the United States. J Hosp Med. 2021;16(5):294-297. https://doi.org/10.12788/jhm.3608
15. Blatz AM, David MZ, Otto WR, Luan X, Gerber JS. Validation of International Classification of Disease-10 code for identifying children hospitalized with coronavirus disease-2019. J Pediatric Infect Dis Soc. 2020;10(4):547-548. https://doi.org/10.1093/jpids/piaa140
16. Kadri SS, Gundrum J, Warner S, et al. Uptake and accuracy of the diagnosis code for COVID-19 among US hospitalizations. JAMA. 2020;324(24):2553-2554. https://doi.org/10.1001/jama.2020.20323
17. Kaiser SV, Rodean J, Bekmezian A, et al; Pediatric Research in Inpatient Settings (PRIS) Network. Effectiveness of pediatric asthma pathways for hospitalized children: a multicenter, national analysis. J Pediatr. 2018;197:165-171.e162. https://doi.org/10.1016/j.jpeds.2018.01.084
18. Feudtner C, Feinstein JA, Zhong W, Hall M, Dai D. Pediatric complex chronic conditions classification system version 2: updated for ICD-10 and complex medical technology dependence and transplantation. BMC Pediatr. 2014;14:199. https://doi.org/10.1186/1471-2431-14-199.
19. Williams DJ, Zhu Y, Grijalva CG, et al. Predicting severe pneumonia outcomes in children. Pediatrics. 2016;138(4):e20161019. https://doi.org/10.1542/peds.2016-1019
20. Zachariah P, Johnson CL, Halabi KC, et al. Epidemiology, clinical features, and disease severity in patients with coronavirus disease 2019 (COVID-19) in a children’s hospital in New York City, New York. JAMA Pediatr. 2020;174(10):e202430. https://doi.org/10.1001/jamapediatrics.2020.2430
21. DeBiasi RL, Song X, Delaney M, et al. Severe coronavirus disease-2019 in children and young adults in the Washington, DC, metropolitan region. J Pediatr. 2020;223:199-203.e191. https://doi.org/10.1016/j.jpeds.2020.05.007
22. Lovinsky-Desir S, Deshpande DR, De A, et al. Asthma among hospitalized patients with COVID-19 and related outcomes. J Allergy Clin Immunol. 2020;146(5):1027-1034.e1024. https://doi.org/10.1016/j.jaci.2020.07.026
23. Beken B, Ozturk GK, Aygun FD, Aydogmus C, Akar HH. Asthma and allergic diseases are not risk factors for hospitalization in children with coronavirus disease 2019. Ann Allergy Asthma Immunol. 2021;126(5):569-575. https://doi.org/10.1016/j.anai.2021.01.018
24. Yehia BR, Winegar A, Fogel R, et al. Association of race with mortality among patients hospitalized with coronavirus disease 2019 (COVID-19) at 92 US hospitals. JAMA Netw Open. 2020;3(8):e2018039. https://doi.org/10.1001/jamanetworkopen.2020.18039
25. Saatci D, Ranger TA, Garriga C, et al. Association between race and COVID-19 outcomes among 2.6 million children in England. JAMA Pediatr. 2021;e211685. https://doi.org/10.1001/jamapediatrics.2021.1685
26. Lopez L, 3rd, Hart LH, 3rd, Katz MH. Racial and ethnic health disparities related to COVID-19. JAMA. 2021;325(8):719-720. https://doi.org/10.1001/jama.2020.26443
27. Altunok ES, Alkan M, Kamat S, et al. Clinical characteristics of adult patients hospitalized with laboratory-confirmed COVID-19 pneumonia. J Infect Chemother. 2020. https://doi.org/10.1016/j.jiac.2020.10.020
28. Ali H, Daoud A, Mohamed MM, et al. Survival rate in acute kidney injury superimposed COVID-19 patients: a systematic review and meta-analysis. Ren Fail. 2020;42(1):393-397. https://doi.org/10.1080/0886022x.2020.1756323
29. Anirvan P, Bharali P, Gogoi M, Thuluvath PJ, Singh SP, Satapathy SK. Liver injury in COVID-19: the hepatic aspect of the respiratory syndrome - what we know so far. World J Hepatol. 2020;12(12):1182-1197. https://doi.org/10.4254/wjh.v12.i12.1182
30. Moschonas IC, Tselepis AD. SARS-CoV-2 infection and thrombotic complications: a narrative review. J Thromb Thrombolysis. 2021;52(1):111-123. https://doi.org/10.1007/s11239-020-02374-3
31. Lee MH, Perl DP, Nair G, et al. Microvascular injury in the brains of patients with Covid-19. N Engl J Med. 2020;384(5):481-483. https://doi.org/10.1056/nejmc2033369
32. Antoon JW, Hall M, Herndon A, et al. Prevalence, risk factors, and outcomes of influenza-associated neurological Complications in Children. J Pediatr. 2021;S0022-3476(21)00657-0. https://doi.org/10.1016/j.jpeds.2021.06.075
The COVID-19 pandemic has led to more than 40 million infections and more than 650,000 deaths in the United States alone.1 Morbidity and mortality have disproportionately affected older adults.2-4 However, acute infection and delayed effects, such as multisystem inflammatory syndrome in children (MIS-C), occur and can lead to severe complications, hospitalization, and death in pediatric patients.5,6 Due to higher clinical disease prevalence and morbidity in the adult population, we have learned much about the clinical factors associated with severe adult COVID-19 disease.5,7-9 Such clinical factors include older age, concurrent comorbidities, smoke exposure, and Black race or Hispanic ethnicity, among others.5,7-10 However, there is a paucity of data on severe COVID-19 disease in pediatric patients.5,11,12 In addition, most immunization strategies and pharmacologic treatments for COVID-19 have not been evaluated or approved for use in children.13 To guide targeted prevention and treatment strategies, there is a critical need to identify children and adolescents—who are among the most vulnerable patient populations—at high risk for severe disease.
Identifying the clinical factors associated with severe COVID-19 disease will help with prioritizing and allocating vaccines when they are approved for use in patients younger than 12 years.
METHODS
Study Design
We conducted a multicenter retrospective cohort study of patients presenting for care at pediatric hospitals that report data to the Pediatric Health Information System (PHIS) database. The PHIS administrative database includes billing and utilization data from 45 US tertiary care hospitals affiliated with the Children’s Hospital Association (Lenexa, Kansas). Data quality and reliability are ensured through a joint validation effort between the Children’s Hospital Association and participating hospitals. Hospitals submit discharge data, including demographics, diagnoses, and procedures using International Classification of Diseases, 10th Revision (ICD-10) codes, along with daily detailed information on pharmacy, location of care, and other services.
Study Population
Patients 30 days to 18 years of age discharged from the emergency department (ED) or inpatient setting with a primary diagnosis of COVID-19 (ICD-10 codes U.071 and U.072) between April 1, 2020, and September 30, 2020, were eligible for inclusion.14 In a prior study, the positive predictive value of an ICD-10–coded diagnosis of COVID-19 among hospitalized pediatric patients was 95.5%, compared with reverse transcription polymerase reaction results or presence of MIS-C.15 The diagnostic code for COVID-19 (ICD-10-CM) also had a high sensitivity (98.0%) in the hospitalized population.16 Acknowledging the increasing practice of screening patients upon admission, and in an attempt to minimize potential misclassification, we did not include encounters with secondary diagnoses of COVID-19 in our primary analyses. Pediatric patients with surgical diagnoses and neonates who never left the hospital were also excluded.
Factors Associated With Severe COVID-19 Disease
Exposures of interest were determined a priori based on current evidence in the literature and included patient age (0-4 years, 5-11 years, and 12-18 years), sex, race and ethnicity (non-Hispanic White, non-Hispanic Black, Hispanic, Asian, other non-White race [defined as Pacific Islander, Native American, or other]), payor type, cardiovascular complex chronic conditions (CCC), neuromuscular CCC, obesity/type 2 diabetes mellitus (DM), pulmonary CCC, asthma (defined using ICD-10 codes17), and immunocompromised CCC
Pediatric Complications and Conditions Associated With COVID-19
Based on current evidence and expert opinion of study members, associated diagnoses and complications co-occurring with a COVID-19 diagnosis were defined a priori and identified through ICD-10 codes (Appendix Table 1). These included acute kidney injury, acute liver injury, aseptic meningitis, asthma exacerbation, bronchiolitis, cerebral infarction, croup, encephalitis, encephalopathy, infant fever, febrile seizure, gastroenteritis/dehydration, Kawasaki disease/MIS-C, myocarditis/pericarditis, pneumonia, lung effusion or empyema, respiratory failure, sepsis, nonfebrile seizure, pancreatitis, sickle cell complications, and thrombotic complications.
Outcomes
COVID-19 severity outcomes were assessed as follows: (1) mild = ED discharge; (2) moderate = inpatient admission; (3) severe = intensive care unit (ICU) admission without mechanical ventilation, shock, or death; and (4) very severe = ICU admission with mechanical ventilation, shock, or death.19 This ordinal ranking system did not violate the proportional odds assumption. Potential reasons for admission to the ICU without mechanical ventilation, shock, or death include, but are not limited to, need for noninvasive ventilation, vital sign instability, dysrhythmias, respiratory insufficiency, or complications arising from concurrent conditions (eg, thrombotic events, need for continuous albuterol therapy). We examined several secondary, hospital-based outcomes, including associated diagnoses and complications, all-cause 30-day healthcare reutilization (ED visit or rehospitalization), length of stay (LOS), and ICU LOS.
Statistical Analysis
Demographic characteristics were summarized using frequencies and percentages for categorical variables and geometric means with SD and medians with interquartile ranges (IQR) for continuous variables, as appropriate. Factors associated with hospitalization (encompassing severity levels 2-4) vs ED discharge (severity level 1) were assessed using logistic regression. Factors associated with increasing severity among hospitalized pediatric patients (severity levels 2, 3, and 4) were assessed using ordinal logistic regression. Covariates in these analyses included race and ethnicity, age, sex, payor, cardiovascular CCC, neurologic/neuromuscular CCC, obesity/type 2 DM, pulmonary CCC, asthma, and immunocompromised CCC. Adjusted odds ratios (aOR) and corresponding 95% CI for each risk factor were generated using generalized linear mixed effects models and random intercepts for each hospital. Given the potential for diagnostic misclassification of pediatric patients with COVID-19 based on primary vs secondary diagnoses, we performed sensitivity analyses defining the study population as those with a primary diagnosis of COVID-19 and those with a secondary diagnosis of COVID-19 plus a concurrent primary diagnosis of a condition associated with COVID-19 (Appendix Table 1).
All analyses were performed using SAS version 9.4 (SAS Institute, Inc), and P < .05 was considered statistically significant. The Institutional Review Board at Vanderbilt University Medical Center determined that this study of de-identified data did not meet the criteria for human subjects research.
RESULTS
Study Population
A total of 19,976 encounters were included in the study. Of those, 15,913 (79.7%) were discharged from the ED and 4063 (20.3%) were hospitalized (Table 1). The most common race/ethnicity was Hispanic (9741, 48.8%), followed by non-Hispanic White (4217, 21.1%). Reference race/ethnicity data for the overall 2019 PHIS population can be found in Appendix Table 2.
The severity distribution among the hospitalized population was moderate (3222, 79.3%), severe (431, 11.3%), and very severe (380, 9.4%). The frequency of COVID-19 diagnoses increased late in the study period (Figure). Among those hospitalized, the median LOS for the index admission was 2 days (IQR, 1-4), while among those admitted to the ICU, the median LOS was 3 days (IQR, 2-5).
Overall, 10.1% (n = 2020) of the study population had an all-cause repeat encounter (ie, subsequent ED encounter or hospitalization) within 30 days following the index discharge. Repeat encounters were more frequent among patients hospitalized than among those discharged from the ED (Appendix Table 3).
Prevalence of Conditions and Complications Associated With COVID-19
Overall, 3257 (16.3%) patients had one or more co-occurring diagnoses categorized as a COVID-19–associated condition or complication. The most frequent diagnoses included lower respiratory tract disease (pneumonia, lung effusion, or empyema; n = 1415, 7.1%), gastroenteritis/dehydration (n = 1068, 5.3%), respiratory failure (n = 731, 3.7%), febrile infant (n = 413, 2.1%), and nonfebrile seizure (n = 425, 2.1%). Aside from nonfebrile seizure, neurological complications were less frequent and included febrile seizure (n = 155, 0.8%), encephalopathy (n = 63, 0.3%), aseptic meningitis (n = 16, 0.1%), encephalitis (n = 11, 0.1%), and cerebral infarction (n = 6, <0.1%). Kawasaki disease and MIS-C comprised 1.7% (n = 346) of diagnoses. Thrombotic complications occurred in 0.1% (n = 13) of patients. Overall, these conditions and complications associated with COVID-19 were more frequent in hospitalized patients than in those discharged from the ED (P < .001) (Table 2).
Factors Associated With COVID-19 Disease Severity
Compared to pediatric patients with COVID-19 discharged from the ED, factors associated with increased odds of hospitalization included private payor insurance; obesity/type 2 DM; asthma; and cardiovascular, immunocompromised, neurologic/neuromuscular, and pulmonary CCCs (Table 3). Factors associated with decreased risk of hospitalization included Black race or Hispanic ethnicity compared with White race; female sex; and age 5 to 11 years and age 12 to 17 years (vs age 0-4 years). Among children and adolescents hospitalized with COVID-19, factors associated with greater disease severity included Black or other non-White race; age 5 to 11 years; age 12 to 17 years; obesity/type 2 DM; immunocompromised conditions; and cardiovascular, neurologic/neuromuscular, and pulmonary CCCs (Table 3).
Sensitivity Analysis
We performed a sensitivity analysis that expanded the study population to include those with a secondary diagnosis of COVID-19 plus a diagnosis of a COVID-19–associated condition or complication. Analyses using the expanded population (N = 21,247) were similar to the primary analyses (Appendix Table 4 and Appendix Table 5).
DISCUSSION
In this large multicenter study evaluating COVID-19 disease severity in more than 19,000 patients presenting for emergency care at US pediatric hospitals, approximately 20% were hospitalized, and among those hospitalized almost a quarter required ICU care. Clinical risk factors associated with increased risk of hospitalization include private payor status and selected comorbidities (obesity/type 2 DM; asthma; and cardiovascular, pulmonary, immunocompromised, neurologic/neuromuscular CCCs), while those associated with decreased risk of hospitalization include older age, female sex, and Black race or Hispanic ethnicity. Factors associated with severe disease among hospitalized pediatric patients include Black or other non-White race, school age (≥5 years), and certain chronic conditions (cardiovascular disease, obesity/type 2 DM, neurologic or neuromuscular disease). Sixteen percent of patients had a concurrent diagnosis for a condition or complication associated with COVID-19.
While the study population (ie, children and adolescents presenting to the ED) represents a small fraction of children and adolescents in the community with SARS-CoV-2 infection, the results provide important insight into factors of severe COVID-19 in the pediatric population. A report from France suggested ventilatory or hemodynamic support or death were independently associated with older age (≥10 years), elevated C-reactive protein, and hypoxemia.12 An Italian study found that younger age (0-4 years) was associated with less severe disease, while preexisting conditions were more likely in patients with severe disease.11 A single-center case series of 50 patients (aged ≤21 years) hospitalized at a children’s hospital in New York City found respiratory failure (n = 9) was more common in children older than 1 year, patients with elevated inflammatory markers, and patients with obesity.20
Our study confirms several factors for severe COVID-19 found in these studies, including older age,11,12,20 obesity,20 and preexisting conditions.11 Our findings also expand on these reports, including identification of factors associated with hospitalization. Given the rate of 30-day re-encounters among pediatric patients with COVID-19 (10.1%), identifying risk factors for hospitalization may aid ED providers in determining optimal disposition (eg, home, hospital admission, ICU). We also identified specific comorbidities associated with more severe disease in those hospitalized with COVID-19, such as cardiovascular disease, obesity/type 2 DM, and pulmonary, neurologic, or neuromuscular conditions. We also found that asthma increased the risk for hospitalization but not more severe disease among those hospitalized. This latter finding also aligns with recent single-center studies,21,22 whereas a Turkish study of pediatric patients aged 0 to 18 years found no association between asthma and COVID-19 hospitalizations.23We also examined payor type and racial/ethnic factors in our analysis. In 2019, patients who identified as Black or Hispanic comprised 52.3% of all encounters and 40.7% of hospitalizations recorded in the PHIS database. During the same year, encounters for influenza among Black or Hispanic pediatric patients comprised 58.7% of all influenza diagnoses and 47.0% of pediatric influenza hospitalizations (Appendix Table 2). In this study, patients who identified as Black or Hispanic race represented a disproportionately large share of patients presenting to children’s hospitals (68.5%) and of those hospitalized (60.8%). Hispanic ethnicity, in particular, represented a disproportionate share of patients seeking care for COVID-19 compared to the overall PHIS population (47.7% and 27.1%, respectively). After accounting for other factors, we found Black and other non-White race—but not of Hispanic ethnicity—were independently associated with more disease severity among those hospitalized. This contrasts with findings from a recent adult study by Yehia et al,24 who found (after adjusting for other clinical factors) no significant difference in mortality between Black patients and White patients among adults hospitalized due to COVID-19. It also contrasts with a recent large population-based UK study wherein pediatric patients identifying as Asian, but not Black or mixed race or ethnicity, had an increased risk of hospital admission and admission to the ICU compared to children identifying as White. Children identifying as Black or mixed race had longer hospital admissions.25 However, as the authors of the study note, residual confounders and ascertainment bias due to differences in COVID testing may have influenced these findings.
Our findings of differences in hospitalization and disease severity among those hospitalized by race and ethnicity should be interpreted carefully. These may reflect a constellation of factors that are difficult to measure, including differences in healthcare access, inequalities in care (including hospital admission inequalities), and implicit bias—all of which may reflect structural racism. For example, it is possible that children who identify as Black or Hispanic have different access to care compared to children who identify as White, and this may affect disease severity on presentation.2 Alternatively, it is possible that White pediatric patients are more likely to be hospitalized as compared to non-White pediatric patients with similar illness severity. Our finding that pediatric patients who identify as Hispanic or Black had a lower risk of hospitalization should be also interpreted carefully, as this may reflect higher utilization of the ED for SARS-CoV-2 testing, increased use of nonemergency services among those without access to primary care, or systematic differences in provider decision-making among this segment of the population.2 Further study is needed to determine specific drivers for racial and ethnic differences in healthcare utilization in children and adolescents with COVID-19.26
Complications and co-occurring diagnoses in adults with COVID-19 are well documented.27-30 However, there is little information to date on the co-occurring diagnoses and complications associated with COVID-19 in children and adolescents. We found that complications and co-occurring conditions occurred in 16.3% of the study population, with the most frequent conditions including known complications of viral infections such as pneumonia, respiratory failure, and seizures. Acute kidney and liver injury, as well as thrombotic complications, occurred less commonly than in adults.26-29 Interestingly, neurologic complications were also uncommon compared to adult reports8,31 and less frequent than in other viral illnesses in children and adolescents. For example, neurologic complications occur in approximately 7.5% of children and adolescents hospitalized with influenza.32
Limitations of the present study include the retrospective design, as well as incomplete patient-level clinical data in the PHIS database. The PHIS database only includes children’s hospitals, which may limit the generalizability of findings to community hospitals. We also excluded newborns, and our findings may not be generalizable to this population. We only included children and adolescents with a primary diagnosis of COVID-19, which has the potential for misclassification in cases where COVID-19 was a secondary diagnosis. However, results of our sensitivity analysis, which incorporated secondary diagnoses of COVID-19, were consistent with findings from our main analyses. Our study was designed to examine associations between certain prespecified factors and COVID-19 severity among pediatric patients who visited the ED or were admitted to the hospital during the COVID-19 pandemic. Thus, our findings must be interpreted in light of these considerations and may not be generalizable outside the ED or hospital setting. For example, it could be that some segments of the population utilized ED resources for testing, whereas others avoided the ED and other healthcare settings for fear of exposure to SARS-CoV-2. We also relied on diagnosis codes to identify concurrent diagnoses, as well as mechanical ventilation in our very severe outcome cohort, which resulted in this classification for some of these diagnoses. Despite these limitations, our findings represent an important step in understanding the risk factors associated with severe clinical COVID-19 disease in pediatric patients.
Our findings may inform future research and clinical interventions. Future studies on antiviral therapies and immune modulators targeting SARS-CoV-2 infection in children and adolescents should focus on high-risk populations, such as those identified in the study, as these patients are most likely to benefit from therapeutic interventions. Similarly, vaccine-development efforts may benefit from additional evaluation in high-risk populations, some of which may have altered immune responses. Furthermore, with increasing vaccination among adults and changes in recommendations, societal mitigation efforts (eg, masking, physical distancing) will diminish. Continued vigilance and COVID-19–mitigation efforts among high-risk children, for whom vaccines are not yet available, are critical during this transition.
CONCLUSION
Among children with COVID-19 who received care at children’s hospitals and EDs, 20% were hospitalized, and, of those, 21% were admitted to the ICU. Older children and adolescent patients had a lower risk of hospitalization; however, when hospitalized, they had greater illness severity. Those with selected comorbidities (eg, cardiovascular, obesity/type 2 DM, pulmonary and neurologic or neuromuscular disease) had both increased odds of hospitalization and in-hospital illness severity. While there were observed differences in COVID-19 severity by race and ethnicity, additional research is needed to clarify the drivers of such disparities. These factors should be considered when prioritizing mitigation strategies to prevent infection (eg, remote learning, avoidance of group activities, prioritization of COVID-19 vaccine when approved for children aged <12 years).
1. Centers for Disease Control and Prevention. COVID data tracker. Accessed September 9, 2021. https://covid.cdc.gov/covid-data-tracker/#datatracker-home
2. Levy C, Basmaci R, Bensaid P, et al. Changes in reverse transcription polymerase chain reaction-positive severe acute respiratory syndrome coronavirus 2 rates in adults and children according to the epidemic stages. Pediatr Infect Dis J. 2020;39(11):e369-e372. https://doi.org/10.1097/inf.0000000000002861
3. Gudbjartsson DF, Helgason A, Jonsson H, et al. Spread of SARS-CoV-2 in the Icelandic population. N Engl J Med. 2020;382(24):2302-2315. https://doi.org/10.1056/nejmoa2006100
4. Garg S, Kim L, Whitaker M, et al. Hospitalization rates and characteristics of patients hospitalized with laboratory-confirmed coronavirus disease 2019 - COVID-NET, 14 States, March 1-30, 2020. MMWR Morb Mortal Wkly Rep. 2020;69(15):458-464. https://doi.org/10.15585/mmwr.mm6915e3
5. Castagnoli R, Votto M, Licari A, et al. Severe acute respiratory syndrome coronavirus 2 (SARS-CoV-2) infection in children and adolescents: a systematic review. JAMA Pediatr. 2020;174(9):882-889. https://doi.org/10.1001/jamapediatrics.2020.1467
6. Feldstein LR, Rose EB, Horwitz SM, et al; Overcoming COVID-19 Investigators; CDC COVID-19 Response Team. Multisystem inflammatory syndrome in U.S. children and adolescents. N Engl J Med. 2020;383(4):334-346. https://doi.org/10.1056/nejmoa2021680
7. Magro B, Zuccaro V, Novelli L, et al. Predicting in-hospital mortality from coronavirus disease 2019: a simple validated app for clinical use. PLoS One. 2021;16(1):e0245281. https://doi.org/10.1371/journal.pone.0245281
8. Helms J, Kremer S, Merdji H, et al. Neurologic features in severe SARS-CoV-2 infection. N Engl J Med. 2020;382(23):2268-2270. https://doi.org/10.1056/nejmc2008597
9. Severe Covid GWAS Group; Ellinghaus D, Degenhardt F, Bujanda L, et al. Genomewide association study of severe Covid-19 with respiratory failure. N Engl J Med. 2020;383(16):1522-1534.
10. Kabarriti R, Brodin NP, Maron MI, et al. association of race and ethnicity with comorbidities and survival among patients with COVID-19 at an urban medical center in New York. JAMA Netw Open. 2020;3(9):e2019795. https://doi.org/10.1001/jamanetworkopen.2020.19795
11. Bellino S, Punzo O, Rota MC, et al; COVID-19 Working Group. COVID-19 disease severity risk factors for pediatric patients in Italy. Pediatrics. 2020;146(4):e2020009399. https://doi.org/10.1542/peds.2020-009399
12. Ouldali N, Yang DD, Madhi F, et al; investigator group of the PANDOR study. Factors associated with severe SARS-CoV-2 infection. Pediatrics. 2020;147(3):e2020023432. https://doi.org/10.1542/peds.2020-023432
13. Castells MC, Phillips EJ. Maintaining safety with SARS-CoV-2 vaccines. N Engl J Med. 2021;384(7):643-649. https://doi.org/10.1056/nejmra2035343
14. Antoon JW, Williams DJ, Thurm C, et al. The COVID-19 pandemic and changes in healthcare utilization for pediatric respiratory and nonrespiratory illnesses in the United States. J Hosp Med. 2021;16(5):294-297. https://doi.org/10.12788/jhm.3608
15. Blatz AM, David MZ, Otto WR, Luan X, Gerber JS. Validation of International Classification of Disease-10 code for identifying children hospitalized with coronavirus disease-2019. J Pediatric Infect Dis Soc. 2020;10(4):547-548. https://doi.org/10.1093/jpids/piaa140
16. Kadri SS, Gundrum J, Warner S, et al. Uptake and accuracy of the diagnosis code for COVID-19 among US hospitalizations. JAMA. 2020;324(24):2553-2554. https://doi.org/10.1001/jama.2020.20323
17. Kaiser SV, Rodean J, Bekmezian A, et al; Pediatric Research in Inpatient Settings (PRIS) Network. Effectiveness of pediatric asthma pathways for hospitalized children: a multicenter, national analysis. J Pediatr. 2018;197:165-171.e162. https://doi.org/10.1016/j.jpeds.2018.01.084
18. Feudtner C, Feinstein JA, Zhong W, Hall M, Dai D. Pediatric complex chronic conditions classification system version 2: updated for ICD-10 and complex medical technology dependence and transplantation. BMC Pediatr. 2014;14:199. https://doi.org/10.1186/1471-2431-14-199.
19. Williams DJ, Zhu Y, Grijalva CG, et al. Predicting severe pneumonia outcomes in children. Pediatrics. 2016;138(4):e20161019. https://doi.org/10.1542/peds.2016-1019
20. Zachariah P, Johnson CL, Halabi KC, et al. Epidemiology, clinical features, and disease severity in patients with coronavirus disease 2019 (COVID-19) in a children’s hospital in New York City, New York. JAMA Pediatr. 2020;174(10):e202430. https://doi.org/10.1001/jamapediatrics.2020.2430
21. DeBiasi RL, Song X, Delaney M, et al. Severe coronavirus disease-2019 in children and young adults in the Washington, DC, metropolitan region. J Pediatr. 2020;223:199-203.e191. https://doi.org/10.1016/j.jpeds.2020.05.007
22. Lovinsky-Desir S, Deshpande DR, De A, et al. Asthma among hospitalized patients with COVID-19 and related outcomes. J Allergy Clin Immunol. 2020;146(5):1027-1034.e1024. https://doi.org/10.1016/j.jaci.2020.07.026
23. Beken B, Ozturk GK, Aygun FD, Aydogmus C, Akar HH. Asthma and allergic diseases are not risk factors for hospitalization in children with coronavirus disease 2019. Ann Allergy Asthma Immunol. 2021;126(5):569-575. https://doi.org/10.1016/j.anai.2021.01.018
24. Yehia BR, Winegar A, Fogel R, et al. Association of race with mortality among patients hospitalized with coronavirus disease 2019 (COVID-19) at 92 US hospitals. JAMA Netw Open. 2020;3(8):e2018039. https://doi.org/10.1001/jamanetworkopen.2020.18039
25. Saatci D, Ranger TA, Garriga C, et al. Association between race and COVID-19 outcomes among 2.6 million children in England. JAMA Pediatr. 2021;e211685. https://doi.org/10.1001/jamapediatrics.2021.1685
26. Lopez L, 3rd, Hart LH, 3rd, Katz MH. Racial and ethnic health disparities related to COVID-19. JAMA. 2021;325(8):719-720. https://doi.org/10.1001/jama.2020.26443
27. Altunok ES, Alkan M, Kamat S, et al. Clinical characteristics of adult patients hospitalized with laboratory-confirmed COVID-19 pneumonia. J Infect Chemother. 2020. https://doi.org/10.1016/j.jiac.2020.10.020
28. Ali H, Daoud A, Mohamed MM, et al. Survival rate in acute kidney injury superimposed COVID-19 patients: a systematic review and meta-analysis. Ren Fail. 2020;42(1):393-397. https://doi.org/10.1080/0886022x.2020.1756323
29. Anirvan P, Bharali P, Gogoi M, Thuluvath PJ, Singh SP, Satapathy SK. Liver injury in COVID-19: the hepatic aspect of the respiratory syndrome - what we know so far. World J Hepatol. 2020;12(12):1182-1197. https://doi.org/10.4254/wjh.v12.i12.1182
30. Moschonas IC, Tselepis AD. SARS-CoV-2 infection and thrombotic complications: a narrative review. J Thromb Thrombolysis. 2021;52(1):111-123. https://doi.org/10.1007/s11239-020-02374-3
31. Lee MH, Perl DP, Nair G, et al. Microvascular injury in the brains of patients with Covid-19. N Engl J Med. 2020;384(5):481-483. https://doi.org/10.1056/nejmc2033369
32. Antoon JW, Hall M, Herndon A, et al. Prevalence, risk factors, and outcomes of influenza-associated neurological Complications in Children. J Pediatr. 2021;S0022-3476(21)00657-0. https://doi.org/10.1016/j.jpeds.2021.06.075
© 2021 Society of Hospital Medicine
Virtual Respiratory Urgent Clinics for COVID-19 Symptoms
Virtual care (VC) has emerged as an effective mode of health care delivery especially in settings where significant barriers to traditional in-person visits exist; a large systematic review supports feasibility of telemedicine in primary care and suggests that telemedicine is at least as effective as traditional care.1 Nevertheless, broad adoption of VC into practice has lagged, impeded by government and private insurance reimbursement requirements as well as the persistent belief that care can best be delivered in person.2-4 Before the COVID-19 pandemic, states that enacted parity legislation that required private insurance companies to provide reimbursement coverage for telehealth services saw a significant increase in the number of outpatient telehealth visits (about ≥ 30% odds compared with nonparity states).3
With the onset of the COVID-19 pandemic, in-person medical appointments were converted to VC visits to reduce increased exposure risks to patients and health care workers.5 Prior government and private sector policies were suspended, and payment restrictions lifted, enabling adoption of VC modalities to rapidly accommodate the emergent need and Centers for Disease Control and Prevention (CDC) recommendations for virtual care.6-11
The CDC guidelines on managing operations during the COVID-19 pandemic highlighted the need to provide care in the safest way for patients and health care personnel and emphasized the importance of optimizing telehealth services. The federal government facilitated telehealth during the COVID-19 pandemic via temporary measures under the COVID-19 public health emergency declaration. This included Health Insurance Portability and Accountability Act flexibility to use everyday technology for VC visits, regulatory changes to deliver services to Medicare and Medicaid patients, permission of telehealth services across state lines, and prescribing of controlled substances via telehealth without an in-person medical evaluation.7
In response, health care providers (HCPs) and health care organizations created or expanded on existing telehealth infrastructure, developing virtual urgent care centers and telephone-based programs to evaluate patients remotely via screening questions that triaged them to a correct level of response, with possible subsequent virtual physician evaluation if indicated.12,13
The Veterans Health Administration (VHA) also shifted to a VC model in response to COVID-19 guided by a unique perspective from a well-developed prior VC experience.14-16 As a federally funded system, the VHA depends on workload documentation for budgeting. Since 2015, the VHA has provided workload credit and incentivized HCPs (via pay for performance) for the use of VC, including telephone visits, video visits, and secure messaging. These incentives resulted in higher rates of telehealth utilization before the COVID-19 pandemic compared with the private sector (with 4.2% and 0.7% of visits within the VHA being telephone and video visits, respectively, compared with telehealth utilization rates of 1.0% for Medicare recipients and 1.1% in an all-payer database).16
Historically, VHA care has successfully transitioned from in-person care models to exclusively virtual modalities to prevent suspension of medical services during natural disasters. Studies performed during these periods, specifically during the 2017 hurricane season (during which multiple VHA hospitals were closed or had limited in-person service available), supported telehealth as an efficient health care delivery method, and even recommended expanding telehealth services within non-VHA environments to accommodate needs of the general public during crises and postdisaster health care delivery.17
Armed with both a well-established telehealth infrastructure and prior knowledge gained from successful systemwide implementation of virtual care during times of disaster, US Department of Veterans Affairs (VA) Connecticut Healthcare System (VACHS) primary care quickly transitioned to a VC model in response to COVID-19.16 Early in the pandemic, a rapid transition to virtual care (RTVC) model was developed, including implementation of virtual respiratory urgent clinics (VRUCs), defined as virtual respiratory symptom triage clinics, staffed by primary care providers (PCPs) aimed at minimizing patient and health care worker exposure risk.
Methods
VACHS consists of 8 primary care sites, including a major tertiary care center, a smaller medical center with full ambulatory services, and 6 community-based outpatient clinics with only primary care and mental health. There are 80 individual PCPs delivering care to 58,058 veterans. VRUCs were established during the COVID-19 pandemic to cover patients across the entire health care system, using a rotational schedule of VA PCPs.
COVID-19 Urgent Clinics Program
Within the first few weeks of the pandemic, VACHS primary care established VRUCS to provide expeditious virtual assessment of respiratory or flu-like symptoms. Using the established telehealth system, the intervention aimed to provide emergent screening, testing, and care to those with potential COVID-19 infections. The model also was designed to minimize exposures to the health care workforce and patients.
Retrospective analysis was performed using information obtained from the electronic health record (EHR) database to describe the characteristics of patients who received care through the VRUCs, such as demographics, era of military service, COVID-19 testing rates and results, as well as subsequent emergency department (ED) visits and hospital admissions. A secondary aim included collection of additional qualitative data via a random sample chart review.
Virtual clinics were established January 22, 2020, and data were analyzed over the next 3 months. Data were retrieved and analyzed from the EHR, and codes were used to categorize the VRUCs.
Results
A total of 445 unique patients used these clinics during this period. Unique patients were defined as individual patients (some may have used a clinic more than once but were counted only once). Of this group, 82% were male, and 48% served in the Gulf War era (1990 to present). A total of 51% of patients received a COVID-19 test (clinics began before wide testing availability), and 10% tested positive. Of all patients using the clinics, approximately 5% were admitted to the hospital, and 18% had at least 1 subsequent ED visit (Table).
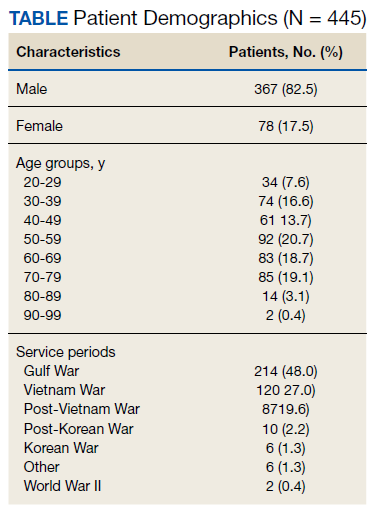
A secondary aim included review of a random sample of 99 patient charts to gain additional information regarding whether the patient was given appropriate isolation precautions, was in a high-exposure occupation (eg, could expose a large number of people), and whether there was appropriate documentation of goals of care, health care proxy or referral to social work to discuss advance directives. In addition, we calculated the average length of time between patients’ initial contact with the health care system call center and the return call by the PCP (wait time).Of charts reviewed, the majority (71%) had documentation of appropriate isolation precautions. Although 25% of patients had documentation of a high-risk profession with potential to expose many people, more than half of the patients had no documentation of occupation. Most patients (86%) had no updated documentation regarding goals of care, health care proxy, or advance directives in their urgent care VC visit. The average time between the patient initiating contact with the health care system call center and a return call to the patient from a PCP was 104 minutes (excluding calls received after 3:30
Discussion
This analysis adds to the growing literature on use of VC during the COVID-19 pandemic. Specifically, we describe the population of patients who used VRUCs within a large health care system in a RTVC. This analysis was limited by lack of available testing during the initial phase of the pandemic, which contributed to the lower than expected rates of testing and test positivity in patients managed via VRUCs. In addition, chart review data are limited as the data includes only what was documented during the visit and not the entire discussion during the encounter.
Several important outcomes from this analysis can be applied to interventions in the future, which may have large public health implications: Several hundred patients who reported respiratory symptoms were expeditiously evaluated by a PCP using VC. The average wait time to full clinical assessment was about 1.5 hours. This short duration between contact and evaluation permitted early education about isolation precautions, which may have minimized spread. In addition, this innovation kept patients out of the medical center, eliminating chains of transmission to other vulnerable patients and health care workers.
Our retrospective chart review also revealed that more than half the patients were not queried about their occupation, but of those that were asked, a significant number were in high-risk professions potentially exposing large numbers of people. This would be an important aspect to add to future templated notes to minimize work-related exposures. Also, we identified that few HCPs discussed goals of care with patients. Given the nature of COVID-19 and potential for rapid decompensation especially in vulnerable patients, this also would be important to include in the future.
Conclusions
VC urgent care clinics to address possible COVID-19 symptoms facilitated expeditious PCP assessment while keeping potentially contagious patients outside of high-risk health care environments. Streamlining and optimizing clinical VC assessments will be imperative to future management of COVID-19 and potentially to other future infectious pandemics. This includes development of templated notes incorporating counseling regarding appropriate isolation, questions about high-contact occupations, and goals of care discussions.
Acknowledgment
The authors thank Robert F. Walsh, MHA.
1. Bashshur RL, Howell JD, Krupinski EA, Harms KM, Bashshur N, Doarn CR. The empirical foundations of telemedicine interventions in primary care. Telemed J E Health. 2016;22(5):342-375. doi:10.1089/tmj.2016.0045
2. Centers for Disease Control and Prevention. Using telehealth to expand access to essential health services during the COVID-19 pandemic. Updated June 10, 2020. Accessed August 20, 2021. https://www.cdc.gov/coronavirus/2019-ncov/hcp/telehealth.html
3. Harvey JB, Valenta S, Simpson K, Lyles M, McElligott J. Utilization of outpatient telehealth services in parity and nonparity states 2010-2015. Telemed J E Health. 2019;25(2):132-136. doi:10.1089/tmj.2017.0265
4. Dorsey ER, Topol EJ. State of telehealth. N Engl J Med. 2016;375(2):154-161. doi:10.1056/NEJMra1601705
5. Rockwell KL, Gilroy AS. Incorporating telemedicine as part of COVID-19 outbreak response systems. Am J Manag Care. 2020;26(4):147-148. doi:10.37765/ajmc.2020.42784
6. Centers for Disease Control and Prevention. Healthcare facility guidance. Updated April 17, 2021. Accessed August 20, 2021. https://www.cdc.gov/coronavirus/2019-ncov/hcp/clinical-care.html
7. US Department of Health and Human Services, Health Resources and Services Administration. Policy changes during COVID-19. Accessed August 20, 2021. https://telehealth.hhs.gov/providers/policy-changes-during-the-covid-19-public-health-emergency
8. Coronavirus Preparedness and Response Supplemental Appropriation Act of 2020. 134 Stat. 146. Published February 2, 2021. Accessed August 20, 2021. https://www.govinfo.gov/content/pkg/CREC-2021-02-02/html/CREC-2021-02-02-pt1-PgS226.htm
9. US Department of Health and Human Services. Notification of enforcement discretion for telehealth remote communications during the COVID-19 nationwide public health emergency. Updated January 20, 2021. Accessed August 20, 2021. https://www.hhs.gov/hipaa/for-professionals/special-topics/emergency-preparedness/notification-enforcement-discretion-telehealth/index.html
10. Centers for Medicare and Medicaid Services. Coverage and payment related to COVID-19 Medicare. 2020. Published March 23, 2020. Accessed August 20, 2021. https://www.cms.gov/files/document/03052020-medicare-covid-19-fact-sheet.pdf
11. American Telemedicine Association. ATA commends 2020 Congress for giving HHS authority to waive restrictions on telehealth for Medicare beneficiaries in response to the COVID-19 outbreak [press release]. Published March 5, 2020. Accessed August 20, 2021. https://www.americantelemed.org/press-releases/ata-commends-congress-for-waiving-restrictions-on-telehealth-for-medicare-beneficiaries-in-response-to-the-covid-19-outbreak
12. Hollander JE, Carr BG. Virtually perfect? Telemedicine for Covid-19. N Engl J Med. 2020;382(18):1679-1681. doi:10.1056/NEJMp2003539
13. Khairat S, Meng C, Xu Y, Edson B, Gianforcaro R. Interpreting COVID-19 and Virtual Care Trends: Cohort Study. JMIR Public Health Surveill. 2020;6(2):e18811. Published 2020 Apr 15. doi:10.2196/18811
14. Ferguson JM, Jacobs J, Yefimova M, Greene L, Heyworth L, Zulman DM. Virtual care expansion in the Veterans Health Administration during the COVID-19 pandemic: clinical services and patient characteristics associated with utilization. J Am Med Inform Assoc. 2021;28(3):453-462. doi:10.1093/jamia/ocaa284
15. Baum A, Kaboli PJ, Schwartz MD. Reduced in-person and increased telehealth outpatient visits during the COVID-19 Pandemic. Ann Intern Med. 2021;174(1):129-131. doi:10.7326/M20-3026
16. Spelman JF, Brienza R, Walsh RF, et al. A model for rapid transition to virtual care, VA Connecticut primary care response to COVID-19. J Gen Intern Med. 2020;35(10):3073-3076. doi:10.1007/s11606-020-06041-4
17. Der-Martirosian C, Chu K, Dobalian A. Use of telehealth to improve access to care at the United States Department of Veterans Affairs during the 2017 Atlantic hurricane season [published online ahead of print, 2020 Apr 13]. Disaster Med Public Health Prep. 2020;1-5. doi:10.1017/dmp.2020.88
Virtual care (VC) has emerged as an effective mode of health care delivery especially in settings where significant barriers to traditional in-person visits exist; a large systematic review supports feasibility of telemedicine in primary care and suggests that telemedicine is at least as effective as traditional care.1 Nevertheless, broad adoption of VC into practice has lagged, impeded by government and private insurance reimbursement requirements as well as the persistent belief that care can best be delivered in person.2-4 Before the COVID-19 pandemic, states that enacted parity legislation that required private insurance companies to provide reimbursement coverage for telehealth services saw a significant increase in the number of outpatient telehealth visits (about ≥ 30% odds compared with nonparity states).3
With the onset of the COVID-19 pandemic, in-person medical appointments were converted to VC visits to reduce increased exposure risks to patients and health care workers.5 Prior government and private sector policies were suspended, and payment restrictions lifted, enabling adoption of VC modalities to rapidly accommodate the emergent need and Centers for Disease Control and Prevention (CDC) recommendations for virtual care.6-11
The CDC guidelines on managing operations during the COVID-19 pandemic highlighted the need to provide care in the safest way for patients and health care personnel and emphasized the importance of optimizing telehealth services. The federal government facilitated telehealth during the COVID-19 pandemic via temporary measures under the COVID-19 public health emergency declaration. This included Health Insurance Portability and Accountability Act flexibility to use everyday technology for VC visits, regulatory changes to deliver services to Medicare and Medicaid patients, permission of telehealth services across state lines, and prescribing of controlled substances via telehealth without an in-person medical evaluation.7
In response, health care providers (HCPs) and health care organizations created or expanded on existing telehealth infrastructure, developing virtual urgent care centers and telephone-based programs to evaluate patients remotely via screening questions that triaged them to a correct level of response, with possible subsequent virtual physician evaluation if indicated.12,13
The Veterans Health Administration (VHA) also shifted to a VC model in response to COVID-19 guided by a unique perspective from a well-developed prior VC experience.14-16 As a federally funded system, the VHA depends on workload documentation for budgeting. Since 2015, the VHA has provided workload credit and incentivized HCPs (via pay for performance) for the use of VC, including telephone visits, video visits, and secure messaging. These incentives resulted in higher rates of telehealth utilization before the COVID-19 pandemic compared with the private sector (with 4.2% and 0.7% of visits within the VHA being telephone and video visits, respectively, compared with telehealth utilization rates of 1.0% for Medicare recipients and 1.1% in an all-payer database).16
Historically, VHA care has successfully transitioned from in-person care models to exclusively virtual modalities to prevent suspension of medical services during natural disasters. Studies performed during these periods, specifically during the 2017 hurricane season (during which multiple VHA hospitals were closed or had limited in-person service available), supported telehealth as an efficient health care delivery method, and even recommended expanding telehealth services within non-VHA environments to accommodate needs of the general public during crises and postdisaster health care delivery.17
Armed with both a well-established telehealth infrastructure and prior knowledge gained from successful systemwide implementation of virtual care during times of disaster, US Department of Veterans Affairs (VA) Connecticut Healthcare System (VACHS) primary care quickly transitioned to a VC model in response to COVID-19.16 Early in the pandemic, a rapid transition to virtual care (RTVC) model was developed, including implementation of virtual respiratory urgent clinics (VRUCs), defined as virtual respiratory symptom triage clinics, staffed by primary care providers (PCPs) aimed at minimizing patient and health care worker exposure risk.
Methods
VACHS consists of 8 primary care sites, including a major tertiary care center, a smaller medical center with full ambulatory services, and 6 community-based outpatient clinics with only primary care and mental health. There are 80 individual PCPs delivering care to 58,058 veterans. VRUCs were established during the COVID-19 pandemic to cover patients across the entire health care system, using a rotational schedule of VA PCPs.
COVID-19 Urgent Clinics Program
Within the first few weeks of the pandemic, VACHS primary care established VRUCS to provide expeditious virtual assessment of respiratory or flu-like symptoms. Using the established telehealth system, the intervention aimed to provide emergent screening, testing, and care to those with potential COVID-19 infections. The model also was designed to minimize exposures to the health care workforce and patients.
Retrospective analysis was performed using information obtained from the electronic health record (EHR) database to describe the characteristics of patients who received care through the VRUCs, such as demographics, era of military service, COVID-19 testing rates and results, as well as subsequent emergency department (ED) visits and hospital admissions. A secondary aim included collection of additional qualitative data via a random sample chart review.
Virtual clinics were established January 22, 2020, and data were analyzed over the next 3 months. Data were retrieved and analyzed from the EHR, and codes were used to categorize the VRUCs.
Results
A total of 445 unique patients used these clinics during this period. Unique patients were defined as individual patients (some may have used a clinic more than once but were counted only once). Of this group, 82% were male, and 48% served in the Gulf War era (1990 to present). A total of 51% of patients received a COVID-19 test (clinics began before wide testing availability), and 10% tested positive. Of all patients using the clinics, approximately 5% were admitted to the hospital, and 18% had at least 1 subsequent ED visit (Table).
A secondary aim included review of a random sample of 99 patient charts to gain additional information regarding whether the patient was given appropriate isolation precautions, was in a high-exposure occupation (eg, could expose a large number of people), and whether there was appropriate documentation of goals of care, health care proxy or referral to social work to discuss advance directives. In addition, we calculated the average length of time between patients’ initial contact with the health care system call center and the return call by the PCP (wait time).Of charts reviewed, the majority (71%) had documentation of appropriate isolation precautions. Although 25% of patients had documentation of a high-risk profession with potential to expose many people, more than half of the patients had no documentation of occupation. Most patients (86%) had no updated documentation regarding goals of care, health care proxy, or advance directives in their urgent care VC visit. The average time between the patient initiating contact with the health care system call center and a return call to the patient from a PCP was 104 minutes (excluding calls received after 3:30
Discussion
This analysis adds to the growing literature on use of VC during the COVID-19 pandemic. Specifically, we describe the population of patients who used VRUCs within a large health care system in a RTVC. This analysis was limited by lack of available testing during the initial phase of the pandemic, which contributed to the lower than expected rates of testing and test positivity in patients managed via VRUCs. In addition, chart review data are limited as the data includes only what was documented during the visit and not the entire discussion during the encounter.
Several important outcomes from this analysis can be applied to interventions in the future, which may have large public health implications: Several hundred patients who reported respiratory symptoms were expeditiously evaluated by a PCP using VC. The average wait time to full clinical assessment was about 1.5 hours. This short duration between contact and evaluation permitted early education about isolation precautions, which may have minimized spread. In addition, this innovation kept patients out of the medical center, eliminating chains of transmission to other vulnerable patients and health care workers.
Our retrospective chart review also revealed that more than half the patients were not queried about their occupation, but of those that were asked, a significant number were in high-risk professions potentially exposing large numbers of people. This would be an important aspect to add to future templated notes to minimize work-related exposures. Also, we identified that few HCPs discussed goals of care with patients. Given the nature of COVID-19 and potential for rapid decompensation especially in vulnerable patients, this also would be important to include in the future.
Conclusions
VC urgent care clinics to address possible COVID-19 symptoms facilitated expeditious PCP assessment while keeping potentially contagious patients outside of high-risk health care environments. Streamlining and optimizing clinical VC assessments will be imperative to future management of COVID-19 and potentially to other future infectious pandemics. This includes development of templated notes incorporating counseling regarding appropriate isolation, questions about high-contact occupations, and goals of care discussions.
Acknowledgment
The authors thank Robert F. Walsh, MHA.
1. Bashshur RL, Howell JD, Krupinski EA, Harms KM, Bashshur N, Doarn CR. The empirical foundations of telemedicine interventions in primary care. Telemed J E Health. 2016;22(5):342-375. doi:10.1089/tmj.2016.0045
2. Centers for Disease Control and Prevention. Using telehealth to expand access to essential health services during the COVID-19 pandemic. Updated June 10, 2020. Accessed August 20, 2021. https://www.cdc.gov/coronavirus/2019-ncov/hcp/telehealth.html
3. Harvey JB, Valenta S, Simpson K, Lyles M, McElligott J. Utilization of outpatient telehealth services in parity and nonparity states 2010-2015. Telemed J E Health. 2019;25(2):132-136. doi:10.1089/tmj.2017.0265
4. Dorsey ER, Topol EJ. State of telehealth. N Engl J Med. 2016;375(2):154-161. doi:10.1056/NEJMra1601705
5. Rockwell KL, Gilroy AS. Incorporating telemedicine as part of COVID-19 outbreak response systems. Am J Manag Care. 2020;26(4):147-148. doi:10.37765/ajmc.2020.42784
6. Centers for Disease Control and Prevention. Healthcare facility guidance. Updated April 17, 2021. Accessed August 20, 2021. https://www.cdc.gov/coronavirus/2019-ncov/hcp/clinical-care.html
7. US Department of Health and Human Services, Health Resources and Services Administration. Policy changes during COVID-19. Accessed August 20, 2021. https://telehealth.hhs.gov/providers/policy-changes-during-the-covid-19-public-health-emergency
8. Coronavirus Preparedness and Response Supplemental Appropriation Act of 2020. 134 Stat. 146. Published February 2, 2021. Accessed August 20, 2021. https://www.govinfo.gov/content/pkg/CREC-2021-02-02/html/CREC-2021-02-02-pt1-PgS226.htm
9. US Department of Health and Human Services. Notification of enforcement discretion for telehealth remote communications during the COVID-19 nationwide public health emergency. Updated January 20, 2021. Accessed August 20, 2021. https://www.hhs.gov/hipaa/for-professionals/special-topics/emergency-preparedness/notification-enforcement-discretion-telehealth/index.html
10. Centers for Medicare and Medicaid Services. Coverage and payment related to COVID-19 Medicare. 2020. Published March 23, 2020. Accessed August 20, 2021. https://www.cms.gov/files/document/03052020-medicare-covid-19-fact-sheet.pdf
11. American Telemedicine Association. ATA commends 2020 Congress for giving HHS authority to waive restrictions on telehealth for Medicare beneficiaries in response to the COVID-19 outbreak [press release]. Published March 5, 2020. Accessed August 20, 2021. https://www.americantelemed.org/press-releases/ata-commends-congress-for-waiving-restrictions-on-telehealth-for-medicare-beneficiaries-in-response-to-the-covid-19-outbreak
12. Hollander JE, Carr BG. Virtually perfect? Telemedicine for Covid-19. N Engl J Med. 2020;382(18):1679-1681. doi:10.1056/NEJMp2003539
13. Khairat S, Meng C, Xu Y, Edson B, Gianforcaro R. Interpreting COVID-19 and Virtual Care Trends: Cohort Study. JMIR Public Health Surveill. 2020;6(2):e18811. Published 2020 Apr 15. doi:10.2196/18811
14. Ferguson JM, Jacobs J, Yefimova M, Greene L, Heyworth L, Zulman DM. Virtual care expansion in the Veterans Health Administration during the COVID-19 pandemic: clinical services and patient characteristics associated with utilization. J Am Med Inform Assoc. 2021;28(3):453-462. doi:10.1093/jamia/ocaa284
15. Baum A, Kaboli PJ, Schwartz MD. Reduced in-person and increased telehealth outpatient visits during the COVID-19 Pandemic. Ann Intern Med. 2021;174(1):129-131. doi:10.7326/M20-3026
16. Spelman JF, Brienza R, Walsh RF, et al. A model for rapid transition to virtual care, VA Connecticut primary care response to COVID-19. J Gen Intern Med. 2020;35(10):3073-3076. doi:10.1007/s11606-020-06041-4
17. Der-Martirosian C, Chu K, Dobalian A. Use of telehealth to improve access to care at the United States Department of Veterans Affairs during the 2017 Atlantic hurricane season [published online ahead of print, 2020 Apr 13]. Disaster Med Public Health Prep. 2020;1-5. doi:10.1017/dmp.2020.88
The Implications of Power Mobility on Body Weight in a Veteran Population
The Veterans Health Administration (VHA) clinical practice recommendations endorse a power mobility device (PMD) for individuals with adequate judgment, cognitive ability, and vision who are unable to propel a manual wheelchair or walk community distances despite standard medical and rehabilitative interventions.1 VHA supports the use of a PMD in order to access medical care and accomplish activities of daily living, both at home and in the community for veterans with mobility limitations secondary to cardiovascular disease, neurologic disorders, pulmonary disease, or musculoskeletal disorders. The goal of a PMD use is increased participation in community and social life, improved health maintenance via enhanced access to medical facilities, and an overall enhanced quality of life. However, there is a common concern among health care providers that prescribing a PMD may decrease physical activity, in turn, leading to obesity and increasing morbidity. 2
The prevalence of obesity is increasing in the United States. In the past decade 35.0% of men and 36.8% of women were classified as obese (body mass index [BMI], ≥ 30).3 Recent figures from the Centers for Disease Control and Prevention estimate that the overall prevalence of obesity in Americans is closer to 42.4%.4 The veteran population is not immune to this; a 2014 study of nearly 5 million veterans reported that the prevalence of obesity in this population was 41%.5,6 In addition to obesity being implicated in exacerbating many medical problems, such as osteoarthritis, insulin resistance, and heart disease, obesity also is associated with a significant decrease in lifespan.7 Almost half of adults who report ambulatory dysfunction are obese.8 Given the increased morbidity and mortality as a result of obesity, interventions that may promote weight gain need to be appropriately identified and minimized.
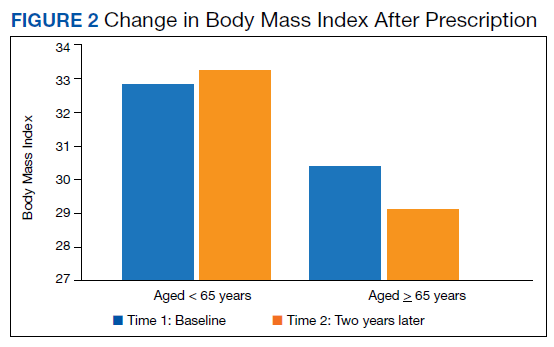
In a retrospective study of 89 veterans, Yang and colleagues demonstrated no significant weight change 1 year after initial PMD prescription.2 Another study of 102 patients noted no significant weight changes 1 year after PMD prescription.9 This study analyzes the effect of PMD prescriptions over a 2-year period on BMI and body weight in a larger population of veterans both as a whole and in BMI/age subgroups.
Methods
The institutional review board at Hunter Holmes McGuire Veterans Affairs Medical Center in Richmond, Virginia, reviewed and approved this study. A waiver of participant consent was approved due to the nature of the research (medical records of patients, some of whom were deceased) and the type of data collected (retrospective data). In addition, each individual was assigned a sequential code to de-identify any personal information. Prosthetics department medical records of consecutive veterans who received PMDs for the first time between January 1, 2011 and June 30, 2012, were reviewed.
Data extracted from the electronic health record (EHR) included demographics, indication for power mobility, weight at time of PMD prescription, weight at 2-years postprescription, and height. Weight readings were considered valid if weight was taken within 3 months of initial prescription and then again within 3 months at the 2-year interval. Individuals without weights recorded in these time frames were excluded. In addition, we excluded medical conditions that might significantly affect body weight, including amyotrophic lateral sclerosis (ALS), amputation during the study period, or history of weight loss surgery. Cancer diagnoses were excluded as they were not an indication for power mobility in the VHA. ALS, though variable in its disease course, was specifically excluded given the likelihood of these patients dying of the natural progression of the disease before the 2-year follow-up period: Median survival times in patients diagnosed with ALS aged > 60 years was < 15 months. 10-12
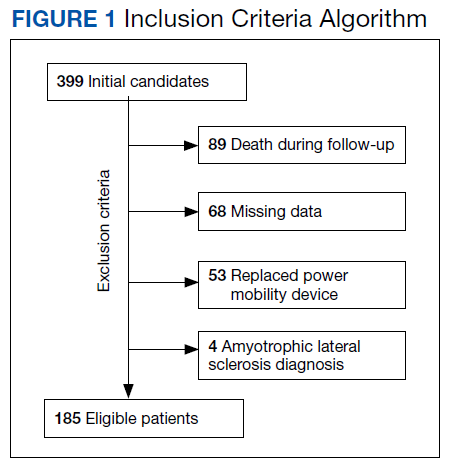
The EHRs of 399 individuals who received a PMD during the period were reviewed, and 185 veterans met criteria for data analysis. Subject exclusions in the weight and BMI analysis included death during the follow-up period (89), missing data (68), prior PMD users who came in for replacements (53), and ALS (4) (Figure 1). Patients were not excluded based on the presence or absence of intentional weight loss efforts as this information was not readily available through chart review.
Statistical Analysis
The primary outcome measure was the change in BMI and body weight from time 1 (date of PMD prescription) to time 2 (2 years later). Analyses were performed using IBM SPSS Statistics, Version 21. BMI was calculated using the weight (lb) x 703/ (height [inches]).2 Dichotomization of BMI was performed using the conventional cut scores: < 30.0, not obese; and ≥ 30.0, obese. Paired t tests and SPSS general linear model (repeated measures) were used to examine change of BMI from time 1 to time 2. The exact McNemar test was used to examine change in obesity classification across time 1 and time 2. Correlating with Yang’s retrospective observational study, data were analyzed separately for aged < 65 years and aged≥ 65 years.2
Results
Of the 185 veterans, 181 were male (98%); mean age was 67.3 years (range, 26-90); and 55% were aged ≥ 65 years. Musculoskeletal disorders (41.6%) were the most common primary indication for a PMD, followed by pulmonary disorders (25.4%) and cardiovascular disorders (23.8%) (Table 1).
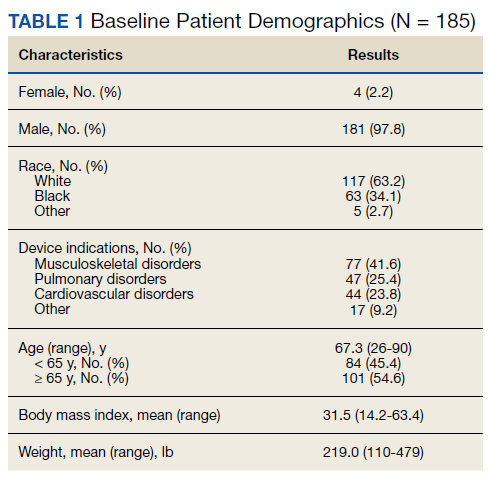
There was a significant decrease in BMI in the first 2 years after receiving a PMD prescription for the first time (estimated marginal means: 31.5 to 30.9 , P = .02). However, age moderated the relationship between BMI and time F[1, 183] = 12.14, P = .001, partial η2 = .06 (Table 2). The 101 subjects aged > 65 years experienced a significant decrease in BMI (estimated marginal means: 30.3 to 29.1, P < .001), whereas the 84 patients aged < 65 years experienced a slight and nonsignificant increase in BMI (estimated marginal means: 32.9 to 33.1, P = .45). BMI was significantly higher for subjects aged < 65 years at Time 1 (F[1, 183] = 4.32, P = .04, partial η2 = .02) and at Time 2 (F[1, 183] = 11.04, P = .001, partial η2 = .06).
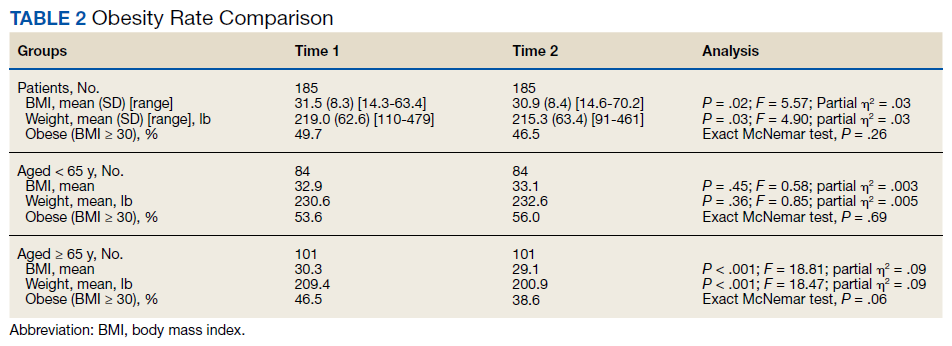
Similarly, there was a significant decrease in weight in the first year after receiving a PMD prescription with a change in mean weight from 219.0 to 215.3 lb (P = .3). Again, age moderated the relationship between weight and time (F = 12.81; P < .001; partial η2 = .07). Individuals aged ≥ 65 years experienced a significant decrease in weight (estimated marginal means = 209.4 to 200.9; P < .001), whereas those aged < 65 years experienced a slight and nonsignificant increase in weight (230.6 to 232.6; P = .36). Weight was significantly higher for individuals aged < 65 years at time 1 (F = 5.34; P = .02; partial η2 = .03) and at time 2 (F = 12.18; P = .001; partial η2 = .06).
The percentage of those who were obese (BMI ≥ 30) at time 1 (49.7%) did not significantly change at time 2 (46.5%) (exact McNemar test, P = .26). Similarly, there was no significant change in obesity from time 1 to time 2 for those aged < 65 years (exact McNemar test P = .69) or for those aged ≥ 65 years (exact McNemar test P = .06). Obesity at time 2 was significantly more common in those aged < 65 years (56.0%) than those aged ≥ 65 years (38.6%), χ2 [1] = 5.54; P = .02. Obesity at time 1 did not differ between those aged < 65 years (53.6%) and aged ≥ 65 years (46.5%), η2 [1] = 0.9; P = .34. Obesity moderated the relationship between weight and time (F = 5.10; P = .03; partial η2= .03) in that obese individuals experienced a significant decrease in weight with estimated marginal means (SE) = 264.5 (4.51) to 257.4 (4.97); F = 11.32; P < .001; partial η2 = .06), whereas nonobese individuals had no weight change with estimated marginal means (SE) = 174.0 (4.48) to 173.61 (4.94); F = .03; P < .86; partial η2< .01).
Discussion
This study demonstrated a significant decrease in both weight and BMI at 2 years after the initiation of a PMD in patients aged < 65 years. No significant change was found for obesity rates. However, veterans who met criteria for obesity at the time of PMD prescription saw a significant decrease in their weight at 2 years compared with those who were nonobese.
VHA supports power mobility when there is a clear functional need that cannot be met by rehabilitation, surgical, or medical interventions to enhance veterans’ abilities to access medical care, accomplish necessary tasks of daily living, and to have greater access to their communities. Though limited by strength of association, studies involving PMD users generally found improvement in reported functional outcomes and overall satisfaction with PMD use based on a systematic review.13 Nonetheless, there is an implicit concern among providers that a PMD prescription, by limiting physical activity, may exacerbate obesity trends in potentially high-risk individuals.
However, a controversy exists about whether increasing physical activity alone leads to weight loss. A 2007 study followed 102 sedentary men and 100 women over 1 year randomized to moderately intensive exercise for 60 minutes, 6 days a week vs no intervention.14 The men lost an average of 4 pounds, and women lost an average of 3 pounds after 1 year. The Women’s Health Study divided 39,876 women into high, medium, and low levels of exercise groups. After 10 years, the intense exercise group did not have any significant weight loss.15
Our study was consistent with existing literature in that a PMD prescription did not correlate with weight gain.2,9 In our veteran population aged ≥ 65 years, we observed an opposite trend of weight loss after PMD prescription. Of note, studies have shown that peak body weight occurs in the sixth decade, remains stable until about aged 70 years, and then slowly decreases thereafter, at a rate of 0.1 to 0.2 kg per year.16 This likely explains some of the weight loss trend we observed in our study of veterans aged ≥ 65 years. Possible additional explanations include improved access to health care and to more nutritional foods that promote general health and well-being.
Limitations
The data were gathered from a predominantly male veteran population, potentially limiting generalizability. The health of any individual is determined by the interaction of factors of which body weight is just a single, isolated component. As such, the effect of powered mobility on body weight is not a direct reflection on the effect on overall health. Additionally, there are many factors that may affect an individual’s body weight, such as optimal management of medical comorbidities, which could not be controlled for in this study. Also, while these values can be compared with other veteran populations, this study had no true control group.
Conclusions
Based on the findings of this study with aforementioned limitations, PMD use does not seem to be associated with significant weight changes. Further studies using control groups and assessing comorbidities are needed.
1. Perlin J. Clinical practice recommendations for motorized wheeled mobility devices: scooters, pushrim-activated power-assist wheelchairs, power wheelchairs, and power wheelchairs with enhanced function. Published 2004. Accessed August 12, 2021. https://www.prosthetics.va.gov/Docs/Motorized_Wheeled_Mobility_Devices.pdf
2. Yang W, Wilson L, Oda I, Yan J. The effect of providing power mobility on weight change. Am J Phys Med Rehabil. 2007;86(9):746-753. doi:10.1097/PHM.0b013e31813e0645
3. Yang, L, Colditz GA. Prevalence of overweight and obesity in the United States, 2007-2012. JAMA Intern Med. 2015; 175(8):1412–1413. doi:10.1001/jamainternmed.2015.2405
4. Hales CM, Carroll MD, Fryar CD, Ogden CL. Prevalence of obesity and severe obesity among adults: United States, 2017-2018. NCHS Data Brief, no 360. Hyattsville, MD: National Center for Health Statistics; 2020.
5. Almond N, Kahwati L, Kinsinger L, Porterfield D. The prevalence of overweight and obesity among U.S. military veterans. Mil Med. 2008;173(6):544-549. doi:10.7205/milmed.173.6.544
6. Breland JY, Phibbs CS, Hoggatt KJ, et al. The obesity epidemic in the Veterans Health Administration: prevalence among key populations of women and men veterans. J Gen Intern Med. 2017;32(suppl 1):11-17. doi:10.1007/s11606-016-3962-1
7. Bray G. Medical consequences of obesity. Int J Clin Endocrinol Metab. 2004;89(6):2583-2589. doi:10.1210/jc.2004-0535
8. Fox MH, Witten MH, Lullo C. Reducing obesity among people with disabilities. J Disabil Policy Stud. 2014;25(3):175-185. doi:10.1177/1044207313494236
9. Zagol BW, Krasuski RA. Effect of motorized scooters on quality of life and cardiovascular risk. Am J Cardiol. 2010;105(5):672-676. doi:10.1016/j.amjcard.2009.10.049
10. Traxinger K, Kelly C, Johnson BA, Lyles RH, Glass JD. Prognosis and epidemiology of amyotrophic lateral sclerosis: analysis of a clinic population, 1997-2011. Neurol Clin Pract. 2013;3(4):313-320. doi:10.1212/cpj.0b013e3182a1b8ab
11. Wolf J, Safer A, Wöhrle J, et al. Factors predicting one-year mortality in amyotrophic lateral sclerosis patients—data from a population-based registry. BMC Neurol. 2014;14(1):197. doi:10.1186/s12883-014-0197-9
12. Körner S, Hendricks M, Kollewe K, et al. Weight loss, dysphagia and supplement intake in patients with amyotrophic lateral sclerosis (ALS): impact on quality of life and therapeutic options. BMC Neurol. 2013;13:84. doi: 10.1186/1471-2377-13-84
13. Auger CJ, Demers L, Gélinas I, et al. Powered mobility for middle-aged and older adults: systematic review of outcomes and appraisal of published evidence. Am J Phys Med Rehabil. 2008;87(8):666-680. doi:10.1097/PHM.0b013e31816de163
14. McTiernan A, Sorensen B, Irwin M, et al. Exercise effect on weight and body fat in men and women. Obesity (Silver Spring). 2007;15(6):1496-512. doi:10.1038/oby.2007.178
15. Lee IM, Djoussé L, Sesso H, Wang L, Buring JE . Physical activity and weight gain prevention, women’s health study. JAMA. 2010;303(12):1173-1179. doi:10.1001/jama.2010.312
16. Wallace J, Schwartz R. Epidemiology of weight loss in humans with special reference to wasting in the elderly. Int J Cardiol. 2002;85(1):15-21. doi:10.1016/s0167-5273(02)00246-2
The Veterans Health Administration (VHA) clinical practice recommendations endorse a power mobility device (PMD) for individuals with adequate judgment, cognitive ability, and vision who are unable to propel a manual wheelchair or walk community distances despite standard medical and rehabilitative interventions.1 VHA supports the use of a PMD in order to access medical care and accomplish activities of daily living, both at home and in the community for veterans with mobility limitations secondary to cardiovascular disease, neurologic disorders, pulmonary disease, or musculoskeletal disorders. The goal of a PMD use is increased participation in community and social life, improved health maintenance via enhanced access to medical facilities, and an overall enhanced quality of life. However, there is a common concern among health care providers that prescribing a PMD may decrease physical activity, in turn, leading to obesity and increasing morbidity. 2
The prevalence of obesity is increasing in the United States. In the past decade 35.0% of men and 36.8% of women were classified as obese (body mass index [BMI], ≥ 30).3 Recent figures from the Centers for Disease Control and Prevention estimate that the overall prevalence of obesity in Americans is closer to 42.4%.4 The veteran population is not immune to this; a 2014 study of nearly 5 million veterans reported that the prevalence of obesity in this population was 41%.5,6 In addition to obesity being implicated in exacerbating many medical problems, such as osteoarthritis, insulin resistance, and heart disease, obesity also is associated with a significant decrease in lifespan.7 Almost half of adults who report ambulatory dysfunction are obese.8 Given the increased morbidity and mortality as a result of obesity, interventions that may promote weight gain need to be appropriately identified and minimized.
In a retrospective study of 89 veterans, Yang and colleagues demonstrated no significant weight change 1 year after initial PMD prescription.2 Another study of 102 patients noted no significant weight changes 1 year after PMD prescription.9 This study analyzes the effect of PMD prescriptions over a 2-year period on BMI and body weight in a larger population of veterans both as a whole and in BMI/age subgroups.
Methods
The institutional review board at Hunter Holmes McGuire Veterans Affairs Medical Center in Richmond, Virginia, reviewed and approved this study. A waiver of participant consent was approved due to the nature of the research (medical records of patients, some of whom were deceased) and the type of data collected (retrospective data). In addition, each individual was assigned a sequential code to de-identify any personal information. Prosthetics department medical records of consecutive veterans who received PMDs for the first time between January 1, 2011 and June 30, 2012, were reviewed.
Data extracted from the electronic health record (EHR) included demographics, indication for power mobility, weight at time of PMD prescription, weight at 2-years postprescription, and height. Weight readings were considered valid if weight was taken within 3 months of initial prescription and then again within 3 months at the 2-year interval. Individuals without weights recorded in these time frames were excluded. In addition, we excluded medical conditions that might significantly affect body weight, including amyotrophic lateral sclerosis (ALS), amputation during the study period, or history of weight loss surgery. Cancer diagnoses were excluded as they were not an indication for power mobility in the VHA. ALS, though variable in its disease course, was specifically excluded given the likelihood of these patients dying of the natural progression of the disease before the 2-year follow-up period: Median survival times in patients diagnosed with ALS aged > 60 years was < 15 months. 10-12
The EHRs of 399 individuals who received a PMD during the period were reviewed, and 185 veterans met criteria for data analysis. Subject exclusions in the weight and BMI analysis included death during the follow-up period (89), missing data (68), prior PMD users who came in for replacements (53), and ALS (4) (Figure 1). Patients were not excluded based on the presence or absence of intentional weight loss efforts as this information was not readily available through chart review.
Statistical Analysis
The primary outcome measure was the change in BMI and body weight from time 1 (date of PMD prescription) to time 2 (2 years later). Analyses were performed using IBM SPSS Statistics, Version 21. BMI was calculated using the weight (lb) x 703/ (height [inches]).2 Dichotomization of BMI was performed using the conventional cut scores: < 30.0, not obese; and ≥ 30.0, obese. Paired t tests and SPSS general linear model (repeated measures) were used to examine change of BMI from time 1 to time 2. The exact McNemar test was used to examine change in obesity classification across time 1 and time 2. Correlating with Yang’s retrospective observational study, data were analyzed separately for aged < 65 years and aged≥ 65 years.2
Results
Of the 185 veterans, 181 were male (98%); mean age was 67.3 years (range, 26-90); and 55% were aged ≥ 65 years. Musculoskeletal disorders (41.6%) were the most common primary indication for a PMD, followed by pulmonary disorders (25.4%) and cardiovascular disorders (23.8%) (Table 1).
There was a significant decrease in BMI in the first 2 years after receiving a PMD prescription for the first time (estimated marginal means: 31.5 to 30.9 , P = .02). However, age moderated the relationship between BMI and time F[1, 183] = 12.14, P = .001, partial η2 = .06 (Table 2). The 101 subjects aged > 65 years experienced a significant decrease in BMI (estimated marginal means: 30.3 to 29.1, P < .001), whereas the 84 patients aged < 65 years experienced a slight and nonsignificant increase in BMI (estimated marginal means: 32.9 to 33.1, P = .45). BMI was significantly higher for subjects aged < 65 years at Time 1 (F[1, 183] = 4.32, P = .04, partial η2 = .02) and at Time 2 (F[1, 183] = 11.04, P = .001, partial η2 = .06).
Similarly, there was a significant decrease in weight in the first year after receiving a PMD prescription with a change in mean weight from 219.0 to 215.3 lb (P = .3). Again, age moderated the relationship between weight and time (F = 12.81; P < .001; partial η2 = .07). Individuals aged ≥ 65 years experienced a significant decrease in weight (estimated marginal means = 209.4 to 200.9; P < .001), whereas those aged < 65 years experienced a slight and nonsignificant increase in weight (230.6 to 232.6; P = .36). Weight was significantly higher for individuals aged < 65 years at time 1 (F = 5.34; P = .02; partial η2 = .03) and at time 2 (F = 12.18; P = .001; partial η2 = .06).
The percentage of those who were obese (BMI ≥ 30) at time 1 (49.7%) did not significantly change at time 2 (46.5%) (exact McNemar test, P = .26). Similarly, there was no significant change in obesity from time 1 to time 2 for those aged < 65 years (exact McNemar test P = .69) or for those aged ≥ 65 years (exact McNemar test P = .06). Obesity at time 2 was significantly more common in those aged < 65 years (56.0%) than those aged ≥ 65 years (38.6%), χ2 [1] = 5.54; P = .02. Obesity at time 1 did not differ between those aged < 65 years (53.6%) and aged ≥ 65 years (46.5%), η2 [1] = 0.9; P = .34. Obesity moderated the relationship between weight and time (F = 5.10; P = .03; partial η2= .03) in that obese individuals experienced a significant decrease in weight with estimated marginal means (SE) = 264.5 (4.51) to 257.4 (4.97); F = 11.32; P < .001; partial η2 = .06), whereas nonobese individuals had no weight change with estimated marginal means (SE) = 174.0 (4.48) to 173.61 (4.94); F = .03; P < .86; partial η2< .01).
Discussion
This study demonstrated a significant decrease in both weight and BMI at 2 years after the initiation of a PMD in patients aged < 65 years. No significant change was found for obesity rates. However, veterans who met criteria for obesity at the time of PMD prescription saw a significant decrease in their weight at 2 years compared with those who were nonobese.
VHA supports power mobility when there is a clear functional need that cannot be met by rehabilitation, surgical, or medical interventions to enhance veterans’ abilities to access medical care, accomplish necessary tasks of daily living, and to have greater access to their communities. Though limited by strength of association, studies involving PMD users generally found improvement in reported functional outcomes and overall satisfaction with PMD use based on a systematic review.13 Nonetheless, there is an implicit concern among providers that a PMD prescription, by limiting physical activity, may exacerbate obesity trends in potentially high-risk individuals.
However, a controversy exists about whether increasing physical activity alone leads to weight loss. A 2007 study followed 102 sedentary men and 100 women over 1 year randomized to moderately intensive exercise for 60 minutes, 6 days a week vs no intervention.14 The men lost an average of 4 pounds, and women lost an average of 3 pounds after 1 year. The Women’s Health Study divided 39,876 women into high, medium, and low levels of exercise groups. After 10 years, the intense exercise group did not have any significant weight loss.15
Our study was consistent with existing literature in that a PMD prescription did not correlate with weight gain.2,9 In our veteran population aged ≥ 65 years, we observed an opposite trend of weight loss after PMD prescription. Of note, studies have shown that peak body weight occurs in the sixth decade, remains stable until about aged 70 years, and then slowly decreases thereafter, at a rate of 0.1 to 0.2 kg per year.16 This likely explains some of the weight loss trend we observed in our study of veterans aged ≥ 65 years. Possible additional explanations include improved access to health care and to more nutritional foods that promote general health and well-being.
Limitations
The data were gathered from a predominantly male veteran population, potentially limiting generalizability. The health of any individual is determined by the interaction of factors of which body weight is just a single, isolated component. As such, the effect of powered mobility on body weight is not a direct reflection on the effect on overall health. Additionally, there are many factors that may affect an individual’s body weight, such as optimal management of medical comorbidities, which could not be controlled for in this study. Also, while these values can be compared with other veteran populations, this study had no true control group.
Conclusions
Based on the findings of this study with aforementioned limitations, PMD use does not seem to be associated with significant weight changes. Further studies using control groups and assessing comorbidities are needed.
1. Perlin J. Clinical practice recommendations for motorized wheeled mobility devices: scooters, pushrim-activated power-assist wheelchairs, power wheelchairs, and power wheelchairs with enhanced function. Published 2004. Accessed August 12, 2021. https://www.prosthetics.va.gov/Docs/Motorized_Wheeled_Mobility_Devices.pdf
2. Yang W, Wilson L, Oda I, Yan J. The effect of providing power mobility on weight change. Am J Phys Med Rehabil. 2007;86(9):746-753. doi:10.1097/PHM.0b013e31813e0645
3. Yang, L, Colditz GA. Prevalence of overweight and obesity in the United States, 2007-2012. JAMA Intern Med. 2015; 175(8):1412–1413. doi:10.1001/jamainternmed.2015.2405
4. Hales CM, Carroll MD, Fryar CD, Ogden CL. Prevalence of obesity and severe obesity among adults: United States, 2017-2018. NCHS Data Brief, no 360. Hyattsville, MD: National Center for Health Statistics; 2020.
5. Almond N, Kahwati L, Kinsinger L, Porterfield D. The prevalence of overweight and obesity among U.S. military veterans. Mil Med. 2008;173(6):544-549. doi:10.7205/milmed.173.6.544
6. Breland JY, Phibbs CS, Hoggatt KJ, et al. The obesity epidemic in the Veterans Health Administration: prevalence among key populations of women and men veterans. J Gen Intern Med. 2017;32(suppl 1):11-17. doi:10.1007/s11606-016-3962-1
7. Bray G. Medical consequences of obesity. Int J Clin Endocrinol Metab. 2004;89(6):2583-2589. doi:10.1210/jc.2004-0535
8. Fox MH, Witten MH, Lullo C. Reducing obesity among people with disabilities. J Disabil Policy Stud. 2014;25(3):175-185. doi:10.1177/1044207313494236
9. Zagol BW, Krasuski RA. Effect of motorized scooters on quality of life and cardiovascular risk. Am J Cardiol. 2010;105(5):672-676. doi:10.1016/j.amjcard.2009.10.049
10. Traxinger K, Kelly C, Johnson BA, Lyles RH, Glass JD. Prognosis and epidemiology of amyotrophic lateral sclerosis: analysis of a clinic population, 1997-2011. Neurol Clin Pract. 2013;3(4):313-320. doi:10.1212/cpj.0b013e3182a1b8ab
11. Wolf J, Safer A, Wöhrle J, et al. Factors predicting one-year mortality in amyotrophic lateral sclerosis patients—data from a population-based registry. BMC Neurol. 2014;14(1):197. doi:10.1186/s12883-014-0197-9
12. Körner S, Hendricks M, Kollewe K, et al. Weight loss, dysphagia and supplement intake in patients with amyotrophic lateral sclerosis (ALS): impact on quality of life and therapeutic options. BMC Neurol. 2013;13:84. doi: 10.1186/1471-2377-13-84
13. Auger CJ, Demers L, Gélinas I, et al. Powered mobility for middle-aged and older adults: systematic review of outcomes and appraisal of published evidence. Am J Phys Med Rehabil. 2008;87(8):666-680. doi:10.1097/PHM.0b013e31816de163
14. McTiernan A, Sorensen B, Irwin M, et al. Exercise effect on weight and body fat in men and women. Obesity (Silver Spring). 2007;15(6):1496-512. doi:10.1038/oby.2007.178
15. Lee IM, Djoussé L, Sesso H, Wang L, Buring JE . Physical activity and weight gain prevention, women’s health study. JAMA. 2010;303(12):1173-1179. doi:10.1001/jama.2010.312
16. Wallace J, Schwartz R. Epidemiology of weight loss in humans with special reference to wasting in the elderly. Int J Cardiol. 2002;85(1):15-21. doi:10.1016/s0167-5273(02)00246-2
Implementation and Impact of a β -Lactam Allergy Assessment Protocol in a Veteran Population
Allergies to β-lactam antibiotics are among the most documented drug allergies, and approximately 10% of the US population reports an allergy specifically to penicillin.1,2 Many allergic reactions are mediated via the antibody immunoglobulin E (IgE), producing an immediate hypersensitivity response, such as hives or anaphylaxis, which can be life threatening. Reactions also may be mediated by T cells of the immune system, which target various cell lines and can cause a drug reaction with eosinophilia and systemic symptoms or Stevens-Johnson syndrome/toxic epidermal necrolysis (SJS/TEN).3Although β-lactam and penicillin allergies are frequently reported, < 5% manifest as either an IgE or T-cell–mediated response.4Furthermore, for the small proportion of patients who once had a true IgE-mediated reaction, including anaphylaxis, 80% experience a decrease in IgE antibodies over time, resulting in a loss of allergic response after about 10 years.2 Due to this decline in IgE response and the initial mislabeling of mild non-IgE penicillin reactions, 95% of patients who are labeled as penicillin-allergic can eventually tolerate a penicillin.2
When a patient’s β-lactam allergy is never reevaluated, negative consequences can ensue. This allergy in a patient’s medical record can lead to the inappropriate avoidance of the entire β-lactam antibiotic class, which includes all penicillins, cephalosporins, and carbapenems. Withholding these antibiotics in certain situations can lead to negative patient outcomes.5-7 For example, the drugs of choice for the infections syphilis and methicillin-susceptible Staphylococcus aureus (S aureus) are a penicillin or cephalosporin, and patients labeled as penicillin-allergic are more likely to experience treatment failure from using second-line therapies.8 Additionally, receiving non-β-lactam antibiotics puts patients at risk of multidrug-resistant pathogens like methicillin-resistant S aureus and vancomycin-resistant Enterococcus (VRE) as well as adverse effects, such as Clostridioides difficile infection.9 Using alternative, and likely broad-spectrum, antibiotics also can be financially detrimental: These medications often are more costly than their β-lactam alternatives, and the inappropriate use of therapies can result in longer hospital courses.9-11
Penicillin allergies can complicate the antibiotic treatment strategy. The Memphis Veterans Affairs Medical Center (MVAMC) in Tennessee recently examined the negative sequelae of β-lactam allergies and found that more than half the patients received inappropriate antibiotics based on guideline recommendations, allergy history, and culture and sensitivity data.12 To mitigate the problems for patients with β-lactam allergies, the 2016 guidelines from the Infectious Diseases Society of America (IDSA) on the Implementation of Antimicrobial Stewardship Programs (ASP) recommend that these patients undergo allergy assessment and penicillin skin testing.13In November 2017, MVAMC implemented such a process. The purpose of this study was to describe our pharmacist-run β-lactam allergy assessment (BLAA) protocol and penicillin allergy clinic (PAC) and evaluate their overall outcomes: the proportion of patients who have been cleared to receive an alternative β-lactam antibiotic or who have had their allergy removed altogether.
Methods
We conducted a retrospective, observational study with approval from the institutional review board at MVAMC. This institution is an academic teaching center with 240 acute care beds and a variety of outpatient clinics available at the main campus, serving veterans in Memphis and the Mid-South area, including west Tennessee, northern Mississippi, and northeastern Arkansas. Patients were consecutively evaluated from November 2017 through February 2020. All MVAMC patients with a documented β-lactam allergy were eligible for inclusion; there were no exclusion criteria. Electronic health record data were assessed and included basic patient demographics, allergy history, and the outcome of the BLAA and PAC. Descriptive statistics were used for data analysis.
The purpose of the BLAA process is to evaluate, clarify, and potentially clear patients of their β-lactam allergies. Started in November 2017, the process includes appropriate patient screening with documentation of the β-lactam allergy. When patients with a β-lactam allergy are admitted to the hospital, they are interviewed by an inpatient CPS. This pharmacist then enters an assessment into the patient’s chart, which includes details of the allergen, reaction, and timing of the event. Based on this information, the CPS provides recommendations: clearance for alternative β-lactams, avoidance of all β-lactams, or removal of the allergy.
In January 2019, the pharmacist-driven penicillin allergy clinic (PAC) was started. Eligible patients receive a skin test to confirm or rule out their allergy after hospital discharge. To facilitate patient identification and screening, the ASP/infectious diseases (ID) clinical pharmacist runs a daily report of hospitalized patients with documented β-lactam allergies. All inpatient CPSs had access to this report and could easily identify and interview patients. Following the interview, the pharmacist enters a note in the patient’s chart, using the BLAA template (eFigures 1 and 2). On completion, a note is viewable in the Notes section adjacent to the patient’s allergies. The pharmacist then can enter a PAC consult for eligible patients. Although most patients qualify for PAC, exclusion criteria include non–IgE-mediated allergies (ie, SJS/TEN), allergies to β-lactams other than penicillins, or recent reactions (ie, within the past 5 years). Each inpatient CPS is trained on this BLAA process, which includes patient screening, chart review, patient interviewing, and the BLAA template and note completion. Pharmacists must demonstrate competency in completing 5 BLAA notes with review from the ASP/ID pharmacist. Once training is completed, this process is integrated into the pharmacist’s everyday workflow.


On receipt of the PAC consult, the ASP/ID pharmacist reviews the patient chart to further assess for eligibility and to determine whether oral challenge alone or skin testing followed by the oral challenge is required based on patient risk stratification (Table 1).3Relative contraindications to PAC include severe or unstable lung disease that requires home oxygen, frequent or recurrent heart failure exacerbations, or patients with acute or unstable cardiopulmonary, neurologic, or mental health conditions. These scenarios are discussed case by case with the allergy/immunology (A/I) physician.

The ASP/ID pharmacist also reviews the patient’s chart for medications that may blunt the histamine response during drug testing. The need to hold these medications before PAC also are individually assessed in conjunction with the A/I physician. The ASP/ID pharmacist and 3 other CPS involved in the creation of the BLAA and PAC have received formal hands-on training on penicillin allergy testing. The PAC process consists of a penicillin skin test, followed by the amoxicillin oral challenge.3The ASP/ID clinical pharmacist who is trained in penicillin skin testing performs all duties in PAC, with oversight from the A/I attending physician as needed. Currently, the ASP/ID pharmacist runs the PAC once a week with the A/I physician available if needed. Along with documenting an A/I clinic note detailing the events of PAC, the ASP/ID pharmacist also will add an addendum to the original BLAA note. If the allergy is removed through direct testing, it also can be removed from the patient’s profile after discussion with the A/I physician. Therefore, the full details necessary to evaluate, clarify, and clear the patient of their β-lactam allergy are in one place.
Results
We evaluated 278 patients, using the BLAA protocol. In this veteran population, patients were generally older males and evenly split between African American and White patients (Table 2). Most patients reported an allergy to penicillin, with a rash being the most common reaction (Table 3).


Of the 278 assessed, 246 patients were evaluated via our BLAA alone and were not seen in PAC. We were able to remove 25% of these patients’ allergies by performing a thorough assessment. Of the 184 patients whose allergies could not be removed via the BLAA alone, 147 (80%) were still eligible for PAC but are awaiting scheduling. Patients ineligible for PAC included those with a cephalosporin allergy or a severe and non–IgE-mediated reaction. Other ineligible patients who were not eligible included those with diseases where risk of testing outweighed the benefits.
Of the 32 patients who were seen in PAC, 75% of allergies were removed through direct testing. No differences between race or gender were observed. Of the 8 patients (25%) whose allergies were not removed, 5 had confirmed penicillin allergies with a positive reaction; 4 of these patients have since tolerated an alternative β-lactam (either a cephalosporin or carbapenem). Three patients had inconclusive tests, most often because their positive control was nonreactive during the percutaneous portion of the skin test; these allergies could neither be confirmed nor removed. Two of these patients have since tolerated alternative β-lactams (both cephalosporins). Although these 8 patients should not be rechallenged with a penicillin antibiotic, they could still be considered for alternative β-lactams, based on the nature and histories of their allergies.
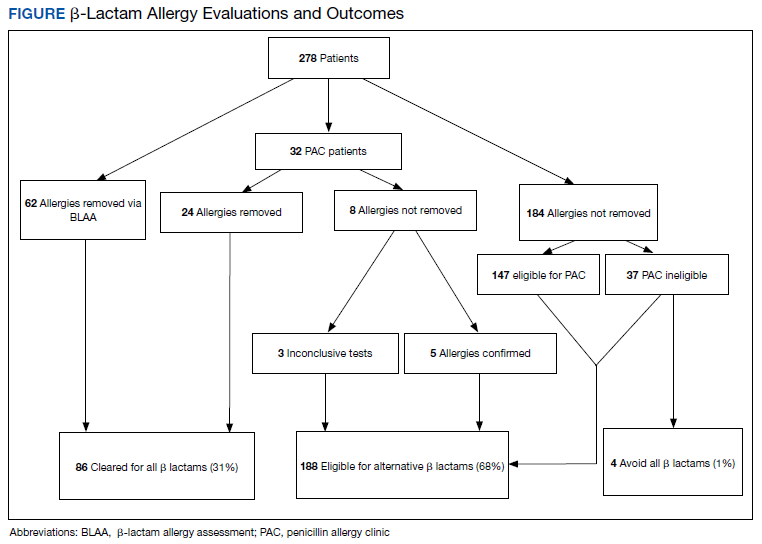
In total, we removed 86 allergies (31% of our patient population) using both BLAA and PAC (Figure). These patients were cleared for all β-lactams. One hundred eighty-eight patients (68%) were cleared to receive an alternative β-lactam based on the nature or history of the allergic reaction. β-lactam avoidance was recommended for only 4 patients (1%), as they had no exposure to any β-lactams, and they had a recent or severe reaction: 2 patients with anaphylaxis in the past 5 years, 1 with SJS/TEN, and 1 with recent convulsions after receiving cefepime. Combining patients whose penicillin allergies were removed with those who had been cleared for alternative β-lactam antibiotics, 99% of patients were cleared for a β-lactam antibiotic.
Discussion
We have implemented a unique and efficient way to evaluate, clarify, and clear β-lactam allergies. Our BLAA protocol allows for a smooth process by distributing the workload of evaluating and clarifying patients’ allergies over many inpatient CPS. Furthermore, the BLAA is readily accessible to health care providers (HCPs), allowing for optimal clinical decision making. HCPs can quickly gather further information on the β-lactam allergy, while seeing actionable recommendations, along with documentation of the PAC visit and subsequent events, if the patient has been seen.
This study demonstrated the promotion of alternative β-lactam use for nearly all patients: 99% of our patient population were deemed candidates for a β-lactam type antibiotic. This percentage included patients whose allergies have been fully cleared, both through BLAA alone and in PAC. Also included are patients who have been cleared for an alternative β-lactam and not necessarily a penicillin.
In our PAC, 8 patients were not cleared for penicillins: 5 had penicillin allergies confirmed, and 3 had inconclusive results. Based on the nature of their reactions and previous tolerance of alternative β-lactams, those 5 patients are still eligible for alternative β-lactams. Additionally, the 3 patients with inconclusive results are also eligible for alternative β-lactams for the same reasons. The patients for whom
Accounting for those patients who have not been seen in PAC, our results are in concordance with previous studies, which demonstrated that implementation of a similar BLAA process results in clearance of ≥ 90% of penicillin allergies.13-17Other studies have evaluated inpatient implementation of penicillin skin testing or oral challenges; in this study, however, BLAAs were completed while the patient was hospitalized, and patients were seen in PAC after discharge. Completing BLAA during hospitalization not only allows for faster assessment and facilitates decision making regarding most patients’ antibiotic regimens, but also provides a tool that can be used by many pharmacists and HCPs. The addition of our PAC to the BLAA protocol further strengthens the impact on clearance of patients’ penicillin allergies.
Limitations
Although our study demonstrates many benefits of implementation of a BLAA protocol and PAC, it has several limitations. This analysis was a retrospective review of the limited number of patients who had assessments completed. Additionally, many patients were waiting to be seen in PAC. This delay is largely due to the length of time to establish our pharmacist-run PAC, the limited number of pharmacists trained and available for skin testing, the time constraints of our staff, and COVID-19 pandemic. Additionally, only pharmacists administer the BLAA questionnaire, but this process could be expanded to other professionals such as nursing staff. Also, this study was not set up as a before-and-after analysis that examined outcomes associated with individual patients. Future directions include assessing the clinical impact of this protocol, such as evaluating provider utilization of β-lactam antibiotics for patients with penicillin allergies and determining associated cost savings.
Conclusions
This study demonstrated that implementation of a pharmacist-driven BLAA protocol and PAC can effectively remove inaccurate penicillin allergy labels and clear patients for alternative β-lactam antibiotic use. The BLAA process in conjunction with PAC will continue to be used to better evaluate, clarify, and clear patient allergies to optimize their care.
1. Lee CE, Zembower TR, Fotis MA, et al. The incidence of antimicrobial allergies in hospitalized patients: implications regarding prescribing patterns and emerging bacterial resistance. Arch Intern Med. 2000;160(18):2819-2822. doi:10.1001/archinte.160.18.2819
2. Shenoy ES, Macy E, Rowe T, Blumenthal KG. Evaluation and management of penicillin allergy: a review. JAMA. 2019;321(2):188-199. doi:10.1001/jama.2018.19283
3. Castells M, Khan DA, Phillips EJ. Penicillin allergy. N Engl J Med. 2019;381(24):2338-2351. doi:10.1056/NEJMra1807761
4. Park M, Markus P, Matesic D, Li JTC. Safety and effectiveness of a preoperative allergy clinic in decreasing vancomycin use in patients with a history of penicillin allergy. Ann Allergy Asthma Immunol. 2006;97(5):681-687. doi:10.1016/S1081-1206(10)61100-3
5. McDanel JS, Perencevich EN, Diekema DJ, et al. Comparative effectiveness of beta-lactams versus vancomycin for treatment of methicillin-susceptible Staphylococcus aureus bloodstream infections among 122 hospitals. Clin Infect Dis. 2015;61(3):361-367. doi:10.1093/cid/civ308
6. Blumenthal KG, Shenoy ES, Varughese CA, Hurwitz S, Hooper DC, Banerji A. Impact of a clinical guideline for prescribing antibiotics to inpatients reporting penicillin or cephalosporin allergy. Ann Allergy Asthma Immunol. 2015;115(4):294-300.e2. doi:10.1016/j.anai.2015.05.011
7. Blumenthal KG, Parker RA, Shenoy ES, Walensky RP. Improving clinical outcomes in patients with methicillin-sensitive Staphylococcus aureus bacteremia and reported penicillin allergy. Clin Infect Dis. 2015;61(5):741-749. doi:10.1093/cid/civ394
8. Jeffres MN, Narayanan PP, Shuster JE, Schramm GE. Consequences of avoiding β-lactams in patients with β-lactam allergies. J Allergy Clin Immunol. 2016;137(4):1148-1153. doi:10.1016/j.jaci.2015.10.026
9. Macy E, Contreras R. Health care use and serious infection prevalence associated with penicillin “allergy” in hospitalized patients: a cohort study. J Allergy Clin Immunol. 2014;133(3):790-796. doi:10.1016/j.jaci2013.09.021
10. Charneski L, Deshpande G, Smith SW. Impact of an antimicrobial allergy label in the medical record on clinical outcomes in hospitalized patients. Pharmacotherapy. 2011;31(8):742-747. doi:10.1592/phco.31.8.742
11. Sade K, Holtzer I, Levo Y, Kivity S. The economic burden of antibiotic treatment of penicillin-allergic patients in internal medicine wards of a general tertiary care hospital. Clin Exp Allergy. 2003;33(4):501-506. doi:10.1046/j.1365-2222.2003.01638.x
12. Ness RA, Bennett JG, Elliott WV, Gillion AR, Pattanaik DN. Impact of β-lactam allergies on antimicrobial selection in an outpatient setting. South Med J. 2019;112(11):591-597. doi:10.14423/SMJ.0000000000001037
13. Barlam TF, Cosgrove SE, Abbo LM, et al. Implementing an antibiotic stewardship program: guidelines by the Infectious Diseases Society of America and the Society for Healthcare Epidemiology of America. Clin Infect Dis. 2016;62(10):e51-e77. doi:10.1093/cid/ciw118
14. King EA, Challa S, Curtin P, Bielory L. Penicillin skin testing in hospitalized patients with beta-lactam allergies: effect on antibiotic selection and cost. Ann Allergy Asthma Immunol. 2016;117(1):67-71. doi:10.1016/j.anai.2016.04.021
15. Chen JR, Tarver SA, Alvarez KS, Tran T, Khan DA. A proactive approach to penicillin allergy testing in hospitalized patients. J Allergy Clin Immunol Pract. 2017;5(3):686-693. doi:10.1016/j.jaip.2016.09.045
16. Rimawi RH, Cook PP, Gooch M, et al. The impact of penicillin skin testing of clinical practice and antimicrobial stewardship. J Hosp Med. 2013;8(6):341-345. doi:10.1002/jhm.2036
17. Heil EL, Bork JT, Schmalzle SA, et al. Implementation of an infectious disease fellow-managed penicillin allergy skin testing service. Open Forum Infect Dis. 2016;3(3):155-161. doi:10.1093/ofid/ofw155
Allergies to β-lactam antibiotics are among the most documented drug allergies, and approximately 10% of the US population reports an allergy specifically to penicillin.1,2 Many allergic reactions are mediated via the antibody immunoglobulin E (IgE), producing an immediate hypersensitivity response, such as hives or anaphylaxis, which can be life threatening. Reactions also may be mediated by T cells of the immune system, which target various cell lines and can cause a drug reaction with eosinophilia and systemic symptoms or Stevens-Johnson syndrome/toxic epidermal necrolysis (SJS/TEN).3Although β-lactam and penicillin allergies are frequently reported, < 5% manifest as either an IgE or T-cell–mediated response.4Furthermore, for the small proportion of patients who once had a true IgE-mediated reaction, including anaphylaxis, 80% experience a decrease in IgE antibodies over time, resulting in a loss of allergic response after about 10 years.2 Due to this decline in IgE response and the initial mislabeling of mild non-IgE penicillin reactions, 95% of patients who are labeled as penicillin-allergic can eventually tolerate a penicillin.2
When a patient’s β-lactam allergy is never reevaluated, negative consequences can ensue. This allergy in a patient’s medical record can lead to the inappropriate avoidance of the entire β-lactam antibiotic class, which includes all penicillins, cephalosporins, and carbapenems. Withholding these antibiotics in certain situations can lead to negative patient outcomes.5-7 For example, the drugs of choice for the infections syphilis and methicillin-susceptible Staphylococcus aureus (S aureus) are a penicillin or cephalosporin, and patients labeled as penicillin-allergic are more likely to experience treatment failure from using second-line therapies.8 Additionally, receiving non-β-lactam antibiotics puts patients at risk of multidrug-resistant pathogens like methicillin-resistant S aureus and vancomycin-resistant Enterococcus (VRE) as well as adverse effects, such as Clostridioides difficile infection.9 Using alternative, and likely broad-spectrum, antibiotics also can be financially detrimental: These medications often are more costly than their β-lactam alternatives, and the inappropriate use of therapies can result in longer hospital courses.9-11
Penicillin allergies can complicate the antibiotic treatment strategy. The Memphis Veterans Affairs Medical Center (MVAMC) in Tennessee recently examined the negative sequelae of β-lactam allergies and found that more than half the patients received inappropriate antibiotics based on guideline recommendations, allergy history, and culture and sensitivity data.12 To mitigate the problems for patients with β-lactam allergies, the 2016 guidelines from the Infectious Diseases Society of America (IDSA) on the Implementation of Antimicrobial Stewardship Programs (ASP) recommend that these patients undergo allergy assessment and penicillin skin testing.13In November 2017, MVAMC implemented such a process. The purpose of this study was to describe our pharmacist-run β-lactam allergy assessment (BLAA) protocol and penicillin allergy clinic (PAC) and evaluate their overall outcomes: the proportion of patients who have been cleared to receive an alternative β-lactam antibiotic or who have had their allergy removed altogether.
Methods
We conducted a retrospective, observational study with approval from the institutional review board at MVAMC. This institution is an academic teaching center with 240 acute care beds and a variety of outpatient clinics available at the main campus, serving veterans in Memphis and the Mid-South area, including west Tennessee, northern Mississippi, and northeastern Arkansas. Patients were consecutively evaluated from November 2017 through February 2020. All MVAMC patients with a documented β-lactam allergy were eligible for inclusion; there were no exclusion criteria. Electronic health record data were assessed and included basic patient demographics, allergy history, and the outcome of the BLAA and PAC. Descriptive statistics were used for data analysis.
The purpose of the BLAA process is to evaluate, clarify, and potentially clear patients of their β-lactam allergies. Started in November 2017, the process includes appropriate patient screening with documentation of the β-lactam allergy. When patients with a β-lactam allergy are admitted to the hospital, they are interviewed by an inpatient CPS. This pharmacist then enters an assessment into the patient’s chart, which includes details of the allergen, reaction, and timing of the event. Based on this information, the CPS provides recommendations: clearance for alternative β-lactams, avoidance of all β-lactams, or removal of the allergy.
In January 2019, the pharmacist-driven penicillin allergy clinic (PAC) was started. Eligible patients receive a skin test to confirm or rule out their allergy after hospital discharge. To facilitate patient identification and screening, the ASP/infectious diseases (ID) clinical pharmacist runs a daily report of hospitalized patients with documented β-lactam allergies. All inpatient CPSs had access to this report and could easily identify and interview patients. Following the interview, the pharmacist enters a note in the patient’s chart, using the BLAA template (eFigures 1 and 2). On completion, a note is viewable in the Notes section adjacent to the patient’s allergies. The pharmacist then can enter a PAC consult for eligible patients. Although most patients qualify for PAC, exclusion criteria include non–IgE-mediated allergies (ie, SJS/TEN), allergies to β-lactams other than penicillins, or recent reactions (ie, within the past 5 years). Each inpatient CPS is trained on this BLAA process, which includes patient screening, chart review, patient interviewing, and the BLAA template and note completion. Pharmacists must demonstrate competency in completing 5 BLAA notes with review from the ASP/ID pharmacist. Once training is completed, this process is integrated into the pharmacist’s everyday workflow.
On receipt of the PAC consult, the ASP/ID pharmacist reviews the patient chart to further assess for eligibility and to determine whether oral challenge alone or skin testing followed by the oral challenge is required based on patient risk stratification (Table 1).3Relative contraindications to PAC include severe or unstable lung disease that requires home oxygen, frequent or recurrent heart failure exacerbations, or patients with acute or unstable cardiopulmonary, neurologic, or mental health conditions. These scenarios are discussed case by case with the allergy/immunology (A/I) physician.
The ASP/ID pharmacist also reviews the patient’s chart for medications that may blunt the histamine response during drug testing. The need to hold these medications before PAC also are individually assessed in conjunction with the A/I physician. The ASP/ID pharmacist and 3 other CPS involved in the creation of the BLAA and PAC have received formal hands-on training on penicillin allergy testing. The PAC process consists of a penicillin skin test, followed by the amoxicillin oral challenge.3The ASP/ID clinical pharmacist who is trained in penicillin skin testing performs all duties in PAC, with oversight from the A/I attending physician as needed. Currently, the ASP/ID pharmacist runs the PAC once a week with the A/I physician available if needed. Along with documenting an A/I clinic note detailing the events of PAC, the ASP/ID pharmacist also will add an addendum to the original BLAA note. If the allergy is removed through direct testing, it also can be removed from the patient’s profile after discussion with the A/I physician. Therefore, the full details necessary to evaluate, clarify, and clear the patient of their β-lactam allergy are in one place.
Results
We evaluated 278 patients, using the BLAA protocol. In this veteran population, patients were generally older males and evenly split between African American and White patients (Table 2). Most patients reported an allergy to penicillin, with a rash being the most common reaction (Table 3).
Of the 278 assessed, 246 patients were evaluated via our BLAA alone and were not seen in PAC. We were able to remove 25% of these patients’ allergies by performing a thorough assessment. Of the 184 patients whose allergies could not be removed via the BLAA alone, 147 (80%) were still eligible for PAC but are awaiting scheduling. Patients ineligible for PAC included those with a cephalosporin allergy or a severe and non–IgE-mediated reaction. Other ineligible patients who were not eligible included those with diseases where risk of testing outweighed the benefits.
Of the 32 patients who were seen in PAC, 75% of allergies were removed through direct testing. No differences between race or gender were observed. Of the 8 patients (25%) whose allergies were not removed, 5 had confirmed penicillin allergies with a positive reaction; 4 of these patients have since tolerated an alternative β-lactam (either a cephalosporin or carbapenem). Three patients had inconclusive tests, most often because their positive control was nonreactive during the percutaneous portion of the skin test; these allergies could neither be confirmed nor removed. Two of these patients have since tolerated alternative β-lactams (both cephalosporins). Although these 8 patients should not be rechallenged with a penicillin antibiotic, they could still be considered for alternative β-lactams, based on the nature and histories of their allergies.
In total, we removed 86 allergies (31% of our patient population) using both BLAA and PAC (Figure). These patients were cleared for all β-lactams. One hundred eighty-eight patients (68%) were cleared to receive an alternative β-lactam based on the nature or history of the allergic reaction. β-lactam avoidance was recommended for only 4 patients (1%), as they had no exposure to any β-lactams, and they had a recent or severe reaction: 2 patients with anaphylaxis in the past 5 years, 1 with SJS/TEN, and 1 with recent convulsions after receiving cefepime. Combining patients whose penicillin allergies were removed with those who had been cleared for alternative β-lactam antibiotics, 99% of patients were cleared for a β-lactam antibiotic.
Discussion
We have implemented a unique and efficient way to evaluate, clarify, and clear β-lactam allergies. Our BLAA protocol allows for a smooth process by distributing the workload of evaluating and clarifying patients’ allergies over many inpatient CPS. Furthermore, the BLAA is readily accessible to health care providers (HCPs), allowing for optimal clinical decision making. HCPs can quickly gather further information on the β-lactam allergy, while seeing actionable recommendations, along with documentation of the PAC visit and subsequent events, if the patient has been seen.
This study demonstrated the promotion of alternative β-lactam use for nearly all patients: 99% of our patient population were deemed candidates for a β-lactam type antibiotic. This percentage included patients whose allergies have been fully cleared, both through BLAA alone and in PAC. Also included are patients who have been cleared for an alternative β-lactam and not necessarily a penicillin.
In our PAC, 8 patients were not cleared for penicillins: 5 had penicillin allergies confirmed, and 3 had inconclusive results. Based on the nature of their reactions and previous tolerance of alternative β-lactams, those 5 patients are still eligible for alternative β-lactams. Additionally, the 3 patients with inconclusive results are also eligible for alternative β-lactams for the same reasons. The patients for whom
Accounting for those patients who have not been seen in PAC, our results are in concordance with previous studies, which demonstrated that implementation of a similar BLAA process results in clearance of ≥ 90% of penicillin allergies.13-17Other studies have evaluated inpatient implementation of penicillin skin testing or oral challenges; in this study, however, BLAAs were completed while the patient was hospitalized, and patients were seen in PAC after discharge. Completing BLAA during hospitalization not only allows for faster assessment and facilitates decision making regarding most patients’ antibiotic regimens, but also provides a tool that can be used by many pharmacists and HCPs. The addition of our PAC to the BLAA protocol further strengthens the impact on clearance of patients’ penicillin allergies.
Limitations
Although our study demonstrates many benefits of implementation of a BLAA protocol and PAC, it has several limitations. This analysis was a retrospective review of the limited number of patients who had assessments completed. Additionally, many patients were waiting to be seen in PAC. This delay is largely due to the length of time to establish our pharmacist-run PAC, the limited number of pharmacists trained and available for skin testing, the time constraints of our staff, and COVID-19 pandemic. Additionally, only pharmacists administer the BLAA questionnaire, but this process could be expanded to other professionals such as nursing staff. Also, this study was not set up as a before-and-after analysis that examined outcomes associated with individual patients. Future directions include assessing the clinical impact of this protocol, such as evaluating provider utilization of β-lactam antibiotics for patients with penicillin allergies and determining associated cost savings.
Conclusions
This study demonstrated that implementation of a pharmacist-driven BLAA protocol and PAC can effectively remove inaccurate penicillin allergy labels and clear patients for alternative β-lactam antibiotic use. The BLAA process in conjunction with PAC will continue to be used to better evaluate, clarify, and clear patient allergies to optimize their care.
1. Lee CE, Zembower TR, Fotis MA, et al. The incidence of antimicrobial allergies in hospitalized patients: implications regarding prescribing patterns and emerging bacterial resistance. Arch Intern Med. 2000;160(18):2819-2822. doi:10.1001/archinte.160.18.2819
2. Shenoy ES, Macy E, Rowe T, Blumenthal KG. Evaluation and management of penicillin allergy: a review. JAMA. 2019;321(2):188-199. doi:10.1001/jama.2018.19283
3. Castells M, Khan DA, Phillips EJ. Penicillin allergy. N Engl J Med. 2019;381(24):2338-2351. doi:10.1056/NEJMra1807761
4. Park M, Markus P, Matesic D, Li JTC. Safety and effectiveness of a preoperative allergy clinic in decreasing vancomycin use in patients with a history of penicillin allergy. Ann Allergy Asthma Immunol. 2006;97(5):681-687. doi:10.1016/S1081-1206(10)61100-3
5. McDanel JS, Perencevich EN, Diekema DJ, et al. Comparative effectiveness of beta-lactams versus vancomycin for treatment of methicillin-susceptible Staphylococcus aureus bloodstream infections among 122 hospitals. Clin Infect Dis. 2015;61(3):361-367. doi:10.1093/cid/civ308
6. Blumenthal KG, Shenoy ES, Varughese CA, Hurwitz S, Hooper DC, Banerji A. Impact of a clinical guideline for prescribing antibiotics to inpatients reporting penicillin or cephalosporin allergy. Ann Allergy Asthma Immunol. 2015;115(4):294-300.e2. doi:10.1016/j.anai.2015.05.011
7. Blumenthal KG, Parker RA, Shenoy ES, Walensky RP. Improving clinical outcomes in patients with methicillin-sensitive Staphylococcus aureus bacteremia and reported penicillin allergy. Clin Infect Dis. 2015;61(5):741-749. doi:10.1093/cid/civ394
8. Jeffres MN, Narayanan PP, Shuster JE, Schramm GE. Consequences of avoiding β-lactams in patients with β-lactam allergies. J Allergy Clin Immunol. 2016;137(4):1148-1153. doi:10.1016/j.jaci.2015.10.026
9. Macy E, Contreras R. Health care use and serious infection prevalence associated with penicillin “allergy” in hospitalized patients: a cohort study. J Allergy Clin Immunol. 2014;133(3):790-796. doi:10.1016/j.jaci2013.09.021
10. Charneski L, Deshpande G, Smith SW. Impact of an antimicrobial allergy label in the medical record on clinical outcomes in hospitalized patients. Pharmacotherapy. 2011;31(8):742-747. doi:10.1592/phco.31.8.742
11. Sade K, Holtzer I, Levo Y, Kivity S. The economic burden of antibiotic treatment of penicillin-allergic patients in internal medicine wards of a general tertiary care hospital. Clin Exp Allergy. 2003;33(4):501-506. doi:10.1046/j.1365-2222.2003.01638.x
12. Ness RA, Bennett JG, Elliott WV, Gillion AR, Pattanaik DN. Impact of β-lactam allergies on antimicrobial selection in an outpatient setting. South Med J. 2019;112(11):591-597. doi:10.14423/SMJ.0000000000001037
13. Barlam TF, Cosgrove SE, Abbo LM, et al. Implementing an antibiotic stewardship program: guidelines by the Infectious Diseases Society of America and the Society for Healthcare Epidemiology of America. Clin Infect Dis. 2016;62(10):e51-e77. doi:10.1093/cid/ciw118
14. King EA, Challa S, Curtin P, Bielory L. Penicillin skin testing in hospitalized patients with beta-lactam allergies: effect on antibiotic selection and cost. Ann Allergy Asthma Immunol. 2016;117(1):67-71. doi:10.1016/j.anai.2016.04.021
15. Chen JR, Tarver SA, Alvarez KS, Tran T, Khan DA. A proactive approach to penicillin allergy testing in hospitalized patients. J Allergy Clin Immunol Pract. 2017;5(3):686-693. doi:10.1016/j.jaip.2016.09.045
16. Rimawi RH, Cook PP, Gooch M, et al. The impact of penicillin skin testing of clinical practice and antimicrobial stewardship. J Hosp Med. 2013;8(6):341-345. doi:10.1002/jhm.2036
17. Heil EL, Bork JT, Schmalzle SA, et al. Implementation of an infectious disease fellow-managed penicillin allergy skin testing service. Open Forum Infect Dis. 2016;3(3):155-161. doi:10.1093/ofid/ofw155
Right Ventricle Dilation Detected on Point-of-Care Ultrasound Is a Predictor of Poor Outcomes in Critically Ill Patients With COVID-19
Point-of-care ultrasound (POCUS) is increasingly being used by critical care physicians to augment the physical examination and guide clinical decision making, and several protocols have been established to standardize the POCUS evaluation.1 During the COVID-19 pandemic, POCUS has been a valuable tool as standard imaging techniques were used judiciously to minimize exposure of personnel and use of personal protective equipment (PPE).2
In the US Department of Veterans Affairs (VA) New York Harbor Healthcare System (VANYHHS) intensive care unit (ICU) on initial clinical examination included POCUS, which was helpful to examine deep vein thromboses, cardiac function, and the presence and extent of pneumonia. An international expert consensus on the use of POCUS for COVID-19 published in December 2020 called for further studies defining the role of lung and cardiac ultrasound in risk stratification, outcomes, and clinical management.3
The objective of this study was to review POCUS findings and correlate them with severity of illness and 30-day outcomes in critically ill patients with COVID-19.
Methods
The study was submitted to and reviewed by the VANYHHS Research and Development committee and study approval and informed consent waiver was granted. The study was a retrospective chart review of patients admitted to the VANYHHS ICU between March and April 2020, a tertiary health care center designated as a COVID-19 hospital.
Patients admitted to the ICU aged > 18 years with a diagnosis of acute hypoxemic respiratory failure, diagnosis of COVID-19, and documentation of POCUS findings in the chart were included in the study. A patient was considered to have a COVID-19 diagnosis following a positive SARS-CoV-2 polymerase chain reaction test documented in the electronic health record (EHR). Acute respiratory failure was defined as hypoxemia < 94% and the need for either supplemental oxygen by nasal cannula > 2 L/min, high flow nasal cannula, noninvasive ventilation, or mechanical ventilation.
To minimize personnel exposure, initial patient evaluations and POCUS examinations were performed by the most senior personnel (ie, fellowship trained, board-certified pulmonary critical care attending physicians or pulmonary and critical care fellowship trainees). Three members of the team had certification in advanced critical care echocardiography by the National Board of Echocardiography and oversaw POCUS imaging. POCUS examinations were performed with a GE Heathcare Venue POCUS or handheld unit. After use, ultrasound probes and ultrasound units were disinfected with wipes designated by the manufacturer and US Environmental Protection Agency for use during the COVID-19 pandemic.
The POCUS protocol used by members of the team was as follows: POCUS lung—at least 2 anterior fields and 1 posterior/lateral field looking at the costophrenic angle on each hemithorax with a phased array or curvilinear probe. A linear probe was used to look for subpleural changes per physician discretion.4,5 Lung ultrasound findings in anterior lung fields were documented as A lines, B lines (as defined by the bedside lung ultrasound in emergency [BLUE] protocol)anterior pleural abnormalities or consolidations.4,5 The costophrenic point findings were documented as presence of consolidation or pleural effusion.
The POCUS cardiac examination consisted of parasternal long and short axis views, apical 4 chamber view, subcostal and inferior vena cava (IVC) view. Left ventricular (LV) ejection fraction was visually estimated as reduced or normal. Right ventricular (RV) dilation was considered present if RV size approached or exceeded LV size in the apical 4 chamber view. RV dysfunction was considered present if in addition there was flattening of interventricular septum, RV free wall hypokinesis or reduced tricuspid annular plane systolic excursion (TAPSE).6 IVC was documented as collapsible or plethoric by size and respirophasic variability (2 cm and 50%). Other POCUS examinations including venous compression were done at the discretion of the treating physician.7 POCUS was also used for the placement of central and arterial lines and to guide fluid management.8
The VA EHR and Venue image local archives were reviewed for patient demographics, laboratory findings, imaging studies and outcomes. All ICU attending physician and fellow notes were reviewed for POCUS lung, cardiac and vascular findings. The chart was also reviewed for management changes as a result of POCUS findings. Patients who had at minimum a POCUS lung or cardiac examination documented in the EHR were included in the study. For patients with serial POCUS the most severe findings were included.
Patients were divided into 2 groups based on 30-day outcome: discharge home vs mortality for comparison. POCUS findings were also compared by need for mechanical ventilation. Patients still hospitalized or transferred to other facilities were excluded from the analysis. A Student t test was used for comparison between the groups for continuous normally distributed variables. Linear and stepwise regression models were used to evaluate univariate and multivariate associations of baseline characteristics, biomarker, and ultrasound findings with patient outcomes. Analyses were performed using R 4.0.2 statistical software.
Results
Eighty-two patients were admitted to the VANYHHS ICU in March and April 2020, including 12 nonveterans. Sixty-four had COVID-19 and acute respiratory failure. POCUS findings were documented in 43 (67%) patients. Thirty-nine patients had documented lung examinations, and 25 patients had documented cardiac examinations. Patients were divided into 2 groups by 30-day outcome (discharge home vs mortality) for statistical analysis. Five patients who were either still hospitalized or had been transferred to another facility were excluded.
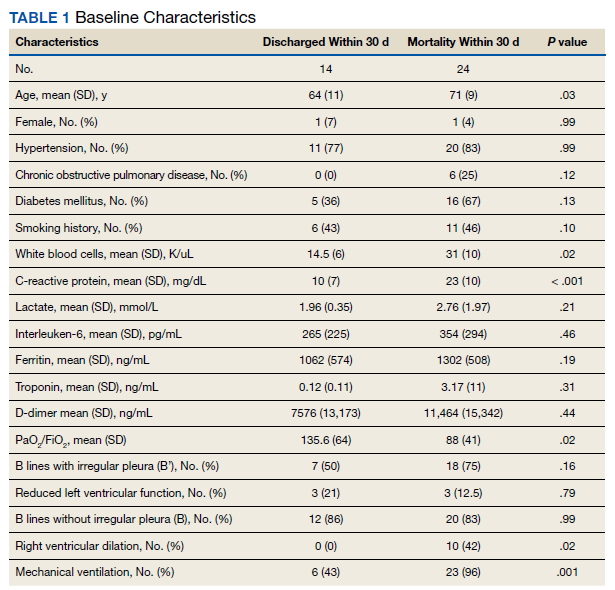
Baseline characteristics of patients included in the study stratified by 30-day outcomes are shown in Table 1. The study group was predominantly male (95%). Patients with poor 30-day outcomes were older, had higher white blood cell counts, more severe hypoxemia, higher rates of mechanical ventilation and RV dilation (Figures 1, 2, 3, 4, and 5). RV dilation was an independent predictor of mortality (odds ratio [OR], 12.0; P = .048).
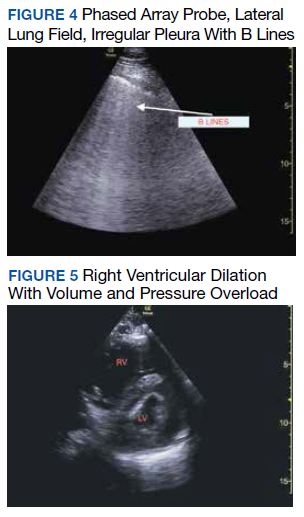
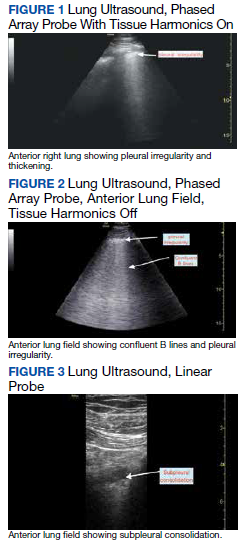
Serial POCUS documented development or progression of RV dilation and dysfunction from the time of ICU admission in 4 of the patients. The presence of B lines with irregular pleura was predictive of a lower arterial pressure of oxygen to fraction of inspired oxygen ratio (PaO2/FiO2) by a value of 71 compared with those without B lines with irregular pleura (P = .005, adjusted R2 = 0.238). All patients with RV dilation had bilateral B lines with pleural irregularities on lung ultrasound. Vascular POCUS detected 4 deep vein thromboses (DVT).7 An arterial thrombus was also detected on focused examination. There was a higher mortality in patients who required mechanical ventilation; however, there was no difference in POCUS characteristics between the groups (Table 2).
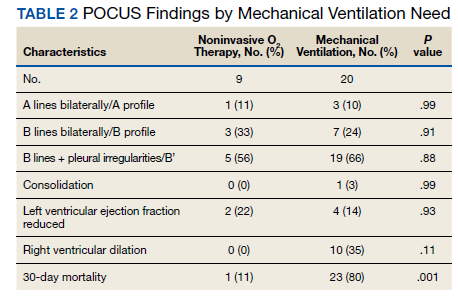
Two severely hypoxemic patients received systemic tissue plasminogen activator (TPA) after findings of massive RV dilation with signs of volume and pressure overload and clinical suspicion of pulmonary embolism (PE). One of these patients also had a popliteal DVT. Both patients were too unstable to transport for additional imaging or therapies. Therapeutic anticoagulation was initiated on 4 patients with positive DVT examinations. In a fifth case an arterial thrombectomy and anticoagulation was required after diminished pulses led to the finding of an occlusive brachial artery thrombus on vascular POCUS.
Discussion
POCUS identified both lung and cardiac features that were associated with worse outcomes. While lung ultrasound abnormalities were very prevalent and associated with worse PaO2 to FiO2 ratios, the presence of RV dilation was associated most clearly with mortality and poor 30-day outcomes in the critical care setting.
Lung ultrasound abnormalities were pervasive in patients with acute respiratory failure and COVID-19. On linear regression we found that presence with bilateral B lines and pleural thickening was predictive of a lower PaO2/FiO2 (coefficient, -70; P = .005). Our study found that B lines with pleural irregularities, otherwise known as a B’ profile per the BLUE protocol, was seen in patients with severe COVID-19. Thus severe acute respiratory failure secondary to COVID-19 has similar lung ultrasound findings as non-COVID-19 acute respiratory distress syndrome (ARDS).4,5 Based on prior lung ultrasound studies in ARDS, lung ultrasound findings can be used as an alternate to chest radiography for the diagnosis of ARDS in COVID-19 and predict the severity of ARDS.9 This has particular implications in overwhelmed and resource poor health care settings.
We found no difference in 30-day mortality based on lung ultrasound findings or profile, probably because of small sample size or because the findings were tabulated as profiles and not differentiated further with lung ultrasound scores.10,11 However, there was a significant difference in RV dilation between the 2 groups by 30 days and its presence was found to be a predictor of mortality even when controlled for hypertension and diabetes mellitus (P = .048) with an OR of 12. RV dysfunction in patients with ARDS on mechanical ventilation ranges from 22 to 25% and is typically associated with high driving pressures.12-14 The mechanism is thought to be multifactorial including hypoxemic vasoconstriction in the pulmonary vasculature in addition to the increased transpulmonary pressure.15 While all of the above are at play in COVID-19 infection, there is reported damage to the pulmonary vascular endothelium and resultant hypercoagulability and thrombosis that further increases the RV afterload.16
While RV strain and dysfunction indices done by an echocardiographer would be ideal, given the surge in infections and hospitalizations and strain on health care resources, POCUS by the treating or examining clinician was considered the only feasible way to screen a large number of patients.17 Identification of RV dilation could influence clinical management including workup for venous thromboembolic disease and optimization of lung protective strategies. Further studies are needed to understand the particular etiology and pathophysiology of COVID-19 associated RV dilation. Given increased thrombosis events in COVID-19 infection we believe a POCUS vascular examination should be included as part of evaluation especially in the presence of increased D-dimers and has been discussed above for its important role in working up RV dilation.18
Limitations
Our study has several limitations. It was retrospective in nature and involved a small group of individuals. There was some variation in POCUS examinations done at the discretion of the examining physician. We did not have a blinded observer independently review all images. Since RV dilation was documented only when RV size approached or exceeded LV size in the apical 4 chamber view representing moderate or severe dilation, we may be underreporting the prevalence in critically ill patients.
Conclusions
POCUS is an invaluable adjunct to clinical evaluation and procedures in patients with severe COVID-19 with the ability to identity patients at risk for worse outcomes. B lines with pleural thickening is a sign of severe ARDS and RV dilatation is predictive of mortality. POCUS should be made available to the treating physician for monitoring and risk stratification and can be incorporated into management algorithms.
Additional point-of-care ultrasound videos.


Acknowledgments
We thank frontline healthcare workers and intensive care unit staff of the US Department of Veterans Affairs New York Harbor Healthcare System (NYHHS) for their dedication to the care of veterans and civilians during the COVID-19 pandemic in New York City. The authors acknowledge the NYHHS research and development committee and administration for their support.
1. Cardenas-Garcia J, Mayo PH. Bedside ultrasonography for the intensivist. Crit Care Clin. 2015;31(1):43-66. doi:10.1016/j.ccc.2014.08.003
2. Vetrugno L, Baciarello M, Bignami E, et al. The “pandemic” increase in lung ultrasound use in response to Covid-19: can we complement computed tomography findings? A narrative review. Ultrasound J. 2020;12(1):39. Published 2020 Aug 17. doi:10.1186/s13089-020-00185-4
3. Hussain A, Via G, Melniker L, et al. Multi-organ point-of-care ultrasound for COVID-19 (PoCUS4COVID): international expert consensus. Crit Care. 2020;24(1):702. Published 2020 Dec 24. doi:10.1186/s13054-020-03369-5
4. Lichtenstein DA, Mezière GA. Relevance of lung ultrasound in the diagnosis of acute respiratory failure: the BLUE protocol [published correction appears in Chest. 2013 Aug;144(2):721]. Chest. 2008;134(1):117-125. doi:10.1378/chest.07-2800
5. Volpicelli G, Elbarbary M, Blaivas M, et al. International evidence-based recommendations for point-of-care lung ultrasound. Intensive Care Med. 2012;38(4):577-591. doi:10.1007/s00134-012-2513-4
6. Narasimhan M, Koenig SJ, Mayo PH. Advanced echocardiography for the critical care physician: part 1. Chest. 2014;145(1):129-134. doi:10.1378/chest.12-2441
7. Kory PD, Pellecchia CM, Shiloh AL, Mayo PH, DiBello C, Koenig S. Accuracy of ultrasonography performed by critical care physicians for the diagnosis of DVT. Chest. 2011;139(3):538-542. doi:10.1378/chest.10-1479
8. Bentzer P, Griesdale DE, Boyd J, MacLean K, Sirounis D, Ayas NT. Will this hemodynamically unstable patient respond to a bolus of intravenous fluids? JAMA. 2016;316(12):1298-1309. doi:10.1001/jama.2016.12310
9. See KC, Ong V, Tan YL, Sahagun J, Taculod J. Chest radiography versus lung ultrasound for identification of acute respiratory distress syndrome: a retrospective observational study. Crit Care. 2018;22(1):203. Published 2018 Aug 18. doi:10.1186/s13054-018-2105-y
10. Deng Q, Zhang Y, Wang H, et al. Semiquantitative lung ultrasound scores in the evaluation and follow-up of critically ill patients with COVID-19: a single-center study. Acad Radiol. 2020;27(10):1363-1372. doi:10.1016/j.acra.2020.07.002
11. Brahier T, Meuwly JY, Pantet O, et al. Lung ultrasonography for risk stratification in patients with COVID-19: a prospective observational cohort study [published online ahead of print, 2020 Sep 17]. Clin Infect Dis. 2020;ciaa1408. doi:10.1093/cid/ciaa1408
12. Vieillard-Baron A, Schmitt JM, Augarde R, et al. Acute cor pulmonale in acute respiratory distress syndrome submitted to protective ventilation: incidence, clinical implications, and prognosis [published correction appears in Crit Care Med. 2002 Mar;30(3):726]. Crit Care Med. 2001;29(8):1551-1555. doi:10.1097/00003246-200108000-00009
13. Boissier F, Katsahian S, Razazi K, et al. Prevalence and prognosis of cor pulmonale during protective ventilation for acute respiratory distress syndrome. Intensive Care Med. 2013;39(10):1725-1733. doi:10.1007/s00134-013-2941-9
14. Jardin F, Vieillard-Baron A. Is there a safe plateau pressure in ARDS? The right heart only knows. Intensive Care Med. 2007;33(3):444-447. doi:10.1007/s00134-007-0552-z
15. Repessé X, Vieillard-Baron A. Right heart function during acute respiratory distress syndrome. Ann Transl Med 2017;5(14):295. doi:10.21037/atm.2017.06.66
16. Abou-Ismail MY, Diamond A, Kapoor S, Arafah Y, Nayak L. The hypercoagulable state in COVID-19: Incidence, pathophysiology, and management [published correction appears in Thromb Res. 2020 Nov 26]. Thromb Res. 2020;194:101-115. doi:10.1016/j.thromres.2020.06.029
17. Kim J, Volodarskiy A, Sultana R, et al. Prognostic utility of right ventricular remodeling over conventional risk stratification in patients with COVID-19. J Am Coll Cardiol. 2020;76(17):1965-1977. doi:10.1016/j.jacc.2020.08.066
18. Al-Samkari H, Karp Leaf RS, Dzik WH, et al. COVID-19 and coagulation: bleeding and thrombotic manifestations of SARS-CoV-2 infection. Blood. 2020;136(4):489-500. doi:10.1182/blood.2020006520
Point-of-care ultrasound (POCUS) is increasingly being used by critical care physicians to augment the physical examination and guide clinical decision making, and several protocols have been established to standardize the POCUS evaluation.1 During the COVID-19 pandemic, POCUS has been a valuable tool as standard imaging techniques were used judiciously to minimize exposure of personnel and use of personal protective equipment (PPE).2
In the US Department of Veterans Affairs (VA) New York Harbor Healthcare System (VANYHHS) intensive care unit (ICU) on initial clinical examination included POCUS, which was helpful to examine deep vein thromboses, cardiac function, and the presence and extent of pneumonia. An international expert consensus on the use of POCUS for COVID-19 published in December 2020 called for further studies defining the role of lung and cardiac ultrasound in risk stratification, outcomes, and clinical management.3
The objective of this study was to review POCUS findings and correlate them with severity of illness and 30-day outcomes in critically ill patients with COVID-19.
Methods
The study was submitted to and reviewed by the VANYHHS Research and Development committee and study approval and informed consent waiver was granted. The study was a retrospective chart review of patients admitted to the VANYHHS ICU between March and April 2020, a tertiary health care center designated as a COVID-19 hospital.
Patients admitted to the ICU aged > 18 years with a diagnosis of acute hypoxemic respiratory failure, diagnosis of COVID-19, and documentation of POCUS findings in the chart were included in the study. A patient was considered to have a COVID-19 diagnosis following a positive SARS-CoV-2 polymerase chain reaction test documented in the electronic health record (EHR). Acute respiratory failure was defined as hypoxemia < 94% and the need for either supplemental oxygen by nasal cannula > 2 L/min, high flow nasal cannula, noninvasive ventilation, or mechanical ventilation.
To minimize personnel exposure, initial patient evaluations and POCUS examinations were performed by the most senior personnel (ie, fellowship trained, board-certified pulmonary critical care attending physicians or pulmonary and critical care fellowship trainees). Three members of the team had certification in advanced critical care echocardiography by the National Board of Echocardiography and oversaw POCUS imaging. POCUS examinations were performed with a GE Heathcare Venue POCUS or handheld unit. After use, ultrasound probes and ultrasound units were disinfected with wipes designated by the manufacturer and US Environmental Protection Agency for use during the COVID-19 pandemic.
The POCUS protocol used by members of the team was as follows: POCUS lung—at least 2 anterior fields and 1 posterior/lateral field looking at the costophrenic angle on each hemithorax with a phased array or curvilinear probe. A linear probe was used to look for subpleural changes per physician discretion.4,5 Lung ultrasound findings in anterior lung fields were documented as A lines, B lines (as defined by the bedside lung ultrasound in emergency [BLUE] protocol)anterior pleural abnormalities or consolidations.4,5 The costophrenic point findings were documented as presence of consolidation or pleural effusion.
The POCUS cardiac examination consisted of parasternal long and short axis views, apical 4 chamber view, subcostal and inferior vena cava (IVC) view. Left ventricular (LV) ejection fraction was visually estimated as reduced or normal. Right ventricular (RV) dilation was considered present if RV size approached or exceeded LV size in the apical 4 chamber view. RV dysfunction was considered present if in addition there was flattening of interventricular septum, RV free wall hypokinesis or reduced tricuspid annular plane systolic excursion (TAPSE).6 IVC was documented as collapsible or plethoric by size and respirophasic variability (2 cm and 50%). Other POCUS examinations including venous compression were done at the discretion of the treating physician.7 POCUS was also used for the placement of central and arterial lines and to guide fluid management.8
The VA EHR and Venue image local archives were reviewed for patient demographics, laboratory findings, imaging studies and outcomes. All ICU attending physician and fellow notes were reviewed for POCUS lung, cardiac and vascular findings. The chart was also reviewed for management changes as a result of POCUS findings. Patients who had at minimum a POCUS lung or cardiac examination documented in the EHR were included in the study. For patients with serial POCUS the most severe findings were included.
Patients were divided into 2 groups based on 30-day outcome: discharge home vs mortality for comparison. POCUS findings were also compared by need for mechanical ventilation. Patients still hospitalized or transferred to other facilities were excluded from the analysis. A Student t test was used for comparison between the groups for continuous normally distributed variables. Linear and stepwise regression models were used to evaluate univariate and multivariate associations of baseline characteristics, biomarker, and ultrasound findings with patient outcomes. Analyses were performed using R 4.0.2 statistical software.
Results
Eighty-two patients were admitted to the VANYHHS ICU in March and April 2020, including 12 nonveterans. Sixty-four had COVID-19 and acute respiratory failure. POCUS findings were documented in 43 (67%) patients. Thirty-nine patients had documented lung examinations, and 25 patients had documented cardiac examinations. Patients were divided into 2 groups by 30-day outcome (discharge home vs mortality) for statistical analysis. Five patients who were either still hospitalized or had been transferred to another facility were excluded.
Baseline characteristics of patients included in the study stratified by 30-day outcomes are shown in Table 1. The study group was predominantly male (95%). Patients with poor 30-day outcomes were older, had higher white blood cell counts, more severe hypoxemia, higher rates of mechanical ventilation and RV dilation (Figures 1, 2, 3, 4, and 5). RV dilation was an independent predictor of mortality (odds ratio [OR], 12.0; P = .048).
Serial POCUS documented development or progression of RV dilation and dysfunction from the time of ICU admission in 4 of the patients. The presence of B lines with irregular pleura was predictive of a lower arterial pressure of oxygen to fraction of inspired oxygen ratio (PaO2/FiO2) by a value of 71 compared with those without B lines with irregular pleura (P = .005, adjusted R2 = 0.238). All patients with RV dilation had bilateral B lines with pleural irregularities on lung ultrasound. Vascular POCUS detected 4 deep vein thromboses (DVT).7 An arterial thrombus was also detected on focused examination. There was a higher mortality in patients who required mechanical ventilation; however, there was no difference in POCUS characteristics between the groups (Table 2).
Two severely hypoxemic patients received systemic tissue plasminogen activator (TPA) after findings of massive RV dilation with signs of volume and pressure overload and clinical suspicion of pulmonary embolism (PE). One of these patients also had a popliteal DVT. Both patients were too unstable to transport for additional imaging or therapies. Therapeutic anticoagulation was initiated on 4 patients with positive DVT examinations. In a fifth case an arterial thrombectomy and anticoagulation was required after diminished pulses led to the finding of an occlusive brachial artery thrombus on vascular POCUS.
Discussion
POCUS identified both lung and cardiac features that were associated with worse outcomes. While lung ultrasound abnormalities were very prevalent and associated with worse PaO2 to FiO2 ratios, the presence of RV dilation was associated most clearly with mortality and poor 30-day outcomes in the critical care setting.
Lung ultrasound abnormalities were pervasive in patients with acute respiratory failure and COVID-19. On linear regression we found that presence with bilateral B lines and pleural thickening was predictive of a lower PaO2/FiO2 (coefficient, -70; P = .005). Our study found that B lines with pleural irregularities, otherwise known as a B’ profile per the BLUE protocol, was seen in patients with severe COVID-19. Thus severe acute respiratory failure secondary to COVID-19 has similar lung ultrasound findings as non-COVID-19 acute respiratory distress syndrome (ARDS).4,5 Based on prior lung ultrasound studies in ARDS, lung ultrasound findings can be used as an alternate to chest radiography for the diagnosis of ARDS in COVID-19 and predict the severity of ARDS.9 This has particular implications in overwhelmed and resource poor health care settings.
We found no difference in 30-day mortality based on lung ultrasound findings or profile, probably because of small sample size or because the findings were tabulated as profiles and not differentiated further with lung ultrasound scores.10,11 However, there was a significant difference in RV dilation between the 2 groups by 30 days and its presence was found to be a predictor of mortality even when controlled for hypertension and diabetes mellitus (P = .048) with an OR of 12. RV dysfunction in patients with ARDS on mechanical ventilation ranges from 22 to 25% and is typically associated with high driving pressures.12-14 The mechanism is thought to be multifactorial including hypoxemic vasoconstriction in the pulmonary vasculature in addition to the increased transpulmonary pressure.15 While all of the above are at play in COVID-19 infection, there is reported damage to the pulmonary vascular endothelium and resultant hypercoagulability and thrombosis that further increases the RV afterload.16
While RV strain and dysfunction indices done by an echocardiographer would be ideal, given the surge in infections and hospitalizations and strain on health care resources, POCUS by the treating or examining clinician was considered the only feasible way to screen a large number of patients.17 Identification of RV dilation could influence clinical management including workup for venous thromboembolic disease and optimization of lung protective strategies. Further studies are needed to understand the particular etiology and pathophysiology of COVID-19 associated RV dilation. Given increased thrombosis events in COVID-19 infection we believe a POCUS vascular examination should be included as part of evaluation especially in the presence of increased D-dimers and has been discussed above for its important role in working up RV dilation.18
Limitations
Our study has several limitations. It was retrospective in nature and involved a small group of individuals. There was some variation in POCUS examinations done at the discretion of the examining physician. We did not have a blinded observer independently review all images. Since RV dilation was documented only when RV size approached or exceeded LV size in the apical 4 chamber view representing moderate or severe dilation, we may be underreporting the prevalence in critically ill patients.
Conclusions
POCUS is an invaluable adjunct to clinical evaluation and procedures in patients with severe COVID-19 with the ability to identity patients at risk for worse outcomes. B lines with pleural thickening is a sign of severe ARDS and RV dilatation is predictive of mortality. POCUS should be made available to the treating physician for monitoring and risk stratification and can be incorporated into management algorithms.
Additional point-of-care ultrasound videos.
Acknowledgments
We thank frontline healthcare workers and intensive care unit staff of the US Department of Veterans Affairs New York Harbor Healthcare System (NYHHS) for their dedication to the care of veterans and civilians during the COVID-19 pandemic in New York City. The authors acknowledge the NYHHS research and development committee and administration for their support.
1. Cardenas-Garcia J, Mayo PH. Bedside ultrasonography for the intensivist. Crit Care Clin. 2015;31(1):43-66. doi:10.1016/j.ccc.2014.08.003
2. Vetrugno L, Baciarello M, Bignami E, et al. The “pandemic” increase in lung ultrasound use in response to Covid-19: can we complement computed tomography findings? A narrative review. Ultrasound J. 2020;12(1):39. Published 2020 Aug 17. doi:10.1186/s13089-020-00185-4
3. Hussain A, Via G, Melniker L, et al. Multi-organ point-of-care ultrasound for COVID-19 (PoCUS4COVID): international expert consensus. Crit Care. 2020;24(1):702. Published 2020 Dec 24. doi:10.1186/s13054-020-03369-5
4. Lichtenstein DA, Mezière GA. Relevance of lung ultrasound in the diagnosis of acute respiratory failure: the BLUE protocol [published correction appears in Chest. 2013 Aug;144(2):721]. Chest. 2008;134(1):117-125. doi:10.1378/chest.07-2800
5. Volpicelli G, Elbarbary M, Blaivas M, et al. International evidence-based recommendations for point-of-care lung ultrasound. Intensive Care Med. 2012;38(4):577-591. doi:10.1007/s00134-012-2513-4
6. Narasimhan M, Koenig SJ, Mayo PH. Advanced echocardiography for the critical care physician: part 1. Chest. 2014;145(1):129-134. doi:10.1378/chest.12-2441
7. Kory PD, Pellecchia CM, Shiloh AL, Mayo PH, DiBello C, Koenig S. Accuracy of ultrasonography performed by critical care physicians for the diagnosis of DVT. Chest. 2011;139(3):538-542. doi:10.1378/chest.10-1479
8. Bentzer P, Griesdale DE, Boyd J, MacLean K, Sirounis D, Ayas NT. Will this hemodynamically unstable patient respond to a bolus of intravenous fluids? JAMA. 2016;316(12):1298-1309. doi:10.1001/jama.2016.12310
9. See KC, Ong V, Tan YL, Sahagun J, Taculod J. Chest radiography versus lung ultrasound for identification of acute respiratory distress syndrome: a retrospective observational study. Crit Care. 2018;22(1):203. Published 2018 Aug 18. doi:10.1186/s13054-018-2105-y
10. Deng Q, Zhang Y, Wang H, et al. Semiquantitative lung ultrasound scores in the evaluation and follow-up of critically ill patients with COVID-19: a single-center study. Acad Radiol. 2020;27(10):1363-1372. doi:10.1016/j.acra.2020.07.002
11. Brahier T, Meuwly JY, Pantet O, et al. Lung ultrasonography for risk stratification in patients with COVID-19: a prospective observational cohort study [published online ahead of print, 2020 Sep 17]. Clin Infect Dis. 2020;ciaa1408. doi:10.1093/cid/ciaa1408
12. Vieillard-Baron A, Schmitt JM, Augarde R, et al. Acute cor pulmonale in acute respiratory distress syndrome submitted to protective ventilation: incidence, clinical implications, and prognosis [published correction appears in Crit Care Med. 2002 Mar;30(3):726]. Crit Care Med. 2001;29(8):1551-1555. doi:10.1097/00003246-200108000-00009
13. Boissier F, Katsahian S, Razazi K, et al. Prevalence and prognosis of cor pulmonale during protective ventilation for acute respiratory distress syndrome. Intensive Care Med. 2013;39(10):1725-1733. doi:10.1007/s00134-013-2941-9
14. Jardin F, Vieillard-Baron A. Is there a safe plateau pressure in ARDS? The right heart only knows. Intensive Care Med. 2007;33(3):444-447. doi:10.1007/s00134-007-0552-z
15. Repessé X, Vieillard-Baron A. Right heart function during acute respiratory distress syndrome. Ann Transl Med 2017;5(14):295. doi:10.21037/atm.2017.06.66
16. Abou-Ismail MY, Diamond A, Kapoor S, Arafah Y, Nayak L. The hypercoagulable state in COVID-19: Incidence, pathophysiology, and management [published correction appears in Thromb Res. 2020 Nov 26]. Thromb Res. 2020;194:101-115. doi:10.1016/j.thromres.2020.06.029
17. Kim J, Volodarskiy A, Sultana R, et al. Prognostic utility of right ventricular remodeling over conventional risk stratification in patients with COVID-19. J Am Coll Cardiol. 2020;76(17):1965-1977. doi:10.1016/j.jacc.2020.08.066
18. Al-Samkari H, Karp Leaf RS, Dzik WH, et al. COVID-19 and coagulation: bleeding and thrombotic manifestations of SARS-CoV-2 infection. Blood. 2020;136(4):489-500. doi:10.1182/blood.2020006520
Provider Perceptions of Opioid Safety Measures in VHA Emergency Departments and Urgent Care Centers
The United States is facing an opioid crisis in which approximately 10 million people have misused opioids in the past year, and an estimated 2 million people have an opioid use disorder (OUD).1 Compared with the general population, veterans treated in the Veterans Health Administration (VHA) facilities are at nearly twice the risk for accidental opioid overdose.2 The implementation of opioid safety measures in VHA facilities across all care settings is a priority in addressing this public health crisis. Hence, VHA leadership is working to minimize veteran risk of fatal opioid overdoses and to increase veteran access to medication-assisted treatments (MAT) for OUD.3
Since the administration of our survey, the VHA has shifted to using the term medication for opioid use disorder (MOUD) instead of MAT for OUD. However, for consistency with the survey we distributed, we use MAT in this analysis.
Acute care settings represent an opportunity to offer appropriate opioid care and treatment options to patients at risk for OUD or opioid-related overdose. VHA facilities offer 2 outpatient acute care settings for emergent ambulatory care: emergency departments (EDs) and urgent care centers (UCCs). Annually, these settings see an estimated 2.5 million patients each year, making EDs and UCCs critical access points of OUD care for veterans. Partnering with key national VHA stakeholders from Pharmacy Benefits Management (PBM), the Office of Emergency Medicine, and Academic Detailing Services (ADS), we developed the Emergency Department Opioid Safety Initiative (ED OSI) aimed at implementing and evaluating opioid safety measures in VHA outpatient acute care settings.
The US Department of Veterans Affairs (VA)/Department of Defense (DoD) Clinical Practice Guidelines for Opioid Therapy for Chronic Pain (CPG) makes recommendations for the initiation and continuation of opioids, risk mitigation, taper of opioids, and opioid therapy for acute pain in VHA facilities.4 Using these recommendations, we developed the broad aims of the ED OSI quality improvement (QI) program. The CPG is clear about the prioritization of safe opioid prescribing practices. New opioid prescriptions written in the ED have been associated with continued and chronic opioid use.5 At the time of prescription, patients not currently and chronically on opioids who receive more than a 3-day supply are at increased risk of becoming long-term opioid users.6 Given the annual volume of patients seen, VHA ED/UCCs are a crucial area for implementing better opioid prescribing practices.
The CPG also includes recommendations for the prescribing or coprescribing of naloxone rescue kits. The administration of naloxone following opioid overdose has been found to be an effective measure against fatal overdose. Increasing provider awareness of common risk factors for opioid-related overdose (eg, frequent ED visits or hospitalizations) helps facilitate a discussion on naloxone prescribing at discharge. Prior studies provide evidence that naloxone distribution and accompanying education also are effective in reducing opioid overdose mortalityand ED visits related to adverse opioid-related events.7,8
Similarly, the guidelines provide recommendations for the use of MAT for veterans with OUD. MAT for OUD is considered a first-line treatment option for patients with moderate-to-severe OUD. When used to treat patients with unsafe opioid use, this treatment helps alleviate symptoms of withdrawal, which can increase opioid taper adherence and has a protective effect against opioid overdose mortality.9 MAT initiated in the ED can increase patient engagement to addiction services.10
These 3 CPG recommendations serve as the basis for the broad goals of the ED OSI program. We aim to develop, implement, and evaluate programs and initiatives to (aim 1) reduce inappropriate opioid prescribing from VHA EDs; (aim 2) increase naloxone distribution from VHA EDs; and (aim 3) increase access to MAT initiation from VHA EDs through the implementation of ED-based MAT-initiation programs with EDs across the VHA. Aim 1 was a focused and strategic QI effort to implement an ED-based program to reduce inappropriate opioid prescribing. The ED OSI prescribing program offered a 4-step bundled approach: (1) sharing of opioid prescribing dashboard data with ED medical director and academic detailer; (2) education of ED providers and implementation of toolkit resources; (3) academic detailers conduct audit and feedback session(s) with highest prescribers; and (4) quarterly reports of opioid prescribing data to ED providers.
Results from the pilot suggested that our program was associated with accelerating the rate at which ED prescribing rates decreased.11 In addition, the pilot found that ED-based QI initiatives in VHA facilities are a feasible practice. As we work to develop and implement the next 2 phases of the QI program, a major consideration is to identify facilitators and address any existing barriers to the implementation of naloxone distribution (aim 2) and MAT-initiation (aim 3) programs for treatment-naïve patients from VHA EDs. To date, there have been no recent published studies examining the barriers and facilitators to use or implementation of MAT initiation or naloxone distribution in VHA facilities or, more specifically, from VHA EDs.12 As part of our QI program, we set out to better understand VHA ED provider perceptions of barriers and facilitators to implementation of programs aimed at increasing naloxone distribution and initiation of MAT for treatment-naïve patients in the ED.
Methods
This project received a QI designation from the Office of PBM Academic Detailing Service Institutional Review Board at the Edward Hines, Jr. Veterans Affairs Hospital VA Medical Center (VAMC). This designation was reviewed and approved by the Rocky Mountain Regional VAMC Research and Development service. In addition, we received national union approval to disseminate this survey nationally across all VA Integrated Service Networks (VISNs).
Survey
We worked with VHA subject matter experts, key stakeholders, and the VA Collaborative Evaluation Center (VACE) to develop the survey. Subject matter experts and stakeholders included VHA emergency medicine leadership, ADS leadership, and mental health and substance treatment providers. VACE is an interdisciplinary group of mixed-method researchers. The survey questions aimed to capture perceptions and experiences regarding naloxone distribution and new MAT initiation of VHA ED/UCC providers.
We used a variety of survey question formats. Close-ended questions with a predefined list of answer options were used to capture discrete domains, such as demographic information, comfort level, and experience level. To capture health care provider (HCP) perceptions on barriers and facilitators, we used multiple-answer multiple-choice questions. Built into this question format was a free-response option, which allowed respondents to offer additional barriers or facilitators. Respondents also had the option of not answering individual questions.
We identified physicians, nurse practitioners (NPs), and physician assistants (PAs) who saw at least 100 patients in the ED or UCC in at least one 3-month period in the prior year and obtained an email address for each. In total, 2228 ED or UCC providers across 132 facilities were emailed a survey; 1883 (84.5%) were ED providers and 345 (15.5%) were UCC providers.
We used Research Electronic Data Capture (REDCap) software to build and disseminate the survey via email. Surveys were initially disseminated in late January 2019. During the 3-month survey period, recipients received 3 automated email reminders from REDCap to complete the survey. Survey data were exported from REDCap. Results were analyzed using descriptive statistics analyses with Microsoft Excel.
Results
One respondent received the survey in error and was excluded from the analysis. The survey response rate was 16.7%: 372 responses from 103 unique facilities. Each VISN had a mean 20 respondents. The majority of respondents (n = 286, 76.9%) worked in highly complex level 1 facilities characterized by high patient volume and more high-risk patients and were teaching and research facilities. Respondents were asked to describe their most recent ED or UCC role. While 281 respondents (75.5%) were medical doctors, 61 respondents (16.4%) were NPs, 30 (8.1%) were PAs, and 26 (7.0%) were ED/UCC chiefs or medical directors (Table 1). Most respondents (80.4%) reported at least 10 years of health care experience.
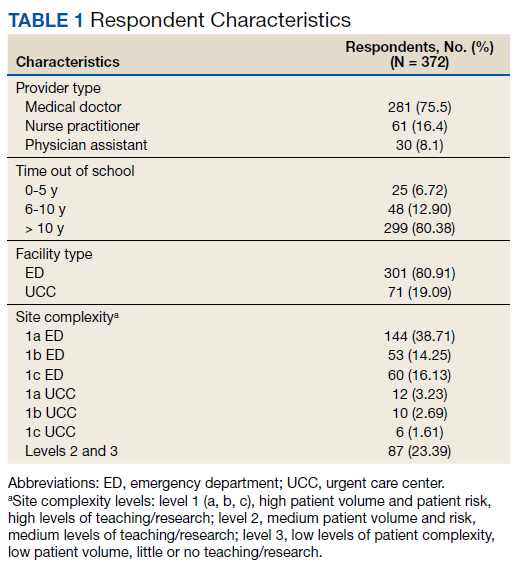
The majority of respondents (72.9%) believed that HCPs at their VHA facility should be prescribing naloxone. When asked to specify which HCPs should be prescribing naloxone, most HCP respondents selected pharmacists (76.4%) and substance abuse providers (71.6%). Less than half of respondents (45.0%) felt that VA ED/UCC providers also should be prescribing naloxone. However, 58.1% of most HCP respondents reported being comfortable or very comfortable with prescribing naloxone to a patient in the ED or UCC who already had an existing prescription of opioids. Similarly, 52.7% of respondents reported being comfortable or very comfortable with coprescribing naloxone when discharging a patient with an opioid prescription from the ED/UCC. Notably, while 36.7% of PAs reported being comfortable/very comfortable coprescribing naloxone, 46.7% reported being comfortable/very comfortable prescribing naloxone to a patient with an existing opioid prescription. Physicians and NPs expressed similar levels of comfort with coprescribing and prescribing naloxone.
Respondents across provider types indicated a number of barriers to prescribing naloxone to medically appropriate patients (Table 2). Many respondents indicated prescribing naloxone was beyond the ED/UCC provider scope of practice (35.2%), followed by the perceived stigma associated with naloxone (33.3%), time required to prescribe naloxone (23.9%), and concern with patient’s ability to use naloxone (22.8%).

Facilitators for prescribing naloxone to medically appropriate patients identified by HCP respondents included pharmacist help and education (44.6%), patient knowledge of medication options (31.7%), societal shift away from opioids for pain management (28.0%), facility leadership (26.9%), and patient interest in safe opioid usage (26.6%) (Table 3). In addition, NPs specifically endorsed

Less than 6.8% of HCP respondents indicated that they were comfortable using MAT. Meanwhile, 42.1% of respondents reported being aware of MAT but not familiar with it, and 23.5% reported that they were unaware of MAT. Correspondingly, 301 of the 372 (88.5%) HCP respondents indicated that they had not prescribed MAT in the past year. Across HCP types, only 24.1% indicated that it is the role of VA ED or UCC providers to prescribe MAT when medically appropriate and subsequently refer patients to substance abuse treatment for follow-up (just 7.1% of PAs endorsed this). Furthermore, 6.5% and 18.8% of HCP respondents indicated that their facility leadership was very supportive and supportive, respectively, of MAT for OUD prescribing.
Barriers to MAT initiation indicated by HCP respondents included limited scope of ED and UCC practice (53.2%), unclear follow-up/referral process (50.3%), time (29.8%), and discomfort (28.2%). Nearly one-third of NPs (27.9%) identified patient willingness/ability as a barrier to MAT initiation (Table 4).
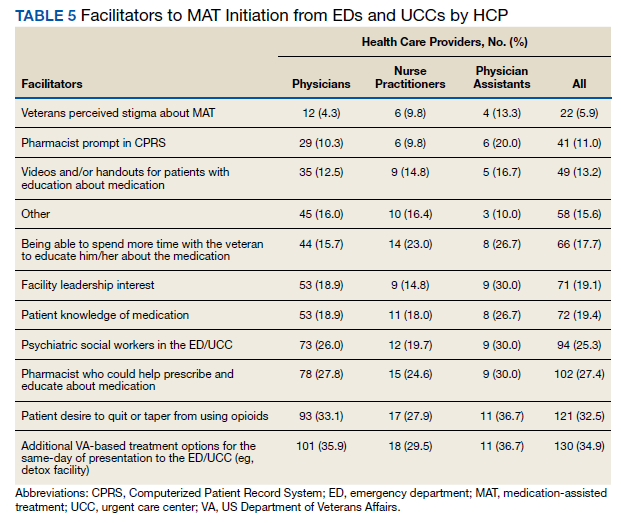

Facilitators of MAT initiation in the ED or UCC included VHA same-day treatment options (34.9%), patient desire (32.5%), pharmacist help/education (27.4%), and psychiatric social workers in the ED or UCC (25.3%). Some NPs (23.0%) and PAs (26.7%) also indicated that having time to educate veterans about the medication would be a facilitator (Table 5). Facility leadership support was considered a facilitator by 30% of PAs.
Discussion
To the best of our knowledge, there have not been any studies examining HCP perceptions of the barriers and facilitators to naloxone distribution or the initiation of MAT in VHA ED and UCCs. Veterans are at an increased risk of overdose when compared with the general population, and increasing access to opioid safety measures (eg, safer prescribing practices, naloxone distribution) and treatment with MAT for OUD across all clinical settings has been a VHA priority.3
National guidance from VHA leadership, the Centers for Disease Control and Prevention (CDC), the US Surgeon General, and the US Department of Health and Human Services (HHS) call for an all-hands-on-deck approach to combatting opioid overdose with naloxone distribution or MAT (such as buprenorphine) initiation.13 VHA ED and UCC settings provide acute outpatient care to patients with medical or psychiatric illnesses or injuries that the patient believes requires emergent or immediate medical attention or for which there is a critical need for treatment to prevent deterioration of the condition or the possible impairment of recovery.14 However, ED and UCC environments are often regarded as settings meant to stabilize a patient until they can be seen by a primary care or long-term care provider.
A major barrier identified by HCPs was that MAT for OUD was outside their ED/UCC scope of practice, which suggests a need for a top-down or peer-to-peer reexamination of the role of HCPs in ED/UCC settings. Any naloxone distribution and/or MAT-initiation program in VHA ED/UCCs should consider education about the role of ED/UCC HCPs in opioid safety and treatment.
Only 25.3% of HCPs reported that their facility leadership was supportive or very supportive of MAT prescribing. This suggests that facility leadership should be engaged in any efforts to implement a MAT-initiation program in the facility’s ED. Engaging leadership in efforts to implement ED-based MAT programs will allow for a better understanding of leadership goals as related to opioid safety and an opportunity to address concerns regarding prescribing MAT in the ED. We recommend engaging facility leadership early in MAT implementation efforts. Respectively, 12.4% and 28.2% of HCP respondents reported discomfort prescribing naloxone or using MAT, suggesting a need for more education. Similarly, only 6.8% of HCPs reported comfort with using MAT.
A consideration for implementing ED/UCC-based MAT should be the inclusion of a training component. An evidence-based clinical treatment pathway that is appropriate to the ED/UCC setting and facility on the administration of MAT also could be beneficial. A clinical treatment pathway that includes ED/UCC-initiated discharge recommendations would address HCP concerns of unclear follow-up plans and system for referral of care. To this end, a key implementation task is coordinating with other outpatient services (eg, pain management clinic, substance use disorder treatment clinic) equipped for long-term patient follow-up to develop a system for referral of care. For example, as part of the clinical treatment pathway, an ED can develop a system of referral for patients initiated on MAT in the ED in which patients are referred for follow-up at the facility’s substance use disorder treatment clinic to be seen within 72 hours to continue the administration of MAT (such as buprenorphine).
In addition to HCP education, results suggest that patient/veteran education regarding naloxone and/or MAT should be considered. HCPs indicated that having help from a pharmacist to educate the patient about the medications would be a facilitator to naloxone distribution and MAT initiation. Similarly, patient knowledge of the medications also was endorsed as a facilitator. As such, a consideration for any future ED/UCC-based naloxone distribution or MAT-initiation programs in the VHA should be patient education whether by a clinically trained professional or an educational campaign for veterans.
Expanded naloxone distribution and initiation of MAT for OUD for EDs/UCCs across the VHA could impact the lives of veterans on long-term opioid therapy, with OUD, or who are otherwise at risk for opioid overdose. Steps taken to address the barriers and leverage the facilitators identified by HCP respondents can greatly reduce current obstacles to widespread implementation of ED/UCC-based naloxone distribution and MAT initiation nationally within the VHA.
Limitations
This survey had a low response rate (16.7%). One potential explanation for the low response rate is that when the survey was deployed, many of the VHA ED/UCC physicians were per-diem employees. Per-diem physicians may be less engaged and aware of site facilitators or barriers to naloxone and MAT prescribing. This, too, may have potentially skewed the collected data. However, the survey did not ask HCPs to disclose their employment status; thus, exact rates of per diem respondents are unknown.
We aimed to capture only self-perceived barriers to prescribing naloxone and MAT in the ED, but we did not capture or measure HCP respondent’s actual prescribing rates of MAT or naloxone. Understanding HCP perceptions of naloxone distribution and MAT initiation in the ED may have been further informed by comparing HCP responses to their actual clinical practice as related to their prescribing of these medications. In future research, we will link HCPs with the actual numbers of naloxone and MAT medications prescribed. Additionally, we do not know how many of these barriers or proposed facilitators will impact clinical practice.
Conclusions
A key aim for VHA leadership is to increase veteran access to naloxone distribution and MAT for OUD across clinical areas. The present study aimed to identify HCP perceptions of barriers and facilitators to the naloxone distribution and MAT-initiation programs in VHA ED/UCCs to inform the development of a targeted QI program to implement these opioid safety measures. Although the survey yielded a low response rate, results allowed us to identify important action items for our QI program, such as the development of clear protocols, follow-up plans, and systems for referral of care and HCP educational materials related to MAT and naloxone. We hope this work will serve as the basis for ED/UCC-tailored programs that can provide customized educational programs for HCPs designed to overcome known barriers to naloxone and MAT initiation.
Acknowledgments
This work was supported by the VA Office of Specialty Care Services 10P11 and through funding provided by the Comprehensive Addiction and Recovery Act (CARA).
1. Substance Abuse and Mental Health Services Administration. Key substance use and mental health indicators in the united states: results from the 2018 National Survey on Drug Use and Health. Published August 2019. Accessed August 20, 2021. https://www.samhsa.gov/data/sites/default/files/cbhsq-reports/NSDUHNationalFindingsReport2018/NSDUHNationalFindingsReport2018.pdf
2. Bohnert AS, Ilgen MA, Galea S, McCarthy JF, Blow FC. Accidental poisoning mortality among patients in the Department of Veterans Affairs Health System. Med Care. 2011;49(4):393-396. doi:10.1097/MLR.0b013e318202aa27
3. US Department of Veterans Affairs, Pharmacy Benefits Management Service. Recommendations for issuing naloxone rescue for the VA opioid overdose education and naloxone distribution (OEND) program. Published August 2016. Accessed August 20, 2021. https://www.pbm.va.gov/PBM/clinicalguidance/clinicalrecommendations/Naloxone_HCl_Rescue_Kits_Recommendations_for_Use.pdf
4. US Department of Defense, US Department of Veterans Affairs, Opioid Therapy for Chronic Pain Work Group. VA/DoD clinical practice guideline for opioid therapy for chronic pain. Published February 2017. Accessed August 20, 2021. https://www.va.gov/HOMELESS/nchav/resources/docs/mental-health/substance-abuse/VA_DoD-CLINICAL-PRACTICE-GUIDELINE-FOR-OPIOID-THERAPY-FOR-CHRONIC-PAIN-508.pdf
5. Barnett ML, Olenski AR, Jena AB. Opioid-prescribing patterns of emergency physicians and risk of long-term use. N Engl J Med. 2017;376(7):663-673. doi:10.1056/NEJMsa1610524
6. Shah A, Hayes CJ, Martin BC. Characteristics of initial prescription episodes and likelihood of long-term opioid use - United States, 2006-2015. MMWR Morb Mortal Wkly Rep. 2017;66(10):265-269. Published 2017 Mar 17. doi:10.15585/mmwr.mm6610a1
7. Clark AK, Wilder CM, Winstanley EL. A systematic review of community opioid overdose prevention and naloxone distribution programs. J Addict Med. 2014;8(3):153-163. doi:10.1097/ADM.0000000000000034
8. Coffin PO, Behar E, Rowe C, et al. Nonrandomized intervention study of naloxone coprescription for primary care patients receiving long-term opioid therapy for Pain. Ann Intern Med. 2016;165(4):245-252. doi:10.7326/M15-2771
9. Ma J, Bao YP, Wang RJ, et al. Effects of medication-assisted treatment on mortality among opioids users: a systematic review and meta-analysis. Mol Psychiatry. 2019;24(12):1868-1883. doi:10.1038/s41380-018-0094-5
10. D’Onofrio G, O’Connor PG, Pantalon MV, et al. Emergency department-initiated buprenorphine/naloxone treatment for opioid dependence: a randomized clinical trial. JAMA. 2015;313(16):1636-1644. doi:10.1001/jama.2015.3474
11. Dieujuste N, Johnson-Koenke R, Christopher M, et al. Feasibility study of a quasi-experimental regional opioid safety prescribing program in Veterans Health Administration emergency departments. Acad Emerg Med. 2020;27(8):734-741. doi:10.1111/acem.13980
12. Mackey K, Veazie S, Anderson J, Bourne D, Peterson K. Evidence brief: barriers and facilitators to use of medications for opioid use disorder. Published July 2017. Accessed August 20, 2021. http://www.ncbi.nlm.nih.gov/books/NBK549203/
13. US Department of Health and Human Services, Office of the Surgeon General. Naloxone: the opioid reversal drug that saves lives. Published December 2018. Accessed August 20, 2021. https://www.hhs.gov/opioids/sites/default/files/2018-12/naloxone-coprescribing-guidance.pdf
14. US Department of Veterans Affairs, Veterans Health Administration. Chapter 256: Emergency department (ED) and urgent care clinic (UCC). Updated October 3, 2016. Accessed August 20, 2021. https://www.cfm.va.gov/til/space/spChapter256.pdf.
The United States is facing an opioid crisis in which approximately 10 million people have misused opioids in the past year, and an estimated 2 million people have an opioid use disorder (OUD).1 Compared with the general population, veterans treated in the Veterans Health Administration (VHA) facilities are at nearly twice the risk for accidental opioid overdose.2 The implementation of opioid safety measures in VHA facilities across all care settings is a priority in addressing this public health crisis. Hence, VHA leadership is working to minimize veteran risk of fatal opioid overdoses and to increase veteran access to medication-assisted treatments (MAT) for OUD.3
Since the administration of our survey, the VHA has shifted to using the term medication for opioid use disorder (MOUD) instead of MAT for OUD. However, for consistency with the survey we distributed, we use MAT in this analysis.
Acute care settings represent an opportunity to offer appropriate opioid care and treatment options to patients at risk for OUD or opioid-related overdose. VHA facilities offer 2 outpatient acute care settings for emergent ambulatory care: emergency departments (EDs) and urgent care centers (UCCs). Annually, these settings see an estimated 2.5 million patients each year, making EDs and UCCs critical access points of OUD care for veterans. Partnering with key national VHA stakeholders from Pharmacy Benefits Management (PBM), the Office of Emergency Medicine, and Academic Detailing Services (ADS), we developed the Emergency Department Opioid Safety Initiative (ED OSI) aimed at implementing and evaluating opioid safety measures in VHA outpatient acute care settings.
The US Department of Veterans Affairs (VA)/Department of Defense (DoD) Clinical Practice Guidelines for Opioid Therapy for Chronic Pain (CPG) makes recommendations for the initiation and continuation of opioids, risk mitigation, taper of opioids, and opioid therapy for acute pain in VHA facilities.4 Using these recommendations, we developed the broad aims of the ED OSI quality improvement (QI) program. The CPG is clear about the prioritization of safe opioid prescribing practices. New opioid prescriptions written in the ED have been associated with continued and chronic opioid use.5 At the time of prescription, patients not currently and chronically on opioids who receive more than a 3-day supply are at increased risk of becoming long-term opioid users.6 Given the annual volume of patients seen, VHA ED/UCCs are a crucial area for implementing better opioid prescribing practices.
The CPG also includes recommendations for the prescribing or coprescribing of naloxone rescue kits. The administration of naloxone following opioid overdose has been found to be an effective measure against fatal overdose. Increasing provider awareness of common risk factors for opioid-related overdose (eg, frequent ED visits or hospitalizations) helps facilitate a discussion on naloxone prescribing at discharge. Prior studies provide evidence that naloxone distribution and accompanying education also are effective in reducing opioid overdose mortalityand ED visits related to adverse opioid-related events.7,8
Similarly, the guidelines provide recommendations for the use of MAT for veterans with OUD. MAT for OUD is considered a first-line treatment option for patients with moderate-to-severe OUD. When used to treat patients with unsafe opioid use, this treatment helps alleviate symptoms of withdrawal, which can increase opioid taper adherence and has a protective effect against opioid overdose mortality.9 MAT initiated in the ED can increase patient engagement to addiction services.10
These 3 CPG recommendations serve as the basis for the broad goals of the ED OSI program. We aim to develop, implement, and evaluate programs and initiatives to (aim 1) reduce inappropriate opioid prescribing from VHA EDs; (aim 2) increase naloxone distribution from VHA EDs; and (aim 3) increase access to MAT initiation from VHA EDs through the implementation of ED-based MAT-initiation programs with EDs across the VHA. Aim 1 was a focused and strategic QI effort to implement an ED-based program to reduce inappropriate opioid prescribing. The ED OSI prescribing program offered a 4-step bundled approach: (1) sharing of opioid prescribing dashboard data with ED medical director and academic detailer; (2) education of ED providers and implementation of toolkit resources; (3) academic detailers conduct audit and feedback session(s) with highest prescribers; and (4) quarterly reports of opioid prescribing data to ED providers.
Results from the pilot suggested that our program was associated with accelerating the rate at which ED prescribing rates decreased.11 In addition, the pilot found that ED-based QI initiatives in VHA facilities are a feasible practice. As we work to develop and implement the next 2 phases of the QI program, a major consideration is to identify facilitators and address any existing barriers to the implementation of naloxone distribution (aim 2) and MAT-initiation (aim 3) programs for treatment-naïve patients from VHA EDs. To date, there have been no recent published studies examining the barriers and facilitators to use or implementation of MAT initiation or naloxone distribution in VHA facilities or, more specifically, from VHA EDs.12 As part of our QI program, we set out to better understand VHA ED provider perceptions of barriers and facilitators to implementation of programs aimed at increasing naloxone distribution and initiation of MAT for treatment-naïve patients in the ED.
Methods
This project received a QI designation from the Office of PBM Academic Detailing Service Institutional Review Board at the Edward Hines, Jr. Veterans Affairs Hospital VA Medical Center (VAMC). This designation was reviewed and approved by the Rocky Mountain Regional VAMC Research and Development service. In addition, we received national union approval to disseminate this survey nationally across all VA Integrated Service Networks (VISNs).
Survey
We worked with VHA subject matter experts, key stakeholders, and the VA Collaborative Evaluation Center (VACE) to develop the survey. Subject matter experts and stakeholders included VHA emergency medicine leadership, ADS leadership, and mental health and substance treatment providers. VACE is an interdisciplinary group of mixed-method researchers. The survey questions aimed to capture perceptions and experiences regarding naloxone distribution and new MAT initiation of VHA ED/UCC providers.
We used a variety of survey question formats. Close-ended questions with a predefined list of answer options were used to capture discrete domains, such as demographic information, comfort level, and experience level. To capture health care provider (HCP) perceptions on barriers and facilitators, we used multiple-answer multiple-choice questions. Built into this question format was a free-response option, which allowed respondents to offer additional barriers or facilitators. Respondents also had the option of not answering individual questions.
We identified physicians, nurse practitioners (NPs), and physician assistants (PAs) who saw at least 100 patients in the ED or UCC in at least one 3-month period in the prior year and obtained an email address for each. In total, 2228 ED or UCC providers across 132 facilities were emailed a survey; 1883 (84.5%) were ED providers and 345 (15.5%) were UCC providers.
We used Research Electronic Data Capture (REDCap) software to build and disseminate the survey via email. Surveys were initially disseminated in late January 2019. During the 3-month survey period, recipients received 3 automated email reminders from REDCap to complete the survey. Survey data were exported from REDCap. Results were analyzed using descriptive statistics analyses with Microsoft Excel.
Results
One respondent received the survey in error and was excluded from the analysis. The survey response rate was 16.7%: 372 responses from 103 unique facilities. Each VISN had a mean 20 respondents. The majority of respondents (n = 286, 76.9%) worked in highly complex level 1 facilities characterized by high patient volume and more high-risk patients and were teaching and research facilities. Respondents were asked to describe their most recent ED or UCC role. While 281 respondents (75.5%) were medical doctors, 61 respondents (16.4%) were NPs, 30 (8.1%) were PAs, and 26 (7.0%) were ED/UCC chiefs or medical directors (Table 1). Most respondents (80.4%) reported at least 10 years of health care experience.
The majority of respondents (72.9%) believed that HCPs at their VHA facility should be prescribing naloxone. When asked to specify which HCPs should be prescribing naloxone, most HCP respondents selected pharmacists (76.4%) and substance abuse providers (71.6%). Less than half of respondents (45.0%) felt that VA ED/UCC providers also should be prescribing naloxone. However, 58.1% of most HCP respondents reported being comfortable or very comfortable with prescribing naloxone to a patient in the ED or UCC who already had an existing prescription of opioids. Similarly, 52.7% of respondents reported being comfortable or very comfortable with coprescribing naloxone when discharging a patient with an opioid prescription from the ED/UCC. Notably, while 36.7% of PAs reported being comfortable/very comfortable coprescribing naloxone, 46.7% reported being comfortable/very comfortable prescribing naloxone to a patient with an existing opioid prescription. Physicians and NPs expressed similar levels of comfort with coprescribing and prescribing naloxone.
Respondents across provider types indicated a number of barriers to prescribing naloxone to medically appropriate patients (Table 2). Many respondents indicated prescribing naloxone was beyond the ED/UCC provider scope of practice (35.2%), followed by the perceived stigma associated with naloxone (33.3%), time required to prescribe naloxone (23.9%), and concern with patient’s ability to use naloxone (22.8%).
Facilitators for prescribing naloxone to medically appropriate patients identified by HCP respondents included pharmacist help and education (44.6%), patient knowledge of medication options (31.7%), societal shift away from opioids for pain management (28.0%), facility leadership (26.9%), and patient interest in safe opioid usage (26.6%) (Table 3). In addition, NPs specifically endorsed
Less than 6.8% of HCP respondents indicated that they were comfortable using MAT. Meanwhile, 42.1% of respondents reported being aware of MAT but not familiar with it, and 23.5% reported that they were unaware of MAT. Correspondingly, 301 of the 372 (88.5%) HCP respondents indicated that they had not prescribed MAT in the past year. Across HCP types, only 24.1% indicated that it is the role of VA ED or UCC providers to prescribe MAT when medically appropriate and subsequently refer patients to substance abuse treatment for follow-up (just 7.1% of PAs endorsed this). Furthermore, 6.5% and 18.8% of HCP respondents indicated that their facility leadership was very supportive and supportive, respectively, of MAT for OUD prescribing.
Barriers to MAT initiation indicated by HCP respondents included limited scope of ED and UCC practice (53.2%), unclear follow-up/referral process (50.3%), time (29.8%), and discomfort (28.2%). Nearly one-third of NPs (27.9%) identified patient willingness/ability as a barrier to MAT initiation (Table 4).
Facilitators of MAT initiation in the ED or UCC included VHA same-day treatment options (34.9%), patient desire (32.5%), pharmacist help/education (27.4%), and psychiatric social workers in the ED or UCC (25.3%). Some NPs (23.0%) and PAs (26.7%) also indicated that having time to educate veterans about the medication would be a facilitator (Table 5). Facility leadership support was considered a facilitator by 30% of PAs.
Discussion
To the best of our knowledge, there have not been any studies examining HCP perceptions of the barriers and facilitators to naloxone distribution or the initiation of MAT in VHA ED and UCCs. Veterans are at an increased risk of overdose when compared with the general population, and increasing access to opioid safety measures (eg, safer prescribing practices, naloxone distribution) and treatment with MAT for OUD across all clinical settings has been a VHA priority.3
National guidance from VHA leadership, the Centers for Disease Control and Prevention (CDC), the US Surgeon General, and the US Department of Health and Human Services (HHS) call for an all-hands-on-deck approach to combatting opioid overdose with naloxone distribution or MAT (such as buprenorphine) initiation.13 VHA ED and UCC settings provide acute outpatient care to patients with medical or psychiatric illnesses or injuries that the patient believes requires emergent or immediate medical attention or for which there is a critical need for treatment to prevent deterioration of the condition or the possible impairment of recovery.14 However, ED and UCC environments are often regarded as settings meant to stabilize a patient until they can be seen by a primary care or long-term care provider.
A major barrier identified by HCPs was that MAT for OUD was outside their ED/UCC scope of practice, which suggests a need for a top-down or peer-to-peer reexamination of the role of HCPs in ED/UCC settings. Any naloxone distribution and/or MAT-initiation program in VHA ED/UCCs should consider education about the role of ED/UCC HCPs in opioid safety and treatment.
Only 25.3% of HCPs reported that their facility leadership was supportive or very supportive of MAT prescribing. This suggests that facility leadership should be engaged in any efforts to implement a MAT-initiation program in the facility’s ED. Engaging leadership in efforts to implement ED-based MAT programs will allow for a better understanding of leadership goals as related to opioid safety and an opportunity to address concerns regarding prescribing MAT in the ED. We recommend engaging facility leadership early in MAT implementation efforts. Respectively, 12.4% and 28.2% of HCP respondents reported discomfort prescribing naloxone or using MAT, suggesting a need for more education. Similarly, only 6.8% of HCPs reported comfort with using MAT.
A consideration for implementing ED/UCC-based MAT should be the inclusion of a training component. An evidence-based clinical treatment pathway that is appropriate to the ED/UCC setting and facility on the administration of MAT also could be beneficial. A clinical treatment pathway that includes ED/UCC-initiated discharge recommendations would address HCP concerns of unclear follow-up plans and system for referral of care. To this end, a key implementation task is coordinating with other outpatient services (eg, pain management clinic, substance use disorder treatment clinic) equipped for long-term patient follow-up to develop a system for referral of care. For example, as part of the clinical treatment pathway, an ED can develop a system of referral for patients initiated on MAT in the ED in which patients are referred for follow-up at the facility’s substance use disorder treatment clinic to be seen within 72 hours to continue the administration of MAT (such as buprenorphine).
In addition to HCP education, results suggest that patient/veteran education regarding naloxone and/or MAT should be considered. HCPs indicated that having help from a pharmacist to educate the patient about the medications would be a facilitator to naloxone distribution and MAT initiation. Similarly, patient knowledge of the medications also was endorsed as a facilitator. As such, a consideration for any future ED/UCC-based naloxone distribution or MAT-initiation programs in the VHA should be patient education whether by a clinically trained professional or an educational campaign for veterans.
Expanded naloxone distribution and initiation of MAT for OUD for EDs/UCCs across the VHA could impact the lives of veterans on long-term opioid therapy, with OUD, or who are otherwise at risk for opioid overdose. Steps taken to address the barriers and leverage the facilitators identified by HCP respondents can greatly reduce current obstacles to widespread implementation of ED/UCC-based naloxone distribution and MAT initiation nationally within the VHA.
Limitations
This survey had a low response rate (16.7%). One potential explanation for the low response rate is that when the survey was deployed, many of the VHA ED/UCC physicians were per-diem employees. Per-diem physicians may be less engaged and aware of site facilitators or barriers to naloxone and MAT prescribing. This, too, may have potentially skewed the collected data. However, the survey did not ask HCPs to disclose their employment status; thus, exact rates of per diem respondents are unknown.
We aimed to capture only self-perceived barriers to prescribing naloxone and MAT in the ED, but we did not capture or measure HCP respondent’s actual prescribing rates of MAT or naloxone. Understanding HCP perceptions of naloxone distribution and MAT initiation in the ED may have been further informed by comparing HCP responses to their actual clinical practice as related to their prescribing of these medications. In future research, we will link HCPs with the actual numbers of naloxone and MAT medications prescribed. Additionally, we do not know how many of these barriers or proposed facilitators will impact clinical practice.
Conclusions
A key aim for VHA leadership is to increase veteran access to naloxone distribution and MAT for OUD across clinical areas. The present study aimed to identify HCP perceptions of barriers and facilitators to the naloxone distribution and MAT-initiation programs in VHA ED/UCCs to inform the development of a targeted QI program to implement these opioid safety measures. Although the survey yielded a low response rate, results allowed us to identify important action items for our QI program, such as the development of clear protocols, follow-up plans, and systems for referral of care and HCP educational materials related to MAT and naloxone. We hope this work will serve as the basis for ED/UCC-tailored programs that can provide customized educational programs for HCPs designed to overcome known barriers to naloxone and MAT initiation.
Acknowledgments
This work was supported by the VA Office of Specialty Care Services 10P11 and through funding provided by the Comprehensive Addiction and Recovery Act (CARA).
1. Substance Abuse and Mental Health Services Administration. Key substance use and mental health indicators in the united states: results from the 2018 National Survey on Drug Use and Health. Published August 2019. Accessed August 20, 2021. https://www.samhsa.gov/data/sites/default/files/cbhsq-reports/NSDUHNationalFindingsReport2018/NSDUHNationalFindingsReport2018.pdf
2. Bohnert AS, Ilgen MA, Galea S, McCarthy JF, Blow FC. Accidental poisoning mortality among patients in the Department of Veterans Affairs Health System. Med Care. 2011;49(4):393-396. doi:10.1097/MLR.0b013e318202aa27
3. US Department of Veterans Affairs, Pharmacy Benefits Management Service. Recommendations for issuing naloxone rescue for the VA opioid overdose education and naloxone distribution (OEND) program. Published August 2016. Accessed August 20, 2021. https://www.pbm.va.gov/PBM/clinicalguidance/clinicalrecommendations/Naloxone_HCl_Rescue_Kits_Recommendations_for_Use.pdf
4. US Department of Defense, US Department of Veterans Affairs, Opioid Therapy for Chronic Pain Work Group. VA/DoD clinical practice guideline for opioid therapy for chronic pain. Published February 2017. Accessed August 20, 2021. https://www.va.gov/HOMELESS/nchav/resources/docs/mental-health/substance-abuse/VA_DoD-CLINICAL-PRACTICE-GUIDELINE-FOR-OPIOID-THERAPY-FOR-CHRONIC-PAIN-508.pdf
5. Barnett ML, Olenski AR, Jena AB. Opioid-prescribing patterns of emergency physicians and risk of long-term use. N Engl J Med. 2017;376(7):663-673. doi:10.1056/NEJMsa1610524
6. Shah A, Hayes CJ, Martin BC. Characteristics of initial prescription episodes and likelihood of long-term opioid use - United States, 2006-2015. MMWR Morb Mortal Wkly Rep. 2017;66(10):265-269. Published 2017 Mar 17. doi:10.15585/mmwr.mm6610a1
7. Clark AK, Wilder CM, Winstanley EL. A systematic review of community opioid overdose prevention and naloxone distribution programs. J Addict Med. 2014;8(3):153-163. doi:10.1097/ADM.0000000000000034
8. Coffin PO, Behar E, Rowe C, et al. Nonrandomized intervention study of naloxone coprescription for primary care patients receiving long-term opioid therapy for Pain. Ann Intern Med. 2016;165(4):245-252. doi:10.7326/M15-2771
9. Ma J, Bao YP, Wang RJ, et al. Effects of medication-assisted treatment on mortality among opioids users: a systematic review and meta-analysis. Mol Psychiatry. 2019;24(12):1868-1883. doi:10.1038/s41380-018-0094-5
10. D’Onofrio G, O’Connor PG, Pantalon MV, et al. Emergency department-initiated buprenorphine/naloxone treatment for opioid dependence: a randomized clinical trial. JAMA. 2015;313(16):1636-1644. doi:10.1001/jama.2015.3474
11. Dieujuste N, Johnson-Koenke R, Christopher M, et al. Feasibility study of a quasi-experimental regional opioid safety prescribing program in Veterans Health Administration emergency departments. Acad Emerg Med. 2020;27(8):734-741. doi:10.1111/acem.13980
12. Mackey K, Veazie S, Anderson J, Bourne D, Peterson K. Evidence brief: barriers and facilitators to use of medications for opioid use disorder. Published July 2017. Accessed August 20, 2021. http://www.ncbi.nlm.nih.gov/books/NBK549203/
13. US Department of Health and Human Services, Office of the Surgeon General. Naloxone: the opioid reversal drug that saves lives. Published December 2018. Accessed August 20, 2021. https://www.hhs.gov/opioids/sites/default/files/2018-12/naloxone-coprescribing-guidance.pdf
14. US Department of Veterans Affairs, Veterans Health Administration. Chapter 256: Emergency department (ED) and urgent care clinic (UCC). Updated October 3, 2016. Accessed August 20, 2021. https://www.cfm.va.gov/til/space/spChapter256.pdf.
Concordance of DNA Repair Gene Mutations in Paired Primary Prostate Cancer Samples and Metastatic Tissue or Cell-free DNA
Importance
DNA damage response repair (DDR) gene mutations represent actionable alterations that can guide precision medicine strategies in men with advanced prostate cancer (PC). However, acquisition of contemporary tissue samples for molecular testing can be a barrier to deploying precision medicine approaches. We hypothesized that DDR alterations represent truncal events in PC and that primary tissue would reflect mutations found in cell-free circulating tumor (ctDNA) and/or metastatic tissue. OBJECTIVE: To assess concordance in DDR gene alterations between primary PC and metastases or ctDNA specimens.
Methods
Patients were included if a DDR pathway mutation was detected in metastatic tissue or ctDNA and primary tissue sequencing was available for comparison. Sequencing data from three cohorts were analyzed: (1) FoundationOne; (2) University of Washington (UW-OncoPlex or SU2C/PCF International Dream Team sequencing pipelines); and (3) University of Washington rapid autopsy series. Only pathogenic somatic mutations were included and we required 30 days between primary tumor tissue and ctDNA/ metastatic tissue acquisition. Clonal hematopoiesis of indeterminant potential (CHIP) and germline events were adjudicated by an expert molecular pathologist and excluded. DDR gene mutations detected in primary prostate tissue matched with metastatic tissue and/or ctDNA findings.
Results
Paired primary and ctDNA/metastatic samples were sequenced from 72 individuals with known DDR alterations. After excluding ctDNA studies where only CHIP and/or germline events (N=21) were observed, 51 subjects remained and were included in the final analysis. The median time from acquisition of primary tissue to acquisition of ctDNA or tumor tissue was 55 months (range: 5-193 months). Concordance in DDR gene mutation status across samples was 84% (95% CI: 71-92%). Rates of concordance between metastatic-primary and ctDNAprimary pairs were similar when CHIP cases were excluded. BRCA2 reversion mutations associated with resistance to PARP inhibitors and platinum chemotherapy were detected in ctDNA from two subjects.
Discussion
Primary prostate tissue accurately reflected the mutational status of actionable DDR genes in metastatic tissue, consistent with DDR alterations being truncal in most cases. After excluding likely CHIP events, ctDNA profiling accurately captured these DDR mutations, while also detecting reversion alterations that may suggest resistance mechanisms.