User login
Prevalence of Suspicious Ultrasound Features in Hot Thyroid Nodules (FULL)
Although historically associated with a low risk of malignancy, hyperthyroidism is no longer thought to be protective against the occurrence of thyroid cancer. The incidence of malignancy has been reported in Graves disease at 2% and as high as 9% in toxic multinodular goiters.1,2
In evaluating patients with thyroid nodules and low thyroid stimulating hormone (TSH), which may indicate hyperthyroidism, the American Thyroid Association (ATA) recommends a radioiodine thyroid scan to determine whether a thyroid nodule is autonomous (hot) or nonfunctional (cold).3 Hot thyroid nodules are nodular areas of hyperfunctioning activity on radioiodine scan where tracer uptake is greater than the surrounding normal thyroid.
Historically, hot nodules have been associated with a low risk of malignancy and typically did not receive further ultrasound evaluation. However, recent studies have documented that the incidence of thyroid cancer in hot nodules may be underestimated. Mirfakhraee and colleagues performed a literature review in 2013 that revealed the prevalence of thyroid carcinoma in hot nodules managed by thyroidectomy ranged from 0% to 12.5% and averaged 3.1%.4 These findings may underestimate the prevalence of malignancy, because most hot nodules are not managed by thyroidectomy.
Given findings of hot nodules harboring malignancy, the authors investigated the role of thyroid ultrasound in patients with hyperthyroidism to identify suspicious features concerning for possible malignancies. The study objective was to estimate the prevalence of hot nodules with sonographic features concerning for malignancy in patients with hyperthyroidism in a Department of Veterans Affairs (VA) health care system.
Methods
This retrospective chart review consisted of 149,549 patients seen between January 2010 and December 2015 at the VA Northern California Health Care System (VANCHCS). The institutional review board approved the study and informed consent was waived.
Seven hundred sixty veterans were identified in the Computerized Patient Record System (CPRS) using the following ICD-9 codes: 242.9 (hyperthyroidism), 242.2 (toxic multinodular goiter), 242.3 (toxic nodular goiter), 242.1 (toxic uninodular goiter), and 241.9 (adenomatous goiter) (Figure 1). 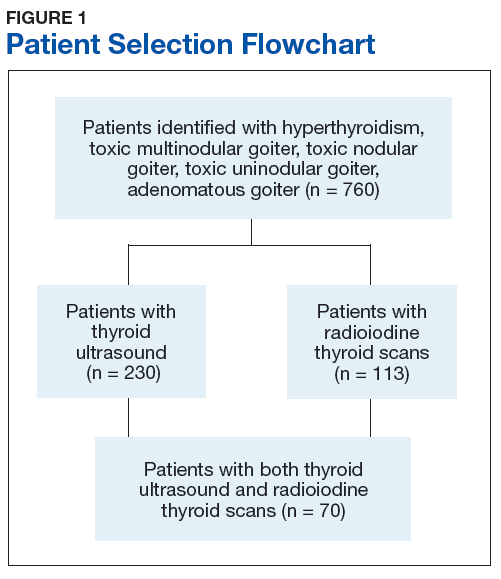
Manual review of thyroid ultrasound scans for suspicious characteristics concerning for thyroid carcinoma were based on the 2015 ATA Management Guidelines for Adult Patients with Thyroid Nodules and Differentiated Thyroid Cancer.3 Per the ATA guidelines, sonographic patterns that are highly suspicious for malignancy were solid hypoechoic nodule or solid hypoechoic component of a partially cystic nodule with one or more of the following features: irregular margins (infiltrative, microlobulated), microcalcifications, taller than wide on transverse view, and rim calcifications with small extrusive soft-tissue component. Sonographic patterns with intermediate suspicion were hypoechoic solid nodule with smooth margins without microcalcifications, extrathyroidal extension, or taller than wide shape.3
Results
Of the 760 identified veterans, 230 had thyroid ultrasounds, and 113 had radioiodine thyroid scans. Of these, 70 patients had both ultrasound and radioiodine thyroid scans. This cohort consisted of 84.3% (59) males and 15.7% women (11). Ages ranged from 32 to 93 (mean age 62.9) years.
A total of 121 nodules were identified among the remaining 43 patients (11 individuals with cold thyroid scans and 16 individuals with no nodules were excluded). Of the 121 nodules, 44 were hot nodules, 29 were coexisting nodules found in patients with hot nodules, and 48 were other nodules found in patients without coexisting hot nodules (Figure 2). 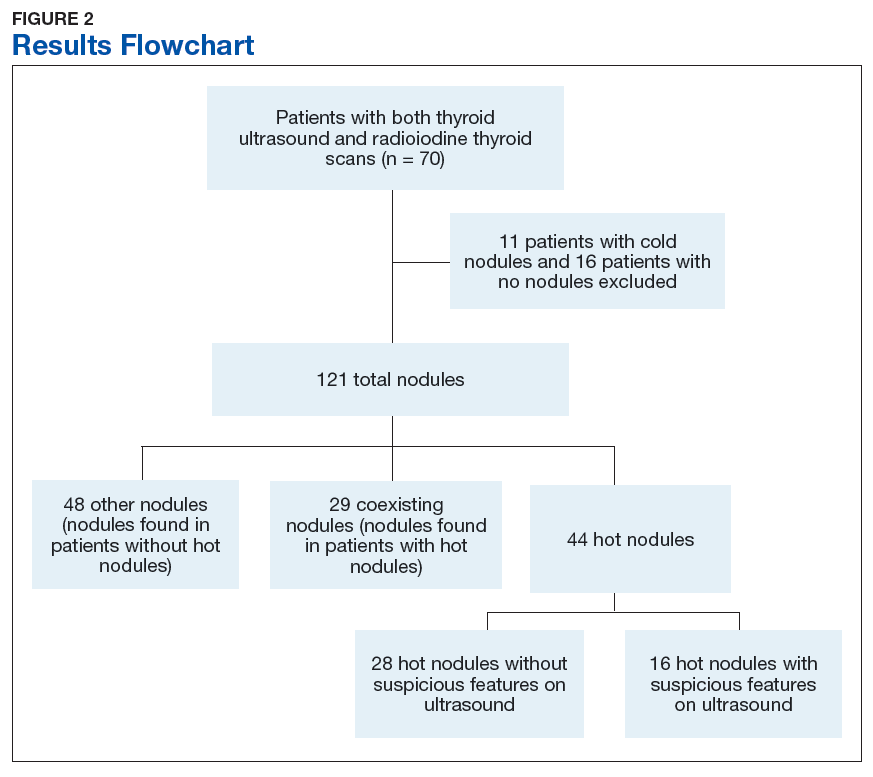
Of the 44 hot nodules, the analysis identified 16 hot nodules with suspicious features on ultrasound and 28 nodules without suspicious findings. Breakdown of specific suspicious features included 11 that were solid hypoechoic, 3 nodules that had microcalcifications, and 2 nodules that had both characteristics (Table). 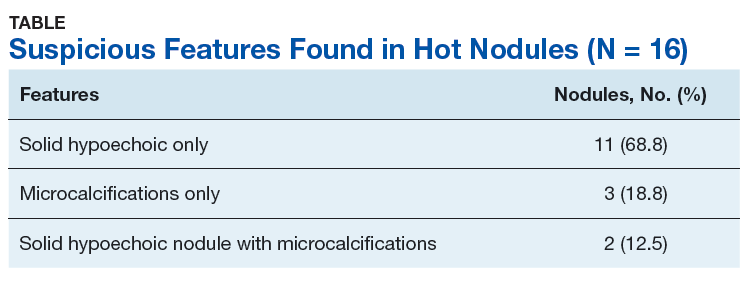
Twelve patients had hot nodules with suspicious ultrasound findings. Of this group, 6 patients had no further workup, 1 patient was lost to follow-up, and 1 patient was planned for fine needle aspiration (FNA) biopsy. Four patients underwent FNA, and all results were benign.
Discussion
Although most veterans identified with hyperthyroidism did not undergo imaging studies, of those who did, a remarkable number had unexpected ultrasonographically suspicious nodules. Of the 44 hot nodules identified on radioiodine studies, 16 had suspicious ultrasound findings that raised concern for malignancy based on the most recent ATA guidelines. In contrast to recent studies that have suggested an increased incidence of thyroid carcinoma in hot nodules, no cancers were detected in this cohort.4 However, only 4 patients in this study underwent FNA.
Worth noting is that the most common suspicious feature found in this study’s cohort was hypoechoic solid nodules, which is a feature that has a sensitivity of 81% however a low specificity of 53% in detecting thyroid malignancy.5 This appearance also is found in 55% of benign thyroid nodules.6 The overlap of hypoechoic nodules as a feature in both benign and malignant thyroid nodules can present as a diagnostic challenge in differentiating between the two.
The 2015 ATA guideline recommends that low TSH warrants a radioiodine scan, and FNA should be considered for isofunctioning or nonfunctioning nodules with suspicious sonographic features. Hot nodules found on scintigraphy need no further cytologic evaluation because they are mostly benign.3 There is no clear stance on the use of ultrasound in hot nodules.
The answer to whether patients with hot nodules should undergo ultrasound still remains unclear. This study showed a surprising number of hot nodules with worrisome architecture found on ultrasound. However, whether that correlates to actual malignant findings remains unknown as most individuals in the cohort did not undergo biopsy. Also, given the high prevalence of suspicious findings, it may be difficult to use ultrasound as a diagnostic tool in patients with hot nodules as false positives may lead to unnecessary interventions such as biopsy.
Limitations
The patient population consisted mostly of men (84.3%) and cannot be applied to the general population. Thyroid nodules are 4 times more common in women than they are in men.7 Another limitation was the lack of data on patients’ radiation exposure while in military service or as civilians. Finally, as a retrospective study, there was unavoidable selection bias.
Conclusion
The prevalence of suspicious findings concerning for malignancy in hot nodules was 36.3% (16/44) based on the 2015 ATA guidelines. This study’s preliminary observation suggests that although ultrasound is a noninvasive and relatively inexpensive diagnostic modality, it has a limited role in the evaluation of hot nodules given the high prevalence of suspicious findings. Clinicians may still consider its use in patients who also have high-risk historic features. This was a thought-generating, retrospective study, and further prospective studies in larger populations are needed to validate the study’s results.
1. Stocker DJ, Burch HB. Thyroid cancer yield in patients with Graves’ disease. Minerva Endocrinol. 2003;28(3):205-212.
2. Cerci C, Cerci SS, Eroglu E, et al. Thyroid cancer in toxic and non-toxic multinodular goiter. J Postgrad Med. 2007;53(3):157-160.
3. Haugen BRM, Alexander EK, Bible KC, et al. 2015 American Thyroid Association Management Guidelines for Adult Patients With Thyroid Nodules and Differentiated Thyroid Cancer: The American Thyroid Association Guidelines Task Force on Thyroid Nodules and Differentiated Thyroid Cancer. Thyroid. 2016;26(1):1-133.
4. Mirfakhraee S, Mathews D, Peng L, Woodruff S, Zigman JM. A solitary hyperfunctioning thyroid nodule harboring thyroid carcinoma: review of the literature. Thyroid Res. 2013;6(1):7.
5. Papini E, Guglielmi R, Bianchini A, et al. Risk of malignancy in nonpalpable thyroid nodules: predictive value of ultrasound and color-Doppler features. J Clin Endocrinol Metab. 2002;87(5):1941-1946.
6. Mazzaferri EL. Management of a solitary thyroid nodule. N Engl J Med. 1993;328(8):553-559.
7. Fish SA, Langer JE, Mandel SJ. Sonographic imaging of thyroid nodules and cervical lymph nodes. Endocrinol Metab Clin North Am. 2008;37(2):401-417.
Although historically associated with a low risk of malignancy, hyperthyroidism is no longer thought to be protective against the occurrence of thyroid cancer. The incidence of malignancy has been reported in Graves disease at 2% and as high as 9% in toxic multinodular goiters.1,2
In evaluating patients with thyroid nodules and low thyroid stimulating hormone (TSH), which may indicate hyperthyroidism, the American Thyroid Association (ATA) recommends a radioiodine thyroid scan to determine whether a thyroid nodule is autonomous (hot) or nonfunctional (cold).3 Hot thyroid nodules are nodular areas of hyperfunctioning activity on radioiodine scan where tracer uptake is greater than the surrounding normal thyroid.
Historically, hot nodules have been associated with a low risk of malignancy and typically did not receive further ultrasound evaluation. However, recent studies have documented that the incidence of thyroid cancer in hot nodules may be underestimated. Mirfakhraee and colleagues performed a literature review in 2013 that revealed the prevalence of thyroid carcinoma in hot nodules managed by thyroidectomy ranged from 0% to 12.5% and averaged 3.1%.4 These findings may underestimate the prevalence of malignancy, because most hot nodules are not managed by thyroidectomy.
Given findings of hot nodules harboring malignancy, the authors investigated the role of thyroid ultrasound in patients with hyperthyroidism to identify suspicious features concerning for possible malignancies. The study objective was to estimate the prevalence of hot nodules with sonographic features concerning for malignancy in patients with hyperthyroidism in a Department of Veterans Affairs (VA) health care system.
Methods
This retrospective chart review consisted of 149,549 patients seen between January 2010 and December 2015 at the VA Northern California Health Care System (VANCHCS). The institutional review board approved the study and informed consent was waived.
Seven hundred sixty veterans were identified in the Computerized Patient Record System (CPRS) using the following ICD-9 codes: 242.9 (hyperthyroidism), 242.2 (toxic multinodular goiter), 242.3 (toxic nodular goiter), 242.1 (toxic uninodular goiter), and 241.9 (adenomatous goiter) (Figure 1).
Manual review of thyroid ultrasound scans for suspicious characteristics concerning for thyroid carcinoma were based on the 2015 ATA Management Guidelines for Adult Patients with Thyroid Nodules and Differentiated Thyroid Cancer.3 Per the ATA guidelines, sonographic patterns that are highly suspicious for malignancy were solid hypoechoic nodule or solid hypoechoic component of a partially cystic nodule with one or more of the following features: irregular margins (infiltrative, microlobulated), microcalcifications, taller than wide on transverse view, and rim calcifications with small extrusive soft-tissue component. Sonographic patterns with intermediate suspicion were hypoechoic solid nodule with smooth margins without microcalcifications, extrathyroidal extension, or taller than wide shape.3
Results
Of the 760 identified veterans, 230 had thyroid ultrasounds, and 113 had radioiodine thyroid scans. Of these, 70 patients had both ultrasound and radioiodine thyroid scans. This cohort consisted of 84.3% (59) males and 15.7% women (11). Ages ranged from 32 to 93 (mean age 62.9) years.
A total of 121 nodules were identified among the remaining 43 patients (11 individuals with cold thyroid scans and 16 individuals with no nodules were excluded). Of the 121 nodules, 44 were hot nodules, 29 were coexisting nodules found in patients with hot nodules, and 48 were other nodules found in patients without coexisting hot nodules (Figure 2).
Of the 44 hot nodules, the analysis identified 16 hot nodules with suspicious features on ultrasound and 28 nodules without suspicious findings. Breakdown of specific suspicious features included 11 that were solid hypoechoic, 3 nodules that had microcalcifications, and 2 nodules that had both characteristics (Table).
Twelve patients had hot nodules with suspicious ultrasound findings. Of this group, 6 patients had no further workup, 1 patient was lost to follow-up, and 1 patient was planned for fine needle aspiration (FNA) biopsy. Four patients underwent FNA, and all results were benign.
Discussion
Although most veterans identified with hyperthyroidism did not undergo imaging studies, of those who did, a remarkable number had unexpected ultrasonographically suspicious nodules. Of the 44 hot nodules identified on radioiodine studies, 16 had suspicious ultrasound findings that raised concern for malignancy based on the most recent ATA guidelines. In contrast to recent studies that have suggested an increased incidence of thyroid carcinoma in hot nodules, no cancers were detected in this cohort.4 However, only 4 patients in this study underwent FNA.
Worth noting is that the most common suspicious feature found in this study’s cohort was hypoechoic solid nodules, which is a feature that has a sensitivity of 81% however a low specificity of 53% in detecting thyroid malignancy.5 This appearance also is found in 55% of benign thyroid nodules.6 The overlap of hypoechoic nodules as a feature in both benign and malignant thyroid nodules can present as a diagnostic challenge in differentiating between the two.
The 2015 ATA guideline recommends that low TSH warrants a radioiodine scan, and FNA should be considered for isofunctioning or nonfunctioning nodules with suspicious sonographic features. Hot nodules found on scintigraphy need no further cytologic evaluation because they are mostly benign.3 There is no clear stance on the use of ultrasound in hot nodules.
The answer to whether patients with hot nodules should undergo ultrasound still remains unclear. This study showed a surprising number of hot nodules with worrisome architecture found on ultrasound. However, whether that correlates to actual malignant findings remains unknown as most individuals in the cohort did not undergo biopsy. Also, given the high prevalence of suspicious findings, it may be difficult to use ultrasound as a diagnostic tool in patients with hot nodules as false positives may lead to unnecessary interventions such as biopsy.
Limitations
The patient population consisted mostly of men (84.3%) and cannot be applied to the general population. Thyroid nodules are 4 times more common in women than they are in men.7 Another limitation was the lack of data on patients’ radiation exposure while in military service or as civilians. Finally, as a retrospective study, there was unavoidable selection bias.
Conclusion
The prevalence of suspicious findings concerning for malignancy in hot nodules was 36.3% (16/44) based on the 2015 ATA guidelines. This study’s preliminary observation suggests that although ultrasound is a noninvasive and relatively inexpensive diagnostic modality, it has a limited role in the evaluation of hot nodules given the high prevalence of suspicious findings. Clinicians may still consider its use in patients who also have high-risk historic features. This was a thought-generating, retrospective study, and further prospective studies in larger populations are needed to validate the study’s results.
1. Stocker DJ, Burch HB. Thyroid cancer yield in patients with Graves’ disease. Minerva Endocrinol. 2003;28(3):205-212.
2. Cerci C, Cerci SS, Eroglu E, et al. Thyroid cancer in toxic and non-toxic multinodular goiter. J Postgrad Med. 2007;53(3):157-160.
3. Haugen BRM, Alexander EK, Bible KC, et al. 2015 American Thyroid Association Management Guidelines for Adult Patients With Thyroid Nodules and Differentiated Thyroid Cancer: The American Thyroid Association Guidelines Task Force on Thyroid Nodules and Differentiated Thyroid Cancer. Thyroid. 2016;26(1):1-133.
4. Mirfakhraee S, Mathews D, Peng L, Woodruff S, Zigman JM. A solitary hyperfunctioning thyroid nodule harboring thyroid carcinoma: review of the literature. Thyroid Res. 2013;6(1):7.
5. Papini E, Guglielmi R, Bianchini A, et al. Risk of malignancy in nonpalpable thyroid nodules: predictive value of ultrasound and color-Doppler features. J Clin Endocrinol Metab. 2002;87(5):1941-1946.
6. Mazzaferri EL. Management of a solitary thyroid nodule. N Engl J Med. 1993;328(8):553-559.
7. Fish SA, Langer JE, Mandel SJ. Sonographic imaging of thyroid nodules and cervical lymph nodes. Endocrinol Metab Clin North Am. 2008;37(2):401-417.
Patient, Caregiver, and Clinician Perspectives on Expectations for Home Healthcare after Discharge: A Qualitative Case Study
Patients who are discharged from the hospital with home healthcare (HHC) are older, sicker, and more likely to be readmitted to the hospital than patients discharged home without HHC.1-3 Communication between clinicians in different settings is a key factor in successful transitions. In prior work, we focused on communication between primary care providers, hospitalists, and HHC nurses to inform efforts to improve care transitions.4,5 In one study, HHC nurses described that patients frequently have expectations beyond the scope of what skilled HHC provides,5 which prompted us to also question experiences of patients and caregivers after discharge with skilled HHC (eg, nursing and physical therapy).
In a prior qualitative study by Foust and colleagues, HHC patients and caregivers described disparate experiences around preparation for hospital discharge—patients expressed knowing about the timing and plans for discharge, and the caregivers frequently felt left out of this discussion.6 In other studies, caregivers of recently discharged patients have described feeling excluded from interactions with clinicians both before and after discharge.7,8 In another recent qualitative study, caregivers described uncertainty about their role compared with the HHC role in caring for the patient.9
As of 2016, a majority of states had passed the Caregiver Advise, Record, and Enable (CARE) Act, which requires hospitals to (1) record a family caregiver in the medical record, (2) inform this caregiver about discharge, and (3) deliver instructions with education about medical tasks that they will need to complete after discharge.10
METHODS
Study Design
In this qualitative descriptive case study, we interviewed HHC patients, an involved caregiver, and the HHC clinician completing the first HHC visit within 7-14 days following hospital discharge. We chose this timeframe to allow patients to receive one or more HHC visits following hospital discharge.
Population
- >65 years old,12 eligibility was initially limited to patients
- >65 years old. Due to recruitment challenges, the age range was broadened to
- >50 years old in October 2017.
Because our goal was to better understand the experience of general medicine patients with multiple comorbidities, we recruited patients from one general medicine unit at an academic hospital in Colorado. Patients on this unit were screened for eligibility Monday-Friday (excluding weekends and holidays) based on research assistant availability.
Criteria included are as follows: HHC referral, three or more comorbidities, resides in the community prior to admission (ie, not in a facility), cognitively intact, English speaking, and able to identify a caregiver participating in their care. Eligible patients were approached for written consent prior to discharge to allow us to contact them 7-14 days after discharge for an interview by phone or in their home, per their preference. At the time of consent, patients provided contact information for their informal caregiver. Caregiver eligibility criteria included the following: age ≥18 years and provides caregiving at least one hour a week before hospital discharge. HHC clinicians approached for interviews had completed the first HHC visit for the patient following discharge. Both caregivers and HHC clinicians provided verbal consent for interviews. All participants received a $25 gift card for participation in the study.
Framework and Data Collection
Our interview guides were organized by the Agency for Healthcare Research and Quality Care Coordination Framework, an approach we have taken in prior work.4,5,13 We added questions about patient preparation and self-management support to build on findings from a prior study with HHC nurses and on prior work by Coleman and colleagues.5,14 Sample questions from the interview guides for patients, caregivers, and HHC clinicians within key analysis domains are included in Appendix 1. The patient and caregiver interviews were completed by an individual with prior experience in social work and healthcare (SS). The HHC clinician interviews were completed by either this individual (SS) or a physician-researcher with experience in qualitative methods (CJ). Patients and caregivers could choose to be interviewed individually or together. All interviews were digitally recorded and transcribed verbatim.
Analysis
Patient interviews lasted an average of 43 minutes, caregiver interviews an average of 41 minutes, and HHC clinician interviews an average of 25 minutes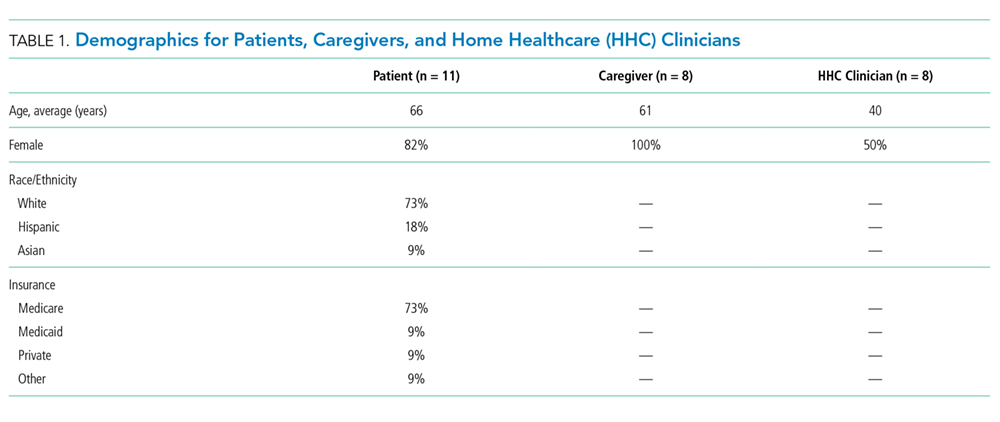
We observed the two main themes of clear and unclear expectations for HHC after discharge. Clear expectations occur when the patient and/or caregiver have expectations for HHC that align with the services they receive. Unclear expectations occur when the patient and/or caregiver expectations are either uncertain or misaligned with the services they receive. Although not all interviews yielded codes about clear or unclear expectations, patients described clear expectations in five cases and unclear expectations in another five cases.
In nine cases with more than one perspective available, expectations were compared within cases and found to be clear (three cases), unclear (three cases), or discordant (three cases) across perspectives. For the discordant cases, the description of clear and unclear expectations differed between patients and either their caregiver or their HHC clinician. Patients and caregivers with clear expectations for HHC frequently described prior experiences with skilled HHC or work experience within the healthcare field. In most cases with unclear expectations, the patient and caregiver did not have prior experience with HHC. In addition, the desire for assistance with personal care for patients such as showering and housekeeping was described by caregivers with unclear expectations. The results are organized into clear, unclear, and discordant expectations from the perspectives of patients, caregivers, and HHC clinicians within cases.
Clear Expectations within Cases
Clear expectations for HHC were identified across perspectives in three cases, with sample quotes provided in Table 2. In the case of patient 1, the patient and HHC nurse had known each other for over two years because the patient had a wound requiring long-term HHC services. A caregiver did not complete an interview in this case. With patient 2, the patient, caregiver, and HHC physical therapist (PT) all describe that the patient had clear expectations for HHC. In this case, the patient and caregiver describe feeling prepared because of previously receiving HHC, prior work experience in the healthcare field, and a caregiver with experience working in HHC. In the case of patient 3, the patient had previously received HHC from the same HHC nurse.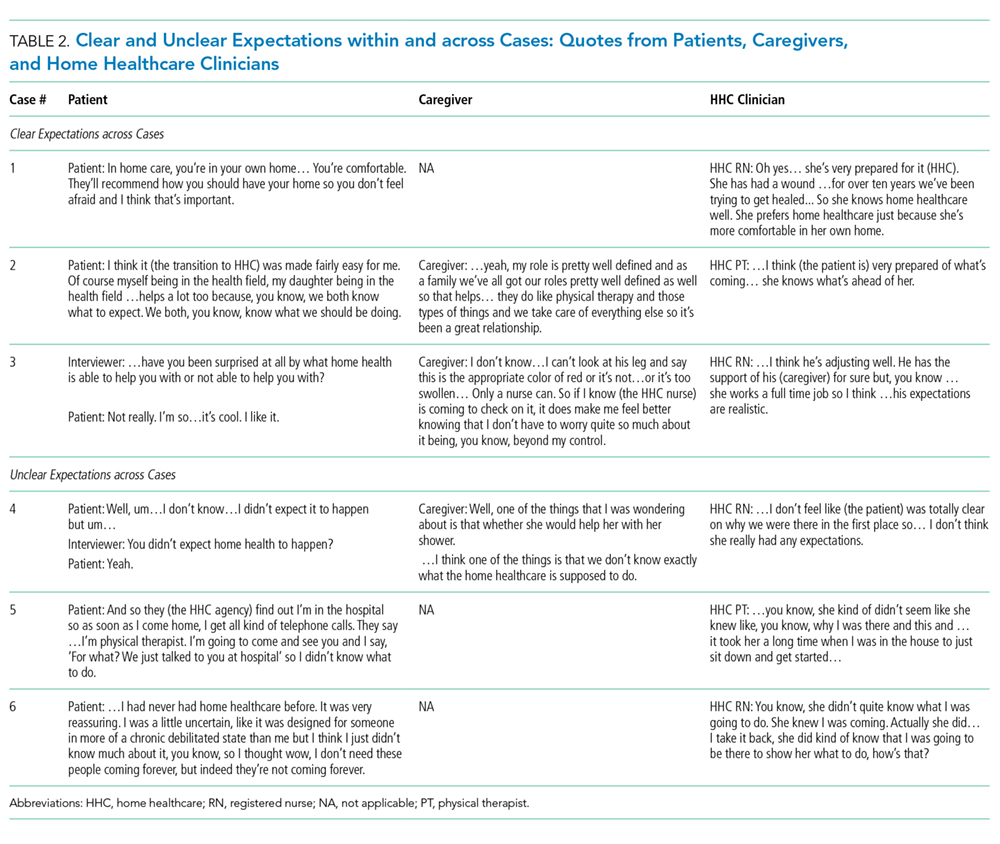
Unclear Expectations across Cases
For the three cases in which unclear expectations were described across perspectives, two of the patients described being new to HHC, with representative quotes in Table 2. Patient 4 and her caregiver are new to HHC and describe unclear expectations for both the HHC referral and the HHC role, which was also noted by the HHC clinician. Of note, the caregiver for patient 4 further described that she was unable to be present for the first HHC visit. In the case of patient 5, although the patient had previously received HHC, the patient describes not knowing why the HHC PT needs to see her after discharge, which is also noted by the HHC PT. Finally, both patient 6 and her HHC PT describe that the patient was not sure about their expectations for HHC and that HHC was a new experience for them.
Discordant Expectation Clarity across Cases
In three of the cases, the description of clear and unclear expectations was discrepant across roles. In case 7, the caregiver and patient are new to HHC and express different perspectives about expectations for HHC. The HHC clinician, in this case, did not complete an interview. The caregiver describes not being present for the first HHC visit and no awareness that the patient was being discharged with HHC:
Caregiver: Well, we didn’t even know she had home health until she got home.
The same caregiver also expresses unclear expectations for HHC:
Caregiver: It’s pretty cloudy. They (the HHC clinicians) don’t help her with her laundry, they don’t help with the housekeeping, they don’t help… with her showers so somebody is there when she showers. They don’t do anything. The only two things like I said is the…home healthcare comes in on Wednesdays to see what she needs and then the therapy comes in one day a week.
However, the patient expresses more clear expectations that are being met by HHC.
Patient: They (HHC) have met my expectations. They come in twice a week. They do vitals, take vitals and discuss with me, you know, what my feelings are, how I’m doing and I know they have met my expectations.
In case 8, although the patient describes knowing about the HHC PT involvement in her care, she expresses some unclear expectations about an HHC nurse after discharge.
Patient: As far as home health, I didn’t have a real …plan there at the hospital… They knew about (the HHC PT) coming once a week but as far as, you know, a nurse coming by to check on me, no.
However, the HHC PT describes feeling that the patient had clear expectations for HHC after discharge:
Interviewer: Can you reflect on whether she was prepared to receive home healthcare?
HHC PT: Yeah, she was ready.
Interviewer: …do you feel like she was prepared to know what to expect from you?
HHC PT: Yeah, but I think that comes from being a previous patient also.
Finally, in case 9, the patient describes clear expectations for HHC even though they were new to HHC:
Patient: …I knew what the PT was going to do and …I still need her because I’ve lost so much weight so she’s been really good, instrumental, at giving me exercises… Occupational therapist…she’s going to teach me how to shave, she’s going to teach me how to get ready for the day.
The HHC PT describes that although the patient knew the PT role, they reflect that the patient may have been somewhat unclear about expectations for the first HHC visit:
HHC PT: He knew all that it entailed with the exception of he didn’t really know what the first day was going to be like and the first day I don’t usually do treatment because it does take a long time to get all the paperwork signed, to do the evaluation and the fact that it takes two hours to do that note.
DISCUSSION
In this qualitative case study with HHC patients, caregivers, and clinicians, the participants described varying levels of expectation clarity for HHC after discharge. We triangulated across and within cases and found three cases with clear expectations and three cases with unclear expectations for HHC across perspectives. In three additional cases, we found discordant expectations across perspectives: patients and HHC clinician expectations differed in two of the cases and a patient and caregiver differed in one case. Of interest, in all three cases of clear expectations across perspectives, the patients and/or caregivers had prior HHC or healthcare work experience. In contrast,
Prior studies in this area have included a qualitative study HHC patients, caregivers, and clinicians by Foust and colleagues in which multiple caregivers described finding out about the discharge from the patient or other caregivers, rather than being actively engaged by clinicians.6 In another recent qualitative study by Arbaje and colleagues, a majority of caregivers described “mismatched expectations” about HHC services, in which caregivers
When caregivers have unclear expectations for HHC, they could be expressing the need for more support after hospital discharge, which suggests an active role for hospital teams to assess and address additional support needs with the patients and caregivers. For example, if the patient or caregiver request additional personal care services, a home health aide could help to reduce caregiver burden and improve the support network for the patient. In a prior study in which patients were asked what would help them to make informed decisions about postacute care options, the patients described wanting to receive practical information that could describe how it would apply to their specific situation and perceived needs.18 To provide this for patients and caregivers, it would follow that hospitals could provide information about skilled HHC nursing and therapies and information about services that could meet additional needs, such as home health aides.
Limitations of this study include that it was a small qualitative case study of patients, caregivers, and HHC clinicians from one medical unit at one academic medical center. Most patients in this study had Medicare insurance, were 65 years and older, white, and female.
In conclusion, to improve care transitions for HHC patients and their caregivers, emphasizing engagement of caregivers is key to ensure that they are educated about HHC, provided with additional support as needed, and included in initial HHC visits once the patients are at home. Even though patients and caregivers with prior HHC experience often had clear expectations for HHC, a strategy to uniformly engage caregivers across a range of experience can ensure caregivers have all the information and support needed to optimize care transitions to HHC.
Disclosures
The authors have nothing to disclose.
Funding
Dr. Christine Jones is supported by grant number K08HS024569 from the Agency for Healthcare Research and Quality. Jason Falvey was supported by grant F31AG056069 from the National Institute on Aging, National Institutes of Health and is currently supported by T32AG019134. The content is solely the responsibility of the authors and does not necessarily represent the official views of the Agency for Healthcare Research and Quality or the National Institutes of Health.
1. Jones CD, Wald HL, Boxer RS, et al. Characteristics associated with home health care referrals at hospital discharge: results from the 2012 National Inpatient Sample. Health Serv Res. 2017;52(2):879-894. doi: 10.1111/1475-6773. PubMed
2. Avalere Health. Home Health Chartbook 2015: Prepared for the Alliance for Home Health Quality and Innovation. 2016.
3. Hospital Compare. https://www.medicare.gov/hospitalcompare/search.html. Accessed May 1, 2017.
4. Jones CD, Vu MB, O’Donnell CM, et al. A failure to communicate: a qualitative exploration of care coordination between hospitalists and primary care providers around patient hospitalizations. J Gen Intern Med. 2015;30(4):417-424. doi: 10.1007/s11606-014-3056-x. PubMed
5. Jones CD, Jones J, Richard A, et al. “Connecting the dots”: a qualitative study of home health nurse perspectives on coordinating care for recently discharged patients. J Gen Intern Med. 2017;32(10):1114-1121. doi: 10.1007/s11606-017-4104-0. PubMed
6. Foust JB, Vuckovic N, Henriquez E. Hospital to home health care transition: patient, caregiver, and clinician perspectives. West J Nurs Res. 2012;34(2):194-212. doi: 10.1177/0193945911400448. PubMed
7. Blair J, Volpe M, Aggarwal B. Challenges, needs, and experiences of recently hospitalized cardiac patients and their informal caregivers. J Cardiovasc Nurs. 2014;29(1):29-37. doi: 10.1097/JCN.0b013e3182784123. PubMed
8. Coleman EA, Roman SP. Family caregivers’ experiences during transitions out of hospital. J Healthc Qual. 2015;37(1):12-21. doi: 10.1097/01.JHQ.0000460117.83437.b3. PubMed
9. Arbaje AI, Hughes A, Werner N, et al. Information management goals and process failures during home visits for middle-aged and older adults receiving skilled home healthcare services after hospital discharge: a multisite, qualitative study. BMJ Qual Saf. 2018. doi: 10.1136/bmjqs-2018-008163. PubMed
10. Coleman EA. Family caregivers as partners in care transitions: the caregiver advise record and enable act. J Hosp Med. 2016;11(12):883-885. doi: 10.1002/jhm.2637. PubMed
11. Jones AL, Harris-Kojetin L, Valverde R. Characteristics and use of home health care by men and women aged 65 and over. Natl Health Stat Report. 2012(52):1-7. PubMed
12. Tian W. An all-payer view of hospital discharge to postacute care, 2013. HCUP Statistical Brief #205. Rockville, Maryland; 2016. PubMed
13. McDonald KM, Sundaram V, Bravata DM, et al. Closing the Quality Gap: A Critical Analysis of Quality Improvement Strategies (Vol. 7: Care Coordination). Rockville, Maryland; 2007. PubMed
14. Coleman EA, Smith JD, Frank JC, Eilertsen TB, Thiare JN, Kramer AM. Development and testing of a measure designed to assess the quality of care transitions. Int J Integr Care. 2002;2:e02. doi: 10.5334/ijic.60. PubMed
15. Jones J, Nowels CT, Sudore R, Ahluwalia S, Bekelman DB. The future as a series of transitions: qualitative study of heart failure patients and their informal caregivers. J Gen Intern Med. 2015;30(2):176-182. doi: 10.1007/s11606-014-3085-5. PubMed
16. Lum HD, Jones J, Lahoff D, et al. Unique challenges of hospice for patients with heart failure: a qualitative study of hospice clinicians. Am Heart J. 2015;170(3):524-530 e523. doi: 10.1016/j.ahj.2015.06.019. PubMed
17. Kerr C, Nixon A, Wild D. Assessing and demonstrating data saturation in qualitative inquiry supporting patient-reported outcomes research. Expert Rev Pharmacoecon Outcomes Res. 2010;10(3):269-281. doi: 10.1586/erp.10.30. PubMed
18. Sefcik JS, Nock RH, Flores EJ, et al. Patient preferences for information on post-acute care services. Res Gerontol Nurs. 2016;9(4):175-182. doi: 10.3928/19404921-20160120-01. PubMed
19. Coleman EA, Roman SP, Hall KA, Min SJ. Enhancing the care transitions intervention protocol to better address the needs of family caregivers. J Healthc Qual. 2015;37(1):2-11. doi: 10.1097/01.JHQ.0000460118.60567.fe. PubMed
Patients who are discharged from the hospital with home healthcare (HHC) are older, sicker, and more likely to be readmitted to the hospital than patients discharged home without HHC.1-3 Communication between clinicians in different settings is a key factor in successful transitions. In prior work, we focused on communication between primary care providers, hospitalists, and HHC nurses to inform efforts to improve care transitions.4,5 In one study, HHC nurses described that patients frequently have expectations beyond the scope of what skilled HHC provides,5 which prompted us to also question experiences of patients and caregivers after discharge with skilled HHC (eg, nursing and physical therapy).
In a prior qualitative study by Foust and colleagues, HHC patients and caregivers described disparate experiences around preparation for hospital discharge—patients expressed knowing about the timing and plans for discharge, and the caregivers frequently felt left out of this discussion.6 In other studies, caregivers of recently discharged patients have described feeling excluded from interactions with clinicians both before and after discharge.7,8 In another recent qualitative study, caregivers described uncertainty about their role compared with the HHC role in caring for the patient.9
As of 2016, a majority of states had passed the Caregiver Advise, Record, and Enable (CARE) Act, which requires hospitals to (1) record a family caregiver in the medical record, (2) inform this caregiver about discharge, and (3) deliver instructions with education about medical tasks that they will need to complete after discharge.10
METHODS
Study Design
In this qualitative descriptive case study, we interviewed HHC patients, an involved caregiver, and the HHC clinician completing the first HHC visit within 7-14 days following hospital discharge. We chose this timeframe to allow patients to receive one or more HHC visits following hospital discharge.
Population
- >65 years old,12 eligibility was initially limited to patients
- >65 years old. Due to recruitment challenges, the age range was broadened to
- >50 years old in October 2017.
Because our goal was to better understand the experience of general medicine patients with multiple comorbidities, we recruited patients from one general medicine unit at an academic hospital in Colorado. Patients on this unit were screened for eligibility Monday-Friday (excluding weekends and holidays) based on research assistant availability.
Criteria included are as follows: HHC referral, three or more comorbidities, resides in the community prior to admission (ie, not in a facility), cognitively intact, English speaking, and able to identify a caregiver participating in their care. Eligible patients were approached for written consent prior to discharge to allow us to contact them 7-14 days after discharge for an interview by phone or in their home, per their preference. At the time of consent, patients provided contact information for their informal caregiver. Caregiver eligibility criteria included the following: age ≥18 years and provides caregiving at least one hour a week before hospital discharge. HHC clinicians approached for interviews had completed the first HHC visit for the patient following discharge. Both caregivers and HHC clinicians provided verbal consent for interviews. All participants received a $25 gift card for participation in the study.
Framework and Data Collection
Our interview guides were organized by the Agency for Healthcare Research and Quality Care Coordination Framework, an approach we have taken in prior work.4,5,13 We added questions about patient preparation and self-management support to build on findings from a prior study with HHC nurses and on prior work by Coleman and colleagues.5,14 Sample questions from the interview guides for patients, caregivers, and HHC clinicians within key analysis domains are included in Appendix 1. The patient and caregiver interviews were completed by an individual with prior experience in social work and healthcare (SS). The HHC clinician interviews were completed by either this individual (SS) or a physician-researcher with experience in qualitative methods (CJ). Patients and caregivers could choose to be interviewed individually or together. All interviews were digitally recorded and transcribed verbatim.
Analysis
Patient interviews lasted an average of 43 minutes, caregiver interviews an average of 41 minutes, and HHC clinician interviews an average of 25 minutes
We observed the two main themes of clear and unclear expectations for HHC after discharge. Clear expectations occur when the patient and/or caregiver have expectations for HHC that align with the services they receive. Unclear expectations occur when the patient and/or caregiver expectations are either uncertain or misaligned with the services they receive. Although not all interviews yielded codes about clear or unclear expectations, patients described clear expectations in five cases and unclear expectations in another five cases.
In nine cases with more than one perspective available, expectations were compared within cases and found to be clear (three cases), unclear (three cases), or discordant (three cases) across perspectives. For the discordant cases, the description of clear and unclear expectations differed between patients and either their caregiver or their HHC clinician. Patients and caregivers with clear expectations for HHC frequently described prior experiences with skilled HHC or work experience within the healthcare field. In most cases with unclear expectations, the patient and caregiver did not have prior experience with HHC. In addition, the desire for assistance with personal care for patients such as showering and housekeeping was described by caregivers with unclear expectations. The results are organized into clear, unclear, and discordant expectations from the perspectives of patients, caregivers, and HHC clinicians within cases.
Clear Expectations within Cases
Clear expectations for HHC were identified across perspectives in three cases, with sample quotes provided in Table 2. In the case of patient 1, the patient and HHC nurse had known each other for over two years because the patient had a wound requiring long-term HHC services. A caregiver did not complete an interview in this case. With patient 2, the patient, caregiver, and HHC physical therapist (PT) all describe that the patient had clear expectations for HHC. In this case, the patient and caregiver describe feeling prepared because of previously receiving HHC, prior work experience in the healthcare field, and a caregiver with experience working in HHC. In the case of patient 3, the patient had previously received HHC from the same HHC nurse.
Unclear Expectations across Cases
For the three cases in which unclear expectations were described across perspectives, two of the patients described being new to HHC, with representative quotes in Table 2. Patient 4 and her caregiver are new to HHC and describe unclear expectations for both the HHC referral and the HHC role, which was also noted by the HHC clinician. Of note, the caregiver for patient 4 further described that she was unable to be present for the first HHC visit. In the case of patient 5, although the patient had previously received HHC, the patient describes not knowing why the HHC PT needs to see her after discharge, which is also noted by the HHC PT. Finally, both patient 6 and her HHC PT describe that the patient was not sure about their expectations for HHC and that HHC was a new experience for them.
Discordant Expectation Clarity across Cases
In three of the cases, the description of clear and unclear expectations was discrepant across roles. In case 7, the caregiver and patient are new to HHC and express different perspectives about expectations for HHC. The HHC clinician, in this case, did not complete an interview. The caregiver describes not being present for the first HHC visit and no awareness that the patient was being discharged with HHC:
Caregiver: Well, we didn’t even know she had home health until she got home.
The same caregiver also expresses unclear expectations for HHC:
Caregiver: It’s pretty cloudy. They (the HHC clinicians) don’t help her with her laundry, they don’t help with the housekeeping, they don’t help… with her showers so somebody is there when she showers. They don’t do anything. The only two things like I said is the…home healthcare comes in on Wednesdays to see what she needs and then the therapy comes in one day a week.
However, the patient expresses more clear expectations that are being met by HHC.
Patient: They (HHC) have met my expectations. They come in twice a week. They do vitals, take vitals and discuss with me, you know, what my feelings are, how I’m doing and I know they have met my expectations.
In case 8, although the patient describes knowing about the HHC PT involvement in her care, she expresses some unclear expectations about an HHC nurse after discharge.
Patient: As far as home health, I didn’t have a real …plan there at the hospital… They knew about (the HHC PT) coming once a week but as far as, you know, a nurse coming by to check on me, no.
However, the HHC PT describes feeling that the patient had clear expectations for HHC after discharge:
Interviewer: Can you reflect on whether she was prepared to receive home healthcare?
HHC PT: Yeah, she was ready.
Interviewer: …do you feel like she was prepared to know what to expect from you?
HHC PT: Yeah, but I think that comes from being a previous patient also.
Finally, in case 9, the patient describes clear expectations for HHC even though they were new to HHC:
Patient: …I knew what the PT was going to do and …I still need her because I’ve lost so much weight so she’s been really good, instrumental, at giving me exercises… Occupational therapist…she’s going to teach me how to shave, she’s going to teach me how to get ready for the day.
The HHC PT describes that although the patient knew the PT role, they reflect that the patient may have been somewhat unclear about expectations for the first HHC visit:
HHC PT: He knew all that it entailed with the exception of he didn’t really know what the first day was going to be like and the first day I don’t usually do treatment because it does take a long time to get all the paperwork signed, to do the evaluation and the fact that it takes two hours to do that note.
DISCUSSION
In this qualitative case study with HHC patients, caregivers, and clinicians, the participants described varying levels of expectation clarity for HHC after discharge. We triangulated across and within cases and found three cases with clear expectations and three cases with unclear expectations for HHC across perspectives. In three additional cases, we found discordant expectations across perspectives: patients and HHC clinician expectations differed in two of the cases and a patient and caregiver differed in one case. Of interest, in all three cases of clear expectations across perspectives, the patients and/or caregivers had prior HHC or healthcare work experience. In contrast,
Prior studies in this area have included a qualitative study HHC patients, caregivers, and clinicians by Foust and colleagues in which multiple caregivers described finding out about the discharge from the patient or other caregivers, rather than being actively engaged by clinicians.6 In another recent qualitative study by Arbaje and colleagues, a majority of caregivers described “mismatched expectations” about HHC services, in which caregivers
When caregivers have unclear expectations for HHC, they could be expressing the need for more support after hospital discharge, which suggests an active role for hospital teams to assess and address additional support needs with the patients and caregivers. For example, if the patient or caregiver request additional personal care services, a home health aide could help to reduce caregiver burden and improve the support network for the patient. In a prior study in which patients were asked what would help them to make informed decisions about postacute care options, the patients described wanting to receive practical information that could describe how it would apply to their specific situation and perceived needs.18 To provide this for patients and caregivers, it would follow that hospitals could provide information about skilled HHC nursing and therapies and information about services that could meet additional needs, such as home health aides.
Limitations of this study include that it was a small qualitative case study of patients, caregivers, and HHC clinicians from one medical unit at one academic medical center. Most patients in this study had Medicare insurance, were 65 years and older, white, and female.
In conclusion, to improve care transitions for HHC patients and their caregivers, emphasizing engagement of caregivers is key to ensure that they are educated about HHC, provided with additional support as needed, and included in initial HHC visits once the patients are at home. Even though patients and caregivers with prior HHC experience often had clear expectations for HHC, a strategy to uniformly engage caregivers across a range of experience can ensure caregivers have all the information and support needed to optimize care transitions to HHC.
Disclosures
The authors have nothing to disclose.
Funding
Dr. Christine Jones is supported by grant number K08HS024569 from the Agency for Healthcare Research and Quality. Jason Falvey was supported by grant F31AG056069 from the National Institute on Aging, National Institutes of Health and is currently supported by T32AG019134. The content is solely the responsibility of the authors and does not necessarily represent the official views of the Agency for Healthcare Research and Quality or the National Institutes of Health.
1. Jones CD, Wald HL, Boxer RS, et al. Characteristics associated with home health care referrals at hospital discharge: results from the 2012 National Inpatient Sample. Health Serv Res. 2017;52(2):879-894. doi: 10.1111/1475-6773. PubMed
2. Avalere Health. Home Health Chartbook 2015: Prepared for the Alliance for Home Health Quality and Innovation. 2016.
3. Hospital Compare. https://www.medicare.gov/hospitalcompare/search.html. Accessed May 1, 2017.
4. Jones CD, Vu MB, O’Donnell CM, et al. A failure to communicate: a qualitative exploration of care coordination between hospitalists and primary care providers around patient hospitalizations. J Gen Intern Med. 2015;30(4):417-424. doi: 10.1007/s11606-014-3056-x. PubMed
5. Jones CD, Jones J, Richard A, et al. “Connecting the dots”: a qualitative study of home health nurse perspectives on coordinating care for recently discharged patients. J Gen Intern Med. 2017;32(10):1114-1121. doi: 10.1007/s11606-017-4104-0. PubMed
6. Foust JB, Vuckovic N, Henriquez E. Hospital to home health care transition: patient, caregiver, and clinician perspectives. West J Nurs Res. 2012;34(2):194-212. doi: 10.1177/0193945911400448. PubMed
7. Blair J, Volpe M, Aggarwal B. Challenges, needs, and experiences of recently hospitalized cardiac patients and their informal caregivers. J Cardiovasc Nurs. 2014;29(1):29-37. doi: 10.1097/JCN.0b013e3182784123. PubMed
8. Coleman EA, Roman SP. Family caregivers’ experiences during transitions out of hospital. J Healthc Qual. 2015;37(1):12-21. doi: 10.1097/01.JHQ.0000460117.83437.b3. PubMed
9. Arbaje AI, Hughes A, Werner N, et al. Information management goals and process failures during home visits for middle-aged and older adults receiving skilled home healthcare services after hospital discharge: a multisite, qualitative study. BMJ Qual Saf. 2018. doi: 10.1136/bmjqs-2018-008163. PubMed
10. Coleman EA. Family caregivers as partners in care transitions: the caregiver advise record and enable act. J Hosp Med. 2016;11(12):883-885. doi: 10.1002/jhm.2637. PubMed
11. Jones AL, Harris-Kojetin L, Valverde R. Characteristics and use of home health care by men and women aged 65 and over. Natl Health Stat Report. 2012(52):1-7. PubMed
12. Tian W. An all-payer view of hospital discharge to postacute care, 2013. HCUP Statistical Brief #205. Rockville, Maryland; 2016. PubMed
13. McDonald KM, Sundaram V, Bravata DM, et al. Closing the Quality Gap: A Critical Analysis of Quality Improvement Strategies (Vol. 7: Care Coordination). Rockville, Maryland; 2007. PubMed
14. Coleman EA, Smith JD, Frank JC, Eilertsen TB, Thiare JN, Kramer AM. Development and testing of a measure designed to assess the quality of care transitions. Int J Integr Care. 2002;2:e02. doi: 10.5334/ijic.60. PubMed
15. Jones J, Nowels CT, Sudore R, Ahluwalia S, Bekelman DB. The future as a series of transitions: qualitative study of heart failure patients and their informal caregivers. J Gen Intern Med. 2015;30(2):176-182. doi: 10.1007/s11606-014-3085-5. PubMed
16. Lum HD, Jones J, Lahoff D, et al. Unique challenges of hospice for patients with heart failure: a qualitative study of hospice clinicians. Am Heart J. 2015;170(3):524-530 e523. doi: 10.1016/j.ahj.2015.06.019. PubMed
17. Kerr C, Nixon A, Wild D. Assessing and demonstrating data saturation in qualitative inquiry supporting patient-reported outcomes research. Expert Rev Pharmacoecon Outcomes Res. 2010;10(3):269-281. doi: 10.1586/erp.10.30. PubMed
18. Sefcik JS, Nock RH, Flores EJ, et al. Patient preferences for information on post-acute care services. Res Gerontol Nurs. 2016;9(4):175-182. doi: 10.3928/19404921-20160120-01. PubMed
19. Coleman EA, Roman SP, Hall KA, Min SJ. Enhancing the care transitions intervention protocol to better address the needs of family caregivers. J Healthc Qual. 2015;37(1):2-11. doi: 10.1097/01.JHQ.0000460118.60567.fe. PubMed
© 2019 Society of Hospital Medicine
Deimplementation of Routine Chest X-rays in Adult Intensive Care Units
Despite increased awareness of Choosing Wisely (CW)® recommendations to reduce low-value care,1 there is limited published data about strategies to implement these guidelines or evidence that they have influenced ordering patterns or reduced healthcare spending
In ICUs, CXR ordering strategies may be routine (daily) or on-demand (with clinical indication). The former strategy’s principal advantage is the potential to detect life-threatening situations that may otherwise escape diagnosis.11 Disadvantages include cost, radiation exposure, patient inconvenience, false-positive workups, and low diagnostic and therapeutic value.12,13 On-demand strategies may safely reduce CXR ordering by 32% to 45%.11-17 Based on this evidence, the Critical Care Societies Collaborative and the American College of Radiology have recommended on-demand CXR ordering.18,19 Here, we describe the effectiveness of an intervention to reduce CXR ordering in two ICUs while evaluating the deimplementation strategies using a validated framework.
METHODS
Setting and Design
Vanderbilt University Medical Center (VUMC) is an academic referral center in Nashville, Tennessee. The cardiovascular ICU (CVICU) has 27 beds and the medical ICU (MICU) has 34 beds. Acute care nurse practitioners (ACNPs) and two critical care physicians staff the CVICU; cardiology fellows, anesthesia critical care fellows, and transplant and cardiac surgeons are also active in patient care. The MICU is staffed by two critical care physicians who supervise one team of ACNPs and two teams of medical residents who rotate through the unit every two weeks. Each MICU team is assigned a fellow in pulmonary and critical care.
We conducted a prospective, nonrandomized study in these units from October 2015 to June 2016. The VUMC Institutional Review Board approved the intervention as a quality improvement (QI) activity, waiving the requirement for informed consent.
Intervention
Following the top CW recommendation of the Critical Care Societies Collaborative—“Don’t order diagnostic tests at regular intervals (such as every day), but rather in response to specific clinical questions.”19—the VUMC resident-led CW Steering Committee designed a multifaceted approach to reduce ordering of routine CXRs in ICUs. The intervention included a didactic session on CW and proper CXR ordering practices, peer champions, data audits, and feedback to providers through weekly e-mails (see Supplemental Materials, 1 – Resident Presentation and 2 – CXR Flyer). 20
In September 2015, CVICU and MICU teams received a didactic session highlighting CW, current CXR ordering rates, and the plan for reducing CXR ordering. On October 5, 2015, teams began receiving weekly e-mails with ordering rates defined as CXRs ordered per patient per day and a brief rationale for reducing unnecessary CXRs. To encourage friendly competition, we provided weekly rates to the MICU teams, allowing for transparent benchmarking against one another. A similar competition strategy was not used in the CVICU due to the lack of multiple teams.
In the CVICU, two ACNPs volunteered as peer champions. These champions coordinated data feedback and advocated for the intervention among their colleagues. In the MICU, three internal medicine residents volunteered as peer champions and fulfilled similar roles.
To facilitate deimplementation, we conducted two Plan-Do-Study-Act (PDSA) cycles, the first from November to mid-December 2015 and the second from mid-December 2015 to mid-January 2016. During these cycles, we tailored our deimplementation strategy based on barriers identified by the peer champions and ICU leaders (described in the Qualitative Results section). Peer champions and the CW Steering Committee generated potential solutions by conversing with stakeholders and using the Expert Recommendations for Implementing Change (ERIC).20 Interventions included disseminating promotional flyers, holding meetings with stakeholders, and providing monthly CXR ordering rates. After the PDSA cycles, we continued reexamining the deimplementation efforts by reviewing ordering rates and soliciting feedback from ICU leaders and peer champions. However, no significant changes to the intervention were made during this time.
Quantitative Evaluation
We extracted data from VUMC’s Enterprise Data Warehouse during the intervention period (October 5, 2015 to May 24, 2016) and a historical control period (October 1, 2014 to October 4, 2015). Within each ICU, descriptive statistics were used to compare patient cohorts in the baseline and intervention periods by age, sex, and race.
The primary outcome was CXRs ordered per patient per day by hospital unit (CVICU or MICU). The baseline period included all data between October 1, 2014 and September 15, 2015. To account for priming of providers from didactic education, we allowed a washout period from September 16, 2015 to October 4, 2015. As a preliminary analysis, we compared CXR rates in the baseline and intervention periods using Wilcoxon rank-sum tests. We then conducted interrupted time-series analyses with segmented linear regression to assess differences in linear trends in CXR rates over the two periods. To account for different staffing models in the MICU, we stratified the impact of the intervention by team—medical resident (physician) or ACNP. R version 3.4.0 was used for statistical analysis.21
Qualitative Evaluation
Our qualitative evaluation consisted of embedded observation and semistructured interviews with stakeholders. The qualitative portion was guided by the Consolidated Framework for Implementation Research (CFIR), a widely used framework for design and evaluation of improvement initiatives that helped us to determine major facilitators and barriers to implementation.22,23
Embedded Observation
From November 2015 to January 2016, we observed morning rounds in the CVICU and MICU one to two times weekly to understand factors facilitating and inhibiting uptake of the intervention. Observations were recorded and organized using a CFIR-based template and directed toward understanding interactions among team members (eg, the decision-making process hierarchy), team workflows and decision-making processes, process of ordering CXRs, and providers’ knowledge and perceptions of the CXR intervention (see Supplemental Material, 3 – CFIR Table).22,23 After rounds, ICU team members were invited to share suggestions for improving the intervention. All observations occurred during and shortly following morning rounds when the vast majority of routine CXRs are ordered; we did not evaluate night or evening workflows. In the spirit of continuous improvement, we evaluated data in real-time.
Semistructured Interviews
Based on the direct observations, we developed semistructured interview questions to further evaluate provider perspectives (eg, “Do you believe ICU patients need a daily CXR?”) and constructs aligning with CFIR (eg, “intervention source—internally vs externally developed;” see Supplemental Material, 4 – Interview Questions).
Stakeholders from both ICUs were recruited through e-mail and in-person requests to participate in semistructured interviews. In the CVICU, we interviewed critical care physicians, anesthesia critical care fellows, and ACNPs. In the MICU, we interviewed medical students, interns, residents, critical care fellows, attending intensivist physicians, and ACNPs. We also interviewed X-ray technologists who routinely perform portable films in the units.
RESULTS
Quantitative Results

Cardiovascular Intensive Care Unit
The median baseline CXR ordering rate in the CVICU was 1.16 CXRs per patient per day, with interquartile range (IQR) 1.06-1.28. During the intervention period, the rate dropped to 1.07 (IQR 0.94-1.21; P < .001; Table 2). The time-series analysis suggested an essentially flat trend during the baseline period, followed by a small but significant drop in ordering rates during the intervention period (P < .001; Table 3 and Figure 1). Ordering rates appeared to increase slightly over the course of the intervention period, but this slight upward trend was not significantly different from the flat trend seen during the baseline period.
Medical Intensive Care Unit
For both physician and ACPN teams, the median baseline CXR ordering rates in the MICU were much lower than the baseline rate in the CVICU (Table 2). For the MICU physician care team, the baseline CXR ordering rate was 0.60 CXRs per patient per day (IQR 0.48-0.73). For the ACNP team, the median rate was 0.39 CXRs per patient per day (IQR 0.21-0.57). Both rates stayed approximately the same during the intervention period (Table 2). The time-series analysis suggested a statistically significant but very slight downward trend in CXR ordering rates during the baseline period, in the physician (P = .011) and ACNP (P = .022) teams (Table 3, Figure 2). Under this model, a small increase in CXR ordering initially occurred during the intervention period for both physician and ACNP teams (P = .010 and P = .055, respectively), after which the rates declined slightly. Trends in ordering rates during the intervention period were not significantly different from the slight downward trends seen during the baseline period.
Qualitative Results
We identified 25 of 39 CFIR constructs as relevant to the initiative (see Supplemental Materials, 3 – CFIR Table.) We determined the major facilitators of deimplementation to be peer champion discussions about CXR ordering on rounds and weekly data feedback, particularly if accompanied by in-person follow-up.
We also noted differences in CXR ordering rationales and decisions between the units. Generally, residents in the MICU and ACNPs in the CVICU made decisions to order CXRs. However, decisions were influenced by the expectations of attending physicians. While CVICU providers tended to order CXRs reflexively as part of morning labs, MICU providers—in particular, ACNPs who had been trained on indications for proper CXR ordering—generally ordered CXRs for specific indications (eg, worsening respiratory status). Of note, MICU ACNPs reported the use of bedside ultrasound as an alternate imaging modality and a reason for their higher threshold to order CXRs.
Deimplementation barriers in both units included the need to identify goal CXR ordering rates and the intervention’s limited visibility. To address these barriers, we conducted PDSA cycles and used the CFIR and ERIC to generate potential solutions.24 We established a goal of a 20% absolute reduction in the CVICU, added monthly CXR rates to weekly e-mail reports to better account for variations in patient populations and ordering practices, and circulated materials to promote on-demand CXR ordering. Promotional materials contained guidelines on CXR ordering and five “Frequently Held Misconceptions” about ordering practices with succinct, evidence-based explanations (see Supplemental Material, 2 – CXR Flyer).
Approximately four months after the start of intervention, some CVICU physicians became concerned that on-demand CXR ordering might be inappropriate for high-risk surgical patients, including those who are undergoing or have undergone heart transplants, lung transplants, or left-ventricular assist device placement. This concern arose following two adverse outcomes, which were not attributed to the CXR initiative, but which heightened concerns about patient safety. A rise in CXR ordering then occurred, and CVICU providers requested that we perform an analysis of these high-risk groups. While segmented linear regression in this subgroup suggested that average daily CXR ordering rates did decrease among the high-risk group at the start of the intervention period (P = .001), the difference between the rates in the two periods was not significant using the Wilcoxon rank-sum test. Exclusion of these patients from the main analysis did not alter the interpretation of the findings reported above for the CVICU.
DISCUSSION
A deimplementation intervention using provider education, peer champions, and data feedback was associated with fewer CXRs in the CVICU (P < .001) but not in the MICU. The CFIR-guided qualitative analysis was valuable for evaluating our deimplementation strategy and for identifying differences between the two ICUs.
Relatively few studies have demonstrated effective interventions that address CW recommendations.25-28 However, three population-level analyses of insurance claims show mixed results.3,4,29 Experts have thus proposed using implementation science to improve uptake of CW recommendations.2,3,7,8 Our study demonstrates the effectiveness of this approach. As expected, providers largely endorsed an on-demand CXR ordering strategy. Using the CFIR, however, we discovered barriers (eg, concern that data feedback did not reflect variations in patients’ needs). Using methods from implementation science allowed us to diagnose and tailor our approaches.
Our qualitative evaluation suggested that the intervention was ineffective mostly due to CFIR’s “inner setting” constructs, including resident fatigue, competing priorities, and decreased investment in QI projects because of the rotating nature of providers in training. Baseline CXR ordering rates in the MICU were also considerably lower than in the CVICU. We observed that CVICU providers ordered many CXRs following the placement of lines or tubes and that ACNPs in the MICU had received education on appropriate CXR ordering practices and had access to an alternate imaging modality in ultrasound. These factors may partially explain the difference in baseline rates.
As noted in a study of cardiac stress testing guidelines, the existence of high-value care recommendations does not mean overuse.30 Indeed, the lack of significant CXR over-ordering in the MICU highlights the importance of baseline measurement and partnering with information technology departments to create the best possible data feedback systems.30-32 Our experience shows that these systems should provide sufficient pre-implementation data (ideally >1 year), such that teams selecting QI projects can ensure that a project is a good use of institutional resources and change capital.
To inform future work, we informally assessed program costs and savings. We estimate the initiative cost $1,600, including $1,000 for curriculum development and teaching time, $300 for educational materials, and $300 for CXR tracking dashboard development. Hospital charges and reimbursements for CXR vary widely.33 We calculated savings using a range of rates, from a conservative $23 (the Medicare reimbursement rate for single-view CXR, CPT code 71010, global fee) to $50 (an approximate blended reimbursement rate across payers).34,35 In the CVICU, we estimate that 51 CXRs were avoided each month, saving $1,173-$2,550 per month or $9,384-$20,400 over eight months of follow-up. Annualizing these figures, we estimate net savings of $12,476-$29,000 in the first year in a 27-bed ICU. Costs to continue the program include education of new employees, booster training, and dashboard maintenance for an estimated annual cost of $1,000. It is difficult to estimate effectiveness over time, but if we conservatively assume that 30 CXRs were avoided each month, then the projected savings would be $8,280-$18,000 per year or an annual net savings of $7,280-$17,000 in the ICU. Although these amounts are modest, providing trainees with experiential learning opportunities in high-value care is valuable in its own right, meets curricular goals, may result in spill-over effects to other diagnostic and therapeutic decisions, and may influence long-term practice patterns. Institutional decisions to pursue projects such as this should take into account these potential benefits.
This evaluation is not without limitations. First, the study was conducted in a single tertiary-care hospital, potentially limiting its generalizability.36 Second, the study design lacked a concurrent control group, and observed outcomes may have been influenced by broader CXR utilization trends, increased awareness of low-value care generally or from previous CW projects at VUMC, seasonal effects, or the Hawthorne effect. Third, the study outcome was all CXRs ordered, rather than CXRs that were unnecessary or not clinically indicated. We chose all CXRs because it was more pragmatic, did not require clinical case review, and could be incorporated promptly into dashboards, enabling timely performance feedback. Other performance measures have taken a similar tack (eg, tracking all-cause readmissions rather than preventable readmissions). Given this approach, we did not track clinical indications for CXRs (eg, central line placement). Fourth, although we compared resident and APRN orders, we did not collect data on other provider characteristics such as years in/out of training or board certification status. These considerations should be addressed in future research.
Finally, the increase in CVICU CXR ordering at the end of the intervention period, which occurred following two adverse events, raises concerns about sustainability. While unrelated to CXR orders, the events resulted in increased ordering of diagnostic tests and showed the difficulty of deimplementation in ICUs. Indeed, some CVICU providers argued that on-demand CXR ordering represented minimal potential cost savings and had not been studied among heart and lung transplant patients. Subsequently, Tonna et al. have shown that on-demand CXR ordering can be safely implemented among such patients.37 Also similar to our study, Tonna et al. observed an initial decrease in CXR ordering, followed by a gradual increase toward baseline ordering rates. These findings highlight the need for sustained awareness and interventions and for the careful selection of high-value projects.
In conclusion, our study shows that a deimplementation intervention based on CW recommendations can reduce CXR ordering and that ongoing evaluation of contextual factors provides insights for both real-time modifications of current interventions and the design of future interventions. We found that messaging about reducing unnecessary tests works well when discussions are framed at the unit level but may be counterproductive if used to question individual ordering decisions.38 Additional lessons learned include the value of participation on rounds to build trust among stakeholders, the utility of monthly rather than weekly statistics for feedback, stakeholder input and peer champions, and differences in approach with physician and ACNP audiences.
Acknowledgments
The authors thank the VUMC Choosing Wisely committee; Mr. Bill Harrell in Advanced Data Analytics for developing the Tableau platform used in our data feedback strategy; Emily Feld, MD, Jerry Zifodya, MD, and Ryan Kindle, MD for assisting with data feedback to providers in the MICU; Todd Rice, MD, Director of the MICU, for his support of the initiative; and Beth Prusaczyk, PhD, MSW and David Stevenson, PhD for providing feedback on earlier drafts of this manuscript.
Disclosures
Dr. Kripalani reports personal fees from Verustat, personal fees from SAI Interactive, and equity from Bioscape Digital, outside the submitted work. All other authors have nothing to disclose.
Funding
This work was supported by an Innovation Grant from the Alliance for Academic Internal Medicine (AAIM, 2016) and by the Departments of Internal Medicine and Graduate Medical Education at Vanderbilt University Medical Center. The AAIM did not have a role in the study design, data collection, data analysis, data interpretation, or manuscript writing.
1. Cassel CK, Guest JA. Choosing Wisely: Helping physicians and patients make smart decisions about their care. JAMA. 2012;307(17):1801-1802.
2. Gonzales R, Cattamanchi A. Changing clinician behavior when less is more. JAMA Intern Med. 2015;175(12):1921-1922.
3. Rosenberg A, Agiro A, Gottlieb M, et al. Early trends among seven recommendations from the Choosing Wisely campaign. JAMA Intern Med. 2015;175(12):1913-1920.
4. Hong AS, Ross-Degnan D, Zhang F, Wharam JF. Small decline in low-value back imaging associated with the ‘Choosing Wisely’ campaign, 2012-14. Health Aff (Millwood). 2017;36(4):671-679. doi: 10.1377/hlthaff.2016.1263.
5. Parks AL, O’Malley PG. From choosing wisely to practicing value—more to the story. JAMA Intern Med. 2016;176(10):1571-1572.
6. Johnson PT, Pahwa AK, Feldman LS, Ziegelstein RC, Hellmann DB. Advancing high-value health care: a new AJM column dedicated to cost-conscious care quality improvement. Am J Med. 2017;130(6):619-621. doi: 10.1016/j.amjmed.2016.12.018.
7. Eccles MP, Mittman BS. Welcome to implementation science. Implement Sci. 2006;1:1. doi: 10.1186/1748-5908-1-1.
8. Bhatia RS, Levinson W, Shortt S, et al. Measuring the effect of Choosing Wisely: an integrated framework to assess campaign impact on low-value care. BMJ Qual Saf. 2015;24:523-531. doi: 10.1136/bmjqs-2015-004070.
9. Selby K, Barnes GD. Learning to de-adopt ineffective healthcare practices. Am J Med. 2018;131(7):721-722. doi: 10.1016/j.amjmed.2018.03.014.
10. Curran GM, Bauer M, Mittman B, Pyne JM, Stetler C. Effectiveness-implementation hybrid designs. Med Care. 2012;50(3):217-226. doi: 10.1097/MLR.0b013e3182408812.
11. Ganapathy A, Adhikari NK, Spiegelman J, Scales DC. Routine chest x-rays in intensive care units: a systematic review and meta-analysis. Crit Care. 2012;16(2):R68. doi: 10.1186/cc11321.
12. Graat ME, Kröner A, Spronk PE, et al. Elimination of daily routine chest radiographs in a mixed medical-surgical intensive care unit. Intensive Care Med. 2007;33(4):639-644. doi: 10.1007/s00134-007-0542-1.
13. Hendrikse KA, Gratama JWC, Ten Hove W, Rommes JH, Schultz MJ, Spronk PE. Low value of routine chest radiographs in a mixed medical-surgical ICU. Chest. 2007;132(3):823-828. doi: 10.1378/chest.07-1162.
14. Clec’h C, Simon P, Hamdi A, et al. Are daily routine chest radiographs useful in critically ill, mechanically ventilated patients? A randomized study. Intensive Care Med. 2008;34(2):264-270. doi: 10.1007/s00134-007-0919-1.
15. Oba Y, Zaza T. Abandoning daily routine chest radiography in the intensive care unit: meta-analysis. Radiology. 2010;255(2):386-395. doi: 10.1148/radiol.10090946.
16. Mets O, Spronk PE, Binnekade J, Stoker J, de Mol BAJM, Schultz MJ. Elimination of daily routine chest radiographs does not change on-demand radiography practice in post-cardiothoracic surgery patients. J Thorac Cardiovasc Surg. 2007;134(1):139-144. doi: 10.1016/j.jtcvs.2007.02.029.
17. Hejblum G, Chalumeau-Lemoine L, Ioos V, et al. Comparison of routine and on-demand prescription of chest radiographs in mechanically ventilated adults: a multicentre, cluster-randomised, two-period crossover study. Lancet. 2009;374(9702):1687-1693. doi: 10.1016/S0140-6736(09)61459-8.
18. McComb BL, Chung JH, Crabtree TD, et al. ACR appropriateness criteria® routine chest radiography. J Thorac Imaging. 2016;31(2):W13-W15. doi: 10.1097/RTI.0000000000000200.
19. Halpern SD, Becker D, Curtis JR, et al. An official American Thoracic Society/American Association of Critical-Care Nurses/American College of Chest Physicians/Society of Critical Care Medicine policy statement: the Choosing Wisely® top 5 list in critical care medicine. Am J Respir Crit Care Med. 2014;190(7):818-826. doi: 10.1164/rccm.201407-1317ST.
20. Powell BJ, Waltz TJ, Chinman MJ, et al. A refined compilation of implementation strategies: Results from the Expert Recommendations for Implementing Change (ERIC) project. Implement Sci. 2015;10:21. doi: 10.1186/s13012-015-0209-1.
21. R [computer program]. Version 3.4.0. Vienna, Austria: R Foundation for Statistical Computing; 2013.
22. Damschroder LJ, Aron DC, Keith RE, Kirsh SR, Alexander JA, Lowery JC. Fostering implementation of health services research findings into practice: a consolidated framework for advancing implementation science. Implement Sci. 2009;4:50. doi: 10.1186/1748-5908-4-50.
23. Kirk MA, Kelley C, Yankey N, Birken SA, Abadie B, Damschroder L. A systematic review of the use of the Consolidated Framework for Implementation Research. Implement Sci. 2016;11:72. doi: 10.1186/s13012-016-0437-z.
24. Speroff T, James BC, Nelson EC, Headrick LA, Brommels M, Reed JE. Guidelines for appraisal and publication of PDSA quality improvement. Qual Manag Health Care. 2014;13(1):33-39. doi: 10.1097/00019514-200401000-00003.
25. Corson AH, Fan VS, White T, et al. A multifaceted hospitalist quality improvement intervention: Decreased frequency of common labs. J Hosp Med. 2015;10(6):390-395. doi: 10.1002/jhm.2354.
26. Ferrari R. Evaluation of the Canadian Rheumatology Association Choosing Wisely recommendation concerning anti-nuclear antibody (ANA) testing. Clin Rheumatol. 2015;34(9):1551-1556. doi: 10.1007/s10067-015-2985-z.
27. Ferrari R, Prosser C. Testing vitamin D levels and choosing wisely. JAMA Intern Med. 2016;176(7):1019-1020.
28. Iams W, Heck J, Kapp M, et al. A multidisciplinary housestaff-led initiative to safely reduce daily laboratory testing. Acad Med. 2016;91(6):813-820. doi: 10.1097/ACM.0000000000001149.
29. Kost A, Genao I, Lee JW, Smith SR. Clinical decisions made in primary care clinics before and after Choosing WiselyTM. J Am Board Fam Med. 2015;28(4):471-474. doi: 10.3122/jabfm.2015.05.140332.
30. Kerr EA, Chen J, Sussman JB, Klamerus ML, Nallamothu BK. Stress testing before low-risk surgery: so many recommendations, so little overuse. JAMA Intern Med. 2015;175(4):645-647. doi: 10.1001/jamainternmed.2014.7877.
31. Colla CH, Morden NE, Sequist TD, Schpero WL, Rosenthal MB. Choosing wisely: prevalence and correlates of low-value health care services in the United States. J Gen Intern Med. 2014;30(2):221-228. doi: 10.1007/s11606-014-3070-z.
32. Shetty KD, Meeker D, Schneider EC, Hussey PS, Damberg CL. Evaluating the feasibility and utility of translating Choosing Wisely recommendations into e-Measures. Healthcare. 2015;3(1):24-37. doi: 10.1016/j.hjdsi.2014.12.002.
33. Woodland DC, Cooper CR, Rashid MF, et al. Routine chest X-ray is unnecessary after ultrasound-guided central venous line placement in the operating room. J Crit Care. 2018;46:13-16. doi: 10.1016/j.jcrc.2018.03.027.
34. Krause TM, Ukhanova M, Revere FL. Private carriers’ physician payment rates compared with Medicare and Medicaid. Tex Med. 2016;112(6):e1.
35. American College of Radiology. Medicare physician fee schedule. Available at https://www.acr.org/Advocacy-and-Economics/Radiology-Economics/Medicare-Medicaid/MPFS. Accessed October 15, 2018.
36. Siegel MD, Rubinowitz AN. Routine daily vs on-demand chest radiographs in intensive care. Lancet. 2009;374(9702):1656-1658. doi: 10.1016/S0140-6736(09)61632-9.
37. Tonna JE, Kawamoto K, Presson AP, et al. Single intervention for a reduction in portable chest radiography (pCXR) in cardiovascular and surgical/trauma ICUs and associated outcomes. J Crit Care. 2018;44:18-23. doi: 10.1016/j.jcrc.2017.10.003.
38. Wolfson D, Santa J, Slass L. Engaging physicians and consumers in conversations about treatment overuse and waste: a short history of the choosing wisely campaign. Acad Med. 2014;89(7):990-995. doi: 10.1097/ACM.0000000000000270.
Despite increased awareness of Choosing Wisely (CW)® recommendations to reduce low-value care,1 there is limited published data about strategies to implement these guidelines or evidence that they have influenced ordering patterns or reduced healthcare spending
In ICUs, CXR ordering strategies may be routine (daily) or on-demand (with clinical indication). The former strategy’s principal advantage is the potential to detect life-threatening situations that may otherwise escape diagnosis.11 Disadvantages include cost, radiation exposure, patient inconvenience, false-positive workups, and low diagnostic and therapeutic value.12,13 On-demand strategies may safely reduce CXR ordering by 32% to 45%.11-17 Based on this evidence, the Critical Care Societies Collaborative and the American College of Radiology have recommended on-demand CXR ordering.18,19 Here, we describe the effectiveness of an intervention to reduce CXR ordering in two ICUs while evaluating the deimplementation strategies using a validated framework.
METHODS
Setting and Design
Vanderbilt University Medical Center (VUMC) is an academic referral center in Nashville, Tennessee. The cardiovascular ICU (CVICU) has 27 beds and the medical ICU (MICU) has 34 beds. Acute care nurse practitioners (ACNPs) and two critical care physicians staff the CVICU; cardiology fellows, anesthesia critical care fellows, and transplant and cardiac surgeons are also active in patient care. The MICU is staffed by two critical care physicians who supervise one team of ACNPs and two teams of medical residents who rotate through the unit every two weeks. Each MICU team is assigned a fellow in pulmonary and critical care.
We conducted a prospective, nonrandomized study in these units from October 2015 to June 2016. The VUMC Institutional Review Board approved the intervention as a quality improvement (QI) activity, waiving the requirement for informed consent.
Intervention
Following the top CW recommendation of the Critical Care Societies Collaborative—“Don’t order diagnostic tests at regular intervals (such as every day), but rather in response to specific clinical questions.”19—the VUMC resident-led CW Steering Committee designed a multifaceted approach to reduce ordering of routine CXRs in ICUs. The intervention included a didactic session on CW and proper CXR ordering practices, peer champions, data audits, and feedback to providers through weekly e-mails (see Supplemental Materials, 1 – Resident Presentation and 2 – CXR Flyer). 20
In September 2015, CVICU and MICU teams received a didactic session highlighting CW, current CXR ordering rates, and the plan for reducing CXR ordering. On October 5, 2015, teams began receiving weekly e-mails with ordering rates defined as CXRs ordered per patient per day and a brief rationale for reducing unnecessary CXRs. To encourage friendly competition, we provided weekly rates to the MICU teams, allowing for transparent benchmarking against one another. A similar competition strategy was not used in the CVICU due to the lack of multiple teams.
In the CVICU, two ACNPs volunteered as peer champions. These champions coordinated data feedback and advocated for the intervention among their colleagues. In the MICU, three internal medicine residents volunteered as peer champions and fulfilled similar roles.
To facilitate deimplementation, we conducted two Plan-Do-Study-Act (PDSA) cycles, the first from November to mid-December 2015 and the second from mid-December 2015 to mid-January 2016. During these cycles, we tailored our deimplementation strategy based on barriers identified by the peer champions and ICU leaders (described in the Qualitative Results section). Peer champions and the CW Steering Committee generated potential solutions by conversing with stakeholders and using the Expert Recommendations for Implementing Change (ERIC).20 Interventions included disseminating promotional flyers, holding meetings with stakeholders, and providing monthly CXR ordering rates. After the PDSA cycles, we continued reexamining the deimplementation efforts by reviewing ordering rates and soliciting feedback from ICU leaders and peer champions. However, no significant changes to the intervention were made during this time.
Quantitative Evaluation
We extracted data from VUMC’s Enterprise Data Warehouse during the intervention period (October 5, 2015 to May 24, 2016) and a historical control period (October 1, 2014 to October 4, 2015). Within each ICU, descriptive statistics were used to compare patient cohorts in the baseline and intervention periods by age, sex, and race.
The primary outcome was CXRs ordered per patient per day by hospital unit (CVICU or MICU). The baseline period included all data between October 1, 2014 and September 15, 2015. To account for priming of providers from didactic education, we allowed a washout period from September 16, 2015 to October 4, 2015. As a preliminary analysis, we compared CXR rates in the baseline and intervention periods using Wilcoxon rank-sum tests. We then conducted interrupted time-series analyses with segmented linear regression to assess differences in linear trends in CXR rates over the two periods. To account for different staffing models in the MICU, we stratified the impact of the intervention by team—medical resident (physician) or ACNP. R version 3.4.0 was used for statistical analysis.21
Qualitative Evaluation
Our qualitative evaluation consisted of embedded observation and semistructured interviews with stakeholders. The qualitative portion was guided by the Consolidated Framework for Implementation Research (CFIR), a widely used framework for design and evaluation of improvement initiatives that helped us to determine major facilitators and barriers to implementation.22,23
Embedded Observation
From November 2015 to January 2016, we observed morning rounds in the CVICU and MICU one to two times weekly to understand factors facilitating and inhibiting uptake of the intervention. Observations were recorded and organized using a CFIR-based template and directed toward understanding interactions among team members (eg, the decision-making process hierarchy), team workflows and decision-making processes, process of ordering CXRs, and providers’ knowledge and perceptions of the CXR intervention (see Supplemental Material, 3 – CFIR Table).22,23 After rounds, ICU team members were invited to share suggestions for improving the intervention. All observations occurred during and shortly following morning rounds when the vast majority of routine CXRs are ordered; we did not evaluate night or evening workflows. In the spirit of continuous improvement, we evaluated data in real-time.
Semistructured Interviews
Based on the direct observations, we developed semistructured interview questions to further evaluate provider perspectives (eg, “Do you believe ICU patients need a daily CXR?”) and constructs aligning with CFIR (eg, “intervention source—internally vs externally developed;” see Supplemental Material, 4 – Interview Questions).
Stakeholders from both ICUs were recruited through e-mail and in-person requests to participate in semistructured interviews. In the CVICU, we interviewed critical care physicians, anesthesia critical care fellows, and ACNPs. In the MICU, we interviewed medical students, interns, residents, critical care fellows, attending intensivist physicians, and ACNPs. We also interviewed X-ray technologists who routinely perform portable films in the units.
RESULTS
Quantitative Results
Cardiovascular Intensive Care Unit
The median baseline CXR ordering rate in the CVICU was 1.16 CXRs per patient per day, with interquartile range (IQR) 1.06-1.28. During the intervention period, the rate dropped to 1.07 (IQR 0.94-1.21; P < .001; Table 2). The time-series analysis suggested an essentially flat trend during the baseline period, followed by a small but significant drop in ordering rates during the intervention period (P < .001; Table 3 and Figure 1). Ordering rates appeared to increase slightly over the course of the intervention period, but this slight upward trend was not significantly different from the flat trend seen during the baseline period.
Medical Intensive Care Unit
For both physician and ACPN teams, the median baseline CXR ordering rates in the MICU were much lower than the baseline rate in the CVICU (Table 2). For the MICU physician care team, the baseline CXR ordering rate was 0.60 CXRs per patient per day (IQR 0.48-0.73). For the ACNP team, the median rate was 0.39 CXRs per patient per day (IQR 0.21-0.57). Both rates stayed approximately the same during the intervention period (Table 2). The time-series analysis suggested a statistically significant but very slight downward trend in CXR ordering rates during the baseline period, in the physician (P = .011) and ACNP (P = .022) teams (Table 3, Figure 2). Under this model, a small increase in CXR ordering initially occurred during the intervention period for both physician and ACNP teams (P = .010 and P = .055, respectively), after which the rates declined slightly. Trends in ordering rates during the intervention period were not significantly different from the slight downward trends seen during the baseline period.
Qualitative Results
We identified 25 of 39 CFIR constructs as relevant to the initiative (see Supplemental Materials, 3 – CFIR Table.) We determined the major facilitators of deimplementation to be peer champion discussions about CXR ordering on rounds and weekly data feedback, particularly if accompanied by in-person follow-up.
We also noted differences in CXR ordering rationales and decisions between the units. Generally, residents in the MICU and ACNPs in the CVICU made decisions to order CXRs. However, decisions were influenced by the expectations of attending physicians. While CVICU providers tended to order CXRs reflexively as part of morning labs, MICU providers—in particular, ACNPs who had been trained on indications for proper CXR ordering—generally ordered CXRs for specific indications (eg, worsening respiratory status). Of note, MICU ACNPs reported the use of bedside ultrasound as an alternate imaging modality and a reason for their higher threshold to order CXRs.
Deimplementation barriers in both units included the need to identify goal CXR ordering rates and the intervention’s limited visibility. To address these barriers, we conducted PDSA cycles and used the CFIR and ERIC to generate potential solutions.24 We established a goal of a 20% absolute reduction in the CVICU, added monthly CXR rates to weekly e-mail reports to better account for variations in patient populations and ordering practices, and circulated materials to promote on-demand CXR ordering. Promotional materials contained guidelines on CXR ordering and five “Frequently Held Misconceptions” about ordering practices with succinct, evidence-based explanations (see Supplemental Material, 2 – CXR Flyer).
Approximately four months after the start of intervention, some CVICU physicians became concerned that on-demand CXR ordering might be inappropriate for high-risk surgical patients, including those who are undergoing or have undergone heart transplants, lung transplants, or left-ventricular assist device placement. This concern arose following two adverse outcomes, which were not attributed to the CXR initiative, but which heightened concerns about patient safety. A rise in CXR ordering then occurred, and CVICU providers requested that we perform an analysis of these high-risk groups. While segmented linear regression in this subgroup suggested that average daily CXR ordering rates did decrease among the high-risk group at the start of the intervention period (P = .001), the difference between the rates in the two periods was not significant using the Wilcoxon rank-sum test. Exclusion of these patients from the main analysis did not alter the interpretation of the findings reported above for the CVICU.
DISCUSSION
A deimplementation intervention using provider education, peer champions, and data feedback was associated with fewer CXRs in the CVICU (P < .001) but not in the MICU. The CFIR-guided qualitative analysis was valuable for evaluating our deimplementation strategy and for identifying differences between the two ICUs.
Relatively few studies have demonstrated effective interventions that address CW recommendations.25-28 However, three population-level analyses of insurance claims show mixed results.3,4,29 Experts have thus proposed using implementation science to improve uptake of CW recommendations.2,3,7,8 Our study demonstrates the effectiveness of this approach. As expected, providers largely endorsed an on-demand CXR ordering strategy. Using the CFIR, however, we discovered barriers (eg, concern that data feedback did not reflect variations in patients’ needs). Using methods from implementation science allowed us to diagnose and tailor our approaches.
Our qualitative evaluation suggested that the intervention was ineffective mostly due to CFIR’s “inner setting” constructs, including resident fatigue, competing priorities, and decreased investment in QI projects because of the rotating nature of providers in training. Baseline CXR ordering rates in the MICU were also considerably lower than in the CVICU. We observed that CVICU providers ordered many CXRs following the placement of lines or tubes and that ACNPs in the MICU had received education on appropriate CXR ordering practices and had access to an alternate imaging modality in ultrasound. These factors may partially explain the difference in baseline rates.
As noted in a study of cardiac stress testing guidelines, the existence of high-value care recommendations does not mean overuse.30 Indeed, the lack of significant CXR over-ordering in the MICU highlights the importance of baseline measurement and partnering with information technology departments to create the best possible data feedback systems.30-32 Our experience shows that these systems should provide sufficient pre-implementation data (ideally >1 year), such that teams selecting QI projects can ensure that a project is a good use of institutional resources and change capital.
To inform future work, we informally assessed program costs and savings. We estimate the initiative cost $1,600, including $1,000 for curriculum development and teaching time, $300 for educational materials, and $300 for CXR tracking dashboard development. Hospital charges and reimbursements for CXR vary widely.33 We calculated savings using a range of rates, from a conservative $23 (the Medicare reimbursement rate for single-view CXR, CPT code 71010, global fee) to $50 (an approximate blended reimbursement rate across payers).34,35 In the CVICU, we estimate that 51 CXRs were avoided each month, saving $1,173-$2,550 per month or $9,384-$20,400 over eight months of follow-up. Annualizing these figures, we estimate net savings of $12,476-$29,000 in the first year in a 27-bed ICU. Costs to continue the program include education of new employees, booster training, and dashboard maintenance for an estimated annual cost of $1,000. It is difficult to estimate effectiveness over time, but if we conservatively assume that 30 CXRs were avoided each month, then the projected savings would be $8,280-$18,000 per year or an annual net savings of $7,280-$17,000 in the ICU. Although these amounts are modest, providing trainees with experiential learning opportunities in high-value care is valuable in its own right, meets curricular goals, may result in spill-over effects to other diagnostic and therapeutic decisions, and may influence long-term practice patterns. Institutional decisions to pursue projects such as this should take into account these potential benefits.
This evaluation is not without limitations. First, the study was conducted in a single tertiary-care hospital, potentially limiting its generalizability.36 Second, the study design lacked a concurrent control group, and observed outcomes may have been influenced by broader CXR utilization trends, increased awareness of low-value care generally or from previous CW projects at VUMC, seasonal effects, or the Hawthorne effect. Third, the study outcome was all CXRs ordered, rather than CXRs that were unnecessary or not clinically indicated. We chose all CXRs because it was more pragmatic, did not require clinical case review, and could be incorporated promptly into dashboards, enabling timely performance feedback. Other performance measures have taken a similar tack (eg, tracking all-cause readmissions rather than preventable readmissions). Given this approach, we did not track clinical indications for CXRs (eg, central line placement). Fourth, although we compared resident and APRN orders, we did not collect data on other provider characteristics such as years in/out of training or board certification status. These considerations should be addressed in future research.
Finally, the increase in CVICU CXR ordering at the end of the intervention period, which occurred following two adverse events, raises concerns about sustainability. While unrelated to CXR orders, the events resulted in increased ordering of diagnostic tests and showed the difficulty of deimplementation in ICUs. Indeed, some CVICU providers argued that on-demand CXR ordering represented minimal potential cost savings and had not been studied among heart and lung transplant patients. Subsequently, Tonna et al. have shown that on-demand CXR ordering can be safely implemented among such patients.37 Also similar to our study, Tonna et al. observed an initial decrease in CXR ordering, followed by a gradual increase toward baseline ordering rates. These findings highlight the need for sustained awareness and interventions and for the careful selection of high-value projects.
In conclusion, our study shows that a deimplementation intervention based on CW recommendations can reduce CXR ordering and that ongoing evaluation of contextual factors provides insights for both real-time modifications of current interventions and the design of future interventions. We found that messaging about reducing unnecessary tests works well when discussions are framed at the unit level but may be counterproductive if used to question individual ordering decisions.38 Additional lessons learned include the value of participation on rounds to build trust among stakeholders, the utility of monthly rather than weekly statistics for feedback, stakeholder input and peer champions, and differences in approach with physician and ACNP audiences.
Acknowledgments
The authors thank the VUMC Choosing Wisely committee; Mr. Bill Harrell in Advanced Data Analytics for developing the Tableau platform used in our data feedback strategy; Emily Feld, MD, Jerry Zifodya, MD, and Ryan Kindle, MD for assisting with data feedback to providers in the MICU; Todd Rice, MD, Director of the MICU, for his support of the initiative; and Beth Prusaczyk, PhD, MSW and David Stevenson, PhD for providing feedback on earlier drafts of this manuscript.
Disclosures
Dr. Kripalani reports personal fees from Verustat, personal fees from SAI Interactive, and equity from Bioscape Digital, outside the submitted work. All other authors have nothing to disclose.
Funding
This work was supported by an Innovation Grant from the Alliance for Academic Internal Medicine (AAIM, 2016) and by the Departments of Internal Medicine and Graduate Medical Education at Vanderbilt University Medical Center. The AAIM did not have a role in the study design, data collection, data analysis, data interpretation, or manuscript writing.
1. Cassel CK, Guest JA. Choosing Wisely: Helping physicians and patients make smart decisions about their care. JAMA. 2012;307(17):1801-1802.
2. Gonzales R, Cattamanchi A. Changing clinician behavior when less is more. JAMA Intern Med. 2015;175(12):1921-1922.
3. Rosenberg A, Agiro A, Gottlieb M, et al. Early trends among seven recommendations from the Choosing Wisely campaign. JAMA Intern Med. 2015;175(12):1913-1920.
4. Hong AS, Ross-Degnan D, Zhang F, Wharam JF. Small decline in low-value back imaging associated with the ‘Choosing Wisely’ campaign, 2012-14. Health Aff (Millwood). 2017;36(4):671-679. doi: 10.1377/hlthaff.2016.1263.
5. Parks AL, O’Malley PG. From choosing wisely to practicing value—more to the story. JAMA Intern Med. 2016;176(10):1571-1572.
6. Johnson PT, Pahwa AK, Feldman LS, Ziegelstein RC, Hellmann DB. Advancing high-value health care: a new AJM column dedicated to cost-conscious care quality improvement. Am J Med. 2017;130(6):619-621. doi: 10.1016/j.amjmed.2016.12.018.
7. Eccles MP, Mittman BS. Welcome to implementation science. Implement Sci. 2006;1:1. doi: 10.1186/1748-5908-1-1.
8. Bhatia RS, Levinson W, Shortt S, et al. Measuring the effect of Choosing Wisely: an integrated framework to assess campaign impact on low-value care. BMJ Qual Saf. 2015;24:523-531. doi: 10.1136/bmjqs-2015-004070.
9. Selby K, Barnes GD. Learning to de-adopt ineffective healthcare practices. Am J Med. 2018;131(7):721-722. doi: 10.1016/j.amjmed.2018.03.014.
10. Curran GM, Bauer M, Mittman B, Pyne JM, Stetler C. Effectiveness-implementation hybrid designs. Med Care. 2012;50(3):217-226. doi: 10.1097/MLR.0b013e3182408812.
11. Ganapathy A, Adhikari NK, Spiegelman J, Scales DC. Routine chest x-rays in intensive care units: a systematic review and meta-analysis. Crit Care. 2012;16(2):R68. doi: 10.1186/cc11321.
12. Graat ME, Kröner A, Spronk PE, et al. Elimination of daily routine chest radiographs in a mixed medical-surgical intensive care unit. Intensive Care Med. 2007;33(4):639-644. doi: 10.1007/s00134-007-0542-1.
13. Hendrikse KA, Gratama JWC, Ten Hove W, Rommes JH, Schultz MJ, Spronk PE. Low value of routine chest radiographs in a mixed medical-surgical ICU. Chest. 2007;132(3):823-828. doi: 10.1378/chest.07-1162.
14. Clec’h C, Simon P, Hamdi A, et al. Are daily routine chest radiographs useful in critically ill, mechanically ventilated patients? A randomized study. Intensive Care Med. 2008;34(2):264-270. doi: 10.1007/s00134-007-0919-1.
15. Oba Y, Zaza T. Abandoning daily routine chest radiography in the intensive care unit: meta-analysis. Radiology. 2010;255(2):386-395. doi: 10.1148/radiol.10090946.
16. Mets O, Spronk PE, Binnekade J, Stoker J, de Mol BAJM, Schultz MJ. Elimination of daily routine chest radiographs does not change on-demand radiography practice in post-cardiothoracic surgery patients. J Thorac Cardiovasc Surg. 2007;134(1):139-144. doi: 10.1016/j.jtcvs.2007.02.029.
17. Hejblum G, Chalumeau-Lemoine L, Ioos V, et al. Comparison of routine and on-demand prescription of chest radiographs in mechanically ventilated adults: a multicentre, cluster-randomised, two-period crossover study. Lancet. 2009;374(9702):1687-1693. doi: 10.1016/S0140-6736(09)61459-8.
18. McComb BL, Chung JH, Crabtree TD, et al. ACR appropriateness criteria® routine chest radiography. J Thorac Imaging. 2016;31(2):W13-W15. doi: 10.1097/RTI.0000000000000200.
19. Halpern SD, Becker D, Curtis JR, et al. An official American Thoracic Society/American Association of Critical-Care Nurses/American College of Chest Physicians/Society of Critical Care Medicine policy statement: the Choosing Wisely® top 5 list in critical care medicine. Am J Respir Crit Care Med. 2014;190(7):818-826. doi: 10.1164/rccm.201407-1317ST.
20. Powell BJ, Waltz TJ, Chinman MJ, et al. A refined compilation of implementation strategies: Results from the Expert Recommendations for Implementing Change (ERIC) project. Implement Sci. 2015;10:21. doi: 10.1186/s13012-015-0209-1.
21. R [computer program]. Version 3.4.0. Vienna, Austria: R Foundation for Statistical Computing; 2013.
22. Damschroder LJ, Aron DC, Keith RE, Kirsh SR, Alexander JA, Lowery JC. Fostering implementation of health services research findings into practice: a consolidated framework for advancing implementation science. Implement Sci. 2009;4:50. doi: 10.1186/1748-5908-4-50.
23. Kirk MA, Kelley C, Yankey N, Birken SA, Abadie B, Damschroder L. A systematic review of the use of the Consolidated Framework for Implementation Research. Implement Sci. 2016;11:72. doi: 10.1186/s13012-016-0437-z.
24. Speroff T, James BC, Nelson EC, Headrick LA, Brommels M, Reed JE. Guidelines for appraisal and publication of PDSA quality improvement. Qual Manag Health Care. 2014;13(1):33-39. doi: 10.1097/00019514-200401000-00003.
25. Corson AH, Fan VS, White T, et al. A multifaceted hospitalist quality improvement intervention: Decreased frequency of common labs. J Hosp Med. 2015;10(6):390-395. doi: 10.1002/jhm.2354.
26. Ferrari R. Evaluation of the Canadian Rheumatology Association Choosing Wisely recommendation concerning anti-nuclear antibody (ANA) testing. Clin Rheumatol. 2015;34(9):1551-1556. doi: 10.1007/s10067-015-2985-z.
27. Ferrari R, Prosser C. Testing vitamin D levels and choosing wisely. JAMA Intern Med. 2016;176(7):1019-1020.
28. Iams W, Heck J, Kapp M, et al. A multidisciplinary housestaff-led initiative to safely reduce daily laboratory testing. Acad Med. 2016;91(6):813-820. doi: 10.1097/ACM.0000000000001149.
29. Kost A, Genao I, Lee JW, Smith SR. Clinical decisions made in primary care clinics before and after Choosing WiselyTM. J Am Board Fam Med. 2015;28(4):471-474. doi: 10.3122/jabfm.2015.05.140332.
30. Kerr EA, Chen J, Sussman JB, Klamerus ML, Nallamothu BK. Stress testing before low-risk surgery: so many recommendations, so little overuse. JAMA Intern Med. 2015;175(4):645-647. doi: 10.1001/jamainternmed.2014.7877.
31. Colla CH, Morden NE, Sequist TD, Schpero WL, Rosenthal MB. Choosing wisely: prevalence and correlates of low-value health care services in the United States. J Gen Intern Med. 2014;30(2):221-228. doi: 10.1007/s11606-014-3070-z.
32. Shetty KD, Meeker D, Schneider EC, Hussey PS, Damberg CL. Evaluating the feasibility and utility of translating Choosing Wisely recommendations into e-Measures. Healthcare. 2015;3(1):24-37. doi: 10.1016/j.hjdsi.2014.12.002.
33. Woodland DC, Cooper CR, Rashid MF, et al. Routine chest X-ray is unnecessary after ultrasound-guided central venous line placement in the operating room. J Crit Care. 2018;46:13-16. doi: 10.1016/j.jcrc.2018.03.027.
34. Krause TM, Ukhanova M, Revere FL. Private carriers’ physician payment rates compared with Medicare and Medicaid. Tex Med. 2016;112(6):e1.
35. American College of Radiology. Medicare physician fee schedule. Available at https://www.acr.org/Advocacy-and-Economics/Radiology-Economics/Medicare-Medicaid/MPFS. Accessed October 15, 2018.
36. Siegel MD, Rubinowitz AN. Routine daily vs on-demand chest radiographs in intensive care. Lancet. 2009;374(9702):1656-1658. doi: 10.1016/S0140-6736(09)61632-9.
37. Tonna JE, Kawamoto K, Presson AP, et al. Single intervention for a reduction in portable chest radiography (pCXR) in cardiovascular and surgical/trauma ICUs and associated outcomes. J Crit Care. 2018;44:18-23. doi: 10.1016/j.jcrc.2017.10.003.
38. Wolfson D, Santa J, Slass L. Engaging physicians and consumers in conversations about treatment overuse and waste: a short history of the choosing wisely campaign. Acad Med. 2014;89(7):990-995. doi: 10.1097/ACM.0000000000000270.
© 2019 Society of Hospital Medicine
Association of Weekend Admission and Weekend Discharge with Length of Stay and 30-Day Readmission in Children’s Hospitals
Increasingly, metrics such as length of stay (LOS) and readmissions are being utilized in the United States to assess quality of healthcare because these factors may represent opportunities to reduce cost and improve healthcare delivery.1-8 However, the relatively low rate of pediatric readmissions,9 coupled with limited data regarding recommended LOS or best practices to prevent readmissions in children, challenges the ability of hospitals to safely reduce LOS and readmission rates for children.10–12
In adults, weekend admission is associated with prolonged LOS, increased readmission rates, and increased risk of mortality.13-21 This association is referred to as the “weekend effect.” While the weekend effect has been examined in children, the results of these studies have been variable, with some studies supporting this association and others refuting it.22-31 In contrast to patient demographic and clinical characteristics that are known to affect LOS and readmissions,32 the weekend effect represents a potentially modifiable aspect of a hospitalization that could be targeted to improve healthcare delivery.
With increasing national attention toward improving quality of care and reducing LOS and healthcare costs, more definitive evidence of the weekend effect is necessary to prioritize resource use at both the local and national levels. Therefore, we sought to determine the association of weekend admission and weekend discharge on LOS and 30-day readmissions, respectively, among a national cohort of children. We hypothesized that children admitted on the weekend would have longer LOS, whereas those discharged on the weekend would have higher readmission rates.
METHODS
Study Design and Data Source
We conducted a multicenter, retrospective, cross-sectional study. Data were obtained from the Pediatric Health Information System (PHIS), an administrative and billing database of 46 free-standing tertiary care pediatric hospitals affiliated with the Children’s Hospital Association (Lenexa, Kansas). Patient data are de-identified within PHIS; however, encrypted patient identifiers allow individual patients to be followed across visits. This study was not considered human subjects research by the policies of the Cincinnati Children’s Hospital Institutional Review Board.
Participants
We included hospitalizations to a PHIS-participating hospital for children aged 0-17 years between October 1, 2014 and September 30, 2015. We excluded children who were transferred from/to another institution, left against medical advice, or died in the hospital because these indications may result in incomplete LOS information and would not consistently contribute to readmission rates. We also excluded birth hospitalizations and children admitted for planned procedures. Birth hospitalizations were defined as hospitalizations that began on the day of birth.
Main Exposures
No standard definition of weekend admission or discharge was identified in the literature.33 Thus, we defined a weekend admission as an admission between 3:00
Main Outcomes
Our outcomes included LOS for weekend admission and 30-day readmissions for weekend discharge. LOS, measured in hours, was defined using the reported admission and discharge times. Readmissions were defined as a return to the same hospital within the subsequent 30 days following discharge.
Patient Demographics and Other Study Variables
Patient demographics included age, gender, race/ethnicity, payer, and median household income quartile based on the patient’s home ZIP code. Other study variables included presence of a complex chronic condition (CCC),34 technology dependence,34 number of chronic conditions of any complexity, admission through the emergency department, intensive care unit (ICU) admission, and case mix index. ICU admission and case mix index were chosen as markers for severity of illness. ICU admission was defined as any child who incurred ICU charges at any time following admission. Case mix index in PHIS is a relative weight assigned to each discharge based on the All-Patient Refined Diagnostic Group (APR-DRG; 3M) assignment and APR-DRG severity of illness, which ranges from 1 (minor) to 4 (extreme). The weights are derived by the Children’s Hospital Association from the HCUP KID 2012 database as the ratio of the average cost for discharges within a specific APR-DRG severity of illness combination to the average cost for all discharges in the database.
Statistical Analysis
Continuous variables were summarized with medians and interquartile ranges, while categorical variables were summarized with frequencies and percentages. Differences in admission and discharge characteristics between weekend and weekday were assessed using Wilcoxon rank sum tests for continuous variables and chi-square tests of association for categorical variables. We used generalized linear mixed modeling (GLMM) techniques to assess the impact of weekend admission on LOS and weekend discharge on readmission, adjusting for important patient demographic and clinical characteristics. Furthermore, we used GLMM point estimates to describe the variation across hospitals of the impact of weekday versus weekend care on LOS and readmissions. We assumed an underlying log-normal distribution for LOS and an underlying binomial distribution for 30-day readmission. All GLMMs included a random intercept for each hospital to account for patient clustering within a hospital. All statistical analyses were performed using SAS v.9.4 (SAS Institute, Cary, North Carolina), and P values <.05 were considered statistically significant.
RESULTS
We identified 390,745 hospitalizations that met inclusion criteria (Supplementary Figure 1). The median LOS among our cohort was 41 hours (interquartile range [IQR] 24-71) and the median 30-day readmission rate was 8.2% (IQR 7.2-9.4).
Admission Demographics for Weekends and Weekdays
Among the included hospitalizations, 92,266 (23.6%) admissions occurred on a weekend (Supplementary Table 1). Overall, a higher percentage of children <5 years of age were admitted on a weekend compared with those admitted on a weekday (53.3% vs 49.1%, P < .001). We observed a small but statistically significant difference in the proportion of weekend versus weekday admissions according to gender, race/ethnicity, payer, and median household income quartile. Children with medical complexity and those with technology dependence were admitted less frequently on a weekend. A higher proportion of children were admitted through the emergency department on a weekend and a higher frequency of ICU utilization was observed for children admitted on a weekend compared with those admitted on a weekday.
Association Between Study Variables and Length of Stay
In comparing adjusted LOS for weekend versus weekday admissions across 43 hospitals, not only did LOS vary across hospitals (P < .001), but the association between LOS and weekend versus weekday care also varied across hospitals (P < .001) (Figure 1). Weekend admission was associated with a significantly longer LOS at eight (18.6%) hospitals and a significantly shorter LOS at four (9.3%) hospitals with nonstatistically significant differences at the remaining hospitals.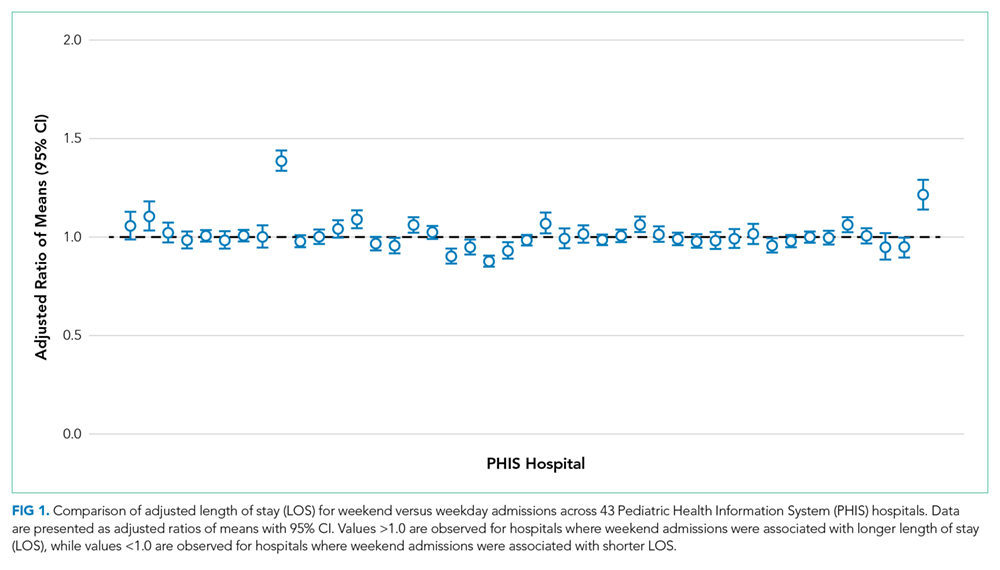
In adjusted analyses, we observed that infants ≤30 days of age, on average, had an adjusted LOS that was 24% longer than that of 15- to 17-year-olds, while children aged 1-14 years had an adjusted LOS that was 6%-18% shorter (Table 1). ICU utilization, admission through the emergency department, and number of chronic conditions had the greatest association with LOS. As the number of chronic conditions increased, the LOS increased. No association was found between weekend versus weekday admission and LOS (adjusted LOS [95% CI]: weekend 63.70 [61.01-66.52] hours versus weekday 63.40 [60.73-66.19] hours, P = .112).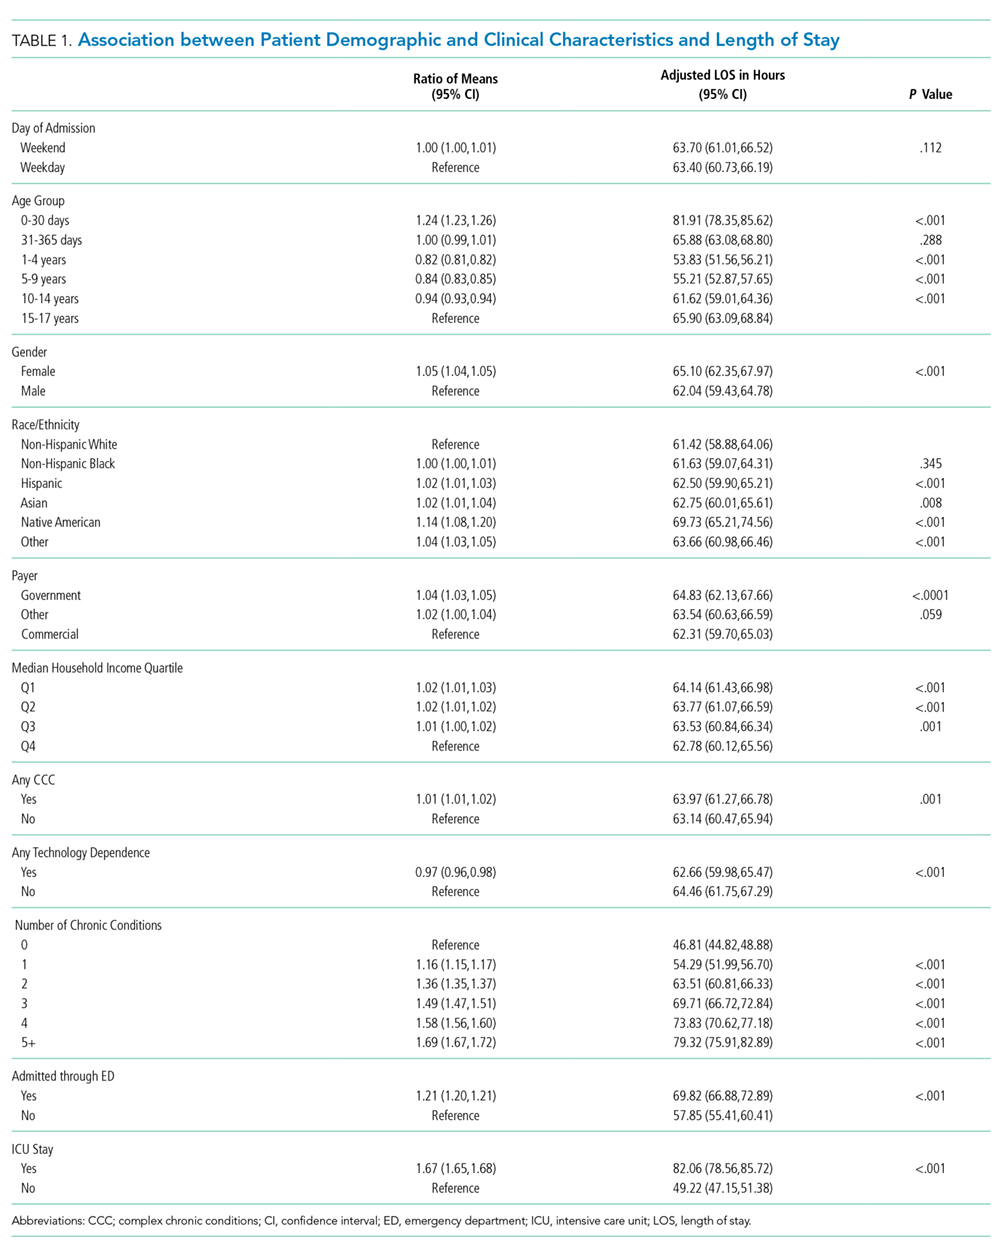
Discharge Demographics for Weekends and Weekdays
Of the included hospitalizations, 127,421 (32.6%) discharges occurred on a weekend (Supplementary Table 2). Overall, a greater percentage of weekend discharges comprised children <5 years of age compared with the percentage of weekday discharges for children <5 years of age (51.5% vs 49.5%, P < .001). No statistically significant differences were found in gender, payer, or median household income quartile between those children discharged on a weekend versus those discharged on a weekday. We found small, statistically significant differences in the proportion of weekend versus weekday discharges according to race/ethnicity, with fewer non-Hispanic white children being discharged on the weekend versus weekday. Children with medical complexity, technology dependence, and patients with ICU utilization were less frequently discharged on a weekend compared with those discharged on a weekday.
Association Between Study Variables and Readmissions
In comparing the adjusted odds of readmissions for weekend versus weekday discharges across 43 PHIS hospitals, we observed significant variation (P < .001) in readmission rates from hospital to hospital (Figure 2). However, the direction of impact of weekend care on readmissions was similar (P = .314) across hospitals (ie, for 37 of 43 hospitals, the readmission rate was greater for weekend discharges compared with that for weekday discharges). For 17 (39.5%) of 43 hospitals, weekend discharge was associated with a significantly higher readmission rate, while the differences between weekday and weekend discharge were not statistically significant for the remaining hospitals.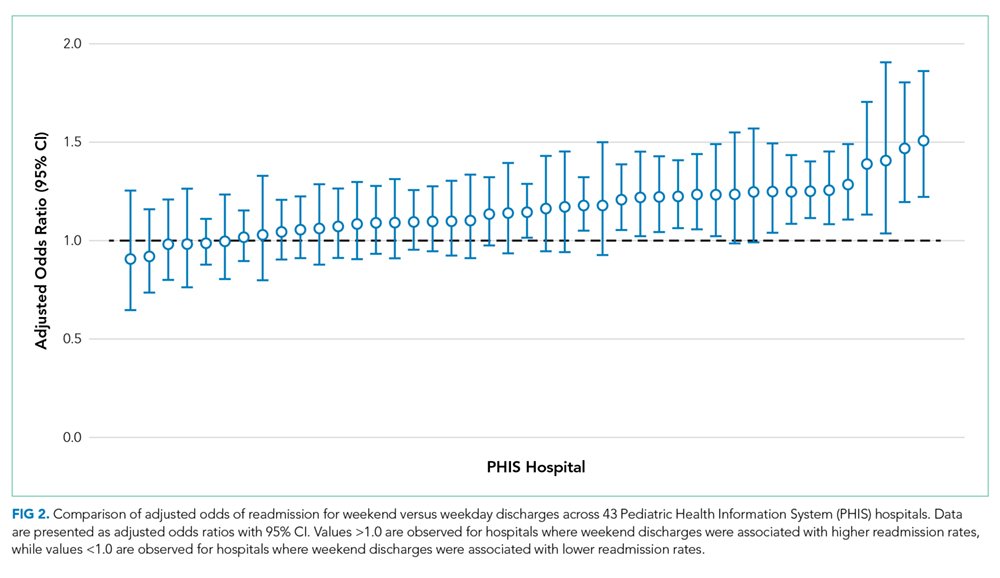
In adjusted analyses, we observed that infants <1 year were more likely to be readmitted compared with 15- to 17-year-olds, while children 5-14 years of age were less likely to be readmitted (Table 2). Medical complexity and the number of chronic conditions had the greatest association with readmissions, with increased likelihood of readmission observed as the number of chronic conditions increased. Weekend discharge was associated with increased probability of readmission compared with weekday discharge (adjusted probability of readmission [95% CI]: weekend 0.13 [0.12-0.13] vs weekday 0.11 [0.11-0.12], P < .001).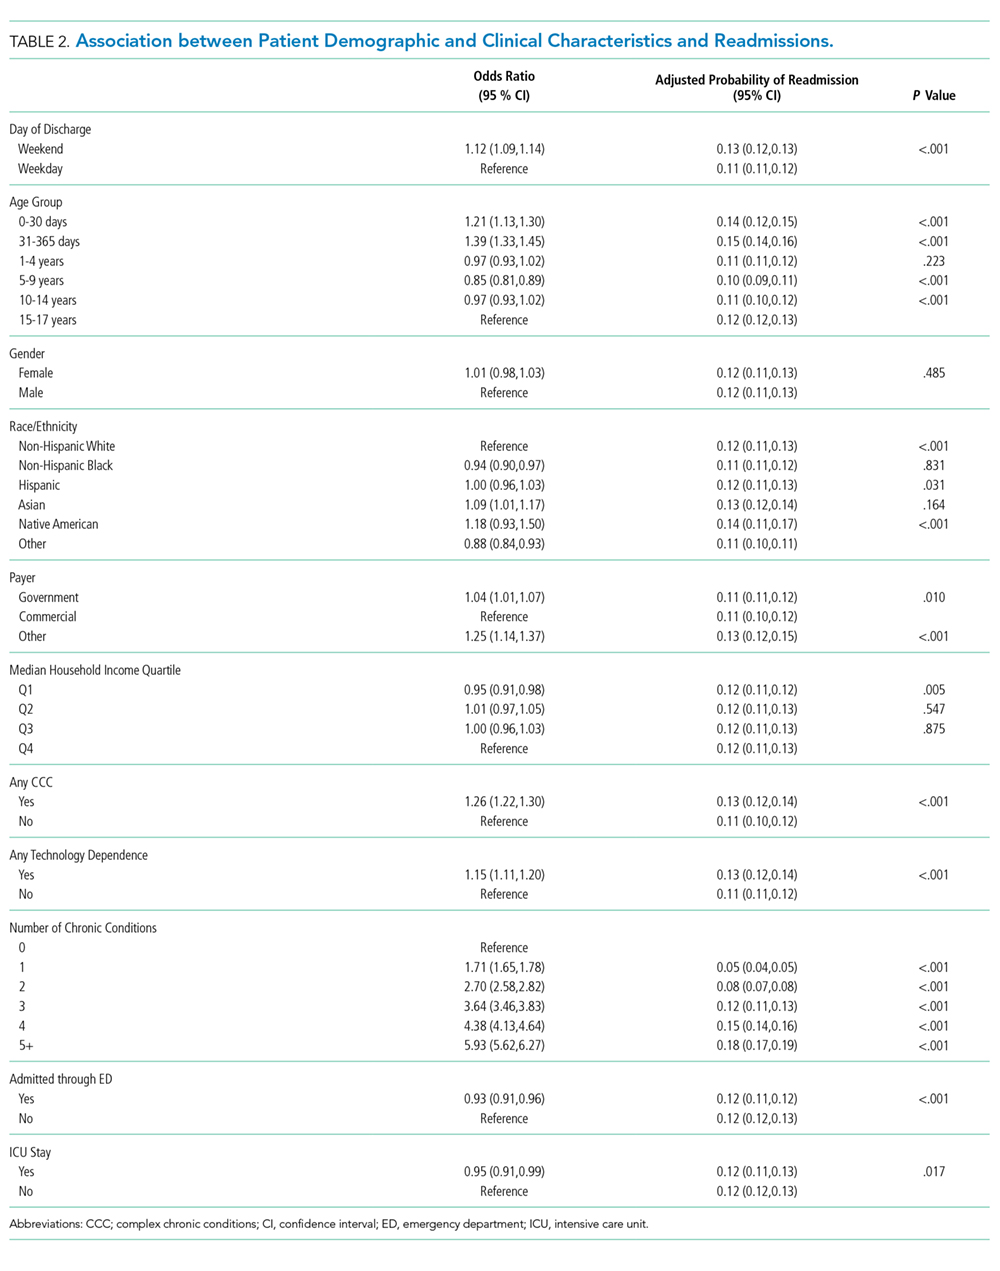
DISCUSSION
While the reasons for the weekend effect are unclear, data supporting this difference have been observed across many diverse patient groups and health systems both nationally and internationally.13-27,31 Weekend care is thought to differ from weekday care because of differences in physician and nurse staffing, availability of ancillary services, access to diagnostic testing and therapeutic interventions, ability to arrange outpatient follow-up, and individual patient clinical factors, including acuity of illness. Few studies have assessed the effect of weekend discharges on patient or system outcomes. Among children within a single health system, readmission risk was associated with weekend admission but not with weekend discharge.22 This observation suggests that if differential care exists, then it occurs during initial clinical management rather than during discharge planning. Consequently, understanding the interaction of weekend admission and LOS is important. In addition, the relative paucity of pediatric data examining a weekend discharge effect limits the ability to generalize these findings across other hospitals or health systems.
In contrast to prior work, we observed a modest increased risk for readmission among those discharged on the weekend in a large sample of children. Auger and Davis reported a lack of association between weekend discharge and readmissions at one tertiary care children’s hospital, citing reduced discharge volumes on the weekend, especially among children with medical complexity, as a possible driver for their observation.22 The inclusion of a much larger population across 43 hospitals in our study may explain our different findings compared with previous research. In addition, the inclusion/exclusion criteria differed between the two studies; we excluded index admissions for planned procedures in this study (which are more likely to occur during the week), which may have contributed to the differing conclusions. Although Auger and Davis suggest that differences in initial clinical management may be responsible for the weekend effect,22 our observations suggest that discharge planning practices may also contribute to readmission risk. For example, a family’s inability to access compounded medications at a local pharmacy or to access primary care following discharge could reasonably contribute to treatment failure and increased readmission risk. Attention to improving and standardizing discharge practices may alleviate differences in readmission risk among children discharged on a weekend.
Individual patient characteristics greatly influence LOS and readmission risk. Congruent with prior studies, medical complexity and technology dependence were among the factors in our study that had the strongest association with LOS and readmission risk.32 As with prior studies22, we observed that children with medical complexity and technology dependence were less frequently admitted and discharged on a weekend than on a weekday, which suggests that physicians may avoid complicated discharges on the weekend. Children with medical complexity present a unique challenge to physicians when assessing discharge readiness, given that these children frequently require careful coordination of durable medical equipment, obtainment of special medication preparations, and possibly the resumption or establishment of home health services. Notably, we cannot discern from our data what proportion of discharges may be delayed over the weekend secondary to challenges involved in coordinating care for children with medical complexity. Future investigations aimed at assessing physician decision making and discharge readiness in relation to discharge timing among children with medical complexity may establish this relationship more clearly.
We observed substantial variation in LOS and readmission risk across 43 tertiary care children’s hospitals. Since the 1970s, numerous studies have reported worse outcomes among patients admitted on the weekend. While the majority of studies support the weekend effect, several recent studies suggest that patients admitted on the weekend are at no greater risk of adverse outcomes than those admitted during the week.35-37 Our work builds on the existing literature, demonstrating a complex and variable relationship between weekend admission/discharge, LOS, and readmission risk across hospitals. Notably, while many hospitals in our study experienced a significant weekend effect in LOS or readmission risk, only four hospitals experienced a statistically significant weekend effect for both LOS and readmission risk (three hospitals experienced increased risk for both, while one hospital experienced increased readmission risk but decreased LOS). Future investigations of the weekend effect should focus on exploring the differences in admission/discharge practices and staffing patterns of hospitals that did or did not experience a weekend effect.
This study has several limitations
CONCLUSION
In a study of 43 children’s hospitals, children discharged on the weekend had a slightly increased readmission risk compared with children discharged on a weekday. Wide variation in the weekend effect on LOS and readmission risk was evident across hospitals. Individual patient characteristics had a greater impact on LOS and readmission risk than the weekend effect. Future investigations aimed at understanding which factors contribute most strongly to a weekend effect within individual hospitals (eg, differences in institutional admission/discharge practices) may help alleviate the weekend effect and improve healthcare quality.
Acknowledgments
This manuscript resulted from “Paper in a Day,” a Pediatric Research in Inpatient Settings (PRIS) Network-sponsored workshop presented at the Pediatric Hospital Medicine 2017 annual meeting. Workshop participants learned how to ask and answer a health services research question and efficiently prepare a manuscript for publication. The following are the members of the PRIS Network who contributed to this work: Jessica L. Bettenhausen, MD; Rebecca M. Cantu, MD, MPH; Jillian M Cotter, MD; Megan Deisz, MD; Teresa Frazer, MD; Pratichi Goenka, MD; Ashley Jenkins, MD; Kathryn E. Kyler, MD; Janet T. Lau, MD; Brian E. Lee, MD; Christiane Lenzen, MD; Trisha Marshall, MD; John M. Morrison MD, PhD; Lauren Nassetta, MD; Raymond Parlar-Chun, MD; Sonya Tang Girdwood MD, PhD; Tony R Tarchichi, MD; Irina G. Trifonova, MD; Jacqueline M. Walker, MD, MHPE; and Susan C. Walley, MD. See appendix for contact information for members of the PRIS Network
Funding
The authors have no financial relationships relevant to this article to disclose.
Disclosures
The authors have no conflicts of interest to disclose.
1. Crossing the Quality Chasm: The IOM Health Care Quality Initiative : Health and Medicine Division. http://www.nationalacademies.org/hmd/Global/News%20Announcements/Crossing-the-Quality-Chasm-The-IOM-Health-Care-Quality-Initiative.aspx. Accessed November 20, 2017.
2. Institute for Healthcare Improvement: IHI Home Page. http://www.ihi.org:80/Pages/default.aspx. Accessed November 20, 2017.
3. Berry JG, Zaslavsky AM, Toomey SL, et al. Recognizing differences in hospital quality performance for pediatric inpatient care. Pediatrics. 2015;136(2):251-262. doi:10.1542/peds.2014-3131
4. NQF: All-Cause Admissions and Readmissions Measures - Final Report. http://www.qualityforum.org/Publications/2015/04/All-Cause_Admissions_and_Readmissions_Measures_-_Final_Report.aspx. Accessed March 24, 2018.
5. Hospital Inpatient Potentially Preventable Readmissions Information and Reports. https://www.illinois.gov/hfs/MedicalProviders/hospitals/PPRReports/Pages/default.aspx. Accessed November 6, 2016.
6. Potentially Preventable Readmissions in Texas Medicaid and CHIP Programs - Fiscal Year 2013 | Texas Health and Human Services. https://hhs.texas.gov/reports/2016/08/potentially-preventable-readmissions-texas-medicaid-and-chip-programs-fiscal-year. Accessed November 6, 2016.
7. Statewide Planning and Research Cooperative System. http://www.health.ny.gov/statistics/sparcs/sb/. Accessed November 6, 2016.
8. HCA Implements Potentially Preventable Readmission (PPR) Adjustments. Wash State Hosp Assoc. http://www.wsha.org/articles/hca-implements-potentially-preventable-readmission-ppr-adjustments/. Accessed November 8, 2016.
9. Berry JG, Toomey SL, Zaslavsky AM, et al. Pediatric readmission prevalence and variability across hospitals. JAMA. 2013;309(4):372-380. doi:10.1001/jama.2012.188351 PubMed
10. Bardach NS, Vittinghoff E, Asteria-Peñaloza R, et al. Measuring hospital quality using pediatric readmission and revisit rates. Pediatrics. 2013;132(3):429-436. doi:10.1542/peds.2012-3527 PubMed
11. Berry JG, Blaine K, Rogers J, et al. A framework of pediatric hospital discharge care informed by legislation, research, and practice. JAMA Pediatr. 2014;168(10):955-962; quiz 965-966. doi:10.1001/jamapediatrics.2014.891 PubMed
12. Auger KA, Simon TD, Cooperberg D, et al. Summary of STARNet: seamless transitions and (Re)admissions network. Pediatrics. 2015;135(1):164. doi:10.1542/peds.2014-1887 PubMed
13. Freemantle N, Ray D, McNulty D, et al. Increased mortality associated with weekend hospital admission: a case for expanded seven day services? BMJ. 2015;351:h4596. doi:10.1136/bmj.h4596 PubMed
14. Schilling PL, Campbell DA, Englesbe MJ, Davis MM. A comparison of in-hospital mortality risk conferred by high hospital occupancy, differences in nurse staffing levels, weekend admission, and seasonal influenza. Med Care. 2010;48(3):224-232. doi:10.1097/MLR.0b013e3181c162c0 PubMed
15. Cram P, Hillis SL, Barnett M, Rosenthal GE. Effects of weekend admission and hospital teaching status on in-hospital mortality. Am J Med. 2004;117(3):151-157. doi:10.1016/j.amjmed.2004.02.035 PubMed
16. Zapf MAC, Kothari AN, Markossian T, et al. The “weekend effect” in urgent general operative procedures. Surgery. 2015;158(2):508-514. doi:10.1016/j.surg.2015.02.024 PubMed
17. Freemantle N, Richardson M, Wood J, et al. Weekend hospitalization and additional risk of death: an analysis of inpatient data. J R Soc Med. 2012;105(2):74-84. doi:10.1258/jrsm.2012.120009 PubMed
18. Bell CM, Redelmeier DA. Mortality among patients admitted to hospitals on weekends as compared with weekdays. N Engl J Med. 2001;345(9):663-668. doi:10.1056/NEJMsa003376 PubMed
19. Coiera E, Wang Y, Magrabi F, Concha OP, Gallego B, Runciman W. Predicting the cumulative risk of death during hospitalization by modeling weekend, weekday and diurnal mortality risks. BMC Health Serv Res. 2014;14:226. doi:10.1186/1472-6963-14-226 PubMed
20. Powell ES, Khare RK, Courtney DM, Feinglass J. The weekend effect for patients with sepsis presenting to the emergency department. J Emerg Med. 2013;45(5):641-648. doi:10.1016/j.jemermed.2013.04.042 PubMed
21. Ananthakrishnan AN, McGinley EL, Saeian K. Outcomes of weekend admissions for upper gastrointestinal hemorrhage: a nationwide analysis. Clin Gastroenterol Hepatol Off Clin Pract J Am Gastroenterol Assoc. 2009;7(3):296-302e1. doi:10.1016/j.cgh.2008.08.013 PubMed
22. Auger KA, Davis MM. Pediatric weekend admission and increased unplanned readmission rates. J Hosp Med. 2015;10(11):743-745. doi:10.1002/jhm.2426 PubMed
23. Goldstein SD, Papandria DJ, Aboagye J, et al. The “weekend effect” in pediatric surgery - increased mortality for children undergoing urgent surgery during the weekend. J Pediatr Surg. 2014;49(7):1087-1091. doi:10.1016/j.jpedsurg.2014.01.001 PubMed
24. Adil MM, Vidal G, Beslow LA. Weekend effect in children with stroke in the nationwide inpatient sample. Stroke. 2016;47(6):1436-1443. doi:10.1161/STROKEAHA.116.013453 PubMed
25. McCrory MC, Spaeder MC, Gower EW, et al. Time of admission to the PICU and mortality. Pediatr Crit Care Med J Soc Crit Care Med World Fed Pediatr Intensive Crit Care Soc. 2017;18(10):915-923. doi:10.1097/PCC.0000000000001268 PubMed
26. Mangold WD. Neonatal mortality by the day of the week in the 1974-75 Arkansas live birth cohort. Am J Public Health. 1981;71(6):601-605. PubMed
27. MacFarlane A. Variations in number of births and perinatal mortality by day of week in England and Wales. Br Med J. 1978;2(6153):1670-1673. PubMed
28. McShane P, Draper ES, McKinney PA, McFadzean J, Parslow RC, Paediatric intensive care audit network (PICANet). Effects of out-of-hours and winter admissions and number of patients per unit on mortality in pediatric intensive care. J Pediatr. 2013;163(4):1039-1044.e5. doi:10.1016/j.jpeds.2013.03.061 PubMed
29. Hixson ED, Davis S, Morris S, Harrison AM. Do weekends or evenings matter in a pediatric intensive care unit? Pediatr Crit Care Med J Soc Crit Care Med World Fed Pediatr Intensive Crit Care Soc. 2005;6(5):523-530. PubMed
30. Gonzalez KW, Dalton BGA, Weaver KL, Sherman AK, St Peter SD, Snyder CL. Effect of timing of cannulation on outcome for pediatric extracorporeal life support. Pediatr Surg Int. 2016;32(7):665-669. doi:10.1007/s00383-016-3901-6 PubMed
31. Desai V, Gonda D, Ryan SL, et al. The effect of weekend and after-hours surgery on morbidity and mortality rates in pediatric neurosurgery patients. J Neurosurg Pediatr. 2015;16(6):726-731. doi:10.3171/2015.6.PEDS15184 PubMed
32. Berry JG, Hall DE, Kuo DZ, et al. Hospital utilization and characteristics of patients experiencing recurrent readmissions within children’s hospitals. JAMA. 2011;305(7):682-690. doi:10.1001/jama.2011.122 PubMed
33. Hoshijima H, Takeuchi R, Mihara T, et al. Weekend versus weekday admission and short-term mortality: A meta-analysis of 88 cohort studies including 56,934,649 participants. Medicine (Baltimore). 2017;96(17):e6685. doi:10.1097/MD.0000000000006685 PubMed
34. Feudtner C, Feinstein JA, Zhong W, Hall M, Dai D. Pediatric complex chronic conditions classification system version 2: updated for ICD-10 and complex medical technology dependence and transplantation. BMC Pediatr. 2014;14:199. doi:10.1186/1471-2431-14-199 PubMed
35. Li L, Rothwell PM, Oxford Vascular Study. Biases in detection of apparent “weekend effect” on outcome with administrative coding data: population based study of stroke. BMJ. 2016;353:i2648. doi: https://doi.org/10.1136/bmj.i2648 PubMed
36. Bray BD, Cloud GC, James MA, et al. Weekly variation in health-care quality by day and time of admission: a nationwide, registry-based, prospective cohort study of acute stroke care. The Lancet. 2016;388(10040):170-177. doi:10.1016/S0140-6736(16)30443-3 PubMed
37. Ko SQ, Strom JB, Shen C, Yeh RW. Mortality, Length of Stay, and Cost of Weekend Admissions. J Hosp Med. 2018. doi:10.12788/jhm.2906 PubMed
38. Tubbs-Cooley HL, Cimiotti JP, Silber JH, Sloane DM, Aiken LH. An observational study of nurse staffing ratios and hospital readmission among children admitted for common conditions. BMJ Qual Saf. 2013;22(9):735-742. doi:10.1136/bmjqs-2012-001610 PubMed
39. Ong M, Bostrom A, Vidyarthi A, McCulloch C, Auerbach A. House staff team workload and organization effects on patient outcomes in an academic general internal medicine inpatient service. Arch Intern Med. 2007;167(1):47-52. doi:10.1001/archinte.167.1.47 PubMed
Increasingly, metrics such as length of stay (LOS) and readmissions are being utilized in the United States to assess quality of healthcare because these factors may represent opportunities to reduce cost and improve healthcare delivery.1-8 However, the relatively low rate of pediatric readmissions,9 coupled with limited data regarding recommended LOS or best practices to prevent readmissions in children, challenges the ability of hospitals to safely reduce LOS and readmission rates for children.10–12
In adults, weekend admission is associated with prolonged LOS, increased readmission rates, and increased risk of mortality.13-21 This association is referred to as the “weekend effect.” While the weekend effect has been examined in children, the results of these studies have been variable, with some studies supporting this association and others refuting it.22-31 In contrast to patient demographic and clinical characteristics that are known to affect LOS and readmissions,32 the weekend effect represents a potentially modifiable aspect of a hospitalization that could be targeted to improve healthcare delivery.
With increasing national attention toward improving quality of care and reducing LOS and healthcare costs, more definitive evidence of the weekend effect is necessary to prioritize resource use at both the local and national levels. Therefore, we sought to determine the association of weekend admission and weekend discharge on LOS and 30-day readmissions, respectively, among a national cohort of children. We hypothesized that children admitted on the weekend would have longer LOS, whereas those discharged on the weekend would have higher readmission rates.
METHODS
Study Design and Data Source
We conducted a multicenter, retrospective, cross-sectional study. Data were obtained from the Pediatric Health Information System (PHIS), an administrative and billing database of 46 free-standing tertiary care pediatric hospitals affiliated with the Children’s Hospital Association (Lenexa, Kansas). Patient data are de-identified within PHIS; however, encrypted patient identifiers allow individual patients to be followed across visits. This study was not considered human subjects research by the policies of the Cincinnati Children’s Hospital Institutional Review Board.
Participants
We included hospitalizations to a PHIS-participating hospital for children aged 0-17 years between October 1, 2014 and September 30, 2015. We excluded children who were transferred from/to another institution, left against medical advice, or died in the hospital because these indications may result in incomplete LOS information and would not consistently contribute to readmission rates. We also excluded birth hospitalizations and children admitted for planned procedures. Birth hospitalizations were defined as hospitalizations that began on the day of birth.
Main Exposures
No standard definition of weekend admission or discharge was identified in the literature.33 Thus, we defined a weekend admission as an admission between 3:00
Main Outcomes
Our outcomes included LOS for weekend admission and 30-day readmissions for weekend discharge. LOS, measured in hours, was defined using the reported admission and discharge times. Readmissions were defined as a return to the same hospital within the subsequent 30 days following discharge.
Patient Demographics and Other Study Variables
Patient demographics included age, gender, race/ethnicity, payer, and median household income quartile based on the patient’s home ZIP code. Other study variables included presence of a complex chronic condition (CCC),34 technology dependence,34 number of chronic conditions of any complexity, admission through the emergency department, intensive care unit (ICU) admission, and case mix index. ICU admission and case mix index were chosen as markers for severity of illness. ICU admission was defined as any child who incurred ICU charges at any time following admission. Case mix index in PHIS is a relative weight assigned to each discharge based on the All-Patient Refined Diagnostic Group (APR-DRG; 3M) assignment and APR-DRG severity of illness, which ranges from 1 (minor) to 4 (extreme). The weights are derived by the Children’s Hospital Association from the HCUP KID 2012 database as the ratio of the average cost for discharges within a specific APR-DRG severity of illness combination to the average cost for all discharges in the database.
Statistical Analysis
Continuous variables were summarized with medians and interquartile ranges, while categorical variables were summarized with frequencies and percentages. Differences in admission and discharge characteristics between weekend and weekday were assessed using Wilcoxon rank sum tests for continuous variables and chi-square tests of association for categorical variables. We used generalized linear mixed modeling (GLMM) techniques to assess the impact of weekend admission on LOS and weekend discharge on readmission, adjusting for important patient demographic and clinical characteristics. Furthermore, we used GLMM point estimates to describe the variation across hospitals of the impact of weekday versus weekend care on LOS and readmissions. We assumed an underlying log-normal distribution for LOS and an underlying binomial distribution for 30-day readmission. All GLMMs included a random intercept for each hospital to account for patient clustering within a hospital. All statistical analyses were performed using SAS v.9.4 (SAS Institute, Cary, North Carolina), and P values <.05 were considered statistically significant.
RESULTS
We identified 390,745 hospitalizations that met inclusion criteria (Supplementary Figure 1). The median LOS among our cohort was 41 hours (interquartile range [IQR] 24-71) and the median 30-day readmission rate was 8.2% (IQR 7.2-9.4).
Admission Demographics for Weekends and Weekdays
Among the included hospitalizations, 92,266 (23.6%) admissions occurred on a weekend (Supplementary Table 1). Overall, a higher percentage of children <5 years of age were admitted on a weekend compared with those admitted on a weekday (53.3% vs 49.1%, P < .001). We observed a small but statistically significant difference in the proportion of weekend versus weekday admissions according to gender, race/ethnicity, payer, and median household income quartile. Children with medical complexity and those with technology dependence were admitted less frequently on a weekend. A higher proportion of children were admitted through the emergency department on a weekend and a higher frequency of ICU utilization was observed for children admitted on a weekend compared with those admitted on a weekday.
Association Between Study Variables and Length of Stay
In comparing adjusted LOS for weekend versus weekday admissions across 43 hospitals, not only did LOS vary across hospitals (P < .001), but the association between LOS and weekend versus weekday care also varied across hospitals (P < .001) (Figure 1). Weekend admission was associated with a significantly longer LOS at eight (18.6%) hospitals and a significantly shorter LOS at four (9.3%) hospitals with nonstatistically significant differences at the remaining hospitals.
In adjusted analyses, we observed that infants ≤30 days of age, on average, had an adjusted LOS that was 24% longer than that of 15- to 17-year-olds, while children aged 1-14 years had an adjusted LOS that was 6%-18% shorter (Table 1). ICU utilization, admission through the emergency department, and number of chronic conditions had the greatest association with LOS. As the number of chronic conditions increased, the LOS increased. No association was found between weekend versus weekday admission and LOS (adjusted LOS [95% CI]: weekend 63.70 [61.01-66.52] hours versus weekday 63.40 [60.73-66.19] hours, P = .112).
Discharge Demographics for Weekends and Weekdays
Of the included hospitalizations, 127,421 (32.6%) discharges occurred on a weekend (Supplementary Table 2). Overall, a greater percentage of weekend discharges comprised children <5 years of age compared with the percentage of weekday discharges for children <5 years of age (51.5% vs 49.5%, P < .001). No statistically significant differences were found in gender, payer, or median household income quartile between those children discharged on a weekend versus those discharged on a weekday. We found small, statistically significant differences in the proportion of weekend versus weekday discharges according to race/ethnicity, with fewer non-Hispanic white children being discharged on the weekend versus weekday. Children with medical complexity, technology dependence, and patients with ICU utilization were less frequently discharged on a weekend compared with those discharged on a weekday.
Association Between Study Variables and Readmissions
In comparing the adjusted odds of readmissions for weekend versus weekday discharges across 43 PHIS hospitals, we observed significant variation (P < .001) in readmission rates from hospital to hospital (Figure 2). However, the direction of impact of weekend care on readmissions was similar (P = .314) across hospitals (ie, for 37 of 43 hospitals, the readmission rate was greater for weekend discharges compared with that for weekday discharges). For 17 (39.5%) of 43 hospitals, weekend discharge was associated with a significantly higher readmission rate, while the differences between weekday and weekend discharge were not statistically significant for the remaining hospitals.
In adjusted analyses, we observed that infants <1 year were more likely to be readmitted compared with 15- to 17-year-olds, while children 5-14 years of age were less likely to be readmitted (Table 2). Medical complexity and the number of chronic conditions had the greatest association with readmissions, with increased likelihood of readmission observed as the number of chronic conditions increased. Weekend discharge was associated with increased probability of readmission compared with weekday discharge (adjusted probability of readmission [95% CI]: weekend 0.13 [0.12-0.13] vs weekday 0.11 [0.11-0.12], P < .001).
DISCUSSION
While the reasons for the weekend effect are unclear, data supporting this difference have been observed across many diverse patient groups and health systems both nationally and internationally.13-27,31 Weekend care is thought to differ from weekday care because of differences in physician and nurse staffing, availability of ancillary services, access to diagnostic testing and therapeutic interventions, ability to arrange outpatient follow-up, and individual patient clinical factors, including acuity of illness. Few studies have assessed the effect of weekend discharges on patient or system outcomes. Among children within a single health system, readmission risk was associated with weekend admission but not with weekend discharge.22 This observation suggests that if differential care exists, then it occurs during initial clinical management rather than during discharge planning. Consequently, understanding the interaction of weekend admission and LOS is important. In addition, the relative paucity of pediatric data examining a weekend discharge effect limits the ability to generalize these findings across other hospitals or health systems.
In contrast to prior work, we observed a modest increased risk for readmission among those discharged on the weekend in a large sample of children. Auger and Davis reported a lack of association between weekend discharge and readmissions at one tertiary care children’s hospital, citing reduced discharge volumes on the weekend, especially among children with medical complexity, as a possible driver for their observation.22 The inclusion of a much larger population across 43 hospitals in our study may explain our different findings compared with previous research. In addition, the inclusion/exclusion criteria differed between the two studies; we excluded index admissions for planned procedures in this study (which are more likely to occur during the week), which may have contributed to the differing conclusions. Although Auger and Davis suggest that differences in initial clinical management may be responsible for the weekend effect,22 our observations suggest that discharge planning practices may also contribute to readmission risk. For example, a family’s inability to access compounded medications at a local pharmacy or to access primary care following discharge could reasonably contribute to treatment failure and increased readmission risk. Attention to improving and standardizing discharge practices may alleviate differences in readmission risk among children discharged on a weekend.
Individual patient characteristics greatly influence LOS and readmission risk. Congruent with prior studies, medical complexity and technology dependence were among the factors in our study that had the strongest association with LOS and readmission risk.32 As with prior studies22, we observed that children with medical complexity and technology dependence were less frequently admitted and discharged on a weekend than on a weekday, which suggests that physicians may avoid complicated discharges on the weekend. Children with medical complexity present a unique challenge to physicians when assessing discharge readiness, given that these children frequently require careful coordination of durable medical equipment, obtainment of special medication preparations, and possibly the resumption or establishment of home health services. Notably, we cannot discern from our data what proportion of discharges may be delayed over the weekend secondary to challenges involved in coordinating care for children with medical complexity. Future investigations aimed at assessing physician decision making and discharge readiness in relation to discharge timing among children with medical complexity may establish this relationship more clearly.
We observed substantial variation in LOS and readmission risk across 43 tertiary care children’s hospitals. Since the 1970s, numerous studies have reported worse outcomes among patients admitted on the weekend. While the majority of studies support the weekend effect, several recent studies suggest that patients admitted on the weekend are at no greater risk of adverse outcomes than those admitted during the week.35-37 Our work builds on the existing literature, demonstrating a complex and variable relationship between weekend admission/discharge, LOS, and readmission risk across hospitals. Notably, while many hospitals in our study experienced a significant weekend effect in LOS or readmission risk, only four hospitals experienced a statistically significant weekend effect for both LOS and readmission risk (three hospitals experienced increased risk for both, while one hospital experienced increased readmission risk but decreased LOS). Future investigations of the weekend effect should focus on exploring the differences in admission/discharge practices and staffing patterns of hospitals that did or did not experience a weekend effect.
This study has several limitations
CONCLUSION
In a study of 43 children’s hospitals, children discharged on the weekend had a slightly increased readmission risk compared with children discharged on a weekday. Wide variation in the weekend effect on LOS and readmission risk was evident across hospitals. Individual patient characteristics had a greater impact on LOS and readmission risk than the weekend effect. Future investigations aimed at understanding which factors contribute most strongly to a weekend effect within individual hospitals (eg, differences in institutional admission/discharge practices) may help alleviate the weekend effect and improve healthcare quality.
Acknowledgments
This manuscript resulted from “Paper in a Day,” a Pediatric Research in Inpatient Settings (PRIS) Network-sponsored workshop presented at the Pediatric Hospital Medicine 2017 annual meeting. Workshop participants learned how to ask and answer a health services research question and efficiently prepare a manuscript for publication. The following are the members of the PRIS Network who contributed to this work: Jessica L. Bettenhausen, MD; Rebecca M. Cantu, MD, MPH; Jillian M Cotter, MD; Megan Deisz, MD; Teresa Frazer, MD; Pratichi Goenka, MD; Ashley Jenkins, MD; Kathryn E. Kyler, MD; Janet T. Lau, MD; Brian E. Lee, MD; Christiane Lenzen, MD; Trisha Marshall, MD; John M. Morrison MD, PhD; Lauren Nassetta, MD; Raymond Parlar-Chun, MD; Sonya Tang Girdwood MD, PhD; Tony R Tarchichi, MD; Irina G. Trifonova, MD; Jacqueline M. Walker, MD, MHPE; and Susan C. Walley, MD. See appendix for contact information for members of the PRIS Network
Funding
The authors have no financial relationships relevant to this article to disclose.
Disclosures
The authors have no conflicts of interest to disclose.
1. Crossing the Quality Chasm: The IOM Health Care Quality Initiative : Health and Medicine Division. http://www.nationalacademies.org/hmd/Global/News%20Announcements/Crossing-the-Quality-Chasm-The-IOM-Health-Care-Quality-Initiative.aspx. Accessed November 20, 2017.
2. Institute for Healthcare Improvement: IHI Home Page. http://www.ihi.org:80/Pages/default.aspx. Accessed November 20, 2017.
3. Berry JG, Zaslavsky AM, Toomey SL, et al. Recognizing differences in hospital quality performance for pediatric inpatient care. Pediatrics. 2015;136(2):251-262. doi:10.1542/peds.2014-3131
4. NQF: All-Cause Admissions and Readmissions Measures - Final Report. http://www.qualityforum.org/Publications/2015/04/All-Cause_Admissions_and_Readmissions_Measures_-_Final_Report.aspx. Accessed March 24, 2018.
5. Hospital Inpatient Potentially Preventable Readmissions Information and Reports. https://www.illinois.gov/hfs/MedicalProviders/hospitals/PPRReports/Pages/default.aspx. Accessed November 6, 2016.
6. Potentially Preventable Readmissions in Texas Medicaid and CHIP Programs - Fiscal Year 2013 | Texas Health and Human Services. https://hhs.texas.gov/reports/2016/08/potentially-preventable-readmissions-texas-medicaid-and-chip-programs-fiscal-year. Accessed November 6, 2016.
7. Statewide Planning and Research Cooperative System. http://www.health.ny.gov/statistics/sparcs/sb/. Accessed November 6, 2016.
8. HCA Implements Potentially Preventable Readmission (PPR) Adjustments. Wash State Hosp Assoc. http://www.wsha.org/articles/hca-implements-potentially-preventable-readmission-ppr-adjustments/. Accessed November 8, 2016.
9. Berry JG, Toomey SL, Zaslavsky AM, et al. Pediatric readmission prevalence and variability across hospitals. JAMA. 2013;309(4):372-380. doi:10.1001/jama.2012.188351 PubMed
10. Bardach NS, Vittinghoff E, Asteria-Peñaloza R, et al. Measuring hospital quality using pediatric readmission and revisit rates. Pediatrics. 2013;132(3):429-436. doi:10.1542/peds.2012-3527 PubMed
11. Berry JG, Blaine K, Rogers J, et al. A framework of pediatric hospital discharge care informed by legislation, research, and practice. JAMA Pediatr. 2014;168(10):955-962; quiz 965-966. doi:10.1001/jamapediatrics.2014.891 PubMed
12. Auger KA, Simon TD, Cooperberg D, et al. Summary of STARNet: seamless transitions and (Re)admissions network. Pediatrics. 2015;135(1):164. doi:10.1542/peds.2014-1887 PubMed
13. Freemantle N, Ray D, McNulty D, et al. Increased mortality associated with weekend hospital admission: a case for expanded seven day services? BMJ. 2015;351:h4596. doi:10.1136/bmj.h4596 PubMed
14. Schilling PL, Campbell DA, Englesbe MJ, Davis MM. A comparison of in-hospital mortality risk conferred by high hospital occupancy, differences in nurse staffing levels, weekend admission, and seasonal influenza. Med Care. 2010;48(3):224-232. doi:10.1097/MLR.0b013e3181c162c0 PubMed
15. Cram P, Hillis SL, Barnett M, Rosenthal GE. Effects of weekend admission and hospital teaching status on in-hospital mortality. Am J Med. 2004;117(3):151-157. doi:10.1016/j.amjmed.2004.02.035 PubMed
16. Zapf MAC, Kothari AN, Markossian T, et al. The “weekend effect” in urgent general operative procedures. Surgery. 2015;158(2):508-514. doi:10.1016/j.surg.2015.02.024 PubMed
17. Freemantle N, Richardson M, Wood J, et al. Weekend hospitalization and additional risk of death: an analysis of inpatient data. J R Soc Med. 2012;105(2):74-84. doi:10.1258/jrsm.2012.120009 PubMed
18. Bell CM, Redelmeier DA. Mortality among patients admitted to hospitals on weekends as compared with weekdays. N Engl J Med. 2001;345(9):663-668. doi:10.1056/NEJMsa003376 PubMed
19. Coiera E, Wang Y, Magrabi F, Concha OP, Gallego B, Runciman W. Predicting the cumulative risk of death during hospitalization by modeling weekend, weekday and diurnal mortality risks. BMC Health Serv Res. 2014;14:226. doi:10.1186/1472-6963-14-226 PubMed
20. Powell ES, Khare RK, Courtney DM, Feinglass J. The weekend effect for patients with sepsis presenting to the emergency department. J Emerg Med. 2013;45(5):641-648. doi:10.1016/j.jemermed.2013.04.042 PubMed
21. Ananthakrishnan AN, McGinley EL, Saeian K. Outcomes of weekend admissions for upper gastrointestinal hemorrhage: a nationwide analysis. Clin Gastroenterol Hepatol Off Clin Pract J Am Gastroenterol Assoc. 2009;7(3):296-302e1. doi:10.1016/j.cgh.2008.08.013 PubMed
22. Auger KA, Davis MM. Pediatric weekend admission and increased unplanned readmission rates. J Hosp Med. 2015;10(11):743-745. doi:10.1002/jhm.2426 PubMed
23. Goldstein SD, Papandria DJ, Aboagye J, et al. The “weekend effect” in pediatric surgery - increased mortality for children undergoing urgent surgery during the weekend. J Pediatr Surg. 2014;49(7):1087-1091. doi:10.1016/j.jpedsurg.2014.01.001 PubMed
24. Adil MM, Vidal G, Beslow LA. Weekend effect in children with stroke in the nationwide inpatient sample. Stroke. 2016;47(6):1436-1443. doi:10.1161/STROKEAHA.116.013453 PubMed
25. McCrory MC, Spaeder MC, Gower EW, et al. Time of admission to the PICU and mortality. Pediatr Crit Care Med J Soc Crit Care Med World Fed Pediatr Intensive Crit Care Soc. 2017;18(10):915-923. doi:10.1097/PCC.0000000000001268 PubMed
26. Mangold WD. Neonatal mortality by the day of the week in the 1974-75 Arkansas live birth cohort. Am J Public Health. 1981;71(6):601-605. PubMed
27. MacFarlane A. Variations in number of births and perinatal mortality by day of week in England and Wales. Br Med J. 1978;2(6153):1670-1673. PubMed
28. McShane P, Draper ES, McKinney PA, McFadzean J, Parslow RC, Paediatric intensive care audit network (PICANet). Effects of out-of-hours and winter admissions and number of patients per unit on mortality in pediatric intensive care. J Pediatr. 2013;163(4):1039-1044.e5. doi:10.1016/j.jpeds.2013.03.061 PubMed
29. Hixson ED, Davis S, Morris S, Harrison AM. Do weekends or evenings matter in a pediatric intensive care unit? Pediatr Crit Care Med J Soc Crit Care Med World Fed Pediatr Intensive Crit Care Soc. 2005;6(5):523-530. PubMed
30. Gonzalez KW, Dalton BGA, Weaver KL, Sherman AK, St Peter SD, Snyder CL. Effect of timing of cannulation on outcome for pediatric extracorporeal life support. Pediatr Surg Int. 2016;32(7):665-669. doi:10.1007/s00383-016-3901-6 PubMed
31. Desai V, Gonda D, Ryan SL, et al. The effect of weekend and after-hours surgery on morbidity and mortality rates in pediatric neurosurgery patients. J Neurosurg Pediatr. 2015;16(6):726-731. doi:10.3171/2015.6.PEDS15184 PubMed
32. Berry JG, Hall DE, Kuo DZ, et al. Hospital utilization and characteristics of patients experiencing recurrent readmissions within children’s hospitals. JAMA. 2011;305(7):682-690. doi:10.1001/jama.2011.122 PubMed
33. Hoshijima H, Takeuchi R, Mihara T, et al. Weekend versus weekday admission and short-term mortality: A meta-analysis of 88 cohort studies including 56,934,649 participants. Medicine (Baltimore). 2017;96(17):e6685. doi:10.1097/MD.0000000000006685 PubMed
34. Feudtner C, Feinstein JA, Zhong W, Hall M, Dai D. Pediatric complex chronic conditions classification system version 2: updated for ICD-10 and complex medical technology dependence and transplantation. BMC Pediatr. 2014;14:199. doi:10.1186/1471-2431-14-199 PubMed
35. Li L, Rothwell PM, Oxford Vascular Study. Biases in detection of apparent “weekend effect” on outcome with administrative coding data: population based study of stroke. BMJ. 2016;353:i2648. doi: https://doi.org/10.1136/bmj.i2648 PubMed
36. Bray BD, Cloud GC, James MA, et al. Weekly variation in health-care quality by day and time of admission: a nationwide, registry-based, prospective cohort study of acute stroke care. The Lancet. 2016;388(10040):170-177. doi:10.1016/S0140-6736(16)30443-3 PubMed
37. Ko SQ, Strom JB, Shen C, Yeh RW. Mortality, Length of Stay, and Cost of Weekend Admissions. J Hosp Med. 2018. doi:10.12788/jhm.2906 PubMed
38. Tubbs-Cooley HL, Cimiotti JP, Silber JH, Sloane DM, Aiken LH. An observational study of nurse staffing ratios and hospital readmission among children admitted for common conditions. BMJ Qual Saf. 2013;22(9):735-742. doi:10.1136/bmjqs-2012-001610 PubMed
39. Ong M, Bostrom A, Vidyarthi A, McCulloch C, Auerbach A. House staff team workload and organization effects on patient outcomes in an academic general internal medicine inpatient service. Arch Intern Med. 2007;167(1):47-52. doi:10.1001/archinte.167.1.47 PubMed
© 2018 Society of Hospital Medicine
Health and Economic Burden of Nonalcoholic Fatty Liver Disease in the United States and Its Impact on Veterans
Nonalcoholic fatty liver disease (NAFLD) is the hepatic manifestation of the metabolic syndrome. NAFLD also is an independent risk factor for cardiovascular disease, type 2 diabetes mellitus (T2DM), chronic kidney disease, cirrhosis, liver cancer, and all-cause mortality.1-3 As the leading cause of liver disease in the US and globally, NAFLD is strongly associated with obesity and metabolic syndrome, with the rising prevalence of NAFLD closely mirroring the epidemic of obesity and T2DM.4,5 The unrelenting increase of NAFLD prevalence has led to a significant rise in associated health care and economic burdens, compounded by the boom in childhood obesity and an aging population. In this review, we will discuss the epidemiology and economic burden of NAFLD in the US and how it affects veteran health.
NAFLD Definition
NAFLD is defined as the presence of > 5% of hepatic steatosis in the absence of excessive alcohol use, steatosis-inducing medication, or other concurrent chronic liver diseases. 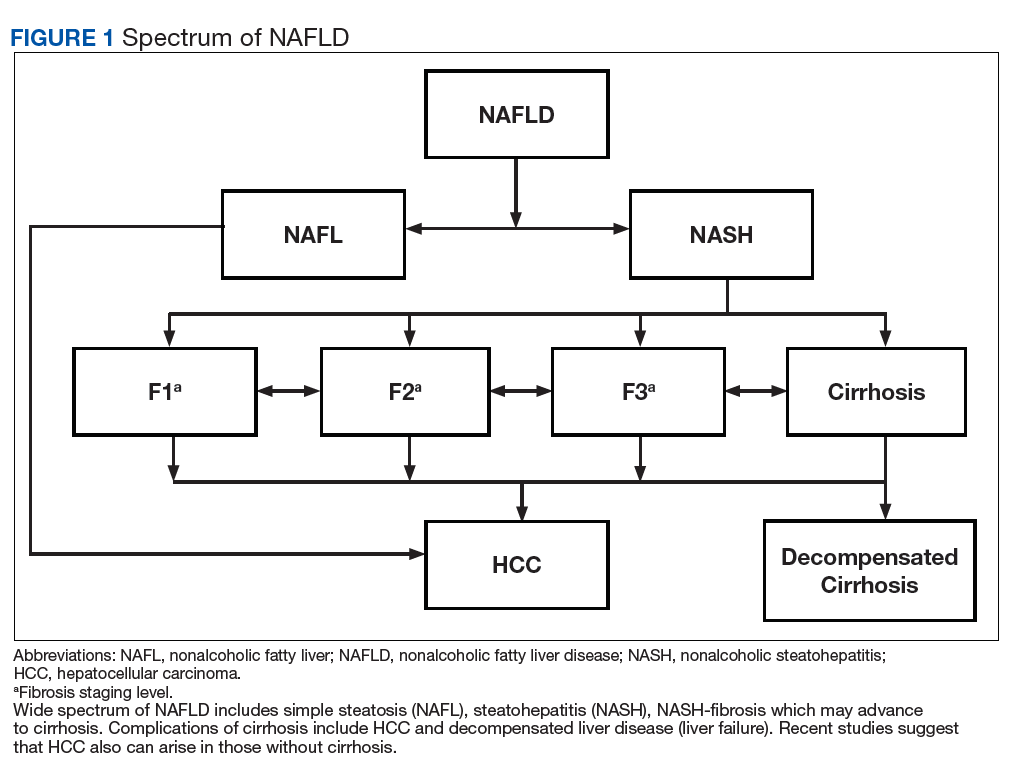
Compared with patients with NAFL, patients with NASH are at a much higher risk of developing fibrosis (scarring of the liver) and cirrhosis (significant scarring with distorted liver architecture). Patients with either NAFL or NASH, with or without advanced fibrosis, also can develop hepatocellular carcinoma (HCC). Severity of liver fibrosis (ie, fibrosis stage) is the most important predictor of liver-associated mortality and all-cause mortality; those with significant fibrosis (≥ F2 stage of fibrosis) are more likely to die of liver disease or to undergo a liver transplant compared with those with earlier stages of disease (ie, stages 0 to F1). Those with advanced scarring or cirrhosis (≥ F3 stage of fibrosis) exhibit an even higher risk of death or liver transplantation.6
NAFLD is a slow and often progressive disease. Time to progression between each stage of fibrosis is about 7 years; however, there has been a documented subset of patients with rapid progression to advanced fibrosis.7 The risk factors associated with this increased risk of fibrosis progression remain poorly understood.
Prevalence
The prevalence of NAFLD in the US is about 24% to 26%—about 85 million Americans. Up to 20% to 30% of these cases (about 17-25 million Americans) are thought to have NASH (Figure 2). 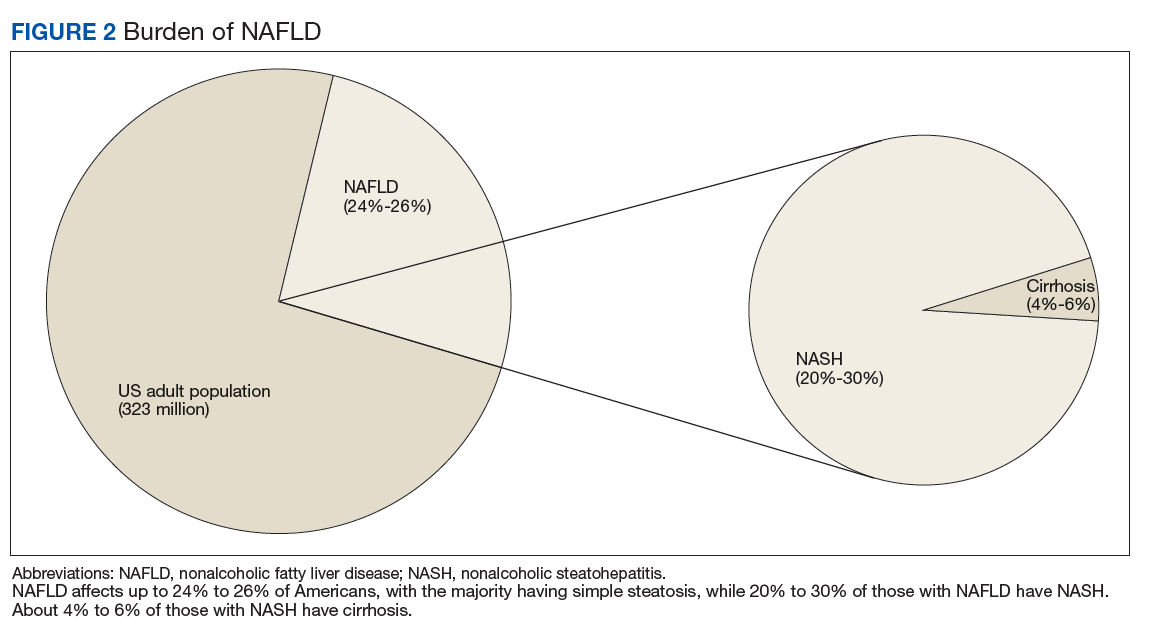
Although liver biopsy remains the current gold standard for diagnosis and histopathologic staging of NAFLD, alternatives to liver biopsy include elastography techniques (ie, transient elastography using Fibroscan[Paris, France], shear wave elastography using Supersonic Image Aixplorer [Weston, FL], and magnetic resonance elastography), magnetic resonance spectroscopy, liver enzymes, and noninvasive simple and complex (serologic) scoring systems such as the Fatty Liver Index. Among these, liver enzymes and serologic scores are most likely to underestimate NAFLD disease burden. Transient elastographyis widely used because the test is easy to perform, noninvasive, and reliably estimates the degree of liver fibrosis in patients with NAFLD by measuring the speed of a mechanically induced shear wave using pulse-echo ultrasonic acquisitions in a much larger portion of the tissue (about 100 times more than a liver biopsy core). Transient elastography also can objectively quantify the amount of liver fat by measuring a 3.5 MHz ultrasound coefficient of attenuation or controlled attenuation parameter (CAP). This correlates with the degree of liver fat, and a higher CAP level reflects a greater degree of steatosis.
The largest study of US veterans utilized abnormal (ie, elevated) liver enzymes as the diagnostic criteria and reviewed nearly 10 million veterans who were followed between 2003 and 2011. Investigators reported a NAFLD prevalence of 13.6% in this population and noted an overall increase in NAFLD prevalence from 6.3% in 2003 to 17.6% in 2011, which highlights the continued growth in NAFLD clinical burden.10 This study, however, is likely to have underestimated the prevalence of NAFLD among veterans because liver enzymes are often normal among those with NAFLD (ie, low sensitivity), and the prevalence of obesity and T2DM are significantly higher in the veteran population vs the general population.
Incidence
There are limited studies on NAFLD incidence. The largest study of US veterans to date used liver enzymes as its diagnostic criteria and reported an annual NAFLD incidence of 2 to 3 per 100 persons (over 9 years from 2003 to 2011).10 There are a few studies from Asia and Europe, and a recent pooled meta-analysis of these studies reported the incidence of NAFLD in Asia to be 52.3 per 1,000 person-years; the incidence in Western countries was 28 per 1,000 person-years.5 These variances may be explained, in part, to disparities in race/background. For example, Hispanics and South Asians (ie, people from Bangladesh, India, or Pakistan) are at higher risk for NAFLD/NASH.11 These findings reinforce the need for further studies to better estimate the true incidence of NAFLD among veterans.
Chronic Liver Disease, Cirrhosis, and Hepatocellular Carcinoma
The prevalence of NASH cirrhosis also has been evaluated using serologic scores, such as aspartate aminotransferase to platelet ratio index (APRI). The National Health and Nutrition Examination Survey (NHANES) database was reviewed, and data for adults in 2 separate periods were analyzed (1999-2002 and 2009-2012) and the prevalence of NASH cirrhosis was noted to have increased 2.5-fold over the period (0.072% vs 0.178%, P < .05).11 Based on data from the HealthCore Integrated Research Database from 2006 to 2014, about 15% of cirrhosis cases were attributed to NAFLD, and about 24% each were attributed to hepatitis C virus (HCV) and alcoholic liver disease.12 A review of about 60,000 veterans with cirrhosis between 2001 and 2013 revealed a prevalence of NAFLD-related cirrhosis of about 15%, while 48% were attributed to HCV.13 In contrast to the continued increase in NAFLD prevalence, the number of patients with HCV-associated liver disease has been in gradual decline since the advent of direct acting antiviral medications in 2011.12
Based on data from the United Network for Organ Sharing (UNOS), the number of patients awaiting liver transplant due to NAFLD nearly tripled from 2004 to 2013, and in 2013 NAFLD became the second leading disease among waitlisted patients for liver transplantation.14 Dynamic Markov modeling predicts that cases of decompensated NASH cirrhosis (ie, liver failure) will rise by 161%, from about 144,000 to 376,000 cases over the next 15 years.8 These projections predict that NAFLD will overtake HCV as the leading cause of chronic liver disease among patients awaiting a liver transplant and will pose a significant clinical and economic burden in the coming years.
Aside from cirrhosis due to NAFLD, NAFLD-related HCC has been on the rise and has overtaken HCV-related HCC. UNOS data from 2003 to 2015 have shown a 2-fold decline in liver transplantation for HCV-associated HCC; however, the same period saw a 10-fold increase in liver transplantation for NAFLD-associated HCC.15,16 This trend in NAFLD-related HCC is expected to grow from 5,000 to 6,000 cases in 2005 to 45,000 cases by 2025.9 More surprisingly, studies from the US veteran population have reported that patients with NAFLD-related HCC are less likely to have cirrhosis compared with patients with HCV- or alcohol-related HCC.17 Among all US veterans who developed HCC in the absence of cirrhosis between 2005 and 2010, NAFLD and metabolic syndrome seemed to be the leading risk factors for development of HCC.18 These trends raise concern for the rise in noncirrhotic HCC in the NAFLD population and highlight the need to improve current screening guidelines for this subset of patients.
Economic Burden
With such a heavy clinical burden and a projected increase in volume over the next decade, NAFLD is expected to have a similarly exponential impact on the economic burden. A review of 976 Medicare beneficiaries with NAFLD who were hospitalized from January 1, 2010 to December 31, 2010, noted a median annual total payment of about $11,000, with significantly lower payment for patients without cirrhosis compared with those with cirrhosis ($10,146 vs $18,804, P < .01).19 Another review of 29,528 Medicare beneficiaries with NAFLD who sought outpatient care between 2005 and 2010 saw a rise in mean yearly charges in 2005 of $2,624 ± 3,308 to $3,608 ± 5,132 in 2010 (P < .05).20
To place these costs in perspective, Allen and colleagues reviewed a large national claims database of individuals enrolled with private and Medicare advantage health plans.21 Comparing patients with NAFLD with a control matched group with similar metabolic comorbidities the study revealed annual median outpatient care costs of $5,363 for the patients with NAFLD with Medicare advantage plans, which was significantly higher than $4,111 for the control group. Projection models based on similar Medicare beneficiaries estimate a rise in annual US economic burden to $103 billion from direct medical care costs alone and another $188 billion in societal costs related to NAFLD.22 New NASH/antifibrotic therapies are being evaluated in clinical trials and are expected to lead to even higher costs. Given the similarities in the trends of NAFLD prevalence between veterans and the general population, it is anticipated that a similar growth and burden in health care utilization cost will affect the VHA.
Association With Other Chronic Medical Conditions
NAFLD is closely associated with metabolic syndrome (Figure 3). Concurrent diagnosis of NAFLD in patients with existing T2DM is associated with poor glycemic control, progressive diabetic retinopathy, diabetic nephropathy, increased risk of cardiovascular complications, and a 2-fold increase in all-cause mortality.1-3 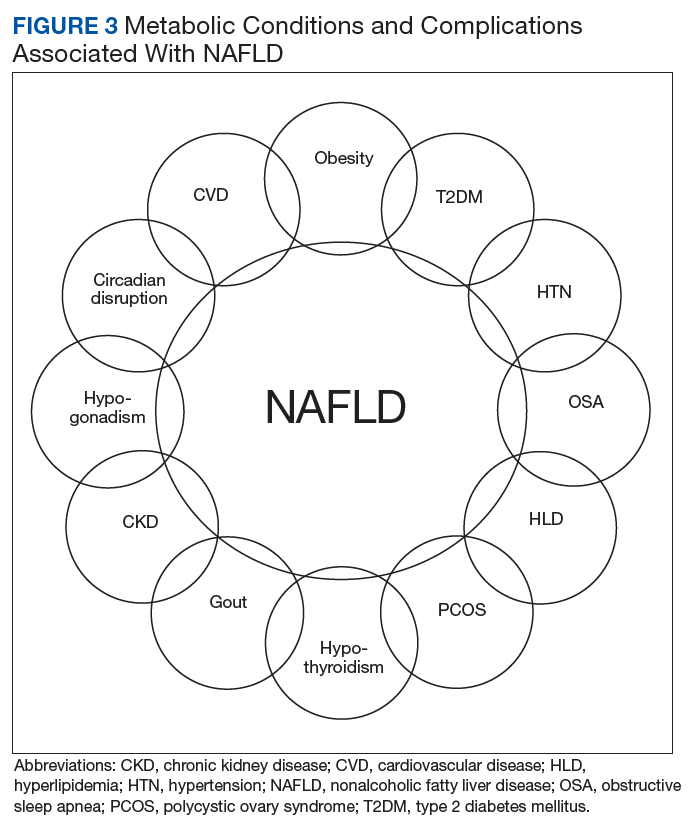
Similar associations have been described between NAFLD and other metabolic conditions such as obesity, hypertension, hypothyroidism, polycystic ovarian syndrome, and chronic kidney disease.31 Identifying patients with NAFLD may help with screening for the above metabolic diseases because patients with NAFLD (by comparison with patients with non-NAFLD) are at higher risk for diabetic, cardiovascular, and pulmonary complications and may warrant a more intensive treatment approach.
Conclusion
A leading cause of chronic liver disease and cirrhosis in the US, NAFLD is independently associated with metabolic syndrome and all-cause mortality. The number of veterans with NAFLD is expected to grow significantly over the coming years given the ongoing epidemic of adult and childhood obesity and T2DM. It is associated with many other medical conditions, including cardiovascular disease and complications, incident metabolic diseases, and may progress to liver cirrhosis and cirrhosis associated complications like HCC and liver failure. The current lack of any approved drug treatment for NASH/fibrosis and the shortage of organs for liver transplant emphasize the need for comprehensive primary prevention measures to reduce the future health and economic costs associated with NAFLD.
There is a growing need to address the epidemic of metabolic syndrome, as heralded by the World Health Organization in its 2013 global action plan. To address this multifaceted disease, initial approach should be to improve NAFLD education among veterans, beginning with the primary care teams and extending to specialty care, including hepatologists. Future steps also should include the development of a comprehensive metabolic/NAFLD clinic in all US Department of Veterans Affairs medical centers that integrates multidisciplinary care, point-of-care evaluation (eg, elastography staging of disease), and access to clinical trials, and have NAFLD care/outcome as a key performance target for all providers.
1. Targher G, Bertolini L, Padovani R, et al. Prevalence of nonalcoholic fatty liver disease and its association with cardiovascular disease among type 2 diabetic patients. Diabetes Care. 2007;30(5):1212-1218.
2. Targher G, Bertolini L, Rodella S, et al. Non-alcoholic fatty liver disease is independently associated with an increased prevalence of chronic kidney disease and proliferative/laser-treated retinopathy in type 2 diabetic patients. Diabetologia. 2008;51(3):444-450.
3. Adams LA, Harmsen S, St Sauver JL, et al. Nonalcoholic fatty liver disease increases risk of death among patients with diabetes: a community-based cohort study. Am J Gastroenterol. 2010. 105(7):1567-1573.
4. Loomba R, Sanyal AJ. The global NAFLD epidemic. Nat Rev Gastroenterol Hepatol. 2013;10(11):686-690.
5. Younossi ZM, Koenig AB, Abdelatif D, Fazel Y, Henry L, Wymer M. Global epidemiology of nonalcoholic fatty liver disease-meta-analytic assessment of prevalence, incidence, and outcomes. Hepatology. 2016;64(1):73-84.
6. Angulo P, Machado MV, Diehl AM. Fibrosis in nonalcoholic fatty liver disease: mechanisms and clinical implications. Semin Liver Dis. 2015;35(2):132-145.
7. Satapathy SK, Sanyal AJ. Epidemiology and natural history of nonalcoholic fatty liver disease. Semin Liver Dis. 2015;35(3):221-235.
8. Estes C, Anstee QM, Arias-Loste MT, et al. Modeling NAFLD disease burden in China, France, Germany, Italy, Japan, Spain, United Kingdom, and United States for the period 2016-2030. J Hepatol. 2018;69(4):896-904.
9. Ahmed O, Liu L, Gayed A, et al. The changing face of hepatocellular carcinoma: forecasting prevalence of nonalcoholic steatohepatitis and hepatitis C cirrhosis. J Clin Exp Hepatol. 2018. In press.
10. Kanwal F, Kramer JR, Duan Z, Yu X, White D, El-Serag HB. Trends in the burden of nonalcoholic fatty liver disease in a United States cohort of veterans. Clin Gastroenterol Hepatol. 2016;14(2):301-308.
11. Kabbany MN, Conjeevaram Selvakumar PK, Watt K, et al. Prevalence of nonalcoholic steatohepatitis-associated cirrhosis in the United States: an analysis of national health and nutrition examination survey data. Am J Gastroenterol. 2017;112(4):581-587.
12. Goldberg D, Ditah IC, Saeian K, et al. Changes in the prevalence of hepatitis C virus infection, nonalcoholic steatohepatitis, and alcoholic liver disease among patients with cirrhosis or liver failure on the waitlist for liver transplantation. Gastroenterology. 2017;152(5):1090-1099.
13. Beste LA, Leipertz SL, Green PK, Dominitz JA, Ross D, Ioannou GN. Trends in burden of cirrhosis and hepatocellular carcinoma by underlying liver disease in US veterans, 2001-2013. Gastroenterology. 2015;149(6):1471-1482.
14. Wong RJ, Aguilar M, Cheung R, et al. Nonalcoholic steatohepatitis is the second leading etiology of liver disease among adults awaiting liver transplantation in the United States. Gastroenterology. 2015;148(3):547-555.
15. Belli LS, Perricone G, Adam R, et al; all the contributing centers (www.eltr.org) and the European Liver and Intestine Transplant Association (ELITA). Impact of DAAs on liver transplantation: major effects on the evolution of indications and results. An ELITA study based on the ELTR registry. J Hepatol. 2018;69(4):810-817.
16. Flemming JA, Kim WR, Brosgart CL, Terrault NA. Reduction in liver transplant wait-listing in the era of direct-acting antiviral therapy. Hepatology. 2017;65(3):804-812.
17. Mittal S, Sada YH, El-Serag HB, et al. Temporal trends of nonalcoholic fatty liver disease-related hepatocellular carcinoma in the Veteran Affairs population. Clin Gastroenterol Hepatol. 2015;13(3):594-601.
18. Mittal S, El-Serag HB, Sada YH, et al. Hepatocellular carcinoma in the absence of cirrhosis in United States veterans is associated with nonalcoholic fatty liver disease. Clin Gastroenterol Hepatol. 2016;14(1):124-131.e1.
19. Sayiner M, Otgonsuren M, Cable R. Variables associated with inpatient and outpatient resource utilization among medicare beneficiaries with nonalcoholic fatty liver disease with or without cirrhosis. J Clin Gastroenterol. 2017;51(3):254-260.
20. Younossi ZM, Zheng L, Stepanova M, Henry L, Venkatesan C, Mishra A. Trends in outpatient resource utilizations and outcomes for Medicare beneficiaries with nonalcoholic fatty liver disease. J Clin Gastroenterol. 2015;49(3):222-227.
21. Allen AM, Van Houten HK, Sangaralingham LR, Talwalkar JA, McCoy RG. Healthcare cost and utilization in nonalcoholic fatty liver disease: real-world data from a large US claims database. Hepatology. 2018;68(6):2230-2238.
22. Younossi ZM, Blissett D, Blissett R, et al. The economic and clinical burden of nonalcoholic fatty liver disease in the United States and Europe. Hepatology. 2016;64(5):1577-1586.
23. Armstrong MJ, Hazlehurst JM, Parker R, et al. Severe asymptomatic non-alcoholic fatty liver disease in routine diabetes care; a multi-disciplinary team approach to diagnosis and management. QJM. 2014;107(1):33-41.
24. Ekstedt M, Franzén LE, Mathiesen UL, et al. Long-term follow-up of patients with NAFLD and elevated liver enzymes. Hepatology. 2006;44(4):865-873.
25. Kim D, Choi SY, Park EH, et al. Nonalcoholic fatty liver disease is associated with coronary artery calcification. Hepatology. 2012;56(2):605-613.
26. Stepanova M, Younossi ZM. Independent association between nonalcoholic fatty liver disease and cardiovascular disease in the US population. Clin Gastroenterol Hepatol. 2012;10(6):646-650.
27. Targher G, Day CP, Bonora E. Risk of cardiovascular disease in patients with nonalcoholic fatty liver disease. N Engl J Med. 2010;363(14):1341-1350.
28. Mir HM, Stepanova M, Afendy H, Cable R, Younossi ZM. Association of sleep disorders with nonalcoholic fatty liver disease (NAFLD): a population-based study. J Clin Exp Hepatol. 2013;3(3):181-185.
29. Agrawal S, Duseja A, Aggarwal A, et al. Obstructive sleep apnea is an important predictor of hepatic fibrosis in patients with nonalcoholic fatty liver disease in a tertiary care center. Hepatol Int. 2015;9(2):283-291.
30. Sookoian S, Pirola CJ. Obstructive sleep apnea is associated with fatty liver and abnormal liver enzymes: a meta-analysis. Obes Surg. 2013;23(11):1815-1825.
31. Armstrong MJ, Adams LA, Canbay A, Syn WK. Extrahepatic complications of nonalcoholic fatty liver disease. Hepatology. 2014;59(3):1174-1197.
Nonalcoholic fatty liver disease (NAFLD) is the hepatic manifestation of the metabolic syndrome. NAFLD also is an independent risk factor for cardiovascular disease, type 2 diabetes mellitus (T2DM), chronic kidney disease, cirrhosis, liver cancer, and all-cause mortality.1-3 As the leading cause of liver disease in the US and globally, NAFLD is strongly associated with obesity and metabolic syndrome, with the rising prevalence of NAFLD closely mirroring the epidemic of obesity and T2DM.4,5 The unrelenting increase of NAFLD prevalence has led to a significant rise in associated health care and economic burdens, compounded by the boom in childhood obesity and an aging population. In this review, we will discuss the epidemiology and economic burden of NAFLD in the US and how it affects veteran health.
NAFLD Definition
NAFLD is defined as the presence of > 5% of hepatic steatosis in the absence of excessive alcohol use, steatosis-inducing medication, or other concurrent chronic liver diseases.
Compared with patients with NAFL, patients with NASH are at a much higher risk of developing fibrosis (scarring of the liver) and cirrhosis (significant scarring with distorted liver architecture). Patients with either NAFL or NASH, with or without advanced fibrosis, also can develop hepatocellular carcinoma (HCC). Severity of liver fibrosis (ie, fibrosis stage) is the most important predictor of liver-associated mortality and all-cause mortality; those with significant fibrosis (≥ F2 stage of fibrosis) are more likely to die of liver disease or to undergo a liver transplant compared with those with earlier stages of disease (ie, stages 0 to F1). Those with advanced scarring or cirrhosis (≥ F3 stage of fibrosis) exhibit an even higher risk of death or liver transplantation.6
NAFLD is a slow and often progressive disease. Time to progression between each stage of fibrosis is about 7 years; however, there has been a documented subset of patients with rapid progression to advanced fibrosis.7 The risk factors associated with this increased risk of fibrosis progression remain poorly understood.
Prevalence
The prevalence of NAFLD in the US is about 24% to 26%—about 85 million Americans. Up to 20% to 30% of these cases (about 17-25 million Americans) are thought to have NASH (Figure 2).
Although liver biopsy remains the current gold standard for diagnosis and histopathologic staging of NAFLD, alternatives to liver biopsy include elastography techniques (ie, transient elastography using Fibroscan[Paris, France], shear wave elastography using Supersonic Image Aixplorer [Weston, FL], and magnetic resonance elastography), magnetic resonance spectroscopy, liver enzymes, and noninvasive simple and complex (serologic) scoring systems such as the Fatty Liver Index. Among these, liver enzymes and serologic scores are most likely to underestimate NAFLD disease burden. Transient elastographyis widely used because the test is easy to perform, noninvasive, and reliably estimates the degree of liver fibrosis in patients with NAFLD by measuring the speed of a mechanically induced shear wave using pulse-echo ultrasonic acquisitions in a much larger portion of the tissue (about 100 times more than a liver biopsy core). Transient elastography also can objectively quantify the amount of liver fat by measuring a 3.5 MHz ultrasound coefficient of attenuation or controlled attenuation parameter (CAP). This correlates with the degree of liver fat, and a higher CAP level reflects a greater degree of steatosis.
The largest study of US veterans utilized abnormal (ie, elevated) liver enzymes as the diagnostic criteria and reviewed nearly 10 million veterans who were followed between 2003 and 2011. Investigators reported a NAFLD prevalence of 13.6% in this population and noted an overall increase in NAFLD prevalence from 6.3% in 2003 to 17.6% in 2011, which highlights the continued growth in NAFLD clinical burden.10 This study, however, is likely to have underestimated the prevalence of NAFLD among veterans because liver enzymes are often normal among those with NAFLD (ie, low sensitivity), and the prevalence of obesity and T2DM are significantly higher in the veteran population vs the general population.
Incidence
There are limited studies on NAFLD incidence. The largest study of US veterans to date used liver enzymes as its diagnostic criteria and reported an annual NAFLD incidence of 2 to 3 per 100 persons (over 9 years from 2003 to 2011).10 There are a few studies from Asia and Europe, and a recent pooled meta-analysis of these studies reported the incidence of NAFLD in Asia to be 52.3 per 1,000 person-years; the incidence in Western countries was 28 per 1,000 person-years.5 These variances may be explained, in part, to disparities in race/background. For example, Hispanics and South Asians (ie, people from Bangladesh, India, or Pakistan) are at higher risk for NAFLD/NASH.11 These findings reinforce the need for further studies to better estimate the true incidence of NAFLD among veterans.
Chronic Liver Disease, Cirrhosis, and Hepatocellular Carcinoma
The prevalence of NASH cirrhosis also has been evaluated using serologic scores, such as aspartate aminotransferase to platelet ratio index (APRI). The National Health and Nutrition Examination Survey (NHANES) database was reviewed, and data for adults in 2 separate periods were analyzed (1999-2002 and 2009-2012) and the prevalence of NASH cirrhosis was noted to have increased 2.5-fold over the period (0.072% vs 0.178%, P < .05).11 Based on data from the HealthCore Integrated Research Database from 2006 to 2014, about 15% of cirrhosis cases were attributed to NAFLD, and about 24% each were attributed to hepatitis C virus (HCV) and alcoholic liver disease.12 A review of about 60,000 veterans with cirrhosis between 2001 and 2013 revealed a prevalence of NAFLD-related cirrhosis of about 15%, while 48% were attributed to HCV.13 In contrast to the continued increase in NAFLD prevalence, the number of patients with HCV-associated liver disease has been in gradual decline since the advent of direct acting antiviral medications in 2011.12
Based on data from the United Network for Organ Sharing (UNOS), the number of patients awaiting liver transplant due to NAFLD nearly tripled from 2004 to 2013, and in 2013 NAFLD became the second leading disease among waitlisted patients for liver transplantation.14 Dynamic Markov modeling predicts that cases of decompensated NASH cirrhosis (ie, liver failure) will rise by 161%, from about 144,000 to 376,000 cases over the next 15 years.8 These projections predict that NAFLD will overtake HCV as the leading cause of chronic liver disease among patients awaiting a liver transplant and will pose a significant clinical and economic burden in the coming years.
Aside from cirrhosis due to NAFLD, NAFLD-related HCC has been on the rise and has overtaken HCV-related HCC. UNOS data from 2003 to 2015 have shown a 2-fold decline in liver transplantation for HCV-associated HCC; however, the same period saw a 10-fold increase in liver transplantation for NAFLD-associated HCC.15,16 This trend in NAFLD-related HCC is expected to grow from 5,000 to 6,000 cases in 2005 to 45,000 cases by 2025.9 More surprisingly, studies from the US veteran population have reported that patients with NAFLD-related HCC are less likely to have cirrhosis compared with patients with HCV- or alcohol-related HCC.17 Among all US veterans who developed HCC in the absence of cirrhosis between 2005 and 2010, NAFLD and metabolic syndrome seemed to be the leading risk factors for development of HCC.18 These trends raise concern for the rise in noncirrhotic HCC in the NAFLD population and highlight the need to improve current screening guidelines for this subset of patients.
Economic Burden
With such a heavy clinical burden and a projected increase in volume over the next decade, NAFLD is expected to have a similarly exponential impact on the economic burden. A review of 976 Medicare beneficiaries with NAFLD who were hospitalized from January 1, 2010 to December 31, 2010, noted a median annual total payment of about $11,000, with significantly lower payment for patients without cirrhosis compared with those with cirrhosis ($10,146 vs $18,804, P < .01).19 Another review of 29,528 Medicare beneficiaries with NAFLD who sought outpatient care between 2005 and 2010 saw a rise in mean yearly charges in 2005 of $2,624 ± 3,308 to $3,608 ± 5,132 in 2010 (P < .05).20
To place these costs in perspective, Allen and colleagues reviewed a large national claims database of individuals enrolled with private and Medicare advantage health plans.21 Comparing patients with NAFLD with a control matched group with similar metabolic comorbidities the study revealed annual median outpatient care costs of $5,363 for the patients with NAFLD with Medicare advantage plans, which was significantly higher than $4,111 for the control group. Projection models based on similar Medicare beneficiaries estimate a rise in annual US economic burden to $103 billion from direct medical care costs alone and another $188 billion in societal costs related to NAFLD.22 New NASH/antifibrotic therapies are being evaluated in clinical trials and are expected to lead to even higher costs. Given the similarities in the trends of NAFLD prevalence between veterans and the general population, it is anticipated that a similar growth and burden in health care utilization cost will affect the VHA.
Association With Other Chronic Medical Conditions
NAFLD is closely associated with metabolic syndrome (Figure 3). Concurrent diagnosis of NAFLD in patients with existing T2DM is associated with poor glycemic control, progressive diabetic retinopathy, diabetic nephropathy, increased risk of cardiovascular complications, and a 2-fold increase in all-cause mortality.1-3
Similar associations have been described between NAFLD and other metabolic conditions such as obesity, hypertension, hypothyroidism, polycystic ovarian syndrome, and chronic kidney disease.31 Identifying patients with NAFLD may help with screening for the above metabolic diseases because patients with NAFLD (by comparison with patients with non-NAFLD) are at higher risk for diabetic, cardiovascular, and pulmonary complications and may warrant a more intensive treatment approach.
Conclusion
A leading cause of chronic liver disease and cirrhosis in the US, NAFLD is independently associated with metabolic syndrome and all-cause mortality. The number of veterans with NAFLD is expected to grow significantly over the coming years given the ongoing epidemic of adult and childhood obesity and T2DM. It is associated with many other medical conditions, including cardiovascular disease and complications, incident metabolic diseases, and may progress to liver cirrhosis and cirrhosis associated complications like HCC and liver failure. The current lack of any approved drug treatment for NASH/fibrosis and the shortage of organs for liver transplant emphasize the need for comprehensive primary prevention measures to reduce the future health and economic costs associated with NAFLD.
There is a growing need to address the epidemic of metabolic syndrome, as heralded by the World Health Organization in its 2013 global action plan. To address this multifaceted disease, initial approach should be to improve NAFLD education among veterans, beginning with the primary care teams and extending to specialty care, including hepatologists. Future steps also should include the development of a comprehensive metabolic/NAFLD clinic in all US Department of Veterans Affairs medical centers that integrates multidisciplinary care, point-of-care evaluation (eg, elastography staging of disease), and access to clinical trials, and have NAFLD care/outcome as a key performance target for all providers.
1. Targher G, Bertolini L, Padovani R, et al. Prevalence of nonalcoholic fatty liver disease and its association with cardiovascular disease among type 2 diabetic patients. Diabetes Care. 2007;30(5):1212-1218.
2. Targher G, Bertolini L, Rodella S, et al. Non-alcoholic fatty liver disease is independently associated with an increased prevalence of chronic kidney disease and proliferative/laser-treated retinopathy in type 2 diabetic patients. Diabetologia. 2008;51(3):444-450.
3. Adams LA, Harmsen S, St Sauver JL, et al. Nonalcoholic fatty liver disease increases risk of death among patients with diabetes: a community-based cohort study. Am J Gastroenterol. 2010. 105(7):1567-1573.
4. Loomba R, Sanyal AJ. The global NAFLD epidemic. Nat Rev Gastroenterol Hepatol. 2013;10(11):686-690.
5. Younossi ZM, Koenig AB, Abdelatif D, Fazel Y, Henry L, Wymer M. Global epidemiology of nonalcoholic fatty liver disease-meta-analytic assessment of prevalence, incidence, and outcomes. Hepatology. 2016;64(1):73-84.
6. Angulo P, Machado MV, Diehl AM. Fibrosis in nonalcoholic fatty liver disease: mechanisms and clinical implications. Semin Liver Dis. 2015;35(2):132-145.
7. Satapathy SK, Sanyal AJ. Epidemiology and natural history of nonalcoholic fatty liver disease. Semin Liver Dis. 2015;35(3):221-235.
8. Estes C, Anstee QM, Arias-Loste MT, et al. Modeling NAFLD disease burden in China, France, Germany, Italy, Japan, Spain, United Kingdom, and United States for the period 2016-2030. J Hepatol. 2018;69(4):896-904.
9. Ahmed O, Liu L, Gayed A, et al. The changing face of hepatocellular carcinoma: forecasting prevalence of nonalcoholic steatohepatitis and hepatitis C cirrhosis. J Clin Exp Hepatol. 2018. In press.
10. Kanwal F, Kramer JR, Duan Z, Yu X, White D, El-Serag HB. Trends in the burden of nonalcoholic fatty liver disease in a United States cohort of veterans. Clin Gastroenterol Hepatol. 2016;14(2):301-308.
11. Kabbany MN, Conjeevaram Selvakumar PK, Watt K, et al. Prevalence of nonalcoholic steatohepatitis-associated cirrhosis in the United States: an analysis of national health and nutrition examination survey data. Am J Gastroenterol. 2017;112(4):581-587.
12. Goldberg D, Ditah IC, Saeian K, et al. Changes in the prevalence of hepatitis C virus infection, nonalcoholic steatohepatitis, and alcoholic liver disease among patients with cirrhosis or liver failure on the waitlist for liver transplantation. Gastroenterology. 2017;152(5):1090-1099.
13. Beste LA, Leipertz SL, Green PK, Dominitz JA, Ross D, Ioannou GN. Trends in burden of cirrhosis and hepatocellular carcinoma by underlying liver disease in US veterans, 2001-2013. Gastroenterology. 2015;149(6):1471-1482.
14. Wong RJ, Aguilar M, Cheung R, et al. Nonalcoholic steatohepatitis is the second leading etiology of liver disease among adults awaiting liver transplantation in the United States. Gastroenterology. 2015;148(3):547-555.
15. Belli LS, Perricone G, Adam R, et al; all the contributing centers (www.eltr.org) and the European Liver and Intestine Transplant Association (ELITA). Impact of DAAs on liver transplantation: major effects on the evolution of indications and results. An ELITA study based on the ELTR registry. J Hepatol. 2018;69(4):810-817.
16. Flemming JA, Kim WR, Brosgart CL, Terrault NA. Reduction in liver transplant wait-listing in the era of direct-acting antiviral therapy. Hepatology. 2017;65(3):804-812.
17. Mittal S, Sada YH, El-Serag HB, et al. Temporal trends of nonalcoholic fatty liver disease-related hepatocellular carcinoma in the Veteran Affairs population. Clin Gastroenterol Hepatol. 2015;13(3):594-601.
18. Mittal S, El-Serag HB, Sada YH, et al. Hepatocellular carcinoma in the absence of cirrhosis in United States veterans is associated with nonalcoholic fatty liver disease. Clin Gastroenterol Hepatol. 2016;14(1):124-131.e1.
19. Sayiner M, Otgonsuren M, Cable R. Variables associated with inpatient and outpatient resource utilization among medicare beneficiaries with nonalcoholic fatty liver disease with or without cirrhosis. J Clin Gastroenterol. 2017;51(3):254-260.
20. Younossi ZM, Zheng L, Stepanova M, Henry L, Venkatesan C, Mishra A. Trends in outpatient resource utilizations and outcomes for Medicare beneficiaries with nonalcoholic fatty liver disease. J Clin Gastroenterol. 2015;49(3):222-227.
21. Allen AM, Van Houten HK, Sangaralingham LR, Talwalkar JA, McCoy RG. Healthcare cost and utilization in nonalcoholic fatty liver disease: real-world data from a large US claims database. Hepatology. 2018;68(6):2230-2238.
22. Younossi ZM, Blissett D, Blissett R, et al. The economic and clinical burden of nonalcoholic fatty liver disease in the United States and Europe. Hepatology. 2016;64(5):1577-1586.
23. Armstrong MJ, Hazlehurst JM, Parker R, et al. Severe asymptomatic non-alcoholic fatty liver disease in routine diabetes care; a multi-disciplinary team approach to diagnosis and management. QJM. 2014;107(1):33-41.
24. Ekstedt M, Franzén LE, Mathiesen UL, et al. Long-term follow-up of patients with NAFLD and elevated liver enzymes. Hepatology. 2006;44(4):865-873.
25. Kim D, Choi SY, Park EH, et al. Nonalcoholic fatty liver disease is associated with coronary artery calcification. Hepatology. 2012;56(2):605-613.
26. Stepanova M, Younossi ZM. Independent association between nonalcoholic fatty liver disease and cardiovascular disease in the US population. Clin Gastroenterol Hepatol. 2012;10(6):646-650.
27. Targher G, Day CP, Bonora E. Risk of cardiovascular disease in patients with nonalcoholic fatty liver disease. N Engl J Med. 2010;363(14):1341-1350.
28. Mir HM, Stepanova M, Afendy H, Cable R, Younossi ZM. Association of sleep disorders with nonalcoholic fatty liver disease (NAFLD): a population-based study. J Clin Exp Hepatol. 2013;3(3):181-185.
29. Agrawal S, Duseja A, Aggarwal A, et al. Obstructive sleep apnea is an important predictor of hepatic fibrosis in patients with nonalcoholic fatty liver disease in a tertiary care center. Hepatol Int. 2015;9(2):283-291.
30. Sookoian S, Pirola CJ. Obstructive sleep apnea is associated with fatty liver and abnormal liver enzymes: a meta-analysis. Obes Surg. 2013;23(11):1815-1825.
31. Armstrong MJ, Adams LA, Canbay A, Syn WK. Extrahepatic complications of nonalcoholic fatty liver disease. Hepatology. 2014;59(3):1174-1197.
Managing the Silent Epidemic of Nonalcoholic Fatty Liver Disease
For many years, viral hepatitis and particularly hepatitis C have been the bread and butter for clinicians dealing with chronic liver diseases. Over the past few years the Veterans Health Administration (VHA) has been incredibly successful in identifying, treating, and curing a significant proportion of veterans of this viral disease. However, nonalcoholic fatty liver disease (NAFLD) has become the most common cause of chronic liver disease worldwide and will soon overtake hepatitis C virus as the leading cause of liver transplantation. NAFLD covers a disease spectrum ranging from nonalcoholic fatty liver (NAFL) progressing to nonalcoholic steatohepatitis (NASH) to liver cirrhosis and liver cancer or liver failure. In the absence of effective treatment approaches, it is not surprising that NAFLD will create financial challenges for the VHA and US health care budgets. It is thus appropriate that Federal Practitioner has decided to publish a series of articles highlighting NAFLD and how it affects millions of Americans on its way to reaching quietly epidemic proportions within the VHA and across the globe.
Although NAFLD seems to have quietly and quickly reached epidemic proportions, its obscurity should not be surprising. NAFLD does not cause obvious symptoms in most patients, there is no simple test available for diagnosis of NASH, and disease-specific medications have not yet been approved for treatment. Primary care providers (PCPs) are the first point of medical contact for a majority of patients with or at risk for NAFLD; shockingly, NAFLD is greatly underrecognized, resulting in delayed diagnoses, which impact both health-related and quality-of-life outcomes in these patients. As emphasized in “Identifying and Treating Nonalcoholic Fatty Liver Disease” by Hunt and colleagues (page 20), PCPs should focus on 4 main aspects related to NAFLD: (1) Does my patient have NAFL? (2) Is my patient at risk for NASH and its ensuing manifestations? (3) Do simple noninvasive serum liver fibrosis markers suggest presence of clinically relevant liver fibrosis? and (4) Does my patient benefit from being referred to a specialist. The PCP is integral in optimally managing medical comorbidities and metabolic abnormalities as well as coordinating intense lifestyle and exercise interventions.
“Health and Economic Burden of Nonalcoholic Fatty Liver Disease in the United States and Its Impact on Veterans” by Shetty and Syn (page 14) discusses the epidemiology and economic burden of NAFLD in the US and how it will affect the health of veterans. Chronic liver disease is a major cause of mortality, morbidity, and health care resource utilization worldwide. Over the past 3 decades, NAFLD has gone from obscure liver diseases to the most common cause of chronic liver disease affecting 25% of the world’s population. Patients with NAFL who have advanced to NASH have an increased risk of liver-specific death. NASH is among the top etiologies for hepatocellular cancer and the fastest growing indication for liver transplantation, projected to overtake hepatitis C virus as the leading cause of liver transplantation. Most disturbing though is the fact that patients with NASH are the least likely to be surveyed for hepatocellular cancer development and the most likely to die while awaiting liver transplantation. Recent modeling estimates a 178% increase in liver deaths related to NASH by 2030.
The clinical burden of all stages of NAFLD is related to its prevalence, incidence, and progressiveness and has to be coupled with its tremendous economic burden based on inpatient, outpatient, professional services, emergency department, and pharmacy costs. It is thus not surprising that we are heading toward a serious health care crisis in the next few decades with the cost of managing NAFLD complications alone approaching an estimated 10-year economic burden of nearly $1 trillion.
The third article by Glass and colleagues (In press) puts the spectrum of NAFLD in the context of a disrupted systemic metabolic environment related to overnutrition alongside reduced physical activity. It is not surprising that type 2 diabetes mellitus (T2DM), obesity, and cardiovascular disease are frequent comorbidities present in a high proportion of patients with NAFLD. The prevalence of NAFLD among people with T2DM exceeds 60%. Importantly, convincing evidence has accumulated supporting the concept that interactions between these metabolic syndrome components and NAFLD are complex and bidirectional. Evidence from cross-sectional and longitudinal studies favors the presence of NAFLD and its severity preceding and/or promoting the development of metabolic comorbidities such as T2DM. Concomitantly, the presence of T2DM seems to accelerate the clinical course of NAFLD and is a predictor of advanced liver fibrosis and mortality. Compared with diseases that have a single etiology, such as viral hepatitis, NAFLD is a very complex disease with multiple interacting metabolic pathways that operate in an individual, leading to the clinical manifestation. Clearly, our present understanding of NAFLD/NASH as a single conglomerate disease is overly simplistic, and further study is warranted.
NAFLD and its variations comprise an increasing number and proportion of referral to hepatologists or providers with experience treating patients with chronic liver disease for the management of advanced disease stages; similarly, PCPs face the challenge to manage early stages of NAFLD. Given the magnitude of the problem of NAFLD, it is imperative that dedicated control efforts at the population level must intensify. As is emphasized in the fourth article of this series (In press), Puri and Fuchs call for a replacement of the traditional health care model of office visits with individual specialist working in silos. To overcome the narrow focus of a subspecialty outpatient clinic, time constraints, and gaps in NAFLD awareness, a patient-centered multidisciplinary approach to the treatment and coordination of care for the medically complex NAFLD patients is needed. The VHA is the largest integrated health care system in the US and is well positioned to implement an organizational strategy to facilitate standardized NAFLD care. The proposed model is centered on a broad assessment of the patient, involving the input from several disciplines; on completion of the assessment, a multidisciplinary team will formulate a personalized intervention plan.
The composition of this multidisciplinary team will vary based on expertise and resources available in each clinical setting. Once an intervention has been started, tracking and monitoring of intermediate and long-term functional outcomes will be helpful to modify the intervention in case outcomes are not achieved. Patient education, from the initial assessment until the intervention phase, plays a critical element to ensure that the patient has sufficient knowledge and skills to achieve the treatment goals set with their health care team.
Ultimately, integration of health care services will lead to better quality of care, increased patient satisfaction, and importantly to improved health care service utilization that will reduce health care resources and costs. Although such a proposal may seem ambitious, it is now the time for innovative thinking that will create sustainable solutions for the silent epidemic of NAFLD. Without advancing a proactive vision, the VA and the world will soon become saddled with an unmanageable economic and health care burden.
Identifying and Treating Nonalcoholic Fatty Liver Disease
Nonalcoholic fatty liver disease (NAFLD) is a silent epidemic affecting nearly 1 in 3 Americans and is increasing within the Veterans Health Administration (VHA).1,2 NAFLD independently increases the risk of type 2 diabetes mellitus (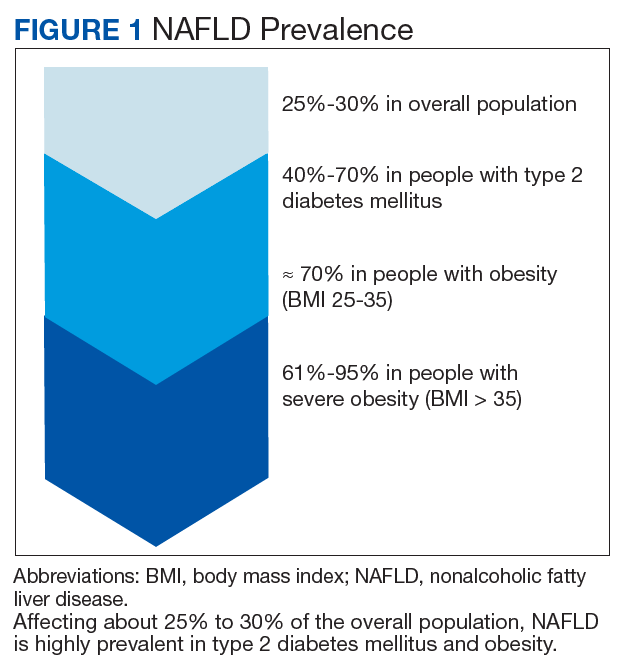
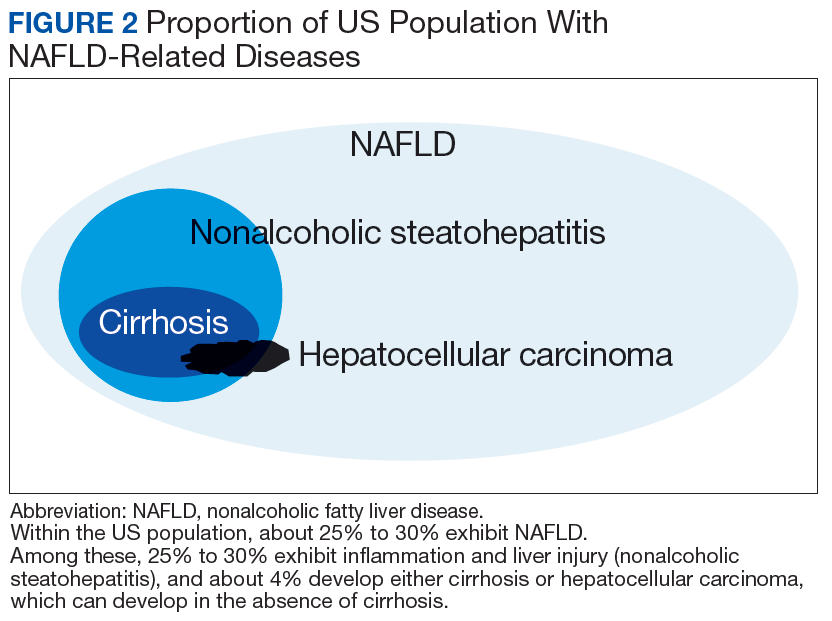
In most patients (80%), NAFLD progresses slowly over decades. The progression is related to continuing insulin resistance.15,16 Greater disease progression is seen in patients with T2DM or concomitant chronic liver disease (such as hepatitis C).10,11,16 Patients with NAFLD who develop advanced fibrosis or cirrhosis experience increased rates of overall mortality, liver-related events, and liver transplantation.1,9,17,18 Within the VHA, NAFLD is the third most common cause of cirrhosis and HCC, occurring at an average age of 66 and 70 years, respectively.19
Although no pharmaceuticals are yet approved to treat NAFLD, even modest weight loss is beneficial. For example, weight loss > 4% improves fatty liver, ≥ 7% improves liver inflammation, and ≥ 10% decreases liver fibrosis (or scarring).21-23 In patients with a prior lack of success with weight loss, weight loss medications may be beneficial for short-term use.24 When comparing the effects of diet, exercise, obesity pharmacotherapy, and combinations for these approaches, intensive lifestyle modification with exercise had the greatest, most enduring benefit.25 Additionally, bariatric (weight loss) surgery has significantly improved health and liver-related outcomes for patients with NASH.26
In at-risk veterans, NAFLD has myriad negative effects on health and QOL. To improve its early identification and management in the VHA, we summarize strategies that all providers can use to screen and treat patients for this condition.
Screening for Advanced Fibrosis
Advanced fibrosis in NAFLD is diagnosed by analyzing adequately sized liver biopsies.27,28 However, noninvasive approaches to quantify advanced fibrosis by imaging or use of a simple fibrosis prediction score also are available. Imaging modalities include measuring liver stiffness, using transient elastography (FibroScan, Waltham, MA) or magnetic resonance elastography.1,29-31 Fibrosis prediction scores use common clinical and laboratory data to predict the presence or absence of advanced fibrosis (Table 1).29 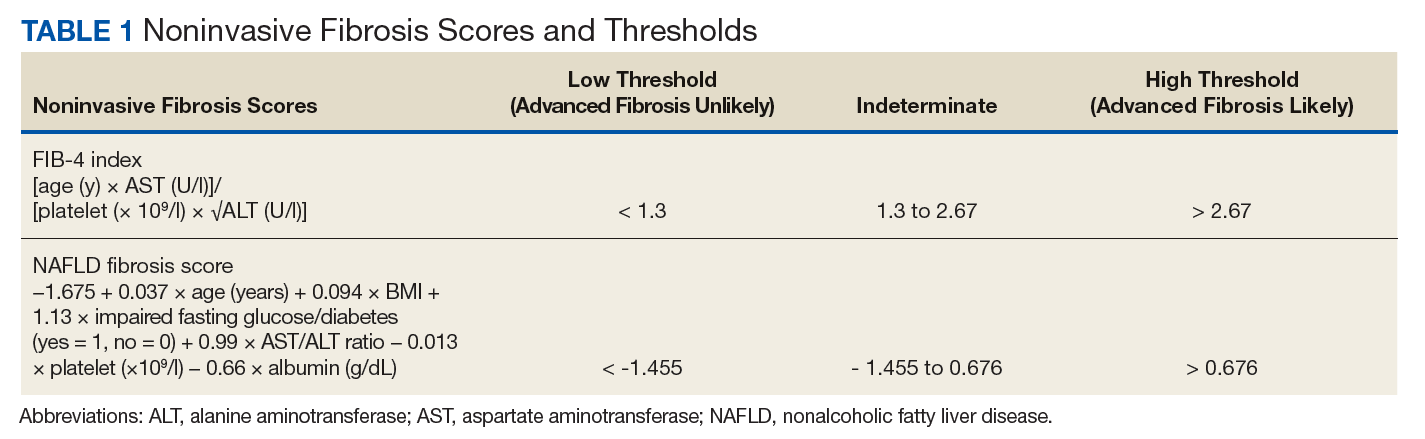
Does This Patient Have NAFLD?
To identify NAFLD, patients with metabolic syndrome and modest or no alcohol use are first assessed for liver injury with ALT, AST, and complete blood count (Figure 3; Case 1).16 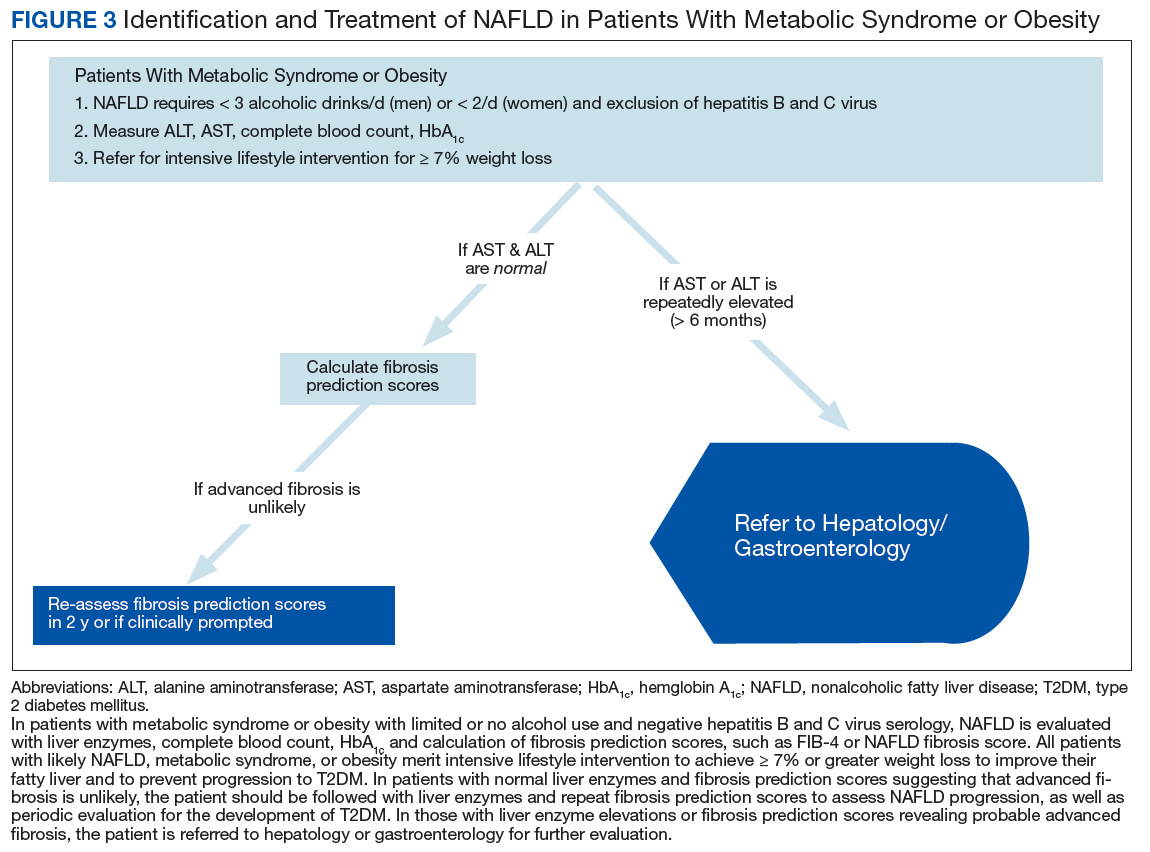
Next, common underlying liver diseases that cause liver injury should be excluded by hepatitis B and C virus serology.11,16 Other underlying liver diseases are uncommon and should be assessed only if clinically indicated. 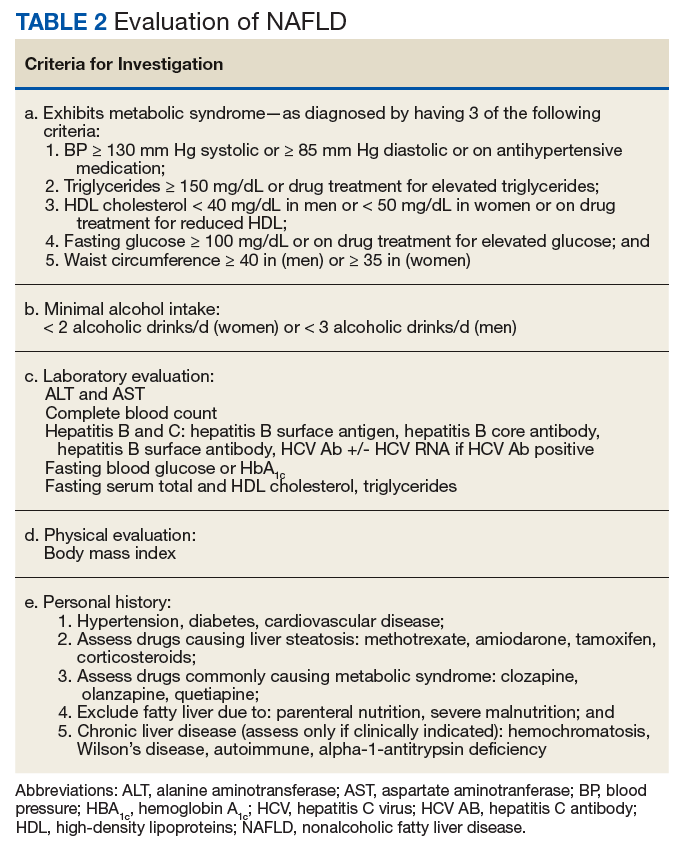
Evaluation of fasting glucose or hemoglobin A1c (HbA1c)can identify undiagnosed T2DM. NAFL, or simple steatosis, is independently associated with an increased risk of T2DM, cardiovascular and kidney disease, yet not overall mortality.16 Over 10 to 20 years, few patients (4%) with simple steatosis progress to cirrhosis.39
In NAFLD, simple steatosis can resolve, and NASH can significantly improve with 7% to 10% weight loss.16,23,40 Patients with simple steatosis on imaging and normal liver enzymes should be monitored with periodic liver enzymes and fibrosis prediction scores (eg, FIB-4) and encouraged to pursue intensive lifestyle intervention.16,33 Without weight loss and exercise interventions metabolic syndrome, T2DM, and NAFLD may progress.
Patients with combined liver steatosis and liver enzyme elevations may exhibit NASH and warrant an evaluation by a hepatologist or gastroenterologist for consideration of additional testing or liver biopsy.16
Encouraging Patients to Pursue Intensive Lifestyle InterventionS
Most veterans wish to collaborate in their care (Table 3, Figure 4) yet experience many barriers, such as low health literacy, high rates of comorbidities, and ongoing drug/alcohol misuse.43,44 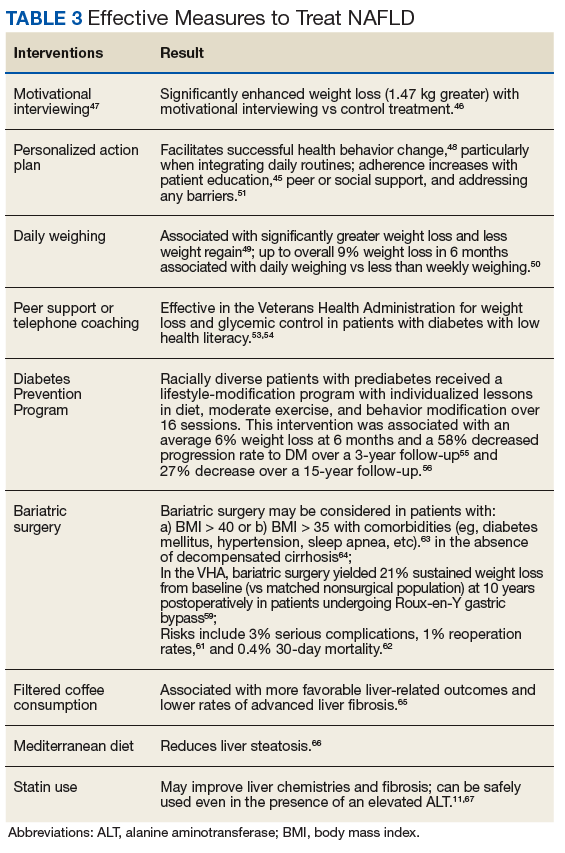
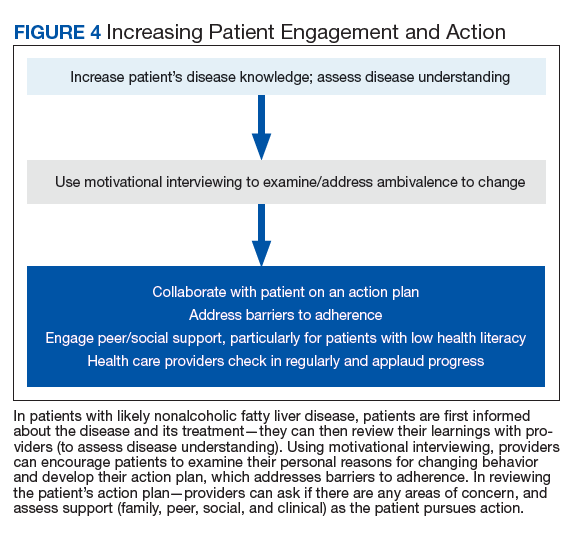
In addition to patient education, motivational interviewing significantly improves weight loss, resulting in a 3.3 lb (1.5 kg) increased weight loss in the intervention group vs the control group in weight loss studies.46
To start the conversation, the health care provider can explain that
- Why would you want to lose weight and exercise?
- How might you go about it in order to succeed?
- What are the 3 best reasons for you to do it?
- How important is it for you to make this change, and why? The provider can also ask the patient to quantify on a scale of 1 to 10: (a) How likely is it that they will make each required change? (b) How hard will each change be for them?
- The provider then summarizes the patient’s reasons for wanting change, how he/she can effect change, what their best reasons are, and how to successfully change. The provider then asks a final question:
- So what do you think you will do?
Most patients report feeling engaged, empowered, open, and understood with motivational interviewing. People are “persuaded by what they hear themselves say,” increasing motivation to change.47
This personalized action plan facilitates successful health behavior change.48 Action plans should integrate daily routines. For example, by placing the scale near the toothbrush, daily weighing is encouraged. Daily weighing is associated with significantly greater weight loss and less weight regain.49 In a 6-month, randomized controlled weight loss trial in men and women, daily weighing (using a scale that automatically transmitted weight data), with weekly e-mails and tailored feedback yielded an overall 9% weight loss and increased use of exercise and diet behaviors associated with weight loss in comparison with those who weighed themselves less than weekly.50 This simple daily measure seems to reinforce a patient’s action plan.
Adherence to an action plan significantly improves with patient education, peer or social support, and addressing barriers to adherence.51 For example, by providing support with weekly text messaging of “How are you?” and addressing the issues that patients reported in a large randomized treatment trial, adherence was significantly improved.52 In VHA patients with low health literacy, peer support or telephone coaching also has proven effective in increasing weight loss and glycemic control in patients with T2DM.53,54 Providing multidisciplinary team support during intensive lifestyle intervention, providers can partner with patients to address questions or issues and applaud progress.
Effective VHA interventions
In an ethnically diverse population of patients with prediabetes, up to 7% weight loss was observed in the Diabetes Prevention Program (DPP).55 In this study patients were randomized to placebo; metformin 850 mg twice daily; or a lifestyle-modification program in which they received one-on-one culturally sensitive, individualized lessons in diet, moderate exercise (≥ 150 minutes weekly), and behavior modification from case managers over 16 sessions. Lessons were reinforced in both group and individual sessions. This intervention was associated with an average of 6% weight loss at 6 months (half of participants attained 7% weight loss) and a 58% decrease in the rate of progression to T2DM over a nearly 3-year follow-up of this population with prediabetes compared with that of the placebo group.55 Over a 15-year follow-up, the intensive lifestyle intervention group sustained a 27% decrease in the incidence of T2DM compared with that of the placebo group.56 To emulate the success of the DPP in the VHA, a web-based DPP-like study in female veterans was performed with online coaching and daily weighing. This study achieved a 5.2% weight loss from baseline at 4 months.57
To improve outcomes, the VHA MOVE! Weight Management Program has been revised to include more sustained intervention (16 sessions) and multiple modes for participating—in person, by telephone, via video, via MOVE! Coach phone app, or any combination.58 Using shared decision making between patients with NAFLD and their providers, a customized MOVE! weight loss program can be developed to enable sustained intensive lifestyle intervention: hypocaloric diet, ≥ 150 minutes of moderate exercise weekly, and behavioral change.
In addition to intensive lifestyle intervention, a prospective study found that bariatric surgery significantly improved outcomes in patients with NASH, with most patients experiencing resolution of their NASH and nearly half exhibiting significantly improved fibrosis.26 In the VHA, bariatric surgery has yielded excellent long-term outcomes, with 21% sustained weight loss from baseline (vs matched nonsurgical population) at 10 years postoperatively in patients undergoing Roux-en-Y gastric bypass.59 Bariatric surgery also results in long-term remission of T2DM in most patients and significant improvement in hypertension and dyslipidemia.60 The risks of bariatric surgery include 3% serious complications, 1% reoperation rates, and 0.4% 30-day mortality.61,62 Bariatric surgery can be considered in patients with BMI > 40 or in patients with BMI > 35 who have comorbidities and do not have decompensated cirrhosis.63,64
Beyond weight loss, more favorable liver-related outcomes and lower rates of advanced liver fibrosis are observed in those consuming filtered coffee; a reduction in liver steatosis also is observed with adherence to a Mediterranean diet.65,66 In NAFLD, statins may improve liver chemistries and fibrosis; this class of medications can be used safely even in the presence of an elevated ALT.11,67
Conclusion
Nonalcoholic fatty liver disease independently increases the risk of T2DM, cardiovascular disease and kidney disease. With its rates increasing in the VHA, earlier identification and intervention is warranted in patients at high risk (ie, those with metabolic syndrome, obesity, and T2DM).2 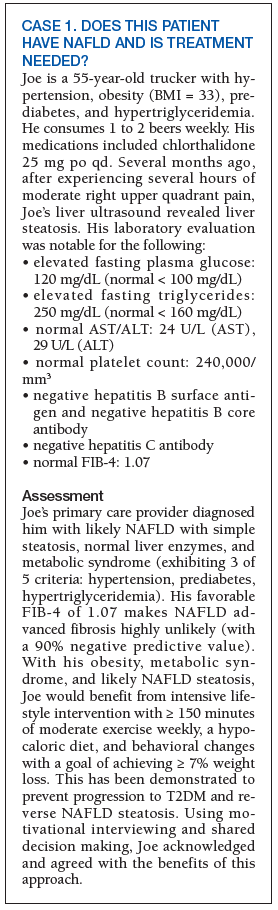
NASH is more frequent in those with liver enzyme elevations or with an elevated FIB-4 and is associated with a long-term risk of cirrhosis. These patients merit referral to hepatology or gastroenterology for further evaluation and consideration of a liver biopsy to identify NASH. Patients with likely NAFLD without liver enzyme elevations can be further evaluated with FIB-4 scores to assess their probability of advanced liver fibrosis and potential need for referral to hepatology or gastroenterology.
Early NAFLD detection and intervention with intensive lifestyle modifications has the potential to avert progression to advanced fibrosis—and its associated increased overall and liver-related mortality, and impaired QOL.3,16,18 Although FIB-4 is a validated predictor of advanced fibrosis, this score is not yet used nationally to identify and risk stratify NAFLD in the VHA. Additionally, the very low use of VHA diet/exercise programs in eligible patients contributes to NAFLD progression.68 The cost-effective DPP has successfully yielded weight loss in patients with prediabetes and decreases in the incidence of T2DM through motivational interviewing and intensive lifestyle intervention.55 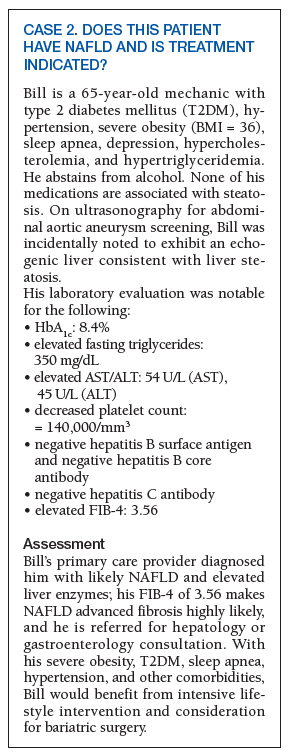
To improve NAFLD management, providers can successfully engage patients through motivational interviewing for intensive lifestyle intervention. Their resulting weight loss is enhanced with a personalized action plan, daily weighing, and peer support. When NAFLD is identified in patients with metabolic risk factors, the probability of advanced fibrosis is easily assessed in those with elevated FIB-4 scores who merit gastrointestinal referral.33,37
In all those identified with NAFLD, disease information should be provided to patients and their families. Intensive lifestyle modification targeting a ≥ 7% weight loss is recommended; motivational interviewing can increase commitment to change and yield a customized action plan for sustained weight loss. Working with the support and encouragement of their team of primary care providers, dieticians, and MOVE! coaches, patients can actively engage to improve their NAFLD and overall health.
1. Rinella ME. Nonalcoholic fatty liver disease: a systematic review. JAMA. 2015;313(22):2263-2273.
2. Kanwal F, Kramer JR, Duan Z, et al. Trends in the burden of nonalcoholic fatty liver disease in a United States cohort of veterans. Clin Gastroenterol Hepatol. 2016;14(2):301-308.
3. Golabi P, Otgonsuren M, Cable R, et al. Non-alcoholic fatty liver disease (NAFLD) is associated with impairment of Health Related Quality of Life (HRQOL). Health Qual Life Outcomes. 2016;14(1):18.
4. Targher G, Bertolini L, Padovani R, et al. Prevalence of nonalcoholic fatty liver disease and its association with cardiovascular disease among type 2 diabetic patients. Diabetes Care. 2007;30(5):1212-1218.
5. Argo CK, Caldwell SH. Epidemiology and natural history of non-alcoholic steatohepatitis. Clin Liver Dis. 2009;13(4):511-531.
6. Centers for Disease Control and Prevention. About Prediabetes & Type 2 Diabetes. https://www.cdc.gov/diabetes/prevention/prediabetes-type2/index.html. Updated June 11, 2018. Accessed November 7, 2018.
7. Littman AJ, Jacobson IG, Boyko EJ, Powell TM, Smith TC; Millennium Cohort Study Team. Weight change following US military service. Int J Obes (Lond). 2013;37(2):244-253.
8. Breland JY, Phibbs CS, Hoggatt KJ, et al. The obesity epidemic in the Veterans Health Administration: prevalence among key populations of women and men veterans. J Gen Intern Med. 2017;32(suppl 1):11-17.
9. Angulo P, Hui JM, Marchesini G, et al. The NAFLD fibrosis score: a noninvasive system that identifies liver fibrosis in patients with NAFLD. Hepatology. 2007;45(4):846-854.
10. Bazick J, Donithan M, Neuschwander-Tetri BA, et al. Clinical model for NASH and advanced fibrosis in adult patients with diabetes and NAFLD: guidelines for referral in NAFLD. Diabetes Care. 2015;38(7):1347-1355.
11. Chalasani N, Younossi Z, Lavine JE, et al. The diagnosis and management of nonalcoholic fatty liver disease: Practice guidance from the American Association for the Study of Liver Diseases. Hepatology. 2018;67(1):328-357.
12. Bril F, Barb D, Portillo‐Sanchez P, et al. Metabolic and histological implications of intrahepatic triglyceride content in nonalcoholic fatty liver disease. Hepatology. 2017;65(4):1132-1144.
13. Diehl AM, Day C. Cause, pathogenesis, and treatment of nonalcoholic steatohepatitis. N Engl J Med. 2017;377(21):2063-2072.
14. Nasr P, Ignatova S, Kechagias S, Ekstedt M. Natural history of nonalcoholic fatty liver disease: a prospective follow-up study with serial biopsies. Hepatol Commun. 2018;27(2):199-210.
15. Singh S, Allen AM, Wang Z, Prokop LJ, Murad MH, Loomba R. Fibrosis progression in nonalcoholic fatty liver vs nonalcoholic steatohepatitis: a systematic review and meta-analysis of paired-biopsy studies. Clin Gastroenterol Hepatol. 2015;13(4):643-654.
16. European Association for the Study of the Liver (EASL); European Association for the Study of Diabetes (EASD); European Association for the Study of Obesity (EASO). EASL-EASD-EASO clinical practice guidelines for the management of non-alcoholic fatty liver disease. J Hepatol. 2016;64(6):1388-1402.
17. Younossi ZM, Blissett D, Blissett R, et al. The economic and clinical burden of nonalcoholic fatty liver disease in the United States and Europe. Hepatology. 2016;64(5):1577-1586.
18. Angulo P, Kleiner DE, Dam-Larsen S, et al. Liver fibrosis, but no other histologic features, is associated with long-term outcomes of patients with nonalcoholic fatty liver disease. Gastroenterology. 2015;149(2):389-397.
19. Beste LA, Leipertz SL, Green PK, Dominitz JA, Ross D, Ioannou GN. Trends in burden of cirrhosis and hepatocellular carcinoma by underlying liver disease in US Veterans, 2001-2013. Gastroenterology 2015;149(6):1471-1482.
20. Mittal S, El-Serag HB, Sada YH, et al. Hepatocellular carcinoma in the absence of cirrhosis in United States veterans is associated with nonalcoholic fatty liver disease. Clin Gastroenterol Hepatol. 2016;14(1):124-131.
21. Kenneally S, Sier JH, Moore JB. Efficacy of dietary and physical activity intervention in non-alcoholic fatty liver disease: a systematic review. BMJ Open Gastroenterol. 2017;4(1):e000139.
22. Thoma C, Day CP, Trenell MI. Lifestyle interventions for the treatment of non-alcoholic fatty liver disease in adults: a systematic review. J Hepatol. 2012;56(1):255-266.
23. Vilar-Gomez E, Martinez-Perez Y, Calzadilla-Bertot L, et al. Weight loss through lifestyle modification significantly reduces features of nonalcoholic steatohepatitis. Gastroenterology. 2015;149(2):367-378.
24. Apovian CM, Aronne LJ, Bessesen DH, et al; Endocrine Society. Pharmacological management of obesity: an endocrine society clinical practice guideline. J Clin Endocrinol Metab. 2015;100(2):342-362.
25. Haw JS, Galaviz KI, Straus AN, et al. Long-term sustainability of diabetes prevention approaches: a systematic review and meta-analysis of randomized clinical trials. JAMA Intern Med. 2017;177(12):1808-1817.
26. Lassailly G, Caiazzo R, Buob D, et al. Bariatric surgery reduces features of nonalcoholic steatohepatitis in morbidly obese patients. Gastroenterology. 2015;149(2):379-388.
27. Kleiner DE, Brunt EM, Van Natta M, et al; Nonalcoholic Steatohepatitis Clinical Research Network. Design and validation of a histological scoring system for nonalcoholic fatty liver disease. Hepatology. 2005;41(6):1313-1321.
28. Bedossa P; FLIP Pathology Consortium. Utility and appropriateness of the fatty liver inhibition of progression (FLIP) algorithm and steatosis, activity, and fibrosis (SAF) score in the evaluation of biopsies of nonalcoholic fatty liver disease. Hepatology. 2014;60(2):565-567.
29. Tapper EB, Sengupta N, Hunink MG, Afdhal NH, Lai M. Cost-effective evaluation of nonalcoholic fatty liver disease with NAFLD fibrosis score and vibration controlled transient elastography. Am J Gastroenterol. 2015;110(9):1298-1304.
30. Cui J, Ang B, Haufe W, et al. Comparative diagnostic accuracy of magnetic resonance elastography vs. eight clinical prediction rules for non‐invasive diagnosis of advanced fibrosis in biopsy‐proven non‐alcoholic fatty liver disease: a prospective study. Aliment Pharmacol Ther. 2015;41(12):1271-1280.
31. Tapper EB, Lok AS-F. Use of liver imaging and biopsy in clinical practice. N Engl J Med . 2017;377(8):756-768.
32. Sterling RK, Lissen E, Clumeck N; APRICOT Clinical Investigators. Development of a simple noninvasive index to predict significant fibrosis in patients with HIV/HCV coinfection. Hepatology. 2006;43(6):1317-1325.
33. Imler T. Indiana University School of Medicine - GIHep calculators. http://gihep.com/calculators/hepatology/fibrosis-4-score. Published 2018. Accessed November 7, 2018.
34. Sun W, Cui H , Li N, et al. Comparison of FIB-4 index, NAFLD fibrosis score and BARD score for prediction of advanced fibrosis in adult patients with non-alcoholic fatty liver disease: a meta-analysis study. Hepatol Res. 2016;46(9):862-870.
35. Imler T, Indiana University School of Medicine - GIHep calculators. http://gihep.com/calculators/hepatology/nafld-fibrosis-score. Published 2018. Accessed November 7, 2018.
36. Harrison SA, Oliver D, Arnold HL, Gogia S, Neuschwander-Tetri BA. Development and validation of a simple NAFLD clinical scoring system for identifying patients without advanced disease. Gut. 2008;57(10):1441-1447.
37. Patel YA, Gifford EJ, Glass LM, et al. Identifying non-alcoholic fatty liver disease advanced fibrosis in the Veterans Health Administration. Dig Dis Sci. 2018;63(9): 2259-2266.
38. Armstrong MJ, Houlihan DD, Bentham L, et al. Presence and severity of non-alcoholic fatty liver disease in a large prospective primary care cohort. J Hepatol. 2012;56(1):234-240.
39. Matteoni CA, Younossi ZM, Gramlich T, Boparai N, Liu YC, McCullough AJ. Nonalcoholic fatty liver disease: a spectrum of clinical and pathological severity. Gastroenterology. 1999;116(6):1413-1419.
40. Promrat K, Kleiner DE, Niemeier HM, et al. Randomized controlled trial testing the effects of weight loss on nonalcoholic steatohepatitis. Hepatology. 2010;51(1):121-129.
41. Mofrad P, Contos MJ, Haque M, et al. Clinical and histologic spectrum of nonalcoholic fatty liver disease associated with normal ALT values. Hepatology. 2003;37(6):1286-1292.
42. Portillo-Sanchez P, Bril F, Maximos M, et al. High prevalence of nonalcoholic fatty liver disease in patients With Type 2 Diabetes Mellitus and Normal Plasma Aminotransferase Levels. J Clin Endocrinol Metab 2015;100(6):2231-2238.
43. Rodriguez V, Andrade AD, Garcia-Retamero R, et al. Health literacy, numeracy, and graphical literacy among veterans in primary care and their effect on shared decision making and trust in physicians. J Health Commun. 2013;18(suppl 1):273-289.
44. Kramer JR, Kanwal F, Richardson P, Mei M, El-Serag HB. Gaps in the achievement of effectiveness of HCV treatment in national VA practice. J Hepatol. 2012;56(2):320-325.
45. Veterans Health Administration. Non-alcoholic fatty liver: information for patients. https://www.hepatitis.va.gov/pdf/NAFL.pdf. Published September 2017. Accessed November 7, 2018.
46. Armstrong MJ, Mottershead TA, Ronksley PE, Sigal RJ, Campbell TS, Hemmelgarn BR. Motivational interviewing to improve weight loss in overweight and/or obese patients: a systematic review and meta-analysis of randomized controlled trials. Obes Rev. 2011;12(9):709-723.
47. Miller WR, Rollnick S. Motivational Interviewing: Helping People Change. Guilford Press: NY, New York; 2013.
48. Leventhal H, Leventhal EA, Breland JY. Cognitive science speaks to the “common sense” of chronic illness management. Ann Behav Med. 2011;41(2):152-163.
49. Zheng Y, Klem ML, Sereika SM, Danford CA, Ewing LJ, Burke LE. Self-weighing in weight management: a systematic literature review. Obesity (Silver Spring). 2015;23(2):256-265.
50. Steinberg DM, Bennett GG, Askew S, Tate DF. Weighing every day matters; daily weighing improves weight loss and adoption of weight control behaviors. J Acad Nutr Diet. 2015;115(4):511-518.
51. Charania MR, Marshall KJ, Lyles CM; HIV/AIDS Prevention Research Synthesis (PRS) Team. Identification of evidence-based interventions for promoting HIV medication adherence: findings from a systematic review of U.S.-based studies, 1996-2011. AIDS Behav. 2014;18(4):646-660.
52. Lester RT, Ritvo P, Mills EJ, et al. Effects of a mobile phone short message service on antiretroviral treatment adherence in Kenya (WelTel Kenya1): a randomised trial. Lancet 2010;376(9755):1838-1845.
53. Dutton GR, Phillips JM, Kukkamalla M, Cherrington AL, Safford MM. Pilot study evaluating the feasibility and initial outcomes of a primary care weight loss intervention with peer coaches. Diabetes Educ. 2015:41(3):361-368.
54. Fisher EB, Coufal MM, Parada H, et al. Peer support in health care and prevention: Cultural, organizational, and dissemination issues. Annu Rev Public Health. 2014;35(1):363-383.
55. Diabetes Prevention Program Research Group. Reduction in the incidence of type 2 diabetes with lifestyle intervention or metformin. N Engl J Med. 2002;(346):393-403.
56. Diabetes Prevention Program Research Group. Long-term effects of lifestyle intervention or metformin on diabetes development and microvascular complications over 15-year follow-up: the Diabetes Prevention Program Outcomes Study. Lancet Diabetes Endocrinol. 2015;3(11):866-875.
57. Moin T, Ertl K, Schneider J, et al. Women veterans’ experience with a web-based diabetes prevention program: a qualitative study to inform future practice. J Med Internet Res. 2015;17(5):e127.
58. US Department of Veterans Affairs. MOVE! Weight management program. https://www.move.va.gov/MOVE/index.asp. Updated October 5, 2018. Accessed November 7, 2018.
59. Maciejewski ML, Arterburn DE, Van Scoyoc L, et al. Bariatric surgery and long-term durability of weight loss. JAMA Surg. 2016;151(11):1046-1055.
60. Adams TD, Davidson LE, Litwin SE, et al. Weight and metabolic outcomes 12 years after gastric bypass. N Engl J Med. 2017;377(12):1143-1155.
61. Dimick JB, Nicholas LH, Ryan AM, Thumma JR, Birkmeyer JD. Bariatric surgery complications beforevs after implementation of a national policy restricting coverage to centers of excellence. JAMA. 2013;309(8):792-799.
62. The Longitudinal Assessment of Bariatric Surgery (LABS) Consortium, Flum DR, Belle SH, et al. Perioperative safety in the longitudinal assessment of bariatric surgery. N Engl J Med. 2009;361(5):445-454.
63. Brito JP, Montori VM, Davis AM; Delegates of the 2nd Diabetes Surgery Summit. Metabolic surgery in the treatment algorithm for type 2 diabetes: a joint statement by international diabetes organizations. JAMA. 2017;317(6):635-636.
64. Mosko JD, Nguyen GC. Increased perioperative mortality following bariatric surgery among patients with cirrhosis. Clin Gastroenterol Hepatol. 2011;9(10):897-901.
65. Saab S, Mallam D, Cox GA 2nd, Tong MJ. Impact of coffee on liver diseases: a systematic review. Liver Int. 2014;34(4):495-504.
66. Ryan MC, Itsiopoulos C, Thodis T, et al. The Mediterranean diet improves hepatic steatosis and insulin sensitivity in individuals with non-alcoholic fatty liver disease. J Hepatol. 2013;59(1):138-143.
67. Musso G, Gambino R, Cassader M, Pagano G. A meta‐analysis of randomized trials for the treatment of nonalcoholic fatty liver disease. Hepatology. 2010;52(1):79-104.
68. Patel Y, Gifford EJ, Glass LM, et al. Risk factors for biopsy-proven non-alcoholic fatty liver disease progression in the Veterans Health Administration. Aliment Pharmacol Ther. 2018;47(2):268-278.
Nonalcoholic fatty liver disease (NAFLD) is a silent epidemic affecting nearly 1 in 3 Americans and is increasing within the Veterans Health Administration (VHA).1,2 NAFLD independently increases the risk of type 2 diabetes mellitus (
In most patients (80%), NAFLD progresses slowly over decades. The progression is related to continuing insulin resistance.15,16 Greater disease progression is seen in patients with T2DM or concomitant chronic liver disease (such as hepatitis C).10,11,16 Patients with NAFLD who develop advanced fibrosis or cirrhosis experience increased rates of overall mortality, liver-related events, and liver transplantation.1,9,17,18 Within the VHA, NAFLD is the third most common cause of cirrhosis and HCC, occurring at an average age of 66 and 70 years, respectively.19
Although no pharmaceuticals are yet approved to treat NAFLD, even modest weight loss is beneficial. For example, weight loss > 4% improves fatty liver, ≥ 7% improves liver inflammation, and ≥ 10% decreases liver fibrosis (or scarring).21-23 In patients with a prior lack of success with weight loss, weight loss medications may be beneficial for short-term use.24 When comparing the effects of diet, exercise, obesity pharmacotherapy, and combinations for these approaches, intensive lifestyle modification with exercise had the greatest, most enduring benefit.25 Additionally, bariatric (weight loss) surgery has significantly improved health and liver-related outcomes for patients with NASH.26
In at-risk veterans, NAFLD has myriad negative effects on health and QOL. To improve its early identification and management in the VHA, we summarize strategies that all providers can use to screen and treat patients for this condition.
Screening for Advanced Fibrosis
Advanced fibrosis in NAFLD is diagnosed by analyzing adequately sized liver biopsies.27,28 However, noninvasive approaches to quantify advanced fibrosis by imaging or use of a simple fibrosis prediction score also are available. Imaging modalities include measuring liver stiffness, using transient elastography (FibroScan, Waltham, MA) or magnetic resonance elastography.1,29-31 Fibrosis prediction scores use common clinical and laboratory data to predict the presence or absence of advanced fibrosis (Table 1).29
Does This Patient Have NAFLD?
To identify NAFLD, patients with metabolic syndrome and modest or no alcohol use are first assessed for liver injury with ALT, AST, and complete blood count (Figure 3; Case 1).16
Next, common underlying liver diseases that cause liver injury should be excluded by hepatitis B and C virus serology.11,16 Other underlying liver diseases are uncommon and should be assessed only if clinically indicated.
Evaluation of fasting glucose or hemoglobin A1c (HbA1c)can identify undiagnosed T2DM. NAFL, or simple steatosis, is independently associated with an increased risk of T2DM, cardiovascular and kidney disease, yet not overall mortality.16 Over 10 to 20 years, few patients (4%) with simple steatosis progress to cirrhosis.39
In NAFLD, simple steatosis can resolve, and NASH can significantly improve with 7% to 10% weight loss.16,23,40 Patients with simple steatosis on imaging and normal liver enzymes should be monitored with periodic liver enzymes and fibrosis prediction scores (eg, FIB-4) and encouraged to pursue intensive lifestyle intervention.16,33 Without weight loss and exercise interventions metabolic syndrome, T2DM, and NAFLD may progress.
Patients with combined liver steatosis and liver enzyme elevations may exhibit NASH and warrant an evaluation by a hepatologist or gastroenterologist for consideration of additional testing or liver biopsy.16
Encouraging Patients to Pursue Intensive Lifestyle InterventionS
Most veterans wish to collaborate in their care (Table 3, Figure 4) yet experience many barriers, such as low health literacy, high rates of comorbidities, and ongoing drug/alcohol misuse.43,44
In addition to patient education, motivational interviewing significantly improves weight loss, resulting in a 3.3 lb (1.5 kg) increased weight loss in the intervention group vs the control group in weight loss studies.46
To start the conversation, the health care provider can explain that
- Why would you want to lose weight and exercise?
- How might you go about it in order to succeed?
- What are the 3 best reasons for you to do it?
- How important is it for you to make this change, and why? The provider can also ask the patient to quantify on a scale of 1 to 10: (a) How likely is it that they will make each required change? (b) How hard will each change be for them?
- The provider then summarizes the patient’s reasons for wanting change, how he/she can effect change, what their best reasons are, and how to successfully change. The provider then asks a final question:
- So what do you think you will do?
Most patients report feeling engaged, empowered, open, and understood with motivational interviewing. People are “persuaded by what they hear themselves say,” increasing motivation to change.47
This personalized action plan facilitates successful health behavior change.48 Action plans should integrate daily routines. For example, by placing the scale near the toothbrush, daily weighing is encouraged. Daily weighing is associated with significantly greater weight loss and less weight regain.49 In a 6-month, randomized controlled weight loss trial in men and women, daily weighing (using a scale that automatically transmitted weight data), with weekly e-mails and tailored feedback yielded an overall 9% weight loss and increased use of exercise and diet behaviors associated with weight loss in comparison with those who weighed themselves less than weekly.50 This simple daily measure seems to reinforce a patient’s action plan.
Adherence to an action plan significantly improves with patient education, peer or social support, and addressing barriers to adherence.51 For example, by providing support with weekly text messaging of “How are you?” and addressing the issues that patients reported in a large randomized treatment trial, adherence was significantly improved.52 In VHA patients with low health literacy, peer support or telephone coaching also has proven effective in increasing weight loss and glycemic control in patients with T2DM.53,54 Providing multidisciplinary team support during intensive lifestyle intervention, providers can partner with patients to address questions or issues and applaud progress.
Effective VHA interventions
In an ethnically diverse population of patients with prediabetes, up to 7% weight loss was observed in the Diabetes Prevention Program (DPP).55 In this study patients were randomized to placebo; metformin 850 mg twice daily; or a lifestyle-modification program in which they received one-on-one culturally sensitive, individualized lessons in diet, moderate exercise (≥ 150 minutes weekly), and behavior modification from case managers over 16 sessions. Lessons were reinforced in both group and individual sessions. This intervention was associated with an average of 6% weight loss at 6 months (half of participants attained 7% weight loss) and a 58% decrease in the rate of progression to T2DM over a nearly 3-year follow-up of this population with prediabetes compared with that of the placebo group.55 Over a 15-year follow-up, the intensive lifestyle intervention group sustained a 27% decrease in the incidence of T2DM compared with that of the placebo group.56 To emulate the success of the DPP in the VHA, a web-based DPP-like study in female veterans was performed with online coaching and daily weighing. This study achieved a 5.2% weight loss from baseline at 4 months.57
To improve outcomes, the VHA MOVE! Weight Management Program has been revised to include more sustained intervention (16 sessions) and multiple modes for participating—in person, by telephone, via video, via MOVE! Coach phone app, or any combination.58 Using shared decision making between patients with NAFLD and their providers, a customized MOVE! weight loss program can be developed to enable sustained intensive lifestyle intervention: hypocaloric diet, ≥ 150 minutes of moderate exercise weekly, and behavioral change.
In addition to intensive lifestyle intervention, a prospective study found that bariatric surgery significantly improved outcomes in patients with NASH, with most patients experiencing resolution of their NASH and nearly half exhibiting significantly improved fibrosis.26 In the VHA, bariatric surgery has yielded excellent long-term outcomes, with 21% sustained weight loss from baseline (vs matched nonsurgical population) at 10 years postoperatively in patients undergoing Roux-en-Y gastric bypass.59 Bariatric surgery also results in long-term remission of T2DM in most patients and significant improvement in hypertension and dyslipidemia.60 The risks of bariatric surgery include 3% serious complications, 1% reoperation rates, and 0.4% 30-day mortality.61,62 Bariatric surgery can be considered in patients with BMI > 40 or in patients with BMI > 35 who have comorbidities and do not have decompensated cirrhosis.63,64
Beyond weight loss, more favorable liver-related outcomes and lower rates of advanced liver fibrosis are observed in those consuming filtered coffee; a reduction in liver steatosis also is observed with adherence to a Mediterranean diet.65,66 In NAFLD, statins may improve liver chemistries and fibrosis; this class of medications can be used safely even in the presence of an elevated ALT.11,67
Conclusion
Nonalcoholic fatty liver disease independently increases the risk of T2DM, cardiovascular disease and kidney disease. With its rates increasing in the VHA, earlier identification and intervention is warranted in patients at high risk (ie, those with metabolic syndrome, obesity, and T2DM).2
NASH is more frequent in those with liver enzyme elevations or with an elevated FIB-4 and is associated with a long-term risk of cirrhosis. These patients merit referral to hepatology or gastroenterology for further evaluation and consideration of a liver biopsy to identify NASH. Patients with likely NAFLD without liver enzyme elevations can be further evaluated with FIB-4 scores to assess their probability of advanced liver fibrosis and potential need for referral to hepatology or gastroenterology.
Early NAFLD detection and intervention with intensive lifestyle modifications has the potential to avert progression to advanced fibrosis—and its associated increased overall and liver-related mortality, and impaired QOL.3,16,18 Although FIB-4 is a validated predictor of advanced fibrosis, this score is not yet used nationally to identify and risk stratify NAFLD in the VHA. Additionally, the very low use of VHA diet/exercise programs in eligible patients contributes to NAFLD progression.68 The cost-effective DPP has successfully yielded weight loss in patients with prediabetes and decreases in the incidence of T2DM through motivational interviewing and intensive lifestyle intervention.55
To improve NAFLD management, providers can successfully engage patients through motivational interviewing for intensive lifestyle intervention. Their resulting weight loss is enhanced with a personalized action plan, daily weighing, and peer support. When NAFLD is identified in patients with metabolic risk factors, the probability of advanced fibrosis is easily assessed in those with elevated FIB-4 scores who merit gastrointestinal referral.33,37
In all those identified with NAFLD, disease information should be provided to patients and their families. Intensive lifestyle modification targeting a ≥ 7% weight loss is recommended; motivational interviewing can increase commitment to change and yield a customized action plan for sustained weight loss. Working with the support and encouragement of their team of primary care providers, dieticians, and MOVE! coaches, patients can actively engage to improve their NAFLD and overall health.
1. Rinella ME. Nonalcoholic fatty liver disease: a systematic review. JAMA. 2015;313(22):2263-2273.
2. Kanwal F, Kramer JR, Duan Z, et al. Trends in the burden of nonalcoholic fatty liver disease in a United States cohort of veterans. Clin Gastroenterol Hepatol. 2016;14(2):301-308.
3. Golabi P, Otgonsuren M, Cable R, et al. Non-alcoholic fatty liver disease (NAFLD) is associated with impairment of Health Related Quality of Life (HRQOL). Health Qual Life Outcomes. 2016;14(1):18.
4. Targher G, Bertolini L, Padovani R, et al. Prevalence of nonalcoholic fatty liver disease and its association with cardiovascular disease among type 2 diabetic patients. Diabetes Care. 2007;30(5):1212-1218.
5. Argo CK, Caldwell SH. Epidemiology and natural history of non-alcoholic steatohepatitis. Clin Liver Dis. 2009;13(4):511-531.
6. Centers for Disease Control and Prevention. About Prediabetes & Type 2 Diabetes. https://www.cdc.gov/diabetes/prevention/prediabetes-type2/index.html. Updated June 11, 2018. Accessed November 7, 2018.
7. Littman AJ, Jacobson IG, Boyko EJ, Powell TM, Smith TC; Millennium Cohort Study Team. Weight change following US military service. Int J Obes (Lond). 2013;37(2):244-253.
8. Breland JY, Phibbs CS, Hoggatt KJ, et al. The obesity epidemic in the Veterans Health Administration: prevalence among key populations of women and men veterans. J Gen Intern Med. 2017;32(suppl 1):11-17.
9. Angulo P, Hui JM, Marchesini G, et al. The NAFLD fibrosis score: a noninvasive system that identifies liver fibrosis in patients with NAFLD. Hepatology. 2007;45(4):846-854.
10. Bazick J, Donithan M, Neuschwander-Tetri BA, et al. Clinical model for NASH and advanced fibrosis in adult patients with diabetes and NAFLD: guidelines for referral in NAFLD. Diabetes Care. 2015;38(7):1347-1355.
11. Chalasani N, Younossi Z, Lavine JE, et al. The diagnosis and management of nonalcoholic fatty liver disease: Practice guidance from the American Association for the Study of Liver Diseases. Hepatology. 2018;67(1):328-357.
12. Bril F, Barb D, Portillo‐Sanchez P, et al. Metabolic and histological implications of intrahepatic triglyceride content in nonalcoholic fatty liver disease. Hepatology. 2017;65(4):1132-1144.
13. Diehl AM, Day C. Cause, pathogenesis, and treatment of nonalcoholic steatohepatitis. N Engl J Med. 2017;377(21):2063-2072.
14. Nasr P, Ignatova S, Kechagias S, Ekstedt M. Natural history of nonalcoholic fatty liver disease: a prospective follow-up study with serial biopsies. Hepatol Commun. 2018;27(2):199-210.
15. Singh S, Allen AM, Wang Z, Prokop LJ, Murad MH, Loomba R. Fibrosis progression in nonalcoholic fatty liver vs nonalcoholic steatohepatitis: a systematic review and meta-analysis of paired-biopsy studies. Clin Gastroenterol Hepatol. 2015;13(4):643-654.
16. European Association for the Study of the Liver (EASL); European Association for the Study of Diabetes (EASD); European Association for the Study of Obesity (EASO). EASL-EASD-EASO clinical practice guidelines for the management of non-alcoholic fatty liver disease. J Hepatol. 2016;64(6):1388-1402.
17. Younossi ZM, Blissett D, Blissett R, et al. The economic and clinical burden of nonalcoholic fatty liver disease in the United States and Europe. Hepatology. 2016;64(5):1577-1586.
18. Angulo P, Kleiner DE, Dam-Larsen S, et al. Liver fibrosis, but no other histologic features, is associated with long-term outcomes of patients with nonalcoholic fatty liver disease. Gastroenterology. 2015;149(2):389-397.
19. Beste LA, Leipertz SL, Green PK, Dominitz JA, Ross D, Ioannou GN. Trends in burden of cirrhosis and hepatocellular carcinoma by underlying liver disease in US Veterans, 2001-2013. Gastroenterology 2015;149(6):1471-1482.
20. Mittal S, El-Serag HB, Sada YH, et al. Hepatocellular carcinoma in the absence of cirrhosis in United States veterans is associated with nonalcoholic fatty liver disease. Clin Gastroenterol Hepatol. 2016;14(1):124-131.
21. Kenneally S, Sier JH, Moore JB. Efficacy of dietary and physical activity intervention in non-alcoholic fatty liver disease: a systematic review. BMJ Open Gastroenterol. 2017;4(1):e000139.
22. Thoma C, Day CP, Trenell MI. Lifestyle interventions for the treatment of non-alcoholic fatty liver disease in adults: a systematic review. J Hepatol. 2012;56(1):255-266.
23. Vilar-Gomez E, Martinez-Perez Y, Calzadilla-Bertot L, et al. Weight loss through lifestyle modification significantly reduces features of nonalcoholic steatohepatitis. Gastroenterology. 2015;149(2):367-378.
24. Apovian CM, Aronne LJ, Bessesen DH, et al; Endocrine Society. Pharmacological management of obesity: an endocrine society clinical practice guideline. J Clin Endocrinol Metab. 2015;100(2):342-362.
25. Haw JS, Galaviz KI, Straus AN, et al. Long-term sustainability of diabetes prevention approaches: a systematic review and meta-analysis of randomized clinical trials. JAMA Intern Med. 2017;177(12):1808-1817.
26. Lassailly G, Caiazzo R, Buob D, et al. Bariatric surgery reduces features of nonalcoholic steatohepatitis in morbidly obese patients. Gastroenterology. 2015;149(2):379-388.
27. Kleiner DE, Brunt EM, Van Natta M, et al; Nonalcoholic Steatohepatitis Clinical Research Network. Design and validation of a histological scoring system for nonalcoholic fatty liver disease. Hepatology. 2005;41(6):1313-1321.
28. Bedossa P; FLIP Pathology Consortium. Utility and appropriateness of the fatty liver inhibition of progression (FLIP) algorithm and steatosis, activity, and fibrosis (SAF) score in the evaluation of biopsies of nonalcoholic fatty liver disease. Hepatology. 2014;60(2):565-567.
29. Tapper EB, Sengupta N, Hunink MG, Afdhal NH, Lai M. Cost-effective evaluation of nonalcoholic fatty liver disease with NAFLD fibrosis score and vibration controlled transient elastography. Am J Gastroenterol. 2015;110(9):1298-1304.
30. Cui J, Ang B, Haufe W, et al. Comparative diagnostic accuracy of magnetic resonance elastography vs. eight clinical prediction rules for non‐invasive diagnosis of advanced fibrosis in biopsy‐proven non‐alcoholic fatty liver disease: a prospective study. Aliment Pharmacol Ther. 2015;41(12):1271-1280.
31. Tapper EB, Lok AS-F. Use of liver imaging and biopsy in clinical practice. N Engl J Med . 2017;377(8):756-768.
32. Sterling RK, Lissen E, Clumeck N; APRICOT Clinical Investigators. Development of a simple noninvasive index to predict significant fibrosis in patients with HIV/HCV coinfection. Hepatology. 2006;43(6):1317-1325.
33. Imler T. Indiana University School of Medicine - GIHep calculators. http://gihep.com/calculators/hepatology/fibrosis-4-score. Published 2018. Accessed November 7, 2018.
34. Sun W, Cui H , Li N, et al. Comparison of FIB-4 index, NAFLD fibrosis score and BARD score for prediction of advanced fibrosis in adult patients with non-alcoholic fatty liver disease: a meta-analysis study. Hepatol Res. 2016;46(9):862-870.
35. Imler T, Indiana University School of Medicine - GIHep calculators. http://gihep.com/calculators/hepatology/nafld-fibrosis-score. Published 2018. Accessed November 7, 2018.
36. Harrison SA, Oliver D, Arnold HL, Gogia S, Neuschwander-Tetri BA. Development and validation of a simple NAFLD clinical scoring system for identifying patients without advanced disease. Gut. 2008;57(10):1441-1447.
37. Patel YA, Gifford EJ, Glass LM, et al. Identifying non-alcoholic fatty liver disease advanced fibrosis in the Veterans Health Administration. Dig Dis Sci. 2018;63(9): 2259-2266.
38. Armstrong MJ, Houlihan DD, Bentham L, et al. Presence and severity of non-alcoholic fatty liver disease in a large prospective primary care cohort. J Hepatol. 2012;56(1):234-240.
39. Matteoni CA, Younossi ZM, Gramlich T, Boparai N, Liu YC, McCullough AJ. Nonalcoholic fatty liver disease: a spectrum of clinical and pathological severity. Gastroenterology. 1999;116(6):1413-1419.
40. Promrat K, Kleiner DE, Niemeier HM, et al. Randomized controlled trial testing the effects of weight loss on nonalcoholic steatohepatitis. Hepatology. 2010;51(1):121-129.
41. Mofrad P, Contos MJ, Haque M, et al. Clinical and histologic spectrum of nonalcoholic fatty liver disease associated with normal ALT values. Hepatology. 2003;37(6):1286-1292.
42. Portillo-Sanchez P, Bril F, Maximos M, et al. High prevalence of nonalcoholic fatty liver disease in patients With Type 2 Diabetes Mellitus and Normal Plasma Aminotransferase Levels. J Clin Endocrinol Metab 2015;100(6):2231-2238.
43. Rodriguez V, Andrade AD, Garcia-Retamero R, et al. Health literacy, numeracy, and graphical literacy among veterans in primary care and their effect on shared decision making and trust in physicians. J Health Commun. 2013;18(suppl 1):273-289.
44. Kramer JR, Kanwal F, Richardson P, Mei M, El-Serag HB. Gaps in the achievement of effectiveness of HCV treatment in national VA practice. J Hepatol. 2012;56(2):320-325.
45. Veterans Health Administration. Non-alcoholic fatty liver: information for patients. https://www.hepatitis.va.gov/pdf/NAFL.pdf. Published September 2017. Accessed November 7, 2018.
46. Armstrong MJ, Mottershead TA, Ronksley PE, Sigal RJ, Campbell TS, Hemmelgarn BR. Motivational interviewing to improve weight loss in overweight and/or obese patients: a systematic review and meta-analysis of randomized controlled trials. Obes Rev. 2011;12(9):709-723.
47. Miller WR, Rollnick S. Motivational Interviewing: Helping People Change. Guilford Press: NY, New York; 2013.
48. Leventhal H, Leventhal EA, Breland JY. Cognitive science speaks to the “common sense” of chronic illness management. Ann Behav Med. 2011;41(2):152-163.
49. Zheng Y, Klem ML, Sereika SM, Danford CA, Ewing LJ, Burke LE. Self-weighing in weight management: a systematic literature review. Obesity (Silver Spring). 2015;23(2):256-265.
50. Steinberg DM, Bennett GG, Askew S, Tate DF. Weighing every day matters; daily weighing improves weight loss and adoption of weight control behaviors. J Acad Nutr Diet. 2015;115(4):511-518.
51. Charania MR, Marshall KJ, Lyles CM; HIV/AIDS Prevention Research Synthesis (PRS) Team. Identification of evidence-based interventions for promoting HIV medication adherence: findings from a systematic review of U.S.-based studies, 1996-2011. AIDS Behav. 2014;18(4):646-660.
52. Lester RT, Ritvo P, Mills EJ, et al. Effects of a mobile phone short message service on antiretroviral treatment adherence in Kenya (WelTel Kenya1): a randomised trial. Lancet 2010;376(9755):1838-1845.
53. Dutton GR, Phillips JM, Kukkamalla M, Cherrington AL, Safford MM. Pilot study evaluating the feasibility and initial outcomes of a primary care weight loss intervention with peer coaches. Diabetes Educ. 2015:41(3):361-368.
54. Fisher EB, Coufal MM, Parada H, et al. Peer support in health care and prevention: Cultural, organizational, and dissemination issues. Annu Rev Public Health. 2014;35(1):363-383.
55. Diabetes Prevention Program Research Group. Reduction in the incidence of type 2 diabetes with lifestyle intervention or metformin. N Engl J Med. 2002;(346):393-403.
56. Diabetes Prevention Program Research Group. Long-term effects of lifestyle intervention or metformin on diabetes development and microvascular complications over 15-year follow-up: the Diabetes Prevention Program Outcomes Study. Lancet Diabetes Endocrinol. 2015;3(11):866-875.
57. Moin T, Ertl K, Schneider J, et al. Women veterans’ experience with a web-based diabetes prevention program: a qualitative study to inform future practice. J Med Internet Res. 2015;17(5):e127.
58. US Department of Veterans Affairs. MOVE! Weight management program. https://www.move.va.gov/MOVE/index.asp. Updated October 5, 2018. Accessed November 7, 2018.
59. Maciejewski ML, Arterburn DE, Van Scoyoc L, et al. Bariatric surgery and long-term durability of weight loss. JAMA Surg. 2016;151(11):1046-1055.
60. Adams TD, Davidson LE, Litwin SE, et al. Weight and metabolic outcomes 12 years after gastric bypass. N Engl J Med. 2017;377(12):1143-1155.
61. Dimick JB, Nicholas LH, Ryan AM, Thumma JR, Birkmeyer JD. Bariatric surgery complications beforevs after implementation of a national policy restricting coverage to centers of excellence. JAMA. 2013;309(8):792-799.
62. The Longitudinal Assessment of Bariatric Surgery (LABS) Consortium, Flum DR, Belle SH, et al. Perioperative safety in the longitudinal assessment of bariatric surgery. N Engl J Med. 2009;361(5):445-454.
63. Brito JP, Montori VM, Davis AM; Delegates of the 2nd Diabetes Surgery Summit. Metabolic surgery in the treatment algorithm for type 2 diabetes: a joint statement by international diabetes organizations. JAMA. 2017;317(6):635-636.
64. Mosko JD, Nguyen GC. Increased perioperative mortality following bariatric surgery among patients with cirrhosis. Clin Gastroenterol Hepatol. 2011;9(10):897-901.
65. Saab S, Mallam D, Cox GA 2nd, Tong MJ. Impact of coffee on liver diseases: a systematic review. Liver Int. 2014;34(4):495-504.
66. Ryan MC, Itsiopoulos C, Thodis T, et al. The Mediterranean diet improves hepatic steatosis and insulin sensitivity in individuals with non-alcoholic fatty liver disease. J Hepatol. 2013;59(1):138-143.
67. Musso G, Gambino R, Cassader M, Pagano G. A meta‐analysis of randomized trials for the treatment of nonalcoholic fatty liver disease. Hepatology. 2010;52(1):79-104.
68. Patel Y, Gifford EJ, Glass LM, et al. Risk factors for biopsy-proven non-alcoholic fatty liver disease progression in the Veterans Health Administration. Aliment Pharmacol Ther. 2018;47(2):268-278.
Female Veterans’ Experiences With VHA Treatment for Military Sexual Trauma
Females are the fastest growing population to seek care at the Veterans Health Administration (VHA).1 Based on a 2014 study examining prevalence of military sexual trauma (MST), it is estimated that about one-third of females in the military screen positive for MST, and the rates are higher for younger veterans.2 Military sexual trauma includes both rape and any sexual activity that occurred without consent; offensive sexual remarks or advances can also represent MST. The issue of MST, therefore, is an important one to address adequately, especially for female veterans who are screened through the VHA system.
Since 1992, the VHA has been required to provide services for MST, defined as “sexual harassment that is threatening in character or physical assault of a sexual nature that occurred while the victim was in the military.”3 Despite this mandate, it has taken many years for all VHA hospitals to adopt recommended screening tools to identify survivors of MST and give them proper resources. Only half of VHA hospitals adopted screening 6 years after the policy change.4 In addition, the environment in which the survivors receive MST care may trigger posttraumatic stress symptoms as many of the other patients seeking care at the VHA hospital resemble the perpetrators.5 Thus, up to half of females who report a history of MST do not receive care for their MST through the VHA.6
Having a history of MST significantly increases the risks of developing mental health disorders, including posttraumatic stress disorder (PTSD), major depressive disorder, generalized anxiety disorder, and suicidal ideation.2 This group also has overall decreased quality of life (QOL). Female veterans have increased sexual dysfunction and dissatisfaction, which is heightened with a history of MST.7 Addressing MST requires treatment of all aspects of life affected by MST, such as mental health, sexual function, and QOL. The quality of treatment for MST through VHA hospitals deserves attention and likely still requires improvement with better incorporation of the patient’s perspective.
Qualitative research allows for incorporation of the patient’s perspective and is useful for exploring new ideas and themes.8 Current qualitative research using individual interviews of MST survivors focuses more on mental health treatment modalities through the VHA system and how resources are used within the system.9,10 While it is important to understand the quantity of these resources, their quality also should be explored. Research has identified unique gender-specific concerns such as female-only mental health groups.10 However, there has been less focus on how to improve current therapies and the treatment modalities (regardless of whether it is a community service or at the VHA system) females find most helpful. There is a gap in understanding the patient’s perspective and assessment of current MST treatments as well as the unmet needs both within and outside of the VHA system. Therefore, the purpose of this study is 2-fold: (1) examine the utilization of VHA services for MST, as well as outside services, through focusgroup sessions; and (2) to offer specific recommendations for improving MST treatment for female veterans from the patient’s perspective.
Methods
After obtaining institutional review board approval (16-H192), females who screened positive for a history of MST, using the validated MST screening questionnaire, were recruited from the Women’s Continuity Clinic, Urology clinic, and via a research flyer placed within key locations at the New Mexico Veterans Affairs (VA) Health Care System (NMVAHCS).11 Inclusion criteria were veterans aged > 18 years who could speak and understand English. Those who agreed to participate attended any 1 of 5 focus groups. Prior to initiation of the focus groups, the investigators generated a focus-group script, including specific questions or probes to explore treatment, unmet needs (such as other health conditions the veteran associated with MST that were not being addressed), and recommendations for care improvement.
Subjects granted consent privately prior to conduction of the focus group. Each participant completed a basic demographic (age, race, ethnicity) and clinical history (including pain conditions and therapy received for MST). These characteristics were evaluated with descriptive statistics, including means and frequencies.
The focus groups took place on the NM VAHCS Raymond G. Murphy VA Medical Center campus in a private conference room and were moderated by nonmedical research personnel experienced in focus-group moderation. Focus groups were recorded and transcribed. An iterative process was used with revisions to the script and probe questions as needed. Focus groups were planned for 2 hours but were allowed to continue at the participants’ discretion.
The de-identified transcripts were uploaded to the web-based qualitative engine Dedoose 6.2.21 software (Los Angeles, CA) and coded. Using grounded theory, the codes were grouped into themes and subsequently organized into emergent concepts.8,12 Following constant comparative methodology, ideas were compared and combined between each focus group.8,13 After completion of the focus groups, the generated ideas were organized and refined to create a conceptual framework that represented the collective ideas from the focus groups.
Results
Between January and June 2017, 5 focus groups with 17 participants were conducted; each session lasted about 3 hours. The average age was 52 ± 8.3 years, and were from a diverse racial and ethnic background. Most reported that > 20 years had passed since the first MST, and care-seeking for the first time was > 11 years after the trauma, although symptoms related to the MST most frequently began within 1 year of the trauma (Table 1). 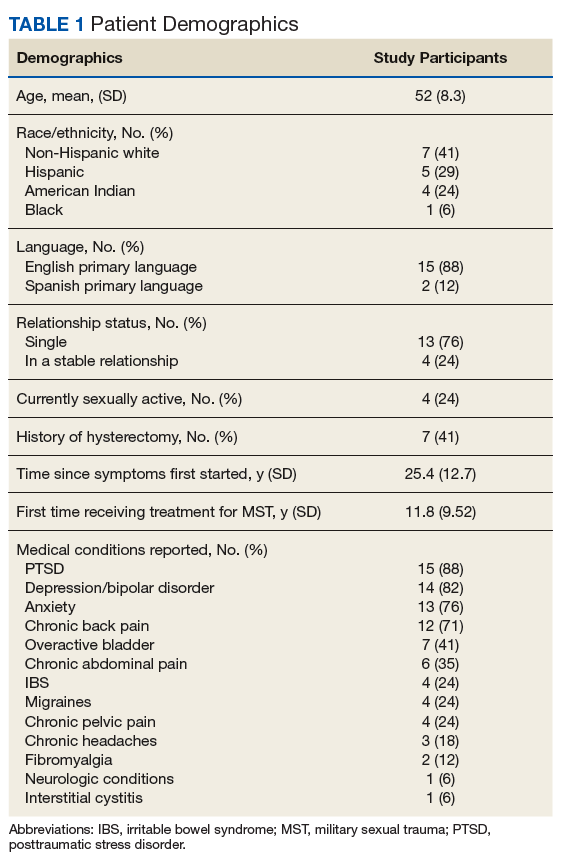
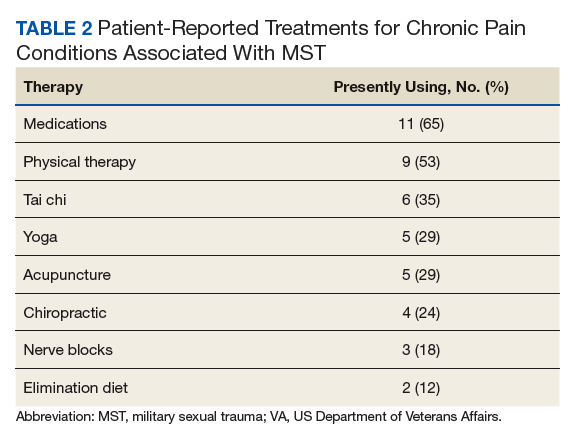
Preliminary Themes
The Trauma
Focus-group participants noted improved therapies offered by the VA but challenges obtaining health care:
“…because I’m really trying to deal with it and just be happy and get my joy back and deal with the isolation.”
“Another way that the memories affected me was barricading myself in my own house, starting from the front door.”
Male-Dominated VA
Participants also noted that, along with screening improving the system, dedicated female staff and service connection are important:
“The Womens Clinic is nice, and it’s nice to know that I can go there and I’m not having to discuss everything with men all over the place.”
“The other thing... that would be really good for survivors of MST, is help with disability.”
While the focus-group participants found dedicated women’s clinics helpful and providing improved care, the overall VA environment remains male-dominated:
“Because it’s really hard to relax and be vulnerable and be in your body and in your emotions if there‘s a bunch of penises around. When I saw these guys on the floor I’m like, I ain’t going in there.”
This male-dominated sense also incorporated a feeling of being misunderstood by a system that has traditionally cared for male veterans:
“People don‘t understand. They think, oh, you‘re overreacting, but they don’t know what it feels like to be inside.”
“I wouldn’t say they treat you like a second citizen, but it’s like almost every appointment I go to that’s not in the Women’s Clinic, the secretaries or whatever will be like ‘Oh, are you looking for somebody, or...’
Assumption Females Are Not Veterans
“There was an older gentleman behind me, they were like ‘Are you checking him in?’ I said, ‘I’m sure he’ll check himself in, but I’m checking myself in.’”
Participants also reported that there is an assumption that you’re not a veteran when you’re female:
“All of the care should be geared to be the same. And we know we need to recognize that men have their issues, and women will have their issues. But we don’t need to just say ‘all women have this issue, throw them over there.’”
Self-Doubt
“The world doesn’t validate rape, you asked for it, it was what you were wearing, it was what you said.”
Ongoing efforts to have female-only spaces, therapy groups, and support networks were encouraged by all 5 focus groups. These themes, provided the foundation for emergent concepts regarding patients’ perceptions of their treatment for MST: (1) Improvement has been slow but measurable; (2) VA cares more about male veterans; (3) The isolation from MST is pervasive; (4) It’s hard to navigate the VA system or any health care when you’re traumatized; and (5) Sexual assault leaves lasting self-doubt that providers need to address.
Isolation
Because there are barriers to seeking care the overarching method for coping with the effects of MST was isolation.
Overcoming the isolation was essential to seeking any care. Participants reported years of living alone, avoiding social situations and contexts, and difficulty with basic tasks because of the isolation.
“That the coping skills, that the isolation is a coping skill and all these things, and that I had to do that to survive.”
Lack of family and provider support and the VHA’s perceived focus on male veterans perpetuated this sense of isolation. Additionally, feeding the isolation were other maladaptive behaviors, such as alcoholism, weight gain, and anger.
“I was always an athlete until my MST, and I still find myself drinking whisky and wanting to smoke pot. It’s not that I want to, I guess it gives me a sense of relief, because my MST made me an alcoholic.”
Participants reported that successful treatment of MST must include treatment of other maladaptive behaviors and specific provider-behavior changes.
At times, providers contribute to female MST survivors’ feeling undervalued:
“I had an hour session and she kept looking at her watch and blowing me off, and I finally said, okay, I’m done, good-bye, after 45 minutes.”
Validation
Participants’ suggestions to improve MST treatment, including goal sharing, validation, knowledge, and support:
“They should have staff awareness groups, or focus groups to teach them the same thing that the patients are receiving as far as how to handle yourself, how to interact with others. Don’t bring your sh** from home into your job. You’re an employee, don’t take it personal.” (
The need for provider-level support and validation likely stems from the sense that many females expressed that MST was their fault. As one participant said,
“It wasn’t violent for me. I froze. So that’s another reason that I feel guilty because it’s like I didn’t fight. I just froze and put up with it, so I feel like jeez it was my fault. I didn’t... Somehow I am responsible for this.”
Thus, the groups concluded that the most powerful support was provider validation:
“The most important for me was that I was told it was not my fault. Over and over and over. That is the most important thing that us females need to know. Because that is such a relief and that opened up so much more.”
At all of the focus groups, female veterans reported that physician validation of the assault was essential to healing. When providers communicated validation, the women experienced the most improvement in symptoms.
Therapies for MST
A variety of modalities was recommended as helpful in coping with symptoms associated with MST. One female noted her therapy dog allowed her to get her first Papanicolaou (Pap) smear in years:
“Pelvic exams are like the seventh circle of hell. Like, God, you’d think I was being abducted by aliens or something. Last time, up here, they let me bring my little dog, which was extraordinarily helpful for me.”
For others, more traditional therapy such as prolonged exposure therapy or cognitive behavioral therapy, was helpful.
“After my prolonged exposure therapy; it saved my life. I’m not suicidal, and the only thing that’s really, really affected is sometimes I still have to sleep with a night light. Over 80% of the symptoms that I had and the problems that I had were alleviated with the therapy.”
Other veterans noted alternative therapies as beneficial for overcoming trauma:
“Yoga has really helped me with dealing with chronic pain and letting go of things that no longer serve me, and remembering about the inhale, the exhale, there’s a pause between the exhale and an inhale, where that’s where I make my choices, my thoughts, catch it, check it, change it, challenge my thoughts, that’s really, really helped me.”
From these concepts, and the specific suggestions female veterans provided for improvement in care,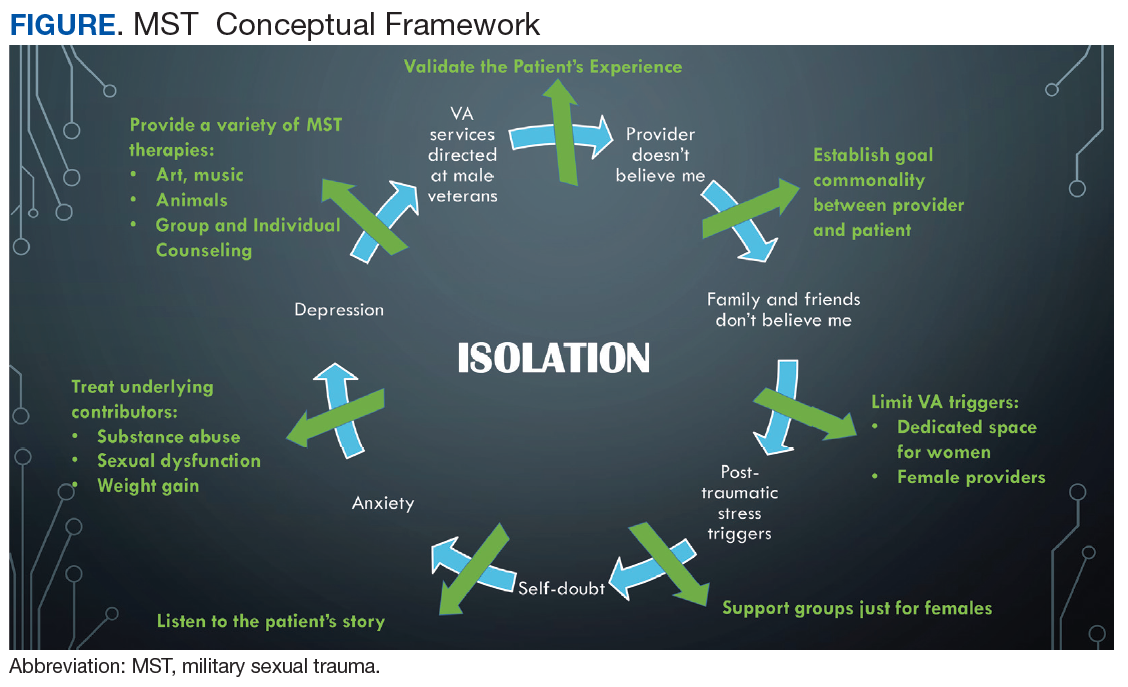
Discussion
This qualitative study of the quality of MST treatment with specific suggestions for improvement shows that the underlying force impacting health care in female survivors of MST is isolation. In turn, that isolation is perpetuated by personal beliefs, mental health, lack of support, and the VHA culture. While there was improvement in VHA care noted, female veterans offered many specific suggestions—simple ones that could be rapidly implemented—to enhance care. Many of these suggestions were targeted at provider-level behaviors such as validation, goal setting, knowledge (both about the military and about MST), and support.
Previous work showed that tangible (ie, words, being present) support rather than broad social support only generally helps reduces posttraumatic stress symptoms.15 These researchers found that tangible support moderated the relationship between number of lifetime traumas and PTSD. Schumm and colleagues also found that high social support predicted lower PTSD severity for inner-city women who experienced both child abuse and adult rape.16 A prior meta-analysis found social support was the strongest correlate of PTSD (effect size = 0.4).17
Our finding that female MST survivors desire verbal support from physicians may point to the inherent sense that validation helps healing, demonstrated by this meta-analysis. Importantly, the focus group participants did not specify the type of physician (psychiatrist, primary care provider, gynecologist, surgeon, etc) who needed to provide this support. Thus, we believe this suggestion is applicable to all physician interactions when the history of MST comes up. Physicians may be unaware of their profound impact in helping women recover from MST. This validation may also apply to survivors of other types of sexual trauma.
A second simple suggestion that arose from the focus groups was the need for broader options for MST therapy. Current data on the locations female veterans are treated for MST include specialty MST clinics, specialty PTSD clinics, psychosocial rehabilitation, and substance use disorder clinics, showing a wide range of settings.18 But female veterans are also asking for more services, including animal therapy, art therapy, yoga, and tai chi. While it may not be possible to offer every resource at every VHA facility, partnering with community services may help fulfill this veteran need.
The focus groups’ third suggestion for improvement in MST was better treatment for the health problems associated with sexual trauma, such as chronic pelvic pain, sexual dysfunction, and weight gain. It is important to note that the female veterans provided this list of associated health conditions from the broader facilitator question “What health problems do you think you have because of MST?” Females correctly identified common sequelae of sexual abuse, including pelvic pain and sexual dysfunction.14,19 Weight gain and obesity have been associated with childhood sexual trauma and abuse, but they are not well studied in MST and may be worth further exploration.20,21
Limitations
There are several inherent weaknesses in this study. The female veterans who agreed to participate in the focus group may not be representative of the entire population, particularly as survivors may be reluctant to talk about their MST experience. The participants in our focus groups were most commonly 2 decades past the MST and their experience with therapy may differ from that of women more recently traumatized and engaged in therapy. However, the fact that many of these females were still receiving some form of therapy 20 years after the traumatic event deserves attention.
Recall bias may have affected how female veterans described their experiences with MST treatment.
Strengths of the study included the inherent patient-centered approach and ability to analyze data not readily extracted from patient records or validated questionnaires. Additionally, this qualitative approach allows for the discovery of patient-driven ideas and concerns. Our focus groups also contained a majority of minority females (including Hispanic and American Indian) populations that are frequently underrepresented in research.
Conclusion
Our data show there is still substantial room for improvement in the therapies and in the physician-level care for MST. While each treatment experience was unique, the collective agreement was that multimodal therapy was beneficial. However, the isolation that often comes from MST makes accessing care and treatment challenging. A crucial component to combating this isolation is provider validation and support for the female’s experience with MST. The simple act of hearing “I believe you” from the provider can make a huge impact on continuing to seek care and overcoming the consequences of MST.
1. Rossiter AG, Smith S. The invisible wounds of war: caring for women veterans who have experienced military sexual trauma. J Am Assoc Nurse Pract. 2014;26(7):364-369.
2. Klingensmith K, Tsai J, Mota N, et al. Military sexual trauma in US veterans: results from the national health and resilience in veterans study. J Clin Psychiatry. 2014;75(10):e1133-e1139.
3. US. Department of Veterans Affairs, Veteran Health Administration. Military sexual trauma. https://www.publichealth.va.gov/docs/vhi/military_sexual_trauma.pdf. Published January 2004. Accessed July 16, 2018.
4. Suris AM, Davis LL, Kashner TM, et al. A survey of sexual trauma treatment provided by VA medical centers. Psychiatr Serv. 1998;49(3):382-384.
5. Gilmore AK, Davis MT, Grubaugh A, et al. “Do you expect me to receive PTSD care in a setting where most of the other patients remind me of the perpetrator?”: home-based telemedicine to address barriers to care unique to military sexual trauma and veterans affairs hospitals. Contemp Clin Trials. 2016;48:59-64.
6. Calhoun PS, Schry AR, Dennis PA, et al. The association between military sexual trauma and use of VA and non-VA health care services among female veterans with military service in Iraq or Afghanistan. J Interpers Violence. 2018;33(15):2439-2464.
7. Rosebrock L, Carroll R. Sexual function in female veterans: a review. J Sex Marital Ther. 2017;43(3):228-245.
8. Glaser BG, Strauss AL. The Discovery of Grounded Theory. Strategies for Qualitative Research. http://www.sxf.uevora.pt/wp-content/uploads/2013/03/Glaser_1967.pdf. Published 1999. Accessed July 16, 2018.
9. Kelly MM, Vogt DS, Scheiderer EM, et al. Effects of military trauma exposure on women veterans’ use and perceptions of Veterans Health Administration care. J Gen Intern Med. 2008;23(6):741-747.
10. Kehle-Forbes SM, Harwood EM, Spoont MR, et al. Experiences with VHA care: a qualitative study of U.S. women veterans with self-reported trauma histories. BMC Women Health. 2017;17(1):38.
11. McIntyre LM, Butterfield MI, Nanda K. Validation of trauma questionnaire in Veteran women. J Gen Int Med;1999;14(3):186-189.
12. Pope C, Ziebland S, Mays N. Analysing qualitative data. BMJ. 2000;320:114-116.
13. Maykut PMR. Beginning Qualitative Research. A Philosophic and Practical Guide. London, England: The Falmer Press; 1994.
14. Cichowski SB, Rogers RG, Clark EA, et al. Military sexual trauma in female veterans is associated with chronic pain conditions. Mil Med. 2017;182(9):e1895-e1899.
15. Glass N, Perrin N, Campbell JC, Soeken K. The protective role of tangible support on post-traumatic stress disorder symptoms in urban women survivors of violence. Res Nurs Health. 2007;30(5):558-568.
16. Schumm JA, Briggs-Phillips M, Hobfoll SE. Cumulative interpersonal traumas and social support as risk and resiliency factors in predicting PTSD and depression among Inner-city women. J Trauma Stress. 2006;19(6):825-836.
17. Ozer EJ, Best SR, Lipsey TL, Weiss DS. Predictors of posttraumatic stress disorder and symptoms in adults: a meta-analysis. Psychol Bull. 2003;129(1):52-73.
18. Valdez C, Kimerling R, Hyun JK, et al. Veterans Health Administration mental health treatment settings of patients who report military sexual trauma. J Trauma Dissociation. 2011;12(3):232-243.
19. Maseroli E, Scavello I, Cipriani S, et al. Psychobiological correlates of vaginismus: an exploratory analysis. J Sex Med. 2017;14(11):1392-1402.
20. Imperatori C, Innamorati M, Lamis DA, et al. Childhood trauma in obese and overweight women with food addiction and clinical-level of binge eating. Child Abuse Negl. 2016;58:180-190.
21. Williamson DF, Thompson TJ, Anda RF, Dietz WH, Felitti V. Body weight and obesity in adults and self-reported abuse in childhood. Int J Obes Relat Metab Disord. 2002;26(8):1075-1082.
Females are the fastest growing population to seek care at the Veterans Health Administration (VHA).1 Based on a 2014 study examining prevalence of military sexual trauma (MST), it is estimated that about one-third of females in the military screen positive for MST, and the rates are higher for younger veterans.2 Military sexual trauma includes both rape and any sexual activity that occurred without consent; offensive sexual remarks or advances can also represent MST. The issue of MST, therefore, is an important one to address adequately, especially for female veterans who are screened through the VHA system.
Since 1992, the VHA has been required to provide services for MST, defined as “sexual harassment that is threatening in character or physical assault of a sexual nature that occurred while the victim was in the military.”3 Despite this mandate, it has taken many years for all VHA hospitals to adopt recommended screening tools to identify survivors of MST and give them proper resources. Only half of VHA hospitals adopted screening 6 years after the policy change.4 In addition, the environment in which the survivors receive MST care may trigger posttraumatic stress symptoms as many of the other patients seeking care at the VHA hospital resemble the perpetrators.5 Thus, up to half of females who report a history of MST do not receive care for their MST through the VHA.6
Having a history of MST significantly increases the risks of developing mental health disorders, including posttraumatic stress disorder (PTSD), major depressive disorder, generalized anxiety disorder, and suicidal ideation.2 This group also has overall decreased quality of life (QOL). Female veterans have increased sexual dysfunction and dissatisfaction, which is heightened with a history of MST.7 Addressing MST requires treatment of all aspects of life affected by MST, such as mental health, sexual function, and QOL. The quality of treatment for MST through VHA hospitals deserves attention and likely still requires improvement with better incorporation of the patient’s perspective.
Qualitative research allows for incorporation of the patient’s perspective and is useful for exploring new ideas and themes.8 Current qualitative research using individual interviews of MST survivors focuses more on mental health treatment modalities through the VHA system and how resources are used within the system.9,10 While it is important to understand the quantity of these resources, their quality also should be explored. Research has identified unique gender-specific concerns such as female-only mental health groups.10 However, there has been less focus on how to improve current therapies and the treatment modalities (regardless of whether it is a community service or at the VHA system) females find most helpful. There is a gap in understanding the patient’s perspective and assessment of current MST treatments as well as the unmet needs both within and outside of the VHA system. Therefore, the purpose of this study is 2-fold: (1) examine the utilization of VHA services for MST, as well as outside services, through focusgroup sessions; and (2) to offer specific recommendations for improving MST treatment for female veterans from the patient’s perspective.
Methods
After obtaining institutional review board approval (16-H192), females who screened positive for a history of MST, using the validated MST screening questionnaire, were recruited from the Women’s Continuity Clinic, Urology clinic, and via a research flyer placed within key locations at the New Mexico Veterans Affairs (VA) Health Care System (NMVAHCS).11 Inclusion criteria were veterans aged > 18 years who could speak and understand English. Those who agreed to participate attended any 1 of 5 focus groups. Prior to initiation of the focus groups, the investigators generated a focus-group script, including specific questions or probes to explore treatment, unmet needs (such as other health conditions the veteran associated with MST that were not being addressed), and recommendations for care improvement.
Subjects granted consent privately prior to conduction of the focus group. Each participant completed a basic demographic (age, race, ethnicity) and clinical history (including pain conditions and therapy received for MST). These characteristics were evaluated with descriptive statistics, including means and frequencies.
The focus groups took place on the NM VAHCS Raymond G. Murphy VA Medical Center campus in a private conference room and were moderated by nonmedical research personnel experienced in focus-group moderation. Focus groups were recorded and transcribed. An iterative process was used with revisions to the script and probe questions as needed. Focus groups were planned for 2 hours but were allowed to continue at the participants’ discretion.
The de-identified transcripts were uploaded to the web-based qualitative engine Dedoose 6.2.21 software (Los Angeles, CA) and coded. Using grounded theory, the codes were grouped into themes and subsequently organized into emergent concepts.8,12 Following constant comparative methodology, ideas were compared and combined between each focus group.8,13 After completion of the focus groups, the generated ideas were organized and refined to create a conceptual framework that represented the collective ideas from the focus groups.
Results
Between January and June 2017, 5 focus groups with 17 participants were conducted; each session lasted about 3 hours. The average age was 52 ± 8.3 years, and were from a diverse racial and ethnic background. Most reported that > 20 years had passed since the first MST, and care-seeking for the first time was > 11 years after the trauma, although symptoms related to the MST most frequently began within 1 year of the trauma (Table 1).
Preliminary Themes
The Trauma
Focus-group participants noted improved therapies offered by the VA but challenges obtaining health care:
“…because I’m really trying to deal with it and just be happy and get my joy back and deal with the isolation.”
“Another way that the memories affected me was barricading myself in my own house, starting from the front door.”
Male-Dominated VA
Participants also noted that, along with screening improving the system, dedicated female staff and service connection are important:
“The Womens Clinic is nice, and it’s nice to know that I can go there and I’m not having to discuss everything with men all over the place.”
“The other thing... that would be really good for survivors of MST, is help with disability.”
While the focus-group participants found dedicated women’s clinics helpful and providing improved care, the overall VA environment remains male-dominated:
“Because it’s really hard to relax and be vulnerable and be in your body and in your emotions if there‘s a bunch of penises around. When I saw these guys on the floor I’m like, I ain’t going in there.”
This male-dominated sense also incorporated a feeling of being misunderstood by a system that has traditionally cared for male veterans:
“People don‘t understand. They think, oh, you‘re overreacting, but they don’t know what it feels like to be inside.”
“I wouldn’t say they treat you like a second citizen, but it’s like almost every appointment I go to that’s not in the Women’s Clinic, the secretaries or whatever will be like ‘Oh, are you looking for somebody, or...’
Assumption Females Are Not Veterans
“There was an older gentleman behind me, they were like ‘Are you checking him in?’ I said, ‘I’m sure he’ll check himself in, but I’m checking myself in.’”
Participants also reported that there is an assumption that you’re not a veteran when you’re female:
“All of the care should be geared to be the same. And we know we need to recognize that men have their issues, and women will have their issues. But we don’t need to just say ‘all women have this issue, throw them over there.’”
Self-Doubt
“The world doesn’t validate rape, you asked for it, it was what you were wearing, it was what you said.”
Ongoing efforts to have female-only spaces, therapy groups, and support networks were encouraged by all 5 focus groups. These themes, provided the foundation for emergent concepts regarding patients’ perceptions of their treatment for MST: (1) Improvement has been slow but measurable; (2) VA cares more about male veterans; (3) The isolation from MST is pervasive; (4) It’s hard to navigate the VA system or any health care when you’re traumatized; and (5) Sexual assault leaves lasting self-doubt that providers need to address.
Isolation
Because there are barriers to seeking care the overarching method for coping with the effects of MST was isolation.
Overcoming the isolation was essential to seeking any care. Participants reported years of living alone, avoiding social situations and contexts, and difficulty with basic tasks because of the isolation.
“That the coping skills, that the isolation is a coping skill and all these things, and that I had to do that to survive.”
Lack of family and provider support and the VHA’s perceived focus on male veterans perpetuated this sense of isolation. Additionally, feeding the isolation were other maladaptive behaviors, such as alcoholism, weight gain, and anger.
“I was always an athlete until my MST, and I still find myself drinking whisky and wanting to smoke pot. It’s not that I want to, I guess it gives me a sense of relief, because my MST made me an alcoholic.”
Participants reported that successful treatment of MST must include treatment of other maladaptive behaviors and specific provider-behavior changes.
At times, providers contribute to female MST survivors’ feeling undervalued:
“I had an hour session and she kept looking at her watch and blowing me off, and I finally said, okay, I’m done, good-bye, after 45 minutes.”
Validation
Participants’ suggestions to improve MST treatment, including goal sharing, validation, knowledge, and support:
“They should have staff awareness groups, or focus groups to teach them the same thing that the patients are receiving as far as how to handle yourself, how to interact with others. Don’t bring your sh** from home into your job. You’re an employee, don’t take it personal.” (
The need for provider-level support and validation likely stems from the sense that many females expressed that MST was their fault. As one participant said,
“It wasn’t violent for me. I froze. So that’s another reason that I feel guilty because it’s like I didn’t fight. I just froze and put up with it, so I feel like jeez it was my fault. I didn’t... Somehow I am responsible for this.”
Thus, the groups concluded that the most powerful support was provider validation:
“The most important for me was that I was told it was not my fault. Over and over and over. That is the most important thing that us females need to know. Because that is such a relief and that opened up so much more.”
At all of the focus groups, female veterans reported that physician validation of the assault was essential to healing. When providers communicated validation, the women experienced the most improvement in symptoms.
Therapies for MST
A variety of modalities was recommended as helpful in coping with symptoms associated with MST. One female noted her therapy dog allowed her to get her first Papanicolaou (Pap) smear in years:
“Pelvic exams are like the seventh circle of hell. Like, God, you’d think I was being abducted by aliens or something. Last time, up here, they let me bring my little dog, which was extraordinarily helpful for me.”
For others, more traditional therapy such as prolonged exposure therapy or cognitive behavioral therapy, was helpful.
“After my prolonged exposure therapy; it saved my life. I’m not suicidal, and the only thing that’s really, really affected is sometimes I still have to sleep with a night light. Over 80% of the symptoms that I had and the problems that I had were alleviated with the therapy.”
Other veterans noted alternative therapies as beneficial for overcoming trauma:
“Yoga has really helped me with dealing with chronic pain and letting go of things that no longer serve me, and remembering about the inhale, the exhale, there’s a pause between the exhale and an inhale, where that’s where I make my choices, my thoughts, catch it, check it, change it, challenge my thoughts, that’s really, really helped me.”
From these concepts, and the specific suggestions female veterans provided for improvement in care,
Discussion
This qualitative study of the quality of MST treatment with specific suggestions for improvement shows that the underlying force impacting health care in female survivors of MST is isolation. In turn, that isolation is perpetuated by personal beliefs, mental health, lack of support, and the VHA culture. While there was improvement in VHA care noted, female veterans offered many specific suggestions—simple ones that could be rapidly implemented—to enhance care. Many of these suggestions were targeted at provider-level behaviors such as validation, goal setting, knowledge (both about the military and about MST), and support.
Previous work showed that tangible (ie, words, being present) support rather than broad social support only generally helps reduces posttraumatic stress symptoms.15 These researchers found that tangible support moderated the relationship between number of lifetime traumas and PTSD. Schumm and colleagues also found that high social support predicted lower PTSD severity for inner-city women who experienced both child abuse and adult rape.16 A prior meta-analysis found social support was the strongest correlate of PTSD (effect size = 0.4).17
Our finding that female MST survivors desire verbal support from physicians may point to the inherent sense that validation helps healing, demonstrated by this meta-analysis. Importantly, the focus group participants did not specify the type of physician (psychiatrist, primary care provider, gynecologist, surgeon, etc) who needed to provide this support. Thus, we believe this suggestion is applicable to all physician interactions when the history of MST comes up. Physicians may be unaware of their profound impact in helping women recover from MST. This validation may also apply to survivors of other types of sexual trauma.
A second simple suggestion that arose from the focus groups was the need for broader options for MST therapy. Current data on the locations female veterans are treated for MST include specialty MST clinics, specialty PTSD clinics, psychosocial rehabilitation, and substance use disorder clinics, showing a wide range of settings.18 But female veterans are also asking for more services, including animal therapy, art therapy, yoga, and tai chi. While it may not be possible to offer every resource at every VHA facility, partnering with community services may help fulfill this veteran need.
The focus groups’ third suggestion for improvement in MST was better treatment for the health problems associated with sexual trauma, such as chronic pelvic pain, sexual dysfunction, and weight gain. It is important to note that the female veterans provided this list of associated health conditions from the broader facilitator question “What health problems do you think you have because of MST?” Females correctly identified common sequelae of sexual abuse, including pelvic pain and sexual dysfunction.14,19 Weight gain and obesity have been associated with childhood sexual trauma and abuse, but they are not well studied in MST and may be worth further exploration.20,21
Limitations
There are several inherent weaknesses in this study. The female veterans who agreed to participate in the focus group may not be representative of the entire population, particularly as survivors may be reluctant to talk about their MST experience. The participants in our focus groups were most commonly 2 decades past the MST and their experience with therapy may differ from that of women more recently traumatized and engaged in therapy. However, the fact that many of these females were still receiving some form of therapy 20 years after the traumatic event deserves attention.
Recall bias may have affected how female veterans described their experiences with MST treatment.
Strengths of the study included the inherent patient-centered approach and ability to analyze data not readily extracted from patient records or validated questionnaires. Additionally, this qualitative approach allows for the discovery of patient-driven ideas and concerns. Our focus groups also contained a majority of minority females (including Hispanic and American Indian) populations that are frequently underrepresented in research.
Conclusion
Our data show there is still substantial room for improvement in the therapies and in the physician-level care for MST. While each treatment experience was unique, the collective agreement was that multimodal therapy was beneficial. However, the isolation that often comes from MST makes accessing care and treatment challenging. A crucial component to combating this isolation is provider validation and support for the female’s experience with MST. The simple act of hearing “I believe you” from the provider can make a huge impact on continuing to seek care and overcoming the consequences of MST.
1. Rossiter AG, Smith S. The invisible wounds of war: caring for women veterans who have experienced military sexual trauma. J Am Assoc Nurse Pract. 2014;26(7):364-369.
2. Klingensmith K, Tsai J, Mota N, et al. Military sexual trauma in US veterans: results from the national health and resilience in veterans study. J Clin Psychiatry. 2014;75(10):e1133-e1139.
3. US. Department of Veterans Affairs, Veteran Health Administration. Military sexual trauma. https://www.publichealth.va.gov/docs/vhi/military_sexual_trauma.pdf. Published January 2004. Accessed July 16, 2018.
4. Suris AM, Davis LL, Kashner TM, et al. A survey of sexual trauma treatment provided by VA medical centers. Psychiatr Serv. 1998;49(3):382-384.
5. Gilmore AK, Davis MT, Grubaugh A, et al. “Do you expect me to receive PTSD care in a setting where most of the other patients remind me of the perpetrator?”: home-based telemedicine to address barriers to care unique to military sexual trauma and veterans affairs hospitals. Contemp Clin Trials. 2016;48:59-64.
6. Calhoun PS, Schry AR, Dennis PA, et al. The association between military sexual trauma and use of VA and non-VA health care services among female veterans with military service in Iraq or Afghanistan. J Interpers Violence. 2018;33(15):2439-2464.
7. Rosebrock L, Carroll R. Sexual function in female veterans: a review. J Sex Marital Ther. 2017;43(3):228-245.
8. Glaser BG, Strauss AL. The Discovery of Grounded Theory. Strategies for Qualitative Research. http://www.sxf.uevora.pt/wp-content/uploads/2013/03/Glaser_1967.pdf. Published 1999. Accessed July 16, 2018.
9. Kelly MM, Vogt DS, Scheiderer EM, et al. Effects of military trauma exposure on women veterans’ use and perceptions of Veterans Health Administration care. J Gen Intern Med. 2008;23(6):741-747.
10. Kehle-Forbes SM, Harwood EM, Spoont MR, et al. Experiences with VHA care: a qualitative study of U.S. women veterans with self-reported trauma histories. BMC Women Health. 2017;17(1):38.
11. McIntyre LM, Butterfield MI, Nanda K. Validation of trauma questionnaire in Veteran women. J Gen Int Med;1999;14(3):186-189.
12. Pope C, Ziebland S, Mays N. Analysing qualitative data. BMJ. 2000;320:114-116.
13. Maykut PMR. Beginning Qualitative Research. A Philosophic and Practical Guide. London, England: The Falmer Press; 1994.
14. Cichowski SB, Rogers RG, Clark EA, et al. Military sexual trauma in female veterans is associated with chronic pain conditions. Mil Med. 2017;182(9):e1895-e1899.
15. Glass N, Perrin N, Campbell JC, Soeken K. The protective role of tangible support on post-traumatic stress disorder symptoms in urban women survivors of violence. Res Nurs Health. 2007;30(5):558-568.
16. Schumm JA, Briggs-Phillips M, Hobfoll SE. Cumulative interpersonal traumas and social support as risk and resiliency factors in predicting PTSD and depression among Inner-city women. J Trauma Stress. 2006;19(6):825-836.
17. Ozer EJ, Best SR, Lipsey TL, Weiss DS. Predictors of posttraumatic stress disorder and symptoms in adults: a meta-analysis. Psychol Bull. 2003;129(1):52-73.
18. Valdez C, Kimerling R, Hyun JK, et al. Veterans Health Administration mental health treatment settings of patients who report military sexual trauma. J Trauma Dissociation. 2011;12(3):232-243.
19. Maseroli E, Scavello I, Cipriani S, et al. Psychobiological correlates of vaginismus: an exploratory analysis. J Sex Med. 2017;14(11):1392-1402.
20. Imperatori C, Innamorati M, Lamis DA, et al. Childhood trauma in obese and overweight women with food addiction and clinical-level of binge eating. Child Abuse Negl. 2016;58:180-190.
21. Williamson DF, Thompson TJ, Anda RF, Dietz WH, Felitti V. Body weight and obesity in adults and self-reported abuse in childhood. Int J Obes Relat Metab Disord. 2002;26(8):1075-1082.
Association between Hospitalist Productivity Payments and High-Value Care Culture
The Centers of Medicare and Medicaid Services (CMS) has introduced new payment models that tie quality and value incentives to 90% of fee-for-service payments and provide 50% of Medicare payments through alternative payment models.1 The push toward value comes after productivity-based physician reimbursement (ie, fee for service) has been associated with poor quality care, including delayed diagnoses, complications, readmissions, increased length of stay, and high costs of care.2-5 The method of physician payment is widely believed to affect clinical behavior by incentivizing doing more, coding for more, and billing for more.6-7 Although payment systems may be used to achieve policy objectives,8 little is known about the association of different payment systems with the culture of delivering value-based care among frontline clinicians.
Culture is defined as a system of shared assumptions, values, beliefs, and norms within an environment and has a powerful role in shaping clinician practice patterns.9-12 The culture within medicine currently contributes to the overuse of resources,11,13 and a culture for improvement is correlated with clinical outcomes. A systematic review found a consistent association between positive organization culture and improved outcomes including mortality.14 Across health systems, institutions with high scores on patient safety culture surveys have shown improvements in clinical behaviors and patient outcomes.15-18
In this study, we aim to describe high-value care culture among internal medicine hospitalists across diverse hospitals and evaluate the relationship between physician reimbursement and high-value care culture.
METHODS
Study Design
This study is an observational, cross-sectional survey-based study of hospitalists from 12 hospitals in California between January and June 2016.
Study Population
A total of 12 hospitals with hospitalist programs in California were chosen to represent three types of hospitals (ie, four university, four community, and four safety net). Safety-net hospitals, which traditionally serve low-income and medically and socially vulnerable patients were defined as those in the top quartile (ie, greater than 0.5) of their Disproportionate Share Index (DSH), which measures Medicaid patient load.19-20
To select hospitals with varying value-based care performance, we stratified using CMS value-based purchasing (VBP) scores from fiscal year 2015; these scores have been used to adjust reimbursement for just over 3,000 hospitals in the VBP program of CMS.22,23 CMS calculates the VBP total performance score as a composite of four domains: (1) clinical processes of care (20% of total performance); (2) patient satisfaction (30%); (3) patient outcomes, including mortality and complications (30%); and (4) cost defined by Medicare payment per beneficiary (20%).21 Established quality measures are based on data reported by participating hospitals and chart abstraction during 2011-2014.22 Although other clinical measures of care intensity have been used as proxies of value-based care,23,24 we used the measure of value that has been publically reported by the CMS VBP given its wide use and effects on reimbursements for 80% of hospitals in the CMS VBP program in 2015.25 We obtained institution-level data from the CMS VBP Program and Hospital Compare files. Each of the three types of hospitals represented institutions with low, middle, and high VBP performance (split in tertiles) as reported by the CMS VBP program. To increase the number of participants in tertiles with fewer hospitalists, a fourth hospital was selected for each hospital type.
We excluded individual hospitalists who primarily identified as working in subspecialty divisions and those who spent less than eight weeks during the last year providing direct patient care on inpatient internal medicine services at the studied institution.
Measurement
Hospitalists were asked to complete the High-Value Care Culture Survey (HVCCSTM), which measures the culture of value-based decision making among frontline clinicians.26 Similar to other validated surveys for the assessment of patient safety culture,27,28 the HVCCS can be used to identify target areas for improvement. The survey includes four domains: (1) leadership and health system messaging, (2) data transparency and access, (3) comfort with cost conversations, and (4) blame-free environment. This tool was developed by using a two-phase national modified Delphi process. It was evaluated at two academic centers to complete factor analysis and assess internal consistency, reliability, and validity among internal medicine hospitalists and residents. Validation included estimating product-moment correlation of overall HVCCS scores and domain scores with the CMS institutional VBP scores. HVCCS scores are standardized to a 0-100 point scale for each of the four domains and are then averaged to obtain an overall score.26
In the survey, value was defined as the quality of care provided to patients in relation to the costs required to deliver that care, and high-value care was defined as care that tried to maximize quality while minimizing costs. Quality was defined as the degree to which health services increased the likelihood of desired health outcomes that are safe, effective, patient centered, timely, equitable, and consistent with current professional knowledge. Cost was defined as the negative financial, physical, and emotional effects on patients and the health system.26
Data Analysis
We described the overall institutional mean high-value care culture and domain scores measured by the HVCCS, hospitalist demographics and training experiences, and hospital characteristics. We also described individual survey items. Descriptive statistics were stratified and compared on the basis of hospital type (ie, safety net, community, or university). We assessed the relationship between the clinician perception of reimbursement structure within their divisions and individually reported high-value care culture scores using bivariate and multilevel linear regression. We hypothesized that compared with hospitalists who were paid with salaries or wages, those who reported reimbursement with productivity adjustments may report lower HVCCS scores and those who reported reimbursement with quality or value adjustments may report higher HVCCS scores. We adjusted for physician- and hospital-level characteristics, including age, gender, and training track, and considered hospital type and size as random effects.
This study was approved by the Institutional Review Board at all 12 sites. All analyses were conducted using STATA® 13.0 (College Station, Texas).
RESULTS
Hospitalist Characteristics
A total of 255 (68.9%, 255/370) hospitalists across all sites completed the survey. Of these respondents, 135 were female (50.6%). On average, hospitalists were 39 years of age (SD 6.8), trained in categorical tracks (221; 86.7%), and had previously trained for 14.3 months at a safety-net hospital (SD 14.2). In total, 166 hospitalists (65.1%) reported being paid with salary or wages, 77 (30.2%) with salary plus productivity adjustments, and 12 (4.7%) with salary plus quality or value adjustments. Moreover, 123 (48.6%) hospitalists agreed that funding for their group depended on the volume of services they delivered. Community-based hospitalists reported higher rates of reimbursement with salary plus productivity (47; 32.0%) compared with their counterparts from university-based (24; 28.2%) and safety-net based programs (6; 26.1%). Among the three different hospital types, significant differences exist in hospitalist mean age (P < .001), gender (P = .01), and the number of months training in a safety-net hospital (P = .02; Table 1).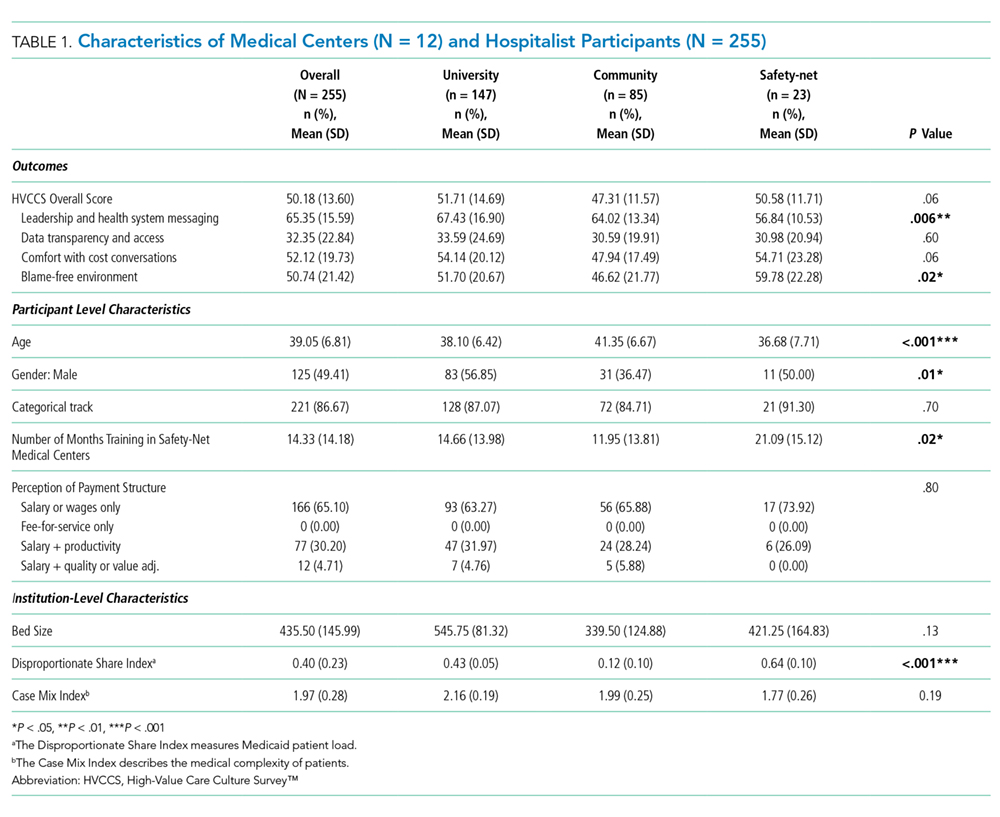
Hospital Characteristics
Of the 12 study sites, four from each type of hospital (ie, safety-net based, community based, and university based) and four representing each value-based purchasing performance tertile (ie, high, middle, and low) were included. Eleven (91.7%) sites were located in urban areas with an average DSH index of 0.40 (SD 0.23), case mix index of 1.97 (SD 0.28), and bed size of 435.5 (SD 146.0; Table 1).
In multilevel regression modeling across all 12 sites, hospitalists from community-based hospitalist programs reported lower mean HVCCS scores (β = −4.4, 95% CI −8.1 to −0.7; Table 2) than those from other hospital types.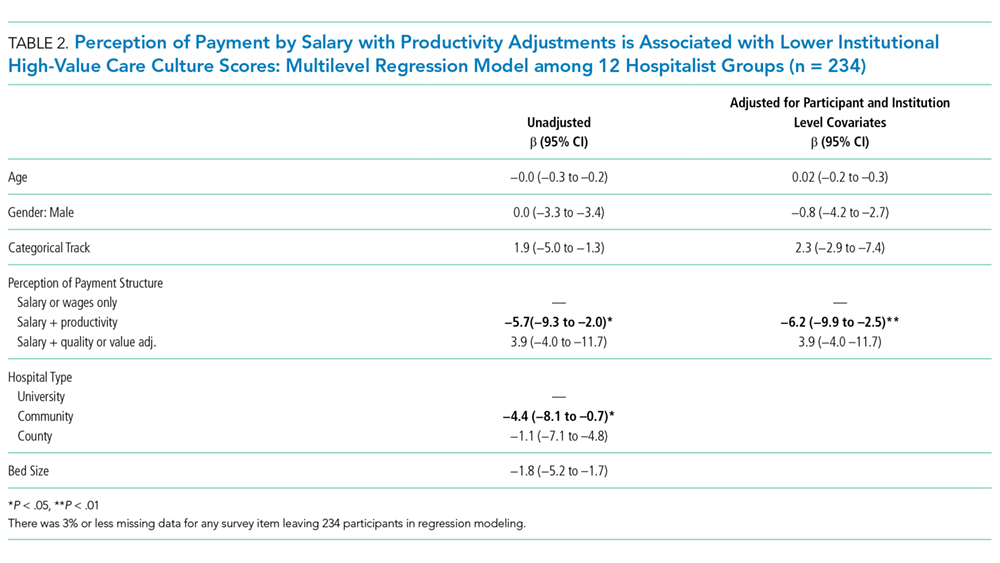
High-Value Care Culture Survey Scores
The mean HVCCS score was 50.2 (SD 13.6), and mean domain scores across all sites were 65.4 (SD 15.6) for leadership and health system messaging, 32.4 (SD 22.8) for data transparency and access, 52.1 (SD 19.7) for comfort with cost conversations, and 50.7 (SD 21.4) for blame-free environment (Table 1). For the majority (two-thirds) of individual HVCCS items, more than 30% of hospitalists across all sites agreed or strongly agreed that components of a low-value care culture exist within their institutions. For example, over 80% of hospitalists reported low transparency and limited access to data (see Appendix I for complete survey responses).
Hospitalists reported different HVCCS domains as strengths or weaknesses within their institutions in accordance with hospital type. Compared with university-based and safety-net-based hospitalists, community-based hospitalists reported lower scores in having a blame-free environment (466, SD 21.8). Nearly 50% reported that the clinicians’ fear of legal repercussions affects their frequency of ordering unneeded tests or procedures, and 30% reported that individual clinicians are blamed for complications. Nearly 40% reported that clinicians are uncomfortable discussing the costs of tests or treatments with patients and reported that clinicians do not feel that physicians should discuss costs with patients. Notably, community-based hospitalists uniquely differed in how they reported components of leadership and health system messaging. Over 60% reported a work climate or role modeling supportive of delivering quality care at lower costs. Only 48%, however, reported success seen from implemented efforts, and 45% reported weighing costs in clinical decision making (Table 1, Appendix I).
University-based hospitalists had significantly higher scores in leadership and health system messaging (67.4, SD 16.9) than community-based and safety-net-based hospitalists. They reported that their institutions consider their suggestions to improve quality care at low cost (75%), openly discuss ways to deliver this care (64%), and are actively implementing projects (73%). However, only 54% reported seeing success from implemented high-value care efforts (Table 1, Appendix I).
Safety-net hospitalists reported lower scores in leadership and health system messaging (56.8, SD 10.5) than university-based and community-based hospitalists. Few hospitalists reported a work climate (26%) or role modeling (30%) that is supportive of delivering quality care at low costs, openly discusses ways to deliver this care (35%), encourages frontline clinicians to pursue improvement projects (57%), or actively implements projects (26%). They also reported higher scores in the blame-free environment domain (59.8, SD 22.3; Table 1; Appendix 1).
Productivity Adjustments and High-Value Care Culture
In multilevel regression modeling, hospitalists who reported reimbursement with salary plus productivity adjustments had a lower mean HVCCS score (β = −6.2, 95% CI −9.9 to –2.5) than those who reported payment with salary or wages alone. Further multilevel regression modeling for each HVCCS domain revealed that hospitalists who reported reimbursement with salary plus productivity adjustments had lower scores in the leadership and health system messaging domain (β = −4.9, 95% CI −9.3 to −0.6) and data transparency and access domain (β = −10.7, 95% CI −16.7 to −4.6). No statistically significant difference was found between hospitalists who reported reimbursement with quality or value adjustments.
DISCUSSION
Understanding the drivers that are associated with a high-value care culture is necessary as payment models for hospitals transition from volume-based to value-based care. In this study, we found a meaningful association (β = −6.2) between clinician reimbursement schemes and measures of high-value care culture. A six-point change in the HVCCS score would correspond with a hospital moving from the top quartile to the median, which represents a significant change in performance. The relationship between clinician reimbursement schemes and high-value care culture may be a bidirectional relationship. Fee for service, the predominant payment scheme, places pressure on clinicians to maximize volume, focus on billing, and provide reactive care.7,29 Conversely, payment schemes that avoid these incentives (ie, salary, wages, and adjustments for quality or value), especially if incentives are felt by frontline clinicians, may better align with goals for long-term health outcomes for patient populations and reduce excess visits and services.2-6,8,30-34 At the same time, hospitals with a strong high-value care culture may be more likely to introduce shared savings programs and alternative payment models than those without. Through these decisions, the leadership can play an important role in creating an environment for change.34 Similar to the study sites, hospitals in California have a higher percentage of risk-based payments than hospitals in other states (>22%)35 and may also provide incentives to promote a high-value care culture or affect local physician compensation models.
Hospitals have options in how they choose to pay their clinicians, and these decisions may have downstream effects, such as building or eroding high-value care culture among clinicians or staff. A dose-response relationship between physician compensation models and value culture is plausible (salary with productivity < salary only < salary with value incentive). However, we did not find a statistically significant difference for salary with value incentive. This result may be attributed to the relatively small sample size in this study.
Hospitals can also improve their internal processes, organizational structure, and align their institutional payment contracts with those that emphasize value over fee-for-service-based incentives to increase value in care delivery.36 The operation of hospitals is challenging when competing payment incentives are used at the same time,7 and leadership will likely achieve more success in improving a high-value care culture and value performance when all efforts, including clinician and institutional payment, are aligned.37-38
Enduring large systems redesign will require directing attention to local organizational culture. For the majority of individual HVCCS items, 30% or more hospitalists across all sites agreed or strongly agreed that components of low-value care culture exist within their institutions. This response demonstrates a lack of focus on culture to address high-value care improvement among the study sites. Division and program leaders can begin measuring culture within their groups to develop new interventions that target culture change and improve value.34 No single panacea exists for the value improvement of hospitalist programs in California across all hospital types and sites.
Unique trends, however, emerge among each hospital type that could direct future improvements. In addition to all sites requiring increased transparency and access to data, community-based hospitalists identified the need for improvement in the creation of a blame-free environment, comfort with cost conversations, and aspects of leadership and health system messaging. While a high proportion of these hospitalists reported a work culture and role modeling that support the delivery of quality care at low costs, opportunities to create open discussion and frontline involvement in improvement efforts, weigh costs into clinical decision making, and cost conversations with patients exist. We hypothesize that these opportunities exist because community-based hospitals create infrastructure and technology to drive improvement that is often unseen by frontline providers. University-based hospitalists performed higher on three of the four domains compared with their counterparts but may have opportunities to promote a blame-free environment. A great proportion of these hospitalists reported the occurrence of open discussion and active projects within their institutions but also identified opportunities for the improvement of project implementation. Safety-net hospitalists reported the need to improve leadership and health system messaging across most domain items. Further study is required to evaluate reasons for safety-net hospitalists’ responses. We hypothesize that these responses may be related to having limited institutional resources to provide data and coordinated care and different institutional payment models. Each of these sites could identify trends in specific questions identified by the HVCCS for improvement in the high-value care culture.25
Our study evaluated 12 hospitalist programs in California that represent hospitals of different sizes and institutional VBP performance. A large multisite study that evaluates HVCCS across other specialties and disciplines in medicine, all regions of the country, and ambulatory care settings may be conducted in the future. Community-based hospitalist programs also reported low mean HVCCS scores, and further studies could better understand this relationship.
The limitations of the study include its small subgroup sample size and the lack of a gold standard for the measurement of high-value care. As expected, hospitalist groups among safety-net hospitals in California are small, and we may have been underpowered to determine some correlations presented by safety-net sites when stratifying by hospital type. Other correlations also may have been limited by sample size, including differences in HVCCS scores based on reimbursement and hospital type and the correlation between a blame-free environment and reimbursement type. Additionally, the field lacks a gold standard for the measurement of high-value care to help stratify institutional value performance for site selection. The VBP measure presents policy implications and is currently the best available measure with recent value data for over 3,000 hospitals nationally and representing various types of hospitals. This study is also cross-sectional and may benefit from the further evaluation of organizational culture over time and across other settings.
CONCLUSION
The HVCCS can identify clear targets for improvement and has been evaluated among internal medicine hospitalists. Hospitalists who are paid partly based on productivity reported low measures of high-value care culture at their institutions. As the nation moves toward increasingly value-based payment models, hospitals can strive to improve their understanding of their individual culture for value and begin addressing gaps.
Acknowledgments
The authors wish to thank Michael Lazarus, MD from the University of California Los Angeles; Robert Wachter, MD, James Harrison, PhD; Victoria Valencia, MPH from Dell Medical School at the University of Texas at Austin; Mithu Molla, MD from University of California Davis; Gregory Seymann, MD from the University of California San Diego; Bindu Swaroop, MD and Alpesh Amin, MD from University of California Irvine; Jessica Murphy, DO and Danny Sam, MD from Kaiser Permanente Santa Clara; Thomas Baudendistel, MD and Rajeeva Ranga, MD from Kaiser Permanente Oakland; Yile Ding, MD from California Pacific Medical Center; Soma Wali, MD from Los Angeles County/ OliveView UCLA Medical Center; Anshu Abhat, MD, MPH from the LA BioMed Institute at Los Angeles County/ Harbor-UCLA Medical Center; Steve Tringali, MD from Community Regional Medical Center Fresno; and Dan Dworsky, MD from Scripps Green Hospital for their site leadership and participation with the study.
Disclosures
Dr. Gupta is the Director of the Teaching Value in Healthcare Learning Network at Costs of Care. Dr. Moriates receives royalties from McGraw Hill for the textbook “Understanding Value-based Healthcare” outside of the submitted work and is the Director of Implementation at Costs of Care.
1.
2.
3.
4.
5.
6.
7.
8.
9.
10.
11.
12.
13. Colla CH. Swimming against the current—what might work to reduce low-value care? N Engl J Med. 2014;371(14):1280-1283. doi: 10.1056/NEJMp1404503. PubMed
14.
15.
16. Singer S, Lin S, Falwell A, Gaba D, Baker L. Relationship of safety climate and safety performance in hospitals. Health Serv Res. 2009;44(2 Pt 1):399-421. doi: 10.1111/j.1475-6773.2008.00918.x. PubMed
17.
18. Berry JC, Davis JT, Bartman T, et al. Improved safety culture and teamwork climate are associated with decreases in patient harm and hospital mortality across a hospital system. J Patient Saf. 2016. doi: 10.1097/PTS.0000000000000251. PubMed
19. Chatterjee P, Joynt KE, Orav EJ, Jha AK. Patient experience in safety-net hospitals: implications for improving care and value-based purchasing. Arch Intern Med. 2012;172(16):1204-1210. doi: 10.1001/archinternmed.2012.3158. PubMed
20. Centers for Medicare and Medicaid Services, Disproportionate Share Hospital (DSH). https://www.cms.gov/Medicare/Medicare-Fee-for-Service-Payment/AcuteInpatientPPS/dsh.html. Accessed May 1, 2018.
21.
22. Center for Medicare and Medicaid Services, Medicare Program. https://www.cms.gov/Medicare/Quality-Initiatives-Patient-Assessment-Instruments/hospital-value-based-purchasing/index.html?redirect=/Hospital-Value-Based-Purchasing/. Accessed May 1, 2018.
23. Sexton JB, Helmreich RL, Neilands TB, et al. The Safety Attitudes Questionnaire: psychometric properties, benchmarking data, and emerging research. BMC Health Serv Res. 2006;6:44. doi: 10.1186/1472-6963-6-44. PubMed
24. Singla AK, Kitch BT, Weissman JS, Campbell EG. Assessing patient safety culture. J Patient Saf. 2006;2(3):105-115. doi: 10.1097/01.jps.0000235388.39149.5a.
25. Centers for Medicare and Medicaid Services, HHS, Medicare Program. Hospital inpatient value-based purchasing program. Final rule. Fed Regist. 2011;76(26):490-547.
26. Gupta R, Moriates C, Clarke R, et al. Development of a high-value care culture survey: a modified Delphi process and psychometric evaluation. BMJ Qual Saf. 2016:1-9. http://dx.doi.org/10.1136/bmjqs-2016-005612 PubMed
27. Centers for Medicare and Medicaid Services. Medicare program; Hospital inpatient value-based purchasing program. Final rule. Fed Regist. 2011;76(88):26490-26547.
28. Arora A, True A, Dartmouth Atlas of Health Care. What Kind of Physician Will You Be? Variation in Health Care and Its Importance for Residency Training. Dartmouth Institute for Health Policy and Clinical Practice; 2012.
29. Berenson RA, Rich EC. US approaches to physician payment: the deconstruction of primary care. J Gen Intern Med. 2010;25(6):613-618. doi: 10.1007/s11606-010-1295-z. PubMed
30. Rosenthal MB, Dudley RA. Pay-for-performance: will the latest payment trend improve care? JAMA: the Journal of the American Medical Association. 1997;297(7):740-744. doi: 10.1001/jama.297.7.740 PubMed
31. Smith M, Saunders SM, Stuckhardt L, McGinnis JM, eds. Best Care at Lower Cost: the Path to Continuously Learning Health Care in America. Washington, DC: National Academies Press; May 10, 2013. PubMed
32. Powers BW, Milstein A, Jain SH. Delivery models for high-risk older patients: Back to the Future? JAMA. 2016;315(1):23-24. doi: 10.1001/jama.2015.17029. PubMed
33. Sinsky CA, Sinsk TA. Lessons from CareMore: A stepping stone to stronger primary care of frail elderly patients. Am J Manag Care. 2015;3(2):2-3.
34. Gupta R, Moriates C. Swimming upstream: creating a culture of high value care. Acad Med. 2016:1-4. doi: 10.1097/ACM.0000000000001485 PubMed
35. Berkeley Forum. California’s delivery system integration and payment system. http://berkeleyhealthcareforum.berkeley.edu/wp-content/uploads/Appendix-II.-California%E2%80%99s-Delivery-System-Integration-and-Payment-System-Methodology.pdf. Accessed July 15, 2018; April 2013.
36. Miller HD. From volume to value: better ways to pay for health care. Health Aff. 2009;28(5):1418-1428. doi: 10.1377/hlthaff.28.5.1418. PubMed
37. Kahn CN, III. Payment reform alone will not transform health care delivery. Health Aff. 2009;28(2):w216-w218. doi: 10.1377/hlthaff.28.2.w216. PubMed
38.
The Centers of Medicare and Medicaid Services (CMS) has introduced new payment models that tie quality and value incentives to 90% of fee-for-service payments and provide 50% of Medicare payments through alternative payment models.1 The push toward value comes after productivity-based physician reimbursement (ie, fee for service) has been associated with poor quality care, including delayed diagnoses, complications, readmissions, increased length of stay, and high costs of care.2-5 The method of physician payment is widely believed to affect clinical behavior by incentivizing doing more, coding for more, and billing for more.6-7 Although payment systems may be used to achieve policy objectives,8 little is known about the association of different payment systems with the culture of delivering value-based care among frontline clinicians.
Culture is defined as a system of shared assumptions, values, beliefs, and norms within an environment and has a powerful role in shaping clinician practice patterns.9-12 The culture within medicine currently contributes to the overuse of resources,11,13 and a culture for improvement is correlated with clinical outcomes. A systematic review found a consistent association between positive organization culture and improved outcomes including mortality.14 Across health systems, institutions with high scores on patient safety culture surveys have shown improvements in clinical behaviors and patient outcomes.15-18
In this study, we aim to describe high-value care culture among internal medicine hospitalists across diverse hospitals and evaluate the relationship between physician reimbursement and high-value care culture.
METHODS
Study Design
This study is an observational, cross-sectional survey-based study of hospitalists from 12 hospitals in California between January and June 2016.
Study Population
A total of 12 hospitals with hospitalist programs in California were chosen to represent three types of hospitals (ie, four university, four community, and four safety net). Safety-net hospitals, which traditionally serve low-income and medically and socially vulnerable patients were defined as those in the top quartile (ie, greater than 0.5) of their Disproportionate Share Index (DSH), which measures Medicaid patient load.19-20
To select hospitals with varying value-based care performance, we stratified using CMS value-based purchasing (VBP) scores from fiscal year 2015; these scores have been used to adjust reimbursement for just over 3,000 hospitals in the VBP program of CMS.22,23 CMS calculates the VBP total performance score as a composite of four domains: (1) clinical processes of care (20% of total performance); (2) patient satisfaction (30%); (3) patient outcomes, including mortality and complications (30%); and (4) cost defined by Medicare payment per beneficiary (20%).21 Established quality measures are based on data reported by participating hospitals and chart abstraction during 2011-2014.22 Although other clinical measures of care intensity have been used as proxies of value-based care,23,24 we used the measure of value that has been publically reported by the CMS VBP given its wide use and effects on reimbursements for 80% of hospitals in the CMS VBP program in 2015.25 We obtained institution-level data from the CMS VBP Program and Hospital Compare files. Each of the three types of hospitals represented institutions with low, middle, and high VBP performance (split in tertiles) as reported by the CMS VBP program. To increase the number of participants in tertiles with fewer hospitalists, a fourth hospital was selected for each hospital type.
We excluded individual hospitalists who primarily identified as working in subspecialty divisions and those who spent less than eight weeks during the last year providing direct patient care on inpatient internal medicine services at the studied institution.
Measurement
Hospitalists were asked to complete the High-Value Care Culture Survey (HVCCSTM), which measures the culture of value-based decision making among frontline clinicians.26 Similar to other validated surveys for the assessment of patient safety culture,27,28 the HVCCS can be used to identify target areas for improvement. The survey includes four domains: (1) leadership and health system messaging, (2) data transparency and access, (3) comfort with cost conversations, and (4) blame-free environment. This tool was developed by using a two-phase national modified Delphi process. It was evaluated at two academic centers to complete factor analysis and assess internal consistency, reliability, and validity among internal medicine hospitalists and residents. Validation included estimating product-moment correlation of overall HVCCS scores and domain scores with the CMS institutional VBP scores. HVCCS scores are standardized to a 0-100 point scale for each of the four domains and are then averaged to obtain an overall score.26
In the survey, value was defined as the quality of care provided to patients in relation to the costs required to deliver that care, and high-value care was defined as care that tried to maximize quality while minimizing costs. Quality was defined as the degree to which health services increased the likelihood of desired health outcomes that are safe, effective, patient centered, timely, equitable, and consistent with current professional knowledge. Cost was defined as the negative financial, physical, and emotional effects on patients and the health system.26
Data Analysis
We described the overall institutional mean high-value care culture and domain scores measured by the HVCCS, hospitalist demographics and training experiences, and hospital characteristics. We also described individual survey items. Descriptive statistics were stratified and compared on the basis of hospital type (ie, safety net, community, or university). We assessed the relationship between the clinician perception of reimbursement structure within their divisions and individually reported high-value care culture scores using bivariate and multilevel linear regression. We hypothesized that compared with hospitalists who were paid with salaries or wages, those who reported reimbursement with productivity adjustments may report lower HVCCS scores and those who reported reimbursement with quality or value adjustments may report higher HVCCS scores. We adjusted for physician- and hospital-level characteristics, including age, gender, and training track, and considered hospital type and size as random effects.
This study was approved by the Institutional Review Board at all 12 sites. All analyses were conducted using STATA® 13.0 (College Station, Texas).
RESULTS
Hospitalist Characteristics
A total of 255 (68.9%, 255/370) hospitalists across all sites completed the survey. Of these respondents, 135 were female (50.6%). On average, hospitalists were 39 years of age (SD 6.8), trained in categorical tracks (221; 86.7%), and had previously trained for 14.3 months at a safety-net hospital (SD 14.2). In total, 166 hospitalists (65.1%) reported being paid with salary or wages, 77 (30.2%) with salary plus productivity adjustments, and 12 (4.7%) with salary plus quality or value adjustments. Moreover, 123 (48.6%) hospitalists agreed that funding for their group depended on the volume of services they delivered. Community-based hospitalists reported higher rates of reimbursement with salary plus productivity (47; 32.0%) compared with their counterparts from university-based (24; 28.2%) and safety-net based programs (6; 26.1%). Among the three different hospital types, significant differences exist in hospitalist mean age (P < .001), gender (P = .01), and the number of months training in a safety-net hospital (P = .02; Table 1).
Hospital Characteristics
Of the 12 study sites, four from each type of hospital (ie, safety-net based, community based, and university based) and four representing each value-based purchasing performance tertile (ie, high, middle, and low) were included. Eleven (91.7%) sites were located in urban areas with an average DSH index of 0.40 (SD 0.23), case mix index of 1.97 (SD 0.28), and bed size of 435.5 (SD 146.0; Table 1).
In multilevel regression modeling across all 12 sites, hospitalists from community-based hospitalist programs reported lower mean HVCCS scores (β = −4.4, 95% CI −8.1 to −0.7; Table 2) than those from other hospital types.
High-Value Care Culture Survey Scores
The mean HVCCS score was 50.2 (SD 13.6), and mean domain scores across all sites were 65.4 (SD 15.6) for leadership and health system messaging, 32.4 (SD 22.8) for data transparency and access, 52.1 (SD 19.7) for comfort with cost conversations, and 50.7 (SD 21.4) for blame-free environment (Table 1). For the majority (two-thirds) of individual HVCCS items, more than 30% of hospitalists across all sites agreed or strongly agreed that components of a low-value care culture exist within their institutions. For example, over 80% of hospitalists reported low transparency and limited access to data (see Appendix I for complete survey responses).
Hospitalists reported different HVCCS domains as strengths or weaknesses within their institutions in accordance with hospital type. Compared with university-based and safety-net-based hospitalists, community-based hospitalists reported lower scores in having a blame-free environment (466, SD 21.8). Nearly 50% reported that the clinicians’ fear of legal repercussions affects their frequency of ordering unneeded tests or procedures, and 30% reported that individual clinicians are blamed for complications. Nearly 40% reported that clinicians are uncomfortable discussing the costs of tests or treatments with patients and reported that clinicians do not feel that physicians should discuss costs with patients. Notably, community-based hospitalists uniquely differed in how they reported components of leadership and health system messaging. Over 60% reported a work climate or role modeling supportive of delivering quality care at lower costs. Only 48%, however, reported success seen from implemented efforts, and 45% reported weighing costs in clinical decision making (Table 1, Appendix I).
University-based hospitalists had significantly higher scores in leadership and health system messaging (67.4, SD 16.9) than community-based and safety-net-based hospitalists. They reported that their institutions consider their suggestions to improve quality care at low cost (75%), openly discuss ways to deliver this care (64%), and are actively implementing projects (73%). However, only 54% reported seeing success from implemented high-value care efforts (Table 1, Appendix I).
Safety-net hospitalists reported lower scores in leadership and health system messaging (56.8, SD 10.5) than university-based and community-based hospitalists. Few hospitalists reported a work climate (26%) or role modeling (30%) that is supportive of delivering quality care at low costs, openly discusses ways to deliver this care (35%), encourages frontline clinicians to pursue improvement projects (57%), or actively implements projects (26%). They also reported higher scores in the blame-free environment domain (59.8, SD 22.3; Table 1; Appendix 1).
Productivity Adjustments and High-Value Care Culture
In multilevel regression modeling, hospitalists who reported reimbursement with salary plus productivity adjustments had a lower mean HVCCS score (β = −6.2, 95% CI −9.9 to –2.5) than those who reported payment with salary or wages alone. Further multilevel regression modeling for each HVCCS domain revealed that hospitalists who reported reimbursement with salary plus productivity adjustments had lower scores in the leadership and health system messaging domain (β = −4.9, 95% CI −9.3 to −0.6) and data transparency and access domain (β = −10.7, 95% CI −16.7 to −4.6). No statistically significant difference was found between hospitalists who reported reimbursement with quality or value adjustments.
DISCUSSION
Understanding the drivers that are associated with a high-value care culture is necessary as payment models for hospitals transition from volume-based to value-based care. In this study, we found a meaningful association (β = −6.2) between clinician reimbursement schemes and measures of high-value care culture. A six-point change in the HVCCS score would correspond with a hospital moving from the top quartile to the median, which represents a significant change in performance. The relationship between clinician reimbursement schemes and high-value care culture may be a bidirectional relationship. Fee for service, the predominant payment scheme, places pressure on clinicians to maximize volume, focus on billing, and provide reactive care.7,29 Conversely, payment schemes that avoid these incentives (ie, salary, wages, and adjustments for quality or value), especially if incentives are felt by frontline clinicians, may better align with goals for long-term health outcomes for patient populations and reduce excess visits and services.2-6,8,30-34 At the same time, hospitals with a strong high-value care culture may be more likely to introduce shared savings programs and alternative payment models than those without. Through these decisions, the leadership can play an important role in creating an environment for change.34 Similar to the study sites, hospitals in California have a higher percentage of risk-based payments than hospitals in other states (>22%)35 and may also provide incentives to promote a high-value care culture or affect local physician compensation models.
Hospitals have options in how they choose to pay their clinicians, and these decisions may have downstream effects, such as building or eroding high-value care culture among clinicians or staff. A dose-response relationship between physician compensation models and value culture is plausible (salary with productivity < salary only < salary with value incentive). However, we did not find a statistically significant difference for salary with value incentive. This result may be attributed to the relatively small sample size in this study.
Hospitals can also improve their internal processes, organizational structure, and align their institutional payment contracts with those that emphasize value over fee-for-service-based incentives to increase value in care delivery.36 The operation of hospitals is challenging when competing payment incentives are used at the same time,7 and leadership will likely achieve more success in improving a high-value care culture and value performance when all efforts, including clinician and institutional payment, are aligned.37-38
Enduring large systems redesign will require directing attention to local organizational culture. For the majority of individual HVCCS items, 30% or more hospitalists across all sites agreed or strongly agreed that components of low-value care culture exist within their institutions. This response demonstrates a lack of focus on culture to address high-value care improvement among the study sites. Division and program leaders can begin measuring culture within their groups to develop new interventions that target culture change and improve value.34 No single panacea exists for the value improvement of hospitalist programs in California across all hospital types and sites.
Unique trends, however, emerge among each hospital type that could direct future improvements. In addition to all sites requiring increased transparency and access to data, community-based hospitalists identified the need for improvement in the creation of a blame-free environment, comfort with cost conversations, and aspects of leadership and health system messaging. While a high proportion of these hospitalists reported a work culture and role modeling that support the delivery of quality care at low costs, opportunities to create open discussion and frontline involvement in improvement efforts, weigh costs into clinical decision making, and cost conversations with patients exist. We hypothesize that these opportunities exist because community-based hospitals create infrastructure and technology to drive improvement that is often unseen by frontline providers. University-based hospitalists performed higher on three of the four domains compared with their counterparts but may have opportunities to promote a blame-free environment. A great proportion of these hospitalists reported the occurrence of open discussion and active projects within their institutions but also identified opportunities for the improvement of project implementation. Safety-net hospitalists reported the need to improve leadership and health system messaging across most domain items. Further study is required to evaluate reasons for safety-net hospitalists’ responses. We hypothesize that these responses may be related to having limited institutional resources to provide data and coordinated care and different institutional payment models. Each of these sites could identify trends in specific questions identified by the HVCCS for improvement in the high-value care culture.25
Our study evaluated 12 hospitalist programs in California that represent hospitals of different sizes and institutional VBP performance. A large multisite study that evaluates HVCCS across other specialties and disciplines in medicine, all regions of the country, and ambulatory care settings may be conducted in the future. Community-based hospitalist programs also reported low mean HVCCS scores, and further studies could better understand this relationship.
The limitations of the study include its small subgroup sample size and the lack of a gold standard for the measurement of high-value care. As expected, hospitalist groups among safety-net hospitals in California are small, and we may have been underpowered to determine some correlations presented by safety-net sites when stratifying by hospital type. Other correlations also may have been limited by sample size, including differences in HVCCS scores based on reimbursement and hospital type and the correlation between a blame-free environment and reimbursement type. Additionally, the field lacks a gold standard for the measurement of high-value care to help stratify institutional value performance for site selection. The VBP measure presents policy implications and is currently the best available measure with recent value data for over 3,000 hospitals nationally and representing various types of hospitals. This study is also cross-sectional and may benefit from the further evaluation of organizational culture over time and across other settings.
CONCLUSION
The HVCCS can identify clear targets for improvement and has been evaluated among internal medicine hospitalists. Hospitalists who are paid partly based on productivity reported low measures of high-value care culture at their institutions. As the nation moves toward increasingly value-based payment models, hospitals can strive to improve their understanding of their individual culture for value and begin addressing gaps.
Acknowledgments
The authors wish to thank Michael Lazarus, MD from the University of California Los Angeles; Robert Wachter, MD, James Harrison, PhD; Victoria Valencia, MPH from Dell Medical School at the University of Texas at Austin; Mithu Molla, MD from University of California Davis; Gregory Seymann, MD from the University of California San Diego; Bindu Swaroop, MD and Alpesh Amin, MD from University of California Irvine; Jessica Murphy, DO and Danny Sam, MD from Kaiser Permanente Santa Clara; Thomas Baudendistel, MD and Rajeeva Ranga, MD from Kaiser Permanente Oakland; Yile Ding, MD from California Pacific Medical Center; Soma Wali, MD from Los Angeles County/ OliveView UCLA Medical Center; Anshu Abhat, MD, MPH from the LA BioMed Institute at Los Angeles County/ Harbor-UCLA Medical Center; Steve Tringali, MD from Community Regional Medical Center Fresno; and Dan Dworsky, MD from Scripps Green Hospital for their site leadership and participation with the study.
Disclosures
Dr. Gupta is the Director of the Teaching Value in Healthcare Learning Network at Costs of Care. Dr. Moriates receives royalties from McGraw Hill for the textbook “Understanding Value-based Healthcare” outside of the submitted work and is the Director of Implementation at Costs of Care.
1.
2.
3.
4.
5.
6.
7.
8.
9.
10.
11.
12.
13. Colla CH. Swimming against the current—what might work to reduce low-value care? N Engl J Med. 2014;371(14):1280-1283. doi: 10.1056/NEJMp1404503. PubMed
14.
15.
16. Singer S, Lin S, Falwell A, Gaba D, Baker L. Relationship of safety climate and safety performance in hospitals. Health Serv Res. 2009;44(2 Pt 1):399-421. doi: 10.1111/j.1475-6773.2008.00918.x. PubMed
17.
18. Berry JC, Davis JT, Bartman T, et al. Improved safety culture and teamwork climate are associated with decreases in patient harm and hospital mortality across a hospital system. J Patient Saf. 2016. doi: 10.1097/PTS.0000000000000251. PubMed
19. Chatterjee P, Joynt KE, Orav EJ, Jha AK. Patient experience in safety-net hospitals: implications for improving care and value-based purchasing. Arch Intern Med. 2012;172(16):1204-1210. doi: 10.1001/archinternmed.2012.3158. PubMed
20. Centers for Medicare and Medicaid Services, Disproportionate Share Hospital (DSH). https://www.cms.gov/Medicare/Medicare-Fee-for-Service-Payment/AcuteInpatientPPS/dsh.html. Accessed May 1, 2018.
21.
22. Center for Medicare and Medicaid Services, Medicare Program. https://www.cms.gov/Medicare/Quality-Initiatives-Patient-Assessment-Instruments/hospital-value-based-purchasing/index.html?redirect=/Hospital-Value-Based-Purchasing/. Accessed May 1, 2018.
23. Sexton JB, Helmreich RL, Neilands TB, et al. The Safety Attitudes Questionnaire: psychometric properties, benchmarking data, and emerging research. BMC Health Serv Res. 2006;6:44. doi: 10.1186/1472-6963-6-44. PubMed
24. Singla AK, Kitch BT, Weissman JS, Campbell EG. Assessing patient safety culture. J Patient Saf. 2006;2(3):105-115. doi: 10.1097/01.jps.0000235388.39149.5a.
25. Centers for Medicare and Medicaid Services, HHS, Medicare Program. Hospital inpatient value-based purchasing program. Final rule. Fed Regist. 2011;76(26):490-547.
26. Gupta R, Moriates C, Clarke R, et al. Development of a high-value care culture survey: a modified Delphi process and psychometric evaluation. BMJ Qual Saf. 2016:1-9. http://dx.doi.org/10.1136/bmjqs-2016-005612 PubMed
27. Centers for Medicare and Medicaid Services. Medicare program; Hospital inpatient value-based purchasing program. Final rule. Fed Regist. 2011;76(88):26490-26547.
28. Arora A, True A, Dartmouth Atlas of Health Care. What Kind of Physician Will You Be? Variation in Health Care and Its Importance for Residency Training. Dartmouth Institute for Health Policy and Clinical Practice; 2012.
29. Berenson RA, Rich EC. US approaches to physician payment: the deconstruction of primary care. J Gen Intern Med. 2010;25(6):613-618. doi: 10.1007/s11606-010-1295-z. PubMed
30. Rosenthal MB, Dudley RA. Pay-for-performance: will the latest payment trend improve care? JAMA: the Journal of the American Medical Association. 1997;297(7):740-744. doi: 10.1001/jama.297.7.740 PubMed
31. Smith M, Saunders SM, Stuckhardt L, McGinnis JM, eds. Best Care at Lower Cost: the Path to Continuously Learning Health Care in America. Washington, DC: National Academies Press; May 10, 2013. PubMed
32. Powers BW, Milstein A, Jain SH. Delivery models for high-risk older patients: Back to the Future? JAMA. 2016;315(1):23-24. doi: 10.1001/jama.2015.17029. PubMed
33. Sinsky CA, Sinsk TA. Lessons from CareMore: A stepping stone to stronger primary care of frail elderly patients. Am J Manag Care. 2015;3(2):2-3.
34. Gupta R, Moriates C. Swimming upstream: creating a culture of high value care. Acad Med. 2016:1-4. doi: 10.1097/ACM.0000000000001485 PubMed
35. Berkeley Forum. California’s delivery system integration and payment system. http://berkeleyhealthcareforum.berkeley.edu/wp-content/uploads/Appendix-II.-California%E2%80%99s-Delivery-System-Integration-and-Payment-System-Methodology.pdf. Accessed July 15, 2018; April 2013.
36. Miller HD. From volume to value: better ways to pay for health care. Health Aff. 2009;28(5):1418-1428. doi: 10.1377/hlthaff.28.5.1418. PubMed
37. Kahn CN, III. Payment reform alone will not transform health care delivery. Health Aff. 2009;28(2):w216-w218. doi: 10.1377/hlthaff.28.2.w216. PubMed
38.
© 2019 Society of Hospital Medicine