User login
Minimum 5-Year Follow-up of Articular Surface Replacement Acetabular Components Used in Total Hip Arthroplasty
ABSTRACT
The articular surface replacement (ASR) monoblock metal-on-metal acetabular component was recalled due to a higher than expected early failure rate. We evaluated the survivorship of the device and variables that may be predictive of failure at a minimum of 5-year follow-up. A single-center, single-surgeon retrospective review was conducted in patients who received the DePuy Synthes ASR™ XL Acetabular hip system from December 2005 to November 2009. Mean values and percentages were calculated and compared using the Fisher’s exact test, simple logistic regression, and Student’s t-test. The significance level was P ≤ .05. This study included 29 patients (24 males, 5 females) with 32 ASR™ XL acetabular hip systems. Mean age and body mass index (BMI) reached 55.2 years and 28.9 kg/m2, respectively. Mean postoperative follow-up was 6.2 years. A total of 2 patients (6.9%) died of an unrelated cause and 1 patient was lost to follow-up (3.4%), leaving 26 patients with 28 hip replacements, all of whom were available for follow-up. The 5-year revision rate was 34.4% (10 patients with 11 hip replacements). Mean time to revision was 3.1 years. Age (P = .76), gender (P = .49), BMI (P = .29), acetabular component abduction angle (P = .12), and acetabulum size (P = .59) were not associated with the increased rate for hip failure. Blood cobalt (7.6 vs 6.8 µg/L, P = .58) and chromium (5.0 vs 2.2 µg/L, P = .31) levels were not significantly higher in the revised group when compared with those of the unrevised group. In the revised group, a 91% decrease in cobalt and 78% decrease in chromium levels were observed at a mean of 6 months following the revision. This study demonstrates a high rate of failure of ASR acetabular components used in total hip arthroplasty at a minimum of 5 years of follow-up. No variable that was predictive of failure could be identified in this series. Close clinical surveillance of these patients is required.
Continue to: Metal-on-metal...
Metal-on-metal (MoM) articulations have been widely explored as an alternative to polyethylene bearings in total hip arthroplasty (THA), with proposed benefits including improved range of motion, lower dislocation rates, and enhanced durability.1 Comprising cobalt and chromium, these MoM bearings gained widespread popularity in the United States, particularly in younger and more active patients looking for longer lasting devices.
The articular surface replacement (ASR) acetabular system (DePuy Synthes) was approved for sale by the US Food and Drug Administration in 2003 and implanted in an estimated 93,000 cases.2 Since then, however, the early failure rate of the prosthesis has been well documented,3-5 leading to a formal global product recall in August 2010. The Australian Orthopaedic Association National Joint Replacement Registry (AOANJRR) was amongst the first to report a 6.4% rate of failure of the device at 3 years when inserted with a Corail stem.6 An acceptable upper rate of hip prosthesis failure is considered to reach 1% per year, with the majority of implants reporting well below this value. A 10.9% failure rate at 5 years was documented when the prosthesis was inserted for resurfacing. The National Joint Registry of England and Wales confirmed these findings and observed a 13% and 12% rate of failure at 5 years for the acetabular and resurfacing systems, respectively.2 With the notable failure of the ASR system, this study reports our single-center 5-year survivorship experience and evaluates any variable that might be predictive of an early failure to aid in patient counseling.
METHODS
A single-center, single-surgeon, retrospective review of a consecutive series of patients was performed from December 2005 to November 2009. This study included all patients who underwent a primary THA with a DePuy Synthes ASR™ XL Acetabular hip system. No patients were excluded. Institutional Review Board approval was obtained. Patient demographics comprising of age, gender, and body mass index (BMI) were recorded. The primary endpoint of this study was 5-year survivorship rates. Secondary endpoints included duration to revision surgery, blood cobalt and chromium levels, time interval of blood ion tests, acetabulum size, acetabular component abduction angle, and duration to follow-up.
Candidates for the ASR™ XL Acetabular hip system included young patients and/or those considered to be physically active. In a select few, ASR devices were implanted upon patient request.
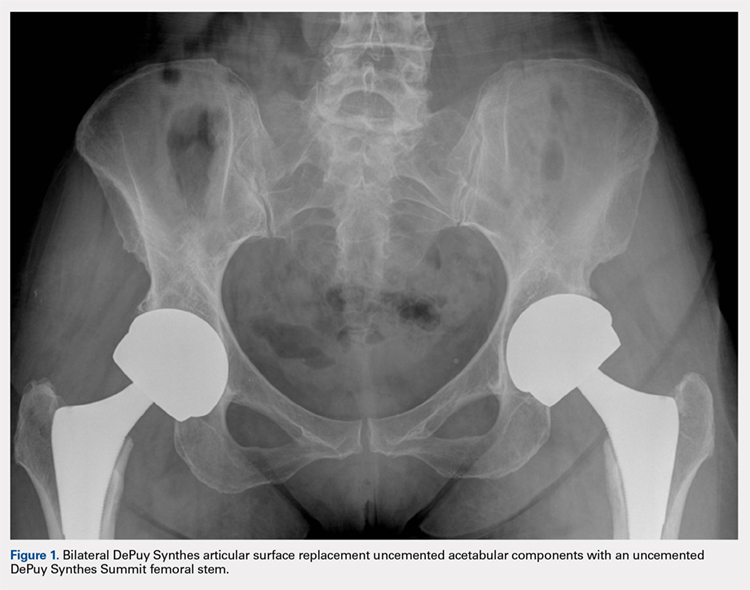
All patients underwent primary total hip replacement with a DePuy Synthes ASR™ XL uncemented acetabular component and an uncemented femoral stem (DePuy Synthes, Summit, or Tri-Lock) inserted via a standard posterior approach (Figure 1). Acetabulum sizes ranged from 52 mm to 68 mm in diameter.
All patients were followed-up yearly in the outpatient setting. Routine (yearly) metal-ion level sampling (whole blood) was started in 2010 for all patients. Laboratory tests were conducted at a single laboratory (Lab Corp.). Abduction cup inclination angles were measured by the providing surgeon using digital radiology software (GE Centricity systems).
The Student’s t-test was used to compare mean values (such as age, BMI, and metal ion levels) between the failure and no-failure groups. The 2-sided Fisher’s exact test analyzed differences in gender. Simple logistic regression analyzed variables associated with the failure group. Significance was P ≤ .05.
Continue to: Results...
RESULTS
A total of 29 patients (24 males, 5 females) with 32 ASR hip replacements were included in this study. Indications for surgery comprised osteoarthritis (28 hips, 87.5%) and avascular necrosis of the hip (4 hips, 12.5%). Mean age and BMI were 55.2 years and 28.9 kg/m2, respectively. A total of 2 patients (6.9%) died of an unrelated cause (1 myocardial infarct, 1 suicide), and 1 patient was lost to follow-up (3.4%), leaving 26 patients with 28 hip replacements, all of whom finished a 5-year minimum follow-up.
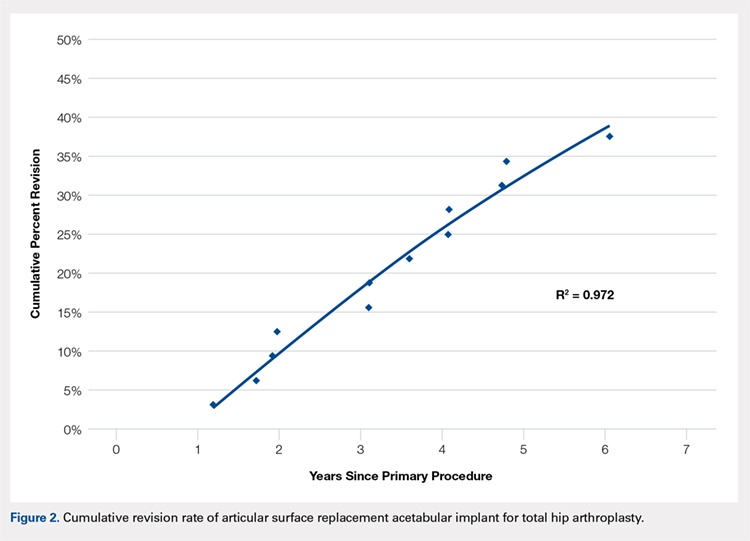
No implant failures were noted in the first year. The 5-year revision rate reached 34.4% (10 patients with 11 hip replacements). Mean time to revision for this subgroup was 3.1 years. Overall, an implant failure was observed in 37.5% of patients (11 patients with 12 hip replacements) at a mean postoperative follow-up of 6.2 years (Figure 2). Indications for implant revision were pain in 11 (92.7%) cases and infection in 1 (8.3%).
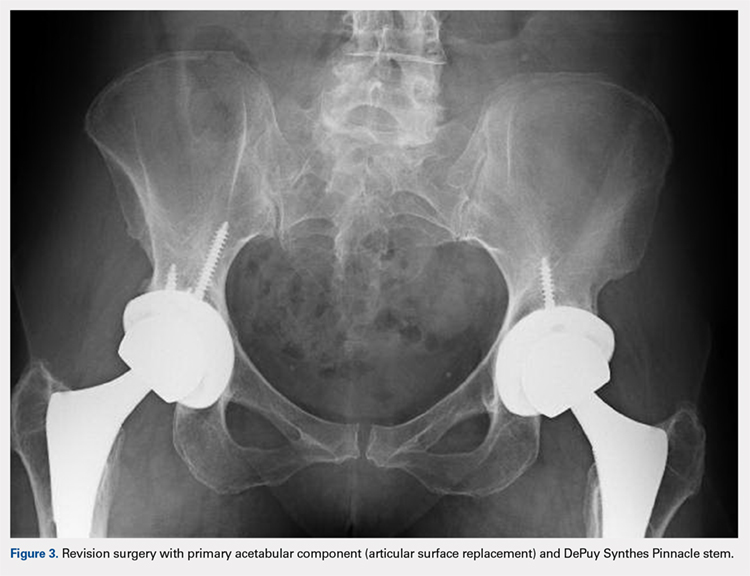
Of the 11 hips revised due to pain, 9 were performed by the original surgeon (8 were completed with primary acetabular components, 1 with a revision shell). Figure 3 shows a bilateral revision performed with primary acetabular components and retained DePuy Synthes Pinnacle femoral stems. In all these cases except 1, the ASR component was grossly loose. One case presented with pseudotumor and impingement between the femoral prosthetic neck and acetabular component after migration of a loose component. After revision, the patient returned with substantial anterior hip pain and heterotopic ossification, and failed conservative treatment, requiring another surgery with prosthesis retention, removal of heterotopic ossification, and iliopsoas lengthening. The surgery successfully relieved the symptoms. No other patients required additional surgery after their revision. In comparison to the original ASR component, the revision shell was 2 to 4 mm larger in diameter. No patient required component revision at a mean of 2.9 years after the revision surgery.
The patient with secondary revision developed a hematogenous streptococcal infection after a dental procedure performed without prophylactic antibiotics. The patient was initially lost to follow-up after the primary surgery and reported no antecedent pain prior to the revision. A substantial metal fluid collection was identified in the hip at the time of débridement and without component loosening. After débridement, the patient developed persistent metal stained wound drainage, necessitating ultimate successful treatment with a 2-stage exchange procedure.
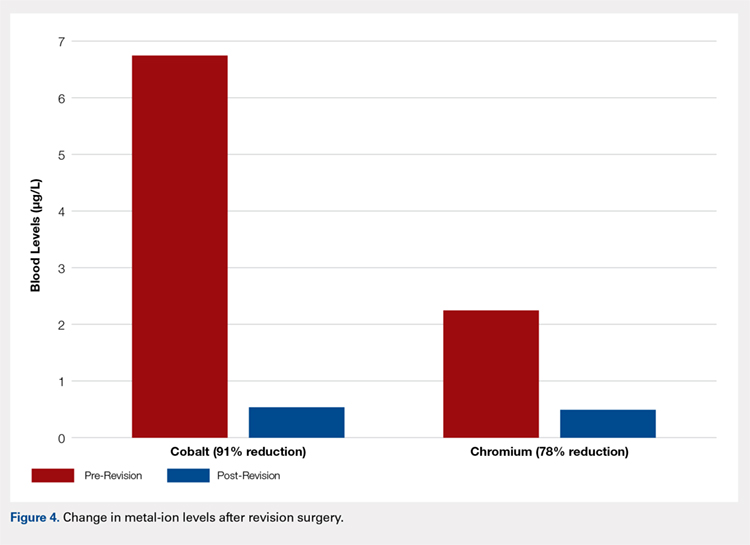
Age (P = .76), gender (P = .49), BMI (P = .29), acetabular component abduction angle (P = .12), and acetabulum size (P = .59) were not associated with an increased rate for hip failure (Table). Blood cobalt (7.6 vs 6.8 µg/L, P = .58) and chromium (5.0 vs 2.2 µg/L, P = .31) levels were not significantly higher in the revised group when compared with those of the unrevised group. The upper limits of blood cobalt and chromium levels reached 18.9 and 15.9 µg/L for the revised group and 16.8 and 5.4 µg/L for the non-revised group, respectively. In the revised group, a 91% decrease in cobalt and 78% decrease in chromium levels were observed at a mean of 6 months after the revision (Figure 4).
Table. Variables Not Associated with Early ASR Failure
|
| No Failure (n = 20) | Failure (n = 12) | P value |
Age (years) | 55.4 ± 6.4 | 54.7 ± 6.3 | .76 | |
BMI (kg/m2) | 29.7 ± 6.7 | 27.4 ± 4.0 | .29 | |
Gender | .49 | |||
Female | 3 (15%) | 3 (25%) | ||
Male | 17 (85%) | 9 (75%) | ||
Acetabulum size (mm) | 59.1 ± 3.9 | 58.3 ± 3.8 | .59 | |
Abduction angle (degrees) | 44.9 ± 4.5 | 42.3 ± 3.8 | .12 | |
Serum levels (µg/L) | ||||
Cobalt | 6.8 ± 6.0 | 7.6 ± 4.7 | .58 | |
| Chromium | 2.2 ± 1.7 | 5.0 ± 5.0 | .31 |
Continue to: Discussion...
DISCUSSION
According to the Center for Disease Control and Prevention, 310,800 total hip replacements were performed among inpatients aged 45 years and older in the US in 2010.7 Specifically, in the 55- to 64-year-old age group, the number of procedures performed tripled from 2000 through 2010. As younger and more active patients opt for hip replacements, a growing need for prosthesis with enhanced durability is observed.
Despite the early proposed advantages of large head MoM bearings, our retrospective study of the DePuy Synthes ASR™ XL Acetabular hip system yielded 15.6% and 34.4% failure rates at 3 and 5 years, respectively. These higher-than-expected rates of failure are consistent with published data. The British Hip Society reported a 21% to 35% revision rate at 4 years and 49% at 6 years for the ASR XL prosthesis.8 In comparison, other MoM prosthesis, on average, report a 12% to 15% rate of failure at 5 years.
Considerable controversy surrounds the causes of adverse wear failure in MoM bearings.9,10 The non-modular design of the ASR prostheses is frequently implicated as a cause of early failure. The lack of a central hole in the 1-piece component compromises the tactile feel of insertion, thereby reducing the surgeon’s ability to assess complete seating.11 This condition may potentially increase the abduction angle at the time of insertion. Screw fixation of the non-modular device is not possible. The ASR XL device (148° to 160°) is less than a hemisphere (180°) in size and hence features a diminished functional articular surface, further compromising implant fixation.11 The functional articular surface is defined as the optimal surface area (10 mm) needed for a MoM implant.12 Griffin and colleagues13 reported a 48 mm ASR XL component, when implanted at 45° of abduction, to function similar to an implant at 59° of abduction, leading to diminished lubrication, metallosis, and edge loading. The version of the acetabular component may similarly and adversely affect implant wear characteristics. Furthermore, the variable thickness of the implant, which is thicker at the dome and thinner at the rim, may further promote edge loading by shifting the center of rotation of the femoral head out from the center of the acetabular prosthesis.11 Studies have also shown that increased wear of the MoM articulation is associated with an acetabular component inclination angle in excess of 55°10,14 and a failure of fixation at time of implantation.15 This study, however, found no correlation between the abduction angle and risk of early implant failure for the ASR acetabular component. No correlation was also detected between the acetabulum size and revision surgery.
The AOANJRR reported loosening (44%), infection (20%), metal sensitivity (12%), fracture (9%), and dislocation of prosthesis (7%) as the indications for revision surgery for the ASR prosthesis.6 Furthermore, a single-center retrospective review of 70 consecutive MoM THAs with ultra-large diameter femoral head and monoblock acetabular components showed that 17.1% required revision within 3 years for loosening, pain, and squeaking.1 Overall, 28.6% of patients reported implant dysfunction. In this study, we observed a similar rate of failure at 3 years (15.6%) for pain (11) and infection (1). The revision surgery successfully relieved all of these symptoms. One patient presented with heterotopic ossification and anterior hip pain after the original revision and required additional surgery with prosthesis retention. No patient in this series required repeat component revisions at a mean of 2.9 years after surgery. In all but 1 case, primary acetabular components were used in the revision, and in all cases except that with infection, the femoral component was retained. Replacement shells were 2 to 4 mm larger in diameter than the original ASR component.
Recently, concerns have arisen regarding the long-term effects of serum cobalt and chromium metal ions levels. Studies have shown increased serum metal ion levels,15 groin pain,16 pseudotumor formation,17 and metallosis18 after the implantation of MoM bearings. In a case study by Mao and colleagues,19 1 patient reported headaches, anorexia, continuous metallic taste in her mouth, and weight loss. A cerebrospinal fluid analysis revealed cobalt and chromium levels at 9 and 13 nmol/L, respectively, indicating that these metal ions can cross the blood-brain barrier. Another patient reported painful muscle fatigue, night cramps, fainting spells, cognitive decline, and an inability to climb stairs. His serum cobalt level reached 258 nmol/L (reference range, 0-20 nmol/L), and chromium level totaled 88 nmol/L (reference range, 0-100 nmol/L). At 8-week follow-up after revision surgery, the symptoms of the patient had resolved, with serum cobalt levels dropping to 42 nmol/L.19 None of the patients in this study presented with any signs or symptoms of metal toxicity. The upper limits of blood cobalt and chromium levels in our study population reached 18.9 and 15.9 µg/L for the revised group and 16.8 and 5.4 µg/L for the non-revised group, respectively. However, we noted a similar drop in post-revision blood cobalt (91% decrease) and chromium (78% decrease) levels.
In summary, our data showed a high revision rate of the DePuy Synthes ASR™ XL Acetabular hip system. Our findings are consistent with internationally published data. In the absence of reliable predictors of early failure, continued close clinical surveillance and laboratory monitoring of these patients are warranted.
CONCLUSION
This study demonstrates the high failure rate of the DePuy Synthes ASR™ XL Acetabular hip system used in THA at a minimum of 5 years of follow-up. No variable that was predictive of failure could be identified in this series. Close clinical surveillance of these patients is therefore required. Metal levels dropped quickly after revision, and the revision surgery can generally be performed with slightly larger primary components. Symptomatic patients with ASR hip replacements, regardless of blood metal-ion levels, were candidates for the revision surgery. Not all failed hips exhibited substantially elevated metal levels. Asymptomatic patients with high blood metal-ion levels should be closely followed-up and revision surgery should be strongly considered, consistent with recently published guidelines.20
- Bernthal NM, Celestre PC, Stavrakis AI, Ludington JC, Oakes DA. Disappointing short-term results with the DePuy ASR XL metal-on-metal total hip arthroplasty. J Arthroplasty. 2012;27(4):539. doi:10.1016/j.arth.2011.08.022.
- de Steiger RN, Hang JR, Miller LN, Graves SE, Davidson DC. Five-year results of the ASR XL acetabular system and the ASR hip resurfacing system: An analysis from the Australian Orthopaedic Association National Joint Replacement Registry. J Bone Joint Surg Am. 2011;93(24):2287. doi:10.2106/JBJS.J.01727.
- Langton DJ, Jameson SS, Joyce TJ, Hallab NJ, Natu S, Nargol AV. Early failure of metal-on-metal bearings in hip resurfacing and large-diameter total hip replacement: a consequence of excess wear. J Bone Joint Surg Br. 2010;92(1):38-46. doi:10.1302/0301-620X.92B1.22770.
- Siebel T, Maubach S, Morlock MM. Lessons learned from early clinical experience and results of 300 ASR hip resurfacing implantations. Proc Inst Mech Eng H. 2006;220(2):345-353. doi:10.1243/095441105X69079.
- Jameson SS, Langton DJ, Nargol AV. Articular surface replacement of the hip: a prospective single-surgeon series. J Bone Joint Surg Br. 2010;92(1):28-37. doi:10.1302/0301-620X.92B1.22769.
- Australian Orthopaedic Association National Joint Replacement Registry annual report 2010. Australian Orthopaedic Association Web site. https://aoanjrr.sahmri.com/annual-reports-2010. Accessed June 19, 2018.
- Wolford ML, Palso K, Bercovitz A. Hospitalization for total hip replacement among inpatients aged 45 and over: United States, 2000-2010. Centers for Disease Control and Prevention Web site. http://www.cdc.gov/nchs/data/databriefs/db186.pdf. Accessed July 13, 2015.
- Hodgkinson J, Skinner J, Kay P. Large diameter metal on metal bearing total hip replacements. British Hip Society Web site. https://www.britishhipsociety.com/uploaded/BHS_MOM_THR.pdf. Accessed August 6, 2015.
- Hart AJ, Ilo K, Underwood R, et al. The relationship between the angle of version and rate of wear of retrieved metal-on-metal resurfacings: a prospective, CT-based study. J Bone Joint Surg Br. 2011;93(3):315-320. doi:10.1302/0301-620X.93B3.25545.
- Langton DJ, Joyce TJ, Jameson SS, et al. Adverse reaction to metal debris following hip resurfacing: the influence of component type, orientation and volumetric wear. J Bone Joint Surg Br. 2011;93(2):164-171. doi:10.1302/0301-620X.93B2.25099.
- Steele GD, Fehring TK, Odum SM, Dennos AC, Nadaud MC. Early failure of articular surface replacement XL total hip arthroplasty. J Arthroplasty. 2011;26(6):14-18. doi:10.1016/j.arth.2011.03.027.
- De Haan R, Campbell PA, Su EP, De Smet KA. Revision of metal-on-metal resurfacing arthroplasty of the hip: the influence of malpositioning of the components. J Bone Joint Surg Br. 2008;90(9):1158-1163. doi:10.1302/0301-620X.90B9.19891.
- Griffin WL, Nanson CJ, Springer BD, Davies MA, Fehring TK. Reduced articular surface of one-piece cups: a cause of runaway wear and early failure. Clin Orthop Relat Res. 2010;468(9):2328-2332. doi:10.1007/s11999-010-1383-8.
- Grammatopolous G, Pandit H, Glyn-Jones S, et al. Optimal acetablular orientation for hip resurfacing. J Bone Joint Surg Br. 2010;92(8):1072-1078. doi:10.1302/0301-620X.92B8.24194.
- MacDonalad SJ, McCalden RW, Chess DG, et al. Meta-onmetal versus polyethylene in hip arthoplasty: a randomized clinical trial. Clin Orthop Relat Res. 2003;(406):282-296.
- Bin Nasser A, Beaule PE, O'Neill M, Kim PR, Fazekas A. Incidence of groin pain after metal-on-metal hip resurfacing. Clin Orthop Relat Res. 2010;468(2):392-399. doi:10.1007/s11999-009-1133-y.
- Mahendra G, Pandit H, Kliskey K, Murray D, Gill HS, Athanasou N. Necrotic and inflammatory changes in metal-on-metal resurfacing hip arthroplasties. Acta Orthop. 2009;80(6):653-659. doi:10.3109/17453670903473016.
- Neumann DRP, Thaler C, Hitzl W, Huber M, Hofstädter T, Dorn U. Long term results of a contemporary metal-on-metal total hip arthroplasty. J Arthroplasty. 2010;25(5):700-708. doi:10.1016/j.arth.2009.05.018.
- Mao X, Wong AA, Crawford RW. Cobalt toxicity--an emerging clinical problem in patients with metal-on-metal hip prostheses? Med J Aust. 2011;194(12):649-651.
- Information statement: current concerns with metal-on-metal hip arthroplasty. American Academy of Orthopaedic Surgeons Web site. https://aaos.org/uploadedFiles/PreProduction/About/Opinion_Statements/advistmt/1035%20Current%20Concerns%20with%20Metal-on-Metal%20Hip%20Arthroplasty.pdf. Accessed June 19, 2018.
ABSTRACT
The articular surface replacement (ASR) monoblock metal-on-metal acetabular component was recalled due to a higher than expected early failure rate. We evaluated the survivorship of the device and variables that may be predictive of failure at a minimum of 5-year follow-up. A single-center, single-surgeon retrospective review was conducted in patients who received the DePuy Synthes ASR™ XL Acetabular hip system from December 2005 to November 2009. Mean values and percentages were calculated and compared using the Fisher’s exact test, simple logistic regression, and Student’s t-test. The significance level was P ≤ .05. This study included 29 patients (24 males, 5 females) with 32 ASR™ XL acetabular hip systems. Mean age and body mass index (BMI) reached 55.2 years and 28.9 kg/m2, respectively. Mean postoperative follow-up was 6.2 years. A total of 2 patients (6.9%) died of an unrelated cause and 1 patient was lost to follow-up (3.4%), leaving 26 patients with 28 hip replacements, all of whom were available for follow-up. The 5-year revision rate was 34.4% (10 patients with 11 hip replacements). Mean time to revision was 3.1 years. Age (P = .76), gender (P = .49), BMI (P = .29), acetabular component abduction angle (P = .12), and acetabulum size (P = .59) were not associated with the increased rate for hip failure. Blood cobalt (7.6 vs 6.8 µg/L, P = .58) and chromium (5.0 vs 2.2 µg/L, P = .31) levels were not significantly higher in the revised group when compared with those of the unrevised group. In the revised group, a 91% decrease in cobalt and 78% decrease in chromium levels were observed at a mean of 6 months following the revision. This study demonstrates a high rate of failure of ASR acetabular components used in total hip arthroplasty at a minimum of 5 years of follow-up. No variable that was predictive of failure could be identified in this series. Close clinical surveillance of these patients is required.
Continue to: Metal-on-metal...
Metal-on-metal (MoM) articulations have been widely explored as an alternative to polyethylene bearings in total hip arthroplasty (THA), with proposed benefits including improved range of motion, lower dislocation rates, and enhanced durability.1 Comprising cobalt and chromium, these MoM bearings gained widespread popularity in the United States, particularly in younger and more active patients looking for longer lasting devices.
The articular surface replacement (ASR) acetabular system (DePuy Synthes) was approved for sale by the US Food and Drug Administration in 2003 and implanted in an estimated 93,000 cases.2 Since then, however, the early failure rate of the prosthesis has been well documented,3-5 leading to a formal global product recall in August 2010. The Australian Orthopaedic Association National Joint Replacement Registry (AOANJRR) was amongst the first to report a 6.4% rate of failure of the device at 3 years when inserted with a Corail stem.6 An acceptable upper rate of hip prosthesis failure is considered to reach 1% per year, with the majority of implants reporting well below this value. A 10.9% failure rate at 5 years was documented when the prosthesis was inserted for resurfacing. The National Joint Registry of England and Wales confirmed these findings and observed a 13% and 12% rate of failure at 5 years for the acetabular and resurfacing systems, respectively.2 With the notable failure of the ASR system, this study reports our single-center 5-year survivorship experience and evaluates any variable that might be predictive of an early failure to aid in patient counseling.
METHODS
A single-center, single-surgeon, retrospective review of a consecutive series of patients was performed from December 2005 to November 2009. This study included all patients who underwent a primary THA with a DePuy Synthes ASR™ XL Acetabular hip system. No patients were excluded. Institutional Review Board approval was obtained. Patient demographics comprising of age, gender, and body mass index (BMI) were recorded. The primary endpoint of this study was 5-year survivorship rates. Secondary endpoints included duration to revision surgery, blood cobalt and chromium levels, time interval of blood ion tests, acetabulum size, acetabular component abduction angle, and duration to follow-up.
Candidates for the ASR™ XL Acetabular hip system included young patients and/or those considered to be physically active. In a select few, ASR devices were implanted upon patient request.
All patients underwent primary total hip replacement with a DePuy Synthes ASR™ XL uncemented acetabular component and an uncemented femoral stem (DePuy Synthes, Summit, or Tri-Lock) inserted via a standard posterior approach (Figure 1). Acetabulum sizes ranged from 52 mm to 68 mm in diameter.
All patients were followed-up yearly in the outpatient setting. Routine (yearly) metal-ion level sampling (whole blood) was started in 2010 for all patients. Laboratory tests were conducted at a single laboratory (Lab Corp.). Abduction cup inclination angles were measured by the providing surgeon using digital radiology software (GE Centricity systems).
The Student’s t-test was used to compare mean values (such as age, BMI, and metal ion levels) between the failure and no-failure groups. The 2-sided Fisher’s exact test analyzed differences in gender. Simple logistic regression analyzed variables associated with the failure group. Significance was P ≤ .05.
Continue to: Results...
RESULTS
A total of 29 patients (24 males, 5 females) with 32 ASR hip replacements were included in this study. Indications for surgery comprised osteoarthritis (28 hips, 87.5%) and avascular necrosis of the hip (4 hips, 12.5%). Mean age and BMI were 55.2 years and 28.9 kg/m2, respectively. A total of 2 patients (6.9%) died of an unrelated cause (1 myocardial infarct, 1 suicide), and 1 patient was lost to follow-up (3.4%), leaving 26 patients with 28 hip replacements, all of whom finished a 5-year minimum follow-up.
No implant failures were noted in the first year. The 5-year revision rate reached 34.4% (10 patients with 11 hip replacements). Mean time to revision for this subgroup was 3.1 years. Overall, an implant failure was observed in 37.5% of patients (11 patients with 12 hip replacements) at a mean postoperative follow-up of 6.2 years (Figure 2). Indications for implant revision were pain in 11 (92.7%) cases and infection in 1 (8.3%).
Of the 11 hips revised due to pain, 9 were performed by the original surgeon (8 were completed with primary acetabular components, 1 with a revision shell). Figure 3 shows a bilateral revision performed with primary acetabular components and retained DePuy Synthes Pinnacle femoral stems. In all these cases except 1, the ASR component was grossly loose. One case presented with pseudotumor and impingement between the femoral prosthetic neck and acetabular component after migration of a loose component. After revision, the patient returned with substantial anterior hip pain and heterotopic ossification, and failed conservative treatment, requiring another surgery with prosthesis retention, removal of heterotopic ossification, and iliopsoas lengthening. The surgery successfully relieved the symptoms. No other patients required additional surgery after their revision. In comparison to the original ASR component, the revision shell was 2 to 4 mm larger in diameter. No patient required component revision at a mean of 2.9 years after the revision surgery.
The patient with secondary revision developed a hematogenous streptococcal infection after a dental procedure performed without prophylactic antibiotics. The patient was initially lost to follow-up after the primary surgery and reported no antecedent pain prior to the revision. A substantial metal fluid collection was identified in the hip at the time of débridement and without component loosening. After débridement, the patient developed persistent metal stained wound drainage, necessitating ultimate successful treatment with a 2-stage exchange procedure.
Age (P = .76), gender (P = .49), BMI (P = .29), acetabular component abduction angle (P = .12), and acetabulum size (P = .59) were not associated with an increased rate for hip failure (Table). Blood cobalt (7.6 vs 6.8 µg/L, P = .58) and chromium (5.0 vs 2.2 µg/L, P = .31) levels were not significantly higher in the revised group when compared with those of the unrevised group. The upper limits of blood cobalt and chromium levels reached 18.9 and 15.9 µg/L for the revised group and 16.8 and 5.4 µg/L for the non-revised group, respectively. In the revised group, a 91% decrease in cobalt and 78% decrease in chromium levels were observed at a mean of 6 months after the revision (Figure 4).
Table. Variables Not Associated with Early ASR Failure
|
| No Failure (n = 20) | Failure (n = 12) | P value |
Age (years) | 55.4 ± 6.4 | 54.7 ± 6.3 | .76 | |
BMI (kg/m2) | 29.7 ± 6.7 | 27.4 ± 4.0 | .29 | |
Gender | .49 | |||
Female | 3 (15%) | 3 (25%) | ||
Male | 17 (85%) | 9 (75%) | ||
Acetabulum size (mm) | 59.1 ± 3.9 | 58.3 ± 3.8 | .59 | |
Abduction angle (degrees) | 44.9 ± 4.5 | 42.3 ± 3.8 | .12 | |
Serum levels (µg/L) | ||||
Cobalt | 6.8 ± 6.0 | 7.6 ± 4.7 | .58 | |
| Chromium | 2.2 ± 1.7 | 5.0 ± 5.0 | .31 |
Continue to: Discussion...
DISCUSSION
According to the Center for Disease Control and Prevention, 310,800 total hip replacements were performed among inpatients aged 45 years and older in the US in 2010.7 Specifically, in the 55- to 64-year-old age group, the number of procedures performed tripled from 2000 through 2010. As younger and more active patients opt for hip replacements, a growing need for prosthesis with enhanced durability is observed.
Despite the early proposed advantages of large head MoM bearings, our retrospective study of the DePuy Synthes ASR™ XL Acetabular hip system yielded 15.6% and 34.4% failure rates at 3 and 5 years, respectively. These higher-than-expected rates of failure are consistent with published data. The British Hip Society reported a 21% to 35% revision rate at 4 years and 49% at 6 years for the ASR XL prosthesis.8 In comparison, other MoM prosthesis, on average, report a 12% to 15% rate of failure at 5 years.
Considerable controversy surrounds the causes of adverse wear failure in MoM bearings.9,10 The non-modular design of the ASR prostheses is frequently implicated as a cause of early failure. The lack of a central hole in the 1-piece component compromises the tactile feel of insertion, thereby reducing the surgeon’s ability to assess complete seating.11 This condition may potentially increase the abduction angle at the time of insertion. Screw fixation of the non-modular device is not possible. The ASR XL device (148° to 160°) is less than a hemisphere (180°) in size and hence features a diminished functional articular surface, further compromising implant fixation.11 The functional articular surface is defined as the optimal surface area (10 mm) needed for a MoM implant.12 Griffin and colleagues13 reported a 48 mm ASR XL component, when implanted at 45° of abduction, to function similar to an implant at 59° of abduction, leading to diminished lubrication, metallosis, and edge loading. The version of the acetabular component may similarly and adversely affect implant wear characteristics. Furthermore, the variable thickness of the implant, which is thicker at the dome and thinner at the rim, may further promote edge loading by shifting the center of rotation of the femoral head out from the center of the acetabular prosthesis.11 Studies have also shown that increased wear of the MoM articulation is associated with an acetabular component inclination angle in excess of 55°10,14 and a failure of fixation at time of implantation.15 This study, however, found no correlation between the abduction angle and risk of early implant failure for the ASR acetabular component. No correlation was also detected between the acetabulum size and revision surgery.
The AOANJRR reported loosening (44%), infection (20%), metal sensitivity (12%), fracture (9%), and dislocation of prosthesis (7%) as the indications for revision surgery for the ASR prosthesis.6 Furthermore, a single-center retrospective review of 70 consecutive MoM THAs with ultra-large diameter femoral head and monoblock acetabular components showed that 17.1% required revision within 3 years for loosening, pain, and squeaking.1 Overall, 28.6% of patients reported implant dysfunction. In this study, we observed a similar rate of failure at 3 years (15.6%) for pain (11) and infection (1). The revision surgery successfully relieved all of these symptoms. One patient presented with heterotopic ossification and anterior hip pain after the original revision and required additional surgery with prosthesis retention. No patient in this series required repeat component revisions at a mean of 2.9 years after surgery. In all but 1 case, primary acetabular components were used in the revision, and in all cases except that with infection, the femoral component was retained. Replacement shells were 2 to 4 mm larger in diameter than the original ASR component.
Recently, concerns have arisen regarding the long-term effects of serum cobalt and chromium metal ions levels. Studies have shown increased serum metal ion levels,15 groin pain,16 pseudotumor formation,17 and metallosis18 after the implantation of MoM bearings. In a case study by Mao and colleagues,19 1 patient reported headaches, anorexia, continuous metallic taste in her mouth, and weight loss. A cerebrospinal fluid analysis revealed cobalt and chromium levels at 9 and 13 nmol/L, respectively, indicating that these metal ions can cross the blood-brain barrier. Another patient reported painful muscle fatigue, night cramps, fainting spells, cognitive decline, and an inability to climb stairs. His serum cobalt level reached 258 nmol/L (reference range, 0-20 nmol/L), and chromium level totaled 88 nmol/L (reference range, 0-100 nmol/L). At 8-week follow-up after revision surgery, the symptoms of the patient had resolved, with serum cobalt levels dropping to 42 nmol/L.19 None of the patients in this study presented with any signs or symptoms of metal toxicity. The upper limits of blood cobalt and chromium levels in our study population reached 18.9 and 15.9 µg/L for the revised group and 16.8 and 5.4 µg/L for the non-revised group, respectively. However, we noted a similar drop in post-revision blood cobalt (91% decrease) and chromium (78% decrease) levels.
In summary, our data showed a high revision rate of the DePuy Synthes ASR™ XL Acetabular hip system. Our findings are consistent with internationally published data. In the absence of reliable predictors of early failure, continued close clinical surveillance and laboratory monitoring of these patients are warranted.
CONCLUSION
This study demonstrates the high failure rate of the DePuy Synthes ASR™ XL Acetabular hip system used in THA at a minimum of 5 years of follow-up. No variable that was predictive of failure could be identified in this series. Close clinical surveillance of these patients is therefore required. Metal levels dropped quickly after revision, and the revision surgery can generally be performed with slightly larger primary components. Symptomatic patients with ASR hip replacements, regardless of blood metal-ion levels, were candidates for the revision surgery. Not all failed hips exhibited substantially elevated metal levels. Asymptomatic patients with high blood metal-ion levels should be closely followed-up and revision surgery should be strongly considered, consistent with recently published guidelines.20
- Bernthal NM, Celestre PC, Stavrakis AI, Ludington JC, Oakes DA. Disappointing short-term results with the DePuy ASR XL metal-on-metal total hip arthroplasty. J Arthroplasty. 2012;27(4):539. doi:10.1016/j.arth.2011.08.022.
- de Steiger RN, Hang JR, Miller LN, Graves SE, Davidson DC. Five-year results of the ASR XL acetabular system and the ASR hip resurfacing system: An analysis from the Australian Orthopaedic Association National Joint Replacement Registry. J Bone Joint Surg Am. 2011;93(24):2287. doi:10.2106/JBJS.J.01727.
- Langton DJ, Jameson SS, Joyce TJ, Hallab NJ, Natu S, Nargol AV. Early failure of metal-on-metal bearings in hip resurfacing and large-diameter total hip replacement: a consequence of excess wear. J Bone Joint Surg Br. 2010;92(1):38-46. doi:10.1302/0301-620X.92B1.22770.
- Siebel T, Maubach S, Morlock MM. Lessons learned from early clinical experience and results of 300 ASR hip resurfacing implantations. Proc Inst Mech Eng H. 2006;220(2):345-353. doi:10.1243/095441105X69079.
- Jameson SS, Langton DJ, Nargol AV. Articular surface replacement of the hip: a prospective single-surgeon series. J Bone Joint Surg Br. 2010;92(1):28-37. doi:10.1302/0301-620X.92B1.22769.
- Australian Orthopaedic Association National Joint Replacement Registry annual report 2010. Australian Orthopaedic Association Web site. https://aoanjrr.sahmri.com/annual-reports-2010. Accessed June 19, 2018.
- Wolford ML, Palso K, Bercovitz A. Hospitalization for total hip replacement among inpatients aged 45 and over: United States, 2000-2010. Centers for Disease Control and Prevention Web site. http://www.cdc.gov/nchs/data/databriefs/db186.pdf. Accessed July 13, 2015.
- Hodgkinson J, Skinner J, Kay P. Large diameter metal on metal bearing total hip replacements. British Hip Society Web site. https://www.britishhipsociety.com/uploaded/BHS_MOM_THR.pdf. Accessed August 6, 2015.
- Hart AJ, Ilo K, Underwood R, et al. The relationship between the angle of version and rate of wear of retrieved metal-on-metal resurfacings: a prospective, CT-based study. J Bone Joint Surg Br. 2011;93(3):315-320. doi:10.1302/0301-620X.93B3.25545.
- Langton DJ, Joyce TJ, Jameson SS, et al. Adverse reaction to metal debris following hip resurfacing: the influence of component type, orientation and volumetric wear. J Bone Joint Surg Br. 2011;93(2):164-171. doi:10.1302/0301-620X.93B2.25099.
- Steele GD, Fehring TK, Odum SM, Dennos AC, Nadaud MC. Early failure of articular surface replacement XL total hip arthroplasty. J Arthroplasty. 2011;26(6):14-18. doi:10.1016/j.arth.2011.03.027.
- De Haan R, Campbell PA, Su EP, De Smet KA. Revision of metal-on-metal resurfacing arthroplasty of the hip: the influence of malpositioning of the components. J Bone Joint Surg Br. 2008;90(9):1158-1163. doi:10.1302/0301-620X.90B9.19891.
- Griffin WL, Nanson CJ, Springer BD, Davies MA, Fehring TK. Reduced articular surface of one-piece cups: a cause of runaway wear and early failure. Clin Orthop Relat Res. 2010;468(9):2328-2332. doi:10.1007/s11999-010-1383-8.
- Grammatopolous G, Pandit H, Glyn-Jones S, et al. Optimal acetablular orientation for hip resurfacing. J Bone Joint Surg Br. 2010;92(8):1072-1078. doi:10.1302/0301-620X.92B8.24194.
- MacDonalad SJ, McCalden RW, Chess DG, et al. Meta-onmetal versus polyethylene in hip arthoplasty: a randomized clinical trial. Clin Orthop Relat Res. 2003;(406):282-296.
- Bin Nasser A, Beaule PE, O'Neill M, Kim PR, Fazekas A. Incidence of groin pain after metal-on-metal hip resurfacing. Clin Orthop Relat Res. 2010;468(2):392-399. doi:10.1007/s11999-009-1133-y.
- Mahendra G, Pandit H, Kliskey K, Murray D, Gill HS, Athanasou N. Necrotic and inflammatory changes in metal-on-metal resurfacing hip arthroplasties. Acta Orthop. 2009;80(6):653-659. doi:10.3109/17453670903473016.
- Neumann DRP, Thaler C, Hitzl W, Huber M, Hofstädter T, Dorn U. Long term results of a contemporary metal-on-metal total hip arthroplasty. J Arthroplasty. 2010;25(5):700-708. doi:10.1016/j.arth.2009.05.018.
- Mao X, Wong AA, Crawford RW. Cobalt toxicity--an emerging clinical problem in patients with metal-on-metal hip prostheses? Med J Aust. 2011;194(12):649-651.
- Information statement: current concerns with metal-on-metal hip arthroplasty. American Academy of Orthopaedic Surgeons Web site. https://aaos.org/uploadedFiles/PreProduction/About/Opinion_Statements/advistmt/1035%20Current%20Concerns%20with%20Metal-on-Metal%20Hip%20Arthroplasty.pdf. Accessed June 19, 2018.
TAKE-HOME POINTS
- High rate of failure of DePuy Synthes ASR™ XL Acetabular hip system used in THA, approaching 34.4% at 5 years.
- Mean time to revision was 3.1 years with pain being the most common indication for revision surgery.
- Age, gender, acetabular component abduction angle, acetabular size, and serum cobalt or chromium levels were not associated with increased rate of failure.
- Serum cobalt and chromium levels decreased significantly within 6 months of revision surgery.
- Close clinical surveillance and laboratory monitoring of patients is required.
Free Composite Serratus Anterior-Latissimus-Rib Flaps for Acute One-Stage Reconstruction of Gustilo IIIB Tibia Fractures
ABSTRACT
Gustilo IIIB injuries of the tibia with segmental bone loss continue to be a difficult reconstructive problem. The serratus anterior-latissimus-rib (SALR) composite flap consists of bone and muscle; this flap can provide soft tissue coverage and vascularized bone in a single surgical procedure. The purpose of this study is to describe the use of the SALR flap for the treatment of a large open tibia fracture with segmental bone loss, with a specific focus on postoperative complications, limb salvage, and time to union.
We reviewed the medical records of patients undergoing an SALR flap (n = 5) for the treatment of Gustilo Type IIIB tibia fractures within 1 month of injury. We compared the mechanism of injury, injury severity score, time from injury to free tissue transfer, complications, and time to radiographic and clinical union.
All patients were male, with a mean age of 25 years. On average, patients underwent free tissue transfer within 1 week of injury. The average time to radiographic union was 7 months. Two patients underwent reoperation. There were no graft failures.
Free SALR flaps can be a useful option for the treatment of high-energy tibia fractures with extensive soft tissue and bone loss. These flaps provide immediate osseous and soft tissue reconstruction with an acceptable complication profile.
Reconstruction of the lower extremity following Gustilo’s grade IIIB injuries is difficult due to loss of both combined soft tissue and segmental bone loss. Since these injuries necessitate the need for soft tissue flap coverage along with vascularized bone grafting, free fibula flaps have classically been used for reconstruction.1-3 In the setting of bilateral lower extremity injury, the contralateral fibula is often not appropriate to harvest and transfer; therefore, other sources of vascularized bone grafts must be utilized including vascularized iliac crest and rib.1-5 The vascularized iliac crest graft is insufficient to provide the bony reconstruction of bone defects >6 cm to 7 cm and does not have a reliable skin paddle.4 In contrast, free composite serratus anterior-latissimus-rib (SALR) flaps can provide both long segments of vascularized bone and abundant soft tissue coverage for large segmental defects.1-5
Continue to: Free fibula grafts have been considered...
Free fibula grafts have been considered the gold standard for the reconstruction of large (>6 cm) bone defects.6 In cases of “mangled extremities,” bone defects are associated with large soft tissue defects, which require either single-stage surgery consisting of 2 separate free flaps (ie, free fibula and free latissimus) or a 2-stage procedure where the soft tissue reconstruction precedes the bone reconstruction.2,7-9 Unlike free fibula and latissimus flaps, composite SALR flaps provide both osseous reconstruction and soft tissue in 1 flap supplied by a single vascular pedicle; unfortunately, outcomes using this flap for large Gustilo IIIB injuries are limited.1-5 The purpose of this study is to examine the use of free composite SALR flaps for soft tissue coverage in cases of Gustilo IIIB injuries with large soft tissue and bony deficits. This study specifically examines time to union, need for reoperation, and graft failure following the use of these flaps.
MATERIALS AND METHODS
Following approval from our Institutional Review Board, we retrospectively reviewed the medical records of patients undergoing a free composite SALR flap (n = 5) for the treatment of a severe open tibia fracture within 1 month of injury. All patients sustained open injuries classified as IIIB on the Gustilo-Anderson scale.10 Medical records were examined for the mechanism of injury (MOI), injury severity score (ISS), time from injury to free tissue transfer, medical comorbidities, surgical complications, and time to radiographic and clinical union. Radiographic union was determined by the presence of bridging bone on 3 of 4 of cortices on plain film radiographs.
All patients were male (n = 5), with a mean age of 25 years (range, 19-30 years) at the time of injury (Table).
Table. Demographics and Outcomes of Patients Undergoing Free Tissue Transfer
| Free Serratus Anterior-Latissimus-Rib Flaps |
Age (Mean ± SEM) | 23 ± 2 years |
Males | 5 |
Females | 0 |
Tobacco Use | 2 |
Body Mass Index (Mean ± SEM) | 26.2 ± 0.9 kg/m2 |
Injury Severity Score (Mean ± SEM) | 18 ± 5 |
Time to Tissue Transfer (Mean ± SEM) | 1 ± 0.3 weeks |
Time to Boney Union (Mean ± SEM) | 7 ± 0.7 months |
Time Non-Weight-Bearing (Mean ± SEM) | 5 ± 0.5 months |
The MOI included motorcycle collisions (n = 2), pedestrian struck by car (n = 1), motor vehicle collisions (n = 1), and direct blow to the leg (n = 1). The mean ISS of the cohort was 18 (range, 10-34) (Table). On average, patients underwent free tissue transfer within 1 week (range, 3 days to 2 weeks) from the time of injury. Patients in this cohort were followed clinically for a mean of 4 years (range, 1-6 years) after surgery. Patients were non-weight-bearing for an average of 5 months (range, 4-6 months) following their reconstructions.
RESULTS
All flaps survived. The mean time to radiographic and clinical union was 7 months (range, 6-9 months). Two patients underwent reoperation. One patient underwent a bone grafting procedure for a delayed union at 6 months postoperative, and 1 patient underwent irrigation and débridement of superficial soft tissue infection. Donor site complications occurred in 2 patients, including chronic rib pain (n = 1) and a pleural effusion requiring drainage (n = 1). At the last follow-up, all ribs had incorporated, and all patients were weight-bearing as tolerated on the limb.
CASE EXAMPLE
A 22-year-old male smoker was transferred to our facility after a motor vehicle accident with bilateral tibia fractures, 1 closed and 1 open with significant bone loss (Figures 1A, 1B). 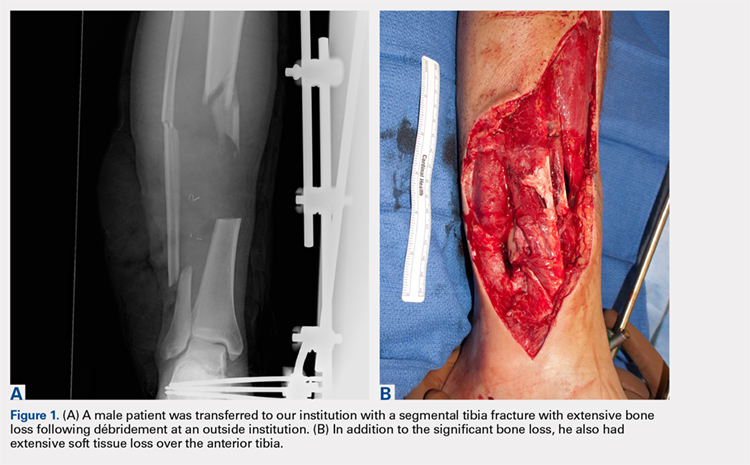
Continue to: Surgical Technique...
SURGICAL TECHNIQUE
The patient is placed in the lateral decubitus position during the procedure. A 2-team approach is used for dissection of the flap and preparation of recipient vessels to decrease operative time. A J-shaped incision is started on the chest at the mid-axillary line and extended just over the fifth and sixth rib. The incision can be made to fall into the intermammary crease in a woman to hide the scar. The dissection begins by exposing the anterior border of the latissimus muscle (Figure 2A). Next, the latissimus is dissected to reveal the thoracodorsal vessels (Figure 2B). At this level, the thoracodorsal vessel can be traced into the axilla. The branch going into the fifth, sixth, and lower slips of the serratus are dissected. The long thoracic nerve and the thoracodorsal nerve are preserved during the dissection (Figure 2C). The fifth, sixth, and seventh slips of the serratus are preferentially included in the dissection while leaving the most superior slips of the serratus to preserve scapular stability. Dissection begins by identifying 2 adjacent rib sections of the fifth and sixth or sixth and seventh ribs. The defect in the lower extremity determines the length of rib harvested. The serratus slips are then divided anteriorly over the chest wall. The dissection is extended to the intercostal spaces of the fourth and fifth ribs. The supraperiosteal dissection is performed at the anterior margin of the rib (Figure 2D). 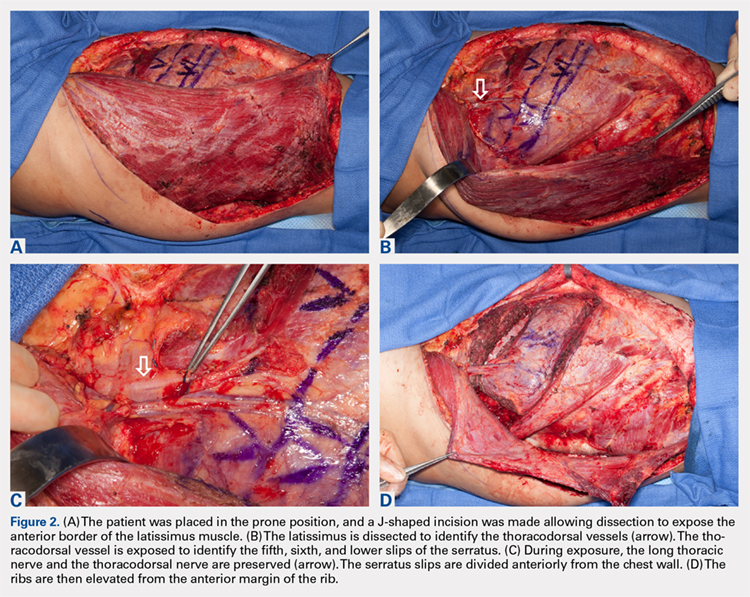

Continue to: Following the surgical procedure...
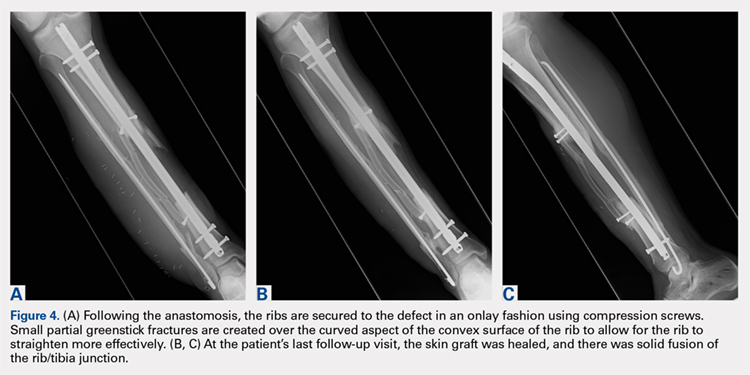
Following the surgical procedure, patients are made non-weight-bearing on the operative extremity until signs of healing are apparent on radiographs. In this case, at the patients’ last follow-up visit, the skin graft was healed, and there was solid fusion of the rib/tibia junction (Figures 4B, 4C).
DISCUSSION
High-energy open injuries to the lower extremities are devastating injuries, with a high rate of late amputation and poor functional outcomes.11-13 Vascularized bone grafting provides both essential osteoinductive and osteoconductive properties to segmental bone defects in areas with inadequate soft tissue coverage, particularly in the setting of >6 cm of bone loss.4,14 The results of this study show that acute reconstruction of the lower limb with a composite vascularized SALR graft is a reliable procedure with an acceptable complication profile.
The timing of soft tissue coverage should be performed as soon as the patient is medically stable enough to undergo a reconstructive procedure, ideally within 7 to 10 days; and this timetable has been shown to decrease rates of infection and free flap failure.15-19 Early coverage provides both control of the soft-tissue envelope and reduces the risk of losing bone.1 Unlike the timing of coverage, the staging of the procedure is controversial. Proponents of the 2-stage free tissue (soft tissue followed by bony flap) transfer feel that although the tissue may not be infected at the time of coverage, it is contaminated with bacteria at the time of bone reconstruction, and as such is at high risk for both infection and complications.20 Unlike 2-stage procedures, single-stage coverage provides immediate soft tissue coverage, as well as bony support. This reduces the time to bony union and negates the need for repeated surgery in a mangled extremity where secondary surgery is complicated by both scar tissue and altered anatomy.1,2 Furthermore, it has been shown that there is no difference in the rates of infection when performing a single-stage compared with a 2-stage procedure.9 In this study, SALR flaps were typically performed within 2 weeks following an injury as a single procedure. We feel this resulted in the low number of complications in the SALR group.
Unlike free fibulas, rib flaps are easily pedicled with an associated soft-tissue flap due to their blood supply, making them ideal for 1-stage reconstruction. The rib has a dual blood supply: 1 from the posterior intercostal artery, and the other, an abundant periosteal blood supply, from the serratus anterior muscle.4 The blood supply to the serratus anterior comes from the thoracodorsal artery, and usually provides 14 cm of a large-caliber pedicle, making it a reliable flap for soft tissue reconstruction.21,22 Another unique feature of the blood supply to this flap is the amount of soft tissue available for both harvest and transfer; larger portions of serratus muscle and latissimus muscle can be harvested if necessary to cover the soft tissue defect.4
Comminuted tibias with segmental bone loss are difficult to manage since they are associated with bony as well as soft tissue defects.1,12,13,23 These injuries are ideal candidates for a single-stage reconstruction using a vascularized SALR flap. In our series, the use of an SALR flap resulted ultimately in a 100% union and limb salvage rate, with no flap failures and a low complication profile. Unlike the SALR, free fibular flaps must be transferred along with a separate latissimus dorsi flap to provide enough soft tissue coverage necessary for reconstructing large Gustilo IIIB injuries, which could increase the risk of flap failure. Since ribs are composed of membranous bone and have a similar cross-sectional area to both metacarpal and metatarsals, there are concerns regarding the biomechanical properties of ribs for weight-bearing.4,22,24-26 To compensate for this relatively small cross-sectional area, 2 ribs (either consecutive or alternative) are frequently harvested.1,4,5,23 Previous studies examining the use of ribs for bony reconstruction have frequently supplemented the rib reconstruction to the tibia using screws and external fixation alone.1,4,5,23 In our series, all SALR grafts were supported with the use of an intramedullary nail (n = 3) or locked plating (n = 1). The use of this supplemental fixation of the SALR graft allowed our patients to return to full weight-bearing (mean, 6 months) much earlier than the length of time cited in previous reports (12 months) examining these injuries.1,4,5,23
Continue to: There are several limitations...
There are several limitations to this study. The small sample size and retrospective nature of the study limits the amount of data we are able to collect from the medical record and places obvious constraints on the analysis. Although all these procedures were performed at 1 institution, multiple providers were involved in the reconstruction of these injuries, and there is no standard protocol for their treatment. Similarly, although other forms of extremity reconstruction were used during this time period, there was no standard protocol that could serve as a comparator for patients who underwent an SALR compared with other reconstructive procedures.
Overall, SALR grafts provide an excellent option for 1-stage reconstruction of severe, open lower extremity injuries. In this series we noted a 100% graft success rate with an acceptable complication profile.
This paper will be judged for the Resident Writer’s Award.
1. Yazar S, Lin CH, Wei FC. One-stage reconstruction of composite bone and soft-tissue defects in traumatic lower extremities. Plast Reconstr Surg. 2004;114(6):1457-1466. doi:10.1097/01.PRS.0000138811.88807.65.
2. Lin CH, Wei FC, Chen HC, Chuang DC. Outcome comparison in traumatic lower-extremity reconstruction by using various composite vascularized bone transplantation. Plast Reconstr Surg. 1999;104(4):984-992. doi:10.1097/00006534-199909040-00013.
3. Tu YK, Yen CY, Yeh WL, Wang IC, Wang KC, Ueng SW. Reconstruction of posttraumatic long bone defect with free vascularized bone graft: good outcome in 48 patients with 6 years' follow-up. Acta Orthopaedica Scandinavica. 2001;72(4):359-364. doi:10.1080/000164701753542014.
4. Lin CH, Wei FC, Levin LS, Su JI, Fan KF, Yeh WL, Hsu DT. Free composite serratus anterior and rib flaps for tibial composite bone and soft-tissue defect. Plast Reconstr Surg. 1997;99(6):1656-1665. Doi:10.1097/00006534-199705000-00028.
5. Georgescu AV, Ignatiadis I, Ileana M, Irina C, Filip A, Olariu R. Long-term results after muscle-rib flap transfer for reconstruction of composite limb defects. Microsurgery. 2011;31(3):218-222. doi:10.1002/micr.20857.
6. Moran CG, Wood MB. Vascularized bone autografts. Orthop Rev. 1993;22(2):187-197. doi:10.1097/01241398-199307000-00031.
7. Banic A, Hertel R. Double vascularized fibulas for reconstruction of large tibial defects. J Reconstr Microsurg. 1993;9(6):421-428. doi:10.1055/s-2007-1006751.
8. Malizos KN, Nunley JA, Goldner RD, Urbaniak JR, Harrelson JM. Free vascularized fibula in traumatic long bone defects and in limb salvaging following tumor resection: comparative study. Microsurgery. 1993;14(6):368-374. doi:10.1002/micr.1920140603.
9. Peat BG, Liggins DF. Microvascular soft tissue reconstruction for acute tibial fractures--late complications and the role of bone grafting. Ann Plast Surg. 1990;24(6):517-520.
10. Gustilo RB, Anderson JT. Prevention of infection in the treatment of one thousand and twenty-five open fractures of long bones: retrospective and prospective analyses. J Bone Joint Surg Am. 1976;58(4):453-458.
11. Gustilo RB, Mendoza RM, Williams DN. Problems in the management of type III (severe) open fractures: a new classification of type III open fractures. J Trauma. 1984;24(8):742-746. doi:10.1097/00005373-198408000-00009.
12. Bosse MJ, MacKenzie EJ, Kellam JF, et al. An analysis of outcomes of reconstruction or amputation after leg-threatening injuries. NEJM. 2002;347(24):1924-1931. doi:10.1056/NEJMoa012604.
13. MacKenzie EJ, Bosse MJ, Pollak AN, et al. Long-term persistence of disability following severe lower-limb trauma. Results of a seven-year follow-up. J Bone Joint Surg Am. 2005;87(8):1801-1809. doi:10.2106/JBJS.E.00032.
14. Bieber EJ, Wood MB. Bone reconstruction. Clin Plast Surg. 1986;13(4):645-655.
15. Melvin JS, Dombroski DG, Torbert JT, Kovach SJ, Esterhai JL, Mehta S. Open tibial shaft fractures: II. Definitive management and limb salvage. J Am Acad Orthop Surg. 2010;18(2):108-117. doi:10.5435/00124635-201002000-00005.
16. Godina M. Early microsurgical reconstruction of complex trauma of the extremities. Plast Reconstr Surg. 1986;78(3):285-292. doi:10.1055/s-2006-944324.
17. Gopal S, Majumder S, Batchelor AG, Knight SL, De Boer P, Smith RM. Fix and flap: the radical orthopaedic and plastic treatment of severe open fractures of the tibia. J Bone Joint Surg Br. 2000;82(7):959-966. doi:10.1302/0301-620X.82B7.0820959.
18. Fischer MD, Gustilo RB, Varecka TF. The timing of flap coverage, bone-grafting, and intramedullary nailing in patients who have a fracture of the tibial shaft with extensive soft-tissue injury. J Bone Joint Surg Am. 1991;73(9):1316-1322. doi:10.2106/00004623-199173090-00005.
19. Tielinen L, Lindahl JE, Tukiainen EJ. Acute unreamed intramedullary nailing and soft tissue reconstruction with muscle flaps for the treatment of severe open tibial shaft fractures. Injury. 2007;38(8):906-912. doi:10.1016/j.injury.2007.02.052.
20. Yaremchuk MJ, Brumback RJ, Manson PN, Burgess AR, Poka A, Weiland AJ. Acute and definitive management of traumatic osteocutaneous defects of the lower extremity. Plast Reconstr Surg. 1987;80(1):1-14. doi:10.1097/00006534-198707000-00002.
21. Ueng WN, Chuang CC, Shih CH. Double-rib composite free transfer to reconstruct a single-spared lower extremity defect. J Trauma. 1995;38(2):210-212.
22. Bruck JC, Bier J, Kistler D. The serratus anterior osteocutaneous free flap. J Reconstr Microsurg. 1990;6(3):209-213. doi:10.1055/s-2007-1006820.
23. Lin CH, Yazar S. Revisiting the serratus anterior rib flap for composite tibial defects. Plast Reconstr Surg. 2004;114(7):1871-1877. doi:10.1097/01.PRS.0000142767.13493.63.
24. Hui KC, Zhang F, Lineaweaver WC, Moon W, Buncke GM, Buncke HJ. Serratus anterior-rib composite flap: anatomic studies and clinical application to hand reconstruction. Ann Plast Surg. 1999;42(2):132-136. doi:10.1097/00000637-199902000-00004.
25. Buncke HJ, Furnas DW, Gordon L, Achauer BM. Free osteocutaneous flap from a rib to the tibia. Plast Reconstr Surg. 1977;59(6):799-804. doi:10.1097/00006534-197706000-00002.
26. Nusbickel FR, Dell PC, Mcandrew MP, Moore MM. Vascularized autografts for reconstruction of skeletal defects following lower extremity trauma. A review. Clin Orthop Relat Res. 1989;(243):65-70.
ABSTRACT
Gustilo IIIB injuries of the tibia with segmental bone loss continue to be a difficult reconstructive problem. The serratus anterior-latissimus-rib (SALR) composite flap consists of bone and muscle; this flap can provide soft tissue coverage and vascularized bone in a single surgical procedure. The purpose of this study is to describe the use of the SALR flap for the treatment of a large open tibia fracture with segmental bone loss, with a specific focus on postoperative complications, limb salvage, and time to union.
We reviewed the medical records of patients undergoing an SALR flap (n = 5) for the treatment of Gustilo Type IIIB tibia fractures within 1 month of injury. We compared the mechanism of injury, injury severity score, time from injury to free tissue transfer, complications, and time to radiographic and clinical union.
All patients were male, with a mean age of 25 years. On average, patients underwent free tissue transfer within 1 week of injury. The average time to radiographic union was 7 months. Two patients underwent reoperation. There were no graft failures.
Free SALR flaps can be a useful option for the treatment of high-energy tibia fractures with extensive soft tissue and bone loss. These flaps provide immediate osseous and soft tissue reconstruction with an acceptable complication profile.
Reconstruction of the lower extremity following Gustilo’s grade IIIB injuries is difficult due to loss of both combined soft tissue and segmental bone loss. Since these injuries necessitate the need for soft tissue flap coverage along with vascularized bone grafting, free fibula flaps have classically been used for reconstruction.1-3 In the setting of bilateral lower extremity injury, the contralateral fibula is often not appropriate to harvest and transfer; therefore, other sources of vascularized bone grafts must be utilized including vascularized iliac crest and rib.1-5 The vascularized iliac crest graft is insufficient to provide the bony reconstruction of bone defects >6 cm to 7 cm and does not have a reliable skin paddle.4 In contrast, free composite serratus anterior-latissimus-rib (SALR) flaps can provide both long segments of vascularized bone and abundant soft tissue coverage for large segmental defects.1-5
Continue to: Free fibula grafts have been considered...
Free fibula grafts have been considered the gold standard for the reconstruction of large (>6 cm) bone defects.6 In cases of “mangled extremities,” bone defects are associated with large soft tissue defects, which require either single-stage surgery consisting of 2 separate free flaps (ie, free fibula and free latissimus) or a 2-stage procedure where the soft tissue reconstruction precedes the bone reconstruction.2,7-9 Unlike free fibula and latissimus flaps, composite SALR flaps provide both osseous reconstruction and soft tissue in 1 flap supplied by a single vascular pedicle; unfortunately, outcomes using this flap for large Gustilo IIIB injuries are limited.1-5 The purpose of this study is to examine the use of free composite SALR flaps for soft tissue coverage in cases of Gustilo IIIB injuries with large soft tissue and bony deficits. This study specifically examines time to union, need for reoperation, and graft failure following the use of these flaps.
MATERIALS AND METHODS
Following approval from our Institutional Review Board, we retrospectively reviewed the medical records of patients undergoing a free composite SALR flap (n = 5) for the treatment of a severe open tibia fracture within 1 month of injury. All patients sustained open injuries classified as IIIB on the Gustilo-Anderson scale.10 Medical records were examined for the mechanism of injury (MOI), injury severity score (ISS), time from injury to free tissue transfer, medical comorbidities, surgical complications, and time to radiographic and clinical union. Radiographic union was determined by the presence of bridging bone on 3 of 4 of cortices on plain film radiographs.
All patients were male (n = 5), with a mean age of 25 years (range, 19-30 years) at the time of injury (Table).
Table. Demographics and Outcomes of Patients Undergoing Free Tissue Transfer
| Free Serratus Anterior-Latissimus-Rib Flaps |
Age (Mean ± SEM) | 23 ± 2 years |
Males | 5 |
Females | 0 |
Tobacco Use | 2 |
Body Mass Index (Mean ± SEM) | 26.2 ± 0.9 kg/m2 |
Injury Severity Score (Mean ± SEM) | 18 ± 5 |
Time to Tissue Transfer (Mean ± SEM) | 1 ± 0.3 weeks |
Time to Boney Union (Mean ± SEM) | 7 ± 0.7 months |
Time Non-Weight-Bearing (Mean ± SEM) | 5 ± 0.5 months |
The MOI included motorcycle collisions (n = 2), pedestrian struck by car (n = 1), motor vehicle collisions (n = 1), and direct blow to the leg (n = 1). The mean ISS of the cohort was 18 (range, 10-34) (Table). On average, patients underwent free tissue transfer within 1 week (range, 3 days to 2 weeks) from the time of injury. Patients in this cohort were followed clinically for a mean of 4 years (range, 1-6 years) after surgery. Patients were non-weight-bearing for an average of 5 months (range, 4-6 months) following their reconstructions.
RESULTS
All flaps survived. The mean time to radiographic and clinical union was 7 months (range, 6-9 months). Two patients underwent reoperation. One patient underwent a bone grafting procedure for a delayed union at 6 months postoperative, and 1 patient underwent irrigation and débridement of superficial soft tissue infection. Donor site complications occurred in 2 patients, including chronic rib pain (n = 1) and a pleural effusion requiring drainage (n = 1). At the last follow-up, all ribs had incorporated, and all patients were weight-bearing as tolerated on the limb.
CASE EXAMPLE
A 22-year-old male smoker was transferred to our facility after a motor vehicle accident with bilateral tibia fractures, 1 closed and 1 open with significant bone loss (Figures 1A, 1B).
Continue to: Surgical Technique...
SURGICAL TECHNIQUE
The patient is placed in the lateral decubitus position during the procedure. A 2-team approach is used for dissection of the flap and preparation of recipient vessels to decrease operative time. A J-shaped incision is started on the chest at the mid-axillary line and extended just over the fifth and sixth rib. The incision can be made to fall into the intermammary crease in a woman to hide the scar. The dissection begins by exposing the anterior border of the latissimus muscle (Figure 2A). Next, the latissimus is dissected to reveal the thoracodorsal vessels (Figure 2B). At this level, the thoracodorsal vessel can be traced into the axilla. The branch going into the fifth, sixth, and lower slips of the serratus are dissected. The long thoracic nerve and the thoracodorsal nerve are preserved during the dissection (Figure 2C). The fifth, sixth, and seventh slips of the serratus are preferentially included in the dissection while leaving the most superior slips of the serratus to preserve scapular stability. Dissection begins by identifying 2 adjacent rib sections of the fifth and sixth or sixth and seventh ribs. The defect in the lower extremity determines the length of rib harvested. The serratus slips are then divided anteriorly over the chest wall. The dissection is extended to the intercostal spaces of the fourth and fifth ribs. The supraperiosteal dissection is performed at the anterior margin of the rib (Figure 2D).
Continue to: Following the surgical procedure...
Following the surgical procedure, patients are made non-weight-bearing on the operative extremity until signs of healing are apparent on radiographs. In this case, at the patients’ last follow-up visit, the skin graft was healed, and there was solid fusion of the rib/tibia junction (Figures 4B, 4C).
DISCUSSION
High-energy open injuries to the lower extremities are devastating injuries, with a high rate of late amputation and poor functional outcomes.11-13 Vascularized bone grafting provides both essential osteoinductive and osteoconductive properties to segmental bone defects in areas with inadequate soft tissue coverage, particularly in the setting of >6 cm of bone loss.4,14 The results of this study show that acute reconstruction of the lower limb with a composite vascularized SALR graft is a reliable procedure with an acceptable complication profile.
The timing of soft tissue coverage should be performed as soon as the patient is medically stable enough to undergo a reconstructive procedure, ideally within 7 to 10 days; and this timetable has been shown to decrease rates of infection and free flap failure.15-19 Early coverage provides both control of the soft-tissue envelope and reduces the risk of losing bone.1 Unlike the timing of coverage, the staging of the procedure is controversial. Proponents of the 2-stage free tissue (soft tissue followed by bony flap) transfer feel that although the tissue may not be infected at the time of coverage, it is contaminated with bacteria at the time of bone reconstruction, and as such is at high risk for both infection and complications.20 Unlike 2-stage procedures, single-stage coverage provides immediate soft tissue coverage, as well as bony support. This reduces the time to bony union and negates the need for repeated surgery in a mangled extremity where secondary surgery is complicated by both scar tissue and altered anatomy.1,2 Furthermore, it has been shown that there is no difference in the rates of infection when performing a single-stage compared with a 2-stage procedure.9 In this study, SALR flaps were typically performed within 2 weeks following an injury as a single procedure. We feel this resulted in the low number of complications in the SALR group.
Unlike free fibulas, rib flaps are easily pedicled with an associated soft-tissue flap due to their blood supply, making them ideal for 1-stage reconstruction. The rib has a dual blood supply: 1 from the posterior intercostal artery, and the other, an abundant periosteal blood supply, from the serratus anterior muscle.4 The blood supply to the serratus anterior comes from the thoracodorsal artery, and usually provides 14 cm of a large-caliber pedicle, making it a reliable flap for soft tissue reconstruction.21,22 Another unique feature of the blood supply to this flap is the amount of soft tissue available for both harvest and transfer; larger portions of serratus muscle and latissimus muscle can be harvested if necessary to cover the soft tissue defect.4
Comminuted tibias with segmental bone loss are difficult to manage since they are associated with bony as well as soft tissue defects.1,12,13,23 These injuries are ideal candidates for a single-stage reconstruction using a vascularized SALR flap. In our series, the use of an SALR flap resulted ultimately in a 100% union and limb salvage rate, with no flap failures and a low complication profile. Unlike the SALR, free fibular flaps must be transferred along with a separate latissimus dorsi flap to provide enough soft tissue coverage necessary for reconstructing large Gustilo IIIB injuries, which could increase the risk of flap failure. Since ribs are composed of membranous bone and have a similar cross-sectional area to both metacarpal and metatarsals, there are concerns regarding the biomechanical properties of ribs for weight-bearing.4,22,24-26 To compensate for this relatively small cross-sectional area, 2 ribs (either consecutive or alternative) are frequently harvested.1,4,5,23 Previous studies examining the use of ribs for bony reconstruction have frequently supplemented the rib reconstruction to the tibia using screws and external fixation alone.1,4,5,23 In our series, all SALR grafts were supported with the use of an intramedullary nail (n = 3) or locked plating (n = 1). The use of this supplemental fixation of the SALR graft allowed our patients to return to full weight-bearing (mean, 6 months) much earlier than the length of time cited in previous reports (12 months) examining these injuries.1,4,5,23
Continue to: There are several limitations...
There are several limitations to this study. The small sample size and retrospective nature of the study limits the amount of data we are able to collect from the medical record and places obvious constraints on the analysis. Although all these procedures were performed at 1 institution, multiple providers were involved in the reconstruction of these injuries, and there is no standard protocol for their treatment. Similarly, although other forms of extremity reconstruction were used during this time period, there was no standard protocol that could serve as a comparator for patients who underwent an SALR compared with other reconstructive procedures.
Overall, SALR grafts provide an excellent option for 1-stage reconstruction of severe, open lower extremity injuries. In this series we noted a 100% graft success rate with an acceptable complication profile.
This paper will be judged for the Resident Writer’s Award.
1. Yazar S, Lin CH, Wei FC. One-stage reconstruction of composite bone and soft-tissue defects in traumatic lower extremities. Plast Reconstr Surg. 2004;114(6):1457-1466. doi:10.1097/01.PRS.0000138811.88807.65.
2. Lin CH, Wei FC, Chen HC, Chuang DC. Outcome comparison in traumatic lower-extremity reconstruction by using various composite vascularized bone transplantation. Plast Reconstr Surg. 1999;104(4):984-992. doi:10.1097/00006534-199909040-00013.
3. Tu YK, Yen CY, Yeh WL, Wang IC, Wang KC, Ueng SW. Reconstruction of posttraumatic long bone defect with free vascularized bone graft: good outcome in 48 patients with 6 years' follow-up. Acta Orthopaedica Scandinavica. 2001;72(4):359-364. doi:10.1080/000164701753542014.
4. Lin CH, Wei FC, Levin LS, Su JI, Fan KF, Yeh WL, Hsu DT. Free composite serratus anterior and rib flaps for tibial composite bone and soft-tissue defect. Plast Reconstr Surg. 1997;99(6):1656-1665. Doi:10.1097/00006534-199705000-00028.
5. Georgescu AV, Ignatiadis I, Ileana M, Irina C, Filip A, Olariu R. Long-term results after muscle-rib flap transfer for reconstruction of composite limb defects. Microsurgery. 2011;31(3):218-222. doi:10.1002/micr.20857.
6. Moran CG, Wood MB. Vascularized bone autografts. Orthop Rev. 1993;22(2):187-197. doi:10.1097/01241398-199307000-00031.
7. Banic A, Hertel R. Double vascularized fibulas for reconstruction of large tibial defects. J Reconstr Microsurg. 1993;9(6):421-428. doi:10.1055/s-2007-1006751.
8. Malizos KN, Nunley JA, Goldner RD, Urbaniak JR, Harrelson JM. Free vascularized fibula in traumatic long bone defects and in limb salvaging following tumor resection: comparative study. Microsurgery. 1993;14(6):368-374. doi:10.1002/micr.1920140603.
9. Peat BG, Liggins DF. Microvascular soft tissue reconstruction for acute tibial fractures--late complications and the role of bone grafting. Ann Plast Surg. 1990;24(6):517-520.
10. Gustilo RB, Anderson JT. Prevention of infection in the treatment of one thousand and twenty-five open fractures of long bones: retrospective and prospective analyses. J Bone Joint Surg Am. 1976;58(4):453-458.
11. Gustilo RB, Mendoza RM, Williams DN. Problems in the management of type III (severe) open fractures: a new classification of type III open fractures. J Trauma. 1984;24(8):742-746. doi:10.1097/00005373-198408000-00009.
12. Bosse MJ, MacKenzie EJ, Kellam JF, et al. An analysis of outcomes of reconstruction or amputation after leg-threatening injuries. NEJM. 2002;347(24):1924-1931. doi:10.1056/NEJMoa012604.
13. MacKenzie EJ, Bosse MJ, Pollak AN, et al. Long-term persistence of disability following severe lower-limb trauma. Results of a seven-year follow-up. J Bone Joint Surg Am. 2005;87(8):1801-1809. doi:10.2106/JBJS.E.00032.
14. Bieber EJ, Wood MB. Bone reconstruction. Clin Plast Surg. 1986;13(4):645-655.
15. Melvin JS, Dombroski DG, Torbert JT, Kovach SJ, Esterhai JL, Mehta S. Open tibial shaft fractures: II. Definitive management and limb salvage. J Am Acad Orthop Surg. 2010;18(2):108-117. doi:10.5435/00124635-201002000-00005.
16. Godina M. Early microsurgical reconstruction of complex trauma of the extremities. Plast Reconstr Surg. 1986;78(3):285-292. doi:10.1055/s-2006-944324.
17. Gopal S, Majumder S, Batchelor AG, Knight SL, De Boer P, Smith RM. Fix and flap: the radical orthopaedic and plastic treatment of severe open fractures of the tibia. J Bone Joint Surg Br. 2000;82(7):959-966. doi:10.1302/0301-620X.82B7.0820959.
18. Fischer MD, Gustilo RB, Varecka TF. The timing of flap coverage, bone-grafting, and intramedullary nailing in patients who have a fracture of the tibial shaft with extensive soft-tissue injury. J Bone Joint Surg Am. 1991;73(9):1316-1322. doi:10.2106/00004623-199173090-00005.
19. Tielinen L, Lindahl JE, Tukiainen EJ. Acute unreamed intramedullary nailing and soft tissue reconstruction with muscle flaps for the treatment of severe open tibial shaft fractures. Injury. 2007;38(8):906-912. doi:10.1016/j.injury.2007.02.052.
20. Yaremchuk MJ, Brumback RJ, Manson PN, Burgess AR, Poka A, Weiland AJ. Acute and definitive management of traumatic osteocutaneous defects of the lower extremity. Plast Reconstr Surg. 1987;80(1):1-14. doi:10.1097/00006534-198707000-00002.
21. Ueng WN, Chuang CC, Shih CH. Double-rib composite free transfer to reconstruct a single-spared lower extremity defect. J Trauma. 1995;38(2):210-212.
22. Bruck JC, Bier J, Kistler D. The serratus anterior osteocutaneous free flap. J Reconstr Microsurg. 1990;6(3):209-213. doi:10.1055/s-2007-1006820.
23. Lin CH, Yazar S. Revisiting the serratus anterior rib flap for composite tibial defects. Plast Reconstr Surg. 2004;114(7):1871-1877. doi:10.1097/01.PRS.0000142767.13493.63.
24. Hui KC, Zhang F, Lineaweaver WC, Moon W, Buncke GM, Buncke HJ. Serratus anterior-rib composite flap: anatomic studies and clinical application to hand reconstruction. Ann Plast Surg. 1999;42(2):132-136. doi:10.1097/00000637-199902000-00004.
25. Buncke HJ, Furnas DW, Gordon L, Achauer BM. Free osteocutaneous flap from a rib to the tibia. Plast Reconstr Surg. 1977;59(6):799-804. doi:10.1097/00006534-197706000-00002.
26. Nusbickel FR, Dell PC, Mcandrew MP, Moore MM. Vascularized autografts for reconstruction of skeletal defects following lower extremity trauma. A review. Clin Orthop Relat Res. 1989;(243):65-70.
TAKE-HOME POINTS
- Gustilo IIIB injuries with segmental bone loss can be difficult to treat with conventional means.
- Vascularized bone grafts are beneficial for reconstructing bone defects >5 cm.
- The SALR composite flap consists of bone and muscle.
- This flap can provide soft tissue coverage and vascularized bone in a single surgical procedure.
- In this study, the use of the SALR composite flap was capable of healing large segmental bony defects at an average of 7 months.
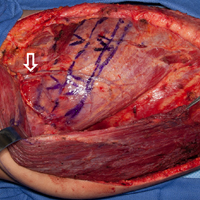
Shoulder Arthroplasty in Patients with Rheumatoid Arthritis: A Population-Based Study Examining Utilization, Adverse Events, Length of Stay, and Cost
ABSTRACT
It has been suggested that the utilization of joint arthroplasty in patients with rheumatoid arthritis (RA) is decreasing; however, this observation is largely based upon evidence pertaining to lower-extremity joint arthroplasty. It remains unknown if these observed trends also hold true for shoulder arthroplasty. The purpose of this study is to utilize a nationally representative population database in the US to identify trends in the utilization of shoulder arthroplasty among patients with RA. Secondarily, we sought to determine the rate of early adverse events, length of stay, and hospitalization costs associated with RA patients undergoing shoulder arthroplasty and to compare these outcomes to those of patients without a diagnosis of RA undergoing shoulder arthroplasty. Using a large population database in the US, we determined the annual rates of shoulder arthroplasty (overall and individual) in RA patients between 2002 and 2011. Early adverse events, length of stay, and hospitalization costs were determined and compared with those of non-RA patients undergoing shoulder arthroplasty. Overall, we identified 332,593 patients who underwent shoulder arthroplasty between 2002 and 2011, of whom 17,883 patients (5.4%) had a diagnosis of RA. Over the study period, there was a significant increase in the utilization of shoulder arthroplasty in RA patients, particularly total shoulder arthroplasty. Over the same period, there was a significant increase in the number of RA patients who underwent shoulder arthroplasty with a diagnosis of rotator cuff disease. There were no significant differences in adverse events or mean hospitalization costs between RA and non-RA patients. Non-RA patients had a significantly shorter length of stay; however, the difference did not appear to be clinically significant. In conclusion, the utilization of shoulder arthroplasty in patients with RA significantly increased from 2002 to 2011, which may partly reflect a trend toward management of rotator cuff disease with arthroplasty rather than repair.
Continue to: It has been suggested...
It has been suggested that the utilization of total joint arthroplasty (TJA) in patients with rheumatoid arthritis (RA) is decreasing over time;1 however, this observation is largely based upon evidence pertaining to lower extremity TJA.2 It remains unknown if these observed trends also hold true for shoulder arthroplasty, whereby the utilization of shoulder arthroplasty in RA patients is not limited to the management of end-stage inflammatory arthropathy. In this study, we used a nationally representative population database in the US to identify trends in the utilization of shoulder arthroplasty among patients with RA. As a secondary objective, we sought to determine the rate of early adverse events, length of stay, and hospitalization costs associated with RA patients undergoing shoulder arthroplasty and compare these outcomes to those of patients without a diagnosis of RA undergoing shoulder arthroplasty. We hypothesize that the utilization of shoulder arthroplasty in RA patients would be decreasing, but adverse events, length of stay, and hospitalization costs would not differ between patients with and without RA undergoing shoulder arthroplasty.
METHODS
We conducted a retrospective cohort study using the Healthcare Cost and Utilization Project (HCUP) Nationwide Inpatient Sample (NIS) from 2002 to 2011.3 The NIS comprises a 20% stratified sample of all hospital discharges in the US. The NIS includes information about patient characteristics (age, sex, insurance status, and medical comorbidities) and hospitalization outcomes (adverse events, costs, and length of stay). The NIS allows identification of hospitalizations according to procedures and diagnoses using International Classification of Diseases, Ninth Revision, Clinical Modification (ICD-9-CM) codes. Given the anonymity of this study, it was exempt from Institutional Review Board ethics approval.
Hospitalizations were selected for the study based on ICD-9-CM procedural codes for hemiarthroplasty (81.81), anatomic total shoulder arthroplasty (TSA) (81.80), and reverse TSA (81.88). These patients were then stratified by an ICD-9-CM diagnosis of RA (714.X). We also utilized ICD-9-CM diagnosis codes to determine the presence of rotator cuff pathology at the time of shoulder arthroplasty (726.13, 727.61, 840.4) and to exclude patients with a history of trauma (812.X, 716.11, 733.8X). In a separate analysis, all patients in the NIS database with an ICD-9-CM diagnosis of RA were identified for each calendar year of the study, and a national estimate of RA patients was generated annually to assess overall and individual utilization rates of shoulder arthroplasty in this population (the national estimate served as the denominator).
Preoperative patient data withdrawn from the NIS included age, sex, insurance status, and medical comorbidities. An Elixhauser Comorbidity Index (ECI) was generated for each patient based on the presence of 29 comorbid conditions. The ECI was chosen because of its capacity to accurately predict mortality and represent the patient burden of comorbidities in similar administrative database studies.4-6
Early adverse events were also chosen based on ICD-9-CM diagnosis codes (Appendix A), and included the following: death, acute kidney injury, cardiac arrest, thromboembolic event, myocardial infarction, peripheral nerve injury, pneumonia, sepsis, stroke, surgical site infection, urinary tract infection, and wound dehiscence. The overall adverse event rate was defined as the occurrence of ≥1 of the above adverse events in a patient.
Appendix A. ICD-9-CM Codes Corresponding to Postoperative Adverse Events
Event | ICD-9-CM |
Acute kidney injury | 584.5-584.9 |
Cardiac arrest | 427.41, 427.5 |
Thromboembolic event | 453.2-453.4, 453.82-453.86, 415.1 |
Myocardial Infarction | 410.00-410.92 |
Peripheral nerve injury | 953.0-953.9 954.0-954.9, 955.0-955.9, 956.0-956.9 |
Pneumonia | 480.0-480.9, 481, 482.0-482.9, 483.0-483.8, 484.1-484.8, 485, 486 |
Sepsis | 038.0-038.9, 112.5, 785.52, 995.91, 995.92 |
Stroke | 430, 432, 433.01-434.91, 997.02 |
Surgical site infection | 998.51, 998.59, 996.67 |
Urinary tract infection | 599 |
Wound dehiscence | 998.30-998.33 |
Abbreviation: ICD-9-CM, International Classification of Diseases, Ninth Revision, Clinical Modification
Length of stay and total hospital charges were available for each patient. Length of stay represents the number of calendar days a patient stayed in the hospital. All hospital charges were converted to hospitalization costs using the HCUP Cost-to-Charge Ratio Files. All hospitalization costs were adjusted for inflation using the US Bureau of Labor statistics yearly inflation calculator to represent charges in the year 2011, which was the final and most recent year in this study.
Continue to: Statistical analysis...
STATISTICAL ANALYSIS
Statistical analyses were conducted using Stata version 13.1 (StataCorp, LP). All analyses took into account the complex survey design of the NIS. Discharge weights, strata, and cluster variables were included to correctly estimate variance and to produce national estimates from the stratified sample. Pearson’s chi-squared test was used to compare age, sex, ECI, and insurance status between RA and non-RA patients undergoing shoulder arthroplasty.
Bivariate and multivariate logistic regressions were subsequently used to compare the rates of adverse events between RA and non-RA patients undergoing shoulder arthroplasty (non-RA cases were used as the reference). Multivariate linear regressions were used to compare hospital length of stay and hospitalization costs between RA and non-RA patients undergoing shoulder arthroplasty. The multivariate regressions were adjusted for baseline differences in age, sex, ECI, and insurance status. Cochran-Armitage tests for trend were used to assess trends over time. All tests were 2-tailed, and the statistical difference was established at a 2-sided α level of 0.05 (P < .05).
RESULTS
Overall, we identified 332,593 patients who underwent shoulder arthroplasty in the US between 2002 and 2011, of which 17,883 patients (5.4%) had a diagnosis of RA. In comparison with non-RA patients undergoing shoulder arthroplasty, patients with RA at the time of shoulder arthroplasty were significantly younger (65.2 ± 12.5 years vs 68.4 ± 11.0 years, P < .001), included a significantly greater proportion of female patients (76.7% vs 53.8%, P < .001), and included a significantly higher proportion of patients with Medicaid insurance (3.6% vs 2.3%, P < .001). There were no significant differences in the mean ECI between patients with and without a diagnosis of RA (Table 1). As depicted in Table 1, there were significant differences in the utilization of specific shoulder arthroplasty types between patients with and without RA, whereby a significantly greater proportion of RA patients underwent hemiarthroplasty (HA) (31.6% vs 29.3%, P = .002) and reverse TSA (7.7% vs 6.6%, P = .002), whereas a significantly greater proportion of non-RA patients underwent anatomic SA (64.0% vs 60.8%, P = .002).
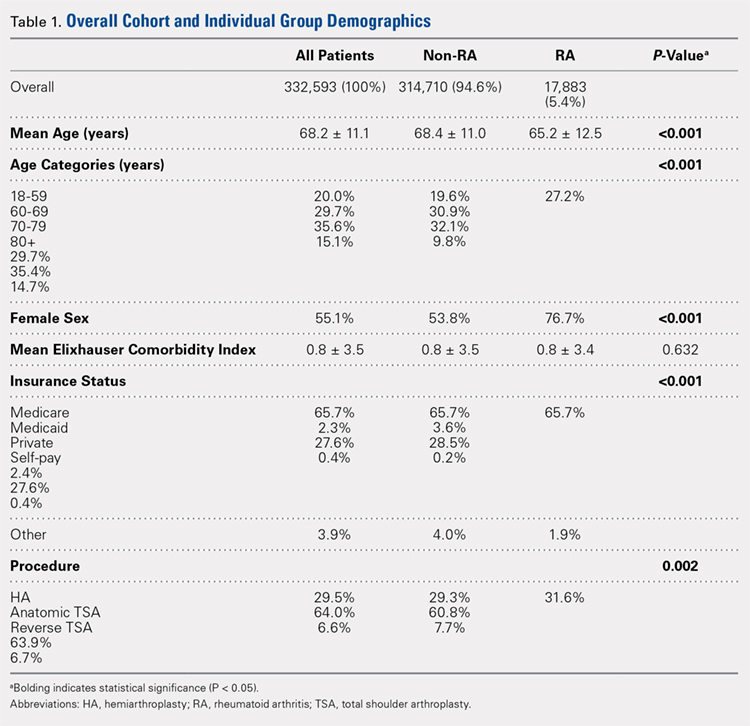
Over the study period from 2002 to 2011, there was a significant increase in the overall utilization of shoulder arthroplasty in RA patients, as indicated by both the absolute number and the proportion of patients with a diagnosis of RA (P < .001) (Table 2, Figure). More specifically, 0.39% of RA patients underwent shoulder arthroplasty in 2002, as compared with 0.58% of RA patients in 2011 (P < .001) (Table 2). With respect to specific arthroplasty types, there was an exponential rise in the utilization of reverse TSA beginning in 2010 and a corresponding decrease in the rates of both HA and anatomic TSA (Table 2, Figure). In addition to changes in shoulder arthroplasty utilization over time among RA patients, we also observed a significant increase in the number of RA patients undergoing shoulder arthroplasty with a corresponding diagnosis of rotator cuff disease (9.7% in 2002 to 15.2% in 2011, P < .001).
Table 2. The Annual Utilization of Shoulder Arthroplasty Among Patients with a Diagnosis of Rheumatoid Arthritis.
Proportion of RA patients |
| ||||
Year | Overall Rate of Shoulder Arthroplastya | HA | Anatomic TSA | Reverse TSA | |
2002 | 0.39 | 0.23 | 0.16 | 0 | |
2003 | 0.37 | 0.19 | 0.18 | 0 | |
2004 | 0.46 | 0.25 | 0.21 | 0 | |
2005 | 0.46 | 0.21 | 0.25 | 0 | |
2006 | 0.47 | 0.20 | 0.27 | 0 | |
2007 | 0.55 | 0.22 | 0.33 | 0 | |
2008 | 0.47 | 0.17 | 0.30 | 0 | |
2009 | 0.50 | 0.15 | 0.35 | 0 | |
2010 | 0.58 | 0.15 | 0.37 | 0.06 | |
2011 | 0.58 | 0.12 | 0.23 | 0.23 | |
Absolute number of RA patients |
| ||||
2002 | 1295 | 768 | 527 | 0 | |
2003 | 1247 | 650 | 597 | 0 | |
2004 | 1667 | 906 | 761 | 0 | |
2005 | 1722 | 776 | 946 | 0 | |
2006 | 1847 | 794 | 1053 | 0 | |
2007 | 2249 | 910 | 1339 | 0 | |
2008 | 2194 | 799 | 1395 | 0 | |
2009 | 2407 | 724 | 1683 | 0 | |
2010 | 2869 | 722 | 1857 | 290 | |
2011 | 3193 | 649 | 1261 | 1283 | |
aRate determined as number of RA patients undergoing shoulder arthroplasty compared to the number of patients with an RA diagnosis in the stated calendar year.
Abbreviations: HA, hemiarthroplasty; RA, rheumatoid arthritis; TSA, total shoulder arthroplasty.
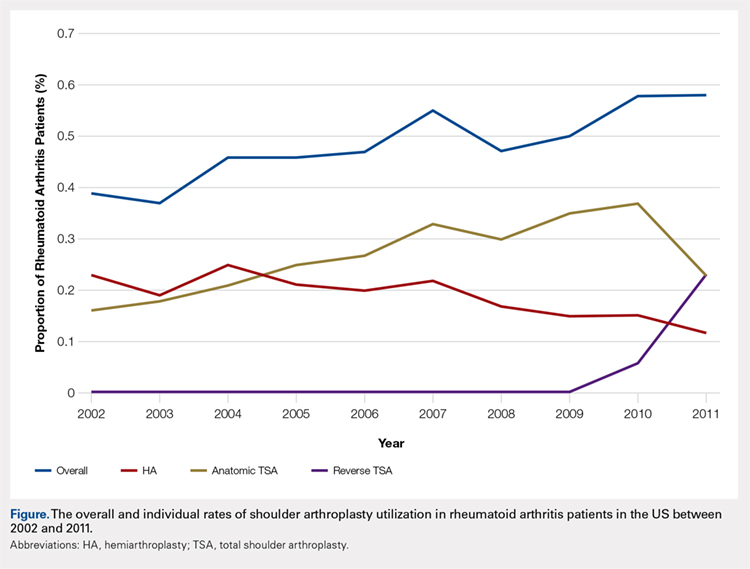
Continue to: Among patients with RA...
Among patients with RA undergoing shoulder arthroplasty, the overall rate of early adverse events was 3.12%, of which the most common early adverse events were urinary tract infections (1.8%), acute kidney injury (0.66%), and pneumonia (0.38%) (Table 3). As compared with patients without a diagnosis of RA undergoing shoulder arthroplasty, there were no significant differences in the overall and individual rates of early adverse events (Table 3).
Table 3. A Comparison of Early Adverse Events, Length of Stay, and Cost Between Patients With and Without Rheumatoid Arthritis (RA) Undergoing Shoulder Arthroplasty
Comparison of Early Adverse Event Rates |
| ||||
| Non-RA Patients | RA Patients | Multivariate Logistic Regression | ||
Odds Ratio | P-Value | ||||
Overall adverse event rate | 3.02% | 3.12% | 1.0 | 0.83 | |
Specific adverse event rate |
|
|
|
| |
Death | 0.08% | 0.05% | 0.9 | 0.91 | |
Acute kidney injury | 0.85% | 0.66% | 0.9 | 0.59 | |
Cardiac arrest | 0.05% | 0.05% | 1.3 | 0.70 | |
Thromboembolic event | 0.01% | 0.00% | - | - | |
Myocardial Infarction | 0.22% | 0.06% | 0.4 | 0.17 | |
Peripheral nerve injury | 0.08% | 0.11% | 1.5 | 0.45 | |
Pneumonia | 0.47% | 0.38% | 0.9 | 0.70 | |
Sepsis | 0.08% | 0.08% | 1.3 | 0.62 | |
Stroke | 0.07% | 0.05% | 0.9 | 0.93 | |
Surgical site infection | 0.09% | 0.13% | 1.4 | 0.52 | |
Urinary tract infection | 1.44% | 1.80% | 1.1 | 0.46 | |
Wound dehiscence | 0.01% | 0.05% | 3.6 | 0.09 | |
Comparison of Length of Stay and Hospital Charges | |||||
| Non-RA Patients (percent) | RA Patients (percent) | Multivariate Linear Regression | ||
Beta | P-Value | ||||
Length of staya | 2.3±2.0 | 2.4±1.6 | +0.1 | 0.002 | |
Hospitalization costb | 14,826±8,336 | 14,787±7,625 | +93 | 0.59 | |
aReported in days. bReported in 2011 US dollars, adjusted for inflation.
The mean length of stay following shoulder arthroplasty in RA patients was 2.4 ± 1.6 days, and the mean hospitalization cost was $14,787 ± $7625 (Table 3). As compared with non-RA patients undergoing shoulder arthroplasty, there were no significant differences in the mean hospitalization costs; however, non-RA patients had a significantly shorter length of stay by 0.1 days (P = .002) (Table 3).
DISCUSSION
In this study, we observed that the utilization of shoulder arthroplasty in patients with RA increased significantly in the decade from 2002 to 2011, largely related to a rise in TSA. Interestingly, we also observed a corresponding rise in the proportion of RA patients undergoing shoulder arthroplasty with a diagnosis of rotator cuff disease, and we believe that this may partly account for the recent increase in the use of the reverse TSA in this patient population. Additionally, we found shoulder arthroplasty in RA patients to be safe in the early postoperative period, with no significant increase in cost as compared with patients undergoing shoulder arthroplasty without a diagnosis of RA. Although we did observe a significant increase in length of stay among RA patients as compared with non-RA patients, the absolute difference was only 0.1 days, and given the aforementioned similarities in cost between RA and non-RA patients, we do not believe this difference to be clinically significant.
It has been theorized that the utilization of TJA in RA patients has been decreasing with improvements in medical management; however, this is largely based upon literature pertaining to lower extremity TJA.2 On the contrary, past research pertaining to the utilization of shoulder arthroplasty in RA patients has been highly variable. For instance, a Swedish study demonstrated a statistically significant decrease in admissions associated with RA-related upper limb surgery and a stable rate of shoulder arthroplasty between 1998 and 2004.7 Similarly, a Finnish study demonstrated that the annual incidence of primary joint arthroplasty in RA patients had declined from 1995 to 2010, with a greater decline for upper-limb arthroplasty as compared with lower-limb arthroplasty.8 Despite these European observations, Jain and colleagues9 reported an increasing rate of TSA among RA patients in the US between the years 1992 and 2005. In this study, we demonstrate a clear increase in the utilization of shoulder arthroplasty among RA patients between 2002 and 2011. What was most striking about our observation was that the rise in utilization appeared to be driven by an increase in TSA, whereas the utilization of HA decreased over time. This change in practice likely reflects several factors, including the multitude of studies that have demonstrated improved outcomes with anatomic TSA as compared with HA in RA patients.10-14
Perhaps the most interesting aspect of our data was the recent exponential rise in the utilization of the reverse TSA. Despite improved outcomes following TSA as compared with HA in RA patients, these outcomes all appear to be highly dependent upon the integrity of the rotator cuff.10 In fact, there is evidence that failure of the rotator cuff could be as high as 75% within 10 years of TSA in patients with RA,15 which ultimately could jeopardize the long-term durability of the TSA implant in this patient population.11 For this reason, interest in the reverse TSA for the RA patient population has increased since its introduction in the US in 2004;16 in fact, in RA patients with end-stage inflammatory arthropathy and a damaged rotator cuff, the reverse TSA has demonstrated excellent results.17-20 Based upon this evidence, it is not surprising that we found an exponential rise in the use of the reverse TSA since 2010, which corresponds to the introduction of an ICD-9 code for this implant.21 Prior to 2010, it is likely that many implanted reverse TSAs were coded as TSA, and for this reason, we believe that the observed rise in the utilization of TSA in RA patients prior to 2010 may have been partly fueled by an increase in the use of the reverse TSA. To further support this theory, there was a dramatic decrease in the use of anatomic TSA following 2010, and we believe this was related to increased awareness of the newly introduced reverse TSA code among surgeons.
Another consideration when examining the utilization of shoulder arthroplasty in RA patients is its versatility in managing different disease states, including rotator cuff disease. As has been documented in the literature, outcomes of rotator cuff repair in RA patients are discouraging.22 For this reason, it is reasonable for surgeons and patients with RA to consider alternatives to rotator cuff repair when nonoperative management has failed to provide adequate improvement in symptoms. One alternative may be shoulder arthroplasty, namely the reverse TSA. In this study, we observed a significant increase in the rate of diagnosis of rotator cuff disease among RA patients undergoing shoulder arthroplasty from 2002 to 2011 (9.7% in 2002 to 15.2% in 2011, P < .001), and it is our belief that the simultaneous increase in the diagnosis of rotator cuff disease and use of TSA is not coincidental. More specifically, there is likely an emerging trend among surgeons toward using the reverse TSA to manage rotator cuff tears in the RA population, rather than undertaking a rotator cuff repair that carries a high rate of failure. Going forward, there is a need to not only identify this trend more clearly but to also compare the outcomes between reverse TSA and rotator cuff repair in the management of rotator cuff tears in RA patients.
Continue to: In this study, we observed...
In this study, we observed that RA patients undergoing shoulder arthroplasty were significantly younger than non-RA patients undergoing shoulder arthroplasty. At first, this observation seems to counter recent literature suggesting that the age of patients with inflammatory arthropathy undergoing TJA is increasing over time;1 however, looking more closely at the data, it becomes clearer that the mean age we report is actually a relative increase as compared with past clinical studies pertaining to RA patients undergoing shoulder arthroplasty (mean ages of 47 years,23 55 years,24 60 years,10 and 62 years25). On the other hand, the continued existence of an age gap between RA and non-RA patients undergoing shoulder arthroplasty may be the result of several possible phenomena. First, this may reflect issues with patient access to and coverage of expensive biologic antirheumatic medication that would otherwise mitigate disease progression. For instance, the out-of-pocket expense for biologic medication through Medicaid and Medicare is substantial,26 which has direct implications on over two-thirds of our RA cohort. Second, it may be skewed by the proportion of RA patients who have previously been or continue to be poorly managed, enabling disease progression to end-stage arthropathy at a younger age. Ultimately, further investigation is needed to determine the reasons for this continued age disparity.
In comparing RA and non-RA patients undergoing shoulder arthroplasty, we did not find a significant difference in the overall nor the individual rates of early adverse events. This finding appears to be unique, as similar studies pertaining to total knee arthroplasty (TKA) demonstrated a significantly higher incidence of postoperative pneumonia and bleeding requiring transfusion among RA patients as compared with non-RA patients.27 In patients with RA being treated with biologic medication and undergoing shoulder arthroplasty, the frequent concern in the postoperative period is the integrity of the wound and the potential for infection.28 In this study, we did not find a significant difference in the rate of early infection, and although the difference in the rate of early wound dehiscence approached significance, it did not meet the threshold of 0.05 (P = .09). This finding is in keeping with the aforementioned NIS study pertaining to TKA, and we believe that it likely reflects the short duration of follow-up for patients in both studies. Given the nature of the database we utilized, we were only privy to complications that arose during the inpatient hospital stay, and it is likely that the clear majority of patients who develop a postoperative infection or wound dehiscence do so in the postoperative setting following discharge. A second concern regarding postoperative wound complications is the management of biologic medication in the perioperative period, which we cannot determine using this database. Despite all these limitations specific to this database, a past systematic review of reverse TSA in RA patients found a low rate of deep infection after reverse TSA in RA patients (3.3%),17 which was not higher than that after shoulder arthroplasty performed in non-RA patients.
A final demonstration from this study is that the hospital length of stay was significantly longer for RA patients than non-RA patients undergoing shoulder arthroplasty; however, given that the difference was only 0.1 days, and there was no significant difference in hospitalization cost, we are inclined to believe that statistical significance may not translate into clinical significance in this scenario. Ultimately, we do believe that length of stay is an important consideration in the current healthcare system, and given our finding that shoulder arthroplasty in the RA patient is safe in the early postoperative period, that a prolonged postoperative hospitalization is not warranted on the sole basis of a patient’s history of RA.
As with all studies using data from a search of an administrative database, such as the NIS database, this study has limitations. First, this type of research is limited by the reliability of both diagnosis and procedural coding. Although the NIS database has demonstrated high reliability,3 it is still possible that events may have been miscoded. Second, the tracking period for adverse events is limited to the inpatient hospital stay, which may be too short to detect certain postoperative complications. As such, the rates we report are likely underestimates of the true incidence of these complications, but this is true for both the RA and non-RA populations. Third, the comparisons we draw between RA and non-RA patients are limited to the scope of the NIS database and the available data; as such, we could not draw comparisons between preoperative disease stage, intraoperative findings, and postoperative course following hospital discharge. Lastly, our data are limited to a distinct period between 2002 and 2011 and may not reflect current practice. Ultimately, our findings may underestimate current trends in shoulder arthroplasty utilization among RA patients, particularly for the reverse TSA.
CONCLUSION
In this study, we found that the utilization of shoulder arthroplasty in patients with RA increased significantly from 2002 to 2011, largely related to a rise in the utilization of TSA. Similarly, we observed a rise in the proportion of RA patients undergoing shoulder arthroplasty with a corresponding diagnosis of rotator cuff disease, and we believe the increased utilization of shoulder arthroplasty among RA patients resulted from management of both end-stage inflammatory arthropathy and rotator cuff disease. Although we did not find a significant difference between RA and non-RA patients in the rates of early adverse events and overall hospitalization costs following shoulder arthroplasty, length of stay was significantly longer among RA patients; however, the absolute difference does not appear to be clinically significant.
- Mertelsmann-Voss C, Lyman S, Pan TJ, Goodman SM, Figgie MP, Mandl LA. US trends in rates of arthroplasty for inflammatory arthritis including rheumatoid arthritis, juvenile idiopathic arthritis, and spondyloarthritis. Arthritis Rheumatol. 2014;66(6):1432-1439. doi:10.1002/art.38384.
- Louie GH, Ward MM. Changes in the rates of joint surgery among patients with rheumatoid arthritis in California, 1983-2007. Ann Rheum Dis. 2010;69(5):868-871. doi:10.1136/ard.2009.112474.
- HCUP Nationwide Inpatient Sample (NIS) Healthcare Cost and Utilization Project (HCUP). Agency for Healthcare Research and Quality; 2002-2011.
- Elixhauser A, Steiner C, Harris DR, Coffey RM. Comorbidity measures for use with administrative data. Med Care. 1998;36(1):8-27. doi:10.1097/00005650-199801000-00004.
- Sharabiani MT, Aylin P, Bottle A. Systematic review of comorbidity indices for administrative data. Med Care. 2012;50(12):1109-1118. doi:10.1097/MLR.0b013e31825f64d0.
- van Walraven C, Austin PC, Jennings A, Quan H, Forster AJ. A modification of the Elixhauser comorbidity measures into a point system for hospital death using administrative data. Med Care. 2009;47(6):626-633. doi:10.1097/MLR.0b013e31819432e5.
- Weiss RJ, Ehlin A, Montgomery SM, Wick MC, Stark A, Wretenberg P. Decrease of RA-related orthopaedic surgery of the upper limbs between 1998 and 2004: data from 54,579 Swedish RA inpatients. Rheumatol Oxf. 2008 ;47(4):491-494. doi. 10.1093/rheumatology/ken009.
- Jämsen E, Virta LJ, Hakala M, Kauppi MJ, Malmivaara A, Lehto MU. The decline in joint replacement surgery in rheumatoid arthritis is associated with a concomitant increase in the intensity of anti-rheumatic therapy: a nationwide register-based study from 1995 through 2010. Acta Orthop. 2013;84(4):331-337. doi:10.3109/17453674.2013.810519.
- Jain A, Stein BE, Skolasky RL, Jones LC, Hungerford MW. Total joint arthroplasty in patients with rheumatoid arthritis: a United States experience from 1992 through 2005. J Arthroplasty. 2012;27(6):881-888. doi:10.1016/j.arth.2011.12.027.
- Barlow JD, Yuan BJ, Schleck CD, Harmsen WS, Cofield RH, Sperling JW. Shoulder arthroplasty for rheumatoid arthritis: 303 consecutive cases with minimum 5-year follow-up. J Shoulder Elbow Surg. 2014;23(6):791-799. doi:10.1016/j.jse.2013.09.016.
- Collins DN, Harryman DT, Wirth MA. Shoulder arthroplasty for the treatment of inflammatory arthritis. J Bone Joint Surg Am. 2004;86–A(11):2489-2496. doi:10.2106/00004623-200411000-00020.
- Rahme H, Mattsson P, Wikblad L, Larsson S. Cement and press-fit humeral stem fixation provides similar results in rheumatoid patients. Clin Orthop Relat Res. 2006;448:28-32. doi:10.1097/01.blo.0000224007.25636.85.
- Rozing PM, Nagels J, Rozing MP. Prognostic factors in arthroplasty in the rheumatoid shoulder. HSS J. 2011;7(1):29-36. doi:10.1007/s11420-010-9172-1.
- Sperling JW, Cofield RH, Schleck CD, Harmsen WS. Total shoulder arthroplasty versus hemiarthroplasty for rheumatoid arthritis of the shoulder: results of 303 consecutive cases. J Shoulder Elbow Surg. 2007;16(6):683-690. doi:10.1016/j.jse.2007.02.135.
- Khan A, Bunker TD, Kitson JB. Clinical and radiological follow-up of the Aequalis third-generation cemented total shoulder replacement: a minimum ten-year study. J Bone Joint Surg Br. 2009;91(12):1594-1600. doi:10.1302/0301-620X.91B12.22139.
- Guery J, Favard L, Sirveaux F, Oudet D, Mole D, Walch G. Reverse total shoulder arthroplasty: survivorship analysis of eighty replacements followed for five to ten years. J Bone Joint Surg Am. 2006;88(8):1742-1747. doi:10.2106/JBJS.E.00851.
- Gee ECA, Hanson EK, Saithna A. Reverse shoulder arthroplasty in rheumatoid arthritis: A systematic review. Open Orthop J. 2015;9:237-245. doi:10.2174/1874325001509010237.
- Holcomb JO, Hebert DJ, Mighell MA, et al. Reverse shoulder arthroplasty in patients with rheumatoid arthritis. J Shoulder Elbow Surg. 2010;19(7):1076-1084. doi:10.1016/j.jse.2009.11.049.
- Postacchini R, Carbone S, Canero G, Ripani M, Postacchini F. Reverse shoulder prosthesis in patients with rheumatoid arthritis: a systematic review. Int Orthop. 2016;40(5):965-973. doi:10.1007/s00264-015-2916-2.
- Rittmeister M, Kerschbaumer F. Grammont reverse total shoulder arthroplasty in patients with rheumatoid arthritis and nonreconstructible rotator cuff lesions. J Shoulder Elbow Surg. 2001;10(1):17-22. doi:10.1067/mse.2001.110515.
- American Medical Association. American Medical Association Web site. www.ama-assn.org/ama. Accessed January 15, 2016.
- Smith AM, Sperling JW, Cofield RH. Rotator cuff repair in patients with rheumatoid arthritis. J Bone Joint Surg. 2005;87(8):1782-1787. doi:10.2106/JBJS.D.02452.
- Betts HM, Abu-Rajab R, Nunn T, Brooksbank AJ. Total shoulder replacement in rheumatoid disease: a 16- to 23-year follow-up. J Bone Joint Surg Br. 2009;91(9):1197-1200. doi:10.1302/0301-620X.91B9.22035.
- Geervliet PC, Somford MP, Winia P, van den Bekerom MP. Long-term results of shoulder hemiarthroplasty in patients with rheumatoid arthritis. Orthopedics. 2015;38(1):e38-e42. doi:10.3928/01477447-20150105-58.
- Hettrich CM, Weldon E III, Boorman RS, Parsons M IV, Matsen FA III. Preoperative factors associated with improvements in shoulder function after humeral hemiarthroplasty. J Bone Joint Surg. 2004;86–A(7):1446-1451.
- Yazdany J, Dudley RA, Chen R, Lin GA, Tseng CW. Coverage for high-cost specialty drugs for rheumatoid arthritis in Medicare Part D. Arthritis Rheumatol. 2015;67(6):1474-1480. doi:10.1002/art.39079.
- Jauregui JJ, Kapadia BH, Dixit A, et al. Thirty-day complications in rheumatoid patients following total knee arthroplasty. Clin Rheumatol. 2016;35(3):595-600. doi:10.1007/s10067-015-3037-4.
- Trail IA, Nuttall D. The results of shoulder arthroplasty in patients with rheumatoid arthritis. J Bone Joint Surg Br. 2002;84(8):1121-1125. doi:10.1302/0301-620X.84B8.0841121
ABSTRACT
It has been suggested that the utilization of joint arthroplasty in patients with rheumatoid arthritis (RA) is decreasing; however, this observation is largely based upon evidence pertaining to lower-extremity joint arthroplasty. It remains unknown if these observed trends also hold true for shoulder arthroplasty. The purpose of this study is to utilize a nationally representative population database in the US to identify trends in the utilization of shoulder arthroplasty among patients with RA. Secondarily, we sought to determine the rate of early adverse events, length of stay, and hospitalization costs associated with RA patients undergoing shoulder arthroplasty and to compare these outcomes to those of patients without a diagnosis of RA undergoing shoulder arthroplasty. Using a large population database in the US, we determined the annual rates of shoulder arthroplasty (overall and individual) in RA patients between 2002 and 2011. Early adverse events, length of stay, and hospitalization costs were determined and compared with those of non-RA patients undergoing shoulder arthroplasty. Overall, we identified 332,593 patients who underwent shoulder arthroplasty between 2002 and 2011, of whom 17,883 patients (5.4%) had a diagnosis of RA. Over the study period, there was a significant increase in the utilization of shoulder arthroplasty in RA patients, particularly total shoulder arthroplasty. Over the same period, there was a significant increase in the number of RA patients who underwent shoulder arthroplasty with a diagnosis of rotator cuff disease. There were no significant differences in adverse events or mean hospitalization costs between RA and non-RA patients. Non-RA patients had a significantly shorter length of stay; however, the difference did not appear to be clinically significant. In conclusion, the utilization of shoulder arthroplasty in patients with RA significantly increased from 2002 to 2011, which may partly reflect a trend toward management of rotator cuff disease with arthroplasty rather than repair.
Continue to: It has been suggested...
It has been suggested that the utilization of total joint arthroplasty (TJA) in patients with rheumatoid arthritis (RA) is decreasing over time;1 however, this observation is largely based upon evidence pertaining to lower extremity TJA.2 It remains unknown if these observed trends also hold true for shoulder arthroplasty, whereby the utilization of shoulder arthroplasty in RA patients is not limited to the management of end-stage inflammatory arthropathy. In this study, we used a nationally representative population database in the US to identify trends in the utilization of shoulder arthroplasty among patients with RA. As a secondary objective, we sought to determine the rate of early adverse events, length of stay, and hospitalization costs associated with RA patients undergoing shoulder arthroplasty and compare these outcomes to those of patients without a diagnosis of RA undergoing shoulder arthroplasty. We hypothesize that the utilization of shoulder arthroplasty in RA patients would be decreasing, but adverse events, length of stay, and hospitalization costs would not differ between patients with and without RA undergoing shoulder arthroplasty.
METHODS
We conducted a retrospective cohort study using the Healthcare Cost and Utilization Project (HCUP) Nationwide Inpatient Sample (NIS) from 2002 to 2011.3 The NIS comprises a 20% stratified sample of all hospital discharges in the US. The NIS includes information about patient characteristics (age, sex, insurance status, and medical comorbidities) and hospitalization outcomes (adverse events, costs, and length of stay). The NIS allows identification of hospitalizations according to procedures and diagnoses using International Classification of Diseases, Ninth Revision, Clinical Modification (ICD-9-CM) codes. Given the anonymity of this study, it was exempt from Institutional Review Board ethics approval.
Hospitalizations were selected for the study based on ICD-9-CM procedural codes for hemiarthroplasty (81.81), anatomic total shoulder arthroplasty (TSA) (81.80), and reverse TSA (81.88). These patients were then stratified by an ICD-9-CM diagnosis of RA (714.X). We also utilized ICD-9-CM diagnosis codes to determine the presence of rotator cuff pathology at the time of shoulder arthroplasty (726.13, 727.61, 840.4) and to exclude patients with a history of trauma (812.X, 716.11, 733.8X). In a separate analysis, all patients in the NIS database with an ICD-9-CM diagnosis of RA were identified for each calendar year of the study, and a national estimate of RA patients was generated annually to assess overall and individual utilization rates of shoulder arthroplasty in this population (the national estimate served as the denominator).
Preoperative patient data withdrawn from the NIS included age, sex, insurance status, and medical comorbidities. An Elixhauser Comorbidity Index (ECI) was generated for each patient based on the presence of 29 comorbid conditions. The ECI was chosen because of its capacity to accurately predict mortality and represent the patient burden of comorbidities in similar administrative database studies.4-6
Early adverse events were also chosen based on ICD-9-CM diagnosis codes (Appendix A), and included the following: death, acute kidney injury, cardiac arrest, thromboembolic event, myocardial infarction, peripheral nerve injury, pneumonia, sepsis, stroke, surgical site infection, urinary tract infection, and wound dehiscence. The overall adverse event rate was defined as the occurrence of ≥1 of the above adverse events in a patient.
Appendix A. ICD-9-CM Codes Corresponding to Postoperative Adverse Events
Event | ICD-9-CM |
Acute kidney injury | 584.5-584.9 |
Cardiac arrest | 427.41, 427.5 |
Thromboembolic event | 453.2-453.4, 453.82-453.86, 415.1 |
Myocardial Infarction | 410.00-410.92 |
Peripheral nerve injury | 953.0-953.9 954.0-954.9, 955.0-955.9, 956.0-956.9 |
Pneumonia | 480.0-480.9, 481, 482.0-482.9, 483.0-483.8, 484.1-484.8, 485, 486 |
Sepsis | 038.0-038.9, 112.5, 785.52, 995.91, 995.92 |
Stroke | 430, 432, 433.01-434.91, 997.02 |
Surgical site infection | 998.51, 998.59, 996.67 |
Urinary tract infection | 599 |
Wound dehiscence | 998.30-998.33 |
Abbreviation: ICD-9-CM, International Classification of Diseases, Ninth Revision, Clinical Modification
Length of stay and total hospital charges were available for each patient. Length of stay represents the number of calendar days a patient stayed in the hospital. All hospital charges were converted to hospitalization costs using the HCUP Cost-to-Charge Ratio Files. All hospitalization costs were adjusted for inflation using the US Bureau of Labor statistics yearly inflation calculator to represent charges in the year 2011, which was the final and most recent year in this study.
Continue to: Statistical analysis...
STATISTICAL ANALYSIS
Statistical analyses were conducted using Stata version 13.1 (StataCorp, LP). All analyses took into account the complex survey design of the NIS. Discharge weights, strata, and cluster variables were included to correctly estimate variance and to produce national estimates from the stratified sample. Pearson’s chi-squared test was used to compare age, sex, ECI, and insurance status between RA and non-RA patients undergoing shoulder arthroplasty.
Bivariate and multivariate logistic regressions were subsequently used to compare the rates of adverse events between RA and non-RA patients undergoing shoulder arthroplasty (non-RA cases were used as the reference). Multivariate linear regressions were used to compare hospital length of stay and hospitalization costs between RA and non-RA patients undergoing shoulder arthroplasty. The multivariate regressions were adjusted for baseline differences in age, sex, ECI, and insurance status. Cochran-Armitage tests for trend were used to assess trends over time. All tests were 2-tailed, and the statistical difference was established at a 2-sided α level of 0.05 (P < .05).
RESULTS
Overall, we identified 332,593 patients who underwent shoulder arthroplasty in the US between 2002 and 2011, of which 17,883 patients (5.4%) had a diagnosis of RA. In comparison with non-RA patients undergoing shoulder arthroplasty, patients with RA at the time of shoulder arthroplasty were significantly younger (65.2 ± 12.5 years vs 68.4 ± 11.0 years, P < .001), included a significantly greater proportion of female patients (76.7% vs 53.8%, P < .001), and included a significantly higher proportion of patients with Medicaid insurance (3.6% vs 2.3%, P < .001). There were no significant differences in the mean ECI between patients with and without a diagnosis of RA (Table 1). As depicted in Table 1, there were significant differences in the utilization of specific shoulder arthroplasty types between patients with and without RA, whereby a significantly greater proportion of RA patients underwent hemiarthroplasty (HA) (31.6% vs 29.3%, P = .002) and reverse TSA (7.7% vs 6.6%, P = .002), whereas a significantly greater proportion of non-RA patients underwent anatomic SA (64.0% vs 60.8%, P = .002).
Over the study period from 2002 to 2011, there was a significant increase in the overall utilization of shoulder arthroplasty in RA patients, as indicated by both the absolute number and the proportion of patients with a diagnosis of RA (P < .001) (Table 2, Figure). More specifically, 0.39% of RA patients underwent shoulder arthroplasty in 2002, as compared with 0.58% of RA patients in 2011 (P < .001) (Table 2). With respect to specific arthroplasty types, there was an exponential rise in the utilization of reverse TSA beginning in 2010 and a corresponding decrease in the rates of both HA and anatomic TSA (Table 2, Figure). In addition to changes in shoulder arthroplasty utilization over time among RA patients, we also observed a significant increase in the number of RA patients undergoing shoulder arthroplasty with a corresponding diagnosis of rotator cuff disease (9.7% in 2002 to 15.2% in 2011, P < .001).
Table 2. The Annual Utilization of Shoulder Arthroplasty Among Patients with a Diagnosis of Rheumatoid Arthritis.
Proportion of RA patients |
| ||||
Year | Overall Rate of Shoulder Arthroplastya | HA | Anatomic TSA | Reverse TSA | |
2002 | 0.39 | 0.23 | 0.16 | 0 | |
2003 | 0.37 | 0.19 | 0.18 | 0 | |
2004 | 0.46 | 0.25 | 0.21 | 0 | |
2005 | 0.46 | 0.21 | 0.25 | 0 | |
2006 | 0.47 | 0.20 | 0.27 | 0 | |
2007 | 0.55 | 0.22 | 0.33 | 0 | |
2008 | 0.47 | 0.17 | 0.30 | 0 | |
2009 | 0.50 | 0.15 | 0.35 | 0 | |
2010 | 0.58 | 0.15 | 0.37 | 0.06 | |
2011 | 0.58 | 0.12 | 0.23 | 0.23 | |
Absolute number of RA patients |
| ||||
2002 | 1295 | 768 | 527 | 0 | |
2003 | 1247 | 650 | 597 | 0 | |
2004 | 1667 | 906 | 761 | 0 | |
2005 | 1722 | 776 | 946 | 0 | |
2006 | 1847 | 794 | 1053 | 0 | |
2007 | 2249 | 910 | 1339 | 0 | |
2008 | 2194 | 799 | 1395 | 0 | |
2009 | 2407 | 724 | 1683 | 0 | |
2010 | 2869 | 722 | 1857 | 290 | |
2011 | 3193 | 649 | 1261 | 1283 | |
aRate determined as number of RA patients undergoing shoulder arthroplasty compared to the number of patients with an RA diagnosis in the stated calendar year.
Abbreviations: HA, hemiarthroplasty; RA, rheumatoid arthritis; TSA, total shoulder arthroplasty.
Continue to: Among patients with RA...
Among patients with RA undergoing shoulder arthroplasty, the overall rate of early adverse events was 3.12%, of which the most common early adverse events were urinary tract infections (1.8%), acute kidney injury (0.66%), and pneumonia (0.38%) (Table 3). As compared with patients without a diagnosis of RA undergoing shoulder arthroplasty, there were no significant differences in the overall and individual rates of early adverse events (Table 3).
Table 3. A Comparison of Early Adverse Events, Length of Stay, and Cost Between Patients With and Without Rheumatoid Arthritis (RA) Undergoing Shoulder Arthroplasty
Comparison of Early Adverse Event Rates |
| ||||
| Non-RA Patients | RA Patients | Multivariate Logistic Regression | ||
Odds Ratio | P-Value | ||||
Overall adverse event rate | 3.02% | 3.12% | 1.0 | 0.83 | |
Specific adverse event rate |
|
|
|
| |
Death | 0.08% | 0.05% | 0.9 | 0.91 | |
Acute kidney injury | 0.85% | 0.66% | 0.9 | 0.59 | |
Cardiac arrest | 0.05% | 0.05% | 1.3 | 0.70 | |
Thromboembolic event | 0.01% | 0.00% | - | - | |
Myocardial Infarction | 0.22% | 0.06% | 0.4 | 0.17 | |
Peripheral nerve injury | 0.08% | 0.11% | 1.5 | 0.45 | |
Pneumonia | 0.47% | 0.38% | 0.9 | 0.70 | |
Sepsis | 0.08% | 0.08% | 1.3 | 0.62 | |
Stroke | 0.07% | 0.05% | 0.9 | 0.93 | |
Surgical site infection | 0.09% | 0.13% | 1.4 | 0.52 | |
Urinary tract infection | 1.44% | 1.80% | 1.1 | 0.46 | |
Wound dehiscence | 0.01% | 0.05% | 3.6 | 0.09 | |
Comparison of Length of Stay and Hospital Charges | |||||
| Non-RA Patients (percent) | RA Patients (percent) | Multivariate Linear Regression | ||
Beta | P-Value | ||||
Length of staya | 2.3±2.0 | 2.4±1.6 | +0.1 | 0.002 | |
Hospitalization costb | 14,826±8,336 | 14,787±7,625 | +93 | 0.59 | |
aReported in days. bReported in 2011 US dollars, adjusted for inflation.
The mean length of stay following shoulder arthroplasty in RA patients was 2.4 ± 1.6 days, and the mean hospitalization cost was $14,787 ± $7625 (Table 3). As compared with non-RA patients undergoing shoulder arthroplasty, there were no significant differences in the mean hospitalization costs; however, non-RA patients had a significantly shorter length of stay by 0.1 days (P = .002) (Table 3).
DISCUSSION
In this study, we observed that the utilization of shoulder arthroplasty in patients with RA increased significantly in the decade from 2002 to 2011, largely related to a rise in TSA. Interestingly, we also observed a corresponding rise in the proportion of RA patients undergoing shoulder arthroplasty with a diagnosis of rotator cuff disease, and we believe that this may partly account for the recent increase in the use of the reverse TSA in this patient population. Additionally, we found shoulder arthroplasty in RA patients to be safe in the early postoperative period, with no significant increase in cost as compared with patients undergoing shoulder arthroplasty without a diagnosis of RA. Although we did observe a significant increase in length of stay among RA patients as compared with non-RA patients, the absolute difference was only 0.1 days, and given the aforementioned similarities in cost between RA and non-RA patients, we do not believe this difference to be clinically significant.
It has been theorized that the utilization of TJA in RA patients has been decreasing with improvements in medical management; however, this is largely based upon literature pertaining to lower extremity TJA.2 On the contrary, past research pertaining to the utilization of shoulder arthroplasty in RA patients has been highly variable. For instance, a Swedish study demonstrated a statistically significant decrease in admissions associated with RA-related upper limb surgery and a stable rate of shoulder arthroplasty between 1998 and 2004.7 Similarly, a Finnish study demonstrated that the annual incidence of primary joint arthroplasty in RA patients had declined from 1995 to 2010, with a greater decline for upper-limb arthroplasty as compared with lower-limb arthroplasty.8 Despite these European observations, Jain and colleagues9 reported an increasing rate of TSA among RA patients in the US between the years 1992 and 2005. In this study, we demonstrate a clear increase in the utilization of shoulder arthroplasty among RA patients between 2002 and 2011. What was most striking about our observation was that the rise in utilization appeared to be driven by an increase in TSA, whereas the utilization of HA decreased over time. This change in practice likely reflects several factors, including the multitude of studies that have demonstrated improved outcomes with anatomic TSA as compared with HA in RA patients.10-14
Perhaps the most interesting aspect of our data was the recent exponential rise in the utilization of the reverse TSA. Despite improved outcomes following TSA as compared with HA in RA patients, these outcomes all appear to be highly dependent upon the integrity of the rotator cuff.10 In fact, there is evidence that failure of the rotator cuff could be as high as 75% within 10 years of TSA in patients with RA,15 which ultimately could jeopardize the long-term durability of the TSA implant in this patient population.11 For this reason, interest in the reverse TSA for the RA patient population has increased since its introduction in the US in 2004;16 in fact, in RA patients with end-stage inflammatory arthropathy and a damaged rotator cuff, the reverse TSA has demonstrated excellent results.17-20 Based upon this evidence, it is not surprising that we found an exponential rise in the use of the reverse TSA since 2010, which corresponds to the introduction of an ICD-9 code for this implant.21 Prior to 2010, it is likely that many implanted reverse TSAs were coded as TSA, and for this reason, we believe that the observed rise in the utilization of TSA in RA patients prior to 2010 may have been partly fueled by an increase in the use of the reverse TSA. To further support this theory, there was a dramatic decrease in the use of anatomic TSA following 2010, and we believe this was related to increased awareness of the newly introduced reverse TSA code among surgeons.
Another consideration when examining the utilization of shoulder arthroplasty in RA patients is its versatility in managing different disease states, including rotator cuff disease. As has been documented in the literature, outcomes of rotator cuff repair in RA patients are discouraging.22 For this reason, it is reasonable for surgeons and patients with RA to consider alternatives to rotator cuff repair when nonoperative management has failed to provide adequate improvement in symptoms. One alternative may be shoulder arthroplasty, namely the reverse TSA. In this study, we observed a significant increase in the rate of diagnosis of rotator cuff disease among RA patients undergoing shoulder arthroplasty from 2002 to 2011 (9.7% in 2002 to 15.2% in 2011, P < .001), and it is our belief that the simultaneous increase in the diagnosis of rotator cuff disease and use of TSA is not coincidental. More specifically, there is likely an emerging trend among surgeons toward using the reverse TSA to manage rotator cuff tears in the RA population, rather than undertaking a rotator cuff repair that carries a high rate of failure. Going forward, there is a need to not only identify this trend more clearly but to also compare the outcomes between reverse TSA and rotator cuff repair in the management of rotator cuff tears in RA patients.
Continue to: In this study, we observed...
In this study, we observed that RA patients undergoing shoulder arthroplasty were significantly younger than non-RA patients undergoing shoulder arthroplasty. At first, this observation seems to counter recent literature suggesting that the age of patients with inflammatory arthropathy undergoing TJA is increasing over time;1 however, looking more closely at the data, it becomes clearer that the mean age we report is actually a relative increase as compared with past clinical studies pertaining to RA patients undergoing shoulder arthroplasty (mean ages of 47 years,23 55 years,24 60 years,10 and 62 years25). On the other hand, the continued existence of an age gap between RA and non-RA patients undergoing shoulder arthroplasty may be the result of several possible phenomena. First, this may reflect issues with patient access to and coverage of expensive biologic antirheumatic medication that would otherwise mitigate disease progression. For instance, the out-of-pocket expense for biologic medication through Medicaid and Medicare is substantial,26 which has direct implications on over two-thirds of our RA cohort. Second, it may be skewed by the proportion of RA patients who have previously been or continue to be poorly managed, enabling disease progression to end-stage arthropathy at a younger age. Ultimately, further investigation is needed to determine the reasons for this continued age disparity.
In comparing RA and non-RA patients undergoing shoulder arthroplasty, we did not find a significant difference in the overall nor the individual rates of early adverse events. This finding appears to be unique, as similar studies pertaining to total knee arthroplasty (TKA) demonstrated a significantly higher incidence of postoperative pneumonia and bleeding requiring transfusion among RA patients as compared with non-RA patients.27 In patients with RA being treated with biologic medication and undergoing shoulder arthroplasty, the frequent concern in the postoperative period is the integrity of the wound and the potential for infection.28 In this study, we did not find a significant difference in the rate of early infection, and although the difference in the rate of early wound dehiscence approached significance, it did not meet the threshold of 0.05 (P = .09). This finding is in keeping with the aforementioned NIS study pertaining to TKA, and we believe that it likely reflects the short duration of follow-up for patients in both studies. Given the nature of the database we utilized, we were only privy to complications that arose during the inpatient hospital stay, and it is likely that the clear majority of patients who develop a postoperative infection or wound dehiscence do so in the postoperative setting following discharge. A second concern regarding postoperative wound complications is the management of biologic medication in the perioperative period, which we cannot determine using this database. Despite all these limitations specific to this database, a past systematic review of reverse TSA in RA patients found a low rate of deep infection after reverse TSA in RA patients (3.3%),17 which was not higher than that after shoulder arthroplasty performed in non-RA patients.
A final demonstration from this study is that the hospital length of stay was significantly longer for RA patients than non-RA patients undergoing shoulder arthroplasty; however, given that the difference was only 0.1 days, and there was no significant difference in hospitalization cost, we are inclined to believe that statistical significance may not translate into clinical significance in this scenario. Ultimately, we do believe that length of stay is an important consideration in the current healthcare system, and given our finding that shoulder arthroplasty in the RA patient is safe in the early postoperative period, that a prolonged postoperative hospitalization is not warranted on the sole basis of a patient’s history of RA.
As with all studies using data from a search of an administrative database, such as the NIS database, this study has limitations. First, this type of research is limited by the reliability of both diagnosis and procedural coding. Although the NIS database has demonstrated high reliability,3 it is still possible that events may have been miscoded. Second, the tracking period for adverse events is limited to the inpatient hospital stay, which may be too short to detect certain postoperative complications. As such, the rates we report are likely underestimates of the true incidence of these complications, but this is true for both the RA and non-RA populations. Third, the comparisons we draw between RA and non-RA patients are limited to the scope of the NIS database and the available data; as such, we could not draw comparisons between preoperative disease stage, intraoperative findings, and postoperative course following hospital discharge. Lastly, our data are limited to a distinct period between 2002 and 2011 and may not reflect current practice. Ultimately, our findings may underestimate current trends in shoulder arthroplasty utilization among RA patients, particularly for the reverse TSA.
CONCLUSION
In this study, we found that the utilization of shoulder arthroplasty in patients with RA increased significantly from 2002 to 2011, largely related to a rise in the utilization of TSA. Similarly, we observed a rise in the proportion of RA patients undergoing shoulder arthroplasty with a corresponding diagnosis of rotator cuff disease, and we believe the increased utilization of shoulder arthroplasty among RA patients resulted from management of both end-stage inflammatory arthropathy and rotator cuff disease. Although we did not find a significant difference between RA and non-RA patients in the rates of early adverse events and overall hospitalization costs following shoulder arthroplasty, length of stay was significantly longer among RA patients; however, the absolute difference does not appear to be clinically significant.
- Mertelsmann-Voss C, Lyman S, Pan TJ, Goodman SM, Figgie MP, Mandl LA. US trends in rates of arthroplasty for inflammatory arthritis including rheumatoid arthritis, juvenile idiopathic arthritis, and spondyloarthritis. Arthritis Rheumatol. 2014;66(6):1432-1439. doi:10.1002/art.38384.
- Louie GH, Ward MM. Changes in the rates of joint surgery among patients with rheumatoid arthritis in California, 1983-2007. Ann Rheum Dis. 2010;69(5):868-871. doi:10.1136/ard.2009.112474.
- HCUP Nationwide Inpatient Sample (NIS) Healthcare Cost and Utilization Project (HCUP). Agency for Healthcare Research and Quality; 2002-2011.
- Elixhauser A, Steiner C, Harris DR, Coffey RM. Comorbidity measures for use with administrative data. Med Care. 1998;36(1):8-27. doi:10.1097/00005650-199801000-00004.
- Sharabiani MT, Aylin P, Bottle A. Systematic review of comorbidity indices for administrative data. Med Care. 2012;50(12):1109-1118. doi:10.1097/MLR.0b013e31825f64d0.
- van Walraven C, Austin PC, Jennings A, Quan H, Forster AJ. A modification of the Elixhauser comorbidity measures into a point system for hospital death using administrative data. Med Care. 2009;47(6):626-633. doi:10.1097/MLR.0b013e31819432e5.
- Weiss RJ, Ehlin A, Montgomery SM, Wick MC, Stark A, Wretenberg P. Decrease of RA-related orthopaedic surgery of the upper limbs between 1998 and 2004: data from 54,579 Swedish RA inpatients. Rheumatol Oxf. 2008 ;47(4):491-494. doi. 10.1093/rheumatology/ken009.
- Jämsen E, Virta LJ, Hakala M, Kauppi MJ, Malmivaara A, Lehto MU. The decline in joint replacement surgery in rheumatoid arthritis is associated with a concomitant increase in the intensity of anti-rheumatic therapy: a nationwide register-based study from 1995 through 2010. Acta Orthop. 2013;84(4):331-337. doi:10.3109/17453674.2013.810519.
- Jain A, Stein BE, Skolasky RL, Jones LC, Hungerford MW. Total joint arthroplasty in patients with rheumatoid arthritis: a United States experience from 1992 through 2005. J Arthroplasty. 2012;27(6):881-888. doi:10.1016/j.arth.2011.12.027.
- Barlow JD, Yuan BJ, Schleck CD, Harmsen WS, Cofield RH, Sperling JW. Shoulder arthroplasty for rheumatoid arthritis: 303 consecutive cases with minimum 5-year follow-up. J Shoulder Elbow Surg. 2014;23(6):791-799. doi:10.1016/j.jse.2013.09.016.
- Collins DN, Harryman DT, Wirth MA. Shoulder arthroplasty for the treatment of inflammatory arthritis. J Bone Joint Surg Am. 2004;86–A(11):2489-2496. doi:10.2106/00004623-200411000-00020.
- Rahme H, Mattsson P, Wikblad L, Larsson S. Cement and press-fit humeral stem fixation provides similar results in rheumatoid patients. Clin Orthop Relat Res. 2006;448:28-32. doi:10.1097/01.blo.0000224007.25636.85.
- Rozing PM, Nagels J, Rozing MP. Prognostic factors in arthroplasty in the rheumatoid shoulder. HSS J. 2011;7(1):29-36. doi:10.1007/s11420-010-9172-1.
- Sperling JW, Cofield RH, Schleck CD, Harmsen WS. Total shoulder arthroplasty versus hemiarthroplasty for rheumatoid arthritis of the shoulder: results of 303 consecutive cases. J Shoulder Elbow Surg. 2007;16(6):683-690. doi:10.1016/j.jse.2007.02.135.
- Khan A, Bunker TD, Kitson JB. Clinical and radiological follow-up of the Aequalis third-generation cemented total shoulder replacement: a minimum ten-year study. J Bone Joint Surg Br. 2009;91(12):1594-1600. doi:10.1302/0301-620X.91B12.22139.
- Guery J, Favard L, Sirveaux F, Oudet D, Mole D, Walch G. Reverse total shoulder arthroplasty: survivorship analysis of eighty replacements followed for five to ten years. J Bone Joint Surg Am. 2006;88(8):1742-1747. doi:10.2106/JBJS.E.00851.
- Gee ECA, Hanson EK, Saithna A. Reverse shoulder arthroplasty in rheumatoid arthritis: A systematic review. Open Orthop J. 2015;9:237-245. doi:10.2174/1874325001509010237.
- Holcomb JO, Hebert DJ, Mighell MA, et al. Reverse shoulder arthroplasty in patients with rheumatoid arthritis. J Shoulder Elbow Surg. 2010;19(7):1076-1084. doi:10.1016/j.jse.2009.11.049.
- Postacchini R, Carbone S, Canero G, Ripani M, Postacchini F. Reverse shoulder prosthesis in patients with rheumatoid arthritis: a systematic review. Int Orthop. 2016;40(5):965-973. doi:10.1007/s00264-015-2916-2.
- Rittmeister M, Kerschbaumer F. Grammont reverse total shoulder arthroplasty in patients with rheumatoid arthritis and nonreconstructible rotator cuff lesions. J Shoulder Elbow Surg. 2001;10(1):17-22. doi:10.1067/mse.2001.110515.
- American Medical Association. American Medical Association Web site. www.ama-assn.org/ama. Accessed January 15, 2016.
- Smith AM, Sperling JW, Cofield RH. Rotator cuff repair in patients with rheumatoid arthritis. J Bone Joint Surg. 2005;87(8):1782-1787. doi:10.2106/JBJS.D.02452.
- Betts HM, Abu-Rajab R, Nunn T, Brooksbank AJ. Total shoulder replacement in rheumatoid disease: a 16- to 23-year follow-up. J Bone Joint Surg Br. 2009;91(9):1197-1200. doi:10.1302/0301-620X.91B9.22035.
- Geervliet PC, Somford MP, Winia P, van den Bekerom MP. Long-term results of shoulder hemiarthroplasty in patients with rheumatoid arthritis. Orthopedics. 2015;38(1):e38-e42. doi:10.3928/01477447-20150105-58.
- Hettrich CM, Weldon E III, Boorman RS, Parsons M IV, Matsen FA III. Preoperative factors associated with improvements in shoulder function after humeral hemiarthroplasty. J Bone Joint Surg. 2004;86–A(7):1446-1451.
- Yazdany J, Dudley RA, Chen R, Lin GA, Tseng CW. Coverage for high-cost specialty drugs for rheumatoid arthritis in Medicare Part D. Arthritis Rheumatol. 2015;67(6):1474-1480. doi:10.1002/art.39079.
- Jauregui JJ, Kapadia BH, Dixit A, et al. Thirty-day complications in rheumatoid patients following total knee arthroplasty. Clin Rheumatol. 2016;35(3):595-600. doi:10.1007/s10067-015-3037-4.
- Trail IA, Nuttall D. The results of shoulder arthroplasty in patients with rheumatoid arthritis. J Bone Joint Surg Br. 2002;84(8):1121-1125. doi:10.1302/0301-620X.84B8.0841121
TAKE-HOME POINTS
- There was a significant increase in the utilization of shoulder arthroplasty in RA patients, particularly TSA.
- There was a significant increase in the number of RA patients who underwent shoulder arthroplasty with a diagnosis of rotator cuff disease.
- There were no significant differences in adverse events or mean hospitalization costs between RA and non-RA patients.
- Non-RA patients had a significantly shorter length of stay.
- The utilization of shoulder arthroplasty in patients with RA significantly increased from 2002 to 2011, which may partly reflect a trend toward management of rotator cuff disease with arthroplasty rather than repair.
Continuous Cryotherapy vs Ice Following Total Shoulder Arthroplasty: A Randomized Control Trial
ABSTRACT
Postoperative pain management is an important component of total shoulder arthroplasty (TSA). Continuous cryotherapy (CC) has been proposed as a means of improving postoperative pain control. However, CC represents an increased cost not typically covered by insurance. The purpose of this study is to compare CC to plain ice (ICE) following TSA. The hypothesis was that CC would lead to lower pain scores and decreased narcotic usage during the first 2 weeks postoperatively.
A randomized controlled trial was performed to compare CC to ICE. Forty patients were randomized to receive either CC or ICE following TSA. The rehabilitation and pain control protocols were otherwise standardized. Visual analog scales (VAS) for pain, satisfaction with cold therapy, and quality of sleep were recorded preoperatively and postoperatively at 24 hours, 3 days, 7 days, and 14 days following surgery. Narcotic usage in morphine equivalents was also recorded.
No significant differences in preoperative pain (5.9 vs 6.8; P = .121), or postoperative pain at 24 hours (4.2 vs 4.3; P = .989), 3 days (4.8 vs 4.7; P = .944), 7 days (2.9 vs 3.3; P = .593) or 14 days (2.5 vs 2.7; P = .742) were observed between the CC and ICE groups. Similarly, no differences in quality of sleep, satisfaction with the cold therapy, or narcotic usage at any time interval were observed between the 2 groups.
No differences in pain control, quality of sleep, patient satisfaction, or narcotic usage were detected between CC and ICE following TSA. CC may offer convenience as an advantage, but the increased cost associated with this type of treatment may not be justified.
The number of total shoulder arthroplasties (TSAs) performed annually is increasing dramatically.1 At the same time, there has been a push toward decreased length of hospital stay and earlier mobilization following joint replacement surgery. Central to these goals is adequate pain control. Multimodal pain pathways exist, and one of the safest and cheapest methods of pain control is cold therapy, which can be accomplished with continuous cryotherapy (CC) or plain ice (ICE).
Continue to: The mechanism of cryotherapy...
The mechanism of cryotherapy for controlling pain is poorly understood. Cryotherapy reduces leukocyte migration and slows down nerve signal transmission, which reduces inflammation, thereby producing a short-term analgesic effect. Stalman and colleagues2 reported on a randomized control study that evaluated the effects of postoperative cooling after knee arthroscopy. Measurements of metabolic and inflammatory markers in the synovial membrane were used to assess whether cryotherapy provides a temperature-sensitive release of prostaglandin E2. Cryotherapy lowered the temperature in the postoperative knee, and synovial prostaglandin concentrations were correlated with temperature. Because prostaglandin is a marker of inflammation and pain, the conclusion was that postoperative cooling appeared to have an anti-inflammatory effect.
The knee literature contains multiple studies that have examined the benefits of cryotherapy after both arthroscopic and arthroplasty procedures. The clinical benefits on pain have been equivocal with some studies showing improvements using cryotherapy3,4 and others showing no difference in the treatment group.5,6
Few studies have examined cryotherapy for the shoulder. Speer and colleagues7 demonstrated that postoperative use of CC was effective in reducing recovery time after shoulder surgery. However; they did not provide an ICE comparative group and did not focus specifically on TSA. In another study, Kraeutler and colleagues8 examined only arthroscopic shoulder surgery cases in a randomized prospective trial and found no significant different between CC and ICE. They concluded that there did not appear to be a significant benefit in using CC over ICE for arthroscopic shoulder procedures.
The purpose of this study is to prospectively evaluate CC and ICE following TSA. The hypothesis was that CC leads to improved pain control, less narcotic consumption, and improved quality of sleep compared to ICE in the immediate postoperative period following TSA.
MATERIALS AND METHODS
This was a prospective randomized control study of patients undergoing TSA receiving either CC or ICE postoperatively. Institutional Review Board approval was obtained before commencement of the study. Inclusion criteria included patients aged 30 to 90 years old undergoing a primary or revision shoulder arthroplasty procedure between June 2015 and January 2016. Exclusion criteria included hemiarthroplasty procedures.
Continue to: Three patients refused...
Three patients refused to participate in the study. Enrollment was performed until 40 patients were enrolled in the study (20 patients in each group). Randomization was performed with a random number generator, and patients were assigned to a treatment group following consent to participate. Complete follow-up was available for all patients. There were 13 (65%) male patients in the CC group. The average age of the CC group at the time of surgery was 68.7 years (range). There were 11 male patients in the ICE group. The average age of the ICE group at the time of surgery was 73.2 years (range). The dominant extremity was involved in 9 (45%) patients in the CC group and in 11 patients (55%) in the ICE group. Surgical case specifics are summarized in Table 1.
Table 1. Summary of Surgical Cases
| CC group (n = 20) | ICE group (n = 20) |
Primary TSA | 7 (35%) | 9 (45%) |
Primary RSA | 12 (60%) | 9 (45%) |
Revision arthroplasty | 1 (5%) | 2 (10%) |
Abbreviations: CC, continuous cryotherapy; ICE, plain ice; RSA, reverse shoulder arthroplasty; TSA, total shoulder arthroplasty.
All surgeries were performed by Dr. Denard. All patients received a single-shot interscalene nerve block prior to the procedure. A deltopectoral approach was utilized, and the subscapularis was managed with the peel technique.9 All patients were admitted to the hospital following surgery. Standard postoperative pain control consisted of as-needed intravenous morphine (1-2 mg every 2 hours, as needed) or an oral narcotic (hydrocodone/acetaminophen 5/325mg, 1-2 every 4 hours, as needed) which was also provided at discharge. However, total narcotic usage was recorded in morphine equivalents to account for substitutions. No non-steroidal anti-inflammatory drugs were allowed until 3 months postoperatively.
The CC group received treatment from a commercially available cryotherapy unit (Polar Care; Breg). All patients received instructions by a medical professional on how to use the unit. The unit was applied immediately postoperatively and set at a temperature of 45°F to 55°F. Patients were instructed to use the unit continuously during postoperative days 0 to 3. This cryotherapy was administered by a nurse while in the hospital but was left to the responsibility of the patient upon discharge. Patients were instructed to use the unit as needed for pain control during the day and continuously while asleep from days 4 to14.
The ICE group used standard ice packs postoperatively. The patients were instructed to apply an ice pack for 20 min every 2 hours while awake during days 0 to 3. This therapy was administered by a nurse while in the hospital but left to the responsibility of the patient upon discharge. Patients were instructed to use ice packs as needed for pain control during the day at a maximum of 20 minutes per hour on postoperative days 4 to 14. Compliance by both groups was monitored using a patient survey after hospital discharge. The number of hours that patients used either the CC or ICE per 24-hour period was recorded at 24 hours, 3 days, 7 days, and 14 days. The nursing staff recorded the number of hours of use of either cold modality for each patient prior to hospital discharge. The average length of stay as an inpatient was 1.2 days for the CC group and 1.3 days for the ICE group.
Visual analog scales (VAS) for pain, satisfaction with the cold therapy, and quality of sleep were recorded preoperatively and postoperatively at 24 hours, 3 days, 7 days, and 14 days following surgery.
Continue to: The Wilcoxon rank-sum test...
STATISTICAL METHOD
The Wilcoxon rank-sum test was used to assess whether scores changed significantly from the preoperative period to the different postoperative time intervals, as well as to assess the values for pain, quality of sleep, and patient satisfaction. P-values <.05 were considered significant.
RESULTS
No differences were observed in the baseline characteristics between the 2 groups. Both groups showed improvements in pain, quality of sleep, and satisfaction with the cold therapy from the preoperative period to the final follow-up.
The VAS pain scores were not different between the CC and ICE groups preoperatively (5.9 vs 6.8; P = .121) or postoperatively at 24 hours (4.2 vs 4.3; P = .989), 3 days (4.8 vs 4.7; P = .944), 7 days (2.9 vs 3.3; P = .593), or 14 days (2.5 vs 2.7; P = .742). Both cohorts demonstrated improved overall pain throughout the study period. These findings are summarized in Table 2.
Table 2. Summary of VAS Pain Scores With Cold Therapy
| CC group (mean ± SD) | ICE group (mean ± SD) | P value | 95% CI |
Preoperative | 5.9 ± 4.1 | 6.8 ± 5.3 | .121 | 3.3-8.3 |
24 hours | 4.2 ± 3.0 | 4.3 ± 3.1 | .989 | 2.9-5.7 |
3 days | 4.8 ± 2.7 | 4.7 ± 3.2 | .944 | 3.2-6.3 |
7 days | 2.9 ± 1.8 | 3.3 ± 2.5 | .593 | 2.1-4.4 |
14 days | 2.5 ± 2.1 | 2.7 ± 1.8 | .742 | 1.5-3.6 |
Abbreviations: CC, continuous cryotherapy; CI, confidence interval; ICE, plain ice; VAS, visual analog scales.
The number of morphine equivalents of pain medication was not different between the CC and ICE groups postoperatively at 24 hours (43 vs 38 mg; P = .579), 3 days (149 vs 116 mg; P = .201), 7 days (308 vs 228 mg; P = .181), or 14 days (431 vs 348 mg; P = .213). Both groups showed increased narcotic consumption from 24 hours postoperatively until the 2-week follow-up. Narcotic consumption is summarized in Table 3.
Table 3. Summary of Narcotic Consumption in Morphine Equivalents
| CC group (mean ± SD) | ICE group (mean ± SD) | P value | 95% CI |
24 hours | 43.0 ± 36.7 | 38.0 ± 42.9 | .579 | 17.9-60.1 |
3 days | 149.0 ± 106.5 | 116.3 ± 108.9 | .201 | 63.4-198.7 |
7 days | 308.1 ± 234.0 | 228 ± 258.3 | .181 | 107.1-348.9 |
14 days | 430.8 ± 384.2 | 347.5 ± 493.4 | .213 | 116.6-610.6 |
Abbreviations: CC, continuous cryotherapy; CI, confidence interval; ICE, plain ice.
VAS for quality of sleep improved in both groups from 24 hours postoperatively until the final follow-up. However, no significant differences in sleep quality were observed between the CC and ICE groups postoperatively at 24 hours (5.1 vs 4.3; P = .382), 3 days (5.1 vs 5.3; P = .601), 7 days (6.0 vs 6.7; P = .319), or 14 days (6.5 vs 7.1; P = .348). The VAS scores for sleep quality are reported in Table 4.
Table 4. Summary of VAS Sleep Quality With Cold Therapya
| CC group (mean ± SD) | ICE group (mean ± SD) | P value | 95% CI |
24 hours | 5.1 ± 2.8 | 4.3 ± 2.4 | .382 | 3.2-6.4 |
3 days | 5.1 ± 1.9 | 5.3 ± 2.3 | .601 | 4.2-6.5 |
7 days | 6.0 ± 2.3 | 6.7 ± 2.1 | .319 | 4.9-7.7 |
14 days | 6.5 ± 2.3 | 7.1 ± 2.5 | .348 | 5.3-8.4 |
a0-10 rating with 10 being the highest possible score.
Abbreviations: CC, continuous cryotherapy; CI, confidence interval; ICE, plain ice; VAS, visual analog scales.
Continue to: Finally, VAS patient satisfaction...
Finally, VAS patient satisfaction scores were not different between the CC and ICE groups postoperatively at 24 hours (7.3 vs 6.1; P = .315), 3 days (6.1 vs 6.6; P = .698), 7 days (6.6 vs 6.9; P = .670), or 14 days (7.1 vs 6.3; P = .288).
While compliance within each group utilizing the randomly assigned cold modality was similar, the usage by the CC group was consistently higher at all time points recorded. No complications or reoperations were observed in either group.
DISCUSSION
The optimal method for managing postoperative pain from an arthroplasty procedure is controversial. This prospective randomized study attempted to confirm the hypothesis that CC infers better pain control, improves quality of sleep, and decreases narcotic usage compared to ICE in the first 2 weeks after a TSA procedure. The results of this study refuted our hypothesis, demonstrating no significant difference in pain control, satisfaction, narcotic usage, or sleep quality between the CC and ICE cohorts at all time points studied.
Studies on knees and lower extremities demonstrate equivocal results for the role CC plays in providing improved postoperative pain control. Thienpont10 evaluated CC in a randomized control trial comparing plain ice packs postoperatively in patients who underwent TKA. The author found no significant difference in VAS for pain or narcotic consumption in morphine equivalents. Thienpont10 recommended that CC not be used for outpatient knee arthroplasty as it is an additional cost that does not improve pain significantly. Healy and colleagues5 reported similar results that CC did not demonstrate a difference in narcotic requirement or pain control compared to plain ice packs, as well as no difference in local postoperative swelling or wound drainage. However, a recently published randomized trial by Su and colleagues11 comparing a cryopneumatic device and ICE with static compression in patients who underwent TKA demonstrated significantly lower narcotic consumption and increased ambulation distances in the treatment group. The treatment group consumed approximately 170 mg morphine equivalents less than the control group between discharge and the 2-week postoperative visit. In addition, a significant difference was observed in the satisfaction scores in the treatment group.11 Similarly, a meta-analysis by Raynor and colleagues12 on randomized clinical trials comparing cryotherapy to a placebo group after anterior cruciate ligament reconstruction showed that cryotherapy is associated with significantly lower postoperative pain (P = .02), but demonstrated no difference in postoperative drainage (P = .23) or range of motion (P = .25).
Although multiple studies have been published regarding the efficacy of cryotherapy after knee surgery, very few studies have compared CC to conventional ICE after shoulder surgery. A prospective randomized trial was performed by Singh and colleagues13 to compare CC vs no ICE in open and arthroscopic shoulder surgery patients. Both the open and arthroscopic groups receiving CC demonstrated significant reductions in pain frequency and more restful sleep at the 7-day, 14-day, and 21-day intervals compared to the control group. However, they did not compare the commercial unit to ICE. In contrast, a study by Kraeutler and colleagues8 randomized 46 patients to receive either CC or ICE in the setting of arthroscopic shoulder surgery. Although no significant difference was observed in morphine equivalent dosage between the 2 groups, the CC group used more pain medication on every postoperative day during the first week after surgery. They found no difference between the 2 groups with regards to narcotic consumption or pain scores. The results of this study mirror those by Kraeutler and colleagues,8 demonstrating no difference in pain scores, sleep quality, or narcotic consumption.
Continue to: With rising costs in the US...
With rising costs in the US healthcare system, a great deal of interest has developed in the application of value-based principles to healthcare. Value can be defined as a gain in benefits over the costs expended.14 The average cost for a commercial CC unit used in this study was $260. A pack of ICE is a nominal cost. Based on the results of this study, the cost of the commercial CC device may not be justified when compared to the cost of an ice pack.
The major strengths of this study are the randomized design and multiple data points during the early postoperative period. However, there are several limitations. First, we did not objectively measure compliance of either therapy and relied only on a patient survey. Usage of the commercial CC unit in hours decreased over half between days 3 and 14. This occurred despite training on the application and specific instructions. We believe this reflects “real-world” usage, but it is possible that compliance affected our results. Second, all patients in this study had a single-shot interscalene block. While this is standard at our institution, it is possible that either CC or ICE would have a more significant effect in the absence of an interscalene block. Finally, we did not evaluate final outcomes in this study and therefore cannot determine if the final outcome was different between the 2 groups. Our goal was simply to evaluate the first 2 weeks following surgery, as this is the most painful period following TSA.
CONCLUSION
There was no difference between CC and ICE in terms of pain control, quality of sleep, patient satisfaction, or narcotic consumption following TSA. CC may offer convenience advantages, but the increased cost associated with this type of unit may not be justified.
1. Kim SH, Wise BL, Zhang Y, Szabo RM. Increasing incidence of shoulder arthroplasty in the United States. J Bone Joint Surg Am. 2011;93(24):2249-2254. doi:10.2106/jbjs.j.01994.
2. Stalman A, Berglund L, Dungnerc E, Arner P, Fellander-Tsai L. Temperature sensitive release of prostaglandin E2 and diminished energy requirements in synovial tissue with postoperative cryotherapy: a prospective randomized study after knee arthroscopy. J Bone Joint Surg Am. 2011;93(21):1961-1968. doi:10.2016/jbjs.j.01790.
3. Levy AS, Marmar E. The role of cold compression dressings in the postoperative treatment of total knee arthroplasty. Clin Orthop Relat Res. 1993;297:174-178. doi:10.1097/00003086-199312000-00029.
4. Webb JM, Williams D, Ivory JP, Day S, Williamson DM. The use of cold compression dressings after total knee replacement: a randomized controlled trial. Orthopaedics 1998;21(1):59-61.
5. Healy WL, Seidman J, Pfeifer BA, Brown DG. Cold compressive dressing after total knee arthroplasty. Clin Orthop Relat Res. 1994;299:143-146. doi:10.1097/00003086-199402000-00019.
6. Whitelaw GP, DeMuth KA, Demos HA, Schepsis A, Jacques E. The use of Cryo/Cuff versus ice and elastic wrap in the postoperative care of knee arthroscopy patients. Am J Knee Surg. 1995;8(1):28-30.
7. Speer KP, Warren RF, Horowitz L. The efficacy of cryotherapy in the postoperative shoulder. J Shoulder Elbow Surg. 1996;5(1):62-68. doi:10.16/s1058-2746(96)80032-2.
8. Kraeutler MJ, Reynolds KA, Long C, McCarthy EC. Compressive cryotherapy versus ice- a prospective, randomized study on postoperative pain in patients undergoing arthroscopic rotator cuff repair or subacromial decompression. J Shoulder Elbow Surg. 2015;24(6):854-859. doi:10.1016/j.jse.2015.02.004.
9. DeFranco MJ, Higgins LD, Warner JP. Subscapularis management in open shoulder surgery. J Am Acad Orthop Surg. 2010;18(12):707-717. doi:10.5435/00124635-201012000-00001.
10. Thienpont E. Does advanced cryotherapy reduce pain and narcotic consumption after knee arthroplasty. Clin Orthop Relat Res. 2014;472(11):3417-3423. doi:10.1007/s11999-014-3810-8.
11. Su EP, Perna M, Boettner F, Mayman DJ, et al. A prospective, multicenter, randomized trial to evaluate the efficacy of a cryopneumatic device on total knee arthroplasty recovery. J Bone Joint Surg Br. 2012;94(11 Suppl A):153-156. doi:10.1302/0301-620x.94B11.30832.
12. Raynor MC, Pietrobon R, Guller U, Higgins LD. Cryotherapy after ACL reconstruction- a meta analysis. J Knee Surg. 2005;18(2):123-129. doi:10.1055/s-0030-1248169.
13. Singh H, Osbahr DC, Holovacs TF, Cawley PW, Speer KP. The efficacy of continuous cryotherapy on the postoperative shoulder: a prospective randomized investigation. J Shoulder Elbow Surg. 2001;10(6):522-525. doi:10.1067/mse.2001.118415.
14. Black EM, Higgins LD, Warner JP. Value based shoulder surgery: outcomes driven, cost-conscious care. J Shoulder Elbow Surg. 2013;22(7):1-10. doi:10.1016/j.se.2013.02.008.
ABSTRACT
Postoperative pain management is an important component of total shoulder arthroplasty (TSA). Continuous cryotherapy (CC) has been proposed as a means of improving postoperative pain control. However, CC represents an increased cost not typically covered by insurance. The purpose of this study is to compare CC to plain ice (ICE) following TSA. The hypothesis was that CC would lead to lower pain scores and decreased narcotic usage during the first 2 weeks postoperatively.
A randomized controlled trial was performed to compare CC to ICE. Forty patients were randomized to receive either CC or ICE following TSA. The rehabilitation and pain control protocols were otherwise standardized. Visual analog scales (VAS) for pain, satisfaction with cold therapy, and quality of sleep were recorded preoperatively and postoperatively at 24 hours, 3 days, 7 days, and 14 days following surgery. Narcotic usage in morphine equivalents was also recorded.
No significant differences in preoperative pain (5.9 vs 6.8; P = .121), or postoperative pain at 24 hours (4.2 vs 4.3; P = .989), 3 days (4.8 vs 4.7; P = .944), 7 days (2.9 vs 3.3; P = .593) or 14 days (2.5 vs 2.7; P = .742) were observed between the CC and ICE groups. Similarly, no differences in quality of sleep, satisfaction with the cold therapy, or narcotic usage at any time interval were observed between the 2 groups.
No differences in pain control, quality of sleep, patient satisfaction, or narcotic usage were detected between CC and ICE following TSA. CC may offer convenience as an advantage, but the increased cost associated with this type of treatment may not be justified.
The number of total shoulder arthroplasties (TSAs) performed annually is increasing dramatically.1 At the same time, there has been a push toward decreased length of hospital stay and earlier mobilization following joint replacement surgery. Central to these goals is adequate pain control. Multimodal pain pathways exist, and one of the safest and cheapest methods of pain control is cold therapy, which can be accomplished with continuous cryotherapy (CC) or plain ice (ICE).
Continue to: The mechanism of cryotherapy...
The mechanism of cryotherapy for controlling pain is poorly understood. Cryotherapy reduces leukocyte migration and slows down nerve signal transmission, which reduces inflammation, thereby producing a short-term analgesic effect. Stalman and colleagues2 reported on a randomized control study that evaluated the effects of postoperative cooling after knee arthroscopy. Measurements of metabolic and inflammatory markers in the synovial membrane were used to assess whether cryotherapy provides a temperature-sensitive release of prostaglandin E2. Cryotherapy lowered the temperature in the postoperative knee, and synovial prostaglandin concentrations were correlated with temperature. Because prostaglandin is a marker of inflammation and pain, the conclusion was that postoperative cooling appeared to have an anti-inflammatory effect.
The knee literature contains multiple studies that have examined the benefits of cryotherapy after both arthroscopic and arthroplasty procedures. The clinical benefits on pain have been equivocal with some studies showing improvements using cryotherapy3,4 and others showing no difference in the treatment group.5,6
Few studies have examined cryotherapy for the shoulder. Speer and colleagues7 demonstrated that postoperative use of CC was effective in reducing recovery time after shoulder surgery. However; they did not provide an ICE comparative group and did not focus specifically on TSA. In another study, Kraeutler and colleagues8 examined only arthroscopic shoulder surgery cases in a randomized prospective trial and found no significant different between CC and ICE. They concluded that there did not appear to be a significant benefit in using CC over ICE for arthroscopic shoulder procedures.
The purpose of this study is to prospectively evaluate CC and ICE following TSA. The hypothesis was that CC leads to improved pain control, less narcotic consumption, and improved quality of sleep compared to ICE in the immediate postoperative period following TSA.
MATERIALS AND METHODS
This was a prospective randomized control study of patients undergoing TSA receiving either CC or ICE postoperatively. Institutional Review Board approval was obtained before commencement of the study. Inclusion criteria included patients aged 30 to 90 years old undergoing a primary or revision shoulder arthroplasty procedure between June 2015 and January 2016. Exclusion criteria included hemiarthroplasty procedures.
Continue to: Three patients refused...
Three patients refused to participate in the study. Enrollment was performed until 40 patients were enrolled in the study (20 patients in each group). Randomization was performed with a random number generator, and patients were assigned to a treatment group following consent to participate. Complete follow-up was available for all patients. There were 13 (65%) male patients in the CC group. The average age of the CC group at the time of surgery was 68.7 years (range). There were 11 male patients in the ICE group. The average age of the ICE group at the time of surgery was 73.2 years (range). The dominant extremity was involved in 9 (45%) patients in the CC group and in 11 patients (55%) in the ICE group. Surgical case specifics are summarized in Table 1.
Table 1. Summary of Surgical Cases
| CC group (n = 20) | ICE group (n = 20) |
Primary TSA | 7 (35%) | 9 (45%) |
Primary RSA | 12 (60%) | 9 (45%) |
Revision arthroplasty | 1 (5%) | 2 (10%) |
Abbreviations: CC, continuous cryotherapy; ICE, plain ice; RSA, reverse shoulder arthroplasty; TSA, total shoulder arthroplasty.
All surgeries were performed by Dr. Denard. All patients received a single-shot interscalene nerve block prior to the procedure. A deltopectoral approach was utilized, and the subscapularis was managed with the peel technique.9 All patients were admitted to the hospital following surgery. Standard postoperative pain control consisted of as-needed intravenous morphine (1-2 mg every 2 hours, as needed) or an oral narcotic (hydrocodone/acetaminophen 5/325mg, 1-2 every 4 hours, as needed) which was also provided at discharge. However, total narcotic usage was recorded in morphine equivalents to account for substitutions. No non-steroidal anti-inflammatory drugs were allowed until 3 months postoperatively.
The CC group received treatment from a commercially available cryotherapy unit (Polar Care; Breg). All patients received instructions by a medical professional on how to use the unit. The unit was applied immediately postoperatively and set at a temperature of 45°F to 55°F. Patients were instructed to use the unit continuously during postoperative days 0 to 3. This cryotherapy was administered by a nurse while in the hospital but was left to the responsibility of the patient upon discharge. Patients were instructed to use the unit as needed for pain control during the day and continuously while asleep from days 4 to14.
The ICE group used standard ice packs postoperatively. The patients were instructed to apply an ice pack for 20 min every 2 hours while awake during days 0 to 3. This therapy was administered by a nurse while in the hospital but left to the responsibility of the patient upon discharge. Patients were instructed to use ice packs as needed for pain control during the day at a maximum of 20 minutes per hour on postoperative days 4 to 14. Compliance by both groups was monitored using a patient survey after hospital discharge. The number of hours that patients used either the CC or ICE per 24-hour period was recorded at 24 hours, 3 days, 7 days, and 14 days. The nursing staff recorded the number of hours of use of either cold modality for each patient prior to hospital discharge. The average length of stay as an inpatient was 1.2 days for the CC group and 1.3 days for the ICE group.
Visual analog scales (VAS) for pain, satisfaction with the cold therapy, and quality of sleep were recorded preoperatively and postoperatively at 24 hours, 3 days, 7 days, and 14 days following surgery.
Continue to: The Wilcoxon rank-sum test...
STATISTICAL METHOD
The Wilcoxon rank-sum test was used to assess whether scores changed significantly from the preoperative period to the different postoperative time intervals, as well as to assess the values for pain, quality of sleep, and patient satisfaction. P-values <.05 were considered significant.
RESULTS
No differences were observed in the baseline characteristics between the 2 groups. Both groups showed improvements in pain, quality of sleep, and satisfaction with the cold therapy from the preoperative period to the final follow-up.
The VAS pain scores were not different between the CC and ICE groups preoperatively (5.9 vs 6.8; P = .121) or postoperatively at 24 hours (4.2 vs 4.3; P = .989), 3 days (4.8 vs 4.7; P = .944), 7 days (2.9 vs 3.3; P = .593), or 14 days (2.5 vs 2.7; P = .742). Both cohorts demonstrated improved overall pain throughout the study period. These findings are summarized in Table 2.
Table 2. Summary of VAS Pain Scores With Cold Therapy
| CC group (mean ± SD) | ICE group (mean ± SD) | P value | 95% CI |
Preoperative | 5.9 ± 4.1 | 6.8 ± 5.3 | .121 | 3.3-8.3 |
24 hours | 4.2 ± 3.0 | 4.3 ± 3.1 | .989 | 2.9-5.7 |
3 days | 4.8 ± 2.7 | 4.7 ± 3.2 | .944 | 3.2-6.3 |
7 days | 2.9 ± 1.8 | 3.3 ± 2.5 | .593 | 2.1-4.4 |
14 days | 2.5 ± 2.1 | 2.7 ± 1.8 | .742 | 1.5-3.6 |
Abbreviations: CC, continuous cryotherapy; CI, confidence interval; ICE, plain ice; VAS, visual analog scales.
The number of morphine equivalents of pain medication was not different between the CC and ICE groups postoperatively at 24 hours (43 vs 38 mg; P = .579), 3 days (149 vs 116 mg; P = .201), 7 days (308 vs 228 mg; P = .181), or 14 days (431 vs 348 mg; P = .213). Both groups showed increased narcotic consumption from 24 hours postoperatively until the 2-week follow-up. Narcotic consumption is summarized in Table 3.
Table 3. Summary of Narcotic Consumption in Morphine Equivalents
| CC group (mean ± SD) | ICE group (mean ± SD) | P value | 95% CI |
24 hours | 43.0 ± 36.7 | 38.0 ± 42.9 | .579 | 17.9-60.1 |
3 days | 149.0 ± 106.5 | 116.3 ± 108.9 | .201 | 63.4-198.7 |
7 days | 308.1 ± 234.0 | 228 ± 258.3 | .181 | 107.1-348.9 |
14 days | 430.8 ± 384.2 | 347.5 ± 493.4 | .213 | 116.6-610.6 |
Abbreviations: CC, continuous cryotherapy; CI, confidence interval; ICE, plain ice.
VAS for quality of sleep improved in both groups from 24 hours postoperatively until the final follow-up. However, no significant differences in sleep quality were observed between the CC and ICE groups postoperatively at 24 hours (5.1 vs 4.3; P = .382), 3 days (5.1 vs 5.3; P = .601), 7 days (6.0 vs 6.7; P = .319), or 14 days (6.5 vs 7.1; P = .348). The VAS scores for sleep quality are reported in Table 4.
Table 4. Summary of VAS Sleep Quality With Cold Therapya
| CC group (mean ± SD) | ICE group (mean ± SD) | P value | 95% CI |
24 hours | 5.1 ± 2.8 | 4.3 ± 2.4 | .382 | 3.2-6.4 |
3 days | 5.1 ± 1.9 | 5.3 ± 2.3 | .601 | 4.2-6.5 |
7 days | 6.0 ± 2.3 | 6.7 ± 2.1 | .319 | 4.9-7.7 |
14 days | 6.5 ± 2.3 | 7.1 ± 2.5 | .348 | 5.3-8.4 |
a0-10 rating with 10 being the highest possible score.
Abbreviations: CC, continuous cryotherapy; CI, confidence interval; ICE, plain ice; VAS, visual analog scales.
Continue to: Finally, VAS patient satisfaction...
Finally, VAS patient satisfaction scores were not different between the CC and ICE groups postoperatively at 24 hours (7.3 vs 6.1; P = .315), 3 days (6.1 vs 6.6; P = .698), 7 days (6.6 vs 6.9; P = .670), or 14 days (7.1 vs 6.3; P = .288).
While compliance within each group utilizing the randomly assigned cold modality was similar, the usage by the CC group was consistently higher at all time points recorded. No complications or reoperations were observed in either group.
DISCUSSION
The optimal method for managing postoperative pain from an arthroplasty procedure is controversial. This prospective randomized study attempted to confirm the hypothesis that CC infers better pain control, improves quality of sleep, and decreases narcotic usage compared to ICE in the first 2 weeks after a TSA procedure. The results of this study refuted our hypothesis, demonstrating no significant difference in pain control, satisfaction, narcotic usage, or sleep quality between the CC and ICE cohorts at all time points studied.
Studies on knees and lower extremities demonstrate equivocal results for the role CC plays in providing improved postoperative pain control. Thienpont10 evaluated CC in a randomized control trial comparing plain ice packs postoperatively in patients who underwent TKA. The author found no significant difference in VAS for pain or narcotic consumption in morphine equivalents. Thienpont10 recommended that CC not be used for outpatient knee arthroplasty as it is an additional cost that does not improve pain significantly. Healy and colleagues5 reported similar results that CC did not demonstrate a difference in narcotic requirement or pain control compared to plain ice packs, as well as no difference in local postoperative swelling or wound drainage. However, a recently published randomized trial by Su and colleagues11 comparing a cryopneumatic device and ICE with static compression in patients who underwent TKA demonstrated significantly lower narcotic consumption and increased ambulation distances in the treatment group. The treatment group consumed approximately 170 mg morphine equivalents less than the control group between discharge and the 2-week postoperative visit. In addition, a significant difference was observed in the satisfaction scores in the treatment group.11 Similarly, a meta-analysis by Raynor and colleagues12 on randomized clinical trials comparing cryotherapy to a placebo group after anterior cruciate ligament reconstruction showed that cryotherapy is associated with significantly lower postoperative pain (P = .02), but demonstrated no difference in postoperative drainage (P = .23) or range of motion (P = .25).
Although multiple studies have been published regarding the efficacy of cryotherapy after knee surgery, very few studies have compared CC to conventional ICE after shoulder surgery. A prospective randomized trial was performed by Singh and colleagues13 to compare CC vs no ICE in open and arthroscopic shoulder surgery patients. Both the open and arthroscopic groups receiving CC demonstrated significant reductions in pain frequency and more restful sleep at the 7-day, 14-day, and 21-day intervals compared to the control group. However, they did not compare the commercial unit to ICE. In contrast, a study by Kraeutler and colleagues8 randomized 46 patients to receive either CC or ICE in the setting of arthroscopic shoulder surgery. Although no significant difference was observed in morphine equivalent dosage between the 2 groups, the CC group used more pain medication on every postoperative day during the first week after surgery. They found no difference between the 2 groups with regards to narcotic consumption or pain scores. The results of this study mirror those by Kraeutler and colleagues,8 demonstrating no difference in pain scores, sleep quality, or narcotic consumption.
Continue to: With rising costs in the US...
With rising costs in the US healthcare system, a great deal of interest has developed in the application of value-based principles to healthcare. Value can be defined as a gain in benefits over the costs expended.14 The average cost for a commercial CC unit used in this study was $260. A pack of ICE is a nominal cost. Based on the results of this study, the cost of the commercial CC device may not be justified when compared to the cost of an ice pack.
The major strengths of this study are the randomized design and multiple data points during the early postoperative period. However, there are several limitations. First, we did not objectively measure compliance of either therapy and relied only on a patient survey. Usage of the commercial CC unit in hours decreased over half between days 3 and 14. This occurred despite training on the application and specific instructions. We believe this reflects “real-world” usage, but it is possible that compliance affected our results. Second, all patients in this study had a single-shot interscalene block. While this is standard at our institution, it is possible that either CC or ICE would have a more significant effect in the absence of an interscalene block. Finally, we did not evaluate final outcomes in this study and therefore cannot determine if the final outcome was different between the 2 groups. Our goal was simply to evaluate the first 2 weeks following surgery, as this is the most painful period following TSA.
CONCLUSION
There was no difference between CC and ICE in terms of pain control, quality of sleep, patient satisfaction, or narcotic consumption following TSA. CC may offer convenience advantages, but the increased cost associated with this type of unit may not be justified.
1. Kim SH, Wise BL, Zhang Y, Szabo RM. Increasing incidence of shoulder arthroplasty in the United States. J Bone Joint Surg Am. 2011;93(24):2249-2254. doi:10.2106/jbjs.j.01994.
2. Stalman A, Berglund L, Dungnerc E, Arner P, Fellander-Tsai L. Temperature sensitive release of prostaglandin E2 and diminished energy requirements in synovial tissue with postoperative cryotherapy: a prospective randomized study after knee arthroscopy. J Bone Joint Surg Am. 2011;93(21):1961-1968. doi:10.2016/jbjs.j.01790.
3. Levy AS, Marmar E. The role of cold compression dressings in the postoperative treatment of total knee arthroplasty. Clin Orthop Relat Res. 1993;297:174-178. doi:10.1097/00003086-199312000-00029.
4. Webb JM, Williams D, Ivory JP, Day S, Williamson DM. The use of cold compression dressings after total knee replacement: a randomized controlled trial. Orthopaedics 1998;21(1):59-61.
5. Healy WL, Seidman J, Pfeifer BA, Brown DG. Cold compressive dressing after total knee arthroplasty. Clin Orthop Relat Res. 1994;299:143-146. doi:10.1097/00003086-199402000-00019.
6. Whitelaw GP, DeMuth KA, Demos HA, Schepsis A, Jacques E. The use of Cryo/Cuff versus ice and elastic wrap in the postoperative care of knee arthroscopy patients. Am J Knee Surg. 1995;8(1):28-30.
7. Speer KP, Warren RF, Horowitz L. The efficacy of cryotherapy in the postoperative shoulder. J Shoulder Elbow Surg. 1996;5(1):62-68. doi:10.16/s1058-2746(96)80032-2.
8. Kraeutler MJ, Reynolds KA, Long C, McCarthy EC. Compressive cryotherapy versus ice- a prospective, randomized study on postoperative pain in patients undergoing arthroscopic rotator cuff repair or subacromial decompression. J Shoulder Elbow Surg. 2015;24(6):854-859. doi:10.1016/j.jse.2015.02.004.
9. DeFranco MJ, Higgins LD, Warner JP. Subscapularis management in open shoulder surgery. J Am Acad Orthop Surg. 2010;18(12):707-717. doi:10.5435/00124635-201012000-00001.
10. Thienpont E. Does advanced cryotherapy reduce pain and narcotic consumption after knee arthroplasty. Clin Orthop Relat Res. 2014;472(11):3417-3423. doi:10.1007/s11999-014-3810-8.
11. Su EP, Perna M, Boettner F, Mayman DJ, et al. A prospective, multicenter, randomized trial to evaluate the efficacy of a cryopneumatic device on total knee arthroplasty recovery. J Bone Joint Surg Br. 2012;94(11 Suppl A):153-156. doi:10.1302/0301-620x.94B11.30832.
12. Raynor MC, Pietrobon R, Guller U, Higgins LD. Cryotherapy after ACL reconstruction- a meta analysis. J Knee Surg. 2005;18(2):123-129. doi:10.1055/s-0030-1248169.
13. Singh H, Osbahr DC, Holovacs TF, Cawley PW, Speer KP. The efficacy of continuous cryotherapy on the postoperative shoulder: a prospective randomized investigation. J Shoulder Elbow Surg. 2001;10(6):522-525. doi:10.1067/mse.2001.118415.
14. Black EM, Higgins LD, Warner JP. Value based shoulder surgery: outcomes driven, cost-conscious care. J Shoulder Elbow Surg. 2013;22(7):1-10. doi:10.1016/j.se.2013.02.008.
TAKE-HOME POINTS
- CC has been proposed as a means of improving postoperative pain control.
- CC represents a cost typically not covered by insurances.
- No difference was noted between the 2 groups in quality of sleep, satisfaction with the cold therapy, or narcotic usage at any time interval.
- While CC may offer convenience advantages, the increased cost associated with this type of unit may not be justified.
- The mechanism for CC for pain control is poorly understood.

Mental Health Conditions and Unplanned Hospital Readmissions in Children
Readmission prevention is a focus of national efforts to improve the quality of hospital care for children.1-5 Several factors contribute to the risk of readmission for hospitalized children, including age, race or ethnicity, payer, and the type and number of comorbid health conditions.6-9 Mental health conditions (MHCs) are a prevalent comorbidity in children hospitalized for physical health reasons that could influence their postdischarge health and safety.
MHCs are increasingly common in children hospitalized for physical health indications; a comorbid MHC is currently present in 10% to 25% of hospitalized children ages 3 years and older.10,11 Hospital length of stay (LOS) and cost are higher in children with an MHC.12,13 Increased resource use may occur because MHCs can impede hospital treatment effectiveness and the child’s recovery from physical illness. MHCs are associated with a lower adherence with medications14-16 and a lower ability to cope with health events and problems.17-19 In adults, MHCs are a well-established risk factor for hospital readmission for a variety of physical health conditions.20-24 Although the influence of MHCs on readmissions in children has not been extensively investigated, higher readmission rates have been reported in adolescents hospitalized for diabetes with an MHC compared with those with no MHC.25,26
To our knowledge, no large studies have examined the relationship between the presence of a comorbid MHC and hospital readmissions in children or adolescents hospitalized for a broad array of medical or procedure conditions. Therefore, we conducted this study to (1) assess the likelihood of 30-day hospital readmission in children with versus without MHC who were hospitalized for one of 10 medical or 10 procedure conditions, and (2) to assess which MHCs are associated with the highest likelihood of hospital readmission.
METHODS
Study Design and Setting
We conducted a national, retrospective cohort study of index hospitalizations for children ages 3 to 21 years who were discharged from January 1, 2013, to November 30, 2013, in the Agency for Healthcare Research and Quality’s (AHRQ) Nationwide Readmissions Database (NRD). Admissions occurring in December 2013 were excluded because they did not have a 30-day timeframe available for readmission measurement. The 2013 NRD includes administrative data for a nationally representative sample of 14 million hospitalizations in 21 states, accounting for 49% of all US hospitalizations and weighted to represent 35.6 million hospitalizations. The database includes deidentified, verified patient linkage numbers so that patients can be tracked across multiple hospitalizations at the same institution or different institutions within a state. The NRD includes hospital information, patient demographic information, and the International Classification of Diseases, 9th Revision-Clinical Modification (ICD-9-CM) discharge diagnoses and procedures, with 1 primary diagnosis and up to 24 additional fields for comorbid diagnoses. This study was approved for exemption by the Children’s Hospital of Philadelphia Institutional Review Board.
Index Admissions
We used the methods described below to create a study cohort of the 10 medical and 10 procedure index admissions associated with the highest volume (ie, the greatest absolute number) of 30-day hospital readmissions. Conditions with a high volume of readmissions were chosen in an effort to identify conditions in which readmission-prevention interventions had the greatest potential to reduce the absolute number of readmissions. We first categorized index hospitalizations for medical and procedure conditions by using the All Patient Refined Diagnosis Related Groups (APR-DRGs; 3M Health Information Systems, Wallingford, CT).27 APR-DRGs use all diagnosis and/or procedure ICD-9-CM codes registered for a hospital discharge to assign 1 reason that best explains the need for hospitalization. We then excluded obstetric hospitalizations, psychiatric hospitalizations, and hospitalizations resulting in death or transfer from being considered as index admissions. Afterwards, we ranked each APR-DRG index hospitalization by the total number of 30-day hospital readmissions that occurred afterward and selected the 10 medical and 10 procedure index admissions with the highest number of readmissions. The APR-DRG index admissions are listed in Figures 1 and 2. For the APR-DRG “digestive system diagnoses,” the most common diagnosis was constipation, and we refer to that category as “constipation.” The most common diagnosis for the APR-DRG called “other operating room procedure for neoplasm” was tumor biopsy, and we refer to that category as “tumor biopsy.”
Main Outcome Measure
The primary study outcome was unplanned, all-cause readmission to any hospital within 30 days of index hospitalization. All-cause readmissions include any hospitalization for the same or different condition as the index admission, including conditions not eligible to be considered as index admissions (obstetric, psychiatric, and hospitalizations resulting in death or transfer). Planned readmissions, identified by using pediatric-specific measure specifications endorsed by AHRQ and the National Quality Forum,28 were excluded from measurement. For index admissions with multiple 30-day readmissions, only the first readmission was counted. Each readmission was treated as an index admission.
Main Independent Variable
The main independent variable was the presence of an MHC documented during the index hospitalization. MHCs were identified and classified into diagnosis categories derived from the AHRQ Chronic Condition Indicator system by using ICD-9-CM codes.29 MHC categories included anxiety disorders, attention-deficit/hyperactivity disorder (ADHD), autism, depression, and substance abuse. Less common MHCs included bipolar disorder, schizophrenia, disruptive behavior disorders, somatoform disorders, and eating disorders. These conditions are included in the group with any MHC, but we did not calculate the adjusted odds ratios (AORs) of readmission for these conditions. Children were identified as having multiple MHCs if they had more than 1 MHC.
Other Characteristics of Index Hospitalizations
A priori, we selected for analysis the known demographic, clinical, and hospital factors associated with the risk of readmission.20-24 The demographic characteristics included patient age, gender, payer category, urban or rural residence, and the median income quartile for a patient’s ZIP code. The hospital characteristics included location, ownership, and teaching hospital designation. The clinical characteristics included the number of chronic conditions30 and indicators for the presence of a complex chronic condition in each of 12 organ systems.31
Statistical Analysis
We calculated descriptive summary statistics for the characteristics of index hospitalizations. We compared characteristics in index admissions of children with versus without MHC by using Wilcoxon Rank-Sum tests for continuous variables and Wald χ2 tests for categorical variables. In the multivariable analysis, we derived logistic regression models to assess the relationship of 30-day hospital readmission with each type of MHC, adjusting for index admission demographic, hospital, and clinical characteristics. MHCs were modeled as binary indicator variables with the presence of any MHC, more than 1 MHC, or each of 5 MHC categories (anxiety disorders, ADHD, autism, depression, substance abuse) compared with no MHC. Four types of logistic regression models were derived (1) for the combined sample of all 10 index medical admissions with each MHC category versus no MHC as a primary predictor, (2) for each medical index admission with any MHC versus no MHC as the primary predictor, (3) for the combined sample of all 10 index procedure admissions with each MHC category versus no MHC as a primary predictor, and (4) for each procedure index admission with any MHC versus no MHC as the primary predictor. All analyses were weighted to achieve national estimates and clustered by hospital by using AHRQ-recommended survey procedures. SAS version 9.4 (SAS Institute, Cary, NC) was used for all analyses. All tests were two-sided, and a P < .05 was
considered statistically significant.
RESULTS
Study Population
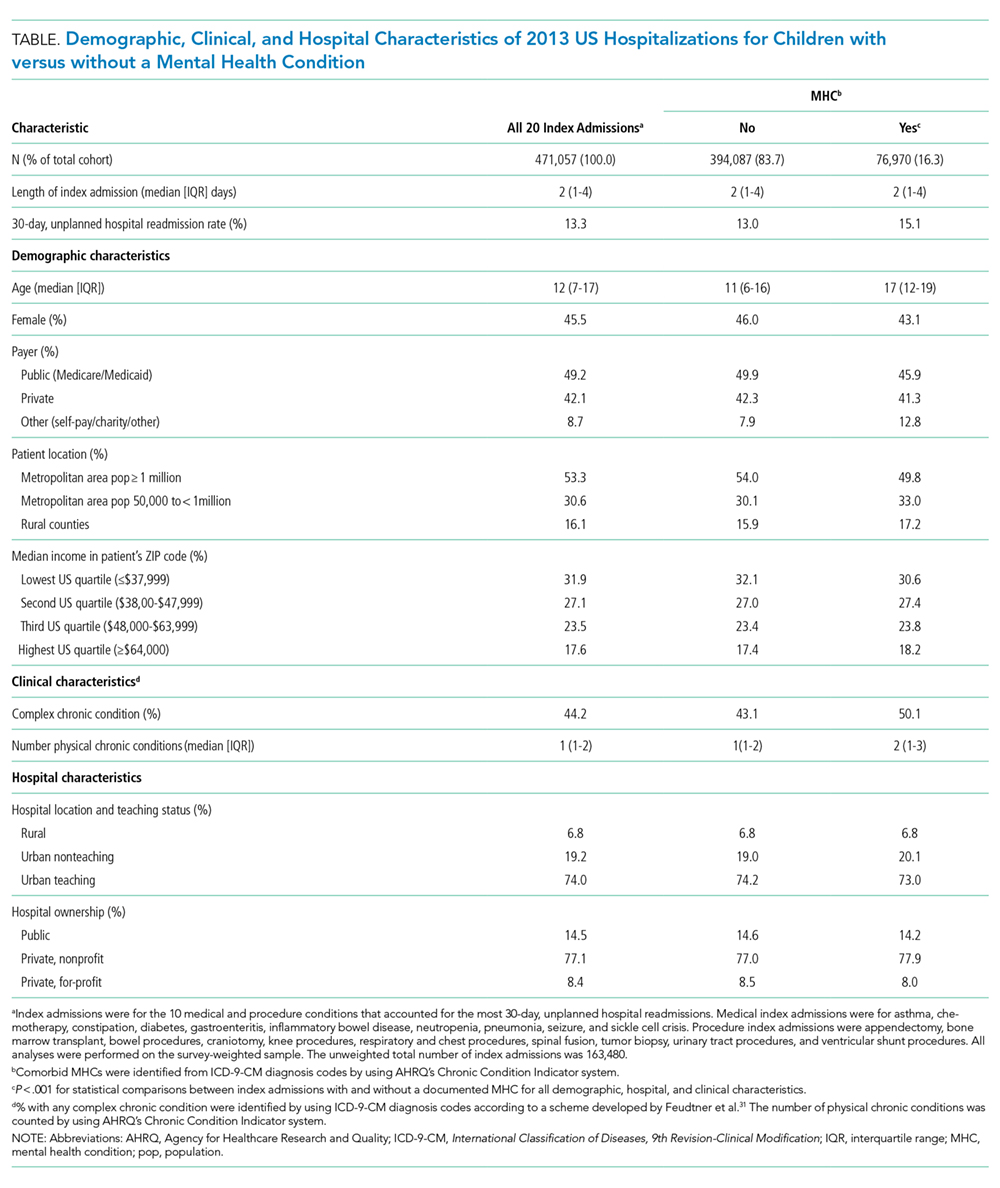
Across all index admissions, 16.3% were for children with an MHC. Overall, children with MHCs were older and more likely to have a chronic30 or complex chronic31 physical health condition than children with no MHCs (Table).
Index Medical Admissions, Mental Health Conditions, and Hospital Readmission
The 10 index medical hospitalizations with the most readmissions for children ages 3 to 20 years were asthma, chemotherapy, constipation, diabetes, gastroenteritis, inflammatory bowel disease, neutropenia, pneumonia, seizure, and sickle cell crisis. Across all index medical hospitalizations, 17.5% were for patients with an MHC (Figure 1). Of index medical admissions with any MHC, 26.3% had ADHD, 22.9% had an anxiety disorder, 14.9% had autism, 18.3% had depression, and 30.9% had substance abuse. Among all admissions with MHCs, 28.9% had 2 or more MHCs.
Index Medical Admissions Combined
For all index medical hospitalizations combined, 17.0% (n = 59,138) had an unplanned, 30-day hospital readmission. The rate of 30-day hospital readmissions was higher with versus without an MHC (17.5 vs 16.8%; P < .001). In a multivariable analysis, presence of an MHC was associated with a higher likelihood of hospital readmission following an index medical admission (AOR, 1.23; 95% confidence interval [CI], 1.19-1.26); Figure 1). All MHCs except autism and ADHD had a higher likelihood of readmission (Figure 3).
Specific Index Medical Admissions
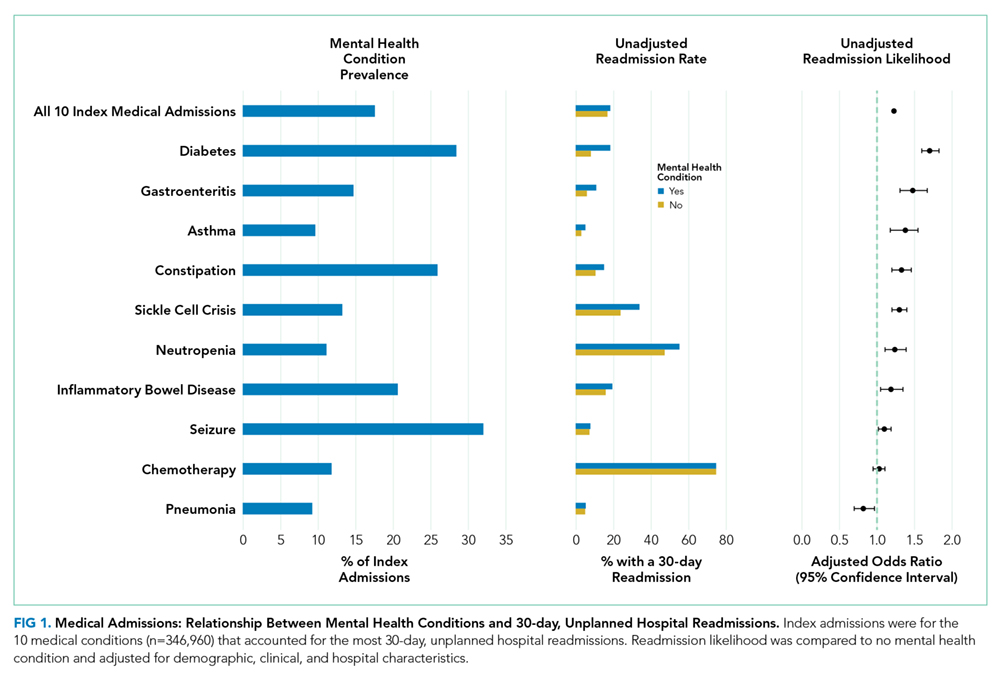
Index Procedure Admissions, Mental Health Conditions, and Hospital Readmission
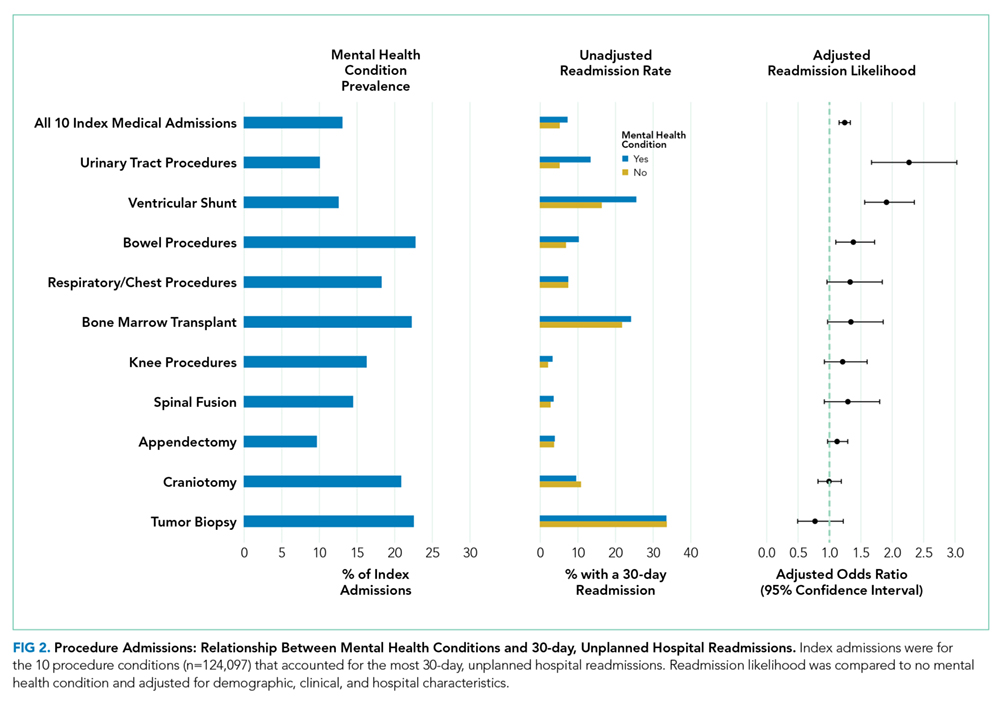
Index Procedure Admissions Combined

Specific Index Procedure Admissions
For specific index procedure admissions, the rate of 30-day hospital readmission ranged from 2.2% for knee procedures to 33.6% for tumor biopsy. For 3 (ie, urinary tract, ventricular shunt, and bowel procedures) of the 10 specific index procedure hospitalizations, having an MHC was associated with higher adjusted odds of 30-day readmission (AOR range, 1.38-2.27; Figure 2).
In total, adjusting for sociodemographic, clinical, and hospital characteristics, MHCs were associated with an additional 2501 medical readmissions and 217 procedure readmissions beyond what would have been expected if MHCs were not associated with readmissions.
DISCUSSION
MHCs are common among pediatric hospitalizations with the highest volume of readmissions; MHCs were present in approximately 1 in 5 medical and 1 in 7 procedure index hospitalizations. Across medical and procedure admissions, the adjusted likelihood of unplanned, all-cause 30-day readmission was 25% higher for children with versus without an MHC. The readmission likelihood varied by the type of medical or procedure admission and by the type of MHC. MHCs had the strongest associations with readmissions following hospitalization for diabetes and urinary tract procedures. The MHC categories associated with the highest readmission likelihood were depression, substance abuse, and multiple MHCs.
The current study complements existing literature by helping establish MHCs as a prevalent and important risk factor for hospital readmission in children. Estimates of the prevalence of MHCs in hospitalized children are between 10% and 25%,10,11,32 and prevalence has increased by as much as 160% over the last 10 years.29 Prior investigations have found that children with an MHC tend to stay longer in the hospital compared with children with no MHC.32 Results from the present study suggest that children with MHCs also experience more inpatient days because of rehospitalizations. Subsequent investigations should strive to understand the mechanisms in the hospital, community, and family environment that are responsible for the increased inpatient utilization in children with MHCs. Understanding how the receipt of mental health services before, during, and after hospitalization influences readmissions could help identify opportunities for practice improvement. Families report the need for better coordination of their child’s medical and mental health care,33 and opportunities exist to improve attendance at mental health visits after acute care encounters.34 Among adults, interventions that address posthospital access to mental healthcare have prevented readmissions.35
Depression was associated with an increased risk of readmission in medical and procedure hospitalizations. As a well-known risk factor for readmission in adult patients,21 depression can adversely affect and exacerbate the physical health recovery of patients experiencing acute and chronic illnesses.14,36,37 Depression is considered a modifiable contributor that, when controlled, may help lower readmission risk. Optimal adherence with behavior and medication treatment for depression is associated with a lower risk of unplanned 30-day readmissions.14-16,19 Emerging evidence demonstrates how multifaceted, psychosocial approaches can improve patients’ adherence with depression treatment plans.38 Increased attention to depression in hospitalized children may uncover new ways to manage symptoms as children transition from hospital to home.
Other MHCs were associated with a different risk of readmission among medical and procedure hospitalizations. For example, ADHD or autism documented during index hospitalization was associated with an increased risk of readmission following procedure hospitalizations and a decreased risk following medical hospitalizations. Perhaps children with ADHD or autism who exhibit hyperactive, impulsive, or repetitive behaviors39,40 are at risk for disrupting their postprocedure wound healing, nutrition recovery, or pain tolerance, which might contribute to increased readmission risk.
MHCs were associated with different readmission risks across specific types of medical or procedure hospitalizations. For example, among medical conditions, the association of readmissions with MHCs was highest for diabetes, which is consistent with prior research.26 Factors that might mediate this relationship include changes in diet and appetite, difficulty with diabetes care plan adherence, and intentional nonadherence as a form of self-harm. Similarly, a higher risk of readmission in chronic medical conditions like asthma, constipation, and sickle cell disease might be mediated by difficulty adhering to medical plans or managing exacerbations at home. In contrast, MHCs had no association with readmission following chemotherapy. In our clinical experience, readmissions following chemotherapy are driven by physiologic problems, such as thrombocytopenia, fever, and/or neutropenia. MHCs might have limited influence over those health issues. For procedure hospitalizations, MHCs had 1 of the strongest associations with ventricular shunt procedures. We hypothesize that MHCs might lead some children to experience general health symptoms that might be associated with shunt malfunction (eg, fatigue, headache, behavior change), which could lead to an increased risk of readmission to evaluate for shunt malfunction. Conversely, we found no relationship between MHCs and readmissions following appendectomy. For appendectomy, MHCs might have limited influence over the development of postsurgical complications (eg, wound infection or ileus). Future research to better elucidate mediators of increased risk of readmission associated with MHCs in certain medical and procedure conditions could help explain these relationships and identify possible future intervention targets to prevent readmissions.
This study has several limitations. The administrative data are not positioned to discover the mechanisms by which MHCs are associated with a higher likelihood of readmission. We used hospital ICD-9-CM codes to identify patients with MHCs. Other methods using more clinically rich data (eg, chart review, prescription medications, etc.) may be preferable to identify patients with MHCs. Although the use of ICD-9-CM codes may have sufficient specificity, some hospitalized children may have an MHC that is not coded. Patients identified by using diagnosis codes could represent patients with a higher severity of illness, patients using medications, or patients whose outpatient records are accessible to make the hospital team aware of the MHC. If documentation of MHCs during hospitalization represents a higher severity of illness, findings may not extrapolate to lower-severity MHCs. As hospitals transition from ICD-9 -CM to ICD-10 coding, and health systems develop more integrated inpatient and outpatient EHRs, diagnostic specificity may improve. We could not analyze the relationships with several potential confounders and explanatory variables that may be related both to the likelihood of having an MHC and the risk of readmission, including medication administration, psychiatric consultation, and parent mental health. Postdischarge health services, including access to a medical home or a usual source of mental healthcare and measures of medication adherence, were not available in the NRD.
Despite these limitations, the current study underscores the importance of MHCs in hospitalized children upon discharge. As subsequent investigations uncover the key drivers explaining the influence of MHCs on hospital readmission risk, hospitals and their local outpatient and community practices may find it useful to consider MHCs when (1) developing contingency plans and establishing follow-up care at discharge,41 (2) exploring opportunities of care integration between mental and physical health care professionals, and (3) devising strategies to reduce hospital readmissions among populations of children.
CONCLUSIONS
MHCs are prevalent in hospitalized children and are associated with an increased risk of 30-day, unplanned hospital readmission. Future readmission prevention efforts may uncover new ways to improve children’s transitions from hospital to home by investigating strategies to address their MHCs.
Acknowledgments
The authors thank Donjo Lau and Troy Richardson for their assistance with the analysis.
Disclosures
Dr. Doupnik was supported by a Ruth L. Kirschstein National Research Service Award institutional training grant (T32-HP010026), funded by the National Institutes of Health. Dr. Zima was supported by the Behavioral Health Centers of Excellence for California (SB852). Dr. Bardach was supported by the National Institute of Child Health and Human Development (K23-HD065836). Dr. Berry was supported by the Agency for Healthcare Research and Quality (R21 HS023092-01). The authors have no financial relationships relevant to this article to disclose. The authors have no potential conflicts of interest to disclose. Dr. Doupnik led the study design and analysis and drafted the initial manuscript. Mr. Lawlor performed the data analysis. Dr. Hall provided statistical consultation. All authors participated in the design of the study, interpretation of the data, revised the manuscript for key intellectual content, and all authors read and approved the final manuscript.
1. Dougherty D, Schiff J, Mangione-Smith R. The Children’s Health Insurance Program Reauthorization Act quality measures initiatives: moving forward to improve measurement, care, and child and adolescent outcomes. Acad Pediatr. 2011;11(3):S1-S10. PubMed
2. Bardach NS, Vittinghoff E, Asteria-Penaloza R, et al. Measuring Hospital Quality Using Pediatric Readmission and Revisit Rates. Pediatrics. 2013;132(3):429-436. doi:10.1542/peds.2012-3527. PubMed
3. Khan A, Nakamura MM, Zaslavsky AM, et al. Same-Hospital Readmission Rates as a Measure of Pediatric Quality of Care. JAMA Pediatr. 2015;169(10):905-912. doi:10.1001/jamapediatrics.2015.1129. PubMed
4. Fassl BA, Nkoy FL, Stone BL, et al. The Joint Commission Children’s Asthma Care quality measures and asthma readmissions. Pediatrics. 2012;130(3):482-491. doi:10.1542/peds.2011-3318. PubMed
5. Hain PD, Gay JC, Berutti TW, Whitney GM, Wang W, Saville BR. Preventability of Early Readmissions at a Children’s Hospital. Pediatrics. 2013;131(1):e171-e181. doi:10.1542/peds.2012-0820. PubMed
6. Nagasako E, Reidhead B, Waterman B, et al. Adding Socioeconomic Data to Hospital Readmissions Calculations May Produce More Useful Results. Health Aff. 2014;33(5):786-791. PubMed
7. Hu J, Gonsahn MD, Nerenz DR. Socioeconomic Status and Readmissions: Evidence from an Urban Teaching Hospital. Health Aff. 2014;33(5):778-785. doi:10.1377/hlthaff.2013.0816. PubMed
8. Sills MR, Hall M, Colvin JD, et al. Association of Social Determinants with Children’s Hospitals’ Preventable Readmissions Performance. JAMA Pediatr. 2016;170(4):350-358. doi:10.1001/jamapediatrics.2015.4440. PubMed
9. Eselius LL, Cleary PD, Zaslavsky AM, Huskamp HA, Busch SH. Case-Mix Adjustment of Consumer Reports about Managed Behavioral Health Care and Health Plans. Health Serv Res. 2008;43(6):2014-2032. doi:10.1111/j.1475-6773.2008.00894.x. PubMed
10. Doupnik SK, Henry MK, Bae H, et al. Mental Health Conditions and Symptoms in Pediatric Hospitalizations: A Single-Center Point Prevalence Study. Acad Pediatr. 2017;17(2):184-190. PubMed
11. Bardach NS, Coker TR, Zima BT, et al. Common and Costly Hospitalizations for Pediatric Mental Health Disorders. Pediatrics. 2014;133(4):602-609. doi:10.1542/peds.2013-3165. PubMed
12. Doupnik SK, Mitra N, Feudtner C, Marcus SC. The Influence of Comorbid Mood and Anxiety Disorders on Outcomes of Pediatric Patients Hospitalized for Pneumonia. Hosp Pediatr. 2016;6(3):135-142. doi:10.1542/hpeds.2015-0177. PubMed
13. Snell C, Fernandes S, Bujoreanu IS, Garcia G. Depression, illness severity, and healthcare utilization in cystic fibrosis. Pediatr Pulmonol. 2014;49(12):1177-1181. doi:10.1002/ppul.22990. PubMed
14. DiMatteo MR, Lepper HS, Croghan TW. Depression Is a Risk Factor for Noncompliance with Medical Treatment: Meta-analysis of the Effects of Anxiety and Depression on Patient Adherence. Arch Intern Med . 2000;160(14):2101-2107. doi:10.1001/archinte.160.14.2101. PubMed
15. Gray WN, Denson LA, Baldassano RN, Hommel KA. Treatment Adherence in Adolescents with Inflammatory Bowel Disease: The Collective Impact of Barriers to Adherence and Anxiety/Depressive Symptoms. J Pediatr Psychol. 2012;37(3):282-291. doi:10.1093/jpepsy/jsr092. PubMed
16. Mosnaim G, Li H, Martin M, et al. Factors associated with levels of adherence to inhaled corticosteroids in minority adolescents with asthma. Ann Allergy Asthma Immunol. 2014;112(2):116-120. doi:10.1016/j.anai.2013.11.021. PubMed
17. Compas BE, Jaser SS, Dunn MJ, Rodriguez EM. Coping with Chronic Illness in Childhood and Adolescence. Ann Rev Clin Psychol. 2012;8(1):455-480. doi:10.1146/annurev-clinpsy-032511-143108. PubMed
18. Graue M, Wentzel-Larsen T, Bru E, Hanestad BR, Søvik O. The coping styles of adolescents with type 1 diabetes are associated with degree of metabolic control. Diabetes Care. 2004;27(6):1313-1317. PubMed
19. Jaser SS, White LE. Coping and resilience in adolescents with type 1 diabetes. Child Care Health Dev. 2011;37(3):335-342. doi:10.1111/j.1365-2214.2010.01184.x. PubMed
20. Cancino RS, Culpepper L, Sadikova E, Martin J, Jack BW, Mitchell SE. Dose-response relationship between depressive symptoms and hospital readmission. J Hosp Med. 2014;9(6):358-364. doi:10.1002/jhm.2180. PubMed
21. Pederson JL, Warkentin LM, Majumdar SR, McAlister FA. Depressive symptoms are associated with higher rates of readmission or mortality after medical hospitalization: A systematic review and meta-analysis. J Hosp Med. 2016;11(5):373-380. doi:10.1002/jhm.2547. PubMed
22. Chwastiak LA, Davydow DS, McKibbin CL, et al. The Effect of Serious Mental Illness on the Risk of Rehospitalization Among Patients with Diabetes. Psychosomatics. 2014;55(2):134-143. PubMed
23. Daratha KB, Barbosa-Leiker C, H Burley M, et al. Co-occurring mood disorders among hospitalized patients and risk for subsequent medical hospitalization. Gen Hosp Psychiatry. 2012;34(5):500-505. doi:10.1016/j.genhosppsych.2012.05.001. PubMed
24. Kartha A, Anthony D, Manasseh CS, et al. Depression is a risk factor for rehospitalization in medical inpatients. Prim Care Companion J Clin Psychiatry. 2007;9(4):256-262. PubMed
25. Myrvik MP, Burks LM, Hoffman RG, Dasgupta M, Panepinto JA. Mental health disorders influence admission rates for pain in children with sickle cell disease. Pediatr Blood Cancer. 2013;60(7):1211-1214. doi:10.1002/pbc.24394. PubMed
26. Garrison MM, Katon WJ, Richardson LP. The impact of psychiatric comorbidities on readmissions for diabetes in youth. Diabetes Care. 2005;28(9):2150-2154. PubMed
27. Averill R, Goldfield N, Hughes JS, et al. All Patient Refined Diagnosis Related Groups (APR-DRGs) Version 20.0: Methodology Overview. https://www.hcup-us.ahrq.gov/db/nation/nis/APR-DRGsV20MethodologyOverviewandBibliography.pdf. Accessed on November 2, 2016.
28. Berry JG, Toomey SL, Zaslavsky AM, et al. Pediatric readmission prevalence and variability across hospitals. JAMA. 2013;309(4):372-380. PubMed
29. Zima BT, Rodean J, Hall M, Bardach NS, Coker TR, Berry JG. Psychiatric Disorders and Trends in Resource Use in Pediatric Hospitals. Pediatrics. 2016;138(5):e20160909-e20160909. doi:10.1542/peds.2016-0909. PubMed
30. Chronic Condition Indicator (CCI) for ICD-9-CM. Healthcare Cost and Utilization Project (HCUP) Tools & Software Page. http://www.hcup-us.ahrq.gov/toolssoftware/chronic/chronic.jsp. Accessed on October 30, 2015.
31. Feudtner C, Feinstein J, Zhong W, Hall M, Dai D. Pediatric complex chronic conditions classification system version 2: updated for ICD-10 and complex medical technology dependence and transplantation. BMC Pediatr. 2014;14(1):199-205. PubMed
32. Doupnik S, Lawlor J, Zima BT, et al. Mental Health Conditions and Medical and Surgical Hospital Utilization. Pediatrics. 2016;138(6):e20162416. doi:10.1542/peds.2016-2416. PubMed
33. Brown NM, Green JC, Desai MM, Weitzman CC, Rosenthal MS. Need and Unmet Need for Care Coordination Among Children with Mental Health Conditions. Pediatrics. 2014;133(3):e530-e537. doi:10.1542/peds.2013-2590. PubMed
34. Sobolewski B, Richey L, Kowatch RA, Grupp-Phelan J. Mental health follow-up among adolescents with suicidal behaviors after emergency department discharge. Arch Suicide Res. 2013;17(4):323-334. doi:10.1080/13811118.2013.801807. PubMed
35. Hansen LO, Greenwald JL, Budnitz T, et al. Project BOOST: Effectiveness of a multihospital effort to reduce rehospitalization. J Hosp Med. 2013;8(8):421-427. doi:10.1002/jhm.2054. PubMed
36. Di Marco F, Verga M, Santus P, et al. Close correlation between anxiety, depression, and asthma control. Respir Med. 2010;104(1):22-28. doi:10.1016/j.rmed.2009.08.005. PubMed
37. Ghose SS, Williams LS, Swindle RW. Depression and other mental health diagnoses after stroke increase inpatient and outpatient medical utilization three years poststroke. Med Care. 2005;43(12):1259-1264. PubMed
38. Szigethy E, Bujoreanu SI, Youk AO, et al. Randomized efficacy trial of two psychotherapies for depression in youth with inflammatory bowel disease. J Am Acad Child Adolesc Psychiatry. 2014;53(7):726-735. PubMed
39. Swensen A, Birnbaum HG, Ben Hamadi R, Greenberg P, Cremieux PY, Secnik K. Incidence and costs of accidents among attention-deficit/hyperactivity disorder patients. J Adolesc Health. 2004;35(4):346.e1-346.e9. doi:10.1016/j.jadohealth.2003.12.003. PubMed
40. Chan E, Zhan C, Homer CJ. Health Care Use and Costs for Children with Attention-Deficit/Hyperactivity Disorder: National Estimates from the Medical Expenditure Panel Survey. Arch Pediatr Adolesc Med. 2002;156(5):504-511. doi:10.1001/archpedi.156.5.504. PubMed
41. Berry JG, Blaine K, Rogers J, et al. A Framework of Pediatric Hospital Discharge Care Informed by Legislation, Research, and Practice. JAMA Pediatr. 2014;168(10):955-962. doi:10.1001/jamapediatrics.2014.891. PubMed
Readmission prevention is a focus of national efforts to improve the quality of hospital care for children.1-5 Several factors contribute to the risk of readmission for hospitalized children, including age, race or ethnicity, payer, and the type and number of comorbid health conditions.6-9 Mental health conditions (MHCs) are a prevalent comorbidity in children hospitalized for physical health reasons that could influence their postdischarge health and safety.
MHCs are increasingly common in children hospitalized for physical health indications; a comorbid MHC is currently present in 10% to 25% of hospitalized children ages 3 years and older.10,11 Hospital length of stay (LOS) and cost are higher in children with an MHC.12,13 Increased resource use may occur because MHCs can impede hospital treatment effectiveness and the child’s recovery from physical illness. MHCs are associated with a lower adherence with medications14-16 and a lower ability to cope with health events and problems.17-19 In adults, MHCs are a well-established risk factor for hospital readmission for a variety of physical health conditions.20-24 Although the influence of MHCs on readmissions in children has not been extensively investigated, higher readmission rates have been reported in adolescents hospitalized for diabetes with an MHC compared with those with no MHC.25,26
To our knowledge, no large studies have examined the relationship between the presence of a comorbid MHC and hospital readmissions in children or adolescents hospitalized for a broad array of medical or procedure conditions. Therefore, we conducted this study to (1) assess the likelihood of 30-day hospital readmission in children with versus without MHC who were hospitalized for one of 10 medical or 10 procedure conditions, and (2) to assess which MHCs are associated with the highest likelihood of hospital readmission.
METHODS
Study Design and Setting
We conducted a national, retrospective cohort study of index hospitalizations for children ages 3 to 21 years who were discharged from January 1, 2013, to November 30, 2013, in the Agency for Healthcare Research and Quality’s (AHRQ) Nationwide Readmissions Database (NRD). Admissions occurring in December 2013 were excluded because they did not have a 30-day timeframe available for readmission measurement. The 2013 NRD includes administrative data for a nationally representative sample of 14 million hospitalizations in 21 states, accounting for 49% of all US hospitalizations and weighted to represent 35.6 million hospitalizations. The database includes deidentified, verified patient linkage numbers so that patients can be tracked across multiple hospitalizations at the same institution or different institutions within a state. The NRD includes hospital information, patient demographic information, and the International Classification of Diseases, 9th Revision-Clinical Modification (ICD-9-CM) discharge diagnoses and procedures, with 1 primary diagnosis and up to 24 additional fields for comorbid diagnoses. This study was approved for exemption by the Children’s Hospital of Philadelphia Institutional Review Board.
Index Admissions
We used the methods described below to create a study cohort of the 10 medical and 10 procedure index admissions associated with the highest volume (ie, the greatest absolute number) of 30-day hospital readmissions. Conditions with a high volume of readmissions were chosen in an effort to identify conditions in which readmission-prevention interventions had the greatest potential to reduce the absolute number of readmissions. We first categorized index hospitalizations for medical and procedure conditions by using the All Patient Refined Diagnosis Related Groups (APR-DRGs; 3M Health Information Systems, Wallingford, CT).27 APR-DRGs use all diagnosis and/or procedure ICD-9-CM codes registered for a hospital discharge to assign 1 reason that best explains the need for hospitalization. We then excluded obstetric hospitalizations, psychiatric hospitalizations, and hospitalizations resulting in death or transfer from being considered as index admissions. Afterwards, we ranked each APR-DRG index hospitalization by the total number of 30-day hospital readmissions that occurred afterward and selected the 10 medical and 10 procedure index admissions with the highest number of readmissions. The APR-DRG index admissions are listed in Figures 1 and 2. For the APR-DRG “digestive system diagnoses,” the most common diagnosis was constipation, and we refer to that category as “constipation.” The most common diagnosis for the APR-DRG called “other operating room procedure for neoplasm” was tumor biopsy, and we refer to that category as “tumor biopsy.”
Main Outcome Measure
The primary study outcome was unplanned, all-cause readmission to any hospital within 30 days of index hospitalization. All-cause readmissions include any hospitalization for the same or different condition as the index admission, including conditions not eligible to be considered as index admissions (obstetric, psychiatric, and hospitalizations resulting in death or transfer). Planned readmissions, identified by using pediatric-specific measure specifications endorsed by AHRQ and the National Quality Forum,28 were excluded from measurement. For index admissions with multiple 30-day readmissions, only the first readmission was counted. Each readmission was treated as an index admission.
Main Independent Variable
The main independent variable was the presence of an MHC documented during the index hospitalization. MHCs were identified and classified into diagnosis categories derived from the AHRQ Chronic Condition Indicator system by using ICD-9-CM codes.29 MHC categories included anxiety disorders, attention-deficit/hyperactivity disorder (ADHD), autism, depression, and substance abuse. Less common MHCs included bipolar disorder, schizophrenia, disruptive behavior disorders, somatoform disorders, and eating disorders. These conditions are included in the group with any MHC, but we did not calculate the adjusted odds ratios (AORs) of readmission for these conditions. Children were identified as having multiple MHCs if they had more than 1 MHC.
Other Characteristics of Index Hospitalizations
A priori, we selected for analysis the known demographic, clinical, and hospital factors associated with the risk of readmission.20-24 The demographic characteristics included patient age, gender, payer category, urban or rural residence, and the median income quartile for a patient’s ZIP code. The hospital characteristics included location, ownership, and teaching hospital designation. The clinical characteristics included the number of chronic conditions30 and indicators for the presence of a complex chronic condition in each of 12 organ systems.31
Statistical Analysis
We calculated descriptive summary statistics for the characteristics of index hospitalizations. We compared characteristics in index admissions of children with versus without MHC by using Wilcoxon Rank-Sum tests for continuous variables and Wald χ2 tests for categorical variables. In the multivariable analysis, we derived logistic regression models to assess the relationship of 30-day hospital readmission with each type of MHC, adjusting for index admission demographic, hospital, and clinical characteristics. MHCs were modeled as binary indicator variables with the presence of any MHC, more than 1 MHC, or each of 5 MHC categories (anxiety disorders, ADHD, autism, depression, substance abuse) compared with no MHC. Four types of logistic regression models were derived (1) for the combined sample of all 10 index medical admissions with each MHC category versus no MHC as a primary predictor, (2) for each medical index admission with any MHC versus no MHC as the primary predictor, (3) for the combined sample of all 10 index procedure admissions with each MHC category versus no MHC as a primary predictor, and (4) for each procedure index admission with any MHC versus no MHC as the primary predictor. All analyses were weighted to achieve national estimates and clustered by hospital by using AHRQ-recommended survey procedures. SAS version 9.4 (SAS Institute, Cary, NC) was used for all analyses. All tests were two-sided, and a P < .05 was
considered statistically significant.
RESULTS
Study Population
Across all index admissions, 16.3% were for children with an MHC. Overall, children with MHCs were older and more likely to have a chronic30 or complex chronic31 physical health condition than children with no MHCs (Table).
Index Medical Admissions, Mental Health Conditions, and Hospital Readmission
The 10 index medical hospitalizations with the most readmissions for children ages 3 to 20 years were asthma, chemotherapy, constipation, diabetes, gastroenteritis, inflammatory bowel disease, neutropenia, pneumonia, seizure, and sickle cell crisis. Across all index medical hospitalizations, 17.5% were for patients with an MHC (Figure 1). Of index medical admissions with any MHC, 26.3% had ADHD, 22.9% had an anxiety disorder, 14.9% had autism, 18.3% had depression, and 30.9% had substance abuse. Among all admissions with MHCs, 28.9% had 2 or more MHCs.
Index Medical Admissions Combined
For all index medical hospitalizations combined, 17.0% (n = 59,138) had an unplanned, 30-day hospital readmission. The rate of 30-day hospital readmissions was higher with versus without an MHC (17.5 vs 16.8%; P < .001). In a multivariable analysis, presence of an MHC was associated with a higher likelihood of hospital readmission following an index medical admission (AOR, 1.23; 95% confidence interval [CI], 1.19-1.26); Figure 1). All MHCs except autism and ADHD had a higher likelihood of readmission (Figure 3).
Specific Index Medical Admissions
Index Procedure Admissions, Mental Health Conditions, and Hospital Readmission
Index Procedure Admissions Combined
Specific Index Procedure Admissions
For specific index procedure admissions, the rate of 30-day hospital readmission ranged from 2.2% for knee procedures to 33.6% for tumor biopsy. For 3 (ie, urinary tract, ventricular shunt, and bowel procedures) of the 10 specific index procedure hospitalizations, having an MHC was associated with higher adjusted odds of 30-day readmission (AOR range, 1.38-2.27; Figure 2).
In total, adjusting for sociodemographic, clinical, and hospital characteristics, MHCs were associated with an additional 2501 medical readmissions and 217 procedure readmissions beyond what would have been expected if MHCs were not associated with readmissions.
DISCUSSION
MHCs are common among pediatric hospitalizations with the highest volume of readmissions; MHCs were present in approximately 1 in 5 medical and 1 in 7 procedure index hospitalizations. Across medical and procedure admissions, the adjusted likelihood of unplanned, all-cause 30-day readmission was 25% higher for children with versus without an MHC. The readmission likelihood varied by the type of medical or procedure admission and by the type of MHC. MHCs had the strongest associations with readmissions following hospitalization for diabetes and urinary tract procedures. The MHC categories associated with the highest readmission likelihood were depression, substance abuse, and multiple MHCs.
The current study complements existing literature by helping establish MHCs as a prevalent and important risk factor for hospital readmission in children. Estimates of the prevalence of MHCs in hospitalized children are between 10% and 25%,10,11,32 and prevalence has increased by as much as 160% over the last 10 years.29 Prior investigations have found that children with an MHC tend to stay longer in the hospital compared with children with no MHC.32 Results from the present study suggest that children with MHCs also experience more inpatient days because of rehospitalizations. Subsequent investigations should strive to understand the mechanisms in the hospital, community, and family environment that are responsible for the increased inpatient utilization in children with MHCs. Understanding how the receipt of mental health services before, during, and after hospitalization influences readmissions could help identify opportunities for practice improvement. Families report the need for better coordination of their child’s medical and mental health care,33 and opportunities exist to improve attendance at mental health visits after acute care encounters.34 Among adults, interventions that address posthospital access to mental healthcare have prevented readmissions.35
Depression was associated with an increased risk of readmission in medical and procedure hospitalizations. As a well-known risk factor for readmission in adult patients,21 depression can adversely affect and exacerbate the physical health recovery of patients experiencing acute and chronic illnesses.14,36,37 Depression is considered a modifiable contributor that, when controlled, may help lower readmission risk. Optimal adherence with behavior and medication treatment for depression is associated with a lower risk of unplanned 30-day readmissions.14-16,19 Emerging evidence demonstrates how multifaceted, psychosocial approaches can improve patients’ adherence with depression treatment plans.38 Increased attention to depression in hospitalized children may uncover new ways to manage symptoms as children transition from hospital to home.
Other MHCs were associated with a different risk of readmission among medical and procedure hospitalizations. For example, ADHD or autism documented during index hospitalization was associated with an increased risk of readmission following procedure hospitalizations and a decreased risk following medical hospitalizations. Perhaps children with ADHD or autism who exhibit hyperactive, impulsive, or repetitive behaviors39,40 are at risk for disrupting their postprocedure wound healing, nutrition recovery, or pain tolerance, which might contribute to increased readmission risk.
MHCs were associated with different readmission risks across specific types of medical or procedure hospitalizations. For example, among medical conditions, the association of readmissions with MHCs was highest for diabetes, which is consistent with prior research.26 Factors that might mediate this relationship include changes in diet and appetite, difficulty with diabetes care plan adherence, and intentional nonadherence as a form of self-harm. Similarly, a higher risk of readmission in chronic medical conditions like asthma, constipation, and sickle cell disease might be mediated by difficulty adhering to medical plans or managing exacerbations at home. In contrast, MHCs had no association with readmission following chemotherapy. In our clinical experience, readmissions following chemotherapy are driven by physiologic problems, such as thrombocytopenia, fever, and/or neutropenia. MHCs might have limited influence over those health issues. For procedure hospitalizations, MHCs had 1 of the strongest associations with ventricular shunt procedures. We hypothesize that MHCs might lead some children to experience general health symptoms that might be associated with shunt malfunction (eg, fatigue, headache, behavior change), which could lead to an increased risk of readmission to evaluate for shunt malfunction. Conversely, we found no relationship between MHCs and readmissions following appendectomy. For appendectomy, MHCs might have limited influence over the development of postsurgical complications (eg, wound infection or ileus). Future research to better elucidate mediators of increased risk of readmission associated with MHCs in certain medical and procedure conditions could help explain these relationships and identify possible future intervention targets to prevent readmissions.
This study has several limitations. The administrative data are not positioned to discover the mechanisms by which MHCs are associated with a higher likelihood of readmission. We used hospital ICD-9-CM codes to identify patients with MHCs. Other methods using more clinically rich data (eg, chart review, prescription medications, etc.) may be preferable to identify patients with MHCs. Although the use of ICD-9-CM codes may have sufficient specificity, some hospitalized children may have an MHC that is not coded. Patients identified by using diagnosis codes could represent patients with a higher severity of illness, patients using medications, or patients whose outpatient records are accessible to make the hospital team aware of the MHC. If documentation of MHCs during hospitalization represents a higher severity of illness, findings may not extrapolate to lower-severity MHCs. As hospitals transition from ICD-9 -CM to ICD-10 coding, and health systems develop more integrated inpatient and outpatient EHRs, diagnostic specificity may improve. We could not analyze the relationships with several potential confounders and explanatory variables that may be related both to the likelihood of having an MHC and the risk of readmission, including medication administration, psychiatric consultation, and parent mental health. Postdischarge health services, including access to a medical home or a usual source of mental healthcare and measures of medication adherence, were not available in the NRD.
Despite these limitations, the current study underscores the importance of MHCs in hospitalized children upon discharge. As subsequent investigations uncover the key drivers explaining the influence of MHCs on hospital readmission risk, hospitals and their local outpatient and community practices may find it useful to consider MHCs when (1) developing contingency plans and establishing follow-up care at discharge,41 (2) exploring opportunities of care integration between mental and physical health care professionals, and (3) devising strategies to reduce hospital readmissions among populations of children.
CONCLUSIONS
MHCs are prevalent in hospitalized children and are associated with an increased risk of 30-day, unplanned hospital readmission. Future readmission prevention efforts may uncover new ways to improve children’s transitions from hospital to home by investigating strategies to address their MHCs.
Acknowledgments
The authors thank Donjo Lau and Troy Richardson for their assistance with the analysis.
Disclosures
Dr. Doupnik was supported by a Ruth L. Kirschstein National Research Service Award institutional training grant (T32-HP010026), funded by the National Institutes of Health. Dr. Zima was supported by the Behavioral Health Centers of Excellence for California (SB852). Dr. Bardach was supported by the National Institute of Child Health and Human Development (K23-HD065836). Dr. Berry was supported by the Agency for Healthcare Research and Quality (R21 HS023092-01). The authors have no financial relationships relevant to this article to disclose. The authors have no potential conflicts of interest to disclose. Dr. Doupnik led the study design and analysis and drafted the initial manuscript. Mr. Lawlor performed the data analysis. Dr. Hall provided statistical consultation. All authors participated in the design of the study, interpretation of the data, revised the manuscript for key intellectual content, and all authors read and approved the final manuscript.
1. Dougherty D, Schiff J, Mangione-Smith R. The Children’s Health Insurance Program Reauthorization Act quality measures initiatives: moving forward to improve measurement, care, and child and adolescent outcomes. Acad Pediatr. 2011;11(3):S1-S10. PubMed
2. Bardach NS, Vittinghoff E, Asteria-Penaloza R, et al. Measuring Hospital Quality Using Pediatric Readmission and Revisit Rates. Pediatrics. 2013;132(3):429-436. doi:10.1542/peds.2012-3527. PubMed
3. Khan A, Nakamura MM, Zaslavsky AM, et al. Same-Hospital Readmission Rates as a Measure of Pediatric Quality of Care. JAMA Pediatr. 2015;169(10):905-912. doi:10.1001/jamapediatrics.2015.1129. PubMed
4. Fassl BA, Nkoy FL, Stone BL, et al. The Joint Commission Children’s Asthma Care quality measures and asthma readmissions. Pediatrics. 2012;130(3):482-491. doi:10.1542/peds.2011-3318. PubMed
5. Hain PD, Gay JC, Berutti TW, Whitney GM, Wang W, Saville BR. Preventability of Early Readmissions at a Children’s Hospital. Pediatrics. 2013;131(1):e171-e181. doi:10.1542/peds.2012-0820. PubMed
6. Nagasako E, Reidhead B, Waterman B, et al. Adding Socioeconomic Data to Hospital Readmissions Calculations May Produce More Useful Results. Health Aff. 2014;33(5):786-791. PubMed
7. Hu J, Gonsahn MD, Nerenz DR. Socioeconomic Status and Readmissions: Evidence from an Urban Teaching Hospital. Health Aff. 2014;33(5):778-785. doi:10.1377/hlthaff.2013.0816. PubMed
8. Sills MR, Hall M, Colvin JD, et al. Association of Social Determinants with Children’s Hospitals’ Preventable Readmissions Performance. JAMA Pediatr. 2016;170(4):350-358. doi:10.1001/jamapediatrics.2015.4440. PubMed
9. Eselius LL, Cleary PD, Zaslavsky AM, Huskamp HA, Busch SH. Case-Mix Adjustment of Consumer Reports about Managed Behavioral Health Care and Health Plans. Health Serv Res. 2008;43(6):2014-2032. doi:10.1111/j.1475-6773.2008.00894.x. PubMed
10. Doupnik SK, Henry MK, Bae H, et al. Mental Health Conditions and Symptoms in Pediatric Hospitalizations: A Single-Center Point Prevalence Study. Acad Pediatr. 2017;17(2):184-190. PubMed
11. Bardach NS, Coker TR, Zima BT, et al. Common and Costly Hospitalizations for Pediatric Mental Health Disorders. Pediatrics. 2014;133(4):602-609. doi:10.1542/peds.2013-3165. PubMed
12. Doupnik SK, Mitra N, Feudtner C, Marcus SC. The Influence of Comorbid Mood and Anxiety Disorders on Outcomes of Pediatric Patients Hospitalized for Pneumonia. Hosp Pediatr. 2016;6(3):135-142. doi:10.1542/hpeds.2015-0177. PubMed
13. Snell C, Fernandes S, Bujoreanu IS, Garcia G. Depression, illness severity, and healthcare utilization in cystic fibrosis. Pediatr Pulmonol. 2014;49(12):1177-1181. doi:10.1002/ppul.22990. PubMed
14. DiMatteo MR, Lepper HS, Croghan TW. Depression Is a Risk Factor for Noncompliance with Medical Treatment: Meta-analysis of the Effects of Anxiety and Depression on Patient Adherence. Arch Intern Med . 2000;160(14):2101-2107. doi:10.1001/archinte.160.14.2101. PubMed
15. Gray WN, Denson LA, Baldassano RN, Hommel KA. Treatment Adherence in Adolescents with Inflammatory Bowel Disease: The Collective Impact of Barriers to Adherence and Anxiety/Depressive Symptoms. J Pediatr Psychol. 2012;37(3):282-291. doi:10.1093/jpepsy/jsr092. PubMed
16. Mosnaim G, Li H, Martin M, et al. Factors associated with levels of adherence to inhaled corticosteroids in minority adolescents with asthma. Ann Allergy Asthma Immunol. 2014;112(2):116-120. doi:10.1016/j.anai.2013.11.021. PubMed
17. Compas BE, Jaser SS, Dunn MJ, Rodriguez EM. Coping with Chronic Illness in Childhood and Adolescence. Ann Rev Clin Psychol. 2012;8(1):455-480. doi:10.1146/annurev-clinpsy-032511-143108. PubMed
18. Graue M, Wentzel-Larsen T, Bru E, Hanestad BR, Søvik O. The coping styles of adolescents with type 1 diabetes are associated with degree of metabolic control. Diabetes Care. 2004;27(6):1313-1317. PubMed
19. Jaser SS, White LE. Coping and resilience in adolescents with type 1 diabetes. Child Care Health Dev. 2011;37(3):335-342. doi:10.1111/j.1365-2214.2010.01184.x. PubMed
20. Cancino RS, Culpepper L, Sadikova E, Martin J, Jack BW, Mitchell SE. Dose-response relationship between depressive symptoms and hospital readmission. J Hosp Med. 2014;9(6):358-364. doi:10.1002/jhm.2180. PubMed
21. Pederson JL, Warkentin LM, Majumdar SR, McAlister FA. Depressive symptoms are associated with higher rates of readmission or mortality after medical hospitalization: A systematic review and meta-analysis. J Hosp Med. 2016;11(5):373-380. doi:10.1002/jhm.2547. PubMed
22. Chwastiak LA, Davydow DS, McKibbin CL, et al. The Effect of Serious Mental Illness on the Risk of Rehospitalization Among Patients with Diabetes. Psychosomatics. 2014;55(2):134-143. PubMed
23. Daratha KB, Barbosa-Leiker C, H Burley M, et al. Co-occurring mood disorders among hospitalized patients and risk for subsequent medical hospitalization. Gen Hosp Psychiatry. 2012;34(5):500-505. doi:10.1016/j.genhosppsych.2012.05.001. PubMed
24. Kartha A, Anthony D, Manasseh CS, et al. Depression is a risk factor for rehospitalization in medical inpatients. Prim Care Companion J Clin Psychiatry. 2007;9(4):256-262. PubMed
25. Myrvik MP, Burks LM, Hoffman RG, Dasgupta M, Panepinto JA. Mental health disorders influence admission rates for pain in children with sickle cell disease. Pediatr Blood Cancer. 2013;60(7):1211-1214. doi:10.1002/pbc.24394. PubMed
26. Garrison MM, Katon WJ, Richardson LP. The impact of psychiatric comorbidities on readmissions for diabetes in youth. Diabetes Care. 2005;28(9):2150-2154. PubMed
27. Averill R, Goldfield N, Hughes JS, et al. All Patient Refined Diagnosis Related Groups (APR-DRGs) Version 20.0: Methodology Overview. https://www.hcup-us.ahrq.gov/db/nation/nis/APR-DRGsV20MethodologyOverviewandBibliography.pdf. Accessed on November 2, 2016.
28. Berry JG, Toomey SL, Zaslavsky AM, et al. Pediatric readmission prevalence and variability across hospitals. JAMA. 2013;309(4):372-380. PubMed
29. Zima BT, Rodean J, Hall M, Bardach NS, Coker TR, Berry JG. Psychiatric Disorders and Trends in Resource Use in Pediatric Hospitals. Pediatrics. 2016;138(5):e20160909-e20160909. doi:10.1542/peds.2016-0909. PubMed
30. Chronic Condition Indicator (CCI) for ICD-9-CM. Healthcare Cost and Utilization Project (HCUP) Tools & Software Page. http://www.hcup-us.ahrq.gov/toolssoftware/chronic/chronic.jsp. Accessed on October 30, 2015.
31. Feudtner C, Feinstein J, Zhong W, Hall M, Dai D. Pediatric complex chronic conditions classification system version 2: updated for ICD-10 and complex medical technology dependence and transplantation. BMC Pediatr. 2014;14(1):199-205. PubMed
32. Doupnik S, Lawlor J, Zima BT, et al. Mental Health Conditions and Medical and Surgical Hospital Utilization. Pediatrics. 2016;138(6):e20162416. doi:10.1542/peds.2016-2416. PubMed
33. Brown NM, Green JC, Desai MM, Weitzman CC, Rosenthal MS. Need and Unmet Need for Care Coordination Among Children with Mental Health Conditions. Pediatrics. 2014;133(3):e530-e537. doi:10.1542/peds.2013-2590. PubMed
34. Sobolewski B, Richey L, Kowatch RA, Grupp-Phelan J. Mental health follow-up among adolescents with suicidal behaviors after emergency department discharge. Arch Suicide Res. 2013;17(4):323-334. doi:10.1080/13811118.2013.801807. PubMed
35. Hansen LO, Greenwald JL, Budnitz T, et al. Project BOOST: Effectiveness of a multihospital effort to reduce rehospitalization. J Hosp Med. 2013;8(8):421-427. doi:10.1002/jhm.2054. PubMed
36. Di Marco F, Verga M, Santus P, et al. Close correlation between anxiety, depression, and asthma control. Respir Med. 2010;104(1):22-28. doi:10.1016/j.rmed.2009.08.005. PubMed
37. Ghose SS, Williams LS, Swindle RW. Depression and other mental health diagnoses after stroke increase inpatient and outpatient medical utilization three years poststroke. Med Care. 2005;43(12):1259-1264. PubMed
38. Szigethy E, Bujoreanu SI, Youk AO, et al. Randomized efficacy trial of two psychotherapies for depression in youth with inflammatory bowel disease. J Am Acad Child Adolesc Psychiatry. 2014;53(7):726-735. PubMed
39. Swensen A, Birnbaum HG, Ben Hamadi R, Greenberg P, Cremieux PY, Secnik K. Incidence and costs of accidents among attention-deficit/hyperactivity disorder patients. J Adolesc Health. 2004;35(4):346.e1-346.e9. doi:10.1016/j.jadohealth.2003.12.003. PubMed
40. Chan E, Zhan C, Homer CJ. Health Care Use and Costs for Children with Attention-Deficit/Hyperactivity Disorder: National Estimates from the Medical Expenditure Panel Survey. Arch Pediatr Adolesc Med. 2002;156(5):504-511. doi:10.1001/archpedi.156.5.504. PubMed
41. Berry JG, Blaine K, Rogers J, et al. A Framework of Pediatric Hospital Discharge Care Informed by Legislation, Research, and Practice. JAMA Pediatr. 2014;168(10):955-962. doi:10.1001/jamapediatrics.2014.891. PubMed
© 2018 Society of Hospital Medicine
Effect of High-Dose Ergocalciferol on Rate of Falls in a Community-Dwelling, Home-Based Primary Care Veteran Population: A Case-Crossover Study
Annually, about 1 in 4 individuals aged ≥ 65 years will experience at least 1 fall, resulting in nearly 2.8 million cases of emergently treated injuries and more than 800,000 hospitalizations.1-3 Therefore, fall prevention has garnered heightened attention as the population ages. Many factors are at play in fall risk, including vitamin D levels.
Although vitamin D is essential for a multitude of physiologic processes, evidence suggests that serum concentrations of 25-hydroxy vitamin D (25[OH]D) < 30 ng/mL are associated with decreased bone mineral density, muscle weakness, impaired lower extremity function, balance problems, and high fall rates.4-12 Through a meta-analysis published in 2009 that included 8 randomized controlled trials of 2,426 participants aged ≥ 65 years, Bischoff-Ferrari and colleagues found that a dose of 700 to 1,000 IU/d significantly reduced the risk of falling compared with doses of 200 to 600 IU/d.13 A subsequent meta-analysis published in 2012 including 14 randomized trials across 28,135 participants aged ≥ 65 years evaluated the efficacy of supplementation with vitamin D with or without calcium cosupplement on fall prevention.14 Although no difference was found in falls across the total sample, a subgroup analysis exploring the effect in participants with lower vitamin D levels demonstrated a statistically significant benefit of vitamin D supplementation. To decrease the risk of fractures and falls, the American Geriatric Society (AGS) recommends vitamin D supplementation of at least 1,000 IU/d in combination with calcium supplementation in older adults, with a minimum goal 25(OH)D level of 30 ng/mL.15
Alarmingly, Bischoff-Ferrari and colleagues published a double-blind, randomized trial that described an association between higher monthly doses of vitamin D3 (cholecalciferol) and an increased risk of falls compared with 24,000 IU/mo. Particularly at higher achieved levels of 25(OH)D, with no difference in benefit was noted on the primary endpoint of lower extremity function.16
Although there exists limited representation of high-dose vitamin D2 and its resultant effects on falls in those aged ≥ 65 years, once weekly prescribing of vitamin D2 in the form of ergocalciferol 50,000 IU remains a commonly used option for repletion of low 25(OH)D. In this study, the authors evaluated the effect of high-dose ergocalciferol on rate of falls in a community-dwelling veteran population ≥ 65 years with low 25(OH)D.
Methods
Following approval from the Lexington Veteran Affairs Medical Center (Lexington VAMC) Institutional Review Board and Research and Development Committee, a retrospective chart review was conducted. Subjects were identified through use of Microsoft SQL (Redmond, WA). Veterans included were those enrolled in home-based primary care (HBPC), a primary care assignment for those individuals requiring skilled services and case management within the home and for whom falls are documented within the electronic health record (EHR). As fall data in a community-dwelling population are difficult to obtain in a retrospective analysis, the HBPC population offered a viable pool of data for evaluation. Some patients eligible for HBPC at the Lexington VAMC may be more dependent on specialized services offered through HBPC or have a reduced ability to perform activities of daily living (ADLs). Other patients can ambulate but may have difficulty traveling great distances to Lexington VAMC.
In addition to HBPC enrollment, veterans were included in the study if they were aged ≥ 65 years and had a 25(OH)D level < 20 ng/mL with subsequent prescribing of high-dose vitamin D2 for repletion, namely, ergocalciferol 50,000 IU once weekly, between March 1, 2005, and September 30, 2016.
Veterans were excluded if they had been enrolled in HBPC for less than 60 days before ergocalciferol initiation, if they were deceased or had been discharged from HBPC within 60 days of ergocalciferol initiation, if they had comorbid conditions that inherently increase the risk of falls (eg, Lewy body dementia, Parkinson disease, bilateral below-the-hip amputation, and hemi- or quadriplegia), or if they had been dispensed a previous prescription of ergocalciferol in the preceding 9 months.
A case-crossover study design was used, which compared the 60-day period prior to initiation of ergocalciferol supplementation with the 60-day period following initiation of supplementation. A 7-day period between these 2 periods was allotted to allow time for mailing of the new prescription and initiation of the supplement.
Data Collection
Data collected included age, sex, levels of 25(OH)D, ergocalciferol prescription data (dose, administration frequency, quantity, day supply, and fill date), falls documented during the 60 days preceding and during supplementation, and the number of medications that posed an increased risk of falls actively prescribed prior to and during supplementation. Those medications considered to increase risk of falls were determined according to the medications listed in the AGS 2015 Updated Beers Criteria for Potentially Inappropriate Medication Use in Older Adults.17
Endpoints
The primary endpoint assessed was the change in rate of falls between the time preceding and during supplementation. The number of falls during the 60 days preceding ergocalciferol supplementation was standardized to falls per person per 30 days and compared with the same parameter during the 60-day period following initiation of ergocalciferol.
The secondary outcome was the rate of falls according to the level of 25(OH)D achieved as a result of supplementation in those patients who achieved a minimum 25(OH)D level of 30 ng/mL according to AGS recommendations. Those patients who achieved a minimum 25(OH)D concentration of 30 ng/mL were separated into 2 equal groups according to their respective concentration relative to the median.
Statistical Analysis
Numerical variables were compared using a Student t test. For the primary outcome, 64 participants were required in order to achieve 80% power at a significance of .05 for a 2-tailed assessment, each serving as his or her own control in the case-crossover study design. For the secondary outcome of falls according to 25(OH)D level following supplementation in order to achieve 80% power at a significance of 0.05 for a 2-tailed assessment, a total of 128 participants who reach a minimum 25(OH)D level of 30 ng/mL were required.
Results
After screening 187 subjects who met the inclusion criteria, 107 subjects were excluded (Figure ). 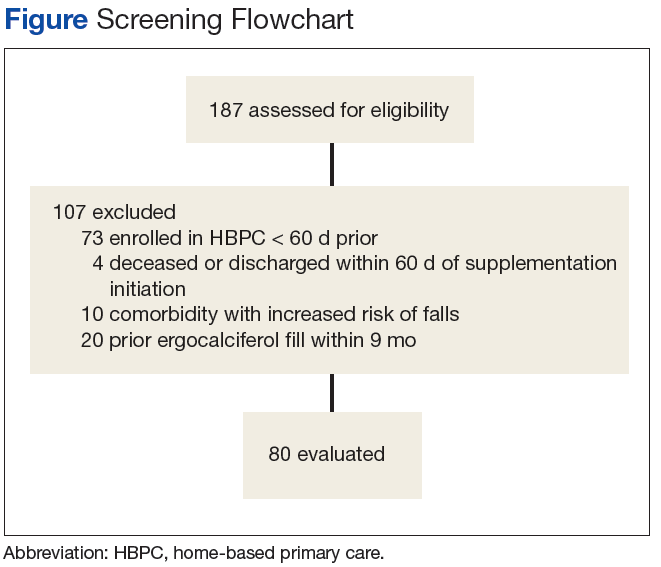
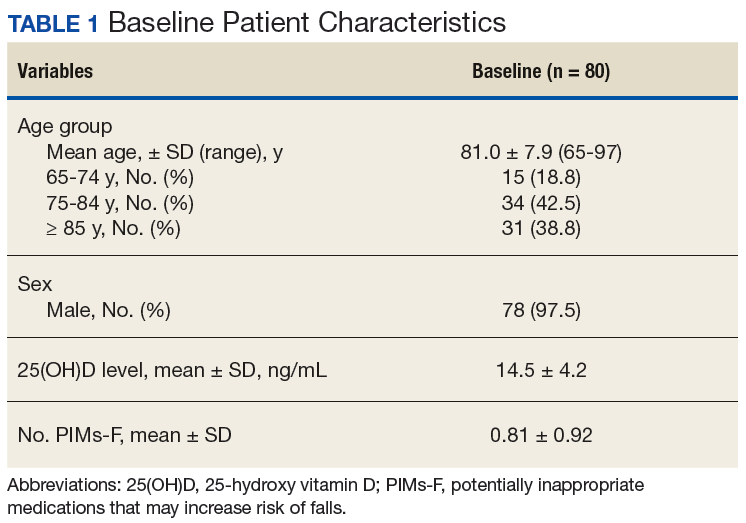
Primary Endpoint
Following once weekly supplementation with ergocalciferol 50,000 IU, 25(OH)D levels increased from 14.5 ng/mL (SD 4.2) to 27.6 (SD 9.6) (P < .01). Of note, the timing of the 25(OH)D level obtained following initiation of supplementation ranged between 8 weeks and 24 weeks. The number of PIMs-F decreased marginally, although to a not statistically significant degree, from 0.81 PIMs-F per person (SD 0.92) to 0.76 PIMs-F per person (SD 0.88). 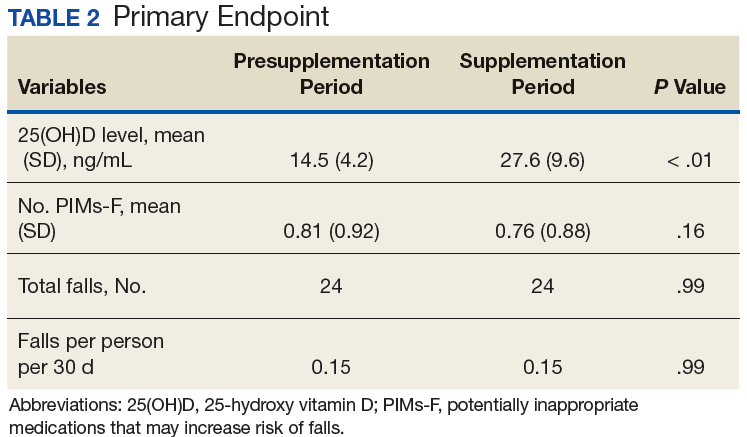
Secondary Endpoint
Although 51 of the subjects (63.8%) failed to achieve the target 25(OH)D level of ≥ 30 ng/mL, 29 were successful (Table 3). 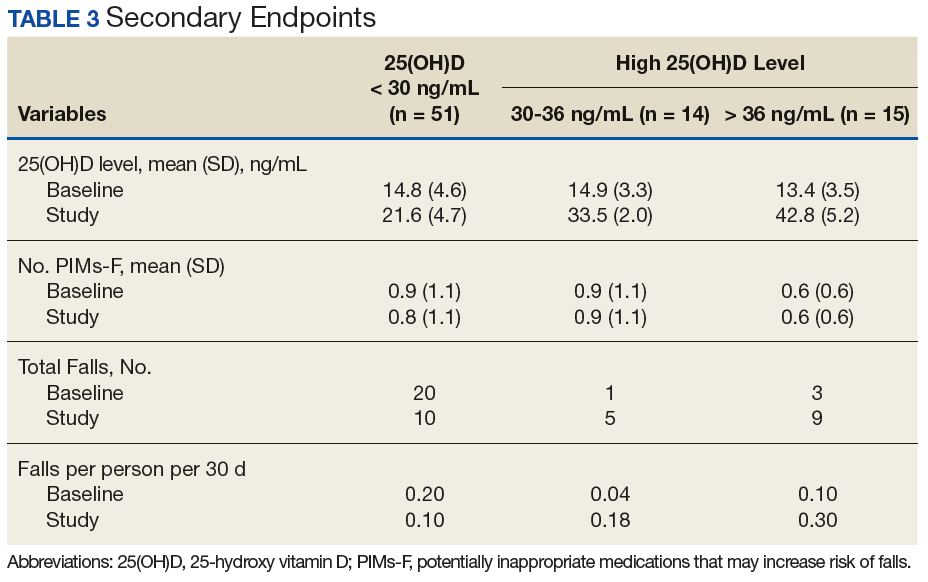
In subjects whose achieved 25(OH)D level was 30 to 36 ng/mL, the rate of falls per person per 30 days increased from 0.036 to 0.18. Similarly, an increase in rate of falls per person per 30 days from 0.1 to 0.3 was noted in subjects whose attained 25(OH)D level was > 36.0 ng/mL. However, study enrollment was underpowered to claim statistical significance in these findings related to the secondary endpoint.
Discussion
In this retrospective chart review, individuals aged ≥ 65 years who were prescribed once weekly ergocalciferol 50,000 IU for increase of 25(OH)D levels < 20 ng/mL experienced no change in rate of falls across the entire study population. In those individuals whose achieved 25(OH)D level met the AGS recommendation of ≥ 30 ng/mL, there was a trend toward an increased rate of falls while the rate of falls decreased for subjects whose achieved 25(OH)D level was < 30 ng/mL.
High-dose vitamin D supplementation, albeit with vitamin D3, and its effect on falls have been evaluated in the geriatric population previously, most notably and recently, by Bischoff-Ferrari and colleagues.16 In a study comparing 24,000 IU vitamin D3 per month vs 60,000 IU vitamin D3 per month vs 24,000 IU vitamin D3 plus calcifediol 300 µg per month, lower extremity function did not differ in the 3 groups. However, an increased number of falls was noted in the second and third arm, respectively. Furthermore, after 12 months of treatment, those individuals who achieved the highest quartile of 25(OH)D level (44.7-98.9 ng/mL) had starkly increased odds of falling and number of falls compared with those achieving the lowest quartile (21.3-30.3 ng/mL).
The results of this study suggest that once-weekly high-dose vitamin D2 may carry a similar risk of increasing falls as found with high-dose vitamin D3, particularly at higher achieved levels of 25(OH)D. A possible explanation for a lower rate of falls in those individuals who did not achieve a 25(OH)D level of at least 30 ng/mL could be that these individuals may not have initiated the medication appropriately or administered it adherently, thereby avoiding a possible deleterious effect that the high-dose preparation may pose in this population.
Given the retrospective nature of the study and the evaluation of the change in the 25(OH)D level following approximately a 90-day supply of ergocalciferol, adherence was not addressed. In this case, although increased 25(OH)D level was the desired outcome of vitamin D supplementation, the increase in rate of falls may be attributable to the high-dose preparation itself. Alternatively, the 25(OH)D target of ≥ 30 ng/mL may be worth reconsidering in favor of a lower target with an upper limit.
The rate of falls in this study was collected over the 60 days following initiation of ergocalciferol. However, the achieved 25(OH)D level was not evaluated until between 8 and 24 weeks following initiation. In this context, it may be more likely that the increased rate of falls could be attributable to the high-dose nature of vitamin D2 supplementation or the rate of 25(OH)D repletion rather than the 25(OH)D level ultimately achieved.
Limitations
Given the study’s retrospective nature, at times there was difficulty in locating information in the EHR, including accurate reports of active medication use during study periods or documentation of all falls that had occurred in the appropriate format. This was further complicated by the reliance on self-reporting of falls, which may potentiate an underestimation of total falls.
The largely homogenous study population may limit extrapolating these results. Additionally, although some diseases and medications with an inherent risk on fall risk were incorporated into the exclusion criteria, on analysis, other diseases and medications were identified that also may pose a similar risk. These include legal blindness and a history of below-the-knee amputation as well as long-term opioid therapy and intensive antihypertensive therapy with multiple agents. Furthermore, other potential risk factors for falls were not addressed, such as functional status, use of assistive devices, or unsafe home environments.
For the secondary endpoint, sample size was not met for statistical significance, which limited the study’s ability to confirm the veracity of the trend of increased falls. Study duration posed an additional limitation. As most veterans enrolled in HBPC have vitamin D supplementation initiated soon after enrollment when the need for vitamin D repletion is routinely assessed, a 2-month duration for evaluation prior to and immediately following initiation of ergocalciferol was necessary to allow for adequate study enrollment for analysis of the primary endpoint. However, this may be resolved through conduction of a prospective study in the future.
Conclusion
There was no difference identified in the rate of falls immediately prior to and following initiation of ergocalciferol 50,000 IU self-administered once weekly. There was a trend of increased rate of falls in subjects with high levels of 25(OH)D achieved. In light of a similar finding of high-dose vitamin D3 associated with an increased rate of falls, particularly with higher achieved levels of 25(OH)D, it may be warranted to consider avoiding high-dose vitamin D2 supplementation. Future research including prospective, randomized clinical studies with a longer duration of follow-up would be recommended to confirm these findings and test the generalizability in the non-HBPC community-dwelling population.
1. Stevens JA, Ballesteros MF, Mack KA, Rudd RA, DeCaro E, Adler G. Gender differences in seeking care for falls in the aged Medicare population. Am J Prev Med. 2012;43(1):59-62.
2. Centers for Disease Control and Prevention, National Center for Injury Prevention and Control. Welcome to WISQARS. https://www.cdc.gov/injury/wisqars/index.html. Updated February 5, 2018. Accessed April 10, 2018.
3. O’Loughlin JL, Robitaille Y, Boivin JF, Suissa S. Incidence of and risk factors for falls and injurious falls among the community-dwelling elderly. Am J Epidemiol. 1993;137(3):342-354.
4. Bischhoff-Ferrari HA, Dawson-Hughes B, Willet WC, et al. Effect of vitamin D on falls: a meta-analysis. JAMA. 2004;291(16):1999-2006.
5. Holick MF. Resurrection of vitamin D deficiency and rickets. J Clin Invest. 2006;116(8):2062-2072.
6. Bischoff-Ferrari HA, Giovannucci E, Willett WC, Dietrich T, Dawson-Hughes B. Estimation of optimal serum concentrations of 25-hydroxyvitamin D for multiple health outcomes. Am J Clin Nutr. 2006;84(1):18-28.
7. Bischoff HA, Stähelin HB, Dick W, et al. Effects of vitamin D and calcium supplementation on falls: a randomized controlled trial. J Bone Miner Res. 2003;18(2):343-351.
8. Bischoff-Ferrari HA, Dietrich T, Orav EJ, et al. Higher 25-OH vitamin D concentrations are associated with better lower-extremity function in both active and inactive persons aged > 60 years. Am J Clin Nutr. 2004;80(3):752-758.
9. Pfeifer M, Begerow B, Minne HW, Abrams C, Nachtigall D, Hansen C. Effects of a short-term vitamin D and calcium supplementation on body sway and secondary hyperparathyroidism in elderly women. J Bone Miner Res. 2000;15(6):1113-1118.
10. Sambrook PN, Chen JS, March LM, et al. Serum parathyroid hormone predicts time to fall independent of vitamin D status in a frail elderly population. J Clin Endocrinol Metab. 2004;89(4):1572-1576.
11. Flicker L, Mead K, MacInnis RJ, et al. Serum vitamin D and falls in older women in residential care in Australia. J Am Geratr Soc. 2003;51(11):1533-1538.
12. Faulkner KA, Cauley JA, Zmuda JM, et al. Higher 1,25-dihydroxyvitamin D3 concentrations associated with lower fall rates in older community-dwelling women. Osteoporos Int. 2006;17(9):1318-1328.
13. Bischoff-Ferrari HA, Dawson-Hughes B, Staehelin HB, et al. Fall prevention with supplemental and active forms of vitamin D: a meta-analysis of randomized controlled trials. BMJ. 2009;339:b3692.
14. Gillespie LD, Robertson MC, Gillespie WJ, et al. Interventions for preventing falls in older people living in the community. Cochrane Database Syst Rev. 2009;(2):CD007146.
15. American Geriatrics Society Workgroup on Vitamin D Supplementation for Older Adults. Recommendations abstracted from the American Geriatrics Society Consensus Statement on vitamin D for the prevention of falls and their consequences. J Am Geriatr Soc. 2014;62(1):147-152.
16. Bischoff-Ferrari HA, Dawson-Hughes B, Orav EJ, et al. Monthly high-dose vitamin D treatment for the prevention of functional decline: a randomized clinical trial. JAMA Intern Med. 2016;176(2):175-183.
17. American Geriatrics Society 2015 Beers Criteria Update Expert Panel. American Geriatrics Society 2015 updated Beers Criteria for potentially inappropriate medication use in older adults. J Am Geriatr Soc. 2015;63(11):2227-2246.
Annually, about 1 in 4 individuals aged ≥ 65 years will experience at least 1 fall, resulting in nearly 2.8 million cases of emergently treated injuries and more than 800,000 hospitalizations.1-3 Therefore, fall prevention has garnered heightened attention as the population ages. Many factors are at play in fall risk, including vitamin D levels.
Although vitamin D is essential for a multitude of physiologic processes, evidence suggests that serum concentrations of 25-hydroxy vitamin D (25[OH]D) < 30 ng/mL are associated with decreased bone mineral density, muscle weakness, impaired lower extremity function, balance problems, and high fall rates.4-12 Through a meta-analysis published in 2009 that included 8 randomized controlled trials of 2,426 participants aged ≥ 65 years, Bischoff-Ferrari and colleagues found that a dose of 700 to 1,000 IU/d significantly reduced the risk of falling compared with doses of 200 to 600 IU/d.13 A subsequent meta-analysis published in 2012 including 14 randomized trials across 28,135 participants aged ≥ 65 years evaluated the efficacy of supplementation with vitamin D with or without calcium cosupplement on fall prevention.14 Although no difference was found in falls across the total sample, a subgroup analysis exploring the effect in participants with lower vitamin D levels demonstrated a statistically significant benefit of vitamin D supplementation. To decrease the risk of fractures and falls, the American Geriatric Society (AGS) recommends vitamin D supplementation of at least 1,000 IU/d in combination with calcium supplementation in older adults, with a minimum goal 25(OH)D level of 30 ng/mL.15
Alarmingly, Bischoff-Ferrari and colleagues published a double-blind, randomized trial that described an association between higher monthly doses of vitamin D3 (cholecalciferol) and an increased risk of falls compared with 24,000 IU/mo. Particularly at higher achieved levels of 25(OH)D, with no difference in benefit was noted on the primary endpoint of lower extremity function.16
Although there exists limited representation of high-dose vitamin D2 and its resultant effects on falls in those aged ≥ 65 years, once weekly prescribing of vitamin D2 in the form of ergocalciferol 50,000 IU remains a commonly used option for repletion of low 25(OH)D. In this study, the authors evaluated the effect of high-dose ergocalciferol on rate of falls in a community-dwelling veteran population ≥ 65 years with low 25(OH)D.
Methods
Following approval from the Lexington Veteran Affairs Medical Center (Lexington VAMC) Institutional Review Board and Research and Development Committee, a retrospective chart review was conducted. Subjects were identified through use of Microsoft SQL (Redmond, WA). Veterans included were those enrolled in home-based primary care (HBPC), a primary care assignment for those individuals requiring skilled services and case management within the home and for whom falls are documented within the electronic health record (EHR). As fall data in a community-dwelling population are difficult to obtain in a retrospective analysis, the HBPC population offered a viable pool of data for evaluation. Some patients eligible for HBPC at the Lexington VAMC may be more dependent on specialized services offered through HBPC or have a reduced ability to perform activities of daily living (ADLs). Other patients can ambulate but may have difficulty traveling great distances to Lexington VAMC.
In addition to HBPC enrollment, veterans were included in the study if they were aged ≥ 65 years and had a 25(OH)D level < 20 ng/mL with subsequent prescribing of high-dose vitamin D2 for repletion, namely, ergocalciferol 50,000 IU once weekly, between March 1, 2005, and September 30, 2016.
Veterans were excluded if they had been enrolled in HBPC for less than 60 days before ergocalciferol initiation, if they were deceased or had been discharged from HBPC within 60 days of ergocalciferol initiation, if they had comorbid conditions that inherently increase the risk of falls (eg, Lewy body dementia, Parkinson disease, bilateral below-the-hip amputation, and hemi- or quadriplegia), or if they had been dispensed a previous prescription of ergocalciferol in the preceding 9 months.
A case-crossover study design was used, which compared the 60-day period prior to initiation of ergocalciferol supplementation with the 60-day period following initiation of supplementation. A 7-day period between these 2 periods was allotted to allow time for mailing of the new prescription and initiation of the supplement.
Data Collection
Data collected included age, sex, levels of 25(OH)D, ergocalciferol prescription data (dose, administration frequency, quantity, day supply, and fill date), falls documented during the 60 days preceding and during supplementation, and the number of medications that posed an increased risk of falls actively prescribed prior to and during supplementation. Those medications considered to increase risk of falls were determined according to the medications listed in the AGS 2015 Updated Beers Criteria for Potentially Inappropriate Medication Use in Older Adults.17
Endpoints
The primary endpoint assessed was the change in rate of falls between the time preceding and during supplementation. The number of falls during the 60 days preceding ergocalciferol supplementation was standardized to falls per person per 30 days and compared with the same parameter during the 60-day period following initiation of ergocalciferol.
The secondary outcome was the rate of falls according to the level of 25(OH)D achieved as a result of supplementation in those patients who achieved a minimum 25(OH)D level of 30 ng/mL according to AGS recommendations. Those patients who achieved a minimum 25(OH)D concentration of 30 ng/mL were separated into 2 equal groups according to their respective concentration relative to the median.
Statistical Analysis
Numerical variables were compared using a Student t test. For the primary outcome, 64 participants were required in order to achieve 80% power at a significance of .05 for a 2-tailed assessment, each serving as his or her own control in the case-crossover study design. For the secondary outcome of falls according to 25(OH)D level following supplementation in order to achieve 80% power at a significance of 0.05 for a 2-tailed assessment, a total of 128 participants who reach a minimum 25(OH)D level of 30 ng/mL were required.
Results
After screening 187 subjects who met the inclusion criteria, 107 subjects were excluded (Figure ).
Primary Endpoint
Following once weekly supplementation with ergocalciferol 50,000 IU, 25(OH)D levels increased from 14.5 ng/mL (SD 4.2) to 27.6 (SD 9.6) (P < .01). Of note, the timing of the 25(OH)D level obtained following initiation of supplementation ranged between 8 weeks and 24 weeks. The number of PIMs-F decreased marginally, although to a not statistically significant degree, from 0.81 PIMs-F per person (SD 0.92) to 0.76 PIMs-F per person (SD 0.88).
Secondary Endpoint
Although 51 of the subjects (63.8%) failed to achieve the target 25(OH)D level of ≥ 30 ng/mL, 29 were successful (Table 3).
In subjects whose achieved 25(OH)D level was 30 to 36 ng/mL, the rate of falls per person per 30 days increased from 0.036 to 0.18. Similarly, an increase in rate of falls per person per 30 days from 0.1 to 0.3 was noted in subjects whose attained 25(OH)D level was > 36.0 ng/mL. However, study enrollment was underpowered to claim statistical significance in these findings related to the secondary endpoint.
Discussion
In this retrospective chart review, individuals aged ≥ 65 years who were prescribed once weekly ergocalciferol 50,000 IU for increase of 25(OH)D levels < 20 ng/mL experienced no change in rate of falls across the entire study population. In those individuals whose achieved 25(OH)D level met the AGS recommendation of ≥ 30 ng/mL, there was a trend toward an increased rate of falls while the rate of falls decreased for subjects whose achieved 25(OH)D level was < 30 ng/mL.
High-dose vitamin D supplementation, albeit with vitamin D3, and its effect on falls have been evaluated in the geriatric population previously, most notably and recently, by Bischoff-Ferrari and colleagues.16 In a study comparing 24,000 IU vitamin D3 per month vs 60,000 IU vitamin D3 per month vs 24,000 IU vitamin D3 plus calcifediol 300 µg per month, lower extremity function did not differ in the 3 groups. However, an increased number of falls was noted in the second and third arm, respectively. Furthermore, after 12 months of treatment, those individuals who achieved the highest quartile of 25(OH)D level (44.7-98.9 ng/mL) had starkly increased odds of falling and number of falls compared with those achieving the lowest quartile (21.3-30.3 ng/mL).
The results of this study suggest that once-weekly high-dose vitamin D2 may carry a similar risk of increasing falls as found with high-dose vitamin D3, particularly at higher achieved levels of 25(OH)D. A possible explanation for a lower rate of falls in those individuals who did not achieve a 25(OH)D level of at least 30 ng/mL could be that these individuals may not have initiated the medication appropriately or administered it adherently, thereby avoiding a possible deleterious effect that the high-dose preparation may pose in this population.
Given the retrospective nature of the study and the evaluation of the change in the 25(OH)D level following approximately a 90-day supply of ergocalciferol, adherence was not addressed. In this case, although increased 25(OH)D level was the desired outcome of vitamin D supplementation, the increase in rate of falls may be attributable to the high-dose preparation itself. Alternatively, the 25(OH)D target of ≥ 30 ng/mL may be worth reconsidering in favor of a lower target with an upper limit.
The rate of falls in this study was collected over the 60 days following initiation of ergocalciferol. However, the achieved 25(OH)D level was not evaluated until between 8 and 24 weeks following initiation. In this context, it may be more likely that the increased rate of falls could be attributable to the high-dose nature of vitamin D2 supplementation or the rate of 25(OH)D repletion rather than the 25(OH)D level ultimately achieved.
Limitations
Given the study’s retrospective nature, at times there was difficulty in locating information in the EHR, including accurate reports of active medication use during study periods or documentation of all falls that had occurred in the appropriate format. This was further complicated by the reliance on self-reporting of falls, which may potentiate an underestimation of total falls.
The largely homogenous study population may limit extrapolating these results. Additionally, although some diseases and medications with an inherent risk on fall risk were incorporated into the exclusion criteria, on analysis, other diseases and medications were identified that also may pose a similar risk. These include legal blindness and a history of below-the-knee amputation as well as long-term opioid therapy and intensive antihypertensive therapy with multiple agents. Furthermore, other potential risk factors for falls were not addressed, such as functional status, use of assistive devices, or unsafe home environments.
For the secondary endpoint, sample size was not met for statistical significance, which limited the study’s ability to confirm the veracity of the trend of increased falls. Study duration posed an additional limitation. As most veterans enrolled in HBPC have vitamin D supplementation initiated soon after enrollment when the need for vitamin D repletion is routinely assessed, a 2-month duration for evaluation prior to and immediately following initiation of ergocalciferol was necessary to allow for adequate study enrollment for analysis of the primary endpoint. However, this may be resolved through conduction of a prospective study in the future.
Conclusion
There was no difference identified in the rate of falls immediately prior to and following initiation of ergocalciferol 50,000 IU self-administered once weekly. There was a trend of increased rate of falls in subjects with high levels of 25(OH)D achieved. In light of a similar finding of high-dose vitamin D3 associated with an increased rate of falls, particularly with higher achieved levels of 25(OH)D, it may be warranted to consider avoiding high-dose vitamin D2 supplementation. Future research including prospective, randomized clinical studies with a longer duration of follow-up would be recommended to confirm these findings and test the generalizability in the non-HBPC community-dwelling population.
1. Stevens JA, Ballesteros MF, Mack KA, Rudd RA, DeCaro E, Adler G. Gender differences in seeking care for falls in the aged Medicare population. Am J Prev Med. 2012;43(1):59-62.
2. Centers for Disease Control and Prevention, National Center for Injury Prevention and Control. Welcome to WISQARS. https://www.cdc.gov/injury/wisqars/index.html. Updated February 5, 2018. Accessed April 10, 2018.
3. O’Loughlin JL, Robitaille Y, Boivin JF, Suissa S. Incidence of and risk factors for falls and injurious falls among the community-dwelling elderly. Am J Epidemiol. 1993;137(3):342-354.
4. Bischhoff-Ferrari HA, Dawson-Hughes B, Willet WC, et al. Effect of vitamin D on falls: a meta-analysis. JAMA. 2004;291(16):1999-2006.
5. Holick MF. Resurrection of vitamin D deficiency and rickets. J Clin Invest. 2006;116(8):2062-2072.
6. Bischoff-Ferrari HA, Giovannucci E, Willett WC, Dietrich T, Dawson-Hughes B. Estimation of optimal serum concentrations of 25-hydroxyvitamin D for multiple health outcomes. Am J Clin Nutr. 2006;84(1):18-28.
7. Bischoff HA, Stähelin HB, Dick W, et al. Effects of vitamin D and calcium supplementation on falls: a randomized controlled trial. J Bone Miner Res. 2003;18(2):343-351.
8. Bischoff-Ferrari HA, Dietrich T, Orav EJ, et al. Higher 25-OH vitamin D concentrations are associated with better lower-extremity function in both active and inactive persons aged > 60 years. Am J Clin Nutr. 2004;80(3):752-758.
9. Pfeifer M, Begerow B, Minne HW, Abrams C, Nachtigall D, Hansen C. Effects of a short-term vitamin D and calcium supplementation on body sway and secondary hyperparathyroidism in elderly women. J Bone Miner Res. 2000;15(6):1113-1118.
10. Sambrook PN, Chen JS, March LM, et al. Serum parathyroid hormone predicts time to fall independent of vitamin D status in a frail elderly population. J Clin Endocrinol Metab. 2004;89(4):1572-1576.
11. Flicker L, Mead K, MacInnis RJ, et al. Serum vitamin D and falls in older women in residential care in Australia. J Am Geratr Soc. 2003;51(11):1533-1538.
12. Faulkner KA, Cauley JA, Zmuda JM, et al. Higher 1,25-dihydroxyvitamin D3 concentrations associated with lower fall rates in older community-dwelling women. Osteoporos Int. 2006;17(9):1318-1328.
13. Bischoff-Ferrari HA, Dawson-Hughes B, Staehelin HB, et al. Fall prevention with supplemental and active forms of vitamin D: a meta-analysis of randomized controlled trials. BMJ. 2009;339:b3692.
14. Gillespie LD, Robertson MC, Gillespie WJ, et al. Interventions for preventing falls in older people living in the community. Cochrane Database Syst Rev. 2009;(2):CD007146.
15. American Geriatrics Society Workgroup on Vitamin D Supplementation for Older Adults. Recommendations abstracted from the American Geriatrics Society Consensus Statement on vitamin D for the prevention of falls and their consequences. J Am Geriatr Soc. 2014;62(1):147-152.
16. Bischoff-Ferrari HA, Dawson-Hughes B, Orav EJ, et al. Monthly high-dose vitamin D treatment for the prevention of functional decline: a randomized clinical trial. JAMA Intern Med. 2016;176(2):175-183.
17. American Geriatrics Society 2015 Beers Criteria Update Expert Panel. American Geriatrics Society 2015 updated Beers Criteria for potentially inappropriate medication use in older adults. J Am Geriatr Soc. 2015;63(11):2227-2246.
Accuracy of Distal Femoral Valgus Deformity Correction: Fixator-Assisted Nailing vs Fixator-Assisted Locked Plating
ABSTRACT
Fixator-assisted nailing (FAN) and fixator-assisted locked plating (FALP) are 2 techniques that can be used to correct distal femoral valgus deformities. The fixator aids in achieving an accurate adjustable initial reduction, which is then made permanent with either nail or plate insertion. FALP can be performed with the knee held in a neutral extended position, whereas FAN requires 30° to 90° of knee flexion to insert the nail, which may cause some alignment loss. We hypothesized that FAN may yield less accurate correction than FALP. Prospectively collected data of a consecutive cohort of patients who underwent valgus deformity femoral correction with FAN or FALP at a single institution over an 8-year period were retrospectively evaluated. Twenty extremities (18 patients) were treated using FAN (median follow-up, 5 years; range, 1-10 years), and 7 extremities (6 patients) were treated with FALP (median follow-up, 5 years; range, 1-8 years). In the FAN cohort, the mean preoperative and postoperative mechanical lateral distal femoral angles (mLDFAs) were 81° (range, 67°-86°) and 89° (range, 80°-100°), respectively (P = .009). In the FALP cohort, the mean preoperative and postoperative mLDFAs were 80° (range, 71°-87°) and 88° (range, 81°-94°), respectively (P < .001). Although the average mechanical axis deviation correction for the FALP group was greater than for the FAN group (32 mm and 27 mm, respectively), the difference was not significant (P = .66). Both methods of femoral deformity correction can be considered safe and effective. On the basis of our results, FAN and FALP are comparable in accuracy for deformity correction in the distal femur.
Multiple etiologies for distal femoral valgus deformity have been described in the literature.1-3 These can be congenital, developmental, secondary to lateral compartmental arthritis, or posttraumatic.4 If not corrected, femoral deformities alter the axial alignment and orientation of the joints, and may lead to early degenerative joint disease and abnormal leg kinematics.3,5 After correcting these deformities, the goal of treatment is to obtain anatomic distal femoral angles and neutral mechanical axis deviation (MAD), but without overcorrecting into varus. Numerous techniques to fix these deformities, such as progressive correction with external fixation or acute correction open reduction with internal fixation (ORIF), have been described.6 Modern external fixation allows for a gradual, adjustable, and more accurate correction but may produce discomfort and complications for patients.7-10 In contrast, ORIF may be more tolerable for the patient, but to achieve a precise correction, considerable technical skills and expertise are required.1,11-14
Two techniques used to correct these valgus femoral deformities in adults are fixator-assisted nailing (FAN) and fixator-assisted locked plating (FALP).1 FAN and FALP combine the advantage of external fixation (accuracy, adjustability) with the benefits of internal fixation (patient comfort), because the osteotomy and correction are performed with the guidance of a temporary external fixator and then permanently fixated by an intramedullary (IM) nail or a locking plate.1,8,11-13,15-18 Both techniques have the possibility to correct varus and valgus deformities, but whenever correcting sagittal plane angulation, the FAN technique may be more challenging. The paucity of studies available involving FAN and FALP do not lead to a conclusive preference of one technique over the other relative to the accuracy and success of correction.15,19,20
Continue to: In both FAN and FALP
In both FAN and FALP, the external fixator is applied and adjusted after the osteotomy for accurate alignment. In FALP, the plate is added without moving the leg from its straight position. However, in FAN, the knee must be flexed to 30° to 90° for insertion of the retrograde knee nail, and the alignment may be lost if the external fixation is not fully stable. Therefore, we hypothesized that FAN would be less accurate than FALP. Hence, the purposes of this study is to compare the correction achieved with FAN and FALP in patients with distal femoral valgus deformities and to describe the intraoperative complications associated with both techniques.
MATERIALS AND METHODS
After proper Institutional Review Board approval was obtained, a consecutive cohort of 35 patients who underwent femoral deformity correction with either FAN or FALP during an 8-year period (January 2002 to December 2010) was retrospectively reviewed. Eleven patients had to be excluded because of inadequate follow-up (<12 months) or because additional procedures were simultaneously performed. A total of 24 patients (27 femora) who had a mean age of 26 years (range, 14-68 years) were included in the final study cohort. Specifically, 20 femora (18 patients) were corrected using the FAN technique (7 males and 11 females; mean age, 36 years; range, 14-68 years), and 7 femora (6 patients) were fixed using the FALP technique (2 males and 4 females; mean age, 16 years; range, 15-19 years). The median follow-up in the FAN cohort was 5 years (range, 1-10 years), and the median follow-up in the FALP cohort was 5 years (range, 1-8 years) (Table 1).
| Table 1. Study Details and Demographic Characteristics | |||
| Detail | Overall | FAN | FALP |
| Number of patients | 24 | 18 | 6 |
| Number of femurs | 27 | 20 | 7 |
| Age in years (range) | 26 (14 to 68) | 36 (14 to 68) | 16 (15 to 19) |
| Male:Female | 9:15 | 7:11 | 2:4 |
| Median follow-up in years (range) | 5 (1 to 10) | 5 (1 to 10) | 5 (1 to 8) |
Abbreviations: FALP, fixator assisted locked plating; FAN, fixator assisted nailing
The specific measurements performed in all patients were MAD, mechanical lateral distal femoral angle (mLDFA), and medial proximal tibia angle (MPTA). These were measured from standing anteroposterior radiographs of the knee that included the femur.21 All outcome data were collected from the medical charts, operative reports, and radiographic evaluations. To ensure accuracy, all measurements were performed by 2 authors blinded to each other’s measurements. If a variation of <5% was obtained, the results were averaged and used for further analysis. Whenever a difference of >5% was obtained, the measurement was repeated by both authors for confirmation.
SURGICAL FAN TECHNIQUE
After measuring the deformity (Figure 1A) with the patient under general anesthesia on a radiolucent table, the involved lower limb is prepared and draped. Two half-pins are inserted medially, 1 proximal and 1 distal to the planned osteotomy site (Figure 1B), and then connected loosely with a monolateral external fixator. Special care is taken while placing the half-pins, not to interfere with the insertion path of the IM rod. When performing the preoperative planning, the level of osteotomy is chosen to enable the placement of at least 2 interlocking screws distal to the osteotomy. Then, a percutaneous osteotomy is performed from a lateral approach, and the bone ends are manipulated (translation and then angulation) to achieve the desired deformity correction. The external fixator is then stabilized and locked in the exact position (Figure 1C). Subsequently, retrograde reaming, nail insertion, and placement of proximal and distal locking screws are performed (Figure 1D). Blocking screws may give additional stability. The removal of the external fixator is the final step (Figure 1E).20 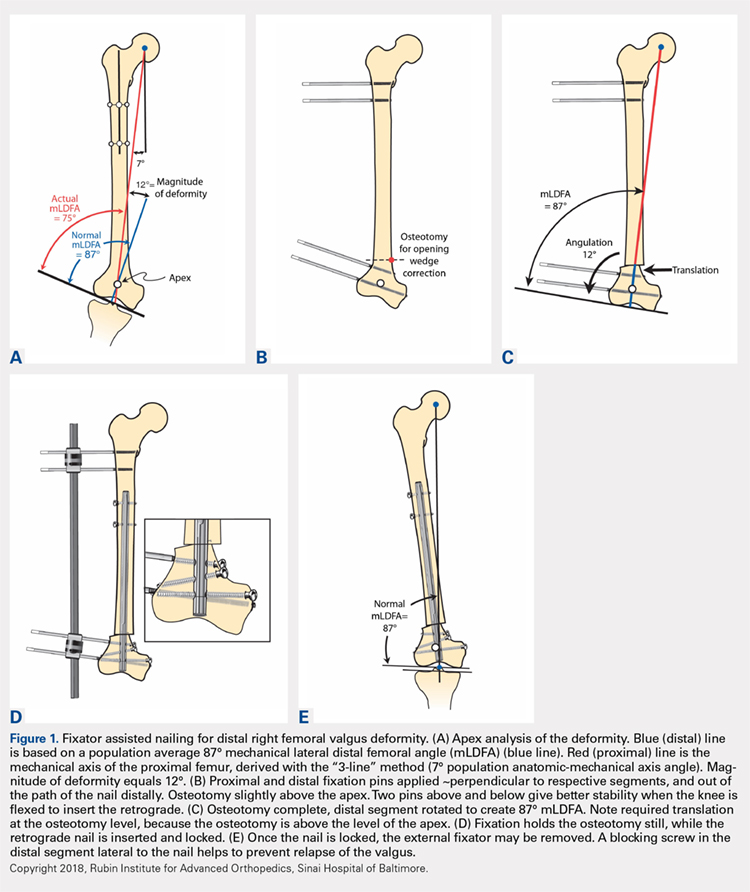
Continue to: When using the FAN technique...
When using the FAN technique, special attention is paid to reducing the risk of fat embolism. This can be reduced but not totally eradicated with the use of reaming irrigation devices.22-24 In our technique of FAN, the bone is cut and displaced prior to reaming so that the pressure of reaming is vented out through the osteotomy, along with the reaming contents, which theoretically can then act as a “prepositioned bone graft” that may speed healing.
SURGICAL FALP TECHNIQUE
Preoperatively, a decision concerning the planned osteotomy and the correct locking plate size is made. In addition, the outline of the plate is marked on the skin. Under general anesthesia, the patients are prepared and draped. A tourniquet is elevated around the upper thigh. Then, 2 half-pins are medially inserted, 1 proximal and 1 distal to the planned osteotomy site, and are then connected loosely with a monolateral external fixator (Figure 2A). A lateral approach to the distal femur is done, preserving the periosteum, except at the level of the osteotomy. After the osteotomy is performed (through an open lateral incision), both segments are translated (Figure 2B) and then the distal segment is angulated to achieve the desired deformity correction, and the desired position is then stabilized by tightening the external fixator connectors (Figure 2C). Subsequently, a locking plate is inserted in the submuscular-extraperiostal plane. The plate does not require being in full contact (flush) with the bone. At least 3 screws are placed on both sides of the osteotomy through a long lateral incision (Figure 2D). Bone graft may be added to the osteotomy site to encourage healing. Then, the external fixator is removed, and all incisions are closed (Figure 2E).15,19 
During each of the procedures, we aimed at having “perfect alignment” with a MAD of 0 mm, in which a Bovie cord is used and passed through the center of the femoral head, knee, and ankle. However, to confirm that the surgery was successful, the actual measurements were performed on standing long-leg films. These films were obtained preoperatively and at latest follow-up. They were performed with the patella aiming forward, the toes straight ahead, feet separated enough for good balance, knees fully extended, and weight equally distributed on the feet. Postoperatively, in both cohorts, partial weight-bearing was encouraged immediately with crutches; physical therapy was instituted daily for knee range of motion. Radiographs were scheduled every 4 weeks to monitor callus formation. Full weight-bearing was allowed when at least 3 cortices were consolidated.1,15,19,20,25,26
All statistical analyses were performed with the aid of the SPSS statistical software package (SPSS). Average values and standard error of the mean were assigned to each variable. A nonparametric Mann-Whitney U test was used, and a 2-tailed P < .05 was considered significant. Correlation of continuous variables was determined by Spearman’s correlation coefficient. Also, multivariate Cox regression analyses after adjustment for age, sex, and deformity correction were used to detect associations within the study population. To evaluate whether our data were normally distributed, Shapiro-Wilk tests were performed.
Continue to: Results...
RESULTS
The mLDFA significantly improved in the FAN cohort from a mean of 81° to a mean of 89° (ranges, 67°-86° and 80°-100°; respectively; P = .001) (Figures 3A, 3B). 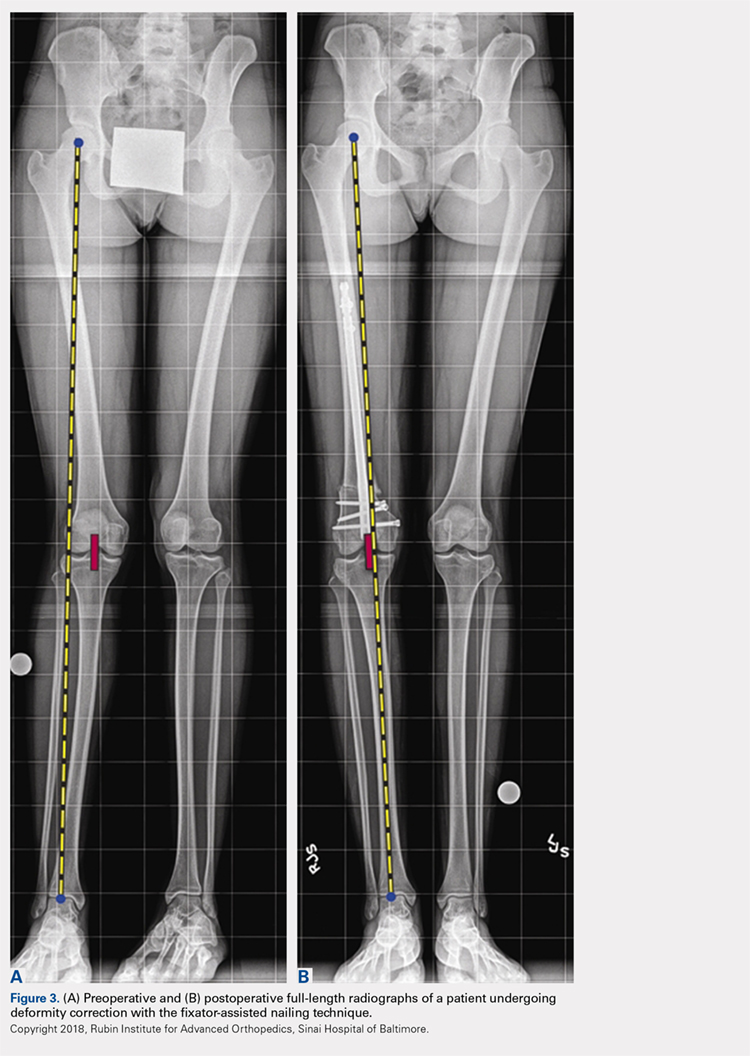
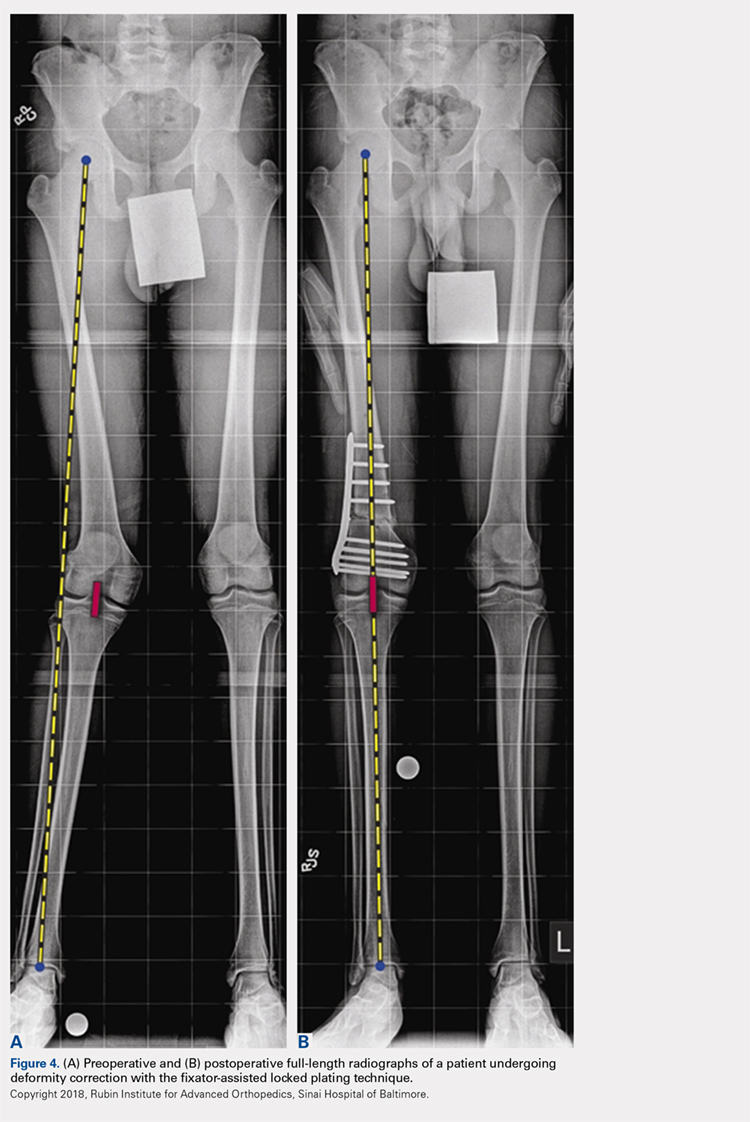
| Table 2. Deformity Correction | ||||
| Measurement | Cohort | Preoperative | Postoperative | P Value |
| mLDFA in degrees (range) | FAN | 81 (67 to 86) | 89 (80 to 100) | 0.001 |
| FALP | 80 (71 to 87) | 90 (88 to 94) | <0.001 | |
| Mechanical axis deviation in mm (range) | FAN | 32 (6 to 64) | 10 (0 to 22) | 0.001 |
| FALP | 34 (17 to 62) | 4 (0 to 11) | 0.002 | |
Abbreviations: FALP, fixator assisted locked plating; FAN, fixator assisted nailing; mLDFA, mechanical lateral distal femoral angle
After evaluating the MPTA, in the FAN cohort, we found that the mean pre- and postoperative MPTAs were not modified. These patients had a mean preoperative angle of 88° (range, 62°-100°), which was kept postoperatively to a mean of 88° (range, 78°-96°). In the FALP cohort, a slight change from 90° to 88° was observed (ranges, 82°-97° and 83°-94°, respectively). None of these changes in MPTA were significant (P > .05).
When evaluating correction of the MAD, we observed that the FAN cohort changed from a preoperative MAD of 32 mm (range, 6-64 mm) to a postoperative mean of 10 mm (range, 0-22 mm), and this correction was statistically significant. (P = .001). The FALP cohort changed from a mean of 34 mm (range, 17-62 mm) preoperatively to 4 mm (range, 0-11 mm) postoperatively, and this was also statistically significant (P = .002). The mean MAD correction for the FAN group vs FALP group was 27 mm vs 32 mm, respectively (Table 2).
In patients with valgus femoral deformity, the MAD is usually lateralized; however, in the FAN cohort, we included 3 patients with medial MADs (10 mm, 13 mm, and 40 mm). This is justified in these patients because a complex deformity of the distal femur and the proximal tibia was present. In the extreme case of a 40-mm medial MAD, the presurgery mLDFA was 76°, and the presurgery MPTA was 62°. The amount of deformity correction in this patient was 16°.
During the follow-up period, 2 complications occurred in the FAN group. One patient developed gait disturbance that resolved with physical therapy. Another had an infection at the osteotomy site. This was addressed with intravenous antibiotic therapy, surgical irrigation and débridement, hardware removal, and antegrade insertion of an antibiotic-coated nail. In the FALP group, 1 patient developed a persistent incomplete peroneal nerve palsy attributed to a 17° correction from valgus to varus, despite prophylactic peroneal nerve decompression. Nonetheless, the patient was satisfied with the result, recovered partial nerve function, and returned for correction of the contralateral leg deformity. When comparing the complications between both cohorts, no significant differences were found: 2 of 18 cases (11%) in the FAN group vs 1 of 6 cases (17%) in the FALP group (P = .78).
Continue to: The goal of this study...
DISCUSSION
The goal of this study was to compare the accuracy of deformity corrections achieved with either FAN or FALP. A number of authors have described results after deformity correction with several plating and nailing techniques; however, the information derived from comparing these 2 techniques is limited. We hypothesized that FALP would be more accurate, because less mobilization during fixation is required. However, we found no significant differences between these 2 techniques.
This study has several limitations. First, the small size of our cohort had to be further reduced owing to limited data; nevertheless, this pathology and the treatment methods used are not commonly performed, which make this cohort 1 of the largest of its type described in the literature. Also, the procedures were performed by multiple surgeons in a population with a wide age range, creating multiple additional variables that complicate the comparison of the sole differences between FAN and FALP. However, owing to these variables, the generalizability of this study may be increased, and similar outcomes can potentially be obtained by other institutions/surgeons. In addition, the variability of our follow-up period is another limitation; however, these patients were all assessed until bony union after skeletal maturity was achieved. Hence, the development of additional deformity is not expected. The lack of clinical outcome with a standardized questionnaire may also be seen as a limitation. However, because the purpose of our study was to assess both surgeries in terms of their ability to achieve angular correction, the addition of patient-reported outcomes may have increased the variability of our data.
The foremost objective in valgus deformity correction is to establish joint orientation angles within anatomic range to prevent overloading of the lateral joint and thereby prevent lateral compartmental osteoarthritis.2,20,27-29 There are 2 categories of fixation: internal and external. With FAN and FALP, we strive to have the adjustability and accuracy of external fixation with the comfort (for the patient) of internal fixation. Accurate osteotomy correction requires an accurate preoperative analysis and osteotomy close to the apex of the deformity.16,21,30-33 The most commonly used osteotomy techniques are drill-hole,31 focal dome,34 rotation, and open- or closed-wedge osteotomies.35,36 After the osteotomy, the resultant correction has to be stabilized. In recent years, the popularity of plates instead of an IM nail for internal fixation has been driven by the rapid development of low contact locking plates.16,19,26,30,37-40
There are certain advantages of using FAN over FALP. In older patients who may require a subsequent total knee arthroplasty (TKA), the midline incision used for retrograde FAN technique is identical to that made for TKA. In contrast, in a younger and more active population, with a longer life expectancy, the extra-articular FALP approach has the advantage of not violating the knee joint. In addition, locking plates may achieve a more rigid fixation than IM nails; however, the stability of IM nails can be augmented with blocking screws.
Continue to: In 20 patients, including children...
In 20 patients, including children and young adults, with frontal and sagittal plane deformities, Marangoz and colleagues7 reported on correction of valgus, varus, and procurvatum deformities using a Taylor Spatial Frame (TSF). Successful correction of severe deformities was achieved gradually with the TSF, resulting in a postoperative deformity (valgus group) of mLDFA 88.9° (range, 85°-95°).7 In a more recent study, Bar-On and colleagues15 described a series of 11 patients (18 segments) with corrective lower limb osteotomies in which all were corrected to within 2° of the planned range. Similarly, Gugenheim and Brinker20 described the use of the FAN technique to correct distal varus and valgus deformities in 14 femora. The final mean mLDFA and MAD in the valgus group were 89° (range, 88°-90°) and 5 mm (range, 0-14 mm medial), respectively.
In their comparative study, Seah and colleagues11 described monolateral frame vs FALP deformity correction in a series of 34 extremities (26 patients) that required distal femoral osteotomy. No differences related to knee range of motion or the ability to correct the deformity between internal and external fixation were reported (P > .05). Similarly, Eidelman and colleagues1 evaluated the outcomes of 6 patients (7 procedures) who underwent surgery performed with the FALP technique for distal femoral valgus deformity. They concluded that this technique is minimally invasive and can provide a precise deformity correction with minimal morbidity.
Other methods of fixation while performing FAN have been described by Jasiewicz and colleagues,22 who evaluated possible differences between the classic Ilizarov device and monolateral fixators in 19 femoral lengthening procedures. The authors concluded that there is no difference between concerning complication rate and treatment time. The use of FAN has also been described in patients with metabolic disease who required deformity correction. In this regard, Kocaoglu and colleagues12 described the use of a monolateral external fixator in combination with an IM nail in a series of 17 patients with metabolic bone disease. The authors concluded that the use of the IM nail prevented recurrence of deformity and refracture.12 Kocaoglu and colleagues14 also published a series of 25 patients treated with the FAN and LON (lengthening over a nail) technique for lengthening and deformity correction. The mean MAD improved from 33.9 mm to11.3 mm (range, 0-30 mm). In contrast, Erlap and colleagues13 compared FAN with circular external fixator for bone realignment of the lower extremity for deformities in patients with rickets. Although no significant difference was found between both groups, FAN was shown to be accurate and to provide great comfort to patients, and it also shortened the total treatment time.13 Finally, the advent of newer technologies could also provide alternatives for correcting valgus deformities. For example, Saragaglia and Chedal-Bornu6 performed 29 computer-assisted valgus knees osteotomies (27 patients) and reported that the goal hip-knee angle was achieved in 86% of patients and that the goal MPTA was achieved in 100% of patients.6
CONCLUSION
Both the FALP and FAN methods of femoral deformity correction are safe and effective surgical techniques. In our opinion, the advantages of the FALP technique result from the easy lateral surgical approach under medial external fixation and stabilization of the osteotomy without bending the knee. Ultimately, the decision to use FAN may be influenced by the surgeon’s perception of the potential need for future TKA. In such cases, a midline anterior approach with nailing is very compatible with subsequent TKA. The surgeon’s experience and preference, while keeping in mind the patient’s predilection, will play an important role in the decision-making process. Larger prospective clinical trials with larger cohorts have to be conducted to confirm our findings.
1. Eidelman M, Keren Y, Norman D. Correction of distal femoral valgus deformities in adolescents and young adults using minimally invasive fixator-assisted locking plating (FALP). J Pediatr Orthop B. 2012;21(6):558-562. doi:10.1097/BPB.0b013e328358f884.
2. Pelletier JP, Raynauld JP, Berthiaume MJ, et al. Risk factors associated with the loss of cartilage volume on weight-bearing areas in knee osteoarthritis patients assessed by quantitative magnetic resonance imaging: a longitudinal study. Arthritis Res Ther. 2007;9(4):R74. doi:10.1186/ar2272.
3. Solomin LN, Paley D, Shchepkina EA, Vilensky VA, Skomoroshko PV. A comparative study of the correction of femoral deformity between the Ilizarov apparatus and ortho-SUV Frame. Int Orthop. 2014;38(4):865-872. doi:10.1007/s00264-013-2247-0.
4. Meric G, Gracitelli GC, Aram LJ, Swank ML, Bugbee WD. Variability in distal femoral anatomy in patients undergoing total knee arthroplasty: measurements on 13,546 computed tomography scans. J Arthroplasty. 2015;30(10):1835-1838. doi:10.1016/j.arth.2015.04.024.
5. Cameron JI, McCauley JC, Kermanshahi AY, Bugbee WD. Lateral opening-wedge distal femoral osteotomy: pain relief, functional improvement, and survivorship at 5 years. Clin Orthop Relat Res. 2015;473(6):2009-2015. doi:10.1007/s11999-014-4106-8.
6. Saragaglia D, Chedal-Bornu B. Computer-assisted osteotomy for valgus knees: medium-term results of 29 cases. Orthop Traumatol Surg Res. 2014;100(5):527-530. doi:10.1016/j.otsr.2014.04.002.
7. Marangoz S, Feldman DS, Sala DA, Hyman JE, Vitale MG. Femoral deformity correction in children and young adults using Taylor Spatial Frame. Clin Orthop Relat Res. 2008;466(12):3018-3024. doi:10.1007/s11999-008-0490-2.
8. Rogers MJ, McFadyen I, Livingstone JA, Monsell F, Jackson M, Atkins RM. Computer hexapod assisted orthopaedic surgery (CHAOS) in the correction of long bone fracture and deformity. J Orthop Trauma. 2007;21(5):337-342. doi:10.1097/BOT.0b013e3180463103.
9. Feldman DS, Madan SS, Ruchelsman DE, Sala DA, Lehman WB. Accuracy of correction of tibia vara: acute versus gradual correction. J Pediatr Orthop. 2006;26(6):794-798. doi:10.1097/01.bpo.0000242375.64854.3d.
10. Manner HM, Huebl M, Radler C, Ganger R, Petje G, Grill F. Accuracy of complex lower-limb deformity correction with external fixation: a comparison of the Taylor Spatial Frame with the Ilizarov ring fixator. J Child Orthop. 2007;1(1):55-61. doi:10.1007/s11832-006-0005-1.
11. Seah KT, Shafi R, Fragomen AT, Rozbruch SR. Distal femoral osteotomy: is internal fixation better than external? Clin Orthop Relat Res. 2011;469(7):2003-2011. doi:10.1007/s11999-010-1755-0.
12. Kocaoglu M, Bilen FE, Sen C, Eralp L, Balci HI. Combined technique for the correction of lower-limb deformities resulting from metabolic bone disease. J Bone Joint Surg Br. 2011;93(1):52-56. doi:10.1302/0301-620X.93B1.24788.
13. Eralp L, Kocaoglu M, Toker B, Balcı HI, Awad A. Comparison of fixator-assisted nailing versus circular external fixator for bone realignment of lower extremity angular deformities in rickets disease. Arch Orthop Trauma Surg. 2011;131(5):581-589. doi:10.1007/s00402-010-1162-8.
14. Kocaoglu M, Eralp L, Bilen FE, Balci HI. Fixator-assisted acute femoral deformity correction and consecutive lengthening over an intramedullary nail. J Bone Joint Surg Am. 2009;91(1):152-159. doi:10.2106/JBJS.H.00114.
15. Bar-On E, Becker T, Katz K, Velkes S, Salai M, Weigl DM. Corrective lower limb osteotomies in children using temporary external fixation and percutaneous locking plates. J Child Orthop. 2009;3(2):137-143. doi:10.1007/s11832-009-0165-x.
16. Herzenberg JE, Kovar FM. External fixation assisted nailing (EFAN) and external fixation assisted plating (EFAP) for deformity correction. In: Solomin LN, ed. The Basic Principles of External Fixation Using the Ilizarov and Other Devices. 2nd ed. Italy: Springer-Verlag; 2012:1363-1378.
17. Eralp L, Kocaoglu M, Cakmak M, Ozden VE. A correction of windswept deformity by fixator assisted nailing. A report of two cases. J Bone Joint Surg Br. 2004;86(7):1065-1068.
18. Eralp L, Kocaoglu M. Distal tibial reconstruction with use of a circular external fixator and an intramedullary nail. Surgical technique. J Bone Joint Surg Am. 2008;90(suppl 2 Pt 2):181-194. doi:10.2106/JBJS.H.00467.
19. Gautier E, Sommer C. Guidelines for the clinical application of the LCP. Injury. 2003;34(Suppl 2):B63-B76. doi:10.1016/j.injury.2003.09.026.
20. Gugenheim JJ Jr, Brinker MR. Bone realignment with use of temporary external fixation for distal femoral valgus and varus deformities. J Bone Joint Surg Am. 2003;85–A(7):1229-1237. doi:10.2106/00004623-200307000-00008.
21. Paley D, Herzenberg JE, Tetsworth K, McKie J, Bhave A. Deformity planning for frontal and sagittal plane corrective osteotomies. Orthop Clin North Am. 1994;25(3):425-465.
22. Jasiewicz B, Kacki W, Tesiorowski M, Potaczek T. Results of femoral lengthening over an intramedullary nail and external fixator. Chir Narzadow Ruchu Ortop Pol. 2008;73(3):177-183.
23. Pape HC, Giannoudis P. The biological and physiological effects of intramedullary reaming. J Bone Joint Surg Br. 2007;89(11):1421-1426. doi:10.1302/0301-620X.89B11.19570.
24. Wozasek GE, Simon P, Redl H, Schlag G. Intramedullary pressure changes and fat intravasation during intramedullary nailing: an experimental study in sheep. J Trauma. 1994;36(2):202-207. doi:10.1097/00005373-199402000-00010.
25. Gordon JE, Goldfarb CA, Luhmann SJ, Lyons D, Schoenecker PL. Femoral lengthening over a humeral intramedullary nail in preadolescent children. J Bone Joint Surg Am. 2002;84–A(6):930-937. doi:10.2106/00004623-200206000-00006.
26. Oh CW, Song HR, Kim JW, et al. Deformity correction with submuscular plating technique in children. J Pediatr Orthop B. 2010;19(1):47-54. doi:10.1097/BPB.0b013e32832f5b06.
27. Guettler J, Glisson R, Stubbs A, Jurist K, Higgins L. The triad of varus malalignment, meniscectomy, and chondral damage: a biomechanical explanation for joint degeneration. Orthopedics. 2007;30(7):558-566.
28. Sharma L, Eckstein F, Song J, et al. Relationship of meniscal damage, meniscal extrusion, malalignment, and joint laxity to subsequent cartilage loss in osteoarthritic knees. Arthritis Rheum. 2008;58(6):1716-1726. doi:10.1002/art.23462.
29. Tanamas S, Hanna FS, Cicuttini FM, Wluka AE, Berry P, Urquhart DM. Does knee malalignment increase the risk of development and progression of knee osteoarthritis? A systematic review. Arthritis Rheum. 2009;61(4):459-467. doi:10.1002/art.24336.
30. Paley D, HJ, Bor N. Fixator-assisted nailing of femoral and tibial deformities. Tech Orthop. 1997;12(4):260-275.
31. Eralp L, Kocaoğlu M, Ozkan K, Türker M. A comparison of two osteotomy techniques for tibial lengthening. Arch Orthop Trauma Surg. 2004;124(5):298-300. doi:10.1007/s00402-004-0646-9.
32. Strecker W, Kinzl L, Keppler P. Corrective osteotomies of the distal femur with retrograde intramedullary nail. Unfallchirurg. 2001;104(10):973-983. doi:10.1007/s001130170040.
33. Watanabe K, Tsuchiya H, Sakurakichi K, Matsubara H, Tomita K. Acute correction using focal dome osteotomy for deformity about knee joint. Arch Orthop Trauma Surg. 2008;128(12):1373-1378. doi:10.1007/s00402-008-0574-1.
34. Hankemeier S, Paley D, Pape HC, Zeichen J, Gosling T, Krettek C. Knee para-articular focal dome osteotomy. Orthopade. 2004;33(2):170-177. doi:10.1007/s00132-003-0588-x.
35. Brinkman JM, Luites JW, Wymenga AB, van Heerwaarden RJ. Early full weight bearing is safe in open-wedge high tibial osteotomy. Acta Orthop. 2010;81(2):193-198. doi:10.3109/17453671003619003.
36. Hankemeier S, Mommsen P, Krettek C, et al. Accuracy of high tibial osteotomy: comparison between open- and closed-wedge technique. Knee Surg Sports Traumatol Arthrosc. 2010;18(10):1328-1333. doi:10.1007/s00167-009-1020-9.
37. Hedequist D, Bishop J, Hresko T. Locking plate fixation for pediatric femur fractures. J Pediatr Orthop. 2008;28(1):6-9. doi:10.1097/bpo.0b013e31815ff301.
38. Iobst CA, Dahl MT. Limb lengthening with submuscular plate stabilization: a case series and description of the technique. J Pediatr Orthop. 2007;27(5):504-509. doi:10.1097/01.bpb.0000279020.96375.88.
39. Uysal M, Akpinar S, Cesur N, Hersekli MA, Tandoğan RN. Plating after lengthening (PAL): technical notes and preliminary clinical experiences. Arch Orthop Trauma Surg. 2007;127(10):889-893. doi:10.1007/s00402-007-0442-4.
40. Smith WR, Ziran BH, Anglen JO, Stahel PF. Locking plates: tips and tricks. Instr Course Lect. 2008;57:25-36.
ABSTRACT
Fixator-assisted nailing (FAN) and fixator-assisted locked plating (FALP) are 2 techniques that can be used to correct distal femoral valgus deformities. The fixator aids in achieving an accurate adjustable initial reduction, which is then made permanent with either nail or plate insertion. FALP can be performed with the knee held in a neutral extended position, whereas FAN requires 30° to 90° of knee flexion to insert the nail, which may cause some alignment loss. We hypothesized that FAN may yield less accurate correction than FALP. Prospectively collected data of a consecutive cohort of patients who underwent valgus deformity femoral correction with FAN or FALP at a single institution over an 8-year period were retrospectively evaluated. Twenty extremities (18 patients) were treated using FAN (median follow-up, 5 years; range, 1-10 years), and 7 extremities (6 patients) were treated with FALP (median follow-up, 5 years; range, 1-8 years). In the FAN cohort, the mean preoperative and postoperative mechanical lateral distal femoral angles (mLDFAs) were 81° (range, 67°-86°) and 89° (range, 80°-100°), respectively (P = .009). In the FALP cohort, the mean preoperative and postoperative mLDFAs were 80° (range, 71°-87°) and 88° (range, 81°-94°), respectively (P < .001). Although the average mechanical axis deviation correction for the FALP group was greater than for the FAN group (32 mm and 27 mm, respectively), the difference was not significant (P = .66). Both methods of femoral deformity correction can be considered safe and effective. On the basis of our results, FAN and FALP are comparable in accuracy for deformity correction in the distal femur.
Multiple etiologies for distal femoral valgus deformity have been described in the literature.1-3 These can be congenital, developmental, secondary to lateral compartmental arthritis, or posttraumatic.4 If not corrected, femoral deformities alter the axial alignment and orientation of the joints, and may lead to early degenerative joint disease and abnormal leg kinematics.3,5 After correcting these deformities, the goal of treatment is to obtain anatomic distal femoral angles and neutral mechanical axis deviation (MAD), but without overcorrecting into varus. Numerous techniques to fix these deformities, such as progressive correction with external fixation or acute correction open reduction with internal fixation (ORIF), have been described.6 Modern external fixation allows for a gradual, adjustable, and more accurate correction but may produce discomfort and complications for patients.7-10 In contrast, ORIF may be more tolerable for the patient, but to achieve a precise correction, considerable technical skills and expertise are required.1,11-14
Two techniques used to correct these valgus femoral deformities in adults are fixator-assisted nailing (FAN) and fixator-assisted locked plating (FALP).1 FAN and FALP combine the advantage of external fixation (accuracy, adjustability) with the benefits of internal fixation (patient comfort), because the osteotomy and correction are performed with the guidance of a temporary external fixator and then permanently fixated by an intramedullary (IM) nail or a locking plate.1,8,11-13,15-18 Both techniques have the possibility to correct varus and valgus deformities, but whenever correcting sagittal plane angulation, the FAN technique may be more challenging. The paucity of studies available involving FAN and FALP do not lead to a conclusive preference of one technique over the other relative to the accuracy and success of correction.15,19,20
Continue to: In both FAN and FALP
In both FAN and FALP, the external fixator is applied and adjusted after the osteotomy for accurate alignment. In FALP, the plate is added without moving the leg from its straight position. However, in FAN, the knee must be flexed to 30° to 90° for insertion of the retrograde knee nail, and the alignment may be lost if the external fixation is not fully stable. Therefore, we hypothesized that FAN would be less accurate than FALP. Hence, the purposes of this study is to compare the correction achieved with FAN and FALP in patients with distal femoral valgus deformities and to describe the intraoperative complications associated with both techniques.
MATERIALS AND METHODS
After proper Institutional Review Board approval was obtained, a consecutive cohort of 35 patients who underwent femoral deformity correction with either FAN or FALP during an 8-year period (January 2002 to December 2010) was retrospectively reviewed. Eleven patients had to be excluded because of inadequate follow-up (<12 months) or because additional procedures were simultaneously performed. A total of 24 patients (27 femora) who had a mean age of 26 years (range, 14-68 years) were included in the final study cohort. Specifically, 20 femora (18 patients) were corrected using the FAN technique (7 males and 11 females; mean age, 36 years; range, 14-68 years), and 7 femora (6 patients) were fixed using the FALP technique (2 males and 4 females; mean age, 16 years; range, 15-19 years). The median follow-up in the FAN cohort was 5 years (range, 1-10 years), and the median follow-up in the FALP cohort was 5 years (range, 1-8 years) (Table 1).
| Table 1. Study Details and Demographic Characteristics | |||
| Detail | Overall | FAN | FALP |
| Number of patients | 24 | 18 | 6 |
| Number of femurs | 27 | 20 | 7 |
| Age in years (range) | 26 (14 to 68) | 36 (14 to 68) | 16 (15 to 19) |
| Male:Female | 9:15 | 7:11 | 2:4 |
| Median follow-up in years (range) | 5 (1 to 10) | 5 (1 to 10) | 5 (1 to 8) |
Abbreviations: FALP, fixator assisted locked plating; FAN, fixator assisted nailing
The specific measurements performed in all patients were MAD, mechanical lateral distal femoral angle (mLDFA), and medial proximal tibia angle (MPTA). These were measured from standing anteroposterior radiographs of the knee that included the femur.21 All outcome data were collected from the medical charts, operative reports, and radiographic evaluations. To ensure accuracy, all measurements were performed by 2 authors blinded to each other’s measurements. If a variation of <5% was obtained, the results were averaged and used for further analysis. Whenever a difference of >5% was obtained, the measurement was repeated by both authors for confirmation.
SURGICAL FAN TECHNIQUE
After measuring the deformity (Figure 1A) with the patient under general anesthesia on a radiolucent table, the involved lower limb is prepared and draped. Two half-pins are inserted medially, 1 proximal and 1 distal to the planned osteotomy site (Figure 1B), and then connected loosely with a monolateral external fixator. Special care is taken while placing the half-pins, not to interfere with the insertion path of the IM rod. When performing the preoperative planning, the level of osteotomy is chosen to enable the placement of at least 2 interlocking screws distal to the osteotomy. Then, a percutaneous osteotomy is performed from a lateral approach, and the bone ends are manipulated (translation and then angulation) to achieve the desired deformity correction. The external fixator is then stabilized and locked in the exact position (Figure 1C). Subsequently, retrograde reaming, nail insertion, and placement of proximal and distal locking screws are performed (Figure 1D). Blocking screws may give additional stability. The removal of the external fixator is the final step (Figure 1E).20
Continue to: When using the FAN technique...
When using the FAN technique, special attention is paid to reducing the risk of fat embolism. This can be reduced but not totally eradicated with the use of reaming irrigation devices.22-24 In our technique of FAN, the bone is cut and displaced prior to reaming so that the pressure of reaming is vented out through the osteotomy, along with the reaming contents, which theoretically can then act as a “prepositioned bone graft” that may speed healing.
SURGICAL FALP TECHNIQUE
Preoperatively, a decision concerning the planned osteotomy and the correct locking plate size is made. In addition, the outline of the plate is marked on the skin. Under general anesthesia, the patients are prepared and draped. A tourniquet is elevated around the upper thigh. Then, 2 half-pins are medially inserted, 1 proximal and 1 distal to the planned osteotomy site, and are then connected loosely with a monolateral external fixator (Figure 2A). A lateral approach to the distal femur is done, preserving the periosteum, except at the level of the osteotomy. After the osteotomy is performed (through an open lateral incision), both segments are translated (Figure 2B) and then the distal segment is angulated to achieve the desired deformity correction, and the desired position is then stabilized by tightening the external fixator connectors (Figure 2C). Subsequently, a locking plate is inserted in the submuscular-extraperiostal plane. The plate does not require being in full contact (flush) with the bone. At least 3 screws are placed on both sides of the osteotomy through a long lateral incision (Figure 2D). Bone graft may be added to the osteotomy site to encourage healing. Then, the external fixator is removed, and all incisions are closed (Figure 2E).15,19
During each of the procedures, we aimed at having “perfect alignment” with a MAD of 0 mm, in which a Bovie cord is used and passed through the center of the femoral head, knee, and ankle. However, to confirm that the surgery was successful, the actual measurements were performed on standing long-leg films. These films were obtained preoperatively and at latest follow-up. They were performed with the patella aiming forward, the toes straight ahead, feet separated enough for good balance, knees fully extended, and weight equally distributed on the feet. Postoperatively, in both cohorts, partial weight-bearing was encouraged immediately with crutches; physical therapy was instituted daily for knee range of motion. Radiographs were scheduled every 4 weeks to monitor callus formation. Full weight-bearing was allowed when at least 3 cortices were consolidated.1,15,19,20,25,26
All statistical analyses were performed with the aid of the SPSS statistical software package (SPSS). Average values and standard error of the mean were assigned to each variable. A nonparametric Mann-Whitney U test was used, and a 2-tailed P < .05 was considered significant. Correlation of continuous variables was determined by Spearman’s correlation coefficient. Also, multivariate Cox regression analyses after adjustment for age, sex, and deformity correction were used to detect associations within the study population. To evaluate whether our data were normally distributed, Shapiro-Wilk tests were performed.
Continue to: Results...
RESULTS
The mLDFA significantly improved in the FAN cohort from a mean of 81° to a mean of 89° (ranges, 67°-86° and 80°-100°; respectively; P = .001) (Figures 3A, 3B).
| Table 2. Deformity Correction | ||||
| Measurement | Cohort | Preoperative | Postoperative | P Value |
| mLDFA in degrees (range) | FAN | 81 (67 to 86) | 89 (80 to 100) | 0.001 |
| FALP | 80 (71 to 87) | 90 (88 to 94) | <0.001 | |
| Mechanical axis deviation in mm (range) | FAN | 32 (6 to 64) | 10 (0 to 22) | 0.001 |
| FALP | 34 (17 to 62) | 4 (0 to 11) | 0.002 | |
Abbreviations: FALP, fixator assisted locked plating; FAN, fixator assisted nailing; mLDFA, mechanical lateral distal femoral angle
After evaluating the MPTA, in the FAN cohort, we found that the mean pre- and postoperative MPTAs were not modified. These patients had a mean preoperative angle of 88° (range, 62°-100°), which was kept postoperatively to a mean of 88° (range, 78°-96°). In the FALP cohort, a slight change from 90° to 88° was observed (ranges, 82°-97° and 83°-94°, respectively). None of these changes in MPTA were significant (P > .05).
When evaluating correction of the MAD, we observed that the FAN cohort changed from a preoperative MAD of 32 mm (range, 6-64 mm) to a postoperative mean of 10 mm (range, 0-22 mm), and this correction was statistically significant. (P = .001). The FALP cohort changed from a mean of 34 mm (range, 17-62 mm) preoperatively to 4 mm (range, 0-11 mm) postoperatively, and this was also statistically significant (P = .002). The mean MAD correction for the FAN group vs FALP group was 27 mm vs 32 mm, respectively (Table 2).
In patients with valgus femoral deformity, the MAD is usually lateralized; however, in the FAN cohort, we included 3 patients with medial MADs (10 mm, 13 mm, and 40 mm). This is justified in these patients because a complex deformity of the distal femur and the proximal tibia was present. In the extreme case of a 40-mm medial MAD, the presurgery mLDFA was 76°, and the presurgery MPTA was 62°. The amount of deformity correction in this patient was 16°.
During the follow-up period, 2 complications occurred in the FAN group. One patient developed gait disturbance that resolved with physical therapy. Another had an infection at the osteotomy site. This was addressed with intravenous antibiotic therapy, surgical irrigation and débridement, hardware removal, and antegrade insertion of an antibiotic-coated nail. In the FALP group, 1 patient developed a persistent incomplete peroneal nerve palsy attributed to a 17° correction from valgus to varus, despite prophylactic peroneal nerve decompression. Nonetheless, the patient was satisfied with the result, recovered partial nerve function, and returned for correction of the contralateral leg deformity. When comparing the complications between both cohorts, no significant differences were found: 2 of 18 cases (11%) in the FAN group vs 1 of 6 cases (17%) in the FALP group (P = .78).
Continue to: The goal of this study...
DISCUSSION
The goal of this study was to compare the accuracy of deformity corrections achieved with either FAN or FALP. A number of authors have described results after deformity correction with several plating and nailing techniques; however, the information derived from comparing these 2 techniques is limited. We hypothesized that FALP would be more accurate, because less mobilization during fixation is required. However, we found no significant differences between these 2 techniques.
This study has several limitations. First, the small size of our cohort had to be further reduced owing to limited data; nevertheless, this pathology and the treatment methods used are not commonly performed, which make this cohort 1 of the largest of its type described in the literature. Also, the procedures were performed by multiple surgeons in a population with a wide age range, creating multiple additional variables that complicate the comparison of the sole differences between FAN and FALP. However, owing to these variables, the generalizability of this study may be increased, and similar outcomes can potentially be obtained by other institutions/surgeons. In addition, the variability of our follow-up period is another limitation; however, these patients were all assessed until bony union after skeletal maturity was achieved. Hence, the development of additional deformity is not expected. The lack of clinical outcome with a standardized questionnaire may also be seen as a limitation. However, because the purpose of our study was to assess both surgeries in terms of their ability to achieve angular correction, the addition of patient-reported outcomes may have increased the variability of our data.
The foremost objective in valgus deformity correction is to establish joint orientation angles within anatomic range to prevent overloading of the lateral joint and thereby prevent lateral compartmental osteoarthritis.2,20,27-29 There are 2 categories of fixation: internal and external. With FAN and FALP, we strive to have the adjustability and accuracy of external fixation with the comfort (for the patient) of internal fixation. Accurate osteotomy correction requires an accurate preoperative analysis and osteotomy close to the apex of the deformity.16,21,30-33 The most commonly used osteotomy techniques are drill-hole,31 focal dome,34 rotation, and open- or closed-wedge osteotomies.35,36 After the osteotomy, the resultant correction has to be stabilized. In recent years, the popularity of plates instead of an IM nail for internal fixation has been driven by the rapid development of low contact locking plates.16,19,26,30,37-40
There are certain advantages of using FAN over FALP. In older patients who may require a subsequent total knee arthroplasty (TKA), the midline incision used for retrograde FAN technique is identical to that made for TKA. In contrast, in a younger and more active population, with a longer life expectancy, the extra-articular FALP approach has the advantage of not violating the knee joint. In addition, locking plates may achieve a more rigid fixation than IM nails; however, the stability of IM nails can be augmented with blocking screws.
Continue to: In 20 patients, including children...
In 20 patients, including children and young adults, with frontal and sagittal plane deformities, Marangoz and colleagues7 reported on correction of valgus, varus, and procurvatum deformities using a Taylor Spatial Frame (TSF). Successful correction of severe deformities was achieved gradually with the TSF, resulting in a postoperative deformity (valgus group) of mLDFA 88.9° (range, 85°-95°).7 In a more recent study, Bar-On and colleagues15 described a series of 11 patients (18 segments) with corrective lower limb osteotomies in which all were corrected to within 2° of the planned range. Similarly, Gugenheim and Brinker20 described the use of the FAN technique to correct distal varus and valgus deformities in 14 femora. The final mean mLDFA and MAD in the valgus group were 89° (range, 88°-90°) and 5 mm (range, 0-14 mm medial), respectively.
In their comparative study, Seah and colleagues11 described monolateral frame vs FALP deformity correction in a series of 34 extremities (26 patients) that required distal femoral osteotomy. No differences related to knee range of motion or the ability to correct the deformity between internal and external fixation were reported (P > .05). Similarly, Eidelman and colleagues1 evaluated the outcomes of 6 patients (7 procedures) who underwent surgery performed with the FALP technique for distal femoral valgus deformity. They concluded that this technique is minimally invasive and can provide a precise deformity correction with minimal morbidity.
Other methods of fixation while performing FAN have been described by Jasiewicz and colleagues,22 who evaluated possible differences between the classic Ilizarov device and monolateral fixators in 19 femoral lengthening procedures. The authors concluded that there is no difference between concerning complication rate and treatment time. The use of FAN has also been described in patients with metabolic disease who required deformity correction. In this regard, Kocaoglu and colleagues12 described the use of a monolateral external fixator in combination with an IM nail in a series of 17 patients with metabolic bone disease. The authors concluded that the use of the IM nail prevented recurrence of deformity and refracture.12 Kocaoglu and colleagues14 also published a series of 25 patients treated with the FAN and LON (lengthening over a nail) technique for lengthening and deformity correction. The mean MAD improved from 33.9 mm to11.3 mm (range, 0-30 mm). In contrast, Erlap and colleagues13 compared FAN with circular external fixator for bone realignment of the lower extremity for deformities in patients with rickets. Although no significant difference was found between both groups, FAN was shown to be accurate and to provide great comfort to patients, and it also shortened the total treatment time.13 Finally, the advent of newer technologies could also provide alternatives for correcting valgus deformities. For example, Saragaglia and Chedal-Bornu6 performed 29 computer-assisted valgus knees osteotomies (27 patients) and reported that the goal hip-knee angle was achieved in 86% of patients and that the goal MPTA was achieved in 100% of patients.6
CONCLUSION
Both the FALP and FAN methods of femoral deformity correction are safe and effective surgical techniques. In our opinion, the advantages of the FALP technique result from the easy lateral surgical approach under medial external fixation and stabilization of the osteotomy without bending the knee. Ultimately, the decision to use FAN may be influenced by the surgeon’s perception of the potential need for future TKA. In such cases, a midline anterior approach with nailing is very compatible with subsequent TKA. The surgeon’s experience and preference, while keeping in mind the patient’s predilection, will play an important role in the decision-making process. Larger prospective clinical trials with larger cohorts have to be conducted to confirm our findings.
1. Eidelman M, Keren Y, Norman D. Correction of distal femoral valgus deformities in adolescents and young adults using minimally invasive fixator-assisted locking plating (FALP). J Pediatr Orthop B. 2012;21(6):558-562. doi:10.1097/BPB.0b013e328358f884.
2. Pelletier JP, Raynauld JP, Berthiaume MJ, et al. Risk factors associated with the loss of cartilage volume on weight-bearing areas in knee osteoarthritis patients assessed by quantitative magnetic resonance imaging: a longitudinal study. Arthritis Res Ther. 2007;9(4):R74. doi:10.1186/ar2272.
3. Solomin LN, Paley D, Shchepkina EA, Vilensky VA, Skomoroshko PV. A comparative study of the correction of femoral deformity between the Ilizarov apparatus and ortho-SUV Frame. Int Orthop. 2014;38(4):865-872. doi:10.1007/s00264-013-2247-0.
4. Meric G, Gracitelli GC, Aram LJ, Swank ML, Bugbee WD. Variability in distal femoral anatomy in patients undergoing total knee arthroplasty: measurements on 13,546 computed tomography scans. J Arthroplasty. 2015;30(10):1835-1838. doi:10.1016/j.arth.2015.04.024.
5. Cameron JI, McCauley JC, Kermanshahi AY, Bugbee WD. Lateral opening-wedge distal femoral osteotomy: pain relief, functional improvement, and survivorship at 5 years. Clin Orthop Relat Res. 2015;473(6):2009-2015. doi:10.1007/s11999-014-4106-8.
6. Saragaglia D, Chedal-Bornu B. Computer-assisted osteotomy for valgus knees: medium-term results of 29 cases. Orthop Traumatol Surg Res. 2014;100(5):527-530. doi:10.1016/j.otsr.2014.04.002.
7. Marangoz S, Feldman DS, Sala DA, Hyman JE, Vitale MG. Femoral deformity correction in children and young adults using Taylor Spatial Frame. Clin Orthop Relat Res. 2008;466(12):3018-3024. doi:10.1007/s11999-008-0490-2.
8. Rogers MJ, McFadyen I, Livingstone JA, Monsell F, Jackson M, Atkins RM. Computer hexapod assisted orthopaedic surgery (CHAOS) in the correction of long bone fracture and deformity. J Orthop Trauma. 2007;21(5):337-342. doi:10.1097/BOT.0b013e3180463103.
9. Feldman DS, Madan SS, Ruchelsman DE, Sala DA, Lehman WB. Accuracy of correction of tibia vara: acute versus gradual correction. J Pediatr Orthop. 2006;26(6):794-798. doi:10.1097/01.bpo.0000242375.64854.3d.
10. Manner HM, Huebl M, Radler C, Ganger R, Petje G, Grill F. Accuracy of complex lower-limb deformity correction with external fixation: a comparison of the Taylor Spatial Frame with the Ilizarov ring fixator. J Child Orthop. 2007;1(1):55-61. doi:10.1007/s11832-006-0005-1.
11. Seah KT, Shafi R, Fragomen AT, Rozbruch SR. Distal femoral osteotomy: is internal fixation better than external? Clin Orthop Relat Res. 2011;469(7):2003-2011. doi:10.1007/s11999-010-1755-0.
12. Kocaoglu M, Bilen FE, Sen C, Eralp L, Balci HI. Combined technique for the correction of lower-limb deformities resulting from metabolic bone disease. J Bone Joint Surg Br. 2011;93(1):52-56. doi:10.1302/0301-620X.93B1.24788.
13. Eralp L, Kocaoglu M, Toker B, Balcı HI, Awad A. Comparison of fixator-assisted nailing versus circular external fixator for bone realignment of lower extremity angular deformities in rickets disease. Arch Orthop Trauma Surg. 2011;131(5):581-589. doi:10.1007/s00402-010-1162-8.
14. Kocaoglu M, Eralp L, Bilen FE, Balci HI. Fixator-assisted acute femoral deformity correction and consecutive lengthening over an intramedullary nail. J Bone Joint Surg Am. 2009;91(1):152-159. doi:10.2106/JBJS.H.00114.
15. Bar-On E, Becker T, Katz K, Velkes S, Salai M, Weigl DM. Corrective lower limb osteotomies in children using temporary external fixation and percutaneous locking plates. J Child Orthop. 2009;3(2):137-143. doi:10.1007/s11832-009-0165-x.
16. Herzenberg JE, Kovar FM. External fixation assisted nailing (EFAN) and external fixation assisted plating (EFAP) for deformity correction. In: Solomin LN, ed. The Basic Principles of External Fixation Using the Ilizarov and Other Devices. 2nd ed. Italy: Springer-Verlag; 2012:1363-1378.
17. Eralp L, Kocaoglu M, Cakmak M, Ozden VE. A correction of windswept deformity by fixator assisted nailing. A report of two cases. J Bone Joint Surg Br. 2004;86(7):1065-1068.
18. Eralp L, Kocaoglu M. Distal tibial reconstruction with use of a circular external fixator and an intramedullary nail. Surgical technique. J Bone Joint Surg Am. 2008;90(suppl 2 Pt 2):181-194. doi:10.2106/JBJS.H.00467.
19. Gautier E, Sommer C. Guidelines for the clinical application of the LCP. Injury. 2003;34(Suppl 2):B63-B76. doi:10.1016/j.injury.2003.09.026.
20. Gugenheim JJ Jr, Brinker MR. Bone realignment with use of temporary external fixation for distal femoral valgus and varus deformities. J Bone Joint Surg Am. 2003;85–A(7):1229-1237. doi:10.2106/00004623-200307000-00008.
21. Paley D, Herzenberg JE, Tetsworth K, McKie J, Bhave A. Deformity planning for frontal and sagittal plane corrective osteotomies. Orthop Clin North Am. 1994;25(3):425-465.
22. Jasiewicz B, Kacki W, Tesiorowski M, Potaczek T. Results of femoral lengthening over an intramedullary nail and external fixator. Chir Narzadow Ruchu Ortop Pol. 2008;73(3):177-183.
23. Pape HC, Giannoudis P. The biological and physiological effects of intramedullary reaming. J Bone Joint Surg Br. 2007;89(11):1421-1426. doi:10.1302/0301-620X.89B11.19570.
24. Wozasek GE, Simon P, Redl H, Schlag G. Intramedullary pressure changes and fat intravasation during intramedullary nailing: an experimental study in sheep. J Trauma. 1994;36(2):202-207. doi:10.1097/00005373-199402000-00010.
25. Gordon JE, Goldfarb CA, Luhmann SJ, Lyons D, Schoenecker PL. Femoral lengthening over a humeral intramedullary nail in preadolescent children. J Bone Joint Surg Am. 2002;84–A(6):930-937. doi:10.2106/00004623-200206000-00006.
26. Oh CW, Song HR, Kim JW, et al. Deformity correction with submuscular plating technique in children. J Pediatr Orthop B. 2010;19(1):47-54. doi:10.1097/BPB.0b013e32832f5b06.
27. Guettler J, Glisson R, Stubbs A, Jurist K, Higgins L. The triad of varus malalignment, meniscectomy, and chondral damage: a biomechanical explanation for joint degeneration. Orthopedics. 2007;30(7):558-566.
28. Sharma L, Eckstein F, Song J, et al. Relationship of meniscal damage, meniscal extrusion, malalignment, and joint laxity to subsequent cartilage loss in osteoarthritic knees. Arthritis Rheum. 2008;58(6):1716-1726. doi:10.1002/art.23462.
29. Tanamas S, Hanna FS, Cicuttini FM, Wluka AE, Berry P, Urquhart DM. Does knee malalignment increase the risk of development and progression of knee osteoarthritis? A systematic review. Arthritis Rheum. 2009;61(4):459-467. doi:10.1002/art.24336.
30. Paley D, HJ, Bor N. Fixator-assisted nailing of femoral and tibial deformities. Tech Orthop. 1997;12(4):260-275.
31. Eralp L, Kocaoğlu M, Ozkan K, Türker M. A comparison of two osteotomy techniques for tibial lengthening. Arch Orthop Trauma Surg. 2004;124(5):298-300. doi:10.1007/s00402-004-0646-9.
32. Strecker W, Kinzl L, Keppler P. Corrective osteotomies of the distal femur with retrograde intramedullary nail. Unfallchirurg. 2001;104(10):973-983. doi:10.1007/s001130170040.
33. Watanabe K, Tsuchiya H, Sakurakichi K, Matsubara H, Tomita K. Acute correction using focal dome osteotomy for deformity about knee joint. Arch Orthop Trauma Surg. 2008;128(12):1373-1378. doi:10.1007/s00402-008-0574-1.
34. Hankemeier S, Paley D, Pape HC, Zeichen J, Gosling T, Krettek C. Knee para-articular focal dome osteotomy. Orthopade. 2004;33(2):170-177. doi:10.1007/s00132-003-0588-x.
35. Brinkman JM, Luites JW, Wymenga AB, van Heerwaarden RJ. Early full weight bearing is safe in open-wedge high tibial osteotomy. Acta Orthop. 2010;81(2):193-198. doi:10.3109/17453671003619003.
36. Hankemeier S, Mommsen P, Krettek C, et al. Accuracy of high tibial osteotomy: comparison between open- and closed-wedge technique. Knee Surg Sports Traumatol Arthrosc. 2010;18(10):1328-1333. doi:10.1007/s00167-009-1020-9.
37. Hedequist D, Bishop J, Hresko T. Locking plate fixation for pediatric femur fractures. J Pediatr Orthop. 2008;28(1):6-9. doi:10.1097/bpo.0b013e31815ff301.
38. Iobst CA, Dahl MT. Limb lengthening with submuscular plate stabilization: a case series and description of the technique. J Pediatr Orthop. 2007;27(5):504-509. doi:10.1097/01.bpb.0000279020.96375.88.
39. Uysal M, Akpinar S, Cesur N, Hersekli MA, Tandoğan RN. Plating after lengthening (PAL): technical notes and preliminary clinical experiences. Arch Orthop Trauma Surg. 2007;127(10):889-893. doi:10.1007/s00402-007-0442-4.
40. Smith WR, Ziran BH, Anglen JO, Stahel PF. Locking plates: tips and tricks. Instr Course Lect. 2008;57:25-36.
TAKE-HOME POINTS
- FAN and FALP are methods to improve the accuracy of long bone deformity correction.
- Both methods include temporary stabilization of the osteotomy with an external fixator.
- FALP is technically easier, since the external fixation pins do not have to be positioned out of the path of the nail, as in FAN.
- Acute corrections in the distal femur from valgus to varus can stretch the peroneal nerve.
- FAN and FALP are equivalent techniques for improving accuracy of deformity correction.
Multi-Modal Pain Control in Ambulatory Hand Surgery
ABSTRACT
We evaluated postoperative pain control and narcotic usage after thumb carpometacarpal (CMC) arthroplasty or open reduction and internal fixation (ORIF) of the distal radius in patients given opiates with or without other non-opiate medication using a specific dosing regimen. A prospective, randomized study of 79 patients undergoing elective CMC arthroplasty or ORIF of the distal radius evaluated postoperative pain in the first 5 postoperative days. Patients were divided into 4 groups: Group 1, oxycodone and acetaminophen PRN; Group 2, oxycodone and acetaminophen with specific dosing; Group 3, oxycodone, acetaminophen, and OxyContin with specific dosing; and Group 4, oxycodone, acetaminophen, and ketorolac with specific dosing. During the first 5 postoperative days, we recorded pain levels according to a numeric pain scale, opioid usage, and complications. Although differences in our data did not reach statistical significance, overall pain scores, opioid usage, and complication rates were less prevalent in the oxycodone, acetaminophen, and ketorolac group. Postoperative pain following ambulatory hand and wrist surgery under regional anesthesia was more effectively controlled with fewer complications using a combination of oxycodone, acetaminophen, and ketorolac with a specific dosing regimen.
Continue to: Regional anesthesia...
Regional anesthesia is a safe and effective modality of perioperative pain control in patients undergoing ambulatory hand procedures.1-10 Often, as the regional block wears off, patients experience a rebound pain effect that can be challenging to manage.
We sought to determine if an organized, multimodal approach in patients undergoing thumb carpometacarpal (CMC) arthroplasty or open reduction and internal fixation (ORIF) of distal radius fractures would provide better postoperative pain control. We hypothesized that this approach would significantly reduce postoperative pain and the need for narcotic pain medication compared with PRN dosing of oxycodone/acetaminophen alone.11-14
MATERIALS AND METHODS
Our study was approved by our Institutional Review Board. Informed consent was obtained from each patient. Patients presenting for elective thumb CMC arthroplasty or ORIF of the distal radius were screened for inclusion in a prospective, randomized study. Inclusion criteria included patients aged 18 to 65 years who could provide informed consent. Patients with chronic pain syndromes, long-term narcotic usage, chronic medical conditions precluding the use of opiates or nonsteroidal anti-inflammatory drugs (NSAIDs), and those who did not have a complete sensory and motor block postoperatively were excluded.
Patients were randomly divided into 1 of 4 study arms. Randomization was performed via sealed envelopes, which were opened in the recovery area when postoperative prescriptions were written. The group distribution was as follows: Group 1, Percocet 5 mg/325 mg alone (control); Group 2, oxycodone 5 mg, acetaminophen 325 mg administered separately; Group 3, oxycodone 5 mg, acetaminophen 325 mg, and oxycodone SR (OxyContin) 10 mg; and Group 4, oxycodone 5 mg, acetaminophen 325 mg, and ketorolac (Toradol) 10 mg (Table 1). Patients in the control group were instructed to take 1 or 2 tablets every 4 to 6 hours as needed for pain. Patients in the 3 experimental groups were given detailed instructions regarding when and how to take their medications. All patients were instructed to take 650 mg of acetaminophen every 6 hours. Patients were provided a sliding scale to assist in dosing their opioid medications according to their numeric pain score (NPS) (Table 2). Group 2 patients were given oxycodone 10 mg in the postanesthesia care unit (PACU) and instructed to take oxycodone 10 mg with acetaminophen 650 mg every 6 hours on a scheduled basis until their block wore off, then dose themselves using the NPS.
Table 1. Patient Groups
Group | Anesthesia | Pain Medications |
1 (standard treatment) | Brachial plexus block | Percocet (oxycodone and acetaminophen) 5-10 mg every 4-6 hours as needed for pain. |
2 | Brachial plexus block | 1. Oxycodone 0-15 mg every 4-6 hours as needed for pain based on pain scale score. 2. Tylenol (Acetaminophen) 650 mg every 6 hours, scheduled. |
3 | Brachial plexus block | 1. Oxycodone 0-15 mg every 4-6 hours as needed for pain based on numeric pain scale. 2. Tylenol (Acetaminophen) 650 mg every 6 hours, scheduled. 3. OxyContin (oxycodone sustained release) 10 mg twice a day, scheduled. |
4 | Brachial plexus block | 1. Oxycodone 0-15 mg every 4-6 hours as needed for pain based on pain scale score. 2. Tylenol (Acetaminophen) 650 mg every 6 hours, scheduled. 3. Toradol (Ketorolac) 10mg every 6 hours, scheduled. |
Table 2. Sliding Scale for Pain Control in the Experimental Groups
Pain Score | Oxycodone Dose |
0-3 | 5 mg (1 tablet) |
4-7 | 10 mg (2 tablets) |
8-10 | 15 mg (3 tablets) |
Group 3 patients were given oxycodone 10 mg in the PACU and instructed to take oxycodone 10 mg with acetaminophen 650 mg every 6 hours and OxyContin 10 mg every 12 hours on a scheduled basis until their block wore off, then dose themselves using NPS. Group 4 patients were given oxycodone 10 mg postoperatively and ketorolac 30 mg intravenously in the PACU and instructed to take oxycodone 10 mg, acetaminophen 650 mg, and ketorolac 10 mg every 6 hours on a scheduled basis until their block wore off, then dose themselves using the NPS.
Patients were provided with a journal and asked to record their medication usage, NPS, and any adverse effects (nausea, vomiting, and uncontrolled pain were specifically mentioned) or complications for 5 days after their procedure. We also attempted to contact patients by telephone on each of the 5 days after their procedure to remind them to complete their logs. They were asked specifically if they were having difficulty with their medications. They were also asked specifically about nausea, vomiting, and over-sedation. If patients requested additional medication to help treat their pain, they were instructed to add an over-the-counter NSAID of their choice based on the label’s suggested dosing.
Continue to: All patients received a supraclavicular...
All patients received a supraclavicular brachial plexus block using 0.75% ropivacaine under the supervision of an attending anesthesiologist experienced in regional anesthesia. Patients underwent thumb CMC arthroplasty utilizing complete resection of the trapezium followed by abductor pollicis longus suspensionplasty under the supervision of 1 of 3 fellowship-trained hand surgeons. ORIF of the distal radius was completed utilizing a volar approach and distal radius locking plate under the supervision of 1 of 3 fellowship-trained hand surgeons.
Primary outcome measures were the total number of oxycodone tablets taken daily and the average daily NPS. Secondary outcomes measured included adverse effects as noted above and the need for a trip to the emergency department for unrelieved pain.
A power analysis was completed prior to the beginning of the study. To detect a difference of at least 1 on the NPS, we determined that 18 patients per group would provide 80% power. This was based on literature utilizing the visual analog scale (VAS), a 100-mm line on which patients can place a mark to describe the intensity of their pain. The standard deviation on the VAS is approximately 15 mm. To account for potential dropout, we elected to recruit 20 patients per group. Non-paired t tests were used to compare groups.
RESULTS
One hundred and eighteen patients enrolled in the study. Of those, 79 patients completed and returned their summary logs (by group: 18 control, 20 oxycodone, 17 OxyContin, and 24 ketorolac). The remaining patients were excluded from the final analysis because they did not return their summary logs. Only 1 patient was excluded from the analysis because he did not have adequate regional anesthesia. Demographic data were analyzed and showed no significant differences between groups at the P < .05 level of significance. Surgical procedures were completed by 3 fellowship-trained hand surgeons. Distal radius fractures were performed using a volar approach. CMC arthroplasty was performed using a procedure that was standardized across surgeons. There were no between-surgeon differences in outcomes.
Average daily NPS (Figure 1) and the total number of oxycodone tablets taken (Figure 2) over the 5-day study period were recorded. Patients in the ketorolac group used fewer oxycodone tablets (19.3) than patients in the other 3 groups (24.4), P =.11, but the difference was not statistically significant. The maximum number of oxycodone tablets used was 71 in the Percocet group, 57 in the oxycodone and ketorolac groups, and 73 in the OxyContin group. The average daily NPS was lower in the ketorolac group during the period of medication use. This value only reached statistical significance on postoperative day 0 when the ketorolac group was compared with the OxyContin group (P = .01) and on postoperative day 1 when the ketorolac group was compared with the oxycodone group (P = .04). Complications (Figure 3) were greater in the non-ketorolac groups. One patient each in the oxycodone and OxyContin groups required a trip to the emergency department for pain control after their block wore off. Nausea and vomiting were present in each of the 4 groups but to a much greater degree in the Percocet and OxyContin groups; however, these results did not reach statistical significance (P = .129). Eleven of the 18 patients in the Percocet group required an additional NSAID (naproxen) and still did not achieve pain control similar to the other groups. This may explain why the average daily pain score in the Percocet group was lower than that in the oxycodone group, in which only 4 of the 20 patients supplemented with naproxen. Patients did, however, require many more oxycodone tablets to achieve pain control in the Percocet group. Over-sedation was reported in 3 patients in the oxycodone group and in 1 patient in the OxyContin group. No patients were found to have bleeding, renal, or other systemic complications.
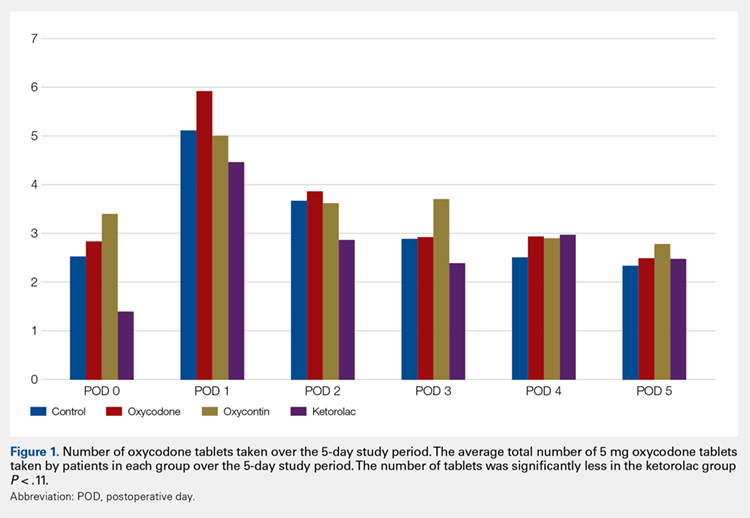
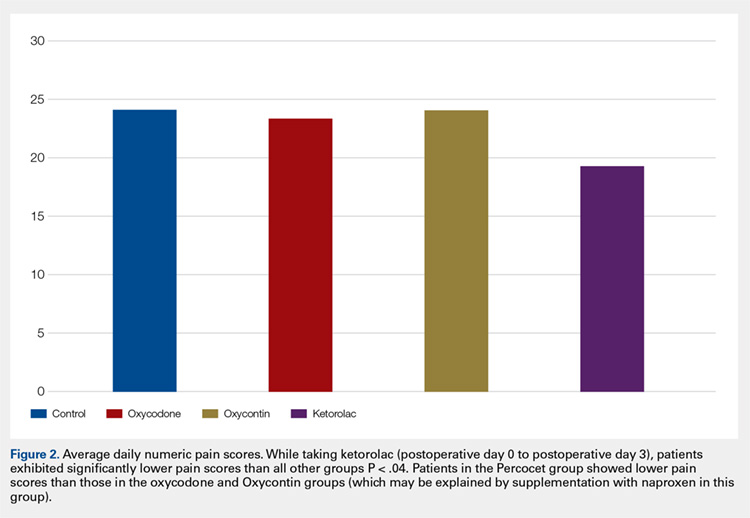
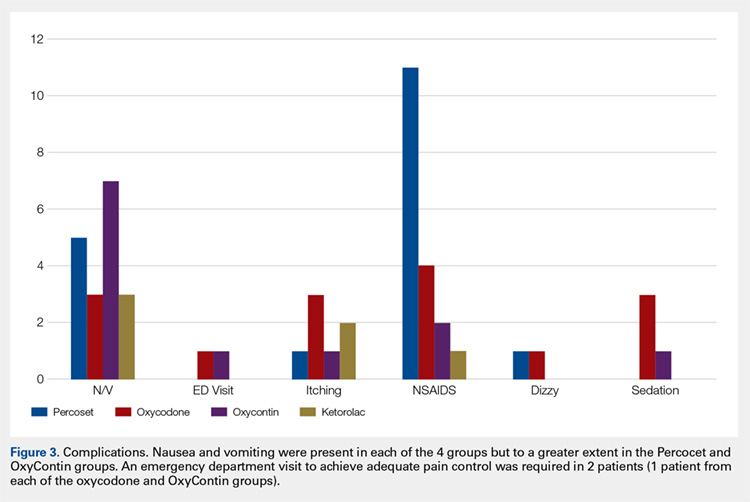
Continue to: Discussion...
DISCUSSION
In this prospective, randomized study, we sought to determine whether a more organized approach to treating postoperative pain using a specific dosing regimen or opiates in conjunction with non-opiate medications would lead to improved pain control and a decreased need for opiates. We found that adding ketorolac to the postoperative pain regimen and outlining a more detailed set of instructions could lower narcotic usage in the first 4 postoperative days. In addition, adding ketorolac decreased other complications commonly seen with narcotic usage and was shown to be safe in our patient population.
Ketorolac has been shown to decrease narcotic pain medication usage in several surgical settings and across different surgical specialties. It is hypothesized that ketorolac potentiates the effects of narcotics.11 Ketorolac given alone has a potent analgesic effect by acting as a strong non-selective cyclooxygenase inhibitor. The major drawback to ketorolac use has been its well-known side-effect profile. Ketorolac is renally excreted, and as such, should not be used in patients with renal insufficiency. In addition, ketorolac has been shown to cause increased gastrointestinal bleeding when used for >5 days.15 Caution should be taken when combining ketorolac with thromboprophylactic medications, especially in older patients.
Many surgeons use NSAIDs along with narcotics as part of a postoperative pain regimen. While this is often adequate for some procedures, when the surgery involves manipulating fractures, internal fixation, or resection arthroplasty, the variation in individual patient pain may call for a more robust protocol. Additionally, as surgeons expand to more complex procedures performed in the outpatient setting, evaluating different combinations of analgesics taken in a more structured manner may provide for improved pain control.
A major component of patient satisfaction is postoperative pain control.3-8,12,16,17 Regional anesthesia is an important tool that allows patients to undergo a surgical procedure with a greatly reduced amount of opioid pain medications. In addition, regional anesthesia can provide significant pain control after the patient has left the ambulatory surgery center, but this relief is short-lived because the medication is designed to lose effectiveness over time. As the effects of regional anesthesia wear off, patients can experience “rebound pain” with severe levels of pain that, on occasion, cannot be controlled with oral analgesics alone. The addition of ketorolac provided improved pain control when compared with the other regimens during this transition period when the regional anesthesia was becoming ineffective. In addition, because patients taking ketorolac used less narcotic medication, they experienced less nausea, vomiting, and over-sedation.
Additionally, patients were instructed to record their medication usage and pain scores on a prospective basis, with the hope of eliminating recall bias. A potential weakness is the inability to show significance for pain relief and reduced narcotic usage with the addition of ketorolac, although there was a trend toward significance. Many of the patients who enrolled in the trial did not return their medication logs. While these patients had to be excluded from data analysis, we continued enrollment until we obtained an adequate number of patients in each group. In addition, in the OxyContin group (Group 3), we could only recruit 17 participants, instead of the 18 needed based on our power study. Although this has a potential to alter the significance of our results, we do not feel this had a substantial impact on our results.
Many patients in the non-ketorolac groups supplemented their medication regimens with NSAIDs, which may have falsely lowered pain scores and narcotic usage. While this confounds our study results, we do not believe that it invalidates the conclusion that ketorolac can be an effective adjunct pain medication for use in patients undergoing ambulatory hand surgery.
The study examined postoperative pain control for only 2 procedures, thumb basal joint arthroplasty and distal radius fracture fixation, both commonly performed in the outpatient setting under regional anesthesia and both typically requiring narcotic pain medication. Perhaps the utilization of these medication regimens with different surgical procedures would have differing results.
We conclude that ketorolac potentially provides patients with improved pain control over the use of narcotic pain medications alone in the setting of ambulatory hand surgery.
This paper will be judged for the Resident Writer’s Award.
- Boezaart AP, Davis G, Le-Wendling L. Recovery after orthopedic surgery: techniques to increase duration of pain control. Curr Opin Anaesthesiol. 2012;25(6):665-672. doi:10.1097/ACO.0b013e328359ab5a.
- Buvanendran A, Kroin JS. Useful adjuvants for postoperative pain management. Best Pract Res Clin Anaesthesiol. 2007;21(1):31-49. doi:10.1016/j.bpa.2006.12.003.
- Coluzzi F, Bragazzi L, Di Bussolo E, Pizza G, Mattia C. Determinants of patient satisfaction in postoperative pain management following hand ambulatory day-surgery. Minerva Med. 2011;102(3):177-186.
- Elvir-Lazo OL, White PF. Postoperative pain management after ambulatory surgery: role of multimodal analgesia. Anesthesiol Clin. 2010;28(2):217-224. doi: 10.1016/j.anclin.2010.02.011.
- Kopp SL, Horlocker TT. Regional anaesthesia in day-stay and short-stay surgery. Anaesthesia. 2010;65(Suppl 1):84-96. doi:10.1111/j.1365-2044.2009.06204.x.
- Rawal N. Postoperative pain treatment for ambulatory surgery. Best Pract Res Clin Anaesthesiol. 2007;21(1):129-148. doi:10.1016/j.bpa.2006.11.005.
- Schug SA, Chong C. Pain management after ambulatory surgery. Curr Opin Anaesthesiol. 2009;22(6):738-743. doi:10.1097/ACO.0b013e32833020f4.
- Sripada R, Bowens C Jr. Regional anesthesia procedures for shoulder and upper arm surgery upper extremity update--2005 to present. Int Anesthesiol Clin. 2012;50(1):26-46. doi:10.1097/AIA.0b013e31821a0284.
- Trompeter A, Camilleri G, Narang K, Hauf W, Venn R. Analgesia requirements after interscalene block for shoulder arthroscopy: the 5 days following surgery. Arch Orthop Trauma Surg. 2010;130(3):417-421. doi:10.1007/s00402-009-0959-9.
- Dufeu N, Marchand-Maillet F, Atchabahian A, et al. Efficacy and safety of ultrasound-guided distal blocks for analgesia without motor blockade after ambulatory hand surgery. J Hand Surg Am. 2014;39(4):737-743. doi:10.1016/j.jhsa.2014.01.011.
- Gutta R, Koehn CR, James LE. Does ketorolac have a preemptive analgesic effect? A randomized, double-blind, control study. J Oral Maxillofac Surg. 2013;71(12):2029-2034. doi:10.1016/j.joms.2013.06.220.
- Nossaman VE, Ramadhyani U, Kadowitz PJ, Nossaman BD. Advances in perioperative pain management: use of medications with dual analgesic mechanisms, tramadol & tapentadol. Anesthesiol Clin. 2010;28(4):647-666. doi:10.1016/j.anclin.2010.08.009.
- Warren-Stomberg M, Brattwall M, Jakobsson JG. Non-opioid analgesics for pain management following ambulatory surgery: a review. Minerva Anestesiol. 2013;79(9):1077-1087.
- Wickerts L, Warrén Stomberg M, Brattwall M, Jakobsson JJ. Coxibs: is there a benefit when compared to traditional non-selective NSAIDs in postoperative pain management? Minerva Anestesiol. 2011;77(11):1084-1098.
- Strom BL, Berlin JA, Kinman JL, et al. Parenteral ketorolac and risk of gastrointestinal and operative site bleeding. A postmarketing surveillance study. JAMA. 1996;275(5):376-382. doi:10.1001/jama.275.5.376.
- Hegarty M, Calder A, Davies K, et al. Does take-home analgesia improve postoperative pain after elective day case surgery? A comparison of hospital vs parent-supplied analgesia. Paediatr Anaesth. 2013;23(5):385-389. doi:10.1111/pan.12077.
- Weber SC, Jain R, Parise C. Pain scores in the management of postoperative pain in shoulder surgery. Arthroscopy. 2007;23(1):65-72. doi:10.1016/j.arthro.2006.11.002.
ABSTRACT
We evaluated postoperative pain control and narcotic usage after thumb carpometacarpal (CMC) arthroplasty or open reduction and internal fixation (ORIF) of the distal radius in patients given opiates with or without other non-opiate medication using a specific dosing regimen. A prospective, randomized study of 79 patients undergoing elective CMC arthroplasty or ORIF of the distal radius evaluated postoperative pain in the first 5 postoperative days. Patients were divided into 4 groups: Group 1, oxycodone and acetaminophen PRN; Group 2, oxycodone and acetaminophen with specific dosing; Group 3, oxycodone, acetaminophen, and OxyContin with specific dosing; and Group 4, oxycodone, acetaminophen, and ketorolac with specific dosing. During the first 5 postoperative days, we recorded pain levels according to a numeric pain scale, opioid usage, and complications. Although differences in our data did not reach statistical significance, overall pain scores, opioid usage, and complication rates were less prevalent in the oxycodone, acetaminophen, and ketorolac group. Postoperative pain following ambulatory hand and wrist surgery under regional anesthesia was more effectively controlled with fewer complications using a combination of oxycodone, acetaminophen, and ketorolac with a specific dosing regimen.
Continue to: Regional anesthesia...
Regional anesthesia is a safe and effective modality of perioperative pain control in patients undergoing ambulatory hand procedures.1-10 Often, as the regional block wears off, patients experience a rebound pain effect that can be challenging to manage.
We sought to determine if an organized, multimodal approach in patients undergoing thumb carpometacarpal (CMC) arthroplasty or open reduction and internal fixation (ORIF) of distal radius fractures would provide better postoperative pain control. We hypothesized that this approach would significantly reduce postoperative pain and the need for narcotic pain medication compared with PRN dosing of oxycodone/acetaminophen alone.11-14
MATERIALS AND METHODS
Our study was approved by our Institutional Review Board. Informed consent was obtained from each patient. Patients presenting for elective thumb CMC arthroplasty or ORIF of the distal radius were screened for inclusion in a prospective, randomized study. Inclusion criteria included patients aged 18 to 65 years who could provide informed consent. Patients with chronic pain syndromes, long-term narcotic usage, chronic medical conditions precluding the use of opiates or nonsteroidal anti-inflammatory drugs (NSAIDs), and those who did not have a complete sensory and motor block postoperatively were excluded.
Patients were randomly divided into 1 of 4 study arms. Randomization was performed via sealed envelopes, which were opened in the recovery area when postoperative prescriptions were written. The group distribution was as follows: Group 1, Percocet 5 mg/325 mg alone (control); Group 2, oxycodone 5 mg, acetaminophen 325 mg administered separately; Group 3, oxycodone 5 mg, acetaminophen 325 mg, and oxycodone SR (OxyContin) 10 mg; and Group 4, oxycodone 5 mg, acetaminophen 325 mg, and ketorolac (Toradol) 10 mg (Table 1). Patients in the control group were instructed to take 1 or 2 tablets every 4 to 6 hours as needed for pain. Patients in the 3 experimental groups were given detailed instructions regarding when and how to take their medications. All patients were instructed to take 650 mg of acetaminophen every 6 hours. Patients were provided a sliding scale to assist in dosing their opioid medications according to their numeric pain score (NPS) (Table 2). Group 2 patients were given oxycodone 10 mg in the postanesthesia care unit (PACU) and instructed to take oxycodone 10 mg with acetaminophen 650 mg every 6 hours on a scheduled basis until their block wore off, then dose themselves using the NPS.
Table 1. Patient Groups
Group | Anesthesia | Pain Medications |
1 (standard treatment) | Brachial plexus block | Percocet (oxycodone and acetaminophen) 5-10 mg every 4-6 hours as needed for pain. |
2 | Brachial plexus block | 1. Oxycodone 0-15 mg every 4-6 hours as needed for pain based on pain scale score. 2. Tylenol (Acetaminophen) 650 mg every 6 hours, scheduled. |
3 | Brachial plexus block | 1. Oxycodone 0-15 mg every 4-6 hours as needed for pain based on numeric pain scale. 2. Tylenol (Acetaminophen) 650 mg every 6 hours, scheduled. 3. OxyContin (oxycodone sustained release) 10 mg twice a day, scheduled. |
4 | Brachial plexus block | 1. Oxycodone 0-15 mg every 4-6 hours as needed for pain based on pain scale score. 2. Tylenol (Acetaminophen) 650 mg every 6 hours, scheduled. 3. Toradol (Ketorolac) 10mg every 6 hours, scheduled. |
Table 2. Sliding Scale for Pain Control in the Experimental Groups
Pain Score | Oxycodone Dose |
0-3 | 5 mg (1 tablet) |
4-7 | 10 mg (2 tablets) |
8-10 | 15 mg (3 tablets) |
Group 3 patients were given oxycodone 10 mg in the PACU and instructed to take oxycodone 10 mg with acetaminophen 650 mg every 6 hours and OxyContin 10 mg every 12 hours on a scheduled basis until their block wore off, then dose themselves using NPS. Group 4 patients were given oxycodone 10 mg postoperatively and ketorolac 30 mg intravenously in the PACU and instructed to take oxycodone 10 mg, acetaminophen 650 mg, and ketorolac 10 mg every 6 hours on a scheduled basis until their block wore off, then dose themselves using the NPS.
Patients were provided with a journal and asked to record their medication usage, NPS, and any adverse effects (nausea, vomiting, and uncontrolled pain were specifically mentioned) or complications for 5 days after their procedure. We also attempted to contact patients by telephone on each of the 5 days after their procedure to remind them to complete their logs. They were asked specifically if they were having difficulty with their medications. They were also asked specifically about nausea, vomiting, and over-sedation. If patients requested additional medication to help treat their pain, they were instructed to add an over-the-counter NSAID of their choice based on the label’s suggested dosing.
Continue to: All patients received a supraclavicular...
All patients received a supraclavicular brachial plexus block using 0.75% ropivacaine under the supervision of an attending anesthesiologist experienced in regional anesthesia. Patients underwent thumb CMC arthroplasty utilizing complete resection of the trapezium followed by abductor pollicis longus suspensionplasty under the supervision of 1 of 3 fellowship-trained hand surgeons. ORIF of the distal radius was completed utilizing a volar approach and distal radius locking plate under the supervision of 1 of 3 fellowship-trained hand surgeons.
Primary outcome measures were the total number of oxycodone tablets taken daily and the average daily NPS. Secondary outcomes measured included adverse effects as noted above and the need for a trip to the emergency department for unrelieved pain.
A power analysis was completed prior to the beginning of the study. To detect a difference of at least 1 on the NPS, we determined that 18 patients per group would provide 80% power. This was based on literature utilizing the visual analog scale (VAS), a 100-mm line on which patients can place a mark to describe the intensity of their pain. The standard deviation on the VAS is approximately 15 mm. To account for potential dropout, we elected to recruit 20 patients per group. Non-paired t tests were used to compare groups.
RESULTS
One hundred and eighteen patients enrolled in the study. Of those, 79 patients completed and returned their summary logs (by group: 18 control, 20 oxycodone, 17 OxyContin, and 24 ketorolac). The remaining patients were excluded from the final analysis because they did not return their summary logs. Only 1 patient was excluded from the analysis because he did not have adequate regional anesthesia. Demographic data were analyzed and showed no significant differences between groups at the P < .05 level of significance. Surgical procedures were completed by 3 fellowship-trained hand surgeons. Distal radius fractures were performed using a volar approach. CMC arthroplasty was performed using a procedure that was standardized across surgeons. There were no between-surgeon differences in outcomes.
Average daily NPS (Figure 1) and the total number of oxycodone tablets taken (Figure 2) over the 5-day study period were recorded. Patients in the ketorolac group used fewer oxycodone tablets (19.3) than patients in the other 3 groups (24.4), P =.11, but the difference was not statistically significant. The maximum number of oxycodone tablets used was 71 in the Percocet group, 57 in the oxycodone and ketorolac groups, and 73 in the OxyContin group. The average daily NPS was lower in the ketorolac group during the period of medication use. This value only reached statistical significance on postoperative day 0 when the ketorolac group was compared with the OxyContin group (P = .01) and on postoperative day 1 when the ketorolac group was compared with the oxycodone group (P = .04). Complications (Figure 3) were greater in the non-ketorolac groups. One patient each in the oxycodone and OxyContin groups required a trip to the emergency department for pain control after their block wore off. Nausea and vomiting were present in each of the 4 groups but to a much greater degree in the Percocet and OxyContin groups; however, these results did not reach statistical significance (P = .129). Eleven of the 18 patients in the Percocet group required an additional NSAID (naproxen) and still did not achieve pain control similar to the other groups. This may explain why the average daily pain score in the Percocet group was lower than that in the oxycodone group, in which only 4 of the 20 patients supplemented with naproxen. Patients did, however, require many more oxycodone tablets to achieve pain control in the Percocet group. Over-sedation was reported in 3 patients in the oxycodone group and in 1 patient in the OxyContin group. No patients were found to have bleeding, renal, or other systemic complications.
Continue to: Discussion...
DISCUSSION
In this prospective, randomized study, we sought to determine whether a more organized approach to treating postoperative pain using a specific dosing regimen or opiates in conjunction with non-opiate medications would lead to improved pain control and a decreased need for opiates. We found that adding ketorolac to the postoperative pain regimen and outlining a more detailed set of instructions could lower narcotic usage in the first 4 postoperative days. In addition, adding ketorolac decreased other complications commonly seen with narcotic usage and was shown to be safe in our patient population.
Ketorolac has been shown to decrease narcotic pain medication usage in several surgical settings and across different surgical specialties. It is hypothesized that ketorolac potentiates the effects of narcotics.11 Ketorolac given alone has a potent analgesic effect by acting as a strong non-selective cyclooxygenase inhibitor. The major drawback to ketorolac use has been its well-known side-effect profile. Ketorolac is renally excreted, and as such, should not be used in patients with renal insufficiency. In addition, ketorolac has been shown to cause increased gastrointestinal bleeding when used for >5 days.15 Caution should be taken when combining ketorolac with thromboprophylactic medications, especially in older patients.
Many surgeons use NSAIDs along with narcotics as part of a postoperative pain regimen. While this is often adequate for some procedures, when the surgery involves manipulating fractures, internal fixation, or resection arthroplasty, the variation in individual patient pain may call for a more robust protocol. Additionally, as surgeons expand to more complex procedures performed in the outpatient setting, evaluating different combinations of analgesics taken in a more structured manner may provide for improved pain control.
A major component of patient satisfaction is postoperative pain control.3-8,12,16,17 Regional anesthesia is an important tool that allows patients to undergo a surgical procedure with a greatly reduced amount of opioid pain medications. In addition, regional anesthesia can provide significant pain control after the patient has left the ambulatory surgery center, but this relief is short-lived because the medication is designed to lose effectiveness over time. As the effects of regional anesthesia wear off, patients can experience “rebound pain” with severe levels of pain that, on occasion, cannot be controlled with oral analgesics alone. The addition of ketorolac provided improved pain control when compared with the other regimens during this transition period when the regional anesthesia was becoming ineffective. In addition, because patients taking ketorolac used less narcotic medication, they experienced less nausea, vomiting, and over-sedation.
Additionally, patients were instructed to record their medication usage and pain scores on a prospective basis, with the hope of eliminating recall bias. A potential weakness is the inability to show significance for pain relief and reduced narcotic usage with the addition of ketorolac, although there was a trend toward significance. Many of the patients who enrolled in the trial did not return their medication logs. While these patients had to be excluded from data analysis, we continued enrollment until we obtained an adequate number of patients in each group. In addition, in the OxyContin group (Group 3), we could only recruit 17 participants, instead of the 18 needed based on our power study. Although this has a potential to alter the significance of our results, we do not feel this had a substantial impact on our results.
Many patients in the non-ketorolac groups supplemented their medication regimens with NSAIDs, which may have falsely lowered pain scores and narcotic usage. While this confounds our study results, we do not believe that it invalidates the conclusion that ketorolac can be an effective adjunct pain medication for use in patients undergoing ambulatory hand surgery.
The study examined postoperative pain control for only 2 procedures, thumb basal joint arthroplasty and distal radius fracture fixation, both commonly performed in the outpatient setting under regional anesthesia and both typically requiring narcotic pain medication. Perhaps the utilization of these medication regimens with different surgical procedures would have differing results.
We conclude that ketorolac potentially provides patients with improved pain control over the use of narcotic pain medications alone in the setting of ambulatory hand surgery.
This paper will be judged for the Resident Writer’s Award.
- Boezaart AP, Davis G, Le-Wendling L. Recovery after orthopedic surgery: techniques to increase duration of pain control. Curr Opin Anaesthesiol. 2012;25(6):665-672. doi:10.1097/ACO.0b013e328359ab5a.
- Buvanendran A, Kroin JS. Useful adjuvants for postoperative pain management. Best Pract Res Clin Anaesthesiol. 2007;21(1):31-49. doi:10.1016/j.bpa.2006.12.003.
- Coluzzi F, Bragazzi L, Di Bussolo E, Pizza G, Mattia C. Determinants of patient satisfaction in postoperative pain management following hand ambulatory day-surgery. Minerva Med. 2011;102(3):177-186.
- Elvir-Lazo OL, White PF. Postoperative pain management after ambulatory surgery: role of multimodal analgesia. Anesthesiol Clin. 2010;28(2):217-224. doi: 10.1016/j.anclin.2010.02.011.
- Kopp SL, Horlocker TT. Regional anaesthesia in day-stay and short-stay surgery. Anaesthesia. 2010;65(Suppl 1):84-96. doi:10.1111/j.1365-2044.2009.06204.x.
- Rawal N. Postoperative pain treatment for ambulatory surgery. Best Pract Res Clin Anaesthesiol. 2007;21(1):129-148. doi:10.1016/j.bpa.2006.11.005.
- Schug SA, Chong C. Pain management after ambulatory surgery. Curr Opin Anaesthesiol. 2009;22(6):738-743. doi:10.1097/ACO.0b013e32833020f4.
- Sripada R, Bowens C Jr. Regional anesthesia procedures for shoulder and upper arm surgery upper extremity update--2005 to present. Int Anesthesiol Clin. 2012;50(1):26-46. doi:10.1097/AIA.0b013e31821a0284.
- Trompeter A, Camilleri G, Narang K, Hauf W, Venn R. Analgesia requirements after interscalene block for shoulder arthroscopy: the 5 days following surgery. Arch Orthop Trauma Surg. 2010;130(3):417-421. doi:10.1007/s00402-009-0959-9.
- Dufeu N, Marchand-Maillet F, Atchabahian A, et al. Efficacy and safety of ultrasound-guided distal blocks for analgesia without motor blockade after ambulatory hand surgery. J Hand Surg Am. 2014;39(4):737-743. doi:10.1016/j.jhsa.2014.01.011.
- Gutta R, Koehn CR, James LE. Does ketorolac have a preemptive analgesic effect? A randomized, double-blind, control study. J Oral Maxillofac Surg. 2013;71(12):2029-2034. doi:10.1016/j.joms.2013.06.220.
- Nossaman VE, Ramadhyani U, Kadowitz PJ, Nossaman BD. Advances in perioperative pain management: use of medications with dual analgesic mechanisms, tramadol & tapentadol. Anesthesiol Clin. 2010;28(4):647-666. doi:10.1016/j.anclin.2010.08.009.
- Warren-Stomberg M, Brattwall M, Jakobsson JG. Non-opioid analgesics for pain management following ambulatory surgery: a review. Minerva Anestesiol. 2013;79(9):1077-1087.
- Wickerts L, Warrén Stomberg M, Brattwall M, Jakobsson JJ. Coxibs: is there a benefit when compared to traditional non-selective NSAIDs in postoperative pain management? Minerva Anestesiol. 2011;77(11):1084-1098.
- Strom BL, Berlin JA, Kinman JL, et al. Parenteral ketorolac and risk of gastrointestinal and operative site bleeding. A postmarketing surveillance study. JAMA. 1996;275(5):376-382. doi:10.1001/jama.275.5.376.
- Hegarty M, Calder A, Davies K, et al. Does take-home analgesia improve postoperative pain after elective day case surgery? A comparison of hospital vs parent-supplied analgesia. Paediatr Anaesth. 2013;23(5):385-389. doi:10.1111/pan.12077.
- Weber SC, Jain R, Parise C. Pain scores in the management of postoperative pain in shoulder surgery. Arthroscopy. 2007;23(1):65-72. doi:10.1016/j.arthro.2006.11.002.
TAKE-HOME POINTS
- While regional anesthesia is safe and effective for patients who undergo ambulatory hand surgery, patients often experience rebound pain as it wears off.
- We tested a multimodal approach for patients who underwent thumb CMC arthroplasty or ORIF of distal radius fracture.
- Patients were provided with a journal and asked to record medication usage, a NPS, and adverse effects. Seventy-nine patients completed the study.
- We found that adding ketorolac to the postoperative pain protocol, with detailed instructions, lowered narcotic usage in the first 4 postoperative days.
- Ketorolac potentially provides patients with improved pain control over the use of narcotic pain medication alone in an ambulatory hand surgery setting.
MRSA in Dermatology Inpatients With a Vesiculobullous Disorder
Methicillin, cloxacillin, flucloxacillin, and cefoxitin are stable, penicillinase-producing β-lactam antibiotics; Staphylococcus aureus strains resistant to these agents are designated as methicillin-resistant S aureus (MRSA). Based on genotypic and phenotypic differences there are 2 strains of MRSA: hospital acquired and community acquired.
The potential for nosocomial transmission and the limited number of antibiotics available to treat MRSA are problematic. Moreover, MRSA has emerged worldwide as a major nosocomial pathogen that contributes to morbidity and mortality. Methicillin-resistant S aureus infection in vesiculobullous disorders such as pemphigus vulgaris (PV) and toxic epidermal necrolysis (TEN) is known to contribute to mortality.1
The reported prevalence of MRSA in India ranges from 12% to 38.44%.2-4 We frequently encounter MRSA in dermatology inpatients, especially those with a vesiculobullous disorder. The primary objective of this study was to determine the prevalence of MRSA in dermatology inpatients with a vesiculobullous disorder; the secondary objective was to determine if MRSA contributes to mortality.
Materials and Methods
A 1-year prospective, cross-sectional, descriptive study was conducted in a tertiary-care center. The study population included all dermatology inpatients with a vesiculobullous disorder. Patients with a vesiculobullous disorder secondary to a primary viral or bacterial disorder were excluded. Permission to conduct the study was granted by the institution’s Human Ethics Committee.
All patients underwent a detailed history and clinical examination. Routine hematology testing, urinalysis, measurement of the blood glucose level, and other investigations relevant to the vesiculobullous disorder were performed. Special investigations were Gram staining, culture, and susceptibility testing of material from a nasal swab and a swab of a representative skin lesion.
Detection of MRSA
Skin lesions were thoroughly cleaned with sterile normal saline. Specimens of pus were drawn with a sterile swab for Gram staining, culture, and susceptibility testing and were analyzed in the institution’s microbiology department. A direct colony suspension (equivalent to McFarland Standard No. 0.5) was inoculated on a Mueller-Hinton agar plate, incorporating cefoxitin, linezolid, vancomycin, amikacin, and rifampicin supplemented with sodium chloride 2% and incubated at 37°C for 24 hours. Staphylococcus aureus colonies were identified by their smooth, convex, shiny, and opaque appearance with a golden yellow pigment, as well as by coagulase positivity, mannitol fermentation, and production of phosphatase.
Methicillin-resistant S aureus was defined as an isolate having a minimum inhibitory concentration of more than 2 μg/mL of cefoxitin; a methicillin-sensitive S aureus isolate was defined as having a minimum inhibitory concentration of less than or equal to 2 μg/mL of cefoxitin. Specimens showing moderate to heavy growth of MRSA were included in the study. For specimens showing mild growth, testing was repeated; if no growth was seen on repeat testing, results were interpreted as negative.
Data were collected and analyzed for frequency and percentage; P<.05 was considered significant.
Results
The number of patients analyzed in the study period was 43. Table 1 shows their salient demographic characteristics, clinical features, and findings of the investigation. The youngest patient was aged 13 years; the oldest was aged 80 years. The male to female ratio was 0.65 to 1. The most common primary lesion was a combined vesicle and bulla (34 patients [79.1%]); the most common secondary lesion was a combination of erosion with crusting (22 patients [51.2%]).
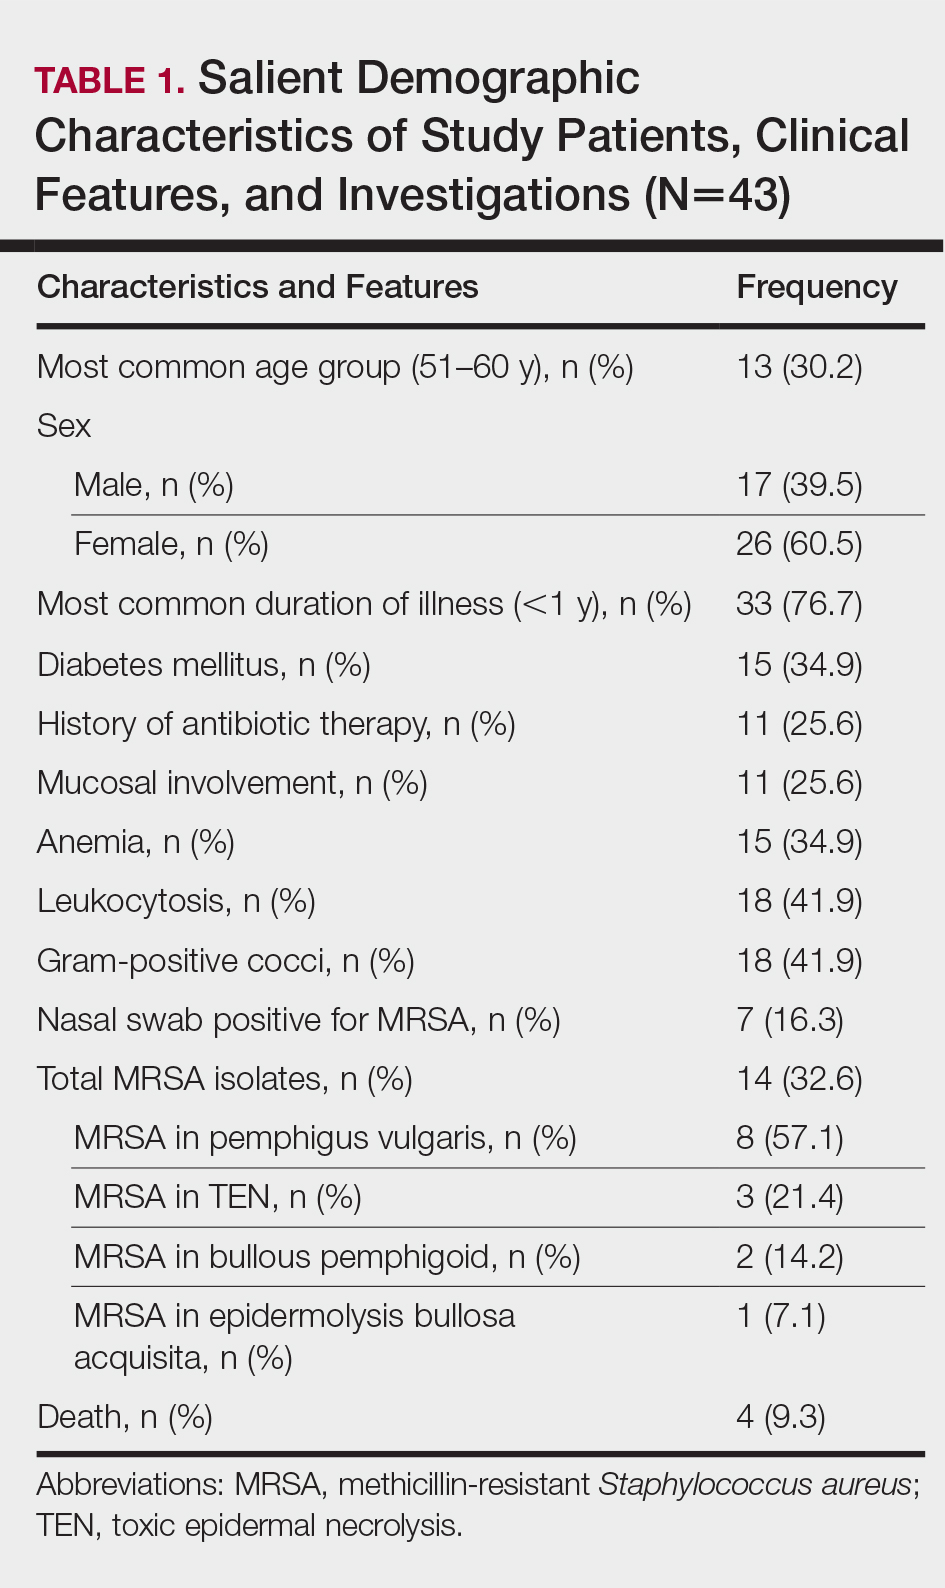
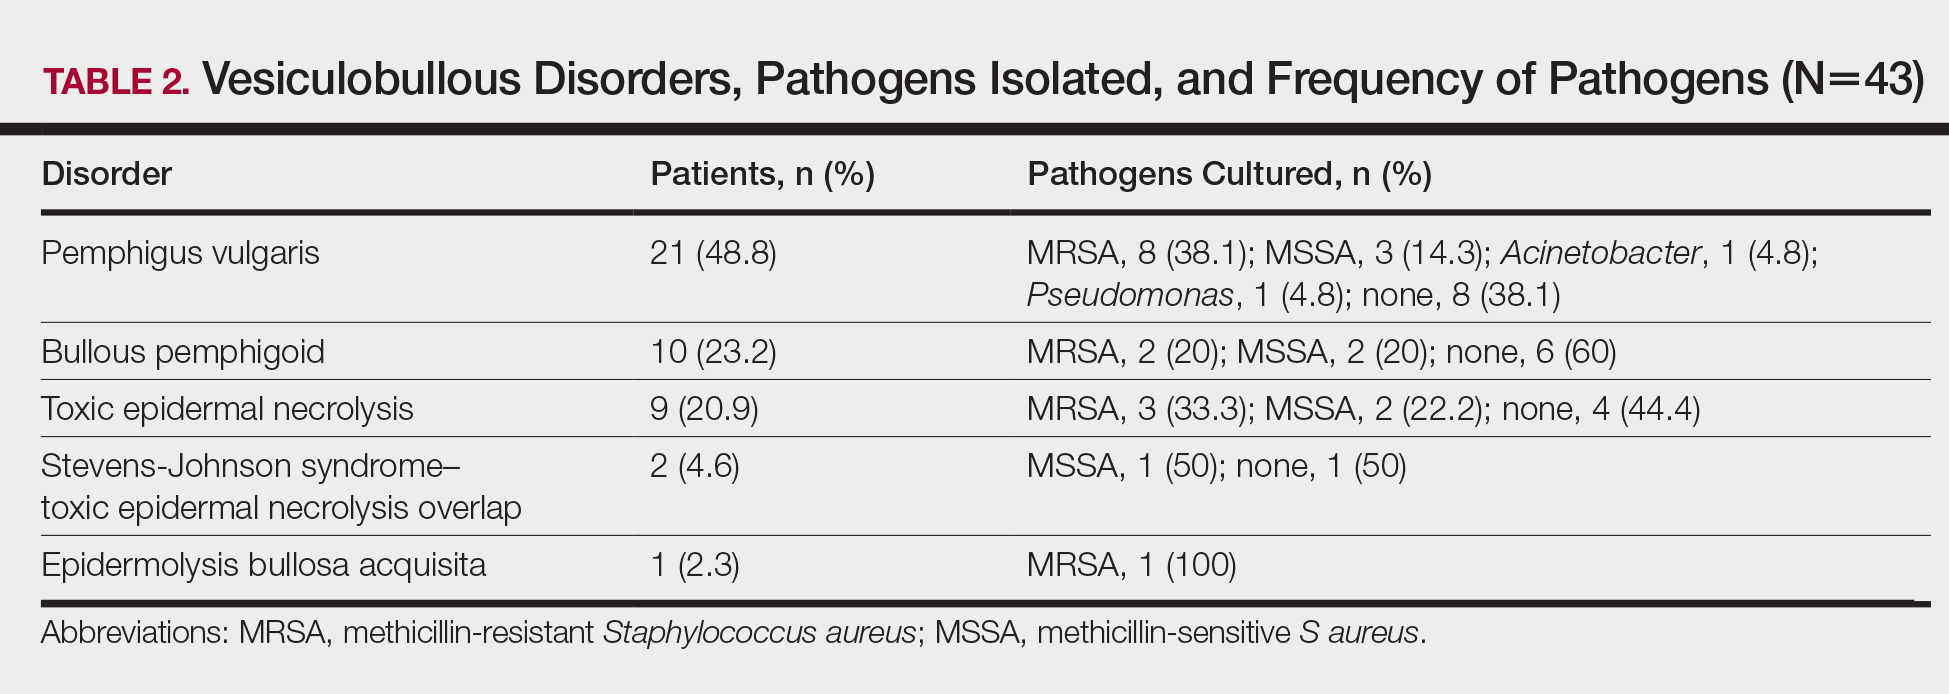
Table 2 lists the types of vesiculobullous disorders seen in this study. Pemphigus vulgaris was the most common (21 patients [48.8%])(Figure 1). Drug-induced vesiculobullous disorders (eg, TEN) were noted in 11 patients (25.6%)(Figure 2).


Table 2 also lists pathogens cultured in the study group. There were 24 bacterial isolates, of which S aureus accounted for 22 (91.7%). Methicillin-resistant S aureus was cultured in 14 patients (32.6%); culture was sterile in 19 patients (44.2%).
Among the 22 cultured staphylococcal species, MRSA accounted for 14 (63.6%) and constituted 58.3% (14/24) of all bacterial isolates. The nasal swab for MRSA was positive in 4 PV patients (9.3%), 2 TEN patients (4.6%), and 1 bullous pemphigoid patient (2.3%). Methicillin-resistant S aureus was most commonly cultured in PV patients (8/14 [57.1%]).
All MRSA strains (100%) were sensitive to vancomycin and linezolid; 34 (79.1%) were sensitive to amikacin. Additionally, 100% of MRSA strains were resistant to oxacillin, cloxacillin, and cefoxitin.
Three patients with PV (7.0%) and 1 patient with TEN (2.3%) died during the course of the study; only 1 death (2.3%) occurred in a patient who had a positive MRSA culture.
Comment
In this 1-year study, we tested and followed 43 patients with autoimmune and drug-induced vesiculobullous disorders. Vesiculobullous disorders in dermatology inpatients are a cause of great concern. When lesions rupture, they leave behind a large area of erosion that forms a nidus of bacterial colonization; often, these bacteria cause severe infection, including septicemia, and result in death.5 Moreover, autoimmune bullous disorders usually require a prolonged hospital stay and powerful immunosuppressive drugs, which contributes to bacterial infection, especially MRSA.6
The age of patients in this study ranged from 13 to 80 years; most patients were in the 6th decade, a pattern seen in studies worldwide.5 In a study by Kanwar and De,7 however, most cases were aged 20 to 40 years.7 In our study, there was a female preponderance (male to female ratio of 0.65 to 1).
Studies have shown that the duration of illness in vesiculobullous disorder is directly associated with MRSA infection. However, in our study with MRSA detected in 14 patients, most patients had a duration of illness less than 1 year (statistically insignificant [P>.05]), a finding similar to Shafi et al.8
The symptomatic nature of these diseases, their unsightly appearance, and mucous-membrane involvement of vesiculobullous disorders prompts these patients to present to the hospital early. However, a prolonged hospital stay by patients with an autoimmune vesiculobullous disorders sets the stage for MRSA colonization.
In this study, diabetes mellitus (DM) was seen in 15 patients (34.9%); 5 of them had MRSA infection (statistically insignificant [P>.05]). Diabetes mellitus contributing to sepsis and MRSA infection, which in turn contributes to morbidity and mortality, has been well-documented.2,4,9
Methicillin-resistant S aureus in this study was isolated most often from blisters and erosions. Vesiculobullous disorders and drug reactions (eg, Stevens-Johnson syndrome, TEN) are characterized by blisters that rupture to form erosions and crusting, which form fissures in the epidermal barrier function that are nidi for colonization by microbes, especially S aureus and MRSA in particular; later, these bacteria can enter dermal vessels and then the bloodstream, leading to septicemia.10
The prevalence of MRSA in this study was 32.6% (14/43), which is high compared to other studies.2-4 Pemphigus vulgaris was the most common disorder infected by MRSA in this study (57.1% [8/14] of MRSA isolates)(Table 1), a finding that reveals that the incidence of MRSA is high among staphylococcal isolates in vesiculobullous disorders. However, the high incidence of MRSA in this study could be a reflection of the number of patients with a severe and chronic vesiculobullous disorder, such as PV, and serious drug reactions such as TEN referred to our tertiary-care center, where we get a large number of patients affected by autoimmune and drug-induced vesiculobullous disorders. Similar findings have been reported by Stryjewski et al.11
A high prevalence of MRSA in a dermatology unit has grave consequences, contributing to morbidity and mortality in particular among patients with a vesiculobullous disorder. Immunosuppressive therapy and comorbidities such as DM contribute to MRSA colonization in vesiculobullous disorders.12 Overcrowding and poor sterilization techniques in public hospitals in India may contribute to the high prevalence of MRSA seen in hospital units.
Patients with a vesiculobullous disorder who are chronic nasal carriers of MRSA are at risk for cutaneous MRSA infection, which in turn can lead to MRSA septicemia and an elevated risk of death. In this study, however, a nasal swab was positive for MRSA in only 7 patients. One patient with MRSA colonization died, which was statistically insignificant (P=1).
In this study, all MRSA strains (100%) were resistant to first-line antibiotics, such as oxacillin, cloxacillin, and cefoxitin; all strains were susceptible to vancomycin and linezolid.
Conclusion
Our study shows that MRSA is becoming the prominent pathogen in nosocomial infections, especially in bedridden patients, which has grave implications. The use of a prophylactic S aureus conjugate vaccine in patients with a chronic vesiculobullous disorder might be justified in the future.15 We found a high prevalence (32.6%) of MRSA in vesiculobullous disorders, no relationship between DM and MRSA colonization, PV was the most common disorder complicated by MRSA, no relationship between nasal colonization and MRSA infection, no relationship between death during the study period and MRSA infection, 100% of MRSA strains were susceptible to vancomycin and linezolid, and 79.1% of MRSA strains were susceptible to amikacin.
- Nair SP. A retrospective study of mortality of pemphigus patients in a tertiary care hospital. Indian J Dermatol Venereol Leprol. 2013;79:706-709.
- Sachdev D, Amladi S, Natarj G, et al. An outbreak of methicillin-resistant Staphylococcus aureus (MRSA) infection in dermatology inpatients. Indian J Dermatol Venereol Leprol. 2003;69:377-380.
- Vijayamohan N, Nair SP. A study of the prevalence of methicillin-resistant Staphylococcus aureus in dermatology inpatients. Indian Dermatol Online J. 2014;5:441-445.
- Malhotra SK, Malhotra S, Dhaliwal GS, et al. Bacterial study of pyodermas in a tertiary care dermatological center. Indian J Dermatol. 2012;57:358-361.
- Valencia IC, Kirsner RS, Kerdel FA. Microbiological evaluation of skin wounds: alarming trends towards antibiotic resistance in an inpatient dermatology service during a 10-year period. J Am Acad Dermatol. 2004;50:845-849.
- Lehman JS, Murell DF, Camilleri MJ, et al. Infection and infection prevention in patients treated with immunosuppressive medications for autoimmune bullous disorders. Dermatol Clin. 2011;29:591-598.
- Kanwar AJ, De D. Pemphigus in India. Indian J Dermatol Venereol Leprol. 2011;77:439-449.
- Shafi M, Khatri ML, Mashima M, et al. Pemphigus: a clinical study of 109 cases from Tripoli, Libya. Indian J Dermatol Venereol Leprol. 1994;60:140-143.
- Torres K, Sampathkumar P. Predictors of methicillin-resistant Staphylococcus aureus colonization at hospital admission. Am J Infect Control. 2013;41:1043-1047.
- Miller LG, Quan C, Shay A, et al. A prospective investigation of outcomes after hospital discharge for endemic, community-acquired methicillin-resistant Staphylococcus aureus skin infection. Clin Infect Dis. 2007;44:483-492.
- Stryjewski M, Chambers HF. Skin and soft-tissue infections caused by community-acquired methicillin-resistant Staphylococcus aureus. Clin Infect Dis. 2008;46(suppl 5):S368-S377.
- Mutasim DF. Management of autoimmune bullous diseases: pharmacology and therapeutics. J Am Acad Dermatol. 2004;51:859-877.
- Cohen PR. Community-acquired methicillin-resistant Staphylococcus aureus skin infections: a review of epidemiology, clinical features, management, and prevention. Int J Dermatol. 2007;46:1-11.
- Elston DM. Methicillin-sensitive and methicillin-resistant Staphylococcus aureus: management principles and selection of antibiotic therapy. Dermatol Clin. 2007;25:157-164.
- Shinefield H, Black S, Fattom A, et al. Use of a Staphylococcus aureus conjugate vaccine in patients receiving hemodialysis. N Engl J Med. 2001;346:491-496.
Methicillin, cloxacillin, flucloxacillin, and cefoxitin are stable, penicillinase-producing β-lactam antibiotics; Staphylococcus aureus strains resistant to these agents are designated as methicillin-resistant S aureus (MRSA). Based on genotypic and phenotypic differences there are 2 strains of MRSA: hospital acquired and community acquired.
The potential for nosocomial transmission and the limited number of antibiotics available to treat MRSA are problematic. Moreover, MRSA has emerged worldwide as a major nosocomial pathogen that contributes to morbidity and mortality. Methicillin-resistant S aureus infection in vesiculobullous disorders such as pemphigus vulgaris (PV) and toxic epidermal necrolysis (TEN) is known to contribute to mortality.1
The reported prevalence of MRSA in India ranges from 12% to 38.44%.2-4 We frequently encounter MRSA in dermatology inpatients, especially those with a vesiculobullous disorder. The primary objective of this study was to determine the prevalence of MRSA in dermatology inpatients with a vesiculobullous disorder; the secondary objective was to determine if MRSA contributes to mortality.
Materials and Methods
A 1-year prospective, cross-sectional, descriptive study was conducted in a tertiary-care center. The study population included all dermatology inpatients with a vesiculobullous disorder. Patients with a vesiculobullous disorder secondary to a primary viral or bacterial disorder were excluded. Permission to conduct the study was granted by the institution’s Human Ethics Committee.
All patients underwent a detailed history and clinical examination. Routine hematology testing, urinalysis, measurement of the blood glucose level, and other investigations relevant to the vesiculobullous disorder were performed. Special investigations were Gram staining, culture, and susceptibility testing of material from a nasal swab and a swab of a representative skin lesion.
Detection of MRSA
Skin lesions were thoroughly cleaned with sterile normal saline. Specimens of pus were drawn with a sterile swab for Gram staining, culture, and susceptibility testing and were analyzed in the institution’s microbiology department. A direct colony suspension (equivalent to McFarland Standard No. 0.5) was inoculated on a Mueller-Hinton agar plate, incorporating cefoxitin, linezolid, vancomycin, amikacin, and rifampicin supplemented with sodium chloride 2% and incubated at 37°C for 24 hours. Staphylococcus aureus colonies were identified by their smooth, convex, shiny, and opaque appearance with a golden yellow pigment, as well as by coagulase positivity, mannitol fermentation, and production of phosphatase.
Methicillin-resistant S aureus was defined as an isolate having a minimum inhibitory concentration of more than 2 μg/mL of cefoxitin; a methicillin-sensitive S aureus isolate was defined as having a minimum inhibitory concentration of less than or equal to 2 μg/mL of cefoxitin. Specimens showing moderate to heavy growth of MRSA were included in the study. For specimens showing mild growth, testing was repeated; if no growth was seen on repeat testing, results were interpreted as negative.
Data were collected and analyzed for frequency and percentage; P<.05 was considered significant.
Results
The number of patients analyzed in the study period was 43. Table 1 shows their salient demographic characteristics, clinical features, and findings of the investigation. The youngest patient was aged 13 years; the oldest was aged 80 years. The male to female ratio was 0.65 to 1. The most common primary lesion was a combined vesicle and bulla (34 patients [79.1%]); the most common secondary lesion was a combination of erosion with crusting (22 patients [51.2%]).
Table 2 lists the types of vesiculobullous disorders seen in this study. Pemphigus vulgaris was the most common (21 patients [48.8%])(Figure 1). Drug-induced vesiculobullous disorders (eg, TEN) were noted in 11 patients (25.6%)(Figure 2).
Table 2 also lists pathogens cultured in the study group. There were 24 bacterial isolates, of which S aureus accounted for 22 (91.7%). Methicillin-resistant S aureus was cultured in 14 patients (32.6%); culture was sterile in 19 patients (44.2%).
Among the 22 cultured staphylococcal species, MRSA accounted for 14 (63.6%) and constituted 58.3% (14/24) of all bacterial isolates. The nasal swab for MRSA was positive in 4 PV patients (9.3%), 2 TEN patients (4.6%), and 1 bullous pemphigoid patient (2.3%). Methicillin-resistant S aureus was most commonly cultured in PV patients (8/14 [57.1%]).
All MRSA strains (100%) were sensitive to vancomycin and linezolid; 34 (79.1%) were sensitive to amikacin. Additionally, 100% of MRSA strains were resistant to oxacillin, cloxacillin, and cefoxitin.
Three patients with PV (7.0%) and 1 patient with TEN (2.3%) died during the course of the study; only 1 death (2.3%) occurred in a patient who had a positive MRSA culture.
Comment
In this 1-year study, we tested and followed 43 patients with autoimmune and drug-induced vesiculobullous disorders. Vesiculobullous disorders in dermatology inpatients are a cause of great concern. When lesions rupture, they leave behind a large area of erosion that forms a nidus of bacterial colonization; often, these bacteria cause severe infection, including septicemia, and result in death.5 Moreover, autoimmune bullous disorders usually require a prolonged hospital stay and powerful immunosuppressive drugs, which contributes to bacterial infection, especially MRSA.6
The age of patients in this study ranged from 13 to 80 years; most patients were in the 6th decade, a pattern seen in studies worldwide.5 In a study by Kanwar and De,7 however, most cases were aged 20 to 40 years.7 In our study, there was a female preponderance (male to female ratio of 0.65 to 1).
Studies have shown that the duration of illness in vesiculobullous disorder is directly associated with MRSA infection. However, in our study with MRSA detected in 14 patients, most patients had a duration of illness less than 1 year (statistically insignificant [P>.05]), a finding similar to Shafi et al.8
The symptomatic nature of these diseases, their unsightly appearance, and mucous-membrane involvement of vesiculobullous disorders prompts these patients to present to the hospital early. However, a prolonged hospital stay by patients with an autoimmune vesiculobullous disorders sets the stage for MRSA colonization.
In this study, diabetes mellitus (DM) was seen in 15 patients (34.9%); 5 of them had MRSA infection (statistically insignificant [P>.05]). Diabetes mellitus contributing to sepsis and MRSA infection, which in turn contributes to morbidity and mortality, has been well-documented.2,4,9
Methicillin-resistant S aureus in this study was isolated most often from blisters and erosions. Vesiculobullous disorders and drug reactions (eg, Stevens-Johnson syndrome, TEN) are characterized by blisters that rupture to form erosions and crusting, which form fissures in the epidermal barrier function that are nidi for colonization by microbes, especially S aureus and MRSA in particular; later, these bacteria can enter dermal vessels and then the bloodstream, leading to septicemia.10
The prevalence of MRSA in this study was 32.6% (14/43), which is high compared to other studies.2-4 Pemphigus vulgaris was the most common disorder infected by MRSA in this study (57.1% [8/14] of MRSA isolates)(Table 1), a finding that reveals that the incidence of MRSA is high among staphylococcal isolates in vesiculobullous disorders. However, the high incidence of MRSA in this study could be a reflection of the number of patients with a severe and chronic vesiculobullous disorder, such as PV, and serious drug reactions such as TEN referred to our tertiary-care center, where we get a large number of patients affected by autoimmune and drug-induced vesiculobullous disorders. Similar findings have been reported by Stryjewski et al.11
A high prevalence of MRSA in a dermatology unit has grave consequences, contributing to morbidity and mortality in particular among patients with a vesiculobullous disorder. Immunosuppressive therapy and comorbidities such as DM contribute to MRSA colonization in vesiculobullous disorders.12 Overcrowding and poor sterilization techniques in public hospitals in India may contribute to the high prevalence of MRSA seen in hospital units.
Patients with a vesiculobullous disorder who are chronic nasal carriers of MRSA are at risk for cutaneous MRSA infection, which in turn can lead to MRSA septicemia and an elevated risk of death. In this study, however, a nasal swab was positive for MRSA in only 7 patients. One patient with MRSA colonization died, which was statistically insignificant (P=1).
In this study, all MRSA strains (100%) were resistant to first-line antibiotics, such as oxacillin, cloxacillin, and cefoxitin; all strains were susceptible to vancomycin and linezolid.
Conclusion
Our study shows that MRSA is becoming the prominent pathogen in nosocomial infections, especially in bedridden patients, which has grave implications. The use of a prophylactic S aureus conjugate vaccine in patients with a chronic vesiculobullous disorder might be justified in the future.15 We found a high prevalence (32.6%) of MRSA in vesiculobullous disorders, no relationship between DM and MRSA colonization, PV was the most common disorder complicated by MRSA, no relationship between nasal colonization and MRSA infection, no relationship between death during the study period and MRSA infection, 100% of MRSA strains were susceptible to vancomycin and linezolid, and 79.1% of MRSA strains were susceptible to amikacin.
- Nair SP. A retrospective study of mortality of pemphigus patients in a tertiary care hospital. Indian J Dermatol Venereol Leprol. 2013;79:706-709.
- Sachdev D, Amladi S, Natarj G, et al. An outbreak of methicillin-resistant Staphylococcus aureus (MRSA) infection in dermatology inpatients. Indian J Dermatol Venereol Leprol. 2003;69:377-380.
- Vijayamohan N, Nair SP. A study of the prevalence of methicillin-resistant Staphylococcus aureus in dermatology inpatients. Indian Dermatol Online J. 2014;5:441-445.
- Malhotra SK, Malhotra S, Dhaliwal GS, et al. Bacterial study of pyodermas in a tertiary care dermatological center. Indian J Dermatol. 2012;57:358-361.
- Valencia IC, Kirsner RS, Kerdel FA. Microbiological evaluation of skin wounds: alarming trends towards antibiotic resistance in an inpatient dermatology service during a 10-year period. J Am Acad Dermatol. 2004;50:845-849.
- Lehman JS, Murell DF, Camilleri MJ, et al. Infection and infection prevention in patients treated with immunosuppressive medications for autoimmune bullous disorders. Dermatol Clin. 2011;29:591-598.
- Kanwar AJ, De D. Pemphigus in India. Indian J Dermatol Venereol Leprol. 2011;77:439-449.
- Shafi M, Khatri ML, Mashima M, et al. Pemphigus: a clinical study of 109 cases from Tripoli, Libya. Indian J Dermatol Venereol Leprol. 1994;60:140-143.
- Torres K, Sampathkumar P. Predictors of methicillin-resistant Staphylococcus aureus colonization at hospital admission. Am J Infect Control. 2013;41:1043-1047.
- Miller LG, Quan C, Shay A, et al. A prospective investigation of outcomes after hospital discharge for endemic, community-acquired methicillin-resistant Staphylococcus aureus skin infection. Clin Infect Dis. 2007;44:483-492.
- Stryjewski M, Chambers HF. Skin and soft-tissue infections caused by community-acquired methicillin-resistant Staphylococcus aureus. Clin Infect Dis. 2008;46(suppl 5):S368-S377.
- Mutasim DF. Management of autoimmune bullous diseases: pharmacology and therapeutics. J Am Acad Dermatol. 2004;51:859-877.
- Cohen PR. Community-acquired methicillin-resistant Staphylococcus aureus skin infections: a review of epidemiology, clinical features, management, and prevention. Int J Dermatol. 2007;46:1-11.
- Elston DM. Methicillin-sensitive and methicillin-resistant Staphylococcus aureus: management principles and selection of antibiotic therapy. Dermatol Clin. 2007;25:157-164.
- Shinefield H, Black S, Fattom A, et al. Use of a Staphylococcus aureus conjugate vaccine in patients receiving hemodialysis. N Engl J Med. 2001;346:491-496.
Practice Points
- Methicillin-resistant Staphylococcus aureus (MRSA) infection in vesiculobullous disorders such as pemphigus vulgaris and toxic epidermal necrolysis is known to contribute to an increase in disease-related mortality.
- Methicillin-resistant S aureus is becoming the prominent pathogen in nosocomial infections, especially in bedridden patients.
- The prevalence of MRSA in vesiculobullous disorders is high; pemphigus vulgaris is the most common vesiculobullous disorder complicated by MRSA.
- Early diagnosis of MRSA helps reduce morbidity and mortality and improves the patient’s prognosis.
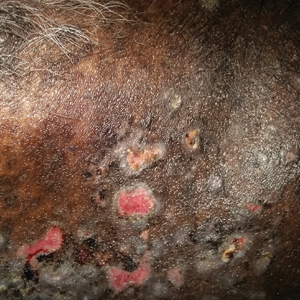
Impact of Sagittal Rotation on Axial Glenoid Width Measurement in the Setting of Glenoid Bone Loss
ABSTRACT
Standard 2-dimensional (2-D) computed tomography (CT) scans of the shoulder are often aligned to the plane of the body as opposed to the plane of the scapula, which may challenge the ability to accurately measure glenoid width and glenoid bone loss (GBL). The purpose of this study is to determine the effect of sagittal rotation of the glenoid on axial anterior-posterior (AP) glenoid width measurements in the setting of anterior GBL.
Forty-three CT scans from consecutive patients with anterior GBL (minimum 10%) were reformatted utilizing open-source DICOM software (OsiriX MD). Patients were grouped according to extent of GBL: I, 10% to 14.9% (N = 12); II, 15% to 19.9% (N = 16); and III, >20% (N = 15). The uncorrected (UNCORR) and corrected (CORR) images were assessed in the axial plane at 5 standardized cuts and measured for AP glenoid width.
For groups I and III, UNCORR scans underestimated axial AP width (and thus overestimated anterior GBL) in cuts 1 and 2, while in cuts 3 to 5, the axial AP width was overestimated (GBL was underestimated). In Group II, axial AP width was underestimated (GBL was overestimated), while in cuts 2 to 5, the axial AP width was overestimated (GBL was underestimated). Overall, AP glenoid width was consistently underestimated in cut 1, the most caudal cut; while AP glenoid width was consistently overestimated in cuts 3 to 5, the more cephalad cuts.
UNCORR 2-D CT scans inaccurately estimated glenoid width and the degree of anterior GBL. This data suggests that corrected 2D CT scans or a 3-dimensional (3-D) reconstruction can help in accurately defining the anterior GBL in patients with shoulder instability.
The treatment of glenohumeral instability has substantially evolved over the past several decades. The understanding of glenoid bone loss (GBL), in particular, has advanced to such a level that we utilize the quantification of GBL for surgical decision-making. Unrecognized and/or untreated GBL is associated with recurrent instability, pain, and disability. Controversy exists, however, regarding the precise amount of anterior GBL that is significant enough to warrant surgical treatment. While historically, 25%1,2 of anterior GBL was thought to be the critical number required to warrant osseous augmentation, studies that are more recent have highlighted the need to perform osseous glenoid reconstruction with lesser degrees of GBL, particularly in the contact athlete.3-9 As small differences in the amount of GBL can change surgical decision-making from an all-soft tissue repair to an osseous reconstruction, it is paramount that we have accurate, valid, and reproducible methods for calculating GBL.
Continue to: Historically, plain radiographs...
Historically, plain radiographs have been the mainstay for evaluating the glenohumeral joint, including Grashey and axillary views, allowing clinicians to evaluate the congruency of the glenohumeral joint and to assess bone loss on both the glenoid and humeral head.1,10 While large, acute fractures of the glenoid are fairly evident on radiographs, including the Grashey view,11 shoulders with chronic and/or attritional anterior GBL are more difficult to evaluate, and often do not provide the information necessary to guide surgical decision-making.
Computed tomography (CT) of the shoulder has become the most commonly utilized imaging modality in the evaluation of patients with shoulder instability associated with GBL. Standard 2-dimensional (2-D) CT scans of the shoulder are often aligned to the plane of the body as opposed to the plane of the scapula/glenoid, as standard protocols often fail to account for the anterior sagittal rotation of the scapula/glenoid, similar to the disadvantage of standard radiographs. While 3-dimensional (3-D) CT reconstructions eliminate the effect of gantry angles, and thus allow for an en face view of the glenoid, 3-D reconstructions are not always available, and cannot always be measured.12-14 Thus, improved methodology for utilizing standard 2D scans is warranted, as the ability to correctly align the axial CT scan to the axis of the glenoid may allow for more accurate GBL measurements, which will ultimately impact surgical decision-making. Recently, Gross and colleagues15 reported the effect of sagittal rotation of the glenoid on axial measurements of anterior-posterior (AP) glenoid width and glenoid version in normal glenoids, without bone loss, and found that the mean angle of correction needed to align the sagittal plane was 20.1° ± 1.2° of rotation. To the authors’ knowledge, this same methodology has not been applied to patients with clinically meaningful anterior GBL. Given that the average glenoid width in human shoulders is 24.4 mm ± 2.9 mm,16 1 mm of glenoid bone loss (GBL) corresponds to approximately 4% of the glenoid width, and thus even subtle differences in the interpretation of GBL may have substantial clinical implications. Therefore, the purpose of this study is to determine the effect of sagittal rotation of the glenoid on axial AP glenoid width measurements in the setting of clinically significant anterior GBL.
METHODS
This study was approved by Massachusetts General Hospital Institutional Review Board. A retrospective review of consecutive patients with a diagnosis of anterior shoulder instability between 2009 and 2013 was conducted. Inclusion criteria comprised patients with a minimum of 10% anterior GBL, an available CT scan of the affected shoulder, and no history of prior ipsilateral surgeries. Exclusion criteria comprised evidence of degenerative changes to the glenoid and/or humeral head, as well as prior ipsilateral shoulder surgery. Sixty consecutive patients were originally identified as having anterior shoulder instability, and 17 were excluded based on the inclusion/exclusion criteria, leaving 43 patients (43 shoulders) available for inclusion. Shoulder CT scans from all 43 patients were reformatted utilizing open-source DICOM software (OsiriX MD, version 2.5.1 65-bit) multi-planar reconstruction (MPR).
CT PROTOCOL
All patients underwent a standard glenohumeral CT scan using a Siemens Sensation 64 Scanner (Siemens), a 64-detector scanner. Scans were acquired with 0.6 mm of collimation, 140 kV, and 300 mA-seconds. Slice thickness was set to 2 mm. All patient information was de-identified for analysis.
The uncorrected (UNCORR) scans were defined as the default orientation on the scanner. In the UNCORR scans, the axial, coronal, and sagittal views were oriented relative to the scanner gantry table, as opposed to the anatomy of the glenoid. The corrected (CORR) CT scans were aligned in all 3 planes relative to the glenoid face, and thus the cuts were perpendicular to the long axis of the glenoid.15 This resulted in sagittal cuts perpendicular to the 12-o’clock to 6-o’clock axis in the sagittal plane (Figure 1). 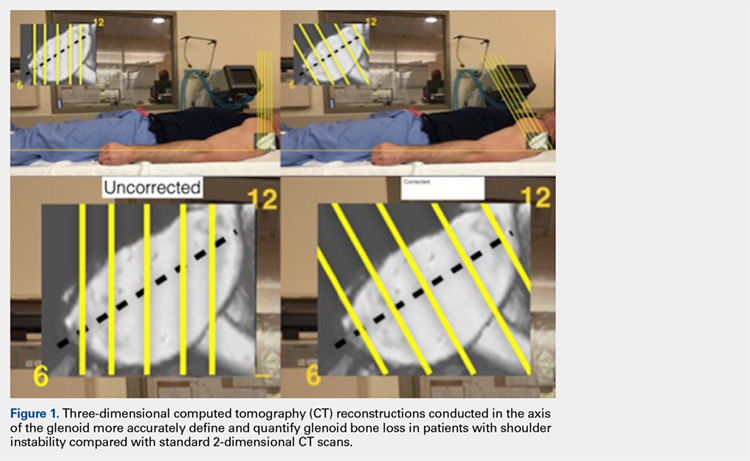
Continue to: In a de-identified fashion...
IMAGE ANALYSIS AND REFORMATTING
In a de-identified fashion, all CT scans were imported and analyzed using open-source Digital Imaging and Communications in Medicine (DICOM) software (OsiriX MD, version 2.5.1 64-bit). By following a previously developed method, CT scans were reformatted using OsiriX MPR. The OsiriX software has an MPR function that allows simultaneous manipulation of 2-D CT scans in 3 orthogonal planes: axial, sagittal, and coronal. In the MPR mode, the alternation of 1 plane directly affects the orientation of the remaining 2 planes. Thus, by using an MPR, one can analyze the impact that a default CT scan performed relative to the gantry of the table, UNCORR, has on the axial images.
First, the en face view was obtained via a 2-step process: alignment of the axial plane to account for the scapular angle, followed by alignment of the coronal plane to adjust for the glenoid inclination.15 These 2 adjustments provided a true en face sagittal glenoid view. The final adjustment step was a sagittal en face rotation of the glenoid such that the superior and inferior glenoid tubercles were placed on the 12-o’clock to 6-o’clock axis (CORR scan). Previous studies have identified a central longitudinal axis that was used in this method to align the supraglenoid tubercle with the 12-o’clock to 6-o’clock axis on the glenoid face.15,17,18 The standard error of mean was 1.21°. This new CORR view resulted in axial cuts through the glenoid that were oriented perpendicular to the 12-o’clock to 6-o’clock axis. The UNCORR and CORR images were assessed in the axial plane at 5 standardized cuts and measured for AP glenoid width by 2 independent observers in a blinded, randomized fashion. When the measured AP width of the UNCORR scan was less than that measured on the CORR scan, the AP width of the glenoid was considered underestimated, and the degree of GBL was considered overestimated (Figure 2). 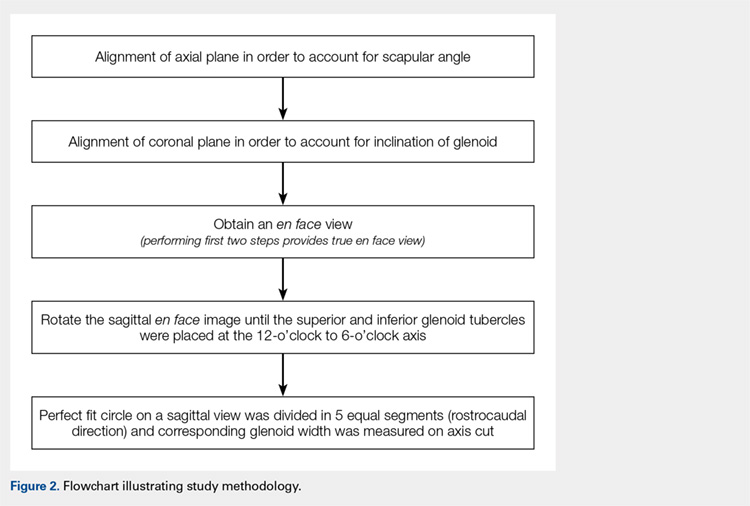
SCAPULAR ANGLE
Scapular angle measurements were performed on the axial view as the angle between a line through the long axis of the body of the scapula, and a line parallel to the CT gantry table.15,19 Subsequently, the axial plane was aligned to the glenoid surface.
CORONAL INCLINATION
Coronal inclination measurements were performed on the sagittal view as the angle between a line tangential to the face of the glenoid and a line perpendicular to the CT gantry table. Positive values represented superior inclination, while negative values represented inferior glenoid inclination.15
SAGITTAL ROTATION
Sagittal rotation measurements were performed using the built-in angle measurement tool in OsiriX in the sagittal plane since the degree of rotation required aligning the long axis of the glenoid to the 12-o’clock to 6-o’clock axis. The amount of rotation was defined as the rotation angle.15
Continue to: Similarly, as described by Gross...
GLENOID WIDTH
Similarly, as described by Gross and colleagues,15 the sagittal en face view was divided via 5 cuts, throughout a superimposed best-fit circle that closely represents the glenoid.9,15,20 For both the UNCORR and CORR, glenoid width (AP distance) was measured on the axial image at the widest point from AP cortex across the glenoid face.
PATIENT GROUPS
Utilizing the en face 3-D CT reconstruction view of the glenoid as the gold standard, patients were placed into 1 of 3 groups according to the degree of anterior GBL measured via the surface method.9,20 The groups were as follows:
I. 10% to 14.9% (N = 12)
II. 15% to 19.9% (N = 16)
III. >20% (N = 15)
STATISTICAL METHODS
Paired t-tests were used to compare all measurements between CORR and UNCORR scans for each of the 5 cuts. A P-value of .05 was used as the threshold for statistical significance in 2-tailed comparisons. Mean and standard errors are presented with standard deviations throughout the study. For interobserver reliability, the measurements between the observers, the intraclass correlation coefficient was calculated. All statistics were performed with SPSS (Version 22).
RESULTS
The study cohort was comprised of 19 left shoulders (44%) and 24 right shoulders (56%), including 36 male patients (84%) and 7 female patients (16%). The average age was 27.8 years (range, 21-40 years). The variability in measured difference, with respect to AP width, was 1.05 mm. The UNCORR CT scans required a mean correction for coronal inclination of 7.0° ± 5.8° (range, -8°-6°). The UNCORR CT scans required a mean correction for scapular angle of 30.2° ± 8.0° (range, 15°-49°). The mean angle of sagittal rotation required to align the glenoid face with the 12-o’clock to 6-o’clock axis was 24.2° ± 5.1 ° (range, 13°-30°). These results are summarized in Table 1.
Table 1. Mean Correction Values Required to Correct the Uncorrected Images to the Corrected Images | |||
Anatomic alignment | Mean (degrees) | Range (degrees) | SD (degrees) |
Scapular angle | 30.2 | 15-49 | 8.0 |
Coronal Inclination | 7.0 | -8-6 | 5.8 |
Sagittal rotation | 24.2 | 13-30 | 5.1 |
For all measurements, the intraclass correlation coefficient for independent observers for all cuts within the 3 groups was r >.900 in all cases.
On an optimized CT scan, over 5 standardized cuts across a best-fit circle of the inferior glenoid, there was a statistically significant absolute mean difference of 12.6% in axial AP glenoid width (2.86 mm ± 2.00 mm, P =.016) when compared with the UNCORR scan. This corresponds to a 3% to 21% error in measurement of the AP width of the glenoid.
Continue to: For the entire cohort...
For the entire cohort of 43 patients, the UNCORR scans underestimated the axial AP width (and thus overestimated GBL) in cut 1 (P =.003), and overestimated the axial AP width (and thus underestimated GBL) in cuts 3 to 5 (P < .001 for all) compared with that of the CORR scans. There was no significant difference between the UNCORR and CORR scans in cut 2 (P = .331).
For groups I (10%-14.9% GBL) and III (>20% GBL), the UNCORR scans underestimated the axial AP width (and thus overestimated anterior GBL) in cuts 1 and 2, while in cuts 3 to 5, the axial AP width was overestimated (GBL was underestimated) (Tables 2, 3). In Group II (15%-19.9% GBL), the axial AP width was underestimated (GBL was overestimated), while in cuts 2 to 5, the axial AP width was overestimated (GBL was underestimated). Overall, AP glenoid width was consistently underestimated in cut 1, the most caudal cut, while AP glenoid width was consistently overestimated in cuts 3 to 5, the more cephalad cuts.
Table 2. Absolute Mean Difference in Axial AP Width (mm) Between Corrected and Uncorrected Images (% difference) | |||||
Cut 1 (Caudal) | Cut 2 | Cut 3 (Center) | Cut 4 | Cut 5 (Cephalad) | |
Group I: 10%-14.9% GBL | 2.4 mm (15.3%) | 1.8 mm (9.0%) | 1.8 mm (7.7%) | 3.0 mm (11.7%) | 4.0 mm (16.8%) |
Group II: 15%-19.9% GBL | 1.8 mm (13.1%) | 1.7 mm (7.9%) | 2.8 mm (10.6%) | 4.1 mm (14.4%) | 4.8 mm (16.9%) |
Group III: >20% | 2.8 mm (16.1%) | 1.9 mm (8.0%) | 2.3 mm (10.3) | 4.4 mm (16.6%) | 5.2 mm (17.0%) |
Abbreviations: AP, anterior-posterior; GBL, glenoid bone loss.
Table 3. Mean AP Glenoid Width Based on CORR and UNCORR Images for the Entire Cohort of 43 Patients | |||||
Axial cut | Mean AP width (mm) | Mean AP width (mm) | Absolute mean AP width difference (mm) | Absolute mean AP width difference (%) | P value |
(Caudal) 1 | 16.6208 | 18.4958 | -1.875 | 14.7768 | .0029565 |
2 | 20.6558 | 21.3166 | -0.661 | 3.6137 | .3310965 |
3 | 24.2583 | 22.3125 | 1.946 | 7.8042 | <.0001 |
4 | 26.1291 | 21.8916 | 4.238 | 15.8449 | <.0001 |
(Rostral) 5 | 26.0875 | 20.4875 | 5.6 | 20.9717 | <.0001 |
Abbreviations: AP, anterior-posterior; CORR, corrected; UNCORR, uncorrected.
DISCUSSION
The principle findings of this study demonstrate that UNCORR conventional 2-D CT scans inaccurately estimate glenoid width as well as inaccurately quantify the degree of anterior GBL. Underestimations of GBL may lead to insufficient treatment of clinically meaningful GBL, thereby increasing the risk of instability recurrence; whereas overestimations of GBL may lead to unnecessary treatment, subjecting patients to increased surgical morbidity. Therefore, the authors recommend correcting the orientation of the scapula in cases wherein clinical decisions are entirely based on 2-D CT, or using alternative methods for quantifying GBL, specifically in the form of 3-D reconstructions.
The use of axial imaging, with CT scans and/or magnetic resonance imaging, is growing in popularity for evaluation of both glenoid anatomy and GBL. Nevertheless, despite our improved ability to critically evaluate the glenoid using these advanced imaging modalities, the images themselves require scrutiny by clinicians to determine if the images accurately depict the true anatomy of the glenoid. As demonstrated by Gross and colleagues,15 conventional 2D CT scan protocols are not optimized to the anatomy of the glenohumeral joint, even in patients without GBL. Due to the alignment of the image relative to the plane of the scapula as opposed to the plane of the glenoid, UNCORR scans result in significantly different measurements of glenoid version (2.0° ± 0.1°) and AP glenoid width (1.2 mm ± 0.42 mm) compared with corrected scans, requiring an average 20.1° ± 1.2° of correction to align the sagittal plane. In the present study involving the patients with GBL, we also found that conventional, UNCORR 2-D CT scan protocols inaccurately estimate glenoid width and the degree of anterior GBL. In particular, AP glenoid width was consistently underestimated in the more caudal cuts, while AP glenoid width was consistently overestimated in the more cephalad cuts. Thus, anterior GBL was overestimated (AP glenoid width was underestimated) in the more caudal cuts, whereas anterior GBL was underestimated in the more cranial cuts (AP glenoid width was overestimated). Given that approximately 1 mm of glenoid bone corresponds to approximately 4% of glenoid width,16 even subtle differences in the interpretation of GBL may lead to gross overestimation/underestimation of bone loss, with significant clinical implications.
In the anterior instability patient population, clinical decision-making is often based on the degree of GBL as determined by advanced imaging modalities. In addition to other patient-specific factors, including age, gender, activity level, type of sport, and number of prior dislocations and/or prior surgeries, the quantity of GBL will often determine which surgical procedure needs to be performed. Typically, patients with >20% to 25% anterior GBL are indicated for a glenoid reconstruction procedure, most commonly via the Latarjet procedure (coracoid transfer).21-27 The Latarjet procedure remains an excellent technique for appropriately indicated patients, with historically good clinical outcomes and low recurrence rates. Complications associated with the Latarjet procedure, however, are not uncommon, including devastating neuropraxia of the axillary and musculocutaneous nerves, and occasionally permanent neurologic deficits.28 Thus, it is critical to avoid overtreating patients with recurrent instability and GBL. As demonstrated by this study, depending on the cranial-to-caudal location on the glenoid, current 2-D CT techniques may underestimate AP glenoid width, resulting in an overestimation of GBL, potentially leading to the decision to proceed with glenoid bone reconstruction when such a procedure is not required. On the contrary, overestimation of AP glenoid width, which occurs in the more cephalad cuts of the glenoid, is perhaps more worrisome, as the resulting underestimation of GBL may lead to inadequate treatment of patients with recurrent instability. Certainly, one of the main risk factors for failed soft tissue shoulder stabilization is a failure to address GBL. If clinical decisions are made based on UNCORR 2-D CT scans, which are often inaccurate with respect to AP glenoid width by an average 2.86 mm ± 2.00 mm (equivalent to 12.6% ± 6.9% GBL) as determined in this study, patients who truly require osseous glenoid reconstructions may be indicated for only soft tissue stabilization, based on the underestimation of GBL.
Continue to: The current gold standard...
The current gold standard for GBL measurement is a perfect-fit circle performed on a 3-D CT scan.22 To that end, it would have been useful to measure the glenoids from this study on 3-D CT scans and compare the data with both UNCORR and CORR measurements. This would have provided a better understanding to what extent the CORR measurements on 2-D scans are relatable with the gold standard. As 3-D CT scans provide a better en face view of the glenoid, more accurate GBL measurements, and ease of 3-D manipulation, they have become more widely used across the country.29,30 Nevertheless, in situations where 3-D imaging is more challenging to obtain because of technology or cost limitations, having a strategy for ensuring proper orientation of 2-D scans would have a substantial impact on clinical decision-making. If such corrections are not made, the inaccuracy of current 2-D scanning protocols justifies the cost 3-D reconstruction protocols. The difference in GBL measurements are critical in cases of increasingly large degrees of GBL, as in these instances, the inferior glenoid becomes more of an inverted-pear shape as opposed to a perfect circle, and differences in CORR and UNCORR images are likely to be more profound.
LIMITATIONS
This study has limitations, such as the relatively small sample size and the selection bias by the reviewers with potential differences in interobserver reliability. Further, minor modifications during the reformatting process may be found with each attempt to manipulate the images and may result in minor, insignificant differences in AP width measurements. Performing 1 or more additional CT scans on the same cohort of patients would have been helpful; however, due to the increased risk of radiation exposure, this was not performed. Performing CT scans on cadaveric specimens with GBL and applying the study methodology would also have been helpful to provide independent verification of our clinical findings; however, specimens were not available for this study. Another limitation of this study is that we did not compare our findings with the findings of glenoid width, and bone loss, as determined using the circle method, which is commonly utilized when 3-D reconstructions are available. In this study, the purpose was to utilize only the 2-D reformatted images, with the assumption that 3-D reconstructions are not always available, and cannot always be measured. To minimize selection bias, the investigators measured the correction effects within groups of patients with similar degrees of GBL (10%-14.9%, 15%-19.9%, and >20%). In addition, not all the selected patients showed degenerative glenoid changes or irregular glenoid shape indicating previous bone augmentation.
CONCLUSIONS
UNCORR 2D CT scans inaccurately estimate glenoid width and the degree of anterior GBL. The clinical implications of these findings are profound and suggest corrected 2D CT scans or 3D reconstruction allow measurements to be taken in the axis of the glenoid to accurately define the anatomy and quantity of anterior GBL in patients with shoulder instability.
1. Cerciello S, Edwards TB, Walch G. Chronic anterior glenohumeral instability in soccer players: results for a series of 28 shoulders treated with the Latarjet procedure. J Orthop Traumatol. 2012;13(4):197-202. doi:10.1007/s10195-012-0201-3.
2. Itoi E, Lee SB, Berglund LJ, Berge LL, An KN. The effect of a glenoid defect on anteroinferior stability of the shoulder after Bankart repair: a cadaveric study. J Bone Joint Surg Am. 2000;82(1):35-46.
3. Bhatia S, Ghodadra NS, Romeo AA, et al. The importance of the recognition and treatment of glenoid bone loss in an athletic population. Sports Health. 2011;3(5):435-440. doi:10.1177/1941738111414126.
4. Lo IK, Parten PM, Burkhart SS. The inverted pear glenoid: an indicator of significant glenoid bone loss. Arthroscopy. 2004;20(2):169-174. doi:10.1016/j.arthro.2003.11.036.
5. Mologne TS, Provencher MT, Menzel KA, Vachon TA, Dewing CB. Arthroscopic stabilization in patients with an inverted pear glenoid: results in patients with bone loss of the anterior glenoid. Am J Sports Med. 2007;35(8):1276-1283. doi:10.1177/0363546507300262.
6. Piasecki DP, Verma NN, Romeo AA, Levine WN, Bach BR Jr, Provencher MT. Glenoid bone deficiency in recurrent anterior shoulder instability: diagnosis and management. J Am Acad Orthop Surg. 2009;17(8):482-493.
7. Provencher MT, Bhatia S, Ghodadra NS, et al. Recurrent shoulder instability: current concepts for evaluation and management of glenoid bone loss. J Bone Joint Surg Am. 2010;92(suppl 2):133-151. doi:10.2106/JBJS.J.00906.
8. Rowe CR, Zarins B, Ciullo JV. Recurrent anterior dislocation of the shoulder after surgical repair. Apparent causes of failure and treatment. J Bone Joint Surg Am. 1984;66(2):159-168.
9. Sugaya H, Moriishi J, Dohi M, Kon Y, Tsuchiya A. Glenoid rim morphology in recurrent anterior glenohumeral instability. J Bone Joint Surg Am. 2003;85-A(5):878-884.
10. Edwards TB, Boulahia A, Walch G. Radiographic analysis of bone defects in chronic anterior shoulder instability. Arthroscopy. 2003;19(7):732-739.
11. Jankauskas L, Rudiger HA, Pfirrmann CW, Jost B, Gerber C. Loss of the sclerotic line of the glenoid on anteroposterior radiographs of the shoulder: a diagnostic sign for an osseous defect of the anterior glenoid rim. J Shoulder Elbow Surg. 2010;19(1):151-156. doi:10.1016/j.jse.2009.04.013.
12. Altan E, Ozbaydar MU, Tonbul M, Yalcin L. Comparison of two different measurement methods to determine glenoid bone defects: area or width? J Shoulder Elbow Surg. 2014;23(8):1215-1222. doi:10.1016/j.jse.2013.11.029.
13. Bishop JY, Jones GL, Rerko MA, Donaldson C, Group MS. 3-D CT is the most reliable imaging modality when quantifying glenoid bone loss. Clin Orthop Relat Res. 2013;471(4):1251-1256. doi:10.1007/s11999-012-2607-x.
14. Chuang TY, Adams CR, Burkhart SS. Use of preoperative three-dimensional computed tomography to quantify glenoid bone loss in shoulder instability. Arthroscopy. 2008; 24(4):376-382. doi:10.1016/j.arthro.2007.10.008.
15. Gross DJ, Golijanin P, Dumont GD, et al. The effect of sagittal rotation of the glenoid on axial glenoid width and glenoid version in computed tomography scan imaging. J Shoulder Elbow Surg. 2016;25(1):61-68. doi:10.1016/j.jse.2015.06.017.
16. Lenart BA, Freedman R, Van Thiel GS, et al. Magnetic resonance imaging evaluation of normal glenoid length and width: an anatomic study. Arthroscopy. 2014;30(8):915-920. doi:10.1016/j.arthro.2014.03.006.
17. Bois AJ, Fening SD, Polster J, Jones MH, Miniaci A. Quantifying glenoid bone loss in anterior shoulder instability: reliability and accuracy of 2-dimensional and 3-dimensional computed tomography measurement techniques. Am J Sports Med. 2012;40(11):2569-2577. doi:10.1177/0363546512458247.
18. Griffith JF, Antonio GE, Tong CW, Ming CK. Anterior shoulder dislocation: quantification of glenoid bone loss with CT. AJR Am J Roentgenol. 2003;180(5):1423-1430. doi:10.2214/ajr.180.5.1801423.
19. Hoenecke HR Jr, Hermida JC, Flores-Hernandez C, D'Lima DD. Accuracy of CT-based measurements of glenoid version for total shoulder arthroplasty. J Shoulder Elbow Surg. 2010;19(2):166-171. doi:10.1016/j.jse.2009.08.009.
20. Huijsmans PE, de Witte PB, de Villiers RV, et al. Recurrent anterior shoulder instability: accuracy of estimations of glenoid bone loss with computed tomography is insufficient for therapeutic decision-making. Skeletal Radiol. 2011;40(10):1329-1334. doi:10.1007/s00256-011-1184-5.
21. Bhatia S, Frank RM, Ghodadra NS, et al. The outcomes and surgical techniques of the latarjet procedure. Arthroscopy. 2014;30(2):227-235. doi:10.1016/j.arthro.2013.10.013.
22. Cunningham G, Benchouk S, Kherad O, Ladermann A. Comparison of arthroscopic and open Latarjet with a learning curve analysis. Knee Surg Sports Traumatol Arthrosc. 2015;24(2):540-545. doi:10.1007/s00167-015-3910-3.
23. Fedorka CJ, Mulcahey MK. Recurrent anterior shoulder instability: a review of the Latarjet procedure and its postoperative rehabilitation. Phys Sportsmed. 2015;43(1):73-79. doi:10.1080/00913847.2015.1005543.
24. Flinkkila T, Sirniö K. Open Latarjet procedure for failed arthroscopic Bankart repair. Orthop Traumatol Surg Res. 2015;101(1):35-38. doi:10.1016/j.otsr.2014.11.005.
25. Hovelius L, Sandström B, Saebö M. One hundred eighteen Bristow-Latarjet repairs for recurrent anterior dislocation of the shoulder prospectively followed for fifteen years: study II-the evolution of dislocation arthropathy. J Shoulder Elbow Surg. 2006;15(3):279-289. doi:10.1016/j.jse.2005.09.014.
26. Hovelius L, Sandström B, Sundgren K, Saebö M. One hundred eighteen Bristow-Latarjet repairs for recurrent anterior dislocation of the shoulder prospectively followed for fifteen years: study I--clinical results. J Shoulder Elbow Surg. 2004;13(5):509-516. doi:10.1016/S1058274604000916.
27. Hovelius L, Vikerfors O, Olofsson A, Svensson O, Rahme H. Bristow-Latarjet and Bankart: a comparative study of shoulder stabilization in 185 shoulders during a seventeen-year follow-up. J Shoulder Elbow Surg. 2011;20(7):1095-1101. doi:10.1016/j.jse.2011.02.005.
28. Gupta A, Delaney R, Petkin K, Lafosse L. Complications of the Latarjet procedure. Curr Rev Musculoskelet Med. 2015;8(1):59-66. doi:10.1007/s12178-015-9258-y.
29. Kwon YW, Powell KA, Yum JK, Brems JJ, Iannotti JP. Use of three-dimensional computed tomography for the analysis of the glenoid anatomy. J Shoulder Elbow Surg. 2005;14(1):85-90. doi:10.1016/j.jse.2004.04.011.
30. Saito H, Itoi E, Sugaya H, Minagawa H, Yamamoto N, Tuoheti Y. Location of the glenoid defect in shoulders with recurrent anterior dislocation. Am J Sports Med. 2005;33(6):889-893. doi:10.1177/0363546504271521.
ABSTRACT
Standard 2-dimensional (2-D) computed tomography (CT) scans of the shoulder are often aligned to the plane of the body as opposed to the plane of the scapula, which may challenge the ability to accurately measure glenoid width and glenoid bone loss (GBL). The purpose of this study is to determine the effect of sagittal rotation of the glenoid on axial anterior-posterior (AP) glenoid width measurements in the setting of anterior GBL.
Forty-three CT scans from consecutive patients with anterior GBL (minimum 10%) were reformatted utilizing open-source DICOM software (OsiriX MD). Patients were grouped according to extent of GBL: I, 10% to 14.9% (N = 12); II, 15% to 19.9% (N = 16); and III, >20% (N = 15). The uncorrected (UNCORR) and corrected (CORR) images were assessed in the axial plane at 5 standardized cuts and measured for AP glenoid width.
For groups I and III, UNCORR scans underestimated axial AP width (and thus overestimated anterior GBL) in cuts 1 and 2, while in cuts 3 to 5, the axial AP width was overestimated (GBL was underestimated). In Group II, axial AP width was underestimated (GBL was overestimated), while in cuts 2 to 5, the axial AP width was overestimated (GBL was underestimated). Overall, AP glenoid width was consistently underestimated in cut 1, the most caudal cut; while AP glenoid width was consistently overestimated in cuts 3 to 5, the more cephalad cuts.
UNCORR 2-D CT scans inaccurately estimated glenoid width and the degree of anterior GBL. This data suggests that corrected 2D CT scans or a 3-dimensional (3-D) reconstruction can help in accurately defining the anterior GBL in patients with shoulder instability.
The treatment of glenohumeral instability has substantially evolved over the past several decades. The understanding of glenoid bone loss (GBL), in particular, has advanced to such a level that we utilize the quantification of GBL for surgical decision-making. Unrecognized and/or untreated GBL is associated with recurrent instability, pain, and disability. Controversy exists, however, regarding the precise amount of anterior GBL that is significant enough to warrant surgical treatment. While historically, 25%1,2 of anterior GBL was thought to be the critical number required to warrant osseous augmentation, studies that are more recent have highlighted the need to perform osseous glenoid reconstruction with lesser degrees of GBL, particularly in the contact athlete.3-9 As small differences in the amount of GBL can change surgical decision-making from an all-soft tissue repair to an osseous reconstruction, it is paramount that we have accurate, valid, and reproducible methods for calculating GBL.
Continue to: Historically, plain radiographs...
Historically, plain radiographs have been the mainstay for evaluating the glenohumeral joint, including Grashey and axillary views, allowing clinicians to evaluate the congruency of the glenohumeral joint and to assess bone loss on both the glenoid and humeral head.1,10 While large, acute fractures of the glenoid are fairly evident on radiographs, including the Grashey view,11 shoulders with chronic and/or attritional anterior GBL are more difficult to evaluate, and often do not provide the information necessary to guide surgical decision-making.
Computed tomography (CT) of the shoulder has become the most commonly utilized imaging modality in the evaluation of patients with shoulder instability associated with GBL. Standard 2-dimensional (2-D) CT scans of the shoulder are often aligned to the plane of the body as opposed to the plane of the scapula/glenoid, as standard protocols often fail to account for the anterior sagittal rotation of the scapula/glenoid, similar to the disadvantage of standard radiographs. While 3-dimensional (3-D) CT reconstructions eliminate the effect of gantry angles, and thus allow for an en face view of the glenoid, 3-D reconstructions are not always available, and cannot always be measured.12-14 Thus, improved methodology for utilizing standard 2D scans is warranted, as the ability to correctly align the axial CT scan to the axis of the glenoid may allow for more accurate GBL measurements, which will ultimately impact surgical decision-making. Recently, Gross and colleagues15 reported the effect of sagittal rotation of the glenoid on axial measurements of anterior-posterior (AP) glenoid width and glenoid version in normal glenoids, without bone loss, and found that the mean angle of correction needed to align the sagittal plane was 20.1° ± 1.2° of rotation. To the authors’ knowledge, this same methodology has not been applied to patients with clinically meaningful anterior GBL. Given that the average glenoid width in human shoulders is 24.4 mm ± 2.9 mm,16 1 mm of glenoid bone loss (GBL) corresponds to approximately 4% of the glenoid width, and thus even subtle differences in the interpretation of GBL may have substantial clinical implications. Therefore, the purpose of this study is to determine the effect of sagittal rotation of the glenoid on axial AP glenoid width measurements in the setting of clinically significant anterior GBL.
METHODS
This study was approved by Massachusetts General Hospital Institutional Review Board. A retrospective review of consecutive patients with a diagnosis of anterior shoulder instability between 2009 and 2013 was conducted. Inclusion criteria comprised patients with a minimum of 10% anterior GBL, an available CT scan of the affected shoulder, and no history of prior ipsilateral surgeries. Exclusion criteria comprised evidence of degenerative changes to the glenoid and/or humeral head, as well as prior ipsilateral shoulder surgery. Sixty consecutive patients were originally identified as having anterior shoulder instability, and 17 were excluded based on the inclusion/exclusion criteria, leaving 43 patients (43 shoulders) available for inclusion. Shoulder CT scans from all 43 patients were reformatted utilizing open-source DICOM software (OsiriX MD, version 2.5.1 65-bit) multi-planar reconstruction (MPR).
CT PROTOCOL
All patients underwent a standard glenohumeral CT scan using a Siemens Sensation 64 Scanner (Siemens), a 64-detector scanner. Scans were acquired with 0.6 mm of collimation, 140 kV, and 300 mA-seconds. Slice thickness was set to 2 mm. All patient information was de-identified for analysis.
The uncorrected (UNCORR) scans were defined as the default orientation on the scanner. In the UNCORR scans, the axial, coronal, and sagittal views were oriented relative to the scanner gantry table, as opposed to the anatomy of the glenoid. The corrected (CORR) CT scans were aligned in all 3 planes relative to the glenoid face, and thus the cuts were perpendicular to the long axis of the glenoid.15 This resulted in sagittal cuts perpendicular to the 12-o’clock to 6-o’clock axis in the sagittal plane (Figure 1).
Continue to: In a de-identified fashion...
IMAGE ANALYSIS AND REFORMATTING
In a de-identified fashion, all CT scans were imported and analyzed using open-source Digital Imaging and Communications in Medicine (DICOM) software (OsiriX MD, version 2.5.1 64-bit). By following a previously developed method, CT scans were reformatted using OsiriX MPR. The OsiriX software has an MPR function that allows simultaneous manipulation of 2-D CT scans in 3 orthogonal planes: axial, sagittal, and coronal. In the MPR mode, the alternation of 1 plane directly affects the orientation of the remaining 2 planes. Thus, by using an MPR, one can analyze the impact that a default CT scan performed relative to the gantry of the table, UNCORR, has on the axial images.
First, the en face view was obtained via a 2-step process: alignment of the axial plane to account for the scapular angle, followed by alignment of the coronal plane to adjust for the glenoid inclination.15 These 2 adjustments provided a true en face sagittal glenoid view. The final adjustment step was a sagittal en face rotation of the glenoid such that the superior and inferior glenoid tubercles were placed on the 12-o’clock to 6-o’clock axis (CORR scan). Previous studies have identified a central longitudinal axis that was used in this method to align the supraglenoid tubercle with the 12-o’clock to 6-o’clock axis on the glenoid face.15,17,18 The standard error of mean was 1.21°. This new CORR view resulted in axial cuts through the glenoid that were oriented perpendicular to the 12-o’clock to 6-o’clock axis. The UNCORR and CORR images were assessed in the axial plane at 5 standardized cuts and measured for AP glenoid width by 2 independent observers in a blinded, randomized fashion. When the measured AP width of the UNCORR scan was less than that measured on the CORR scan, the AP width of the glenoid was considered underestimated, and the degree of GBL was considered overestimated (Figure 2).
SCAPULAR ANGLE
Scapular angle measurements were performed on the axial view as the angle between a line through the long axis of the body of the scapula, and a line parallel to the CT gantry table.15,19 Subsequently, the axial plane was aligned to the glenoid surface.
CORONAL INCLINATION
Coronal inclination measurements were performed on the sagittal view as the angle between a line tangential to the face of the glenoid and a line perpendicular to the CT gantry table. Positive values represented superior inclination, while negative values represented inferior glenoid inclination.15
SAGITTAL ROTATION
Sagittal rotation measurements were performed using the built-in angle measurement tool in OsiriX in the sagittal plane since the degree of rotation required aligning the long axis of the glenoid to the 12-o’clock to 6-o’clock axis. The amount of rotation was defined as the rotation angle.15
Continue to: Similarly, as described by Gross...
GLENOID WIDTH
Similarly, as described by Gross and colleagues,15 the sagittal en face view was divided via 5 cuts, throughout a superimposed best-fit circle that closely represents the glenoid.9,15,20 For both the UNCORR and CORR, glenoid width (AP distance) was measured on the axial image at the widest point from AP cortex across the glenoid face.
PATIENT GROUPS
Utilizing the en face 3-D CT reconstruction view of the glenoid as the gold standard, patients were placed into 1 of 3 groups according to the degree of anterior GBL measured via the surface method.9,20 The groups were as follows:
I. 10% to 14.9% (N = 12)
II. 15% to 19.9% (N = 16)
III. >20% (N = 15)
STATISTICAL METHODS
Paired t-tests were used to compare all measurements between CORR and UNCORR scans for each of the 5 cuts. A P-value of .05 was used as the threshold for statistical significance in 2-tailed comparisons. Mean and standard errors are presented with standard deviations throughout the study. For interobserver reliability, the measurements between the observers, the intraclass correlation coefficient was calculated. All statistics were performed with SPSS (Version 22).
RESULTS
The study cohort was comprised of 19 left shoulders (44%) and 24 right shoulders (56%), including 36 male patients (84%) and 7 female patients (16%). The average age was 27.8 years (range, 21-40 years). The variability in measured difference, with respect to AP width, was 1.05 mm. The UNCORR CT scans required a mean correction for coronal inclination of 7.0° ± 5.8° (range, -8°-6°). The UNCORR CT scans required a mean correction for scapular angle of 30.2° ± 8.0° (range, 15°-49°). The mean angle of sagittal rotation required to align the glenoid face with the 12-o’clock to 6-o’clock axis was 24.2° ± 5.1 ° (range, 13°-30°). These results are summarized in Table 1.
Table 1. Mean Correction Values Required to Correct the Uncorrected Images to the Corrected Images | |||
Anatomic alignment | Mean (degrees) | Range (degrees) | SD (degrees) |
Scapular angle | 30.2 | 15-49 | 8.0 |
Coronal Inclination | 7.0 | -8-6 | 5.8 |
Sagittal rotation | 24.2 | 13-30 | 5.1 |
For all measurements, the intraclass correlation coefficient for independent observers for all cuts within the 3 groups was r >.900 in all cases.
On an optimized CT scan, over 5 standardized cuts across a best-fit circle of the inferior glenoid, there was a statistically significant absolute mean difference of 12.6% in axial AP glenoid width (2.86 mm ± 2.00 mm, P =.016) when compared with the UNCORR scan. This corresponds to a 3% to 21% error in measurement of the AP width of the glenoid.
Continue to: For the entire cohort...
For the entire cohort of 43 patients, the UNCORR scans underestimated the axial AP width (and thus overestimated GBL) in cut 1 (P =.003), and overestimated the axial AP width (and thus underestimated GBL) in cuts 3 to 5 (P < .001 for all) compared with that of the CORR scans. There was no significant difference between the UNCORR and CORR scans in cut 2 (P = .331).
For groups I (10%-14.9% GBL) and III (>20% GBL), the UNCORR scans underestimated the axial AP width (and thus overestimated anterior GBL) in cuts 1 and 2, while in cuts 3 to 5, the axial AP width was overestimated (GBL was underestimated) (Tables 2, 3). In Group II (15%-19.9% GBL), the axial AP width was underestimated (GBL was overestimated), while in cuts 2 to 5, the axial AP width was overestimated (GBL was underestimated). Overall, AP glenoid width was consistently underestimated in cut 1, the most caudal cut, while AP glenoid width was consistently overestimated in cuts 3 to 5, the more cephalad cuts.
Table 2. Absolute Mean Difference in Axial AP Width (mm) Between Corrected and Uncorrected Images (% difference) | |||||
Cut 1 (Caudal) | Cut 2 | Cut 3 (Center) | Cut 4 | Cut 5 (Cephalad) | |
Group I: 10%-14.9% GBL | 2.4 mm (15.3%) | 1.8 mm (9.0%) | 1.8 mm (7.7%) | 3.0 mm (11.7%) | 4.0 mm (16.8%) |
Group II: 15%-19.9% GBL | 1.8 mm (13.1%) | 1.7 mm (7.9%) | 2.8 mm (10.6%) | 4.1 mm (14.4%) | 4.8 mm (16.9%) |
Group III: >20% | 2.8 mm (16.1%) | 1.9 mm (8.0%) | 2.3 mm (10.3) | 4.4 mm (16.6%) | 5.2 mm (17.0%) |
Abbreviations: AP, anterior-posterior; GBL, glenoid bone loss.
Table 3. Mean AP Glenoid Width Based on CORR and UNCORR Images for the Entire Cohort of 43 Patients | |||||
Axial cut | Mean AP width (mm) | Mean AP width (mm) | Absolute mean AP width difference (mm) | Absolute mean AP width difference (%) | P value |
(Caudal) 1 | 16.6208 | 18.4958 | -1.875 | 14.7768 | .0029565 |
2 | 20.6558 | 21.3166 | -0.661 | 3.6137 | .3310965 |
3 | 24.2583 | 22.3125 | 1.946 | 7.8042 | <.0001 |
4 | 26.1291 | 21.8916 | 4.238 | 15.8449 | <.0001 |
(Rostral) 5 | 26.0875 | 20.4875 | 5.6 | 20.9717 | <.0001 |
Abbreviations: AP, anterior-posterior; CORR, corrected; UNCORR, uncorrected.
DISCUSSION
The principle findings of this study demonstrate that UNCORR conventional 2-D CT scans inaccurately estimate glenoid width as well as inaccurately quantify the degree of anterior GBL. Underestimations of GBL may lead to insufficient treatment of clinically meaningful GBL, thereby increasing the risk of instability recurrence; whereas overestimations of GBL may lead to unnecessary treatment, subjecting patients to increased surgical morbidity. Therefore, the authors recommend correcting the orientation of the scapula in cases wherein clinical decisions are entirely based on 2-D CT, or using alternative methods for quantifying GBL, specifically in the form of 3-D reconstructions.
The use of axial imaging, with CT scans and/or magnetic resonance imaging, is growing in popularity for evaluation of both glenoid anatomy and GBL. Nevertheless, despite our improved ability to critically evaluate the glenoid using these advanced imaging modalities, the images themselves require scrutiny by clinicians to determine if the images accurately depict the true anatomy of the glenoid. As demonstrated by Gross and colleagues,15 conventional 2D CT scan protocols are not optimized to the anatomy of the glenohumeral joint, even in patients without GBL. Due to the alignment of the image relative to the plane of the scapula as opposed to the plane of the glenoid, UNCORR scans result in significantly different measurements of glenoid version (2.0° ± 0.1°) and AP glenoid width (1.2 mm ± 0.42 mm) compared with corrected scans, requiring an average 20.1° ± 1.2° of correction to align the sagittal plane. In the present study involving the patients with GBL, we also found that conventional, UNCORR 2-D CT scan protocols inaccurately estimate glenoid width and the degree of anterior GBL. In particular, AP glenoid width was consistently underestimated in the more caudal cuts, while AP glenoid width was consistently overestimated in the more cephalad cuts. Thus, anterior GBL was overestimated (AP glenoid width was underestimated) in the more caudal cuts, whereas anterior GBL was underestimated in the more cranial cuts (AP glenoid width was overestimated). Given that approximately 1 mm of glenoid bone corresponds to approximately 4% of glenoid width,16 even subtle differences in the interpretation of GBL may lead to gross overestimation/underestimation of bone loss, with significant clinical implications.
In the anterior instability patient population, clinical decision-making is often based on the degree of GBL as determined by advanced imaging modalities. In addition to other patient-specific factors, including age, gender, activity level, type of sport, and number of prior dislocations and/or prior surgeries, the quantity of GBL will often determine which surgical procedure needs to be performed. Typically, patients with >20% to 25% anterior GBL are indicated for a glenoid reconstruction procedure, most commonly via the Latarjet procedure (coracoid transfer).21-27 The Latarjet procedure remains an excellent technique for appropriately indicated patients, with historically good clinical outcomes and low recurrence rates. Complications associated with the Latarjet procedure, however, are not uncommon, including devastating neuropraxia of the axillary and musculocutaneous nerves, and occasionally permanent neurologic deficits.28 Thus, it is critical to avoid overtreating patients with recurrent instability and GBL. As demonstrated by this study, depending on the cranial-to-caudal location on the glenoid, current 2-D CT techniques may underestimate AP glenoid width, resulting in an overestimation of GBL, potentially leading to the decision to proceed with glenoid bone reconstruction when such a procedure is not required. On the contrary, overestimation of AP glenoid width, which occurs in the more cephalad cuts of the glenoid, is perhaps more worrisome, as the resulting underestimation of GBL may lead to inadequate treatment of patients with recurrent instability. Certainly, one of the main risk factors for failed soft tissue shoulder stabilization is a failure to address GBL. If clinical decisions are made based on UNCORR 2-D CT scans, which are often inaccurate with respect to AP glenoid width by an average 2.86 mm ± 2.00 mm (equivalent to 12.6% ± 6.9% GBL) as determined in this study, patients who truly require osseous glenoid reconstructions may be indicated for only soft tissue stabilization, based on the underestimation of GBL.
Continue to: The current gold standard...
The current gold standard for GBL measurement is a perfect-fit circle performed on a 3-D CT scan.22 To that end, it would have been useful to measure the glenoids from this study on 3-D CT scans and compare the data with both UNCORR and CORR measurements. This would have provided a better understanding to what extent the CORR measurements on 2-D scans are relatable with the gold standard. As 3-D CT scans provide a better en face view of the glenoid, more accurate GBL measurements, and ease of 3-D manipulation, they have become more widely used across the country.29,30 Nevertheless, in situations where 3-D imaging is more challenging to obtain because of technology or cost limitations, having a strategy for ensuring proper orientation of 2-D scans would have a substantial impact on clinical decision-making. If such corrections are not made, the inaccuracy of current 2-D scanning protocols justifies the cost 3-D reconstruction protocols. The difference in GBL measurements are critical in cases of increasingly large degrees of GBL, as in these instances, the inferior glenoid becomes more of an inverted-pear shape as opposed to a perfect circle, and differences in CORR and UNCORR images are likely to be more profound.
LIMITATIONS
This study has limitations, such as the relatively small sample size and the selection bias by the reviewers with potential differences in interobserver reliability. Further, minor modifications during the reformatting process may be found with each attempt to manipulate the images and may result in minor, insignificant differences in AP width measurements. Performing 1 or more additional CT scans on the same cohort of patients would have been helpful; however, due to the increased risk of radiation exposure, this was not performed. Performing CT scans on cadaveric specimens with GBL and applying the study methodology would also have been helpful to provide independent verification of our clinical findings; however, specimens were not available for this study. Another limitation of this study is that we did not compare our findings with the findings of glenoid width, and bone loss, as determined using the circle method, which is commonly utilized when 3-D reconstructions are available. In this study, the purpose was to utilize only the 2-D reformatted images, with the assumption that 3-D reconstructions are not always available, and cannot always be measured. To minimize selection bias, the investigators measured the correction effects within groups of patients with similar degrees of GBL (10%-14.9%, 15%-19.9%, and >20%). In addition, not all the selected patients showed degenerative glenoid changes or irregular glenoid shape indicating previous bone augmentation.
CONCLUSIONS
UNCORR 2D CT scans inaccurately estimate glenoid width and the degree of anterior GBL. The clinical implications of these findings are profound and suggest corrected 2D CT scans or 3D reconstruction allow measurements to be taken in the axis of the glenoid to accurately define the anatomy and quantity of anterior GBL in patients with shoulder instability.
1. Cerciello S, Edwards TB, Walch G. Chronic anterior glenohumeral instability in soccer players: results for a series of 28 shoulders treated with the Latarjet procedure. J Orthop Traumatol. 2012;13(4):197-202. doi:10.1007/s10195-012-0201-3.
2. Itoi E, Lee SB, Berglund LJ, Berge LL, An KN. The effect of a glenoid defect on anteroinferior stability of the shoulder after Bankart repair: a cadaveric study. J Bone Joint Surg Am. 2000;82(1):35-46.
3. Bhatia S, Ghodadra NS, Romeo AA, et al. The importance of the recognition and treatment of glenoid bone loss in an athletic population. Sports Health. 2011;3(5):435-440. doi:10.1177/1941738111414126.
4. Lo IK, Parten PM, Burkhart SS. The inverted pear glenoid: an indicator of significant glenoid bone loss. Arthroscopy. 2004;20(2):169-174. doi:10.1016/j.arthro.2003.11.036.
5. Mologne TS, Provencher MT, Menzel KA, Vachon TA, Dewing CB. Arthroscopic stabilization in patients with an inverted pear glenoid: results in patients with bone loss of the anterior glenoid. Am J Sports Med. 2007;35(8):1276-1283. doi:10.1177/0363546507300262.
6. Piasecki DP, Verma NN, Romeo AA, Levine WN, Bach BR Jr, Provencher MT. Glenoid bone deficiency in recurrent anterior shoulder instability: diagnosis and management. J Am Acad Orthop Surg. 2009;17(8):482-493.
7. Provencher MT, Bhatia S, Ghodadra NS, et al. Recurrent shoulder instability: current concepts for evaluation and management of glenoid bone loss. J Bone Joint Surg Am. 2010;92(suppl 2):133-151. doi:10.2106/JBJS.J.00906.
8. Rowe CR, Zarins B, Ciullo JV. Recurrent anterior dislocation of the shoulder after surgical repair. Apparent causes of failure and treatment. J Bone Joint Surg Am. 1984;66(2):159-168.
9. Sugaya H, Moriishi J, Dohi M, Kon Y, Tsuchiya A. Glenoid rim morphology in recurrent anterior glenohumeral instability. J Bone Joint Surg Am. 2003;85-A(5):878-884.
10. Edwards TB, Boulahia A, Walch G. Radiographic analysis of bone defects in chronic anterior shoulder instability. Arthroscopy. 2003;19(7):732-739.
11. Jankauskas L, Rudiger HA, Pfirrmann CW, Jost B, Gerber C. Loss of the sclerotic line of the glenoid on anteroposterior radiographs of the shoulder: a diagnostic sign for an osseous defect of the anterior glenoid rim. J Shoulder Elbow Surg. 2010;19(1):151-156. doi:10.1016/j.jse.2009.04.013.
12. Altan E, Ozbaydar MU, Tonbul M, Yalcin L. Comparison of two different measurement methods to determine glenoid bone defects: area or width? J Shoulder Elbow Surg. 2014;23(8):1215-1222. doi:10.1016/j.jse.2013.11.029.
13. Bishop JY, Jones GL, Rerko MA, Donaldson C, Group MS. 3-D CT is the most reliable imaging modality when quantifying glenoid bone loss. Clin Orthop Relat Res. 2013;471(4):1251-1256. doi:10.1007/s11999-012-2607-x.
14. Chuang TY, Adams CR, Burkhart SS. Use of preoperative three-dimensional computed tomography to quantify glenoid bone loss in shoulder instability. Arthroscopy. 2008; 24(4):376-382. doi:10.1016/j.arthro.2007.10.008.
15. Gross DJ, Golijanin P, Dumont GD, et al. The effect of sagittal rotation of the glenoid on axial glenoid width and glenoid version in computed tomography scan imaging. J Shoulder Elbow Surg. 2016;25(1):61-68. doi:10.1016/j.jse.2015.06.017.
16. Lenart BA, Freedman R, Van Thiel GS, et al. Magnetic resonance imaging evaluation of normal glenoid length and width: an anatomic study. Arthroscopy. 2014;30(8):915-920. doi:10.1016/j.arthro.2014.03.006.
17. Bois AJ, Fening SD, Polster J, Jones MH, Miniaci A. Quantifying glenoid bone loss in anterior shoulder instability: reliability and accuracy of 2-dimensional and 3-dimensional computed tomography measurement techniques. Am J Sports Med. 2012;40(11):2569-2577. doi:10.1177/0363546512458247.
18. Griffith JF, Antonio GE, Tong CW, Ming CK. Anterior shoulder dislocation: quantification of glenoid bone loss with CT. AJR Am J Roentgenol. 2003;180(5):1423-1430. doi:10.2214/ajr.180.5.1801423.
19. Hoenecke HR Jr, Hermida JC, Flores-Hernandez C, D'Lima DD. Accuracy of CT-based measurements of glenoid version for total shoulder arthroplasty. J Shoulder Elbow Surg. 2010;19(2):166-171. doi:10.1016/j.jse.2009.08.009.
20. Huijsmans PE, de Witte PB, de Villiers RV, et al. Recurrent anterior shoulder instability: accuracy of estimations of glenoid bone loss with computed tomography is insufficient for therapeutic decision-making. Skeletal Radiol. 2011;40(10):1329-1334. doi:10.1007/s00256-011-1184-5.
21. Bhatia S, Frank RM, Ghodadra NS, et al. The outcomes and surgical techniques of the latarjet procedure. Arthroscopy. 2014;30(2):227-235. doi:10.1016/j.arthro.2013.10.013.
22. Cunningham G, Benchouk S, Kherad O, Ladermann A. Comparison of arthroscopic and open Latarjet with a learning curve analysis. Knee Surg Sports Traumatol Arthrosc. 2015;24(2):540-545. doi:10.1007/s00167-015-3910-3.
23. Fedorka CJ, Mulcahey MK. Recurrent anterior shoulder instability: a review of the Latarjet procedure and its postoperative rehabilitation. Phys Sportsmed. 2015;43(1):73-79. doi:10.1080/00913847.2015.1005543.
24. Flinkkila T, Sirniö K. Open Latarjet procedure for failed arthroscopic Bankart repair. Orthop Traumatol Surg Res. 2015;101(1):35-38. doi:10.1016/j.otsr.2014.11.005.
25. Hovelius L, Sandström B, Saebö M. One hundred eighteen Bristow-Latarjet repairs for recurrent anterior dislocation of the shoulder prospectively followed for fifteen years: study II-the evolution of dislocation arthropathy. J Shoulder Elbow Surg. 2006;15(3):279-289. doi:10.1016/j.jse.2005.09.014.
26. Hovelius L, Sandström B, Sundgren K, Saebö M. One hundred eighteen Bristow-Latarjet repairs for recurrent anterior dislocation of the shoulder prospectively followed for fifteen years: study I--clinical results. J Shoulder Elbow Surg. 2004;13(5):509-516. doi:10.1016/S1058274604000916.
27. Hovelius L, Vikerfors O, Olofsson A, Svensson O, Rahme H. Bristow-Latarjet and Bankart: a comparative study of shoulder stabilization in 185 shoulders during a seventeen-year follow-up. J Shoulder Elbow Surg. 2011;20(7):1095-1101. doi:10.1016/j.jse.2011.02.005.
28. Gupta A, Delaney R, Petkin K, Lafosse L. Complications of the Latarjet procedure. Curr Rev Musculoskelet Med. 2015;8(1):59-66. doi:10.1007/s12178-015-9258-y.
29. Kwon YW, Powell KA, Yum JK, Brems JJ, Iannotti JP. Use of three-dimensional computed tomography for the analysis of the glenoid anatomy. J Shoulder Elbow Surg. 2005;14(1):85-90. doi:10.1016/j.jse.2004.04.011.
30. Saito H, Itoi E, Sugaya H, Minagawa H, Yamamoto N, Tuoheti Y. Location of the glenoid defect in shoulders with recurrent anterior dislocation. Am J Sports Med. 2005;33(6):889-893. doi:10.1177/0363546504271521.
TAKE-HOME POINTS
- Standard 2-D CT scans of the shoulder are often aligned to the plane of the body as opposed to the plane of the scapula, which may challenge the ability to accurately measure glenoid width and GBL.
- Underestimations of GBL may lead to insufficient treatment of clinically meaningful GBL, thereby increasing the risk of instability recurrence; whereas overestimations of GBL may lead to unnecessary treatment, subjecting patients to increased surgical morbidity.
- AP glenoid width was consistently underestimated in uncorrected axial cut 1, the most caudal cut.
- AP glenoid width was consistently overestimated in uncorrected axial cuts 3 to 5, the more cephalad cuts.
- CORR 2-D CT scans or a 3-D reconstruction can help in accurately defining the anterior GBL in patients with shoulder instability.