User login
Real-World Evidence for Safety and Effectiveness of Repeated Courses of Hyaluronic Acid Injections on the Time to Knee Replacement Surgery
ABSTRACT
Osteoarthritis (OA) of the knee is a top cause of disability among the elderly. Total knee replacement (TKR) has been available as an effective and definite surgical method to treat severe OA of the knee. However, TKR is a significant procedure with potential risk for serious complications and high costs. Alternative lower risk therapies that can delay or obviate TKR are valuable to those who are poor candidates for surgery or wish to avoid TKR as long as possible. Given the chondroprotective effects of hyaluronic acid (HA) injections, they are a safe and effective treatment to improve pain, function, and longevity of the knee. Thus, HA features the potential to delay or obviate TKR.
We aim to study the safety and effectiveness of repeated courses of HA on the time to TKR over a 3-year period using data from a large US health plan administrative claims database.
Retrospective analyses were conducted by identifying knee OA patients during the selection period (2007-2010). The follow-up period was 36 months, post-index date of initial HA injection. Procedural outcomes and adverse events of interest were tabulated and analyzed. A Cox proportional hazards model was used to model the risk of TKR.
A total of 50,389 patients who received HA for treatment of knee OA and met the study inclusion criteria were analyzed. Successive courses of HA showed a good safety profile and led to high proportions of patients without TKR 3 years after treatment initiation. Multivariate statistical modeling showed that multiple courses of HA injections significantly decreased the rates of TKR (95.0% without TKR for ≥5 courses vs 71.6% without TKR for 1 course; hazard ratio, 0.138; P < .0001).
Repeated courses of treatment with HA are safe and are associated with the delay of TKR for up to 3 years. Additional research is needed to evaluate the effect of repeated HA courses on delaying TKR beyond a 3-year time horizon.
Continue to: Osteoarthritis (OA) of the knee...
Osteoarthritis (OA) of the knee has emerged as one of the main causes of disability in the United States. Although no currently known cure of OA can reverse the progression of the disease, total knee replacement (TKR) is an effective and definitive treatment. However, TKR is an invasive procedure with potential risk for serious complications, and it has imposed high costs on the US healthcare system, with expenses accounting for hospital expenditures of TKR estimated at $28.5 billion in 2009.1Alternative low-risk therapies that can delay or obviate TKR are valuable to a number of patients, especially the poor candidates for surgery or those who wish to avoid TKR.
Intra-articular (IA) hyaluronic acid (HA) injections have been available as a safe and effective treatment option to alleviate pain and to improve joint functions.2 Results of randomized double-blind controlled clinical trials have demonstrated the pain-relieving effect of IA HA injections.3-5 Furthermore, a recent network meta-analysis comparing various pharmacologic interventions for knee OA has confirmed the efficacy of IA HA injections, which outperformed other interventions when compared with oral placebos.6,7 IA therapies are more effective than oral therapies for knee OA pain, with IA HA injections demonstrating the most pain reduction, potentially due to the benefit associated with needle injection and aspiration. Recent experimental studies have also suggested that IA HA may provide cartilage protection, reduce inflammation, and boost the viscosity of synovial fluid;8 IA HA may also exert therapeutic effects by inhibiting bone formation in OA patients.9,10 HA possesses the potential to delay or obviate TKR. Previous research with a case series review of patients in an orthopedic specialty practice reported that the use of IA HA injections in patients with grade IV OA delayed TKR substantially.11 One study analyzed retrospective medical claims data from a single private insurer and discovered potential evidence for the modest benefit of IA HA injections in delaying TKR.12
More detailed research work on a large sample of patients with knee OA and the requirement of TKR as a condition for inclusion using US administrative claims data has demonstrated the TKR-delaying effects of IA HA injections in comparison with a control group without claims for IA HA injections.13,14 This study also uses real-world US administrative data but utilizes a different approach by starting with a sample of patients with knee OA and evidence of IA HA injections and then assessing the effect of repeated courses of HA treatment on the delay of TKR, without TKR as a mandatory condition for inclusion. All patients with knee OA within the time window were included, regardless of the need for TKR compared with previous studies which only considered patients who ultimately received TKR. Safety information and effectiveness information were examined to achieve a balanced risk-benefit assessment. We also analyzed how multiple courses of HA treatment and other potentially relevant covariates at baseline affected the risk of receiving TKR in a multivariate survival model. We aimed to achieve a realistic assessment of the clinical utility of HA injections in delaying TKR in a real-world setting using both safety and effectiveness data.
METHODS
DATA SOURCE
A retrospective cohort observational study using IMS Health’s PharMetrics Plus Health Plan Claims Database was conducted by identifying knee OA patients with claims indicating initiation of HA injection at an index date during the selection period (July 1, 2007 to June 30, 2010). All common HA agents in the US market during this period (Euflexxa, Hyalgan, Orthovisc, Supartz, and Synvisc) were selected via the corresponding J-codes and pooled for investigation of HA class effects. The follow-up period was 36 months, post-index date of the initial HA injection. Outcomes were measured, and adverse events were identified during this period. The time window for identification of adverse events was within 2 weeks from any injection during the course of therapy (evidence of an emergency room visit and/or physician office visit with requisite code). The data during the 12-month pre-index baseline period from the claims database was used to obtain information about baseline patient characteristics, such as age, gender, type of coverage, physician specialty, Charlson Comorbidity Index (CCI), major comorbidities, and major medications of interest commonly used among patients with knee OA.
STUDY SAMPLE SELECTION
The eligible patients required an outpatient claim indicating the initiation of HA injection. The date of the first claim for the patient within the selection window was defined as their index date. Patients had to be ≥18 years of age in the year of their index date. They had to present at least 1 clinical knee OA diagnosis at any point in the 12-month pre-index period (including the index date), and only patients who were continuously enrolled from 12 months pre-index to 36 months post-index date were evaluated. Among these patients (approximately 1.4 million), the following were excluded to minimize complications in data analysis and interpretation: patients with evidence of any HA use in the pre-index period; patients with evidence of a different kind of HA index medication in the post-index period; patients with evidence of TKR within 30 days of the index event during the post-index period; patients with evidence of 2 different kinds of HA index medications on the index date; and patients with evidence of diagnosis of hip OA, fibromyalgia, rheumatoid arthritis, lupus, or gout during the pre-index period.
Five patient cohorts were defined according to the number of courses of IA HA injections over the entire post-index period.
Continue to: Statistical analysis...
STATISTICAL ANALYSIS
All statistical analyses were performed using SAS version 9.2 (SAS Institute Inc.). Descriptive statistics such as means, standard deviations, medians, and 25% and 75% percentiles (Q1 and Q3, respectively) were provided for the continuous variables. Numbers and percentages were provided for the categorical variables. For statistical testing, Student’s t-tests were applied for the continuous variables and chi-square tests for the categorical variables. All the statistical tests were two-tailed. The sample sizes in this database study are remarkably large, such that differences that are not clinically important could still be statistically significant at the conventional alpha level of 0.05. Thus, we applied a more stringent requirement of the alpha level of 0.0001 to identify highly statistically significant results. The number and percentage of patients within each cohort with at least 1 instance of an adverse event of interest (those adverse events commonly expected for patients who receive IA injections for knee OA) were assessed. Times to TKR during the 36-month post-index period were analyzed and compared among different cohorts. Any patients who had not undergone TKR by the end of the post-index period were considered censored at 36 months. The Kaplan-Meier method was employed to model survival curves with time to TKR data, and log-rank tests were used to compare survival curves among different cohorts. A Cox proportional hazards model (PHM) was used to model the risk of TKR with a pre-specified set of covariates adjusted for baseline attributes, such as age, gender, comorbidities, and pre-index healthcare costs. Hazard ratios with 95% confidence intervals were used to examine the measures of event risk.
RESULTS
PATIENT CHARACTERISTICS
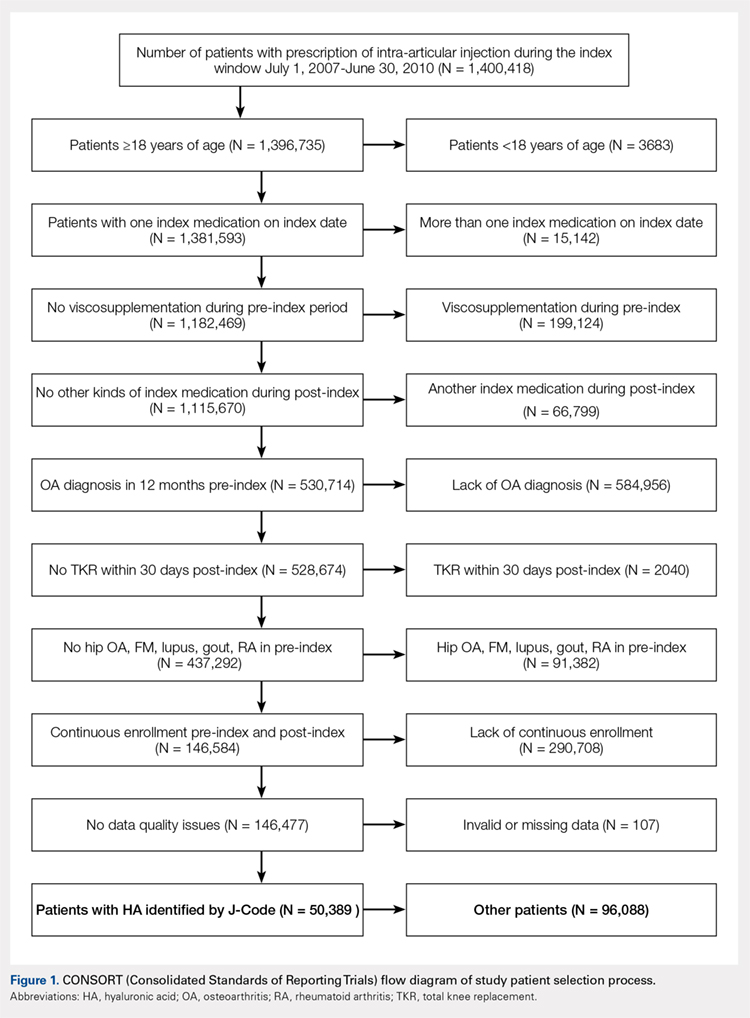
Applying study selection criteria to the claims database yielded 50,389 patients (Figure 1), providing an ample sample size for the statistical analysis. Only patients with evidence of knee OA and use of HA injections (the index medication of interest) were selected, regardless of whether they received TKR during the post-index period. The requirement for a knee OA diagnosis during the 12-month pre-index period resulted in the significant attrition of patients, with 584,956 patients being excluded. Among the 50,389 patients who received HA for treatment of knee OA, 36,260 (72.0%) received a single course of treatment, 8709 (17.3%) received 2 courses, 3179 (6.3%) received 3 courses, 1354 (2.7%) received 4 courses, and 887 (1.8%) received ≥5 courses of treatment.
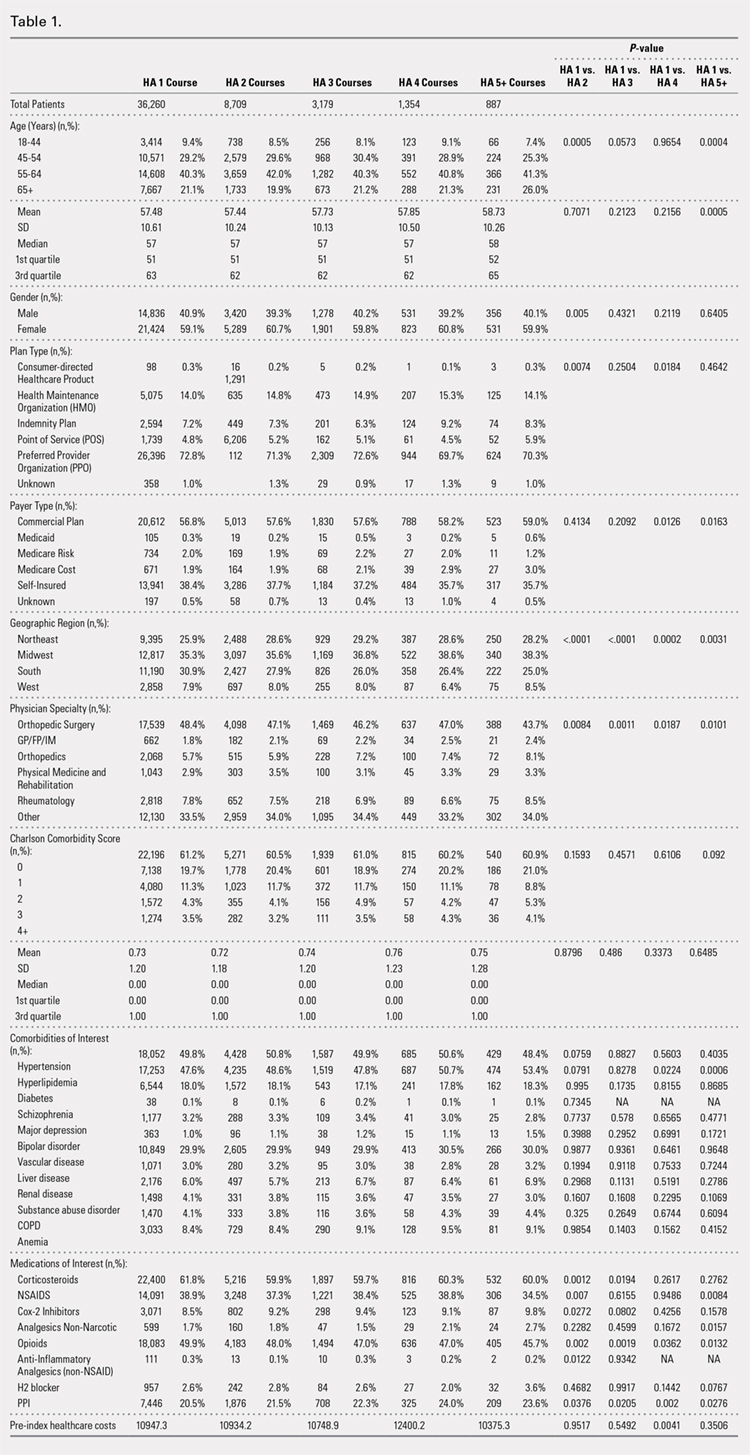
Comparison of baseline characteristics among the 5 IA HA cohorts showed the fairly similar baseline characteristics of all cohorts (Table 1). Geographic region, physician specialty, and opioid use showed differences among the cohorts. Cohorts with ≥5 HA courses presented lower proportions of patients from Southern US states, patients seeing orthopedic surgeons, and patients using opioids than cohorts with fewer HA courses.
PROCEDURES OF INTEREST
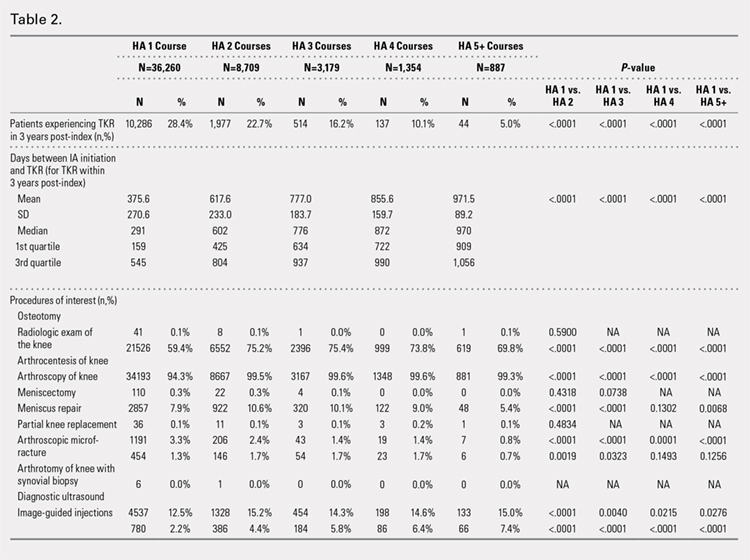
An analysis of the procedures patients received after HA treatment initiation showed that higher numbers of HA treatment courses resulted in lower proportions of patients receiving TKR within 3 years after HA treatment initiation (Table 2). With an increasing number of HA treatment courses, the proportion of patients with TKR within 3 years post-index consistently decreased from 28.4% (for 1 HA course) to 5.0% (for ≥5 HA courses), with all differences being highly statistically significant (P < .0001). Similarly, partial knee replacement exhibited a similar trend, with the proportion of patients decreasing from 3.3% (for 1 HA course) to 0.8% (for ≥5 HA courses; P < .0001). Among the patients with TKR within 3 years post-index, increasing numbers of treatment courses correlated with increasing time to TKR, with a mean of 375.6 days (for 1 HA course) rising to a mean of 971.5 days (for ≥5 HA courses; P < .0001). On the other hand, patients with multiple courses of HA treatment were more likely to undergo radiologic examinations of the knee, arthrocenteses, and image-guided injections than patients with only a single course of HA treatment (P < .0001).
ADVERSE EVENTS
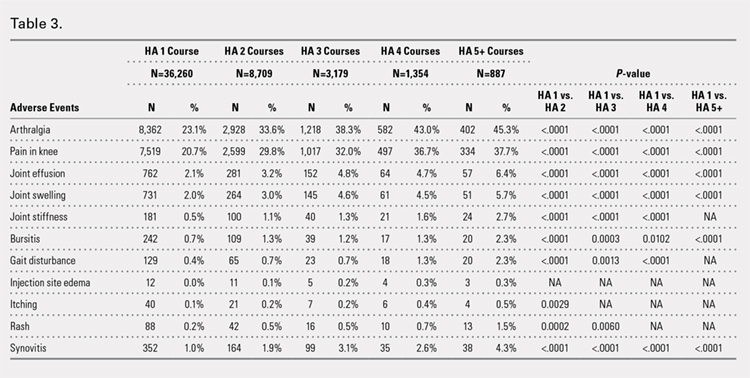
Arthralgia and joint pain in the knee were the most commonly recorded adverse events (Table 3). More courses of HA treatment were associated with higher rates of adverse events. Overall, the reported adverse events profile of repeated courses of HA treatment consisted of mostly common and mild adverse events and displayed no safety concern for patients with knee OA that was followed-up for 3 years. The causality of these adverse events directly related to HA injections vs a specific disease state cannot be determined from an administrative claims data set.
TIME TO TKR
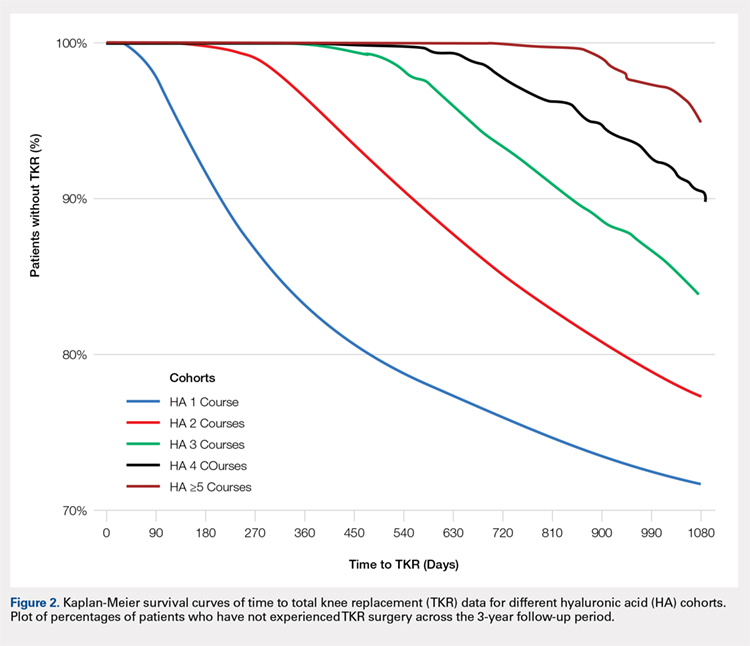
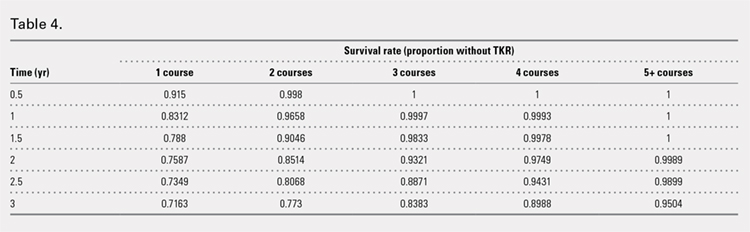
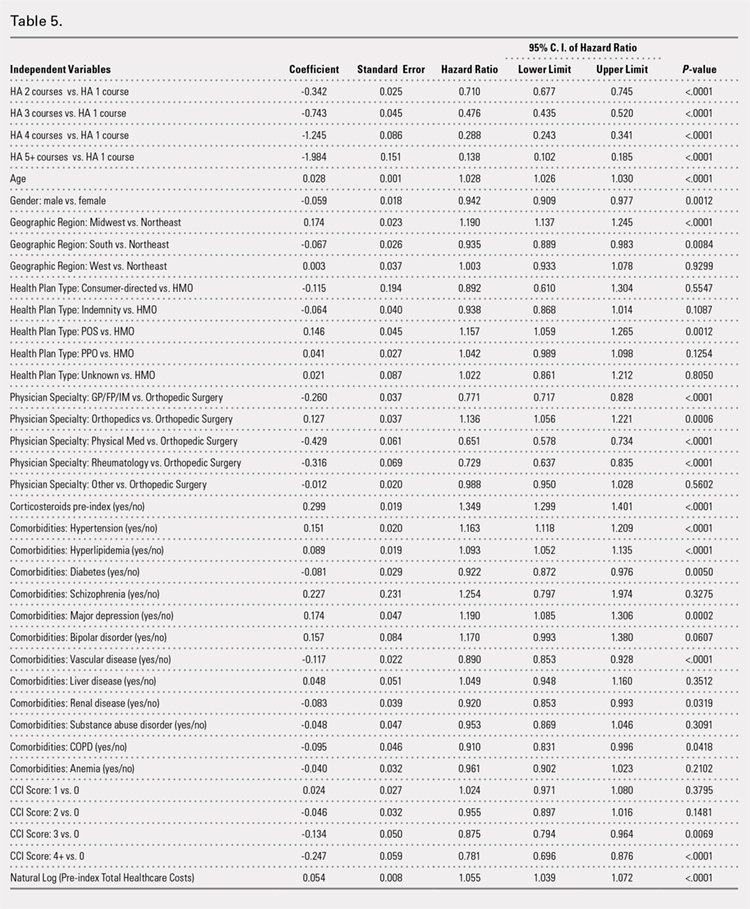
Successive courses of HA led to high proportions of patients without TKR 3 years after HA treatment initiation. This result is evident in the Kaplan-Meier survival curves of time to TKR for different HA cohorts (Figure 2), with log-rank tests of multiple courses vs a single course of HA (P < .0001) showing highly statistically significance. Tabulation of proportions of patients without TKR by various time points showed that increasing numbers of HA treatment courses correlated with higher proportions of patients without TKR at almost all time points (Table 4); within 3 years post-index, 71.6% of patients in the 1 HA course cohort exhibited no TKR, whereas 95.0% of patients in ≥5 HA courses cohort presented no TKR. We also performed a multivariate Cox PHM (Table 5) to account for baseline characteristics of different HA cohorts with covariates when estimating the risks of receiving TKR. The results of the Cox PHM showed that multiple courses of HA treatment significantly decreased the risk of TKR (hazard ratio, 0.138 for ≥5 HA courses vs 1 HA course; P < .0001). Inspection of other highly significant covariates showed that being older, living in the Midwest region of the US (vs the Northeast), receiving pre-index corticosteroids, having an orthopedic surgeon as a treating physician (vs a general practitioner, a rheumatologist, or a physical medicine and rehabilitation specialist), experiencing hypertension or hyperlipidemia, and higher pre-index total healthcare costs were associated with an increased risk of TKR (all P < .0001). Vascular disease and high CCI scores were associated with a decreased risk of TKR (P < .0001).
Continue to: Discussion...
DISCUSSION
This study demonstrated that multiple courses of HA treatment can delay the need for surgery for up to 3 years, with risk for both TKR and partial knee replacement decreasing in a dose-dependent manner. The potentially confounding effect of differences in baseline characteristics that could influence patients’ propensity to receive TKR in a database study was controlled by performing a multivariate analysis with covariate adjustment. The TKR-delaying effect of HA injection was more prominent in cohorts with a high number of HA treatment courses: 19 out of 20 patients in the cohort of ≥5 HA courses were free of TKR at the end of the 3-year post-index period. Such a high proportion of patients avoiding TKR with repeated courses of HA suggests that some patients may be able to successfully delay TKR well beyond the 3-year time span. This finding is counter-evidence to the frequently made assumption15 that all patients with knee OA will eventually progress to a state of disability, making TKR inevitable. The patients with end-stage radiographic knee OA can also benefit from IA HA injections for an extended period of time;16 the latest evidence indicates that nonoperative management can improve symptoms irrespective of radiographic disease severity, implying that TKR needs not to be the only therapeutic option for patients with end-stage radiographic knee OA.17 This finding suggests that HA treatment should be considered an important clinical treatment option for patients with knee OA.
Although the incidence rates of certain adverse events, such as arthralgia/joint pain, are sizable, these temporary adverse events commonly occur among patients who receive IA injections for knee OA; most of these events may simply include symptoms of the remaining underlying knee OA. These results are consistent with those of previous literature reporting the safety of repeated treatment with IA HA injections in a prospective clinical trial18 and demonstrating that repeated courses of HA treatment pose no greater safety risk than a single course of HA treatment.
Multivariate modeling outcomes of factors influencing risk of receiving TKR are broadly consistent with the generally accepted notions that different levels of disease severity and patients’ willingness to consider TKR at baseline influence the likelihood and timing of receiving TKR.19,20 Age and obesity are common risk factors for progression of OA. Orthopedic surgeons are more likely to recommend surgery than non-surgeons. The pre-index use of corticosteroids and high pre-index healthcare costs could be associated with more severe symptoms at baseline. Patients with vascular disease or severe comorbidities, as evidenced by high CCI scores, make poor candidates for major elective surgeries such as TKR. These results are intuitive and validate the clinical insights of this study. Moreover, inclusion of these covariates in the analysis model allows for indirect adjustment of the most important prognostic factors for TKR at baseline, permitting proper statistical comparison of the results for different cohort groups.
Recently, the efficacy of HA injections for OA patients has become the subject of debate when the American Academy of Orthopaedic Surgeons (AAOS) revised its clinical practice guideline, recommending against the use of HA.21 The AAOS’ findings differ from those of other clinical societies, such as the American College of Rheumatology22 and the European League Against Rheumatism,23 which provide no strong recommendation against the use of HA injections. The announcement of the new guideline by AAOS caused concern among clinicians and payers who had valued IA HA injections as a means to control knee OA pain before patients progress to TKR;24 on the other hand, the demand for nonoperative treatment of knee OA remains high. Utilization rates of TKR have increased dramatically, and surgeries are now performed on younger patients with increasing burden on the healthcare system,25,26 in spite of the fact that as high as a third of TKR surgeries may have been performed in inappropriate patients.27 Part of the confusion surrounding clinical utility of HA stems from the fact that up until recently, relatively little research looked into the practical benefits of HA in actual clinical practice. Analyses of databases such as registries are now gaining attention to overcome that problem. Examination of large administrative databases maintained by commercial payers offers the benefit of probing realistically the safety and efficacy of treatments in actual clinical environments in a very large number of patients with heterogeneous backgrounds. Recently, the Agency for Healthcare Research and Quality’s Technology Assessment Program in the US called for such studies to determine whether HA injections can delay progression to TKR.28 The results of this study and several others11,13,14,16 suggest that use of HA to treat OA of the knee is associated with the delay of TKR, supporting the utility of HA in clinical practice and the healthcare system. Potential clinical benefits of delaying TKR may include the reduced risk of aseptic loosening if younger patients can wait for TKR or more time to allow the modification of risk factors in patients who will ultimately undergo TKR.
LIMITATIONS
Follow-up period was limited to 3 years post-index date because longer follow-up data were not available at the time of the study design. If an incorrect adverse event or OA diagnosis was listed in the medical record, or if the medical record was incomplete, then patients might have been misclassified, resulting in selection bias. The claims dataset includes no uninsured and Medicare patients, as the population in the database consisted primarily of commercially-insured patients in the US. Therefore, the results are most generalizable to other commercially-insured patients in the US. Generalizability to other populations may not be assured if they differ in their accessibility to physician services or prescriptions from the patients in this study. Other treatments such as the nonsteroidal anti-inflammatory drugs used by patients were not included within the pre-specified statistical model because their potential effects were assumed to be short-lived and much less than those of corticosteroid. Including these treatments would overload the statistical model with too many covariates, leading to potential computational instability. The database used provides no information on systemic factors, including plan limits on medication use, that could affect care. Given the large and diverse nature of the healthcare plans in the database. However, these factors should not have materially affected our study results. The claims database also lacks direct indicators of OA disease severity, such as Kellgren-Lawrence scores or patient-reported outcomes, including pain and function questionnaire scores. Our multivariate analysis indirectly makes up for this deficiency by considering other baseline characteristics or clinical indicators that may be correlated with information unavailable in a claims database. Patients who opt to undergo repeated courses of HA treatment may be more inclined to avoid surgery or may naturally experience OA disease progression more slowly, making them potentially different from patients who select to undergo surgery earlier without repeated courses of HA treatment. This condition may introduce a bias that causes difficulty in proving the causality between repeated HA use and delay of TKR.
CONCLUSION
Analysis of the knee OA patient data from a real-world database showed that repeated courses of treatment with HA are safe and are associated with the delay of TKR for up to 3 years. Additional research is needed to evaluate the effects of repeated HA courses on delaying TKR beyond a 3-year period.
- Murphy L, Helmick CG. The impact of osteoarthritis in the United States: a population-health perspective. Am J Nurs. 2012;112(3 Suppl 1):S13-S19.
- Arnold W, Fullerton DS, Holder S, May CS. Viscosupplementation: managed care issues for osteoarthritis of the knee. J Manag Care Pharm. 2007;13(4 Suppl):S3-S19.
- Strand V, Conaghan PG, Lohmander LS, et al. An integrated analysis of five double-blind, randomized controlled trials evaluating the safety and efficacy of a hyaluronan product for intra-articular injection in osteoarthritis of the knee. Osteoarthritis Cartilage. 2006;14(9):859-866.
- Strand V, Baraf HS, Lavin PT, Lim S, Hosokawa H. A multicenter, randomized controlled trial comparing a single intra-articular injection of Gel-200, a new cross-linked formulation of hyaluronic acid, to phosphate buffered saline for treatment of osteoarthritis of the knee. Osteoarthritis Cartilage. 2012;20(5):350-356.
- Strand V, McIntyre LF, Beach WR, Miller LE, Block JE. Safety and efficacy of US-approved viscosupplements for knee osteoarthritis: a systematic review and meta-analysis of randomized, saline-controlled trials. J Pain Res. 2015;8:217-228.
- Bannuru RR, Schmid CH, Kent DM, Vaysbrott EE, Wong JB, McAlindon TE. Comparative effectiveness of pharmacologic interventions for knee osteoarthritis: a systematic review and network meta-analysis. Ann Intern Med. 2015;162(1):46-54.
- Mandl LA, Losina E. Relative efficacy of knee osteoarthritis treatments: are all placebos created equal? Ann Intern Med. 2015;162(1):71-72.
- Kusayama Y, Akamatsu Y, Kumagai K, Kobayashi H, Aratake M, Saito T. Changes in synovial fluid biomarkers and clinical efficacy of intra-articular injections of hyaluronic acid for patients with knee osteoarthritis. J Exp Orthop. 2014;1(1):16. doi:10.1186/s40634-014-0016-7.
- Kaneko K, Higuchi C, Kunugiza Y, et al. Hyaluronan inhibits BMP-induced osteoblast differentiation. FEBS Lett. 2015;589(4):447-454. doi:10.1016/j.febslet.2014.
- Altman RD, Manjoo A, Fierlinger A, Niazi F, Nicholls M. The mechanism of action for hyaluronic acid treatment in the osteoarthritic knee: a systematic review. BMC Musculoskelet Disord. 2015;16:321. doi:10.1186/s12891-015-0775-z.
- Waddell DD, Bricker DC. Total knee replacement delayed with hylan G-F 20 use in patients with grade IV osteoarthritis. J Manag Care Pharm. 2007;13(2):113-121.
- Khan T, Nanchanatt G, Farber K, Jan S. Analysis of the effectiveness of hyaluronic acid in prevention of total knee replacement in osteoarthritis patients. J Manag Care Pharm. 2014;20:S49.
- Abbott T, Altman RD, Dimeff R, et al. Do hyaluronic acid injections delay total knee replacement surgery? Arthritis Rheum. 2013;65(Suppl 10):2139.
- Altman R, Lim S, Steen R, Dasa V. Intra-articular hyaluronic acid delays total knee replacement in patients with knee osteoarthritis: evidence from a large U.S. health claims database. Osteoarthritis Cartilage. 2015;23(Suppl 2):A403-A404.
- Mather RC 3rd, Hug KT, Orlando LA, et al. Economic evaluation of access to musculoskeletal care: the case of waiting for total knee arthroplasty. BMC Musculoskelet Disord. 2014;15:22. doi:10.1186/1471-2474-15-22.
- Waddell DD, Joseph B. Delayed total knee replacement with Hylan G-F 20. J Knee Surg. 2016;29(2):159-168. doi:10.1055/s-0034-1395281.
- Atukorala I, Makovey J, Williams M, Ochoa Albiztegui E, Eyles JP, Hunter DJ. If you have end-stage radiographic knee osteoarthritis can you respond to non-surgical management? Osteoarthritis Cartilage. 2015;23(Suppl 2):A329.
- Strand V, Baraf HS, Lavin PT, Lim S, Hosokawa H. Effectiveness and safety of a multicenter extension and retreatment trial of Gel-200 in patients with knee osteoarthritis. Cartilage. 2012;3(4):297-304. doi:10.1177/1947603512451024.
- Riddle DL, Kong X, Jiranek WA. Two-year incidence and predictors of future knee arthroplasty in persons with symptomatic knee osteoarthritis: preliminary analysis of longitudinal data from the osteoarthritis initiative. Knee. 2009;16(6):494-500.
- Hawker GA, Guan J, Croxford R, et al. A prospective population-based study of the predictors of undergoing total joint arthroplasty. Arthritis Rheum. 2006;54(10):3212-3220.
- Jevsevar DS. Treatment of osteoarthritis of the knee: evidence-based guideline, 2nd edition. J Am Acad Orthop Surg. 2013;21(9):571-576. doi:10.5435/JAAOS-21-09-571.
- Hochberg MC, Altman RD, April KT, et al. American College of Rheumatology 2012 recommendations for the use of nonpharmacologic and pharmacologic therapies in osteoarthritis of the hand, hip, and knee. Arthritis Care Res (Hoboken). 2012;64(4):465-474.
- Jordan KM, Arden NK, Doherty M, et al. EULAR Recommendations 2003: an evidence based approach to the management of knee osteoarthritis: report of a task force of the standing committee for international clinical studies including therapeutic trials (ESCISIT). Ann Rheum Dis. 2003;62(12):1145-1155.
- Bannuru RR, Vaysbrot EE, McIntyre LF. Did the American Academy of Orthopaedic Surgeons osteoarthritis guidelines miss the mark? Arthroscopy. 2014;30(1):86-89. doi:10.1016/j.arthro.2013.10.007.
- Losina E, Thornhill TS, Rome BN, Wright J, Katz JN. The dramatic increase in total knee replacement utilization rates in the United States cannot be fully explained by growth in population size and the obesity epidemic. J Bone Joint Surg Am. 2012;94(3):201-207. doi:10.2106/JBJS.J.01958.
- Weinstein AM, Rome BN, Reichmann WM, et al. Estimating the burden of total knee replacement in the United States. J Bone Joint Surg Am. 2013;95(5):385-392. doi:10.2106/JBJS.L.00206.
- Riddle DL, Jiranek WA, Hayes CW. Use of a validated algorithm to judge the appropriateness of total knee arthroplasty in the United States: a multicenter longitudinal cohort study. Arthritis Rheumatol. 2014;66(8):2134-2143. doi:10.1002/art.38685.
- NewBerry SJ, Fitzgerald JD, Maglione MA, et al. Agency for Healthcare Research and Quality Web site. Systematic Review for Effectiveness of Hyaluronic Acid in the Treatment of Severe Degenerative Joint Disease (DJD) of the Knee: Technology Assessment Report. http://www.ahrq.gov/research/findings/ta/call-for-public-review.html. Published July 23, 2015. Accessed December 22, 2014.
ABSTRACT
Osteoarthritis (OA) of the knee is a top cause of disability among the elderly. Total knee replacement (TKR) has been available as an effective and definite surgical method to treat severe OA of the knee. However, TKR is a significant procedure with potential risk for serious complications and high costs. Alternative lower risk therapies that can delay or obviate TKR are valuable to those who are poor candidates for surgery or wish to avoid TKR as long as possible. Given the chondroprotective effects of hyaluronic acid (HA) injections, they are a safe and effective treatment to improve pain, function, and longevity of the knee. Thus, HA features the potential to delay or obviate TKR.
We aim to study the safety and effectiveness of repeated courses of HA on the time to TKR over a 3-year period using data from a large US health plan administrative claims database.
Retrospective analyses were conducted by identifying knee OA patients during the selection period (2007-2010). The follow-up period was 36 months, post-index date of initial HA injection. Procedural outcomes and adverse events of interest were tabulated and analyzed. A Cox proportional hazards model was used to model the risk of TKR.
A total of 50,389 patients who received HA for treatment of knee OA and met the study inclusion criteria were analyzed. Successive courses of HA showed a good safety profile and led to high proportions of patients without TKR 3 years after treatment initiation. Multivariate statistical modeling showed that multiple courses of HA injections significantly decreased the rates of TKR (95.0% without TKR for ≥5 courses vs 71.6% without TKR for 1 course; hazard ratio, 0.138; P < .0001).
Repeated courses of treatment with HA are safe and are associated with the delay of TKR for up to 3 years. Additional research is needed to evaluate the effect of repeated HA courses on delaying TKR beyond a 3-year time horizon.
Continue to: Osteoarthritis (OA) of the knee...
Osteoarthritis (OA) of the knee has emerged as one of the main causes of disability in the United States. Although no currently known cure of OA can reverse the progression of the disease, total knee replacement (TKR) is an effective and definitive treatment. However, TKR is an invasive procedure with potential risk for serious complications, and it has imposed high costs on the US healthcare system, with expenses accounting for hospital expenditures of TKR estimated at $28.5 billion in 2009.1Alternative low-risk therapies that can delay or obviate TKR are valuable to a number of patients, especially the poor candidates for surgery or those who wish to avoid TKR.
Intra-articular (IA) hyaluronic acid (HA) injections have been available as a safe and effective treatment option to alleviate pain and to improve joint functions.2 Results of randomized double-blind controlled clinical trials have demonstrated the pain-relieving effect of IA HA injections.3-5 Furthermore, a recent network meta-analysis comparing various pharmacologic interventions for knee OA has confirmed the efficacy of IA HA injections, which outperformed other interventions when compared with oral placebos.6,7 IA therapies are more effective than oral therapies for knee OA pain, with IA HA injections demonstrating the most pain reduction, potentially due to the benefit associated with needle injection and aspiration. Recent experimental studies have also suggested that IA HA may provide cartilage protection, reduce inflammation, and boost the viscosity of synovial fluid;8 IA HA may also exert therapeutic effects by inhibiting bone formation in OA patients.9,10 HA possesses the potential to delay or obviate TKR. Previous research with a case series review of patients in an orthopedic specialty practice reported that the use of IA HA injections in patients with grade IV OA delayed TKR substantially.11 One study analyzed retrospective medical claims data from a single private insurer and discovered potential evidence for the modest benefit of IA HA injections in delaying TKR.12
More detailed research work on a large sample of patients with knee OA and the requirement of TKR as a condition for inclusion using US administrative claims data has demonstrated the TKR-delaying effects of IA HA injections in comparison with a control group without claims for IA HA injections.13,14 This study also uses real-world US administrative data but utilizes a different approach by starting with a sample of patients with knee OA and evidence of IA HA injections and then assessing the effect of repeated courses of HA treatment on the delay of TKR, without TKR as a mandatory condition for inclusion. All patients with knee OA within the time window were included, regardless of the need for TKR compared with previous studies which only considered patients who ultimately received TKR. Safety information and effectiveness information were examined to achieve a balanced risk-benefit assessment. We also analyzed how multiple courses of HA treatment and other potentially relevant covariates at baseline affected the risk of receiving TKR in a multivariate survival model. We aimed to achieve a realistic assessment of the clinical utility of HA injections in delaying TKR in a real-world setting using both safety and effectiveness data.
METHODS
DATA SOURCE
A retrospective cohort observational study using IMS Health’s PharMetrics Plus Health Plan Claims Database was conducted by identifying knee OA patients with claims indicating initiation of HA injection at an index date during the selection period (July 1, 2007 to June 30, 2010). All common HA agents in the US market during this period (Euflexxa, Hyalgan, Orthovisc, Supartz, and Synvisc) were selected via the corresponding J-codes and pooled for investigation of HA class effects. The follow-up period was 36 months, post-index date of the initial HA injection. Outcomes were measured, and adverse events were identified during this period. The time window for identification of adverse events was within 2 weeks from any injection during the course of therapy (evidence of an emergency room visit and/or physician office visit with requisite code). The data during the 12-month pre-index baseline period from the claims database was used to obtain information about baseline patient characteristics, such as age, gender, type of coverage, physician specialty, Charlson Comorbidity Index (CCI), major comorbidities, and major medications of interest commonly used among patients with knee OA.
STUDY SAMPLE SELECTION
The eligible patients required an outpatient claim indicating the initiation of HA injection. The date of the first claim for the patient within the selection window was defined as their index date. Patients had to be ≥18 years of age in the year of their index date. They had to present at least 1 clinical knee OA diagnosis at any point in the 12-month pre-index period (including the index date), and only patients who were continuously enrolled from 12 months pre-index to 36 months post-index date were evaluated. Among these patients (approximately 1.4 million), the following were excluded to minimize complications in data analysis and interpretation: patients with evidence of any HA use in the pre-index period; patients with evidence of a different kind of HA index medication in the post-index period; patients with evidence of TKR within 30 days of the index event during the post-index period; patients with evidence of 2 different kinds of HA index medications on the index date; and patients with evidence of diagnosis of hip OA, fibromyalgia, rheumatoid arthritis, lupus, or gout during the pre-index period.
Five patient cohorts were defined according to the number of courses of IA HA injections over the entire post-index period.
Continue to: Statistical analysis...
STATISTICAL ANALYSIS
All statistical analyses were performed using SAS version 9.2 (SAS Institute Inc.). Descriptive statistics such as means, standard deviations, medians, and 25% and 75% percentiles (Q1 and Q3, respectively) were provided for the continuous variables. Numbers and percentages were provided for the categorical variables. For statistical testing, Student’s t-tests were applied for the continuous variables and chi-square tests for the categorical variables. All the statistical tests were two-tailed. The sample sizes in this database study are remarkably large, such that differences that are not clinically important could still be statistically significant at the conventional alpha level of 0.05. Thus, we applied a more stringent requirement of the alpha level of 0.0001 to identify highly statistically significant results. The number and percentage of patients within each cohort with at least 1 instance of an adverse event of interest (those adverse events commonly expected for patients who receive IA injections for knee OA) were assessed. Times to TKR during the 36-month post-index period were analyzed and compared among different cohorts. Any patients who had not undergone TKR by the end of the post-index period were considered censored at 36 months. The Kaplan-Meier method was employed to model survival curves with time to TKR data, and log-rank tests were used to compare survival curves among different cohorts. A Cox proportional hazards model (PHM) was used to model the risk of TKR with a pre-specified set of covariates adjusted for baseline attributes, such as age, gender, comorbidities, and pre-index healthcare costs. Hazard ratios with 95% confidence intervals were used to examine the measures of event risk.
RESULTS
PATIENT CHARACTERISTICS
Applying study selection criteria to the claims database yielded 50,389 patients (Figure 1), providing an ample sample size for the statistical analysis. Only patients with evidence of knee OA and use of HA injections (the index medication of interest) were selected, regardless of whether they received TKR during the post-index period. The requirement for a knee OA diagnosis during the 12-month pre-index period resulted in the significant attrition of patients, with 584,956 patients being excluded. Among the 50,389 patients who received HA for treatment of knee OA, 36,260 (72.0%) received a single course of treatment, 8709 (17.3%) received 2 courses, 3179 (6.3%) received 3 courses, 1354 (2.7%) received 4 courses, and 887 (1.8%) received ≥5 courses of treatment.
Comparison of baseline characteristics among the 5 IA HA cohorts showed the fairly similar baseline characteristics of all cohorts (Table 1). Geographic region, physician specialty, and opioid use showed differences among the cohorts. Cohorts with ≥5 HA courses presented lower proportions of patients from Southern US states, patients seeing orthopedic surgeons, and patients using opioids than cohorts with fewer HA courses.
PROCEDURES OF INTEREST
An analysis of the procedures patients received after HA treatment initiation showed that higher numbers of HA treatment courses resulted in lower proportions of patients receiving TKR within 3 years after HA treatment initiation (Table 2). With an increasing number of HA treatment courses, the proportion of patients with TKR within 3 years post-index consistently decreased from 28.4% (for 1 HA course) to 5.0% (for ≥5 HA courses), with all differences being highly statistically significant (P < .0001). Similarly, partial knee replacement exhibited a similar trend, with the proportion of patients decreasing from 3.3% (for 1 HA course) to 0.8% (for ≥5 HA courses; P < .0001). Among the patients with TKR within 3 years post-index, increasing numbers of treatment courses correlated with increasing time to TKR, with a mean of 375.6 days (for 1 HA course) rising to a mean of 971.5 days (for ≥5 HA courses; P < .0001). On the other hand, patients with multiple courses of HA treatment were more likely to undergo radiologic examinations of the knee, arthrocenteses, and image-guided injections than patients with only a single course of HA treatment (P < .0001).
ADVERSE EVENTS
Arthralgia and joint pain in the knee were the most commonly recorded adverse events (Table 3). More courses of HA treatment were associated with higher rates of adverse events. Overall, the reported adverse events profile of repeated courses of HA treatment consisted of mostly common and mild adverse events and displayed no safety concern for patients with knee OA that was followed-up for 3 years. The causality of these adverse events directly related to HA injections vs a specific disease state cannot be determined from an administrative claims data set.
TIME TO TKR
Successive courses of HA led to high proportions of patients without TKR 3 years after HA treatment initiation. This result is evident in the Kaplan-Meier survival curves of time to TKR for different HA cohorts (Figure 2), with log-rank tests of multiple courses vs a single course of HA (P < .0001) showing highly statistically significance. Tabulation of proportions of patients without TKR by various time points showed that increasing numbers of HA treatment courses correlated with higher proportions of patients without TKR at almost all time points (Table 4); within 3 years post-index, 71.6% of patients in the 1 HA course cohort exhibited no TKR, whereas 95.0% of patients in ≥5 HA courses cohort presented no TKR. We also performed a multivariate Cox PHM (Table 5) to account for baseline characteristics of different HA cohorts with covariates when estimating the risks of receiving TKR. The results of the Cox PHM showed that multiple courses of HA treatment significantly decreased the risk of TKR (hazard ratio, 0.138 for ≥5 HA courses vs 1 HA course; P < .0001). Inspection of other highly significant covariates showed that being older, living in the Midwest region of the US (vs the Northeast), receiving pre-index corticosteroids, having an orthopedic surgeon as a treating physician (vs a general practitioner, a rheumatologist, or a physical medicine and rehabilitation specialist), experiencing hypertension or hyperlipidemia, and higher pre-index total healthcare costs were associated with an increased risk of TKR (all P < .0001). Vascular disease and high CCI scores were associated with a decreased risk of TKR (P < .0001).
Continue to: Discussion...
DISCUSSION
This study demonstrated that multiple courses of HA treatment can delay the need for surgery for up to 3 years, with risk for both TKR and partial knee replacement decreasing in a dose-dependent manner. The potentially confounding effect of differences in baseline characteristics that could influence patients’ propensity to receive TKR in a database study was controlled by performing a multivariate analysis with covariate adjustment. The TKR-delaying effect of HA injection was more prominent in cohorts with a high number of HA treatment courses: 19 out of 20 patients in the cohort of ≥5 HA courses were free of TKR at the end of the 3-year post-index period. Such a high proportion of patients avoiding TKR with repeated courses of HA suggests that some patients may be able to successfully delay TKR well beyond the 3-year time span. This finding is counter-evidence to the frequently made assumption15 that all patients with knee OA will eventually progress to a state of disability, making TKR inevitable. The patients with end-stage radiographic knee OA can also benefit from IA HA injections for an extended period of time;16 the latest evidence indicates that nonoperative management can improve symptoms irrespective of radiographic disease severity, implying that TKR needs not to be the only therapeutic option for patients with end-stage radiographic knee OA.17 This finding suggests that HA treatment should be considered an important clinical treatment option for patients with knee OA.
Although the incidence rates of certain adverse events, such as arthralgia/joint pain, are sizable, these temporary adverse events commonly occur among patients who receive IA injections for knee OA; most of these events may simply include symptoms of the remaining underlying knee OA. These results are consistent with those of previous literature reporting the safety of repeated treatment with IA HA injections in a prospective clinical trial18 and demonstrating that repeated courses of HA treatment pose no greater safety risk than a single course of HA treatment.
Multivariate modeling outcomes of factors influencing risk of receiving TKR are broadly consistent with the generally accepted notions that different levels of disease severity and patients’ willingness to consider TKR at baseline influence the likelihood and timing of receiving TKR.19,20 Age and obesity are common risk factors for progression of OA. Orthopedic surgeons are more likely to recommend surgery than non-surgeons. The pre-index use of corticosteroids and high pre-index healthcare costs could be associated with more severe symptoms at baseline. Patients with vascular disease or severe comorbidities, as evidenced by high CCI scores, make poor candidates for major elective surgeries such as TKR. These results are intuitive and validate the clinical insights of this study. Moreover, inclusion of these covariates in the analysis model allows for indirect adjustment of the most important prognostic factors for TKR at baseline, permitting proper statistical comparison of the results for different cohort groups.
Recently, the efficacy of HA injections for OA patients has become the subject of debate when the American Academy of Orthopaedic Surgeons (AAOS) revised its clinical practice guideline, recommending against the use of HA.21 The AAOS’ findings differ from those of other clinical societies, such as the American College of Rheumatology22 and the European League Against Rheumatism,23 which provide no strong recommendation against the use of HA injections. The announcement of the new guideline by AAOS caused concern among clinicians and payers who had valued IA HA injections as a means to control knee OA pain before patients progress to TKR;24 on the other hand, the demand for nonoperative treatment of knee OA remains high. Utilization rates of TKR have increased dramatically, and surgeries are now performed on younger patients with increasing burden on the healthcare system,25,26 in spite of the fact that as high as a third of TKR surgeries may have been performed in inappropriate patients.27 Part of the confusion surrounding clinical utility of HA stems from the fact that up until recently, relatively little research looked into the practical benefits of HA in actual clinical practice. Analyses of databases such as registries are now gaining attention to overcome that problem. Examination of large administrative databases maintained by commercial payers offers the benefit of probing realistically the safety and efficacy of treatments in actual clinical environments in a very large number of patients with heterogeneous backgrounds. Recently, the Agency for Healthcare Research and Quality’s Technology Assessment Program in the US called for such studies to determine whether HA injections can delay progression to TKR.28 The results of this study and several others11,13,14,16 suggest that use of HA to treat OA of the knee is associated with the delay of TKR, supporting the utility of HA in clinical practice and the healthcare system. Potential clinical benefits of delaying TKR may include the reduced risk of aseptic loosening if younger patients can wait for TKR or more time to allow the modification of risk factors in patients who will ultimately undergo TKR.
LIMITATIONS
Follow-up period was limited to 3 years post-index date because longer follow-up data were not available at the time of the study design. If an incorrect adverse event or OA diagnosis was listed in the medical record, or if the medical record was incomplete, then patients might have been misclassified, resulting in selection bias. The claims dataset includes no uninsured and Medicare patients, as the population in the database consisted primarily of commercially-insured patients in the US. Therefore, the results are most generalizable to other commercially-insured patients in the US. Generalizability to other populations may not be assured if they differ in their accessibility to physician services or prescriptions from the patients in this study. Other treatments such as the nonsteroidal anti-inflammatory drugs used by patients were not included within the pre-specified statistical model because their potential effects were assumed to be short-lived and much less than those of corticosteroid. Including these treatments would overload the statistical model with too many covariates, leading to potential computational instability. The database used provides no information on systemic factors, including plan limits on medication use, that could affect care. Given the large and diverse nature of the healthcare plans in the database. However, these factors should not have materially affected our study results. The claims database also lacks direct indicators of OA disease severity, such as Kellgren-Lawrence scores or patient-reported outcomes, including pain and function questionnaire scores. Our multivariate analysis indirectly makes up for this deficiency by considering other baseline characteristics or clinical indicators that may be correlated with information unavailable in a claims database. Patients who opt to undergo repeated courses of HA treatment may be more inclined to avoid surgery or may naturally experience OA disease progression more slowly, making them potentially different from patients who select to undergo surgery earlier without repeated courses of HA treatment. This condition may introduce a bias that causes difficulty in proving the causality between repeated HA use and delay of TKR.
CONCLUSION
Analysis of the knee OA patient data from a real-world database showed that repeated courses of treatment with HA are safe and are associated with the delay of TKR for up to 3 years. Additional research is needed to evaluate the effects of repeated HA courses on delaying TKR beyond a 3-year period.
- Murphy L, Helmick CG. The impact of osteoarthritis in the United States: a population-health perspective. Am J Nurs. 2012;112(3 Suppl 1):S13-S19.
- Arnold W, Fullerton DS, Holder S, May CS. Viscosupplementation: managed care issues for osteoarthritis of the knee. J Manag Care Pharm. 2007;13(4 Suppl):S3-S19.
- Strand V, Conaghan PG, Lohmander LS, et al. An integrated analysis of five double-blind, randomized controlled trials evaluating the safety and efficacy of a hyaluronan product for intra-articular injection in osteoarthritis of the knee. Osteoarthritis Cartilage. 2006;14(9):859-866.
- Strand V, Baraf HS, Lavin PT, Lim S, Hosokawa H. A multicenter, randomized controlled trial comparing a single intra-articular injection of Gel-200, a new cross-linked formulation of hyaluronic acid, to phosphate buffered saline for treatment of osteoarthritis of the knee. Osteoarthritis Cartilage. 2012;20(5):350-356.
- Strand V, McIntyre LF, Beach WR, Miller LE, Block JE. Safety and efficacy of US-approved viscosupplements for knee osteoarthritis: a systematic review and meta-analysis of randomized, saline-controlled trials. J Pain Res. 2015;8:217-228.
- Bannuru RR, Schmid CH, Kent DM, Vaysbrott EE, Wong JB, McAlindon TE. Comparative effectiveness of pharmacologic interventions for knee osteoarthritis: a systematic review and network meta-analysis. Ann Intern Med. 2015;162(1):46-54.
- Mandl LA, Losina E. Relative efficacy of knee osteoarthritis treatments: are all placebos created equal? Ann Intern Med. 2015;162(1):71-72.
- Kusayama Y, Akamatsu Y, Kumagai K, Kobayashi H, Aratake M, Saito T. Changes in synovial fluid biomarkers and clinical efficacy of intra-articular injections of hyaluronic acid for patients with knee osteoarthritis. J Exp Orthop. 2014;1(1):16. doi:10.1186/s40634-014-0016-7.
- Kaneko K, Higuchi C, Kunugiza Y, et al. Hyaluronan inhibits BMP-induced osteoblast differentiation. FEBS Lett. 2015;589(4):447-454. doi:10.1016/j.febslet.2014.
- Altman RD, Manjoo A, Fierlinger A, Niazi F, Nicholls M. The mechanism of action for hyaluronic acid treatment in the osteoarthritic knee: a systematic review. BMC Musculoskelet Disord. 2015;16:321. doi:10.1186/s12891-015-0775-z.
- Waddell DD, Bricker DC. Total knee replacement delayed with hylan G-F 20 use in patients with grade IV osteoarthritis. J Manag Care Pharm. 2007;13(2):113-121.
- Khan T, Nanchanatt G, Farber K, Jan S. Analysis of the effectiveness of hyaluronic acid in prevention of total knee replacement in osteoarthritis patients. J Manag Care Pharm. 2014;20:S49.
- Abbott T, Altman RD, Dimeff R, et al. Do hyaluronic acid injections delay total knee replacement surgery? Arthritis Rheum. 2013;65(Suppl 10):2139.
- Altman R, Lim S, Steen R, Dasa V. Intra-articular hyaluronic acid delays total knee replacement in patients with knee osteoarthritis: evidence from a large U.S. health claims database. Osteoarthritis Cartilage. 2015;23(Suppl 2):A403-A404.
- Mather RC 3rd, Hug KT, Orlando LA, et al. Economic evaluation of access to musculoskeletal care: the case of waiting for total knee arthroplasty. BMC Musculoskelet Disord. 2014;15:22. doi:10.1186/1471-2474-15-22.
- Waddell DD, Joseph B. Delayed total knee replacement with Hylan G-F 20. J Knee Surg. 2016;29(2):159-168. doi:10.1055/s-0034-1395281.
- Atukorala I, Makovey J, Williams M, Ochoa Albiztegui E, Eyles JP, Hunter DJ. If you have end-stage radiographic knee osteoarthritis can you respond to non-surgical management? Osteoarthritis Cartilage. 2015;23(Suppl 2):A329.
- Strand V, Baraf HS, Lavin PT, Lim S, Hosokawa H. Effectiveness and safety of a multicenter extension and retreatment trial of Gel-200 in patients with knee osteoarthritis. Cartilage. 2012;3(4):297-304. doi:10.1177/1947603512451024.
- Riddle DL, Kong X, Jiranek WA. Two-year incidence and predictors of future knee arthroplasty in persons with symptomatic knee osteoarthritis: preliminary analysis of longitudinal data from the osteoarthritis initiative. Knee. 2009;16(6):494-500.
- Hawker GA, Guan J, Croxford R, et al. A prospective population-based study of the predictors of undergoing total joint arthroplasty. Arthritis Rheum. 2006;54(10):3212-3220.
- Jevsevar DS. Treatment of osteoarthritis of the knee: evidence-based guideline, 2nd edition. J Am Acad Orthop Surg. 2013;21(9):571-576. doi:10.5435/JAAOS-21-09-571.
- Hochberg MC, Altman RD, April KT, et al. American College of Rheumatology 2012 recommendations for the use of nonpharmacologic and pharmacologic therapies in osteoarthritis of the hand, hip, and knee. Arthritis Care Res (Hoboken). 2012;64(4):465-474.
- Jordan KM, Arden NK, Doherty M, et al. EULAR Recommendations 2003: an evidence based approach to the management of knee osteoarthritis: report of a task force of the standing committee for international clinical studies including therapeutic trials (ESCISIT). Ann Rheum Dis. 2003;62(12):1145-1155.
- Bannuru RR, Vaysbrot EE, McIntyre LF. Did the American Academy of Orthopaedic Surgeons osteoarthritis guidelines miss the mark? Arthroscopy. 2014;30(1):86-89. doi:10.1016/j.arthro.2013.10.007.
- Losina E, Thornhill TS, Rome BN, Wright J, Katz JN. The dramatic increase in total knee replacement utilization rates in the United States cannot be fully explained by growth in population size and the obesity epidemic. J Bone Joint Surg Am. 2012;94(3):201-207. doi:10.2106/JBJS.J.01958.
- Weinstein AM, Rome BN, Reichmann WM, et al. Estimating the burden of total knee replacement in the United States. J Bone Joint Surg Am. 2013;95(5):385-392. doi:10.2106/JBJS.L.00206.
- Riddle DL, Jiranek WA, Hayes CW. Use of a validated algorithm to judge the appropriateness of total knee arthroplasty in the United States: a multicenter longitudinal cohort study. Arthritis Rheumatol. 2014;66(8):2134-2143. doi:10.1002/art.38685.
- NewBerry SJ, Fitzgerald JD, Maglione MA, et al. Agency for Healthcare Research and Quality Web site. Systematic Review for Effectiveness of Hyaluronic Acid in the Treatment of Severe Degenerative Joint Disease (DJD) of the Knee: Technology Assessment Report. http://www.ahrq.gov/research/findings/ta/call-for-public-review.html. Published July 23, 2015. Accessed December 22, 2014.
TAKE-HOME POINTS
- Repeated courses of treatment with HA are safe and are associated with the delay of TKR for up to 3 years.
- HA treatment should be considered an important clinical treatment option for patients with knee OA.
- Repeated courses of treatment with HA are safe.
- Repeated courses of HA treatment pose no greater safety risk than a single course of HA treatment.
- Additional research is needed to evaluate the effects of repeated HA courses on delaying TKR beyond a 3-year period.
Treatment of Grade III Acromioclavicular Separations in Professional Baseball Pitchers: A Survey of Major League Baseball Team Physicians
ABSTRACT
Despite advancements in surgical technique and understanding of throwing mechanics, controversy persists regarding the treatment of grade III acromioclavicular (AC) joint separations, particularly in throwing athletes. Twenty-eight major league baseball (MLB) orthopedic team physicians were surveyed to determine their definitive management of a grade III AC separation in the dominant arm of a professional baseball pitcher and their experience treating AC joint separations in starting pitchers and position players. Return-to-play outcomes were also evaluated. Twenty (71.4%) team physicians recommended nonoperative intervention compared to 8 (28.6%) who would have operated acutely. Eighteen (64.3%) team physicians had treated at least 1 professional pitcher with a grade III AC separation; 51 (77.3%) pitchers had been treated nonoperatively compared to 15 (22.7%) operatively. No difference was observed in the proportion of pitchers who returned to the same level of play (P = .54), had full, unrestricted range of motion (P = .23), or had full pain relief (P = .19) between the operatively and nonoperatively treated MLB pitchers. The majority (53.6%) of physicians would not include an injection if the injury was treated nonoperatively. Open coracoclavicular reconstruction (65.2%) was preferred for operative cases; 66.7% of surgeons would also include distal clavicle excision as an adjunct procedure. About 90% of physicians would return pitchers to throwing >12 weeks after surgery compared to after 4 to 6 weeks in nonoperatively treated cases. In conclusion, MLB team physicians preferred nonoperative management for an acute grade III AC joint separation in professional pitchers. If operative intervention is required, ligament reconstruction with adjunct distal clavicle excision were the most commonly performed procedures.
Continue to: Despite advancements in surgucal technique...
Despite advancements in surgical technique and improved understanding of the physiology of throwing mechanics, controversy persists regarding the preferred treatment for grade III acromioclavicular (AC) joint separations.1-6 Nonsurgical management has demonstrated return to prior function with fewer complications.7 However, there is a growing body of evidence demonstrating that surgical intervention is associated with more favorable outcomes8 and should be considered in patients who place high functional demands on their shoulders.9
The reported results on professional athletes in the literature remain ambivalent. Multiple small case reports/series have reported successful nonoperative treatment of elite athletes.10-12 Not surprisingly, McFarland and colleagues13 reported in 1997 that 69% of major league baseball (MLB) team physicians preferred nonoperative treatment for a theoretical starting pitcher sustaining a grade III AC separation 1 week prior to the start of the season. In contrast, reports of an inability to throw at a pre-injury level are equally commonplace.14,15 Nevertheless, all of these studies were limited to small cohorts, as the incidence of grade III AC separations in elite throwing athletes is relatively uncommon.13,16
In this study, we re-evaluated the study performed by McFarland and colleagues13 in 1997 by surveying all active MLB team orthopedic surgeons. We asked them how they would treat a grade III AC separation in a starting professional baseball pitcher. The physicians were also asked about their personal experience evaluating outcomes in these elite athletes. Given our improved understanding of the anatomy, pathophysiology, and surgical techniques for treating grade III AC separations, we hypothesize that more MLB team physicians would favor operative intervention treatment in professional baseball pitchers, as their vocation places higher demands on their shoulders.
MATERIALS AND METHODS
A questionnaire (Appendix A) was distributed to the team physicians of all 30 MLB teams. In addition to surgeon demographics, including age, years in practice, and years of taking care of an MLB team, the initial section of the questionnaire asked orthopedic surgeons how they would treat a theoretical starting pitcher who sustained a grade III AC joint separation of the dominant throwing arm 1 week prior to the start of the season. Physicians who preferred nonoperative treatment were asked whether they would use an injection (and what type), as well as when they would allow the pitcher to start a progressive interval throwing program. Physicians who preferred operative treatment were asked to rank their indications for operating, what procedure they would use (eg, open vs arthroscopic or coracoclavicular ligament repair vs reconstruction), and whether the surgical intervention would include distal clavicle excision. Both groups of physicians were also asked if their preferred treatment would change if the injury were to occur at the end of the season.
The second portion of the questionnaire asked surgeons about their experience treating AC joint separations in both starting pitchers and position players, as well as to describe the long-term outcomes of their preferred treatment, including time to return to full clearance for pitching, whether their patients returned to their prior level of play, and whether these patients had full pain relief. Finally, physicians were asked if any of the nonoperatively treated players ultimately crossed over and required operative intervention.
Continue to: Statistics...
STATISTICS
Descriptive statistics were used for continuous variables, and frequencies were used for categorical variables. Linear regression was performed to determine the correlation between the physician’s training or experience in treating AC joint separations and their recommended treatment. Fischer’s exact test/chi-square analysis was used to compare categorical variables. All tests were conducted using 2-sided hypothesis testing with statistical significance set at P < .05. All statistical analyses were conducted with SPSS 21.0 software (IBM Corporation).
RESULTS
A total of 28 MLB team physicians completed the questionnaires from 18 of the 30 MLB teams. The average age of the responders was 50.5 years (range, 34-60 years), with an average of 18.2 years in practice (range, 2-30 years) and 10.8 years (range, 1-24 years) taking care of their current professional baseball team. About 82% of the team physicians completed a sports medicine fellowship. On average, physicians saw 16.6 (range, 5-50) grade III or higher AC joint separations per year, and operated on 4.6 (range, 0-10) per year.
Nonoperative treatment was the preferred treatment for a grade III AC joint separation in a starting professional baseball pitcher for the majority of team physicians (20/28). No correlation was observed between the physician’s age (P = .881), years in practice (P = .915), years taking care of their professional team (P = .989), percentage of practice focused on shoulders (P = .986), number of AC joint injuries seen (P = .325), or number of surgeries performed per year (P = .807) with the team physician’s preferred treatment. Compared to the proportion reported originally by McFarland and colleagues13 in 1997 (69%), there was no difference in the proportion of team physicians that recommended nonoperative treatment (P = 1).
If treating this injury nonoperatively, 46.4% of physicians would also use an injection, with orthobiologics (eg, platelet-rich plasma) as the most popular choice (Table 1). No consensus was provided on the timeframe to return pitchers back to a progressive interval throwing program; however, 46.67% of physicians would return pitchers 4 to 6 weeks after a nonoperatively treated injury, while 35.7% would return pitchers 7 to 12 weeks after the initial injury.
Table 1. Treatment Preferences of Grade III AC Separation by MLB Team Physicians
Nonoperativea | |
Yes injection | 13 (46.4%) |
Cortisone | 3 (23.1%) |
Orthobiologic | 10 (76.9%) |
Local anesthetic (eg, lidocaine) | 1 (7.7%) |
Intramuscular toradol | 3 (23.1%) |
No injection | 15 (53.6%) |
Operativea | |
Open coracoclavicular ligament repair | 3 (13.0%) |
Open coracoclavicular ligament reconstruction | 15 (65.2%) |
Arthroscopic reconstruction with graft | 6 (26.1%) |
Arthroscopic repair with implant (ie, tight-rope) | 2 (8.7%) |
Distal clavicle excisionb | 16 (66.7%) |
Would not intervene operatively | 5 (17.9%) |
|
|
aRespondents were allowed to choose more than 1 treatment in each category. bChosen as an adjunct treatment.
Abbreviations: AC, acromioclavicular; MLB, major league baseball.
Most physicians (64.3%) cited functional limitations as the most important reason for indicating operative treatment, followed by pain (21.4%), and a deformity (14.3%). About 65% preferred open coracoclavicular ligament reconstruction. No physician recommended the Weaver-Dunn procedure or use of hardware (eg, hook plate). Of those who preferred an operative intervention, 66.7% would also include a distal clavicle excision, which is significantly higher than the proportion reported by McFarland and colleagues13 (23%, P = .0170). About 90% of physicians would return pitchers to play >12 weeks after operative treatment.
Continue to: If the injury occurred at the end ...
If the injury occurred at the end of the season, 7 of the 20 orthopedists (35%) who recommended nonoperative treatment said they would change to an operative intervention. Eighteen of 28 responders would have the same algorithm for MLB position players. Team physicians were less likely to recommend operative intervention in position players due to less demand on the arm and increased ability to accommodate the injury by altering their throwing mechanics.
Eighteen (64%) of the team physicians had treated at least 1 professional pitcher with a grade III AC separation in his dominant arm, and 11 (39.3%) had treated >1. Collectively, team physicians had treated 15 professional pitchers operatively, and 51 nonoperatively; only 3 patients converted to operative intervention after a failed nonoperative treatment.
Of the pitchers treated operatively, 93.3% (14) of pitchers returned to their prior level of pitching. The 1 patient who failed to return to the same level of pitching retired instead of returning to play. About 80% (12) of the pitchers had full pain relief, and 93.3% (14) had full range of motion (ROM). The pitcher who failed to regain full ROM also had a concomitant rotator cuff repair. The only complication reported from an operative intervention was a pitcher who sustained a coracoid fracture 10 months postoperatively while throwing 100 mph. Of the pitchers treated nonoperatively, 96% returned to their prior level of pitching, 92.2% (47) had full complete pain relief when throwing, and 100% had full ROM. No differences were observed between the proportion of pitchers who returned to their prior level of pitching, regained full ROM, or had full pain relief in the operative and nonoperative groups (Table 2).
Table 2. Outcomes of Treatment of Grade III AC Separation in 58 Professional Baseball Players
| Operative | Nonoperative | P-value |
Return to same level of play | 14/15 (93.3%) | 49/51 (96%) | 0.54 |
Full pain relief | 12/15 (80%) | 47/51 (92.2%) | 0.19 |
Full ROM | 14/15 (93.3%) | 51/51 (100%) | 0.23 |
Abbreviations: AC, acromioclavicular; ROM, range of motion.
DISCUSSION
Controversy persists regarding the optimal management of acute grade III AC separations, with the current available evidence potentially suggesting better cosmetic and radiological results but no definite differences in clinical results.1-6,17,18 In the absence of formal clinical practice guidelines, surgeons rely on their own experience or defer to the anecdotal experience of experts in the field. Our initial hypothesis was false in this survey of MLB team physicians taking care of overhead throwing athletes at the highest level. Our results demonstrate that despite improved techniques and an increased understanding of the pathophysiology of AC joint separations, conservative management is still the preferred treatment for acute grade III AC joint separations in professional baseball pitchers. The proportion of team physicians recommending nonoperative treatment in our series was essentially equivalent to the results reported by McFarland and colleagues13 in 1997, suggesting that the pendulum continues to favor conservative management initially. This status quo likely reflects both the dearth of literature suggesting a substantial benefit of acute operative repair, as well as the ability to accommodate with conservative measures after most grade III AC injuries, even at the highest level of athletic competition.
These results are also consistent with trends from the last few decades. In the 1970s, the overwhelming preference for treating an acute complete AC joint separation was surgical repair, with Powers and Bach10 reporting in a 1974 survey of 163 chairmen of orthopedic programs around the country that 91.5% advocated surgical treatment. However, surgical preference had reversed by the 1990s. Of the 187 chairmen and 59 team physicians surveyed by Cox19 in 1992, 72% and 86% respectively preferred nonoperative treatment in a theoretical 21-year-old athlete with a grade III AC separation. Nissen and Chatterjee20 reported in 2007 on a survey of all American Orthopaedic Society for Sports Medicine surgeons (N = 577) and Accreditation Council for Graduate Medical Education orthopedic program residency directors (N = 87) that >80% of responders preferred conservative measures for this acute injury. The reversal of trends has also been corroborated by recent multicenter trials demonstrating no difference in clinical outcomes between operative and nonoperative treatment of high grade AC joint dislocations, albeit these patients were not all high level overhead throwing athletes.17,18
Continue to: The trends in surgical interventions are notable...
The trends in surgical interventions are notable within the smaller subset of patients who are indicated for operative repair. Use of hardware and primary ligament repair, while popular in the surveys conducted in the 1970s10 and 1990s13 and even present in Nissen and Chatterjee’s20 2007 survey, were noticeably absent from our survey results, with the majority of respondents preferring open coracoclavicular ligament reconstruction. The role of distal clavicle excision has also expanded, from 23% of team physicians recommending it in 199713 to 57% to 59% in Nissen and Chatterjee’s20 2007 survey, to 66.7% in our series. This trend is not surprising as several recent cadaveric biomechanical studies have demonstrated that not only do peak graft forces not increase significantly,21 the anterior-posterior and superior-inferior motion at the AC joint following ligament reconstruction is maintained despite resection of the lateral clavicle.22 Additionally, primary distal clavicle excision may prevent the development of post-traumatic arthritis at the AC joint and osteolysis of the distal clavicle as a possible pain generator in the future.23 However, some respondents cautioned against performing a concomitant distal clavicle excision, as some biomechanical data demonstrate that resecting the distal clavicle may lead to increased horizontal translation at the AC joint despite intact superior and posterior AC capsules.24 Professional baseball pitchers may also be more lax and thus prone to more instability. Primary repair or reconstruction may not always lead to complete pre-injury stability in these individuals. This subtle unrecognized instability is hard to diagnosis and may be a persistent source of pain; thus, adding a distal clavicle excision may actually exacerbate the instability.
The nuanced indications for operative intervention, such as the presence of associated lesions were not captured by our survey.25 While most team physicians cited functional limitations as their most common reason for offering surgery, several MLB orthopedic surgeons also commented on evaluating the stability of the AC joint after a grade III injury, akin to the consensus statement from the International Society of Arthroscopy, Knee Surgery and Orthopaedic Sports Medicine (ISAKOS) Upper Extremity Committee26 in 2014 that diversified the Rockwood Grade III AC joint separation into its IIIA and IIIB classifications. The ISAKOS recommendations include initial conservative management and a second evaluation (both clinical and radiographic) for grade III lesions 3 to 6 weeks after the injury. However, as professional baseball is an incredibly profitable sport with an annual revenue approaching $9.5 billion27 and pitching salaries up to $32.5 million in 2015, serious financial considerations must be given to players who wish to avoid undergoing delayed surgery.
This study has shortcomings typical of expert opinion papers. The retrospective nature of this study places the data at risk of recall bias. Objective data (eg, terminal ROM, pain relief, and return to play) were obtained from a retrospective chart review; however, no standard documentation or collection method was used given the number of surgeons involved and, thus, conclusions based on treatment outcomes are imperfect. Another major weakness of this survey is the relatively small number of patients and respondents. An a priori power analysis was not available, as this was a retrospective review. A comparative trial will be necessary to definitively support one treatment over another. Assuming a 95% return to play in the nonoperatively treated group, approximately 300 patients would be needed in a prospective 2-armed study with 80% power to detect a 10% reduction in the incidence of return to play using an alpha level of 0.05 and assuming no loss to follow-up. This sample size would be difficult to achieve in this patient population.
However, compared to past series,13 the number of professional baseball players treated by the collective experience of these MLB team physicians is the largest reported to date. As suggested above, the rarity of this condition in elite athletes precludes the ability to have matched controls to definitively determine the optimal treatment, which may explain the lack of difference in the return to play, ROM, and pain relief outcomes. Instead, we can only extrapolate based on the collective anecdotal experience of the MLB team physicians.
CONCLUSION
Despite advances in surgical technique and understanding of throwing mechanics, the majority of MLB team physicians preferred nonoperative management for an acute grade III AC joint separation in a professional baseball pitcher. Open coracoclavicular ligament reconstruction was preferred for those who preferred operative intervention. An increasing number of orthopedic surgeons now consider a distal clavicle excision as an adjunct procedure.
This paper will be judged for the Resident Writer’s Award.
- Spencer EE Jr. Treatment of grade III acromioclavicular joint injuries: a systematic review. Clin Orthop Relat Res. 2007;455:38-44. doi:10.1097/BLO.0b013e318030df83.
- Ceccarelli E, Bondì R, Alviti F, Garofalo R, Miulli F, Padua R. Treatment of acute grade III acromioclavicular dislocation: A lack of evidence. J Orthop Traumatol. 2008;9(2):105-108. doi:10.1007/s10195-008-0013-7.
- Smith TO, Chester R, Pearse EO, Hing CB. Operative versus non-operative management following rockwood grade III acromioclavicular separation: a meta-analysis of the current evidence base. J Orthop Traumatol. 2011;12(1):19-27. doi:10.1007/s10195-011-0127-1.
- Beitzel K, Cote MP, Apostolakos J, et al. Current concepts in the treatment of acromioclavicular joint dislocations. Arthroscopy. 2013;29(2):387-397. doi:10.1016/j.arthro.2012.11.023.
- Korsten K, Gunning AC, Leenen LP. Operative or conservative treatment in patients with rockwood type III acromioclavicular dislocation: a systematic review and update of current literature. Int Orthop. 2014;38(4):831-838. doi:10.1007/s00264-013-2143-7.
- Modi CS, Beazley J, Zywiel MG, Lawrence TM, Veillette CJ. Controversies relating to the management of acromioclavicular joint dislocations. Bone Joint J. 2013;95-B(12):1595-1602. doi:10.1302/0301-620X.95B12.31802.
- Reid D, Polson K, Johnson L. Acromioclavicular joint separations grades I-III: a review of the literature and development of best practice guidelines. Sports Med. 2012;42(8):681-696. doi:10.2165/11633460-000000000-00000.
- Farber AJ, Cascio BM, Wilckens JH. Type III acromioclavicular separation: rationale for anatomical reconstruction. Am J Orthop. 2008;37(7):349-355.
- Li X, Ma R, Bedi A, Dines DM, Altchek DW, Dines JS. Management of acromioclavicular joint injuries. J Bone Joint Surg Am. 2014;96(1):73-84. doi:10.2106/JBJS.L.00734.
- Powers JA, Bach PJ. Acromioclavicular separations. Closed or open treatment? Clin Orthop Relat Res. 1974;104(104):213-223. doi:10.1097/00003086-197410000-00024.
- Glick JM, Milburn LJ, Haggerty JF, Nishimoto D. Dislocated acromioclavicular joint: follow-up study of 35 unreduced acromioclavicular dislocations. Am J Sports Med. 1977;5(6):264-270. doi:10.1177/036354657700500614.
- Watson ST, Wyland DJ. Return to play after nonoperative management for a severe type III acromioclavicular separation in the throwing shoulder of a collegiate pitcher. Phys Sportsmed. 2015;43(1):99-103. doi:10.1080/00913847.2015.1001937.
- McFarland EG, Blivin SJ, Doehring CB, Curl LA, Silberstein C. Treatment of grade III acromioclavicular separations in professional throwing athletes: results of a survey. Am J Orthop. 1997;26(11):771-774.
- Wojtys EM, Nelson G. Conservative treatment of grade III acromioclavicular dislocations. Clin Orthop Relat Res. 1991;268(268):112-119.
- Galpin RD, Hawkins RJ, Grainger RW. A comparative analysis of operative versus nonoperative treatment of grade III acromioclavicular separations. Clin Orthop Relat Res. 1985;193(193):150-155. doi:10.1097/00003086-198503000-00020.
- Pallis M, Cameron KL, Svoboda SJ, Owens BD. Epidemiology of acromioclavicular joint injury in young athletes. Am J Sports Med. 2012;40(9):2072-2077. doi:10.1177/0363546512450162.
- Canadian Orthopaedic Trauma Society. Multicenter randomized clinical trial of nonoperative versus operative treatment of acute acromio-clavicular joint dislocation. J Orthop Trauma. 2015;29(11):479-487. doi:10.1097/BOT.0000000000000437.
- Joukainen A, Kröger H, Niemitukia L, Mäkelä EA, Väätäinen U. Results of operative and nonoperative treatment of rockwood types III and V acromioclavicular joint dislocation: a prospective, randomized trial with an 18- to 20-year follow-up. Orthop J Sports Med. 2014;2(12):2325967114560130. doi:10.1177/2325967114560130.
- Cox JS. Current method of treatment of acromioclavicular joint dislocations. Orthopedics. 1992;15(9):1041-1044.
- Nissen CW, Chatterjee A. Type III acromioclavicular separation: results of a recent survey on its management. Am J Orthop. 2007;36(2):89-93.
- Kowalsky MS, Kremenic IJ, Orishimo KF, McHugh MP, Nicholas SJ, Lee SJ. The effect of distal clavicle excision on in situ graft forces in coracoclavicular ligament reconstruction. Am J Sports Med. 2010;38(11):2313-2319. doi:10.1177/0363546510374447.
- Beaver AB, Parks BG, Hinton RY. Biomechanical analysis of distal clavicle excision with acromioclavicular joint reconstruction. Am J Sports Med. 2013;41(7):1684-1688. doi:10.1177/0363546513488750.
- Mumford EB. Acromioclavicular dislocation. J Bone Joint Surg Am. 1941;23:799-802.
- Beitzel K, Sablan N, Chowaniec DM, et al. Sequential resection of the distal clavicle and its effects on horizontal acromioclavicular joint translation. Am J Sports Med. 2012;40(3):681-685. doi:10.1177/0363546511428880.
- Arrigoni P, Brady PC, Zottarelli L, et al. Associated lesions requiring additional surgical treatment in grade 3 acromioclavicular joint dislocations. Arthroscopy. 2014;30(1):6-10. doi:10.1016/j.arthro.2013.10.006.
- Beitzel K, Mazzocca AD, Bak K, et al. ISAKOS upper extremity committee consensus statement on the need for diversification of the rockwood classification for acromioclavicular joint injuries. Arthroscopy. 2014;30(2):271-278. doi:10.1016/j.arthro.2013.11.005.
- Brown M. MLB sees record revenues for 2015, up $500 million and approaching $9.5 billion. Forbes Web site. http://www.forbes.com/sites/maurybrown/2015/12/04/mlb-sees-record-revenu.... Published December 4, 2015. Accessed February 4, 2016.
ABSTRACT
Despite advancements in surgical technique and understanding of throwing mechanics, controversy persists regarding the treatment of grade III acromioclavicular (AC) joint separations, particularly in throwing athletes. Twenty-eight major league baseball (MLB) orthopedic team physicians were surveyed to determine their definitive management of a grade III AC separation in the dominant arm of a professional baseball pitcher and their experience treating AC joint separations in starting pitchers and position players. Return-to-play outcomes were also evaluated. Twenty (71.4%) team physicians recommended nonoperative intervention compared to 8 (28.6%) who would have operated acutely. Eighteen (64.3%) team physicians had treated at least 1 professional pitcher with a grade III AC separation; 51 (77.3%) pitchers had been treated nonoperatively compared to 15 (22.7%) operatively. No difference was observed in the proportion of pitchers who returned to the same level of play (P = .54), had full, unrestricted range of motion (P = .23), or had full pain relief (P = .19) between the operatively and nonoperatively treated MLB pitchers. The majority (53.6%) of physicians would not include an injection if the injury was treated nonoperatively. Open coracoclavicular reconstruction (65.2%) was preferred for operative cases; 66.7% of surgeons would also include distal clavicle excision as an adjunct procedure. About 90% of physicians would return pitchers to throwing >12 weeks after surgery compared to after 4 to 6 weeks in nonoperatively treated cases. In conclusion, MLB team physicians preferred nonoperative management for an acute grade III AC joint separation in professional pitchers. If operative intervention is required, ligament reconstruction with adjunct distal clavicle excision were the most commonly performed procedures.
Continue to: Despite advancements in surgucal technique...
Despite advancements in surgical technique and improved understanding of the physiology of throwing mechanics, controversy persists regarding the preferred treatment for grade III acromioclavicular (AC) joint separations.1-6 Nonsurgical management has demonstrated return to prior function with fewer complications.7 However, there is a growing body of evidence demonstrating that surgical intervention is associated with more favorable outcomes8 and should be considered in patients who place high functional demands on their shoulders.9
The reported results on professional athletes in the literature remain ambivalent. Multiple small case reports/series have reported successful nonoperative treatment of elite athletes.10-12 Not surprisingly, McFarland and colleagues13 reported in 1997 that 69% of major league baseball (MLB) team physicians preferred nonoperative treatment for a theoretical starting pitcher sustaining a grade III AC separation 1 week prior to the start of the season. In contrast, reports of an inability to throw at a pre-injury level are equally commonplace.14,15 Nevertheless, all of these studies were limited to small cohorts, as the incidence of grade III AC separations in elite throwing athletes is relatively uncommon.13,16
In this study, we re-evaluated the study performed by McFarland and colleagues13 in 1997 by surveying all active MLB team orthopedic surgeons. We asked them how they would treat a grade III AC separation in a starting professional baseball pitcher. The physicians were also asked about their personal experience evaluating outcomes in these elite athletes. Given our improved understanding of the anatomy, pathophysiology, and surgical techniques for treating grade III AC separations, we hypothesize that more MLB team physicians would favor operative intervention treatment in professional baseball pitchers, as their vocation places higher demands on their shoulders.
MATERIALS AND METHODS
A questionnaire (Appendix A) was distributed to the team physicians of all 30 MLB teams. In addition to surgeon demographics, including age, years in practice, and years of taking care of an MLB team, the initial section of the questionnaire asked orthopedic surgeons how they would treat a theoretical starting pitcher who sustained a grade III AC joint separation of the dominant throwing arm 1 week prior to the start of the season. Physicians who preferred nonoperative treatment were asked whether they would use an injection (and what type), as well as when they would allow the pitcher to start a progressive interval throwing program. Physicians who preferred operative treatment were asked to rank their indications for operating, what procedure they would use (eg, open vs arthroscopic or coracoclavicular ligament repair vs reconstruction), and whether the surgical intervention would include distal clavicle excision. Both groups of physicians were also asked if their preferred treatment would change if the injury were to occur at the end of the season.
The second portion of the questionnaire asked surgeons about their experience treating AC joint separations in both starting pitchers and position players, as well as to describe the long-term outcomes of their preferred treatment, including time to return to full clearance for pitching, whether their patients returned to their prior level of play, and whether these patients had full pain relief. Finally, physicians were asked if any of the nonoperatively treated players ultimately crossed over and required operative intervention.
Continue to: Statistics...
STATISTICS
Descriptive statistics were used for continuous variables, and frequencies were used for categorical variables. Linear regression was performed to determine the correlation between the physician’s training or experience in treating AC joint separations and their recommended treatment. Fischer’s exact test/chi-square analysis was used to compare categorical variables. All tests were conducted using 2-sided hypothesis testing with statistical significance set at P < .05. All statistical analyses were conducted with SPSS 21.0 software (IBM Corporation).
RESULTS
A total of 28 MLB team physicians completed the questionnaires from 18 of the 30 MLB teams. The average age of the responders was 50.5 years (range, 34-60 years), with an average of 18.2 years in practice (range, 2-30 years) and 10.8 years (range, 1-24 years) taking care of their current professional baseball team. About 82% of the team physicians completed a sports medicine fellowship. On average, physicians saw 16.6 (range, 5-50) grade III or higher AC joint separations per year, and operated on 4.6 (range, 0-10) per year.
Nonoperative treatment was the preferred treatment for a grade III AC joint separation in a starting professional baseball pitcher for the majority of team physicians (20/28). No correlation was observed between the physician’s age (P = .881), years in practice (P = .915), years taking care of their professional team (P = .989), percentage of practice focused on shoulders (P = .986), number of AC joint injuries seen (P = .325), or number of surgeries performed per year (P = .807) with the team physician’s preferred treatment. Compared to the proportion reported originally by McFarland and colleagues13 in 1997 (69%), there was no difference in the proportion of team physicians that recommended nonoperative treatment (P = 1).
If treating this injury nonoperatively, 46.4% of physicians would also use an injection, with orthobiologics (eg, platelet-rich plasma) as the most popular choice (Table 1). No consensus was provided on the timeframe to return pitchers back to a progressive interval throwing program; however, 46.67% of physicians would return pitchers 4 to 6 weeks after a nonoperatively treated injury, while 35.7% would return pitchers 7 to 12 weeks after the initial injury.
Table 1. Treatment Preferences of Grade III AC Separation by MLB Team Physicians
Nonoperativea | |
Yes injection | 13 (46.4%) |
Cortisone | 3 (23.1%) |
Orthobiologic | 10 (76.9%) |
Local anesthetic (eg, lidocaine) | 1 (7.7%) |
Intramuscular toradol | 3 (23.1%) |
No injection | 15 (53.6%) |
Operativea | |
Open coracoclavicular ligament repair | 3 (13.0%) |
Open coracoclavicular ligament reconstruction | 15 (65.2%) |
Arthroscopic reconstruction with graft | 6 (26.1%) |
Arthroscopic repair with implant (ie, tight-rope) | 2 (8.7%) |
Distal clavicle excisionb | 16 (66.7%) |
Would not intervene operatively | 5 (17.9%) |
|
|
aRespondents were allowed to choose more than 1 treatment in each category. bChosen as an adjunct treatment.
Abbreviations: AC, acromioclavicular; MLB, major league baseball.
Most physicians (64.3%) cited functional limitations as the most important reason for indicating operative treatment, followed by pain (21.4%), and a deformity (14.3%). About 65% preferred open coracoclavicular ligament reconstruction. No physician recommended the Weaver-Dunn procedure or use of hardware (eg, hook plate). Of those who preferred an operative intervention, 66.7% would also include a distal clavicle excision, which is significantly higher than the proportion reported by McFarland and colleagues13 (23%, P = .0170). About 90% of physicians would return pitchers to play >12 weeks after operative treatment.
Continue to: If the injury occurred at the end ...
If the injury occurred at the end of the season, 7 of the 20 orthopedists (35%) who recommended nonoperative treatment said they would change to an operative intervention. Eighteen of 28 responders would have the same algorithm for MLB position players. Team physicians were less likely to recommend operative intervention in position players due to less demand on the arm and increased ability to accommodate the injury by altering their throwing mechanics.
Eighteen (64%) of the team physicians had treated at least 1 professional pitcher with a grade III AC separation in his dominant arm, and 11 (39.3%) had treated >1. Collectively, team physicians had treated 15 professional pitchers operatively, and 51 nonoperatively; only 3 patients converted to operative intervention after a failed nonoperative treatment.
Of the pitchers treated operatively, 93.3% (14) of pitchers returned to their prior level of pitching. The 1 patient who failed to return to the same level of pitching retired instead of returning to play. About 80% (12) of the pitchers had full pain relief, and 93.3% (14) had full range of motion (ROM). The pitcher who failed to regain full ROM also had a concomitant rotator cuff repair. The only complication reported from an operative intervention was a pitcher who sustained a coracoid fracture 10 months postoperatively while throwing 100 mph. Of the pitchers treated nonoperatively, 96% returned to their prior level of pitching, 92.2% (47) had full complete pain relief when throwing, and 100% had full ROM. No differences were observed between the proportion of pitchers who returned to their prior level of pitching, regained full ROM, or had full pain relief in the operative and nonoperative groups (Table 2).
Table 2. Outcomes of Treatment of Grade III AC Separation in 58 Professional Baseball Players
| Operative | Nonoperative | P-value |
Return to same level of play | 14/15 (93.3%) | 49/51 (96%) | 0.54 |
Full pain relief | 12/15 (80%) | 47/51 (92.2%) | 0.19 |
Full ROM | 14/15 (93.3%) | 51/51 (100%) | 0.23 |
Abbreviations: AC, acromioclavicular; ROM, range of motion.
DISCUSSION
Controversy persists regarding the optimal management of acute grade III AC separations, with the current available evidence potentially suggesting better cosmetic and radiological results but no definite differences in clinical results.1-6,17,18 In the absence of formal clinical practice guidelines, surgeons rely on their own experience or defer to the anecdotal experience of experts in the field. Our initial hypothesis was false in this survey of MLB team physicians taking care of overhead throwing athletes at the highest level. Our results demonstrate that despite improved techniques and an increased understanding of the pathophysiology of AC joint separations, conservative management is still the preferred treatment for acute grade III AC joint separations in professional baseball pitchers. The proportion of team physicians recommending nonoperative treatment in our series was essentially equivalent to the results reported by McFarland and colleagues13 in 1997, suggesting that the pendulum continues to favor conservative management initially. This status quo likely reflects both the dearth of literature suggesting a substantial benefit of acute operative repair, as well as the ability to accommodate with conservative measures after most grade III AC injuries, even at the highest level of athletic competition.
These results are also consistent with trends from the last few decades. In the 1970s, the overwhelming preference for treating an acute complete AC joint separation was surgical repair, with Powers and Bach10 reporting in a 1974 survey of 163 chairmen of orthopedic programs around the country that 91.5% advocated surgical treatment. However, surgical preference had reversed by the 1990s. Of the 187 chairmen and 59 team physicians surveyed by Cox19 in 1992, 72% and 86% respectively preferred nonoperative treatment in a theoretical 21-year-old athlete with a grade III AC separation. Nissen and Chatterjee20 reported in 2007 on a survey of all American Orthopaedic Society for Sports Medicine surgeons (N = 577) and Accreditation Council for Graduate Medical Education orthopedic program residency directors (N = 87) that >80% of responders preferred conservative measures for this acute injury. The reversal of trends has also been corroborated by recent multicenter trials demonstrating no difference in clinical outcomes between operative and nonoperative treatment of high grade AC joint dislocations, albeit these patients were not all high level overhead throwing athletes.17,18
Continue to: The trends in surgical interventions are notable...
The trends in surgical interventions are notable within the smaller subset of patients who are indicated for operative repair. Use of hardware and primary ligament repair, while popular in the surveys conducted in the 1970s10 and 1990s13 and even present in Nissen and Chatterjee’s20 2007 survey, were noticeably absent from our survey results, with the majority of respondents preferring open coracoclavicular ligament reconstruction. The role of distal clavicle excision has also expanded, from 23% of team physicians recommending it in 199713 to 57% to 59% in Nissen and Chatterjee’s20 2007 survey, to 66.7% in our series. This trend is not surprising as several recent cadaveric biomechanical studies have demonstrated that not only do peak graft forces not increase significantly,21 the anterior-posterior and superior-inferior motion at the AC joint following ligament reconstruction is maintained despite resection of the lateral clavicle.22 Additionally, primary distal clavicle excision may prevent the development of post-traumatic arthritis at the AC joint and osteolysis of the distal clavicle as a possible pain generator in the future.23 However, some respondents cautioned against performing a concomitant distal clavicle excision, as some biomechanical data demonstrate that resecting the distal clavicle may lead to increased horizontal translation at the AC joint despite intact superior and posterior AC capsules.24 Professional baseball pitchers may also be more lax and thus prone to more instability. Primary repair or reconstruction may not always lead to complete pre-injury stability in these individuals. This subtle unrecognized instability is hard to diagnosis and may be a persistent source of pain; thus, adding a distal clavicle excision may actually exacerbate the instability.
The nuanced indications for operative intervention, such as the presence of associated lesions were not captured by our survey.25 While most team physicians cited functional limitations as their most common reason for offering surgery, several MLB orthopedic surgeons also commented on evaluating the stability of the AC joint after a grade III injury, akin to the consensus statement from the International Society of Arthroscopy, Knee Surgery and Orthopaedic Sports Medicine (ISAKOS) Upper Extremity Committee26 in 2014 that diversified the Rockwood Grade III AC joint separation into its IIIA and IIIB classifications. The ISAKOS recommendations include initial conservative management and a second evaluation (both clinical and radiographic) for grade III lesions 3 to 6 weeks after the injury. However, as professional baseball is an incredibly profitable sport with an annual revenue approaching $9.5 billion27 and pitching salaries up to $32.5 million in 2015, serious financial considerations must be given to players who wish to avoid undergoing delayed surgery.
This study has shortcomings typical of expert opinion papers. The retrospective nature of this study places the data at risk of recall bias. Objective data (eg, terminal ROM, pain relief, and return to play) were obtained from a retrospective chart review; however, no standard documentation or collection method was used given the number of surgeons involved and, thus, conclusions based on treatment outcomes are imperfect. Another major weakness of this survey is the relatively small number of patients and respondents. An a priori power analysis was not available, as this was a retrospective review. A comparative trial will be necessary to definitively support one treatment over another. Assuming a 95% return to play in the nonoperatively treated group, approximately 300 patients would be needed in a prospective 2-armed study with 80% power to detect a 10% reduction in the incidence of return to play using an alpha level of 0.05 and assuming no loss to follow-up. This sample size would be difficult to achieve in this patient population.
However, compared to past series,13 the number of professional baseball players treated by the collective experience of these MLB team physicians is the largest reported to date. As suggested above, the rarity of this condition in elite athletes precludes the ability to have matched controls to definitively determine the optimal treatment, which may explain the lack of difference in the return to play, ROM, and pain relief outcomes. Instead, we can only extrapolate based on the collective anecdotal experience of the MLB team physicians.
CONCLUSION
Despite advances in surgical technique and understanding of throwing mechanics, the majority of MLB team physicians preferred nonoperative management for an acute grade III AC joint separation in a professional baseball pitcher. Open coracoclavicular ligament reconstruction was preferred for those who preferred operative intervention. An increasing number of orthopedic surgeons now consider a distal clavicle excision as an adjunct procedure.
This paper will be judged for the Resident Writer’s Award.
- Spencer EE Jr. Treatment of grade III acromioclavicular joint injuries: a systematic review. Clin Orthop Relat Res. 2007;455:38-44. doi:10.1097/BLO.0b013e318030df83.
- Ceccarelli E, Bondì R, Alviti F, Garofalo R, Miulli F, Padua R. Treatment of acute grade III acromioclavicular dislocation: A lack of evidence. J Orthop Traumatol. 2008;9(2):105-108. doi:10.1007/s10195-008-0013-7.
- Smith TO, Chester R, Pearse EO, Hing CB. Operative versus non-operative management following rockwood grade III acromioclavicular separation: a meta-analysis of the current evidence base. J Orthop Traumatol. 2011;12(1):19-27. doi:10.1007/s10195-011-0127-1.
- Beitzel K, Cote MP, Apostolakos J, et al. Current concepts in the treatment of acromioclavicular joint dislocations. Arthroscopy. 2013;29(2):387-397. doi:10.1016/j.arthro.2012.11.023.
- Korsten K, Gunning AC, Leenen LP. Operative or conservative treatment in patients with rockwood type III acromioclavicular dislocation: a systematic review and update of current literature. Int Orthop. 2014;38(4):831-838. doi:10.1007/s00264-013-2143-7.
- Modi CS, Beazley J, Zywiel MG, Lawrence TM, Veillette CJ. Controversies relating to the management of acromioclavicular joint dislocations. Bone Joint J. 2013;95-B(12):1595-1602. doi:10.1302/0301-620X.95B12.31802.
- Reid D, Polson K, Johnson L. Acromioclavicular joint separations grades I-III: a review of the literature and development of best practice guidelines. Sports Med. 2012;42(8):681-696. doi:10.2165/11633460-000000000-00000.
- Farber AJ, Cascio BM, Wilckens JH. Type III acromioclavicular separation: rationale for anatomical reconstruction. Am J Orthop. 2008;37(7):349-355.
- Li X, Ma R, Bedi A, Dines DM, Altchek DW, Dines JS. Management of acromioclavicular joint injuries. J Bone Joint Surg Am. 2014;96(1):73-84. doi:10.2106/JBJS.L.00734.
- Powers JA, Bach PJ. Acromioclavicular separations. Closed or open treatment? Clin Orthop Relat Res. 1974;104(104):213-223. doi:10.1097/00003086-197410000-00024.
- Glick JM, Milburn LJ, Haggerty JF, Nishimoto D. Dislocated acromioclavicular joint: follow-up study of 35 unreduced acromioclavicular dislocations. Am J Sports Med. 1977;5(6):264-270. doi:10.1177/036354657700500614.
- Watson ST, Wyland DJ. Return to play after nonoperative management for a severe type III acromioclavicular separation in the throwing shoulder of a collegiate pitcher. Phys Sportsmed. 2015;43(1):99-103. doi:10.1080/00913847.2015.1001937.
- McFarland EG, Blivin SJ, Doehring CB, Curl LA, Silberstein C. Treatment of grade III acromioclavicular separations in professional throwing athletes: results of a survey. Am J Orthop. 1997;26(11):771-774.
- Wojtys EM, Nelson G. Conservative treatment of grade III acromioclavicular dislocations. Clin Orthop Relat Res. 1991;268(268):112-119.
- Galpin RD, Hawkins RJ, Grainger RW. A comparative analysis of operative versus nonoperative treatment of grade III acromioclavicular separations. Clin Orthop Relat Res. 1985;193(193):150-155. doi:10.1097/00003086-198503000-00020.
- Pallis M, Cameron KL, Svoboda SJ, Owens BD. Epidemiology of acromioclavicular joint injury in young athletes. Am J Sports Med. 2012;40(9):2072-2077. doi:10.1177/0363546512450162.
- Canadian Orthopaedic Trauma Society. Multicenter randomized clinical trial of nonoperative versus operative treatment of acute acromio-clavicular joint dislocation. J Orthop Trauma. 2015;29(11):479-487. doi:10.1097/BOT.0000000000000437.
- Joukainen A, Kröger H, Niemitukia L, Mäkelä EA, Väätäinen U. Results of operative and nonoperative treatment of rockwood types III and V acromioclavicular joint dislocation: a prospective, randomized trial with an 18- to 20-year follow-up. Orthop J Sports Med. 2014;2(12):2325967114560130. doi:10.1177/2325967114560130.
- Cox JS. Current method of treatment of acromioclavicular joint dislocations. Orthopedics. 1992;15(9):1041-1044.
- Nissen CW, Chatterjee A. Type III acromioclavicular separation: results of a recent survey on its management. Am J Orthop. 2007;36(2):89-93.
- Kowalsky MS, Kremenic IJ, Orishimo KF, McHugh MP, Nicholas SJ, Lee SJ. The effect of distal clavicle excision on in situ graft forces in coracoclavicular ligament reconstruction. Am J Sports Med. 2010;38(11):2313-2319. doi:10.1177/0363546510374447.
- Beaver AB, Parks BG, Hinton RY. Biomechanical analysis of distal clavicle excision with acromioclavicular joint reconstruction. Am J Sports Med. 2013;41(7):1684-1688. doi:10.1177/0363546513488750.
- Mumford EB. Acromioclavicular dislocation. J Bone Joint Surg Am. 1941;23:799-802.
- Beitzel K, Sablan N, Chowaniec DM, et al. Sequential resection of the distal clavicle and its effects on horizontal acromioclavicular joint translation. Am J Sports Med. 2012;40(3):681-685. doi:10.1177/0363546511428880.
- Arrigoni P, Brady PC, Zottarelli L, et al. Associated lesions requiring additional surgical treatment in grade 3 acromioclavicular joint dislocations. Arthroscopy. 2014;30(1):6-10. doi:10.1016/j.arthro.2013.10.006.
- Beitzel K, Mazzocca AD, Bak K, et al. ISAKOS upper extremity committee consensus statement on the need for diversification of the rockwood classification for acromioclavicular joint injuries. Arthroscopy. 2014;30(2):271-278. doi:10.1016/j.arthro.2013.11.005.
- Brown M. MLB sees record revenues for 2015, up $500 million and approaching $9.5 billion. Forbes Web site. http://www.forbes.com/sites/maurybrown/2015/12/04/mlb-sees-record-revenu.... Published December 4, 2015. Accessed February 4, 2016.
TAKE-HOME POINTS
- There was no difference in return to previous level of play between professional pitchers treated nonoperatively and operatively for grade III AC separation.
- MLB team physicians prefer nonoperative management for acute grade III AC joint separation in professional pitchers.
- The majority of MLB physicians do not use injections for nonoperative treatment of grade III AC separations; however, use of orthobiologics (eg, PRP) is becoming more commonplace.
- Persistent functional limitations and pain are the most common surgical indications for treatment of grade III AC separation in high level throwing athletes.
- If operative intervention is indicated for grade III AC separation, open coracoclavicular reconstruction and adjunct distal clavicle excision are preferred by most MLB team physicians.
Biomechanical Analysis of a Novel Buried Fixation Technique Using Headless Compression Screws for the Treatment of Patella Fractures
ABSTRACT
The traditional technique for patella fracture fixation utilizes prominent hardware. Prominent hardware use, however, results in a high rate of reoperation for symptomatic implant removal. This biomechanical study evaluates the effectiveness of a novel patella fixation technique that minimizes implant prominence.
Patellar transverse osteotomies were created in 13 pairs of cadaveric knees. Paired knees were assigned to either standard fixation (SF) using cannulated partially threaded screws and stainless steel wire tension band, or buried fixation (BF) using headless compression screws with a No. 2 FiberWire tension band and a No. 5 FiberWire cerclage suture. Quadriceps tendons were cyclically loaded to full extension followed by load to failure. The gap across the fracture site, stiffness, and load to failure were measured.
The differences in stiffness and load to failure between the 2 groups were not statistically significant. During cyclic loading, significantly greater gapping was observed across the fracture site in the BF group compared with SF group (P < .05).
Both constructs failed under loads that exceeded typical loads experienced during the postoperative rehabilitation period. Nevertheless, the BF technique demonstrated larger gap formation and a reduced load to failure than the SF technique. Further clinical studies are therefore underway to determine whether the use of constructs with decreased stability but increased patient comfort could improve clinical outcomes and reduce reoperation rates.
Continue to: Patella fractures are common...
Patella fractures are common injuries that can cause considerable disability to the knee extensor apparatus.1-3 Transverse patella fractures are the most common fracture pattern associated with patella fractures.{Harrell, 2003 #3}2 Given that the patella plays a crucial role in knee extensor biomechanics, its proper integrity is vital for physiological knee motion and ambulation.4 Traditionally, patella fractures with >2 mm of displacement have been managed with cannulated screws or Kirschner wires (K-wires) and a stainless-steel wire tension band.5-9 The goal in the treatment of patellar fractures is to reduce fracture fragments accurately and to minimize additional insults to the articular cartilage.10
Despite advances in surgical protocols and acceptable radiographic outcomes, functional impairment remains common after the treatment of patella fractures. Functional impairment includes knee pain, screw head pain, implant removal, wire breakage, and patella baja.1 The need for implant removal is one of the most common complications following the open reduction internal fixation of patella fractures.2,11 The subcutaneous and exposed nature of the patella in conjunction with soft tissue irritation resulting from standard fixation (SF) predisposes the patient toward prominence and discomfort with the retained implant. Although nonunion rates are low, the rate of implant removal can reach as high as 52%.2,10-12 To overcome some of these complications, we designed a novel buried fixation (BF) method for the treatment of transverse fractures. Our method minimizes the amount of exposed implant to improve patient comfort and potentially reduce the need for future implant removal. These effects are achieved by using headless compression screws and nonabsorbable sutures to attenuate the soft tissue irritation associated with traditional fixation.13 While our novel technique has demonstrated improved clinical results, it has not been tested biomechanically against a traditional fixation technique. Therefore, this study aims to evaluate and compare the structural integrity of our novel BF technique with that of the standard technique that uses cannulated screws and wire tension band. We hypothesized that the stability provided by our technique would be similar to that provided by SF for transverse patella fractures.
MATERIALS AND METHODS
SPECIMEN PREPARATION
Thirteen matched pairs of fresh-frozen human cadaveric knees were obtained from a Cedars-Sinai approved tissue bank. Specimens were cut midfemur and were intact to the foot. Legs with major structural bony or ligamentous abnormalities, extensor mechanism disruption, or septic knees were excluded from testing. To assess the bone quality of each specimen prior to testing, dual-energy X-ray absorptiometry was performed using a GE Lunar iDXA scanner (GE Healthcare). Specimens were stored at −30°C and thawed at room temperature for 24 hours prior to biomechanical testing.
A midline anterior approach to the patella was performed, and the extensor retinaculum, quadriceps tendon, and patellar tendon were exposed. A digital caliper was used to measure the craniocaudal and mediolateral dimensions of the patella, and a transverse osteotomy (Arbeitsgemeinschaft für Osteosynthesefragen/Orthopaedic Trauma Association [AO/OTA] type 34-C1) was created at the midway point between superior and inferior poles by using an oscillating saw. The retinaculum was then incised to the level of the midaxial line of the femur. One leg from each matched pair was allocated to the SF group, and the other was allocated to the BF group. Left and right legs were alternately assigned to each group to ensure that laterality was balanced between the 2 groups.
SURGICAL TECHNIQUE
The repair of the specimens in the SF group involved the use of 2 parallel 4.0-mm partially threaded cannulated screws (Acumed) and an 18-gauge monofilament steel wire (Ethicon) in a figure-eight tension band (Figure 1A). The repair of the specimens in the BF group involved the use of 2 parallel standard Acutrak headless compression screws (Acumed), a No. 2 FiberWire (Arthrex) in a figure-eight tension band, and a No. 5 FiberWire (Arthrex) was applied as cerclage around the patella (Figure 1B).
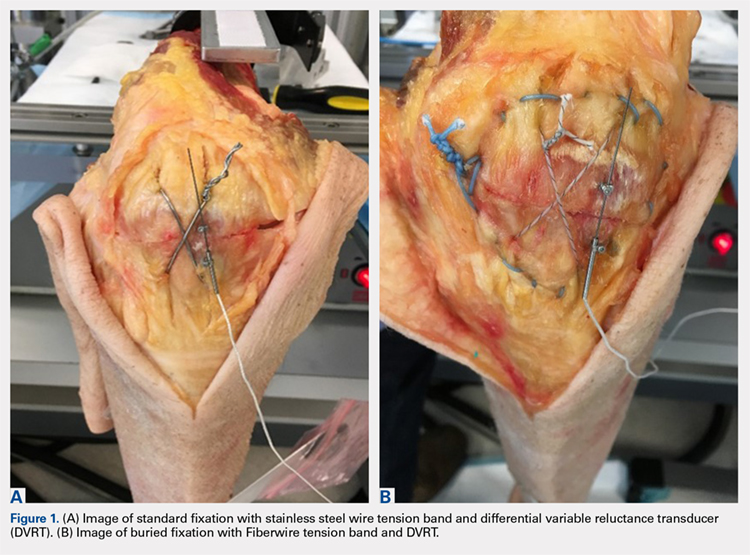
Continue to: Mechanical testing...
MECHANICAL TESTING
Mechanical testing was performed on a biaxial 370.02 Bionix Testing System (MTS Systems Corp.). The femur was rigidly and horizontally secured to a custom-built test frame, and the lower leg was left free to move. The quadriceps tendon was secured in a freeze clamp and was attached to the MTS actuator for loading via a pulley system such that raising the actuator was translated into a simulated quadriceps extensor force.
A differential variable reluctance transducer (DVRT) (Lord MicroStrain) was placed across the osteotomy site to measure the distraction, or gap, across the fracture line. The minimum load to full extension for each specimen was then determined under a slow, controlled increase in load until the leg was in a fully extended position. Any distraction across the fracture line during the initial loading phase was determined by using digital calipers. The specimen was then subjected to a preconditioning phase with 10 cycles from 0 N to full extension under the previously determined load, which was applied at the rate of 5 N/s. Meanwhile, displacement across the fracture site was recorded via the DVRT. Following the preconditioning phase, each specimen was then tested to failure in displacement control at the rate of 1.5 mm/s. Failure was defined as implant failure (screw pullout) or DVRT gapping across the osteotomy site >3 mm.10,14
Outcome measures included stiffness (N/mm), which was calculated as the slope of the linear change in load from full extension to failure vs DVRT displacement during the final loading phase; failure load (N); gapping (mm) across the osteotomy site at each cycle during the preconditioning phase; and failure mode (pullout vs >3.0 mm gap).
STATISTICAL ANALYSIS
An a priori power analysis revealed that 13 knees per group would be required to obtain an α of 0.05 and a power of 0.80. This calculation was based on a 20% difference in fracture displacement calculated by using the standard deviation and mean previously reported for cannulated screws with nonabsorbable sutures.14
Means and standard deviations for all dependent outcome measures were computed and compared across the independent measure of fixation type (BF vs SF) through repeated measures Analysis of variance (ANOVA-GLM, SAS 9.3, SAS Institute, Inc.) after controlling for bone mineral density (BMD), gender, and age. Multivariate repeated-measures ANOVA with Tukey's studentized range was applied to cyclic gap data. The mode of failure was compared across fixation type (BF vs SF) for matched data using McNemar’s test. Intracorrelations were computed and examined over all data and separately on the basis of screw fixation type (BF vs SF). All tests were considered statistically significant when P < .05.
Continue to: Results...
RESULTS
Specimen donors were 46% (6/13) male with an average age of 78.5 years (±13.77; range, 56-91 years) and 54% (7/13) female with an average age of 76.57 years (±14.37; range, 59-102 years). Average BMD was significantly lower in female (0.71 ± 0.18) than in male specimens (1.15 ± 0.33) (P < .05).
The average load to full extension across all specimens was 272 N (±54; range, 160-360 N) and was well balanced across matched pairs (270 ± 56 N for BF and 273 ± 54 N for SF). Of the 13 BF specimens, 4 experienced distraction across the fracture line during the determination of the minimum load to full extension. This initial pretest gap was measured with digital calipers (average, 1.5 mm; range, 0.90-1.85 mm) and added as an offset to the respective DVRT displacement data recorded during testing.
The total number of specimens included in the displacement data calculations decreased from 13 to 11 per group because DVRT data were not recorded during cyclic loading for 1 specimen and were considered unreliable in another. The maximum displacement measured across the fracture site during cyclic loading was significantly higher in the BF (0.94 ± 1.21) group than in the SF group (0.19 ± 0.26) as shown in the Table. The average slope of the gap per cycle for each specimen was calculated and compared between the BF and SF groups. The BF group demonstrated a significantly greater increase in gap per cycle than the SF group (Figure 2). Stiffness during load to failure was calculated for all but 1 specimen that did not display any measurable displacement during the final loading cycle. The average final stiffness and failure load between the BF and SF groups were not significantly different (Table). An equal number of specimens in both groups failed through gapping (6/13) and pullout (7/13).
Table. Means and Standard Deviations of the Main Outcome Measures
| Standard Fixation | Buried Fixation | N | P-value |
Load at Failure (N) | 1112.78 ± 457.25 | 973.20 ± 321.38 | 13 | 0.265 |
Final Stiffness (N/mm) | 358.42 ± 165.45 | 445.33 ± 310.09 | 11 | 0.175 |
Max Cyclic Gap (mm) | 0.19 ± 0.26 | 0.94 ± 1.21 | 11 | 0.026a |
Pullout: Gap Failure (ratio) | 7:6 | 7:6 | 13 | NS |
aIndicates statistical significance (P < .05).
Abbreviation: NS, not significant.
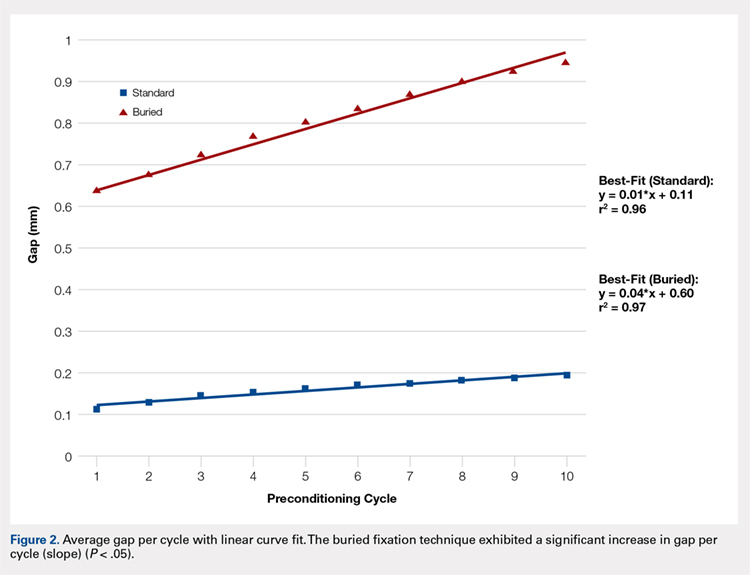
Failure load was significantly positively correlated with BMD (R = 0.62, P < .001) when all specimens were grouped together. When analyzed separately, the SF group was significantly correlated with BMD (P < .01), whereas the BF group had a marginally significant correlation (P = .06) with BMD (Figure 3). In both groups, BMD was positively correlated with stiffness and negatively correlated with gapping. Neither of these trends, however, was significant.
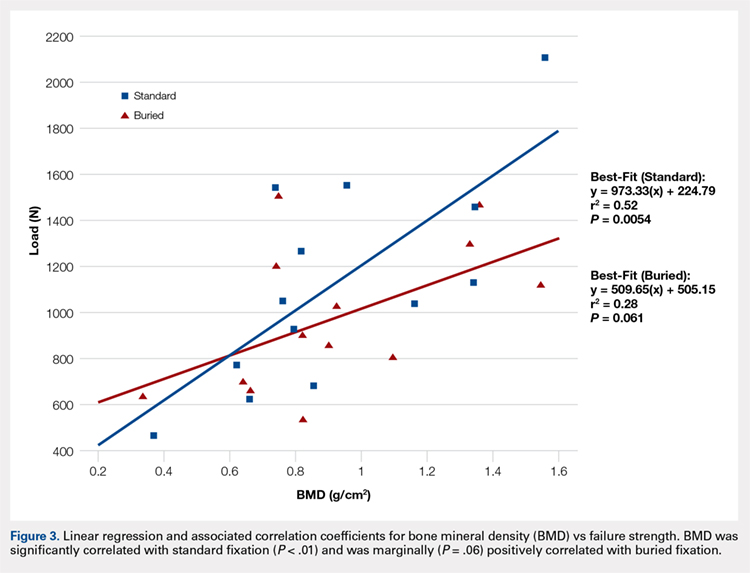
Continue to: Discussion...
DISCUSSION
We proposed a novel BF technique for the treatment of noncomminuted transverse patella fractures. Our technique utilizes headless cannulated compression screws and nonabsorbable suture tension bands. We then biomechanically compared our proposed technique with an established fixation technique that uses partially threaded cannulated screws and stainless steel wire tension bands. We hypothesized that the mechanical response of the BF technique to cyclic and failure loading would be similar to that of the SF technique. Our results demonstrate a significant increase in gap formation across the fracture site among knees and an overall reduced load to failure in the BF group (Figure 2). Whether these inferior results manifest clinically is not yet established. Both constructs could withstand forces that are typically experienced during the postoperative period. Given the high rate of symptomatic implant removal associated with the traditional technique, the low-profile buried technique might be an attractive alternative that provides increased patient comfort but may require an extended period of postoperative protection against bony ingrowths.
Patellar fixation constructs that use a combination of cannulated screws and a wire tension band provide the best resistance to patella fracture displacement when compared with screws or wires alone.4,15 Although this combination is biomechanically favorable, the steel wire often causes the painful irritation of the surrounding soft tissues and can break or migrate, thus increasing the rates of implant removal surgery to as high as 52%.4,10,12,15 We developed our novel BF technique, which uses headless compression screws and a No. 2 FiberWire tension band, to address the high rates of reoperation and patient dissatisfaction associated with the SF technique.
Headless compression screws have been successfully used in the reduction and fixation of scaphoid fractures and sesamoid fractures.16,17 The pull-out strengths of these screws are comparable with those of other commonly used screws, such as Twinfix and Herbert-Whipple screws.16 Similarly, the strength of a No. 5 FiberWire is comparable with that of an 18-gauge stainless-steel wire.14,18 Several studies have also obtained good outcomes with nonmetallic constructs that use nonabsorbable sutures alone.19,20 In this study, we utilized a No. 2 FiberWire as the tension band. The use of the No. 2 FiberWire facilitated threading through headless cannulated screws and created a low-profile knot. However, the use of thin FiberWire, despite a No. 5 FiberWire cerclage, likely contributed to the increase in distraction across the fracture.
The highest patellofemoral joint reaction force during level walking is approximately 35 kg (half body weight), which is equivalent to 350 N.15,21,22 This force is similar to the average cyclic load used in this experiment (272 ± 54 N). Gapping increased in the BF group but did not reach the defined failure value of 3 mm, and the ultimate load to failure was relatively high across both groups (SF, 1123 N; BF, 973 N). These results suggest that both fixation methods can withstand the typical patellofemoral joint forces that are experienced during the postoperative period.4 In addition, in a clinical setting, patients are placed in hinged knee braces for at least 2 weeks to limit their flexion angle and to allow for healing and bony ingrowth. Postoperative knee-brace protection presumably increases the overall strength of the fixation.
The number of specimens (n = 26) evaluated in this study was greater than that used in other biomechanical patella fracture studies.14 Furthermore, none of our specimens were reused. Our study design was further strengthened given that fellowship-trained trauma surgeons performed all surgical procedures. Finally, the data collection and analysis of numerous clinically relevant factors, such as BMD, age, and cyclical loading, contributed to the comprehensive description of each technique with respect to patient-specific criteria.
Similar to all cadaveric studies, our data only represent the immediate postoperative condition and does not represent any healing that would occur during postoperative rehabilitation. Postoperative knee-brace protection and bone healing across the fracture site would likely strengthen both constructs in a clinical setting. In addition, the average age of our specimens is 77.5 years, and therefore does not best represent the age range (20-50 years) of the typical adult population affected by patella fractures.3,23,24 Finally, postsurgical reduction was confirmed through visual inspection and not through fluoroscopy as in a clinical setting. Radiographic images were obtained after each experiment only to confirm screw placement post facto (Figures 4A, 4B).
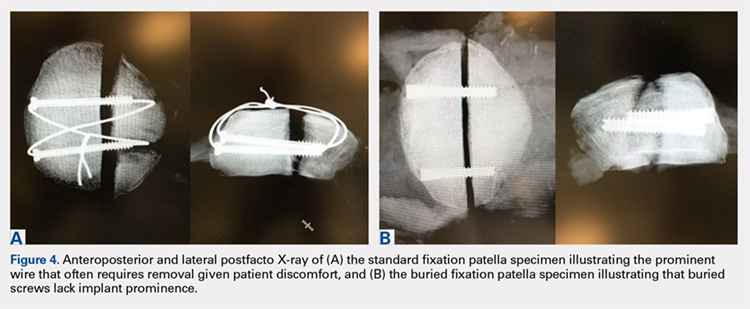
CONCLUSION
This study demonstrates the utility of a novel BF technique. Nevertheless, the proposed technique exhibited increased gapping and a lower load to failure than the current gold standard. The significance of these inferior results in clinical and functional settings has not been established. The proposed BF technique may be an appealing alternative to the SF technique given its low profile and potential to reduce the rates of future implant removal. Further studies on the long-term outcomes of patients treated through the BF technique are currently under way and will ultimately determine the utility of the proposed construct.
This paper will be judged for the Resident Writer’s Award.
- Lazaro LE, Wellman DS, Sauro G, et al. Outcomes after operative fixation of complete articular patellar fractures: assessment of functional impairment. J Bone Joint Surg Am. 2013;95(14):e96 1-8. doi:10.2106/JBJS.L.00012.
- Bostman O, Kiviluoto O, Santavirta S, Nirhamo J, Wilppula E. Fractures of the patella treated by operation. Arch Orthop Trauma Surg. 1983;102(2):78-81.
- Gwinner C, Märdian S, Schwabe P, Schaser KD, Krapohl BD, Jung TM. Current concepts review: fractures of the patella. GMS Interdiscip Plast Reconstr Surg DGPW. 2016;5:Doc01. doi:10.3205/iprs000080.
- Carpenter JE, Kasman RA, Patel N, Lee ML, Goldstein SA. Biomechanical evaluation of current patella fracture fixation techniques. J Orthop Trauma. 1997;11(5):351-356.
- Patel VR, Parks BG, Wang Y, Ebert FR, Jinnah RH. Fixation of patella fractures with braided polyester suture: a biomechanical study. Injury. 2000;31(1):1-6.
- Harrell RM, Tong J, Weinhold PS, Dahners LE. Comparison of the mechanical properties of different tension band materials and suture techniques. J Orthop Trauma. 2003;17(2):119-122.
- Banks KE, Ambrose CG, Wheeless JS, Tissue CM, Sen M. An alternative patellar fracture fixation: a biomechanical study. J Orthop Trauma. 2013;27(6):345-351. doi:10.1097/BOT.0b013e31826623eb.
- Thelen S, Schneppendahl J, Baumgartner R, et al. Cyclic long-term loading of a bilateral fixed-angle plate in comparison with tension band wiring with K-wires or cannulated screws in transverse patella fractures. Knee Surg Sports Traumatol Arthrosc. 2013;21(2):311-317. doi:10.1007/s00167-012-1999-1.
- Thelen S, Schneppendahl J, Jopen E, et al. Biomechanical cadaver testing of a fixed-angle plate in comparison to tension wiring and screw fixation in transverse patella fractures. Injury. 2012;43(8):1290-1295. doi:10.1016/j.injury.2012.04.020.
- LeBrun CT, Langford JR, Sagi HC. Functional outcomes after operatively treated patella fractures. J Orthop Trauma. 2012;26(7):422-426. doi:10.1097/BOT.0b013e318228c1a1.
- Dy CJ, Little MT, Berkes MB, et al. Meta-analysis of re-operation, nonunion, and infection after open reduction and internal fixation of patella fractures. J Trauma Acute Care Surg. 2012;73(4):928-932. doi:10.1097/TA.0b013e31825168b6.
- Smith ST, Cramer KE, Karges DE, Watson JT, Moed BR. Early complications in the operative treatment of patella fractures. J Orthop Trauma. 1997;11(3):183-187.
- Berg EE. Open reduction internal fixation of displaced transverse patella fractures with figure-eight wiring through parallel cannulated compression screws. J Orthop Trauma. 1997;11(8):573-576.
- Bryant TL, Anderson CL, Stevens CG, Conrad BP, Vincent HK, Sadasivan KK. Comparison of cannulated screws with FiberWire or stainless steel wire for patella fracture fixation: A pilot study. J Orthop. 2015;12(2):92-96. doi:10.1016/j.jor.2014.04.011.
- Burvant JG, Thomas KA, Alexander R, Harris MB. Evaluation of methods of internal fixation of transverse patella fractures: a biomechanical study. J Orthop Trauma. 1994;8(2):147-153.
- Crawford LA, Powell ES, Trail IA. The fixation strength of scaphoid bone screws: an in vitro investigation using polyurethane foam. J Hand Surg Am. 2012;37(2):255-260. doi:10.1016/j.jhsa.2011.10.021.
- Eddy AL, Galuppo LD, Stover SM, Taylor KT, Jensen DG. A biomechanical comparison of headless tapered variable pitch compression and ao cortical bone screws for fixation of a simulated midbody transverse fracture of the proximal sesamoid bone in horses. Vet Surg. 2004;33(3):253-262. doi:10.1111/j.1532-950X.2004.04037.x.
- Camarda L, La Gattuta A, Butera M, Siragusa F, D'Arienzo M. FiberWire tension band for patellar fractures. J Orthop Traumatol. 2016;17(1):75-80. doi:10.1007/s10195-015-0359-6.
- Camarda L, Morello S, Balistreri F, D'Arienzo A, D'Arienzo M. Non-metallic implant for patellar fracture fixation: A systematic review. Injury. 2016;47(8):1613-1617. doi:10.1016/j.injury.2016.05.039.
- Han F, Pearce CJ, Ng DQ, et al. A double button adjustable loop device is biomechanically equivalent to tension band wire in the fixation of transverse patellar fractures-A cadaveric study. Injury. 2017;48(2):270-276. doi:10.1016/j.injury.2016.11.013.
- Reilly DT, Martens M. Experimental analysis of the quadriceps muscle force and patello-femoral joint reaction force for various activities. Acta Orthop Scand. 1972;43(2):126-137. doi:10.1016/j.injury.2016.11.013.
- Buff HU, Jones LC, Hungerford DS. Experimental determination of forces transmitted through the patello-femoral joint. J Biomech. 1988;21(1):17-23.
- Bostrom A. Fracture of the patella. A study of 422 patellar fractures. Acta Orthop Scand Suppl. 1972;143:1-80.
- Court-Brown CM, Caesar B. Epidemiology of adult fractures: A review. Injury. 2006;37(8):691-697. doi:10.1111/iwj.12675.
ABSTRACT
The traditional technique for patella fracture fixation utilizes prominent hardware. Prominent hardware use, however, results in a high rate of reoperation for symptomatic implant removal. This biomechanical study evaluates the effectiveness of a novel patella fixation technique that minimizes implant prominence.
Patellar transverse osteotomies were created in 13 pairs of cadaveric knees. Paired knees were assigned to either standard fixation (SF) using cannulated partially threaded screws and stainless steel wire tension band, or buried fixation (BF) using headless compression screws with a No. 2 FiberWire tension band and a No. 5 FiberWire cerclage suture. Quadriceps tendons were cyclically loaded to full extension followed by load to failure. The gap across the fracture site, stiffness, and load to failure were measured.
The differences in stiffness and load to failure between the 2 groups were not statistically significant. During cyclic loading, significantly greater gapping was observed across the fracture site in the BF group compared with SF group (P < .05).
Both constructs failed under loads that exceeded typical loads experienced during the postoperative rehabilitation period. Nevertheless, the BF technique demonstrated larger gap formation and a reduced load to failure than the SF technique. Further clinical studies are therefore underway to determine whether the use of constructs with decreased stability but increased patient comfort could improve clinical outcomes and reduce reoperation rates.
Continue to: Patella fractures are common...
Patella fractures are common injuries that can cause considerable disability to the knee extensor apparatus.1-3 Transverse patella fractures are the most common fracture pattern associated with patella fractures.{Harrell, 2003 #3}2 Given that the patella plays a crucial role in knee extensor biomechanics, its proper integrity is vital for physiological knee motion and ambulation.4 Traditionally, patella fractures with >2 mm of displacement have been managed with cannulated screws or Kirschner wires (K-wires) and a stainless-steel wire tension band.5-9 The goal in the treatment of patellar fractures is to reduce fracture fragments accurately and to minimize additional insults to the articular cartilage.10
Despite advances in surgical protocols and acceptable radiographic outcomes, functional impairment remains common after the treatment of patella fractures. Functional impairment includes knee pain, screw head pain, implant removal, wire breakage, and patella baja.1 The need for implant removal is one of the most common complications following the open reduction internal fixation of patella fractures.2,11 The subcutaneous and exposed nature of the patella in conjunction with soft tissue irritation resulting from standard fixation (SF) predisposes the patient toward prominence and discomfort with the retained implant. Although nonunion rates are low, the rate of implant removal can reach as high as 52%.2,10-12 To overcome some of these complications, we designed a novel buried fixation (BF) method for the treatment of transverse fractures. Our method minimizes the amount of exposed implant to improve patient comfort and potentially reduce the need for future implant removal. These effects are achieved by using headless compression screws and nonabsorbable sutures to attenuate the soft tissue irritation associated with traditional fixation.13 While our novel technique has demonstrated improved clinical results, it has not been tested biomechanically against a traditional fixation technique. Therefore, this study aims to evaluate and compare the structural integrity of our novel BF technique with that of the standard technique that uses cannulated screws and wire tension band. We hypothesized that the stability provided by our technique would be similar to that provided by SF for transverse patella fractures.
MATERIALS AND METHODS
SPECIMEN PREPARATION
Thirteen matched pairs of fresh-frozen human cadaveric knees were obtained from a Cedars-Sinai approved tissue bank. Specimens were cut midfemur and were intact to the foot. Legs with major structural bony or ligamentous abnormalities, extensor mechanism disruption, or septic knees were excluded from testing. To assess the bone quality of each specimen prior to testing, dual-energy X-ray absorptiometry was performed using a GE Lunar iDXA scanner (GE Healthcare). Specimens were stored at −30°C and thawed at room temperature for 24 hours prior to biomechanical testing.
A midline anterior approach to the patella was performed, and the extensor retinaculum, quadriceps tendon, and patellar tendon were exposed. A digital caliper was used to measure the craniocaudal and mediolateral dimensions of the patella, and a transverse osteotomy (Arbeitsgemeinschaft für Osteosynthesefragen/Orthopaedic Trauma Association [AO/OTA] type 34-C1) was created at the midway point between superior and inferior poles by using an oscillating saw. The retinaculum was then incised to the level of the midaxial line of the femur. One leg from each matched pair was allocated to the SF group, and the other was allocated to the BF group. Left and right legs were alternately assigned to each group to ensure that laterality was balanced between the 2 groups.
SURGICAL TECHNIQUE
The repair of the specimens in the SF group involved the use of 2 parallel 4.0-mm partially threaded cannulated screws (Acumed) and an 18-gauge monofilament steel wire (Ethicon) in a figure-eight tension band (Figure 1A). The repair of the specimens in the BF group involved the use of 2 parallel standard Acutrak headless compression screws (Acumed), a No. 2 FiberWire (Arthrex) in a figure-eight tension band, and a No. 5 FiberWire (Arthrex) was applied as cerclage around the patella (Figure 1B).
Continue to: Mechanical testing...
MECHANICAL TESTING
Mechanical testing was performed on a biaxial 370.02 Bionix Testing System (MTS Systems Corp.). The femur was rigidly and horizontally secured to a custom-built test frame, and the lower leg was left free to move. The quadriceps tendon was secured in a freeze clamp and was attached to the MTS actuator for loading via a pulley system such that raising the actuator was translated into a simulated quadriceps extensor force.
A differential variable reluctance transducer (DVRT) (Lord MicroStrain) was placed across the osteotomy site to measure the distraction, or gap, across the fracture line. The minimum load to full extension for each specimen was then determined under a slow, controlled increase in load until the leg was in a fully extended position. Any distraction across the fracture line during the initial loading phase was determined by using digital calipers. The specimen was then subjected to a preconditioning phase with 10 cycles from 0 N to full extension under the previously determined load, which was applied at the rate of 5 N/s. Meanwhile, displacement across the fracture site was recorded via the DVRT. Following the preconditioning phase, each specimen was then tested to failure in displacement control at the rate of 1.5 mm/s. Failure was defined as implant failure (screw pullout) or DVRT gapping across the osteotomy site >3 mm.10,14
Outcome measures included stiffness (N/mm), which was calculated as the slope of the linear change in load from full extension to failure vs DVRT displacement during the final loading phase; failure load (N); gapping (mm) across the osteotomy site at each cycle during the preconditioning phase; and failure mode (pullout vs >3.0 mm gap).
STATISTICAL ANALYSIS
An a priori power analysis revealed that 13 knees per group would be required to obtain an α of 0.05 and a power of 0.80. This calculation was based on a 20% difference in fracture displacement calculated by using the standard deviation and mean previously reported for cannulated screws with nonabsorbable sutures.14
Means and standard deviations for all dependent outcome measures were computed and compared across the independent measure of fixation type (BF vs SF) through repeated measures Analysis of variance (ANOVA-GLM, SAS 9.3, SAS Institute, Inc.) after controlling for bone mineral density (BMD), gender, and age. Multivariate repeated-measures ANOVA with Tukey's studentized range was applied to cyclic gap data. The mode of failure was compared across fixation type (BF vs SF) for matched data using McNemar’s test. Intracorrelations were computed and examined over all data and separately on the basis of screw fixation type (BF vs SF). All tests were considered statistically significant when P < .05.
Continue to: Results...
RESULTS
Specimen donors were 46% (6/13) male with an average age of 78.5 years (±13.77; range, 56-91 years) and 54% (7/13) female with an average age of 76.57 years (±14.37; range, 59-102 years). Average BMD was significantly lower in female (0.71 ± 0.18) than in male specimens (1.15 ± 0.33) (P < .05).
The average load to full extension across all specimens was 272 N (±54; range, 160-360 N) and was well balanced across matched pairs (270 ± 56 N for BF and 273 ± 54 N for SF). Of the 13 BF specimens, 4 experienced distraction across the fracture line during the determination of the minimum load to full extension. This initial pretest gap was measured with digital calipers (average, 1.5 mm; range, 0.90-1.85 mm) and added as an offset to the respective DVRT displacement data recorded during testing.
The total number of specimens included in the displacement data calculations decreased from 13 to 11 per group because DVRT data were not recorded during cyclic loading for 1 specimen and were considered unreliable in another. The maximum displacement measured across the fracture site during cyclic loading was significantly higher in the BF (0.94 ± 1.21) group than in the SF group (0.19 ± 0.26) as shown in the Table. The average slope of the gap per cycle for each specimen was calculated and compared between the BF and SF groups. The BF group demonstrated a significantly greater increase in gap per cycle than the SF group (Figure 2). Stiffness during load to failure was calculated for all but 1 specimen that did not display any measurable displacement during the final loading cycle. The average final stiffness and failure load between the BF and SF groups were not significantly different (Table). An equal number of specimens in both groups failed through gapping (6/13) and pullout (7/13).
Table. Means and Standard Deviations of the Main Outcome Measures
| Standard Fixation | Buried Fixation | N | P-value |
Load at Failure (N) | 1112.78 ± 457.25 | 973.20 ± 321.38 | 13 | 0.265 |
Final Stiffness (N/mm) | 358.42 ± 165.45 | 445.33 ± 310.09 | 11 | 0.175 |
Max Cyclic Gap (mm) | 0.19 ± 0.26 | 0.94 ± 1.21 | 11 | 0.026a |
Pullout: Gap Failure (ratio) | 7:6 | 7:6 | 13 | NS |
aIndicates statistical significance (P < .05).
Abbreviation: NS, not significant.
Failure load was significantly positively correlated with BMD (R = 0.62, P < .001) when all specimens were grouped together. When analyzed separately, the SF group was significantly correlated with BMD (P < .01), whereas the BF group had a marginally significant correlation (P = .06) with BMD (Figure 3). In both groups, BMD was positively correlated with stiffness and negatively correlated with gapping. Neither of these trends, however, was significant.
Continue to: Discussion...
DISCUSSION
We proposed a novel BF technique for the treatment of noncomminuted transverse patella fractures. Our technique utilizes headless cannulated compression screws and nonabsorbable suture tension bands. We then biomechanically compared our proposed technique with an established fixation technique that uses partially threaded cannulated screws and stainless steel wire tension bands. We hypothesized that the mechanical response of the BF technique to cyclic and failure loading would be similar to that of the SF technique. Our results demonstrate a significant increase in gap formation across the fracture site among knees and an overall reduced load to failure in the BF group (Figure 2). Whether these inferior results manifest clinically is not yet established. Both constructs could withstand forces that are typically experienced during the postoperative period. Given the high rate of symptomatic implant removal associated with the traditional technique, the low-profile buried technique might be an attractive alternative that provides increased patient comfort but may require an extended period of postoperative protection against bony ingrowths.
Patellar fixation constructs that use a combination of cannulated screws and a wire tension band provide the best resistance to patella fracture displacement when compared with screws or wires alone.4,15 Although this combination is biomechanically favorable, the steel wire often causes the painful irritation of the surrounding soft tissues and can break or migrate, thus increasing the rates of implant removal surgery to as high as 52%.4,10,12,15 We developed our novel BF technique, which uses headless compression screws and a No. 2 FiberWire tension band, to address the high rates of reoperation and patient dissatisfaction associated with the SF technique.
Headless compression screws have been successfully used in the reduction and fixation of scaphoid fractures and sesamoid fractures.16,17 The pull-out strengths of these screws are comparable with those of other commonly used screws, such as Twinfix and Herbert-Whipple screws.16 Similarly, the strength of a No. 5 FiberWire is comparable with that of an 18-gauge stainless-steel wire.14,18 Several studies have also obtained good outcomes with nonmetallic constructs that use nonabsorbable sutures alone.19,20 In this study, we utilized a No. 2 FiberWire as the tension band. The use of the No. 2 FiberWire facilitated threading through headless cannulated screws and created a low-profile knot. However, the use of thin FiberWire, despite a No. 5 FiberWire cerclage, likely contributed to the increase in distraction across the fracture.
The highest patellofemoral joint reaction force during level walking is approximately 35 kg (half body weight), which is equivalent to 350 N.15,21,22 This force is similar to the average cyclic load used in this experiment (272 ± 54 N). Gapping increased in the BF group but did not reach the defined failure value of 3 mm, and the ultimate load to failure was relatively high across both groups (SF, 1123 N; BF, 973 N). These results suggest that both fixation methods can withstand the typical patellofemoral joint forces that are experienced during the postoperative period.4 In addition, in a clinical setting, patients are placed in hinged knee braces for at least 2 weeks to limit their flexion angle and to allow for healing and bony ingrowth. Postoperative knee-brace protection presumably increases the overall strength of the fixation.
The number of specimens (n = 26) evaluated in this study was greater than that used in other biomechanical patella fracture studies.14 Furthermore, none of our specimens were reused. Our study design was further strengthened given that fellowship-trained trauma surgeons performed all surgical procedures. Finally, the data collection and analysis of numerous clinically relevant factors, such as BMD, age, and cyclical loading, contributed to the comprehensive description of each technique with respect to patient-specific criteria.
Similar to all cadaveric studies, our data only represent the immediate postoperative condition and does not represent any healing that would occur during postoperative rehabilitation. Postoperative knee-brace protection and bone healing across the fracture site would likely strengthen both constructs in a clinical setting. In addition, the average age of our specimens is 77.5 years, and therefore does not best represent the age range (20-50 years) of the typical adult population affected by patella fractures.3,23,24 Finally, postsurgical reduction was confirmed through visual inspection and not through fluoroscopy as in a clinical setting. Radiographic images were obtained after each experiment only to confirm screw placement post facto (Figures 4A, 4B).
CONCLUSION
This study demonstrates the utility of a novel BF technique. Nevertheless, the proposed technique exhibited increased gapping and a lower load to failure than the current gold standard. The significance of these inferior results in clinical and functional settings has not been established. The proposed BF technique may be an appealing alternative to the SF technique given its low profile and potential to reduce the rates of future implant removal. Further studies on the long-term outcomes of patients treated through the BF technique are currently under way and will ultimately determine the utility of the proposed construct.
This paper will be judged for the Resident Writer’s Award.
- Lazaro LE, Wellman DS, Sauro G, et al. Outcomes after operative fixation of complete articular patellar fractures: assessment of functional impairment. J Bone Joint Surg Am. 2013;95(14):e96 1-8. doi:10.2106/JBJS.L.00012.
- Bostman O, Kiviluoto O, Santavirta S, Nirhamo J, Wilppula E. Fractures of the patella treated by operation. Arch Orthop Trauma Surg. 1983;102(2):78-81.
- Gwinner C, Märdian S, Schwabe P, Schaser KD, Krapohl BD, Jung TM. Current concepts review: fractures of the patella. GMS Interdiscip Plast Reconstr Surg DGPW. 2016;5:Doc01. doi:10.3205/iprs000080.
- Carpenter JE, Kasman RA, Patel N, Lee ML, Goldstein SA. Biomechanical evaluation of current patella fracture fixation techniques. J Orthop Trauma. 1997;11(5):351-356.
- Patel VR, Parks BG, Wang Y, Ebert FR, Jinnah RH. Fixation of patella fractures with braided polyester suture: a biomechanical study. Injury. 2000;31(1):1-6.
- Harrell RM, Tong J, Weinhold PS, Dahners LE. Comparison of the mechanical properties of different tension band materials and suture techniques. J Orthop Trauma. 2003;17(2):119-122.
- Banks KE, Ambrose CG, Wheeless JS, Tissue CM, Sen M. An alternative patellar fracture fixation: a biomechanical study. J Orthop Trauma. 2013;27(6):345-351. doi:10.1097/BOT.0b013e31826623eb.
- Thelen S, Schneppendahl J, Baumgartner R, et al. Cyclic long-term loading of a bilateral fixed-angle plate in comparison with tension band wiring with K-wires or cannulated screws in transverse patella fractures. Knee Surg Sports Traumatol Arthrosc. 2013;21(2):311-317. doi:10.1007/s00167-012-1999-1.
- Thelen S, Schneppendahl J, Jopen E, et al. Biomechanical cadaver testing of a fixed-angle plate in comparison to tension wiring and screw fixation in transverse patella fractures. Injury. 2012;43(8):1290-1295. doi:10.1016/j.injury.2012.04.020.
- LeBrun CT, Langford JR, Sagi HC. Functional outcomes after operatively treated patella fractures. J Orthop Trauma. 2012;26(7):422-426. doi:10.1097/BOT.0b013e318228c1a1.
- Dy CJ, Little MT, Berkes MB, et al. Meta-analysis of re-operation, nonunion, and infection after open reduction and internal fixation of patella fractures. J Trauma Acute Care Surg. 2012;73(4):928-932. doi:10.1097/TA.0b013e31825168b6.
- Smith ST, Cramer KE, Karges DE, Watson JT, Moed BR. Early complications in the operative treatment of patella fractures. J Orthop Trauma. 1997;11(3):183-187.
- Berg EE. Open reduction internal fixation of displaced transverse patella fractures with figure-eight wiring through parallel cannulated compression screws. J Orthop Trauma. 1997;11(8):573-576.
- Bryant TL, Anderson CL, Stevens CG, Conrad BP, Vincent HK, Sadasivan KK. Comparison of cannulated screws with FiberWire or stainless steel wire for patella fracture fixation: A pilot study. J Orthop. 2015;12(2):92-96. doi:10.1016/j.jor.2014.04.011.
- Burvant JG, Thomas KA, Alexander R, Harris MB. Evaluation of methods of internal fixation of transverse patella fractures: a biomechanical study. J Orthop Trauma. 1994;8(2):147-153.
- Crawford LA, Powell ES, Trail IA. The fixation strength of scaphoid bone screws: an in vitro investigation using polyurethane foam. J Hand Surg Am. 2012;37(2):255-260. doi:10.1016/j.jhsa.2011.10.021.
- Eddy AL, Galuppo LD, Stover SM, Taylor KT, Jensen DG. A biomechanical comparison of headless tapered variable pitch compression and ao cortical bone screws for fixation of a simulated midbody transverse fracture of the proximal sesamoid bone in horses. Vet Surg. 2004;33(3):253-262. doi:10.1111/j.1532-950X.2004.04037.x.
- Camarda L, La Gattuta A, Butera M, Siragusa F, D'Arienzo M. FiberWire tension band for patellar fractures. J Orthop Traumatol. 2016;17(1):75-80. doi:10.1007/s10195-015-0359-6.
- Camarda L, Morello S, Balistreri F, D'Arienzo A, D'Arienzo M. Non-metallic implant for patellar fracture fixation: A systematic review. Injury. 2016;47(8):1613-1617. doi:10.1016/j.injury.2016.05.039.
- Han F, Pearce CJ, Ng DQ, et al. A double button adjustable loop device is biomechanically equivalent to tension band wire in the fixation of transverse patellar fractures-A cadaveric study. Injury. 2017;48(2):270-276. doi:10.1016/j.injury.2016.11.013.
- Reilly DT, Martens M. Experimental analysis of the quadriceps muscle force and patello-femoral joint reaction force for various activities. Acta Orthop Scand. 1972;43(2):126-137. doi:10.1016/j.injury.2016.11.013.
- Buff HU, Jones LC, Hungerford DS. Experimental determination of forces transmitted through the patello-femoral joint. J Biomech. 1988;21(1):17-23.
- Bostrom A. Fracture of the patella. A study of 422 patellar fractures. Acta Orthop Scand Suppl. 1972;143:1-80.
- Court-Brown CM, Caesar B. Epidemiology of adult fractures: A review. Injury. 2006;37(8):691-697. doi:10.1111/iwj.12675.
TAKE-HOME POINTS
- Symptomatic implant removal rates are high after patella fixation with standard techniques.
- Novel buried technique may address the issue of symptomatic implants and is an attractive alternative.
- Both techniques withstand physiologic loads, but the buried technique had overall increased gapping and lower load to failure.
- The significance of these inferior results in clinical and functional settings has not been established.
- Long-term functional outcome studies will delineate the utility of the proposed new construct.
Acne Treatment: Analysis of Acne-Related Social Media Posts and the Impact on Patient Care
Social media has become a prominent source of medical information for patients, including those with dermatologic conditions.1,2 Physicians, patients, and pharmaceutical companies can use social media platforms to communicate with each other and share knowledge and advertisements related to conditions. Social media can influence patients’ perceptions of their disease and serve as a modality to acquire medical treatments.3 Furthermore, social media posts from illicit pharmacies can result in patients buying harmful medications without physician oversight.4,5 Examination of the content and sources of social media posts related to acne may be useful in determining those who are primarily utilizing social media and for what purpose. The goal of this systematic review was to identify sources of acne-related social media posts to determine communication trends to gain a better understanding of the potential impact social media may have on patient care.
Methods
Social media posts were identified (May 2008 to May 2016) using the search terms acne and treatment across all social media platforms available through a commercial social media data aggregating software (Crimson Hexagon). Information from relevant posts was extracted and compiled into a spreadsheet that included the content, post date, social media platform, and hyperlink. To further analyze the data, the first 100 posts on acne treatment from May 2008 to May 2016 were selected and manually classified by the following types of communication: (1) patient-to-patient (eg, testimonies of patients’ medical experiences); (2) professional-to-patient (eg, clinical knowledge or experience provided by a medical provider and/or cited article in reference to relevant treatments); (3) pharmaceutical company–to-patient (eg, information from reputable drug manufacturers regarding drug activity and adverse effects); (4) illicit pharmacy–to-patient (eg, pharmacies with advertisements calling patients to buy a drug online or offering discrete shipping without a prescription)4,5; or (5) other-to-patient (eg, posts that did not contain enough detail to be classified).
Results
Hundreds of thousands of social media posts discussing acne treatment were identified over the 8-year study period (Figure 1). The social media data aggregator extracted posts from various blogs, website comment sections, and online forums, as well as major social media platforms (ie, Facebook, Twitter, Google+, Tumblr). The first 100 posts selected for further analysis included 0 from 2008, 6 from 2009, 36 from 2010, 15 from 2011, 7 from 2012, 8 from 2013, 12 from 2014, 11 from 2015, and 5 from 2016. From this sample, 65 posts were considered to have an illicit source; conversely, 18 posts were from patients and 7 posts were from pharmaceutical companies (Figure 2).


Comment
This study demonstrated that discussion of acne treatment is prevalent in social media. Although our research underrepresents the social media interest in specific acne treatments, as only posts mentioning the terms acne and treatment were evaluated to gain insights into how social media platforms are being used by individuals with cutaneous disease. As such, even with this potential underrepresentation, our study demonstrated a high incidence of illicit marketing of prescription acne medications across multiple social media platforms (Figure 2). The sale of dermatologic pharmaceuticals (eg, isotretinoin) without a prescription is recognized by the US Government as a problem that is rapidly growing.4,5 Illicit pharmacies pose as legitimate pharmacies that can provide prescription medications to consumers without a prescription.5,6 The fact that these illicit pharmacy–to-patient posts were the most abundant in our study may speak to their relative success on social media platforms in encouraging patients to purchase prescription medications without physician oversight. These findings should concern health care providers, as the procurement of prescription medications without a prescription may put patients at risk.
- Alinia H, Moradi Tuchayi S, Farhangian ME, et al. Rosacea patients seeking advice: qualitative analysis of patients’ posts on a rosacea support forum. J Dermatolog Treat. 2016;27:99-102.
- Karimkhani C, Connett J, Boyers L, et al. Dermatology on Instagram. Dermatology Online J. 2014:20. pii:13030/qt71g178w9.
- Smailhodzic E, Hooijsma W, Boonstra A, et al. Social media use in healthcare: a systematic review of effects on patients and on their relationship with healthcare professionals. BMC Health Serv Res. 2016;16:442.
- Lagan BM, Dolk H, White B, et al. Assessing the availability of the teratogenic drug isotretinoin outside the pregnancy prevention programme: a survey of e-pharmacies. Pharmacoepidemiol Drug Saf. 2014;23:411-418.
- Lott JP, Kovarik CL. Availability of oral isotretinoin and terbinafine on the Internet. J Am Acad Dermatol. 2010;62:153-154.
- Mahé E, Beauchet A. Dermatologists and the Internet. J Am Acad Dermatol. 2010;63:908.
Social media has become a prominent source of medical information for patients, including those with dermatologic conditions.1,2 Physicians, patients, and pharmaceutical companies can use social media platforms to communicate with each other and share knowledge and advertisements related to conditions. Social media can influence patients’ perceptions of their disease and serve as a modality to acquire medical treatments.3 Furthermore, social media posts from illicit pharmacies can result in patients buying harmful medications without physician oversight.4,5 Examination of the content and sources of social media posts related to acne may be useful in determining those who are primarily utilizing social media and for what purpose. The goal of this systematic review was to identify sources of acne-related social media posts to determine communication trends to gain a better understanding of the potential impact social media may have on patient care.
Methods
Social media posts were identified (May 2008 to May 2016) using the search terms acne and treatment across all social media platforms available through a commercial social media data aggregating software (Crimson Hexagon). Information from relevant posts was extracted and compiled into a spreadsheet that included the content, post date, social media platform, and hyperlink. To further analyze the data, the first 100 posts on acne treatment from May 2008 to May 2016 were selected and manually classified by the following types of communication: (1) patient-to-patient (eg, testimonies of patients’ medical experiences); (2) professional-to-patient (eg, clinical knowledge or experience provided by a medical provider and/or cited article in reference to relevant treatments); (3) pharmaceutical company–to-patient (eg, information from reputable drug manufacturers regarding drug activity and adverse effects); (4) illicit pharmacy–to-patient (eg, pharmacies with advertisements calling patients to buy a drug online or offering discrete shipping without a prescription)4,5; or (5) other-to-patient (eg, posts that did not contain enough detail to be classified).
Results
Hundreds of thousands of social media posts discussing acne treatment were identified over the 8-year study period (Figure 1). The social media data aggregator extracted posts from various blogs, website comment sections, and online forums, as well as major social media platforms (ie, Facebook, Twitter, Google+, Tumblr). The first 100 posts selected for further analysis included 0 from 2008, 6 from 2009, 36 from 2010, 15 from 2011, 7 from 2012, 8 from 2013, 12 from 2014, 11 from 2015, and 5 from 2016. From this sample, 65 posts were considered to have an illicit source; conversely, 18 posts were from patients and 7 posts were from pharmaceutical companies (Figure 2).
Comment
This study demonstrated that discussion of acne treatment is prevalent in social media. Although our research underrepresents the social media interest in specific acne treatments, as only posts mentioning the terms acne and treatment were evaluated to gain insights into how social media platforms are being used by individuals with cutaneous disease. As such, even with this potential underrepresentation, our study demonstrated a high incidence of illicit marketing of prescription acne medications across multiple social media platforms (Figure 2). The sale of dermatologic pharmaceuticals (eg, isotretinoin) without a prescription is recognized by the US Government as a problem that is rapidly growing.4,5 Illicit pharmacies pose as legitimate pharmacies that can provide prescription medications to consumers without a prescription.5,6 The fact that these illicit pharmacy–to-patient posts were the most abundant in our study may speak to their relative success on social media platforms in encouraging patients to purchase prescription medications without physician oversight. These findings should concern health care providers, as the procurement of prescription medications without a prescription may put patients at risk.
- Alinia H, Moradi Tuchayi S, Farhangian ME, et al. Rosacea patients seeking advice: qualitative analysis of patients’ posts on a rosacea support forum. J Dermatolog Treat. 2016;27:99-102.
- Karimkhani C, Connett J, Boyers L, et al. Dermatology on Instagram. Dermatology Online J. 2014:20. pii:13030/qt71g178w9.
- Smailhodzic E, Hooijsma W, Boonstra A, et al. Social media use in healthcare: a systematic review of effects on patients and on their relationship with healthcare professionals. BMC Health Serv Res. 2016;16:442.
- Lagan BM, Dolk H, White B, et al. Assessing the availability of the teratogenic drug isotretinoin outside the pregnancy prevention programme: a survey of e-pharmacies. Pharmacoepidemiol Drug Saf. 2014;23:411-418.
- Lott JP, Kovarik CL. Availability of oral isotretinoin and terbinafine on the Internet. J Am Acad Dermatol. 2010;62:153-154.
- Mahé E, Beauchet A. Dermatologists and the Internet. J Am Acad Dermatol. 2010;63:908.
Practice Points
- Social media content can influence patients’ perceptions of their disease and serve as a modality to acquire medical treatments, though the source often is unknown.
- This study aimed to identify sources of acne-related social media posts to determine communication trends to gain a better understanding of the potential impact social media may have on patient care.
- Due to the potential for illicit marketing of prescription acne medications across multiple social media platforms, it is important to ask your patients what resources they use to learn about acne and offer to answer any questions regarding acne and its treatment.
Screening for Depression in Rosacea Patients
Rosacea is a chronic skin condition that can be classified into 4 subtypes: erythematotelangiectatic, papulopustular, phymatous, and ocular. Erythematotelangiectatic rosacea is characterized by redness of the face and excessive blushing. Papulopustular rosacea is a more severe form of disease that is characterized by papules and pustules of the central face. If left untreated, these subtypes may progress to phymatous rosacea, which is characterized by skin thickening, fibrosis, and cosmetic disfigurement. Ocular rosacea is characterized by redness and irritation of the eyes.1 Rosacea patients often are burdened with embarrassment, social anxiety, and psychiatric comorbidities.
The Patient Health Questionnaire 9 (PHQ-9) is a validated and reliable self-administered tool for diagnosis of depression and designation of depression severity. This instrument could prove useful in screening for depression in rosacea patients given the high incidence of psychiatric comorbidities in this patient population.2 The PHQ-9 consists of 9 questions that assess for criteria used to define depressive disorders in the Diagnostic and Statistical Manual of Mental Disorders (Fourth Edition).3 The questionnaire is brief, easy to administer, and has 88% specificity and sensitivity.4
Other studies have evaluated the relationship between rosacea and psychiatric illness, but the PHQ-9 was not used as a screening tool.7,8 Rosacea patients are at increased risk for having psychiatrist-diagnosed depression.5 In one assessment, a positive correlation between rosacea and psychiatric illness was noted using the Dermatology Life Quality Index, the rejection scale of the Questionnaire on Experience with Skin Complaints, and the German version of the Hospital Anxiety and Depression Scale.6 Interpretation of Rosacea Quality of Life and Dermatology Life Quality Index scores indicated that rosacea has a negative impact on quality of life.7
The purpose of this study was to examine the relationship between self-assessed rosacea severity scores and level of depression using the validated rosacea self-assessment tool and the PHQ-9 questionnaire, respectively.
Methods
Study Population
Study participants were adult patients from the Wake Forest Baptist Medical Center (Winston-Salem, North Carolina) dermatology clinic from January 2011 to December 2014 who had received a diagnosis of rosacea (International Classification of Diseases, Ninth Revision [ICD-9] code 695.3) from a Wake Forest dermatologist. Institutional review board approval was obtained prior to initiation of the study. Data collection occurred from October 2014 through February 2015. A total of 478 patients met criteria for participation in the study and were identified from the Wake Forest Baptist Hospital Transitional Data Warehouse and the electronic medical record. Because rosacea typically is not diagnosed in children and the data measures are not validated in children, this demographic group was excluded from participation.
Of 478 eligible patients who were invited to participate via mail or telephone, 46 completed the rosacea self-assessment tool and PHQ-9 survey in person. A total of 432 patients were mailed a presurvey recruitment letter notifying them that they would be receiving a survey in the mail unless they contacted the study team to decline participation. An email address and telephone number for the study team was provided. Twenty patients declined to participate in the study; surveys were then mailed to the remaining 412 patients. Sixteen of the mailed surveys were returned by the post office due to an incorrect address.

Self-assessments
Patients selected images to self-identify the severity of their rosacea symptoms, including erythema, papulopustular lesions, ocular symptoms, and nasal involvement by looking at photographs on the self-assessment tool, which showed various rosacea severity levels. Scores ranged from 2 (least severe) to 8 (most severe). The PHQ-9 survey was completed by participants to assess mental health and mood.
Statistical Analysis
Results were reported using descriptive statistics. Regression analysis was performed to identify independent outcome predictors. To study the relationship between age and demographic variables, the population was divided into 2 groups: patients aged 60 years and older and patients younger than 60 years. Correlation of variables with duration of disease also was studied by creating 2 groups: patients with a disease duration of 11 years or longer and patients with a disease duration of less than 11 years. Comparisons were completed between groups using χ2 tests for proportions and t tests or analysis of variance for continuous variables. Analysis of variance was applied among all patients classified according to the following levels of depression: nondepressed, minimal depression symptoms, minor depression, major depression (moderate), and major depression (severe).
Results
There is a direct relationship between rosacea severity and depression when comparing across the following levels of depression: nondepressed, minimal depression symptoms, minor depression, major depression (moderate), and major depression (severe)(P=.006; F=5.18; N=183)
; MDM, major depression (moderate); MD, minor depression; MS, minimal depression symptoms; ND, nondepressed.")
. MDS indicates major depression (severe); MDM, major depression (moderate); MD, minor depression; MS, minimal depression symptoms; ND, nondepressed.")
Most patients reported they were nondepressed (68.9%). As measured by the PHQ-9, 31.1% of patients experienced some level of depression: 21.9% reported minimal depression symptoms, 7.1% reported minor depression, 1.1% reported major depression (moderate), and 1.1% reported major depression (severe)(Table).

Comment
There is a direct relationship between rosacea severity and level of depression. In our study, nearly one-third of patients reported some degree of depression. The reason for this correlation may be due to disease stigmatization and decreased quality of life due to the somatic symptoms of rosacea. Our study reinforced the results of other studies evaluating the psychosocial impact of rosacea.8,9 Depression is associated with poor treatment adherence and poor outcomes in rosacea patients; therefore, depression may serve as an important outcome measure.10 The psychosocial impact of rosacea can be severe, but with disease improvement, there often is an improvement in the patient’s psychosocial status.7
There are several limitations to our study. The study population consisted of patients at a university dermatology clinic who may not be representative of patients in the general population; however, our hospital system does not require referral and provides care to a large percentage of the surrounding community.
Clinical implementation of the validated rosacea self-assessment tool and PHQ-9 may have several benefits. Patient-assessed rosacea severity and psychosocial impact obtained via use of these tools would provide physicians with information to fine-tune rosacea treatment regimens. Patients with the greatest social impact may require a more aggressive treatment approach. Early detection of depression in the rosacea population is important in informing treatment strategy and improving outcomes. Physicians should pay close attention to signs of depression in rosacea patients and determine if psychiatric treatment or referral for psychiatric evaluation is indicated. The correlation between rosacea and depression underscores the importance of treating this highly impactful disease; however, the low number of responders from the major depression (moderate) subgroup prevented us from making any strong conclusion about this specific subgroup.
- Steinhoff M, Schauber J, Leyden JJ. New insights into rosacea pathophysiology: a review of recent findings. J Am Acad Dermatol. 2013;69(6, suppl 1):S15-S26.
- Kroenke K, Spitzer RL. The PHQ-9: a new depression diagnostic and severity measure. Psychol Ann. 2002;32:509-515.
- America Psychiatric Association. Diagnostic and Statistical Manual of Mental Disorders. 4th ed. Washington, DC: American Psychiatric Association; 2000.
- Kroenke K, Spitzer RL, Williams JB. The PHQ-9: validity of a brief depression severity measure. J Gen Intern Med. 2001;16:606-613.
- Gupta MA, Gupta AK, Chen SJ, et al. Comorbidity of rosacea and depression: an analysis of the National Ambulatory Medical Care Survey and National Hospital Ambulatory Care Survey—outpatient department data collected by the US National Center for Health Statistics from 1995 to 2002. Br J Dermatol. 2005;153:1176-1181.
- Böhm D, Schwanitz P, Stock Gissendanner S, et al. Symptom severity and psychological sequelae in rosacea: results of a survey. Psychol Health Med. 2014;19:586-591.
- Moustafa F, Lewallen RS, Feldman SR. The psychological impact of rosacea and the influence of current management options. J Am Acad Dermatol. 2014;71:973-980.
- Halioua B, Cribier B, Frey M, et al. Feelings of stigmatization in patients with rosacea [published online June 21, 2016]. J Eur Acad Dermatol Venereol. 2016;31:163-168.
- Bewley A, Fowler J, Schöfer H, et al. Erythema of rosacea impairs health-related quality of life: results of a meta-analysis [published online March 16, 2016]. Dermatol Ther (Heidelb). 2016;6:237-247.
- Korman AM, Hill D, Alikhan A, et al. Impact and management of depression in psoriasis patients [published online January 4, 2016]. Expert Opin Pharmacother. 2016;17:147-152.
Rosacea is a chronic skin condition that can be classified into 4 subtypes: erythematotelangiectatic, papulopustular, phymatous, and ocular. Erythematotelangiectatic rosacea is characterized by redness of the face and excessive blushing. Papulopustular rosacea is a more severe form of disease that is characterized by papules and pustules of the central face. If left untreated, these subtypes may progress to phymatous rosacea, which is characterized by skin thickening, fibrosis, and cosmetic disfigurement. Ocular rosacea is characterized by redness and irritation of the eyes.1 Rosacea patients often are burdened with embarrassment, social anxiety, and psychiatric comorbidities.
The Patient Health Questionnaire 9 (PHQ-9) is a validated and reliable self-administered tool for diagnosis of depression and designation of depression severity. This instrument could prove useful in screening for depression in rosacea patients given the high incidence of psychiatric comorbidities in this patient population.2 The PHQ-9 consists of 9 questions that assess for criteria used to define depressive disorders in the Diagnostic and Statistical Manual of Mental Disorders (Fourth Edition).3 The questionnaire is brief, easy to administer, and has 88% specificity and sensitivity.4
Other studies have evaluated the relationship between rosacea and psychiatric illness, but the PHQ-9 was not used as a screening tool.7,8 Rosacea patients are at increased risk for having psychiatrist-diagnosed depression.5 In one assessment, a positive correlation between rosacea and psychiatric illness was noted using the Dermatology Life Quality Index, the rejection scale of the Questionnaire on Experience with Skin Complaints, and the German version of the Hospital Anxiety and Depression Scale.6 Interpretation of Rosacea Quality of Life and Dermatology Life Quality Index scores indicated that rosacea has a negative impact on quality of life.7
The purpose of this study was to examine the relationship between self-assessed rosacea severity scores and level of depression using the validated rosacea self-assessment tool and the PHQ-9 questionnaire, respectively.
Methods
Study Population
Study participants were adult patients from the Wake Forest Baptist Medical Center (Winston-Salem, North Carolina) dermatology clinic from January 2011 to December 2014 who had received a diagnosis of rosacea (International Classification of Diseases, Ninth Revision [ICD-9] code 695.3) from a Wake Forest dermatologist. Institutional review board approval was obtained prior to initiation of the study. Data collection occurred from October 2014 through February 2015. A total of 478 patients met criteria for participation in the study and were identified from the Wake Forest Baptist Hospital Transitional Data Warehouse and the electronic medical record. Because rosacea typically is not diagnosed in children and the data measures are not validated in children, this demographic group was excluded from participation.
Of 478 eligible patients who were invited to participate via mail or telephone, 46 completed the rosacea self-assessment tool and PHQ-9 survey in person. A total of 432 patients were mailed a presurvey recruitment letter notifying them that they would be receiving a survey in the mail unless they contacted the study team to decline participation. An email address and telephone number for the study team was provided. Twenty patients declined to participate in the study; surveys were then mailed to the remaining 412 patients. Sixteen of the mailed surveys were returned by the post office due to an incorrect address.
Self-assessments
Patients selected images to self-identify the severity of their rosacea symptoms, including erythema, papulopustular lesions, ocular symptoms, and nasal involvement by looking at photographs on the self-assessment tool, which showed various rosacea severity levels. Scores ranged from 2 (least severe) to 8 (most severe). The PHQ-9 survey was completed by participants to assess mental health and mood.
Statistical Analysis
Results were reported using descriptive statistics. Regression analysis was performed to identify independent outcome predictors. To study the relationship between age and demographic variables, the population was divided into 2 groups: patients aged 60 years and older and patients younger than 60 years. Correlation of variables with duration of disease also was studied by creating 2 groups: patients with a disease duration of 11 years or longer and patients with a disease duration of less than 11 years. Comparisons were completed between groups using χ2 tests for proportions and t tests or analysis of variance for continuous variables. Analysis of variance was applied among all patients classified according to the following levels of depression: nondepressed, minimal depression symptoms, minor depression, major depression (moderate), and major depression (severe).
Results
There is a direct relationship between rosacea severity and depression when comparing across the following levels of depression: nondepressed, minimal depression symptoms, minor depression, major depression (moderate), and major depression (severe)(P=.006; F=5.18; N=183)
Most patients reported they were nondepressed (68.9%). As measured by the PHQ-9, 31.1% of patients experienced some level of depression: 21.9% reported minimal depression symptoms, 7.1% reported minor depression, 1.1% reported major depression (moderate), and 1.1% reported major depression (severe)(Table).
Comment
There is a direct relationship between rosacea severity and level of depression. In our study, nearly one-third of patients reported some degree of depression. The reason for this correlation may be due to disease stigmatization and decreased quality of life due to the somatic symptoms of rosacea. Our study reinforced the results of other studies evaluating the psychosocial impact of rosacea.8,9 Depression is associated with poor treatment adherence and poor outcomes in rosacea patients; therefore, depression may serve as an important outcome measure.10 The psychosocial impact of rosacea can be severe, but with disease improvement, there often is an improvement in the patient’s psychosocial status.7
There are several limitations to our study. The study population consisted of patients at a university dermatology clinic who may not be representative of patients in the general population; however, our hospital system does not require referral and provides care to a large percentage of the surrounding community.
Clinical implementation of the validated rosacea self-assessment tool and PHQ-9 may have several benefits. Patient-assessed rosacea severity and psychosocial impact obtained via use of these tools would provide physicians with information to fine-tune rosacea treatment regimens. Patients with the greatest social impact may require a more aggressive treatment approach. Early detection of depression in the rosacea population is important in informing treatment strategy and improving outcomes. Physicians should pay close attention to signs of depression in rosacea patients and determine if psychiatric treatment or referral for psychiatric evaluation is indicated. The correlation between rosacea and depression underscores the importance of treating this highly impactful disease; however, the low number of responders from the major depression (moderate) subgroup prevented us from making any strong conclusion about this specific subgroup.
- Steinhoff M, Schauber J, Leyden JJ. New insights into rosacea pathophysiology: a review of recent findings. J Am Acad Dermatol. 2013;69(6, suppl 1):S15-S26.
- Kroenke K, Spitzer RL. The PHQ-9: a new depression diagnostic and severity measure. Psychol Ann. 2002;32:509-515.
- America Psychiatric Association. Diagnostic and Statistical Manual of Mental Disorders. 4th ed. Washington, DC: American Psychiatric Association; 2000.
- Kroenke K, Spitzer RL, Williams JB. The PHQ-9: validity of a brief depression severity measure. J Gen Intern Med. 2001;16:606-613.
- Gupta MA, Gupta AK, Chen SJ, et al. Comorbidity of rosacea and depression: an analysis of the National Ambulatory Medical Care Survey and National Hospital Ambulatory Care Survey—outpatient department data collected by the US National Center for Health Statistics from 1995 to 2002. Br J Dermatol. 2005;153:1176-1181.
- Böhm D, Schwanitz P, Stock Gissendanner S, et al. Symptom severity and psychological sequelae in rosacea: results of a survey. Psychol Health Med. 2014;19:586-591.
- Moustafa F, Lewallen RS, Feldman SR. The psychological impact of rosacea and the influence of current management options. J Am Acad Dermatol. 2014;71:973-980.
- Halioua B, Cribier B, Frey M, et al. Feelings of stigmatization in patients with rosacea [published online June 21, 2016]. J Eur Acad Dermatol Venereol. 2016;31:163-168.
- Bewley A, Fowler J, Schöfer H, et al. Erythema of rosacea impairs health-related quality of life: results of a meta-analysis [published online March 16, 2016]. Dermatol Ther (Heidelb). 2016;6:237-247.
- Korman AM, Hill D, Alikhan A, et al. Impact and management of depression in psoriasis patients [published online January 4, 2016]. Expert Opin Pharmacother. 2016;17:147-152.
Practice Points
- Rosacea patients often are burdened with embarrassment, social anxiety, and psychiatric comorbidities.
- There is a direct relationship between rosacea severity and degree of depression.
- Physicians should pay close attention to signs of depression in rosacea patients and determine if psychiatric treatment or referral for psychiatric evaluation is indicated.
Reasons for Readmission Following Primary Total Shoulder Arthroplasty
ABSTRACT
An increasing interest focuses on the rates and risk factors for hospital readmission. However, little is known regarding the readmission following total shoulder arthroplasty (TSA). This study aims to determine the rates, risk factors, and reasons for hospital readmission following primary TSA. Patients undergoing TSA (anatomic or reverse) as part of the American College of Surgeons National Surgical Quality Improvement Program in 2011 to 2013 were identified. The rate of unplanned readmission to the hospital within 30 postoperative days was characterized. Using multivariate regression, demographic and comorbidity factors were tested for independent association with readmission. Finally, the reasons for readmission were characterized. A total of 3627 patients were identified. Among the admitted patients, 93 (2.56%) were readmitted within 30 days of surgery. The independent risk factors for readmission included old age (for age 60-69 years, relative risk [RR] = 1.6; for age 70-79 years, RR = 2.3; for age ≥80 years, RR = 23.1; P = .042), male sex (RR = 1.6, P = .025), anemia (RR = 1.9, P = .005), and dependent functional status (RR = 2.8, P = .012). The reasons for readmission were available for 84 of the 93 readmitted patients. The most common reasons for readmission comprised pneumonia (14 cases, 16.7%), dislocation (7 cases, 8.3%), pulmonary embolism (7 cases, 8.3%), and surgical site infection (6 cases, 7.1%). Unplanned readmission occurs following about 1 in 40 cases of TSA. The most common causes of readmission include pneumonia, dislocation, pulmonary embolism, and surgical site infection. Patients with old age, male sex, anemia, and dependent functional status are at higher risk for readmission and should be counseled and monitored accordingly.
Continue to: Total shoulder arthroplasty...
Total shoulder arthroplasty (TSA) is performed with increasing frequency in the United States and is considered to be cost-effective.1-4 Following the procedure, patients generally achieve shoulder function and pain relief.5-8 Despite the success of the procedure, the growing literature on TSA has also reported rates of complications between 3.6% and 25% of the treated patients.9-16
In recent years, an increasing interest has focused on the rates and risk factors for unplanned hospital readmissions; these variables may not only reflect the quality of patient care but also result in considerable costs to the healthcare system. For instance, among Medicare patients, readmissions within 30 days of discharge occur in almost 20% of cases, costing $17.4 billion per year.17 Readmission rates increasingly factor into hospital performance metrics and reimbursement, including the Hospital Readmissions Reduction Program of the Patient Protection and Affordable Care Act that reduces Centers for Medicare and Medicaid Services payments to hospitals with high 30-day readmission rates.18
To date, only a few studies have evaluated readmission following TSA, with 30- to 90-day readmission rates ranging from 4.5% to 7.3%.19-23 These studies comprised single institution series20,22 and analyses of administrative databases.19,21,23 Most studies have shown that readmission occurs more often for medical than surgical reasons, with surgical reasons most commonly including infection and dislocation.19-23 However, only limited analyses have been conducted regarding risk factors for readmission.21,23 To date and to our knowledge, no study has investigated reasons for readmission following TSA using nationwide data.
This study aims to determine the rates, risk factors, and reasons for hospital readmission following primary TSA in the United States using the American College of Surgeons National Surgical Quality Improvement Program (NSQIP) database.
METHODS
DATA SOURCE
The NSQIP database was utilized to address the study purpose. NSQIP is a nationwide prospective surgical registry established by the American College of Surgeons and reports data from academic and community hospitals across the United States.24 Patients undertaking surgery at these centers are followed by the surgical clinical reviewers at the participating NSQIP sites prospectively for 30 days following the procedure to record complications including readmission. Preoperative and surgical data, such as demographics, medical comorbid diseases, and operative time, are also included. Previous studies have analyzed the complications of various orthopedic surgeries using the NSQIP data.14,16,25-30
DATA COLLECTION
We retrospectively identified from NSQIP the patients who underwent primary TSA (anatomic or reverse) in 2013 to 2014. The timeframe 2013 to 2014 was used because NSQIP only began recording reasons for readmission in 2013. The inclusion criteria were as follows: Current Procedural Terminology (CPT) code for TSA (23472); preoperative diagnosis according to the International Classification of Diseases, Ninth Revision (ICD-9) codes 714.0, 715.11, 715.31, 715.91, 715.21, 715.89, 716.xx 718.xx, 719.xx, 726.x, 727.xx, and 733.41 (where x is a wild card digit); and no missing demographic, comorbidity, or outcome data. Anatomic and reverse TSA were analyzed together because they share the same CPT code, and the NSQIP database prevents searching by the ICD-9 procedure code.
The rate of unplanned readmission to the hospital within 30 postoperative days was characterized. The reasons for readmission in this 30-day period were only available in 2013 and were determined using the ICD-9 diagnosis codes. Patient demographics were recorded for use in identifying potential risk factors for readmission; the demographic data included sex, age, smoking status, body mass index (BMI), and comorbidities, including end-stage renal disease, dyspnea on exertion, congestive heart failure, diabetes mellitus, hypertension, and chronic obstructive pulmonary disease (COPD).
Continue to: Statistical analysis...
STATISTICAL ANALYSIS
Statistical analyses were performed using Stata version 13.1 (StataCorp). First, using bivariate and multivariate regression, demographic and comorbidity factors were tested for independent association with readmission to the hospital within 30 days of surgery. Second, among the readmitted patients, the reasons for readmission were tabulated. Of note, the reasons for readmission were only documented for the procedures performed in 2013. All tests were 2-tailed and conducted at an α level of 0.05.
RESTULTS
A total of 3627 TSA patients were identified. The mean age (± standard deviation) was 69.4 ± 9.5 years, 55.8% of patients were female, and mean BMI was 30.1 ± 7.0 years. Table 1 provides the additional demographic data. Of the 3627 included patients, 93 (2.56%) were readmitted within 30 days of surgery. The 95% confidence interval for the estimated rate of readmission reached 2.05% to 3.08%.
Table 1. Patient Population
| Number | Percent |
Total | 3627 | 100.0% |
Age |
|
|
18-59 | 539 | 14.9% |
60-69 | 1235 | 34.1% |
70-79 | 1317 | 36.3% |
≥80 | 536 | 14.8% |
Sex |
|
|
Male | 1603 | 44.2% |
Female | 2024 | 55.8% |
Body mass index |
|
|
Normal (<25 kg/m2) | 650 | 17.9% |
Overweight (25-30 kg/m2) | 1147 | 31.6% |
Obese (≥30 kg/m2) | 1830 | 50.5% |
Functional status |
|
|
Independent | 3544 | 97.7% |
Dependent | 83 | 2.3% |
Diabetes mellitus |
|
|
No | 3022 | 83.3% |
Yes | 605 | 16.7% |
Dyspnea on exertion |
|
|
No | 3393 | 93.6% |
Yes | 234 | 6.5% |
Hypertension |
|
|
No | 1192 | 32.9% |
Yes | 2435 | 67.1% |
COPD |
|
|
No | 3384 | 93.3% |
Yes | 243 | 6.7% |
Current smoker |
|
|
No | 3249 | 89.6% |
Yes | 378 | 10.4% |
Anemia |
|
|
No | 3051 | 84.1% |
Yes | 576 | 15.9% |
Abbreviation: COPD, chronic obstructive pulmonary disease.
In the bivariate analyses (Table 2), the following factors were positively associated readmission: older age (60-69 years, relative risk [RR] = 1.6; 70-79 years, RR = 2.2; ≥80 years, RR = 3.3; P = .011), dependent functional status (RR = 2.9, P = .008), and anemia (RR = 2.2, P < .001).
Table 2. Bivariate Analysis of Risk Factors for Readmission
| Rate | RR | 95% CI | P-value |
Age |
|
|
| 0.011 |
18-59 | 1.30% | Ref. | - |
|
60-69 | 2.02% | 1.6 | 0.7-3.6 |
|
70-79 | 2.89% | 2.2 | 1.0-4.9 |
|
≥80 | 4.29% | 3.3 | 1.4-7.6 |
|
Sex |
|
|
| 0.099 |
Female | 2.17% | Ref. | - |
|
Male | 3.06% | 1.4 | 0.9-2.1 |
|
Body mass index |
|
|
| 0.764 |
Normal (<25 kg/m2) | 2.92% | Ref. | - |
|
Overweight (25-30 kg/m2) | 2.35% | 0.8 | 0.5-1.4 |
|
Obese (≥30 kg/m2) | 2.57% | 0.9 | 0.5-1.5 |
|
Functional status |
|
|
| 0.008 |
Independent | 2.45% | Ref. | - |
|
Dependent | 7.23% | 2.9 | 1.3-6.5 |
|
Diabetes mellitus |
|
|
| 0.483 |
No | 2.48% | Ref. | - |
|
Yes | 2.98% | 1.2 | 0.7-2.0 |
|
Dyspnea on exertion |
|
|
| 0.393 |
No | 2.51% | Ref. | - |
|
Yes | 3.42% | 1.4 | 0.7-2.8 |
|
Hypertension |
|
|
| 0.145 |
No | 2.01% | Ref. | - |
|
Yes | 2.83% | 1.4 | 0.9-2.2 |
|
COPD |
|
|
| 0.457 |
No | 2.51% | Ref. | - |
|
Yes | 3.29% | 1.3 | 0.6-2.7 |
|
Current smoker |
|
|
| 0.116 |
No | 2.71% | Ref. | - |
|
Yes | 1.32% | 0.5 | 0.2-1.2 |
|
Anemia |
|
|
| <0.001 |
No | 2.16% | Ref. | - |
|
Yes | 4.69% | 2.2 | 1.4-3.4 |
|
Abbreviations: CI, confidence interval; COPD, chronic obstructive pulmonary disease; RR, relative risk.
In the multivariate analyses (Table 3), the following factors were independent risk factors for readmission: older age (60-69 years, RR = 1.6; 70-79 years, RR = 2.3; ≥80 years, RR = 3.1; P =.027), male sex (RR = 1.6, P = .025), anemia (RR = 1.9, P = .005), and dependent functional status (RR = 2.8, P = .012). Interestingly, readmission showed no independent association with diabetes, dyspnea on exertion, BMI, COPD, hypertension, or current smoking status (P > .05 for each).
Table 3. Independent Risk Factors for Readmission on Multivariate Analysis
| Rate | RR | 95% CI | P-value |
Age |
|
|
| 0.027 |
18-59 | 1.30% | Ref | - |
|
60-69 | 2.02% | 1.6 | 0.7-3.6 |
|
70-79 | 2.89% | 2.3 | 1.0-5.1 |
|
≥80 | 4.29% | 3.1 | 1.3-7.4 |
|
Sex |
|
|
| 0.025 |
Female | 2.17% | Ref. | - |
|
Male | 3.06% | 1.6 | 1.1-2.4 |
|
Anemia |
|
|
| 0.005 |
No | 2.16% | Ref | - |
|
Yes | 4.69% | 1.9 | 1.2-3.0 |
|
Functional status |
|
|
| 0.012 |
Independent | 2.45% | Ref | - |
|
Dependent | 7.23% | 2.8 | 1.3-6.2 |
|
Abbreviations: CI, confidence interval; COPD, chronic obstructive pulmonary disease; RR, relative risk.
Continue to: Table 4...
The reasons for readmission were available for 84 of the 93 readmitted patients. The most common reasons for readmission included pneumonia (14 cases, 16.7%), dislocation (7 cases, 8.3%), pulmonary embolism (7 cases, 8.3%), and surgical site infection (6 cases, 7.1%) (Table 4).
Table 4. Reasons for Readmission
| Number | Percent |
Pneumonia | 14 | 16.7% |
Dislocation | 7 | 8.3% |
Pulmonary embolism | 7 | 8.3% |
Surgical site infection | 6 | 7.1% |
Atrial fibrillation | 4 | 4.8% |
Hematoma | 4 | 4.8% |
Altered mental status | 3 | 3.6% |
Chest pain | 3 | 3.6% |
Renal insufficiency/kidney failure | 3 | 3.6% |
Urinary tract infection | 3 | 3.6% |
Acute gastric or duodenal ulcer | 2 | 2.4% |
Dermatitis/other allergic reaction | 2 | 2.4% |
Orthostatic hypotension/syncope | 2 | 2.4% |
Pain | 2 | 2.4% |
Respiratory distress | 2 | 2.4% |
Sepsis | 2 | 2.4% |
Urinary retention | 2 | 2.4% |
Acute cholecystitis | 1 | 1.2% |
Cerebrovascular accident | 1 | 1.2% |
Constipation | 1 | 1.2% |
Contusion of shoulder | 1 | 1.2% |
Deep venous thrombosis requiring therapy | 1 | 1.2% |
Gastrointestinal hemorrhage | 1 | 1.2% |
Gout | 1 | 1.2% |
Hepatic encephalopathy | 1 | 1.2% |
Intestinal infection | 1 | 1.2% |
Narcotic overdose | 1 | 1.2% |
Nausea/vomiting | 1 | 1.2% |
Proximal humerus fracture | 1 | 1.2% |
Rotator cuff tear | 1 | 1.2% |
Seroma | 1 | 1.2% |
Unspecified disease of pericardium | 1 | 1.2% |
Weakness | 1 | 1.2% |
DISCUSSION
Our analysis of 3042 TSAs from the NSQIP database suggests that unplanned readmission to the hospital occurs following about 1 in 40 cases of TSA. The study also suggests that the most common reasons for readmission encompass pneumonia, dislocation, pulmonary embolism, and surgical site infection. Old age, male sex, anemia, and dependent functional status serve as risk factors for readmission, and patients with such factors should be counseled and monitored accordingly.
In recent years, an increasing emphasis has centered on reducing rates of hospital readmission, with programs such as the Hospital Readmissions Reduction Program of the Affordable Care Act cutting reimbursements for hospitals with high 30-day readmission rates.17,18 To date, only a few studies have evaluated the reasons for readmission and readmission rates for TSA.19-23 Initial reports consisted of single-institution TSA registry reviews. For example, Mahoney and colleagues20 retrospectively evaluated shoulder arthroplasty procedures at their institution to document the readmission rates, finding a 5.9% readmission rate at 30 days. Readmission occurred more frequently in the first 30 days following discharge than in the 30- to 90-day period, with the most common reasons for readmission including medical complications, infection, and dislocation. Streubel and colleagues22 evaluated reoperation rates from their institution’s TSA registry, finding a 0.6% reoperation rate for primary TSA at 30 days and 1.5% for revision TSA. Instability and infection were the most common indications for reoperation. Our findings confirm these single-institution results and demonstrate their application to a nationwide sample of TSA, not just to high-volume academic centers. We similarly observed that dislocation, surgical site infection, and medical complications (mostly pneumonia and pulmonary embolism) were common causes of readmission, and that the 30-day readmission rate was about 1 in 40.
Several authors have since used statewide databases to analyze and determine risk factors for readmission following TSA. Lyman and colleagues19 used the New York State Database to show that higher hospital TSA surgical volume was associated with a lower rate of readmission when age and comorbidities were controlled for in a multivariate model. Old age was also associated with an increased readmission rate in their multivariate analysis, but comorbidities (as measured by the Charlson comorbidity index) presented a nonsignificant associative trend. These authors opted not to determine specific causes of readmission. Schairer and colleagues21 used State Inpatient Databases from 7 states, finding a 90-day readmission rate of 7.3%, 82% of which were due to medical complications and 18% of which were due to surgical complications (mostly infection and dislocation). Their multivariate regression revealed that male sex, reverse TSA, Medicaid insurance, patients discharged to inpatient rehabilitation or nursing facilities, medical comorbidities, and low-volume TSA hospitals were associated with readmission. Zhang and colleagues23 used the same source to show that the 90-day readmission rate reached 14% for surgically treated proximal humerus fractures and higher for patients who underwent open reduction internal fixation, were female, were African American, were discharged to a nursing facility, possessed Medicaid insurance, or experienced medical comorbidities. Most recently, Basques and colleagues31 analyzed 1505 TSA cases from 2011 and 2012 in the NSQIP database, finding a 3.3% rate of readmission, with heart disease and hypertension as risk factors for readmission. Although the limitations of the NSQIP database prevented us from analyzing surgeon and hospital TSA volume or reverse vs anatomic TSA, our results confirm that the findings from statewide database studies apply to the United States nationwide NSQIP database. Old patient age, male sex, and medical comorbidities (anemia and dependent functional status) are independent risk factors for TSA readmission. We identified pneumonia, dislocation, pulmonary embolism, and surgical site infection as the most common reasons for readmission.
This study features several limitations that should be considered when interpreting the results. Anatomic and reverse TSA share a CPT code and were not separated using NSQIP data. A number of studies have reported that reverse TSA may place patients at higher risk for readmission;20,21 however, confounding by other patient factors could play a role in this finding. The 30-day timeframe for readmission is another potential limitation; however, this timeframe is frequently used in other studies and is the relevant timeframe for the reduced reimbursement penalties from the Hospital Readmissions Reduction Program of the Affordable Care Act.18 Furthermore, the NSQIP database contains no information on surgeon or hospital TSA volume, which is a result of safeguards for patient and provider privacy. Additionally, readmission data were only available for 2011 to 2013, with causes of readmission only present in 2013. Although provided with such current information, we cannot analyze readmission trends over time, such as in response to the Affordable Care Act of 2010. Finally, although NSQIP surgical clinical reviewers strive to identify readmissions to other hospitals during their reviews of outpatient medical records, proportions of these readmissions are possibly missed. Therefore, our 30-day readmission rate may slightly underestimate the true rate.
Despite these limitations, the NSQIP database offers a unique opportunity to examine risk factors and reasons for readmission following TSA. The prior literature on readmission following TSA stemmed either from limited samples or administrative data, which feature known limitations.32 By utilizing a large, prospective, non-administrative, nationwide sample, our findings are probably both more reliable and generalizable to the country as a whole.
CONCLUSION
Unplanned readmission occurs following about 1 in 40 cases of TSA. The most common causes of readmission include pneumonia, dislocation, pulmonary embolism, and surgical site infection. Patients with old age, male sex, anemia, and dependent functional status are at a higher risk for readmission and should be counseled and monitored accordingly.
This paper will be judged for the Resident Writer’s Award.
- Adams JE, Sperling JW, Hoskin TL, Melton LJ, Cofield RH. Shoulder arthroplasty in Olmsted County, Minnesota, 1976-2000: a population-based study. J Shoulder Elbow Surg.2006;15(1):50-55. doi:10.1016/j.jse.2005.04.009.
- Jain NB, Higgins LD, Guller U, Pietrobon R, Katz JN. Trends in the epidemiology of total shoulder arthroplasty in the United States from 1990-2000. Arthritis Rheum.2006;55(4):591-597. doi:10.1002/art.22102.
- Kim SH, Wise BL, Zhang Y, Szabo RM. Increasing incidence of shoulder arthroplasty in the United States. J Bone Joint Surg Am. 2011;93(24):2249-2254. doi:10.2106/JBJS.J.01994. doi:10.2106/JBJS.J.01994.
- Mather RC, Watters TS, Orlando LA, Bolognesi MP, Moorman CT. Cost effectiveness analysis of hemiarthroplasty and total shoulder arthroplasty. J Shoulder Elbow Surg.2010;19(3):325-334. doi:10.1016/j.jse.2009.11.057.
- Carter MJ, Mikuls TR, Nayak S, Fehringer EV, Michaud K. Impact of total shoulder arthroplasty on generic and shoulder-specific health-related quality-of-life measures: a systematic literature review and meta-analysis. J Bone Joint Surg Am. 2012;94(17):e127. doi:10.2106/JBJS.K.00204.
- Deshmukh AV, Koris M, Zurakowski D, Thornhill TS. Total shoulder arthroplasty: long-term survivorship, functional outcome, and quality of life. J Shoulder Elbow Surg. 2005;14(5):471-479. doi:10.1016/j.jse.2005.02.009.
- Montoya F, Magosch P, Scheiderer B, Lichtenberg S, Melean P, Habermeyer P. Midterm results of a total shoulder prosthesis fixed with a cementless glenoid component. J Shoulder Elbow Surg. 2013;22(5):628-635. doi:10.1016/j.jse.2012.07.005.
- Raiss P, Bruckner T, Rickert M, Walch G. Longitudinal observational study of total shoulder replacements with cement: fifteen to twenty-year follow-up. J Bone Joint Surg Am.2014;96(3):198-205. doi:10.2106/JBJS.M.00079.
- Bohsali KI, Wirth MA, Rockwood CA. Complications of total shoulder arthroplasty. J Bone Joint Surg Am. 2006;88(10):2279-2292. doi:10.2106/JBJS.F.00125.
- Chalmers PN, Gupta AK, Rahman Z, Bruce B, Romeo AA, Nicholson GP. Predictors of early complications of total shoulder arthroplasty. J Arthroplasty. 2014;29(4):856-860. doi:10.1016/j.arth.2013.07.002.
- Cheung E, Willis M, Walker M, Clark R, Frankle MA. Complications in reverse total shoulder arthroplasty. J Am Acad Orthop Surg. 2011;19(7):439-449.
- Papadonikolakis A, Neradilek MB, Matsen FA. Failure of the glenoid component in anatomic total shoulder arthroplasty: a systematic review of the English-language literature between 2006 and 2012. J Bone Joint Surg Am. 2013;95(24):2205-2212. doi:10.2106/JBJS.L.00552.
- Saltzman BM, Chalmers PN, Gupta AK, Romeo AA, Nicholson GP. Complication rates comparing primary with revision reverse total shoulder arthroplasty. J Shoulder Elbow Surg.2014;23(11):1647-1654. doi:10.1016/j.jse.2014.04.015.
- Shields E, Iannuzzi JC, Thorsness R, Noyes K, Voloshin I. Perioperative complications after hemiarthroplasty and total shoulder arthroplasty are equivalent. J Shoulder Elbow Surg. 2014;23(10):1449-1453. doi:10.1016/j.jse.2014.01.052.
- Sperling JW, Hawkins RJ, Walch G, Mahoney AP, Zuckerman JD. Complications in total shoulder arthroplasty. Instr Course Lect. 2013;62:135-141.
- Shields E, Thirukumaran C, Thorsness R, Noyes K, Voloshin I. An analysis of adult patient risk factors and complications within 30 days after arthroscopic shoulder surgery. Arthroscopy. 2015;31(5):807-815. doi:10.1016/j.arthro.2014.12.011.
- Jencks SF, Williams MV, Coleman EA. Rehospitalizations among patients in the Medicare fee-for-service program. N Engl J Med. 2009;360(14):1418-1428. doi:10.1056/NEJMsa0803563.
- Centers for Medicare & Medicaid Services. Readmissions reduction program (HRRP). . Updated April 27, 2018. Accessed June 29, 2018.
- Lyman S, Jones EC, Bach PB, Peterson MG, Marx RG. The association between hospital volume and total shoulder arthroplasty outcomes. Clin Orthop Relat Res. 2005;432:132-137. doi:10.1097/01.blo.0000150571.51381.9a.
- Mahoney A, Bosco JA, Zuckerman JD. Readmission after shoulder arthroplasty. J Shoulder Elbow Surg. 2014;23(3):377-381. doi:10.1016/j.jse.2013.08.007.
- Schairer WW, Zhang AL, Feeley BT. Hospital readmissions after primary shoulder arthroplasty. J Shoulder Elbow Surg. 2014;23(9):1349-1355. doi:10.1016/j.jse.2013.12.004.
- Streubel PN, Simone JP, Sperling JW, Cofield R. Thirty and ninety-day reoperation rates after shoulder arthroplasty. J Bone Joint Surg Am. 2014;96(3):e17. doi:10.2106/JBJS.M.00127.
- Zhang AL, Schairer WW, Feeley BT. Hospital readmissions after surgical treatment of proximal humerus fractures: is arthroplasty safer than open reduction internal fixation? Clin Orthop Relat Res. 2014;472(8):2317-2324. doi:10.1007/s11999-014-3613-y.
- American College of Surgeons. ACS National Surgical Quality Improvement Program. http://www.acsnsqip.org. Accessed July 15, 2015.
- Basques BA, Gardner EC, Varthi AG, et al. Risk factors for short-term adverse events and readmission after arthroscopic meniscectomy: does age matter? Am J Sports Med.2015;43(1):169-175. doi:10.1177/0363546514551923.
- Haughom BD, Schairer WW, Hellman MD, Yi PH, Levine BR. Does resident involvement impact post-operative complications following primary total knee arthroplasty? An analysis of 24,529 cases. J Arthroplasty. 2014;29(7):1468-1472.e2. doi:10.1016/j.arth.2014.02.036.
- Haughom BD, Schairer WW, Hellman MD, Yi PH, Levine BR. Resident involvement does not influence complication after total hip arthroplasty: an analysis of 13,109 cases. J Arthroplasty. 2014;29(10):1919-1924. doi:10.1016/j.arth.2014.06.003.
- Martin CT, Gao Y, Pugely AJ, Wolf BR. 30-day morbidity and mortality after elective shoulder arthroscopy: a review of 9410 cases. J Shoulder Elbow Surg. 2013;22(12):1667-1675.e1. doi:10.1016/j.jse.2013.06.022.
- Martin CT, Pugely AJ, Gao Y, Wolf BR. Risk factors for thirty-day morbidity and mortality following knee arthroscopy: a review of 12,271 patients from the national surgical quality improvement program database. J Bone Joint Surg Am. 2013;95(14):e98 1-10. doi:10.2106/JBJS.L.01440.
- Waterman BR, Dunn JC, Bader J, Urrea L, Schoenfeld AJ, Belmont PJ. Thirty-day morbidity and mortality after elective total shoulder arthroplasty: patient-based and surgical risk factors. J Shoulder Elbow Surg. 2015;24(1):24-30. doi:10.1016/j.jse.2014.05.016.
- Basques BA, Gardner EC, Toy JO, Golinvaux NS, Bohl DD, Grauer JN. Length of stay and readmission after total shoulder arthroplasty: an analysis of 1505 cases. Am J Orthop.2015;44(8):E268-E271.
- Bohl DD, Russo GS, Basques BA, et al. Variations in data collection methods between national databases affect study results: a comparison of the nationwide inpatient sample and national surgical quality improvement program databases for lumbar spine fusion procedures. J Bone Joint Surg Am. 2014;96(23):e193. doi:10.2106/JBJS.M.01490.
ABSTRACT
An increasing interest focuses on the rates and risk factors for hospital readmission. However, little is known regarding the readmission following total shoulder arthroplasty (TSA). This study aims to determine the rates, risk factors, and reasons for hospital readmission following primary TSA. Patients undergoing TSA (anatomic or reverse) as part of the American College of Surgeons National Surgical Quality Improvement Program in 2011 to 2013 were identified. The rate of unplanned readmission to the hospital within 30 postoperative days was characterized. Using multivariate regression, demographic and comorbidity factors were tested for independent association with readmission. Finally, the reasons for readmission were characterized. A total of 3627 patients were identified. Among the admitted patients, 93 (2.56%) were readmitted within 30 days of surgery. The independent risk factors for readmission included old age (for age 60-69 years, relative risk [RR] = 1.6; for age 70-79 years, RR = 2.3; for age ≥80 years, RR = 23.1; P = .042), male sex (RR = 1.6, P = .025), anemia (RR = 1.9, P = .005), and dependent functional status (RR = 2.8, P = .012). The reasons for readmission were available for 84 of the 93 readmitted patients. The most common reasons for readmission comprised pneumonia (14 cases, 16.7%), dislocation (7 cases, 8.3%), pulmonary embolism (7 cases, 8.3%), and surgical site infection (6 cases, 7.1%). Unplanned readmission occurs following about 1 in 40 cases of TSA. The most common causes of readmission include pneumonia, dislocation, pulmonary embolism, and surgical site infection. Patients with old age, male sex, anemia, and dependent functional status are at higher risk for readmission and should be counseled and monitored accordingly.
Continue to: Total shoulder arthroplasty...
Total shoulder arthroplasty (TSA) is performed with increasing frequency in the United States and is considered to be cost-effective.1-4 Following the procedure, patients generally achieve shoulder function and pain relief.5-8 Despite the success of the procedure, the growing literature on TSA has also reported rates of complications between 3.6% and 25% of the treated patients.9-16
In recent years, an increasing interest has focused on the rates and risk factors for unplanned hospital readmissions; these variables may not only reflect the quality of patient care but also result in considerable costs to the healthcare system. For instance, among Medicare patients, readmissions within 30 days of discharge occur in almost 20% of cases, costing $17.4 billion per year.17 Readmission rates increasingly factor into hospital performance metrics and reimbursement, including the Hospital Readmissions Reduction Program of the Patient Protection and Affordable Care Act that reduces Centers for Medicare and Medicaid Services payments to hospitals with high 30-day readmission rates.18
To date, only a few studies have evaluated readmission following TSA, with 30- to 90-day readmission rates ranging from 4.5% to 7.3%.19-23 These studies comprised single institution series20,22 and analyses of administrative databases.19,21,23 Most studies have shown that readmission occurs more often for medical than surgical reasons, with surgical reasons most commonly including infection and dislocation.19-23 However, only limited analyses have been conducted regarding risk factors for readmission.21,23 To date and to our knowledge, no study has investigated reasons for readmission following TSA using nationwide data.
This study aims to determine the rates, risk factors, and reasons for hospital readmission following primary TSA in the United States using the American College of Surgeons National Surgical Quality Improvement Program (NSQIP) database.
METHODS
DATA SOURCE
The NSQIP database was utilized to address the study purpose. NSQIP is a nationwide prospective surgical registry established by the American College of Surgeons and reports data from academic and community hospitals across the United States.24 Patients undertaking surgery at these centers are followed by the surgical clinical reviewers at the participating NSQIP sites prospectively for 30 days following the procedure to record complications including readmission. Preoperative and surgical data, such as demographics, medical comorbid diseases, and operative time, are also included. Previous studies have analyzed the complications of various orthopedic surgeries using the NSQIP data.14,16,25-30
DATA COLLECTION
We retrospectively identified from NSQIP the patients who underwent primary TSA (anatomic or reverse) in 2013 to 2014. The timeframe 2013 to 2014 was used because NSQIP only began recording reasons for readmission in 2013. The inclusion criteria were as follows: Current Procedural Terminology (CPT) code for TSA (23472); preoperative diagnosis according to the International Classification of Diseases, Ninth Revision (ICD-9) codes 714.0, 715.11, 715.31, 715.91, 715.21, 715.89, 716.xx 718.xx, 719.xx, 726.x, 727.xx, and 733.41 (where x is a wild card digit); and no missing demographic, comorbidity, or outcome data. Anatomic and reverse TSA were analyzed together because they share the same CPT code, and the NSQIP database prevents searching by the ICD-9 procedure code.
The rate of unplanned readmission to the hospital within 30 postoperative days was characterized. The reasons for readmission in this 30-day period were only available in 2013 and were determined using the ICD-9 diagnosis codes. Patient demographics were recorded for use in identifying potential risk factors for readmission; the demographic data included sex, age, smoking status, body mass index (BMI), and comorbidities, including end-stage renal disease, dyspnea on exertion, congestive heart failure, diabetes mellitus, hypertension, and chronic obstructive pulmonary disease (COPD).
Continue to: Statistical analysis...
STATISTICAL ANALYSIS
Statistical analyses were performed using Stata version 13.1 (StataCorp). First, using bivariate and multivariate regression, demographic and comorbidity factors were tested for independent association with readmission to the hospital within 30 days of surgery. Second, among the readmitted patients, the reasons for readmission were tabulated. Of note, the reasons for readmission were only documented for the procedures performed in 2013. All tests were 2-tailed and conducted at an α level of 0.05.
RESTULTS
A total of 3627 TSA patients were identified. The mean age (± standard deviation) was 69.4 ± 9.5 years, 55.8% of patients were female, and mean BMI was 30.1 ± 7.0 years. Table 1 provides the additional demographic data. Of the 3627 included patients, 93 (2.56%) were readmitted within 30 days of surgery. The 95% confidence interval for the estimated rate of readmission reached 2.05% to 3.08%.
Table 1. Patient Population
| Number | Percent |
Total | 3627 | 100.0% |
Age |
|
|
18-59 | 539 | 14.9% |
60-69 | 1235 | 34.1% |
70-79 | 1317 | 36.3% |
≥80 | 536 | 14.8% |
Sex |
|
|
Male | 1603 | 44.2% |
Female | 2024 | 55.8% |
Body mass index |
|
|
Normal (<25 kg/m2) | 650 | 17.9% |
Overweight (25-30 kg/m2) | 1147 | 31.6% |
Obese (≥30 kg/m2) | 1830 | 50.5% |
Functional status |
|
|
Independent | 3544 | 97.7% |
Dependent | 83 | 2.3% |
Diabetes mellitus |
|
|
No | 3022 | 83.3% |
Yes | 605 | 16.7% |
Dyspnea on exertion |
|
|
No | 3393 | 93.6% |
Yes | 234 | 6.5% |
Hypertension |
|
|
No | 1192 | 32.9% |
Yes | 2435 | 67.1% |
COPD |
|
|
No | 3384 | 93.3% |
Yes | 243 | 6.7% |
Current smoker |
|
|
No | 3249 | 89.6% |
Yes | 378 | 10.4% |
Anemia |
|
|
No | 3051 | 84.1% |
Yes | 576 | 15.9% |
Abbreviation: COPD, chronic obstructive pulmonary disease.
In the bivariate analyses (Table 2), the following factors were positively associated readmission: older age (60-69 years, relative risk [RR] = 1.6; 70-79 years, RR = 2.2; ≥80 years, RR = 3.3; P = .011), dependent functional status (RR = 2.9, P = .008), and anemia (RR = 2.2, P < .001).
Table 2. Bivariate Analysis of Risk Factors for Readmission
| Rate | RR | 95% CI | P-value |
Age |
|
|
| 0.011 |
18-59 | 1.30% | Ref. | - |
|
60-69 | 2.02% | 1.6 | 0.7-3.6 |
|
70-79 | 2.89% | 2.2 | 1.0-4.9 |
|
≥80 | 4.29% | 3.3 | 1.4-7.6 |
|
Sex |
|
|
| 0.099 |
Female | 2.17% | Ref. | - |
|
Male | 3.06% | 1.4 | 0.9-2.1 |
|
Body mass index |
|
|
| 0.764 |
Normal (<25 kg/m2) | 2.92% | Ref. | - |
|
Overweight (25-30 kg/m2) | 2.35% | 0.8 | 0.5-1.4 |
|
Obese (≥30 kg/m2) | 2.57% | 0.9 | 0.5-1.5 |
|
Functional status |
|
|
| 0.008 |
Independent | 2.45% | Ref. | - |
|
Dependent | 7.23% | 2.9 | 1.3-6.5 |
|
Diabetes mellitus |
|
|
| 0.483 |
No | 2.48% | Ref. | - |
|
Yes | 2.98% | 1.2 | 0.7-2.0 |
|
Dyspnea on exertion |
|
|
| 0.393 |
No | 2.51% | Ref. | - |
|
Yes | 3.42% | 1.4 | 0.7-2.8 |
|
Hypertension |
|
|
| 0.145 |
No | 2.01% | Ref. | - |
|
Yes | 2.83% | 1.4 | 0.9-2.2 |
|
COPD |
|
|
| 0.457 |
No | 2.51% | Ref. | - |
|
Yes | 3.29% | 1.3 | 0.6-2.7 |
|
Current smoker |
|
|
| 0.116 |
No | 2.71% | Ref. | - |
|
Yes | 1.32% | 0.5 | 0.2-1.2 |
|
Anemia |
|
|
| <0.001 |
No | 2.16% | Ref. | - |
|
Yes | 4.69% | 2.2 | 1.4-3.4 |
|
Abbreviations: CI, confidence interval; COPD, chronic obstructive pulmonary disease; RR, relative risk.
In the multivariate analyses (Table 3), the following factors were independent risk factors for readmission: older age (60-69 years, RR = 1.6; 70-79 years, RR = 2.3; ≥80 years, RR = 3.1; P =.027), male sex (RR = 1.6, P = .025), anemia (RR = 1.9, P = .005), and dependent functional status (RR = 2.8, P = .012). Interestingly, readmission showed no independent association with diabetes, dyspnea on exertion, BMI, COPD, hypertension, or current smoking status (P > .05 for each).
Table 3. Independent Risk Factors for Readmission on Multivariate Analysis
| Rate | RR | 95% CI | P-value |
Age |
|
|
| 0.027 |
18-59 | 1.30% | Ref | - |
|
60-69 | 2.02% | 1.6 | 0.7-3.6 |
|
70-79 | 2.89% | 2.3 | 1.0-5.1 |
|
≥80 | 4.29% | 3.1 | 1.3-7.4 |
|
Sex |
|
|
| 0.025 |
Female | 2.17% | Ref. | - |
|
Male | 3.06% | 1.6 | 1.1-2.4 |
|
Anemia |
|
|
| 0.005 |
No | 2.16% | Ref | - |
|
Yes | 4.69% | 1.9 | 1.2-3.0 |
|
Functional status |
|
|
| 0.012 |
Independent | 2.45% | Ref | - |
|
Dependent | 7.23% | 2.8 | 1.3-6.2 |
|
Abbreviations: CI, confidence interval; COPD, chronic obstructive pulmonary disease; RR, relative risk.
Continue to: Table 4...
The reasons for readmission were available for 84 of the 93 readmitted patients. The most common reasons for readmission included pneumonia (14 cases, 16.7%), dislocation (7 cases, 8.3%), pulmonary embolism (7 cases, 8.3%), and surgical site infection (6 cases, 7.1%) (Table 4).
Table 4. Reasons for Readmission
| Number | Percent |
Pneumonia | 14 | 16.7% |
Dislocation | 7 | 8.3% |
Pulmonary embolism | 7 | 8.3% |
Surgical site infection | 6 | 7.1% |
Atrial fibrillation | 4 | 4.8% |
Hematoma | 4 | 4.8% |
Altered mental status | 3 | 3.6% |
Chest pain | 3 | 3.6% |
Renal insufficiency/kidney failure | 3 | 3.6% |
Urinary tract infection | 3 | 3.6% |
Acute gastric or duodenal ulcer | 2 | 2.4% |
Dermatitis/other allergic reaction | 2 | 2.4% |
Orthostatic hypotension/syncope | 2 | 2.4% |
Pain | 2 | 2.4% |
Respiratory distress | 2 | 2.4% |
Sepsis | 2 | 2.4% |
Urinary retention | 2 | 2.4% |
Acute cholecystitis | 1 | 1.2% |
Cerebrovascular accident | 1 | 1.2% |
Constipation | 1 | 1.2% |
Contusion of shoulder | 1 | 1.2% |
Deep venous thrombosis requiring therapy | 1 | 1.2% |
Gastrointestinal hemorrhage | 1 | 1.2% |
Gout | 1 | 1.2% |
Hepatic encephalopathy | 1 | 1.2% |
Intestinal infection | 1 | 1.2% |
Narcotic overdose | 1 | 1.2% |
Nausea/vomiting | 1 | 1.2% |
Proximal humerus fracture | 1 | 1.2% |
Rotator cuff tear | 1 | 1.2% |
Seroma | 1 | 1.2% |
Unspecified disease of pericardium | 1 | 1.2% |
Weakness | 1 | 1.2% |
DISCUSSION
Our analysis of 3042 TSAs from the NSQIP database suggests that unplanned readmission to the hospital occurs following about 1 in 40 cases of TSA. The study also suggests that the most common reasons for readmission encompass pneumonia, dislocation, pulmonary embolism, and surgical site infection. Old age, male sex, anemia, and dependent functional status serve as risk factors for readmission, and patients with such factors should be counseled and monitored accordingly.
In recent years, an increasing emphasis has centered on reducing rates of hospital readmission, with programs such as the Hospital Readmissions Reduction Program of the Affordable Care Act cutting reimbursements for hospitals with high 30-day readmission rates.17,18 To date, only a few studies have evaluated the reasons for readmission and readmission rates for TSA.19-23 Initial reports consisted of single-institution TSA registry reviews. For example, Mahoney and colleagues20 retrospectively evaluated shoulder arthroplasty procedures at their institution to document the readmission rates, finding a 5.9% readmission rate at 30 days. Readmission occurred more frequently in the first 30 days following discharge than in the 30- to 90-day period, with the most common reasons for readmission including medical complications, infection, and dislocation. Streubel and colleagues22 evaluated reoperation rates from their institution’s TSA registry, finding a 0.6% reoperation rate for primary TSA at 30 days and 1.5% for revision TSA. Instability and infection were the most common indications for reoperation. Our findings confirm these single-institution results and demonstrate their application to a nationwide sample of TSA, not just to high-volume academic centers. We similarly observed that dislocation, surgical site infection, and medical complications (mostly pneumonia and pulmonary embolism) were common causes of readmission, and that the 30-day readmission rate was about 1 in 40.
Several authors have since used statewide databases to analyze and determine risk factors for readmission following TSA. Lyman and colleagues19 used the New York State Database to show that higher hospital TSA surgical volume was associated with a lower rate of readmission when age and comorbidities were controlled for in a multivariate model. Old age was also associated with an increased readmission rate in their multivariate analysis, but comorbidities (as measured by the Charlson comorbidity index) presented a nonsignificant associative trend. These authors opted not to determine specific causes of readmission. Schairer and colleagues21 used State Inpatient Databases from 7 states, finding a 90-day readmission rate of 7.3%, 82% of which were due to medical complications and 18% of which were due to surgical complications (mostly infection and dislocation). Their multivariate regression revealed that male sex, reverse TSA, Medicaid insurance, patients discharged to inpatient rehabilitation or nursing facilities, medical comorbidities, and low-volume TSA hospitals were associated with readmission. Zhang and colleagues23 used the same source to show that the 90-day readmission rate reached 14% for surgically treated proximal humerus fractures and higher for patients who underwent open reduction internal fixation, were female, were African American, were discharged to a nursing facility, possessed Medicaid insurance, or experienced medical comorbidities. Most recently, Basques and colleagues31 analyzed 1505 TSA cases from 2011 and 2012 in the NSQIP database, finding a 3.3% rate of readmission, with heart disease and hypertension as risk factors for readmission. Although the limitations of the NSQIP database prevented us from analyzing surgeon and hospital TSA volume or reverse vs anatomic TSA, our results confirm that the findings from statewide database studies apply to the United States nationwide NSQIP database. Old patient age, male sex, and medical comorbidities (anemia and dependent functional status) are independent risk factors for TSA readmission. We identified pneumonia, dislocation, pulmonary embolism, and surgical site infection as the most common reasons for readmission.
This study features several limitations that should be considered when interpreting the results. Anatomic and reverse TSA share a CPT code and were not separated using NSQIP data. A number of studies have reported that reverse TSA may place patients at higher risk for readmission;20,21 however, confounding by other patient factors could play a role in this finding. The 30-day timeframe for readmission is another potential limitation; however, this timeframe is frequently used in other studies and is the relevant timeframe for the reduced reimbursement penalties from the Hospital Readmissions Reduction Program of the Affordable Care Act.18 Furthermore, the NSQIP database contains no information on surgeon or hospital TSA volume, which is a result of safeguards for patient and provider privacy. Additionally, readmission data were only available for 2011 to 2013, with causes of readmission only present in 2013. Although provided with such current information, we cannot analyze readmission trends over time, such as in response to the Affordable Care Act of 2010. Finally, although NSQIP surgical clinical reviewers strive to identify readmissions to other hospitals during their reviews of outpatient medical records, proportions of these readmissions are possibly missed. Therefore, our 30-day readmission rate may slightly underestimate the true rate.
Despite these limitations, the NSQIP database offers a unique opportunity to examine risk factors and reasons for readmission following TSA. The prior literature on readmission following TSA stemmed either from limited samples or administrative data, which feature known limitations.32 By utilizing a large, prospective, non-administrative, nationwide sample, our findings are probably both more reliable and generalizable to the country as a whole.
CONCLUSION
Unplanned readmission occurs following about 1 in 40 cases of TSA. The most common causes of readmission include pneumonia, dislocation, pulmonary embolism, and surgical site infection. Patients with old age, male sex, anemia, and dependent functional status are at a higher risk for readmission and should be counseled and monitored accordingly.
This paper will be judged for the Resident Writer’s Award.
- Adams JE, Sperling JW, Hoskin TL, Melton LJ, Cofield RH. Shoulder arthroplasty in Olmsted County, Minnesota, 1976-2000: a population-based study. J Shoulder Elbow Surg.2006;15(1):50-55. doi:10.1016/j.jse.2005.04.009.
- Jain NB, Higgins LD, Guller U, Pietrobon R, Katz JN. Trends in the epidemiology of total shoulder arthroplasty in the United States from 1990-2000. Arthritis Rheum.2006;55(4):591-597. doi:10.1002/art.22102.
- Kim SH, Wise BL, Zhang Y, Szabo RM. Increasing incidence of shoulder arthroplasty in the United States. J Bone Joint Surg Am. 2011;93(24):2249-2254. doi:10.2106/JBJS.J.01994. doi:10.2106/JBJS.J.01994.
- Mather RC, Watters TS, Orlando LA, Bolognesi MP, Moorman CT. Cost effectiveness analysis of hemiarthroplasty and total shoulder arthroplasty. J Shoulder Elbow Surg.2010;19(3):325-334. doi:10.1016/j.jse.2009.11.057.
- Carter MJ, Mikuls TR, Nayak S, Fehringer EV, Michaud K. Impact of total shoulder arthroplasty on generic and shoulder-specific health-related quality-of-life measures: a systematic literature review and meta-analysis. J Bone Joint Surg Am. 2012;94(17):e127. doi:10.2106/JBJS.K.00204.
- Deshmukh AV, Koris M, Zurakowski D, Thornhill TS. Total shoulder arthroplasty: long-term survivorship, functional outcome, and quality of life. J Shoulder Elbow Surg. 2005;14(5):471-479. doi:10.1016/j.jse.2005.02.009.
- Montoya F, Magosch P, Scheiderer B, Lichtenberg S, Melean P, Habermeyer P. Midterm results of a total shoulder prosthesis fixed with a cementless glenoid component. J Shoulder Elbow Surg. 2013;22(5):628-635. doi:10.1016/j.jse.2012.07.005.
- Raiss P, Bruckner T, Rickert M, Walch G. Longitudinal observational study of total shoulder replacements with cement: fifteen to twenty-year follow-up. J Bone Joint Surg Am.2014;96(3):198-205. doi:10.2106/JBJS.M.00079.
- Bohsali KI, Wirth MA, Rockwood CA. Complications of total shoulder arthroplasty. J Bone Joint Surg Am. 2006;88(10):2279-2292. doi:10.2106/JBJS.F.00125.
- Chalmers PN, Gupta AK, Rahman Z, Bruce B, Romeo AA, Nicholson GP. Predictors of early complications of total shoulder arthroplasty. J Arthroplasty. 2014;29(4):856-860. doi:10.1016/j.arth.2013.07.002.
- Cheung E, Willis M, Walker M, Clark R, Frankle MA. Complications in reverse total shoulder arthroplasty. J Am Acad Orthop Surg. 2011;19(7):439-449.
- Papadonikolakis A, Neradilek MB, Matsen FA. Failure of the glenoid component in anatomic total shoulder arthroplasty: a systematic review of the English-language literature between 2006 and 2012. J Bone Joint Surg Am. 2013;95(24):2205-2212. doi:10.2106/JBJS.L.00552.
- Saltzman BM, Chalmers PN, Gupta AK, Romeo AA, Nicholson GP. Complication rates comparing primary with revision reverse total shoulder arthroplasty. J Shoulder Elbow Surg.2014;23(11):1647-1654. doi:10.1016/j.jse.2014.04.015.
- Shields E, Iannuzzi JC, Thorsness R, Noyes K, Voloshin I. Perioperative complications after hemiarthroplasty and total shoulder arthroplasty are equivalent. J Shoulder Elbow Surg. 2014;23(10):1449-1453. doi:10.1016/j.jse.2014.01.052.
- Sperling JW, Hawkins RJ, Walch G, Mahoney AP, Zuckerman JD. Complications in total shoulder arthroplasty. Instr Course Lect. 2013;62:135-141.
- Shields E, Thirukumaran C, Thorsness R, Noyes K, Voloshin I. An analysis of adult patient risk factors and complications within 30 days after arthroscopic shoulder surgery. Arthroscopy. 2015;31(5):807-815. doi:10.1016/j.arthro.2014.12.011.
- Jencks SF, Williams MV, Coleman EA. Rehospitalizations among patients in the Medicare fee-for-service program. N Engl J Med. 2009;360(14):1418-1428. doi:10.1056/NEJMsa0803563.
- Centers for Medicare & Medicaid Services. Readmissions reduction program (HRRP). . Updated April 27, 2018. Accessed June 29, 2018.
- Lyman S, Jones EC, Bach PB, Peterson MG, Marx RG. The association between hospital volume and total shoulder arthroplasty outcomes. Clin Orthop Relat Res. 2005;432:132-137. doi:10.1097/01.blo.0000150571.51381.9a.
- Mahoney A, Bosco JA, Zuckerman JD. Readmission after shoulder arthroplasty. J Shoulder Elbow Surg. 2014;23(3):377-381. doi:10.1016/j.jse.2013.08.007.
- Schairer WW, Zhang AL, Feeley BT. Hospital readmissions after primary shoulder arthroplasty. J Shoulder Elbow Surg. 2014;23(9):1349-1355. doi:10.1016/j.jse.2013.12.004.
- Streubel PN, Simone JP, Sperling JW, Cofield R. Thirty and ninety-day reoperation rates after shoulder arthroplasty. J Bone Joint Surg Am. 2014;96(3):e17. doi:10.2106/JBJS.M.00127.
- Zhang AL, Schairer WW, Feeley BT. Hospital readmissions after surgical treatment of proximal humerus fractures: is arthroplasty safer than open reduction internal fixation? Clin Orthop Relat Res. 2014;472(8):2317-2324. doi:10.1007/s11999-014-3613-y.
- American College of Surgeons. ACS National Surgical Quality Improvement Program. http://www.acsnsqip.org. Accessed July 15, 2015.
- Basques BA, Gardner EC, Varthi AG, et al. Risk factors for short-term adverse events and readmission after arthroscopic meniscectomy: does age matter? Am J Sports Med.2015;43(1):169-175. doi:10.1177/0363546514551923.
- Haughom BD, Schairer WW, Hellman MD, Yi PH, Levine BR. Does resident involvement impact post-operative complications following primary total knee arthroplasty? An analysis of 24,529 cases. J Arthroplasty. 2014;29(7):1468-1472.e2. doi:10.1016/j.arth.2014.02.036.
- Haughom BD, Schairer WW, Hellman MD, Yi PH, Levine BR. Resident involvement does not influence complication after total hip arthroplasty: an analysis of 13,109 cases. J Arthroplasty. 2014;29(10):1919-1924. doi:10.1016/j.arth.2014.06.003.
- Martin CT, Gao Y, Pugely AJ, Wolf BR. 30-day morbidity and mortality after elective shoulder arthroscopy: a review of 9410 cases. J Shoulder Elbow Surg. 2013;22(12):1667-1675.e1. doi:10.1016/j.jse.2013.06.022.
- Martin CT, Pugely AJ, Gao Y, Wolf BR. Risk factors for thirty-day morbidity and mortality following knee arthroscopy: a review of 12,271 patients from the national surgical quality improvement program database. J Bone Joint Surg Am. 2013;95(14):e98 1-10. doi:10.2106/JBJS.L.01440.
- Waterman BR, Dunn JC, Bader J, Urrea L, Schoenfeld AJ, Belmont PJ. Thirty-day morbidity and mortality after elective total shoulder arthroplasty: patient-based and surgical risk factors. J Shoulder Elbow Surg. 2015;24(1):24-30. doi:10.1016/j.jse.2014.05.016.
- Basques BA, Gardner EC, Toy JO, Golinvaux NS, Bohl DD, Grauer JN. Length of stay and readmission after total shoulder arthroplasty: an analysis of 1505 cases. Am J Orthop.2015;44(8):E268-E271.
- Bohl DD, Russo GS, Basques BA, et al. Variations in data collection methods between national databases affect study results: a comparison of the nationwide inpatient sample and national surgical quality improvement program databases for lumbar spine fusion procedures. J Bone Joint Surg Am. 2014;96(23):e193. doi:10.2106/JBJS.M.01490.
TAKE-HOME POINTS
- Shoulder arthroplasty is an increasingly commonly performed procedure for shoulder arthritis and other conditions.
- Unplanned readmission in the 30 days after shoulder arthroplasty occurred in about 1 of 40 cases.
- Increasing age was associated with readmission, particularly age >80 years.
- Other risk factors for readmission were male sex, anemia, and dependent functional status.
- The most common reasons for readmission were pneumonia, dislocation, pulmonary embolism, and surgical site infection.
Patient Satisfaction and Quality of Care: A Prospective Study at Outpatient Dermatology Clinics
The Patient Protection and Affordable Care Act has increased the number of insured Americans by more than 20 million individuals.1 Approximately half of the newly insured have an income at or below 138% of the poverty level and are on average younger, sicker, and more likely to report poor to fair health compared to those individuals who already had health care coverage.2 Specialties such as dermatology are faced with the challenge of expanding access to these newly insured individuals while also improving quality of care.
Because of the complexity of defining quality in medicine, patient satisfaction is being used as a proxy for quality, with physicians evaluated and reimbursed based on patient satisfaction scores. Little research has been conducted to validate the relationship between patient satisfaction and quality; however, one study showed online reviews from patients on Yelp correlated with traditional markers of quality, such as mortality and readmission rates, lending credibility to the notion that patient satisfaction equates quality of care.3 Moreover, prospective studies have found positive correlations between patient satisfaction and compliance to therapy4,5; however, these studies may not give a complete picture of the relationship between patient satisfaction and quality of care, as other studies also have illustrated that, more often than not, factors extrinsic to actual medical care (eg, time spent in the waiting room) play a considerable role in patient satisfaction scores.6-9
When judging the quality of care that is provided, one study found that patients rate physicians based on interpersonal skills and not care delivered.8 Another important factor related to patient satisfaction is the anonymity of the surveys. Patients who have negative experiences are more likely to respond to online surveys than those who have positive experiences, skewing overall ratings.6 Additionally, because of Health Insurance Portability and Accountability Act regulations, physicians often are unable to respond directly to public patient reviews, resulting in an incomplete picture of the quality of care provided.
Ultimately, even if physicians do not agree that patient satisfaction correlates with quality of care, it is increasingly being used as a marker of such. Leading health care systems are embracing this new weight on patient satisfaction by increasing transparency and publishing patient satisfaction results online, allowing patients more access to physician reviews.
In dermatology, patient satisfaction serves an even more important role, as traditional markers of quality such as mortality and hospital readmission rates are not reasonable measures of patient care in this specialty, leaving patient satisfaction as one of the most accessible markers insurance companies and prospective patients can use to evaluate dermatologists. Furthermore, treatment modalities in dermatology often aim to improve quality of life, of which patient satisfaction arguably serves as an indicator. Ideally, patient satisfaction would allow physicians to identify areas where they may be better able to meet patients’ needs. However, patient satisfaction scores rarely are used as outcome measures in studies and are notoriously difficult to ascertain, as they tend to be inaccurate and may be unreliable in correlation with physician skill and training or may be skewed by patients’ desires to please their physicians.10 There also is a lack of standardized tools and scales to quantitatively judge outcomes in procedural surgeries.
Although patient satisfaction is being used as a measure of quality of care and is particularly necessary in a field such as dermatology that has outcome measures that are subjective in nature, there is a gap in the current literature regarding patient satisfaction and dermatology. To fill this gap, we conducted a prospective study of targeted interventions administered at outpatient dermatology clinics to determine if they resulted in statistically significant increases in patient satisfaction measures, particularly among Spanish-speaking patients.
Methods
We conducted a prospective study evaluating patient satisfaction in the outpatient dermatology clinics of LAC+USC Medical Center in Los Angeles, California, spanning over 1 year. During this time period, patients were randomly selected to participate and were asked to complete the Short-Form Patient Satisfaction Questionnaire (PSQ-18), which asked patients to rate their care experience on a 5-point Likert scale (1=strongly agree; 5=strongly disagree). The survey was separated into the following 7 subscales or categories looking at different aspects of care: general satisfaction, technical quality, interpersonal manner, communication, financial aspects, time spent with physician, and accessibility and convenience. Patients were given this survey both before and after targeted interventions to improve patient satisfaction were implemented. The targeted interventions were created based on literature review in the factors affecting patient satisfaction. The change in relative satisfaction was then determined using statistical analysis. The study was approved by the University of Southern California Health Science institutional review board.
Results
Of 470 patients surveyed, the average age was 49 years. Fifty percent of respondents were male, 70% self-identified as Hispanic, 45% spoke Spanish as their native language, and 69% reported a mean annual household income of less than $15,000. When scores were stratified, English-speaking patients were significantly more satisfied than Spanish-speaking patients in the categories of technical quality (P.0340), financial aspects (P.0301), interpersonal manner (P.0037), and time spent with physician (P.0059). Specifically, in the time spent with physician category, the lowest scores were found in females, patients aged 18 to 29 years, and patients with a mean annual household income less than $15,000. These demographics correlate well with many of the newly insured and intimate the need for improved patient satisfaction, particularly in this subset of patients.
After analyzing baseline patient satisfaction scores, we implemented targeted interventions such as creating a call tree, developing multilingual disease-specific patient handouts, instituting quarterly nursing in-services, which judged interpersonal and occupational nursing skills, and recruiting bilingual staff. These interventions were implemented simultaneously and were selected with the goal of reducing the impact of the language barrier between physicians and patients and increasing accessibility to clinics. Following approximately 3 months of these interventions, performance on many categories increased in our demographics that were lowest performing when we collected baseline data. In Spanish-speaking respondents, improvement in several categories approached statistical significance, including general satisfaction (P.110), interpersonal skills (P.080), and time spent with physician (P.096). When stratifying by income and age, patients with a mean annual household income less than $15,000 demonstrated an improved technical quality (P.066) subscale score, and participants aged 18 to 29 years showed improvement in both accessibility and convenience (P.053) and financial aspects (P.056) subscales.
Comment
The categories where improvements were found are noteworthy and suggest that certain aspects of care are more important than others. Although it seems intuitive that clinical acumen and training should be important contributors to patient satisfaction, one study that analyzed 1000 online comments regarding patient satisfaction with dermatologists on the website DrScore.com found that most comments concerned physician personality and interpersonal skills rather than medical judgment and acumen,4 suggesting that a patient’s perception of the character of the physician directly affects patient satisfaction scores. This notion was reiterated by other studies, including one that found that a patient’s perception of the physician’s kindness and empathy skills, is the most important measure of quality of care scores.8 Although this perception can be intimidating to some physicians, as certain interpersonal skills are difficult to change, it is reassuring to note that external environment and cues, such as the clinic building and staff, also seem to affect interpersonal ratings. As seen in our study, patient ratings of a physician’s interpersonal skills increased after educational materials for staff and patients were created and more bilingual staff was recruited. Other environmental changes, such as spending a few more minutes with patients and sitting down when talking to patients, are relatively easy to administer and can improve patient satisfaction scores.8
Although some of the scores in our study approached but did not reach statistical significance, likely because of a small sample size, they suggest that targeted interventions can improve patient satisfaction. They also suggested that targeted interventions are particularly useful in Spanish-speaking patients, younger patients, and patients from lower socioeconomic backgrounds, which are all characteristics of the newly insured under the Patient Protection and Affordable Health Care Act.
Our study also is unique in that dermatology as a specialty is lagging in quality improvement studies. In the few studies evaluating patient satisfaction in the literature, the care provided by dermatologists was painted in a positive light.6,11 One study evaluated 45 dermatology practices and reported average patient satisfaction scores of 3.46 and 4.72 of 5 on Yelp and ZocDoc, respectively.11 Another study looking at dermatologist ratings on DrScore.com found that the majority of patients were satisfied with the care they received.6
Although these studies seem encouraging, they have several limitations. First, their results were not stratified by patient demographics and therefore may not be generalizable to low-income populations that constitute much of the newly insured. Secondly, the observational nature and limited number of studies prohibit meaningful conclusions from being drawn and leave many questions unanswered. Additionally, although the raw patient satisfaction scores seem good, dermatology is lacking compared to the patient satisfaction scores within other specialties. A study of more than 28,000 Yelp reviews of 23 specialties found that dermatology ranked second to last, ahead of only psychiatry.7 Of course, given the observational nature of this study, it is impossible to generalize, as many confounders (eg, medical comorbidities, patient age) may have skewed the dermatology ranking. Regardless, there is always room for improvement, and luckily improving patient satisfaction is not an elusive goal.
Conclusion
As dermatologists, our interventions often improve quality of life; therefore, we are positioned to be leaders in the quality improvement field. Despite the numerous limitations of using patient satisfaction as a measure for quality of care, it is used by payers to determine reimbursement and patients to select providers. Encouraging initial data from our prospective study demonstrate that small interventions can increase patient satisfaction. Continued work to maximize patient satisfaction is needed to improve outcomes for our patients, help validate the quality of care being provided, and further solidify the importance of having insurers maintain sufficient dermatologists in their networks.
- Uberoi N, Finegold K, Gee E. Health insurance coverage and the Affordable Care Act, 2010-2016. US Department of Health & Human Services website. https://aspe.hhs.gov/system/files/pdf/187551/ACA2010-2016.pdf. Published March 3, 2016. Accessed May 18, 2018.
- Shatzer A, Long SK, Zuckerman S. Who are the newly insured as of early March 2014? Urban Institute Health Policy Center website. http://hrms.urban.org/briefs/Who-Are-the-Newly-Insured.html. Published May 22, 2014. Accessed May 18, 2018.
- Bardach NS, Asteria-Peñaloza R, Boscardin WJ, et al. The relationship between commercial website ratings and traditional hospital performance measures in the USA. BMJ Qual Saf. 2013;22:194-202.
- Kincey J, Bradshaw P, Ley P. Patient satisfaction and reported acceptance of medical advice in general practice. J R Coll Gen Pract. 1975;25:558-566.
- Francis V, Korsch BM, Morris MJ. Gaps in doctor-patient communication. patients’ response to medical advice. N Engl J Med. 1969;280:535-540.
- Ali ST, Feldman SR. Patient satisfaction in dermatology: a qualitative assessment. Dermatol Online J. 2014;20. pii:doj_21534.
- Internet study: highest educated & trained doctors get poorest online reviews. Vanguard Communications website. https://vanguard communications.net/best-online-doctor-reviews/. Published April 22, 2015. Accessed May 18, 2018.
- Uhas AA, Camacho FT, Feldman SR, et al. The relationship between physician friendliness and caring, and patient satisfaction: findings from an internet-based survey. Patient. 2008;1:91-96.
- Anderson RT, Camacho FT, Balkrishnan R. Willing to wait?: the influence of patient wait time on satisfaction with primary care. BMC Health Serv Res. 2007;7:31.
- Maibach HI, Gorouhi F. Evidence-Based Dermatology. 2nd ed. Shelton, CT: People’s Medical Publishing House-USA; 2011.
- Smith R, Lipoff J. Evaluation of dermatology practice online reviews. JAMA Dermatol. 2016;152:153-157.
The Patient Protection and Affordable Care Act has increased the number of insured Americans by more than 20 million individuals.1 Approximately half of the newly insured have an income at or below 138% of the poverty level and are on average younger, sicker, and more likely to report poor to fair health compared to those individuals who already had health care coverage.2 Specialties such as dermatology are faced with the challenge of expanding access to these newly insured individuals while also improving quality of care.
Because of the complexity of defining quality in medicine, patient satisfaction is being used as a proxy for quality, with physicians evaluated and reimbursed based on patient satisfaction scores. Little research has been conducted to validate the relationship between patient satisfaction and quality; however, one study showed online reviews from patients on Yelp correlated with traditional markers of quality, such as mortality and readmission rates, lending credibility to the notion that patient satisfaction equates quality of care.3 Moreover, prospective studies have found positive correlations between patient satisfaction and compliance to therapy4,5; however, these studies may not give a complete picture of the relationship between patient satisfaction and quality of care, as other studies also have illustrated that, more often than not, factors extrinsic to actual medical care (eg, time spent in the waiting room) play a considerable role in patient satisfaction scores.6-9
When judging the quality of care that is provided, one study found that patients rate physicians based on interpersonal skills and not care delivered.8 Another important factor related to patient satisfaction is the anonymity of the surveys. Patients who have negative experiences are more likely to respond to online surveys than those who have positive experiences, skewing overall ratings.6 Additionally, because of Health Insurance Portability and Accountability Act regulations, physicians often are unable to respond directly to public patient reviews, resulting in an incomplete picture of the quality of care provided.
Ultimately, even if physicians do not agree that patient satisfaction correlates with quality of care, it is increasingly being used as a marker of such. Leading health care systems are embracing this new weight on patient satisfaction by increasing transparency and publishing patient satisfaction results online, allowing patients more access to physician reviews.
In dermatology, patient satisfaction serves an even more important role, as traditional markers of quality such as mortality and hospital readmission rates are not reasonable measures of patient care in this specialty, leaving patient satisfaction as one of the most accessible markers insurance companies and prospective patients can use to evaluate dermatologists. Furthermore, treatment modalities in dermatology often aim to improve quality of life, of which patient satisfaction arguably serves as an indicator. Ideally, patient satisfaction would allow physicians to identify areas where they may be better able to meet patients’ needs. However, patient satisfaction scores rarely are used as outcome measures in studies and are notoriously difficult to ascertain, as they tend to be inaccurate and may be unreliable in correlation with physician skill and training or may be skewed by patients’ desires to please their physicians.10 There also is a lack of standardized tools and scales to quantitatively judge outcomes in procedural surgeries.
Although patient satisfaction is being used as a measure of quality of care and is particularly necessary in a field such as dermatology that has outcome measures that are subjective in nature, there is a gap in the current literature regarding patient satisfaction and dermatology. To fill this gap, we conducted a prospective study of targeted interventions administered at outpatient dermatology clinics to determine if they resulted in statistically significant increases in patient satisfaction measures, particularly among Spanish-speaking patients.
Methods
We conducted a prospective study evaluating patient satisfaction in the outpatient dermatology clinics of LAC+USC Medical Center in Los Angeles, California, spanning over 1 year. During this time period, patients were randomly selected to participate and were asked to complete the Short-Form Patient Satisfaction Questionnaire (PSQ-18), which asked patients to rate their care experience on a 5-point Likert scale (1=strongly agree; 5=strongly disagree). The survey was separated into the following 7 subscales or categories looking at different aspects of care: general satisfaction, technical quality, interpersonal manner, communication, financial aspects, time spent with physician, and accessibility and convenience. Patients were given this survey both before and after targeted interventions to improve patient satisfaction were implemented. The targeted interventions were created based on literature review in the factors affecting patient satisfaction. The change in relative satisfaction was then determined using statistical analysis. The study was approved by the University of Southern California Health Science institutional review board.
Results
Of 470 patients surveyed, the average age was 49 years. Fifty percent of respondents were male, 70% self-identified as Hispanic, 45% spoke Spanish as their native language, and 69% reported a mean annual household income of less than $15,000. When scores were stratified, English-speaking patients were significantly more satisfied than Spanish-speaking patients in the categories of technical quality (P.0340), financial aspects (P.0301), interpersonal manner (P.0037), and time spent with physician (P.0059). Specifically, in the time spent with physician category, the lowest scores were found in females, patients aged 18 to 29 years, and patients with a mean annual household income less than $15,000. These demographics correlate well with many of the newly insured and intimate the need for improved patient satisfaction, particularly in this subset of patients.
After analyzing baseline patient satisfaction scores, we implemented targeted interventions such as creating a call tree, developing multilingual disease-specific patient handouts, instituting quarterly nursing in-services, which judged interpersonal and occupational nursing skills, and recruiting bilingual staff. These interventions were implemented simultaneously and were selected with the goal of reducing the impact of the language barrier between physicians and patients and increasing accessibility to clinics. Following approximately 3 months of these interventions, performance on many categories increased in our demographics that were lowest performing when we collected baseline data. In Spanish-speaking respondents, improvement in several categories approached statistical significance, including general satisfaction (P.110), interpersonal skills (P.080), and time spent with physician (P.096). When stratifying by income and age, patients with a mean annual household income less than $15,000 demonstrated an improved technical quality (P.066) subscale score, and participants aged 18 to 29 years showed improvement in both accessibility and convenience (P.053) and financial aspects (P.056) subscales.
Comment
The categories where improvements were found are noteworthy and suggest that certain aspects of care are more important than others. Although it seems intuitive that clinical acumen and training should be important contributors to patient satisfaction, one study that analyzed 1000 online comments regarding patient satisfaction with dermatologists on the website DrScore.com found that most comments concerned physician personality and interpersonal skills rather than medical judgment and acumen,4 suggesting that a patient’s perception of the character of the physician directly affects patient satisfaction scores. This notion was reiterated by other studies, including one that found that a patient’s perception of the physician’s kindness and empathy skills, is the most important measure of quality of care scores.8 Although this perception can be intimidating to some physicians, as certain interpersonal skills are difficult to change, it is reassuring to note that external environment and cues, such as the clinic building and staff, also seem to affect interpersonal ratings. As seen in our study, patient ratings of a physician’s interpersonal skills increased after educational materials for staff and patients were created and more bilingual staff was recruited. Other environmental changes, such as spending a few more minutes with patients and sitting down when talking to patients, are relatively easy to administer and can improve patient satisfaction scores.8
Although some of the scores in our study approached but did not reach statistical significance, likely because of a small sample size, they suggest that targeted interventions can improve patient satisfaction. They also suggested that targeted interventions are particularly useful in Spanish-speaking patients, younger patients, and patients from lower socioeconomic backgrounds, which are all characteristics of the newly insured under the Patient Protection and Affordable Health Care Act.
Our study also is unique in that dermatology as a specialty is lagging in quality improvement studies. In the few studies evaluating patient satisfaction in the literature, the care provided by dermatologists was painted in a positive light.6,11 One study evaluated 45 dermatology practices and reported average patient satisfaction scores of 3.46 and 4.72 of 5 on Yelp and ZocDoc, respectively.11 Another study looking at dermatologist ratings on DrScore.com found that the majority of patients were satisfied with the care they received.6
Although these studies seem encouraging, they have several limitations. First, their results were not stratified by patient demographics and therefore may not be generalizable to low-income populations that constitute much of the newly insured. Secondly, the observational nature and limited number of studies prohibit meaningful conclusions from being drawn and leave many questions unanswered. Additionally, although the raw patient satisfaction scores seem good, dermatology is lacking compared to the patient satisfaction scores within other specialties. A study of more than 28,000 Yelp reviews of 23 specialties found that dermatology ranked second to last, ahead of only psychiatry.7 Of course, given the observational nature of this study, it is impossible to generalize, as many confounders (eg, medical comorbidities, patient age) may have skewed the dermatology ranking. Regardless, there is always room for improvement, and luckily improving patient satisfaction is not an elusive goal.
Conclusion
As dermatologists, our interventions often improve quality of life; therefore, we are positioned to be leaders in the quality improvement field. Despite the numerous limitations of using patient satisfaction as a measure for quality of care, it is used by payers to determine reimbursement and patients to select providers. Encouraging initial data from our prospective study demonstrate that small interventions can increase patient satisfaction. Continued work to maximize patient satisfaction is needed to improve outcomes for our patients, help validate the quality of care being provided, and further solidify the importance of having insurers maintain sufficient dermatologists in their networks.
- Uberoi N, Finegold K, Gee E. Health insurance coverage and the Affordable Care Act, 2010-2016. US Department of Health & Human Services website. https://aspe.hhs.gov/system/files/pdf/187551/ACA2010-2016.pdf. Published March 3, 2016. Accessed May 18, 2018.
- Shatzer A, Long SK, Zuckerman S. Who are the newly insured as of early March 2014? Urban Institute Health Policy Center website. http://hrms.urban.org/briefs/Who-Are-the-Newly-Insured.html. Published May 22, 2014. Accessed May 18, 2018.
- Bardach NS, Asteria-Peñaloza R, Boscardin WJ, et al. The relationship between commercial website ratings and traditional hospital performance measures in the USA. BMJ Qual Saf. 2013;22:194-202.
- Kincey J, Bradshaw P, Ley P. Patient satisfaction and reported acceptance of medical advice in general practice. J R Coll Gen Pract. 1975;25:558-566.
- Francis V, Korsch BM, Morris MJ. Gaps in doctor-patient communication. patients’ response to medical advice. N Engl J Med. 1969;280:535-540.
- Ali ST, Feldman SR. Patient satisfaction in dermatology: a qualitative assessment. Dermatol Online J. 2014;20. pii:doj_21534.
- Internet study: highest educated & trained doctors get poorest online reviews. Vanguard Communications website. https://vanguard communications.net/best-online-doctor-reviews/. Published April 22, 2015. Accessed May 18, 2018.
- Uhas AA, Camacho FT, Feldman SR, et al. The relationship between physician friendliness and caring, and patient satisfaction: findings from an internet-based survey. Patient. 2008;1:91-96.
- Anderson RT, Camacho FT, Balkrishnan R. Willing to wait?: the influence of patient wait time on satisfaction with primary care. BMC Health Serv Res. 2007;7:31.
- Maibach HI, Gorouhi F. Evidence-Based Dermatology. 2nd ed. Shelton, CT: People’s Medical Publishing House-USA; 2011.
- Smith R, Lipoff J. Evaluation of dermatology practice online reviews. JAMA Dermatol. 2016;152:153-157.
Practice Points
- It is becoming increasingly important, particularly in the field of dermatology, to both measure and work to improve patient satisfaction scores.
- Preliminary research has found that simple interventions, such as providing disease-specific handouts and interpreter services, can improve satisfaction scores, making patient satisfaction an achievable goal.

Diet and Dermatology: Google Search Results for Acne, Psoriasis, and Eczema
Researching medical information currently is the third most common use of the Internet in the United States,1 with the majority of adults using the Web as their first source for health information before seeing a physician.2 When assessing health-related information online, resources can be grouped into 4 categories: (1) those attributed to self-proclaimed experts, (2) promotional, (3) social media, and (4) educational.3 Access to such a wide range of sources may give readers the opportunity to share personal anecdotes and opinions, thereby serving as a forum for information that essentially cannot be validated. Although such websites may include useful information and cite current literature, in other instances health-related information may be misleading or fabricated.3
In a study evaluating 291 skin conditions and related Google trends, acne, psoriasis, and eczema were among the most burdensome diseases, with acne yielding the highest number of search results.4 Results of the study indicated a positive correlation between disease burden and online search interest.4 The impact of these online searches and the validity of Google search results are topics worth considering, as more dermatology patients are relying on holistic and nonpharmaceutical approaches to treatment and disease management.5 The purpose of this study was to evaluate content on diet and dermatology available on the Internet for acne, psoriasis, and eczema.
Methods
Google searches were performed in December 2017 using the terms diet and acne, diet and psoriasis, and diet and eczema. The first 10 results for each respective search were reviewed for recommendations about which foods to incorporate in the diet and which to avoid. They also were classified according to the following 4 website categories: (1) those attributed to self-proclaimed experts, (2) promotional, (3) social media, and (4) educational. The recommendations gathered from the 30 websites were then compared to the current literature assessing the impact of diet on these respective conditions by conducting PubMed searches of articles indexed for MEDLINE using the same terms.
Results
The results of this study are outlined in the eTable.

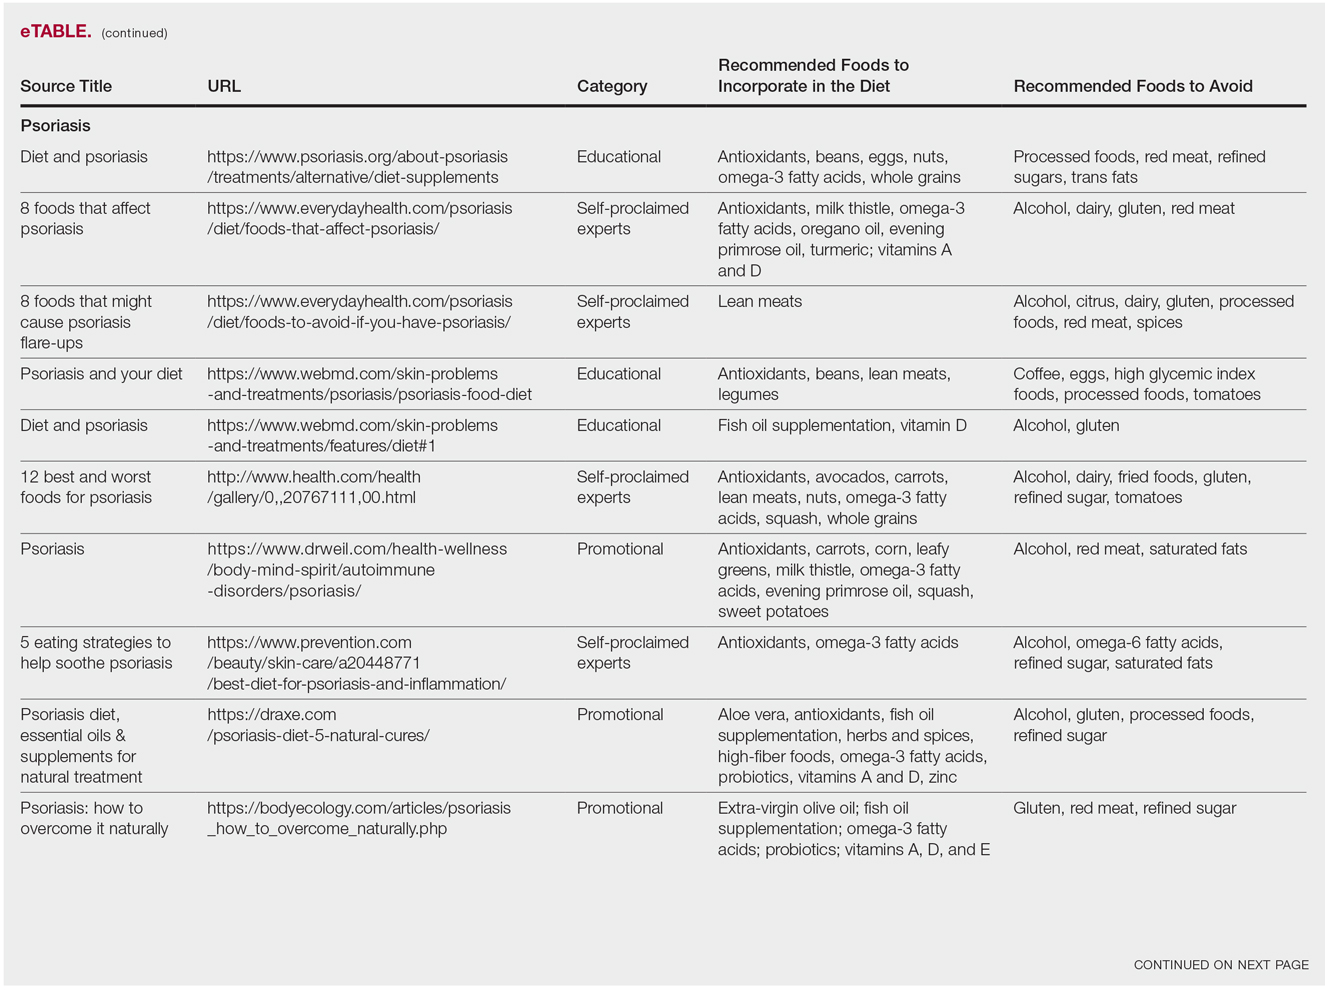
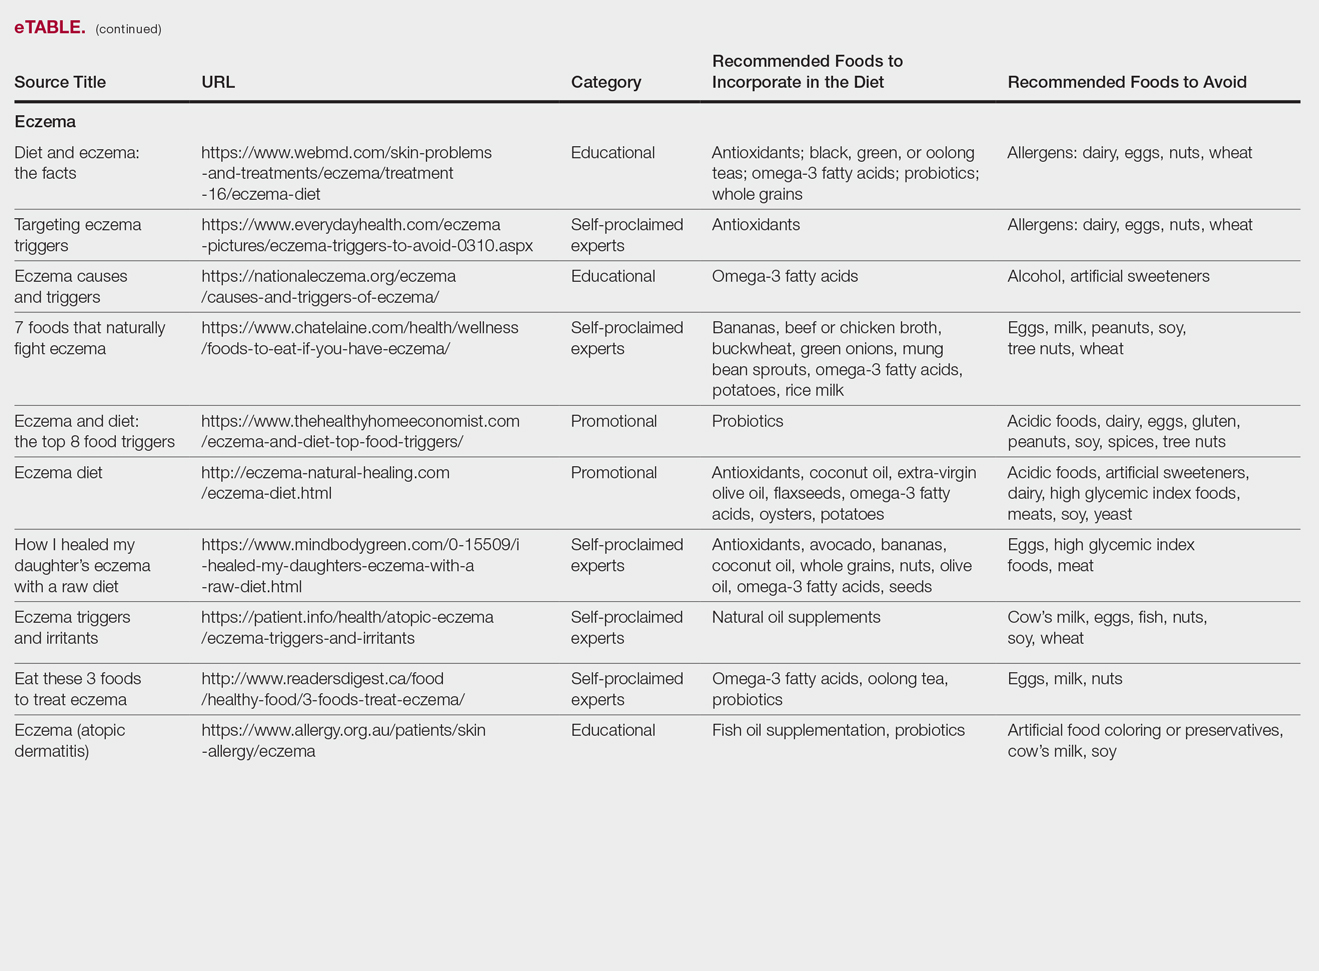
Acne
Our Google search using the term diet and acne produced 17,500,000 results. Of the first 10 search results, 40% (4/10) were websites attributed to self-proclaimed experts, 40% (4/10) were educational resources, and 20% (2/10) were promotional websites. Most of the websites advised acne patients to avoid high glycemic index foods (90% [9/10]) and dairy products (90% [9/10]). When discussing which foods to include in the diet, 70% (7/10) of websites recommended that patients incorporate omega-3 fatty acids and antioxidants in the diet.
Research has shown that a low glycemic index diet can lead to a decrease in patients’ acne lesion counts in some instances.6,7 In a case-controlled study of 2258 patients on a popular weight loss diet that emphasized low glycemic index foods, 87% of participants reported a reduction in acne and 91% reported a decrease in their dosage or number of acne medications.7 Still, the exact correlation between acne development and consumption of glycemic index foods has not been confirmed. However, high glycemic index diets have been linked to hyperinsulinemia, indicating that insulin levels may play a role in acne formation.8 The majority of other currently available studies evaluated the potential link between dairy consumption and acne. A retrospective analysis of 47,355 women spanning 12 weeks showed a positive link between increased dairy consumption, specifically skim milk, and acne formation. Despite the positive trend, limitations such as recall bias made it difficult to draw a conclusion based on these findings.9 However, results of a longitudinal questionnaire-based population study evaluating the impact of dairy consumption on acne in 2489 adolescent patients confirmed a positive correlation.10 Studies conducted in 2009 and 2011 concluded that milk consumption results in elevated insulinlike growth factor 1 levels, which were linked to comedogenesis.8,11
Currently, there are well-described mechanisms to explain the association of dairy consumption and glycemic index with acne. Confirming a correlation between acne development and dairy consumption suggests that a dairy-free diet may benefit acne patients.5 Other trials indicate that low glycemic index diets are beneficial in treating acne.6,7 Therefore, some of the recommendations made in our search results may be of merit; however, there is minimal evidence proving the benefits of the other dietary recommendations made in the websites we evaluated.
Psoriasis
Our Google search using the term diet and psoriasis yielded a total of 9,420,000 results. Of the first 10 search results, 40% (4/10) were websites attributed to self-proclaimed experts, 30% (3/10) were promotional, and 30% (3/10) were educational. Seventy percent (7/10) of websites recommended avoiding alcohol and 60% (6/10) recommended avoiding gluten, with others discouraging consumption of red meat. Most of the websites encouraged patients to consume omega-3 fatty acids and antioxidants, while a few also recommended vitamins A, D, and E, as well as evening primrose oil supplements.
Although current research indicates a positive correlation between excessive alcohol use and psoriasis severity, it is still unclear whether alcohol consumption can be directly linked to the disease.12-14 Likewise, despite belief that increased oxidative stress likely contributes to inflammation in psoriasis, there is little evidence linking antioxidants to improvement in psoriasis symptoms.12 However, the current literature is inconsistent regarding the effects of fish oil supplementation on psoriasis.12 In a randomized double-blind study of 145 patients, there was no significant difference in psoriasis area and severity index scores between a control group and a treatment group receiving fish oil supplementation.15 In another RCT of 45 participants, those given daily very long-chain omega-3 fatty acid supplements saw no difference in psoriasis symptoms.15 Despite debate, literature assessing the impact of gluten-free diets has described improvement in psoriasis lesions in patients with celiac-specific antibodies.16 Although some observational studies described vitamin D supplementation to be beneficial in the treatment of psoriatic lesions, a more recent RCT found no significant difference between control and treatment groups.17-19
Studies also have revealed that certain eating patterns, such as those associated with the Mediterranean diet that is rich in fruits, vegetables, whole grains, and omega-3 fatty acids may be linked to improved endothelial function scores and reduced C-reactive protein and IL-18levels.20,21 In a double-blind RCT of 75 patients with plaque psoriasis, mean (SD) psoriasis area and severity index scores decreased by 11.2 (9.8) in a group treated with omega-3 fatty acids compared to 7.5 (8.8) with omega-6 fatty acids (P=.048).22
Although excessive alcohol use may be linked to psoriasis, there is no conclusive evidence indicating causation, thereby discrediting online claims.12-14 Research has revealed that gluten-free diets in psoriasis patients with celiac disease may improve psoriasis treatment16; however, sufficient evidence is lacking for diets low in gluten and high in polyunsaturated fatty acids or antioxidant supplementation. Of the dietary supplements recommended in the search results we reviewed, fish oil appears to be the most promising, but no recommendations can be made based on the current research.
Eczema
Our Google search using the term diet and eczema yielded 1,160,000 results, with 50% (5/10) of websites attributed to self-proclaimed experts, 30% (3/10) to educational websites, and 20% (2/10) to promotional sites. Of the first 10 results, 80% (8/10) recommended that patients with eczema avoid milk/dairy and 50% (5/10) advised to avoid soy and wheat/gluten. Other websites indicated to avoid eggs, nuts, and artificial sweeteners. Patients were encouraged to incorporate omega-3 fatty acids in their diets, and a few sites recommended bananas, coconut oil, olive oil, and various teas.
In a review of 11 studies with a total of 596 participants, supplementation with vitamins D and E, fish oil, olive oil, and linoleic acid was evaluated for the treatment of eczema.23 Although results indicated modest improvement of eczema severity with supplementation of fish oil, evidence favoring this treatment is limited and unconvincing. Furthermore, some evidence indicates that elimination diets are only appropriate for patients with food allergies.24 In a study evaluating an egg-free and dairy-free diet for eczema patients, only participants with positive egg-specific serum IgE levels saw improvement in disease severity.23 Even though IgE-mediated food allergies have been reported in 40% of children with moderate eczema, the contribution of these allergies to eczema is questionable.25
There is little evidence in the literature to indicate a definitive correlation between the foods mentioned in the search results we evaluated and the development of eczema; however, for patients with food allergies and eczema, elimination diets may decrease disease severity.25,26 There is insufficient evidence to suggest a benefit from evening primrose oil or fish oil supplementation, thereby debunking claims found online.
Comment
Although our Google search results included a wide range of sources and information regarding diet and dermatologic conditions such as acne, psoriasis, and eczema, most of the information we found was either unfounded or misleading. Study limitations in the current literature include small sample size, potential recall bias, lack of appropriate controls, incomplete reported results, and the failure to clearly define skin changes.
When considering the accuracy and type of information regarding skin conditions that is available on the Internet, it is important to note that most of the results we reviewed were webpages attributed to self-proclaimed experts. Although educational websites also were included in the search results, whether or not patients prefer or understand the content of such websites is still unknown; therefore, health organizations should consider revising online patient education materials to allow universal comprehension.27
Furthermore, it is important to consider the impact that widespread Internet access may have on the physician-patient relationship. Having access to health-related information online and being able to potentially self-diagnose could delay or deter patients from seeking professional advice or care.3 A study evaluating the impact of online searches on the physician-patient relationship among 175 patients determined that 36.5% of patients gathered information online prior to their consultation with a physician, while 67.3% chose to complement the information given to them by their physician with online resources.28 Based on these statistics, it is important that physicians be up-to-date with Internet discourse to discredit unfounded recommendations. Ultimately, when it comes to diet and dermatology, patients ought to be skeptical of the information currently available on the Internet, given that most of it is unsubstantiated by medical research.
- Fox S. Online health search 2006. Pew Research Center website. http://www.pewinternet.org/2006/10/29/online-health-search-2006/. Published October 29, 2006. Accessed May 3, 2018.
- Prestin A, Vieux SN, Chou WY. Is online health activity alive and well or flatlining? findings from 10 years of the health information national trends survey. J Health Commun. 2015;20:790-798.
- Zeichner JA, Del Rosso JQ. Acne and the internet. Dermatol Clin. 2016;34:129-132.
- Whitsitt J, Karimkhani C, Boyers LN, et al. Comparing burden of dermatologic disease to search interest on Google trends. Dermatol Online J. 2015;21. pii:13030/qt5xg811qp.
- Shokeen D. Influence of diet in acne vulgaris and atopic dermatitis. Cutis. 2016;98:E28-E29.
- Veith WB, Silverberg NB. The association of acne vulgaris with diet. Cutis. 2011;88:84-91.
- Rouhani P. Acne improves with a popular, low glycemic diet from South Beach. J Am Acad Dermatol. 2009;60(3, suppl 1):P706.
- Melnick BC. Evidence for acne-promoting effect of milk and other insulinotropic dairy products. Nestle Nutr Worksop Ser Pediatr Program. 2011;67:131-145.
- Adebamowo CA, Spiegelman D, Berkey CS, et al. High school dietary diary intake and teenage acne. J Am Acad Dermatol. 2005;52:207-214.
- Ulvestad M, Bjertness E, Dalgard F, et al. Acne and dairy products in adolescence: results from a Norwegian longitudinal study [published online July 16, 2016]. J Eur Acad Dermatol Venereol. 2017;31:530-535.
- Melnick BC, Schmitz G. Role of insulin, insulin like growth factor 1, hyperglycemic food and milk consumption in the pathogenesis of acne vulgaris. Exp Dermatol. 2009;18:833-841.
- Murzaku EC, Bronsnick T, Rao BK. Diet in dermatology: part II. melanoma, chronic urticaria, and psoriasis. J Am Acad Dermatol. 2014;71:1053.E1-1053.E16.
- Tobin AM, Higgins EM, Norris S, et al. Prevalence of psoriasis in patients with alcoholic liver disease. Clin Exp Dermatol. 2009;34:698-701.
- Kirby B, Richards HL, Mason DL, et al. Alcohol consumption and psychological distress in patients with psoriasis. Br J Dermatol. 2008;158:138-140.
- Søyland E, Funk J, Rajika G, et al. Effect of dietary supplementation with very long-chain n-3 fatty acids in patients with psoriasis. N Engl J Med. 1993;328:1812-1816.
- Michaëlsson G, Gerdén B, Hagforsen E, et al. Psoriasis patients with antibodies to gliadin can be improved by a gluten-free diet. Br J Dermatol. 2000;142:44-51.
- Morimoto S, Yoshikawa K. Psoriasis and vitamin D3. a review of our experience. Arch Dermatol. 1989;125:231-234.
- Smith EL, Pincus SH, Donovan L, et al. A novel approach for the evaluation and treatment of psoriasis. oral or topical use of 1,25-dihydroxyvitamin D3 can be a safe and effective therapy for psoriasis. J Am Acad Dermatol. 1988;19:516-528.
- Siddiqui MA, Al-Khawajah MM. Vitamin D3 and psoriasis: a randomized double-blind placebo-controlled study. J Dermatol Treat. 1990;1:243-245.
- Wang Y, Gao H, Loyd CM, et al. Chronic skin-specific inflammation promotes vascular inflammation and thrombosis. J Invest Dermatol. 2012;132:2067-2075.
- Barrea L, Nappi F, Di Somma C, et al. Environmental risk factors in psoriasis: the point of view of the nutritionist. Int J Environ Res Public Health. 2016;13. pii:E743. doi:10.3390/ijerph13070743.
- Mayser P, Mrowietz U, Arenberger P, et al. Omega-3 fatty acid-based lipid infusion in patients with chronic plaque psoriasis: results of a double-blind, randomized, placebo-controlled, multicenter trial. J Am Acad Dermatol. 1998;38:539-547.
- Bath-Hextall FJ, Jenkinson C, Humphreys R, et al. Dietary supplements for established atopic eczema. Cochrane Database Syst Rev. 2012;2:CD005205.
- Bronsnick T, Murzaku EC, Rao BK. Diet in dermatology: part I. atopic dermatitis, acne, and nonmelanoma skin cancer [published online November 15, 2014]. J Am Acad Dermatol. 2014;71:1039.E1-1039.E12.
- Campbell DE. The role of food allergy in childhood atopic dermatitis. J Paediatr Child Health. 2012;48:1058-1064.
- Werfel T, Erdmann S, Fuchs T, et al. Approach to suspected food allergy in atopic dermatitis. guideline of the Task Force on Food Allergy of the German Society of Allergology and Clinical Immunology (DGAKI) and the Medical Association of German Allergologists (ADA) and the German Society of Pediatric Allergology (GPA). J Dtsch Dermatol Ges. 2009;3:265-271.
- John AM, John ES, Hansberry DR, et al. Assessment of online patient education materials from major dermatologic associations. J Clin Aesthet Dermatol. 2016;9:23-28.
- Orgaz-Molina J, Cotugno M, Girón-Prieto MS, et al. A study of internet searches for medical information in dermatology patients: the patient-physician relationship. Actas Dermosifiliogr. 2015;106:493-499.
Researching medical information currently is the third most common use of the Internet in the United States,1 with the majority of adults using the Web as their first source for health information before seeing a physician.2 When assessing health-related information online, resources can be grouped into 4 categories: (1) those attributed to self-proclaimed experts, (2) promotional, (3) social media, and (4) educational.3 Access to such a wide range of sources may give readers the opportunity to share personal anecdotes and opinions, thereby serving as a forum for information that essentially cannot be validated. Although such websites may include useful information and cite current literature, in other instances health-related information may be misleading or fabricated.3
In a study evaluating 291 skin conditions and related Google trends, acne, psoriasis, and eczema were among the most burdensome diseases, with acne yielding the highest number of search results.4 Results of the study indicated a positive correlation between disease burden and online search interest.4 The impact of these online searches and the validity of Google search results are topics worth considering, as more dermatology patients are relying on holistic and nonpharmaceutical approaches to treatment and disease management.5 The purpose of this study was to evaluate content on diet and dermatology available on the Internet for acne, psoriasis, and eczema.
Methods
Google searches were performed in December 2017 using the terms diet and acne, diet and psoriasis, and diet and eczema. The first 10 results for each respective search were reviewed for recommendations about which foods to incorporate in the diet and which to avoid. They also were classified according to the following 4 website categories: (1) those attributed to self-proclaimed experts, (2) promotional, (3) social media, and (4) educational. The recommendations gathered from the 30 websites were then compared to the current literature assessing the impact of diet on these respective conditions by conducting PubMed searches of articles indexed for MEDLINE using the same terms.
Results
The results of this study are outlined in the eTable.
Acne
Our Google search using the term diet and acne produced 17,500,000 results. Of the first 10 search results, 40% (4/10) were websites attributed to self-proclaimed experts, 40% (4/10) were educational resources, and 20% (2/10) were promotional websites. Most of the websites advised acne patients to avoid high glycemic index foods (90% [9/10]) and dairy products (90% [9/10]). When discussing which foods to include in the diet, 70% (7/10) of websites recommended that patients incorporate omega-3 fatty acids and antioxidants in the diet.
Research has shown that a low glycemic index diet can lead to a decrease in patients’ acne lesion counts in some instances.6,7 In a case-controlled study of 2258 patients on a popular weight loss diet that emphasized low glycemic index foods, 87% of participants reported a reduction in acne and 91% reported a decrease in their dosage or number of acne medications.7 Still, the exact correlation between acne development and consumption of glycemic index foods has not been confirmed. However, high glycemic index diets have been linked to hyperinsulinemia, indicating that insulin levels may play a role in acne formation.8 The majority of other currently available studies evaluated the potential link between dairy consumption and acne. A retrospective analysis of 47,355 women spanning 12 weeks showed a positive link between increased dairy consumption, specifically skim milk, and acne formation. Despite the positive trend, limitations such as recall bias made it difficult to draw a conclusion based on these findings.9 However, results of a longitudinal questionnaire-based population study evaluating the impact of dairy consumption on acne in 2489 adolescent patients confirmed a positive correlation.10 Studies conducted in 2009 and 2011 concluded that milk consumption results in elevated insulinlike growth factor 1 levels, which were linked to comedogenesis.8,11
Currently, there are well-described mechanisms to explain the association of dairy consumption and glycemic index with acne. Confirming a correlation between acne development and dairy consumption suggests that a dairy-free diet may benefit acne patients.5 Other trials indicate that low glycemic index diets are beneficial in treating acne.6,7 Therefore, some of the recommendations made in our search results may be of merit; however, there is minimal evidence proving the benefits of the other dietary recommendations made in the websites we evaluated.
Psoriasis
Our Google search using the term diet and psoriasis yielded a total of 9,420,000 results. Of the first 10 search results, 40% (4/10) were websites attributed to self-proclaimed experts, 30% (3/10) were promotional, and 30% (3/10) were educational. Seventy percent (7/10) of websites recommended avoiding alcohol and 60% (6/10) recommended avoiding gluten, with others discouraging consumption of red meat. Most of the websites encouraged patients to consume omega-3 fatty acids and antioxidants, while a few also recommended vitamins A, D, and E, as well as evening primrose oil supplements.
Although current research indicates a positive correlation between excessive alcohol use and psoriasis severity, it is still unclear whether alcohol consumption can be directly linked to the disease.12-14 Likewise, despite belief that increased oxidative stress likely contributes to inflammation in psoriasis, there is little evidence linking antioxidants to improvement in psoriasis symptoms.12 However, the current literature is inconsistent regarding the effects of fish oil supplementation on psoriasis.12 In a randomized double-blind study of 145 patients, there was no significant difference in psoriasis area and severity index scores between a control group and a treatment group receiving fish oil supplementation.15 In another RCT of 45 participants, those given daily very long-chain omega-3 fatty acid supplements saw no difference in psoriasis symptoms.15 Despite debate, literature assessing the impact of gluten-free diets has described improvement in psoriasis lesions in patients with celiac-specific antibodies.16 Although some observational studies described vitamin D supplementation to be beneficial in the treatment of psoriatic lesions, a more recent RCT found no significant difference between control and treatment groups.17-19
Studies also have revealed that certain eating patterns, such as those associated with the Mediterranean diet that is rich in fruits, vegetables, whole grains, and omega-3 fatty acids may be linked to improved endothelial function scores and reduced C-reactive protein and IL-18levels.20,21 In a double-blind RCT of 75 patients with plaque psoriasis, mean (SD) psoriasis area and severity index scores decreased by 11.2 (9.8) in a group treated with omega-3 fatty acids compared to 7.5 (8.8) with omega-6 fatty acids (P=.048).22
Although excessive alcohol use may be linked to psoriasis, there is no conclusive evidence indicating causation, thereby discrediting online claims.12-14 Research has revealed that gluten-free diets in psoriasis patients with celiac disease may improve psoriasis treatment16; however, sufficient evidence is lacking for diets low in gluten and high in polyunsaturated fatty acids or antioxidant supplementation. Of the dietary supplements recommended in the search results we reviewed, fish oil appears to be the most promising, but no recommendations can be made based on the current research.
Eczema
Our Google search using the term diet and eczema yielded 1,160,000 results, with 50% (5/10) of websites attributed to self-proclaimed experts, 30% (3/10) to educational websites, and 20% (2/10) to promotional sites. Of the first 10 results, 80% (8/10) recommended that patients with eczema avoid milk/dairy and 50% (5/10) advised to avoid soy and wheat/gluten. Other websites indicated to avoid eggs, nuts, and artificial sweeteners. Patients were encouraged to incorporate omega-3 fatty acids in their diets, and a few sites recommended bananas, coconut oil, olive oil, and various teas.
In a review of 11 studies with a total of 596 participants, supplementation with vitamins D and E, fish oil, olive oil, and linoleic acid was evaluated for the treatment of eczema.23 Although results indicated modest improvement of eczema severity with supplementation of fish oil, evidence favoring this treatment is limited and unconvincing. Furthermore, some evidence indicates that elimination diets are only appropriate for patients with food allergies.24 In a study evaluating an egg-free and dairy-free diet for eczema patients, only participants with positive egg-specific serum IgE levels saw improvement in disease severity.23 Even though IgE-mediated food allergies have been reported in 40% of children with moderate eczema, the contribution of these allergies to eczema is questionable.25
There is little evidence in the literature to indicate a definitive correlation between the foods mentioned in the search results we evaluated and the development of eczema; however, for patients with food allergies and eczema, elimination diets may decrease disease severity.25,26 There is insufficient evidence to suggest a benefit from evening primrose oil or fish oil supplementation, thereby debunking claims found online.
Comment
Although our Google search results included a wide range of sources and information regarding diet and dermatologic conditions such as acne, psoriasis, and eczema, most of the information we found was either unfounded or misleading. Study limitations in the current literature include small sample size, potential recall bias, lack of appropriate controls, incomplete reported results, and the failure to clearly define skin changes.
When considering the accuracy and type of information regarding skin conditions that is available on the Internet, it is important to note that most of the results we reviewed were webpages attributed to self-proclaimed experts. Although educational websites also were included in the search results, whether or not patients prefer or understand the content of such websites is still unknown; therefore, health organizations should consider revising online patient education materials to allow universal comprehension.27
Furthermore, it is important to consider the impact that widespread Internet access may have on the physician-patient relationship. Having access to health-related information online and being able to potentially self-diagnose could delay or deter patients from seeking professional advice or care.3 A study evaluating the impact of online searches on the physician-patient relationship among 175 patients determined that 36.5% of patients gathered information online prior to their consultation with a physician, while 67.3% chose to complement the information given to them by their physician with online resources.28 Based on these statistics, it is important that physicians be up-to-date with Internet discourse to discredit unfounded recommendations. Ultimately, when it comes to diet and dermatology, patients ought to be skeptical of the information currently available on the Internet, given that most of it is unsubstantiated by medical research.
- Fox S. Online health search 2006. Pew Research Center website. http://www.pewinternet.org/2006/10/29/online-health-search-2006/. Published October 29, 2006. Accessed May 3, 2018.
- Prestin A, Vieux SN, Chou WY. Is online health activity alive and well or flatlining? findings from 10 years of the health information national trends survey. J Health Commun. 2015;20:790-798.
- Zeichner JA, Del Rosso JQ. Acne and the internet. Dermatol Clin. 2016;34:129-132.
- Whitsitt J, Karimkhani C, Boyers LN, et al. Comparing burden of dermatologic disease to search interest on Google trends. Dermatol Online J. 2015;21. pii:13030/qt5xg811qp.
- Shokeen D. Influence of diet in acne vulgaris and atopic dermatitis. Cutis. 2016;98:E28-E29.
- Veith WB, Silverberg NB. The association of acne vulgaris with diet. Cutis. 2011;88:84-91.
- Rouhani P. Acne improves with a popular, low glycemic diet from South Beach. J Am Acad Dermatol. 2009;60(3, suppl 1):P706.
- Melnick BC. Evidence for acne-promoting effect of milk and other insulinotropic dairy products. Nestle Nutr Worksop Ser Pediatr Program. 2011;67:131-145.
- Adebamowo CA, Spiegelman D, Berkey CS, et al. High school dietary diary intake and teenage acne. J Am Acad Dermatol. 2005;52:207-214.
- Ulvestad M, Bjertness E, Dalgard F, et al. Acne and dairy products in adolescence: results from a Norwegian longitudinal study [published online July 16, 2016]. J Eur Acad Dermatol Venereol. 2017;31:530-535.
- Melnick BC, Schmitz G. Role of insulin, insulin like growth factor 1, hyperglycemic food and milk consumption in the pathogenesis of acne vulgaris. Exp Dermatol. 2009;18:833-841.
- Murzaku EC, Bronsnick T, Rao BK. Diet in dermatology: part II. melanoma, chronic urticaria, and psoriasis. J Am Acad Dermatol. 2014;71:1053.E1-1053.E16.
- Tobin AM, Higgins EM, Norris S, et al. Prevalence of psoriasis in patients with alcoholic liver disease. Clin Exp Dermatol. 2009;34:698-701.
- Kirby B, Richards HL, Mason DL, et al. Alcohol consumption and psychological distress in patients with psoriasis. Br J Dermatol. 2008;158:138-140.
- Søyland E, Funk J, Rajika G, et al. Effect of dietary supplementation with very long-chain n-3 fatty acids in patients with psoriasis. N Engl J Med. 1993;328:1812-1816.
- Michaëlsson G, Gerdén B, Hagforsen E, et al. Psoriasis patients with antibodies to gliadin can be improved by a gluten-free diet. Br J Dermatol. 2000;142:44-51.
- Morimoto S, Yoshikawa K. Psoriasis and vitamin D3. a review of our experience. Arch Dermatol. 1989;125:231-234.
- Smith EL, Pincus SH, Donovan L, et al. A novel approach for the evaluation and treatment of psoriasis. oral or topical use of 1,25-dihydroxyvitamin D3 can be a safe and effective therapy for psoriasis. J Am Acad Dermatol. 1988;19:516-528.
- Siddiqui MA, Al-Khawajah MM. Vitamin D3 and psoriasis: a randomized double-blind placebo-controlled study. J Dermatol Treat. 1990;1:243-245.
- Wang Y, Gao H, Loyd CM, et al. Chronic skin-specific inflammation promotes vascular inflammation and thrombosis. J Invest Dermatol. 2012;132:2067-2075.
- Barrea L, Nappi F, Di Somma C, et al. Environmental risk factors in psoriasis: the point of view of the nutritionist. Int J Environ Res Public Health. 2016;13. pii:E743. doi:10.3390/ijerph13070743.
- Mayser P, Mrowietz U, Arenberger P, et al. Omega-3 fatty acid-based lipid infusion in patients with chronic plaque psoriasis: results of a double-blind, randomized, placebo-controlled, multicenter trial. J Am Acad Dermatol. 1998;38:539-547.
- Bath-Hextall FJ, Jenkinson C, Humphreys R, et al. Dietary supplements for established atopic eczema. Cochrane Database Syst Rev. 2012;2:CD005205.
- Bronsnick T, Murzaku EC, Rao BK. Diet in dermatology: part I. atopic dermatitis, acne, and nonmelanoma skin cancer [published online November 15, 2014]. J Am Acad Dermatol. 2014;71:1039.E1-1039.E12.
- Campbell DE. The role of food allergy in childhood atopic dermatitis. J Paediatr Child Health. 2012;48:1058-1064.
- Werfel T, Erdmann S, Fuchs T, et al. Approach to suspected food allergy in atopic dermatitis. guideline of the Task Force on Food Allergy of the German Society of Allergology and Clinical Immunology (DGAKI) and the Medical Association of German Allergologists (ADA) and the German Society of Pediatric Allergology (GPA). J Dtsch Dermatol Ges. 2009;3:265-271.
- John AM, John ES, Hansberry DR, et al. Assessment of online patient education materials from major dermatologic associations. J Clin Aesthet Dermatol. 2016;9:23-28.
- Orgaz-Molina J, Cotugno M, Girón-Prieto MS, et al. A study of internet searches for medical information in dermatology patients: the patient-physician relationship. Actas Dermosifiliogr. 2015;106:493-499.
Practice Points
- It is important physicians be well-informed regarding Internet discourse to discredit unfounded recommendations.
- It is likely that patients seeking medical advice regarding their dermatologic condition and treatment will have done prior research on the Internet.
- Oftentimes, the information on educational health websites can be confusing to patients.
- Because of widespread Internet access to health-related information, patients may opt to self-diagnose and therefore delay seeking professional care.

Rheumatoid Arthritis vs Osteoarthritis: Comparison of Demographics and Trends of Joint Replacement Data from the Nationwide Inpatient Sample
ABSTRACT
Current literature regarding complications following total joint arthroplasty have primarily focused on patients with osteoarthritis (OA), with less emphasis on the trends and in-hospital outcomes of rheumatoid arthritis (RA) patients undergoing these procedures. The purpose of this study is to analyze the outcomes and trends of RA patients undergoing total knee arthroplasty (TKA) or total hip arthroplasty (THA) compared to OA patients.
Data from the Nationwide Inpatient Sample from 2006 to 2011 was extracted using the International Classification of Diseases, Ninth Revision codes for patients that received a TKA or THA. Outcome measures included cardiovascular complications, cerebrovascular complications, pulmonary complications, wound dehiscence, and infection. Inpatient and hospital demographics including primary diagnosis, age, gender, primary payer, hospital teaching status, Charlson Comorbidity Index score, hospital bed size, location, and median household income were analyzed.
Logistic regression analysis of OA vs RA patients with patient outcomes revealed that osteoarthritic THA candidates had lower risk for cardiovascular complications, pulmonary complications, wound dehiscence, infections, and systemic complications, compared to rheumatoid patients. There was a significantly elevated risk of cerebrovascular complication in osteoarthritic THA compared to RA THA. OA patients undergoing TKA had significantly higher risk for cardiovascular and cerebrovascular complications. There were significant decreases in mechanical wounds, infection, and systemic complications in the OA TKA patients.
RA patients are at higher risk for postoperative infection, wound dehiscence, and systemic complications after TKA and THA compared to OA patients. These findings highlight the importance of preoperative medical clearance and management to optimize RA patients and improve the postoperative outcomes.
Continue to: RA is a chronic systemic inflammatory disease...
Rheumatoid arthritis (RA) is a chronic systemic inflammatory disease that causes joint deterioration, leading to pain, disability, systemic complications, short lifespan, and decline in quality of life.1-3 The deterioration primarily affects the synovial membranes of joints, causing arthritis and resulting in extra-articular sequelae such as cardiovascular disease,4 pulmonary disease,5 and increased infection rates.3,6 RA is the most prevalent inflammatory arthritis worldwide and affects up to 50 cases per 100,000 in both the US and northern Europe.2,7-9 Although the gold standard of care for these patients is medical management with immunosuppressant drugs such as disease-modifying anti-rheumatic drugs (DMARDs), total joint arthroplasty (TJA) remains an important tool in the management of joint deterioration in such patients.
Total knee arthroplasty (TKA) and total hip arthroplasty (THA) are common procedures utilized to treat disorders that cause joint pain and hindered joint mobility, including osteoarthritis (OA) and RA. Given the aging population, the amount of TKAs and THAs performed in the US has consistently increased each year, with the vast majority of this increase composed of patients with OA.10 As a result, previous studies investigated the trends and outcomes of these procedures in patients with OA, but relatively less is known about the outcomes and trends of patients with RA undergoing the same surgeries.
Given that RA is a fundamentally different condition with its own pathological characteristics, an understanding of how these differences may impact postoperative outcomes in patients with RA is important. This study aims to present a comparative analysis of the trends and postoperative outcomes between patients with RA and OA undergoing TKA and THA (Figure 1, Tables 1 and 2).
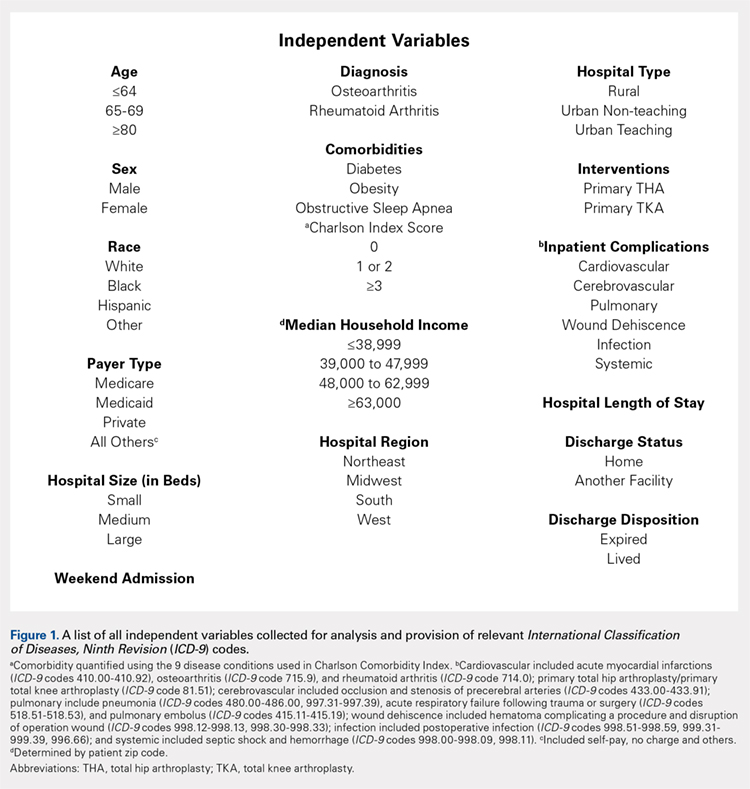
Table 1. Demographics of Total Knee Arthroplasty Patients Based on Primary Diagnosis of Osteoarthritis
| OA | RA | Total | P Value | |||
| No. | Percent | No. | Percent | No. | Percent | (RA vs OA) |
Age group |
|
|
|
|
|
| <.0001 |
<64 years | 295,637 | 42.42 | 11,325 | 48.90 | 306,962 | 42.63 |
|
65 to 79 years | 329,034 | 47.22 | 10,055 | 43.42 | 339,089 | 47.09 |
|
≥80 years | 72,197 | 10.36 | 1780 | 7.69 | 73,977 | 10.27 |
|
Gender |
|
|
|
|
|
| <.0001 |
Male | 259,192 | 37.19 | 4887 | 21.12 | 264,079 | 36.68 |
|
Female | 435,855 | 62.54 | 18,248 | 78.88 | 454,103 | 63.07 |
|
Race |
|
|
|
|
|
| <.0001 |
White | 468,632 | 67.25 | 14,532 | 77.18 | 483,164 | 67.10 |
|
Black | 39,691 | 5.7 | 2119 | 11.25 | 41,810 | 5.81 |
|
Hispanic | 28,573 | 4.1 | 1395 | 7.41 | 29,968 | 4.16 |
|
Other | 21,306 | 3.06 | 783 | 4.16 | 22,089 | 3.07 |
|
Region of hospital |
|
|
|
|
|
| <.0001 |
Northeast | 112,031 | 16.08 | 3417 | 14.75 | 115,448 | 16.03 |
|
Midwest | 192,595 | 27.64 | 5975 | 25.80 | 198,570 | 27.58 |
|
South | 257,855 | 37 | 9422 | 40.68 | 267,277 | 37.12 |
|
West | 134,387 | 19.28 | 4346 | 18.77 | 138,733 | 19.27 |
|
Location/teaching status of hospital |
|
|
|
|
|
| <.0001 |
Rural | 86,321 | 12.39 | 2709 | 11.79 | 89,030 | 12.36 |
|
Urban non-teaching | 333,043 | 47.79 | 10,905 | 47.46 | 343,948 | 47.77 |
|
Urban teaching | 273,326 | 39.22 | 9363 | 40.75 | 282,689 | 39.26 |
|
Hospital location |
|
|
|
|
|
| .0024 |
Rural | 86,321 | 12.39 | 2709 | 11.79 | 89,030 | 12.36 |
|
Urban | 606,369 | 87.01 | 20,268 | 88.21 | 626,637 | 87.03 |
|
Hospital teaching status |
|
|
|
|
|
| <.0001 |
Teaching | 409,465 | 58.76 | 13,275 | 57.78 | 422,740 | 58.71 |
|
Non-teaching | 283,225 | 40.64 | 9702 | 42.22 | 292,927 | 40.68 |
|
Comorbidities |
|
|
|
|
|
|
|
Obstructive sleep apnea | 65,342 | 9.38 | 1946 | 8.40 | 67,288 | 9.35 | <.0001 |
Diabetes | 147,292 | 21.14 | 4289 | 18.52 | 151,581 | 21.05 | <.0001 |
Obesity | 129,277 | 18.55 | 3730 | 16.11 | 133,007 | 18.47 | <.0001 |
Abbreviations: OA, osteoarthritis; RA, rheumatoid arthritis.
Table 2. Demographics of Total Hip Arthroplasty Patients Based on Primary Diagnosis of Osteoarthritis or Rheumatoid Arthritis
| OA | RA | Total | P Value | |||
| No. | Percent | No. | Percent | No. | Percent | (RA vs OA) |
Age group |
|
|
|
|
|
| <.0001 |
<64 years | 133,645 | 45.18 | 4679 | 48.02 | 138,324 | 45.27 |
|
65 to 79 years | 123,628 | 41.8 | 3992 | 40.97 | 127,620 | 41.77 |
|
≥80 years | 38,513 | 13.02 | 1073 | 11.01 | 39,586 | 12.96 |
|
Gender |
|
|
|
|
|
| <.0001 |
Male | 129,708 | 43.85 | 2457 | 25.24 | 132,165 | 43.26 |
|
Female | 165,010 | 55.79 | 7278 | 74.76 | 172,288 | 56.39 |
|
Race |
|
|
|
|
|
| <.0001 |
White | 207,005 | 69.98 | 6322 | 80.08 | 213,327 | 69.82 |
|
Black | 15,505 | 5.24 | 771 | 9.77 | 16,276 | 5.33 |
|
Hispanic | 6784 | 2.29 | 522 | 6.61 | 7306 | 2.39 |
|
Other | 7209 | 2.44 | 280 | 3.55 | 7489 | 2.45 |
|
Region of hospital |
|
|
|
|
|
| <.0001 |
Northeast | 58,525 | 19.79 | 1683 | 17.27 | 60,208 | 19.71 |
|
Midwest | 79,040 | 26.72 | 2446 | 25.10 | 81,486 | 26.67 |
|
South | 95,337 | 32.23 | 3716 | 38.14 | 99,053 | 32.42 |
|
West | 62,884 | 21.26 | 1899 | 19.49 | 64,783 | 21.20 |
|
Location/teaching status of hospital |
|
|
|
|
|
| .0065 |
Rural | 30,954 | 10.46 | 993 | 10.26 | 31,947 | 10.46 |
|
Urban non-teaching | 133,061 | 44.99 | 4245 | 43.87 | 137,306 | 44.94 |
|
Urban teaching | 130,150 | 44 | 4439 | 45.87 | 134,589 | 44.05 |
|
Hospital location |
|
|
|
|
|
| .4098 |
Rural | 30,954 | 10.46 | 993 | 10.26 | 31,947 | 10.46 |
|
Urban | 263,211 | 88.99 | 8684 | 89.74 | 271,895 | 88.99 |
|
Hospital teaching status |
|
|
|
|
|
| .0077 |
Teaching | 159,313 | 53.86 | 5108 | 52.78 | 164,421 | 53.82 |
|
Non-teaching | 134,852 | 45.59 | 4569 | 47.22 | 139,421 | 45.63 |
|
Comorbidities |
|
|
|
|
|
|
|
Obstructive sleep apnea | 19,760 | 6.68 | 573 | 5.88 | 20,333 | 6.65 | .0028 |
Diabetes | 41,929 | 14.18 | 1325 | 13.60 | 43,254 | 14.16 | .1077 |
Obesity | 38,808 | 13.12 | 1100 | 11.29 | 39,908 | 13.06 | <.0001 |
Abbreviations: OA, osteoarthritis; RA, rheumatoid arthritis
Continue to: Methods...
METHODS
Exemptions were obtained from the Institutional Review Board. Data from the Nationwide Inpatient Sample (NIS) from 2006 to 2011 were extracted using the International Classification of Diseases, Ninth Revision, Clinical Modification (ICD-9-CM) codes for patients that received primary TKA or THA, as well as their comorbid conditions. No patients or populations were excluded from the sampling process. A list of all independent variables collected for analysis and provision of relevant ICD-9 codes is included in Figure 1. The NIS is the largest all-payer stratified survey of inpatient care in the US healthcare system. As of 2011, each year provides information on approximately 8 million inpatient stays from about 1000 hospitals in 46 states. All discharges from sampled hospitals are also represented in the database. All patient information is protected, and all methods were conducted in accordance with the highest ethical standards of Human and Animal Rights Research.
STATISTICAL ANALYSIS
SAS 9.2 and PROC FREQ statistics software were used to generate P values (chi square result) and analyze the trends (Cochran-Armitage). Results were weighted utilizing standard discharge weights from the NIS to ensure accurate comparison of data from different time points. P < .05 was considered statistically significant. Multivariable logistic regression analyses were performed to generate odds ratio and 95% confidence limits to assess outcomes across different demographic variables.
RESULTS
Data on 337,082 and 1,362,241 patients undergoing THA or TKA, respectively, between 2006 and 2011 were analyzed. Patients in both groups were further differentiated by a diagnosis of either OA or RA. OA was the most common diagnosis, constituting 96.8% of all arthritic THA and TKA patients. From 2006 to 2011, a 36% and 34% increase in total number of THAs and TKAs, respectively, were reported. The number of patients with OA undergoing THA and TKA steadily increased from 2006 to 2011 (Figure 2). The number of THA and TKA procedures in patients with RA followed a similar trend but at a comparatively slower rate (Figure 3). The TKA geographical trends mirrored those observed with THA. The majority of operations were performed at urban hospitals (89% THA, 87% TKA; P < .0001). Among patients with RA and OA, the majority of TKAs (47.77%; P < .0001) took place in urban non-teaching hospitals than in urban teaching hospitals (39.26%). This pattern was not the same for THA, with 44.94% being performed at urban teaching hospitals and 44.05% at urban non-teaching institutions (P < .0001). Rural hospitals accounted for a low percentage of operations for both procedures: 10.46% of THA and 12.36% of TKA (P < .0001). Large institutions (based on the number of beds) claimed the majority of cases (59% of THA and TKA).
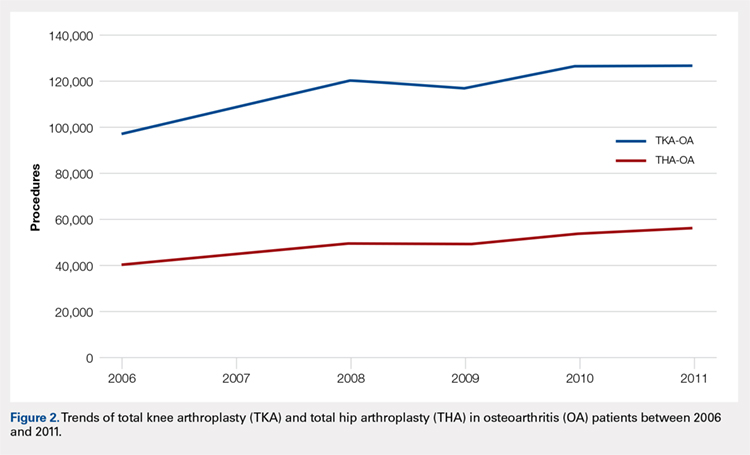
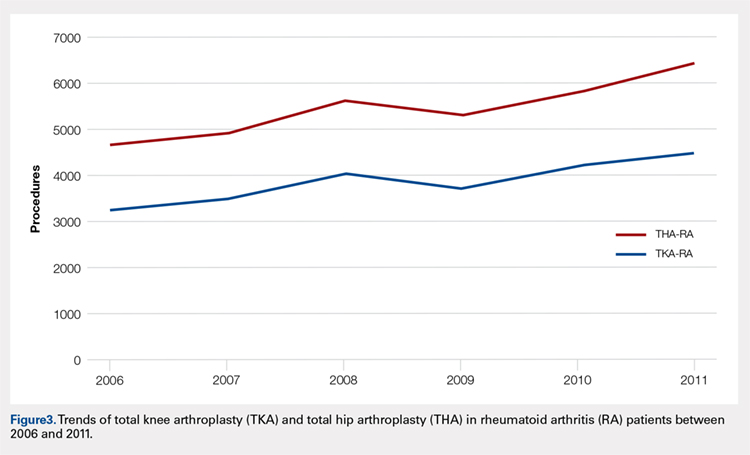
Logistic regression analysis and odds ratios of patients with OA vs those with RA with patient outcomes adjusted for age, Charlson Comorbidity Index (CCI) score, and gender revealed that patients with OA undergoing THA had lower risk for cardiovascular (0.674; confidence interval (CI) 0.587-0.774) and pulmonary complications (0.416; CI 0.384-0.450), wound dehiscence (0.647; CI 0.561-0.747), infections (0.258; CI 0.221-0.301), and systemic complications (0.625; CI 0.562-0.695) than patients with RA. Patients with OA exhibited statistically significantly higher odds of experiencing cerebrovascular complications after THA than those with RA (1.946; CI 1.673-2.236) (Table 3). In a similar logistic regression analysis of OA vs RA in TKA, which was adjusted for age, CCI score, and gender, patients with OA had significantly higher risk for cardiovascular (1.329; CI 1.069-1.651) and cerebrovascular complications (1.635; CI 1.375-1.943) than patients with RA. Significant decreases in wound dehiscence (0.757; CI 0.639-0.896), infection (0.331; CI 0.286-0.383), and systemic complication (0.641; CI 0.565-0.729) were noted in the patients with OA and TKA (Table 4).
Table 3. Odds Ratio for In-Hospital Complications Following THA for OA Patients vs RA Patients
| Odds Ratio | Confidence Limits |
Cardiovascular complication | .674 | .587-.744 |
Cerebrovascular complication | 1.946 | 1.673-2.236 |
Pulmonary complication | .416 | .384-.450 |
Wound dehiscence | .647 | .561-.747 |
Infection | .258 | .221-.301 |
Systemic complication | .625 | .562-.695 |
Abbreviations: OA, osteoarthritis; RA, rheumatoid arthritis; THA, total hip arthroplasty.
Table 4. Odds Ratio for In-Hospital Complications Following TKA for OA Patients vs RA Patients
| Odds Ratio | Confidence Limits |
Cardiovascular complication | 1.329 | 1.069-1.651 |
Cerebrovascular complication | 1.635 | 1.375-1.943 |
Pulmonary complication | 1.03 | .995-1.223 |
Wound dehiscence | .757 | .639-.896 |
Infection | .331 | .286-.383 |
Systemic complication | .641 | .565-.729 |
Abbreviations: OA, osteoarthritis; RA, rheumatoid arthritis; TKA, total knee arthroplasty.
Continue to: Discussion...
DISCUSSION
Our results showed a continuous yearly increase from 2006 to 2011 in THA and TKA procedures at a rate of 36% and 34%, respectively; this result was consistent with existing literature.11 Despite a substantial increase in the amount of total THA and TKA procedures, the ratio of patients with RA undergoing these operations has decreased or remained nearly the same. Similar effects were found in Japan and the US when examining patients with RA undergoing TJA procedures between 2001 and 2007 and between 1992 and 2005, respectively.12-14 This observation may be explained by the advances and early initiation of pharmacologic treatment and the widespread use of DMARDs such as methotrexate (MTX), azathioprine, leflunomide, hydroxychloroquine, and biological response modifiers TNF-α and interleukin-1.15 These medications have drastically improved survival rates of patients with RA with impressive capabilities in symptom relief.15 With the increasing use of DMARDs and aggressive treatment early on in the disease process, patients with RA are showing markedly slow progression of joint deterioration, leading to a decreased need for orthopedic intervention compared with the general population.13,15
When analyzing the complication rates for patients undergoing TKA and THA, we observed that patients with RA exhibited a significant increase in the rates of infections, wound dehiscence, and systemic complications prior to discharge from the hospital compared with the OA population. The increased risk of infections was reported in previous studies assessing postoperative complication rates in TJA.16,17 A study utilizing the Norwegian Arthroplasty Registry noted an increased risk of late infection in patients with RA, leading to increased rates of revision TJA in comparison with patients with OA.16 Another study, which was based on the Canadian Institute for Health Information Discharge Abstract Database, showed that patients with RA are at an increased risk of infection only after THA and interestingly not after TKA.17 Although our study did not identify the causes of the increased infection rate, the inherent nature of the disease and the immunomodulatory drugs used to treat it may contribute to this increased infectious risk in patients with RA.6,18 Immunosuppressive DMARDs are some of the widely used medications employed to treat RA and are prime suspects of causing increased infection rates.15 The perioperative use of MTX has not been shown to cause short-term increases in infection for patients undergoing orthopedic intervention, but leflunomide and TNF-α inhibitors have been shown to cause a significant several-fold increase in risk for surgical wound infections.19,20
All patients with RA presented with significant increases for infection, wound dehiscence, and systemic complications, whereas only patients with RA undergoing THA showed increased risk of pulmonary and cardiovascular complications when compared with patients with OA. Surprisingly, in TKA, patients with RA were at a significantly decreased risk of cardiovascular complications. This observation was interesting due to cardiovascular disease being one of RA's most notable extra-articular features.4,21
Patients with RA undergoing TJA also showed significantly lower cerebrovascular complications than patients with OA. The significant reduction in risk for these complications has not been previously reported in the current literature, and it was an unexpected finding as past studies have found an increased risk in cerebrovascular disease in patients with RA. RA is an inflammatory disease exhibiting the upregulation of procoagulation factors,22 so we expected patients with RA to be at an increased risk for cerebrovascular and cardiovascular complications over patients with OA. Although we are unsure why these results were observed, we postulate that pharmaceutical interventions may confer some protection to patients with RA. For example, aspirin is commonly utilized in RA for its protective anti-platelet effect23 and may be a contributing factor to why we found low postoperative complication rates in cerebrovascular disease. However, the reason why aspirin may be protective against cerebrovascular and not cardiovascular complications remains unclear. Moreover, most guidelines suggest that aspirin be stopped prior to surgery.24 Although patients with RA were younger than those with OA, age was accounted for when analyzing the data.
A major strength of the study was the large sample size and the adjustment of potential confounding variables when examining the difference in complications between RA and OA. It is also a national US study that utilizes a validated database. Given that the patient samples in the NIS are reported in a uniform and de-identified manner, the database is considered ideal and has been extensively used for retrospective large observational cohort studies.25 However, the study also had some limitations due to the retrospective and administrative nature of the NIS database. Only data concerning patient complications during their inpatient stay at the hospital were available. Patients who may develop complications following discharge were not included in the data, providing a very small window of time for analysis. Another limitation with the database was its lack of ability to identify the severity of each patient's disease process or the medical treatment they received perioperatively. Finally, no patient-reported outcomes were determined, which would provide information on whether these complications affect the patients’ postoperational satisfaction in regard to their pain and disability.
CONCLUSION
As RA patients continue to utilize joint arthroplasty to repair deteriorated joints, understanding of how the disease process and its medical management may impact patient outcomes is important. This article reports significantly higher postoperational infection rates in RA than in patients with OA, which may be due to the medical management of the disease. Although new medications have been introduced and are being used to treat patients with RA, they have not altered the complication rate following TJA in this patient population. Thus, surgeons and other members of the management team should be familiar with the common medical conditions, co-morbidities, and medical treatments/side effects that are encountered in patients with RA. Future studies should delve into possible differences in long-term outcomes of patients with RA undergoing TKA and THA, as well as whether certain perioperative strategies and therapies (medical or physical) may decrease complications and improve outcomes.
This paper will be judged for the Resident Writer’s Award.
- Myasoedova E, Davis JM 3rd, Crowson CS, Gabriel SE. Epidemiology of rheumatoid arthritis: rheumatoid arthritis and mortality. Curr Rheumatol Rep. 2010;12(5):379-385. doi:10.1007/s11926-010-0117-y.
- Firestein GS. Evolving concepts of rheumatoid arthritis. Nature. 2003;423(6937):356-361. doi:10.1038/nature01661.
- Gullick NJ, Scott DL. Co-morbidities in established rheumatoid arthritis. Best Pract Res Clin Rheumatol. 2011;25(4):469-483. doi:10.1016/j.berh.2011.10.009.
- Masuda H, Miyazaki T, Shimada K, et al. Disease duration and severity impacts on long-term cardiovascular events in Japanese patients with rheumatoid arthritis. J Cardiol. 2014;64(5):366-370. doi:10.1016/j.jjcc.2014.02.018.
- Bongartz T, Nannini C, Medina-Velasquez YF, et al. Incidence and mortality of interstitial lung disease in rheumatoid arthritis: a population-based study. Arthritis Rheum.2010;62(6):1583-1591. doi:10.1002/art.27405.
- Doran MF, Crowson CS, Pond GR, O'Fallon WM, Gabriel SE. Frequency of infection in patients with rheumatoid arthritis compared with controls: a population-based study. Arthritis Rheum. 2002;46(9):2287-2293. doi:10.1002/art.10524.
- Rossini M, Rossi E, Bernardi D, et al. Prevalence and incidence of rheumatoid arthritis in Italy. Rheumatol Int. 2014;34(5):659664. doi:10.1007/s00296-014-2974-6.
- Alamanos Y, Voulgari PV, Drosos AA. Incidence and prevalence of rheumatoid arthritis, based on the 1987 American College of Rheumatology criteria: a systematic review. Semin Arthritis Rheum. 2006;36(3):182-188. doi:10.1016/j.semarthrit.2006.08.006.
- Carbonell J, Cobo T, Balsa A, Descalzo MA, Carmona L. The incidence of rheumatoid arthritis in Spain: results from a nationwide primary care registry. Rheumatology.2008;47(7):1088-1092. doi:10.1093/rheumatology/ken205.
- Skytta ET, Honkanen PB, Eskelinen A, Huhtala H, Remes V. Fewer and older patients with rheumatoid arthritis need total knee replacement. Scand J Rheumatol. 2012;41(5):345-349. doi:10.3109/03009742.2012.681061.
- Singh JA, Vessely MB, Harmsen WS, et al. A population-based study of trends in the use of total hip and total knee arthroplasty, 1969–2008. Mayo Clin Proc. 2010;85(10):898-904. doi:10.4065/mcp.2010.0115.
- Momohara S, Inoue E, Ikari K, et al. Decrease in orthopaedic operations, including total joint replacements, in patients with rheumatoid arthritis between 2001 and 2007: data from Japanese outpatients in a single institute-based large observational cohort (IORRA). Ann Rheum Dis. 2010;69(1):312-313. doi:10.1136/ard.2009.107599.
- Jain A, Stein BE, Skolasky RL, Jones LC, Hungerford MW. Total joint arthroplasty in patients with rheumatoid arthritis: a United States experience from 1992 through 2005. J Arthroplasty. 2012;27(6):881-888. doi:10.1016/j.arth.2011.12.027.
- Mertelsmann-Voss C, Lyman S, Pan TJ, Goodman SM, Figgie MP, Mandl LA. US trends in rates of arthroplasty for inflammatory arthritis including rheumatoid arthritis, juvenile idiopathic arthritis, and spondyloarthritis. Arthritis Rheumatol 2014;66(6):1432-1439. doi:10.1002/art.38384.
- Howe CR, Gardner GC, Kadel NJ. Perioperative medication management for the patient with rheumatoid arthritis. J Am Acad Orthop Surg. 2006;14(9):544-551. doi:10.5435/00124635-200609000-00004.
- Schrama JC, Espehaug B, Hallan G, et al. Risk of revision for infection in primary total hip and knee arthroplasty in patients with rheumatoid arthritis compared with osteoarthritis: a prospective, population-based study on 108,786 hip and knee joint arthroplasties from the Norwegian Arthroplasty Register. Arthritis Care Res. 2010;62(4):473-479. doi:10.1002/acr.20036.
- Ravi B, Croxford R, Hollands S, et al. Increased risk of complications following total joint arthroplasty in patients with rheumatoid arthritis. Arthritis Rheumatol. 2014;66(2):254-263. doi:10.1002/art.38231.
- Au K, Reed G, Curtis JR, et al. High disease activity is associated with an increased risk of infection in patients with rheumatoid arthritis. Ann Rheum Dis. 2011;70(5):785-791. doi:10.1136/ard.2010.128637.
- Bongartz T, Sutton AJ, Sweeting MJ, Buchan I, Matteson EL, Montori V. Anti-TNF antibody therapy in rheumatoid arthritis and the risk of serious infections and malignancies: systematic review and meta-analysis of rare harmful effects in randomized controlled trials. JAMA. 2006;295(19):2275-2285. doi:10.1001/jama.295.19.2275.
- Scherrer CB, Mannion AF, Kyburz D, Vogt M, Kramers-de Quervain IA. Infection risk after orthopedic surgery in patients with inflammatory rheumatic diseases treated with immunosuppressive drugs. Arthritis Care Res. 2013;65(12):2032-2040. doi:10.1002/acr.22077.
- Bacani AK, Gabriel SE, Crowson CS, Heit JA, Matteson EL. Noncardiac vascular disease in rheumatoid arthritis: increase in venous thromboembolic events? Arthritis Rheum.2012;64(1):53-61. doi:10.1002/art.33322.
- Wallberg-Jonsson S, Dahlen GH, Nilsson TK, Ranby M, Rantapaa-Dahlqvist S. Tissue plasminogen activator, plasminogen activator inhibitor-1 and von Willebrand factor in rheumatoid arthritis. Clin Rheumatol. 1993;12(3):318324.
- van Heereveld HA, Laan RF, van den Hoogen FH, Malefijt MC, Novakova IR, van de Putte LB. Prevention of symptomatic thrombosis with short term (low molecular weight) heparin in patients with rheumatoid arthritis after hip or knee replacement. Ann Rheum Dis.2001;60(10):974-976. doi:10.1136/ard.60.10.974.
- Mont MA, Jacobs JJ, Boggio LN, et al. Preventing venous thromboembolic disease in patients undergoing elective hip and knee arthroplasty. J Am Acad Orthop Surg.2011;19(12):768-776.
- Bozic KJ, Bashyal RK, Anthony SG, Chiu V, Shulman B, Rubash HE. Is administratively coded comorbidity and complication data in total joint arthroplasty valid? Clin Orthop Relat Res. 2013;471(1):201-205. doi:10.1007/s11999-012-2352-1.
ABSTRACT
Current literature regarding complications following total joint arthroplasty have primarily focused on patients with osteoarthritis (OA), with less emphasis on the trends and in-hospital outcomes of rheumatoid arthritis (RA) patients undergoing these procedures. The purpose of this study is to analyze the outcomes and trends of RA patients undergoing total knee arthroplasty (TKA) or total hip arthroplasty (THA) compared to OA patients.
Data from the Nationwide Inpatient Sample from 2006 to 2011 was extracted using the International Classification of Diseases, Ninth Revision codes for patients that received a TKA or THA. Outcome measures included cardiovascular complications, cerebrovascular complications, pulmonary complications, wound dehiscence, and infection. Inpatient and hospital demographics including primary diagnosis, age, gender, primary payer, hospital teaching status, Charlson Comorbidity Index score, hospital bed size, location, and median household income were analyzed.
Logistic regression analysis of OA vs RA patients with patient outcomes revealed that osteoarthritic THA candidates had lower risk for cardiovascular complications, pulmonary complications, wound dehiscence, infections, and systemic complications, compared to rheumatoid patients. There was a significantly elevated risk of cerebrovascular complication in osteoarthritic THA compared to RA THA. OA patients undergoing TKA had significantly higher risk for cardiovascular and cerebrovascular complications. There were significant decreases in mechanical wounds, infection, and systemic complications in the OA TKA patients.
RA patients are at higher risk for postoperative infection, wound dehiscence, and systemic complications after TKA and THA compared to OA patients. These findings highlight the importance of preoperative medical clearance and management to optimize RA patients and improve the postoperative outcomes.
Continue to: RA is a chronic systemic inflammatory disease...
Rheumatoid arthritis (RA) is a chronic systemic inflammatory disease that causes joint deterioration, leading to pain, disability, systemic complications, short lifespan, and decline in quality of life.1-3 The deterioration primarily affects the synovial membranes of joints, causing arthritis and resulting in extra-articular sequelae such as cardiovascular disease,4 pulmonary disease,5 and increased infection rates.3,6 RA is the most prevalent inflammatory arthritis worldwide and affects up to 50 cases per 100,000 in both the US and northern Europe.2,7-9 Although the gold standard of care for these patients is medical management with immunosuppressant drugs such as disease-modifying anti-rheumatic drugs (DMARDs), total joint arthroplasty (TJA) remains an important tool in the management of joint deterioration in such patients.
Total knee arthroplasty (TKA) and total hip arthroplasty (THA) are common procedures utilized to treat disorders that cause joint pain and hindered joint mobility, including osteoarthritis (OA) and RA. Given the aging population, the amount of TKAs and THAs performed in the US has consistently increased each year, with the vast majority of this increase composed of patients with OA.10 As a result, previous studies investigated the trends and outcomes of these procedures in patients with OA, but relatively less is known about the outcomes and trends of patients with RA undergoing the same surgeries.
Given that RA is a fundamentally different condition with its own pathological characteristics, an understanding of how these differences may impact postoperative outcomes in patients with RA is important. This study aims to present a comparative analysis of the trends and postoperative outcomes between patients with RA and OA undergoing TKA and THA (Figure 1, Tables 1 and 2).
Table 1. Demographics of Total Knee Arthroplasty Patients Based on Primary Diagnosis of Osteoarthritis
| OA | RA | Total | P Value | |||
| No. | Percent | No. | Percent | No. | Percent | (RA vs OA) |
Age group |
|
|
|
|
|
| <.0001 |
<64 years | 295,637 | 42.42 | 11,325 | 48.90 | 306,962 | 42.63 |
|
65 to 79 years | 329,034 | 47.22 | 10,055 | 43.42 | 339,089 | 47.09 |
|
≥80 years | 72,197 | 10.36 | 1780 | 7.69 | 73,977 | 10.27 |
|
Gender |
|
|
|
|
|
| <.0001 |
Male | 259,192 | 37.19 | 4887 | 21.12 | 264,079 | 36.68 |
|
Female | 435,855 | 62.54 | 18,248 | 78.88 | 454,103 | 63.07 |
|
Race |
|
|
|
|
|
| <.0001 |
White | 468,632 | 67.25 | 14,532 | 77.18 | 483,164 | 67.10 |
|
Black | 39,691 | 5.7 | 2119 | 11.25 | 41,810 | 5.81 |
|
Hispanic | 28,573 | 4.1 | 1395 | 7.41 | 29,968 | 4.16 |
|
Other | 21,306 | 3.06 | 783 | 4.16 | 22,089 | 3.07 |
|
Region of hospital |
|
|
|
|
|
| <.0001 |
Northeast | 112,031 | 16.08 | 3417 | 14.75 | 115,448 | 16.03 |
|
Midwest | 192,595 | 27.64 | 5975 | 25.80 | 198,570 | 27.58 |
|
South | 257,855 | 37 | 9422 | 40.68 | 267,277 | 37.12 |
|
West | 134,387 | 19.28 | 4346 | 18.77 | 138,733 | 19.27 |
|
Location/teaching status of hospital |
|
|
|
|
|
| <.0001 |
Rural | 86,321 | 12.39 | 2709 | 11.79 | 89,030 | 12.36 |
|
Urban non-teaching | 333,043 | 47.79 | 10,905 | 47.46 | 343,948 | 47.77 |
|
Urban teaching | 273,326 | 39.22 | 9363 | 40.75 | 282,689 | 39.26 |
|
Hospital location |
|
|
|
|
|
| .0024 |
Rural | 86,321 | 12.39 | 2709 | 11.79 | 89,030 | 12.36 |
|
Urban | 606,369 | 87.01 | 20,268 | 88.21 | 626,637 | 87.03 |
|
Hospital teaching status |
|
|
|
|
|
| <.0001 |
Teaching | 409,465 | 58.76 | 13,275 | 57.78 | 422,740 | 58.71 |
|
Non-teaching | 283,225 | 40.64 | 9702 | 42.22 | 292,927 | 40.68 |
|
Comorbidities |
|
|
|
|
|
|
|
Obstructive sleep apnea | 65,342 | 9.38 | 1946 | 8.40 | 67,288 | 9.35 | <.0001 |
Diabetes | 147,292 | 21.14 | 4289 | 18.52 | 151,581 | 21.05 | <.0001 |
Obesity | 129,277 | 18.55 | 3730 | 16.11 | 133,007 | 18.47 | <.0001 |
Abbreviations: OA, osteoarthritis; RA, rheumatoid arthritis.
Table 2. Demographics of Total Hip Arthroplasty Patients Based on Primary Diagnosis of Osteoarthritis or Rheumatoid Arthritis
| OA | RA | Total | P Value | |||
| No. | Percent | No. | Percent | No. | Percent | (RA vs OA) |
Age group |
|
|
|
|
|
| <.0001 |
<64 years | 133,645 | 45.18 | 4679 | 48.02 | 138,324 | 45.27 |
|
65 to 79 years | 123,628 | 41.8 | 3992 | 40.97 | 127,620 | 41.77 |
|
≥80 years | 38,513 | 13.02 | 1073 | 11.01 | 39,586 | 12.96 |
|
Gender |
|
|
|
|
|
| <.0001 |
Male | 129,708 | 43.85 | 2457 | 25.24 | 132,165 | 43.26 |
|
Female | 165,010 | 55.79 | 7278 | 74.76 | 172,288 | 56.39 |
|
Race |
|
|
|
|
|
| <.0001 |
White | 207,005 | 69.98 | 6322 | 80.08 | 213,327 | 69.82 |
|
Black | 15,505 | 5.24 | 771 | 9.77 | 16,276 | 5.33 |
|
Hispanic | 6784 | 2.29 | 522 | 6.61 | 7306 | 2.39 |
|
Other | 7209 | 2.44 | 280 | 3.55 | 7489 | 2.45 |
|
Region of hospital |
|
|
|
|
|
| <.0001 |
Northeast | 58,525 | 19.79 | 1683 | 17.27 | 60,208 | 19.71 |
|
Midwest | 79,040 | 26.72 | 2446 | 25.10 | 81,486 | 26.67 |
|
South | 95,337 | 32.23 | 3716 | 38.14 | 99,053 | 32.42 |
|
West | 62,884 | 21.26 | 1899 | 19.49 | 64,783 | 21.20 |
|
Location/teaching status of hospital |
|
|
|
|
|
| .0065 |
Rural | 30,954 | 10.46 | 993 | 10.26 | 31,947 | 10.46 |
|
Urban non-teaching | 133,061 | 44.99 | 4245 | 43.87 | 137,306 | 44.94 |
|
Urban teaching | 130,150 | 44 | 4439 | 45.87 | 134,589 | 44.05 |
|
Hospital location |
|
|
|
|
|
| .4098 |
Rural | 30,954 | 10.46 | 993 | 10.26 | 31,947 | 10.46 |
|
Urban | 263,211 | 88.99 | 8684 | 89.74 | 271,895 | 88.99 |
|
Hospital teaching status |
|
|
|
|
|
| .0077 |
Teaching | 159,313 | 53.86 | 5108 | 52.78 | 164,421 | 53.82 |
|
Non-teaching | 134,852 | 45.59 | 4569 | 47.22 | 139,421 | 45.63 |
|
Comorbidities |
|
|
|
|
|
|
|
Obstructive sleep apnea | 19,760 | 6.68 | 573 | 5.88 | 20,333 | 6.65 | .0028 |
Diabetes | 41,929 | 14.18 | 1325 | 13.60 | 43,254 | 14.16 | .1077 |
Obesity | 38,808 | 13.12 | 1100 | 11.29 | 39,908 | 13.06 | <.0001 |
Abbreviations: OA, osteoarthritis; RA, rheumatoid arthritis
Continue to: Methods...
METHODS
Exemptions were obtained from the Institutional Review Board. Data from the Nationwide Inpatient Sample (NIS) from 2006 to 2011 were extracted using the International Classification of Diseases, Ninth Revision, Clinical Modification (ICD-9-CM) codes for patients that received primary TKA or THA, as well as their comorbid conditions. No patients or populations were excluded from the sampling process. A list of all independent variables collected for analysis and provision of relevant ICD-9 codes is included in Figure 1. The NIS is the largest all-payer stratified survey of inpatient care in the US healthcare system. As of 2011, each year provides information on approximately 8 million inpatient stays from about 1000 hospitals in 46 states. All discharges from sampled hospitals are also represented in the database. All patient information is protected, and all methods were conducted in accordance with the highest ethical standards of Human and Animal Rights Research.
STATISTICAL ANALYSIS
SAS 9.2 and PROC FREQ statistics software were used to generate P values (chi square result) and analyze the trends (Cochran-Armitage). Results were weighted utilizing standard discharge weights from the NIS to ensure accurate comparison of data from different time points. P < .05 was considered statistically significant. Multivariable logistic regression analyses were performed to generate odds ratio and 95% confidence limits to assess outcomes across different demographic variables.
RESULTS
Data on 337,082 and 1,362,241 patients undergoing THA or TKA, respectively, between 2006 and 2011 were analyzed. Patients in both groups were further differentiated by a diagnosis of either OA or RA. OA was the most common diagnosis, constituting 96.8% of all arthritic THA and TKA patients. From 2006 to 2011, a 36% and 34% increase in total number of THAs and TKAs, respectively, were reported. The number of patients with OA undergoing THA and TKA steadily increased from 2006 to 2011 (Figure 2). The number of THA and TKA procedures in patients with RA followed a similar trend but at a comparatively slower rate (Figure 3). The TKA geographical trends mirrored those observed with THA. The majority of operations were performed at urban hospitals (89% THA, 87% TKA; P < .0001). Among patients with RA and OA, the majority of TKAs (47.77%; P < .0001) took place in urban non-teaching hospitals than in urban teaching hospitals (39.26%). This pattern was not the same for THA, with 44.94% being performed at urban teaching hospitals and 44.05% at urban non-teaching institutions (P < .0001). Rural hospitals accounted for a low percentage of operations for both procedures: 10.46% of THA and 12.36% of TKA (P < .0001). Large institutions (based on the number of beds) claimed the majority of cases (59% of THA and TKA).
Logistic regression analysis and odds ratios of patients with OA vs those with RA with patient outcomes adjusted for age, Charlson Comorbidity Index (CCI) score, and gender revealed that patients with OA undergoing THA had lower risk for cardiovascular (0.674; confidence interval (CI) 0.587-0.774) and pulmonary complications (0.416; CI 0.384-0.450), wound dehiscence (0.647; CI 0.561-0.747), infections (0.258; CI 0.221-0.301), and systemic complications (0.625; CI 0.562-0.695) than patients with RA. Patients with OA exhibited statistically significantly higher odds of experiencing cerebrovascular complications after THA than those with RA (1.946; CI 1.673-2.236) (Table 3). In a similar logistic regression analysis of OA vs RA in TKA, which was adjusted for age, CCI score, and gender, patients with OA had significantly higher risk for cardiovascular (1.329; CI 1.069-1.651) and cerebrovascular complications (1.635; CI 1.375-1.943) than patients with RA. Significant decreases in wound dehiscence (0.757; CI 0.639-0.896), infection (0.331; CI 0.286-0.383), and systemic complication (0.641; CI 0.565-0.729) were noted in the patients with OA and TKA (Table 4).
Table 3. Odds Ratio for In-Hospital Complications Following THA for OA Patients vs RA Patients
| Odds Ratio | Confidence Limits |
Cardiovascular complication | .674 | .587-.744 |
Cerebrovascular complication | 1.946 | 1.673-2.236 |
Pulmonary complication | .416 | .384-.450 |
Wound dehiscence | .647 | .561-.747 |
Infection | .258 | .221-.301 |
Systemic complication | .625 | .562-.695 |
Abbreviations: OA, osteoarthritis; RA, rheumatoid arthritis; THA, total hip arthroplasty.
Table 4. Odds Ratio for In-Hospital Complications Following TKA for OA Patients vs RA Patients
| Odds Ratio | Confidence Limits |
Cardiovascular complication | 1.329 | 1.069-1.651 |
Cerebrovascular complication | 1.635 | 1.375-1.943 |
Pulmonary complication | 1.03 | .995-1.223 |
Wound dehiscence | .757 | .639-.896 |
Infection | .331 | .286-.383 |
Systemic complication | .641 | .565-.729 |
Abbreviations: OA, osteoarthritis; RA, rheumatoid arthritis; TKA, total knee arthroplasty.
Continue to: Discussion...
DISCUSSION
Our results showed a continuous yearly increase from 2006 to 2011 in THA and TKA procedures at a rate of 36% and 34%, respectively; this result was consistent with existing literature.11 Despite a substantial increase in the amount of total THA and TKA procedures, the ratio of patients with RA undergoing these operations has decreased or remained nearly the same. Similar effects were found in Japan and the US when examining patients with RA undergoing TJA procedures between 2001 and 2007 and between 1992 and 2005, respectively.12-14 This observation may be explained by the advances and early initiation of pharmacologic treatment and the widespread use of DMARDs such as methotrexate (MTX), azathioprine, leflunomide, hydroxychloroquine, and biological response modifiers TNF-α and interleukin-1.15 These medications have drastically improved survival rates of patients with RA with impressive capabilities in symptom relief.15 With the increasing use of DMARDs and aggressive treatment early on in the disease process, patients with RA are showing markedly slow progression of joint deterioration, leading to a decreased need for orthopedic intervention compared with the general population.13,15
When analyzing the complication rates for patients undergoing TKA and THA, we observed that patients with RA exhibited a significant increase in the rates of infections, wound dehiscence, and systemic complications prior to discharge from the hospital compared with the OA population. The increased risk of infections was reported in previous studies assessing postoperative complication rates in TJA.16,17 A study utilizing the Norwegian Arthroplasty Registry noted an increased risk of late infection in patients with RA, leading to increased rates of revision TJA in comparison with patients with OA.16 Another study, which was based on the Canadian Institute for Health Information Discharge Abstract Database, showed that patients with RA are at an increased risk of infection only after THA and interestingly not after TKA.17 Although our study did not identify the causes of the increased infection rate, the inherent nature of the disease and the immunomodulatory drugs used to treat it may contribute to this increased infectious risk in patients with RA.6,18 Immunosuppressive DMARDs are some of the widely used medications employed to treat RA and are prime suspects of causing increased infection rates.15 The perioperative use of MTX has not been shown to cause short-term increases in infection for patients undergoing orthopedic intervention, but leflunomide and TNF-α inhibitors have been shown to cause a significant several-fold increase in risk for surgical wound infections.19,20
All patients with RA presented with significant increases for infection, wound dehiscence, and systemic complications, whereas only patients with RA undergoing THA showed increased risk of pulmonary and cardiovascular complications when compared with patients with OA. Surprisingly, in TKA, patients with RA were at a significantly decreased risk of cardiovascular complications. This observation was interesting due to cardiovascular disease being one of RA's most notable extra-articular features.4,21
Patients with RA undergoing TJA also showed significantly lower cerebrovascular complications than patients with OA. The significant reduction in risk for these complications has not been previously reported in the current literature, and it was an unexpected finding as past studies have found an increased risk in cerebrovascular disease in patients with RA. RA is an inflammatory disease exhibiting the upregulation of procoagulation factors,22 so we expected patients with RA to be at an increased risk for cerebrovascular and cardiovascular complications over patients with OA. Although we are unsure why these results were observed, we postulate that pharmaceutical interventions may confer some protection to patients with RA. For example, aspirin is commonly utilized in RA for its protective anti-platelet effect23 and may be a contributing factor to why we found low postoperative complication rates in cerebrovascular disease. However, the reason why aspirin may be protective against cerebrovascular and not cardiovascular complications remains unclear. Moreover, most guidelines suggest that aspirin be stopped prior to surgery.24 Although patients with RA were younger than those with OA, age was accounted for when analyzing the data.
A major strength of the study was the large sample size and the adjustment of potential confounding variables when examining the difference in complications between RA and OA. It is also a national US study that utilizes a validated database. Given that the patient samples in the NIS are reported in a uniform and de-identified manner, the database is considered ideal and has been extensively used for retrospective large observational cohort studies.25 However, the study also had some limitations due to the retrospective and administrative nature of the NIS database. Only data concerning patient complications during their inpatient stay at the hospital were available. Patients who may develop complications following discharge were not included in the data, providing a very small window of time for analysis. Another limitation with the database was its lack of ability to identify the severity of each patient's disease process or the medical treatment they received perioperatively. Finally, no patient-reported outcomes were determined, which would provide information on whether these complications affect the patients’ postoperational satisfaction in regard to their pain and disability.
CONCLUSION
As RA patients continue to utilize joint arthroplasty to repair deteriorated joints, understanding of how the disease process and its medical management may impact patient outcomes is important. This article reports significantly higher postoperational infection rates in RA than in patients with OA, which may be due to the medical management of the disease. Although new medications have been introduced and are being used to treat patients with RA, they have not altered the complication rate following TJA in this patient population. Thus, surgeons and other members of the management team should be familiar with the common medical conditions, co-morbidities, and medical treatments/side effects that are encountered in patients with RA. Future studies should delve into possible differences in long-term outcomes of patients with RA undergoing TKA and THA, as well as whether certain perioperative strategies and therapies (medical or physical) may decrease complications and improve outcomes.
This paper will be judged for the Resident Writer’s Award.
- Myasoedova E, Davis JM 3rd, Crowson CS, Gabriel SE. Epidemiology of rheumatoid arthritis: rheumatoid arthritis and mortality. Curr Rheumatol Rep. 2010;12(5):379-385. doi:10.1007/s11926-010-0117-y.
- Firestein GS. Evolving concepts of rheumatoid arthritis. Nature. 2003;423(6937):356-361. doi:10.1038/nature01661.
- Gullick NJ, Scott DL. Co-morbidities in established rheumatoid arthritis. Best Pract Res Clin Rheumatol. 2011;25(4):469-483. doi:10.1016/j.berh.2011.10.009.
- Masuda H, Miyazaki T, Shimada K, et al. Disease duration and severity impacts on long-term cardiovascular events in Japanese patients with rheumatoid arthritis. J Cardiol. 2014;64(5):366-370. doi:10.1016/j.jjcc.2014.02.018.
- Bongartz T, Nannini C, Medina-Velasquez YF, et al. Incidence and mortality of interstitial lung disease in rheumatoid arthritis: a population-based study. Arthritis Rheum.2010;62(6):1583-1591. doi:10.1002/art.27405.
- Doran MF, Crowson CS, Pond GR, O'Fallon WM, Gabriel SE. Frequency of infection in patients with rheumatoid arthritis compared with controls: a population-based study. Arthritis Rheum. 2002;46(9):2287-2293. doi:10.1002/art.10524.
- Rossini M, Rossi E, Bernardi D, et al. Prevalence and incidence of rheumatoid arthritis in Italy. Rheumatol Int. 2014;34(5):659664. doi:10.1007/s00296-014-2974-6.
- Alamanos Y, Voulgari PV, Drosos AA. Incidence and prevalence of rheumatoid arthritis, based on the 1987 American College of Rheumatology criteria: a systematic review. Semin Arthritis Rheum. 2006;36(3):182-188. doi:10.1016/j.semarthrit.2006.08.006.
- Carbonell J, Cobo T, Balsa A, Descalzo MA, Carmona L. The incidence of rheumatoid arthritis in Spain: results from a nationwide primary care registry. Rheumatology.2008;47(7):1088-1092. doi:10.1093/rheumatology/ken205.
- Skytta ET, Honkanen PB, Eskelinen A, Huhtala H, Remes V. Fewer and older patients with rheumatoid arthritis need total knee replacement. Scand J Rheumatol. 2012;41(5):345-349. doi:10.3109/03009742.2012.681061.
- Singh JA, Vessely MB, Harmsen WS, et al. A population-based study of trends in the use of total hip and total knee arthroplasty, 1969–2008. Mayo Clin Proc. 2010;85(10):898-904. doi:10.4065/mcp.2010.0115.
- Momohara S, Inoue E, Ikari K, et al. Decrease in orthopaedic operations, including total joint replacements, in patients with rheumatoid arthritis between 2001 and 2007: data from Japanese outpatients in a single institute-based large observational cohort (IORRA). Ann Rheum Dis. 2010;69(1):312-313. doi:10.1136/ard.2009.107599.
- Jain A, Stein BE, Skolasky RL, Jones LC, Hungerford MW. Total joint arthroplasty in patients with rheumatoid arthritis: a United States experience from 1992 through 2005. J Arthroplasty. 2012;27(6):881-888. doi:10.1016/j.arth.2011.12.027.
- Mertelsmann-Voss C, Lyman S, Pan TJ, Goodman SM, Figgie MP, Mandl LA. US trends in rates of arthroplasty for inflammatory arthritis including rheumatoid arthritis, juvenile idiopathic arthritis, and spondyloarthritis. Arthritis Rheumatol 2014;66(6):1432-1439. doi:10.1002/art.38384.
- Howe CR, Gardner GC, Kadel NJ. Perioperative medication management for the patient with rheumatoid arthritis. J Am Acad Orthop Surg. 2006;14(9):544-551. doi:10.5435/00124635-200609000-00004.
- Schrama JC, Espehaug B, Hallan G, et al. Risk of revision for infection in primary total hip and knee arthroplasty in patients with rheumatoid arthritis compared with osteoarthritis: a prospective, population-based study on 108,786 hip and knee joint arthroplasties from the Norwegian Arthroplasty Register. Arthritis Care Res. 2010;62(4):473-479. doi:10.1002/acr.20036.
- Ravi B, Croxford R, Hollands S, et al. Increased risk of complications following total joint arthroplasty in patients with rheumatoid arthritis. Arthritis Rheumatol. 2014;66(2):254-263. doi:10.1002/art.38231.
- Au K, Reed G, Curtis JR, et al. High disease activity is associated with an increased risk of infection in patients with rheumatoid arthritis. Ann Rheum Dis. 2011;70(5):785-791. doi:10.1136/ard.2010.128637.
- Bongartz T, Sutton AJ, Sweeting MJ, Buchan I, Matteson EL, Montori V. Anti-TNF antibody therapy in rheumatoid arthritis and the risk of serious infections and malignancies: systematic review and meta-analysis of rare harmful effects in randomized controlled trials. JAMA. 2006;295(19):2275-2285. doi:10.1001/jama.295.19.2275.
- Scherrer CB, Mannion AF, Kyburz D, Vogt M, Kramers-de Quervain IA. Infection risk after orthopedic surgery in patients with inflammatory rheumatic diseases treated with immunosuppressive drugs. Arthritis Care Res. 2013;65(12):2032-2040. doi:10.1002/acr.22077.
- Bacani AK, Gabriel SE, Crowson CS, Heit JA, Matteson EL. Noncardiac vascular disease in rheumatoid arthritis: increase in venous thromboembolic events? Arthritis Rheum.2012;64(1):53-61. doi:10.1002/art.33322.
- Wallberg-Jonsson S, Dahlen GH, Nilsson TK, Ranby M, Rantapaa-Dahlqvist S. Tissue plasminogen activator, plasminogen activator inhibitor-1 and von Willebrand factor in rheumatoid arthritis. Clin Rheumatol. 1993;12(3):318324.
- van Heereveld HA, Laan RF, van den Hoogen FH, Malefijt MC, Novakova IR, van de Putte LB. Prevention of symptomatic thrombosis with short term (low molecular weight) heparin in patients with rheumatoid arthritis after hip or knee replacement. Ann Rheum Dis.2001;60(10):974-976. doi:10.1136/ard.60.10.974.
- Mont MA, Jacobs JJ, Boggio LN, et al. Preventing venous thromboembolic disease in patients undergoing elective hip and knee arthroplasty. J Am Acad Orthop Surg.2011;19(12):768-776.
- Bozic KJ, Bashyal RK, Anthony SG, Chiu V, Shulman B, Rubash HE. Is administratively coded comorbidity and complication data in total joint arthroplasty valid? Clin Orthop Relat Res. 2013;471(1):201-205. doi:10.1007/s11999-012-2352-1.
TAKE-HOME POINTS
- Patients undergoing THA for OA, when compared to those with RA undergoing THA, had lower risk for postoperative cardiovascular, pulmonary, wound dehiscence, infections, and systemic complications.
- Patients with OA undergoing THA had statistically significant higher risk of cerebrovascular complication compared to RA patients undergoing the same procedure.
- In TKA, OA patients had significantly higher risk for cardiovascular and cerebrovascular complications, and a significant lower risk for mechanical wounds, infection, and systemic complications.
- RA patients are at higher risk for postoperative infection, wound dehiscence, and systemic complications after TKA and THA compared to OA patients.
- These findings highlight the importance of preoperative medical clearance and management to optimize RA patients and improve the postoperative outcomes.