User login
Blood Loss Reduction with Tranexamic Acid and a Bipolar Sealer in Direct Anterior Total Hip Arthroplasty
ABSTRACT
The purpose of this study is to determine the effectiveness of tranexamic acid (TXA) alone and in conjunction with a bipolar sealer in reducing postoperative transfusions during direct anterior (DA) total hip arthroplasty (THA).
In this retrospective review, we analyzed 173 consecutive patients who underwent primary unilateral DA THA performed by 2 surgeons during a 1-year period. Subjects were divided into 3 groups based on TXA use: 63 patients received TXA alone (TXA group), 49 patients received TXA in addition to a bipolar sealer (TXA + bipolar sealer group), and 61 patients received neither TXA nor a bipolar sealer (control group). Primary end points were the transfusion rate and estimated blood loss. Secondary end points were length of stay, postoperative drop in hemoglobin, and postoperative drain output.
Two patients in the TXA group and 10 patients in the control group were transfused (P = .02). In the TXA + bipolar sealer group, 1 patient was transfused (P = .02). No significant difference in the rate of transfusion was found between the TXA group and the TXA + bipolar sealer group (P = .99). Estimated blood loss was 310.3 mL ± 182.5 mL in the TXA group (P = .004), 292.9 mL ± 130.8 mL in the TXA + bipolar sealer group (P = .003), and 404.9 mL ± 201.2 mL in the control group.
The use of TXA, with and without the concomitant use of a bipolar sealer, decreases intraoperative blood loss and postoperative transfusion requirements. The addition of a bipolar sealer, however, does not appear to provide any additional decrease in blood loss.
Historically, patients undergoing total hip arthroplasty (THA) have significant blood loss and required blood transfusions.1-3 Blood transfusions increase not only the risk of complications but also the cost of the procedure.4-9 Although less invasive techniques in hip surgery may decrease blood loss,10-12 intraoperative blood loss remains a concern. Optimization of anemia and blood conservation techniques include preoperative autologous blood donation, perioperative hemodilution, meticulous surgical hemostasis, and the use of antifibrinolytic agents.4,5,7,13,14 Antifibrinolytics are inexpensive and have been shown to reduce blood loss during THA and total knee arthroplasty (TKA).7,15-17
Continue to: Tranexamic acid (TXA), a synthetic analog...
Tranexamic acid (TXA), a synthetic analog of the amino acid lysine, is one antifibrinolytic that has recently been adopted in total joint arthroplasty. TXA competitively inhibits the lysine binding site of plasminogen, inhibiting fibrinolysis and leading to clot stabilization.18-20 Because of its safety and low cost, TXA has been readily accepted. The bipolar sealer enhances surgical hemostasis by sealing vessels at the surgical site through radiofrequency ablation. In contrast to standard electrocautery, a bipolar sealer uses saline to maintain tissue temperatures at <100°C, minimizing damage to surrounding tissues.21 Many applications of a bipolar sealer have been reported in the fields of surgical oncology,21 pulmonary surgery,21 liver resection,22 THA23,24 and TKA,25,26 and spine surgery.27 We recently published our reduction in transfusion rates during direct anterior (DA) THA with use of a bipolar sealer.28
Although many studies have analyzed the use of TXA and a bipolar sealer with the posterior and lateral approaches to hip arthroplasty, there is a paucity of research analyzing its use in the DA approach. This study retrospectively reviews the effectiveness of TXA alone and in conjunction with a bipolar sealer in reducing allogeneic blood transfusions in DA THA.
METHODS
This is a retrospective, comparative study evaluating the efficacy of TXA with and without a bipolar sealer in unilateral DA THA. The study included 173 patients who underwent standard DA THA performed by 2 surgeons in the period April 2013 to April 2014. Patient demographic information is summarized in Table 1.
Table 1. Demographic Data
| All (N = 173) | TXA Only (n = 63) | TXA + Bipolar Sealer (n = 49) | Control (n = 61) | P-value (TXA vs Control) | P-value (TXA + Sealer vs Control) | P-value (TXA + Sealer vs TXA) |
Age (y)a | 64.8 ± 10.5 (28.4-87.6) | 66.9 ± 9.9 (47.2-87.6) | 62.1 ± 11.0 (28.4-86.3) | 64.7 ± 10.4 (38.3-85.8) | .31 | .24 | .03 |
Genderb |
|
|
|
| .99 | 0.95 | .94 |
Male | 82 (47.4%) | 30 (47.6%) | 23 (46.9%) | 29 (47.5%) |
|
|
|
Female | 91 (52.6%) | 33 (52.4%) | 26 (53.1%) | 32 (52.5%) |
|
|
|
BMI (kg/m2)a | 27.9 ± 4.4 (17.5-40.6) | 27.8 ± 3.3 (21.6-35.9) | 29.1 ± 5.3 (17.8-40.6) | 27.0 ± 4.5 (17.5-39.8) | .16 | .03 | .13 |
Preoperative hemoglobin levela | 13.6 ± 1.3 (10.5-17.2) | 13.9 ± 1.2 (11.5-17.1) | 13.5 ± 1.4 (10.5-16.6) | 13.5 ± 1.2 (10.5-17.2) | .10 | .98 | .10 |
aResult values are expressed as mean ± standard deviation (range). bResult values are expressed as number of cases (percentage of column header population).
Abbreviations: BMI, body mass index; TXA, tranexamic acid.
Three cohorts were created based on intraoperative blood loss management practices at the surgeon’s discretion. The first group included 63 patients who underwent DA THA with TXA but not a bipolar sealer. The second group included 49 patients who underwent DA THA with TXA and a bipolar sealer. The third (control) group included 61 patients who underwent DA THA without TXA or a bipolar sealer. Data for the control group were collected prospectively as a part of a randomized trial, which demonstrated a reduction in transfusion requirements and blood loss with the use of a bipolar sealer in DA THA.28 All patients received a surgical hemovac suction drain, which was removed at 24 hours after surgery. All patients received 40 mg of enoxaparin daily for 2 weeks for venous thromboembolism prophylaxis starting the day after surgery.
All patients in the first 2 groups received 2 g of TXA administered intravenously in 2 doses: the first dose was given preoperatively, and the second dose was given immediately postoperatively in the recovery room. The bipolar sealer was utilized as needed perioperatively according to the manufacturer’s instructions to address specific bleeding targets. The common sites and steps of a DA THA, in which bleeding typically occurs, are:
- The medial femoral circumflex artery during the approach to the capsule;
- The anterior hip capsule vessels prior to capsulotomy;
- The deep branch of the medial femoral circumflex artery and the nutrient vessels to the lesser trochanter encountered while exposing the medial neck and releasing the medial capsule;
- The posterior-superior retinacular arteries encountered after femoral neck osteotomy and removal of the femoral head along the posterior capsule; and
- The branch of the obturator artery encountered during exposure of the acetabular fovea.29-31
At the time of this study, the transfusion criteria included hemoglobin <8 g/dL in the presence of clinical symptoms.
Continue to: Primary outcome measures...
OUTCOME MEASURES AND DATA ANALYSIS
Primary outcome measures were transfusion requirements and estimated blood loss. Secondary outcome measures were postoperative decrease in hemoglobin, length of stay, and postoperative drain output. Demographic and operative data were compared between groups to ensure that there were no statistically significant differences in blood loss and transfusion requirements. All data were recorded in a password encrypted file and subsequently transferred to the REDCap system (Research Electronic Data Capture, Vanderbilt University).
STATISTICAL ANALYSIS
A priori sample size calculation was performed on the basis of a prior study 28, which evaluated surgical blood loss reduction utilizing a bipolar sealer. This study suggested a sample size of 20 per group to detect the minimal clinically important difference of 1.5 (standard deviation (SD) = 1.5, α = 0.05, β = 0.20). Additionally, a general estimate for detecting a 1-unit change on an ordinal scale of 136 (SD = 1.0, α = 0.05, β = 0.20) resulted in the same number. We conservatively chose to include at least 24 patients in each study arm in the event of greater true variance. The Wilcoxon rank-sum test was used for comparison of continuous data between groups. Differences between means were analyzed using 2-sided t tests. Comparison of categorical data was performed using Pearson’s chi-square or Fisher’s exact probability test as indicated. Ordinal ranking scores were compared using the Mantel-Haenszel test.
RESULTS
There were no statistically significant differences between groups with respect to sex, age, body mass index, or preoperative hemoglobin level (Table 1). Two patients in the TXA group and 10 patients in the control group were transfused (P = .02). In the TXA + bipolar sealer group, 1 patient was transfused (P = .02). A comparison of the transfusion rate between the TXA group and the TXA + bipolar sealer group yielded no significant difference (P = .99). The estimated blood loss was 310.3 mL ± 182.5 mL in the TXA group (P = .004), 292.9 mL ± 130.8 mL in the TXA + bipolar sealer group (P = .003), and 404.9 mL ± 201.2 mL in the control group (P = .71) (Table 2).
Table 2. Patient-Related Outcomes
| TXA Only (N = 63) | TXA + Bipolar Sealer (n = 49) | Control (n = 61) | P-value (TXA vs Control) | P-value (TXA + Sealer vs Control) | P-value (TXA + Sealer vs TXA) |
Patients Transfuseda | 2 (3.2%) | 1 (2.0%) | 10 (16.4%) | .02 | .02 | .99 |
Hemoglobin Drop (g/dL)b = preoperative Hb-lowest Hb | 3.5 ± 0.8 (1.8-6.3) | 3.5 ± 1.1 (1.7-6.0) | 4.3 ± 1.2 (2.0-7.5) | <.001 | <.001 | .60 |
Total Drain Output (mL)b | 326.3 ± 197.5 (15-1050) | 309.8 ± 196.3 (20-920) | 473.6 ± 199.7 (90-960) | <.001 | <.001 | .58 |
Calculated Blood Loss (mL)b = 1000 x total Hb loss/preoperative Hb | 1217.8 ± 335.8 (573.0-2514.4) | 1289.5 ± 382.4 (536.1-2418.2) | 1514.7 ± 467.9 (789.4-3451.1) | <.001 | .005 | .43 |
Estimated Blood Loss (mL)b | 310.3 ± 182.5 (100-1400) | 292.9 ± 130.8 (75-600) | 404.9 ± 201.2 (150-1000) | .004 | .003 | .71 |
Length of Stay (d)a | 2.2 ± 0.6 (1-4) | 2.2 ± 0.9 (1-5) | 2.6 ± 0.8 (1-5) | .004 | .03 | .78 |
aResult values are expressed as mean ± standard deviation (range). bResult values are expressed as number of cases (percentage of column header population).
Abbreviation: TXA, tranexamic acid.
The total drain output was 326.3 mL ± 197.5 mL in the TXA group (P < .001 for comparison with the control group), 309.8 mL ± 196.3 mL in the TXA + bipolar sealer group (P < .001 for comparison with the control group), and 473.6 mL ± 199.7 mL in the control group (P = .58). The decrease in hemoglobin was 3.5 g/dL ± 0.8 g/dL in the TXA group (P < .001), 3.5 g/dL ± 1.1 g/dL in the TXA + bipolar sealer group (P < .001), and 4.3 g/dL ± 1.2 g/dL in the control group (Table 2). The length of stay was 2.2 ± 0.6 days for the TXA group (P = .004) and 2.2 ± 0.9 days (P = .03) for the TXA + bipolar sealer group, and 2.6 ± 0.8 days in the control group (P = .78) (Table 2).
DISCUSSION
This study shows that the use of TXA alone provides a significant decrease in transfusion rates and estimated blood loss, a benefit which was not further increased with the addition of a bipolar sealer (Table 2). Many studies have demonstrated that TXA reduces blood loss and transfusion rates in patients undergoing THA and TKA.29 However, TXA’s acceptance as a more readily used hemostatic medication has been hindered by the theoretically increased risk of thromboembolism in susceptible, high-risk patients.32-35 In a 2012 meta-analysis conducted by Yang and colleagues,36 the use of TXA led to significantly less blood loss per patient and fewer transfusions without leading to an increased risk of thromboembolic events.
Continue to: Similarly, the bipolar sealer...
Similarly, the bipolar sealer has been shown to decrease transfusion rates and stabilize perioperative hemoglobin levels.25-27 In this recent prospective clinical trial evaluating the use of a bipolar sealer during DA THA, we observed decreased intraoperative blood loss and transfusion requirements in patients managed with a bipolar sealer.28 However, in a study conducted by Barsoum and colleagues37 evaluating the use of a bipolar sealer in THA with a posterior approach, there were no significant postoperative benefits in terms of blood loss, transfusion requirements, clinical evaluations, functionality, or health-related quality of life in patients managed with a bipolar sealer.
Although the results of our research are in line with those of previous publications, it is important to address 3 limitations within this study. First, only the control group in this study was enrolled prospectively; the remaining groups were reviewed retrospectively. Second, our adoption of TXA was recent; therefore, a confounding factor is that our surgeons had more experience in the anterior approach when using TXA. Third, the established transfusion threshold of <8 g/dl for this study led to more liberal use of transfusions. Since the conclusion of this study, we have adopted stricter transfusion criteria (hemoglobin <7.0 g/dL with clinical symptoms) which has led to even lower transfusion requirements.
CONCLUSION
In the reviewed patient population, TXA decreased blood loss and transfusion requirements following DA THA. However, the addition of a bipolar sealer did not provide an advantage. The results of this study do not support the routine use of a bipolar sealer in DA THA.
1. Sehat KR, Evans R, Newman JH. How much blood is really lost in total knee and hip arthroplasty? Knee. 2000;7(3):151-155.
2. Toy PT, Kaplan EB, McVay PA, Lee SJ, Strauss RG, Stehling LC. Blood loss and replacement in total hip arthroplasty: a multicenter study. The Preoperative Autologous Blood Donation Study Group. Transfusion. 1992;32(1):63-67.
3. Pierson JL, Hannon TJ, Earles DR. A blood-conservation algorithm to reduce blood transfusions after total hip and knee arthroplasty. J Bone Joint Surg Am. 2004;86-A(7):1512-1518.
4. Gill JB, Rosenstein A. The use of antifibrinolytic agents in total hip arthroplasty. J Arthroplasty. 2006;21(6):869-873.
5. Sukeik M, Alshryda S, Haddad FS, Mason JM. Systematic review and meta-analysis of the use of tranexamic acid in total hip replacement. J Bone Joint Surg Br. 2011;93(1):39-46. doi:10.1302/0301-620X.93B1.24984.
6. Rajesparan K, Biant LC, Ahmad M, Field RE. The effect of an intravenous bolus of tranexamic acid on blood loss in total hip replacement. J Bone Joint Surg Br. 2009;91(6):776-783. doi:10.1302/0301-620X.91B6.22393.
7. Hynes MC, Calder P, Rosenfeld P, Scott G. The use of tranexamic acid to reduce blood loss during total hip arthroplasty: an observational study. Ann R Coll Surg Engl. 2005;87(2):99-101. doi:10.1308/147870805X28118.
8. Earnshaw P. Blood conservation in orthopaedic surgery: the role of epoetin alfa. Int Orthop. 2001;25(5):273-278. doi:10.1007/s002640100261.
9. Kleinman S, Chan P, Robillard P. Risks associated with transfusion of cellular blood components in Canada. Transfus Med Rev. 2003;17(2):120-162. doi:10.1053/tmrv.2003.50009.
10. Lovell TP. Single-incision direct anterior approach for total hip arthroplasty using a standard operating table. J Arthroplast. 2008;23(7 Suppl):64-68. doi:10.1016/j.arth.2008.06.027.
11. Wojciechowski P, Kusz D, Kopeć K, Borowski M. Minimally invasive approaches in total hip arthroplasty. Ortop Traumatol Rehabil. 2007;9(1):1-7.
12. Rachbauer F, Krismer M. [Minimally invasive total hip arthroplasty via direct anterior approach]. Oper Orthop Traumatol. 2008;20(3):239-251. doi:10.1007/s00064-008-1306-y.
13. Johansson T, Pettersson LG, Lisander B. Tranexamic acid in total hip arthroplasty saves blood and money: a randomized, double-blind study in 100 patients. Acta Orthop. 2005;76(3):314-319.
14. Claeys MA, Vermeersch N, Haentjens P. Reduction of blood loss with tranexamic acid in primary total hip replacement surgery. Acta Chir Belg. 2007;107(4):397-401.
15. Ido K, Neo M, Asada Y, et al. Reduction of blood loss using tranexamic acid in total knee and hip arthroplasties. Arch Orthop Trauma Surg. 2000;120(9):518-520.
16. Benoni G, Fredin H, Knebel R, Nilsson P. Blood conservation with tranexamic acid in total hip arthroplasty: a randomized, double-blind study in 40 primary operations. Acta Orthop Scand. 2001;72(5):442-448. doi:10.1080/000164701753532754.
17. Ekbäck G, Axelsson K, Ryttberg L, et al. Tranexamic acid reduces blood loss in total hip replacement surgery. Anesth Analg. 2000;91(5):1124-1130.
18. Ralley FE, Berta D, Binns V, Howard J, Naudie DDR. One intraoperative dose of tranexamic acid for patients having primary hip or knee arthroplasty. Clin Orthop Relat Res. 2010;468(7):1905-1911. doi:10.1007/s11999-009-1217-8.
19. Eubanks JD. Antifibrinolytics in major orthopaedic surgery. J Am Acad Orthop Surg. 2010;18(3):132-138.
20. Astedt B. Clinical pharmacology of tranexamic acid. Scand J Gastroenterol Suppl. 1987;137:22-25.
21. Kirschbaum A, Kunz J, Steinfeldt T, Pehl A, Meyer C, Bartsch DK. Bipolar impedance-controlled sealing of the pulmonary artery with SealSafe G3 electric current: determination of bursting pressures in an ex vivo model. J Surg Res. 2014;192(2):611-615. doi:10.1016/j.jss.2014.07.014.
22. Romano F, Garancini M, Uggeri F, et al. Bleeding in hepatic surgery: sorting through methods to prevent it. HPB Surg. 2012;2012:169351. doi:10.1155/2012/169351.
23. Marulanda GA, Ulrich SD, Seyler TM, Delanois RE, Mont MA. Reductions in blood loss with a bipolar sealer in total hip arthroplasty. Expert Rev Med Devices. 2008;5(2):125-131. doi:10.1586/17434440.5.2.125.
24. Rosenberg AG. Reducing blood loss in total joint surgery with a saline-coupled bipolar sealing technology. J Arthroplast. 2007;22(4 Suppl 1):82-85. doi:10.1016/j.arth.2007.02.018.
25. Marulanda GA, Krebs VE, Bierbaum BE, et al. Haemostasis using a bipolar sealer in primary unilateral total knee arthroplasty. Am J Orthop. 2009;38(12):E179-E183.
26. Weeden SH, Schmidt RH, Isabell G. Haemostatic efficacy of a bipolar sealing device in minimally invasive total knee arthroplasty. J Bone Joint Surg Br Proceedings. 2009;91-B:45.
27. Gordon ZL, Son-Hing JP, Poe-Kochert C, Thompson GH. Bipolar sealer device reduces blood loss and transfusion requirements in posterior spinal fusion for adolescent idiopathic scoliosis. J Pediatr Orthop. 2013;33(7):700-706. doi:10.1097/BPO.0b013e31829d5721.
28. Suarez JC, Slotkin EM, Szubski CR, Barsoum WK, Patel PD. Prospective, randomized trial to evaluate efficacy of a bipolar sealer in direct anterior approach total hip arthroplasty. J Arthroplasty. 2015;30(11):1953-1958. doi:10.1016/j.arth.2015.05.023.
29. Gautier E, Ganz K, Krügel N, Gill T, Ganz R. Anatomy of the medial femoral circumflex artery and its surgical implications. J Bone Joint Surg. 2000;82(5):679-683. doi:10.1302/0301-620x.82b5.10426.
30. Trueta J, Harrison MHM. The normal vascular anatomy of the femoral head in adult man. J Bone Joint Surg Br. 1953;35-B(3):442-461.
31. Sevitt S, Thompson RG. The distribution and anastomoses of arteries supplying the
head and neck of the femur. J Bone Joint Surg Br. 1965;47-B:560-573. doi:10.1302/0301-620X.47B3.560.
32. Saleh A, Hebeish M, Farias-Kovac M, et al. Use of hemostatic agents in hip and knee arthroplasty. JBJS. 2014;2(1):1-12. doi:10.2106/JBJS.RVW.M.00061.
33. Howes JP, Sharma V, Cohen AT. Tranexamic acid reduces blood loss after knee arthroplasty. J Bone Joint Surg Br. 1996;78(6):995-996.
34. Karkouti K. Is tranexamic acid indicated for total knee replacement surgery? Anesth Analg. 2000;91(1):244-245.
35. Graham ID, Alvarez G, Tetroe J, McAuley L, Laupacis A. Factors influencing the adoption of blood alternatives to minimize allogeneic transfusion: the perspective of eight Ontario hospitals. Can J Surg. 2002;45(2):132-140.
36. Yang ZG, Chen WP, Wu LD. Effectiveness and safety of tranexamic acid in reducing blood loss in total knee arthroplasty: a meta-analysis. J Bone Joint Surg Am. 2012;94(13):1153-1159. doi:10.2106/JBJS.K.00873.
37. Barsoum WK, Klika AK, Murray TG, Higuera C, Lee HH, Krebs VE. Prospective randomized evaluation of the need for blood transfusion during primary total hip arthroplasty with use of a bipolar sealer. J Bone Joint Surg Am. 2011;93(6):513-518. doi:10.2106/JBJS.J.00036.
ABSTRACT
The purpose of this study is to determine the effectiveness of tranexamic acid (TXA) alone and in conjunction with a bipolar sealer in reducing postoperative transfusions during direct anterior (DA) total hip arthroplasty (THA).
In this retrospective review, we analyzed 173 consecutive patients who underwent primary unilateral DA THA performed by 2 surgeons during a 1-year period. Subjects were divided into 3 groups based on TXA use: 63 patients received TXA alone (TXA group), 49 patients received TXA in addition to a bipolar sealer (TXA + bipolar sealer group), and 61 patients received neither TXA nor a bipolar sealer (control group). Primary end points were the transfusion rate and estimated blood loss. Secondary end points were length of stay, postoperative drop in hemoglobin, and postoperative drain output.
Two patients in the TXA group and 10 patients in the control group were transfused (P = .02). In the TXA + bipolar sealer group, 1 patient was transfused (P = .02). No significant difference in the rate of transfusion was found between the TXA group and the TXA + bipolar sealer group (P = .99). Estimated blood loss was 310.3 mL ± 182.5 mL in the TXA group (P = .004), 292.9 mL ± 130.8 mL in the TXA + bipolar sealer group (P = .003), and 404.9 mL ± 201.2 mL in the control group.
The use of TXA, with and without the concomitant use of a bipolar sealer, decreases intraoperative blood loss and postoperative transfusion requirements. The addition of a bipolar sealer, however, does not appear to provide any additional decrease in blood loss.
Historically, patients undergoing total hip arthroplasty (THA) have significant blood loss and required blood transfusions.1-3 Blood transfusions increase not only the risk of complications but also the cost of the procedure.4-9 Although less invasive techniques in hip surgery may decrease blood loss,10-12 intraoperative blood loss remains a concern. Optimization of anemia and blood conservation techniques include preoperative autologous blood donation, perioperative hemodilution, meticulous surgical hemostasis, and the use of antifibrinolytic agents.4,5,7,13,14 Antifibrinolytics are inexpensive and have been shown to reduce blood loss during THA and total knee arthroplasty (TKA).7,15-17
Continue to: Tranexamic acid (TXA), a synthetic analog...
Tranexamic acid (TXA), a synthetic analog of the amino acid lysine, is one antifibrinolytic that has recently been adopted in total joint arthroplasty. TXA competitively inhibits the lysine binding site of plasminogen, inhibiting fibrinolysis and leading to clot stabilization.18-20 Because of its safety and low cost, TXA has been readily accepted. The bipolar sealer enhances surgical hemostasis by sealing vessels at the surgical site through radiofrequency ablation. In contrast to standard electrocautery, a bipolar sealer uses saline to maintain tissue temperatures at <100°C, minimizing damage to surrounding tissues.21 Many applications of a bipolar sealer have been reported in the fields of surgical oncology,21 pulmonary surgery,21 liver resection,22 THA23,24 and TKA,25,26 and spine surgery.27 We recently published our reduction in transfusion rates during direct anterior (DA) THA with use of a bipolar sealer.28
Although many studies have analyzed the use of TXA and a bipolar sealer with the posterior and lateral approaches to hip arthroplasty, there is a paucity of research analyzing its use in the DA approach. This study retrospectively reviews the effectiveness of TXA alone and in conjunction with a bipolar sealer in reducing allogeneic blood transfusions in DA THA.
METHODS
This is a retrospective, comparative study evaluating the efficacy of TXA with and without a bipolar sealer in unilateral DA THA. The study included 173 patients who underwent standard DA THA performed by 2 surgeons in the period April 2013 to April 2014. Patient demographic information is summarized in Table 1.
Table 1. Demographic Data
| All (N = 173) | TXA Only (n = 63) | TXA + Bipolar Sealer (n = 49) | Control (n = 61) | P-value (TXA vs Control) | P-value (TXA + Sealer vs Control) | P-value (TXA + Sealer vs TXA) |
Age (y)a | 64.8 ± 10.5 (28.4-87.6) | 66.9 ± 9.9 (47.2-87.6) | 62.1 ± 11.0 (28.4-86.3) | 64.7 ± 10.4 (38.3-85.8) | .31 | .24 | .03 |
Genderb |
|
|
|
| .99 | 0.95 | .94 |
Male | 82 (47.4%) | 30 (47.6%) | 23 (46.9%) | 29 (47.5%) |
|
|
|
Female | 91 (52.6%) | 33 (52.4%) | 26 (53.1%) | 32 (52.5%) |
|
|
|
BMI (kg/m2)a | 27.9 ± 4.4 (17.5-40.6) | 27.8 ± 3.3 (21.6-35.9) | 29.1 ± 5.3 (17.8-40.6) | 27.0 ± 4.5 (17.5-39.8) | .16 | .03 | .13 |
Preoperative hemoglobin levela | 13.6 ± 1.3 (10.5-17.2) | 13.9 ± 1.2 (11.5-17.1) | 13.5 ± 1.4 (10.5-16.6) | 13.5 ± 1.2 (10.5-17.2) | .10 | .98 | .10 |
aResult values are expressed as mean ± standard deviation (range). bResult values are expressed as number of cases (percentage of column header population).
Abbreviations: BMI, body mass index; TXA, tranexamic acid.
Three cohorts were created based on intraoperative blood loss management practices at the surgeon’s discretion. The first group included 63 patients who underwent DA THA with TXA but not a bipolar sealer. The second group included 49 patients who underwent DA THA with TXA and a bipolar sealer. The third (control) group included 61 patients who underwent DA THA without TXA or a bipolar sealer. Data for the control group were collected prospectively as a part of a randomized trial, which demonstrated a reduction in transfusion requirements and blood loss with the use of a bipolar sealer in DA THA.28 All patients received a surgical hemovac suction drain, which was removed at 24 hours after surgery. All patients received 40 mg of enoxaparin daily for 2 weeks for venous thromboembolism prophylaxis starting the day after surgery.
All patients in the first 2 groups received 2 g of TXA administered intravenously in 2 doses: the first dose was given preoperatively, and the second dose was given immediately postoperatively in the recovery room. The bipolar sealer was utilized as needed perioperatively according to the manufacturer’s instructions to address specific bleeding targets. The common sites and steps of a DA THA, in which bleeding typically occurs, are:
- The medial femoral circumflex artery during the approach to the capsule;
- The anterior hip capsule vessels prior to capsulotomy;
- The deep branch of the medial femoral circumflex artery and the nutrient vessels to the lesser trochanter encountered while exposing the medial neck and releasing the medial capsule;
- The posterior-superior retinacular arteries encountered after femoral neck osteotomy and removal of the femoral head along the posterior capsule; and
- The branch of the obturator artery encountered during exposure of the acetabular fovea.29-31
At the time of this study, the transfusion criteria included hemoglobin <8 g/dL in the presence of clinical symptoms.
Continue to: Primary outcome measures...
OUTCOME MEASURES AND DATA ANALYSIS
Primary outcome measures were transfusion requirements and estimated blood loss. Secondary outcome measures were postoperative decrease in hemoglobin, length of stay, and postoperative drain output. Demographic and operative data were compared between groups to ensure that there were no statistically significant differences in blood loss and transfusion requirements. All data were recorded in a password encrypted file and subsequently transferred to the REDCap system (Research Electronic Data Capture, Vanderbilt University).
STATISTICAL ANALYSIS
A priori sample size calculation was performed on the basis of a prior study 28, which evaluated surgical blood loss reduction utilizing a bipolar sealer. This study suggested a sample size of 20 per group to detect the minimal clinically important difference of 1.5 (standard deviation (SD) = 1.5, α = 0.05, β = 0.20). Additionally, a general estimate for detecting a 1-unit change on an ordinal scale of 136 (SD = 1.0, α = 0.05, β = 0.20) resulted in the same number. We conservatively chose to include at least 24 patients in each study arm in the event of greater true variance. The Wilcoxon rank-sum test was used for comparison of continuous data between groups. Differences between means were analyzed using 2-sided t tests. Comparison of categorical data was performed using Pearson’s chi-square or Fisher’s exact probability test as indicated. Ordinal ranking scores were compared using the Mantel-Haenszel test.
RESULTS
There were no statistically significant differences between groups with respect to sex, age, body mass index, or preoperative hemoglobin level (Table 1). Two patients in the TXA group and 10 patients in the control group were transfused (P = .02). In the TXA + bipolar sealer group, 1 patient was transfused (P = .02). A comparison of the transfusion rate between the TXA group and the TXA + bipolar sealer group yielded no significant difference (P = .99). The estimated blood loss was 310.3 mL ± 182.5 mL in the TXA group (P = .004), 292.9 mL ± 130.8 mL in the TXA + bipolar sealer group (P = .003), and 404.9 mL ± 201.2 mL in the control group (P = .71) (Table 2).
Table 2. Patient-Related Outcomes
| TXA Only (N = 63) | TXA + Bipolar Sealer (n = 49) | Control (n = 61) | P-value (TXA vs Control) | P-value (TXA + Sealer vs Control) | P-value (TXA + Sealer vs TXA) |
Patients Transfuseda | 2 (3.2%) | 1 (2.0%) | 10 (16.4%) | .02 | .02 | .99 |
Hemoglobin Drop (g/dL)b = preoperative Hb-lowest Hb | 3.5 ± 0.8 (1.8-6.3) | 3.5 ± 1.1 (1.7-6.0) | 4.3 ± 1.2 (2.0-7.5) | <.001 | <.001 | .60 |
Total Drain Output (mL)b | 326.3 ± 197.5 (15-1050) | 309.8 ± 196.3 (20-920) | 473.6 ± 199.7 (90-960) | <.001 | <.001 | .58 |
Calculated Blood Loss (mL)b = 1000 x total Hb loss/preoperative Hb | 1217.8 ± 335.8 (573.0-2514.4) | 1289.5 ± 382.4 (536.1-2418.2) | 1514.7 ± 467.9 (789.4-3451.1) | <.001 | .005 | .43 |
Estimated Blood Loss (mL)b | 310.3 ± 182.5 (100-1400) | 292.9 ± 130.8 (75-600) | 404.9 ± 201.2 (150-1000) | .004 | .003 | .71 |
Length of Stay (d)a | 2.2 ± 0.6 (1-4) | 2.2 ± 0.9 (1-5) | 2.6 ± 0.8 (1-5) | .004 | .03 | .78 |
aResult values are expressed as mean ± standard deviation (range). bResult values are expressed as number of cases (percentage of column header population).
Abbreviation: TXA, tranexamic acid.
The total drain output was 326.3 mL ± 197.5 mL in the TXA group (P < .001 for comparison with the control group), 309.8 mL ± 196.3 mL in the TXA + bipolar sealer group (P < .001 for comparison with the control group), and 473.6 mL ± 199.7 mL in the control group (P = .58). The decrease in hemoglobin was 3.5 g/dL ± 0.8 g/dL in the TXA group (P < .001), 3.5 g/dL ± 1.1 g/dL in the TXA + bipolar sealer group (P < .001), and 4.3 g/dL ± 1.2 g/dL in the control group (Table 2). The length of stay was 2.2 ± 0.6 days for the TXA group (P = .004) and 2.2 ± 0.9 days (P = .03) for the TXA + bipolar sealer group, and 2.6 ± 0.8 days in the control group (P = .78) (Table 2).
DISCUSSION
This study shows that the use of TXA alone provides a significant decrease in transfusion rates and estimated blood loss, a benefit which was not further increased with the addition of a bipolar sealer (Table 2). Many studies have demonstrated that TXA reduces blood loss and transfusion rates in patients undergoing THA and TKA.29 However, TXA’s acceptance as a more readily used hemostatic medication has been hindered by the theoretically increased risk of thromboembolism in susceptible, high-risk patients.32-35 In a 2012 meta-analysis conducted by Yang and colleagues,36 the use of TXA led to significantly less blood loss per patient and fewer transfusions without leading to an increased risk of thromboembolic events.
Continue to: Similarly, the bipolar sealer...
Similarly, the bipolar sealer has been shown to decrease transfusion rates and stabilize perioperative hemoglobin levels.25-27 In this recent prospective clinical trial evaluating the use of a bipolar sealer during DA THA, we observed decreased intraoperative blood loss and transfusion requirements in patients managed with a bipolar sealer.28 However, in a study conducted by Barsoum and colleagues37 evaluating the use of a bipolar sealer in THA with a posterior approach, there were no significant postoperative benefits in terms of blood loss, transfusion requirements, clinical evaluations, functionality, or health-related quality of life in patients managed with a bipolar sealer.
Although the results of our research are in line with those of previous publications, it is important to address 3 limitations within this study. First, only the control group in this study was enrolled prospectively; the remaining groups were reviewed retrospectively. Second, our adoption of TXA was recent; therefore, a confounding factor is that our surgeons had more experience in the anterior approach when using TXA. Third, the established transfusion threshold of <8 g/dl for this study led to more liberal use of transfusions. Since the conclusion of this study, we have adopted stricter transfusion criteria (hemoglobin <7.0 g/dL with clinical symptoms) which has led to even lower transfusion requirements.
CONCLUSION
In the reviewed patient population, TXA decreased blood loss and transfusion requirements following DA THA. However, the addition of a bipolar sealer did not provide an advantage. The results of this study do not support the routine use of a bipolar sealer in DA THA.
1. Sehat KR, Evans R, Newman JH. How much blood is really lost in total knee and hip arthroplasty? Knee. 2000;7(3):151-155.
2. Toy PT, Kaplan EB, McVay PA, Lee SJ, Strauss RG, Stehling LC. Blood loss and replacement in total hip arthroplasty: a multicenter study. The Preoperative Autologous Blood Donation Study Group. Transfusion. 1992;32(1):63-67.
3. Pierson JL, Hannon TJ, Earles DR. A blood-conservation algorithm to reduce blood transfusions after total hip and knee arthroplasty. J Bone Joint Surg Am. 2004;86-A(7):1512-1518.
4. Gill JB, Rosenstein A. The use of antifibrinolytic agents in total hip arthroplasty. J Arthroplasty. 2006;21(6):869-873.
5. Sukeik M, Alshryda S, Haddad FS, Mason JM. Systematic review and meta-analysis of the use of tranexamic acid in total hip replacement. J Bone Joint Surg Br. 2011;93(1):39-46. doi:10.1302/0301-620X.93B1.24984.
6. Rajesparan K, Biant LC, Ahmad M, Field RE. The effect of an intravenous bolus of tranexamic acid on blood loss in total hip replacement. J Bone Joint Surg Br. 2009;91(6):776-783. doi:10.1302/0301-620X.91B6.22393.
7. Hynes MC, Calder P, Rosenfeld P, Scott G. The use of tranexamic acid to reduce blood loss during total hip arthroplasty: an observational study. Ann R Coll Surg Engl. 2005;87(2):99-101. doi:10.1308/147870805X28118.
8. Earnshaw P. Blood conservation in orthopaedic surgery: the role of epoetin alfa. Int Orthop. 2001;25(5):273-278. doi:10.1007/s002640100261.
9. Kleinman S, Chan P, Robillard P. Risks associated with transfusion of cellular blood components in Canada. Transfus Med Rev. 2003;17(2):120-162. doi:10.1053/tmrv.2003.50009.
10. Lovell TP. Single-incision direct anterior approach for total hip arthroplasty using a standard operating table. J Arthroplast. 2008;23(7 Suppl):64-68. doi:10.1016/j.arth.2008.06.027.
11. Wojciechowski P, Kusz D, Kopeć K, Borowski M. Minimally invasive approaches in total hip arthroplasty. Ortop Traumatol Rehabil. 2007;9(1):1-7.
12. Rachbauer F, Krismer M. [Minimally invasive total hip arthroplasty via direct anterior approach]. Oper Orthop Traumatol. 2008;20(3):239-251. doi:10.1007/s00064-008-1306-y.
13. Johansson T, Pettersson LG, Lisander B. Tranexamic acid in total hip arthroplasty saves blood and money: a randomized, double-blind study in 100 patients. Acta Orthop. 2005;76(3):314-319.
14. Claeys MA, Vermeersch N, Haentjens P. Reduction of blood loss with tranexamic acid in primary total hip replacement surgery. Acta Chir Belg. 2007;107(4):397-401.
15. Ido K, Neo M, Asada Y, et al. Reduction of blood loss using tranexamic acid in total knee and hip arthroplasties. Arch Orthop Trauma Surg. 2000;120(9):518-520.
16. Benoni G, Fredin H, Knebel R, Nilsson P. Blood conservation with tranexamic acid in total hip arthroplasty: a randomized, double-blind study in 40 primary operations. Acta Orthop Scand. 2001;72(5):442-448. doi:10.1080/000164701753532754.
17. Ekbäck G, Axelsson K, Ryttberg L, et al. Tranexamic acid reduces blood loss in total hip replacement surgery. Anesth Analg. 2000;91(5):1124-1130.
18. Ralley FE, Berta D, Binns V, Howard J, Naudie DDR. One intraoperative dose of tranexamic acid for patients having primary hip or knee arthroplasty. Clin Orthop Relat Res. 2010;468(7):1905-1911. doi:10.1007/s11999-009-1217-8.
19. Eubanks JD. Antifibrinolytics in major orthopaedic surgery. J Am Acad Orthop Surg. 2010;18(3):132-138.
20. Astedt B. Clinical pharmacology of tranexamic acid. Scand J Gastroenterol Suppl. 1987;137:22-25.
21. Kirschbaum A, Kunz J, Steinfeldt T, Pehl A, Meyer C, Bartsch DK. Bipolar impedance-controlled sealing of the pulmonary artery with SealSafe G3 electric current: determination of bursting pressures in an ex vivo model. J Surg Res. 2014;192(2):611-615. doi:10.1016/j.jss.2014.07.014.
22. Romano F, Garancini M, Uggeri F, et al. Bleeding in hepatic surgery: sorting through methods to prevent it. HPB Surg. 2012;2012:169351. doi:10.1155/2012/169351.
23. Marulanda GA, Ulrich SD, Seyler TM, Delanois RE, Mont MA. Reductions in blood loss with a bipolar sealer in total hip arthroplasty. Expert Rev Med Devices. 2008;5(2):125-131. doi:10.1586/17434440.5.2.125.
24. Rosenberg AG. Reducing blood loss in total joint surgery with a saline-coupled bipolar sealing technology. J Arthroplast. 2007;22(4 Suppl 1):82-85. doi:10.1016/j.arth.2007.02.018.
25. Marulanda GA, Krebs VE, Bierbaum BE, et al. Haemostasis using a bipolar sealer in primary unilateral total knee arthroplasty. Am J Orthop. 2009;38(12):E179-E183.
26. Weeden SH, Schmidt RH, Isabell G. Haemostatic efficacy of a bipolar sealing device in minimally invasive total knee arthroplasty. J Bone Joint Surg Br Proceedings. 2009;91-B:45.
27. Gordon ZL, Son-Hing JP, Poe-Kochert C, Thompson GH. Bipolar sealer device reduces blood loss and transfusion requirements in posterior spinal fusion for adolescent idiopathic scoliosis. J Pediatr Orthop. 2013;33(7):700-706. doi:10.1097/BPO.0b013e31829d5721.
28. Suarez JC, Slotkin EM, Szubski CR, Barsoum WK, Patel PD. Prospective, randomized trial to evaluate efficacy of a bipolar sealer in direct anterior approach total hip arthroplasty. J Arthroplasty. 2015;30(11):1953-1958. doi:10.1016/j.arth.2015.05.023.
29. Gautier E, Ganz K, Krügel N, Gill T, Ganz R. Anatomy of the medial femoral circumflex artery and its surgical implications. J Bone Joint Surg. 2000;82(5):679-683. doi:10.1302/0301-620x.82b5.10426.
30. Trueta J, Harrison MHM. The normal vascular anatomy of the femoral head in adult man. J Bone Joint Surg Br. 1953;35-B(3):442-461.
31. Sevitt S, Thompson RG. The distribution and anastomoses of arteries supplying the
head and neck of the femur. J Bone Joint Surg Br. 1965;47-B:560-573. doi:10.1302/0301-620X.47B3.560.
32. Saleh A, Hebeish M, Farias-Kovac M, et al. Use of hemostatic agents in hip and knee arthroplasty. JBJS. 2014;2(1):1-12. doi:10.2106/JBJS.RVW.M.00061.
33. Howes JP, Sharma V, Cohen AT. Tranexamic acid reduces blood loss after knee arthroplasty. J Bone Joint Surg Br. 1996;78(6):995-996.
34. Karkouti K. Is tranexamic acid indicated for total knee replacement surgery? Anesth Analg. 2000;91(1):244-245.
35. Graham ID, Alvarez G, Tetroe J, McAuley L, Laupacis A. Factors influencing the adoption of blood alternatives to minimize allogeneic transfusion: the perspective of eight Ontario hospitals. Can J Surg. 2002;45(2):132-140.
36. Yang ZG, Chen WP, Wu LD. Effectiveness and safety of tranexamic acid in reducing blood loss in total knee arthroplasty: a meta-analysis. J Bone Joint Surg Am. 2012;94(13):1153-1159. doi:10.2106/JBJS.K.00873.
37. Barsoum WK, Klika AK, Murray TG, Higuera C, Lee HH, Krebs VE. Prospective randomized evaluation of the need for blood transfusion during primary total hip arthroplasty with use of a bipolar sealer. J Bone Joint Surg Am. 2011;93(6):513-518. doi:10.2106/JBJS.J.00036.
TAKE-HOME POINTS
- TXA reduces blood loss and transfusion requirements in THA.
- The bipolar sealer enhances surgical hemostasis by sealing vessels at the surgical site through radiofrequency ablation.
- The use of TXA, with and without the concomitant use of a bipolar sealer, decreases intraoperative blood loss and postoperative transfusion requirements.
- The addition of a bipolar sealer did not offer an advantage to transfusion requirements in anterior THA.
- TXA should be used routinely in THA.

Nonoperative Treatment of Closed Extra-Articular Distal Humeral Shaft Fractures in Adults: A Comparison of Functional Bracing and Above-Elbow Casting
ABSTRACT
Diaphyseal fractures of the distal humerus have a high rate of union when treated with a functional brace or an above-elbow cast (AEC). This study compares alignment of the humerus and motion of the elbow after functional brace or AEC treatment.
One-hundred and five consecutive patients with a closed, extra-articular fracture of the distal humeral diaphysis were identified in the orthopedic trauma databases of 3 hospitals between 2003 and 2012. Seventy-five patients with a follow-up of at least 6 months or with radiographic and clinical evidence of fracture union were included (51 treated with functional bracing and 24 treated with an AEC).
All of the fractures healed. The average arc of elbow flexion was 130° ± 9° in braced patients vs 127° ± 12° in casted patients. Four patients (8%) in the bracing group and 4 (17%) in the casting group lost >20° of elbow motion. The average varus angulation on radiographs was 17° ± 8° in braced and 13° ± 8° in casted patients, while the average posterior angulation was 9° ± 6° vs 7° ± 7°, respectively.
Closed extra-articular distal diaphyseal humerus fractures heal with both bracing and casting and there are no differences in average elbow motion or radiographic alignment.
Nonoperative treatment of closed fractures of the humeral shaft (AO/OTA [Arbeitsgemeinschaft für Osteosynthesefragen/Orthopaedic Trauma Association] type 12) with a functional brace or above-elbow cast (AEC) is associated with a high union rate, good motion, and good function. Advocates of casting believe that a brace cannot control fracture alignment as well as a cast that allows for immobilization and molding. Advocates of brace treatment are concerned that immobilization in a cast will cause elbow stiffness.1-11
Continue to: In our differing institutions...
In our differing institutions, there are advocates of each type of treatment, providing the opportunity for a comparison. This retrospective study compares brace and cast treatment. The working hypothesis was that there is no difference in elbow motion 6 months or more after fracture. We also compared radiographic alignment after union.
MATERIALS AND METHODS
Between 2003 and 2012, consecutive adult patients treated for a nonpathological fracture of the diaphysis of the distal humerus at the orthopedic trauma service of 3 level 1 academic trauma centers were identified from prospectively collected trauma injury databases. Patients with vascular injury, ipsilateral upper extremity fracture, and periprosthetic fractures were excluded. The attending orthopedic surgeon chose the treatment method and evaluated the range of motion (ROM) of the elbow and radiographic union at the final ambulatory visit. We included patients followed to clinical and radiographic union with a minimum of 6 months of follow-up. We also included patients with <6 months’ follow-up who demonstrated union and had elbow ROM within 10° of the uninjured arm.
We identified 105 consecutive adult patients with a closed nonpathological extra-articular distal humeral shaft fracture (fracture of the distal humeral shaft with an AO/OTA type-12.A, 12.B, or 12.C pattern) treated with an AEC or a brace in our databases.12 Two patients in the brace group chose surgery to improve alignment within 3 weeks of injury and were excluded from the analysis. Twenty-eight patients had inadequate follow-up.
A total of 75 patients were included in the study. At the first and second institutions, 51 patients were treated with functional bracing with an average follow-up of 7 months. At the third institution, 24 patients were treated with an AEC with an average follow-up of 4 months. Seventeen out of 24 patients in the long arm casting group and 19 out of 51 patients in the bracing group, who were included since they had <6 months of follow-up, demonstrated union and had elbow ROM within 10° of the uninjured arm. Differing methods of closed immobilization were the result of differing treatment algorithms at each institution.
The patients who were treated with a functional brace averaged 34 years of age (range, 18-90 years) and included 27 men and 24 women. The brace was removed at an average of 11.5 weeks (range, 8-18 weeks) after initial injury. Six patients had an injury-associated radial nerve palsy, all of which fully recovered within an average of 4 months (range, 0.5-7 months). Sixteen patients were injured due to a fall from standing height, 2 due to a fall from a greater height than standing, 16 in a motor-vehicle accident, 15 during a sport activity, and 2 were not specifically documented.
Continue to: Four patients had concomitant...
Four patients had concomitant injuries: one patient had a mid-shaft humeral fracture on the contralateral arm; a second had an ankle fracture; a third had an ankle fracture, acetabular fracture, a rib fracture, and pneumothorax; and the fourth had 2 rib fractures.
The patients who were treated with an AEC had an average age of 32 years (range,18-82 years) and included 14 men and 10 women. The cast was removed at an average of 4.2 weeks (range, 3-7 weeks) after the initial injury. Two patients had an injury-associated radial nerve palsy, both of which fully recovered. Five patients were injured due to a fall from standing height, 1 due to a fall from a height greater than standing, 7 during a motor-vehicle accident, 5 during a sport activity, and 6 were not documented. Two patients sustained concomitant injuries: one patient sustained a tibia-fibula fracture, and another patient sustained facial trauma.
The 2 groups were comparable in age and gender, as well as the injury mechanism (Table).
Table. Patient Demographics and Outcome Data
| Functional Bracing (n = 51) | Long Arm Casting (n = 24) | Significance (P < .05) |
Sex |
|
|
|
Male | 27 (54%) | 14 (58%) |
|
Female | 24 (46%) | 10 (42%) |
|
Average age (y) | 34 (range, 18-90) | 32 (range, 18-82) |
|
Mechanism of injury |
|
|
|
Standing height | 16 (31%) | 5 (20%) |
|
Greater height | 2 (4%) | 1 (4%) |
|
Motor vehicle collision | 16 (31%) | 7 (29%) |
|
Sports activity | 15 (29 %) | 5 (21%) |
|
Other | 2 (4%) | 6 (25%) |
|
Follow-up (months) | 7 (range, 2-25) | 4 (range, 2-15) |
|
Elbow range of motion (degrees) | 130 ± 9.4 | 127 ± 11.9 | P = .26 |
Varus/valgus angulation (degrees) | 17 ± 7.8 varus | 13 ± 8.4 varus | P = .11 |
Anterior/posterior angulation (degrees) | 9 ± 6.2 posterior | 7 ± 7.5 posterior | P = .54 |
FUNCTIONAL BRACING TECHNIQUE
Upon presentation after injury, patients were immobilized in a coaptation splint (Figure 1A). Within 10 days, the arm was placed in a pre-manufactured polyethylene functional brace (Corflex) and the arm was supported with a simple sling. Patients were allowed to use the hand for light tasks and move the elbow, but most patients were not capable of active elbow flexion exercises until early healing was established 4 to 6 weeks after injury. Shoulder motion was discouraged until radiographic union. Patients started active, self-assisted elbow and shoulder stretching exercises, and weaned from the brace once radiographic union was confirmed between 6 and 10 weeks after injury (Figures 1B, 1C). 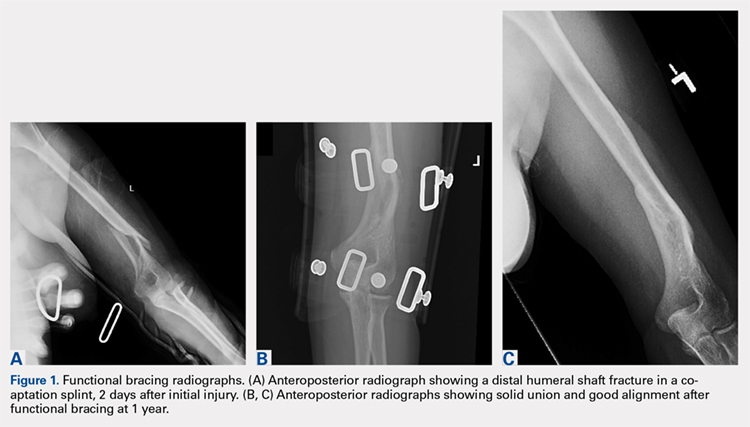
ABOVE-ELBOW CASE
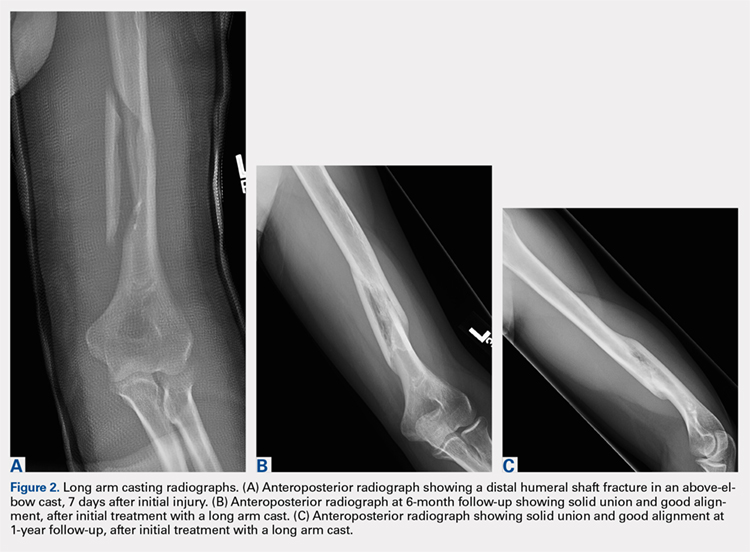
Patients were also initially immobilized in a coaptation splint upon initial presentation. Within 7 days, an above-elbow fiberglass cast with neutral forearm rotation and 90° of elbow flexion was applied with a supracondylar mold, followed by radiographic imaging (Figure 2A). With the fractured arm dependent, a valgus mold was applied as the material hardened in order to align the fracture site and limit varus angulation.
Continue to: There were no shoulder...
There were no shoulder ROM restrictions. Casts were removed, skin checked, and replaced every week for 4 to 6 weeks. Casts were removed when callus was noted on radiographs. After cast removal, physician-taught active and active-assisted elbow stretching exercises were given to patients to be performed on a daily basis at home. Patients were followed until clinical and radiographic union and elbow ROM to within 10° of the injured arm (Figures 2B, 2C).
STATISTICAL ANALYSIS
Alignment of the humerus (including varus-valgus alignment and apex anterior-posterior alignment) was measured on anteroposterior and lateral radiographs as the angle between lines bisecting the humeral diaphysis proximal and distal to the fracture. The normality of the data was tested using the Kolmogorov-Smirnov test. To statistically compare continuous variables with a normal distribution, t-tests were used; otherwise the Wilcoxon t-test was applied. The Pearson’s Chi-Square test was used to statistically compare dichotomous variables, except when expected cell frequency was <5, in which case the Fisher exact test was used. The level of significance was set at P < .05.
RESULTS
RANGE OF MOTION AND RADIOGRAPHIC ALIGNMENT
The average range of elbow motion was 130° ± 9° after brace treatment and 127° ± 12° after cast treatment (P = .26). Four patients (8%) treated with a brace and 3 (12%) treated with a cast lost >20° of elbow motion.
All the fractures healed. The average varus angulation on the anteroposterior radiograph was 17° (range, 2°-26°) in braced patients and 13 (range, 5°-31°) in casted patients (P = .11). The average posterior angulation on the lateral radiograph was 9° (range, 0°-28°) in braced patients vs 7° (range, 2°-33°) in casted patients (P = .54).
Continue to: Two weeks after initiating brace...
COMPLICATIONS
Two weeks after initiating brace treatment, an obese patient suffered a rash with desquamation that necessitated discontinuation of the brace. However, the skin and fracture ultimately healed with a coaptation splint and sling support without additional complications. In the casting cohort, 2 patients returned to the emergency department after AEC placement because of swelling of the hand and pain in the cast. Both casts were removed and reapplied.
DISCUSSION
Fractures of the distal third of the humeral diaphysis heal without surgery. Fracture angulation and elbow stiffness are the concerns that lead to variations in nonoperative treatment.1-3 Advocates of casting believe they can get better alignment without losing elbow motion, and advocates of bracing feel that the brace is less cumbersome.1-3,5-8 We compared these treatments retrospectively and found them comparable.
This study should be considered in light of its limitations. Many patients were lost to follow-up in our urban trauma centers. We do not know if these patients did better, worse, or the same as the patients we were able to evaluate, but our opinion is that patients having problems were more likely to return. The evaluation time was relatively short, but motion can only improve in the longer-term. Two patients that were initially braced chose surgery, probably because either they or their surgeon were nervous about the radiographic appearance of the fracture. In our opinion, continued nonoperative treatment of these patients would not affect the findings.
Cast treatment of distal diaphyseal humerus fractures does not cause permanent elbow stiffness. This is confirmed by our results; as casted patients did not lose final ROM compared to the bracing cohort. These injuries are extra-articular and casted patients are transitioned to bracing once humeri have significant union demonstrated by the arm moving as a unit. To our knowledge, there is no other study that has evaluated casting for these fractures, but it may be that evidence of permanent stiffness with nonoperative treatment of distal metaphyseal fractures of the humerus [AO/OTA type 13] is misapplied to distal humeral shaft fractures [AO/OTA type 12].3,9,10,12 For brace treatment, Sarmiento and colleagues9 showed no significant elbow stiffness in a consecutive cohort of 69 patients, while Jawa and colleagues5 showed no increased elbow stiffness compared to plate fixation. Given the accumulated data,3,5,6,8,13 advocates of operative treatment for distal third diaphyseal humerus fractures12 can no longer site elbow stiffness as a disadvantage of nonoperative treatment, whether with cast or brace.
As shown in this study, patients that choose nonoperative treatment can expect their fracture to heal with an average of approximately 15° of varus angulation, as well as 2 others evaluating brace treatment.5,9 Some will heal with as much as 30° of varus angulation.5,9 The arm may look a little different, particularly in thin patients, but there is no evidence that this angulation affects function. The risks, discomforts, and inconveniences of surgery can be balanced with the ability of surgery to improve alignment and allow elbow motion a few weeks earlier. The aesthetics of the scar after surgery may not be better than the deformity after nonoperative treatment. Patients should be involved in these decisions.
Continue to: No cost comparison...
No cost comparison was done between these 2 treatment modalities. However, both casting and bracing offer substantially lower costs comparted to surgical treatment with high efficacy and less risk for the patient. In some billing environments, closed treatments of fractures are captured as “surgical interventions” with global periods included in the reimbursement. Both casting and bracing are relatively inexpensive with materials that are readily accessible in nearly any general or subspecialty orthopedic practice.
There is a passive implication that operative treatment of distal third diaphyseal humerus fractures affords better results and union for patients in the discussed literature. Our results demonstrate that the distal diaphyseal humerus has a natural anatomic and biologic propensity to heal with closed immobilization. Patients should be made aware that while operative treatments exist for this fracture pattern, nonoperative treatment modalities have proven to be efficacious using a variety of immobilization methods. Thus, patients that prefer nonoperative treatment of a distal third diaphyseal humerus fracture can choose between a cast or a brace with confidence of the efficacy of the nonoperative treatment.
1. McKee MD. Fractures of the shaft of the humerus. In: Bucholz R, Heckman JD, Court-Brown C, eds. Rockwood and Green’s Fractures in Adults. 6th ed. Philadelphia: Lippencott Williams & Wilkins; 2006:1117-1159.
2. Schemitsch E, Bhandari M, Talbot M. Fractures of the humeral shaft. In: Browner BD, Jupiter JB, Levine AM, Trafton PG, Krettek C, eds. Skeletal Trauma. 4th ed. Philadelphia: Saunders-Elsevier Company; 2009:1593-1622.
3. Walker M, Palumbo B, Badman B, Brooks J, Van Gelderen J, Mighell M. Humeral shaft fractures: a review. J Shoulder Elbow Surg. 2011;20(5):833-844. doi:10.1016/j.jse.2010.11.030.
4. Balfour GW, Mooney V, Ashby ME. Diaphyseal fractures of the humerus treated with a ready-made fracture brace. J Bone Joint Surg Am. 1982;64(1):11-13. doi:10.2106/00004623-198264010-00002.
5. Jawa A, McCarty P, Doornberg J, Harris M, Ring D. Extra-articular distal-third diaphyseal fractures of the humerus. A comparison of functional bracing and plate fixation. J Bone Joint Surg Am. 2006;88(11):2343-2347. doi:10.2106/JBJS.F.00334.
6. Pehlivan O. Functional treatment of the distal third humeral shaft fractures. Arch Orthop Trauma Surg. 2002;122(7):390-395. doi:10.1007/s00402-002-0403-x.
7. Ring D, Chin K, Taghinia AH, Jupiter JB. Nonunion after functional brace treatment of diaphyseal humerus fractures. J Trauma. 2007;62(5):1157-1158. doi:10.1097/01.ta.0000222719.52619.2c.
8. Sarmiento A, Horowitch A, Aboulafia A, Vangsness CT Jr. Functional bracing for comminuted extra-articular fractures of the distal third of the humerus. J Bone Joint Surg Br. 1990;72(4):283-287.
9. Sarmiento A, Kinman PB, Galvin EG, Schmitt RH, Phillips JG. Functional bracing of fractures of the shaft of the humerus. J Bone Joint Surg Am. 1977;59(5):596-601.
10. Toivanen JA, Nieminen J, Laine HJ, Honkonen SE, Jarvinen MJ. Functional treatment of closed humeral shaft fractures. Int Orthop. 2005;29(1):10-13. doi:10.1007/s00264-004-0612-8.
11. Wallny T, Westermann K, Sagebiel C, Reimer M, Wagner UA. Functional treatment of humeral shaft fractures: indications and results. J Orthop Trauma. 1997;11(4):283-287.
12. Marsh JL, Slongo TF, Agel J, et al. Fracture and dislocation classification compendium - 2007: Orthopaedic Trauma Association classification, database and outcomes committee. J Orthop Trauma. 2007;21(10 Suppl):S1-S133.
13. Paris H, Tropiano P, Clouet D'orval B, Chaudet H, Poitout DG. Fractures of the shaft of the humerus: systematic plate fixation. Anatomic and functional results in 156 cases and a review of the literature. Rev Chir Orthop Reparatrice Appar Mot. 2000;86(4):346-359.
ABSTRACT
Diaphyseal fractures of the distal humerus have a high rate of union when treated with a functional brace or an above-elbow cast (AEC). This study compares alignment of the humerus and motion of the elbow after functional brace or AEC treatment.
One-hundred and five consecutive patients with a closed, extra-articular fracture of the distal humeral diaphysis were identified in the orthopedic trauma databases of 3 hospitals between 2003 and 2012. Seventy-five patients with a follow-up of at least 6 months or with radiographic and clinical evidence of fracture union were included (51 treated with functional bracing and 24 treated with an AEC).
All of the fractures healed. The average arc of elbow flexion was 130° ± 9° in braced patients vs 127° ± 12° in casted patients. Four patients (8%) in the bracing group and 4 (17%) in the casting group lost >20° of elbow motion. The average varus angulation on radiographs was 17° ± 8° in braced and 13° ± 8° in casted patients, while the average posterior angulation was 9° ± 6° vs 7° ± 7°, respectively.
Closed extra-articular distal diaphyseal humerus fractures heal with both bracing and casting and there are no differences in average elbow motion or radiographic alignment.
Nonoperative treatment of closed fractures of the humeral shaft (AO/OTA [Arbeitsgemeinschaft für Osteosynthesefragen/Orthopaedic Trauma Association] type 12) with a functional brace or above-elbow cast (AEC) is associated with a high union rate, good motion, and good function. Advocates of casting believe that a brace cannot control fracture alignment as well as a cast that allows for immobilization and molding. Advocates of brace treatment are concerned that immobilization in a cast will cause elbow stiffness.1-11
Continue to: In our differing institutions...
In our differing institutions, there are advocates of each type of treatment, providing the opportunity for a comparison. This retrospective study compares brace and cast treatment. The working hypothesis was that there is no difference in elbow motion 6 months or more after fracture. We also compared radiographic alignment after union.
MATERIALS AND METHODS
Between 2003 and 2012, consecutive adult patients treated for a nonpathological fracture of the diaphysis of the distal humerus at the orthopedic trauma service of 3 level 1 academic trauma centers were identified from prospectively collected trauma injury databases. Patients with vascular injury, ipsilateral upper extremity fracture, and periprosthetic fractures were excluded. The attending orthopedic surgeon chose the treatment method and evaluated the range of motion (ROM) of the elbow and radiographic union at the final ambulatory visit. We included patients followed to clinical and radiographic union with a minimum of 6 months of follow-up. We also included patients with <6 months’ follow-up who demonstrated union and had elbow ROM within 10° of the uninjured arm.
We identified 105 consecutive adult patients with a closed nonpathological extra-articular distal humeral shaft fracture (fracture of the distal humeral shaft with an AO/OTA type-12.A, 12.B, or 12.C pattern) treated with an AEC or a brace in our databases.12 Two patients in the brace group chose surgery to improve alignment within 3 weeks of injury and were excluded from the analysis. Twenty-eight patients had inadequate follow-up.
A total of 75 patients were included in the study. At the first and second institutions, 51 patients were treated with functional bracing with an average follow-up of 7 months. At the third institution, 24 patients were treated with an AEC with an average follow-up of 4 months. Seventeen out of 24 patients in the long arm casting group and 19 out of 51 patients in the bracing group, who were included since they had <6 months of follow-up, demonstrated union and had elbow ROM within 10° of the uninjured arm. Differing methods of closed immobilization were the result of differing treatment algorithms at each institution.
The patients who were treated with a functional brace averaged 34 years of age (range, 18-90 years) and included 27 men and 24 women. The brace was removed at an average of 11.5 weeks (range, 8-18 weeks) after initial injury. Six patients had an injury-associated radial nerve palsy, all of which fully recovered within an average of 4 months (range, 0.5-7 months). Sixteen patients were injured due to a fall from standing height, 2 due to a fall from a greater height than standing, 16 in a motor-vehicle accident, 15 during a sport activity, and 2 were not specifically documented.
Continue to: Four patients had concomitant...
Four patients had concomitant injuries: one patient had a mid-shaft humeral fracture on the contralateral arm; a second had an ankle fracture; a third had an ankle fracture, acetabular fracture, a rib fracture, and pneumothorax; and the fourth had 2 rib fractures.
The patients who were treated with an AEC had an average age of 32 years (range,18-82 years) and included 14 men and 10 women. The cast was removed at an average of 4.2 weeks (range, 3-7 weeks) after the initial injury. Two patients had an injury-associated radial nerve palsy, both of which fully recovered. Five patients were injured due to a fall from standing height, 1 due to a fall from a height greater than standing, 7 during a motor-vehicle accident, 5 during a sport activity, and 6 were not documented. Two patients sustained concomitant injuries: one patient sustained a tibia-fibula fracture, and another patient sustained facial trauma.
The 2 groups were comparable in age and gender, as well as the injury mechanism (Table).
Table. Patient Demographics and Outcome Data
| Functional Bracing (n = 51) | Long Arm Casting (n = 24) | Significance (P < .05) |
Sex |
|
|
|
Male | 27 (54%) | 14 (58%) |
|
Female | 24 (46%) | 10 (42%) |
|
Average age (y) | 34 (range, 18-90) | 32 (range, 18-82) |
|
Mechanism of injury |
|
|
|
Standing height | 16 (31%) | 5 (20%) |
|
Greater height | 2 (4%) | 1 (4%) |
|
Motor vehicle collision | 16 (31%) | 7 (29%) |
|
Sports activity | 15 (29 %) | 5 (21%) |
|
Other | 2 (4%) | 6 (25%) |
|
Follow-up (months) | 7 (range, 2-25) | 4 (range, 2-15) |
|
Elbow range of motion (degrees) | 130 ± 9.4 | 127 ± 11.9 | P = .26 |
Varus/valgus angulation (degrees) | 17 ± 7.8 varus | 13 ± 8.4 varus | P = .11 |
Anterior/posterior angulation (degrees) | 9 ± 6.2 posterior | 7 ± 7.5 posterior | P = .54 |
FUNCTIONAL BRACING TECHNIQUE
Upon presentation after injury, patients were immobilized in a coaptation splint (Figure 1A). Within 10 days, the arm was placed in a pre-manufactured polyethylene functional brace (Corflex) and the arm was supported with a simple sling. Patients were allowed to use the hand for light tasks and move the elbow, but most patients were not capable of active elbow flexion exercises until early healing was established 4 to 6 weeks after injury. Shoulder motion was discouraged until radiographic union. Patients started active, self-assisted elbow and shoulder stretching exercises, and weaned from the brace once radiographic union was confirmed between 6 and 10 weeks after injury (Figures 1B, 1C).
ABOVE-ELBOW CASE
Patients were also initially immobilized in a coaptation splint upon initial presentation. Within 7 days, an above-elbow fiberglass cast with neutral forearm rotation and 90° of elbow flexion was applied with a supracondylar mold, followed by radiographic imaging (Figure 2A). With the fractured arm dependent, a valgus mold was applied as the material hardened in order to align the fracture site and limit varus angulation.
Continue to: There were no shoulder...
There were no shoulder ROM restrictions. Casts were removed, skin checked, and replaced every week for 4 to 6 weeks. Casts were removed when callus was noted on radiographs. After cast removal, physician-taught active and active-assisted elbow stretching exercises were given to patients to be performed on a daily basis at home. Patients were followed until clinical and radiographic union and elbow ROM to within 10° of the injured arm (Figures 2B, 2C).
STATISTICAL ANALYSIS
Alignment of the humerus (including varus-valgus alignment and apex anterior-posterior alignment) was measured on anteroposterior and lateral radiographs as the angle between lines bisecting the humeral diaphysis proximal and distal to the fracture. The normality of the data was tested using the Kolmogorov-Smirnov test. To statistically compare continuous variables with a normal distribution, t-tests were used; otherwise the Wilcoxon t-test was applied. The Pearson’s Chi-Square test was used to statistically compare dichotomous variables, except when expected cell frequency was <5, in which case the Fisher exact test was used. The level of significance was set at P < .05.
RESULTS
RANGE OF MOTION AND RADIOGRAPHIC ALIGNMENT
The average range of elbow motion was 130° ± 9° after brace treatment and 127° ± 12° after cast treatment (P = .26). Four patients (8%) treated with a brace and 3 (12%) treated with a cast lost >20° of elbow motion.
All the fractures healed. The average varus angulation on the anteroposterior radiograph was 17° (range, 2°-26°) in braced patients and 13 (range, 5°-31°) in casted patients (P = .11). The average posterior angulation on the lateral radiograph was 9° (range, 0°-28°) in braced patients vs 7° (range, 2°-33°) in casted patients (P = .54).
Continue to: Two weeks after initiating brace...
COMPLICATIONS
Two weeks after initiating brace treatment, an obese patient suffered a rash with desquamation that necessitated discontinuation of the brace. However, the skin and fracture ultimately healed with a coaptation splint and sling support without additional complications. In the casting cohort, 2 patients returned to the emergency department after AEC placement because of swelling of the hand and pain in the cast. Both casts were removed and reapplied.
DISCUSSION
Fractures of the distal third of the humeral diaphysis heal without surgery. Fracture angulation and elbow stiffness are the concerns that lead to variations in nonoperative treatment.1-3 Advocates of casting believe they can get better alignment without losing elbow motion, and advocates of bracing feel that the brace is less cumbersome.1-3,5-8 We compared these treatments retrospectively and found them comparable.
This study should be considered in light of its limitations. Many patients were lost to follow-up in our urban trauma centers. We do not know if these patients did better, worse, or the same as the patients we were able to evaluate, but our opinion is that patients having problems were more likely to return. The evaluation time was relatively short, but motion can only improve in the longer-term. Two patients that were initially braced chose surgery, probably because either they or their surgeon were nervous about the radiographic appearance of the fracture. In our opinion, continued nonoperative treatment of these patients would not affect the findings.
Cast treatment of distal diaphyseal humerus fractures does not cause permanent elbow stiffness. This is confirmed by our results; as casted patients did not lose final ROM compared to the bracing cohort. These injuries are extra-articular and casted patients are transitioned to bracing once humeri have significant union demonstrated by the arm moving as a unit. To our knowledge, there is no other study that has evaluated casting for these fractures, but it may be that evidence of permanent stiffness with nonoperative treatment of distal metaphyseal fractures of the humerus [AO/OTA type 13] is misapplied to distal humeral shaft fractures [AO/OTA type 12].3,9,10,12 For brace treatment, Sarmiento and colleagues9 showed no significant elbow stiffness in a consecutive cohort of 69 patients, while Jawa and colleagues5 showed no increased elbow stiffness compared to plate fixation. Given the accumulated data,3,5,6,8,13 advocates of operative treatment for distal third diaphyseal humerus fractures12 can no longer site elbow stiffness as a disadvantage of nonoperative treatment, whether with cast or brace.
As shown in this study, patients that choose nonoperative treatment can expect their fracture to heal with an average of approximately 15° of varus angulation, as well as 2 others evaluating brace treatment.5,9 Some will heal with as much as 30° of varus angulation.5,9 The arm may look a little different, particularly in thin patients, but there is no evidence that this angulation affects function. The risks, discomforts, and inconveniences of surgery can be balanced with the ability of surgery to improve alignment and allow elbow motion a few weeks earlier. The aesthetics of the scar after surgery may not be better than the deformity after nonoperative treatment. Patients should be involved in these decisions.
Continue to: No cost comparison...
No cost comparison was done between these 2 treatment modalities. However, both casting and bracing offer substantially lower costs comparted to surgical treatment with high efficacy and less risk for the patient. In some billing environments, closed treatments of fractures are captured as “surgical interventions” with global periods included in the reimbursement. Both casting and bracing are relatively inexpensive with materials that are readily accessible in nearly any general or subspecialty orthopedic practice.
There is a passive implication that operative treatment of distal third diaphyseal humerus fractures affords better results and union for patients in the discussed literature. Our results demonstrate that the distal diaphyseal humerus has a natural anatomic and biologic propensity to heal with closed immobilization. Patients should be made aware that while operative treatments exist for this fracture pattern, nonoperative treatment modalities have proven to be efficacious using a variety of immobilization methods. Thus, patients that prefer nonoperative treatment of a distal third diaphyseal humerus fracture can choose between a cast or a brace with confidence of the efficacy of the nonoperative treatment.
1. McKee MD. Fractures of the shaft of the humerus. In: Bucholz R, Heckman JD, Court-Brown C, eds. Rockwood and Green’s Fractures in Adults. 6th ed. Philadelphia: Lippencott Williams & Wilkins; 2006:1117-1159.
2. Schemitsch E, Bhandari M, Talbot M. Fractures of the humeral shaft. In: Browner BD, Jupiter JB, Levine AM, Trafton PG, Krettek C, eds. Skeletal Trauma. 4th ed. Philadelphia: Saunders-Elsevier Company; 2009:1593-1622.
3. Walker M, Palumbo B, Badman B, Brooks J, Van Gelderen J, Mighell M. Humeral shaft fractures: a review. J Shoulder Elbow Surg. 2011;20(5):833-844. doi:10.1016/j.jse.2010.11.030.
4. Balfour GW, Mooney V, Ashby ME. Diaphyseal fractures of the humerus treated with a ready-made fracture brace. J Bone Joint Surg Am. 1982;64(1):11-13. doi:10.2106/00004623-198264010-00002.
5. Jawa A, McCarty P, Doornberg J, Harris M, Ring D. Extra-articular distal-third diaphyseal fractures of the humerus. A comparison of functional bracing and plate fixation. J Bone Joint Surg Am. 2006;88(11):2343-2347. doi:10.2106/JBJS.F.00334.
6. Pehlivan O. Functional treatment of the distal third humeral shaft fractures. Arch Orthop Trauma Surg. 2002;122(7):390-395. doi:10.1007/s00402-002-0403-x.
7. Ring D, Chin K, Taghinia AH, Jupiter JB. Nonunion after functional brace treatment of diaphyseal humerus fractures. J Trauma. 2007;62(5):1157-1158. doi:10.1097/01.ta.0000222719.52619.2c.
8. Sarmiento A, Horowitch A, Aboulafia A, Vangsness CT Jr. Functional bracing for comminuted extra-articular fractures of the distal third of the humerus. J Bone Joint Surg Br. 1990;72(4):283-287.
9. Sarmiento A, Kinman PB, Galvin EG, Schmitt RH, Phillips JG. Functional bracing of fractures of the shaft of the humerus. J Bone Joint Surg Am. 1977;59(5):596-601.
10. Toivanen JA, Nieminen J, Laine HJ, Honkonen SE, Jarvinen MJ. Functional treatment of closed humeral shaft fractures. Int Orthop. 2005;29(1):10-13. doi:10.1007/s00264-004-0612-8.
11. Wallny T, Westermann K, Sagebiel C, Reimer M, Wagner UA. Functional treatment of humeral shaft fractures: indications and results. J Orthop Trauma. 1997;11(4):283-287.
12. Marsh JL, Slongo TF, Agel J, et al. Fracture and dislocation classification compendium - 2007: Orthopaedic Trauma Association classification, database and outcomes committee. J Orthop Trauma. 2007;21(10 Suppl):S1-S133.
13. Paris H, Tropiano P, Clouet D'orval B, Chaudet H, Poitout DG. Fractures of the shaft of the humerus: systematic plate fixation. Anatomic and functional results in 156 cases and a review of the literature. Rev Chir Orthop Reparatrice Appar Mot. 2000;86(4):346-359.
TAKE-HOME POINTS
- Closed extra-articular distal diaphyseal humerus fractures heal predictably with both bracing and casting.
- There are no differences in average elbow motion between bracing and casting of these fractures.
- There are no differences in radiographic alignment between bracing and casting of these fractures.
- The distal diaphyseal humerus has a natural anatomic and biologic propensity to heal with closed immobilization.
- Patients preferring nonoperative treatment can choose between a cast or a brace with confidence of the efficacy of either treatment.
The Effect of Immunonutrition on Veterans Undergoing Major Surgery for Gastrointestinal Cancer (FULL)
Immunonutrition involves the use of omega-3 fatty acids, glutamine, arginine, and/or nucleotides individually or in combination at therapeutic levels to specifically modulate the immune system against altering inflammatory and metabolic pathways.1 Current literature supports the routine use of immune-enhancing formulas (containing both arginine and fish oil) in surgical patients.2-4 Although most of the literature favors the use of immunonutrition in surgical patients, some studies reported no benefit over standard oral nutrition supplementation.5
Background
Most studies evaluating the effect of immunonutrition for those undergoing elective surgery have been conducted in surgical oncology patients.6-12 Advanced cancers and older age can lead to cancer cachexia and sarcopenia, respectively. These conditions increase a patient’s surgical morbidity and mortality risk likely because of the negative effects on lean body mass, nutrient intake, and inflammatory and metabolic profile.13 However, early detection of some cancers through routine screening might lead to earlier surgical intervention that minimizes these negative tumor effects on the patient. Immunonutrition provided to well-nourished and malnourished patients has shown benefits, which supports the premise that a combination of immunonutrients included in immune-enhancing diets might have a beneficial pharmacotherapeutic effect beyond that of providing energy, protein, vitamins, and minerals for nutritional support.7,14
There are a lack of data regarding whether there is a window of opportunity for improved outcomes. Is the greatest need for immunonutrients during the peak of the injury, which might be immediately after surgery, or is it before the procedure? Arginine is a conditionally essential amino acid that has been shown to have a beneficial effect on the immune system by enhancing T-lymphocyte response when supplemented in surgical patients. When the arginase 1 (ARG 1) enzyme in myeloid cells is expressed during the inflammatory response to injury, accelerated use of arginine can deplete endogenous arginine, making it conditionally essential.
If adequate arginine cannot be synthesized or an exogenous source is not provided, T-cell dysfunction and decreased nitric oxide production leads to immune and vascular dysfunction, respectively.15,16 Providing arginine and omega-3 fatty acids might have a synergistic effect by shifting to an anti-inflammatory prostaglandin profile that has been shown to decrease ARG 1 expression while providing an exogenous source of arginine.17 Postsurgical inflammation might be caused in part by pro-inflammatory mediators and the anti-inflammatory properties of omega-3 fatty acids might offset this if cell membranes are loaded preoperatively.18 Therefore, preoperative immunonutrition might allow tissues to recover from planned surgical trauma. Bouwens and colleagues demonstrated that intake of eicosapentaenoic acid/docosahexaenoic acid over 26 weeks can alter the gene expression profiles of immune cells to a more anti-inflammatory status.19 However, Senkal and colleagues recommended that 3 to 7 days preoperatively is adequate to positively alter the lipid profile of tissues.20
Oncology patients preparing for surgery often are exposed to the physiologic stress of radiation and chemotherapy as neoadjuvant treatment to surgery. Oncology treatment and the adverse nutritional effects of treatment increase risk for arginine deficiency, such as poor nutrition intake, increased requirements, decreased production. Braga and colleagues demonstrated improved gut microprofusion and gut oxygenation intraoperatively, an effect that continued for up to 5 days after surgery.21 Waitzberg conducted a systematic review of randomized clinical trials evaluating immunonutrition in preoperative, postoperative, and perioperative periods. The results showed that the greatest improvements in postoperative infections and length of stay occurred in patients receiving preoperative 0.5 to 1 L/d of an immune nutrition product containing supplemental omega-3 fatty acids, arginine, and nucleotides for 5 to 7 days.22
It is unclear which population of surgical patients benefit the most from immunonutrition. Some results in the literature favor use in malnourished patients.18,23 However, other studies also have found benefit in well-nourished patients.7,14,21
Veterans who seek medical care at the Department of Veteran Affairs (VA) have higher rates of cancer, obesity, and diabetes mellitus, which complicate surgical outcomes.24 In addition to comorbidities, veterans who seek medical care at the VA are more likely to have been deployed overseas and have more physical and mental health disorders compared with that of nonveteran patients or veterans who do not use the VA. Because of higher comorbidities, unique deployment history, and mental health disorders, all of which may impact quality of life concerns, veterans are clinically more complex, which makes comparisons with the private sector difficult. The VA has the advantage of providing comprehensive care to veterans in all settings, including preparation for surgery and postsurgical follow-up with an interdisciplinary team.
The objective of this study was to compare surgical outcomes in veterans who receive preoperative supplementation using an immune-modulating formula with veterans who received a standard oral supplement. Although practice guidelines have been developed from studies in US nonveteran populations, there are no high- quality randomized studies of veterans.
This study design also would allow the VA to gauge cost-effectiveness of immunonutrition before implementing new protocols. There is convincing data supporting significant economic benefit; however, more cost-benefit studies are needed to fully assess.18,25-27 Immunonutrition products are more expensive than are standard nutrition supplements, but overall cost of care when immunonutrition products are used could be lower because of reduction of complications and hospital resources.
Methods
From November 2011 to January 2016, the authors conducted a single-center, prospective, randomized parallel-group study in veterans undergoing elective gastrointestinal oncologic surgery. Inclusion criteria included planned esophageal, gastric, pancreatic, colorectal, or liver resections in veterans with histologically documented neoplasm of the gastrointestinal tract. Patients were excluded if they were admitted to the intensive care unit (ICU) before surgery, were receiving steroids or other immunosuppressive medications, had a recent hospital admission for pulmonary, cardiac, or renal disease, or were exhibiting signs or symptoms of infection or sepsis, including elevated white blood cells (WBC) > 10,000/mL or a temperature > 37.7° C.
The study was approved by the research and development committee and the institutional review board at James A. Haley Veterans’ Hospital (JAHVH) in Tampa, Florida. The clinicaltrials.gov identifier for the study was NCT01471743.
Nutrition Formula
Subjects were randomized into 2 oral supplement groups: immunonutrition group (ING) patients received immunonutrition, and standard nutrition group (SNG) received a standard formula (Table 1). 
Study Procedures
All veterans with planned gastrointestinal surgeries were evaluated in the JAHVH general surgery clinic. Veterans meeting the inclusion criteria were invited to participate in the study, and informed consent was obtained. A research randomizer program assigned subjects to the groups to reach equal 1:1 randomization. Enrolled participants were provided their randomized supplement (unblinded) in the general surgery clinic and instructed on the amount of supplement to consume and date to begin taking the supplement. Participants were instructed to continue with their normal diet in addition to the supplement. No additional nutrition education was provided. Participants were asked to keep track of their daily supplement intake. Patients in both groups also used preoperative bowel preparations when indicated.
At the time of enrollment, presurgical comorbidities, anthropometric data, and nutrition status parameters were obtained. Postoperatively, study personnel interviewed each patient about formula consumption and tolerance. Thirty days postoperatively, patient demographics, surgical characteristics (eg, surgery, operative time, blood loss), nutrition risk screening (NRS 2002) score, diet/enteral orders, days spent NPO, days in the hospital or in the ICU, and complications (eg, wound infection, abscess, sepsis, pneumonia, urinary tract infection, intestinal fistula, ileus, or anastomotic leakage) were collected from the electronic health record.
Statistical Analysis
The primary outcome measure was overall postoperative complication rate and postoperative infection rate. Based on reviews of similar studies available at the time of protocol development, it was assumed that a postoperative infection rate of 38% in the SNG and 15% in the ING would indicate treatment efficacy. A sample size of 54 patients in each group would provide a Type I error level α = .05 and a power of 80%. A total of 108 patients enrolled in the study. Chi-square analysis was used to determine this primary outcome measure.
Secondary outcomes (mean number of complications, hospital days, NPO (nothing by mouth) days, and ICU days) were evaluated with Mann Whitney U test because of violation of assumptions for the t test. All P values were 2-tailed and statistical significance was accepted at P < .05 with clinical significance accepted at P < .10. Analysis for intention to treat (ITT) and per protocol are provided for outcome measures. For the ITT analysis, multiple imputation (last observation carried forward) was used. Sensitivity analysis found that the data were missing at random. SPSS software version 21.0 (Chicago, IL) was used for statistical analysis.
Results
During the study period, 137 patients were assessed for eligibility (Figure). 
The sample was predominately white and male, which is consistent with the veteran population. There were no statistical differences for baseline patient or surgical characteristics between the groups (Table 2). 
There was a significant difference (P = .09) in the surgical procedures completed. There was only 1 pancreatic surgery completed in the ING and 9 pancreatic surgeries completed in the SNG.
Primary Outcomes
The overall rate of complications differed between the groups (Table 3). 
Given the large number of colorectal procedures, a separate per-protocol analysis included 37 patients from ING and 36 patients in the SNG (Table 4). 
Secondary Outcomes
The ITT analysis found that overall number of hospital days was slightly higher in the ING compared with that of the SNG, 9.4 vs 9.3 days, respectively. In the per-protocol analysis there were 1.3 fewer hospital days for those who received immunonutrition (P = .059). No significant differences were found between the groups in the number of days spent in the ICU or number of days NPO (Table 3). Death within 30 days postoperative was twice as high for those in the SNG vs ING, with no deaths in the per-protocol analysis for those in the ING.
The colorectal analysis found 8.5 hospital days for ING patients vs 10.0 days for SNG patients, (P = .08). There were no deaths in the ING and 1 death in the SNG for colorectal procedure patients.
Discussion
Surgery is traumatic to healthy patients with or without cancer. Patients with cancer who receive surgical intervention might be at an even higher risk for complications because of altered metabolic pathways, nutritional deficiencies, and depressed immune function.13 Meta-analyses of immunonutrition studies conducted over the past 2 decades have come to different conclusions regarding the benefit of immunonutrition in the elective gastrointestinal cancer surgery population.3,5,18 Although practice guidelines from the American Society of Parenteral and Enteral Nutrition and the European Society of Parenteral and Enteral Nutrition recommend routine use of immune-modulating formulas in surgical oncology patients, there is still some debate about the optimal timing, dose, individual formula constituents, and populations that will benefit.2,25 Earlier studies evaluating the economics of immunonutrition have shown significant cost savings related to reduction in length of stay and decrease in infectious complications even after accounting for the extra cost of the formula.26,27 More recent economic analyses confirmed these cost savings showing a savings of about $1,000 to $2,500 per patient with higher savings when immunonutrition was given preoperatively.28,29
For practitioners treating veterans with cancer, good stewardship of federal dollars and optimal outcomes are important considerations before implementing new therapies. Therefore, JAHVH set out to evaluate whether standard oral nutrition supplementation would be as effective as the higher cost immunonutrition supplementation in cancer patients receiving elective surgical procedures.
Rates of Complications
In this study, favorable effects of immunonutrition were found on total postoperative complications and number of hospital days. The total number of patients who experienced complications was 39% lower in the ING than it was in SNG in the ITT analysis and 37% lower in the colorectal per-protocol analysis. These rates are similar to the 48% lower rate Braga and colleagues found in their study in patients with colorectal cancer who received 5 days of preoperative immunonutrition.21 Because more than half of the patients in this study had colorectal cancer, the group is comparable to the Braga and colleagues study population. The overall supplement adherence rate was 86%, which was slightly lower than the 90% adherence rate that Braga and colleagues found. Lower consumption rates might have been a factor in not achieving a greater therapeutic benefit for infectious complications. Some studies suggest a therapeutic goal intake of greater than two-thirds of the prescribed amount.10,30 In the present study, 70.4% of the ING and 83% of the SNG met that recommended therapeutic goal, which is more than Hübner colleagues reported in their study (53% of the ING and 60% in the SNG meeting therapeutic intake goal).
Okamoto and colleagues also reported a much lower complication rate in gastric cancer patients who received immunonutrition (13.3%) compared with that of those receiving an isoenergetic formula (40%).11 The group receiving immunonutrition in the Okamoto and colleagues study had 4 times fewer infectious complications than did the standard group (P = .039), and a contributing reason might be that they supplemented for 7 days preoperatively. Similar to the current study’s results, Giger-Pabst and colleagues and Hübner and colleagues did not find any significant difference in infectious complications.10,30 Important notes of comparison include a low adherence rate in the study conducted by Hübner and colleagues and the lower dose of immunonutrition used by Giger-Pabst andcolleagues who used 3 days of preoperative supplementation, which may not be long enough to promote the tissue benefits of immunonutrition.
Although, the current study did not find any statistically significant difference in infectious complications, the SNG experienced 1.8 times more infections than did the ING, which indicates that immunonutrition support may be clinically beneficial. Based on previous literature and the results of this study, the authors speculate that at least 5 days of intake of the study immunonutrition formula could positively affect outcomes.
The authors suspect that the added arginine and fish oil in the immunonutrition product act synergistically as therapeutic ingredients to shift toward a preoperative anti-inflammatory prostaglandin environment while providing exogenous arginine to possibly prevent or correct a conditionally essential need for arginine that would promote adequate nitric oxide production. Another crucial factor is that the a priori power analysis was looking at a 38% complication rate in the SNG and only 15% complication rate in the ING, which generated a sample size of 108 participants. The post hoc power analysis indicates that this study is underpowered based on the complication rates, which could be a reason for insignificant infectious complications.
The benefits of immunonutrients are still being studied. Future studies in a controlled surgical setting could determine whether immunonutrition has a clinical outcome effect on operative time and surgical blood loss. A challenge for the investigators was to decide whether the difference in operative time and blood loss was a surgical characteristic or a clinical outcome. The positive impact of immunonutrients on tissue perfusion and cell integrity have been shown in other studies to reduce tissue inflammation and alter gene expression, which could affect how tissues respond to surgical insults.10,11 Because JAHVH is a teaching institution and multiple surgeons are involved with the patients, this question will continue to be unresolved. Future research may want to consider controlling for variability in surgical technique and perioperative protocols to evaluate this as a clinical outcome.
Limitations
Several limitations of this trial need to be addressed. Although the design of the study was a randomized controlled trial, it was an unblinded, single-center study with a small sample size. Surgeons were not aware of which supplement each subject had received; however, researchers took no measures to ensure the surgeons were blinded. To minimize bias, 2 investigators evaluated the records for complication rates to confirm consistency, and any discrepancies were resolved by a third investigator. Although adherence was evaluated, it was patient-reported, and lab testing was not conducted to ensure that tissues were loaded with therapeutic amounts of immunonutrients or to determine baseline levels of nutrient intake, which could show a nutrient response curve.
The use of other nutritional supplements, such as vitamins, probiotics, or additional fatty acids were not monitored, and the study formulas differed in protein and fiber content, which could have impacted the overall nutrient intake and affected the primary outcomes. Another limitation includes the variety of surgeons used over the period of the study. At a teaching institution, it is not feasible to limit the number of surgeons performing surgery.
Additionally, the study period was 5 years, and there have been changes in fasting times, medications, and bowel preparation over the course of that period, which could not be accounted for. Postoperative immunonutrition was not provided in this study based on the limited evidence available when the protocol was initiated. However, since that time, evidence supports and encourages postoperative therapy and might have proven beneficial to the patients. Data were not collected on the need for additional surgery within the study period, which could significantly impact outcomes.
Future studies would benefit from a longer postoperative monitoring period because this study looked only at the 30-day postoperative period. Last, randomization did not account for equal allocation of surgical procedures, and a higher number of pancreatic surgeries in the SNG could account for the higher complication rate found in that group. Although the colorectal analysis is underpowered, the results continue to show beneficial results with the use of immunonutrition.
Conclusion
The primary purpose of this research was to determine whether the veteran population would benefit from an immunonutrition preoperative protocol as recommended by several practice guidelines. The results of the initial analysis and the colorectal analysis were presented to the hospital interdisciplinary nutrition committee who voted that a preoperative immunonutrition protocol will be implemented at JAHVH because of the high comorbidity rate experienced by veterans.
1. Grimble RF. Immunonutrition. Curr Opin Gastroenterol. 2005;21(2):216-222.
2. McClave SA, Martindale RG, Vanek VW, et al; A.S.P.E.N. Board of Directors; American College of Critical Care Medicine; Society of Critical Care Medicine. Guidelines for the provision and assessment of nutrition support therapy in the adult critically ill patient: Society of Critical Care Medicine (SCCM) and American Society for Parenteral and Enteral Nutrition (A.S.P.E.N.). JPEN J Parenter Enteral Nutr. 2009;33(3):277-316.
3. Marimuthu K, Varadhan KK, Ljungqvist O, Lobo DN. A meta-analysis of the effect of combinations of immune modulating nutrients on outcome in patients undergoing major open gastrointestinal surgery. Ann Surg. 2012;255(6):1060-1068.
4. Bharadwaj S, Trivax B, Tandon P, Alkam B, Hanouneh I, Steiger E. Should perioperative immunonutrition for elective surgery be the current standard of care? Gastroenterol Rep (Oxford). 2016;4(2):87-95.
5. Hegazi RA, Hustead DS, Evans DC. Preoperative standard oral nutrition supplements vs immunonutrition: results of a systematic review and meta-analysis. J Am Coll Surg. 2014;219(5):1078-1087.
6. Xu J, Zhong Y, Jing D, Wu Z. Preoperative enteral immunonutrition improves postoperative outcome in patients with gastrointestinal cancer. World J Surg. 2006;30(7):1284-1289.
7. Horie H, Okada M, Kojima M, Nagai H. Favorable effects of preoperative enteral immunonutrition on a surgical site infection in patients with colorectal cancer without malnutrition. Surg Today. 2006;36(12):1063-1068.
8. Fujitani K, Tsujinaka T, Fujita J, et al; Osaka Gastrointestinal Cancer Chemotherapy Study Group. Prospective randomized trial of preoperative enteral immunonutrition followed by elective total gastrectomy for gastric cancer. Br J Surg. 2012;99(5):621-629.
9. Braga M, Gianotti L, Nespoli L, Radaelli G, Di Carlo V. Nutritional approach in malnourished surgical patients: a prospective randomized study. Arch Surg. 2002;137(2):174-180.
10. Giger-Pabst U, Lange J, Maurer C, et al. Short-term preoperative supplementation of an immunoenriched diet does not improve clinical outcome in well-nourished patients undergoing abdominal cancer surgery. Nutrition. 2013;29(5):724-729.
11. Okamoto Y, Okano K, Izuishi K, Usuki H, Wakabayashi H, Suzuki Y. Attenuation of the systemic inflammatory response and infectious complications after gastrectomy with preoperative oral arginine and omega-3 fatty acids supplemented immunonutrition. World J Surg. 2009;33(9):1815-1821.
12. Yildiz SY, Yazicoiog˘lu MB, Tiryaki Ç, Çiftçi A, Boyaciog˘lu Z. The effect of enteral immunonutrition in upper gastrointestinal surgery for cancer: a prospective study. Turk J Med Sci. 2016;46(2):393-400.
13. Peterson SJ, Mozer M. Differentiating sarcopenia and cachexia among patients with cancer. Nutr Clin Pract. 2017;32(1):30-39.
14. Gianotti L, Braga M, Nespoli L, Radaelli G, Beneduce A, Di Carlo V. A randomized controlled trial of preoperative oral supplementation with a specialized diet in patients with gastrointestinal cancer. Gastroenterology. 2002;122(7):1763-1770.
15. Daly JM, Reynolds J, Thom A, et al. Immune and metabolic effects of arginine in the surgical patient. Ann Surg. 1988;208(4):512-523.
16. Aida T, Furukawa K, Suzuki D, et al. Preoperative immunonutrition decreases postoperative complications by modulating prostaglandin E2 production and T-cell differentiation in patients undergoing pancreato-duodenectomy. Surgery. 2014;155(1):124-133.
17. Bansal V, Syres KM, Makarenkova V, et al. Interactions between fatty acids and arginine metabolism: implications for the design of immune-enhancing diets. JPEN J Parenter Enteral Nutr. 2005;29(1 suppl):S75-S80.
18. Osland E, Hossain MB, Khan S, Memon MA. Effect of timing of pharmaconutrition (immunonutrition) administration on outcomes of elective surgery for gastrointestinal malignancies: a systematic review and meta-analysis. JPEN J Parenter Enteral Nutr. 2014;38(1):53-69.
19. Bouwens M, van de Rest O, Dellschaft N, et al. Fish-oil supplementation induces antiinflammatory gene expression profiles in human blood mononuclear cells. Am J Clin Nutr. 2009;90(2):415-424.
20. Senkal M, Haaker R, Linseisen J, Wolfram G, Homann HH, Stehle P. Preoperative oral supplementation with long-chain omega-3 fatty acids beneficially alters phospholipid fatty acid patterns in liver, gut mucosa, and tumor tissue. JPEN J Parenter Enteral Nutr. 2005;29(4):236-240.
21. Braga M, Gianotti L, Vignali A, Carlo VD. Preoperative oral arginine and n-3 fatty acid supplementation improves the immunometabolic host response and outcome after colorectal resection for cancer. Surgery. 2002;132(5):805-814.
22. Waitzberg DL, Saito H, Plank LD, et al. Postsurgical infections are reduced with specialized nutrition support. World J Surg. 2006;30(8):1592-1604.
23. Klek S, Sierzega M, Szybinski P, et al. The immunomodulating enteral nutrition in malnourished surgical patients—a prospective, randomized, double-blind clinical trial. Clin Nutr. 2011;30(3):282-288.
24. Farmer CM, Hosek SD, Adamson DM. Balancing demand and supply for veteran’s health care: a summary of three RAND assessments conducted under the Veterans Choice Act. Rand Health Q. 2016;6(1):12.
25. Arends J, Bachmann P, Baracos V, et al. ESPEN guidelines on nutrition in cancer patients. Clin Nutr. 2017;36(1):11-48.
26. Mauskopf JA, Candrilli SD, Chevrou-Séverac H, Ochoa JB. Immunonutrition for patients undergoing elective surgery for gastrointestinal cancer: Impact on hospital costs. World J Surg Oncol. 2012;10:136.
27. Senkal M, Mumme A, Eickhoff U, et al. Early postoperative enteral immunonutrition: clinical outcome and cost-comparison analysis in surgical patients. Crit Care Med. 1997;25(9):1489-1496.
28. Chevrou-Séverac H, Pinget C, Cerantola Y, Demartines N, Wasserfallen JB, Schäfer M. Cost-effectiveness analysis of immune-modulating nutritional support for gastrointestinal cancer patients. Clin Nutr. 2014;33(4):649-654.
29. Strickland A, Brogan A, Krauss J, Martindale R, Cresci G. Is the use of specialized nutritional formulations a cost-effective strategy? A national database evaluation. JPEN J Parenter Enteral Nutr. 2005;29(1 suppl):S81-S91.
30. Hübner M, Cerantola Y, Grass F, Bertrand PC, Schäfer M, Demartines N. Preoperative immunonutrition in patients at nutritional risk: results of a double-blinded randomized clinical trial. Eur J Clin Nutr. 2012;66(7):850-855.
Immunonutrition involves the use of omega-3 fatty acids, glutamine, arginine, and/or nucleotides individually or in combination at therapeutic levels to specifically modulate the immune system against altering inflammatory and metabolic pathways.1 Current literature supports the routine use of immune-enhancing formulas (containing both arginine and fish oil) in surgical patients.2-4 Although most of the literature favors the use of immunonutrition in surgical patients, some studies reported no benefit over standard oral nutrition supplementation.5
Background
Most studies evaluating the effect of immunonutrition for those undergoing elective surgery have been conducted in surgical oncology patients.6-12 Advanced cancers and older age can lead to cancer cachexia and sarcopenia, respectively. These conditions increase a patient’s surgical morbidity and mortality risk likely because of the negative effects on lean body mass, nutrient intake, and inflammatory and metabolic profile.13 However, early detection of some cancers through routine screening might lead to earlier surgical intervention that minimizes these negative tumor effects on the patient. Immunonutrition provided to well-nourished and malnourished patients has shown benefits, which supports the premise that a combination of immunonutrients included in immune-enhancing diets might have a beneficial pharmacotherapeutic effect beyond that of providing energy, protein, vitamins, and minerals for nutritional support.7,14
There are a lack of data regarding whether there is a window of opportunity for improved outcomes. Is the greatest need for immunonutrients during the peak of the injury, which might be immediately after surgery, or is it before the procedure? Arginine is a conditionally essential amino acid that has been shown to have a beneficial effect on the immune system by enhancing T-lymphocyte response when supplemented in surgical patients. When the arginase 1 (ARG 1) enzyme in myeloid cells is expressed during the inflammatory response to injury, accelerated use of arginine can deplete endogenous arginine, making it conditionally essential.
If adequate arginine cannot be synthesized or an exogenous source is not provided, T-cell dysfunction and decreased nitric oxide production leads to immune and vascular dysfunction, respectively.15,16 Providing arginine and omega-3 fatty acids might have a synergistic effect by shifting to an anti-inflammatory prostaglandin profile that has been shown to decrease ARG 1 expression while providing an exogenous source of arginine.17 Postsurgical inflammation might be caused in part by pro-inflammatory mediators and the anti-inflammatory properties of omega-3 fatty acids might offset this if cell membranes are loaded preoperatively.18 Therefore, preoperative immunonutrition might allow tissues to recover from planned surgical trauma. Bouwens and colleagues demonstrated that intake of eicosapentaenoic acid/docosahexaenoic acid over 26 weeks can alter the gene expression profiles of immune cells to a more anti-inflammatory status.19 However, Senkal and colleagues recommended that 3 to 7 days preoperatively is adequate to positively alter the lipid profile of tissues.20
Oncology patients preparing for surgery often are exposed to the physiologic stress of radiation and chemotherapy as neoadjuvant treatment to surgery. Oncology treatment and the adverse nutritional effects of treatment increase risk for arginine deficiency, such as poor nutrition intake, increased requirements, decreased production. Braga and colleagues demonstrated improved gut microprofusion and gut oxygenation intraoperatively, an effect that continued for up to 5 days after surgery.21 Waitzberg conducted a systematic review of randomized clinical trials evaluating immunonutrition in preoperative, postoperative, and perioperative periods. The results showed that the greatest improvements in postoperative infections and length of stay occurred in patients receiving preoperative 0.5 to 1 L/d of an immune nutrition product containing supplemental omega-3 fatty acids, arginine, and nucleotides for 5 to 7 days.22
It is unclear which population of surgical patients benefit the most from immunonutrition. Some results in the literature favor use in malnourished patients.18,23 However, other studies also have found benefit in well-nourished patients.7,14,21
Veterans who seek medical care at the Department of Veteran Affairs (VA) have higher rates of cancer, obesity, and diabetes mellitus, which complicate surgical outcomes.24 In addition to comorbidities, veterans who seek medical care at the VA are more likely to have been deployed overseas and have more physical and mental health disorders compared with that of nonveteran patients or veterans who do not use the VA. Because of higher comorbidities, unique deployment history, and mental health disorders, all of which may impact quality of life concerns, veterans are clinically more complex, which makes comparisons with the private sector difficult. The VA has the advantage of providing comprehensive care to veterans in all settings, including preparation for surgery and postsurgical follow-up with an interdisciplinary team.
The objective of this study was to compare surgical outcomes in veterans who receive preoperative supplementation using an immune-modulating formula with veterans who received a standard oral supplement. Although practice guidelines have been developed from studies in US nonveteran populations, there are no high- quality randomized studies of veterans.
This study design also would allow the VA to gauge cost-effectiveness of immunonutrition before implementing new protocols. There is convincing data supporting significant economic benefit; however, more cost-benefit studies are needed to fully assess.18,25-27 Immunonutrition products are more expensive than are standard nutrition supplements, but overall cost of care when immunonutrition products are used could be lower because of reduction of complications and hospital resources.
Methods
From November 2011 to January 2016, the authors conducted a single-center, prospective, randomized parallel-group study in veterans undergoing elective gastrointestinal oncologic surgery. Inclusion criteria included planned esophageal, gastric, pancreatic, colorectal, or liver resections in veterans with histologically documented neoplasm of the gastrointestinal tract. Patients were excluded if they were admitted to the intensive care unit (ICU) before surgery, were receiving steroids or other immunosuppressive medications, had a recent hospital admission for pulmonary, cardiac, or renal disease, or were exhibiting signs or symptoms of infection or sepsis, including elevated white blood cells (WBC) > 10,000/mL or a temperature > 37.7° C.
The study was approved by the research and development committee and the institutional review board at James A. Haley Veterans’ Hospital (JAHVH) in Tampa, Florida. The clinicaltrials.gov identifier for the study was NCT01471743.
Nutrition Formula
Subjects were randomized into 2 oral supplement groups: immunonutrition group (ING) patients received immunonutrition, and standard nutrition group (SNG) received a standard formula (Table 1).
Study Procedures
All veterans with planned gastrointestinal surgeries were evaluated in the JAHVH general surgery clinic. Veterans meeting the inclusion criteria were invited to participate in the study, and informed consent was obtained. A research randomizer program assigned subjects to the groups to reach equal 1:1 randomization. Enrolled participants were provided their randomized supplement (unblinded) in the general surgery clinic and instructed on the amount of supplement to consume and date to begin taking the supplement. Participants were instructed to continue with their normal diet in addition to the supplement. No additional nutrition education was provided. Participants were asked to keep track of their daily supplement intake. Patients in both groups also used preoperative bowel preparations when indicated.
At the time of enrollment, presurgical comorbidities, anthropometric data, and nutrition status parameters were obtained. Postoperatively, study personnel interviewed each patient about formula consumption and tolerance. Thirty days postoperatively, patient demographics, surgical characteristics (eg, surgery, operative time, blood loss), nutrition risk screening (NRS 2002) score, diet/enteral orders, days spent NPO, days in the hospital or in the ICU, and complications (eg, wound infection, abscess, sepsis, pneumonia, urinary tract infection, intestinal fistula, ileus, or anastomotic leakage) were collected from the electronic health record.
Statistical Analysis
The primary outcome measure was overall postoperative complication rate and postoperative infection rate. Based on reviews of similar studies available at the time of protocol development, it was assumed that a postoperative infection rate of 38% in the SNG and 15% in the ING would indicate treatment efficacy. A sample size of 54 patients in each group would provide a Type I error level α = .05 and a power of 80%. A total of 108 patients enrolled in the study. Chi-square analysis was used to determine this primary outcome measure.
Secondary outcomes (mean number of complications, hospital days, NPO (nothing by mouth) days, and ICU days) were evaluated with Mann Whitney U test because of violation of assumptions for the t test. All P values were 2-tailed and statistical significance was accepted at P < .05 with clinical significance accepted at P < .10. Analysis for intention to treat (ITT) and per protocol are provided for outcome measures. For the ITT analysis, multiple imputation (last observation carried forward) was used. Sensitivity analysis found that the data were missing at random. SPSS software version 21.0 (Chicago, IL) was used for statistical analysis.
Results
During the study period, 137 patients were assessed for eligibility (Figure).
The sample was predominately white and male, which is consistent with the veteran population. There were no statistical differences for baseline patient or surgical characteristics between the groups (Table 2).
There was a significant difference (P = .09) in the surgical procedures completed. There was only 1 pancreatic surgery completed in the ING and 9 pancreatic surgeries completed in the SNG.
Primary Outcomes
The overall rate of complications differed between the groups (Table 3).
Given the large number of colorectal procedures, a separate per-protocol analysis included 37 patients from ING and 36 patients in the SNG (Table 4).
Secondary Outcomes
The ITT analysis found that overall number of hospital days was slightly higher in the ING compared with that of the SNG, 9.4 vs 9.3 days, respectively. In the per-protocol analysis there were 1.3 fewer hospital days for those who received immunonutrition (P = .059). No significant differences were found between the groups in the number of days spent in the ICU or number of days NPO (Table 3). Death within 30 days postoperative was twice as high for those in the SNG vs ING, with no deaths in the per-protocol analysis for those in the ING.
The colorectal analysis found 8.5 hospital days for ING patients vs 10.0 days for SNG patients, (P = .08). There were no deaths in the ING and 1 death in the SNG for colorectal procedure patients.
Discussion
Surgery is traumatic to healthy patients with or without cancer. Patients with cancer who receive surgical intervention might be at an even higher risk for complications because of altered metabolic pathways, nutritional deficiencies, and depressed immune function.13 Meta-analyses of immunonutrition studies conducted over the past 2 decades have come to different conclusions regarding the benefit of immunonutrition in the elective gastrointestinal cancer surgery population.3,5,18 Although practice guidelines from the American Society of Parenteral and Enteral Nutrition and the European Society of Parenteral and Enteral Nutrition recommend routine use of immune-modulating formulas in surgical oncology patients, there is still some debate about the optimal timing, dose, individual formula constituents, and populations that will benefit.2,25 Earlier studies evaluating the economics of immunonutrition have shown significant cost savings related to reduction in length of stay and decrease in infectious complications even after accounting for the extra cost of the formula.26,27 More recent economic analyses confirmed these cost savings showing a savings of about $1,000 to $2,500 per patient with higher savings when immunonutrition was given preoperatively.28,29
For practitioners treating veterans with cancer, good stewardship of federal dollars and optimal outcomes are important considerations before implementing new therapies. Therefore, JAHVH set out to evaluate whether standard oral nutrition supplementation would be as effective as the higher cost immunonutrition supplementation in cancer patients receiving elective surgical procedures.
Rates of Complications
In this study, favorable effects of immunonutrition were found on total postoperative complications and number of hospital days. The total number of patients who experienced complications was 39% lower in the ING than it was in SNG in the ITT analysis and 37% lower in the colorectal per-protocol analysis. These rates are similar to the 48% lower rate Braga and colleagues found in their study in patients with colorectal cancer who received 5 days of preoperative immunonutrition.21 Because more than half of the patients in this study had colorectal cancer, the group is comparable to the Braga and colleagues study population. The overall supplement adherence rate was 86%, which was slightly lower than the 90% adherence rate that Braga and colleagues found. Lower consumption rates might have been a factor in not achieving a greater therapeutic benefit for infectious complications. Some studies suggest a therapeutic goal intake of greater than two-thirds of the prescribed amount.10,30 In the present study, 70.4% of the ING and 83% of the SNG met that recommended therapeutic goal, which is more than Hübner colleagues reported in their study (53% of the ING and 60% in the SNG meeting therapeutic intake goal).
Okamoto and colleagues also reported a much lower complication rate in gastric cancer patients who received immunonutrition (13.3%) compared with that of those receiving an isoenergetic formula (40%).11 The group receiving immunonutrition in the Okamoto and colleagues study had 4 times fewer infectious complications than did the standard group (P = .039), and a contributing reason might be that they supplemented for 7 days preoperatively. Similar to the current study’s results, Giger-Pabst and colleagues and Hübner and colleagues did not find any significant difference in infectious complications.10,30 Important notes of comparison include a low adherence rate in the study conducted by Hübner and colleagues and the lower dose of immunonutrition used by Giger-Pabst andcolleagues who used 3 days of preoperative supplementation, which may not be long enough to promote the tissue benefits of immunonutrition.
Although, the current study did not find any statistically significant difference in infectious complications, the SNG experienced 1.8 times more infections than did the ING, which indicates that immunonutrition support may be clinically beneficial. Based on previous literature and the results of this study, the authors speculate that at least 5 days of intake of the study immunonutrition formula could positively affect outcomes.
The authors suspect that the added arginine and fish oil in the immunonutrition product act synergistically as therapeutic ingredients to shift toward a preoperative anti-inflammatory prostaglandin environment while providing exogenous arginine to possibly prevent or correct a conditionally essential need for arginine that would promote adequate nitric oxide production. Another crucial factor is that the a priori power analysis was looking at a 38% complication rate in the SNG and only 15% complication rate in the ING, which generated a sample size of 108 participants. The post hoc power analysis indicates that this study is underpowered based on the complication rates, which could be a reason for insignificant infectious complications.
The benefits of immunonutrients are still being studied. Future studies in a controlled surgical setting could determine whether immunonutrition has a clinical outcome effect on operative time and surgical blood loss. A challenge for the investigators was to decide whether the difference in operative time and blood loss was a surgical characteristic or a clinical outcome. The positive impact of immunonutrients on tissue perfusion and cell integrity have been shown in other studies to reduce tissue inflammation and alter gene expression, which could affect how tissues respond to surgical insults.10,11 Because JAHVH is a teaching institution and multiple surgeons are involved with the patients, this question will continue to be unresolved. Future research may want to consider controlling for variability in surgical technique and perioperative protocols to evaluate this as a clinical outcome.
Limitations
Several limitations of this trial need to be addressed. Although the design of the study was a randomized controlled trial, it was an unblinded, single-center study with a small sample size. Surgeons were not aware of which supplement each subject had received; however, researchers took no measures to ensure the surgeons were blinded. To minimize bias, 2 investigators evaluated the records for complication rates to confirm consistency, and any discrepancies were resolved by a third investigator. Although adherence was evaluated, it was patient-reported, and lab testing was not conducted to ensure that tissues were loaded with therapeutic amounts of immunonutrients or to determine baseline levels of nutrient intake, which could show a nutrient response curve.
The use of other nutritional supplements, such as vitamins, probiotics, or additional fatty acids were not monitored, and the study formulas differed in protein and fiber content, which could have impacted the overall nutrient intake and affected the primary outcomes. Another limitation includes the variety of surgeons used over the period of the study. At a teaching institution, it is not feasible to limit the number of surgeons performing surgery.
Additionally, the study period was 5 years, and there have been changes in fasting times, medications, and bowel preparation over the course of that period, which could not be accounted for. Postoperative immunonutrition was not provided in this study based on the limited evidence available when the protocol was initiated. However, since that time, evidence supports and encourages postoperative therapy and might have proven beneficial to the patients. Data were not collected on the need for additional surgery within the study period, which could significantly impact outcomes.
Future studies would benefit from a longer postoperative monitoring period because this study looked only at the 30-day postoperative period. Last, randomization did not account for equal allocation of surgical procedures, and a higher number of pancreatic surgeries in the SNG could account for the higher complication rate found in that group. Although the colorectal analysis is underpowered, the results continue to show beneficial results with the use of immunonutrition.
Conclusion
The primary purpose of this research was to determine whether the veteran population would benefit from an immunonutrition preoperative protocol as recommended by several practice guidelines. The results of the initial analysis and the colorectal analysis were presented to the hospital interdisciplinary nutrition committee who voted that a preoperative immunonutrition protocol will be implemented at JAHVH because of the high comorbidity rate experienced by veterans.
1. Grimble RF. Immunonutrition. Curr Opin Gastroenterol. 2005;21(2):216-222.
2. McClave SA, Martindale RG, Vanek VW, et al; A.S.P.E.N. Board of Directors; American College of Critical Care Medicine; Society of Critical Care Medicine. Guidelines for the provision and assessment of nutrition support therapy in the adult critically ill patient: Society of Critical Care Medicine (SCCM) and American Society for Parenteral and Enteral Nutrition (A.S.P.E.N.). JPEN J Parenter Enteral Nutr. 2009;33(3):277-316.
3. Marimuthu K, Varadhan KK, Ljungqvist O, Lobo DN. A meta-analysis of the effect of combinations of immune modulating nutrients on outcome in patients undergoing major open gastrointestinal surgery. Ann Surg. 2012;255(6):1060-1068.
4. Bharadwaj S, Trivax B, Tandon P, Alkam B, Hanouneh I, Steiger E. Should perioperative immunonutrition for elective surgery be the current standard of care? Gastroenterol Rep (Oxford). 2016;4(2):87-95.
5. Hegazi RA, Hustead DS, Evans DC. Preoperative standard oral nutrition supplements vs immunonutrition: results of a systematic review and meta-analysis. J Am Coll Surg. 2014;219(5):1078-1087.
6. Xu J, Zhong Y, Jing D, Wu Z. Preoperative enteral immunonutrition improves postoperative outcome in patients with gastrointestinal cancer. World J Surg. 2006;30(7):1284-1289.
7. Horie H, Okada M, Kojima M, Nagai H. Favorable effects of preoperative enteral immunonutrition on a surgical site infection in patients with colorectal cancer without malnutrition. Surg Today. 2006;36(12):1063-1068.
8. Fujitani K, Tsujinaka T, Fujita J, et al; Osaka Gastrointestinal Cancer Chemotherapy Study Group. Prospective randomized trial of preoperative enteral immunonutrition followed by elective total gastrectomy for gastric cancer. Br J Surg. 2012;99(5):621-629.
9. Braga M, Gianotti L, Nespoli L, Radaelli G, Di Carlo V. Nutritional approach in malnourished surgical patients: a prospective randomized study. Arch Surg. 2002;137(2):174-180.
10. Giger-Pabst U, Lange J, Maurer C, et al. Short-term preoperative supplementation of an immunoenriched diet does not improve clinical outcome in well-nourished patients undergoing abdominal cancer surgery. Nutrition. 2013;29(5):724-729.
11. Okamoto Y, Okano K, Izuishi K, Usuki H, Wakabayashi H, Suzuki Y. Attenuation of the systemic inflammatory response and infectious complications after gastrectomy with preoperative oral arginine and omega-3 fatty acids supplemented immunonutrition. World J Surg. 2009;33(9):1815-1821.
12. Yildiz SY, Yazicoiog˘lu MB, Tiryaki Ç, Çiftçi A, Boyaciog˘lu Z. The effect of enteral immunonutrition in upper gastrointestinal surgery for cancer: a prospective study. Turk J Med Sci. 2016;46(2):393-400.
13. Peterson SJ, Mozer M. Differentiating sarcopenia and cachexia among patients with cancer. Nutr Clin Pract. 2017;32(1):30-39.
14. Gianotti L, Braga M, Nespoli L, Radaelli G, Beneduce A, Di Carlo V. A randomized controlled trial of preoperative oral supplementation with a specialized diet in patients with gastrointestinal cancer. Gastroenterology. 2002;122(7):1763-1770.
15. Daly JM, Reynolds J, Thom A, et al. Immune and metabolic effects of arginine in the surgical patient. Ann Surg. 1988;208(4):512-523.
16. Aida T, Furukawa K, Suzuki D, et al. Preoperative immunonutrition decreases postoperative complications by modulating prostaglandin E2 production and T-cell differentiation in patients undergoing pancreato-duodenectomy. Surgery. 2014;155(1):124-133.
17. Bansal V, Syres KM, Makarenkova V, et al. Interactions between fatty acids and arginine metabolism: implications for the design of immune-enhancing diets. JPEN J Parenter Enteral Nutr. 2005;29(1 suppl):S75-S80.
18. Osland E, Hossain MB, Khan S, Memon MA. Effect of timing of pharmaconutrition (immunonutrition) administration on outcomes of elective surgery for gastrointestinal malignancies: a systematic review and meta-analysis. JPEN J Parenter Enteral Nutr. 2014;38(1):53-69.
19. Bouwens M, van de Rest O, Dellschaft N, et al. Fish-oil supplementation induces antiinflammatory gene expression profiles in human blood mononuclear cells. Am J Clin Nutr. 2009;90(2):415-424.
20. Senkal M, Haaker R, Linseisen J, Wolfram G, Homann HH, Stehle P. Preoperative oral supplementation with long-chain omega-3 fatty acids beneficially alters phospholipid fatty acid patterns in liver, gut mucosa, and tumor tissue. JPEN J Parenter Enteral Nutr. 2005;29(4):236-240.
21. Braga M, Gianotti L, Vignali A, Carlo VD. Preoperative oral arginine and n-3 fatty acid supplementation improves the immunometabolic host response and outcome after colorectal resection for cancer. Surgery. 2002;132(5):805-814.
22. Waitzberg DL, Saito H, Plank LD, et al. Postsurgical infections are reduced with specialized nutrition support. World J Surg. 2006;30(8):1592-1604.
23. Klek S, Sierzega M, Szybinski P, et al. The immunomodulating enteral nutrition in malnourished surgical patients—a prospective, randomized, double-blind clinical trial. Clin Nutr. 2011;30(3):282-288.
24. Farmer CM, Hosek SD, Adamson DM. Balancing demand and supply for veteran’s health care: a summary of three RAND assessments conducted under the Veterans Choice Act. Rand Health Q. 2016;6(1):12.
25. Arends J, Bachmann P, Baracos V, et al. ESPEN guidelines on nutrition in cancer patients. Clin Nutr. 2017;36(1):11-48.
26. Mauskopf JA, Candrilli SD, Chevrou-Séverac H, Ochoa JB. Immunonutrition for patients undergoing elective surgery for gastrointestinal cancer: Impact on hospital costs. World J Surg Oncol. 2012;10:136.
27. Senkal M, Mumme A, Eickhoff U, et al. Early postoperative enteral immunonutrition: clinical outcome and cost-comparison analysis in surgical patients. Crit Care Med. 1997;25(9):1489-1496.
28. Chevrou-Séverac H, Pinget C, Cerantola Y, Demartines N, Wasserfallen JB, Schäfer M. Cost-effectiveness analysis of immune-modulating nutritional support for gastrointestinal cancer patients. Clin Nutr. 2014;33(4):649-654.
29. Strickland A, Brogan A, Krauss J, Martindale R, Cresci G. Is the use of specialized nutritional formulations a cost-effective strategy? A national database evaluation. JPEN J Parenter Enteral Nutr. 2005;29(1 suppl):S81-S91.
30. Hübner M, Cerantola Y, Grass F, Bertrand PC, Schäfer M, Demartines N. Preoperative immunonutrition in patients at nutritional risk: results of a double-blinded randomized clinical trial. Eur J Clin Nutr. 2012;66(7):850-855.
The Effects of Ranolazine on Hemoglobin A1c in a Veteran Population
Diabetes mellitus (DM) is a risk factor for cardiovascular disease(CVD).1-4 Death rates from heart disease are 2- to 4-times higher among adults with DM compared with those of adults without DM. In the US, it is estimated that 21.1 million adults have diagnosed DM, 8.1 million adults have undiagnosed DM, and 80.8 million adults have prediabetes.3 The American Heart Association has identified an untreated fasting blood glucose level < 100 mg/dL as a component of ideal cardiovascular health.3
Although the use of antidiabetic agents has been shown to reduce the risks of microvascular complications among patients with DM, a cardiovascular benefit has not been consistently demonstrated with all available agents, and some used in the treatment of DM are associated with cardiovascular harm.5 In addition, some cardiovascular medications may contribute to the development of DM or may mask the symptoms of hypoglycemia.6 Given the risk for CVD among patients with DM, a medication with utility in both DM and CVD could be beneficial.
Evidence for Use of Ranolazine
Ranolazine is indicated for the treatment of chronic angina.7 In clinical trials, ranolazine also was found to decrease hemoglobin A1c (HbA1c).8-15 The possible mechanisms for lowering HbA1c with ranolazine include preservation of pancreatic β-cells and an increase in glucose-dependent insulin secretion.6 The most common adverse effects associated with ranolazine include dizziness, headache, constipation, and nausea.7
Ranolazine has been shown to be efficacious and safe in the reduction of angina symptoms among patients with and without DM.8-12 In addition to improving symptoms of angina, studies have demonstrated a reduction in HbA1c among patients taking ranolazine.9,13-15 In an open-label extension of the Combination Assessment of Ranolazine in Stable Angina (CARISA) trial, ranolazine 750 mg twice daily and 1,000 mg twice daily led to a greater reduction in HbA1c when each was compared with placebo (-0.48% HbA1c, P = .008; and -0.70% HbA1c, P = .001, respectively).9
Among the 5,576 patients enrolled in the Metabolic Efficiency With Ranolazine for Less Ischemia in Non-ST-Elevation Acute Coronary Syndromes—Thrombolysis in Myocardial Infarction 36 (MERLIN-TIMI 36) trial with a baseline HbA1c, ranolazine significantly reduced HbA1c at 4 months when compared with placebo among patients with and without DM.13 In addition, patients with DM who were treated with ranolazine were more likely to achieve a HbA1c < 7% at 4 months when compared with placebo (59% vs 49%; P < .001). Ranolazine was not found to increase the incidence of hypoglycemia.
A subgroup analysis of MERLIN-TIMI 36 evaluated the effects of ranolazine compared with those of placebo on fasting plasma glucose and HbA1c in patients with moderate DM (HbA1c ≥ 6% but < 8%, fasting plasma glucose < 250 mg/dL) and severe DM (A1c ≥ 8%, fasting plasma glucose 150-400 mg/dL).14 A significant reduction in HbA1c with ranolazine in addition to standard of care antidiabetes treatment was observed among both groups. The placebo-corrected decrease in HbA1c in the moderate DM group was 0.28% (95% confidence interval [CI] -0.55 to 0; P = .045) and in the severe DM group was 0.59% (95% CI -0.99 to -0.20; P < .001).
In a trial designed to evaluate change in HbA1c in patients taking ranolazine 1,000 mg twice daily compared with that of placebo, ranolazine led to a greater decrease in HbA1c compared with that of placebo (placebo corrected change in HbA1c -0.56%, P = .001).15 In addition, a higher percentage of patients achieved HbA1c < 7% at 24 weeks in the ranolazine group compared with that of placebo (41.2% vs 25.7%; P = .001). No patient experienced severe hypoglycemia or had documented hypoglycemia in this study.
These trials suggest that ranolazine, in addition to decreasing anginal events, is potentially beneficial in achieving better control of DM. However, more studies are needed to determine this benefit. In addition, no trials have examined the 500-mg twice daily dose of ranolazine in HbA1c reduction.
The purpose of this study was to evaluate the change in HbA1c among veterans with DM after the initiation of ranolazine. The study compared the percentage of veterans achieving HbA1c < 7% or < 8% after initiation of ranolazine with the baseline, to determine whether there is a dose-related change in HbA1c among different ranolazine regimens and to determine whether there is a change in the incidence of hypoglycemia after the initiation of ranolazine.
Methods
This was a multicenter, retrospective study. The institutional review board and research and development committee for 3 Veterans Affairs medical centers (VAMCs) approved this study and waived informed consent. Additionally, this study was approved for access to national patient information through the Corporate Data Warehouse (CDW).
Subjects were eligible for inclusion in this study if they were aged ≥ 18 years, had a diagnosis of type 2 DM, and received their first prescription of ranolazine at a VAMC from January 1, 2008 through March 31, 2015. Exclusion criteria included subjects with no baseline HbA1c (defined as the HbA1c result closest to the ranolazine initiation date and within 90 days before to 14 days after ranolazine initiation), no follow-up HbA1c (defined as the first HbA1c result within 60 to 180 days after the ranolazine initiation date), any change to their DM medication regimen during the follow-up period, or who discontinued ranolazine prior to collection of the follow-up HbA1c.
Data were collected from the electronic health record (EHR) for each subject from 6 months prior to the ranolazine initiation date through 6 months after the ranolazine initiation date. The ranolazine initiation date was defined as the date ranolazine was picked up in person at a VAMC pharmacy or 7 days after the date filled for medications sent by mail. 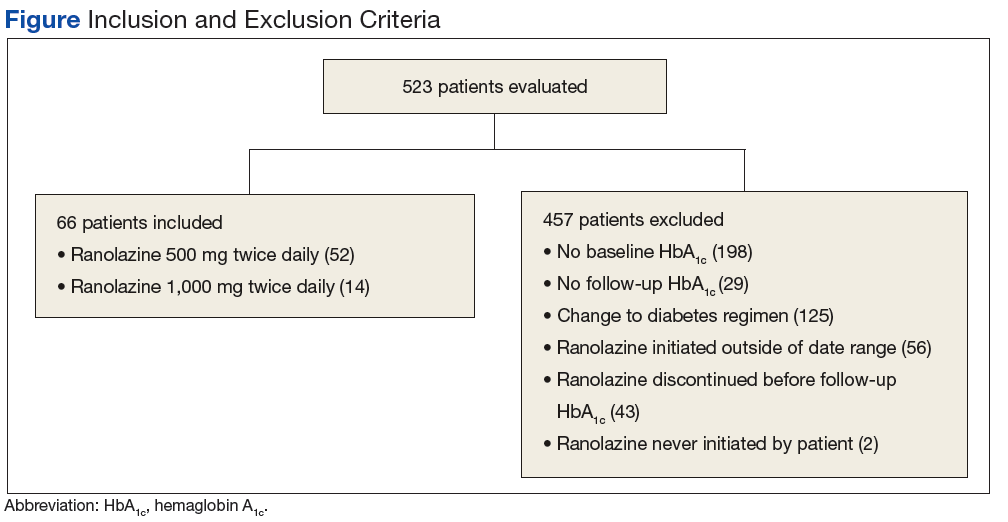
The primary endpoint of this study was the change in HbA1c after ranolazine initiation. The secondary endpoint was the percentage of study subjects achieving HbA1c < 7% and < 8% before and after the initiation of ranolazine.
To achieve 80% power to detect a change in HbA1c of 0.4%, a sample size of 52 patients was required. For the primary endpoint, a paired t test was used to test for statistical significance. The McNemar test was used to evaluate for a significant change in subjects achieving an HbA1c < 7% and HbA1c < 8% with the initiation of ranolazine.
Results
A total of 523 patients were evaluated for study inclusion, of which 66 patients were included (Figure). The most common reasons for exclusion included no HbA1c at baseline and changes to the DM medication regimen during follow-up. 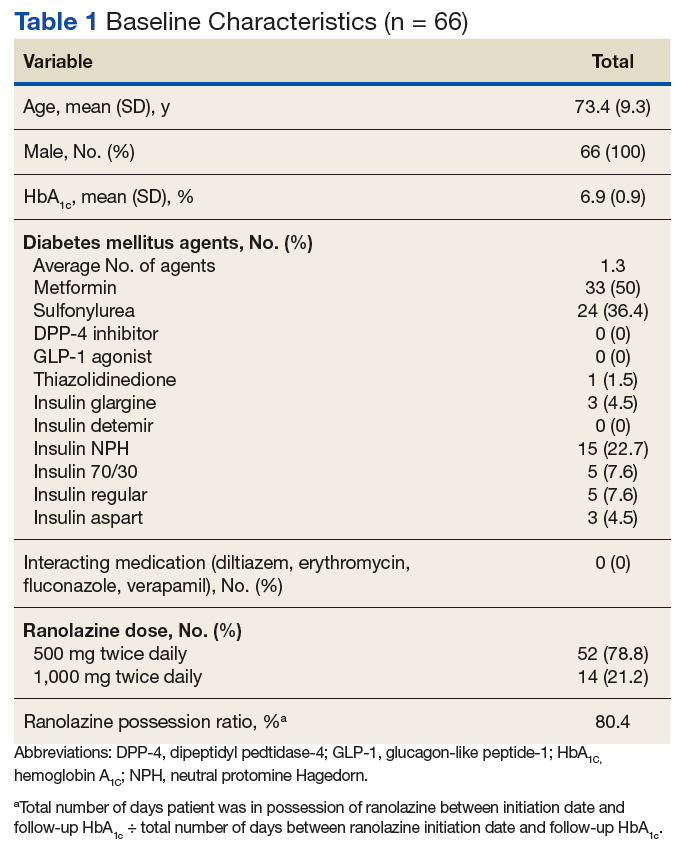
Ranolazine at any dose was associated with a change in HbA1c of -0.3% (P < .001). 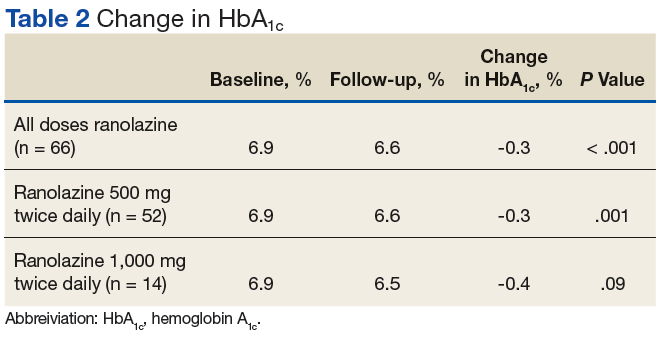
A dose of 500 mg ranolazine twice daily also was associated with a significant decrease in HbA1c by 0.3% (P = .001). A significant increase in veterans achieving HbA1c < 7% after ranolazine initiation was observed (42.3% before ranolazine initiation vs 73.1% after ranolazine initiation; P = .001), and a nonsignificant increase in veterans achieving HbA1c < 8% was observed (82.7% before ranolazine initiation vs 90.4% after ranolazine initiation, P = .37).
At a dose of 1,000 mg twice daily, a 0.4% decrease in HbA1c was observed. However, this result was not found to be statistically significant (P = .09), and the study was underpowered to detect a significant change in HbA1c at this dose. 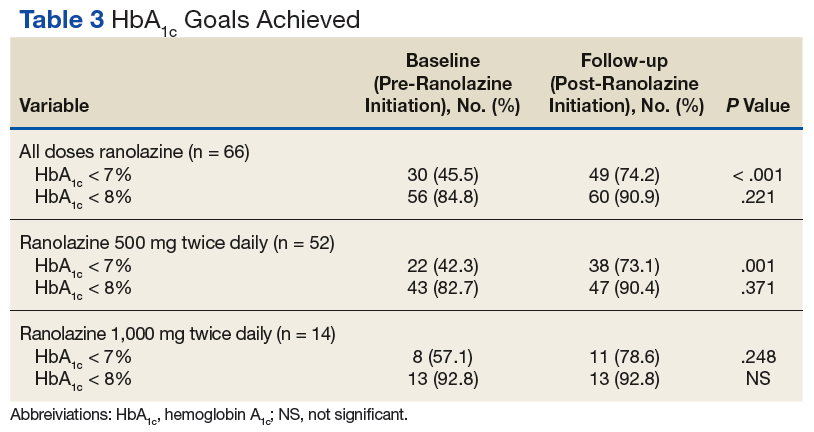
Hypoglycemia was not reported in a majority of study patient progress notes; thus, it was not evaluated further.
Discussion
In this study of a veteran population, ranolazine was associated with an HbA1c decrease of 0.3%. This change is less than that observed in previous studies, which may be related to a lower baseline HbA1c for the patients in this study. In addition, a greater percentage of veterans achieved an HbA1c < 7% after initiation of ranolazine compared with that of the baseline.
To the authors’ knowledge, this is the first study evaluating ranolazine and HbA1c in a veteran population. It also is the first study to demonstrate an association between HbA1c lowering and ranolazine at a dose of 500 mg twice daily. These results suggest that in patients with chronic angina and type 2 DM, ranolazine could potentially play a dual role in therapy.
Limitations
The authors recognize several limitations in this study. Given its observational design, it cannot be definitively concluded that the decrease in HbA1c was due to the initiation of ranolazine. While excluding patients with changes to their antidiabetic medication regimen was done in an effort to minimize confounding factors, it is possible that other factors, such as lifestyle, also could explain changes in HbA1c. It is possible that changes to the DM medication regimen were made but not documented in the EHR. In addition, information on hypoglycemia was not readily available; thus, the safety of ranolazine among patients with DM could not be evaluated fully. Finally, the patient population characteristics may limit external validity.
Conclusion
In this observational study, ranolazine was associated with a statistically significant decrease in HbA1c among veterans with DM, which supports previously published literature.9, 13-15 However, no randomized controlled trials have been performed specifically studying the impact of ranolazine on HbA1c among patient with DM. Ideally, future prospective, randomized placebo-controlled studies will take place to further evaluate the association between ranolazine use and HbA1c lowering.
1. Kannel WB, McGee DL. Diabetes and cardiovascular disease—the Framingham study. JAMA. 1979;241(19): 2035-2038.
2. Selvin E, Coresh J, Golden SH, Boland LL, Brancati FL, Steffes MW; Atherosclerosis risk in communities study. Glycemic control, atherosclerosis, and risk factors for cardiovascular disease in individuals with diabetes: the atherosclerosis risk in communities study. Diabetes Care. 2005;28(8):1965-1973.
3. Writing Group Members, Mozaffarian D, Benjamion EJ, et al; American Heart Association Statistics Committee and Stroke Statistics Subcommittee. Heart disease and stroke statistics—2016 update: a report from the American Heart Association. Circulation. 2016;133(4):e38-e360.
4. Conaway DG, O’Keefe JH, Reid KJ, Spertus J. Frequency of undiagnosed diabetes mellitus in patients with acute coronary syndrome. Am J Cardiol. 2005;96(3):363-365.
5. Hiatt WR, Kaul S, Smith RJ. The cardiovascular safety of diabetes drugs—insights from the rosiglitazone experience. N Engl J Med. 2013;369(14):1285-1287.
6. Ning Y, Zhen W, Fu Z, et al. Ranolazine increases β-cell survival and improves glucose homeostasis in low-dose streptozotocin-induced diabetes in mice. J Pharmacol Exp Ther. 2011;337(1):50-58.
7. Ranexa [package insert]. Foster City, CA: Gilead Sciences Inc; 2016.
8. Chaitman BR, Pepine CJ, Parker JO, et al; Combination Assessment of Ranolazine In Stable Angina (CARISA) Investigators. Effects of ranolazine with atenolol, amlodipine, or diltiazem on exercise tolerance and angina frequency in patients with severe chronic angina: a randomized controlled trial. JAMA. 2004;291(3):309-316.
9. Timmis AD, Chaitman BR, Crager M. Effects of ranolazine on exercise tolerance and HbA1c in patients with chronic angina and diabetes. Eur Heart J. 2006;27(1):42-48.
10. Morrow DA, Scirica BM, Karwatowska-Prokopczuk E, et al; MERLIN-TIMI 36 Trial Investigators. Effects of ranolazine on recurrent cardiovascular events in patients with non-ST-elevation acute coronary syndromes: the MERLIN-TIMI 36 randomized trial. JAMA. 2007;297(16):1775-1783.
11. Kosiborod M, Arnold SV, Spertus JA, et al. Evaluation of ranolazine in patients with type 2 diabetes mellitus and chronic stable angina: results from the TERISA randomized clinical trial (Type 2 Diabetes Evaluation of Ranolazine in Subjects With Chronic Stable Angina). J Am Coll Cardiol. 2013;61(20):2038-2045.
12. Arnold SV, McGuire DK, Spertus JA, et al. Effectiveness of ranolazine in patients with type 2 diabetes mellitus and chronic stable angina according to baseline hemoglobin A1c. Am Heart J. 2014;168(4):457-465.e2.
13. Morrow DA, Scirica BM, Chaitman BR, et al; MERLIN-TIMI 36 Trial Investigators. Evaluation of the glycometabolic effects of ranolazine patients with and without diabetes mellitus in the MERLIN-TIMI 36 randomized controlled trial. Circulation. 2009;119(15):2032-2039.
14. Chisholm JW, Goldfine AB, Dhalla AK, et al. Effect of ranolazine on A1c and glucose levels in hyperglycemic patients with non-ST elevation acute coronary syndrome. Diabetes Care. 2010;33(6):1163-1168.
15. Eckel RH, Henry RR, Yue P, et al. Effect of ranolazine monotherapy on glycemic control in subjects with type 2 diabetes. Diabetes Care. 2015;38(7):1189-1196.
Diabetes mellitus (DM) is a risk factor for cardiovascular disease(CVD).1-4 Death rates from heart disease are 2- to 4-times higher among adults with DM compared with those of adults without DM. In the US, it is estimated that 21.1 million adults have diagnosed DM, 8.1 million adults have undiagnosed DM, and 80.8 million adults have prediabetes.3 The American Heart Association has identified an untreated fasting blood glucose level < 100 mg/dL as a component of ideal cardiovascular health.3
Although the use of antidiabetic agents has been shown to reduce the risks of microvascular complications among patients with DM, a cardiovascular benefit has not been consistently demonstrated with all available agents, and some used in the treatment of DM are associated with cardiovascular harm.5 In addition, some cardiovascular medications may contribute to the development of DM or may mask the symptoms of hypoglycemia.6 Given the risk for CVD among patients with DM, a medication with utility in both DM and CVD could be beneficial.
Evidence for Use of Ranolazine
Ranolazine is indicated for the treatment of chronic angina.7 In clinical trials, ranolazine also was found to decrease hemoglobin A1c (HbA1c).8-15 The possible mechanisms for lowering HbA1c with ranolazine include preservation of pancreatic β-cells and an increase in glucose-dependent insulin secretion.6 The most common adverse effects associated with ranolazine include dizziness, headache, constipation, and nausea.7
Ranolazine has been shown to be efficacious and safe in the reduction of angina symptoms among patients with and without DM.8-12 In addition to improving symptoms of angina, studies have demonstrated a reduction in HbA1c among patients taking ranolazine.9,13-15 In an open-label extension of the Combination Assessment of Ranolazine in Stable Angina (CARISA) trial, ranolazine 750 mg twice daily and 1,000 mg twice daily led to a greater reduction in HbA1c when each was compared with placebo (-0.48% HbA1c, P = .008; and -0.70% HbA1c, P = .001, respectively).9
Among the 5,576 patients enrolled in the Metabolic Efficiency With Ranolazine for Less Ischemia in Non-ST-Elevation Acute Coronary Syndromes—Thrombolysis in Myocardial Infarction 36 (MERLIN-TIMI 36) trial with a baseline HbA1c, ranolazine significantly reduced HbA1c at 4 months when compared with placebo among patients with and without DM.13 In addition, patients with DM who were treated with ranolazine were more likely to achieve a HbA1c < 7% at 4 months when compared with placebo (59% vs 49%; P < .001). Ranolazine was not found to increase the incidence of hypoglycemia.
A subgroup analysis of MERLIN-TIMI 36 evaluated the effects of ranolazine compared with those of placebo on fasting plasma glucose and HbA1c in patients with moderate DM (HbA1c ≥ 6% but < 8%, fasting plasma glucose < 250 mg/dL) and severe DM (A1c ≥ 8%, fasting plasma glucose 150-400 mg/dL).14 A significant reduction in HbA1c with ranolazine in addition to standard of care antidiabetes treatment was observed among both groups. The placebo-corrected decrease in HbA1c in the moderate DM group was 0.28% (95% confidence interval [CI] -0.55 to 0; P = .045) and in the severe DM group was 0.59% (95% CI -0.99 to -0.20; P < .001).
In a trial designed to evaluate change in HbA1c in patients taking ranolazine 1,000 mg twice daily compared with that of placebo, ranolazine led to a greater decrease in HbA1c compared with that of placebo (placebo corrected change in HbA1c -0.56%, P = .001).15 In addition, a higher percentage of patients achieved HbA1c < 7% at 24 weeks in the ranolazine group compared with that of placebo (41.2% vs 25.7%; P = .001). No patient experienced severe hypoglycemia or had documented hypoglycemia in this study.
These trials suggest that ranolazine, in addition to decreasing anginal events, is potentially beneficial in achieving better control of DM. However, more studies are needed to determine this benefit. In addition, no trials have examined the 500-mg twice daily dose of ranolazine in HbA1c reduction.
The purpose of this study was to evaluate the change in HbA1c among veterans with DM after the initiation of ranolazine. The study compared the percentage of veterans achieving HbA1c < 7% or < 8% after initiation of ranolazine with the baseline, to determine whether there is a dose-related change in HbA1c among different ranolazine regimens and to determine whether there is a change in the incidence of hypoglycemia after the initiation of ranolazine.
Methods
This was a multicenter, retrospective study. The institutional review board and research and development committee for 3 Veterans Affairs medical centers (VAMCs) approved this study and waived informed consent. Additionally, this study was approved for access to national patient information through the Corporate Data Warehouse (CDW).
Subjects were eligible for inclusion in this study if they were aged ≥ 18 years, had a diagnosis of type 2 DM, and received their first prescription of ranolazine at a VAMC from January 1, 2008 through March 31, 2015. Exclusion criteria included subjects with no baseline HbA1c (defined as the HbA1c result closest to the ranolazine initiation date and within 90 days before to 14 days after ranolazine initiation), no follow-up HbA1c (defined as the first HbA1c result within 60 to 180 days after the ranolazine initiation date), any change to their DM medication regimen during the follow-up period, or who discontinued ranolazine prior to collection of the follow-up HbA1c.
Data were collected from the electronic health record (EHR) for each subject from 6 months prior to the ranolazine initiation date through 6 months after the ranolazine initiation date. The ranolazine initiation date was defined as the date ranolazine was picked up in person at a VAMC pharmacy or 7 days after the date filled for medications sent by mail.
The primary endpoint of this study was the change in HbA1c after ranolazine initiation. The secondary endpoint was the percentage of study subjects achieving HbA1c < 7% and < 8% before and after the initiation of ranolazine.
To achieve 80% power to detect a change in HbA1c of 0.4%, a sample size of 52 patients was required. For the primary endpoint, a paired t test was used to test for statistical significance. The McNemar test was used to evaluate for a significant change in subjects achieving an HbA1c < 7% and HbA1c < 8% with the initiation of ranolazine.
Results
A total of 523 patients were evaluated for study inclusion, of which 66 patients were included (Figure). The most common reasons for exclusion included no HbA1c at baseline and changes to the DM medication regimen during follow-up.
Ranolazine at any dose was associated with a change in HbA1c of -0.3% (P < .001).
A dose of 500 mg ranolazine twice daily also was associated with a significant decrease in HbA1c by 0.3% (P = .001). A significant increase in veterans achieving HbA1c < 7% after ranolazine initiation was observed (42.3% before ranolazine initiation vs 73.1% after ranolazine initiation; P = .001), and a nonsignificant increase in veterans achieving HbA1c < 8% was observed (82.7% before ranolazine initiation vs 90.4% after ranolazine initiation, P = .37).
At a dose of 1,000 mg twice daily, a 0.4% decrease in HbA1c was observed. However, this result was not found to be statistically significant (P = .09), and the study was underpowered to detect a significant change in HbA1c at this dose.
Hypoglycemia was not reported in a majority of study patient progress notes; thus, it was not evaluated further.
Discussion
In this study of a veteran population, ranolazine was associated with an HbA1c decrease of 0.3%. This change is less than that observed in previous studies, which may be related to a lower baseline HbA1c for the patients in this study. In addition, a greater percentage of veterans achieved an HbA1c < 7% after initiation of ranolazine compared with that of the baseline.
To the authors’ knowledge, this is the first study evaluating ranolazine and HbA1c in a veteran population. It also is the first study to demonstrate an association between HbA1c lowering and ranolazine at a dose of 500 mg twice daily. These results suggest that in patients with chronic angina and type 2 DM, ranolazine could potentially play a dual role in therapy.
Limitations
The authors recognize several limitations in this study. Given its observational design, it cannot be definitively concluded that the decrease in HbA1c was due to the initiation of ranolazine. While excluding patients with changes to their antidiabetic medication regimen was done in an effort to minimize confounding factors, it is possible that other factors, such as lifestyle, also could explain changes in HbA1c. It is possible that changes to the DM medication regimen were made but not documented in the EHR. In addition, information on hypoglycemia was not readily available; thus, the safety of ranolazine among patients with DM could not be evaluated fully. Finally, the patient population characteristics may limit external validity.
Conclusion
In this observational study, ranolazine was associated with a statistically significant decrease in HbA1c among veterans with DM, which supports previously published literature.9, 13-15 However, no randomized controlled trials have been performed specifically studying the impact of ranolazine on HbA1c among patient with DM. Ideally, future prospective, randomized placebo-controlled studies will take place to further evaluate the association between ranolazine use and HbA1c lowering.
1. Kannel WB, McGee DL. Diabetes and cardiovascular disease—the Framingham study. JAMA. 1979;241(19): 2035-2038.
2. Selvin E, Coresh J, Golden SH, Boland LL, Brancati FL, Steffes MW; Atherosclerosis risk in communities study. Glycemic control, atherosclerosis, and risk factors for cardiovascular disease in individuals with diabetes: the atherosclerosis risk in communities study. Diabetes Care. 2005;28(8):1965-1973.
3. Writing Group Members, Mozaffarian D, Benjamion EJ, et al; American Heart Association Statistics Committee and Stroke Statistics Subcommittee. Heart disease and stroke statistics—2016 update: a report from the American Heart Association. Circulation. 2016;133(4):e38-e360.
4. Conaway DG, O’Keefe JH, Reid KJ, Spertus J. Frequency of undiagnosed diabetes mellitus in patients with acute coronary syndrome. Am J Cardiol. 2005;96(3):363-365.
5. Hiatt WR, Kaul S, Smith RJ. The cardiovascular safety of diabetes drugs—insights from the rosiglitazone experience. N Engl J Med. 2013;369(14):1285-1287.
6. Ning Y, Zhen W, Fu Z, et al. Ranolazine increases β-cell survival and improves glucose homeostasis in low-dose streptozotocin-induced diabetes in mice. J Pharmacol Exp Ther. 2011;337(1):50-58.
7. Ranexa [package insert]. Foster City, CA: Gilead Sciences Inc; 2016.
8. Chaitman BR, Pepine CJ, Parker JO, et al; Combination Assessment of Ranolazine In Stable Angina (CARISA) Investigators. Effects of ranolazine with atenolol, amlodipine, or diltiazem on exercise tolerance and angina frequency in patients with severe chronic angina: a randomized controlled trial. JAMA. 2004;291(3):309-316.
9. Timmis AD, Chaitman BR, Crager M. Effects of ranolazine on exercise tolerance and HbA1c in patients with chronic angina and diabetes. Eur Heart J. 2006;27(1):42-48.
10. Morrow DA, Scirica BM, Karwatowska-Prokopczuk E, et al; MERLIN-TIMI 36 Trial Investigators. Effects of ranolazine on recurrent cardiovascular events in patients with non-ST-elevation acute coronary syndromes: the MERLIN-TIMI 36 randomized trial. JAMA. 2007;297(16):1775-1783.
11. Kosiborod M, Arnold SV, Spertus JA, et al. Evaluation of ranolazine in patients with type 2 diabetes mellitus and chronic stable angina: results from the TERISA randomized clinical trial (Type 2 Diabetes Evaluation of Ranolazine in Subjects With Chronic Stable Angina). J Am Coll Cardiol. 2013;61(20):2038-2045.
12. Arnold SV, McGuire DK, Spertus JA, et al. Effectiveness of ranolazine in patients with type 2 diabetes mellitus and chronic stable angina according to baseline hemoglobin A1c. Am Heart J. 2014;168(4):457-465.e2.
13. Morrow DA, Scirica BM, Chaitman BR, et al; MERLIN-TIMI 36 Trial Investigators. Evaluation of the glycometabolic effects of ranolazine patients with and without diabetes mellitus in the MERLIN-TIMI 36 randomized controlled trial. Circulation. 2009;119(15):2032-2039.
14. Chisholm JW, Goldfine AB, Dhalla AK, et al. Effect of ranolazine on A1c and glucose levels in hyperglycemic patients with non-ST elevation acute coronary syndrome. Diabetes Care. 2010;33(6):1163-1168.
15. Eckel RH, Henry RR, Yue P, et al. Effect of ranolazine monotherapy on glycemic control in subjects with type 2 diabetes. Diabetes Care. 2015;38(7):1189-1196.
Lung Cancer Screening: Translating Research Into Practice (FULL)
According to the National Lung Screening Trial (NLST), use of low-dose computed tomography (LDCT) reduced lung cancer deaths by 20%. That finding led the U.S. Preventive Services Task Force (USPSTF) to recommend screening for high-risk individuals (current and former heavy smokers). And that, in turn, led to hospitals nationwide setting up lung cancer screening programs—a number that rose “dramatically,” according to the National Cancer Institute (NCI), after the Centers for Medicare and Medicaid Services decided to cover LDCT screening for high-risk Medicare beneficiaries.
But how does the screening recommendation pan out in real life? Primary care physicians and pulmonologists alike were concerned about the workability of putting LDCT into real-life practice. And not without basis: Published experience with implementation of lung cancer screening (LCS) is limited, say VHA researchers. Their 3-year demonstration project bears out the concerns, they add.
When they designed the study, the researchers wanted to see how feasible LCS would be in terms of resources and effort, whether patients would take part, what their clinical experience might be, and what type of findings the screenings might produce. The researchers found that establishing and sustaining a screening program requires “significant clinical effort for as-yet uncertain patient benefit.” They also found “wide variation” in both processes and patient experiences among the 8 VA hospitals in the study. Moreover, they found that, although most patients had findings that required follow-up, few had early-stage lung cancers.
Of the 2,106 screened patients in a JAMA Internal Medicine study, 1,257 had nodules. More than half of those required tracking, and 2% required further evaluation, but the findings were not cancer. Just 1.5% had lung cancer. Scans of 857 patients (40.7%) also revealed a variety of incidental findings, such as emphysema, other pulmonary abnormalities, and coronary artery calcification.
The researchers say that implementing a comprehensive program that followed recommendations was “challenging and complex,” requiring new tools and processes for staff as well as for dedicated patient coordination. As an example, they say creating electronic tools to capture the necessary clinical data in real time that met the needs of the screening coordinators proved to be difficult, “even with the VHA’s highly regarded electronic medical record.”
Also, finding out who actually had a smoking history of > 30 pack-years of smoking per the USPSTF recommendation was not easy. Lead investigator Linda Kinsinger, MD, MPH, points out, “People who smoke don’t track that sort of thing as closely as you think they would, and they don’t smoke at the same level for years and years.”
The researchers estimate that nearly 900,000 veterans meet the initial screening criteria for age, smoking history, and medical history, but they caution that accurately identifying the patients and discussing risks and benefits will take “significant effort” for primary care teams. Even if that number were reduced by 16% to account for longer medical contraindications, the number of veterans who might be candidates for annual LCS would be “substantial.” And based on the researchers’ experience, a bit more than half the candidates will agree to be screened.
Although screening programs are a complex endeavor, the researchers say, the results of their study can help the VHA plan for broader implementation of comprehensive screening programs.
“What [the VHA] is reporting is the initial experience for almost everybody,” said Lynn Tanoue, MD, director of the Lung Screening and Nodule Program at Yale Cancer Center in New Haven, Connecticut, in an interview with the NCI. “Until people really started doing lung cancer screening and began to understand the challenges of doing it properly, you couldn’t have known what it was going to be like.” But she adds, “The data from NLST were very clear. We should accept that there is benefit and choose the right population to screen.”
However, although the LDCT screening can find signs of early lung cancer, a biopsy is often necessary. Researchers from Boston University suggest an effective, much less invasive approach: analyzing gene expression in nasal cell samples.
The researchers collected and analyzed nasal cell samples from 505 current and former smokers for gene expression. They found 535 genes that were expressed differently between patients who were diagnosed with lung cancer and those whose lesions were benign.
Comparing those data with data from bronchial airway samples from the same patients, the researchers found changes that were similar between the nose and lung samples of patients with lung cancer, suggesting that smoking might cause similar genetic changes throughout the entire airway.
The researchers used the 30 most prominent changes to create a biomarker panel and tested it in 130 other patients. Compared with a clinical risk factor model that considered age, smoking status, and other factors, the biomarker panel was better at predicting lung cancer. Combining the 2 models further improved detection. “We find that nasal gene expression contains information about the presence of cancer that is independent of standard clinical risk factors,” said one of the co-lead investigators.
Lung cancer screening is still experiencing “growing pains,” the NCI says. And the need for screening is both acute and chronic: A 2015 study found that only 4% of people who meet the criteria for screening actually undergo screening.
These studies not only open avenues for better screening and diagnosis, but also highlight the need for better patient education.
Click here to read the digital edition.
Kinsinger LS, Anderson C, Kim J, et al. JAMA Intern Med. 2017;177(3):399-406.
National Cancer Institute. https://www.cancer.gov/types/lung/research/nlst. Updated September 8, 2014. Accessed April 25, 2017.
National Institutes of Health. https://www.nih.gov/news-events/nih-research-matters/noninvasive-strategies-lung-cancer-testing. Published March 7, 2017. Accessed April
25, 2017.
AEGIS Study Team. J. Natl Cancer Inst. 2017;109(7).
National Cancer Institute. https://www.cancer.gov/news-events/cancer-currents-blog/2017/lung-cancer-screening-challenges. Published February 27, 2017. Accessed April
25, 2017.
According to the National Lung Screening Trial (NLST), use of low-dose computed tomography (LDCT) reduced lung cancer deaths by 20%. That finding led the U.S. Preventive Services Task Force (USPSTF) to recommend screening for high-risk individuals (current and former heavy smokers). And that, in turn, led to hospitals nationwide setting up lung cancer screening programs—a number that rose “dramatically,” according to the National Cancer Institute (NCI), after the Centers for Medicare and Medicaid Services decided to cover LDCT screening for high-risk Medicare beneficiaries.
But how does the screening recommendation pan out in real life? Primary care physicians and pulmonologists alike were concerned about the workability of putting LDCT into real-life practice. And not without basis: Published experience with implementation of lung cancer screening (LCS) is limited, say VHA researchers. Their 3-year demonstration project bears out the concerns, they add.
When they designed the study, the researchers wanted to see how feasible LCS would be in terms of resources and effort, whether patients would take part, what their clinical experience might be, and what type of findings the screenings might produce. The researchers found that establishing and sustaining a screening program requires “significant clinical effort for as-yet uncertain patient benefit.” They also found “wide variation” in both processes and patient experiences among the 8 VA hospitals in the study. Moreover, they found that, although most patients had findings that required follow-up, few had early-stage lung cancers.
Of the 2,106 screened patients in a JAMA Internal Medicine study, 1,257 had nodules. More than half of those required tracking, and 2% required further evaluation, but the findings were not cancer. Just 1.5% had lung cancer. Scans of 857 patients (40.7%) also revealed a variety of incidental findings, such as emphysema, other pulmonary abnormalities, and coronary artery calcification.
The researchers say that implementing a comprehensive program that followed recommendations was “challenging and complex,” requiring new tools and processes for staff as well as for dedicated patient coordination. As an example, they say creating electronic tools to capture the necessary clinical data in real time that met the needs of the screening coordinators proved to be difficult, “even with the VHA’s highly regarded electronic medical record.”
Also, finding out who actually had a smoking history of > 30 pack-years of smoking per the USPSTF recommendation was not easy. Lead investigator Linda Kinsinger, MD, MPH, points out, “People who smoke don’t track that sort of thing as closely as you think they would, and they don’t smoke at the same level for years and years.”
The researchers estimate that nearly 900,000 veterans meet the initial screening criteria for age, smoking history, and medical history, but they caution that accurately identifying the patients and discussing risks and benefits will take “significant effort” for primary care teams. Even if that number were reduced by 16% to account for longer medical contraindications, the number of veterans who might be candidates for annual LCS would be “substantial.” And based on the researchers’ experience, a bit more than half the candidates will agree to be screened.
Although screening programs are a complex endeavor, the researchers say, the results of their study can help the VHA plan for broader implementation of comprehensive screening programs.
“What [the VHA] is reporting is the initial experience for almost everybody,” said Lynn Tanoue, MD, director of the Lung Screening and Nodule Program at Yale Cancer Center in New Haven, Connecticut, in an interview with the NCI. “Until people really started doing lung cancer screening and began to understand the challenges of doing it properly, you couldn’t have known what it was going to be like.” But she adds, “The data from NLST were very clear. We should accept that there is benefit and choose the right population to screen.”
However, although the LDCT screening can find signs of early lung cancer, a biopsy is often necessary. Researchers from Boston University suggest an effective, much less invasive approach: analyzing gene expression in nasal cell samples.
The researchers collected and analyzed nasal cell samples from 505 current and former smokers for gene expression. They found 535 genes that were expressed differently between patients who were diagnosed with lung cancer and those whose lesions were benign.
Comparing those data with data from bronchial airway samples from the same patients, the researchers found changes that were similar between the nose and lung samples of patients with lung cancer, suggesting that smoking might cause similar genetic changes throughout the entire airway.
The researchers used the 30 most prominent changes to create a biomarker panel and tested it in 130 other patients. Compared with a clinical risk factor model that considered age, smoking status, and other factors, the biomarker panel was better at predicting lung cancer. Combining the 2 models further improved detection. “We find that nasal gene expression contains information about the presence of cancer that is independent of standard clinical risk factors,” said one of the co-lead investigators.
Lung cancer screening is still experiencing “growing pains,” the NCI says. And the need for screening is both acute and chronic: A 2015 study found that only 4% of people who meet the criteria for screening actually undergo screening.
These studies not only open avenues for better screening and diagnosis, but also highlight the need for better patient education.
Click here to read the digital edition.
Kinsinger LS, Anderson C, Kim J, et al. JAMA Intern Med. 2017;177(3):399-406.
National Cancer Institute. https://www.cancer.gov/types/lung/research/nlst. Updated September 8, 2014. Accessed April 25, 2017.
National Institutes of Health. https://www.nih.gov/news-events/nih-research-matters/noninvasive-strategies-lung-cancer-testing. Published March 7, 2017. Accessed April
25, 2017.
AEGIS Study Team. J. Natl Cancer Inst. 2017;109(7).
National Cancer Institute. https://www.cancer.gov/news-events/cancer-currents-blog/2017/lung-cancer-screening-challenges. Published February 27, 2017. Accessed April
25, 2017.
Enhanced Melanoma Diagnosis With Multispectral Digital Skin Lesion Analysis
Early detection of melanoma, which is known to improve survival rates, remains a challenge for dermatologists. Suspicious pigmented lesions typically are evaluated via clinical examination and dermoscopy; however, new technologies are being developed to provide additional objective information for clinicians to incorporate into their biopsy decisions.
Multispectral digital skin lesion analysis (MSDSLA) uses 10 bands of visible and near-infrared light (430–950 nm) to image and analyze pigmented skin lesions (PSLs) down to 2.5 mm below the skin surface and measures the distribution of melanin using 75 unique algorithms to determine the degree of the morphologic disorder. Using a logical regression model previously validated on a set of 1632 PSLs, the probability of melanoma and probability of being a melanoma/PSL of high-risk malignant potential are then provided to the clinician.1
In this study, we analyzed aggregate data from 7 prior studies2-8 to better determine how MSDSLA impacts the biopsy decisions of dermatologists and nondermatologists following clinical examination and dermoscopic evaluation of PSLs.
Methods
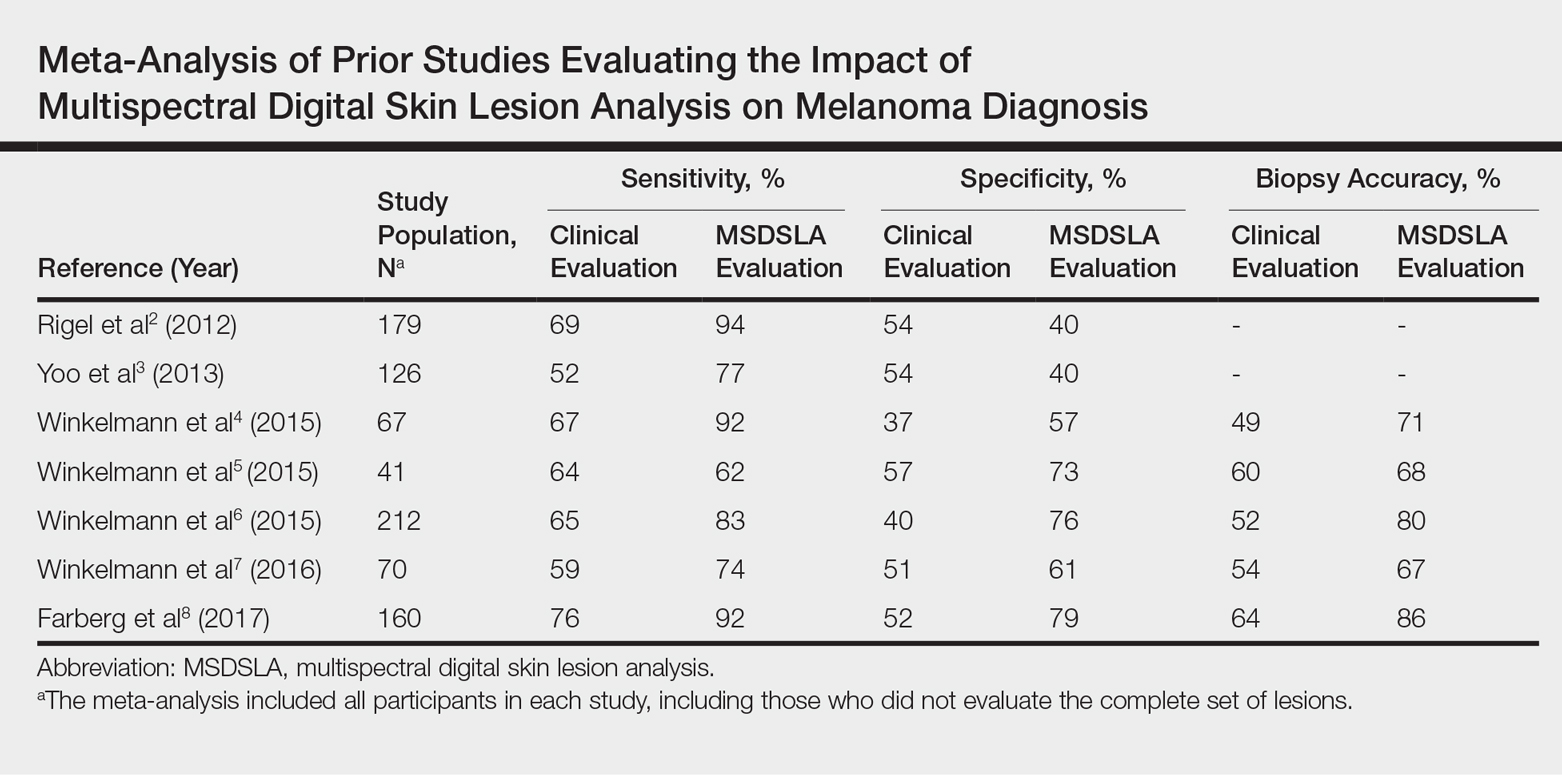
Results
Overall sensitivity for the detection of melanoma or other high-grade PSLs improved from 70% on clinical and dermoscopic evaluation to 88% after MSDSLA information was provided (P<.0001), and specificity increased from 52% to 58% (P<.001). Diagnostic accuracy also improved from 59% on clinical evaluation to 69% after review of MSDSLA findings (P<.0001). The positive predictive value of biopsy decisions was 47% following clinical evaluation, which improved to 56% after evaluation of MSDSLA findings (P<.001), and the negative predictive value increased from 74% to 89% (P<.0001). The overall percentage of lesions selected for biopsy did not significantly change following MSDSLA data integration (57% vs 60%)(Figure). Given that similar numbers of lesions were biopsied with improved sensitivity and specificity, the integration of MSDSLA data into the biopsy decision led to an improved biopsy ratio (ratio of melanomas biopsied to total biopsies) and fewer unnecessary biopsies.
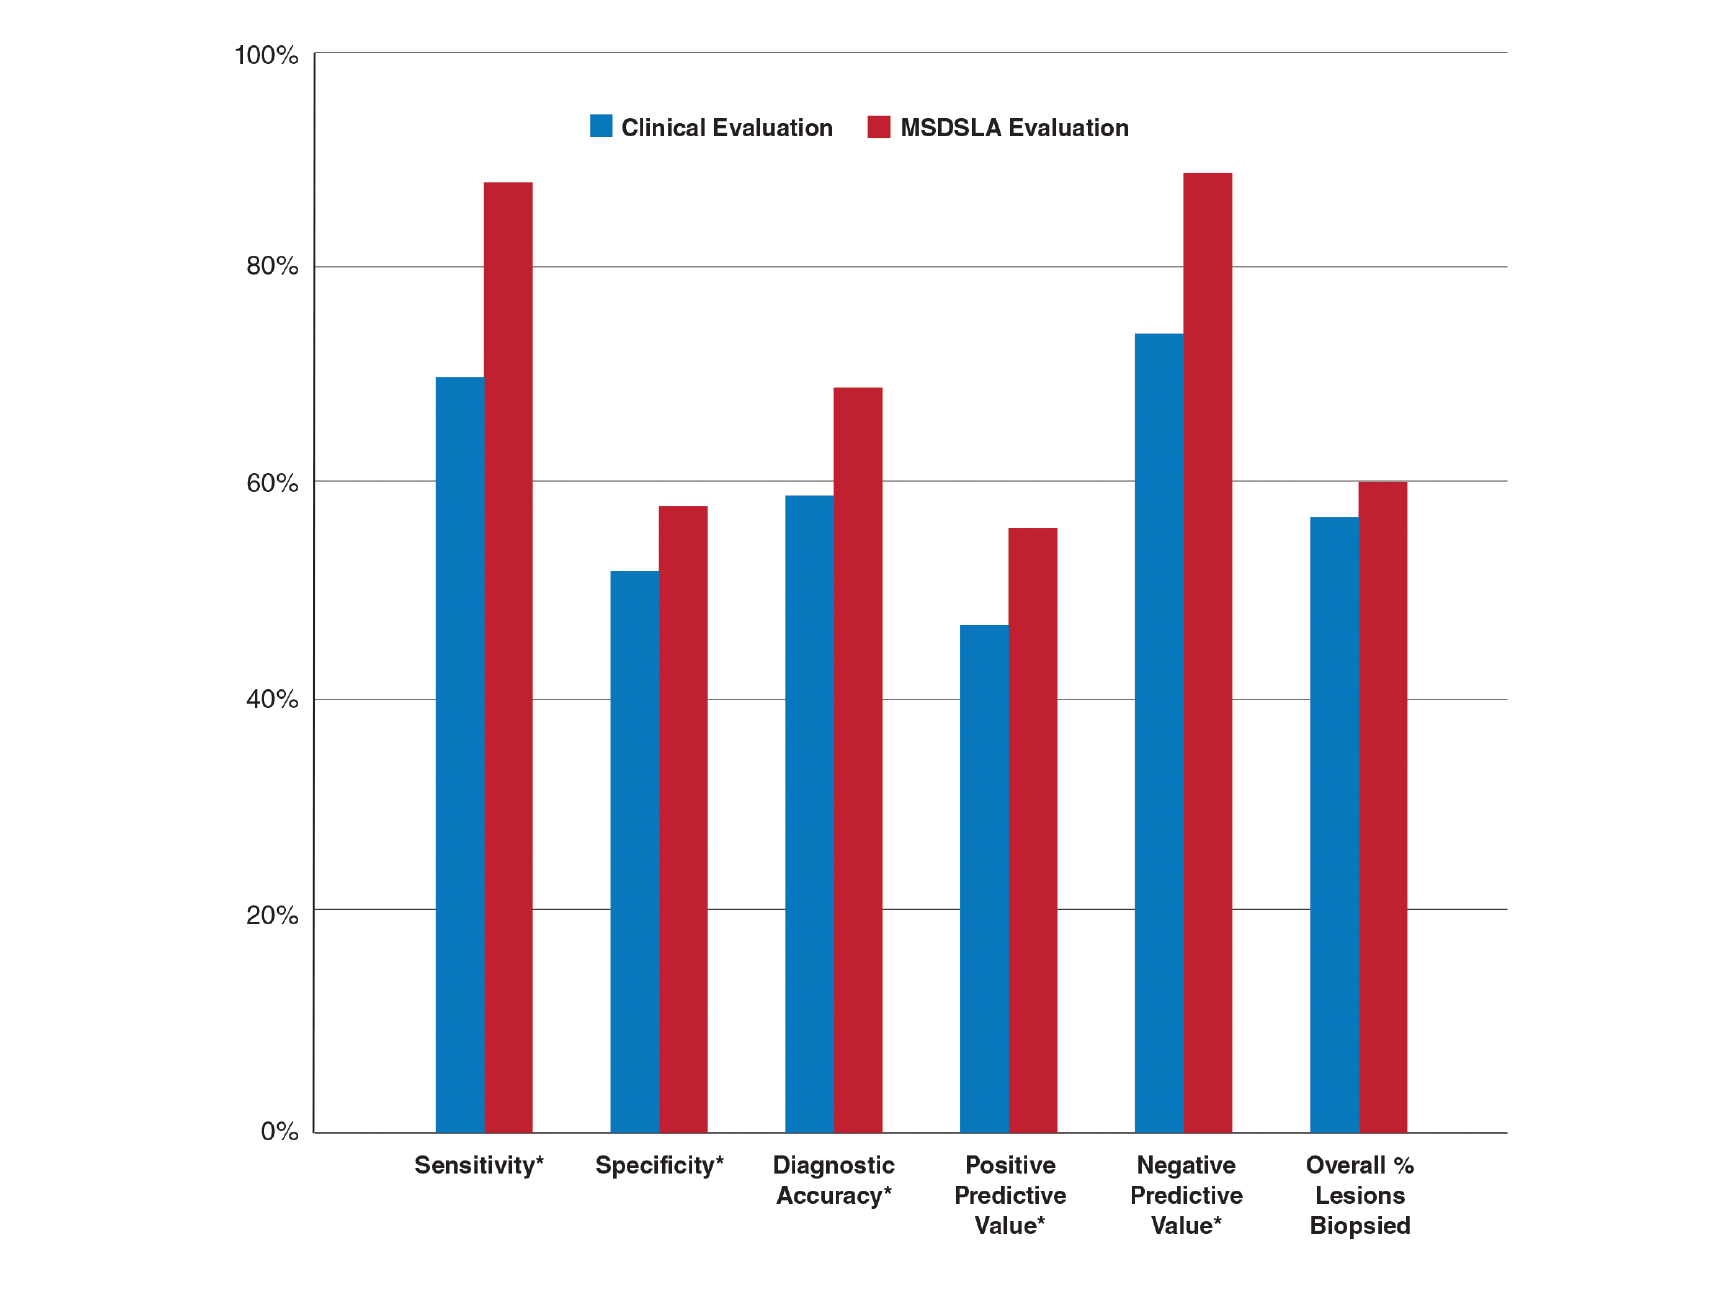
Comment
Our broad analysis further supported the findings of prior studies that decisions to biopsy clinically suspicious PSLs are more sensitive, specific, and accurate when practitioners are provided MSDSLA information following clinical examination.2-8
Given the evolution in health care economics, it is clear that greater emphasis will continue to be placed on superior, evidence-based, effective care. The reported diagnostic sensitivities and specificities of clinical evaluation and dermoscopy for melanoma detection vary widely throughout the literature, with sensitivities ranging from 58% to over 90% and specificities ranging from 77% to 99%.9-11
Our study had several limitations. For this analysis to be more representative of lesion biopsy selection in the clinical setting, biopsy sensitivity (correctly identifying lesions appropriate for biopsy) vs melanoma sensitivity (identifying a lesion as melanoma) was used.13 The overall sensitivity found was within the range of prior studies,2-8 but this approach may have potentially led to a lower specificity due to an increased number of lesions biopsied. Additionally, the melanomas selected for these studies were early (malignant melanoma in situ or mean thickness of invasive malignant melanoma of 0.3 mm), and the nonmelanomas (including low-grade dysplastic nevi) were not necessarily diagnostically straightforward. This may have led to the clinical and dermoscopic sensitivity and specificity noted being lower than in some prior studies.9-11
The risk of missing a melanoma with MSDSLA devices has led manufacturers to strive for a high sensitivity for their devices, leading to lower specificity as a consequence. For this reason and other ambiguous practical considerations (eg, device and patient costs, difficulty with insurance reimbursement), the adoption of this technology into routine clinical practice has remained relatively static; however, using enhanced diagnostic technologies such as MSDSLA may help with more accurate identification of high-risk PSLs, thereby leading to earlier detection and overall less expensive, more cost-effective treatment of melanoma.
- Monheit G, Cognetta AB, Ferris L, et al. The performance of MelaFind: a prospective multicenter study. Arch Dermatol. 2011;147:188-194.
- Rigel DS, Roy M, Yoo J, et al. Impact of guidance from a computer-aided multispectral digital skin lesion analysis device on decision to biopsy lesions clinically suggestive of melanoma. Arch Dermatol. 2012;148:541-543.
- Yoo J, Rigel DS, Roy M, et al. Impact of guidance from a multispectral digital skin lesion analysis device on dermatology residents decisions to biopsy lesions clinically suggestive of melanoma. J Am Acad Dermatol. 2013;68:AB152.
- Winkelmann RR, Yoo J, Tucker N, et al. Impact of guidance provided by a multispectral digital skin lesion analysis device following dermoscopy on decisions to biopsy atypical melanocytic lesions. J Clin Aesthet Dermatol. 2015;8:21-24.
- Winkelmann RR, Hauschild A, Tucker N, et al. The impact of multispectral digital skin lesion analysis on German dermatologist decisions to biopsy atypical pigmented lesions with clinical characteristics of melanoma. J Clin Aesthet Dermatol. 2015;8:27-29.
- Winkelmann RR, Tucker N, White R, et al. Pigmented skin lesion biopsies after computer-aided multispectral digital skin lesion analysis. J Am Osteopath Assoc. 2015;115:666-669.
- Winkelmann RR, Farberg AS, Tucker N, et al. Enhancement of international dermatologists’ pigmented skin lesion biopsy decisions following dermoscopy with subsequent integration of multispectral digital skin lesion analysis [published online July 1, 2016]. J Clin Aesthet Dermatol. 2016;9:53-55.
- Farberg AS, Winkelmann RR, Tucker N, et al. The impact of quantitative data provided by a multi-spectral digital skin lesion analysis device on dermatologists’ decisions to biopsy pigmented lesions [published online September 1, 2017]. J Clin Aesthet Dermatol. 2017;10:24-26.
- Wolf IH, Smolle J, Soyer HP, et al. Sensitivity in the clinical diagnosis of malignant melanoma. Melanoma Res. 1998;8:425-429.
- Kittler H, Pehamberger H, Wolff K, et al. Diagnostic accuracy of dermoscopy. Lancet Oncol. 2002;3:159-165.
- Ascierto PA, Palmieri G, Celentano E, et al. Sensitivity and specificity of epiluminescence microscopy: evaluation on a sample of 2731 excised cutaneous pigmented lesions: the Melanoma Cooperative Study. Br J Dermatol. 2000;142:893-898.
- Carli P, Nardini P, Crocetti E, et al. Frequency and characteristics of melanomas missed at a pigmented lesion clinic: a registry-based study. Melanoma Res. 2004;14:403-407.
- Friedman RJ, Gutkowicz-Krusin D, Farber MJ, et al. The diagnostic performance of expert dermoscopists vs a computer-vision system on small-diameter melanomas. Arch Dermatol. 2008;144:476-482.
Early detection of melanoma, which is known to improve survival rates, remains a challenge for dermatologists. Suspicious pigmented lesions typically are evaluated via clinical examination and dermoscopy; however, new technologies are being developed to provide additional objective information for clinicians to incorporate into their biopsy decisions.
Multispectral digital skin lesion analysis (MSDSLA) uses 10 bands of visible and near-infrared light (430–950 nm) to image and analyze pigmented skin lesions (PSLs) down to 2.5 mm below the skin surface and measures the distribution of melanin using 75 unique algorithms to determine the degree of the morphologic disorder. Using a logical regression model previously validated on a set of 1632 PSLs, the probability of melanoma and probability of being a melanoma/PSL of high-risk malignant potential are then provided to the clinician.1
In this study, we analyzed aggregate data from 7 prior studies2-8 to better determine how MSDSLA impacts the biopsy decisions of dermatologists and nondermatologists following clinical examination and dermoscopic evaluation of PSLs.
Methods
Results
Overall sensitivity for the detection of melanoma or other high-grade PSLs improved from 70% on clinical and dermoscopic evaluation to 88% after MSDSLA information was provided (P<.0001), and specificity increased from 52% to 58% (P<.001). Diagnostic accuracy also improved from 59% on clinical evaluation to 69% after review of MSDSLA findings (P<.0001). The positive predictive value of biopsy decisions was 47% following clinical evaluation, which improved to 56% after evaluation of MSDSLA findings (P<.001), and the negative predictive value increased from 74% to 89% (P<.0001). The overall percentage of lesions selected for biopsy did not significantly change following MSDSLA data integration (57% vs 60%)(Figure). Given that similar numbers of lesions were biopsied with improved sensitivity and specificity, the integration of MSDSLA data into the biopsy decision led to an improved biopsy ratio (ratio of melanomas biopsied to total biopsies) and fewer unnecessary biopsies.
Comment
Our broad analysis further supported the findings of prior studies that decisions to biopsy clinically suspicious PSLs are more sensitive, specific, and accurate when practitioners are provided MSDSLA information following clinical examination.2-8
Given the evolution in health care economics, it is clear that greater emphasis will continue to be placed on superior, evidence-based, effective care. The reported diagnostic sensitivities and specificities of clinical evaluation and dermoscopy for melanoma detection vary widely throughout the literature, with sensitivities ranging from 58% to over 90% and specificities ranging from 77% to 99%.9-11
Our study had several limitations. For this analysis to be more representative of lesion biopsy selection in the clinical setting, biopsy sensitivity (correctly identifying lesions appropriate for biopsy) vs melanoma sensitivity (identifying a lesion as melanoma) was used.13 The overall sensitivity found was within the range of prior studies,2-8 but this approach may have potentially led to a lower specificity due to an increased number of lesions biopsied. Additionally, the melanomas selected for these studies were early (malignant melanoma in situ or mean thickness of invasive malignant melanoma of 0.3 mm), and the nonmelanomas (including low-grade dysplastic nevi) were not necessarily diagnostically straightforward. This may have led to the clinical and dermoscopic sensitivity and specificity noted being lower than in some prior studies.9-11
The risk of missing a melanoma with MSDSLA devices has led manufacturers to strive for a high sensitivity for their devices, leading to lower specificity as a consequence. For this reason and other ambiguous practical considerations (eg, device and patient costs, difficulty with insurance reimbursement), the adoption of this technology into routine clinical practice has remained relatively static; however, using enhanced diagnostic technologies such as MSDSLA may help with more accurate identification of high-risk PSLs, thereby leading to earlier detection and overall less expensive, more cost-effective treatment of melanoma.
- Monheit G, Cognetta AB, Ferris L, et al. The performance of MelaFind: a prospective multicenter study. Arch Dermatol. 2011;147:188-194.
- Rigel DS, Roy M, Yoo J, et al. Impact of guidance from a computer-aided multispectral digital skin lesion analysis device on decision to biopsy lesions clinically suggestive of melanoma. Arch Dermatol. 2012;148:541-543.
- Yoo J, Rigel DS, Roy M, et al. Impact of guidance from a multispectral digital skin lesion analysis device on dermatology residents decisions to biopsy lesions clinically suggestive of melanoma. J Am Acad Dermatol. 2013;68:AB152.
- Winkelmann RR, Yoo J, Tucker N, et al. Impact of guidance provided by a multispectral digital skin lesion analysis device following dermoscopy on decisions to biopsy atypical melanocytic lesions. J Clin Aesthet Dermatol. 2015;8:21-24.
- Winkelmann RR, Hauschild A, Tucker N, et al. The impact of multispectral digital skin lesion analysis on German dermatologist decisions to biopsy atypical pigmented lesions with clinical characteristics of melanoma. J Clin Aesthet Dermatol. 2015;8:27-29.
- Winkelmann RR, Tucker N, White R, et al. Pigmented skin lesion biopsies after computer-aided multispectral digital skin lesion analysis. J Am Osteopath Assoc. 2015;115:666-669.
- Winkelmann RR, Farberg AS, Tucker N, et al. Enhancement of international dermatologists’ pigmented skin lesion biopsy decisions following dermoscopy with subsequent integration of multispectral digital skin lesion analysis [published online July 1, 2016]. J Clin Aesthet Dermatol. 2016;9:53-55.
- Farberg AS, Winkelmann RR, Tucker N, et al. The impact of quantitative data provided by a multi-spectral digital skin lesion analysis device on dermatologists’ decisions to biopsy pigmented lesions [published online September 1, 2017]. J Clin Aesthet Dermatol. 2017;10:24-26.
- Wolf IH, Smolle J, Soyer HP, et al. Sensitivity in the clinical diagnosis of malignant melanoma. Melanoma Res. 1998;8:425-429.
- Kittler H, Pehamberger H, Wolff K, et al. Diagnostic accuracy of dermoscopy. Lancet Oncol. 2002;3:159-165.
- Ascierto PA, Palmieri G, Celentano E, et al. Sensitivity and specificity of epiluminescence microscopy: evaluation on a sample of 2731 excised cutaneous pigmented lesions: the Melanoma Cooperative Study. Br J Dermatol. 2000;142:893-898.
- Carli P, Nardini P, Crocetti E, et al. Frequency and characteristics of melanomas missed at a pigmented lesion clinic: a registry-based study. Melanoma Res. 2004;14:403-407.
- Friedman RJ, Gutkowicz-Krusin D, Farber MJ, et al. The diagnostic performance of expert dermoscopists vs a computer-vision system on small-diameter melanomas. Arch Dermatol. 2008;144:476-482.
Practice Points
- Multispectral digital skin lesion analysis (MSDSLA) can be a valuable tool in the evaluation of pigmented skin lesions (PSLs).
- MSDSLA may help to better identify high-risk PSLs and improve cost of care.
Mohs Micrographic Surgery for Digital Melanoma and Nonmelanoma Skin Cancers
Mohs micrographic surgery (MMS) is a specialized surgical technique for the treatment of melanoma and nonmelanoma skin cancers (NMSCs).1-3 The procedure involves surgical excision, histopathologic examination, precise mapping of malignant tissue, and wound management. Indications for MMS in skin cancer patients include recurring lesions, lesions in high-risk anatomic locations, aggressive histologic subtypes (ie, morpheaform, micronodular, infiltrative, high-grade, poorly differentiated), perineural invasion, large lesion size (>2 cm in diameter), poorly defined lateral or vertical clinical borders, rapid growth of the lesion, immunocompromised status, and sites of positive margins on prior excision. The therapeutic advantages of MMS include tissue conservation and optimal margin control in cosmetically or functionally sensitive areas, such as acral sites (eg, hands, feet, digits).1,3
The intricacies of the nail apparatus complicate diagnostic biopsy and precise delineation of peripheral margins in digital skin cancers; thus, early diagnosis and intraoperative histologic examination of the margins are essential. Traditionally, the surgical approach to subungual cutaneous tumors such as melanoma has included digital amputation4; however, a study of the treatment of subungual melanoma revealed no difference in survival based on the level of amputation, therefore advocating for less radical treatment.4
Interestingly, MMS for cutaneous tumors localized to the digits is not frequently reviewed in the dermatologic literature. We present a retrospective case series evaluating the clinical outcomes of digital melanoma and NMSCs treated with MMS.
Methods
A retrospective chart review was performed at a private dermatology practice to identify patients who underwent MMS for melanoma or NMSC localized to the digits from January 2009 to December 2014. All patients were treated in the office by 1 Mohs surgeon (A.H.) and were evaluated before and after MMS. Data were collected from the electronic medical record of the practice, including patient demographics, histopathologic diagnosis, tumor status (primary or recurrent lesion), anatomic site of the tumor, preoperative and postoperative size of the lesion, number of MMS stages, surgical repair technique, postoperative complications, and follow-up period.
Results
Twenty-seven patients (13 male, 14 female) with a total of 28 lesions (malignant melanoma or NMSC) localized to the digits were identified (Table). The mean age at the time of MMS was 64.07 years.
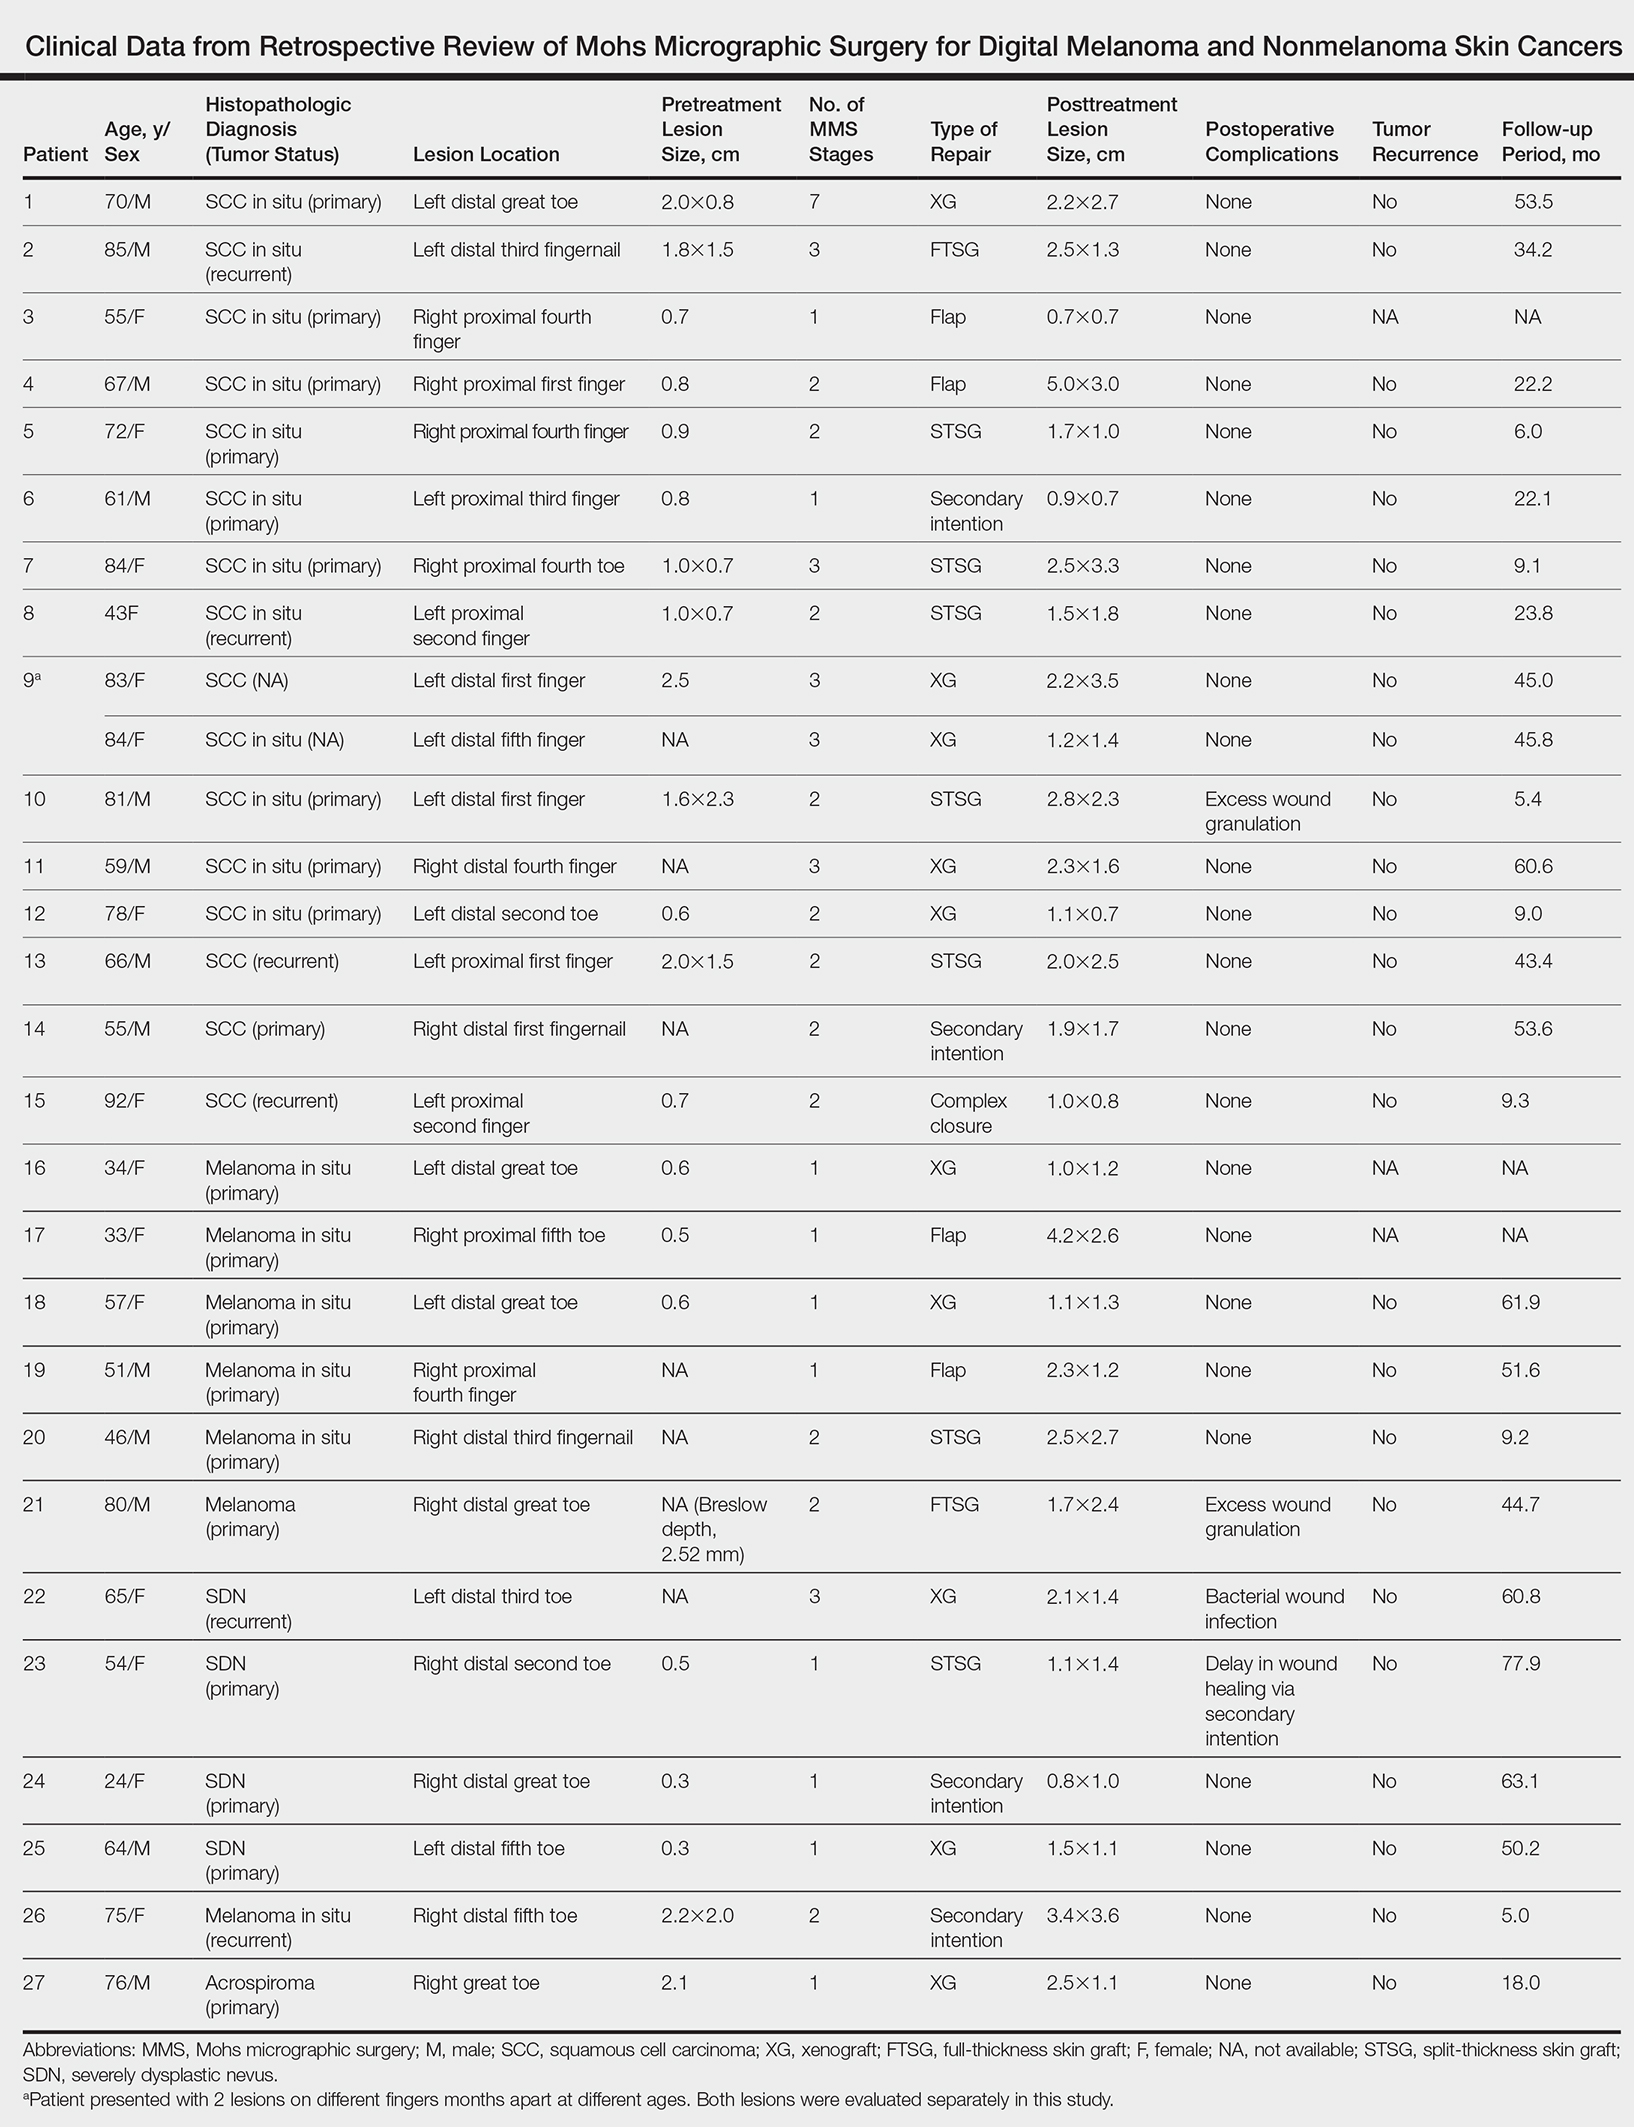
Surgical techniques used for repair following MMS included xenograft (10/28 [35.71%]); split-thickness skin graft (7/28 [25.0%]); secondary intention (4/28 [14.29%]); flap (4/28 [14.29%]); full-thickness skin graft (2/28 [7.14%]); and complex closure (1/28 [3.57%]). Clinical preoperative, operative, and postoperative photos from Patient 21 in this series are shown here (Figure). Two patients required bony phalanx resection due to invasion of the tumor into the periosteum: 1 had a malignant melanoma (Breslow depth, 2.52 mm); the other had an SCC. In addition, following removal of a severely dysplastic nevus, debulked tissue revealed melanoma in 1 patient.
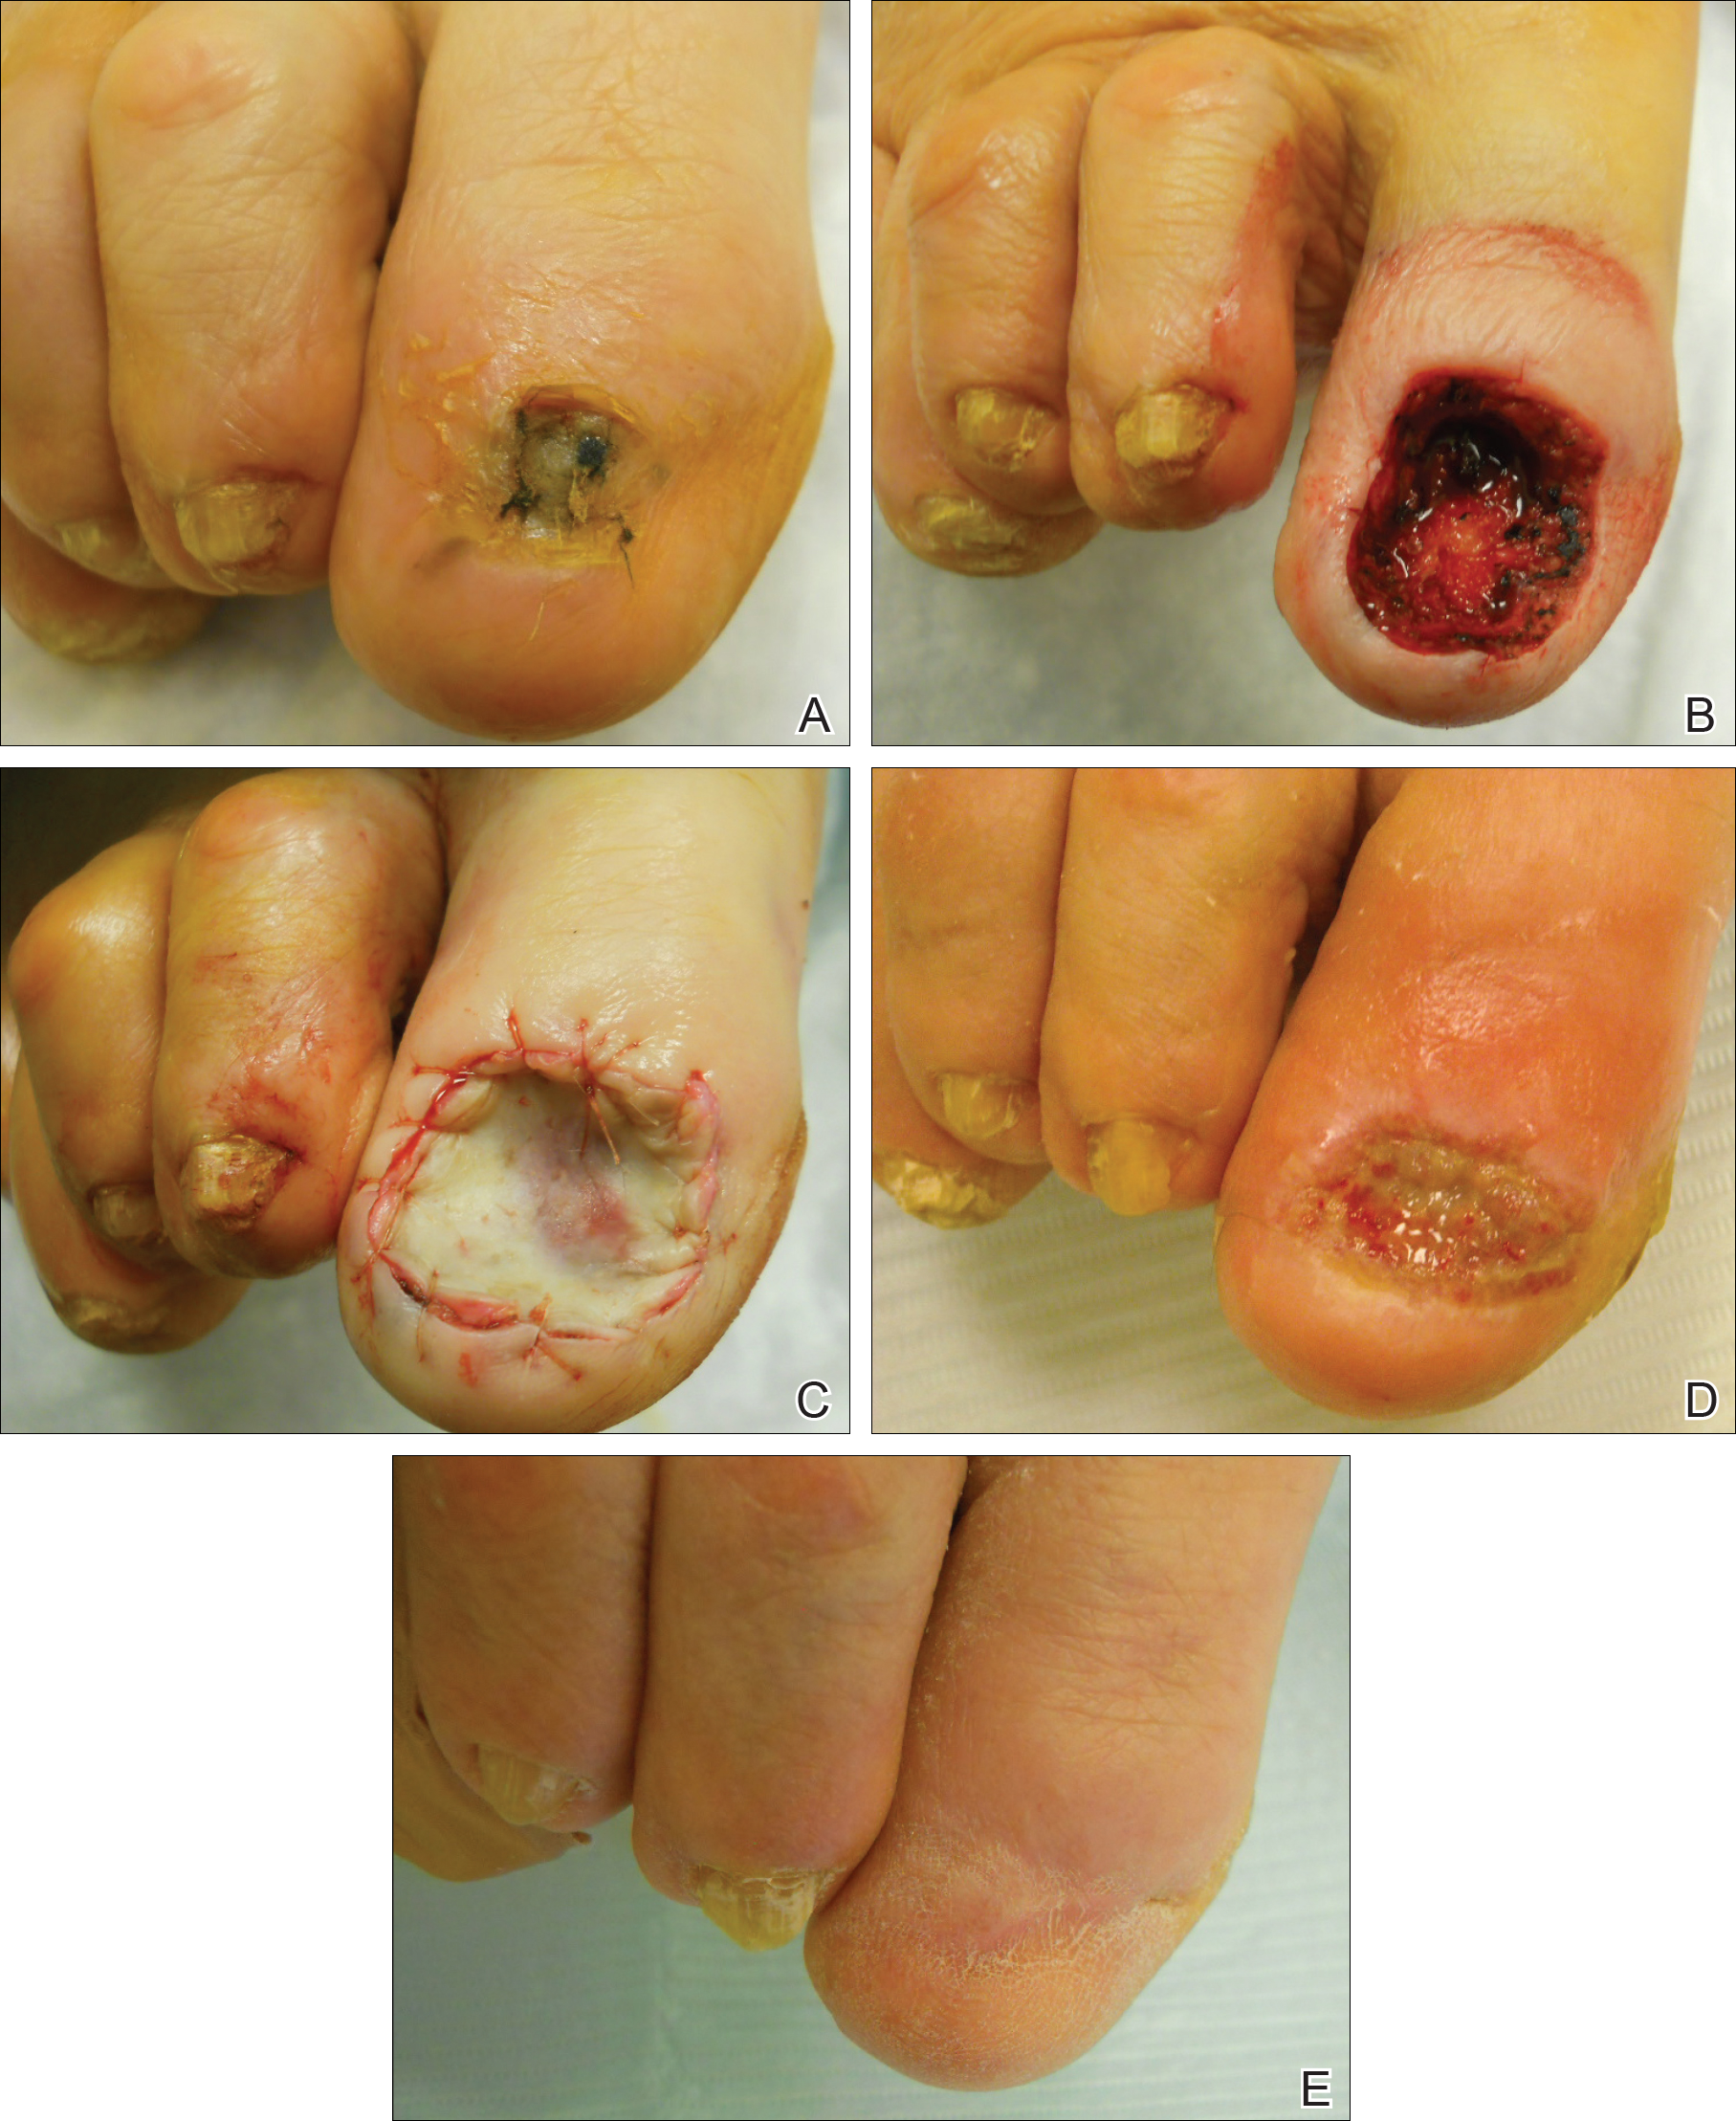
Postoperative complications were noted in 4 (14.29%) of 28 MMS procedures, including bacterial wound infection (3.57%), excess granulation tissue that required wound debridement (7.14%), and delay in wound healing (3.57%). Follow-up data were available for 25 of the 28 MMS procedures (mean follow-up, 35.4 months), during which no recurrences were observed.
Comment
Mohs micrographic surgery is a specialized technique used in the treatment of cutaneous tumors, including basal cell carcinoma, SCC, melanoma in situ, atypical fibroxanthoma, dermatofibrosarcoma protuberans, sebaceous carcinoma, microcystic adnexal carcinoma, and Merkel cell carcinoma, among other cutaneous tumors.1-3 Mohs micrographic surgery provides the advantage of tissue conservation as well as optimal margin control in cosmetically or functionally sensitive areas while providing a higher cure rate than surgical excision. During the procedure, the surgical margin is examined histologically, thus ensuring definitive removal of the tumor but minimal loss of surrounding normal tissue.1-3 Mohs micrographic surgery is particularly useful for treating lesions on acral sites (eg, hands, feet, and digits).3-5
The treatment of digital skin cancers has evolved over the past 50 years with advancements resulting in more precise, tissue-sparing methods, in contrast to previous treatments such as amputation and wide local excision.6 More specifically, traditional digital amputation for the treatment of subungual melanoma has been reevaluated in multiple studies, which did not demonstrate a statistically significant difference in survival based on the level of amputation, thereby favoring less radical treatment.4,6 Moehrle et al7 found no statistical difference in recurrence rate when comparing patients with digital melanomas treated with partial amputation and those treated with digit-sparing surgery with limited excision and histologic evaluation of margins. Additionally, in a study conducted by Lazar et al,8 no recurrence of 13 subungual malignancies treated with MMS that utilized a full-thickness graft was reported at 4-year follow-up. In a large retrospective series of digital melanomas treated with MMS, Terushkin et al5 reported that 96.5% (55/57) of patients with primary melanomas that were treated with MMS avoided amputation, and the 5- and 10-year melanoma-specific survival rates for all patients treated with MMS were 95.0% and 82.6%, respectively.
In our study, cutaneous malignancies were located most often on the fingers, and the most common skin cancer identified was SCC in situ. The literature has shown that SCC in situ and SCC are the most common cutaneous neoplasms of the digits and nail unit.9 The most common specific anatomic site of cutaneous malignancy in our study was the great toe, followed by the fourth finger. A study conducted by Tan et al9 revealed that the great toe was the most common location of melanoma of the nail bed and subungual region, followed by the thumb. In contrast, primary subungual SCCs occur most frequently on the finger, with rare cases involving the toes.10
The etiology of digital SCC may involve extensive sun exposure, chronic trauma and wounds, and viral infection.9,11 More specifically, the dermatologic literature provides evidence of human papillomavirus (HPV) type 16 involvement in the pathogenesis of digital and periungual SCC. A genital-digital mechanism of spread has been implicated.11,12 An increased recurrence rate of HPV-associated digital SCCs has been reported following MMS, likely secondary to residual postsurgical HPV infection.11,12
Maintaining function and cosmesis of the hands, feet, and digits following MMS can be challenging, sometimes requiring skin grafts and flaps to close the defect. In the 28 MMS procedures evaluated in our study, 19 (67.9%) surgical defects were repaired with a graft (ie, split-thickness skin graft, full-thickness skin graft, xenograft), 4 (14.3%) with a flap (advancement and rotation), 4 (14.3%) by secondary intention, and 1 (3.6%) with primary complex closure.
Surgical grafts can be categorized based on the origin of the graft.2,13 Autografts, derived from the patient’s skin, are the most frequently used dermatologic graft and can be further categorized as full-thickness skin grafts, which include the epidermis and the entire dermis, thus preserving adnexal structures, and split-thickness skin grafts, which include the epidermis and partial dermis.2,13
A cross-sectional survey of fellowship-trained Mohs surgeons revealed that more than two-thirds of repairs for cutaneous acral cancers were performed using a primary closure technique, and one-fourth of closures were performed using secondary intention.15 Of the less frequently utilized skin-graft repairs, more were for acral lesions on the legs than on the arms.14 The type of procedure and graft used is dependent on multiple variables, including the anatomic location of the lesion and final size of the defect following MMS.2 Similarly, the use of specific types of sutures depends on the anatomic location of the lesion, relative thickness of the skin, degree of tension, and desired cosmetic result.15 The expertise of a hand surgeon may be required, particularly in cases in which the extensor tendon of the distal interphalangeal joint is compromised, manifested by a droopy fingertip when the hand is held horizontally. Additionally, special attention should be paid to removing the entire nail matrix before skin grafting for subungual tumors to avoid nail growth under the skin graft.
Evaluation of debulked tissue from digital skin cancers proved to be important in our study. In Patient 21, debulked tissue revealed melanoma following removal of a severely dysplastic nevus. This finding emphasizes the importance of complete excision of such lesions, as remaining underlying portions of the lesion can reveal residual tumor of the same or different histopathology.
In a prospective study, MMS was shown to have a low rate (0.91%; 95% confidence interval, 0.38%-1.45%) of surgical site infection in the absence of prophylactic antibiotics.16 The highest rates of surgical site infection were closely associated with flap closure. In our study, most patients had an uncomplicated and successful postoperative recovery. Only 1 (3.57%) of the 28 MMS procedures (Patient 22) was complicated by a bacterial wound infection postoperatively. The lesion removed in this case was a severely dysplastic melanocytic nevus on the toe. Infection resolved after a course of oral antibiotics, but the underlying cause of the wound infection in the patient was unclear. Other postoperative complications in our study included delayed wound healing and excess granulation tissue requiring wound debridement.
There are limited data in the dermatologic literature regarding outcomes following MMS for the treatment of cutaneous malignancies localized to the digits.
Additional limitations of this case review include its single-center and retrospective design, the small sample size, and 1 Mohs surgeon having performed all surgeries.
Conclusion
This study provides further evidence of the benefit of MMS for the treatment of malignant melanoma and NMSCs of the digits. This procedure provides margin-controlled excision of these malignant neoplasms while preserving maximal normal tissue, thereby providing patients with improved postoperative function and cosmesis. Long-term follow-up data demonstrating a lack of tumor recurrence underscores the assertion that MMS is safe and effective for the treatment of skin cancer of the digits.
- Dim-Jamora KC, Perone JB. Management of cutaneous tumors with mohs micrographic surgery. Semin Plast Surg. 2008;22:247-256.
- McLeod MP, Choudhary S, Alqubaisy YA, et al. Indications for Mohs micrographic surgery. In: Nouri K, ed. Mohs Micrographic Surgery. New York, NY: Springer; 2012:5-13.
- Loosemore MP, Morales-Burgos A, Goldberg LH. Acral lentiginous melanoma of the toe treated using Mohs surgery with sparing of the digit and subsequent reconstruction using split-thickness skin graft. Dermatol Surg. 2013;39:136-138.
- Rayatt SS, Dancey AL, Davison PM. Thumb subungual melanoma: is amputation necessary? J Plast Reconstr Aesthet Surg. 2007;60:635-638.
- Terushkin V, Brodland DG, Sharon DJ, et al. Digit-sparing Mohs surgery for melanoma. Dermatol Surg. 2016;42:83-93.
- Viola KV, Jhaveri MB, Soulos PR, et al. Mohs micrographic surgery and surgical excision for nonmelanoma skin cancer treatment in the Medicare population. Arch Dermatol. 2012;148:473-477.
- Moehrle M, Metzger S, Schippert W. “Functional” surgery in subungual melanoma. Dermatol Surg. 2003;29:366-374.
- Lazar A, Abimelec P, Dumontier C, et al. Full thickness skin graft from nail unit reconstruction. J Hand Surg Br. 2005;30:194-198.
- Tan KB, Moncrieff M, Thompson JF, et al. Subungual melanoma: a study of 124 cases highlighting features of early lesions, potential for histologic reports. Am J Surg Pathol. 2007;31:1902-1912.
- Nasca MR, Innocenzi D, Micali G. Subungual squamous cell carcinoma of the toe: report on three cases. Dermatol Surg. 2004;30:345-348.
- Dika E, Piraccini BM, Balestri RR, et al. Mohs surgery for squamous cell carcinoma of the nail: report of 15 cases. our experience and a long-term follow-up. Br J Dermatol. 2012;167:1310-1314.
- Alam M, Caldwell JB, Eliezri YD. Human papillomavirus-associated digital squamous cell carcinoma: literature review and report of 21 new cases. J Am Acad Dermatol. 2003;48:385-393.
- Filho L, Anselmo J, Dadalti P, et al. Skin grafts in cutaneous oncology. Braz Ann Dermatol. 2006;81:465-472.
- Raimer DW, Group AR, Petitt MS, et al. Porcine xenograft biosynthetic wound dressings for the management of postoperative Mohs wounds. Dermatol Online J. 2011;17:1.
- Alam M, Helenowksi IB, Cohen JL, et al. Association between type of reconstruction after Mohs micrographic surgery and surgeon-, patient-, and tumor-specific features: a cross-sectional study. Dermatol Surg. 2013;39:51-55.
- Rogers HD, Desciak EB, Marcus RP, et al. Prospective study of wound infections in Mohs micrographic surgery using clean surgical technique in the absence of prophylactic antibiotics. J Am Acad Dermatol. 2010;63:842-851.
Mohs micrographic surgery (MMS) is a specialized surgical technique for the treatment of melanoma and nonmelanoma skin cancers (NMSCs).1-3 The procedure involves surgical excision, histopathologic examination, precise mapping of malignant tissue, and wound management. Indications for MMS in skin cancer patients include recurring lesions, lesions in high-risk anatomic locations, aggressive histologic subtypes (ie, morpheaform, micronodular, infiltrative, high-grade, poorly differentiated), perineural invasion, large lesion size (>2 cm in diameter), poorly defined lateral or vertical clinical borders, rapid growth of the lesion, immunocompromised status, and sites of positive margins on prior excision. The therapeutic advantages of MMS include tissue conservation and optimal margin control in cosmetically or functionally sensitive areas, such as acral sites (eg, hands, feet, digits).1,3
The intricacies of the nail apparatus complicate diagnostic biopsy and precise delineation of peripheral margins in digital skin cancers; thus, early diagnosis and intraoperative histologic examination of the margins are essential. Traditionally, the surgical approach to subungual cutaneous tumors such as melanoma has included digital amputation4; however, a study of the treatment of subungual melanoma revealed no difference in survival based on the level of amputation, therefore advocating for less radical treatment.4
Interestingly, MMS for cutaneous tumors localized to the digits is not frequently reviewed in the dermatologic literature. We present a retrospective case series evaluating the clinical outcomes of digital melanoma and NMSCs treated with MMS.
Methods
A retrospective chart review was performed at a private dermatology practice to identify patients who underwent MMS for melanoma or NMSC localized to the digits from January 2009 to December 2014. All patients were treated in the office by 1 Mohs surgeon (A.H.) and were evaluated before and after MMS. Data were collected from the electronic medical record of the practice, including patient demographics, histopathologic diagnosis, tumor status (primary or recurrent lesion), anatomic site of the tumor, preoperative and postoperative size of the lesion, number of MMS stages, surgical repair technique, postoperative complications, and follow-up period.
Results
Twenty-seven patients (13 male, 14 female) with a total of 28 lesions (malignant melanoma or NMSC) localized to the digits were identified (Table). The mean age at the time of MMS was 64.07 years.
Surgical techniques used for repair following MMS included xenograft (10/28 [35.71%]); split-thickness skin graft (7/28 [25.0%]); secondary intention (4/28 [14.29%]); flap (4/28 [14.29%]); full-thickness skin graft (2/28 [7.14%]); and complex closure (1/28 [3.57%]). Clinical preoperative, operative, and postoperative photos from Patient 21 in this series are shown here (Figure). Two patients required bony phalanx resection due to invasion of the tumor into the periosteum: 1 had a malignant melanoma (Breslow depth, 2.52 mm); the other had an SCC. In addition, following removal of a severely dysplastic nevus, debulked tissue revealed melanoma in 1 patient.
Postoperative complications were noted in 4 (14.29%) of 28 MMS procedures, including bacterial wound infection (3.57%), excess granulation tissue that required wound debridement (7.14%), and delay in wound healing (3.57%). Follow-up data were available for 25 of the 28 MMS procedures (mean follow-up, 35.4 months), during which no recurrences were observed.
Comment
Mohs micrographic surgery is a specialized technique used in the treatment of cutaneous tumors, including basal cell carcinoma, SCC, melanoma in situ, atypical fibroxanthoma, dermatofibrosarcoma protuberans, sebaceous carcinoma, microcystic adnexal carcinoma, and Merkel cell carcinoma, among other cutaneous tumors.1-3 Mohs micrographic surgery provides the advantage of tissue conservation as well as optimal margin control in cosmetically or functionally sensitive areas while providing a higher cure rate than surgical excision. During the procedure, the surgical margin is examined histologically, thus ensuring definitive removal of the tumor but minimal loss of surrounding normal tissue.1-3 Mohs micrographic surgery is particularly useful for treating lesions on acral sites (eg, hands, feet, and digits).3-5
The treatment of digital skin cancers has evolved over the past 50 years with advancements resulting in more precise, tissue-sparing methods, in contrast to previous treatments such as amputation and wide local excision.6 More specifically, traditional digital amputation for the treatment of subungual melanoma has been reevaluated in multiple studies, which did not demonstrate a statistically significant difference in survival based on the level of amputation, thereby favoring less radical treatment.4,6 Moehrle et al7 found no statistical difference in recurrence rate when comparing patients with digital melanomas treated with partial amputation and those treated with digit-sparing surgery with limited excision and histologic evaluation of margins. Additionally, in a study conducted by Lazar et al,8 no recurrence of 13 subungual malignancies treated with MMS that utilized a full-thickness graft was reported at 4-year follow-up. In a large retrospective series of digital melanomas treated with MMS, Terushkin et al5 reported that 96.5% (55/57) of patients with primary melanomas that were treated with MMS avoided amputation, and the 5- and 10-year melanoma-specific survival rates for all patients treated with MMS were 95.0% and 82.6%, respectively.
In our study, cutaneous malignancies were located most often on the fingers, and the most common skin cancer identified was SCC in situ. The literature has shown that SCC in situ and SCC are the most common cutaneous neoplasms of the digits and nail unit.9 The most common specific anatomic site of cutaneous malignancy in our study was the great toe, followed by the fourth finger. A study conducted by Tan et al9 revealed that the great toe was the most common location of melanoma of the nail bed and subungual region, followed by the thumb. In contrast, primary subungual SCCs occur most frequently on the finger, with rare cases involving the toes.10
The etiology of digital SCC may involve extensive sun exposure, chronic trauma and wounds, and viral infection.9,11 More specifically, the dermatologic literature provides evidence of human papillomavirus (HPV) type 16 involvement in the pathogenesis of digital and periungual SCC. A genital-digital mechanism of spread has been implicated.11,12 An increased recurrence rate of HPV-associated digital SCCs has been reported following MMS, likely secondary to residual postsurgical HPV infection.11,12
Maintaining function and cosmesis of the hands, feet, and digits following MMS can be challenging, sometimes requiring skin grafts and flaps to close the defect. In the 28 MMS procedures evaluated in our study, 19 (67.9%) surgical defects were repaired with a graft (ie, split-thickness skin graft, full-thickness skin graft, xenograft), 4 (14.3%) with a flap (advancement and rotation), 4 (14.3%) by secondary intention, and 1 (3.6%) with primary complex closure.
Surgical grafts can be categorized based on the origin of the graft.2,13 Autografts, derived from the patient’s skin, are the most frequently used dermatologic graft and can be further categorized as full-thickness skin grafts, which include the epidermis and the entire dermis, thus preserving adnexal structures, and split-thickness skin grafts, which include the epidermis and partial dermis.2,13
A cross-sectional survey of fellowship-trained Mohs surgeons revealed that more than two-thirds of repairs for cutaneous acral cancers were performed using a primary closure technique, and one-fourth of closures were performed using secondary intention.15 Of the less frequently utilized skin-graft repairs, more were for acral lesions on the legs than on the arms.14 The type of procedure and graft used is dependent on multiple variables, including the anatomic location of the lesion and final size of the defect following MMS.2 Similarly, the use of specific types of sutures depends on the anatomic location of the lesion, relative thickness of the skin, degree of tension, and desired cosmetic result.15 The expertise of a hand surgeon may be required, particularly in cases in which the extensor tendon of the distal interphalangeal joint is compromised, manifested by a droopy fingertip when the hand is held horizontally. Additionally, special attention should be paid to removing the entire nail matrix before skin grafting for subungual tumors to avoid nail growth under the skin graft.
Evaluation of debulked tissue from digital skin cancers proved to be important in our study. In Patient 21, debulked tissue revealed melanoma following removal of a severely dysplastic nevus. This finding emphasizes the importance of complete excision of such lesions, as remaining underlying portions of the lesion can reveal residual tumor of the same or different histopathology.
In a prospective study, MMS was shown to have a low rate (0.91%; 95% confidence interval, 0.38%-1.45%) of surgical site infection in the absence of prophylactic antibiotics.16 The highest rates of surgical site infection were closely associated with flap closure. In our study, most patients had an uncomplicated and successful postoperative recovery. Only 1 (3.57%) of the 28 MMS procedures (Patient 22) was complicated by a bacterial wound infection postoperatively. The lesion removed in this case was a severely dysplastic melanocytic nevus on the toe. Infection resolved after a course of oral antibiotics, but the underlying cause of the wound infection in the patient was unclear. Other postoperative complications in our study included delayed wound healing and excess granulation tissue requiring wound debridement.
There are limited data in the dermatologic literature regarding outcomes following MMS for the treatment of cutaneous malignancies localized to the digits.
Additional limitations of this case review include its single-center and retrospective design, the small sample size, and 1 Mohs surgeon having performed all surgeries.
Conclusion
This study provides further evidence of the benefit of MMS for the treatment of malignant melanoma and NMSCs of the digits. This procedure provides margin-controlled excision of these malignant neoplasms while preserving maximal normal tissue, thereby providing patients with improved postoperative function and cosmesis. Long-term follow-up data demonstrating a lack of tumor recurrence underscores the assertion that MMS is safe and effective for the treatment of skin cancer of the digits.
- Dim-Jamora KC, Perone JB. Management of cutaneous tumors with mohs micrographic surgery. Semin Plast Surg. 2008;22:247-256.
- McLeod MP, Choudhary S, Alqubaisy YA, et al. Indications for Mohs micrographic surgery. In: Nouri K, ed. Mohs Micrographic Surgery. New York, NY: Springer; 2012:5-13.
- Loosemore MP, Morales-Burgos A, Goldberg LH. Acral lentiginous melanoma of the toe treated using Mohs surgery with sparing of the digit and subsequent reconstruction using split-thickness skin graft. Dermatol Surg. 2013;39:136-138.
- Rayatt SS, Dancey AL, Davison PM. Thumb subungual melanoma: is amputation necessary? J Plast Reconstr Aesthet Surg. 2007;60:635-638.
- Terushkin V, Brodland DG, Sharon DJ, et al. Digit-sparing Mohs surgery for melanoma. Dermatol Surg. 2016;42:83-93.
- Viola KV, Jhaveri MB, Soulos PR, et al. Mohs micrographic surgery and surgical excision for nonmelanoma skin cancer treatment in the Medicare population. Arch Dermatol. 2012;148:473-477.
- Moehrle M, Metzger S, Schippert W. “Functional” surgery in subungual melanoma. Dermatol Surg. 2003;29:366-374.
- Lazar A, Abimelec P, Dumontier C, et al. Full thickness skin graft from nail unit reconstruction. J Hand Surg Br. 2005;30:194-198.
- Tan KB, Moncrieff M, Thompson JF, et al. Subungual melanoma: a study of 124 cases highlighting features of early lesions, potential for histologic reports. Am J Surg Pathol. 2007;31:1902-1912.
- Nasca MR, Innocenzi D, Micali G. Subungual squamous cell carcinoma of the toe: report on three cases. Dermatol Surg. 2004;30:345-348.
- Dika E, Piraccini BM, Balestri RR, et al. Mohs surgery for squamous cell carcinoma of the nail: report of 15 cases. our experience and a long-term follow-up. Br J Dermatol. 2012;167:1310-1314.
- Alam M, Caldwell JB, Eliezri YD. Human papillomavirus-associated digital squamous cell carcinoma: literature review and report of 21 new cases. J Am Acad Dermatol. 2003;48:385-393.
- Filho L, Anselmo J, Dadalti P, et al. Skin grafts in cutaneous oncology. Braz Ann Dermatol. 2006;81:465-472.
- Raimer DW, Group AR, Petitt MS, et al. Porcine xenograft biosynthetic wound dressings for the management of postoperative Mohs wounds. Dermatol Online J. 2011;17:1.
- Alam M, Helenowksi IB, Cohen JL, et al. Association between type of reconstruction after Mohs micrographic surgery and surgeon-, patient-, and tumor-specific features: a cross-sectional study. Dermatol Surg. 2013;39:51-55.
- Rogers HD, Desciak EB, Marcus RP, et al. Prospective study of wound infections in Mohs micrographic surgery using clean surgical technique in the absence of prophylactic antibiotics. J Am Acad Dermatol. 2010;63:842-851.
Practice Points
- Melanoma and nonmelanoma skin cancers of the digits traditionally have been treated with wide local surgical excision and even amputation.
- Conservative tissue sparing techniques such as Mohs micrographic surgery can be used to treat digital skin cancers with high cure rates and improved functional and cosmetic results.
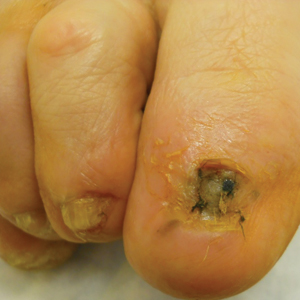
Improving Teamwork and Patient Outcomes with Daily Structured Interdisciplinary Bedside Rounds: A Multimethod Evaluation
Evidence has emerged over the last decade of the importance of the front line patient care team in improving quality and safety of patient care.1-3 Improving collaboration and workflow is thought to increase reliability of care delivery.1 One promising method to improve collaboration is the interdisciplinary ward round (IDR), whereby medical, nursing, and allied health staff attend ward rounds together. IDRs have been shown to reduce the average cost and length of hospital stay,4,5 although a recent systematic review found inconsistent improvements across studies.6 Using the term “interdisciplinary,” however, does not necessarily imply the inclusion of all disciplines necessary for patient care. The challenge of conducting interdisciplinary rounds is considerable in today’s busy clinical environment: health professionals who are spread across multiple locations within the hospital, and who have competing hospital responsibilities and priorities, must come together at the same time and for a set period each day. A survey with respondents from Australia, the United States, and Canada found that only 65% of rounds labelled “interdisciplinary” included a physician.7
While IDRs are not new, structured IDRs involve the purposeful inclusion of all disciplinary groups relevant to a patient’s care, alongside a checklist tool to aid comprehensive but concise daily assessment of progress and treatment planning. Novel, structured IDR interventions have been tested recently in various settings, resulting in improved teamwork, hospital performance, and patient outcomes in the US, including the Structured Interdisciplinary Bedside Round (SIBR) model.8-12
The aim of this study was to assess the impact of the new structure and the associated practice changes on interprofessional working and a set of key patient and hospital outcome measures. As part of the intervention, the hospital established an Acute Medical Unit (AMU) based on the Accountable Care Unit model.13
METHODS
Description of the Intervention
The AMU brought together 2 existing medical wards, a general medical ward and a 48-hour turnaround Medical Assessment Unit (MAU), into 1 geographical location with 26 beds. Prior to the merger, the MAU and general medical ward had separate and distinct cultures and workflows. The MAU was staffed with experienced nurses; nurses worked within a patient allocation model, the workload was shared, and relationships were collegial. In contrast, the medical ward was more typical of the remainder of the hospital: nurses had a heavy workload, managed a large group of longer-term complex patients, and they used a team-based nursing model of care in which senior nurses supervised junior staff. It was decided that because of the seniority of the MAU staff, they should be in charge of the combined AMU, and the patient allocation model of care would be used to facilitate SIBR.
Consultants, junior doctors, nurses, and allied health professionals (including a pharmacist, physiotherapist, occupational therapist, and social worker) were geographically aligned to the new ward, allowing them to participate as a team in daily structured ward rounds. Rounds are scheduled at the same time each day to enable family participation. The ward round is coordinated by a registrar or intern, with input from patient, family, nursing staff, pharmacy, allied health, and other doctors (intern, registrar, and consultant) based on the unit. The patient load is distributed between 2 rounds: 1 scheduled for 10
Data Collection Strategy
The study was set in an AMU in a large tertiary care hospital in regional Australia and used a convergent parallel multimethod approach14 to evaluate the implementation and effect of SIBR in the AMU. The study population consisted of 32 clinicians employed at the study hospital: (1) the leadership team involved in the development and implementation of the intervention and (2) members of clinical staff who were part of the AMU team.
Qualitative Data
Qualitative measures consisted of semistructured interviews. We utilized multiple strategies to recruit interviewees, including a snowball technique, criterion sampling,15 and emergent sampling, so that we could seek the views of both the leadership team responsible for the implementation and “frontline” clinical staff whose daily work was directly affected by it. Everyone who was initially recruited agreed to be interviewed, and additional frontline staff asked to be interviewed once they realized that we were asking about how staff experienced the changes in practice.
The research team developed a semistructured interview guide based on an understanding of the merger of the 2 units as well as an understanding of changes in practice of the rounds (provided in Appendix 1). The questions were pilot tested on a separate unit and revised. Questions were structured into 5 topic areas: planning and implementation of AMU/SIBR model, changes in work practices because of the new model, team functioning, job satisfaction, and perceived impact of the new model on patients and families. All interviews were audio-recorded and transcribed verbatim for analysis.
Quantitative Data
Quantitative data were collected on patient outcome measures: length of stay (LOS), discharge date and time, mode of separation (including death), primary diagnostic category, total hospital stay cost and “clinical response calls,” and patient demographic data (age, gender, and Patient Clinical Complexity Level [PCCL]). The PCCL is a standard measure used in Australian public inpatient facilities and is calculated for each episode of care.16 It measures the cumulative effect of a patient’s complications and/or comorbidities and takes an integer value between 0 (no clinical complexity effect) and 4 (catastrophic clinical complexity effect).
Data regarding LOS, diagnosis (Australian Refined Diagnosis Related Groups [AR-DRG], version 7), discharge date, and mode of separation (including death) were obtained from the New South Wales Ministry of Health’s Health Information Exchange for patients discharged during the year prior to the intervention through 1 year after the implementation of the intervention. The total hospital stay cost for these individuals was obtained from the local Health Service Organizational Performance Management unit. Inclusion criteria were inpatients aged over 15 years experiencing acute episodes of care; patients with a primary diagnostic category of mental diseases and disorders were excluded. LOS was calculated based on ward stay. AMU data were compared with the remaining hospital ward data (the control group). Data on “clinical response calls” per month per ward were also obtained for the 12 months prior to intervention and the 12 months of the intervention.
Analysis
Qualitative Analysis
Qualitative data analysis consisted of a hybrid form of textual analysis, combining inductive and deductive logics.17,18 Initially, 3 researchers (J.P., J.J., and R.C.W.) independently coded the interview data inductively to identify themes. Discrepancies were resolved through discussion until consensus was reached. Then, to further facilitate analysis, the researchers deductively imposed a matrix categorization, consisting of 4 a priori categories: context/conditions, practices/processes, professional interactions, and consequences.19,20 Additional a priori categories were used to sort the themes further in terms of experiences prior to, during, and following implementation of the intervention. To compare changes in those different time periods, we wanted to know what themes were related to implementation and whether those themes continued to be applicable to sustainability of the changes.
Quantitative analysis. Distribution of continuous data was examined by using the one-sample Kolmogorov-Smirnov test. We compared pre-SIBR (baseline) measures using the Student t test for normally distributed data, the Mann-Whitney U z test for nonparametric data (denoted as M-W U z), and χ2 tests for categorical data. Changes in monthly “clinical response calls” between the AMU and the control wards over time were explored by using analysis of variance (ANOVA). Changes in LOS and cost of stay from the year prior to the intervention to the first year of the intervention were analyzed by using generalized linear models, which are a form of linear regression. Factors, or independent variables, included in the models were time period (before or during intervention), ward (AMU or control), an interaction term (time by ward), patient age, gender, primary diagnosis (major diagnostic categories of the AR-DRG version 7.0), and acuity (PCCL). The estimated marginal means for cost of stay for the 12-month period prior to the intervention and for the first 12 months of the intervention were produced. All statistical analyses were performed by using IBM SPSS version 21 (IBM Corp., Armonk, New York) and with alpha set at P < .05.
RESULTS
Qualitative Evaluation of the Intervention
Participants.
Three researchers (RCW, JP, and JJ) conducted in-person, semistructured interviews with 32 clinicians (9 male, 23 female) during a 3-day period. The duration of the interviews ranged from 19 minutes to 68 minutes. Participants consisted of 8 doctors, 18 nurses, 5 allied health professionals, and an administrator. Ten of the participants were involved in the leadership group that drove the planning and implementation of SIBR and the AMU.
Themes
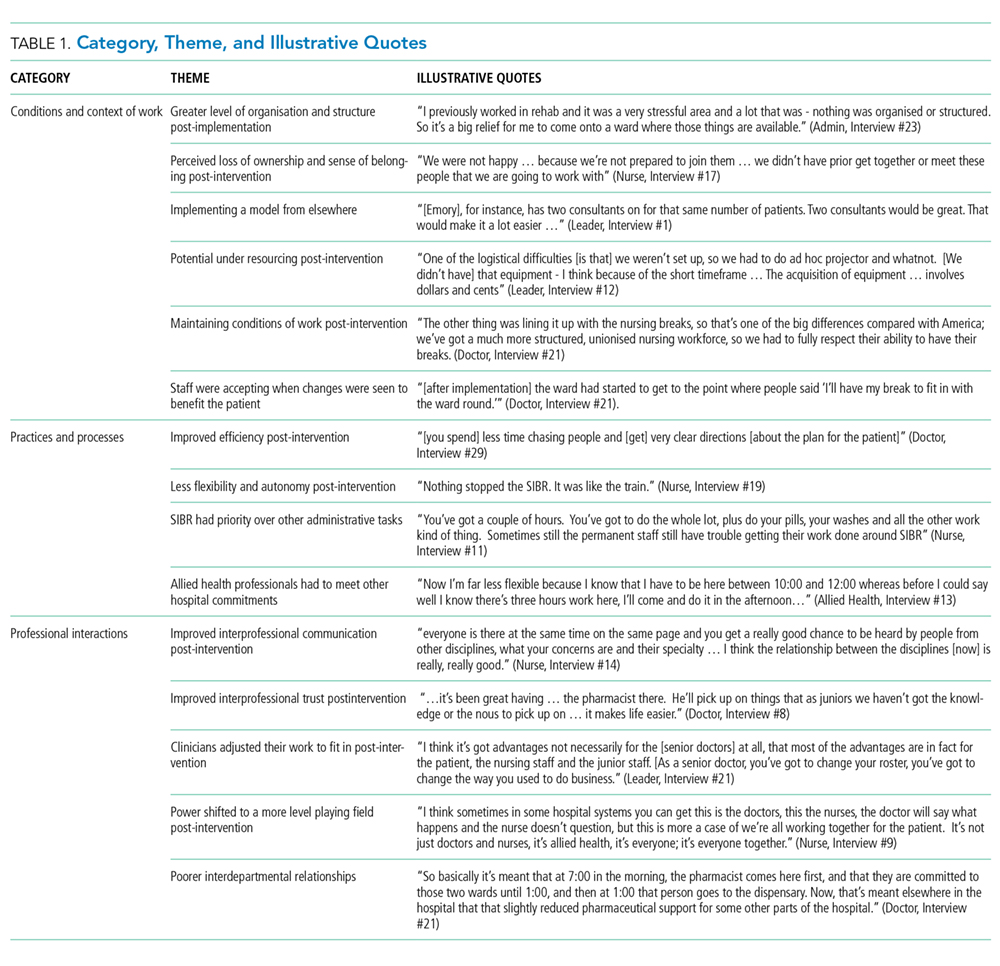
Context and Conditions of Work
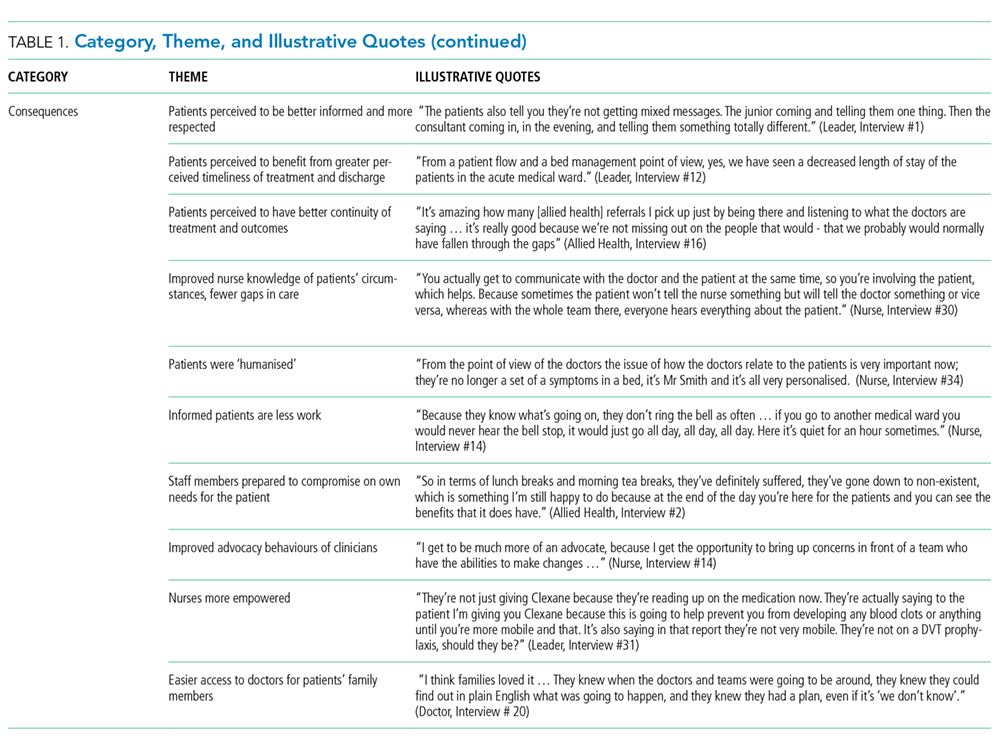
Practices and Processes
Participants perceived postintervention work processes to be more efficient. A primary example was a near-universal approval of the time saved from not “chasing” other professionals now that they were predictably available on the ward. More timely decision-making was thought to result from this predicted availability and associated improvements in communication.
The SIBR enforced a workflow on all staff, who felt there was less flexibility to work autonomously (doctors) or according to patients’ needs (nurses). More junior staff expressed anxiety about delayed completion of discharge-related administrative tasks because of the midday completion of the round. Allied health professionals who had commitments in other areas of the hospital often faced a dilemma about how to prioritize SIBR attendance and activities on other wards. This was managed differently depending on the specific allied health profession and the individuals within that profession.
Professional Interactions
In terms of interprofessional dynamics on the AMU, the implementation of SIBR resulted in a shift in power between the doctors and the nurses. In the old ward, doctors largely controlled the timing of medical rounding processes. In the new AMU, doctors had to relinquish some control over the timing of personal workflow to comply with the requirements of SIBR. Furthermore, there was evidence that this had some impact on traditional hierarchical models of communication and created a more level playing field, as nonmedical professionals felt more empowered to voice their thoughts during and outside of rounds.
The rounds provided much greater visibility of the “big picture” and each profession’s role within it; this allowed each clinician to adjust their work to fit in and take account of others. The process was not instantaneous, and trust developed over a period of weeks. Better communication meant fewer misunderstandings, and workload dropped.
The participation of allied health professionals in the round enhanced clinician interprofessional skills and knowledge. The more inclusive approach facilitated greater trust between clinical disciplines and a development of increased confidence among nursing, allied health, and administrative professionals.
In contrast to the positive impacts of the new model of care on communication and relationships within the AMU, interdepartmental relationships were seen to have suffered. The processes and practices of the new AMU are different to those in the other hospital departments, resulting in some isolation of the unit and difficulties interacting with other areas of the hospital. For example, the trade-offs that allied health professionals made to participate in SIBR often came at the expense of other units or departments.
Consequences
All interviewees lauded the benefits of the SIBR intervention for patients. Patients were perceived to be better informed and more respected, and they benefited from greater perceived timeliness of treatment and discharge, easier access to doctors, better continuity of treatment and outcomes, improved nurse knowledge of their circumstances, and fewer gaps in their care. Clinicians spoke directly to the patient during SIBR, rather than consulting with professional colleagues over the patient’s head. Some staff felt that doctors were now thinking of patients as “people” rather than “a set of symptoms.” Nurses discovered that informed patients are easier to manage.
Staff members were prepared to compromise on their own needs in the interests of the patient. The emphasis on the patient during rounds resulted in improved advocacy behaviors of clinicians. The nurses became more empowered and able to show greater initiative. Families appeared to find it much easier to access the doctors and obtain information about the patient, resulting in less distress and a greater sense of control and trust in the process.
Quantitative Evaluation of the Intervention
Hospital Outcomes
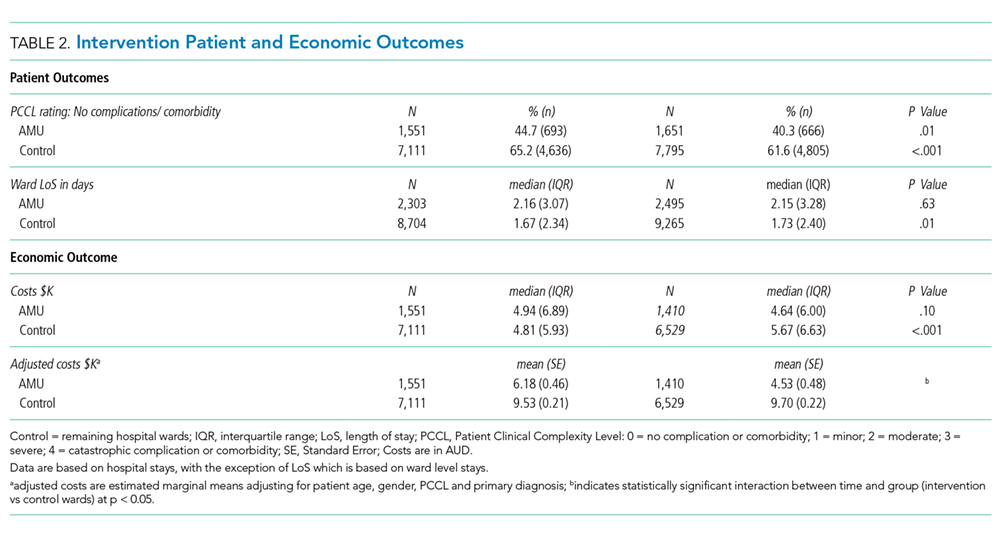
Patient demographics did not change over time within either the AMU or control wards. However, there were significant increases in Patient Clinical Complexity Level (PCCL) ratings for both the AMU (44.7% to 40.3%; P<0.05) and the control wards (65.2% to 61.6%; P < .001). There was not a statistically significant shift over time in median LoS on the ward prior to (2.16 days, IQR 3.07) and during SIBR in the AMU (2.15 days; IQR 3.28), while LoS increased in the control (pre-SIBR: 1.67, 2.34; during SIBR 1.73, 2.40; M-W U z = -2.46, P = .014). Mortality rates were stable across time for both the AMU (pre-SIBR 2.6% [95% confidence interval {CI}, 1.9-3.5]; during SIBR 2.8% [95% CI, 2.1-3.7]) and the control (pre-SIBR 1.3% [95% CI, 1.0-1.5]; during SIBR 1.2% [95% CI, 1.0-1.4]).
The total number of “clinical response calls” or “flags” per month dropped significantly from pre-SIBR to during SIBR for the AMU from a mean of 63.1 (standard deviation 15.1) to 31.5 (10.8), but remained relatively stable in the control (pre-SIBR 72.5 [17.6]; during SIBR 74.0 [28.3]), and this difference was statistically significant (F (1,44) = 9.03; P = .004). There was no change in monthly “red flags” or “rapid response calls” over time (AMU: 10.5 [3.6] to 9.1 [4.7]; control: 40.3 [11.7] to 41.8 [10.8]). The change in total “clinical response calls” over time was attributable to the “yellow flags” or the decline in “calls for clinical review” in the AMU (from 52.6 [13.5] to 22.4 [9.2]). The average monthly “yellow flags” remained stable in the control (pre-SIBR 32.2 [11.6]; during SIBR 32.3 [22.4]). The AMU and the control wards differed significantly in how the number of monthly “calls for clinical review” changed from pre-SIBR to during SIBR (F (1,44) = 12.18; P = .001).
The 2 main outcome measures, LOS and costs, were analyzed to determine whether changes over time differed between the AMU and the control wards after accounting for age, gender, and PCCL. There was no statistically significant difference between the AMU and control wards in terms of change in LOS over time (Wald χ2 = 1.05; degrees of freedom [df] = 1; P = .31). There was a statistically significant interaction for cost of stay, indicating that ward types differed in how they changed over time (with a drop in cost over time observed in the AMU and an increase observed in the control) (Wald χ2 = 6.34; df = 1; P = .012.
DISCUSSION
We report on the implementation of an AMU model of care, including the reorganization of a nursing unit, implementation of IDR, and geographical localization. Our study design allowed a more comprehensive assessment of the implementation of system redesign to include provider perceptions and clinical outcomes.
The 2 very different cultures of the old wards that were combined into the AMU, as well as the fact that the teams had not previously worked together, made the merger of the 2 wards difficult. Historically, the 2 teams had worked in very different ways, and this created barriers to implementation. The SIBR also demanded new ways of working closely with other disciplines, which disrupted older clinical cultures and relationships. While organizational culture is often discussed, and even measured, the full impact of cultural factors when making workplace changes is frequently underestimated.21 The development of a new culture takes time, and it can lag organizational structural changes by months or even years.22 As our interviewees expressed, often emotionally, there was a sense of loss during the merger of the 2 units. While this is a potential consequence of any large organizational change, it could be addressed during the planning stages, prior to implementation, by acknowledging and perhaps honoring what is being left behind. It is safe to assume that future units implementing the rounding intervention will not fully realize commensurate levels of culture change until well after the structural and process changes are finalized, and only then if explicit effort is made to engender cultural change.
Overall, however, the interviewees perceived that the SIBR intervention led to improved teamwork and team functioning. These improvements were thought to benefit task performance and patient safety. Our study is consistent with other research in the literature that reported that greater staff empowerment and commitment is associated with interdisciplinary patient care interventions in front line caregiving teams.23,24 The perception of a more equal nurse-physician relationship resulted in improved job satisfaction, better interprofessional relationships, and perceived improvements in patient care. A flatter power gradient across professions and increased interdisciplinary teamwork has been shown to be associated with improved patient outcomes.25,26
Changes to clinician workflow can significantly impact the introduction of new models of care. A mandated time each day for structured rounds meant less flexibility in workflow for clinicians and made greater demands on their time management and communication skills. Furthermore, the need for human resource negotiations with nurse representatives was an unexpected component of successfully introducing the changes to workflow. Once the benefits of saved time and better communication became evident, changes to workflow were generally accepted. These challenges can be managed if stakeholders are engaged and supportive of the changes.13
Finally, our findings emphasize the importance of combining qualitative and quantitative data when evaluating an intervention. In this case, the qualitative outcomes that include “intangible” positive effects, such as cultural change and improved staff understanding of one another’s roles, might encourage us to continue with the SIBR intervention, which would allow more time to see if the trend of reduced LOS identified in the statistical analysis would translate to a significant effect over time.
We are unable to identify which aspects of the intervention led to the greatest impact on our outcomes. A recent study found that interdisciplinary rounds had no impact on patients’ perceptions of shared decision-making or care satisfaction.27 Although our findings indicated many potential benefits for patients, we were not able to interview patients or their carers to confirm these findings. In addition, we do not have any patient-centered outcomes, which would be important to consider in future work. Although our data on clinical response calls might be seen as a proxy for adverse events, we do not have data on adverse events or errors, and these are important to consider in future work. Finally, our findings are based on data from a single institution.
CONCLUSIONS
While there were some criticisms, participants expressed overwhelmingly positive reactions to the SIBR. The biggest reported benefit was perceived improved communication and understanding between and within the clinical professions, and between clinicians and patients. Improved communication was perceived to have fostered improved teamwork and team functioning, with most respondents feeling that they were a valued part of the new team. Improved teamwork was thought to contribute to improved task performance and led interviewees to perceive a higher level of patient safety. This research highlights the need for multimethod evaluations that address contextual factors as well as clinical outcomes.
Acknowledgments
The authors would like to acknowledge the clinicians and staff members who participated in this study. We would also like to acknowledge the support from the NSW Clinical Excellence Commission, in particular, Dr. Peter Kennedy, Mr. Wilson Yeung, Ms. Tracy Clarke, and Mr. Allan Zhang, and also from Ms. Karen Storey and Mr. Steve Shea of the Organisational Performance Management team at the Orange Health Service.
Disclosures
None of the authors had conflicts of interest in relation to the conduct or reporting of this study, with the exception that the lead author’s institution, the Australian Institute of Health Innovation, received a small grant from the New South Wales Clinical Excellence Commission to conduct the work. Ethics approval for the research was granted by the Greater Western Area Health Service Human Research Ethics Committee (HREC/13/GWAHS/22). All interviewees consented to participate in the study. For patient data, consent was not obtained, but presented data are anonymized. The full dataset is available from the corresponding author with restrictions. This research was funded by the NSW Clinical Excellence Commission, who also encouraged submission of the article for publication. The funding source did not have any role in conduct or reporting of the study. R.C.W., J.P., and J.J. conceptualized and conducted the qualitative component of the study, including method, data collection, data analysis, and writing of the manuscript. G.L., C.H., and H.D. conceptualized the quantitative component of the study, including method, data collection, data analysis, and writing of the manuscript. G.S. contributed to conceptualization of the study, and significantly contributed to the revision of the manuscript. All authors, external and internal, had full access to all of the data (including statistical reports and tables) in the study and can take responsibility for the integrity of the data and the accuracy of the data analysis. As the lead author, R.C.W. affirms that the manuscript is an honest, accurate, and transparent account of the study being reported, that no important aspects of the study have been omitted, and that any discrepancies from the study as planned have been explained.
1. Johnson JK, Batalden PB. Educating health professionals to improve care within the clinical microsystem. McLaughlin and Kaluzny’s Continuous Quality Improvement In Health Care. Burlington: Jones & Bartlett Learning; 2013.
2. Mohr JJ, Batalden P, Barach PB. Integrating patient safety into the clinical microsystem. Qual Saf Health Care. 2004;13:ii34-ii38. PubMed
3. Sanchez JA, Barach PR. High reliability organizations and surgical microsystems: re-engineering surgical care. Surg Clin North Am. 2012;92:1-14. PubMed
4. Curley C, McEachern JE, Speroff T. A firm trial of interdisciplinary rounds on the inpatient medical wards: an intervention designed using continuous quality improvement. Med Care. 1998;36:AS4-AS12. PubMed
5. O’Mahony S, Mazur E, Charney P, Wang Y, Fine J. Use of multidisciplinary rounds to simultaneously improve quality outcomes, enhance resident education, and shorten length of stay. J Gen Intern Med. 2007;22:1073-1079. PubMed
6. Pannick S, Beveridge I, Wachter RM, Sevdalis N. Improving the quality and safety of care on the medical ward: a review and synthesis of the evidence base. Eur J Intern Med. 2014;25:874-887. PubMed
7. Halm MA, Gagner S, Goering M, Sabo J, Smith M, Zaccagnini M. Interdisciplinary rounds: impact on patients, families, and staff. Clin Nurse Spec. 2003;17:133-142. PubMed
8. Stein J, Murphy D, Payne C, et al. A remedy for fragmented hospital care. Harvard Business Review. 2013.
9. O’Leary KJ, Buck R, Fligiel HM, et al. Structured interdisciplinary rounds in a medical teaching unit: improving patient safety. Arch Intern Med. 2010;171:678-684. PubMed
10. O’Leary KJ, Haviley C, Slade ME, Shah HM, Lee J, Williams MV. Improving teamwork: impact of structured interdisciplinary rounds on a hospitalist unit. J Hosp Med. 2011;6:88-93. PubMed
11. O’Leary KJ, Ritter CD, Wheeler H, Szekendi MK, Brinton TS, Williams MV. Teamwork on inpatient medical units: assessing attitudes and barriers. Qual Saf Health Care. 2011;19:117-121. PubMed
12. O’Leary KJ, Creden AJ, Slade ME, et al. Implementation of unit-based interventions to improve teamwork and patient safety on a medical service. Am J Med Qual. 2014;30:409-416. PubMed
13. Stein J, Payne C, Methvin A, et al. Reorganizing a hospital ward as an accountable care unit. J Hosp Med. 2015;10:36-40. PubMed
14. Creswell JW. Research Design: Qualitative, Quantitative, and Mixed Methods Approaches. Thousand Oaks: SAGE Publications; 2013.
15. Palinkas LA, Horwitz SM, Green CA, Wisdom JP, Duan N, Hoagwood K. Purposeful sampling for qualitative data collection and analysis in mixed method implementation research. Adm Pol Ment Health. 2015;42:533-544. PubMed
16. Australian Consortium for Classification Development (ACCD). Review of the AR-DRG classification Case Complexity Process: Final Report; 2014.
http://ihpa.gov.au/internet/ihpa/publishing.nsf/Content/admitted-acute. Accessed September 21, 2015.
17. Lofland J, Lofland LH. Analyzing Social Settings. Belmont: Wadsworth Publishing Company; 2006.
18. Miles MB, Huberman AM, Saldaña J. Qualitative Data Analysis: A Methods Sourcebook. Los Angeles: SAGE Publications; 2014.
19. Corbin J, Strauss A. Basics of Qualitative Research: Techniques and Procedures for Developing Grounded Theory. Thousand Oaks: SAGE Publications; 2008.
20. Corbin JM, Strauss A. Grounded theory research: procedures, canons, and evaluative criteria. Qual Sociol. 1990;13:3-21.
21. O’Leary KJ, Johnson JK, Auerbach AD. Do interdisciplinary rounds improve patient outcomes? only if they improve teamwork. J Hosp Med. 2016;11:524-525. PubMed
22. Clay-Williams R. Restructuring and the resilient organisation: implications for health care. In: Hollnagel E, Braithwaite J, Wears R, editors. Resilient health care. Surrey: Ashgate Publishing Limited; 2013.
23. Williams I, Dickinson H, Robinson S, Allen C. Clinical microsystems and the NHS: a sustainable method for improvement? J Health Organ and Manag. 2009;23:119-132. PubMed
24. Nelson EC, Godfrey MM, Batalden PB, et al. Clinical microsystems, part 1. The building blocks of health systems. Jt Comm J Qual Patient Saf. 2008;34:367-378. PubMed
25. Chisholm-Burns MA, Lee JK, Spivey CA, et al. US pharmacists’ effect as team members on patient care: systematic review and meta-analyses. Med Care. 2010;48:923-933. PubMed
26. Zwarenstein M, Goldman J, Reeves S. Interprofessional collaboration: effects of practice-based interventions on professional practice and healthcare outcomes. Cochrane Database Syst Rev. 2009;3:CD000072. PubMed
27. O’Leary KJ, Killarney A, Hansen LO, et al. Effect of patient-centred bedside rounds on hospitalised patients’ decision control, activation and satisfaction with care. BMJ Qual Saf. 2015;25:921-928. PubMed
Evidence has emerged over the last decade of the importance of the front line patient care team in improving quality and safety of patient care.1-3 Improving collaboration and workflow is thought to increase reliability of care delivery.1 One promising method to improve collaboration is the interdisciplinary ward round (IDR), whereby medical, nursing, and allied health staff attend ward rounds together. IDRs have been shown to reduce the average cost and length of hospital stay,4,5 although a recent systematic review found inconsistent improvements across studies.6 Using the term “interdisciplinary,” however, does not necessarily imply the inclusion of all disciplines necessary for patient care. The challenge of conducting interdisciplinary rounds is considerable in today’s busy clinical environment: health professionals who are spread across multiple locations within the hospital, and who have competing hospital responsibilities and priorities, must come together at the same time and for a set period each day. A survey with respondents from Australia, the United States, and Canada found that only 65% of rounds labelled “interdisciplinary” included a physician.7
While IDRs are not new, structured IDRs involve the purposeful inclusion of all disciplinary groups relevant to a patient’s care, alongside a checklist tool to aid comprehensive but concise daily assessment of progress and treatment planning. Novel, structured IDR interventions have been tested recently in various settings, resulting in improved teamwork, hospital performance, and patient outcomes in the US, including the Structured Interdisciplinary Bedside Round (SIBR) model.8-12
The aim of this study was to assess the impact of the new structure and the associated practice changes on interprofessional working and a set of key patient and hospital outcome measures. As part of the intervention, the hospital established an Acute Medical Unit (AMU) based on the Accountable Care Unit model.13
METHODS
Description of the Intervention
The AMU brought together 2 existing medical wards, a general medical ward and a 48-hour turnaround Medical Assessment Unit (MAU), into 1 geographical location with 26 beds. Prior to the merger, the MAU and general medical ward had separate and distinct cultures and workflows. The MAU was staffed with experienced nurses; nurses worked within a patient allocation model, the workload was shared, and relationships were collegial. In contrast, the medical ward was more typical of the remainder of the hospital: nurses had a heavy workload, managed a large group of longer-term complex patients, and they used a team-based nursing model of care in which senior nurses supervised junior staff. It was decided that because of the seniority of the MAU staff, they should be in charge of the combined AMU, and the patient allocation model of care would be used to facilitate SIBR.
Consultants, junior doctors, nurses, and allied health professionals (including a pharmacist, physiotherapist, occupational therapist, and social worker) were geographically aligned to the new ward, allowing them to participate as a team in daily structured ward rounds. Rounds are scheduled at the same time each day to enable family participation. The ward round is coordinated by a registrar or intern, with input from patient, family, nursing staff, pharmacy, allied health, and other doctors (intern, registrar, and consultant) based on the unit. The patient load is distributed between 2 rounds: 1 scheduled for 10
Data Collection Strategy
The study was set in an AMU in a large tertiary care hospital in regional Australia and used a convergent parallel multimethod approach14 to evaluate the implementation and effect of SIBR in the AMU. The study population consisted of 32 clinicians employed at the study hospital: (1) the leadership team involved in the development and implementation of the intervention and (2) members of clinical staff who were part of the AMU team.
Qualitative Data
Qualitative measures consisted of semistructured interviews. We utilized multiple strategies to recruit interviewees, including a snowball technique, criterion sampling,15 and emergent sampling, so that we could seek the views of both the leadership team responsible for the implementation and “frontline” clinical staff whose daily work was directly affected by it. Everyone who was initially recruited agreed to be interviewed, and additional frontline staff asked to be interviewed once they realized that we were asking about how staff experienced the changes in practice.
The research team developed a semistructured interview guide based on an understanding of the merger of the 2 units as well as an understanding of changes in practice of the rounds (provided in Appendix 1). The questions were pilot tested on a separate unit and revised. Questions were structured into 5 topic areas: planning and implementation of AMU/SIBR model, changes in work practices because of the new model, team functioning, job satisfaction, and perceived impact of the new model on patients and families. All interviews were audio-recorded and transcribed verbatim for analysis.
Quantitative Data
Quantitative data were collected on patient outcome measures: length of stay (LOS), discharge date and time, mode of separation (including death), primary diagnostic category, total hospital stay cost and “clinical response calls,” and patient demographic data (age, gender, and Patient Clinical Complexity Level [PCCL]). The PCCL is a standard measure used in Australian public inpatient facilities and is calculated for each episode of care.16 It measures the cumulative effect of a patient’s complications and/or comorbidities and takes an integer value between 0 (no clinical complexity effect) and 4 (catastrophic clinical complexity effect).
Data regarding LOS, diagnosis (Australian Refined Diagnosis Related Groups [AR-DRG], version 7), discharge date, and mode of separation (including death) were obtained from the New South Wales Ministry of Health’s Health Information Exchange for patients discharged during the year prior to the intervention through 1 year after the implementation of the intervention. The total hospital stay cost for these individuals was obtained from the local Health Service Organizational Performance Management unit. Inclusion criteria were inpatients aged over 15 years experiencing acute episodes of care; patients with a primary diagnostic category of mental diseases and disorders were excluded. LOS was calculated based on ward stay. AMU data were compared with the remaining hospital ward data (the control group). Data on “clinical response calls” per month per ward were also obtained for the 12 months prior to intervention and the 12 months of the intervention.
Analysis
Qualitative Analysis
Qualitative data analysis consisted of a hybrid form of textual analysis, combining inductive and deductive logics.17,18 Initially, 3 researchers (J.P., J.J., and R.C.W.) independently coded the interview data inductively to identify themes. Discrepancies were resolved through discussion until consensus was reached. Then, to further facilitate analysis, the researchers deductively imposed a matrix categorization, consisting of 4 a priori categories: context/conditions, practices/processes, professional interactions, and consequences.19,20 Additional a priori categories were used to sort the themes further in terms of experiences prior to, during, and following implementation of the intervention. To compare changes in those different time periods, we wanted to know what themes were related to implementation and whether those themes continued to be applicable to sustainability of the changes.
Quantitative analysis. Distribution of continuous data was examined by using the one-sample Kolmogorov-Smirnov test. We compared pre-SIBR (baseline) measures using the Student t test for normally distributed data, the Mann-Whitney U z test for nonparametric data (denoted as M-W U z), and χ2 tests for categorical data. Changes in monthly “clinical response calls” between the AMU and the control wards over time were explored by using analysis of variance (ANOVA). Changes in LOS and cost of stay from the year prior to the intervention to the first year of the intervention were analyzed by using generalized linear models, which are a form of linear regression. Factors, or independent variables, included in the models were time period (before or during intervention), ward (AMU or control), an interaction term (time by ward), patient age, gender, primary diagnosis (major diagnostic categories of the AR-DRG version 7.0), and acuity (PCCL). The estimated marginal means for cost of stay for the 12-month period prior to the intervention and for the first 12 months of the intervention were produced. All statistical analyses were performed by using IBM SPSS version 21 (IBM Corp., Armonk, New York) and with alpha set at P < .05.
RESULTS
Qualitative Evaluation of the Intervention
Participants.
Three researchers (RCW, JP, and JJ) conducted in-person, semistructured interviews with 32 clinicians (9 male, 23 female) during a 3-day period. The duration of the interviews ranged from 19 minutes to 68 minutes. Participants consisted of 8 doctors, 18 nurses, 5 allied health professionals, and an administrator. Ten of the participants were involved in the leadership group that drove the planning and implementation of SIBR and the AMU.
Themes
Context and Conditions of Work
Practices and Processes
Participants perceived postintervention work processes to be more efficient. A primary example was a near-universal approval of the time saved from not “chasing” other professionals now that they were predictably available on the ward. More timely decision-making was thought to result from this predicted availability and associated improvements in communication.
The SIBR enforced a workflow on all staff, who felt there was less flexibility to work autonomously (doctors) or according to patients’ needs (nurses). More junior staff expressed anxiety about delayed completion of discharge-related administrative tasks because of the midday completion of the round. Allied health professionals who had commitments in other areas of the hospital often faced a dilemma about how to prioritize SIBR attendance and activities on other wards. This was managed differently depending on the specific allied health profession and the individuals within that profession.
Professional Interactions
In terms of interprofessional dynamics on the AMU, the implementation of SIBR resulted in a shift in power between the doctors and the nurses. In the old ward, doctors largely controlled the timing of medical rounding processes. In the new AMU, doctors had to relinquish some control over the timing of personal workflow to comply with the requirements of SIBR. Furthermore, there was evidence that this had some impact on traditional hierarchical models of communication and created a more level playing field, as nonmedical professionals felt more empowered to voice their thoughts during and outside of rounds.
The rounds provided much greater visibility of the “big picture” and each profession’s role within it; this allowed each clinician to adjust their work to fit in and take account of others. The process was not instantaneous, and trust developed over a period of weeks. Better communication meant fewer misunderstandings, and workload dropped.
The participation of allied health professionals in the round enhanced clinician interprofessional skills and knowledge. The more inclusive approach facilitated greater trust between clinical disciplines and a development of increased confidence among nursing, allied health, and administrative professionals.
In contrast to the positive impacts of the new model of care on communication and relationships within the AMU, interdepartmental relationships were seen to have suffered. The processes and practices of the new AMU are different to those in the other hospital departments, resulting in some isolation of the unit and difficulties interacting with other areas of the hospital. For example, the trade-offs that allied health professionals made to participate in SIBR often came at the expense of other units or departments.
Consequences
All interviewees lauded the benefits of the SIBR intervention for patients. Patients were perceived to be better informed and more respected, and they benefited from greater perceived timeliness of treatment and discharge, easier access to doctors, better continuity of treatment and outcomes, improved nurse knowledge of their circumstances, and fewer gaps in their care. Clinicians spoke directly to the patient during SIBR, rather than consulting with professional colleagues over the patient’s head. Some staff felt that doctors were now thinking of patients as “people” rather than “a set of symptoms.” Nurses discovered that informed patients are easier to manage.
Staff members were prepared to compromise on their own needs in the interests of the patient. The emphasis on the patient during rounds resulted in improved advocacy behaviors of clinicians. The nurses became more empowered and able to show greater initiative. Families appeared to find it much easier to access the doctors and obtain information about the patient, resulting in less distress and a greater sense of control and trust in the process.
Quantitative Evaluation of the Intervention
Hospital Outcomes
Patient demographics did not change over time within either the AMU or control wards. However, there were significant increases in Patient Clinical Complexity Level (PCCL) ratings for both the AMU (44.7% to 40.3%; P<0.05) and the control wards (65.2% to 61.6%; P < .001). There was not a statistically significant shift over time in median LoS on the ward prior to (2.16 days, IQR 3.07) and during SIBR in the AMU (2.15 days; IQR 3.28), while LoS increased in the control (pre-SIBR: 1.67, 2.34; during SIBR 1.73, 2.40; M-W U z = -2.46, P = .014). Mortality rates were stable across time for both the AMU (pre-SIBR 2.6% [95% confidence interval {CI}, 1.9-3.5]; during SIBR 2.8% [95% CI, 2.1-3.7]) and the control (pre-SIBR 1.3% [95% CI, 1.0-1.5]; during SIBR 1.2% [95% CI, 1.0-1.4]).
The total number of “clinical response calls” or “flags” per month dropped significantly from pre-SIBR to during SIBR for the AMU from a mean of 63.1 (standard deviation 15.1) to 31.5 (10.8), but remained relatively stable in the control (pre-SIBR 72.5 [17.6]; during SIBR 74.0 [28.3]), and this difference was statistically significant (F (1,44) = 9.03; P = .004). There was no change in monthly “red flags” or “rapid response calls” over time (AMU: 10.5 [3.6] to 9.1 [4.7]; control: 40.3 [11.7] to 41.8 [10.8]). The change in total “clinical response calls” over time was attributable to the “yellow flags” or the decline in “calls for clinical review” in the AMU (from 52.6 [13.5] to 22.4 [9.2]). The average monthly “yellow flags” remained stable in the control (pre-SIBR 32.2 [11.6]; during SIBR 32.3 [22.4]). The AMU and the control wards differed significantly in how the number of monthly “calls for clinical review” changed from pre-SIBR to during SIBR (F (1,44) = 12.18; P = .001).
The 2 main outcome measures, LOS and costs, were analyzed to determine whether changes over time differed between the AMU and the control wards after accounting for age, gender, and PCCL. There was no statistically significant difference between the AMU and control wards in terms of change in LOS over time (Wald χ2 = 1.05; degrees of freedom [df] = 1; P = .31). There was a statistically significant interaction for cost of stay, indicating that ward types differed in how they changed over time (with a drop in cost over time observed in the AMU and an increase observed in the control) (Wald χ2 = 6.34; df = 1; P = .012.
DISCUSSION
We report on the implementation of an AMU model of care, including the reorganization of a nursing unit, implementation of IDR, and geographical localization. Our study design allowed a more comprehensive assessment of the implementation of system redesign to include provider perceptions and clinical outcomes.
The 2 very different cultures of the old wards that were combined into the AMU, as well as the fact that the teams had not previously worked together, made the merger of the 2 wards difficult. Historically, the 2 teams had worked in very different ways, and this created barriers to implementation. The SIBR also demanded new ways of working closely with other disciplines, which disrupted older clinical cultures and relationships. While organizational culture is often discussed, and even measured, the full impact of cultural factors when making workplace changes is frequently underestimated.21 The development of a new culture takes time, and it can lag organizational structural changes by months or even years.22 As our interviewees expressed, often emotionally, there was a sense of loss during the merger of the 2 units. While this is a potential consequence of any large organizational change, it could be addressed during the planning stages, prior to implementation, by acknowledging and perhaps honoring what is being left behind. It is safe to assume that future units implementing the rounding intervention will not fully realize commensurate levels of culture change until well after the structural and process changes are finalized, and only then if explicit effort is made to engender cultural change.
Overall, however, the interviewees perceived that the SIBR intervention led to improved teamwork and team functioning. These improvements were thought to benefit task performance and patient safety. Our study is consistent with other research in the literature that reported that greater staff empowerment and commitment is associated with interdisciplinary patient care interventions in front line caregiving teams.23,24 The perception of a more equal nurse-physician relationship resulted in improved job satisfaction, better interprofessional relationships, and perceived improvements in patient care. A flatter power gradient across professions and increased interdisciplinary teamwork has been shown to be associated with improved patient outcomes.25,26
Changes to clinician workflow can significantly impact the introduction of new models of care. A mandated time each day for structured rounds meant less flexibility in workflow for clinicians and made greater demands on their time management and communication skills. Furthermore, the need for human resource negotiations with nurse representatives was an unexpected component of successfully introducing the changes to workflow. Once the benefits of saved time and better communication became evident, changes to workflow were generally accepted. These challenges can be managed if stakeholders are engaged and supportive of the changes.13
Finally, our findings emphasize the importance of combining qualitative and quantitative data when evaluating an intervention. In this case, the qualitative outcomes that include “intangible” positive effects, such as cultural change and improved staff understanding of one another’s roles, might encourage us to continue with the SIBR intervention, which would allow more time to see if the trend of reduced LOS identified in the statistical analysis would translate to a significant effect over time.
We are unable to identify which aspects of the intervention led to the greatest impact on our outcomes. A recent study found that interdisciplinary rounds had no impact on patients’ perceptions of shared decision-making or care satisfaction.27 Although our findings indicated many potential benefits for patients, we were not able to interview patients or their carers to confirm these findings. In addition, we do not have any patient-centered outcomes, which would be important to consider in future work. Although our data on clinical response calls might be seen as a proxy for adverse events, we do not have data on adverse events or errors, and these are important to consider in future work. Finally, our findings are based on data from a single institution.
CONCLUSIONS
While there were some criticisms, participants expressed overwhelmingly positive reactions to the SIBR. The biggest reported benefit was perceived improved communication and understanding between and within the clinical professions, and between clinicians and patients. Improved communication was perceived to have fostered improved teamwork and team functioning, with most respondents feeling that they were a valued part of the new team. Improved teamwork was thought to contribute to improved task performance and led interviewees to perceive a higher level of patient safety. This research highlights the need for multimethod evaluations that address contextual factors as well as clinical outcomes.
Acknowledgments
The authors would like to acknowledge the clinicians and staff members who participated in this study. We would also like to acknowledge the support from the NSW Clinical Excellence Commission, in particular, Dr. Peter Kennedy, Mr. Wilson Yeung, Ms. Tracy Clarke, and Mr. Allan Zhang, and also from Ms. Karen Storey and Mr. Steve Shea of the Organisational Performance Management team at the Orange Health Service.
Disclosures
None of the authors had conflicts of interest in relation to the conduct or reporting of this study, with the exception that the lead author’s institution, the Australian Institute of Health Innovation, received a small grant from the New South Wales Clinical Excellence Commission to conduct the work. Ethics approval for the research was granted by the Greater Western Area Health Service Human Research Ethics Committee (HREC/13/GWAHS/22). All interviewees consented to participate in the study. For patient data, consent was not obtained, but presented data are anonymized. The full dataset is available from the corresponding author with restrictions. This research was funded by the NSW Clinical Excellence Commission, who also encouraged submission of the article for publication. The funding source did not have any role in conduct or reporting of the study. R.C.W., J.P., and J.J. conceptualized and conducted the qualitative component of the study, including method, data collection, data analysis, and writing of the manuscript. G.L., C.H., and H.D. conceptualized the quantitative component of the study, including method, data collection, data analysis, and writing of the manuscript. G.S. contributed to conceptualization of the study, and significantly contributed to the revision of the manuscript. All authors, external and internal, had full access to all of the data (including statistical reports and tables) in the study and can take responsibility for the integrity of the data and the accuracy of the data analysis. As the lead author, R.C.W. affirms that the manuscript is an honest, accurate, and transparent account of the study being reported, that no important aspects of the study have been omitted, and that any discrepancies from the study as planned have been explained.
1. Johnson JK, Batalden PB. Educating health professionals to improve care within the clinical microsystem. McLaughlin and Kaluzny’s Continuous Quality Improvement In Health Care. Burlington: Jones & Bartlett Learning; 2013.
2. Mohr JJ, Batalden P, Barach PB. Integrating patient safety into the clinical microsystem. Qual Saf Health Care. 2004;13:ii34-ii38. PubMed
3. Sanchez JA, Barach PR. High reliability organizations and surgical microsystems: re-engineering surgical care. Surg Clin North Am. 2012;92:1-14. PubMed
4. Curley C, McEachern JE, Speroff T. A firm trial of interdisciplinary rounds on the inpatient medical wards: an intervention designed using continuous quality improvement. Med Care. 1998;36:AS4-AS12. PubMed
5. O’Mahony S, Mazur E, Charney P, Wang Y, Fine J. Use of multidisciplinary rounds to simultaneously improve quality outcomes, enhance resident education, and shorten length of stay. J Gen Intern Med. 2007;22:1073-1079. PubMed
6. Pannick S, Beveridge I, Wachter RM, Sevdalis N. Improving the quality and safety of care on the medical ward: a review and synthesis of the evidence base. Eur J Intern Med. 2014;25:874-887. PubMed
7. Halm MA, Gagner S, Goering M, Sabo J, Smith M, Zaccagnini M. Interdisciplinary rounds: impact on patients, families, and staff. Clin Nurse Spec. 2003;17:133-142. PubMed
8. Stein J, Murphy D, Payne C, et al. A remedy for fragmented hospital care. Harvard Business Review. 2013.
9. O’Leary KJ, Buck R, Fligiel HM, et al. Structured interdisciplinary rounds in a medical teaching unit: improving patient safety. Arch Intern Med. 2010;171:678-684. PubMed
10. O’Leary KJ, Haviley C, Slade ME, Shah HM, Lee J, Williams MV. Improving teamwork: impact of structured interdisciplinary rounds on a hospitalist unit. J Hosp Med. 2011;6:88-93. PubMed
11. O’Leary KJ, Ritter CD, Wheeler H, Szekendi MK, Brinton TS, Williams MV. Teamwork on inpatient medical units: assessing attitudes and barriers. Qual Saf Health Care. 2011;19:117-121. PubMed
12. O’Leary KJ, Creden AJ, Slade ME, et al. Implementation of unit-based interventions to improve teamwork and patient safety on a medical service. Am J Med Qual. 2014;30:409-416. PubMed
13. Stein J, Payne C, Methvin A, et al. Reorganizing a hospital ward as an accountable care unit. J Hosp Med. 2015;10:36-40. PubMed
14. Creswell JW. Research Design: Qualitative, Quantitative, and Mixed Methods Approaches. Thousand Oaks: SAGE Publications; 2013.
15. Palinkas LA, Horwitz SM, Green CA, Wisdom JP, Duan N, Hoagwood K. Purposeful sampling for qualitative data collection and analysis in mixed method implementation research. Adm Pol Ment Health. 2015;42:533-544. PubMed
16. Australian Consortium for Classification Development (ACCD). Review of the AR-DRG classification Case Complexity Process: Final Report; 2014.
http://ihpa.gov.au/internet/ihpa/publishing.nsf/Content/admitted-acute. Accessed September 21, 2015.
17. Lofland J, Lofland LH. Analyzing Social Settings. Belmont: Wadsworth Publishing Company; 2006.
18. Miles MB, Huberman AM, Saldaña J. Qualitative Data Analysis: A Methods Sourcebook. Los Angeles: SAGE Publications; 2014.
19. Corbin J, Strauss A. Basics of Qualitative Research: Techniques and Procedures for Developing Grounded Theory. Thousand Oaks: SAGE Publications; 2008.
20. Corbin JM, Strauss A. Grounded theory research: procedures, canons, and evaluative criteria. Qual Sociol. 1990;13:3-21.
21. O’Leary KJ, Johnson JK, Auerbach AD. Do interdisciplinary rounds improve patient outcomes? only if they improve teamwork. J Hosp Med. 2016;11:524-525. PubMed
22. Clay-Williams R. Restructuring and the resilient organisation: implications for health care. In: Hollnagel E, Braithwaite J, Wears R, editors. Resilient health care. Surrey: Ashgate Publishing Limited; 2013.
23. Williams I, Dickinson H, Robinson S, Allen C. Clinical microsystems and the NHS: a sustainable method for improvement? J Health Organ and Manag. 2009;23:119-132. PubMed
24. Nelson EC, Godfrey MM, Batalden PB, et al. Clinical microsystems, part 1. The building blocks of health systems. Jt Comm J Qual Patient Saf. 2008;34:367-378. PubMed
25. Chisholm-Burns MA, Lee JK, Spivey CA, et al. US pharmacists’ effect as team members on patient care: systematic review and meta-analyses. Med Care. 2010;48:923-933. PubMed
26. Zwarenstein M, Goldman J, Reeves S. Interprofessional collaboration: effects of practice-based interventions on professional practice and healthcare outcomes. Cochrane Database Syst Rev. 2009;3:CD000072. PubMed
27. O’Leary KJ, Killarney A, Hansen LO, et al. Effect of patient-centred bedside rounds on hospitalised patients’ decision control, activation and satisfaction with care. BMJ Qual Saf. 2015;25:921-928. PubMed
© 2018 Society of Hospital Medicine
Proximal Humerus Fracture 3-D Modeling
ABSTRACT
The objective of this study is to determine the reproducibility and feasibility of using 3-dimensional (3-D) computer simulation of proximal humerus fracture computed tomography (CT) scans for fracture reduction. We hypothesized that anatomic reconstruction with 3-D models would be anatomically accurate and reproducible.
Preoperative CT scans of 28 patients with 3- and 4-part (AO classification 11-B1, 11-B2, 11-C1, 11-C2) proximal humerus fractures who were treated by hemiarthroplasty were converted into 3-D computer models. The displaced fractured fragments were anatomically reduced with computer simulation by 2 fellowship-trained shoulder surgeons, and measurements were made of the reconstructed proximal humerus.
The measurements of the reconstructed models had very good to excellent interobserver and intraobserver reliability. The reconstructions of these humerus fractures showed interclass correlation coefficients ranging from 0.71 to 0.93 between 1 observer and from 0.82 to 0.98 between 2 different observers. The fracture reduction was judged against normal proximal humerus geometry to determine reduction accuracy.
The 3-D modeling techniques used to reconstruct 3- and 4-part proximal humerus fractures were reliable and accurate. This technique of modeling and reconstructing proximal humerus fractures could be used to enhance the preoperative planning of open reduction and internal fixation or hemiarthroplasty for 3- and 4-part proximal humerus fractures.
The treatment of proximal humerus fractures is influenced by multiple factors, including patient age, associated injuries, bone quality, and fracture pattern. Three- and 4-part fractures are among the more severe of these fractures, which may result in vascular compromise to the humeral head, leading to avascular necrosis. Surgical goals for the management of these fractures are to optimize functional outcomes by re-creating a stable construct with a functional rotator cuff by open reduction and internal fixation (ORIF), hemiarthroplasty with tuberosity ORIF, or reverse shoulder replacement. Achieving a good outcome following hemiarthroplasty is dependent on many factors, including anatomic tuberosity healing and component positioning.1,2,3 Repairing the greater tuberosity in a near-anatomic position has been shown to greatly affect the results of hemiarthroplasty for fracture.3,4
Continue to: Three-dimensional (3-D) modeling...
Three-dimensional (3-D) modeling is increasingly being used in preoperative planning of shoulder arthroplasty and determining proper proximal humeral fracture treatment. 5 However, no studies have examined the reconstruction of a fractured proximal humerus into native anatomy using computer simulation. The purpose of this study is to determine the accuracy and reliability of anatomically reconstructing the preinjury proximal humerus using 3-D computer models created from postinjury computed tomography (CT) scans. The results of this study could lead to useful techniques employing CT–based models for patient-specific preoperative planning of proximal humeral fracture ORIF and during tuberosity reduction and fixation during hemiarthroplasty for fracture. We hypothesize that it is feasible to reconstruct the original anatomy of the proximal humerus by using 3-D computer modeling of proximal humerus fractures with high reliability based on interobserver and intraobserver review.
METHODS
After Institutional Review Board approval was obtained, we reviewed the medical records of consecutive patients with a diagnosis of proximal humeral fracture and the treatment codes for hemiarthroplasty from 2000 to 2013. Inclusion criteria included 3- and 4-part fractures (AO classifications 11-B1, 11-B2, 11-C1, 11-C2). CT scans with insufficient quality to differentiate bone from soft tissue (inadequate signal-to-noise ratio) were excluded from the study. A total of 28 patients with adequate CT scans met the criteria for inclusion in this study.
The CT scan protocol included 0.5-mm axial cuts with inclusion of the proximal humerus in the Digital Imaging and Communications in Medicine format. These CT scans were converted into patient-specific 3-D computer models of the shoulder using Mimics software (Materialise Inc.). The use of this software to produce anatomically accurate models has previously been verified in a shoulder model.6,7 The tuberosity fragments were then individually separated from each other using the voxel-selecting capabilities of 3-D software and manipulated with translation and rotation for anatomic reduction (Figures 1A-1D, Figure 2). 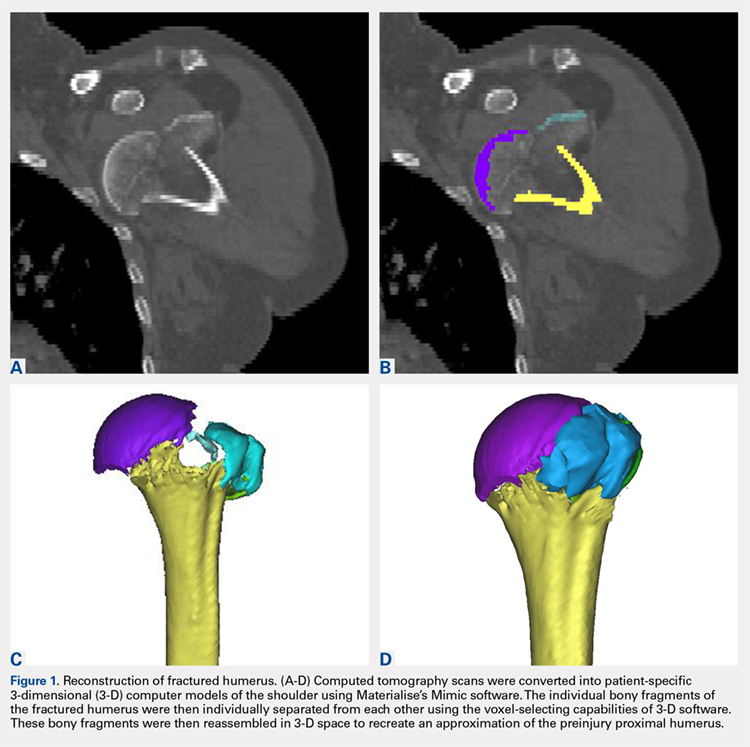
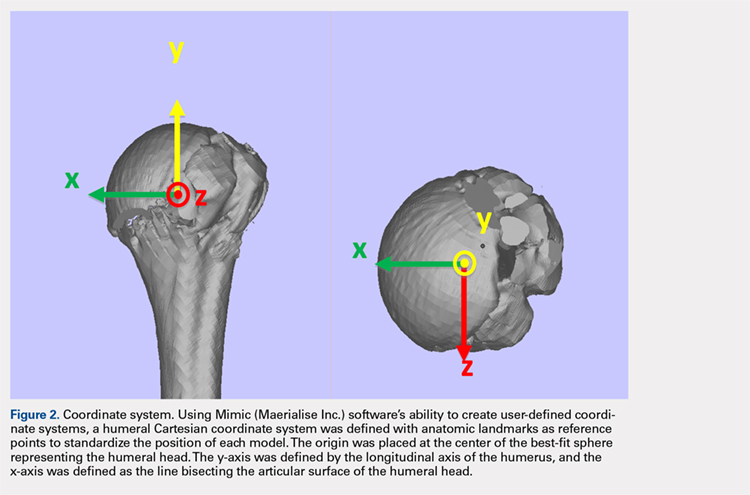
The de-identified anatomically reconstructed shoulder models were then uploaded into Materialise’s Magics rapid prototyping software, and a user-defined humeral Cartesian coordinate system was defined with anatomic landmarks as reference points to standardize the position of each model (Figure 3).8,9 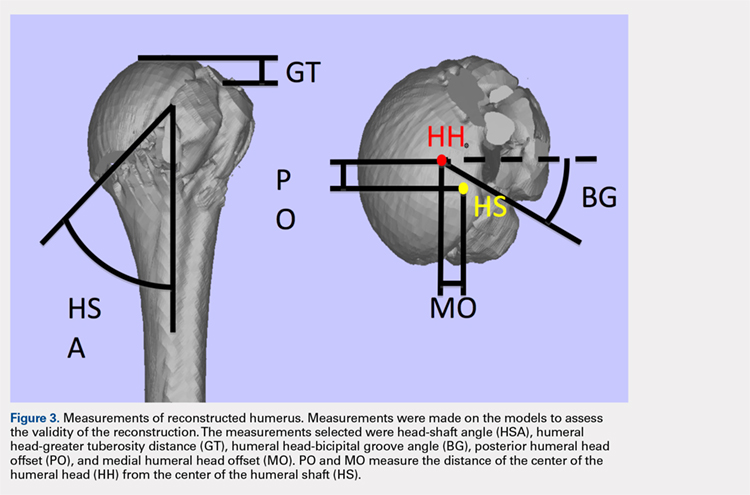
A series of measurements were made on these models to assess the validity and reliability of the reassembly. The bicipital groove at the anatomic neck was used to measure humeral head version as described by Kummer and colleagues.10 The head-shaft angle, humeral head-greater tuberosity distance, humeral head-bicipital groove angle, and posterior and medial humeral head offset were measured directly on the reconstructed humerus.
Continue to: Two fellowship-trained shoulder...
Two fellowship-trained shoulder surgeons independently reassembled these fracture fragments via computer simulation. Interobserver reliability testing was conducted on these reconstructions by measuring the geometry between the 2 different surgeons’ reconstructions. Intraobserver reliability testing was conducted by 1 surgeon repeating the reconstructions with 4-week intervals between trials and measuring the geometry between the 2 different trials. The average dimensions of the reconstructed proximal humerus fractures were compared with the geometry of normal humeri reported in previously conducted anatomic studies.11,12,13
STATISTICS
The measured dimensions of the 28 reassembled proximal humeri models were averaged across all trials between the 2 fellowship-trained surgeons and compared with the range of normal dimensions of a healthy proximal humerus using the 2 one-sided tests (TOST) method for equivalence between 2 means given a range. The interobserver and intraobserver reliabilities were quantified using the interclass correlation coefficient. An excellent correlation was defined as a correlation coefficient >0.81; very good was defined as 0.61 to 0.80; and good was defined as 0.41 to 0.60.
RESULTS
Of the patients studied, 9 (32.1%) were male, and the average age at the time of CT scanning was 72 years. Of the 28 patients with fracture, 18 (64.2%) had 3-part fractures (AO classifications 11-B1, 11-B2), and 10 (35.8%) had 4-part fractures (AO classifications 11-C1, 11-C2). When examining the location of the intertubercular fracture line, we found that 13 (46.4%) fractures went through the bicipital groove. Of the remaining fracture lines, 9 (32.1%) extended into the greater tuberosity and 6 (21.4%) extended into the lesser tuberosity.
All users were able to reconstruct all 28 fractures using this technique. The average measured dimensions fell within the range of dimensions of a normal healthy proximal humerus specified in the literature to within a 95% confidence interval using the TOST for equivalence, in which we compared measured values with ranges reported in the literature (Table).11,12,13
Table. Dimensions of Proximal Humerus Geometry
| Normal Parameters | Average Dimensions From Trials | Dimensions From Literature |
| Head shaft angle | 43.5° ± 1° | 42.5° ± 12.5° |
| Head to greater tuberosity distance | 4.9 mm ± 0.4 mm | 8 mm ± 3.2 mm |
Head to bicipital groove angle (anatomic neck) | 26.4° ± 2° | 27.3° ± 14° |
| Posterior humeral head offset | 1.6 mm ± 0.3 mm | 4 mm ± 6 mm |
| Medial humeral head offset | 4.5 mm ± 0.3 mm | 9 mm ± 5 mm |
The reconstructions of these humerus fractures showed intraclass correlation coefficients ranging from 0.71 to 0.93 in 1 observer and interclass correlation coefficients from 0.82 to 0.98 between 2 different observers (Table).
DISCUSSION
This study demonstrates that it is feasible to reliably and accurately reconstruct the original anatomy of the proximal humerus by using 3-D computer modeling of proximal humerus fractures. Poor outcomes after hemiarthroplasty for proximal humerus fractures are mostly related to tuberosity malpositioning, resorption, or failure of fixation and resultant dysfunction of the rotator cuff.14,15,16 These studies highlight the importance of accurate tuberosity reduction during surgical care of these fractures.
Continue to: The 3-D computer model...
The 3-D computer model reconstruction of 3- and 4-part proximal humerus fractures were reliable and valid. The interclass correlation coefficients showed very good to excellent interobserver and intraobserver reliability for all measurements conducted. The averaged dimensions from all trials fell within the appropriate range of dimensions for a normal healthy humerus reported in the literature, as verified by the TOST method.11,12,13 The 3-D modeling capabilities demonstrated in this study allowed a greater understanding of the fracture patterns present in 3- and 4-part (AO classifications 11-B1, 11-B2, 11-C1, 11-C2) humerus fractures.
Overreduction of greater tuberosity to create cortical overlap with the lateral shaft may be used to promote bony union. As a result of this distalization, there may be extra strains placed on the rotator cuff, making the patient more prone to rotator cuff tear, as well as improperly balancing the dynamic stabilizers of the shoulder. Poor clinical outcomes in hemiarthroplasty for proximal humerus fractures have been correlated with a greater tuberosity placed distal relative to the humeral head by 1 cm in a study2 and by 2 cm in another.3
This study has several limitations. The first is the assumption that our injured patients had preinjury proximal humerus geometry within the range of normal dimensions of a healthy humerus. Unfortunately, because we were unable to obtain CT scans of the contralateral shoulder, we had to use standard proximal humerus geometry as the control. Another limitation, inherent in the technique, is that only cortical and dense trabecular bone was modeled, so that comminuted or osteoporotic bone was not well modeled. This study did not correlate the findings from these models with clinical outcomes. A prospective study is needed to evaluate the impact of this 3-D modeling on fracture reductions and clinical outcomes.
This study demonstrates that patient-specific modeling of proximal humerus fracture 3-D CT scans may help surgeons reliably and accurately reconstruct fractures. This technique may have utility in the preoperative planning of tuberosity fracture reduction and hemiarthroplasty. It gives surgeons the ability to visualize fracture fragments, and the process of reconstructing the fragments may help surgeons understand the required maneuvers for reduction at the time of surgery. This technique also provides dimensions of the patient’s native humerus, thus potentially improving the anatomic accuracy of the reduction or hemiarthroplasty reconstruction. With the new trend toward patient-specific instrumentation, this study also provides a means of planning the size of the humeral prostheses as well as the version relative to the biceps groove and intertubercular fracture line.
CONCLUSION
This study demonstrates the feasibility of using 3-D computer modeling of complex proximal humerus fractures in anatomic reconstruction. These techniques of computer-simulated 3-D models are valid and reliable. We believe that this technique of modeling and reconstructing proximal humerus fractures could be used to enhance the preoperative planning of hemiarthroplasty for 3- and 4-part proximal humerus fractures by providing improved understanding of the patient’s native humeral geometry and tuberosity reduction.
1. Boileau P, Krishnan SG, Tinsi L, Walch G, Coste JS, Mole D. Tuberosity malposition and migration: reasons for poor outcomes after hemiarthroplasty for displaced fractures of the proximal humerus. J Shoulder Elbow Surg. 2002;11(5):401-412. doi:10.1067/mse.2002.124527.
2. Mighell MA, Kolm GP, Collinge CA, Frankle MA. Outcomes of hemiarthroplasty for fractures of the proximal humerus. J Shoulder Elbow Surg. 2003;12(6):569-577. doi:10.1016/S1058274603002131.
3. Greiner SH, Kaab MJ, Kroning I, Scheibel M, Perka C. Reconstruction of humeral length and centering of the prosthetic head in hemiarthroplasty for proximal humeral fractures. J Shoulder Elbow Surg. 2008;17(5):709-714. doi:10.1016/j.jse.2008.03.004.
4. Smith AM, Mardones RM, Sperling JW, Cofield RH. Early complications of operatively treated proximal humeral fractures. J Shoulder Elbow Surg. 2007;16(1):14-24. doi:10.1016/j.jse.2006.05.008.
5. Scalise JJ, Codsi MJ, Bryan J, Iannotti JP. The three-dimensional glenoid vault model can estimate normal glenoid version in osteoarthritis. J Shoulder Elbow Surg. 2008;17(3):487-491. doi:10.1016/j.jse.2007.09.006.
6. Bryce CD, Pennypacker JL, Kulkarni N, et al. Validation of three-dimensional models of in situ scapulae. J Shoulder Elbow Surg. 2008;17(5):825-832. doi:10.1016/j.jse.2008.01.141.
7. Yongpravat C, Kim HM, Gardner TR, Bigliani LU, Levine WN, Ahmad CS. Glenoid implant orientation and cement failure in total shoulder arthroplasty: a finite element analysis. J Shoulder Elbow Surg. 2013;22(7):940-947. doi:10.1016/j.jse.2012.09.007.
8. Boileau P, Walch G. The three-dimensional geometry of the proximal humerus. Implications for surgical technique and prosthetic design. J Bone Joint Surg Br. 1997;79(5):857-865. doi:10.1302/0301-620X.79B5.0790857.
9. Wu G, van der Helm FC, Veeger HE, et al. ISB recommendation on definitions of joint coordinate systems of various joints for the reporting of human joint motion--Part II: shoulder, elbow, wrist and hand. J Biomech. 2005;38(5):981-992.
10. Kummer FJ, Perkins R, Zuckerman JD. The use of the bicipital groove for alignment of the humeral stem in shoulder arthroplasty. J Shoulder Elbow Surg. 1998;7(2):144-146. doi:10.1016/S1058-2746(98)90225-7.
11. Iannotti JP, Gabriel JP, Schneck SL, Evans BG, Misra S. The normal glenohumeral relationships. An anatomical study of one hundred and forty shoulders. J Bone Joint Surg Am. 1992;74(4):491-500.
12. Pearl ML, Volk AG. Coronal plane geometry of the proximal humerus relevant to prosthetic arthroplasty. J Shoulder Elbow Surg. 1996;5(4):320-326. doi:10.1016/S1058-2746(96)80060-7.
13. Pearl ML. Proximal humeral anatomy in shoulder arthroplasty: Implications for prosthetic design and surgical technique. J Shoulder Elbow Surg. 2005;14(1 Suppl S):99S-104S. doi:10.1016/j.jse.2004.09.025.
14. Prakash U, McGurty DW, Dent JA. Hemiarthroplasty for severe fractures of the proximal humerus. J Shoulder Elbow Surg. 2002;11(5):428-430. doi:10.1067/mse.2002.126615.
15. Robinson CM, Page RS, Hill RM, Sanders DL, Court-Brown CM, Wakefield AE. Primary hemiarthroplasty for treatment of proximal humeral fractures. J Bone Joint Surg Am. 2003;85-A(7):1215-1223.
16. Zyto K, Wallace WA, Frostick SP, Preston BJ. Outcome after hemiarthroplasty for three- and four-part fractures of the proximal humerus. J Shoulder Elbow Surg. 1998;7(2):85-89. doi:10.1016/S1058-2746(98)90215-4.
ABSTRACT
The objective of this study is to determine the reproducibility and feasibility of using 3-dimensional (3-D) computer simulation of proximal humerus fracture computed tomography (CT) scans for fracture reduction. We hypothesized that anatomic reconstruction with 3-D models would be anatomically accurate and reproducible.
Preoperative CT scans of 28 patients with 3- and 4-part (AO classification 11-B1, 11-B2, 11-C1, 11-C2) proximal humerus fractures who were treated by hemiarthroplasty were converted into 3-D computer models. The displaced fractured fragments were anatomically reduced with computer simulation by 2 fellowship-trained shoulder surgeons, and measurements were made of the reconstructed proximal humerus.
The measurements of the reconstructed models had very good to excellent interobserver and intraobserver reliability. The reconstructions of these humerus fractures showed interclass correlation coefficients ranging from 0.71 to 0.93 between 1 observer and from 0.82 to 0.98 between 2 different observers. The fracture reduction was judged against normal proximal humerus geometry to determine reduction accuracy.
The 3-D modeling techniques used to reconstruct 3- and 4-part proximal humerus fractures were reliable and accurate. This technique of modeling and reconstructing proximal humerus fractures could be used to enhance the preoperative planning of open reduction and internal fixation or hemiarthroplasty for 3- and 4-part proximal humerus fractures.
The treatment of proximal humerus fractures is influenced by multiple factors, including patient age, associated injuries, bone quality, and fracture pattern. Three- and 4-part fractures are among the more severe of these fractures, which may result in vascular compromise to the humeral head, leading to avascular necrosis. Surgical goals for the management of these fractures are to optimize functional outcomes by re-creating a stable construct with a functional rotator cuff by open reduction and internal fixation (ORIF), hemiarthroplasty with tuberosity ORIF, or reverse shoulder replacement. Achieving a good outcome following hemiarthroplasty is dependent on many factors, including anatomic tuberosity healing and component positioning.1,2,3 Repairing the greater tuberosity in a near-anatomic position has been shown to greatly affect the results of hemiarthroplasty for fracture.3,4
Continue to: Three-dimensional (3-D) modeling...
Three-dimensional (3-D) modeling is increasingly being used in preoperative planning of shoulder arthroplasty and determining proper proximal humeral fracture treatment. 5 However, no studies have examined the reconstruction of a fractured proximal humerus into native anatomy using computer simulation. The purpose of this study is to determine the accuracy and reliability of anatomically reconstructing the preinjury proximal humerus using 3-D computer models created from postinjury computed tomography (CT) scans. The results of this study could lead to useful techniques employing CT–based models for patient-specific preoperative planning of proximal humeral fracture ORIF and during tuberosity reduction and fixation during hemiarthroplasty for fracture. We hypothesize that it is feasible to reconstruct the original anatomy of the proximal humerus by using 3-D computer modeling of proximal humerus fractures with high reliability based on interobserver and intraobserver review.
METHODS
After Institutional Review Board approval was obtained, we reviewed the medical records of consecutive patients with a diagnosis of proximal humeral fracture and the treatment codes for hemiarthroplasty from 2000 to 2013. Inclusion criteria included 3- and 4-part fractures (AO classifications 11-B1, 11-B2, 11-C1, 11-C2). CT scans with insufficient quality to differentiate bone from soft tissue (inadequate signal-to-noise ratio) were excluded from the study. A total of 28 patients with adequate CT scans met the criteria for inclusion in this study.
The CT scan protocol included 0.5-mm axial cuts with inclusion of the proximal humerus in the Digital Imaging and Communications in Medicine format. These CT scans were converted into patient-specific 3-D computer models of the shoulder using Mimics software (Materialise Inc.). The use of this software to produce anatomically accurate models has previously been verified in a shoulder model.6,7 The tuberosity fragments were then individually separated from each other using the voxel-selecting capabilities of 3-D software and manipulated with translation and rotation for anatomic reduction (Figures 1A-1D, Figure 2).
The de-identified anatomically reconstructed shoulder models were then uploaded into Materialise’s Magics rapid prototyping software, and a user-defined humeral Cartesian coordinate system was defined with anatomic landmarks as reference points to standardize the position of each model (Figure 3).8,9
A series of measurements were made on these models to assess the validity and reliability of the reassembly. The bicipital groove at the anatomic neck was used to measure humeral head version as described by Kummer and colleagues.10 The head-shaft angle, humeral head-greater tuberosity distance, humeral head-bicipital groove angle, and posterior and medial humeral head offset were measured directly on the reconstructed humerus.
Continue to: Two fellowship-trained shoulder...
Two fellowship-trained shoulder surgeons independently reassembled these fracture fragments via computer simulation. Interobserver reliability testing was conducted on these reconstructions by measuring the geometry between the 2 different surgeons’ reconstructions. Intraobserver reliability testing was conducted by 1 surgeon repeating the reconstructions with 4-week intervals between trials and measuring the geometry between the 2 different trials. The average dimensions of the reconstructed proximal humerus fractures were compared with the geometry of normal humeri reported in previously conducted anatomic studies.11,12,13
STATISTICS
The measured dimensions of the 28 reassembled proximal humeri models were averaged across all trials between the 2 fellowship-trained surgeons and compared with the range of normal dimensions of a healthy proximal humerus using the 2 one-sided tests (TOST) method for equivalence between 2 means given a range. The interobserver and intraobserver reliabilities were quantified using the interclass correlation coefficient. An excellent correlation was defined as a correlation coefficient >0.81; very good was defined as 0.61 to 0.80; and good was defined as 0.41 to 0.60.
RESULTS
Of the patients studied, 9 (32.1%) were male, and the average age at the time of CT scanning was 72 years. Of the 28 patients with fracture, 18 (64.2%) had 3-part fractures (AO classifications 11-B1, 11-B2), and 10 (35.8%) had 4-part fractures (AO classifications 11-C1, 11-C2). When examining the location of the intertubercular fracture line, we found that 13 (46.4%) fractures went through the bicipital groove. Of the remaining fracture lines, 9 (32.1%) extended into the greater tuberosity and 6 (21.4%) extended into the lesser tuberosity.
All users were able to reconstruct all 28 fractures using this technique. The average measured dimensions fell within the range of dimensions of a normal healthy proximal humerus specified in the literature to within a 95% confidence interval using the TOST for equivalence, in which we compared measured values with ranges reported in the literature (Table).11,12,13
Table. Dimensions of Proximal Humerus Geometry
| Normal Parameters | Average Dimensions From Trials | Dimensions From Literature |
| Head shaft angle | 43.5° ± 1° | 42.5° ± 12.5° |
| Head to greater tuberosity distance | 4.9 mm ± 0.4 mm | 8 mm ± 3.2 mm |
Head to bicipital groove angle (anatomic neck) | 26.4° ± 2° | 27.3° ± 14° |
| Posterior humeral head offset | 1.6 mm ± 0.3 mm | 4 mm ± 6 mm |
| Medial humeral head offset | 4.5 mm ± 0.3 mm | 9 mm ± 5 mm |
The reconstructions of these humerus fractures showed intraclass correlation coefficients ranging from 0.71 to 0.93 in 1 observer and interclass correlation coefficients from 0.82 to 0.98 between 2 different observers (Table).
DISCUSSION
This study demonstrates that it is feasible to reliably and accurately reconstruct the original anatomy of the proximal humerus by using 3-D computer modeling of proximal humerus fractures. Poor outcomes after hemiarthroplasty for proximal humerus fractures are mostly related to tuberosity malpositioning, resorption, or failure of fixation and resultant dysfunction of the rotator cuff.14,15,16 These studies highlight the importance of accurate tuberosity reduction during surgical care of these fractures.
Continue to: The 3-D computer model...
The 3-D computer model reconstruction of 3- and 4-part proximal humerus fractures were reliable and valid. The interclass correlation coefficients showed very good to excellent interobserver and intraobserver reliability for all measurements conducted. The averaged dimensions from all trials fell within the appropriate range of dimensions for a normal healthy humerus reported in the literature, as verified by the TOST method.11,12,13 The 3-D modeling capabilities demonstrated in this study allowed a greater understanding of the fracture patterns present in 3- and 4-part (AO classifications 11-B1, 11-B2, 11-C1, 11-C2) humerus fractures.
Overreduction of greater tuberosity to create cortical overlap with the lateral shaft may be used to promote bony union. As a result of this distalization, there may be extra strains placed on the rotator cuff, making the patient more prone to rotator cuff tear, as well as improperly balancing the dynamic stabilizers of the shoulder. Poor clinical outcomes in hemiarthroplasty for proximal humerus fractures have been correlated with a greater tuberosity placed distal relative to the humeral head by 1 cm in a study2 and by 2 cm in another.3
This study has several limitations. The first is the assumption that our injured patients had preinjury proximal humerus geometry within the range of normal dimensions of a healthy humerus. Unfortunately, because we were unable to obtain CT scans of the contralateral shoulder, we had to use standard proximal humerus geometry as the control. Another limitation, inherent in the technique, is that only cortical and dense trabecular bone was modeled, so that comminuted or osteoporotic bone was not well modeled. This study did not correlate the findings from these models with clinical outcomes. A prospective study is needed to evaluate the impact of this 3-D modeling on fracture reductions and clinical outcomes.
This study demonstrates that patient-specific modeling of proximal humerus fracture 3-D CT scans may help surgeons reliably and accurately reconstruct fractures. This technique may have utility in the preoperative planning of tuberosity fracture reduction and hemiarthroplasty. It gives surgeons the ability to visualize fracture fragments, and the process of reconstructing the fragments may help surgeons understand the required maneuvers for reduction at the time of surgery. This technique also provides dimensions of the patient’s native humerus, thus potentially improving the anatomic accuracy of the reduction or hemiarthroplasty reconstruction. With the new trend toward patient-specific instrumentation, this study also provides a means of planning the size of the humeral prostheses as well as the version relative to the biceps groove and intertubercular fracture line.
CONCLUSION
This study demonstrates the feasibility of using 3-D computer modeling of complex proximal humerus fractures in anatomic reconstruction. These techniques of computer-simulated 3-D models are valid and reliable. We believe that this technique of modeling and reconstructing proximal humerus fractures could be used to enhance the preoperative planning of hemiarthroplasty for 3- and 4-part proximal humerus fractures by providing improved understanding of the patient’s native humeral geometry and tuberosity reduction.
1. Boileau P, Krishnan SG, Tinsi L, Walch G, Coste JS, Mole D. Tuberosity malposition and migration: reasons for poor outcomes after hemiarthroplasty for displaced fractures of the proximal humerus. J Shoulder Elbow Surg. 2002;11(5):401-412. doi:10.1067/mse.2002.124527.
2. Mighell MA, Kolm GP, Collinge CA, Frankle MA. Outcomes of hemiarthroplasty for fractures of the proximal humerus. J Shoulder Elbow Surg. 2003;12(6):569-577. doi:10.1016/S1058274603002131.
3. Greiner SH, Kaab MJ, Kroning I, Scheibel M, Perka C. Reconstruction of humeral length and centering of the prosthetic head in hemiarthroplasty for proximal humeral fractures. J Shoulder Elbow Surg. 2008;17(5):709-714. doi:10.1016/j.jse.2008.03.004.
4. Smith AM, Mardones RM, Sperling JW, Cofield RH. Early complications of operatively treated proximal humeral fractures. J Shoulder Elbow Surg. 2007;16(1):14-24. doi:10.1016/j.jse.2006.05.008.
5. Scalise JJ, Codsi MJ, Bryan J, Iannotti JP. The three-dimensional glenoid vault model can estimate normal glenoid version in osteoarthritis. J Shoulder Elbow Surg. 2008;17(3):487-491. doi:10.1016/j.jse.2007.09.006.
6. Bryce CD, Pennypacker JL, Kulkarni N, et al. Validation of three-dimensional models of in situ scapulae. J Shoulder Elbow Surg. 2008;17(5):825-832. doi:10.1016/j.jse.2008.01.141.
7. Yongpravat C, Kim HM, Gardner TR, Bigliani LU, Levine WN, Ahmad CS. Glenoid implant orientation and cement failure in total shoulder arthroplasty: a finite element analysis. J Shoulder Elbow Surg. 2013;22(7):940-947. doi:10.1016/j.jse.2012.09.007.
8. Boileau P, Walch G. The three-dimensional geometry of the proximal humerus. Implications for surgical technique and prosthetic design. J Bone Joint Surg Br. 1997;79(5):857-865. doi:10.1302/0301-620X.79B5.0790857.
9. Wu G, van der Helm FC, Veeger HE, et al. ISB recommendation on definitions of joint coordinate systems of various joints for the reporting of human joint motion--Part II: shoulder, elbow, wrist and hand. J Biomech. 2005;38(5):981-992.
10. Kummer FJ, Perkins R, Zuckerman JD. The use of the bicipital groove for alignment of the humeral stem in shoulder arthroplasty. J Shoulder Elbow Surg. 1998;7(2):144-146. doi:10.1016/S1058-2746(98)90225-7.
11. Iannotti JP, Gabriel JP, Schneck SL, Evans BG, Misra S. The normal glenohumeral relationships. An anatomical study of one hundred and forty shoulders. J Bone Joint Surg Am. 1992;74(4):491-500.
12. Pearl ML, Volk AG. Coronal plane geometry of the proximal humerus relevant to prosthetic arthroplasty. J Shoulder Elbow Surg. 1996;5(4):320-326. doi:10.1016/S1058-2746(96)80060-7.
13. Pearl ML. Proximal humeral anatomy in shoulder arthroplasty: Implications for prosthetic design and surgical technique. J Shoulder Elbow Surg. 2005;14(1 Suppl S):99S-104S. doi:10.1016/j.jse.2004.09.025.
14. Prakash U, McGurty DW, Dent JA. Hemiarthroplasty for severe fractures of the proximal humerus. J Shoulder Elbow Surg. 2002;11(5):428-430. doi:10.1067/mse.2002.126615.
15. Robinson CM, Page RS, Hill RM, Sanders DL, Court-Brown CM, Wakefield AE. Primary hemiarthroplasty for treatment of proximal humeral fractures. J Bone Joint Surg Am. 2003;85-A(7):1215-1223.
16. Zyto K, Wallace WA, Frostick SP, Preston BJ. Outcome after hemiarthroplasty for three- and four-part fractures of the proximal humerus. J Shoulder Elbow Surg. 1998;7(2):85-89. doi:10.1016/S1058-2746(98)90215-4.
TAKE-HOME POINTS
- Proximal humerus fractures may be better understood with 3-D CT imaging.
- 3-D computer modeling of complex proximal humerus fractures allows an understanding of tuebroisty reduction durring ORIF or hemiarthroplasty.
- 3-D modeling enhances preoperative planning for hemiarthroplasty implant size and position relative to the repaired tuberosity fragments.
- 3-D modeling of fracture reduction can help surgeons understand the patient’s native humeral geometry and anatomy.
- Preoperative evaluation of fracture characteristics and fragment reduction help surgeons better understand surgical solutions.
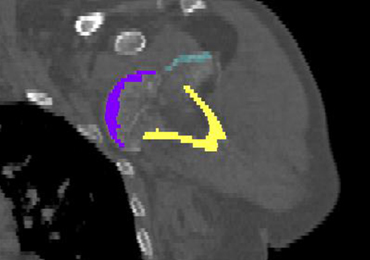
A Practical Guide to Urine Drug Monitoring
Urine drug monitoring (UDM) is an important tool to screen adherence and identify possible misuse and abuse in patients on opioid therapy.1 Various guidelines for opioid therapy emphasize the importance of UDM as a standard of care.2-6 Routine and random monitoring is recommended for all patients on long-term opioid therapy prior to initiation and throughout duration of therapy.1-3 The recommended UDM frequency varies based on individual risk assessment and clinical judgment. Similar to any other diagnostic or monitoring test, the goal for UDM should be to guide therapy and improve patient care (Box). Inappropriate interpretation of the results and failure to order definitive testing when necessary may adversely affect patient care. 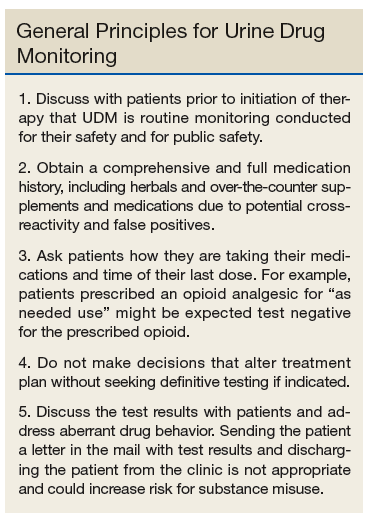
Urine Drug Monitoring
Sample Collection
Urine drug testing generally requires a minimum of 30 mL of urine (depending on the kit type) collected in a private restroom. In the authors’ experience, the sample collection most often is unobserved in clinical practice. Most laboratories keep urine samples for a limited time, often 7 days. Therefor, if results are unexpected, health care providers must notify the laboratory in a timely manner to order definitive testing if indicated.
Specimen Validity Testing
Attempts to dilute, adulterate, and substitute urine may be detected by visual inspection and laboratory validity testing. Validity testing of urine specimens includes temperature, specific gravity, pH, urine creatinine, and presence of adulterants (Tables 1 and 2).7-9 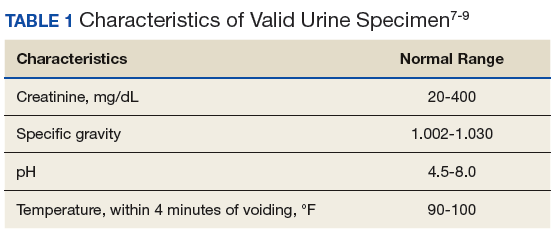
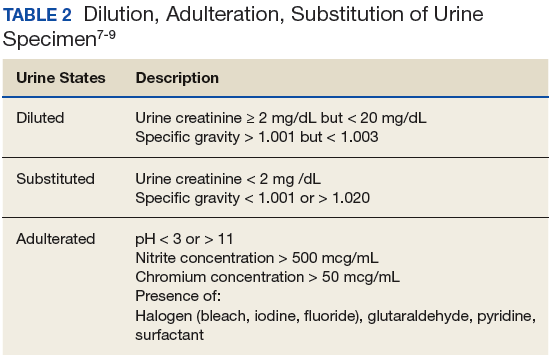
The combination of specific gravity and urinary creatinine may help screen for dilution or substitution. Dilution may occur precollection by consumption of excess amounts of fluids or postcollection by adding fluid to the specimen. Other causes of diluted urine should be considered, such as renal tubular dysfunction or diuretic use. Household adulterants include vinegar, detergent, sodium chloride, hydrogen peroxide, eye/nose drops, soda, or ammonia.10 There are numerous commercially available adulterants, including Klear, UrinAid, Urine Luck, Stealth Synthetics, Whizzies, and Clear Choice. The active ingredients of some include peroxide/peroxidase, sodium or potassium nitrate, pyridinium chlorochromate, or glutaraldehyde. There are laboratory tests to detect the presence of these adulterants. Whenever in doubt, it is advisable that health care providers (HCPs) contact their laboratory to investigate tampering. Another approach if tampering is suspected is to collect blood samples. Although this method is more expensive and invasive, it eliminates means of tampering. Hair follicle testing is an option as well.
Types of Urine Drug Monitoring
There are 2 general types of UDM: Presumptive by immunoassay (IA) and confirmatory testing by chromatography. Simply, UDM by IA commonly referred to as urine drug screening (UDS), serves as the differential assessments, whereas chromatography is the definitive assessment. This article reviews the clinical utility and limitations of the 2 types of UDM, including false positives and false negatives, and when to order more tests.
Immunoassay
The IA drug test uses antibodies to detect the presence of selected drugs and/or their metabolites based on a predetermined cutoff threshold.8 Immunoassay monitoring is the initial qualitative test to identify the presence of drug classes in the urine based on a detection threshold. Typically, UDM by IA is performed as an initial evaluation of potential appropriate use, misuse, nonuse, or abuse of medications. It also can detect the presence of illegal substances or unprescribed medications. Immunoassay is relatively quick, inexpensive, and sensitive; however, because it lacks specificity, it can result in various false positives and false negatives.
Immunoassay tests also are subject to varying windows of detection depending on the substance ingested (Table 3). 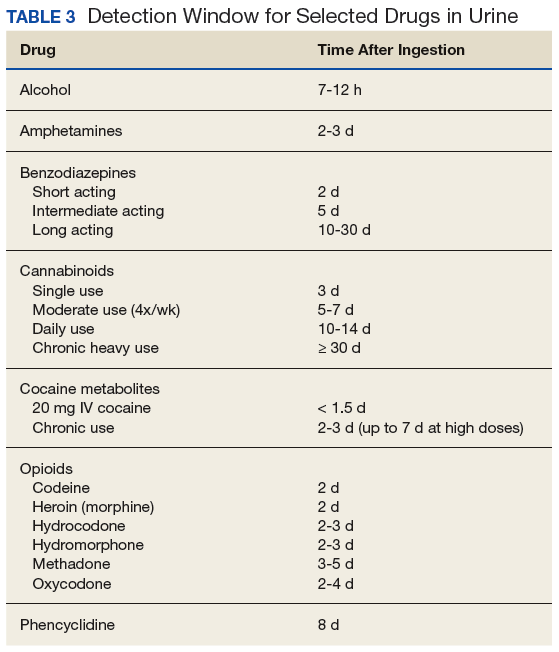
The cutoff levels listed in Table 1 are consistent with testing for employment but not necessarily for aberrant behavior in patients receiving long-term opioid therapy. These cutoffs lower the risk of false positives and provide better accuracy with clinical monitoring. For example, a level of 2,000 ng/mL is listed for both test types in Table 4, but for clinical testing, the IA cutoff is 3,000 ng/mL, and gas chromatography/mass spectrometry (GC-MS) can detect even trace amounts of opioid and their metabolites. 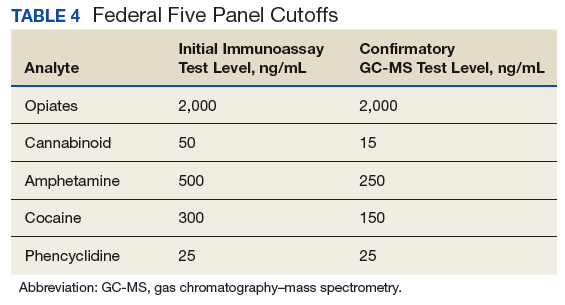
The opiate panel with IA tests for opium alkaloids and/or their metabolites, including morphine and codeine.7-9 Heroin is a semisynthetic opioid that is metabolized to diacetyl morphine and ultimately is detected as morphine.7,8 Other semisynthetic opioids, such as hydrocodone and oxycodone, may or may not be detected by the opiate IA depending on the dose and assay. 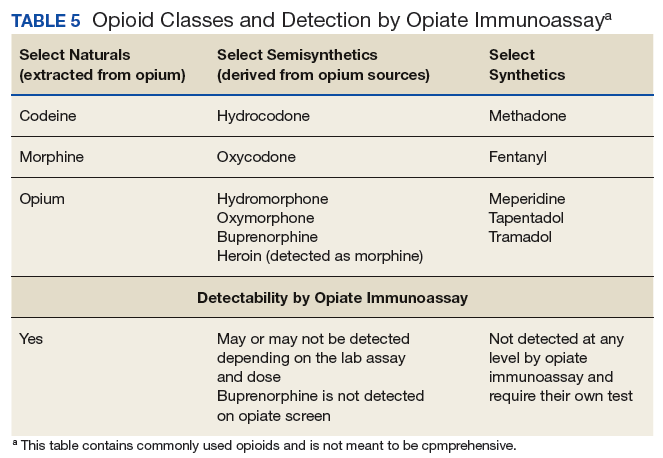
Benzodiazepine IAs often are designed to detect nordiazepam, oxazepam, and temazepam, all of which are metabolites of diazepam. However, benzodiazepine IAs also can detect other drugs that are structurally similar to benzodiazepines.11,12 This means that benzodiazepines are detected based on their ability to cross-react with the IA test. Lorazepam and clonazepam have low cross-reactivity and are generally not detected on benzodiazepine IA.12,13 Therefore, it is not uncommon for patients on lorazepam or clonazepam to test negative for benzodiazepines on this IA. If these patients do test positive at low doses, it could be a concern that they are taking a different benzodiazepine instead of, or in addition to, the prescribed medication.
Amphetamines and methamphetamine are simple molecules that are difficult to develop specific antibodies for; therefore, they carry a high false-positive rate with IA testing.8 It is important to note that methylphenidate is not detected by the amphetamine IA as it is not an amphetamine.8 The IA for cocaine tests specifically for benzoylecgonine, a metabolite specific to cocaine and has no cross-reactivity.8,12,14
False positives. Due to the lack of specificity of UDM by IA, false positives are common; with the exception of cocaine. Clinicians must obtain a comprehensive medication history of the patient, including over-the-counter medications, herbals, and supplements. Table 6 lists common sources of false positives with UDM by IA.1,8,9 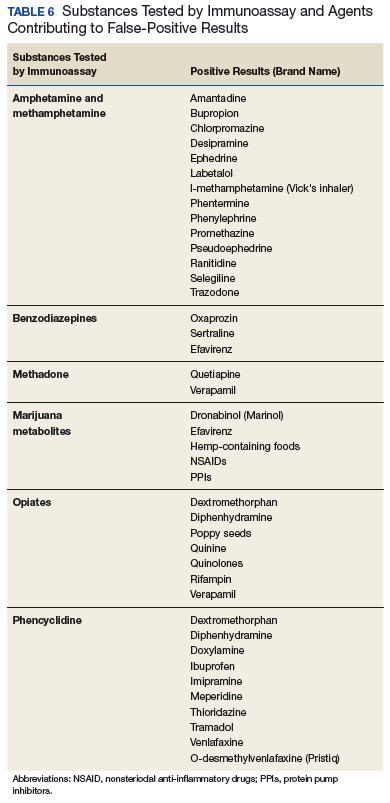
False negatives. A variety of factors can cause false-negative results, includingthe cross-reactivity of the antibody in the IA, the cutoff concentration that yields a positive result, and/or the time between drug ingestion. As discussed previously, the opiate panel tests for metabolites of morphine, codeine, and heroin, which consequently may lead to semisynthetic/synthetic opioids not being detected.8,11 For example, a patient who was prescribed hydrocodone/acetaminophen 5 mg/325 mg 4 times a day, tests negative for opiates by IA. The negative result is not unexpected because the dose of semisynthetic opioid is too low for detection by IA.
Chromatography
Chromatography generally is reserved for confirmatory or definitive testing when the initial UDM by IA results are unexpected.1 Unlike IA, chromatography can detect the presence of specific drugs and/or metabolites. Types of chromatography testing include GC/MS, liquid chromatography tandem mass spectrometry (LC/MS/MS), and high-performance liquid chromatography.9 Depending on the specific test, chromatography uses a gas or liquid carrier medium to separate the urine sample’s compounds by their molecular interactions with the carrier medium (mainly by different polarities). During this separation process, all the individual compounds are fed into a mass spectrometer, that ionizes the compounds and detects fragments by using their mass-to-charge ratios. This process allows for the identification of distinct compounds based on their molecular fingerprints.
Gas chromatography/mass spectrometry has remained the standard test for confirmatory testing.1,8 However, it is important to note that LC/MS/MS has been gaining favor over GC/MS. Using LC/MS/MS requires less urine volume to conduct an analysis, and the analysis has a second analytical separation step, thus it is expected to have a lower susceptibility to false results caused by concomitant use of other medications.15,16
Regardless of the test medium, quantitative confirmation through chromatography offers several advantages over IA. It is more accurate, as it can identify small quantities of specific drugs and confirm their presence in urine.8 Also, although there are still cutoff limits associated with chromatography, the specific cutoffs are much lower in value than those in IA tests.Finally, a study conducted in 2010 by Pesce and colleagues found that IA testing was associated with varying rates of false-negative results compared with those of LC-MS/MS.17 Specifically, false-negative rates associated with IA were found to be 22%, 50%, and 23.4% for benzodiazepines, cocaine, and propoxyphene, respectively.17 Unfortunately, chromatography testing methods take longer to produce results and are costly compared with those of IA.Thus, chromatography testing methods typically are reserved for when the IA produces unexpected results. Conversely, IA can be done at point of care with in-office readable cups or strips, or sent out for a 24-hour to 48-hour turnaround time.7,8
Alcohol Testing
Health care providers also could screen for alcohol misuse, which can compromise safe opioid use. Alcohol can accelerate the release of certain sustained-release formulations, causing “dose dumping.”18 Furthermore, alcohol also can increase the risk of opioid-induced respiratory depression. Many laboratories include ethanol that is measured using an enzymatic reaction and generally detected 12 hours after alcohol use.7-9 Urinary ethanol is not an optimal marker for assessing alcohol use. Ethyl glucuronide (EtG) and ethyl sulfate (EtS) are 2 minor metabolites of ethanol formed by UDP-glucuronosyltransferase.19 These markers can be detected for up to 80 hours after alcohol consumption. Markers for prolonged and/or heavy drinking include but are not limited to phosphatidylethanol, γ-glutamyltransferase, or carbohydrate-deficient transferrin.20
Pharmacokinetics/Pharmacogenetics
Pharmacokinetics is what the body does with the drug and is measured by absorption, distribution, metabolism, and elimination.16 Pharmacokinetics ultimately determines the fate of how much and how fast a drug and/or metabolites end up in the urine. It is important to understand the pharmacokinetics to interpret the results of UDM by chromatography as the reported results include parent drugs and metabolites.
Some metabolites of medications available commercially could be mistaken as if the patient were taking a medication that was not prescribed. For example, hydromorphone is a metabolite of hydrocodone and oxymorphone is a metabolite of oxycodone, both of which are commercially available as stand-alone prescriptions. Likewise, oxazepam is commercially available as is temazepam, and both are metabolites of diazepam. Also, it is important to consider patient’s body habitus, which affects volume of distribution, meaning more drug is stored in the periphery and may have a longer detection window.21 Patients with renal and/or hepatic impairment can have reduced clearance of the medications.
It is equally important to consider the role that pharmacogenetic polymorphism can play in UDM, as polymorphisms may impact results.1,8 For example, consider a patient on extended-release oxycodone 30 mg twice daily. Oxycodone is metabolized via cytochrome (CYP) P450 enzyme 3A4 into noroxycodone and, to a much lesser extent, by CYP2D6 into oxymorphone. In this case, if tested by chromatography, the patient’s urine level of oxycodone should be higher than that of either metabolite; specifically, the urine level of noroxycodone should be higher than that of oxymorphone. If there are only concentrations of oxycodone found in the urine with no metabolites, the possible explanations are either the patient dissolved oxycodone into the urine sample without ingestion or the patient may have poor activity of CYP2D6 and CYP3A4 isoenzymes; the latter of which can be confirmed by pharmacogenetic testing. Notwithstanding, drug-drug interactions with CYP inhibitors can produce the same outcome.
Conclusion
Urine drug monitoring is an important tool for substance misuse or abuse and adherence to the prescribed regimen. The most commonly used test is UDM by IA due to its low cost and quick results. However, it comes with an array of false-positive and false-negative results. Clinicians should seek definitive results by confirmatory testing prior to making changes that alter patient care, and all results should include discussions with the patient.
Clinical pharmacy specialists are generally an excellent and often untapped resource to provide guidance for interpretation of both IA and chromatographic testing. Clinical pharmacy specialists have an excellent understanding of the physical and medicinal chemistry properties of laboratory testing, a vast understanding of drug metabolites and interactions that might increase or decrease drug concentrations might account for possible false positives and false negatives, and they can help decipher unexpected results.
Finally, it is important to consider that UDM is done for patients and not to patients, with the ultimate goal of improving the safety of the patient and the public. Unexpected results should be discussed with patients to identify the underlying reasons, which may then warrant further intervention, such as definitive testing and ultimate referral to a substance abuse treatment program. Simply sending a discharge or medication discontinuation letter to a patient can create a confrontational situation rather than an educational opportunity for both patient and provider.
1. Owen GT, Burton AW, Schade CM, Passik S. Urine drug testing: current recommendations and best practices. Pain Physician. 2012;15(3)(suppl):ES119-ES133.
2. US Department of Defense, US Department of Veteran Affairs, The Opioid Therapy for Chronic Pain Working Group. VA/DoD clinical practice guideline for opioid therapy in chronic pain. Version 3.0. Washington, DC: Veterans Health Administration and Department of Defense; 2017.
3. Dowell D, Haegerich TM, Chou R. CDC Guideline for Prescribing Opioids for Chronic Pain — United States, 2016. MMWR Recomm Rep. 2016;65(1):1-49.
4. Cheung CW, Qiu Q, Choi SW, Moore B, Goucke R, Irwin M. Chronic opioid therapy for chronic non-cancer pain: a review and comparison of treatment guidelines. Pain Physician. 2014;17(5):401-414.
5. Chou R, Fanciullo GJ, Fine PG, et al; American Pain Society-American Academy of Pain Medicine Opioids Guidelines Panel. Clinical guidelines for the use of chronic opioid therapy in chronic noncancer pain. J Pain. 2009;10(2):113-130.
6. Manchikanti L, Abdi S, Atluri S, et al; American Society of Interventional Pain Physicians. American Society of Interventional Pain Physicians (ASIPP) guidelines for responsible opioid prescribing in chronic non-cancer pain: Part 2 – guidance. Pain Physician. 2012;15(3)(suppl):S67-S116.
7. Hammet-Stabler CA, Webster LR. A clinical guide to urine drug testing. CME certified monograph. http://ccoe.rbhs.rutgers.edu/online/ARCHIVE/endurings/09MC07.pdf. Published May 2008. Accessed March 23, 2018.
8. Moeller KE, Lee KC, Kissack JC. Urine drug screening: practical guide for clinicians. Mayo Clin Proc. 2008;83(1):66-76.
9. Gourlay DL, Heit HA, Caplan YH. Urine drug testing in clinical practice. The art and science of patient care. Edition 6. https://www.remitigate.com/wp-content/uploads/2015/11 /Urine-Drug-Testing-in-Clinical-Practice-Ed6_2015-08.pdf. Published August 31, 2015. Accessed March 23, 2018.
10. Jamison RL, Oliver RE. Disorders of urinary concentration and dilution. Am J Med. 1982;72(2):308-322.
11. Valentine JL, Middleton R, Sparks C. Identification of urinary benzodiazepines and their metabolites: comparison of automated HPLC and GC-MS after immunoassay screening of clinical specimens. J Anal Toxicol. 1996;20(6):416-424.
12. Raouf M, Fudin J. Benzodiazepine Metabolism and Pharmacokinetics. http://paindr.com/wp-content/up loads/2015/10/Revised-BZD_-9-30.pdf. Published September 30, 2015. Accessed March 23, 2018. 13. DRI Benzodiazepine Assay [package insert]. Fremont, CA: Mircogenics Corp; 2012.
14. Carney S, Wolf CE, Tarnai-Moak L, Poklis A. Evaluation of two enzyme immunoassays for the detection of the cocaine metabolite benzoylecgonine in 1,398 urine specimens. J Clin Lab Anal. 2012;26(3):130-135.
15. Mikel C, Pesce A, West C. A tale of two drug testing technologies: GC-MS and LC-MS/MS. Pain Physician. 2010;13(1):91- 92.
16. Stout PR, Bynum ND, Mitchell JM, Baylor MR, Ropero-Miller JD. A comparison of the validity of gas chromatography- mass spectrometry and liquid chromatography- tandem mass spectrometry analysis of urine samples for morphine, codeine, 6-acetylmorphine, and benzoylecgonine. J Anal Toxicol. 2009;33(8):398-408.
17. Pesce A, Rosenthal M, West R, et al. An evaluation of the diagnostic accuracy of liquid chromatography-tandem mass spectroscopy versus immunoassay drug testing in pain patients. Pain Physician. 2010;13(3):273-281.
18. Gudin J, Mogali S, Jones J, Comer SD. Risks, management, and monitoring of combination opioid, benzodiazepines, and/or alcohol use. Postgrad Med. 2013;125(4):115–130.
19. Böttcher M, Beck O, Helander A. Evaluation of a new immunoassay for urinary ethyl glucuronide testing. Alcohol Alcohol. 2008;43(1):46-48.
20. Peterson K. Biomarkers for alcohol use and abuse—a summary. Alcohol Res Health. 2004-2005;28(1):30-37.
21. Sera LC, McPherson ML.Pharmacokinetics and pharmacodynamic changes associated with aging and implications for drug therapy. Clin Geriatr Med. 2012;28(2):273-286.
Urine drug monitoring (UDM) is an important tool to screen adherence and identify possible misuse and abuse in patients on opioid therapy.1 Various guidelines for opioid therapy emphasize the importance of UDM as a standard of care.2-6 Routine and random monitoring is recommended for all patients on long-term opioid therapy prior to initiation and throughout duration of therapy.1-3 The recommended UDM frequency varies based on individual risk assessment and clinical judgment. Similar to any other diagnostic or monitoring test, the goal for UDM should be to guide therapy and improve patient care (Box). Inappropriate interpretation of the results and failure to order definitive testing when necessary may adversely affect patient care.
Urine Drug Monitoring
Sample Collection
Urine drug testing generally requires a minimum of 30 mL of urine (depending on the kit type) collected in a private restroom. In the authors’ experience, the sample collection most often is unobserved in clinical practice. Most laboratories keep urine samples for a limited time, often 7 days. Therefor, if results are unexpected, health care providers must notify the laboratory in a timely manner to order definitive testing if indicated.
Specimen Validity Testing
Attempts to dilute, adulterate, and substitute urine may be detected by visual inspection and laboratory validity testing. Validity testing of urine specimens includes temperature, specific gravity, pH, urine creatinine, and presence of adulterants (Tables 1 and 2).7-9
The combination of specific gravity and urinary creatinine may help screen for dilution or substitution. Dilution may occur precollection by consumption of excess amounts of fluids or postcollection by adding fluid to the specimen. Other causes of diluted urine should be considered, such as renal tubular dysfunction or diuretic use. Household adulterants include vinegar, detergent, sodium chloride, hydrogen peroxide, eye/nose drops, soda, or ammonia.10 There are numerous commercially available adulterants, including Klear, UrinAid, Urine Luck, Stealth Synthetics, Whizzies, and Clear Choice. The active ingredients of some include peroxide/peroxidase, sodium or potassium nitrate, pyridinium chlorochromate, or glutaraldehyde. There are laboratory tests to detect the presence of these adulterants. Whenever in doubt, it is advisable that health care providers (HCPs) contact their laboratory to investigate tampering. Another approach if tampering is suspected is to collect blood samples. Although this method is more expensive and invasive, it eliminates means of tampering. Hair follicle testing is an option as well.
Types of Urine Drug Monitoring
There are 2 general types of UDM: Presumptive by immunoassay (IA) and confirmatory testing by chromatography. Simply, UDM by IA commonly referred to as urine drug screening (UDS), serves as the differential assessments, whereas chromatography is the definitive assessment. This article reviews the clinical utility and limitations of the 2 types of UDM, including false positives and false negatives, and when to order more tests.
Immunoassay
The IA drug test uses antibodies to detect the presence of selected drugs and/or their metabolites based on a predetermined cutoff threshold.8 Immunoassay monitoring is the initial qualitative test to identify the presence of drug classes in the urine based on a detection threshold. Typically, UDM by IA is performed as an initial evaluation of potential appropriate use, misuse, nonuse, or abuse of medications. It also can detect the presence of illegal substances or unprescribed medications. Immunoassay is relatively quick, inexpensive, and sensitive; however, because it lacks specificity, it can result in various false positives and false negatives.
Immunoassay tests also are subject to varying windows of detection depending on the substance ingested (Table 3).
The cutoff levels listed in Table 1 are consistent with testing for employment but not necessarily for aberrant behavior in patients receiving long-term opioid therapy. These cutoffs lower the risk of false positives and provide better accuracy with clinical monitoring. For example, a level of 2,000 ng/mL is listed for both test types in Table 4, but for clinical testing, the IA cutoff is 3,000 ng/mL, and gas chromatography/mass spectrometry (GC-MS) can detect even trace amounts of opioid and their metabolites.
The opiate panel with IA tests for opium alkaloids and/or their metabolites, including morphine and codeine.7-9 Heroin is a semisynthetic opioid that is metabolized to diacetyl morphine and ultimately is detected as morphine.7,8 Other semisynthetic opioids, such as hydrocodone and oxycodone, may or may not be detected by the opiate IA depending on the dose and assay.
Benzodiazepine IAs often are designed to detect nordiazepam, oxazepam, and temazepam, all of which are metabolites of diazepam. However, benzodiazepine IAs also can detect other drugs that are structurally similar to benzodiazepines.11,12 This means that benzodiazepines are detected based on their ability to cross-react with the IA test. Lorazepam and clonazepam have low cross-reactivity and are generally not detected on benzodiazepine IA.12,13 Therefore, it is not uncommon for patients on lorazepam or clonazepam to test negative for benzodiazepines on this IA. If these patients do test positive at low doses, it could be a concern that they are taking a different benzodiazepine instead of, or in addition to, the prescribed medication.
Amphetamines and methamphetamine are simple molecules that are difficult to develop specific antibodies for; therefore, they carry a high false-positive rate with IA testing.8 It is important to note that methylphenidate is not detected by the amphetamine IA as it is not an amphetamine.8 The IA for cocaine tests specifically for benzoylecgonine, a metabolite specific to cocaine and has no cross-reactivity.8,12,14
False positives. Due to the lack of specificity of UDM by IA, false positives are common; with the exception of cocaine. Clinicians must obtain a comprehensive medication history of the patient, including over-the-counter medications, herbals, and supplements. Table 6 lists common sources of false positives with UDM by IA.1,8,9
False negatives. A variety of factors can cause false-negative results, includingthe cross-reactivity of the antibody in the IA, the cutoff concentration that yields a positive result, and/or the time between drug ingestion. As discussed previously, the opiate panel tests for metabolites of morphine, codeine, and heroin, which consequently may lead to semisynthetic/synthetic opioids not being detected.8,11 For example, a patient who was prescribed hydrocodone/acetaminophen 5 mg/325 mg 4 times a day, tests negative for opiates by IA. The negative result is not unexpected because the dose of semisynthetic opioid is too low for detection by IA.
Chromatography
Chromatography generally is reserved for confirmatory or definitive testing when the initial UDM by IA results are unexpected.1 Unlike IA, chromatography can detect the presence of specific drugs and/or metabolites. Types of chromatography testing include GC/MS, liquid chromatography tandem mass spectrometry (LC/MS/MS), and high-performance liquid chromatography.9 Depending on the specific test, chromatography uses a gas or liquid carrier medium to separate the urine sample’s compounds by their molecular interactions with the carrier medium (mainly by different polarities). During this separation process, all the individual compounds are fed into a mass spectrometer, that ionizes the compounds and detects fragments by using their mass-to-charge ratios. This process allows for the identification of distinct compounds based on their molecular fingerprints.
Gas chromatography/mass spectrometry has remained the standard test for confirmatory testing.1,8 However, it is important to note that LC/MS/MS has been gaining favor over GC/MS. Using LC/MS/MS requires less urine volume to conduct an analysis, and the analysis has a second analytical separation step, thus it is expected to have a lower susceptibility to false results caused by concomitant use of other medications.15,16
Regardless of the test medium, quantitative confirmation through chromatography offers several advantages over IA. It is more accurate, as it can identify small quantities of specific drugs and confirm their presence in urine.8 Also, although there are still cutoff limits associated with chromatography, the specific cutoffs are much lower in value than those in IA tests.Finally, a study conducted in 2010 by Pesce and colleagues found that IA testing was associated with varying rates of false-negative results compared with those of LC-MS/MS.17 Specifically, false-negative rates associated with IA were found to be 22%, 50%, and 23.4% for benzodiazepines, cocaine, and propoxyphene, respectively.17 Unfortunately, chromatography testing methods take longer to produce results and are costly compared with those of IA.Thus, chromatography testing methods typically are reserved for when the IA produces unexpected results. Conversely, IA can be done at point of care with in-office readable cups or strips, or sent out for a 24-hour to 48-hour turnaround time.7,8
Alcohol Testing
Health care providers also could screen for alcohol misuse, which can compromise safe opioid use. Alcohol can accelerate the release of certain sustained-release formulations, causing “dose dumping.”18 Furthermore, alcohol also can increase the risk of opioid-induced respiratory depression. Many laboratories include ethanol that is measured using an enzymatic reaction and generally detected 12 hours after alcohol use.7-9 Urinary ethanol is not an optimal marker for assessing alcohol use. Ethyl glucuronide (EtG) and ethyl sulfate (EtS) are 2 minor metabolites of ethanol formed by UDP-glucuronosyltransferase.19 These markers can be detected for up to 80 hours after alcohol consumption. Markers for prolonged and/or heavy drinking include but are not limited to phosphatidylethanol, γ-glutamyltransferase, or carbohydrate-deficient transferrin.20
Pharmacokinetics/Pharmacogenetics
Pharmacokinetics is what the body does with the drug and is measured by absorption, distribution, metabolism, and elimination.16 Pharmacokinetics ultimately determines the fate of how much and how fast a drug and/or metabolites end up in the urine. It is important to understand the pharmacokinetics to interpret the results of UDM by chromatography as the reported results include parent drugs and metabolites.
Some metabolites of medications available commercially could be mistaken as if the patient were taking a medication that was not prescribed. For example, hydromorphone is a metabolite of hydrocodone and oxymorphone is a metabolite of oxycodone, both of which are commercially available as stand-alone prescriptions. Likewise, oxazepam is commercially available as is temazepam, and both are metabolites of diazepam. Also, it is important to consider patient’s body habitus, which affects volume of distribution, meaning more drug is stored in the periphery and may have a longer detection window.21 Patients with renal and/or hepatic impairment can have reduced clearance of the medications.
It is equally important to consider the role that pharmacogenetic polymorphism can play in UDM, as polymorphisms may impact results.1,8 For example, consider a patient on extended-release oxycodone 30 mg twice daily. Oxycodone is metabolized via cytochrome (CYP) P450 enzyme 3A4 into noroxycodone and, to a much lesser extent, by CYP2D6 into oxymorphone. In this case, if tested by chromatography, the patient’s urine level of oxycodone should be higher than that of either metabolite; specifically, the urine level of noroxycodone should be higher than that of oxymorphone. If there are only concentrations of oxycodone found in the urine with no metabolites, the possible explanations are either the patient dissolved oxycodone into the urine sample without ingestion or the patient may have poor activity of CYP2D6 and CYP3A4 isoenzymes; the latter of which can be confirmed by pharmacogenetic testing. Notwithstanding, drug-drug interactions with CYP inhibitors can produce the same outcome.
Conclusion
Urine drug monitoring is an important tool for substance misuse or abuse and adherence to the prescribed regimen. The most commonly used test is UDM by IA due to its low cost and quick results. However, it comes with an array of false-positive and false-negative results. Clinicians should seek definitive results by confirmatory testing prior to making changes that alter patient care, and all results should include discussions with the patient.
Clinical pharmacy specialists are generally an excellent and often untapped resource to provide guidance for interpretation of both IA and chromatographic testing. Clinical pharmacy specialists have an excellent understanding of the physical and medicinal chemistry properties of laboratory testing, a vast understanding of drug metabolites and interactions that might increase or decrease drug concentrations might account for possible false positives and false negatives, and they can help decipher unexpected results.
Finally, it is important to consider that UDM is done for patients and not to patients, with the ultimate goal of improving the safety of the patient and the public. Unexpected results should be discussed with patients to identify the underlying reasons, which may then warrant further intervention, such as definitive testing and ultimate referral to a substance abuse treatment program. Simply sending a discharge or medication discontinuation letter to a patient can create a confrontational situation rather than an educational opportunity for both patient and provider.
1. Owen GT, Burton AW, Schade CM, Passik S. Urine drug testing: current recommendations and best practices. Pain Physician. 2012;15(3)(suppl):ES119-ES133.
2. US Department of Defense, US Department of Veteran Affairs, The Opioid Therapy for Chronic Pain Working Group. VA/DoD clinical practice guideline for opioid therapy in chronic pain. Version 3.0. Washington, DC: Veterans Health Administration and Department of Defense; 2017.
3. Dowell D, Haegerich TM, Chou R. CDC Guideline for Prescribing Opioids for Chronic Pain — United States, 2016. MMWR Recomm Rep. 2016;65(1):1-49.
4. Cheung CW, Qiu Q, Choi SW, Moore B, Goucke R, Irwin M. Chronic opioid therapy for chronic non-cancer pain: a review and comparison of treatment guidelines. Pain Physician. 2014;17(5):401-414.
5. Chou R, Fanciullo GJ, Fine PG, et al; American Pain Society-American Academy of Pain Medicine Opioids Guidelines Panel. Clinical guidelines for the use of chronic opioid therapy in chronic noncancer pain. J Pain. 2009;10(2):113-130.
6. Manchikanti L, Abdi S, Atluri S, et al; American Society of Interventional Pain Physicians. American Society of Interventional Pain Physicians (ASIPP) guidelines for responsible opioid prescribing in chronic non-cancer pain: Part 2 – guidance. Pain Physician. 2012;15(3)(suppl):S67-S116.
7. Hammet-Stabler CA, Webster LR. A clinical guide to urine drug testing. CME certified monograph. http://ccoe.rbhs.rutgers.edu/online/ARCHIVE/endurings/09MC07.pdf. Published May 2008. Accessed March 23, 2018.
8. Moeller KE, Lee KC, Kissack JC. Urine drug screening: practical guide for clinicians. Mayo Clin Proc. 2008;83(1):66-76.
9. Gourlay DL, Heit HA, Caplan YH. Urine drug testing in clinical practice. The art and science of patient care. Edition 6. https://www.remitigate.com/wp-content/uploads/2015/11 /Urine-Drug-Testing-in-Clinical-Practice-Ed6_2015-08.pdf. Published August 31, 2015. Accessed March 23, 2018.
10. Jamison RL, Oliver RE. Disorders of urinary concentration and dilution. Am J Med. 1982;72(2):308-322.
11. Valentine JL, Middleton R, Sparks C. Identification of urinary benzodiazepines and their metabolites: comparison of automated HPLC and GC-MS after immunoassay screening of clinical specimens. J Anal Toxicol. 1996;20(6):416-424.
12. Raouf M, Fudin J. Benzodiazepine Metabolism and Pharmacokinetics. http://paindr.com/wp-content/up loads/2015/10/Revised-BZD_-9-30.pdf. Published September 30, 2015. Accessed March 23, 2018. 13. DRI Benzodiazepine Assay [package insert]. Fremont, CA: Mircogenics Corp; 2012.
14. Carney S, Wolf CE, Tarnai-Moak L, Poklis A. Evaluation of two enzyme immunoassays for the detection of the cocaine metabolite benzoylecgonine in 1,398 urine specimens. J Clin Lab Anal. 2012;26(3):130-135.
15. Mikel C, Pesce A, West C. A tale of two drug testing technologies: GC-MS and LC-MS/MS. Pain Physician. 2010;13(1):91- 92.
16. Stout PR, Bynum ND, Mitchell JM, Baylor MR, Ropero-Miller JD. A comparison of the validity of gas chromatography- mass spectrometry and liquid chromatography- tandem mass spectrometry analysis of urine samples for morphine, codeine, 6-acetylmorphine, and benzoylecgonine. J Anal Toxicol. 2009;33(8):398-408.
17. Pesce A, Rosenthal M, West R, et al. An evaluation of the diagnostic accuracy of liquid chromatography-tandem mass spectroscopy versus immunoassay drug testing in pain patients. Pain Physician. 2010;13(3):273-281.
18. Gudin J, Mogali S, Jones J, Comer SD. Risks, management, and monitoring of combination opioid, benzodiazepines, and/or alcohol use. Postgrad Med. 2013;125(4):115–130.
19. Böttcher M, Beck O, Helander A. Evaluation of a new immunoassay for urinary ethyl glucuronide testing. Alcohol Alcohol. 2008;43(1):46-48.
20. Peterson K. Biomarkers for alcohol use and abuse—a summary. Alcohol Res Health. 2004-2005;28(1):30-37.
21. Sera LC, McPherson ML.Pharmacokinetics and pharmacodynamic changes associated with aging and implications for drug therapy. Clin Geriatr Med. 2012;28(2):273-286.