User login
Short-Term Storage of Platelet-Rich Plasma at Room Temperature Does Not Affect Growth Factor or Catabolic Cytokine Concentration
ABSTRACT
The aim of this study was to provide clinical recommendations about the use of platelet-rich plasma (PRP) that was subjected to short-term storage at room temperature. We determined bioactive growth factor and cytokine concentrations as indicators of platelet and white blood cell degranulation in blood and PRP. Additionally, this study sought to validate the use of manual, direct smear analysis as an alternative to automated methods for platelet quantification in PRP.
Blood was used to generate low-leukocyte PRP (Llo PRP) or high-leukocyte PRP (Lhi PRP). Blood was either processed immediately or kept at room temperature for 2 or 4 hours prior to generation of PRP, which was then held at room temperature for 0, 1, 2, or 4 hours. Subsequently, bioactive transforming growth factor beta-1 and matrix metalloproteinase-9 were measured by ELISA (enzyme-linked immunosorbent assay). Manual and automated platelet counts were performed on all blood and PRP samples.
There were no differences in growth factor or cytokine concentration when blood or Llo PRP or Lhi PRP was retained at room temperature for up to 4 hours. Manual, direct smear analysis for platelet quantification was not different from the use of automated machine counting for PRP samples, but in the starting blood samples, manual platelet counts were significantly higher than those generated using automated technology.
When there is a delay of up to 4 hours in the generation of PRP from blood or in the application of PRP to the patient, bioactive growth factor and cytokine concentrations remain stable in both blood and PRP. A manual direct counting method is a simple, cost-effective, and valid method to measure the contents of the PRP product being delivered to the patient.
Platelet-rich plasma (PRP) is used to promote healing in many areas of medicine, such as dental surgery,1,2 soft-tissue injury,3,4 orthopedic surgery,5,6 wound healing,7 and veterinary medicine.8,9 Despite its extensive use, there are still questions about the clinical efficacy of PRP.10-12 Due to biological heterogeneity between patients13,14 and differences between available manufacturing kits,13,15 PRP can be highly variable between patients. There are classification schemes to categorize the various types of PRP,16-18 which can be divided broadly into low-leukocyte PRP (Llo PRP) and high-leukocyte PRP (Lhi PRP). PRP can be used as a point of care therapy, prepared and used immediately, or it can be used during a surgical procedure. In some institutions, blood is drawn by a phlebotomist, processed in the hospital laboratory, and then delivered to the operating room. In other instances, PRP is generated patient-side by the primary attending physician’s team, who draws the blood and processes it for immediate use.5,19 Delays at any step in these various scenarios could lead to the blood or the resultant PRP remaining at room temperature from minutes to several hours prior to administration to the patient. This variability in PRP protocols between clinical and surgical settings adds to concerns regarding the stability and efficacy of the biologic.
Continue to: When performing clinical or research...
When performing clinical or research studies using PRP, it is important to report the contents of the PRP delivered to the patient. By documenting the cellular content of the PRP delivered to the patient, the common questions of optimal platelet dose and the importance of leukocytes in PRP can begin to be answered. There are some known factors that contribute to PRP variability, such as patient biology and operator technique, but there are many other unknown factors. In some instances, there is a failure to generate PRP, defined as a lower platelet count in the PRP preparation than in the starting blood sample.13,14 To measure the platelet and cellular contents of the starting blood and PRP, samples can be submitted to a clinical pathology laboratory for a complete blood count, which adds cost to the patient above the typically unreimbursed cost of the PRP injection itself. An alternative method for measuring platelet concentrations is the use of direct smear analysis on glass slides. The use of direct smears to measure platelet concentration is well validated for blood,20,21 but the use of direct smears of PRP for determining platelet concentrations has not been previously validated. The use of manual platelet counts would provide an alternative to automated platelet counting for clinical and preclinical research studies to characterize the type of PRP administered to the patient.
The primary aim of this study was to determine if retention of blood or PRP at room temperature for various time intervals had an effect on final growth factor or catabolic cytokine concentration. Bioactive transforming growth factor-β1 (TGF-β1) and matrix metalloproteinase-9 (MMP-9) were measured as representatives of growth factors and catabolic cytokines, respectively. The secondary aim was to identify if manual platelet counts were an accurate reflection of automated counts. The outcomes of these experiments should provide immediately relevant information for the clinical application of PRP.
MATERIALS AND METHODS
Blood Collection and Generation of PRP
Under Institutional Review Board approval, blood (105 mL) was collected from healthy human volunteers (N = 5) into a syringe containing acid citrate dextrose anticoagulant to a final concentration of 10% acid citrate dextrose. Three 15-mL aliquots of blood were used to generate Llo PRP (Autologous Conditioned Plasma Double Syringe, Arthrex) and three 20-mL aliquots were used to generate Lhi PRP (SmartPReP 2, Harvest Technologies) (Figure 1). 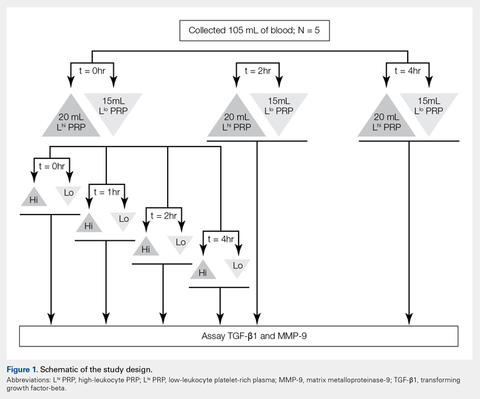
Automated and Manual Counts
Automated complete blood counts were performed by a board certified clinical pathologist in the clinical pathology department of Cornell University on all blood, Llo PRP, and Lhi PRP samples. A manual platelet count, using a modified Giemsa stain,22 was performed on smears of all blood and PRP samples (Video). Slides were scanned at 10x magnification to identify an area where many red blood cells were present while maintaining a clear field of view (Figure 2A). The magnification was then increased to 100x using oil immersion, and the total number of platelets was counted in 10 fields of view (Figure 2B). 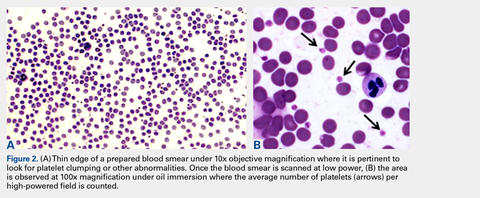
Growth Factor and Catabolic Cytokine Measurements
Blood and PRP samples were thawed for ELISA (enzyme-linked immunosorbent assay) analysis. TGF-β1 concentration was determined using the TGF-β1 Emax ImmunoAssay System (Promega Corporation), which measures biologically active TGF-β1. We chose TGF-β1 because it is commonly measured in PRP studies as an anabolic cytokine with multiple effects on tissue healing. The functions of TGF-β1 include stimulation of undifferentiated mesenchymal cell proliferation; regulation of endothelial, fibroblast, and osteoblast mitogenesis; coordination of collagen synthesis; promotion of endothelial chemotaxis and angiogenesis; activation of extracellular matrix synthesis in cartilage; and reduction of the catabolic activity of interluekin-1 and MMPs.23-25 In addition, TGF-β1 concentration strongly correlates with platelet concentration.26 MMP-9 concentration was determined using the MMP-9 Biotrak Activity Assay (GE Healthcare Biosciences) which measures both active and pro- forms of MMP-9. In PRP, MMP-9 was measured as an indicator of white blood cell (WBC) concentration.26 A catabolic cytokine capable of degrading collagen,13,27 MMP-9 has been linked to poor healing.28 For both assays, samples were measured in duplicate using a multiple detection plate reader (Tecan Safire).
Continue to: Statistical Analysis...
Statistical Analysis
Data were tested for the normal distribution to determine the appropriate statistical test. Manual and automated platelet counts were compared to each other in whole blood, Llo PRP, and Lhi PRP samples using a paired t test. Bioactive TGF-β1 concentrations in blood, Llo PRP, and Lhi PRP, were compared using a Kruskal-Wallis one-way analysis of variance (ANOVA) with Dunn’s all-pairwise comparison. Bioactive and pro-MMP-9 concentrations measured in the retained blood or PRP samples were compared using a one-way ANOVA with Tukey’s all-pairwise comparison. Statistical analyses were performed using Statistix 9 software (Analytical Software). A P value of <0.05 was considered significant.
RESULTS
Validation of PRP
PRP, as defined by an increase in platelet concentration in PRP compared with blood, was successfully generated in all samples by both systems. There was an average 1.98 ± 0.14-fold increase in platelet concentration in Llo PRP and an average 3.06 ± 0.24-fold increase in Lhi PRP. Platelet concentration was significantly higher in Lhi PRP than in Llo PRP (P = 0.001). Compared to whole blood, WBC concentration was 0.47 ± 0.07-fold lower in Llo PRP and 1.98 ± 0.14-fold greater in Lhi PRP. Similar to platelets, WBCs were significantly greater in Lhi PRP than in Llo PRP (P = 0.02).
Bioactive TGF-β1 and MMP-9 Concentration in Blood Retained at Room Temperature
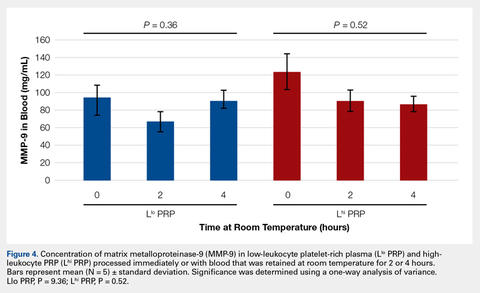
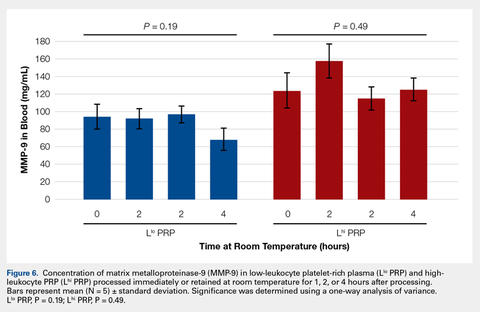
To reflect the clinical situation where blood would be drawn from a patient, but there would be a delay in processing the blood to generate PRP, blood samples were retained at room temperature for up to 4 hours prior to analysis. Neither bioactive TGF-β1 (Figure 3) nor bioactive/pro-MMP-9 concentrations (Figure 4) changed significantly over time when blood was retained at room temperature prior to centrifugation to generate PRP. 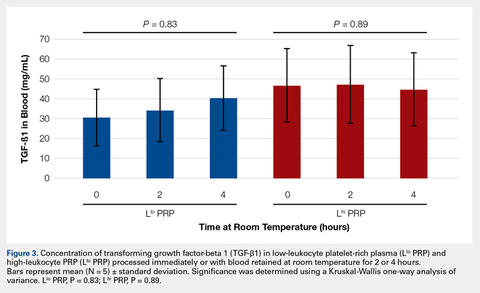
Bioactive TGF-β1 and MMP-9 Concentration in PRP Retained at Room Temperature
In order to mimic the clinical situation where PRP would be generated but might sit out prior to being administered to the patient, PRP samples were retained at room temperature for up to 4 hours prior to analysis. In these samples, bioactive TGF-β1 concentrations were not significantly different between PRP products analyzed immediately and those samples retained at room temperature for up to 4 hours (Figure 5). 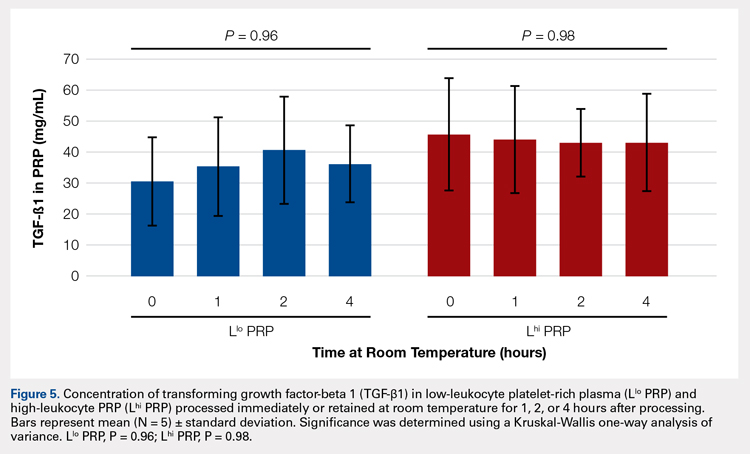
Automatic vs Manual Platelet Count
Manual platelet counts were compared to automated platelet counts to determine if a manual platelet smear analysis could be a reliable method for analyzing PRP in clinical and pre-clinical studies. There was a significant difference between the automated and manual platelet counts in blood samples (Table) (P = 0.05, N = 5) with the manual platelet count having a higher average (99.1 thou/uL) platelet concentration than automated counts. Platelet clumping was identified in 2 automated counts, which falsely decreased platelet concentration by an unknown quantity. Manual platelet counts for both Llo PRP (n = 30) and Lhi PRP (n = 30) were not different from automated platelet counts. Platelet clumping was not reported on any manual platelet counts performed on PRP samples.
Table. Platelet Concentrations of Whole Blood, Llo PRP, and Lhi PRP (N = 5)
| |||||
| Automated Count | Manual Count | P Value | ||
| Mean ± SD | Range | Mean ± SD | Range |
|
Blood | 111.8 ± 59.5 | 54-202 | 210.9 ± 59.4 | 144-297 | 0.05 |
Llo PRP | 421.4 ± 132.8 | 319-620 | 410.1 ± 94.2 | 318-543 | 0.61 |
Lhi PRP | 634.4 ± 88.8 | 517-766 | 635.4 ± 176.6 | 491-933 | 0.99 |
A paired t test was performed to compare results obtained from an automated platelet count and those obtained from a manual count.
Abbreviations: Lhi PRP, high-leukocyte platelet-rich plasma; Llo PRP, low-leukocyte platelet-rich plasma; SD, standard deviation.
Continue to:The primary aim of this study...
DISCUSSION
The primary aim of this study was to improve the clinical use of PRP by characterizing changes that might occur due to extended preparation times. Physicians commonly question the stability of blood or PRP if it is retained at room temperature prior to being administered to the patient. Clinical recommendations to optimize PRP preparation can be derived from a better understanding of the stability of platelets and WBCs, which contribute to the anabolic and catabolic cytokines in PRP.
The results of this study suggest that platelets and WBCs remain stable in blood and both Llo PRP and Lhi PRP for up to 4 hours. The use of bioactive ELISAs to measure TGF-β1 and MMP-9 allows for determination of stability of the PRP product retained at room temperature for up to 4 hours. This provides a time buffer to allow for delays from either institutional logistics or unanticipated clinical delays, without adverse effects on the generation of the final PRP product. As with all biologics, there are many factors that contribute to variability, but a relatively short delay of up to 4 hours in either generation of PRP from blood or in administration of PRP to the patient does not appear to contribute to that variability. Similar studies have been performed on equine PRP and suggest that growth factor concentrations remain stable for up to 6 hours after preparation of PRP29 and in human PRP, which implies that although samples degrade over time, platelet integrity might be acceptable for clinical use for up to 5 days after preparation, particularly if stored in oxygen.30 In contrast to this study, neither of the previously published reports used assays to measure biological activity in the stored PRP. Regardless of the variability between the studies with respect to the type of PRP evaluated and the outcome measures used, all of the studies support the concept that PRP can be stored at room temperature for at least a few hours before clinical use.
Centrifugation of blood does not guarantee the generation of PRP.13,14 In some cases, platelet counts in PRP are similar to or even less than that in the starting whole blood sample. To determine whether a clinical outcome is attributed to PRP, it is vital to know the platelet concentration and, arguably, the WBC concentration in the blood used to generate PRP and in the PRP sample administered to the patient. The platelet concentration in blood and PRP samples can be quantified using automated or manual methods. The use of automated methods can add significant cost to a study or procedure. Manually evaluating a blood smear is an accepted, though more time consuming, method of analyzing cellular components of a blood sample. Depending on the standard operating procedure of the laboratory, manual smears are often done in conjunction with an automated count. This identifies abnormalities in cellular shape or size, or platelet clumping, which are not consistently recognized by automated methods. Manually evaluating a blood smear does take some training, but the material cost is very low, which has added value for clinical or preclinical research studies. Interestingly, the results of this study indicate that manual platelet counts in blood may be more accurate than the count generated from an automated counter because the automated platelet counts were falsely low due to platelet clumping. Platelet clumping can occur as early as 1 hour after blood collection, regardless of the type of anticoagulant used.31
LIMITATIONS
The sample size of this study was small. However, variability in PRP has been well documented in multiple other studies using slightly larger sample sizes.13,14,16 Another potential limitation of this study could be that only one growth factor, TGF-β1, and one catabolic cytokine, MMP-9, were used as surrogate measures to represent platelet and WBC stability, respectively. We chose TGF-β1 because it is correlated with platelet concentrations14,15,26 and MMP-9 because it is an indicator of catabolic factors in PRP that have been correlated with WBC concentrations.26
CONCLUSION
This study illustrated that growth factor and cytokine concentrations in both Llo PRP and Lhi PRP are stable for up to 4 hours. The clinical implications of these results suggest that if the generation or administration of PRP is delayed by up to 4 hours, the resultant PRP retains its bioactivity and is acceptable for clinical application. However, given the known variability of PRP generated due to patient and manufacturer variability,13,14 it is still important to ensure that the product is indeed PRP, with an increase in platelet number over the starting sample of blood. This validation can be performed with a simple and cost-effective manual smear analysis of blood and PRP. The results of this study provide information that can be immediately translated into clinical, surgical, and research practices.
1. Nikolidakis D, Jansen JA. The biology of platelet-rich plasma and its application in oral surgery: Literature review. Tissue Eng Part B Rev. 2008;14(3):249-258. doi:10.1089/ten.teb.2008.0062.
2. Sánchez AR, Sheridan PJ, Kupp LI. Is platelet-rich plasma the perfect enhancement factor? A current review. Int J Oral Maxillofac Implants. 2003;18(1):93-103.
3. Monto RR. Platelet rich plasma treatment for chronic achilles tendinosis. Foot Ankle Int. 2012;33(5):379-385. doi:10.3113/FAI.2012.0379.
4. Owens RF, Ginnetti J, Conti SF, Latona C. Clinical and magnetic resonance imaging outcomes following platelet rich plasma injection for chronic midsubstance Achilles tendinopathy. Foot ankle Int. 2011;32(11):1032-1039. doi:10.3113/FAI.2011.1032.
5. Sánchez M, Anitua E, Azofra J, Andía I, Padilla S, Mujika I. Comparison of surgically repaired achilles tendon tears using platelet-rich fibrin matrices. Am J Sports Med. 2007;35(2):245-251. doi:10.1177/0363546506294078.
6. Silva A, Sampaio R. Anatomic ACL reconstruction: does the platelet-rich plasma accelerate tendon healing? Knee Surg Sports Traumatol Arthrosc. 2009;17(6):676-682. doi:10.1007/s00167-009-0762-8.
7. Fréchette JP, Martineau I, Gagnon G. Platelet-rich plasmas: growth factor content and roles in wound healing. J Dent Res. 2005;84(5):434-439. doi:10.1177/154405910508400507.
8. Bosch G, René van Weeren P, Barneveld A, van Schie HTM. Computerised analysis of standardised ultrasonographic images to monitor the repair of surgically created core lesions in equine superficial digital flexor tendons following treatment with intratendinous platelet rich plasma or placebo. Vet J. 2011;187(1):92-98. doi:10.1016/j.tvjl.2009.10.014.
9. Torricelli P, Fini M, Filardo G, et al. Regenerative medicine for the treatment of musculoskeletal overuse injuries in competition horses. Int Orthop. 2011;35(10):1569-1576. doi:10.1007/s00264-011-1237-3.
10. Sampson S, Gerhardt M, Mandelbaum B. Platelet rich plasma injection grafts for musculoskeletal injuries: a review. Curr Rev Musculoskelet Med. 2008;1(3-4):165-174. doi:10.1007/s12178-008-9032-5.
11. Sheth U, Simunovic N, Klein G, et al. Efficacy of autologous platelet-rich plasma use for orthopaedic indications: a meta-analysis. J Bone Joint Surg Am. 2012;94(4):298-307. doi:10.2106/JBJS.K.00154.
12. Vannini F, Di Matteo B, Filardo G, Kon E, Marcacci M, Giannini S. Platelet-rich plasma for foot and ankle pathologies: a systematic review. Foot Ankle Surg. 2014;20(1):2-9. doi:10.1016/j.fas.2013.08.001.
13. Boswell SG, Cole BJ, Sundman EA, Karas V, Fortier LA. Platelet-rich plasma: a milieu of bioactive factors. Arthroscopy. 2012;28(3):429-439. doi:10.1016/j.arthro.2011.10.018.
14. Mazzocca AD, McCarthy MBR, Chowaniec DM, et al. Platelet-rich plasma differs according to preparation method and human variability. J Bone Joint Surg Am. 2012;94(4):308-316. doi:10.2106/JBJS.K.00430.
15. Castillo TN, Pouliot MA, Kim HJ, Dragoo JL. Comparison of growth factor and platelet concentration from commercial platelet-rich plasma separation systems. Am J Sports Med. 2011;39(2):266-271. doi:10.1177/0363546510387517.
16. Arnoczky SP, Sheibani-Rad S, Shebani-Rad S. The basic science of platelet-rich plasma (PRP): what clinicians need to know. Sports Med Arthrosc. 2013;21(4):180-185. doi:10.1097/JSA.0b013e3182999712.
17. Dohan Ehrenfest DM, Bielecki T, Corso M Del, Inchingolo F, Sammartino G. Shedding light in the controversial terminology for platelet-rich products: Platelet-rich plasma (PRP), platelet-rich fibrin (PRF), platelet-leukocyte gel (PLG), preparation rich in growth factors (PRGF), classification and commercialism. J Biomed Mater Res Part A. 2010;95A(4):1280-1282. doi:10.1002/jbm.a.32894.
18. Dohan Ehrenfest DM, Rasmusson L, Albrektsson T. Classification of platelet concentrates: from pure platelet-rich plasma (P-PRP) to leucocyte- and platelet-rich fibrin (L-PRF). Trends Biotechnol. 2009;27(3):158-167. doi:10.1016/j.tibtech.2008.11.009.
19. Everts PA, Knape JT, Weibrich G, et al. Platelet-rich plasma and platelet gel: a review. J Extra Corpor Technol. 2006;38(2):174-187.
20. Malok M, Titchener EH, Bridgers C, Lee BY, Bamberg R. Comparison of two platelet count estimation methodologies for peripheral blood smears. Clin Lab Sci. 2007;20(3):154-160.
21. Gulati G, Uppal G, Florea AD, Gong J. Detection of platelet clumps on peripheral blood smears by CellaVision DM96 System and Microscopic Review. Lab Med. 2014;45(4):368-371. doi:10.1309/LM604RQVKVLRFXOR.
22. Gulati G, Song J, Florea AD, Gong J. Purpose and criteria for blood smear scan, blood smear examination, and blood smear review. Ann Lab Med. 2013;33(1):1-7. doi:10.3343/alm.2013.33.1.1.
23. Barrientos S, Stojadinovic O, Golinko MS, Brem H, Tomic-Canic M. Perspective article: Growth factors and cytokines in wound healing. Wound Repair Regen. 2008;16(5):585-601. doi:10.1111/j.1524-475X.2008.00410.x.
24. Crane D, Everts P. Platelet rich plasma (PRP) matrix grafts. Pract Pain Manag. 2008;8(1):12-26.
25. Fortier LA, Barker JU, Strauss EJ, McCarrel TM, Cole BJ. The role of growth factors in cartilage repair. Clin Orthop Relat Res. 2011;469(10):2706-2715. doi:10.1007/s11999-011-1857-3.
26. Sundman EA, Cole BJ, Fortier LA. Growth factor and catabolic cytokine concentrations are influenced by the cellular composition of platelet-rich plasma. Am J Sports Med. 2011;39(10):2135-2140. doi:10.1177/0363546511417792.
27. Vu TH, Shipley JM, Bergers G, et al. MMP-9/gelatinase B is a key regulator of growth plate angiogenesis and apoptosis of hypertrophic chondrocytes. Cell. 1998;93(3):411-422.
28. Watelet JB, Demetter P, Claeys C, Van Cauwenberge P, Cuvelier C, Bachert C. Neutrophil-derived metalloproteinase-9 predicts healing quality after sinus surgery. Laryngoscope. 2005;115(1):56-61. doi:10.1097/01.mlg.0000150674.30237.3f.
29. Hauschild G, Geburek F, Gosheger G, et al. Short term storage stability at room temperature of two different platelet-rich plasma preparations from equine donors and potential impact on growth factor concentrations. BMC Vet Res. 2017;13(1):7. doi:10.1186/s12917-016-0920-4.
30. Moore GW, Maloney JC, Archer RA, et al. Platelet-rich plasma for tissue regeneration can be stored at room temperature for at least five days. Br J Biomed Sci. 2017;74(2):71-77. doi:10.1080/09674845.2016.1233792.
31. McShine RL, Sibinga S, Brozovic B. Differences between the effects of EDTA and citrate anticoagulants on platelet count and mean platelet volume. Clin Lab Haematol. 1990;12(3):277-285.
ABSTRACT
The aim of this study was to provide clinical recommendations about the use of platelet-rich plasma (PRP) that was subjected to short-term storage at room temperature. We determined bioactive growth factor and cytokine concentrations as indicators of platelet and white blood cell degranulation in blood and PRP. Additionally, this study sought to validate the use of manual, direct smear analysis as an alternative to automated methods for platelet quantification in PRP.
Blood was used to generate low-leukocyte PRP (Llo PRP) or high-leukocyte PRP (Lhi PRP). Blood was either processed immediately or kept at room temperature for 2 or 4 hours prior to generation of PRP, which was then held at room temperature for 0, 1, 2, or 4 hours. Subsequently, bioactive transforming growth factor beta-1 and matrix metalloproteinase-9 were measured by ELISA (enzyme-linked immunosorbent assay). Manual and automated platelet counts were performed on all blood and PRP samples.
There were no differences in growth factor or cytokine concentration when blood or Llo PRP or Lhi PRP was retained at room temperature for up to 4 hours. Manual, direct smear analysis for platelet quantification was not different from the use of automated machine counting for PRP samples, but in the starting blood samples, manual platelet counts were significantly higher than those generated using automated technology.
When there is a delay of up to 4 hours in the generation of PRP from blood or in the application of PRP to the patient, bioactive growth factor and cytokine concentrations remain stable in both blood and PRP. A manual direct counting method is a simple, cost-effective, and valid method to measure the contents of the PRP product being delivered to the patient.
Platelet-rich plasma (PRP) is used to promote healing in many areas of medicine, such as dental surgery,1,2 soft-tissue injury,3,4 orthopedic surgery,5,6 wound healing,7 and veterinary medicine.8,9 Despite its extensive use, there are still questions about the clinical efficacy of PRP.10-12 Due to biological heterogeneity between patients13,14 and differences between available manufacturing kits,13,15 PRP can be highly variable between patients. There are classification schemes to categorize the various types of PRP,16-18 which can be divided broadly into low-leukocyte PRP (Llo PRP) and high-leukocyte PRP (Lhi PRP). PRP can be used as a point of care therapy, prepared and used immediately, or it can be used during a surgical procedure. In some institutions, blood is drawn by a phlebotomist, processed in the hospital laboratory, and then delivered to the operating room. In other instances, PRP is generated patient-side by the primary attending physician’s team, who draws the blood and processes it for immediate use.5,19 Delays at any step in these various scenarios could lead to the blood or the resultant PRP remaining at room temperature from minutes to several hours prior to administration to the patient. This variability in PRP protocols between clinical and surgical settings adds to concerns regarding the stability and efficacy of the biologic.
Continue to: When performing clinical or research...
When performing clinical or research studies using PRP, it is important to report the contents of the PRP delivered to the patient. By documenting the cellular content of the PRP delivered to the patient, the common questions of optimal platelet dose and the importance of leukocytes in PRP can begin to be answered. There are some known factors that contribute to PRP variability, such as patient biology and operator technique, but there are many other unknown factors. In some instances, there is a failure to generate PRP, defined as a lower platelet count in the PRP preparation than in the starting blood sample.13,14 To measure the platelet and cellular contents of the starting blood and PRP, samples can be submitted to a clinical pathology laboratory for a complete blood count, which adds cost to the patient above the typically unreimbursed cost of the PRP injection itself. An alternative method for measuring platelet concentrations is the use of direct smear analysis on glass slides. The use of direct smears to measure platelet concentration is well validated for blood,20,21 but the use of direct smears of PRP for determining platelet concentrations has not been previously validated. The use of manual platelet counts would provide an alternative to automated platelet counting for clinical and preclinical research studies to characterize the type of PRP administered to the patient.
The primary aim of this study was to determine if retention of blood or PRP at room temperature for various time intervals had an effect on final growth factor or catabolic cytokine concentration. Bioactive transforming growth factor-β1 (TGF-β1) and matrix metalloproteinase-9 (MMP-9) were measured as representatives of growth factors and catabolic cytokines, respectively. The secondary aim was to identify if manual platelet counts were an accurate reflection of automated counts. The outcomes of these experiments should provide immediately relevant information for the clinical application of PRP.
MATERIALS AND METHODS
Blood Collection and Generation of PRP
Under Institutional Review Board approval, blood (105 mL) was collected from healthy human volunteers (N = 5) into a syringe containing acid citrate dextrose anticoagulant to a final concentration of 10% acid citrate dextrose. Three 15-mL aliquots of blood were used to generate Llo PRP (Autologous Conditioned Plasma Double Syringe, Arthrex) and three 20-mL aliquots were used to generate Lhi PRP (SmartPReP 2, Harvest Technologies) (Figure 1).
Automated and Manual Counts
Automated complete blood counts were performed by a board certified clinical pathologist in the clinical pathology department of Cornell University on all blood, Llo PRP, and Lhi PRP samples. A manual platelet count, using a modified Giemsa stain,22 was performed on smears of all blood and PRP samples (Video). Slides were scanned at 10x magnification to identify an area where many red blood cells were present while maintaining a clear field of view (Figure 2A). The magnification was then increased to 100x using oil immersion, and the total number of platelets was counted in 10 fields of view (Figure 2B).
Growth Factor and Catabolic Cytokine Measurements
Blood and PRP samples were thawed for ELISA (enzyme-linked immunosorbent assay) analysis. TGF-β1 concentration was determined using the TGF-β1 Emax ImmunoAssay System (Promega Corporation), which measures biologically active TGF-β1. We chose TGF-β1 because it is commonly measured in PRP studies as an anabolic cytokine with multiple effects on tissue healing. The functions of TGF-β1 include stimulation of undifferentiated mesenchymal cell proliferation; regulation of endothelial, fibroblast, and osteoblast mitogenesis; coordination of collagen synthesis; promotion of endothelial chemotaxis and angiogenesis; activation of extracellular matrix synthesis in cartilage; and reduction of the catabolic activity of interluekin-1 and MMPs.23-25 In addition, TGF-β1 concentration strongly correlates with platelet concentration.26 MMP-9 concentration was determined using the MMP-9 Biotrak Activity Assay (GE Healthcare Biosciences) which measures both active and pro- forms of MMP-9. In PRP, MMP-9 was measured as an indicator of white blood cell (WBC) concentration.26 A catabolic cytokine capable of degrading collagen,13,27 MMP-9 has been linked to poor healing.28 For both assays, samples were measured in duplicate using a multiple detection plate reader (Tecan Safire).
Continue to: Statistical Analysis...
Statistical Analysis
Data were tested for the normal distribution to determine the appropriate statistical test. Manual and automated platelet counts were compared to each other in whole blood, Llo PRP, and Lhi PRP samples using a paired t test. Bioactive TGF-β1 concentrations in blood, Llo PRP, and Lhi PRP, were compared using a Kruskal-Wallis one-way analysis of variance (ANOVA) with Dunn’s all-pairwise comparison. Bioactive and pro-MMP-9 concentrations measured in the retained blood or PRP samples were compared using a one-way ANOVA with Tukey’s all-pairwise comparison. Statistical analyses were performed using Statistix 9 software (Analytical Software). A P value of <0.05 was considered significant.
RESULTS
Validation of PRP
PRP, as defined by an increase in platelet concentration in PRP compared with blood, was successfully generated in all samples by both systems. There was an average 1.98 ± 0.14-fold increase in platelet concentration in Llo PRP and an average 3.06 ± 0.24-fold increase in Lhi PRP. Platelet concentration was significantly higher in Lhi PRP than in Llo PRP (P = 0.001). Compared to whole blood, WBC concentration was 0.47 ± 0.07-fold lower in Llo PRP and 1.98 ± 0.14-fold greater in Lhi PRP. Similar to platelets, WBCs were significantly greater in Lhi PRP than in Llo PRP (P = 0.02).
Bioactive TGF-β1 and MMP-9 Concentration in Blood Retained at Room Temperature
To reflect the clinical situation where blood would be drawn from a patient, but there would be a delay in processing the blood to generate PRP, blood samples were retained at room temperature for up to 4 hours prior to analysis. Neither bioactive TGF-β1 (Figure 3) nor bioactive/pro-MMP-9 concentrations (Figure 4) changed significantly over time when blood was retained at room temperature prior to centrifugation to generate PRP.
Bioactive TGF-β1 and MMP-9 Concentration in PRP Retained at Room Temperature
In order to mimic the clinical situation where PRP would be generated but might sit out prior to being administered to the patient, PRP samples were retained at room temperature for up to 4 hours prior to analysis. In these samples, bioactive TGF-β1 concentrations were not significantly different between PRP products analyzed immediately and those samples retained at room temperature for up to 4 hours (Figure 5).
Automatic vs Manual Platelet Count
Manual platelet counts were compared to automated platelet counts to determine if a manual platelet smear analysis could be a reliable method for analyzing PRP in clinical and pre-clinical studies. There was a significant difference between the automated and manual platelet counts in blood samples (Table) (P = 0.05, N = 5) with the manual platelet count having a higher average (99.1 thou/uL) platelet concentration than automated counts. Platelet clumping was identified in 2 automated counts, which falsely decreased platelet concentration by an unknown quantity. Manual platelet counts for both Llo PRP (n = 30) and Lhi PRP (n = 30) were not different from automated platelet counts. Platelet clumping was not reported on any manual platelet counts performed on PRP samples.
Table. Platelet Concentrations of Whole Blood, Llo PRP, and Lhi PRP (N = 5)
| |||||
| Automated Count | Manual Count | P Value | ||
| Mean ± SD | Range | Mean ± SD | Range |
|
Blood | 111.8 ± 59.5 | 54-202 | 210.9 ± 59.4 | 144-297 | 0.05 |
Llo PRP | 421.4 ± 132.8 | 319-620 | 410.1 ± 94.2 | 318-543 | 0.61 |
Lhi PRP | 634.4 ± 88.8 | 517-766 | 635.4 ± 176.6 | 491-933 | 0.99 |
A paired t test was performed to compare results obtained from an automated platelet count and those obtained from a manual count.
Abbreviations: Lhi PRP, high-leukocyte platelet-rich plasma; Llo PRP, low-leukocyte platelet-rich plasma; SD, standard deviation.
Continue to:The primary aim of this study...
DISCUSSION
The primary aim of this study was to improve the clinical use of PRP by characterizing changes that might occur due to extended preparation times. Physicians commonly question the stability of blood or PRP if it is retained at room temperature prior to being administered to the patient. Clinical recommendations to optimize PRP preparation can be derived from a better understanding of the stability of platelets and WBCs, which contribute to the anabolic and catabolic cytokines in PRP.
The results of this study suggest that platelets and WBCs remain stable in blood and both Llo PRP and Lhi PRP for up to 4 hours. The use of bioactive ELISAs to measure TGF-β1 and MMP-9 allows for determination of stability of the PRP product retained at room temperature for up to 4 hours. This provides a time buffer to allow for delays from either institutional logistics or unanticipated clinical delays, without adverse effects on the generation of the final PRP product. As with all biologics, there are many factors that contribute to variability, but a relatively short delay of up to 4 hours in either generation of PRP from blood or in administration of PRP to the patient does not appear to contribute to that variability. Similar studies have been performed on equine PRP and suggest that growth factor concentrations remain stable for up to 6 hours after preparation of PRP29 and in human PRP, which implies that although samples degrade over time, platelet integrity might be acceptable for clinical use for up to 5 days after preparation, particularly if stored in oxygen.30 In contrast to this study, neither of the previously published reports used assays to measure biological activity in the stored PRP. Regardless of the variability between the studies with respect to the type of PRP evaluated and the outcome measures used, all of the studies support the concept that PRP can be stored at room temperature for at least a few hours before clinical use.
Centrifugation of blood does not guarantee the generation of PRP.13,14 In some cases, platelet counts in PRP are similar to or even less than that in the starting whole blood sample. To determine whether a clinical outcome is attributed to PRP, it is vital to know the platelet concentration and, arguably, the WBC concentration in the blood used to generate PRP and in the PRP sample administered to the patient. The platelet concentration in blood and PRP samples can be quantified using automated or manual methods. The use of automated methods can add significant cost to a study or procedure. Manually evaluating a blood smear is an accepted, though more time consuming, method of analyzing cellular components of a blood sample. Depending on the standard operating procedure of the laboratory, manual smears are often done in conjunction with an automated count. This identifies abnormalities in cellular shape or size, or platelet clumping, which are not consistently recognized by automated methods. Manually evaluating a blood smear does take some training, but the material cost is very low, which has added value for clinical or preclinical research studies. Interestingly, the results of this study indicate that manual platelet counts in blood may be more accurate than the count generated from an automated counter because the automated platelet counts were falsely low due to platelet clumping. Platelet clumping can occur as early as 1 hour after blood collection, regardless of the type of anticoagulant used.31
LIMITATIONS
The sample size of this study was small. However, variability in PRP has been well documented in multiple other studies using slightly larger sample sizes.13,14,16 Another potential limitation of this study could be that only one growth factor, TGF-β1, and one catabolic cytokine, MMP-9, were used as surrogate measures to represent platelet and WBC stability, respectively. We chose TGF-β1 because it is correlated with platelet concentrations14,15,26 and MMP-9 because it is an indicator of catabolic factors in PRP that have been correlated with WBC concentrations.26
CONCLUSION
This study illustrated that growth factor and cytokine concentrations in both Llo PRP and Lhi PRP are stable for up to 4 hours. The clinical implications of these results suggest that if the generation or administration of PRP is delayed by up to 4 hours, the resultant PRP retains its bioactivity and is acceptable for clinical application. However, given the known variability of PRP generated due to patient and manufacturer variability,13,14 it is still important to ensure that the product is indeed PRP, with an increase in platelet number over the starting sample of blood. This validation can be performed with a simple and cost-effective manual smear analysis of blood and PRP. The results of this study provide information that can be immediately translated into clinical, surgical, and research practices.
1. Nikolidakis D, Jansen JA. The biology of platelet-rich plasma and its application in oral surgery: Literature review. Tissue Eng Part B Rev. 2008;14(3):249-258. doi:10.1089/ten.teb.2008.0062.
2. Sánchez AR, Sheridan PJ, Kupp LI. Is platelet-rich plasma the perfect enhancement factor? A current review. Int J Oral Maxillofac Implants. 2003;18(1):93-103.
3. Monto RR. Platelet rich plasma treatment for chronic achilles tendinosis. Foot Ankle Int. 2012;33(5):379-385. doi:10.3113/FAI.2012.0379.
4. Owens RF, Ginnetti J, Conti SF, Latona C. Clinical and magnetic resonance imaging outcomes following platelet rich plasma injection for chronic midsubstance Achilles tendinopathy. Foot ankle Int. 2011;32(11):1032-1039. doi:10.3113/FAI.2011.1032.
5. Sánchez M, Anitua E, Azofra J, Andía I, Padilla S, Mujika I. Comparison of surgically repaired achilles tendon tears using platelet-rich fibrin matrices. Am J Sports Med. 2007;35(2):245-251. doi:10.1177/0363546506294078.
6. Silva A, Sampaio R. Anatomic ACL reconstruction: does the platelet-rich plasma accelerate tendon healing? Knee Surg Sports Traumatol Arthrosc. 2009;17(6):676-682. doi:10.1007/s00167-009-0762-8.
7. Fréchette JP, Martineau I, Gagnon G. Platelet-rich plasmas: growth factor content and roles in wound healing. J Dent Res. 2005;84(5):434-439. doi:10.1177/154405910508400507.
8. Bosch G, René van Weeren P, Barneveld A, van Schie HTM. Computerised analysis of standardised ultrasonographic images to monitor the repair of surgically created core lesions in equine superficial digital flexor tendons following treatment with intratendinous platelet rich plasma or placebo. Vet J. 2011;187(1):92-98. doi:10.1016/j.tvjl.2009.10.014.
9. Torricelli P, Fini M, Filardo G, et al. Regenerative medicine for the treatment of musculoskeletal overuse injuries in competition horses. Int Orthop. 2011;35(10):1569-1576. doi:10.1007/s00264-011-1237-3.
10. Sampson S, Gerhardt M, Mandelbaum B. Platelet rich plasma injection grafts for musculoskeletal injuries: a review. Curr Rev Musculoskelet Med. 2008;1(3-4):165-174. doi:10.1007/s12178-008-9032-5.
11. Sheth U, Simunovic N, Klein G, et al. Efficacy of autologous platelet-rich plasma use for orthopaedic indications: a meta-analysis. J Bone Joint Surg Am. 2012;94(4):298-307. doi:10.2106/JBJS.K.00154.
12. Vannini F, Di Matteo B, Filardo G, Kon E, Marcacci M, Giannini S. Platelet-rich plasma for foot and ankle pathologies: a systematic review. Foot Ankle Surg. 2014;20(1):2-9. doi:10.1016/j.fas.2013.08.001.
13. Boswell SG, Cole BJ, Sundman EA, Karas V, Fortier LA. Platelet-rich plasma: a milieu of bioactive factors. Arthroscopy. 2012;28(3):429-439. doi:10.1016/j.arthro.2011.10.018.
14. Mazzocca AD, McCarthy MBR, Chowaniec DM, et al. Platelet-rich plasma differs according to preparation method and human variability. J Bone Joint Surg Am. 2012;94(4):308-316. doi:10.2106/JBJS.K.00430.
15. Castillo TN, Pouliot MA, Kim HJ, Dragoo JL. Comparison of growth factor and platelet concentration from commercial platelet-rich plasma separation systems. Am J Sports Med. 2011;39(2):266-271. doi:10.1177/0363546510387517.
16. Arnoczky SP, Sheibani-Rad S, Shebani-Rad S. The basic science of platelet-rich plasma (PRP): what clinicians need to know. Sports Med Arthrosc. 2013;21(4):180-185. doi:10.1097/JSA.0b013e3182999712.
17. Dohan Ehrenfest DM, Bielecki T, Corso M Del, Inchingolo F, Sammartino G. Shedding light in the controversial terminology for platelet-rich products: Platelet-rich plasma (PRP), platelet-rich fibrin (PRF), platelet-leukocyte gel (PLG), preparation rich in growth factors (PRGF), classification and commercialism. J Biomed Mater Res Part A. 2010;95A(4):1280-1282. doi:10.1002/jbm.a.32894.
18. Dohan Ehrenfest DM, Rasmusson L, Albrektsson T. Classification of platelet concentrates: from pure platelet-rich plasma (P-PRP) to leucocyte- and platelet-rich fibrin (L-PRF). Trends Biotechnol. 2009;27(3):158-167. doi:10.1016/j.tibtech.2008.11.009.
19. Everts PA, Knape JT, Weibrich G, et al. Platelet-rich plasma and platelet gel: a review. J Extra Corpor Technol. 2006;38(2):174-187.
20. Malok M, Titchener EH, Bridgers C, Lee BY, Bamberg R. Comparison of two platelet count estimation methodologies for peripheral blood smears. Clin Lab Sci. 2007;20(3):154-160.
21. Gulati G, Uppal G, Florea AD, Gong J. Detection of platelet clumps on peripheral blood smears by CellaVision DM96 System and Microscopic Review. Lab Med. 2014;45(4):368-371. doi:10.1309/LM604RQVKVLRFXOR.
22. Gulati G, Song J, Florea AD, Gong J. Purpose and criteria for blood smear scan, blood smear examination, and blood smear review. Ann Lab Med. 2013;33(1):1-7. doi:10.3343/alm.2013.33.1.1.
23. Barrientos S, Stojadinovic O, Golinko MS, Brem H, Tomic-Canic M. Perspective article: Growth factors and cytokines in wound healing. Wound Repair Regen. 2008;16(5):585-601. doi:10.1111/j.1524-475X.2008.00410.x.
24. Crane D, Everts P. Platelet rich plasma (PRP) matrix grafts. Pract Pain Manag. 2008;8(1):12-26.
25. Fortier LA, Barker JU, Strauss EJ, McCarrel TM, Cole BJ. The role of growth factors in cartilage repair. Clin Orthop Relat Res. 2011;469(10):2706-2715. doi:10.1007/s11999-011-1857-3.
26. Sundman EA, Cole BJ, Fortier LA. Growth factor and catabolic cytokine concentrations are influenced by the cellular composition of platelet-rich plasma. Am J Sports Med. 2011;39(10):2135-2140. doi:10.1177/0363546511417792.
27. Vu TH, Shipley JM, Bergers G, et al. MMP-9/gelatinase B is a key regulator of growth plate angiogenesis and apoptosis of hypertrophic chondrocytes. Cell. 1998;93(3):411-422.
28. Watelet JB, Demetter P, Claeys C, Van Cauwenberge P, Cuvelier C, Bachert C. Neutrophil-derived metalloproteinase-9 predicts healing quality after sinus surgery. Laryngoscope. 2005;115(1):56-61. doi:10.1097/01.mlg.0000150674.30237.3f.
29. Hauschild G, Geburek F, Gosheger G, et al. Short term storage stability at room temperature of two different platelet-rich plasma preparations from equine donors and potential impact on growth factor concentrations. BMC Vet Res. 2017;13(1):7. doi:10.1186/s12917-016-0920-4.
30. Moore GW, Maloney JC, Archer RA, et al. Platelet-rich plasma for tissue regeneration can be stored at room temperature for at least five days. Br J Biomed Sci. 2017;74(2):71-77. doi:10.1080/09674845.2016.1233792.
31. McShine RL, Sibinga S, Brozovic B. Differences between the effects of EDTA and citrate anticoagulants on platelet count and mean platelet volume. Clin Lab Haematol. 1990;12(3):277-285.
TAKE-HOME POINTS
- Blood can be stored at room temperature for up to 4 hours before making PRP without loss in activity.
- PRP can be stored at room temperature for up to 4 hours before administration to a patient without loss in activity.
- Manual, direct smear analysis is as accurate as automated counting for measuring platelet concentration in PRP.

Using the Child and Adolescent Service Intensity Instrument (CASII) as an Outcome Measure
From the Jewish Family and Children’s Service, Phoenix, AZ (Dr. Henderson) and Consult-Stat, Macungie, PA (Ms. Wasser, Dr. Wasser).
Abstract
- Background: The reliability and validity of the Child and Adolescent Service Intensity Instrument (CASII) as a tool to help determine needed level of care for children with behavioral health needs has previously been established.
- Objective: To determine the utility of the CASII as an outcome measure.
- Methods: A sample consisting of all clients (n = 8465) admitted to service at an outpatient beha
vioral health facility from 2013 through 2016 were studied. CASII was administered at admission and discharge and ratings were compared with paired t-tests within demographic and diagnosis groups. - Results: Mean CASII composite ratings decreased between admission and discharge in the entire cohort as well as within gender, age group, and multiple diagnosis groups tested.
- Conclusion: CASII was useful as an outcome measure in our relatively low to moderate acuity population.
Keywords: outcomes, evidence based practice, child psychology, outpatient research.
The primary goal of mental health services is to provide interventions that result in a reduction of problematic symptomatology [1]; therefore, evaluation of those interventions is important for both the client as well as the stakeholders of the organization providing them. Health care payment reforms require tracking quality measures, and such measures directly influence the development, administration, and monitoring of mental health programs as well as specific treatment modalities [2,3]. Organizations are more likely to benefit when outcomes measures are relayed quantitatively [4]. In addition, clients are becoming more informed regarding the quality of care, and outcomes assessments can inform clients that programs are delivering the most efficacious therapies based on current evidence-based practice standards.
Developing outcomes assessments in behavioral health is challenging [5–7]. There are numerous potential outcome domains that can be assessed as well as different ways of measuring them. Futher, evaluating treatment can be expensive, with components including developing a tool, training staff to administer the tool, ensuring the necessary technical support to store and process the data, interpretation of the data, compiling reports, and communicating results to clients and providers [5]. Being mindful of these components and their associated costs, our organization considered whether a tool we currently use to assess the appropriate intensity of service needed for an individual could also be used as an outcome measure.
Therapeutic methods for children in our organization consist of a “system of care” approach designed by a treatment team that incorporates varied methods depending on the needs of the child. The primary goal is to prevent children with traumatic-based disorders from developing continuing disorders associated with their experiences, such as substance use and chronic health and mental health disorders. Our organization currently uses the CASII (Child and Adolescent Service Intensity Instrument) to assess the appropriate level of intensity of service needed by the child. The CASII incorporates holistic information on the child, within the context of his/her family and social ecology, assessing across 6 dimensions: risk of harm (including trauma issues), functional status, co-occurring conditions, recovery environment, resiliency/response to services, and involvement in services.
In order to comply with the call to consider outcomes measurement and evidence based practice as an integral component of children’s mental health services, this study was performed. It examines the use of the CASII as an outcomes measure based on the rationale that a decreased level of care upon discharge would correlate with a positive outcome by proxy.
Methods
CASII Instrument
The CASII is a decision support tool to help the service provider determine the intensity of services that a child should have to adequately address their behavioral health needs. The CASII has a strong evidence base supporting its reliability and validity [8], and has gained wide usage in a range of health care settings over the past 13 years [9–11].
As mentioned, the CASII assesses the client across 6 key dimensions: risk of harm (including trauma issues), functional status, co-occurring conditions, recovery environment, resiliency/response to services, and involvement in services. Each dimension is scored along a 5-point rating scale, and a total or composite rating is calculated by adding the scores for each dimension. The composite rating corresponds with the level of service intensity needed. There are 7 levels of service intensity, ranging from Level 0 (corresponding with a composite rating of 9 or less) to Level 6 (corresponding with a composite rating of 28 or more) (Table 1). 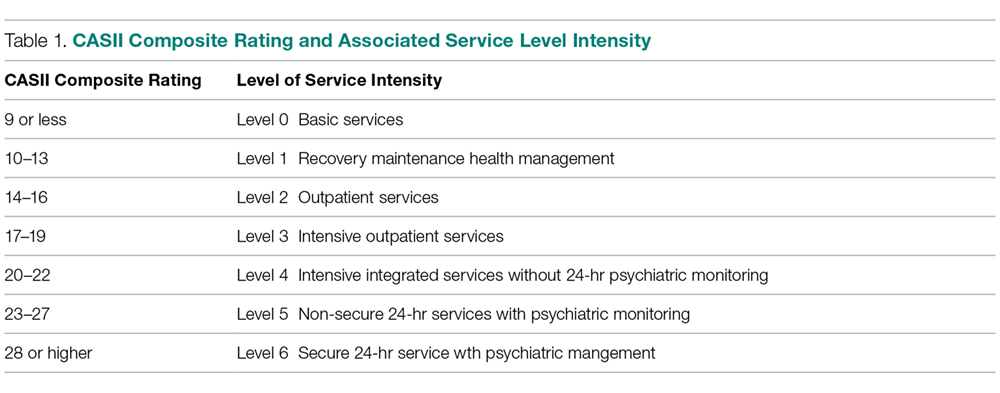
Study Sample
The sample consisted of all clients (n = 8465) admitted to service from 2013 through 2016 to our facility. Our facility is an outpatient facility offering counseling, mental health assessment and treatment, early childhood trauma assessment, child crisis interventions and rehabilitation for domestic violence, child abuse and neglect, and substance abuse. All clients between the ages of 6 and 17 are assessed with the CASII on admission and then at 6-month intervals until discharge from the program. Being discharged from the program of care prompts the completion of the discharge CASII. If the client had been rated within the 30 days prior to discharge the most recent CASII is used as the discharge measure.
Data Analysis
Data for all admissions from 2013 and 2016 were extracted from the organization’s computer system into an Excel file. The data collected included gender, calendar year of admission to the program, age, and diagnosis group based on the discharge diagnosis given by the mental health team, and whether the client was a participant in the Youth in Transition (YIT) program (program for older clients that includes life skills training in addition to standard therapy). The CASII composite rating at baseline and discharge as well as ratings for each of the 6 dimensions assessed with the CASII were also collected.
We used SPSS (v25.01) software for statistical analysis. Analysis included paired (pre-post) t-tests that were applied to the entire cohort as well as within gender, age group, participation in the YIT program, and diagnosis groups. Diagnosis groups were included only if the frequency of cases within the group was large enough to meet the sample size requirements of central limit theorem (in general, n > 25), with 2 exceptions: schizophrenia spectrum was included because of the rarity of the diagnosis (n = 11) and neurodevelopmental disorders (also n = 11) was included because there was no violation of the equal variance assumption as well as interest to the investigators. In addition to the paired analysis, we used group t tests to determine if there were severity differences between groups at baseline. Lastly, we assessed change from admission to discharge for each of the 6 dimensions that make up the composite rating.
We designated the 7 levels of care defined by the CASII as continuous in nature, and therefore computations of means and standard deviations (SD) are appropriate for assessment. The interpretation of the CASII composite rating and the level of care as a continuous variable has also been reported in the literature [11,12].
The research and analysis was viewed as exploratory in nature and a P value less than 0.05 was considered statistically significant. There was no correction for multiple comparisons applied to the data in order to not mask any observed differences in the data. All analyses were 2-tailed. If any individual had a missing value for either an admission or discharge CASII assessment they were excluded from the statistical analysis.
Results
There were 8465 clients admitted from 2013 and 2016. The sample was predominantly male (54.5%), and the majority fell into the older 12–17 year old cohort (54.0%). Admissions were evenly distributed across the 4 years that we studied, with the lowest percentage in 2013 at 23.4% and the highest in 2014 at 26.0%. Discharge diagnosis was available for the majority of the cohort. The top 5 most frequent diagnosis groups were adjustment disorders (n = 807, 18.3%), ADHD (n = 798, 18.1%), child neglect (n = 775, 17.6%), mood disorders (n = 602, 13.6%), and impulse disorders (n = 262, 5.9%). There were 232 (2.7%) clients that participated in the YIT program. Table 2 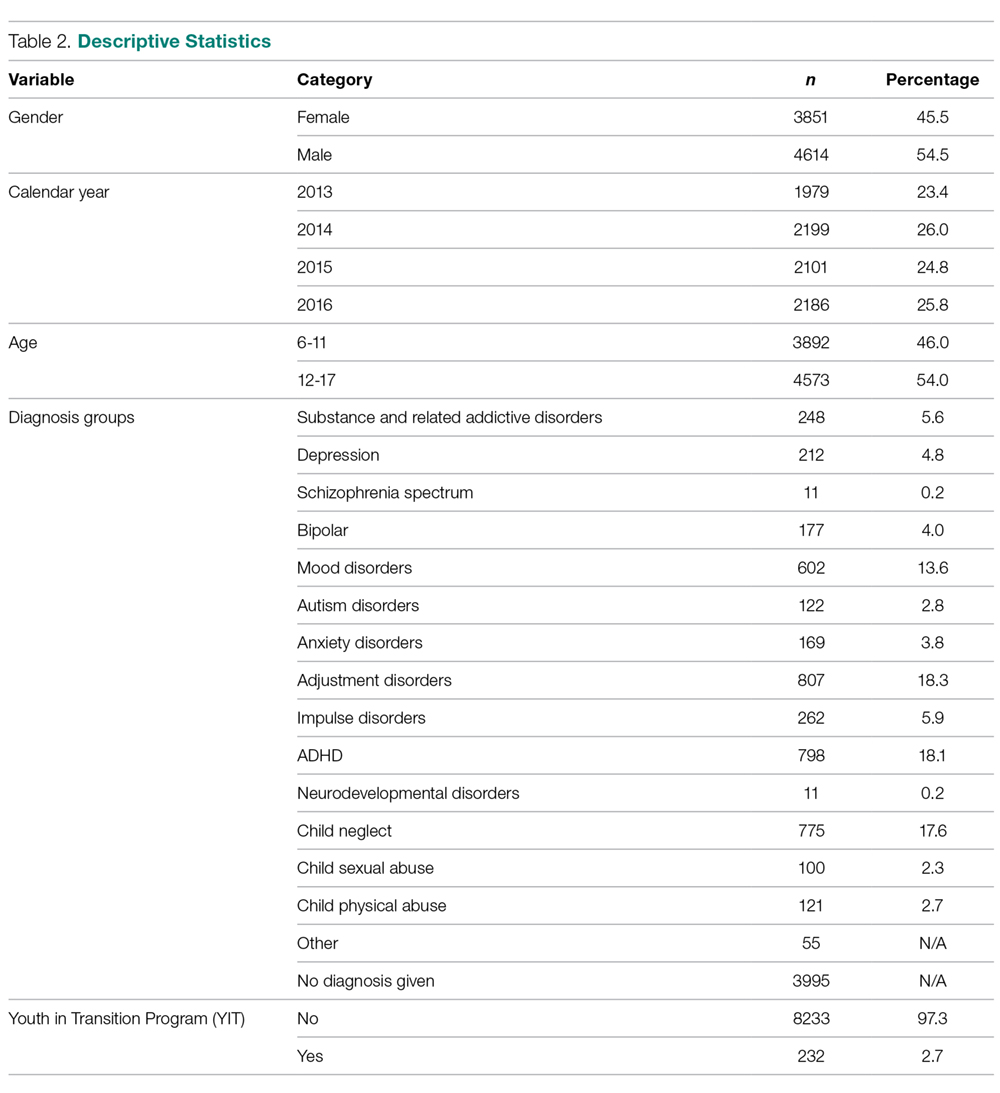
At admission, several groups had higher mean composite ratings. Males had higher ratings (in need of higher level of service intensity) than females (P < 0.001), 12–17 year olds had a significantly higher acuity level than 6–11 year olds (P < 0.001), and clients in the YIT program had a higher acuity level than those not in the YIT program (P = 0.001). Baseline acuity levels for primary discharge diagnosis for selected groups are shown in the Figure. 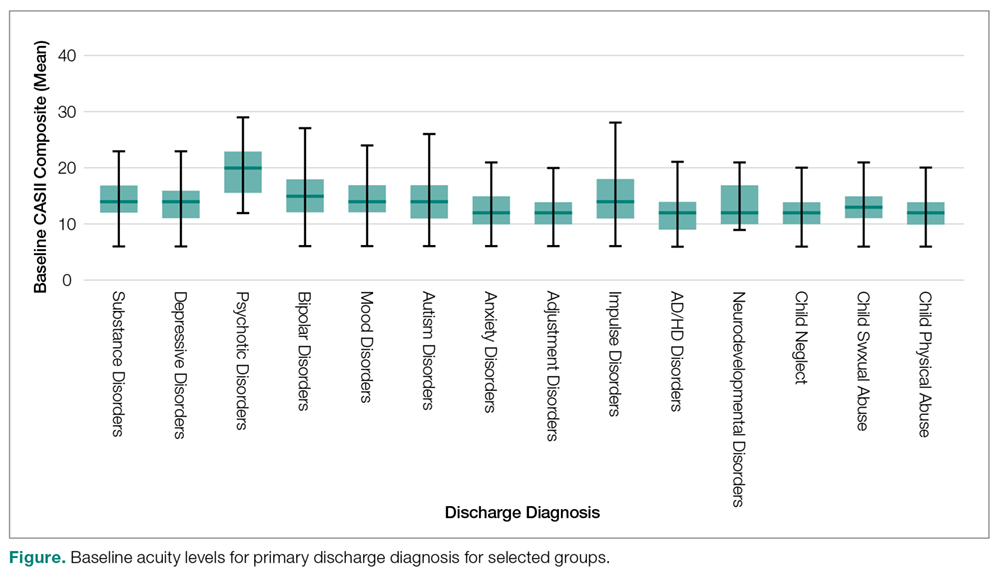
When analyzing the entire cohort for which data were available (n = 6944), the mean CASII composite rating dropped from 13.23 (± 4.35 SD) to 12.04 (± 3.84 SD), P < 0.001. Excluding youth that participated in YIT, the mean CASII score dropped from 13.21 (± 4.33) at admission to 13.17 (± 4.52) at discharge. Mean composite rating for clients participating in the YIT program dropped from 14.31 (± 5.12) at admission to 13.17 (± 4.52) at discharge (P = 0.022). For diagnosis groups, statistically significant reduction in mean CASII composite rating was observed for all groups except neurodevelopmentall disorders (P = 0.166). The results for all groups and diagnosis cohorts can be found in Table 3. 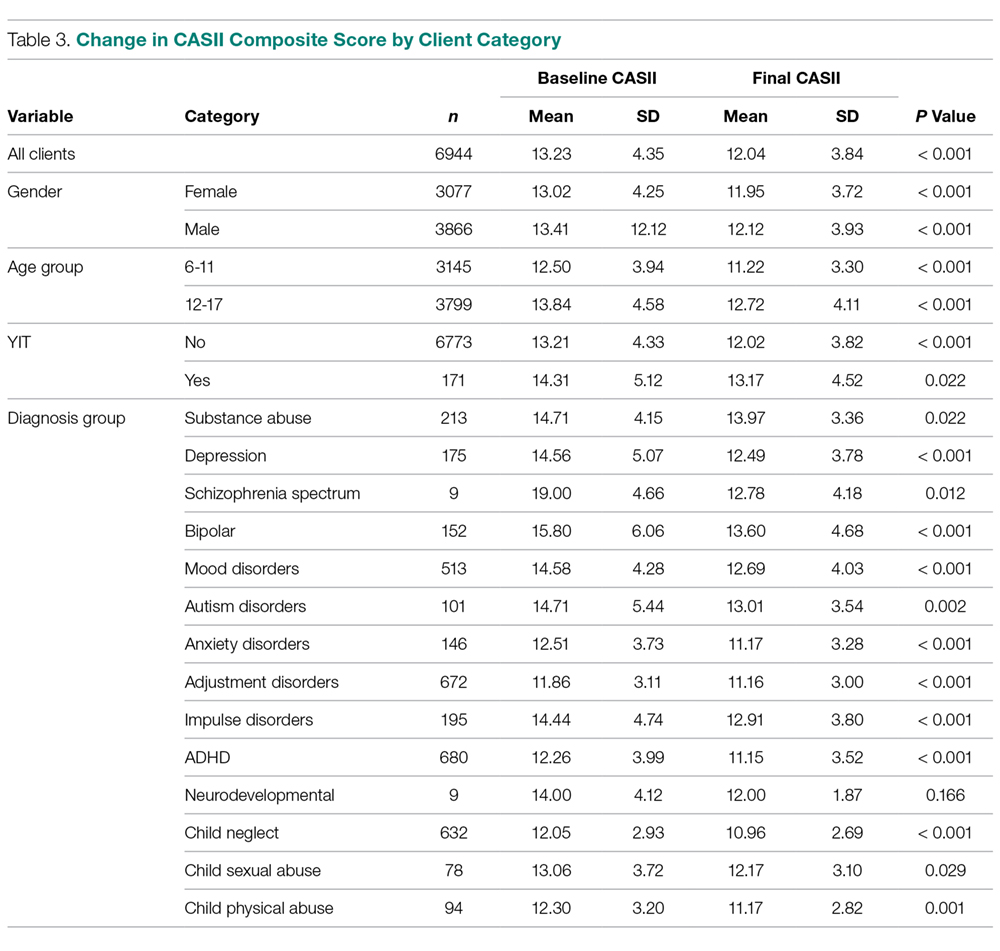
As noted, the CASII assesses the client across 6 dimensions, each of which is scored along a 5-point rating scale, and the composite rating is calculated by adding the scores for each dimension. Table 4 shows the change in mean dimension scores from baseline to discharge for these dimensions. Mean scores improved significantly (all P < 0.001). 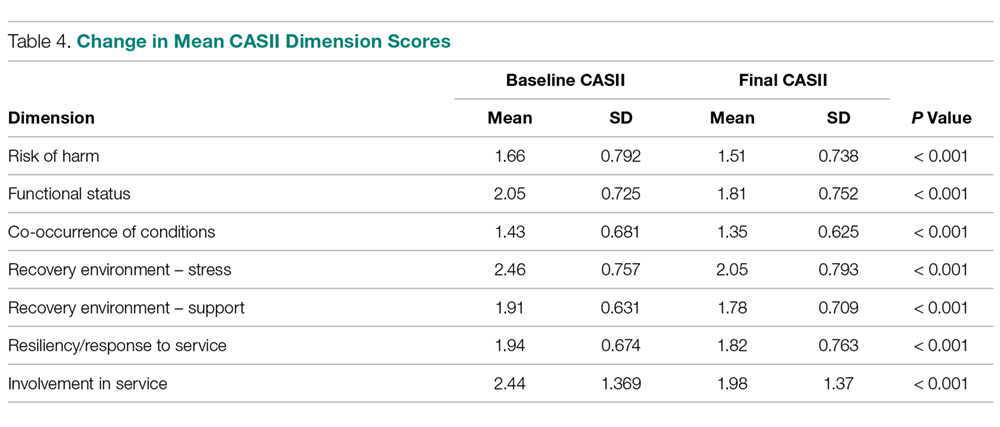
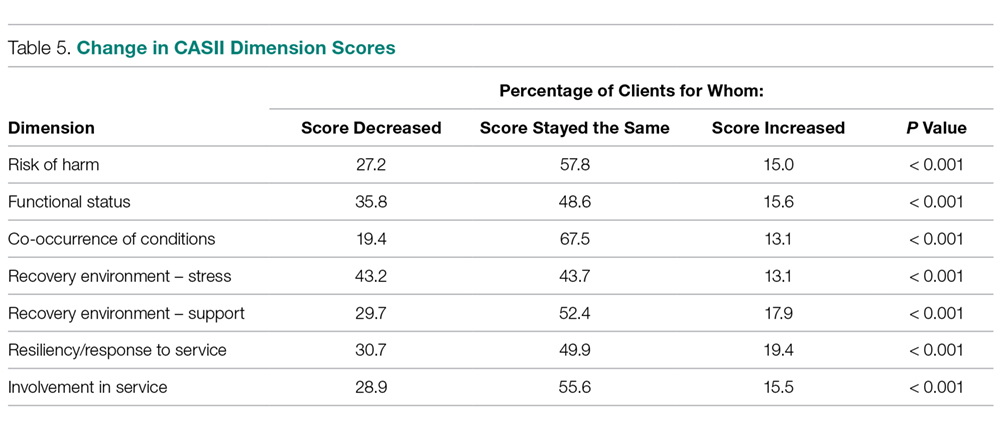
Discussion
Organizations that provide mental health services are burdened with a complicated milieu of providing the best care possible in a complicated system of assessment, reimbursement, admissions/discharges, and a variety of other tasks. Using multiple measures complicates assessment and increases costs because of training staff, developing and interpreting the tool results, data storage and more comprehensive analysis and communication of results back to stakeholders and staff. Complicated measures are often times not understood by the staff and those responsible for care, nor are measures understood by the clients and their families. While a wide array of psychometric assessment tools exist, most are applicable to only specific diagnosis groups or illnesses.
Our study showed that the CASII may be used to monitor progress and reassess the level of service intensity needed, and therefore may be useful as an outcome measure. There are benefits in having a single score as an outcome measure. A single score for each client is quick and easy to understand by board members, staff of the organization as well as clients outside of the organization such as funders, client, press etc. Also the use of a single score is cost effective as costs for interpretation, training and communication within and outside of the organization are reduced.
A number of limitations must be mentioned. Although a change in score represents a change in client condition, this change in condition can have a wide variety of explanations. Change can be related to the therapy received, to changes in the client’s environment, support services, and many other factors. Our research did not allow us to discern what aspects of care may have reduced level of service intensity needed at discharge. In addition, our study involved clients of low and moderate acuity. The study does not address if CASII would be sensitive to change in upper acuity ranges. Therefore, our findings may not be generalizable in these settings.
Tolan and Dodge [10] called for the enhancement or an elevation in the assessment of psychology as a matter of public policy. An approach that involves all levels of scientific inquiry including economics, political science and other sciences is desperately needed. Assessment of the type presented in this article, even if instruments such as the CASII are not used, can help to shape that policy by providing unquestionably accurate assessment of a client’s condition which demonstrates the need for that support. Further research looking at specific attributes of therapy and the client’s condition and environment may be helpful in applying CASII composite ratings and dimension scores as outcome measures.
Corresponding author: Dr. Lorrie Henderson, Jewish Family and Children’s Service, 4747 North 7th St., Suite 100, Phoenix, AZ 850142.
Financial disclosures: None.
1. Thornicroft G, Slade M. New trends in assessing the outcomes of mental health interventions. World Psychiatry 2014;13:118.
2. England MJ, Butler AS, Gonzalez ML, editors. Psychosocial interventions for mental and substance use disorders: a framework for establishing evidence-based standards. Committee on Developing Evidence-Based Standards for Psychosocial Interventions for Mental Disorders; Board on Health Sciences Policy; Institute of Medicine. Washington (DC): National Academies Press; 2015 Sep 18.
3. Schurer Coldiron J, Hensley SW, Bruns EJ, Paragoris R. Putting the outcomes‐based principle into action part one: a guide for wraparound care coordinators; The National Technical Assistance Network for Children’s Behavioral Health. 2016. Available at: https://nwi.pdx.edu/pdf/Putting-the-Outcomes-Based-Principle-Into-Action.pdf.
4. Lachar D, Randle S, Harper R, et al. The brief psychiatric rating scale for children (BPRS-C): Validity and reliability of an anchored version. J Am Acad Child Adol Psychiatry 2001;40:333–40.
5. Sperry L, Brill PL, Howard KI, Grissom GR. Treatment outcomes in psychotherapy and psychiatric interventions. Philadelphia: Brunner/Mazel; 1996.
6. Burlingame GM, Lambert MJ, Reisinger CW, et al. Pragmatics of tracking mental health outcomes in a managed care setting. J Ment Health Adm 1995;22:226–36.
7. Henderson L, McIlhaney K, Wasser T. Measuring outcomes of multiple diagnosis groups in residential treatment using the brief psychiatric rating scale for children (BPRS-C). Children Youth Serv Rev 2008:24:243–59.
8. Fallon T Jr, Pumariega A, Sowers W, et al. A level of care instrument for children’s systems of care: Construction, reliability and validity. J Child Fam Studies 2006:15:143–155.
9. Minnesota Department of Human Services announcement. DHS updates requirement for standardized outcome measures for children’s mental health. #17-53-01. 27 Feb 2017.
10. Tolan P, Dodge K. Children’s mental health as a primary care and concern: a system for comprehensive support and service. Am Psychol 2005;60:601–14.
11. Child and Adolescent Service Intensity Instrument (CASII) Overview for Anthem Connecticut Members. Accessed at www11.anthem.com/provider/ct/f3/s9/t1/pw_e205607.pdf?refer=ahpprovider.
12. Chenven M, Dominguez E, Grimes K, et al. CASII: Child and adolescent Service Intensity Instrument Background information and Initial Data Analysis. American Academy of Child and Adolescent Psychiatry Work Group June 2001.
From the Jewish Family and Children’s Service, Phoenix, AZ (Dr. Henderson) and Consult-Stat, Macungie, PA (Ms. Wasser, Dr. Wasser).
Abstract
- Background: The reliability and validity of the Child and Adolescent Service Intensity Instrument (CASII) as a tool to help determine needed level of care for children with behavioral health needs has previously been established.
- Objective: To determine the utility of the CASII as an outcome measure.
- Methods: A sample consisting of all clients (n = 8465) admitted to service at an outpatient beha
vioral health facility from 2013 through 2016 were studied. CASII was administered at admission and discharge and ratings were compared with paired t-tests within demographic and diagnosis groups. - Results: Mean CASII composite ratings decreased between admission and discharge in the entire cohort as well as within gender, age group, and multiple diagnosis groups tested.
- Conclusion: CASII was useful as an outcome measure in our relatively low to moderate acuity population.
Keywords: outcomes, evidence based practice, child psychology, outpatient research.
The primary goal of mental health services is to provide interventions that result in a reduction of problematic symptomatology [1]; therefore, evaluation of those interventions is important for both the client as well as the stakeholders of the organization providing them. Health care payment reforms require tracking quality measures, and such measures directly influence the development, administration, and monitoring of mental health programs as well as specific treatment modalities [2,3]. Organizations are more likely to benefit when outcomes measures are relayed quantitatively [4]. In addition, clients are becoming more informed regarding the quality of care, and outcomes assessments can inform clients that programs are delivering the most efficacious therapies based on current evidence-based practice standards.
Developing outcomes assessments in behavioral health is challenging [5–7]. There are numerous potential outcome domains that can be assessed as well as different ways of measuring them. Futher, evaluating treatment can be expensive, with components including developing a tool, training staff to administer the tool, ensuring the necessary technical support to store and process the data, interpretation of the data, compiling reports, and communicating results to clients and providers [5]. Being mindful of these components and their associated costs, our organization considered whether a tool we currently use to assess the appropriate intensity of service needed for an individual could also be used as an outcome measure.
Therapeutic methods for children in our organization consist of a “system of care” approach designed by a treatment team that incorporates varied methods depending on the needs of the child. The primary goal is to prevent children with traumatic-based disorders from developing continuing disorders associated with their experiences, such as substance use and chronic health and mental health disorders. Our organization currently uses the CASII (Child and Adolescent Service Intensity Instrument) to assess the appropriate level of intensity of service needed by the child. The CASII incorporates holistic information on the child, within the context of his/her family and social ecology, assessing across 6 dimensions: risk of harm (including trauma issues), functional status, co-occurring conditions, recovery environment, resiliency/response to services, and involvement in services.
In order to comply with the call to consider outcomes measurement and evidence based practice as an integral component of children’s mental health services, this study was performed. It examines the use of the CASII as an outcomes measure based on the rationale that a decreased level of care upon discharge would correlate with a positive outcome by proxy.
Methods
CASII Instrument
The CASII is a decision support tool to help the service provider determine the intensity of services that a child should have to adequately address their behavioral health needs. The CASII has a strong evidence base supporting its reliability and validity [8], and has gained wide usage in a range of health care settings over the past 13 years [9–11].
As mentioned, the CASII assesses the client across 6 key dimensions: risk of harm (including trauma issues), functional status, co-occurring conditions, recovery environment, resiliency/response to services, and involvement in services. Each dimension is scored along a 5-point rating scale, and a total or composite rating is calculated by adding the scores for each dimension. The composite rating corresponds with the level of service intensity needed. There are 7 levels of service intensity, ranging from Level 0 (corresponding with a composite rating of 9 or less) to Level 6 (corresponding with a composite rating of 28 or more) (Table 1).
Study Sample
The sample consisted of all clients (n = 8465) admitted to service from 2013 through 2016 to our facility. Our facility is an outpatient facility offering counseling, mental health assessment and treatment, early childhood trauma assessment, child crisis interventions and rehabilitation for domestic violence, child abuse and neglect, and substance abuse. All clients between the ages of 6 and 17 are assessed with the CASII on admission and then at 6-month intervals until discharge from the program. Being discharged from the program of care prompts the completion of the discharge CASII. If the client had been rated within the 30 days prior to discharge the most recent CASII is used as the discharge measure.
Data Analysis
Data for all admissions from 2013 and 2016 were extracted from the organization’s computer system into an Excel file. The data collected included gender, calendar year of admission to the program, age, and diagnosis group based on the discharge diagnosis given by the mental health team, and whether the client was a participant in the Youth in Transition (YIT) program (program for older clients that includes life skills training in addition to standard therapy). The CASII composite rating at baseline and discharge as well as ratings for each of the 6 dimensions assessed with the CASII were also collected.
We used SPSS (v25.01) software for statistical analysis. Analysis included paired (pre-post) t-tests that were applied to the entire cohort as well as within gender, age group, participation in the YIT program, and diagnosis groups. Diagnosis groups were included only if the frequency of cases within the group was large enough to meet the sample size requirements of central limit theorem (in general, n > 25), with 2 exceptions: schizophrenia spectrum was included because of the rarity of the diagnosis (n = 11) and neurodevelopmental disorders (also n = 11) was included because there was no violation of the equal variance assumption as well as interest to the investigators. In addition to the paired analysis, we used group t tests to determine if there were severity differences between groups at baseline. Lastly, we assessed change from admission to discharge for each of the 6 dimensions that make up the composite rating.
We designated the 7 levels of care defined by the CASII as continuous in nature, and therefore computations of means and standard deviations (SD) are appropriate for assessment. The interpretation of the CASII composite rating and the level of care as a continuous variable has also been reported in the literature [11,12].
The research and analysis was viewed as exploratory in nature and a P value less than 0.05 was considered statistically significant. There was no correction for multiple comparisons applied to the data in order to not mask any observed differences in the data. All analyses were 2-tailed. If any individual had a missing value for either an admission or discharge CASII assessment they were excluded from the statistical analysis.
Results
There were 8465 clients admitted from 2013 and 2016. The sample was predominantly male (54.5%), and the majority fell into the older 12–17 year old cohort (54.0%). Admissions were evenly distributed across the 4 years that we studied, with the lowest percentage in 2013 at 23.4% and the highest in 2014 at 26.0%. Discharge diagnosis was available for the majority of the cohort. The top 5 most frequent diagnosis groups were adjustment disorders (n = 807, 18.3%), ADHD (n = 798, 18.1%), child neglect (n = 775, 17.6%), mood disorders (n = 602, 13.6%), and impulse disorders (n = 262, 5.9%). There were 232 (2.7%) clients that participated in the YIT program. Table 2
At admission, several groups had higher mean composite ratings. Males had higher ratings (in need of higher level of service intensity) than females (P < 0.001), 12–17 year olds had a significantly higher acuity level than 6–11 year olds (P < 0.001), and clients in the YIT program had a higher acuity level than those not in the YIT program (P = 0.001). Baseline acuity levels for primary discharge diagnosis for selected groups are shown in the Figure.
When analyzing the entire cohort for which data were available (n = 6944), the mean CASII composite rating dropped from 13.23 (± 4.35 SD) to 12.04 (± 3.84 SD), P < 0.001. Excluding youth that participated in YIT, the mean CASII score dropped from 13.21 (± 4.33) at admission to 13.17 (± 4.52) at discharge. Mean composite rating for clients participating in the YIT program dropped from 14.31 (± 5.12) at admission to 13.17 (± 4.52) at discharge (P = 0.022). For diagnosis groups, statistically significant reduction in mean CASII composite rating was observed for all groups except neurodevelopmentall disorders (P = 0.166). The results for all groups and diagnosis cohorts can be found in Table 3.
As noted, the CASII assesses the client across 6 dimensions, each of which is scored along a 5-point rating scale, and the composite rating is calculated by adding the scores for each dimension. Table 4 shows the change in mean dimension scores from baseline to discharge for these dimensions. Mean scores improved significantly (all P < 0.001).
Discussion
Organizations that provide mental health services are burdened with a complicated milieu of providing the best care possible in a complicated system of assessment, reimbursement, admissions/discharges, and a variety of other tasks. Using multiple measures complicates assessment and increases costs because of training staff, developing and interpreting the tool results, data storage and more comprehensive analysis and communication of results back to stakeholders and staff. Complicated measures are often times not understood by the staff and those responsible for care, nor are measures understood by the clients and their families. While a wide array of psychometric assessment tools exist, most are applicable to only specific diagnosis groups or illnesses.
Our study showed that the CASII may be used to monitor progress and reassess the level of service intensity needed, and therefore may be useful as an outcome measure. There are benefits in having a single score as an outcome measure. A single score for each client is quick and easy to understand by board members, staff of the organization as well as clients outside of the organization such as funders, client, press etc. Also the use of a single score is cost effective as costs for interpretation, training and communication within and outside of the organization are reduced.
A number of limitations must be mentioned. Although a change in score represents a change in client condition, this change in condition can have a wide variety of explanations. Change can be related to the therapy received, to changes in the client’s environment, support services, and many other factors. Our research did not allow us to discern what aspects of care may have reduced level of service intensity needed at discharge. In addition, our study involved clients of low and moderate acuity. The study does not address if CASII would be sensitive to change in upper acuity ranges. Therefore, our findings may not be generalizable in these settings.
Tolan and Dodge [10] called for the enhancement or an elevation in the assessment of psychology as a matter of public policy. An approach that involves all levels of scientific inquiry including economics, political science and other sciences is desperately needed. Assessment of the type presented in this article, even if instruments such as the CASII are not used, can help to shape that policy by providing unquestionably accurate assessment of a client’s condition which demonstrates the need for that support. Further research looking at specific attributes of therapy and the client’s condition and environment may be helpful in applying CASII composite ratings and dimension scores as outcome measures.
Corresponding author: Dr. Lorrie Henderson, Jewish Family and Children’s Service, 4747 North 7th St., Suite 100, Phoenix, AZ 850142.
Financial disclosures: None.
1. Thornicroft G, Slade M. New trends in assessing the outcomes of mental health interventions. World Psychiatry 2014;13:118.
2. England MJ, Butler AS, Gonzalez ML, editors. Psychosocial interventions for mental and substance use disorders: a framework for establishing evidence-based standards. Committee on Developing Evidence-Based Standards for Psychosocial Interventions for Mental Disorders; Board on Health Sciences Policy; Institute of Medicine. Washington (DC): National Academies Press; 2015 Sep 18.
3. Schurer Coldiron J, Hensley SW, Bruns EJ, Paragoris R. Putting the outcomes‐based principle into action part one: a guide for wraparound care coordinators; The National Technical Assistance Network for Children’s Behavioral Health. 2016. Available at: https://nwi.pdx.edu/pdf/Putting-the-Outcomes-Based-Principle-Into-Action.pdf.
4. Lachar D, Randle S, Harper R, et al. The brief psychiatric rating scale for children (BPRS-C): Validity and reliability of an anchored version. J Am Acad Child Adol Psychiatry 2001;40:333–40.
5. Sperry L, Brill PL, Howard KI, Grissom GR. Treatment outcomes in psychotherapy and psychiatric interventions. Philadelphia: Brunner/Mazel; 1996.
6. Burlingame GM, Lambert MJ, Reisinger CW, et al. Pragmatics of tracking mental health outcomes in a managed care setting. J Ment Health Adm 1995;22:226–36.
7. Henderson L, McIlhaney K, Wasser T. Measuring outcomes of multiple diagnosis groups in residential treatment using the brief psychiatric rating scale for children (BPRS-C). Children Youth Serv Rev 2008:24:243–59.
8. Fallon T Jr, Pumariega A, Sowers W, et al. A level of care instrument for children’s systems of care: Construction, reliability and validity. J Child Fam Studies 2006:15:143–155.
9. Minnesota Department of Human Services announcement. DHS updates requirement for standardized outcome measures for children’s mental health. #17-53-01. 27 Feb 2017.
10. Tolan P, Dodge K. Children’s mental health as a primary care and concern: a system for comprehensive support and service. Am Psychol 2005;60:601–14.
11. Child and Adolescent Service Intensity Instrument (CASII) Overview for Anthem Connecticut Members. Accessed at www11.anthem.com/provider/ct/f3/s9/t1/pw_e205607.pdf?refer=ahpprovider.
12. Chenven M, Dominguez E, Grimes K, et al. CASII: Child and adolescent Service Intensity Instrument Background information and Initial Data Analysis. American Academy of Child and Adolescent Psychiatry Work Group June 2001.
Gone Fishing: A Unique Histologic Pattern in Cutaneous Angiosarcoma
Cutaneous angiosarcoma is a rare malignant tumor of vascular endothelial cells that has the propensity to arise in various clinical settings. This tumor predominantly occurs in the head and neck region in elderly patients, but it also has been reported to develop postradiotherapy or in the setting of chronic lymphedema in the extremities.1-3 In all settings, the diagnosis carries a very poor prognosis with a high likelihood of local recurrence and rapid dissemination. The mortality rate typically is 80% or higher.2,4-6
Making the correct clinical diagnosis of cutaneous angiosarcoma may be difficult given the variety of patient symptoms and clinical appearances that can be demonstrated on presentation. Lesions can appear as bluish or violaceous plaques, macules, or nodules, and ulceration may be present in some advanced cases.5,7 Clinical misdiagnosis is common, as cutaneous angiosarcomas may be mistaken for infectious processes, benign vascular malformations, and other cutaneous malignancies.1 Biopsy often is delayed given the initial benign appearance of the lesions, and this frequently results in aggressive and extensive disease at the time of diagnosis, which is unfortunate given that small tumor size has been shown to be one of the only favorable prognostic indicators in cutaneous angiosarcoma.1,2,6,8
Microscopically, diagnosis of cutaneous angiosarcoma can present a challenge, as the histology varies between a well-differentiated vascular neoplasm and a considerably anaplastic and poorly differentiated malignancy. On low power, some areas may appear as benign hemangiomas with other areas showing frank sarcomatous features.9 As a result, these tumors can be mistaken for a variety of other diseases including melanomas, carcinomas, or other vascular tumors.6,8,9 Previously, electron microscopy has been utilized on undifferentiated tumors to help distinguish cutaneous angiosarcomas from other potential diagnoses. The atypical tumor cells of cutaneous angiosarcoma display common features of endothelial cells (eg, pinocytotic vesicles, tubulated bodies).7 Historically, it has been noted that the histologic findings and tumor grade provide little evidence regarding the aggressiveness of the tumor, and all cutaneous angiosarcoma diagnoses receive a poor prognosis.6,8
Classically, the histologic findings of cutaneous angiosarcoma include a highly infiltrative neoplasm forming irregular vascular channels that penetrate through the cutaneous soft tissues and frequently extend into the subcutaneous fat. The vascular spaces are lined by hyperchromatic endothelial cells with varying degrees of atypia.1,2,4,6,7,10 Occasionally, prominent endothelial cells lining a papillary structure within the lumen of the neoformed vessel may also be observed. Currently, immunohistochemical staining for MYC, Ki-67, D2-40, and various other markers complement the histologic findings to aid in the diagnosis of cutaneous angiosarcoma.11,12 An additional diagnostic clue that has been described in cases of postirradiation cutaneous angiosarcoma shows free-floating or tufted pleomorphic spindle cells within the vascular lumen (Figure). This finding has been described as “fish in the creek.”11 In this study, we aimed to determine the frequency and subsequent diagnostic utility of the fish-in-the-creek finding in cases of cutaneous angiosarcoma.

Methods
A natural language search of our institutional archives over a 20-year period (1997–2017) using the term angiosarcoma was performed. Fifteen cases of cutaneous angiosarcoma were identified. Fifteen additional benign and malignant vascular tumors with cutaneous angiosarco
Results
The histologic pattern of fish in the creek was identified in all 15 cases of cutaneous angiosarcoma and was absent in the other 15 malignancies examined in this study. This finding shows the potential for the fish-in-the-creek pattern to be used as an additional diagnostic tool for dermatopathologists.
Comment
Cutaneous angiosarcoma is a rare but aggressive malignancy that proves difficult to diagnose both clinically and histologically as well as to treat effectively.1,5-8 Our results indicate that fish in the creek may be a useful and salient histologic feature in cutaneous angiosarcoma. It is important to recognize, however, that this finding should not be the sole feature upon which a diagnosis of cutaneous angiosarcoma is made, as it requires corroboration with positivity of MYC and D2-40 as well as a high Ki-67 proliferation index (>20%).11,12 Finding a fish-in-the-creek pattern should prompt dermatopathologists to consider a diagnosis of cutaneous angiosarcoma in the appropriate clinical and histologic settings.
The chief limitation of this study was the small sample size, with only 15 cases of cutaneous angiosarcoma available in the last 20 years at our institution. The limited sample size did not allow us to make claims on sensitivity and specificity regarding this histologic feature; however, with a larger sample size, the true diagnostic potential could be elucidated. Although the pathologists were blinded to the original diagnoses as they examined it for fish in the creek, it is possible they were able to make the correct diagnosis based on other histopathologic clues and therefore were biased.
Although the fish-in-the-creek pattern is present in cutaneous angiosarcoma, there may be other mimickers to consider. Intraluminal papillary projections lined by endothelial cells may be sectioned in a manner imitating this finding.3 In such a case, these endothelial cells must be differentiated from the free-floating or tufted spindle cells in order to have a positive finding for fish in the creek. There can be confusion if the biopsy cuts through a section of spindled cells, resulting in difficulty differentiating cutaneous angiosarcoma from other spindle tumors such as spindle cell melanoma or spindle cell squamous cell carcinoma.6 In such cases, immunohistochemistry may be helpful, as spindle cell melanoma would stain positive for S100 and SOX10 and spindle cell squamous cell carcinoma would stain positive for p63 and cytokeratin.
Various treatment strategies for cutaneous angiosarcoma have been employed, with the majority still resulting in poor outcomes.2,4-6 The recommended treatment is radical surgical excision of the primary tumor with lymph node clearance if possible. Following excision, the patient should undergo high-dose, wide-field radiotherapy to the region.5,8 Cutaneous angiosarcomas also have the ability to spread extensively through the dermis and can result in subclinical or clinically obvious widespread disease with multifocal or satellite lesions present. Distant metastases occur most frequently in the cervical lymph nodes and lungs.7 In cases where the disease is too extensive for surgery, palliative radiation monotherapy can be used.5,6
As atypical vascular lesions are considered to be a precursor to cutaneous angiosarcoma, it is important to note that the fish-in-the-creek feature was absent in all 6 of the atypical vascular lesions observed in the study. The differentiation generally is made based on MYC, which is present in cutaneous angiosarcomas and absent in atypical vascular lesions.10 The feature of fish in the creek may now be an additional clue for dermatopathologists to differentiate between angiosarcomas and other similar-appearing tumors.
Conclusion
Our study aimed to highlight an important histologic feature of cutaneous angiosarcomas that can aid in the diagnosis of this deceptive malignancy. Our findings warrant further study of the fish-in-the-creek histologic pattern in a larger sample size to determine its success as a diagnostic tool for cutaneous angiosarcomas. As noted previously, tumor grade does not impact survival outcome, but small tumor size has been one of the only features found to result in a more favorable prognosis.1,6,8 Future studies to identify a correlation between the histologic finding of fish in the creek and disease outcome in cutaneous angiosarcoma may be helpful to determine if these histologic findings provide prognostic significance in cases of cutaneous angiosarcoma.
- Aust MR, Olsen KD, Lewis JE, et al. Angiosarcomas of the head and neck: clinical and pathologic characteristics. Ann Otol Rhinol Laryngol. 1997;106:943-951.
- Holden CA, Spittle MF, Jones EW. Angiosarcoma of the face and scalp, prognosis and treatment. Cancer. 1987;59:1046-1057.
- Woodward AH, Ivins JC, Soule EH. Lymphangiosarcoma arising in chronic lymphedematous extremities. Cancer. 1972;30:562-572.
- Calonje E, Brenn T, McKee PH, et al. McKee’s Pathology of the Skin. 4th ed. Edinburgh, Scotland: Elsevier Saunders; 2012.
- Morrison WH, Byers RM, Garden AS, et al. Cutaneous angiosarcoma of the head and neck. a therapeutic dilemma. Cancer. 1995;76:319-327.
- Hodgkinson DJ, Soule EH, Woods JE. Cutaneous angiosarcoma of the head and neck. Cancer. 1979;44:1106-1113.
- Rosai J, Sumner HW, Kostianovsky M, et al. Angiosarcoma of the skin: a clinicopathologic and fine structural study. Hum Pathol. 1976;7:83-109.
- Pawlik TM, Paulino AF, Mcginn CJ, et al. Cutaneous angiosarcoma of the scalp: a multidisciplinary approach. Cancer. 2003;98:1716-1726.
- Haustein UF. Angiosarcoma of the face and scalp. Int J Dermatol. 1991;30:851-856.
- Elston DM, Ferringer T, Ko C, et al. Dermatopathology. 2nd ed. Edinburgh, Scotland: Saunders Elsevier; 2014.
- Requena L, Kutzner H. Cutaneous Soft Tissue Tumors. Philadelphia, PA: Wolters Kluwer; 2015.
- Cuda J, Mirzamani N, Kantipudi R, et al. Diagnostic utility of Fli-1 and D2-40 in distinguishing atypical fibroxanthoma from angiosarcoma. Am J Dermatopathol. 2013;35:316-318.
Cutaneous angiosarcoma is a rare malignant tumor of vascular endothelial cells that has the propensity to arise in various clinical settings. This tumor predominantly occurs in the head and neck region in elderly patients, but it also has been reported to develop postradiotherapy or in the setting of chronic lymphedema in the extremities.1-3 In all settings, the diagnosis carries a very poor prognosis with a high likelihood of local recurrence and rapid dissemination. The mortality rate typically is 80% or higher.2,4-6
Making the correct clinical diagnosis of cutaneous angiosarcoma may be difficult given the variety of patient symptoms and clinical appearances that can be demonstrated on presentation. Lesions can appear as bluish or violaceous plaques, macules, or nodules, and ulceration may be present in some advanced cases.5,7 Clinical misdiagnosis is common, as cutaneous angiosarcomas may be mistaken for infectious processes, benign vascular malformations, and other cutaneous malignancies.1 Biopsy often is delayed given the initial benign appearance of the lesions, and this frequently results in aggressive and extensive disease at the time of diagnosis, which is unfortunate given that small tumor size has been shown to be one of the only favorable prognostic indicators in cutaneous angiosarcoma.1,2,6,8
Microscopically, diagnosis of cutaneous angiosarcoma can present a challenge, as the histology varies between a well-differentiated vascular neoplasm and a considerably anaplastic and poorly differentiated malignancy. On low power, some areas may appear as benign hemangiomas with other areas showing frank sarcomatous features.9 As a result, these tumors can be mistaken for a variety of other diseases including melanomas, carcinomas, or other vascular tumors.6,8,9 Previously, electron microscopy has been utilized on undifferentiated tumors to help distinguish cutaneous angiosarcomas from other potential diagnoses. The atypical tumor cells of cutaneous angiosarcoma display common features of endothelial cells (eg, pinocytotic vesicles, tubulated bodies).7 Historically, it has been noted that the histologic findings and tumor grade provide little evidence regarding the aggressiveness of the tumor, and all cutaneous angiosarcoma diagnoses receive a poor prognosis.6,8
Classically, the histologic findings of cutaneous angiosarcoma include a highly infiltrative neoplasm forming irregular vascular channels that penetrate through the cutaneous soft tissues and frequently extend into the subcutaneous fat. The vascular spaces are lined by hyperchromatic endothelial cells with varying degrees of atypia.1,2,4,6,7,10 Occasionally, prominent endothelial cells lining a papillary structure within the lumen of the neoformed vessel may also be observed. Currently, immunohistochemical staining for MYC, Ki-67, D2-40, and various other markers complement the histologic findings to aid in the diagnosis of cutaneous angiosarcoma.11,12 An additional diagnostic clue that has been described in cases of postirradiation cutaneous angiosarcoma shows free-floating or tufted pleomorphic spindle cells within the vascular lumen (Figure). This finding has been described as “fish in the creek.”11 In this study, we aimed to determine the frequency and subsequent diagnostic utility of the fish-in-the-creek finding in cases of cutaneous angiosarcoma.
Methods
A natural language search of our institutional archives over a 20-year period (1997–2017) using the term angiosarcoma was performed. Fifteen cases of cutaneous angiosarcoma were identified. Fifteen additional benign and malignant vascular tumors with cutaneous angiosarco
Results
The histologic pattern of fish in the creek was identified in all 15 cases of cutaneous angiosarcoma and was absent in the other 15 malignancies examined in this study. This finding shows the potential for the fish-in-the-creek pattern to be used as an additional diagnostic tool for dermatopathologists.
Comment
Cutaneous angiosarcoma is a rare but aggressive malignancy that proves difficult to diagnose both clinically and histologically as well as to treat effectively.1,5-8 Our results indicate that fish in the creek may be a useful and salient histologic feature in cutaneous angiosarcoma. It is important to recognize, however, that this finding should not be the sole feature upon which a diagnosis of cutaneous angiosarcoma is made, as it requires corroboration with positivity of MYC and D2-40 as well as a high Ki-67 proliferation index (>20%).11,12 Finding a fish-in-the-creek pattern should prompt dermatopathologists to consider a diagnosis of cutaneous angiosarcoma in the appropriate clinical and histologic settings.
The chief limitation of this study was the small sample size, with only 15 cases of cutaneous angiosarcoma available in the last 20 years at our institution. The limited sample size did not allow us to make claims on sensitivity and specificity regarding this histologic feature; however, with a larger sample size, the true diagnostic potential could be elucidated. Although the pathologists were blinded to the original diagnoses as they examined it for fish in the creek, it is possible they were able to make the correct diagnosis based on other histopathologic clues and therefore were biased.
Although the fish-in-the-creek pattern is present in cutaneous angiosarcoma, there may be other mimickers to consider. Intraluminal papillary projections lined by endothelial cells may be sectioned in a manner imitating this finding.3 In such a case, these endothelial cells must be differentiated from the free-floating or tufted spindle cells in order to have a positive finding for fish in the creek. There can be confusion if the biopsy cuts through a section of spindled cells, resulting in difficulty differentiating cutaneous angiosarcoma from other spindle tumors such as spindle cell melanoma or spindle cell squamous cell carcinoma.6 In such cases, immunohistochemistry may be helpful, as spindle cell melanoma would stain positive for S100 and SOX10 and spindle cell squamous cell carcinoma would stain positive for p63 and cytokeratin.
Various treatment strategies for cutaneous angiosarcoma have been employed, with the majority still resulting in poor outcomes.2,4-6 The recommended treatment is radical surgical excision of the primary tumor with lymph node clearance if possible. Following excision, the patient should undergo high-dose, wide-field radiotherapy to the region.5,8 Cutaneous angiosarcomas also have the ability to spread extensively through the dermis and can result in subclinical or clinically obvious widespread disease with multifocal or satellite lesions present. Distant metastases occur most frequently in the cervical lymph nodes and lungs.7 In cases where the disease is too extensive for surgery, palliative radiation monotherapy can be used.5,6
As atypical vascular lesions are considered to be a precursor to cutaneous angiosarcoma, it is important to note that the fish-in-the-creek feature was absent in all 6 of the atypical vascular lesions observed in the study. The differentiation generally is made based on MYC, which is present in cutaneous angiosarcomas and absent in atypical vascular lesions.10 The feature of fish in the creek may now be an additional clue for dermatopathologists to differentiate between angiosarcomas and other similar-appearing tumors.
Conclusion
Our study aimed to highlight an important histologic feature of cutaneous angiosarcomas that can aid in the diagnosis of this deceptive malignancy. Our findings warrant further study of the fish-in-the-creek histologic pattern in a larger sample size to determine its success as a diagnostic tool for cutaneous angiosarcomas. As noted previously, tumor grade does not impact survival outcome, but small tumor size has been one of the only features found to result in a more favorable prognosis.1,6,8 Future studies to identify a correlation between the histologic finding of fish in the creek and disease outcome in cutaneous angiosarcoma may be helpful to determine if these histologic findings provide prognostic significance in cases of cutaneous angiosarcoma.
- Aust MR, Olsen KD, Lewis JE, et al. Angiosarcomas of the head and neck: clinical and pathologic characteristics. Ann Otol Rhinol Laryngol. 1997;106:943-951.
- Holden CA, Spittle MF, Jones EW. Angiosarcoma of the face and scalp, prognosis and treatment. Cancer. 1987;59:1046-1057.
- Woodward AH, Ivins JC, Soule EH. Lymphangiosarcoma arising in chronic lymphedematous extremities. Cancer. 1972;30:562-572.
- Calonje E, Brenn T, McKee PH, et al. McKee’s Pathology of the Skin. 4th ed. Edinburgh, Scotland: Elsevier Saunders; 2012.
- Morrison WH, Byers RM, Garden AS, et al. Cutaneous angiosarcoma of the head and neck. a therapeutic dilemma. Cancer. 1995;76:319-327.
- Hodgkinson DJ, Soule EH, Woods JE. Cutaneous angiosarcoma of the head and neck. Cancer. 1979;44:1106-1113.
- Rosai J, Sumner HW, Kostianovsky M, et al. Angiosarcoma of the skin: a clinicopathologic and fine structural study. Hum Pathol. 1976;7:83-109.
- Pawlik TM, Paulino AF, Mcginn CJ, et al. Cutaneous angiosarcoma of the scalp: a multidisciplinary approach. Cancer. 2003;98:1716-1726.
- Haustein UF. Angiosarcoma of the face and scalp. Int J Dermatol. 1991;30:851-856.
- Elston DM, Ferringer T, Ko C, et al. Dermatopathology. 2nd ed. Edinburgh, Scotland: Saunders Elsevier; 2014.
- Requena L, Kutzner H. Cutaneous Soft Tissue Tumors. Philadelphia, PA: Wolters Kluwer; 2015.
- Cuda J, Mirzamani N, Kantipudi R, et al. Diagnostic utility of Fli-1 and D2-40 in distinguishing atypical fibroxanthoma from angiosarcoma. Am J Dermatopathol. 2013;35:316-318.
Practice Points
- The histologic finding of “fish in the creek” is characterized by free-floating or tufted pleomorphic spindle cells within the vascular lumen.
- Fish in the creek has only been demonstrated in cutaneous angiosarcoma when compared to histologic findings of other similar vascular malignancies.
- The fish-in-the-creek finding may be an additional diagnostic tool in cases of cutaneous angiosarcoma.

Getting the hypertension Dx right: Patient positioning matters
ABSTRACT
Purpose This study evaluated the effect of patient positioning on the diagnosis of hypertension in a clinic setting and the importance of following guidelines for measuring blood pressure (BP).
Methods In the trial part of this study, we recorded BP measurements by an aneroid sphygmomanometer with patients seated first on an examination table, a commonly observed practice, and second in the standard seated position as defined by the American Heart Association. Two measurements were obtained in each position for 204 patients, and we determined the difference between the average readings in the 2 positions. Factored into the comparison was an estimation of inherent variance of the device and observer achieved by repeated measurements on a healthy individual.
Results This investigation included an initial observational study of 25 regional primary care offices, the results of which showed frequent lack of adherence with accepted guidelines in patient positioning during BP measurement. The overall systolic and diastolic BPs were more than 2 mm Hg lower in the standard seated position compared with the examination table position (P<.001). Noncompliance with the position guideline resulted in misclassification of 15 patients (7.4%) as prehypertensive, when, in fact, they were normotensive. Misclassification of hypertension occurred in 12 patients (5.9%), when, in fact, they were normotensive. Logistic regression using relevant clinical factors did not identify those individuals who were misclassified.
Conclusion This study underscores the importance of patient positioning on BP determinations in order to accurately diagnose hypertension.
The high prevalence of hypertension and its burden of disease in the United States and worldwide are well known.1 Hypertension is a major risk factor for coronary heart disease, congestive heart failure, ischemic and hemorrhagic stroke, chronic kidney disease, and peripheral arterial disease.2 Among all risk factors, hypertension ranked first worldwide in disability-adjusted life-years.3 However, misclassification of an individual’s blood pressure (BP) as prehypertension or hypertension also confers significant health and financial burdens due to unnecessary medical encounters, testing, and treatment, and to increased cost of insurance coverage and out-of-pocket expenses. A correct assessment of BP in the outpatient setting depends on accurate measurement technique.
The diagnosis of hypertension is based on indirect measurement of BP using in-office, ambulatory, or home monitoring. Although office BP measurement is less than ideal, it is used most often to diagnose and monitor hypertension. Furthermore, most published trials of treatment recommendations are based on office BP measurements.4
Automated oscillometric and aneroid sphygmomanometers are common BP measurement devices. Proper technique is particularly important with the aneroid sphygmomanometer to obtain consistent and accurate results.5 Good training and an ability to hear the Korotkoff sounds are crucial.
Expert consensus groups such as the American Heart Association (AHA) publish recommendations for proper technique in reliably measuring BP,6-8 and they emphasize the importance of patient positioning during BP measurement. The individual should be seated comfortably in a chair with both arms and back supported, legs uncrossed, and feet flat on the floor. We’ll refer to this as the “standard position.” Although the proper technique for measuring BP has been widely advocated, a recent literature review for the US Preventive Services Task Force concluded that surprisingly few studies are available on the diagnostic accuracy of office BP practices.9
One paper evaluated the effect of leg crossing on accuracy of BP measurement. No subjects were reclassified as hypertensive, but the study lacked statistical rigor.10 Another study found variable BP readings regardless of body position.11
The purpose of our study was to compare BP measurement in 2 positions: the standard position described above, and the examination table position in which the patient is seated on the edge of the table with back, arms, and feet unsupported.
METHODS
We conducted our literature search across several scientific and medical literature databases, including PubMed, ScienceDirect, and CINAHL. Only English-language articles were reviewed.
We followed the BP measurement guidelines of the AHA. Prior to beginning the study, we provided instructions in proper BP measurement technique to the nurses who would obtain the data. The minimum sample size of patients needed to identify a difference of at least 2 mm Hg was 26, as estimated by power analysis. This was calculated using an alpha of .05 and a beta of .13.
The study population consisted of patients presenting consecutively to a teaching family medicine center. Adult patients, ages 18 and older, were informed about the study and invited to participate. Those who agreed were asked to read and sign an informed consent approved by a regional institutional review board for human subjects. We excluded patients who declined participation for any reason, who were in severe pain or distress that may have prevented them from completing the protocol, or who had limited mobility that could interfere with climbing onto the examination table. Patients considered for the study totaled 250, 28 of whom were ineligible. Another 18 patients declined participation, leaving 204 who completed the protocol.
Before testing began, we estimated the standard deviation of each aneroid sphygmomanometer and the assigned observer by repeatedly measuring the BP of a healthy normotensive individual sitting in the standard position. We obtained 46 measurements over 2 days to avoid subject and operator fatigue. Standard deviation for systolic BP was 3.6 mm Hg; for diastolic it was 3.8 mm Hg.
During testing, nurses recorded BP for each patient twice in the examination table position and twice in the standard position. They entered data into an Excel workbook for subsequent analysis. All examination rooms were equipped with newly purchased aneroid sphygmomanometers, and the appropriate cuff size was selected for each patient. Patients were instructed to remain quiet during the measurements. Patients sat first on the edge of the examination table. After a 5-minute rest, BP was measured twice in the same arm. Measurements were separated by 1 to 2 minutes. Patients then sat in the chair and rested another 2 minutes before BP was again measured twice in the same arm. The arms and back were supported in the chair and the stethoscope placed at heart level.
As per protocol, we obtained 4 BP readings on each patient and calculated the difference between the average systolic and diastolic BP values from the 2 positions. The standard error of the mean of this difference was determined using the equation, where Sd is the standard deviation of the aneroid sphygmomanometer and observer.12 A one-sided, 95% confidence upper bound for the standard error of the difference is 1.65 × SEd. We compared patient-specific differences against this upper bound to identify significant systolic and diastolic BP changes due to positioning. If the patient’s BP difference exceeded the upper bound, it was attributed to the positional change and not to variation inherent to the sphygmomanometer and observer.
As an example, consider a patient whose average systolic BP readings from the examination-table and standard positions, respectively, were 128 mm Hg and 120 mm Hg. Assuming an SEd of 3.55 and an upper bound of 5.86, the observed 8 mm Hg difference in average systolic BPs would be considered significant. The amount of random variation from the sphygmomanometer and observer would not be expected to exceed 5.86 mm Hg.
In accordance with accepted standards, prehypertension was defined as a BP between 120-139/80-89 mm Hg, and hypertension was defined as a BP ≥140/90 mm Hg.4 BP below 120/80 mm Hg was considered normal. We calculated each patient’s average systolic and diastolic BP values in the 2 positions and thereby classified the individual as normotensive, prehypertensive, or hypertensive. We regarded as misclassified any patient whose BP showed significant lowering between the examination-table and standard positions resulting in a change of classification from prehypertensive or hypertensive to normotensive. For example, a patient with an examination-table position average reading of 126/85 mm Hg and a standard position average reading of 118/78 mm Hg would have been misclassified as prehypertensive.
We reviewed charts and gathered data, including subject age, sex, obesity (defined as a body mass index of ≥30 kg/m2), and history of diabetes, hypertension, or smoking. Other than age, all data were binary. We performed logistic regression analysis using the Excel Add-in Real Statistics Resource Pack software (Release 4.3)13 to determine if these factors could predict significant lowering of BP due to positional change.
Our associated observational study. We also conducted a separate observational study of 25 regional primary care offices to evaluate compliance with the AHA guidelines for measuring BP. The office nurses taking measurements were not informed of the study’s purpose to prevent deviation from their common practice.
Data on 9 guideline criteria were collected to assess supervision of patients before and during measurements, including having the patient sit in a chair in quiet and comfortable surroundings with arms and back supported and feet on the ground. We also noted the type of BP measuring device used. Additionally, observers assessed the technique of the individuals using a manual device, including cuff placement and deflation rate. The observations were conducted during a clinic visit by a medical student knowledgeable in the AHA guidelines for measuring BP by automated oscillometric or aneroid sphygmomanometric devices. We conducted the study over a 2-week period in the second quarter of 2016.
RESULTS
Power analysis performed prior to the study showed that a minimum of 26 patients would be needed to predict a 2 mm Hg difference between BPs obtained in the 2 positions. Of the 204 patients used in the logistic regression analysis, 78 were men and 126 were women. Ages ranged from 18 to 101 years, yielding a mean of 54. One-hundred sixteen had previously received a diagnosis of hypertension, 39 had diabetes, 92 were obese, 22 were current smokers, and 68 were former smokers.
TABLE 1 shows the means and ranges of systolic and diastolic BP for both study positions. With this study population, mean BP recorded in the examination-table position decreased in the standard position by 2.1 and 2.2 mm Hg for systolic and diastolic BP, respectively (P<.001).
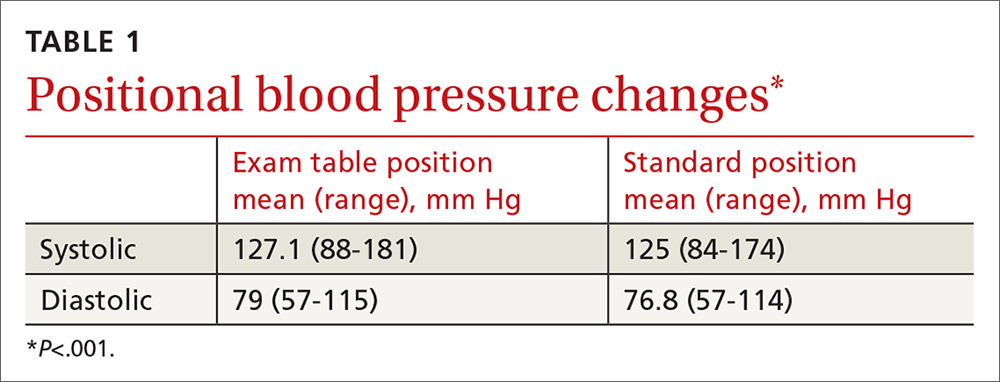
Significant BP lowering—as defined by a one-sided 95% confidence upper bound for the standard error of differences between study positions—was determined to be 5.86 and 6.22 mm Hg for systolic and diastolic pressures, respectively. Significant lowering of BP and misclassification due to positioning are summarized in TABLE 2. Significant lowering of mean systolic or diastolic BP with positional change from table to chair occurred in 62 subjects (30.4%). Misclassification of prehypertension occurred in 7.4% of subjects, and misclassification of hypertension occurred in 5.9%.
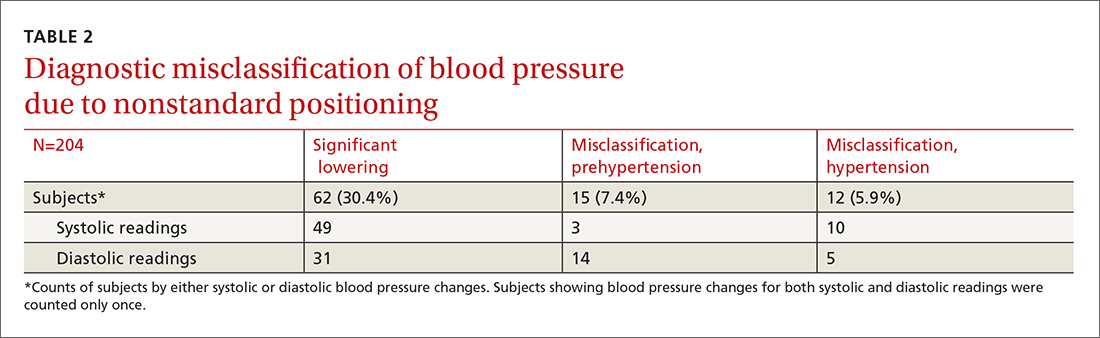
Logistic regression using patient age, sex, obesity, and history of diabetes, hypertension, and smoking as independent factors did not predict significant BP lowering with positional change.
Our observational study revealed that proper positioning in a chair was followed in only 10 of the 25 offices. In the remaining offices, patients were seated on the examination table. A 5-minute rest period before measuring BP was allowed in only 10 of the 25 offices. An automated oscillometric device was used in only 2 of the 25 offices.
DISCUSSION
In this study, 27 subjects (13.2%) were misclassified as prehypertensive or hypertensive as a result of deviating from the standard position in obtaining BP. Although the standard position is universally recommended, the guideline is not always followed in clinical practice.14
One study by Villegas et al found that 60% of physicians and nurses working in a major hospital were measuring BP inaccurately.15 In our initial observational study, 60% of primary care practices visited did not adhere to the recommended patient positioning. These medical offices are located in the community surrounding our facility and are operated by the same health care organization. The misclassification of prehypertension and hypertension observed in our prospective comparison of BP recordings in table and chair positions is, therefore, likely to occur to some degree at these practices, as well.
Similar diagnostic misclassifications have been reported in other medical settings. In a published survey of 114 medical offices, McKay and coworkers noted frequent inconsistencies with published guidelines in measuring BP.16
Common clinical demographic data obtained during this study showed no association with the positional BP change. Increased muscle tension due to lack of body support while sitting on the edge of the examination table could be the cause of elevated BP for this subgroup of individuals. Measuring muscle tension of the arms and back while seated on an exam table and chair was beyond the scope of this study.
In clinical practice, different types of BP measuring devices are used. Calibration and quality control of these devices is often lacking.17 Before starting our study, we determined the statistical variance of the aneroid sphygmomanometers and found it to approximate the manufacturer’s precision specification. Guidelines recommend using the mean of 2 BP readings as representing the patient’s BP for a given clinic visit. Additional readings are recommended if there is more than a 5 mm Hg difference between the initial 2 readings.4
In our study, we used sampling statistics of the BP readings and clinical guideline BP ranges in making diagnostic determinations. The inability to identify those patients whose BP will be affected by positional change highlights the importance of following standard BP measurement guidelines for all patients.
Study limitations. Positional change in BP from examination table to chair lacks a comparison to BP changes in positioning from chair to table. If similar BP changes in the reverse sequence were to be observed, this would add support to the hypothesis that muscle tension of the unsupported body is a cause of BP elevation in certain individuals. We believe, however, that the sequence of BP measurements (from table to chair) did not have a significant impact because all patients were allowed to rest in each position before the BP was measured. The BP was therefore measured in a steady-state in both positions.
Additionally, BP measurement by aneroid sphygmomanometry is highly dependent on observer skill and hearing ability. Furthermore, a disproportionate number of BP measurements recorded in the study ended in zero, suggesting terminal digit bias by the observer. These sources of error may be avoided using an automated oscillometric measuring device.18 Automated devices also allow for repeated independent measurements that minimize the white-coat effect. However, there are also limitations to the accuracy of oscillometric equipment. This is especially true when recording BP in the elderly, a group whose stiff arterial walls may cause erroneous measurements.19
Guideline justification. Nonadherence to standard positioning when measuring BP leads to certain individuals being misclassified as prehypertensive or hypertensive. Misclassification in turn leads to unnecessary medical encounters, testing, and treatment. Misdiagnosis is also likely to increase the cost of an individual’s insurance coverage and out-of-pocket health care expenses.
CORRESPONDENCE
Roy N. Morcos, MD, St. Elizabeth Family Medicine Residency Program, 8423 Market Street, Suite 101, Boardman, Ohio 44512; [email protected].
1. Kearney PM, Whelton M, Reynolds K, et al. Global burden of hypertension: analysis of worldwide data. Lancet. 2005;365:217-223.
2. Lim SS, Vos T, Flaxman AD, et al. A comparative risk assessment of burden of disease and injury attributable to 67 risk factors and risk factor clusters in 21 regions, 1990-2010: a systematic analysis for the Global Burden of Disease Study 2010. Lancet. 2012;380:2224-2260.
3. Murray CJ, Lopez AD. Measuring the global burden of disease. New Engl J Med. 2013;369:448-457.
4. Chobanian AV, Bakris GL, Black HR, et al. The Seventh Report of the Joint National Committee on Prevention, Detection, Evaluation, and Treatment of High Blood Pressure: the JNC 7 report. JAMA. 2003;289:2560-2572.
5. Bailey RH, Bauer JH. A review of common errors in the indirect measurement of blood pressure. Sphygmomanometry. Arch Intern Med. 1993;153:2741-2748.
6. Padwal RS, Hemmelgarn BR, McAlister FA, et al. The 2007 Canadian Hypertension Education Program recommendations for the management of hypertension: part 1- blood pressure measurement, diagnosis and assessment of risk. Can J Cardiol. 2007;23:529-538.
7. Campbell NR, Chockalingam A, Fodor JG, et al. Accurate, reproducible measurement of blood pressure. CMAJ. 1990;143:19-24.
8. Pickering TG, Hall JE, Appel LJ, et al. Recommendations for blood pressure measurement in humans: an AHA scientific statement from the Council on High Blood Pressure Research Professional and Public Education Subcommittee. J Clin Hypertens. 2005;7:102-109.
9. Piper MA, Evans CV, Burda BU, et al. Diagnostic and predictive accuracy of blood pressure screening methods with consideration of rescreening intervals: a systematic review for the U.S. Preventive Services Task Force. Ann Intern Med. 2015;162:192-204.
10. Peters GL, Binder SK, Campbell NR. The effect of crossing legs on blood pressure: a randomized single-blind cross-over study. Blood Press Monit. 1999;4:97-101.
11. Cicolini G, Pizzi C, Palma E, et al. Differences in blood pressure by body position (supine, Fowler’s, and sitting) in hypertensive subjects. Am J Hypertens. 2011;24:1073-1079.
12. Daniel WW, Cross CL. Biostatistics: A Foundation for Analysis in the Health Sciences (10th Edition). Hoboken, NJ: John Wiley & Sons; 2013.
13. Zaiontz C. Real statistics using Excel. Available at: http://www.real-statistics.com/. Accessed February 20, 2018.
14. Burgess SE, MacLaughlin EJ, Smith PA, et al. Blood pressure rising: differences between current clinical and recommended measurement techniques. J Am Soc Hypertens. 2011;5:484-488.
15. Villegas I, Arias IC, Botero A, et al. Evaluation of the technique used by health-care workers for taking blood pressure. Hypertension. 1995;26:1204-1206.
16. McKay DW, Campbell NR, Parab LS, et al. Clinical assessment of blood pressure. J Hum Hypertens. 1990;4:639-645.
17. Jones DW, Appel LJ, Sheps SG, et al. Measuring blood pressure accurately: new and persistent challenges. JAMA. 2003;289:1027-1030.
18. Leung AA, Nerenberg K, Daskalopoulou SS, et al. Hypertension Canada’s 2016 Canadian Hypertension Education Program Guidelines for Blood Pressure Measurement, Diagnosis, Assessment of Risk, Prevention, and Treatment of Hypertension. Can J Cardiol. 2016;32:569-588.
19. Raamat R, Talts J, Jagomägi K, et al. Errors of oscillometric blood pressure measurement as predicted by simulation. Blood Press Monit. 2011;16:238-245.
ABSTRACT
Purpose This study evaluated the effect of patient positioning on the diagnosis of hypertension in a clinic setting and the importance of following guidelines for measuring blood pressure (BP).
Methods In the trial part of this study, we recorded BP measurements by an aneroid sphygmomanometer with patients seated first on an examination table, a commonly observed practice, and second in the standard seated position as defined by the American Heart Association. Two measurements were obtained in each position for 204 patients, and we determined the difference between the average readings in the 2 positions. Factored into the comparison was an estimation of inherent variance of the device and observer achieved by repeated measurements on a healthy individual.
Results This investigation included an initial observational study of 25 regional primary care offices, the results of which showed frequent lack of adherence with accepted guidelines in patient positioning during BP measurement. The overall systolic and diastolic BPs were more than 2 mm Hg lower in the standard seated position compared with the examination table position (P<.001). Noncompliance with the position guideline resulted in misclassification of 15 patients (7.4%) as prehypertensive, when, in fact, they were normotensive. Misclassification of hypertension occurred in 12 patients (5.9%), when, in fact, they were normotensive. Logistic regression using relevant clinical factors did not identify those individuals who were misclassified.
Conclusion This study underscores the importance of patient positioning on BP determinations in order to accurately diagnose hypertension.
The high prevalence of hypertension and its burden of disease in the United States and worldwide are well known.1 Hypertension is a major risk factor for coronary heart disease, congestive heart failure, ischemic and hemorrhagic stroke, chronic kidney disease, and peripheral arterial disease.2 Among all risk factors, hypertension ranked first worldwide in disability-adjusted life-years.3 However, misclassification of an individual’s blood pressure (BP) as prehypertension or hypertension also confers significant health and financial burdens due to unnecessary medical encounters, testing, and treatment, and to increased cost of insurance coverage and out-of-pocket expenses. A correct assessment of BP in the outpatient setting depends on accurate measurement technique.
The diagnosis of hypertension is based on indirect measurement of BP using in-office, ambulatory, or home monitoring. Although office BP measurement is less than ideal, it is used most often to diagnose and monitor hypertension. Furthermore, most published trials of treatment recommendations are based on office BP measurements.4
Automated oscillometric and aneroid sphygmomanometers are common BP measurement devices. Proper technique is particularly important with the aneroid sphygmomanometer to obtain consistent and accurate results.5 Good training and an ability to hear the Korotkoff sounds are crucial.
Expert consensus groups such as the American Heart Association (AHA) publish recommendations for proper technique in reliably measuring BP,6-8 and they emphasize the importance of patient positioning during BP measurement. The individual should be seated comfortably in a chair with both arms and back supported, legs uncrossed, and feet flat on the floor. We’ll refer to this as the “standard position.” Although the proper technique for measuring BP has been widely advocated, a recent literature review for the US Preventive Services Task Force concluded that surprisingly few studies are available on the diagnostic accuracy of office BP practices.9
One paper evaluated the effect of leg crossing on accuracy of BP measurement. No subjects were reclassified as hypertensive, but the study lacked statistical rigor.10 Another study found variable BP readings regardless of body position.11
The purpose of our study was to compare BP measurement in 2 positions: the standard position described above, and the examination table position in which the patient is seated on the edge of the table with back, arms, and feet unsupported.
METHODS
We conducted our literature search across several scientific and medical literature databases, including PubMed, ScienceDirect, and CINAHL. Only English-language articles were reviewed.
We followed the BP measurement guidelines of the AHA. Prior to beginning the study, we provided instructions in proper BP measurement technique to the nurses who would obtain the data. The minimum sample size of patients needed to identify a difference of at least 2 mm Hg was 26, as estimated by power analysis. This was calculated using an alpha of .05 and a beta of .13.
The study population consisted of patients presenting consecutively to a teaching family medicine center. Adult patients, ages 18 and older, were informed about the study and invited to participate. Those who agreed were asked to read and sign an informed consent approved by a regional institutional review board for human subjects. We excluded patients who declined participation for any reason, who were in severe pain or distress that may have prevented them from completing the protocol, or who had limited mobility that could interfere with climbing onto the examination table. Patients considered for the study totaled 250, 28 of whom were ineligible. Another 18 patients declined participation, leaving 204 who completed the protocol.
Before testing began, we estimated the standard deviation of each aneroid sphygmomanometer and the assigned observer by repeatedly measuring the BP of a healthy normotensive individual sitting in the standard position. We obtained 46 measurements over 2 days to avoid subject and operator fatigue. Standard deviation for systolic BP was 3.6 mm Hg; for diastolic it was 3.8 mm Hg.
During testing, nurses recorded BP for each patient twice in the examination table position and twice in the standard position. They entered data into an Excel workbook for subsequent analysis. All examination rooms were equipped with newly purchased aneroid sphygmomanometers, and the appropriate cuff size was selected for each patient. Patients were instructed to remain quiet during the measurements. Patients sat first on the edge of the examination table. After a 5-minute rest, BP was measured twice in the same arm. Measurements were separated by 1 to 2 minutes. Patients then sat in the chair and rested another 2 minutes before BP was again measured twice in the same arm. The arms and back were supported in the chair and the stethoscope placed at heart level.
As per protocol, we obtained 4 BP readings on each patient and calculated the difference between the average systolic and diastolic BP values from the 2 positions. The standard error of the mean of this difference was determined using the equation, where Sd is the standard deviation of the aneroid sphygmomanometer and observer.12 A one-sided, 95% confidence upper bound for the standard error of the difference is 1.65 × SEd. We compared patient-specific differences against this upper bound to identify significant systolic and diastolic BP changes due to positioning. If the patient’s BP difference exceeded the upper bound, it was attributed to the positional change and not to variation inherent to the sphygmomanometer and observer.
As an example, consider a patient whose average systolic BP readings from the examination-table and standard positions, respectively, were 128 mm Hg and 120 mm Hg. Assuming an SEd of 3.55 and an upper bound of 5.86, the observed 8 mm Hg difference in average systolic BPs would be considered significant. The amount of random variation from the sphygmomanometer and observer would not be expected to exceed 5.86 mm Hg.
In accordance with accepted standards, prehypertension was defined as a BP between 120-139/80-89 mm Hg, and hypertension was defined as a BP ≥140/90 mm Hg.4 BP below 120/80 mm Hg was considered normal. We calculated each patient’s average systolic and diastolic BP values in the 2 positions and thereby classified the individual as normotensive, prehypertensive, or hypertensive. We regarded as misclassified any patient whose BP showed significant lowering between the examination-table and standard positions resulting in a change of classification from prehypertensive or hypertensive to normotensive. For example, a patient with an examination-table position average reading of 126/85 mm Hg and a standard position average reading of 118/78 mm Hg would have been misclassified as prehypertensive.
We reviewed charts and gathered data, including subject age, sex, obesity (defined as a body mass index of ≥30 kg/m2), and history of diabetes, hypertension, or smoking. Other than age, all data were binary. We performed logistic regression analysis using the Excel Add-in Real Statistics Resource Pack software (Release 4.3)13 to determine if these factors could predict significant lowering of BP due to positional change.
Our associated observational study. We also conducted a separate observational study of 25 regional primary care offices to evaluate compliance with the AHA guidelines for measuring BP. The office nurses taking measurements were not informed of the study’s purpose to prevent deviation from their common practice.
Data on 9 guideline criteria were collected to assess supervision of patients before and during measurements, including having the patient sit in a chair in quiet and comfortable surroundings with arms and back supported and feet on the ground. We also noted the type of BP measuring device used. Additionally, observers assessed the technique of the individuals using a manual device, including cuff placement and deflation rate. The observations were conducted during a clinic visit by a medical student knowledgeable in the AHA guidelines for measuring BP by automated oscillometric or aneroid sphygmomanometric devices. We conducted the study over a 2-week period in the second quarter of 2016.
RESULTS
Power analysis performed prior to the study showed that a minimum of 26 patients would be needed to predict a 2 mm Hg difference between BPs obtained in the 2 positions. Of the 204 patients used in the logistic regression analysis, 78 were men and 126 were women. Ages ranged from 18 to 101 years, yielding a mean of 54. One-hundred sixteen had previously received a diagnosis of hypertension, 39 had diabetes, 92 were obese, 22 were current smokers, and 68 were former smokers.
TABLE 1 shows the means and ranges of systolic and diastolic BP for both study positions. With this study population, mean BP recorded in the examination-table position decreased in the standard position by 2.1 and 2.2 mm Hg for systolic and diastolic BP, respectively (P<.001).
Significant BP lowering—as defined by a one-sided 95% confidence upper bound for the standard error of differences between study positions—was determined to be 5.86 and 6.22 mm Hg for systolic and diastolic pressures, respectively. Significant lowering of BP and misclassification due to positioning are summarized in TABLE 2. Significant lowering of mean systolic or diastolic BP with positional change from table to chair occurred in 62 subjects (30.4%). Misclassification of prehypertension occurred in 7.4% of subjects, and misclassification of hypertension occurred in 5.9%.
Logistic regression using patient age, sex, obesity, and history of diabetes, hypertension, and smoking as independent factors did not predict significant BP lowering with positional change.
Our observational study revealed that proper positioning in a chair was followed in only 10 of the 25 offices. In the remaining offices, patients were seated on the examination table. A 5-minute rest period before measuring BP was allowed in only 10 of the 25 offices. An automated oscillometric device was used in only 2 of the 25 offices.
DISCUSSION
In this study, 27 subjects (13.2%) were misclassified as prehypertensive or hypertensive as a result of deviating from the standard position in obtaining BP. Although the standard position is universally recommended, the guideline is not always followed in clinical practice.14
One study by Villegas et al found that 60% of physicians and nurses working in a major hospital were measuring BP inaccurately.15 In our initial observational study, 60% of primary care practices visited did not adhere to the recommended patient positioning. These medical offices are located in the community surrounding our facility and are operated by the same health care organization. The misclassification of prehypertension and hypertension observed in our prospective comparison of BP recordings in table and chair positions is, therefore, likely to occur to some degree at these practices, as well.
Similar diagnostic misclassifications have been reported in other medical settings. In a published survey of 114 medical offices, McKay and coworkers noted frequent inconsistencies with published guidelines in measuring BP.16
Common clinical demographic data obtained during this study showed no association with the positional BP change. Increased muscle tension due to lack of body support while sitting on the edge of the examination table could be the cause of elevated BP for this subgroup of individuals. Measuring muscle tension of the arms and back while seated on an exam table and chair was beyond the scope of this study.
In clinical practice, different types of BP measuring devices are used. Calibration and quality control of these devices is often lacking.17 Before starting our study, we determined the statistical variance of the aneroid sphygmomanometers and found it to approximate the manufacturer’s precision specification. Guidelines recommend using the mean of 2 BP readings as representing the patient’s BP for a given clinic visit. Additional readings are recommended if there is more than a 5 mm Hg difference between the initial 2 readings.4
In our study, we used sampling statistics of the BP readings and clinical guideline BP ranges in making diagnostic determinations. The inability to identify those patients whose BP will be affected by positional change highlights the importance of following standard BP measurement guidelines for all patients.
Study limitations. Positional change in BP from examination table to chair lacks a comparison to BP changes in positioning from chair to table. If similar BP changes in the reverse sequence were to be observed, this would add support to the hypothesis that muscle tension of the unsupported body is a cause of BP elevation in certain individuals. We believe, however, that the sequence of BP measurements (from table to chair) did not have a significant impact because all patients were allowed to rest in each position before the BP was measured. The BP was therefore measured in a steady-state in both positions.
Additionally, BP measurement by aneroid sphygmomanometry is highly dependent on observer skill and hearing ability. Furthermore, a disproportionate number of BP measurements recorded in the study ended in zero, suggesting terminal digit bias by the observer. These sources of error may be avoided using an automated oscillometric measuring device.18 Automated devices also allow for repeated independent measurements that minimize the white-coat effect. However, there are also limitations to the accuracy of oscillometric equipment. This is especially true when recording BP in the elderly, a group whose stiff arterial walls may cause erroneous measurements.19
Guideline justification. Nonadherence to standard positioning when measuring BP leads to certain individuals being misclassified as prehypertensive or hypertensive. Misclassification in turn leads to unnecessary medical encounters, testing, and treatment. Misdiagnosis is also likely to increase the cost of an individual’s insurance coverage and out-of-pocket health care expenses.
CORRESPONDENCE
Roy N. Morcos, MD, St. Elizabeth Family Medicine Residency Program, 8423 Market Street, Suite 101, Boardman, Ohio 44512; [email protected].
1. Kearney PM, Whelton M, Reynolds K, et al. Global burden of hypertension: analysis of worldwide data. Lancet. 2005;365:217-223.
2. Lim SS, Vos T, Flaxman AD, et al. A comparative risk assessment of burden of disease and injury attributable to 67 risk factors and risk factor clusters in 21 regions, 1990-2010: a systematic analysis for the Global Burden of Disease Study 2010. Lancet. 2012;380:2224-2260.
3. Murray CJ, Lopez AD. Measuring the global burden of disease. New Engl J Med. 2013;369:448-457.
4. Chobanian AV, Bakris GL, Black HR, et al. The Seventh Report of the Joint National Committee on Prevention, Detection, Evaluation, and Treatment of High Blood Pressure: the JNC 7 report. JAMA. 2003;289:2560-2572.
5. Bailey RH, Bauer JH. A review of common errors in the indirect measurement of blood pressure. Sphygmomanometry. Arch Intern Med. 1993;153:2741-2748.
6. Padwal RS, Hemmelgarn BR, McAlister FA, et al. The 2007 Canadian Hypertension Education Program recommendations for the management of hypertension: part 1- blood pressure measurement, diagnosis and assessment of risk. Can J Cardiol. 2007;23:529-538.
7. Campbell NR, Chockalingam A, Fodor JG, et al. Accurate, reproducible measurement of blood pressure. CMAJ. 1990;143:19-24.
8. Pickering TG, Hall JE, Appel LJ, et al. Recommendations for blood pressure measurement in humans: an AHA scientific statement from the Council on High Blood Pressure Research Professional and Public Education Subcommittee. J Clin Hypertens. 2005;7:102-109.
9. Piper MA, Evans CV, Burda BU, et al. Diagnostic and predictive accuracy of blood pressure screening methods with consideration of rescreening intervals: a systematic review for the U.S. Preventive Services Task Force. Ann Intern Med. 2015;162:192-204.
10. Peters GL, Binder SK, Campbell NR. The effect of crossing legs on blood pressure: a randomized single-blind cross-over study. Blood Press Monit. 1999;4:97-101.
11. Cicolini G, Pizzi C, Palma E, et al. Differences in blood pressure by body position (supine, Fowler’s, and sitting) in hypertensive subjects. Am J Hypertens. 2011;24:1073-1079.
12. Daniel WW, Cross CL. Biostatistics: A Foundation for Analysis in the Health Sciences (10th Edition). Hoboken, NJ: John Wiley & Sons; 2013.
13. Zaiontz C. Real statistics using Excel. Available at: http://www.real-statistics.com/. Accessed February 20, 2018.
14. Burgess SE, MacLaughlin EJ, Smith PA, et al. Blood pressure rising: differences between current clinical and recommended measurement techniques. J Am Soc Hypertens. 2011;5:484-488.
15. Villegas I, Arias IC, Botero A, et al. Evaluation of the technique used by health-care workers for taking blood pressure. Hypertension. 1995;26:1204-1206.
16. McKay DW, Campbell NR, Parab LS, et al. Clinical assessment of blood pressure. J Hum Hypertens. 1990;4:639-645.
17. Jones DW, Appel LJ, Sheps SG, et al. Measuring blood pressure accurately: new and persistent challenges. JAMA. 2003;289:1027-1030.
18. Leung AA, Nerenberg K, Daskalopoulou SS, et al. Hypertension Canada’s 2016 Canadian Hypertension Education Program Guidelines for Blood Pressure Measurement, Diagnosis, Assessment of Risk, Prevention, and Treatment of Hypertension. Can J Cardiol. 2016;32:569-588.
19. Raamat R, Talts J, Jagomägi K, et al. Errors of oscillometric blood pressure measurement as predicted by simulation. Blood Press Monit. 2011;16:238-245.

Dual Radial Styloid and Volar Plating for Unstable Fractures of the Distal Radius
ABSTRACT
As the operative management of displaced distal radius fractures evolves, intraoperative techniques and fixation strategies evolve as well. Achieving and maintaining an acceptable reduction is paramount but can be difficult with particular fracture patterns. In this article, we describe the use of a radial column plate as a reduction tool in the management of unstable distal radius fractures, along with clinical and radiographic clinical outcomes. This technique can be useful in situations where multiplanar instability exists, or simply when intraoperative assistance is limited. Surgeons can expect acceptable radiographic and clinical outcomes when using this technique, although effects on scar formation and wrist range of motion are currently not known.
Continue to: Distal radius fractures...
Distal radius fractures are among the most common orthopedic injuries encountered; their reported incidence is >640,000 annually and is estimated to increase.1-4 The management of these injuries has evolved from closed reduction and casting to percutaneous pinning and internal fixation, as the importance of achieving and maintaining an anatomic reduction has become more apparent.5-7 More recently, volar locking plates have emerged as a way to prevent complications associated with dorsal plating. Most authors agree that volar locked plating achieves stable fixation and allows for early postoperative wrist range of motion (ROM).5,8-11 However, a volar approach to a dorsally unstable fracture creates difficulty with regard to reduction at the time of surgery and several reports have noted mechanical failure with utilization of locked volar plating alone.12-15
Dual plating of unstable distal radius fractures with a volar locking plate and a radial column plate has been described in the past in the setting of severely comminuted fractures or in patterns with a large radial styloid fragment that was not addressed with a volar locking plate alone.16-19 The purpose of this study is to present the use of the radial column plate as a tool that allows a surgeon to achieve and maintain reduction during open reduction and internal fixation (ORIF) of an unstable distal radius fracture.
OPERATIVE TECHNIQUE
Patients for whom ORIF is indicated include those with unstable distal radius fractures, with or without intra-articular extension and involvement of both the intermediate and lateral columns.
The patient is positioned supine on the operating table with the operative hand placed palm-up on a radiolucent hand table. A volar approach to the distal radius is undertaken, utilizing the interval between the flexor carpi radialis (FCR) tendon and the radial artery. The floor of the FCR sheath is incised, and a self-retaining retractor with blunt tips can be placed to permit visualization. The pronator quadratus (PQ) is sharply reflected off the radial boarder of the distal radius and approximately 1 mm to 2 mm proximal to the radiocarpal joint with an L-shaped incision for fracture site exposure. The brachioradialis is then identified and tenotomized with a scalpel (Figure 1).

A preliminary reduction is then performed using a combination of axial traction and palmar translation of the carpus. The surgeon should not be concerned with radial height or inclination at this point; however, volar tilt should be established as best as possible. A rolled towel is placed dorsal to the metacarpals, holding the wrist in a flexed position as it is placed back onto the radiolucent hand table.
Continue to: A 7 to 8 hole...
A 7 to 8 hole 2.0-mm reconstruction plate (DePuy Synthes) is bent to the shape of the radial boarder of the distal radius. Undercontouring of the plate is necessary to allow for its use as a reduction tool. The plate is then applied to the radial column ensuring that the distal aspect of the plate engages the distal fracture fragment(s) (Figure 2). A single 2.4-mm fully threaded cortical screw in the radial to ulnar direction is then placed bicortically in the proximal fragment in the hole nearest the fracture site. As the screw is tightened, the plate will push the distal fragment(s) due to its undercontoured shape, and in doing so, will restore radial height and inclination (Figure 3). As this screw is being used as a “working screw,” it will be longer than needed after final tightening. A second screw is then placed proximally to prevent rotation of the plate, and the initial screw can be replaced if its length is of concern. If it is the intention of the surgeon to remove the plate prior to wound closure, the second screw is typically not necessary, and there is no indication for exchanging the first screw if it is long.

At this point, final changes to the reduction can still be performed, as the distal fragment(s) has no fixation except for a buttress plate on its radial border. However, the pressure applied by this plate is still typically adequate to maintain a reduction without the use of percutaneous pins or an assistant holding the reduction. Volar fixation is then applied and positioned under both direct visualization and fluoroscopic aid, and cortical and locking screws are inserted as needed (Figure 4). The radial styloid plate can then be removed; however, it is our preference to leave it in place, as we have not seen any postoperative issues that we can attribute to this technique. The PQ is then repaired over the volar locking plate directly to the radial column plate.

At our institution, patients are maintained in a plaster volar-based wrist splint for a period of 2 weeks postoperatively. After splint and suture removal, active and passive ROM exercises of the wrist and hand are initiated, and a custom thermoplast volar wrist splint is manufactured. This splint is to be worn at all times except during physical therapy. At the 6-week postoperative visit, all restrictions are lifted, assuming there are no complications or unexpected issues. Patients are then seen for follow-up at 3 and 6 months postoperatively. Continued follow-up is indicated if patients are following an abnormal clinical or radiographic course.

MATERIALS AND METHODS
After Institutional Review Board approval was obtained, a clinical outcomes registry was queried to identify all patients treated operatively by the senior author (DGL) for a distal radius fracture at our Level 1 trauma center between August 2002 and December 2013. Adult (age >18 years) patients with isolated distal radius fractures treated with a radial styloid plate were included for initial review (N = 261). Patients for whom 6-month clinical or radiographic outcomes were unknown were then excluded (n = 225).
Patient demographics were recorded from the existing database along with visual analog scale, Quick Disabilities of the Arm, Shoulder and Hand (DASH), and short form 36 (SF-36) physical component scores (PCS) and mental component scores (MCS) from the final follow-up visit. Injury and intraoperative and final radiographs were assessed by a single reviewer (MRG) using calibrated radiographs on our institution’s picture archiving and communication system. Radial height, radial inclination, and volar tilt were documented for each time point except for radial height, which was not recorded for intraoperative fluoroscopy images due to lack of calibration. Intra-articular extension was noted on injury films. Wound complications, the presence of a deep or superficial infection, and removal of implants after union were recorded.
Continue to: RESULTS
RESULTS
Thirty-six patients met the inclusion criteria and were therefore included in the study. The average age at the time of surgery was 60.6 years (range, 25-87 years), 27 patients (75%) were female, and 21 (58%) had left-sided injuries. Patient comorbidities can be seen in Table 1. Twenty-six fractures (72.2%) had intra-articular extension. Average follow-up was 15.6 months (range, 6-53.9 months).
Table 1. Comorbidities of Patients Treated with Radial Column Plating
| Total No. of patients | 36 | |
| Diabetes mellitus | 2 | 5.6% |
| Hyperlipidemia | 7 | 19.4% |
| Hypertension | 11 | 30.6% |
| Current smoker | 4 | 11.1% |
| Current alcohol abuse | 1 | 2.8% |
| Peripheral vascular disease | 0 | 0.0% |
| Mean body mass index | 27.0 | Range: 19-34.5 |
Radiographic measurements at the time of injury, surgery, and final follow-up can be seen in Table 2. As previously noted, radial height could not be recorded on intraoperative films due to the use of fluoroscopy, which is not calibrated at our institution. The average changes in radial inclination and volar tilt from the time of surgery (intraoperative fluoroscopy) to final follow-up were 0.46° (range, −4.4°-4.3°) and 0.24° (range, −10.6°-9.6°), respectively. All patients had acceptable radial height, radial inclination, and volar tilt at final follow-up. Clinical outcomes were obtained at a mean of 15.6 months (range, 6-54 months) and were generally good, with a mean DASH score of 20.7 (range, 0-57.5), SF-36 PCS of 45.4 (range, 22.7-68.0), and SF-36 MCS of 50.5 (range, 22.3-64.1) (Table 3). Of the 36 patients with 6-month outcome scores, 13 (36.1%) elected for implant removal after fracture union at a mean of 7.6 months after index surgery (range, 3.2-49.8 months). No infections or wound complications were noted.
Table 2. Radiographic Measurements for Patients Treated with Radial Column Plating
| Mean Measurement | Range | |
| Injury radiographs | ||
| Radial inclination (degrees) | 7.3 | −22.9-22 |
| Radial height (mm) | 3.3 | −14.9-11.5 |
| Volar tilt (degrees) | −10.4 | −49.2-33.9 |
| Intraoperative fluoroscopy | ||
| Radial inclination (degrees) | 21.1 | 13.1-26.6 |
| Volar tilt (degrees) | 6.2 | −3.6-12.2 |
| Final radiographs | ||
| Radial inclination (degrees) | 21.5 | 14.5-29.2 |
| Radial height (mm) | 11.0 | 7.6-14.6 |
| Volar tilt (degrees) | 6.8 | −12.4-18.8 |
DISCUSSION
In this article, we described the use of a radial column plate as a tool to achieve and maintain a reduction during the surgical fixation of an unstable distal radius fracture with a volar locking plate. We have further presented a series of 36 patients treated in this manner and their clinical and radiographic outcomes. This technique permits the maintenance of coronal alignment, thereby limiting the use of percutaneous techniques or the need to manually hold fracture fragments in a reduced position, which may be valuable to the surgeon who is operating without a surgical assistant.
Table 3. Clinical Outcome Scores at Final Follow-Up for Patients Treated with Radial Column Plating
| Outcome Score | Mean Score | Range |
| VAS | 1.4 | 0-7.5 |
| DASH | 20.7 | 0-57.5 |
| PCS | 45.4 | 22.7-68 |
| MCS | 50.5 | 22.3-64.1 |
Abbreviations: DASH, Quick Disabilities of the Arm, Shoulder and Hand; MCS, mental component scores; PCS, physical component scores; VAS, visual analog scale.
In addition to its value as a reduction tool, unlike traditional temporary k-wire fixation, we believe that the utilization of a radial styloid plate allows for increased stability until fracture union is achieved. Biomechanical studies have demonstrated favorable results with the use of a radial column plate. Grindel and colleagues20 evaluated dual radial styloid and volar radius plating vs volar plating alone in their biomechanical comparison of 8 cadaveric matched hand and forearm pairs. Specimens were fixated with a volar locking plate, and a 1-cm wedge osteotomy was created dorsally approximately 2 cm from the articular margin. The distal fragment was then osteotomized longitudinally between the 2 ulnar and 2 radial distal locking screws to create a fracture pattern that mimics a dorsally unstable injury with intra-articular extension. Half of the specimens then underwent radial styloid plating with 2 screws securing the construct proximally, and load-to-failure testing was performed. The authors found that utilization of both the volar and radial styloid plates resulted in 50% increased stiffness and 76% increased force-to-failure as compared with radial styloid plating alone. Similar, although not statistically significant, results were found by Blythe and colleagues.21 In their cadaveric study, dorsal and volar plating with an additional radial column plate resulted in improved stiffness with axial loading compared to volar or dorsal plating alone 21.
Two prior studies have presented outcome data after fixation of distal radius fractures with radial column and volar radius dual plating. Tang and colleagues16 described this technique and presented postoperative outcomes in 8 patients followed for an average of 35 weeks. They reported a 100% union rate, no loss of reduction, and a mean DASH score of 19.9. Jacobi and colleagues17 also described this technique in their 2010 report. In their cohort of 10 patients treated by multiple surgeons, they found a mean of 39° of flexion, 49° of extension, 75° of pronation, and 75° of supination at 24 months postoperatively. Eight patients were rated as “excellent,” 1 as “good,” and 1 as “fair” according to the Gartland and Werley score, with all 10 cases achieving bony union. No cases demonstrated loss of volar tilt, radial length, or radial inclination. In both studies, however, the use of the radial column plate was advocated as a fragment-specific fixation tool and not as a reduction tool.
Continue to: Although 1-year DASH scores...
Although 1-year DASH scores for volar plating alone have been shown in the literature to be consistently within 6 and 13, 3-month and 6-month scores have historically been >18.22-27 Our short-term clinical results (Table 3) are comparable to these historic controls. Further, within our cohort there were no cases of nonunion, postoperative infection, or wound complications, and radiographic measures show maintenance of reduction at final follow-up (Table 2).
We do recognize that 36.1% (13/36) of our cohort had their distal radius implants removed. Although this incidence is high, it stems from the fact that patients who elect for implant removal are more likely to have had an atypical postoperative course and are therefore followed for longer than 6 months. Those who do not elect for removal are typically discharged from care after their 3-month postoperative visit, and were therefore not eligible for inclusion in this study. Overall, a total of 261 patients have been treated with this technique by the senior surgeon. Of those patients, only 28 (10.7%) underwent removal of surgical implants. If the remaining patients had been followed for the full 6 months, it is likely that outcome scores would have been skewed in a more favorable direction.
Surgeons electing to utilize radial styloid plating for displaced distal radius fractures should recognize that the required increased surgical dissection might lead to increased scar formation and postoperative stiffness. A limitation of this study is the lack of quantitative wrist ROM data. Future studies may compare final clinical outcomes and ROM for patients treated with and without radial column fixation.
CONCLUSION
We advocate for the use of a radial column plate as a tool to help achieve and maintain fracture reduction in the setting of an unstable distal radius fracture being treated with ORIF. This technique may be particularly useful when a surgical assistant is not available. Surgeons can expect clinical and radiographic results that are similar to those of volar locked plating alone.
1. Larsen CF, Lauritsen J. Epidemiology of acute wrist trauma. Int J Epidemiol. 1993;22(5):911-916.
2. Chung KC, Spilson SV. The frequency and epidemiology of hand and forearm fractures in the United States. J Hand Surg Am. 2001;26(5):908-915. doi:10.1053/jhsu.2001.26322.
3. Melton LJ 3rd, Amadio PC, Crowson CS, O'Fallon WM. Long-term trends in the incidence of distal forearm fractures. Osteoporos Int. 1998;8(4):341-348.
4. Hagino H, Yamamoto K, Ohshiro H, Nakamura T, Kishimoto H, Nose T. Changing incidence of hip, distal radius, and proximal humerus fractures in Tottori Prefecture, Japan. Bone. 1999;24(3):265-270.
5. Diaz-Garcia RJ, Chung KC. The evolution of distal radius fracture management: A historical treatise. Hand Clin. 2012;28(2):105-111. doi:10.1016/j.hcl.2012.02.007.
6. McQueen M, Caspers J. Colles fracture: Does the anatomical result affect the final function? J Bone Joint Surg Br. 1988;70(4):649-651.
7. Stewart HD, Innes AR, Burke FD. Factors affecting the outcome of Colles' fracture: an anatomical and functional study. Injury. 1985;16(5):289-295.
8. Knight D, Hajducka C, Will E, McQueen M. Locked volar plating for unstable distal radial fractures: Clinical and radiological outcomes. Injury. 2010;41(2):184-189. doi:10.1016/j.injury.2009.08.024.
9. Anakwe R, Khan L, Cook R, McEachan J. Locked volar plating for complex distal radius fractures: patient reported outcomes and satisfaction. J Orthop Surg Res. 2010;5:51. doi:10.1186/1749799X-5-51.
10. Gruber G, Gruber K, Giessauf C, et al. Volar plate fixation of AO type C2 and C3 distal radius fractures, a single-center study of 55 patients. J Orthop Trauma. 2008;22(7):467-472. doi:10.1097/BOT.0b013e318180db09.
11. Koval KJ, Harrast JJ, Anglen JO, Weinstein JN. Fractures of the distal part of the radius. The evolution of practice over time. Where’s the evidence? J Bone Joint Surg Am. 2008;90(9):1855-1861. doi:10.2106/JBJS.G.01569.
12. Foo TL, Gan AW, Soh T, Chew WY. Mechanical failure of the distal radius volar locking plate. J Orthop Surg (Hong Kong). 2013;21(3):332-336. doi:10.11777/230949901302100314.
13. Ward CM, Kuhl TL, Adams BD. Early complications of volar plating of distal radius fractures and their relationship to surgeon experience. Hand (N Y). 2011;6(2):185-189. doi:10.1007/s11552-010-9313-5.
14. Min W, Kaplan K, Miyamoto R, Tejwani NC. A unique failure mechanism of a distal radius fracture fixed with volar plating--a case report. Bull NYU Hosp Jt Dis. 2010;68(4):304-306.
15. Cao J, Ozer K. Failure of volar locking plate fixation of an extraarticular distal radius fracture: A case report. Patient Saf Surg. 2010;4(1):19. doi:10.1186/1754-9493-4-19.
16. Tang P, Ding A, Uzumcugil A. Radial column and volar plating (RCVP) for distal radius fractures with a radial styloid component or severe comminution. Tech Hand Up Extrem Surg. 2010;14(3):143-149. doi:10.1097/BTH.0b013e3181cae14d.
17. Jacobi M, Wahl P, Kohut G. Repositioning and stabilization of the radial styloid process in comminuted fractures of the distal radius using a single approach: The radio-volar double plating technique. J Orthop Surg Res. 2010;5:55. doi:10.1186/1749-799X-5-55.
18. Rikli DA, Regazzoni P. The double plating technique for distal radius fractures. Tech Hand Up Extrem Surg. 2000;4(2):107-114.
19. Rikli DA, Regazzoni P. Fractures of the distal end of the radius treated by internal fixation and early function. A preliminary report of 20 cases. J Bone Joint Surg Br. 1996;78(4):588-592.
20. Grindel SI, Wang M, Gerlach M, McGrady LM, Brown S. Biomechanical comparison of fixed-angle volar plate versus fixed-angle volar plate plus fragment-specific fixation in a cadaveric distal radius fracture model. J Hand Surg Am. 2007;32(2):194-199. doi:10.1016/j.jhsa.2006.12.003.
21. Blythe M, Stoffel K, Jarrett P, Kuster M. Volar versus dorsal locking plates with and without radial styloid locking plates for the fixation of dorsally comminuted distal radius fractures: A biomechanical study in cadavers. J Hand Surg Am. 2006;31(10):1587-1593. doi:10.1016/j.jhsa.2006.09.011.
22. Loveridge J, Ahearn N, Gee C, Pearson D, Sivaloganathan S, Bhatia R. Treatment of distal radial fractures with the DVR-A plate--the early bristol experience. Hand Surg. 2013;18(2):159-167. doi:10.1142/S0218810413500184.
23. Karantana A, Downing ND, Forward DP, et al. Surgical treatment of distal radial fractures with a volar locking plate versus conventional percutaneous methods: a randomized controlled trial. J Bone Joint Surg Am. 2013;95(19):1737-1744. doi:10.2106/JBJS.L.00232.
24. Egol K, Walsh M, Tejwani N, McLaurin T, Wynn C, Paksima N. Bridging external fixation and supplementary kirschner-wire fixation versus volar locked plating for unstable fractures of the distal radius: A randomised, prospective trial. J Bone Joint Surg Br. 2008;90(9):1214-1221. doi:10.1302/0301-620X.90B9.20521.
25. von Recum J, Matschke S, Jupiter JB, et al. Characteristics of two different locking compression plates in the volar fixation of complex articular distal radius fractures. Bone Joint Res. 2012;1(6):111-117. doi:10.1302/2046-3758.16.2000008.
26. Safi A, Hart R, Těknědžjan B, Kozák T. Treatment of extra-articular and simple articular distal radial fractures with intramedullary nail versus volar locking plate. J Hand Surg Eur Vol. 2013;38(7):774-779. doi:10.1177/1753193413478715.
27. Kim JK, Park SD. Outcomes after volar plate fixation of low-grade open and closed distal radius fractures are similar. Clin Orthop Relat Res. 2013;471(6):2030-2035. doi:10.1007/s11999-013-2798-9.
ABSTRACT
As the operative management of displaced distal radius fractures evolves, intraoperative techniques and fixation strategies evolve as well. Achieving and maintaining an acceptable reduction is paramount but can be difficult with particular fracture patterns. In this article, we describe the use of a radial column plate as a reduction tool in the management of unstable distal radius fractures, along with clinical and radiographic clinical outcomes. This technique can be useful in situations where multiplanar instability exists, or simply when intraoperative assistance is limited. Surgeons can expect acceptable radiographic and clinical outcomes when using this technique, although effects on scar formation and wrist range of motion are currently not known.
Continue to: Distal radius fractures...
Distal radius fractures are among the most common orthopedic injuries encountered; their reported incidence is >640,000 annually and is estimated to increase.1-4 The management of these injuries has evolved from closed reduction and casting to percutaneous pinning and internal fixation, as the importance of achieving and maintaining an anatomic reduction has become more apparent.5-7 More recently, volar locking plates have emerged as a way to prevent complications associated with dorsal plating. Most authors agree that volar locked plating achieves stable fixation and allows for early postoperative wrist range of motion (ROM).5,8-11 However, a volar approach to a dorsally unstable fracture creates difficulty with regard to reduction at the time of surgery and several reports have noted mechanical failure with utilization of locked volar plating alone.12-15
Dual plating of unstable distal radius fractures with a volar locking plate and a radial column plate has been described in the past in the setting of severely comminuted fractures or in patterns with a large radial styloid fragment that was not addressed with a volar locking plate alone.16-19 The purpose of this study is to present the use of the radial column plate as a tool that allows a surgeon to achieve and maintain reduction during open reduction and internal fixation (ORIF) of an unstable distal radius fracture.
OPERATIVE TECHNIQUE
Patients for whom ORIF is indicated include those with unstable distal radius fractures, with or without intra-articular extension and involvement of both the intermediate and lateral columns.
The patient is positioned supine on the operating table with the operative hand placed palm-up on a radiolucent hand table. A volar approach to the distal radius is undertaken, utilizing the interval between the flexor carpi radialis (FCR) tendon and the radial artery. The floor of the FCR sheath is incised, and a self-retaining retractor with blunt tips can be placed to permit visualization. The pronator quadratus (PQ) is sharply reflected off the radial boarder of the distal radius and approximately 1 mm to 2 mm proximal to the radiocarpal joint with an L-shaped incision for fracture site exposure. The brachioradialis is then identified and tenotomized with a scalpel (Figure 1).
A preliminary reduction is then performed using a combination of axial traction and palmar translation of the carpus. The surgeon should not be concerned with radial height or inclination at this point; however, volar tilt should be established as best as possible. A rolled towel is placed dorsal to the metacarpals, holding the wrist in a flexed position as it is placed back onto the radiolucent hand table.
Continue to: A 7 to 8 hole...
A 7 to 8 hole 2.0-mm reconstruction plate (DePuy Synthes) is bent to the shape of the radial boarder of the distal radius. Undercontouring of the plate is necessary to allow for its use as a reduction tool. The plate is then applied to the radial column ensuring that the distal aspect of the plate engages the distal fracture fragment(s) (Figure 2). A single 2.4-mm fully threaded cortical screw in the radial to ulnar direction is then placed bicortically in the proximal fragment in the hole nearest the fracture site. As the screw is tightened, the plate will push the distal fragment(s) due to its undercontoured shape, and in doing so, will restore radial height and inclination (Figure 3). As this screw is being used as a “working screw,” it will be longer than needed after final tightening. A second screw is then placed proximally to prevent rotation of the plate, and the initial screw can be replaced if its length is of concern. If it is the intention of the surgeon to remove the plate prior to wound closure, the second screw is typically not necessary, and there is no indication for exchanging the first screw if it is long.
At this point, final changes to the reduction can still be performed, as the distal fragment(s) has no fixation except for a buttress plate on its radial border. However, the pressure applied by this plate is still typically adequate to maintain a reduction without the use of percutaneous pins or an assistant holding the reduction. Volar fixation is then applied and positioned under both direct visualization and fluoroscopic aid, and cortical and locking screws are inserted as needed (Figure 4). The radial styloid plate can then be removed; however, it is our preference to leave it in place, as we have not seen any postoperative issues that we can attribute to this technique. The PQ is then repaired over the volar locking plate directly to the radial column plate.
At our institution, patients are maintained in a plaster volar-based wrist splint for a period of 2 weeks postoperatively. After splint and suture removal, active and passive ROM exercises of the wrist and hand are initiated, and a custom thermoplast volar wrist splint is manufactured. This splint is to be worn at all times except during physical therapy. At the 6-week postoperative visit, all restrictions are lifted, assuming there are no complications or unexpected issues. Patients are then seen for follow-up at 3 and 6 months postoperatively. Continued follow-up is indicated if patients are following an abnormal clinical or radiographic course.
MATERIALS AND METHODS
After Institutional Review Board approval was obtained, a clinical outcomes registry was queried to identify all patients treated operatively by the senior author (DGL) for a distal radius fracture at our Level 1 trauma center between August 2002 and December 2013. Adult (age >18 years) patients with isolated distal radius fractures treated with a radial styloid plate were included for initial review (N = 261). Patients for whom 6-month clinical or radiographic outcomes were unknown were then excluded (n = 225).
Patient demographics were recorded from the existing database along with visual analog scale, Quick Disabilities of the Arm, Shoulder and Hand (DASH), and short form 36 (SF-36) physical component scores (PCS) and mental component scores (MCS) from the final follow-up visit. Injury and intraoperative and final radiographs were assessed by a single reviewer (MRG) using calibrated radiographs on our institution’s picture archiving and communication system. Radial height, radial inclination, and volar tilt were documented for each time point except for radial height, which was not recorded for intraoperative fluoroscopy images due to lack of calibration. Intra-articular extension was noted on injury films. Wound complications, the presence of a deep or superficial infection, and removal of implants after union were recorded.
Continue to: RESULTS
RESULTS
Thirty-six patients met the inclusion criteria and were therefore included in the study. The average age at the time of surgery was 60.6 years (range, 25-87 years), 27 patients (75%) were female, and 21 (58%) had left-sided injuries. Patient comorbidities can be seen in Table 1. Twenty-six fractures (72.2%) had intra-articular extension. Average follow-up was 15.6 months (range, 6-53.9 months).
Table 1. Comorbidities of Patients Treated with Radial Column Plating
| Total No. of patients | 36 | |
| Diabetes mellitus | 2 | 5.6% |
| Hyperlipidemia | 7 | 19.4% |
| Hypertension | 11 | 30.6% |
| Current smoker | 4 | 11.1% |
| Current alcohol abuse | 1 | 2.8% |
| Peripheral vascular disease | 0 | 0.0% |
| Mean body mass index | 27.0 | Range: 19-34.5 |
Radiographic measurements at the time of injury, surgery, and final follow-up can be seen in Table 2. As previously noted, radial height could not be recorded on intraoperative films due to the use of fluoroscopy, which is not calibrated at our institution. The average changes in radial inclination and volar tilt from the time of surgery (intraoperative fluoroscopy) to final follow-up were 0.46° (range, −4.4°-4.3°) and 0.24° (range, −10.6°-9.6°), respectively. All patients had acceptable radial height, radial inclination, and volar tilt at final follow-up. Clinical outcomes were obtained at a mean of 15.6 months (range, 6-54 months) and were generally good, with a mean DASH score of 20.7 (range, 0-57.5), SF-36 PCS of 45.4 (range, 22.7-68.0), and SF-36 MCS of 50.5 (range, 22.3-64.1) (Table 3). Of the 36 patients with 6-month outcome scores, 13 (36.1%) elected for implant removal after fracture union at a mean of 7.6 months after index surgery (range, 3.2-49.8 months). No infections or wound complications were noted.
Table 2. Radiographic Measurements for Patients Treated with Radial Column Plating
| Mean Measurement | Range | |
| Injury radiographs | ||
| Radial inclination (degrees) | 7.3 | −22.9-22 |
| Radial height (mm) | 3.3 | −14.9-11.5 |
| Volar tilt (degrees) | −10.4 | −49.2-33.9 |
| Intraoperative fluoroscopy | ||
| Radial inclination (degrees) | 21.1 | 13.1-26.6 |
| Volar tilt (degrees) | 6.2 | −3.6-12.2 |
| Final radiographs | ||
| Radial inclination (degrees) | 21.5 | 14.5-29.2 |
| Radial height (mm) | 11.0 | 7.6-14.6 |
| Volar tilt (degrees) | 6.8 | −12.4-18.8 |
DISCUSSION
In this article, we described the use of a radial column plate as a tool to achieve and maintain a reduction during the surgical fixation of an unstable distal radius fracture with a volar locking plate. We have further presented a series of 36 patients treated in this manner and their clinical and radiographic outcomes. This technique permits the maintenance of coronal alignment, thereby limiting the use of percutaneous techniques or the need to manually hold fracture fragments in a reduced position, which may be valuable to the surgeon who is operating without a surgical assistant.
Table 3. Clinical Outcome Scores at Final Follow-Up for Patients Treated with Radial Column Plating
| Outcome Score | Mean Score | Range |
| VAS | 1.4 | 0-7.5 |
| DASH | 20.7 | 0-57.5 |
| PCS | 45.4 | 22.7-68 |
| MCS | 50.5 | 22.3-64.1 |
Abbreviations: DASH, Quick Disabilities of the Arm, Shoulder and Hand; MCS, mental component scores; PCS, physical component scores; VAS, visual analog scale.
In addition to its value as a reduction tool, unlike traditional temporary k-wire fixation, we believe that the utilization of a radial styloid plate allows for increased stability until fracture union is achieved. Biomechanical studies have demonstrated favorable results with the use of a radial column plate. Grindel and colleagues20 evaluated dual radial styloid and volar radius plating vs volar plating alone in their biomechanical comparison of 8 cadaveric matched hand and forearm pairs. Specimens were fixated with a volar locking plate, and a 1-cm wedge osteotomy was created dorsally approximately 2 cm from the articular margin. The distal fragment was then osteotomized longitudinally between the 2 ulnar and 2 radial distal locking screws to create a fracture pattern that mimics a dorsally unstable injury with intra-articular extension. Half of the specimens then underwent radial styloid plating with 2 screws securing the construct proximally, and load-to-failure testing was performed. The authors found that utilization of both the volar and radial styloid plates resulted in 50% increased stiffness and 76% increased force-to-failure as compared with radial styloid plating alone. Similar, although not statistically significant, results were found by Blythe and colleagues.21 In their cadaveric study, dorsal and volar plating with an additional radial column plate resulted in improved stiffness with axial loading compared to volar or dorsal plating alone 21.
Two prior studies have presented outcome data after fixation of distal radius fractures with radial column and volar radius dual plating. Tang and colleagues16 described this technique and presented postoperative outcomes in 8 patients followed for an average of 35 weeks. They reported a 100% union rate, no loss of reduction, and a mean DASH score of 19.9. Jacobi and colleagues17 also described this technique in their 2010 report. In their cohort of 10 patients treated by multiple surgeons, they found a mean of 39° of flexion, 49° of extension, 75° of pronation, and 75° of supination at 24 months postoperatively. Eight patients were rated as “excellent,” 1 as “good,” and 1 as “fair” according to the Gartland and Werley score, with all 10 cases achieving bony union. No cases demonstrated loss of volar tilt, radial length, or radial inclination. In both studies, however, the use of the radial column plate was advocated as a fragment-specific fixation tool and not as a reduction tool.
Continue to: Although 1-year DASH scores...
Although 1-year DASH scores for volar plating alone have been shown in the literature to be consistently within 6 and 13, 3-month and 6-month scores have historically been >18.22-27 Our short-term clinical results (Table 3) are comparable to these historic controls. Further, within our cohort there were no cases of nonunion, postoperative infection, or wound complications, and radiographic measures show maintenance of reduction at final follow-up (Table 2).
We do recognize that 36.1% (13/36) of our cohort had their distal radius implants removed. Although this incidence is high, it stems from the fact that patients who elect for implant removal are more likely to have had an atypical postoperative course and are therefore followed for longer than 6 months. Those who do not elect for removal are typically discharged from care after their 3-month postoperative visit, and were therefore not eligible for inclusion in this study. Overall, a total of 261 patients have been treated with this technique by the senior surgeon. Of those patients, only 28 (10.7%) underwent removal of surgical implants. If the remaining patients had been followed for the full 6 months, it is likely that outcome scores would have been skewed in a more favorable direction.
Surgeons electing to utilize radial styloid plating for displaced distal radius fractures should recognize that the required increased surgical dissection might lead to increased scar formation and postoperative stiffness. A limitation of this study is the lack of quantitative wrist ROM data. Future studies may compare final clinical outcomes and ROM for patients treated with and without radial column fixation.
CONCLUSION
We advocate for the use of a radial column plate as a tool to help achieve and maintain fracture reduction in the setting of an unstable distal radius fracture being treated with ORIF. This technique may be particularly useful when a surgical assistant is not available. Surgeons can expect clinical and radiographic results that are similar to those of volar locked plating alone.
1. Larsen CF, Lauritsen J. Epidemiology of acute wrist trauma. Int J Epidemiol. 1993;22(5):911-916.
2. Chung KC, Spilson SV. The frequency and epidemiology of hand and forearm fractures in the United States. J Hand Surg Am. 2001;26(5):908-915. doi:10.1053/jhsu.2001.26322.
3. Melton LJ 3rd, Amadio PC, Crowson CS, O'Fallon WM. Long-term trends in the incidence of distal forearm fractures. Osteoporos Int. 1998;8(4):341-348.
4. Hagino H, Yamamoto K, Ohshiro H, Nakamura T, Kishimoto H, Nose T. Changing incidence of hip, distal radius, and proximal humerus fractures in Tottori Prefecture, Japan. Bone. 1999;24(3):265-270.
5. Diaz-Garcia RJ, Chung KC. The evolution of distal radius fracture management: A historical treatise. Hand Clin. 2012;28(2):105-111. doi:10.1016/j.hcl.2012.02.007.
6. McQueen M, Caspers J. Colles fracture: Does the anatomical result affect the final function? J Bone Joint Surg Br. 1988;70(4):649-651.
7. Stewart HD, Innes AR, Burke FD. Factors affecting the outcome of Colles' fracture: an anatomical and functional study. Injury. 1985;16(5):289-295.
8. Knight D, Hajducka C, Will E, McQueen M. Locked volar plating for unstable distal radial fractures: Clinical and radiological outcomes. Injury. 2010;41(2):184-189. doi:10.1016/j.injury.2009.08.024.
9. Anakwe R, Khan L, Cook R, McEachan J. Locked volar plating for complex distal radius fractures: patient reported outcomes and satisfaction. J Orthop Surg Res. 2010;5:51. doi:10.1186/1749799X-5-51.
10. Gruber G, Gruber K, Giessauf C, et al. Volar plate fixation of AO type C2 and C3 distal radius fractures, a single-center study of 55 patients. J Orthop Trauma. 2008;22(7):467-472. doi:10.1097/BOT.0b013e318180db09.
11. Koval KJ, Harrast JJ, Anglen JO, Weinstein JN. Fractures of the distal part of the radius. The evolution of practice over time. Where’s the evidence? J Bone Joint Surg Am. 2008;90(9):1855-1861. doi:10.2106/JBJS.G.01569.
12. Foo TL, Gan AW, Soh T, Chew WY. Mechanical failure of the distal radius volar locking plate. J Orthop Surg (Hong Kong). 2013;21(3):332-336. doi:10.11777/230949901302100314.
13. Ward CM, Kuhl TL, Adams BD. Early complications of volar plating of distal radius fractures and their relationship to surgeon experience. Hand (N Y). 2011;6(2):185-189. doi:10.1007/s11552-010-9313-5.
14. Min W, Kaplan K, Miyamoto R, Tejwani NC. A unique failure mechanism of a distal radius fracture fixed with volar plating--a case report. Bull NYU Hosp Jt Dis. 2010;68(4):304-306.
15. Cao J, Ozer K. Failure of volar locking plate fixation of an extraarticular distal radius fracture: A case report. Patient Saf Surg. 2010;4(1):19. doi:10.1186/1754-9493-4-19.
16. Tang P, Ding A, Uzumcugil A. Radial column and volar plating (RCVP) for distal radius fractures with a radial styloid component or severe comminution. Tech Hand Up Extrem Surg. 2010;14(3):143-149. doi:10.1097/BTH.0b013e3181cae14d.
17. Jacobi M, Wahl P, Kohut G. Repositioning and stabilization of the radial styloid process in comminuted fractures of the distal radius using a single approach: The radio-volar double plating technique. J Orthop Surg Res. 2010;5:55. doi:10.1186/1749-799X-5-55.
18. Rikli DA, Regazzoni P. The double plating technique for distal radius fractures. Tech Hand Up Extrem Surg. 2000;4(2):107-114.
19. Rikli DA, Regazzoni P. Fractures of the distal end of the radius treated by internal fixation and early function. A preliminary report of 20 cases. J Bone Joint Surg Br. 1996;78(4):588-592.
20. Grindel SI, Wang M, Gerlach M, McGrady LM, Brown S. Biomechanical comparison of fixed-angle volar plate versus fixed-angle volar plate plus fragment-specific fixation in a cadaveric distal radius fracture model. J Hand Surg Am. 2007;32(2):194-199. doi:10.1016/j.jhsa.2006.12.003.
21. Blythe M, Stoffel K, Jarrett P, Kuster M. Volar versus dorsal locking plates with and without radial styloid locking plates for the fixation of dorsally comminuted distal radius fractures: A biomechanical study in cadavers. J Hand Surg Am. 2006;31(10):1587-1593. doi:10.1016/j.jhsa.2006.09.011.
22. Loveridge J, Ahearn N, Gee C, Pearson D, Sivaloganathan S, Bhatia R. Treatment of distal radial fractures with the DVR-A plate--the early bristol experience. Hand Surg. 2013;18(2):159-167. doi:10.1142/S0218810413500184.
23. Karantana A, Downing ND, Forward DP, et al. Surgical treatment of distal radial fractures with a volar locking plate versus conventional percutaneous methods: a randomized controlled trial. J Bone Joint Surg Am. 2013;95(19):1737-1744. doi:10.2106/JBJS.L.00232.
24. Egol K, Walsh M, Tejwani N, McLaurin T, Wynn C, Paksima N. Bridging external fixation and supplementary kirschner-wire fixation versus volar locked plating for unstable fractures of the distal radius: A randomised, prospective trial. J Bone Joint Surg Br. 2008;90(9):1214-1221. doi:10.1302/0301-620X.90B9.20521.
25. von Recum J, Matschke S, Jupiter JB, et al. Characteristics of two different locking compression plates in the volar fixation of complex articular distal radius fractures. Bone Joint Res. 2012;1(6):111-117. doi:10.1302/2046-3758.16.2000008.
26. Safi A, Hart R, Těknědžjan B, Kozák T. Treatment of extra-articular and simple articular distal radial fractures with intramedullary nail versus volar locking plate. J Hand Surg Eur Vol. 2013;38(7):774-779. doi:10.1177/1753193413478715.
27. Kim JK, Park SD. Outcomes after volar plate fixation of low-grade open and closed distal radius fractures are similar. Clin Orthop Relat Res. 2013;471(6):2030-2035. doi:10.1007/s11999-013-2798-9.
TAKE-HOME POINTS
- Radial column fixation can be used as a reduction tool in unstable distal radius fractures.
- Radial column fixation can help maintain reduction until union in unstable distal radius fractures when combined with volar plating.
- When operating without an assistant, radial column plating can assist in reduction maintenance when other techniques are not successful and holding a reduction manually is not possible.
- Acceptable clinical and radiographic outcomes can be achieved with the use of dual radial styloid and volar plating for unstable distal radius fractures.
- The effects of increased dissection during radial column fixation in distal radius fractures with regard to scar formation and wrist ROM is currently not known.

Implant Survivorship and Complication Rates After Total Knee Arthroplasty With a Third-Generation Cemented System: 15-Year Follow-Up
ABSTRACT
This work is a retrospective cohort study evaluating patients who had undergone third-generation cemented total knee arthroplasty (TKA) with prostheses (NexGen, Zimmer Biomet) utilizing posterior-stabilized (PS) and cruciate-retaining (CR) designs at a single center at their 15-year follow-up.
The purpose of this study is to determine the functional knee scores, reoperations, and long-term survivorship for patients with the NexGen Zimmer Biomet Knee system at the 15-year follow-up. In total, 99 patients who had undergone primary TKA were followed for 15 years.
At the 15-year follow-up, survivorship in both study groups was similar: 98% for PS TKAs and 100% for CR TKAs. The 2 groups also showed similar functionality: 80% of the PS implants and 89% of the CR implants were associated with no or mild pain (P = .40). Reoperation rates were 2% for the PS group and 0% for the CR group (P = .38). No differences in any of the outcomes analyzed were observed between patients who had CR TKA and those who had undergone PS TKA.
Our study found no significant differences in functional outcomes between PS and CR NexGen knee implants. Patients treated by both methods showed excellent longevity and survivorship at the 15-year follow-up.
Continue to: Total knee arthroplasty...
Total knee arthroplasty (TKA) is an orthopedic procedure with increasing demand.1 Over the past 2 decades, a surge in TKA implants has been observed. Of the available prosthetic designs, only a few implants with long-term follow-up have been reported.2-9 The NexGen TKA system (Zimmer Biomet) has been shown to have excellent clinical and radiographic results at an intermediate follow-up term of 8 years.10 This system is a third-generation prosthetic design that was developed to improve problems seen with its predecessors, such as the Miller-Galante II system (Zimmer Biomet), the Insall-Burstein II system (Zimmer Biomet), and the Constrained Condylar Knee (Zimmer Biomet), which were mainly for patellar maltracking.11-17 The NexGen TKA system is a fixed-bearing system designed to include an anatomic femoral trochlea with the option of cruciate-retaining (CR), posterior-stabilized (PS), or more constrained implants. This study evaluates the long-term success of the CR and PS NexGen TKA systems. Outcomes measured include functional knee scores and reoperation rates at the 15-year follow-up. Based on the measured outcomes, potential differences between the PS and CR implants from this system are cited.
MATERIAL AND METHODS
Between July 1995 and July 1997, 334 consecutive primary TKAs were performed on 287 patients at our institution. In total, 167 patients (186 knees) underwent posterior CR TKAs with the NexGen CR prosthesis (Zimmer Biomet), and 120 patients (148 knees) underwent PS TKAs using the NexGen Legacy PS prosthesis (Zimmer Biomet). This retrospective double cohort study was reviewed and approved by our Institutional Review Board. At the 15-year postoperative follow-up, 99 patients were available (Figure 1).
, total deceased (7 pateints; 7 knees), and total lost to follow-up (30 patients, 35 knees)")
The CR and PS implants were used with similar frequencies by the surgeons who performed the procedures. Patients were not randomized into either the PS- or CR-implant teams; the final decision on implant selection was left to the operating surgeon’s discretion. However, in addition to standard indications for TKA (pain and disability associated with severe arthritic change seen on radiographs and refractory to conservative measures), absolute contraindications to the CR implant included severe combined deformity (flexion contraction >30° combined with a varus or valgus deformity >20°) or posterior cruciate ligament insufficiency (often associated with inflammatory arthritis).
The surgical technique for the CR and PS designs was identical, and included a median parapatellar approach, femoral rotational alignment perpendicular to the transepicondylar axis, measured resection of the flexion and extension gaps, intramedullary femoral alignment, and extramedullary tibial alignment. All components were cemented, and the patella of each patient was resurfaced. All patients received preoperative antibiotics that were continued for 48 hours postoperatively, and 4 weeks of anticoagulation with dose-adjusted warfarin to maintain an international normalized ratio of 1.5 to 2.0.
Patients were observed postoperatively at the 5- to 8-year and 15-year time points. The 5-year data were previously published in 2005 by Bozic and colleagues.10 Patients available for follow-up at the 15-year time-point were evaluated using the 100-point Hospital for Special Surgery (HSS) knee scoring system, which assigns up to 30 points for pain, 22 points for function, 18 points for range of motion, and 10 points each for quadricep strength, deformity, and instability. In addition, common medical conditions limiting patient activity were assessed; these included joint replacement; arthritis in another joint, the back, or spine; weakness or fatigue; breathing or heart ailments; and others.
Continue to: At the 15-year follow-up...
At the 15-year follow-up, patients were contacted via telephone to obtain their HSS knee scores. If patients were unavailable/unable to answer the questions asked, knee score information was collected from a first-degree relative or caretaker. Patients that could not be contacted by phone were sent a HSS knee score survey to their last known address. The online Social Security Death Index was queried for confirmation of death. If deceased, a first-degree relative was contacted for confirmation.
Survivorship was evaluated using revision for any reason and revision for aseptic loosening as separate endpoints via the Kaplan-Meier product-limit method, and the CR and PS TKA groups were compared using the log-rank test. The power of the study for detecting differences between the TKA groups was determined to be 80%, based on a moderate hazard ratio of 1.5, using the log-rank test. Differences between PS and CR TKAs were assessed using the Pearson chi-square test for knee pain and functional outcomes, Fisher’s exact test for patient limitations, such as joint replacement, and the non-parametric Mann Whitney U-test for median pain scores (Table 1). Spearman correlations between the patients’ self-reported knee scores (as a percentage of normal) and physician-based knee scores were performed to assess whether self-reported knee scores were significantly correlated with physician-based knee scores. Kaplan-Meier analysis was performed to evaluate time-related freedom from reoperation at 95% confidence intervals. Statistical analysis was conducted using IBM SPSS Statistics (version 21.0, IBM). Two-tailed P < .05 was considered statistically significant.

RESULTS
Of the 287 patients (334 knees) who had primary TKAs, 99 patients (121 knees; 75 CR and 46 PS) were available at the 15-year follow-up. A total of 155 patients (171 knees) died before the 15-year follow-up, and 33 (42 knees) were lost to follow-up (Figure 1). The functional status of the knees of patients who were lost to follow-up or who had died since the previous follow-up data were published is unknown.
Demographic and outcome data for the cohort of 121 TKAs (99 patients) are summarized in Table 2. The median age at surgery was 64 years, and 71% of the cohort was female.

At the 15-year follow-up, survivorship in both groups was similar: 98% for PS TKAs and 100% for CR TKAs. The 2 groups were also similar functionally: 80% of the PS implants and 89% of the CR implants were associated with no or mild pain (P = .40). Approximately half of the patients in both groups (52% PS; 50% CR; P = .88) required walking support (canes or walkers) and nearly half of both groups (46% PS; 48% CR; P = .62) could walk <5 blocks or only short distances in their homes. In addition, 46% of the patients in both groups reported needing arm assistance to functionally rise from a chair (P = .43); 91% of the patients in both groups could also walk up and down stairs (P = .77). No statistical difference in the medical conditions limiting the patients in the 2 groups was found: joint replacement (2% PS; 6% CR; P = .71), arthritis in another joint (43% PS; 45% CR; P = .84), back or spine arthritis (31% PS; 33% CR; P = 1.00), weakness or fatigue (24% PS; 25% CR; P = 1.00), breathing or heart ailments (11% PS; 20% CR; P = .40), and other reasons (27% PS; 25% CR; P = 1.00). In addition, median self-reported knee scores were 95 and 93 points for the PS and CR groups, respectively (P = .55).
Continue to: Patients reported 2 complications...
Patients reported 2 complications since the previous 5- to 8-year follow-up, 1 in each group. The first case underwent a PS TKA that required open reduction internal fixation for a bilateral supracondylar peri-prosthesis femur fracture following a fall, which was subsequently complicated with infection and ultimately led to above-the-knee amputation. In the second case, a CR TKA patient experienced persistent swelling and knee instability. The patient followed up with a local orthopaedist, but to date, no reoperations on the knee have been reported.
Spearman correlations between the patients’ self-reported knee scores (as a percentage of normal) and physician-based knee scores were moderately correlated with physician-based knee scores (rs = 0.42; P < .001).
Reoperation rates were 2% for PS and 0% for CR (P = .38). Kaplan-Meier analysis was performed to evaluate time-related freedom from reoperation and no significance difference between the PS and CR groups was revealed (log-rank test = 1.40, P = .24, Figure 2).

DISCUSSION
The success of TKA in pain relief and restoration of function has led to increased demands for this surgery.1 Such demand has enabled the introduction of a new joint replacement prosthesis to the market.18 Considering the increased incidence of osteoarthritis in the younger population (<55 years of age), critically reviewing the longevity and durability of TKA implant designs is of great importance. Compared with other TKA implant designs, the NexGen Zimmer Biomet Knee system has shown excellent longevity at the 15-year follow-up.5,6,9,11-15 Our study began with 136 patients, and, after eliminating the deceased, those lost to follow-up, and non-responders, a total of 99 patients were available for the 15-year follow-up. At this time-point, 80% of the PS implants and 89% of the CR implants were associated with no or mild pain. Survivorship at the 15-year follow-up was similar in both groups: 98% for PS TKAs and 100% for CR TKAs. The reoperation rate was low in both groups, and no evidence of aseptic loosening was found. Based on our results, the NexGen Zimmer Biomet Knee system can be concluded to show excellent longevity and functional outcomes at the 15-year follow-up.
Our study includes several limiting factors that were taken into consideration during the analysis of the results. One of the main limitations of this work is that it required a 15-year follow-up of predominantly elderly patients; many of the participants may be expected to be deceased at this time-point. In our study, a total of 7 patients were confirmed to be deceased by a first-degree relative or the Social Security Death Index. In addition, unlike Bozic and colleagues’10 previous 5-year follow-up study, radiographic imaging data were not collected at the 15-year follow-up. However, given that this study aimed to assess the functional knee scores and reoperation rates of the PS and CR NexGen Zimmer Biomet Knee system, radiographic information did not appear to be necessary.
CONCLUSION
This study found no significant differences in functional outcomes between the PS and CR NexGen knee implants. Patients who received these implants showed excellent longevity and survivorship at their 15-year follow-up.
1. Lützner J, Hübel U, Kirschner S, Günther KP, Krummenauer F. Langzeitergebnisse in der Knieendoprothetik. Chirurg. 2011;82(7):618-624. doi:10.1007/s00104-010-2001-8.
2. Font-Rodriguez DE, Scuderi GR, Insall J. Survivorship of cemented total knee arthroplasty. Clin Orthop Relat Res. 1997;345:79-86.
3. Rodriguez JA, Bhende H, Ranawat CS. Total condylar knee replacement: a 20-year followup study. Clin Orthop Relat Res. 2001;388:10-17.
4. Van Loon CJM, Wisse MA, de Waal Malefijt MC, Jansen RH, Veth RPH. The kinematic total knee arthroplasty. Arch Orth Traum Surg. 2000;120(1-2):48-52. doi:10.1007/PL00021215.
5. Buechel FFS. Long-term followup after mobile-bearing total knee replacement. Clin Orthop Relat Res. 2002;404:40-50.
6. Ito J, Koshino T, Okamoto R, Saito T. 15-year follow-up study of total knee arthroplasty in patients with rheumatoid arthritis. J Arthroplasty. 2003;18(8):984-992. doi:10.1016/S0883-5403(03)00262-6.
7. Dixon MC, Brown RR, Parsch D, Scott RD. Modular fixed-bearing total knee arthroplasty with retention of the posterior cruciate ligament. J Bone Joint Surg. 2005;87(3):598-603. doi:10.2106/JBJS.C.00591.
8. Duffy GP, Crowder AR, Trousdale RR, Berry DJ. Cemented total knee arthroplasty using a modern prosthesis in young patients with osteoarthritis. J Arthroplasty. 2007;22(6 Suppl 2):67-70. doi:10.1016/j.arth.2007.05.001.
9. Baker PN, Khaw FM, Kirk LMG, Esler CNA, Gregg PJ. A randomised controlled trial of cemented versus cementless press-fit condylar total knee replacement: 15-year survival analysis. J Bone Joint Surg. 2007;89-B(12):1608-1614. doi:10.1302/0301-620x.89b12.19363.
10. Bozic KJ, Kinder J, Menegini M, Zurakowski D, Rosenberg AG, Galante JO. Implant survivorship and complication rates after total knee arthroplasty with a third-generation cemented system: 5 to 8 years followup. Clin Orthop Relat Res. 2005;430:117-124. doi:10.1097/01.blo.0000146539.23869.14.
11. Effenberger H, Berka J, Hilzensauer G, Ramsauer T, Dorn U, Kißlinger E. Miller-Galante total knee arthroplasty: the importance of material and design on the revision rate. Int Orthop. 2001;25(6):378-381. doi:10.1007/s002640100294.
12. Kirk PG, Rorabeck CH, Bourne RB. Clinical comparison of the Miller Galante I and AMK total knee systems. J Arthroplasty. 1994;9(2):131-136. doi:10.1016/0883-5403(94)90061-2.
13. Kobori M, Kamisato S, Yoshida M, Kobori K. Revision of failed metal-backed patellar component of Miller/Galante-I total knee prosthesis. J Orthop Sci. 2000;5(5):436-438. doi:10.1007/s007760070020.
14. Larson CM, Lachiewicz PF. Patellofemoral complications with the insall-burstein II posterior-stabilized total knee arthroplasty. J Arthroplasty. 1999;14(3):288-292. doi:http://dx.doi.org/10.1016/S0883-5403(99)90053-0.
15. Matsuda S, Miura H, Nagamine R, Urabe K, Hirata G, Iwamoto Y. Effect of femoral and tibial component position on patellar tracking following total knee arthroplasty: 10-year follow-up of Miller-Galante I knees. Am J Knee Surg. 2001;14(3):152-156.
16. Miyagi T, Matsuda S, Miura H, Nagamine R, Urabe K. Changes in patellar tracking after total knee arthroplasty: 10-year follow-up of Miller-Balante I knees. Orthopedics. 2002;25(8):811-813. doi:10.3928/0147-7447-20020801-10.
17. Rao AR, Engh GA, Collier MB, Lounici S. Tibial interface wear in retrieved total knee components and correlations with modular insert motion. J Bone Joint Surg. 2002;84(10):1849-1855.
18. Anand R, Graves SE, de Steiger RN, et al. What is the benefit of introducing new hip and knee prostheses? J Bone Joint Surg. 2011;93(3):51-54. doi:10.2106/JBJS.K.00867.
ABSTRACT
This work is a retrospective cohort study evaluating patients who had undergone third-generation cemented total knee arthroplasty (TKA) with prostheses (NexGen, Zimmer Biomet) utilizing posterior-stabilized (PS) and cruciate-retaining (CR) designs at a single center at their 15-year follow-up.
The purpose of this study is to determine the functional knee scores, reoperations, and long-term survivorship for patients with the NexGen Zimmer Biomet Knee system at the 15-year follow-up. In total, 99 patients who had undergone primary TKA were followed for 15 years.
At the 15-year follow-up, survivorship in both study groups was similar: 98% for PS TKAs and 100% for CR TKAs. The 2 groups also showed similar functionality: 80% of the PS implants and 89% of the CR implants were associated with no or mild pain (P = .40). Reoperation rates were 2% for the PS group and 0% for the CR group (P = .38). No differences in any of the outcomes analyzed were observed between patients who had CR TKA and those who had undergone PS TKA.
Our study found no significant differences in functional outcomes between PS and CR NexGen knee implants. Patients treated by both methods showed excellent longevity and survivorship at the 15-year follow-up.
Continue to: Total knee arthroplasty...
Total knee arthroplasty (TKA) is an orthopedic procedure with increasing demand.1 Over the past 2 decades, a surge in TKA implants has been observed. Of the available prosthetic designs, only a few implants with long-term follow-up have been reported.2-9 The NexGen TKA system (Zimmer Biomet) has been shown to have excellent clinical and radiographic results at an intermediate follow-up term of 8 years.10 This system is a third-generation prosthetic design that was developed to improve problems seen with its predecessors, such as the Miller-Galante II system (Zimmer Biomet), the Insall-Burstein II system (Zimmer Biomet), and the Constrained Condylar Knee (Zimmer Biomet), which were mainly for patellar maltracking.11-17 The NexGen TKA system is a fixed-bearing system designed to include an anatomic femoral trochlea with the option of cruciate-retaining (CR), posterior-stabilized (PS), or more constrained implants. This study evaluates the long-term success of the CR and PS NexGen TKA systems. Outcomes measured include functional knee scores and reoperation rates at the 15-year follow-up. Based on the measured outcomes, potential differences between the PS and CR implants from this system are cited.
MATERIAL AND METHODS
Between July 1995 and July 1997, 334 consecutive primary TKAs were performed on 287 patients at our institution. In total, 167 patients (186 knees) underwent posterior CR TKAs with the NexGen CR prosthesis (Zimmer Biomet), and 120 patients (148 knees) underwent PS TKAs using the NexGen Legacy PS prosthesis (Zimmer Biomet). This retrospective double cohort study was reviewed and approved by our Institutional Review Board. At the 15-year postoperative follow-up, 99 patients were available (Figure 1).
The CR and PS implants were used with similar frequencies by the surgeons who performed the procedures. Patients were not randomized into either the PS- or CR-implant teams; the final decision on implant selection was left to the operating surgeon’s discretion. However, in addition to standard indications for TKA (pain and disability associated with severe arthritic change seen on radiographs and refractory to conservative measures), absolute contraindications to the CR implant included severe combined deformity (flexion contraction >30° combined with a varus or valgus deformity >20°) or posterior cruciate ligament insufficiency (often associated with inflammatory arthritis).
The surgical technique for the CR and PS designs was identical, and included a median parapatellar approach, femoral rotational alignment perpendicular to the transepicondylar axis, measured resection of the flexion and extension gaps, intramedullary femoral alignment, and extramedullary tibial alignment. All components were cemented, and the patella of each patient was resurfaced. All patients received preoperative antibiotics that were continued for 48 hours postoperatively, and 4 weeks of anticoagulation with dose-adjusted warfarin to maintain an international normalized ratio of 1.5 to 2.0.
Patients were observed postoperatively at the 5- to 8-year and 15-year time points. The 5-year data were previously published in 2005 by Bozic and colleagues.10 Patients available for follow-up at the 15-year time-point were evaluated using the 100-point Hospital for Special Surgery (HSS) knee scoring system, which assigns up to 30 points for pain, 22 points for function, 18 points for range of motion, and 10 points each for quadricep strength, deformity, and instability. In addition, common medical conditions limiting patient activity were assessed; these included joint replacement; arthritis in another joint, the back, or spine; weakness or fatigue; breathing or heart ailments; and others.
Continue to: At the 15-year follow-up...
At the 15-year follow-up, patients were contacted via telephone to obtain their HSS knee scores. If patients were unavailable/unable to answer the questions asked, knee score information was collected from a first-degree relative or caretaker. Patients that could not be contacted by phone were sent a HSS knee score survey to their last known address. The online Social Security Death Index was queried for confirmation of death. If deceased, a first-degree relative was contacted for confirmation.
Survivorship was evaluated using revision for any reason and revision for aseptic loosening as separate endpoints via the Kaplan-Meier product-limit method, and the CR and PS TKA groups were compared using the log-rank test. The power of the study for detecting differences between the TKA groups was determined to be 80%, based on a moderate hazard ratio of 1.5, using the log-rank test. Differences between PS and CR TKAs were assessed using the Pearson chi-square test for knee pain and functional outcomes, Fisher’s exact test for patient limitations, such as joint replacement, and the non-parametric Mann Whitney U-test for median pain scores (Table 1). Spearman correlations between the patients’ self-reported knee scores (as a percentage of normal) and physician-based knee scores were performed to assess whether self-reported knee scores were significantly correlated with physician-based knee scores. Kaplan-Meier analysis was performed to evaluate time-related freedom from reoperation at 95% confidence intervals. Statistical analysis was conducted using IBM SPSS Statistics (version 21.0, IBM). Two-tailed P < .05 was considered statistically significant.
RESULTS
Of the 287 patients (334 knees) who had primary TKAs, 99 patients (121 knees; 75 CR and 46 PS) were available at the 15-year follow-up. A total of 155 patients (171 knees) died before the 15-year follow-up, and 33 (42 knees) were lost to follow-up (Figure 1). The functional status of the knees of patients who were lost to follow-up or who had died since the previous follow-up data were published is unknown.
Demographic and outcome data for the cohort of 121 TKAs (99 patients) are summarized in Table 2. The median age at surgery was 64 years, and 71% of the cohort was female.
At the 15-year follow-up, survivorship in both groups was similar: 98% for PS TKAs and 100% for CR TKAs. The 2 groups were also similar functionally: 80% of the PS implants and 89% of the CR implants were associated with no or mild pain (P = .40). Approximately half of the patients in both groups (52% PS; 50% CR; P = .88) required walking support (canes or walkers) and nearly half of both groups (46% PS; 48% CR; P = .62) could walk <5 blocks or only short distances in their homes. In addition, 46% of the patients in both groups reported needing arm assistance to functionally rise from a chair (P = .43); 91% of the patients in both groups could also walk up and down stairs (P = .77). No statistical difference in the medical conditions limiting the patients in the 2 groups was found: joint replacement (2% PS; 6% CR; P = .71), arthritis in another joint (43% PS; 45% CR; P = .84), back or spine arthritis (31% PS; 33% CR; P = 1.00), weakness or fatigue (24% PS; 25% CR; P = 1.00), breathing or heart ailments (11% PS; 20% CR; P = .40), and other reasons (27% PS; 25% CR; P = 1.00). In addition, median self-reported knee scores were 95 and 93 points for the PS and CR groups, respectively (P = .55).
Continue to: Patients reported 2 complications...
Patients reported 2 complications since the previous 5- to 8-year follow-up, 1 in each group. The first case underwent a PS TKA that required open reduction internal fixation for a bilateral supracondylar peri-prosthesis femur fracture following a fall, which was subsequently complicated with infection and ultimately led to above-the-knee amputation. In the second case, a CR TKA patient experienced persistent swelling and knee instability. The patient followed up with a local orthopaedist, but to date, no reoperations on the knee have been reported.
Spearman correlations between the patients’ self-reported knee scores (as a percentage of normal) and physician-based knee scores were moderately correlated with physician-based knee scores (rs = 0.42; P < .001).
Reoperation rates were 2% for PS and 0% for CR (P = .38). Kaplan-Meier analysis was performed to evaluate time-related freedom from reoperation and no significance difference between the PS and CR groups was revealed (log-rank test = 1.40, P = .24, Figure 2).
DISCUSSION
The success of TKA in pain relief and restoration of function has led to increased demands for this surgery.1 Such demand has enabled the introduction of a new joint replacement prosthesis to the market.18 Considering the increased incidence of osteoarthritis in the younger population (<55 years of age), critically reviewing the longevity and durability of TKA implant designs is of great importance. Compared with other TKA implant designs, the NexGen Zimmer Biomet Knee system has shown excellent longevity at the 15-year follow-up.5,6,9,11-15 Our study began with 136 patients, and, after eliminating the deceased, those lost to follow-up, and non-responders, a total of 99 patients were available for the 15-year follow-up. At this time-point, 80% of the PS implants and 89% of the CR implants were associated with no or mild pain. Survivorship at the 15-year follow-up was similar in both groups: 98% for PS TKAs and 100% for CR TKAs. The reoperation rate was low in both groups, and no evidence of aseptic loosening was found. Based on our results, the NexGen Zimmer Biomet Knee system can be concluded to show excellent longevity and functional outcomes at the 15-year follow-up.
Our study includes several limiting factors that were taken into consideration during the analysis of the results. One of the main limitations of this work is that it required a 15-year follow-up of predominantly elderly patients; many of the participants may be expected to be deceased at this time-point. In our study, a total of 7 patients were confirmed to be deceased by a first-degree relative or the Social Security Death Index. In addition, unlike Bozic and colleagues’10 previous 5-year follow-up study, radiographic imaging data were not collected at the 15-year follow-up. However, given that this study aimed to assess the functional knee scores and reoperation rates of the PS and CR NexGen Zimmer Biomet Knee system, radiographic information did not appear to be necessary.
CONCLUSION
This study found no significant differences in functional outcomes between the PS and CR NexGen knee implants. Patients who received these implants showed excellent longevity and survivorship at their 15-year follow-up.
1. Lützner J, Hübel U, Kirschner S, Günther KP, Krummenauer F. Langzeitergebnisse in der Knieendoprothetik. Chirurg. 2011;82(7):618-624. doi:10.1007/s00104-010-2001-8.
2. Font-Rodriguez DE, Scuderi GR, Insall J. Survivorship of cemented total knee arthroplasty. Clin Orthop Relat Res. 1997;345:79-86.
3. Rodriguez JA, Bhende H, Ranawat CS. Total condylar knee replacement: a 20-year followup study. Clin Orthop Relat Res. 2001;388:10-17.
4. Van Loon CJM, Wisse MA, de Waal Malefijt MC, Jansen RH, Veth RPH. The kinematic total knee arthroplasty. Arch Orth Traum Surg. 2000;120(1-2):48-52. doi:10.1007/PL00021215.
5. Buechel FFS. Long-term followup after mobile-bearing total knee replacement. Clin Orthop Relat Res. 2002;404:40-50.
6. Ito J, Koshino T, Okamoto R, Saito T. 15-year follow-up study of total knee arthroplasty in patients with rheumatoid arthritis. J Arthroplasty. 2003;18(8):984-992. doi:10.1016/S0883-5403(03)00262-6.
7. Dixon MC, Brown RR, Parsch D, Scott RD. Modular fixed-bearing total knee arthroplasty with retention of the posterior cruciate ligament. J Bone Joint Surg. 2005;87(3):598-603. doi:10.2106/JBJS.C.00591.
8. Duffy GP, Crowder AR, Trousdale RR, Berry DJ. Cemented total knee arthroplasty using a modern prosthesis in young patients with osteoarthritis. J Arthroplasty. 2007;22(6 Suppl 2):67-70. doi:10.1016/j.arth.2007.05.001.
9. Baker PN, Khaw FM, Kirk LMG, Esler CNA, Gregg PJ. A randomised controlled trial of cemented versus cementless press-fit condylar total knee replacement: 15-year survival analysis. J Bone Joint Surg. 2007;89-B(12):1608-1614. doi:10.1302/0301-620x.89b12.19363.
10. Bozic KJ, Kinder J, Menegini M, Zurakowski D, Rosenberg AG, Galante JO. Implant survivorship and complication rates after total knee arthroplasty with a third-generation cemented system: 5 to 8 years followup. Clin Orthop Relat Res. 2005;430:117-124. doi:10.1097/01.blo.0000146539.23869.14.
11. Effenberger H, Berka J, Hilzensauer G, Ramsauer T, Dorn U, Kißlinger E. Miller-Galante total knee arthroplasty: the importance of material and design on the revision rate. Int Orthop. 2001;25(6):378-381. doi:10.1007/s002640100294.
12. Kirk PG, Rorabeck CH, Bourne RB. Clinical comparison of the Miller Galante I and AMK total knee systems. J Arthroplasty. 1994;9(2):131-136. doi:10.1016/0883-5403(94)90061-2.
13. Kobori M, Kamisato S, Yoshida M, Kobori K. Revision of failed metal-backed patellar component of Miller/Galante-I total knee prosthesis. J Orthop Sci. 2000;5(5):436-438. doi:10.1007/s007760070020.
14. Larson CM, Lachiewicz PF. Patellofemoral complications with the insall-burstein II posterior-stabilized total knee arthroplasty. J Arthroplasty. 1999;14(3):288-292. doi:http://dx.doi.org/10.1016/S0883-5403(99)90053-0.
15. Matsuda S, Miura H, Nagamine R, Urabe K, Hirata G, Iwamoto Y. Effect of femoral and tibial component position on patellar tracking following total knee arthroplasty: 10-year follow-up of Miller-Galante I knees. Am J Knee Surg. 2001;14(3):152-156.
16. Miyagi T, Matsuda S, Miura H, Nagamine R, Urabe K. Changes in patellar tracking after total knee arthroplasty: 10-year follow-up of Miller-Balante I knees. Orthopedics. 2002;25(8):811-813. doi:10.3928/0147-7447-20020801-10.
17. Rao AR, Engh GA, Collier MB, Lounici S. Tibial interface wear in retrieved total knee components and correlations with modular insert motion. J Bone Joint Surg. 2002;84(10):1849-1855.
18. Anand R, Graves SE, de Steiger RN, et al. What is the benefit of introducing new hip and knee prostheses? J Bone Joint Surg. 2011;93(3):51-54. doi:10.2106/JBJS.K.00867.
TAKE-HOME POINTS
- TKA has a high success rate in pain relief and restoration of function in patients with severe osteoarthritis.
- NexGen (Zimmer Biomet) knee implants showed excellent functional outcomes at 15 years.
- There are no significant differences in functional outcomes between the PS and CR knee systems.
- NexGen knee implants showed excellent longevity and survivorship at 15-year follow-up with no evidence of aseptic loosening.
- There is an increased incidence of knee osteoarthritis in the younger population (<55 years of age).

Focusing on Inattention: The Diagnostic Accuracy of Brief Measures of Inattention for Detecting Delirium
Delirium is an acute neurocognitive disorder1 that affects up to 25% of older emergency department (ED) and hospitalized patients.2-4 The relationship between delirium and adverse outcomes is well documented.5-7 Delirium is a strong predictor of increased length of mechanical ventilation, longer intensive care unit and hospital stays, increased risk of falls, long-term cognitive impairment, and mortality.8-13 Delirium is frequently missed by healthcare professionals2,14-16 and goes undetected in up to 3 out of 4 patients by bedside nurses and medical practitioners in many hospital settings.14,17-22 A significant barrier to recognizing delirium is the absence of brief delirium assessments.
In an effort to improve delirium recognition in the acute care setting, there has been a concerted effort to develop and validate brief delirium assessments. To address this unmet need, 4 ‘A’s Test (4AT), the Brief Confusion Assessment Method (bCAM), and the 3-minute diagnostic assessment for CAM-defined delirium (3D-CAM) are 1- to 3-minute delirium assessments that were validated in acutely ill older patients.23 However, 1 to 3 minutes may still be too long in busy clinical environments, and briefer (<30 seconds) delirium assessments may be needed.
One potential more-rapid method to screen for delirium is to specifically test for the presence of inattention, which is a cardinal feature of delirium.24,25 Inattention can be ascertained by having the patient recite the months backwards, recite the days of the week backwards, or spell a word backwards.26 Recent studies have evaluated the diagnostic accuracy of reciting the months of the year backwards for delirium. O’Regan et al.27 evaluated the diagnostic accuracy of the month of the year backwards from December to July (MOTYB-6) and observed that this task was 84% sensitive and 90% specific for delirium in older patients. However, they performed the reference standard delirium assessments in patients who had a positive MOTYB-6, which can overestimate sensitivity and underestimate specificity (verification bias).28 Fick et al.29 examined the diagnostic accuracy of 20 individual elements of the 3D-CAM and observed that reciting the months of the year backwards from December to January (MOTYB-12) was 83% sensitive and 69% specific for delirium. However, this was an exploratory study that was designed to identify an element of the 3D-CAM that had the best diagnostic accuracy.
To address these limitations, we sought to evaluate the diagnostic performance of the MOTYB-6 and MOTYB-12 for delirium as diagnosed by a reference standard. We also explored other brief tests of inattention such as spelling a word (“LUNCH”) backwards, reciting the days of the week backwards, 10-letter vigilance “A” task, and 5 picture recognition task.
METHODS
Study Design and Setting
This was a preplanned secondary analysis of a prospective observational study that validated 3 delirium assessments.30,31 This study was conducted at a tertiary care, academic ED. The local institutional review board (IRB) reviewed and approved this study. Informed consent from the patient or an authorized surrogate was obtained whenever possible. Because this was an observational study and posed minimal risk to the patient, the IRB granted a waiver of consent for patients who were both unable to provide consent and were without an authorized surrogate available in the ED or by phone.
Selection of Participants
We enrolled a convenience sample of patients between June 2010 and February 2012 Monday through Friday from 8
Research assistants approached patients who met inclusion criteria and determined if any exclusion criteria were present. If none of the exclusion criteria were present, then the research assistant reviewed the informed consent document with the patient or authorized surrogate if the patient was not capable of providing consent. If a patient was not capable of providing consent and no authorized surrogate was available, then the patient was enrolled (under the waiver of consent) as long as the patient assented to be a part of the study. Once the patient was enrolled, the research assistant contacted the physician rater and reference standard psychiatrists to approach the patient.
Measures of Inattention
An emergency physician (JHH) who had no formal training in the mental status assessment of elders administered a cognitive battery to the patient, including tests of inattention. The following inattention tasks were administered:
- Spell the word “LUNCH” backwards.30 Patients were initially allowed to spell the word “LUNCH” forwards. Patients who were unable to perform the task were assigned 5 errors.
- Recite the months of the year backwards from December to July.23,26,27,30,32 Patients who were unable to perform the task were assigned 6 errors.
- Recite the days of the week backwards.23,26,33 Patients who were unable to perform the task were assigned 7 errors.
- Ten-letter vigilance “A” task.34 The patient was given a series of 10 letters (“S-A-V-E-A-H-A-A-R-T”) every 3 seconds and was asked to squeeze the rater’s hand every time the patient heard the letter “A.” Patients who were unable to perform the task were assigned 10 errors.
- Five picture recognition task.34 Patients were shown 5 objects on picture cards. Afterwards, patients were shown 10 pictures with the previously shown objects intermingled. The patient had to identify which objects were seen previously in the first 5 pictures. Patients who were unable to perform the task were assigned 10 errors.
- Recite the months of the year backwards from December to January.29 Patients who were unable to perform the task were assigned 12 errors.
Reference Standard for Delirium
A comprehensive consultation-liaison psychiatrist assessment was the reference standard for delirium; the diagnosis of delirium was based on Diagnostic and Statistical Manual of Mental Disorders, Fourth Edition, Text Revision (DSM-IV-TR) criteria.35 Three psychiatrists who each had an average of 11 years of clinical experience and regularly diagnosed delirium as part of their daily clinical practice were available to perform these assessments. To arrive at the diagnosis of delirium, they interviewed those who best understood the patient’s mental status (eg, the patient’s family members or caregivers, physician, and nurses). They also reviewed the patient’s medical record and radiology and laboratory test results. They performed bedside cognitive testing that included, but was not limited to, the Mini-Mental State Examination, Clock Drawing Test, Luria hand sequencing task, and tests for verbal fluency. A focused neurological examination was also performed (ie, screening for paraphasic errors, tremors, tone, asterixis, frontal release signs, etc.), and they also evaluated the patient for affective lability, hallucinations, and level of alertness. If the presence of delirium was still questionable, then confrontational naming, proverb interpretation or similarities, and assessments for apraxias were performed at the discretion of the psychiatrist. The psychiatrists were blinded to the physician’s assessments, and the assessments were conducted within 3 hours of each other.
Additional Variables Collected
Using medical record review, comorbidity burden, severity of illness, and premorbid cognition were ascertained. The Charlson Comorbidity Index, a weighted index that takes into account the number and seriousness of 19 preexisting comorbid conditions, was used to quantify comorbidity burden; higher scores indicate higher comorbid burden.36,37 The Acute Physiology Score of the Acute Physiology and Chronic Health Evaluation II was used to quantify severity of illness.38 This score is based upon the initial values of 12 routine physiologic measurements such as vital sign and laboratory abnormalities; higher scores represent higher severities of illness.38 The medical record was reviewed to ascertain the presence of premorbid cognitive impairment; any documentation of dementia in the patient’s clinical problem list or physician history and physical examination from the outpatient or inpatient settings was considered positive. The medical record review was performed by a research assistant and was double-checked for accuracy by one of the investigators (JHH).
Data Analyses
Measures of central tendency and dispersion for continuous variables were reported as medians and interquartile ranges. Categorical variables were reported as proportions. Receiver operating characteristic curves were constructed for each inattention task. Area under the receiver operating characteristic curves (AUC) was reported to provide a global measure of diagnostic accuracy. Sensitivities, specificities, positive likelihood ratios (PLRs), and negative likelihood ratios (NLRs) with their 95% CIs were calculated using the psychiatrist’s assessment as the reference standard.39 Cut-points with PLRs greater than 10 (strongly increased the likelihood of delirium) or NLRs less than 0.1 (strongly decreased the likelihood of delirium) were preferentially reported whenever possible.
All statistical analyses were performed with open source R statistical software version 3.0.1 (http://www.r-project.org/), SAS 9.4 (SAS Institute, Cary, NC), and Microsoft Excel 2010 (Microsoft Inc., Redmond, WA).
RESULTS
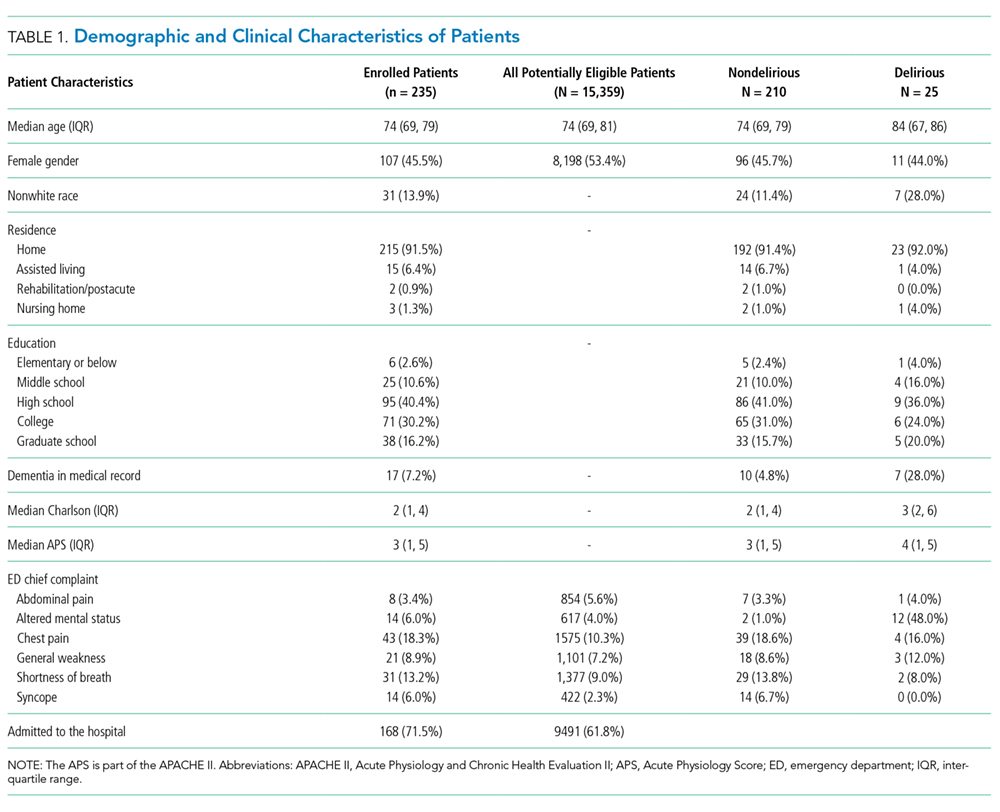
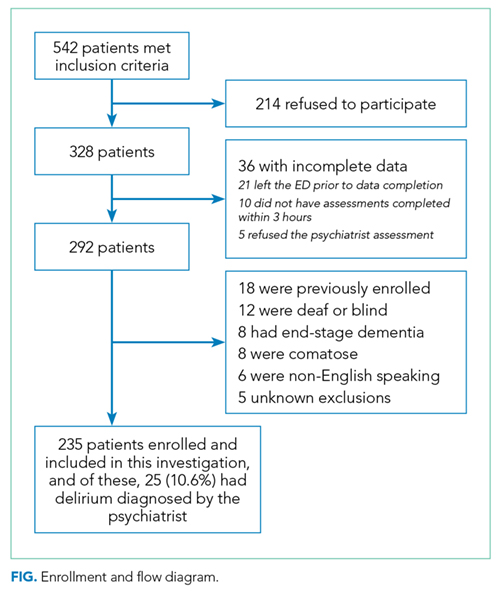
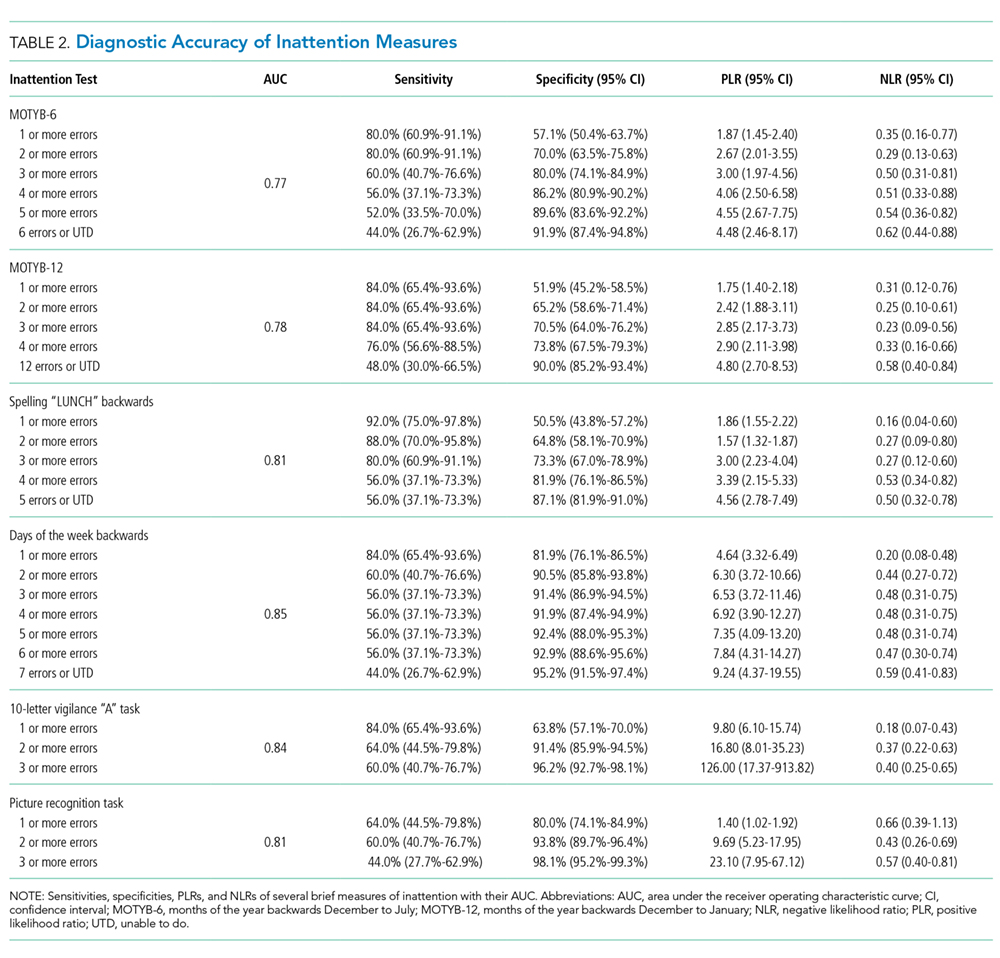
DISCUSSION
Delirium is frequently missed by healthcare providers because it is not routinely screened for in the acute care setting. To help address this deficiency of care, we evaluated several brief measures of inattention that take less than 30 seconds to complete. We observed that any errors made on the MOTYB-6 and MOTYB-12 tasks had very good sensitivities (80% and 84%) but were limited by their modest specificities (approximately 50%) for delirium. As a result, these assessments have limited clinical utility as standalone delirium screens. We also explored other commonly used brief measures of inattention and at a variety of error cutoffs. Reciting the days of the week backwards appeared to best balance sensitivity and specificity. None of the inattention measures could convincingly rule out delirium (NLR < 0.10), but the vigilance “A” and picture recognition tasks may have clinical utility in ruling in delirium (PLR > 10). Overall, all the inattention tasks, including MOTYB-6 and MOTYB-12, had very good diagnostic performances based upon their AUC. However, achieving a high sensitivity often had to be sacrificed for specificity or, alternatively, achieving a high specificity had to be sacrificed for sensitivity.
Inattention has been shown to be the cardinal feature for delirium,40 and its assessment using cognitive testing has been recommended to help identify the presence of delirium according to an expert consensus panel.26 The diagnostic performance of the MOTYB-12 observed in our study is similar to a study by Fick et al., who reported that MOTYB-12 had very good sensitivity (83%) but had modest specificity (69%) with a cutoff of 1 or more errors. Hendry et al. observed that the MOTYB-12 was 91% sensitive and 50% specific using a cutoff of 4 or more errors. With regard to the MOTYB-6, our reported specificity was different from what was observed by O’Regan et al.27 Using 1 or more errors as a cutoff, they observed a much higher specificity for delirium than we did (90% vs 57%). Discordant observations regarding the diagnostic accuracy for other inattention tasks also exist. We observed that making any error on the days of the week backwards task was 84% sensitive and 82% specific for delirium, whereas Fick et al. observed a sensitivity and specificity of 50% and 94%, respectively. For the vigilance “A” task, we observed that making 2 or more errors over a series of 10 letters was 64.0% sensitive and 91.4% specific for delirium, whereas Pompei et al.41 observed that making 2 or more errors over a series of 60 letters was 51% sensitive and 77% specific for delirium.
The abovementioned discordant findings may be driven by spectrum bias, wherein the sensitivities and specificities for each inattention task may differ in different subgroups. As a result, differences in the age distribution, proportion of college graduates, history of dementia, and susceptibility to delirium can influence overall sensitivity and specificity. Objective measures of delirium, including the inattention screens studied, are particularly prone to spectrum bias.31,34 However, the strength of this approach is that the assessment of inattention becomes less reliant upon clinical judgment and allows it to be used by raters from a wide range of clinical backgrounds. On the other hand, a subjective interpretation of these inattention tasks may allow the rater to capture the subtleties of inattention (ie, decreased speed of performance in a highly intelligent and well-educated patient without dementia). The disadvantage of this approach, however, is that it is more dependent on clinical judgment and may have decreased diagnostic accuracy in those with less clinical experience or with limited training.14,42,43 These factors must be carefully considered when determining which delirium assessment to use.
Additional research is required to determine the clinical utility of these brief inattention assessments. These findings need to be further validated in larger studies, and the optimal cutoff of each task for different subgroup of patients (eg, demented vs nondemented) needs to be further clarified. It is not completely clear whether these inattention tests can serve as standalone assessments. Depending on the cutoff used, some of these assessments may have unacceptable false negative or false positive rates that may lead to increased adverse patient outcomes or increased resource utilization, respectively. Additional components or assessments may be needed to improve the diagnostic accuracy of these assessments. In addition to understanding these inattention assessments’ diagnostic accuracies, their ability to predict adverse outcomes also needs to be investigated. While a previous study observed that making any error on the MOTYB-12 task was associated with increased physical restraint use and prolonged hospital length of stay,44 these assessments’ ability to prognosticate long-term outcomes such as mortality or long-term cognition or function need to be studied. Lastly, studies should also evaluate how easily implementable these assessments are and whether improved delirium recognition leads to improved patient outcomes.
This study has several notable limitations. Though planned a priori, this was a secondary analysis of a larger investigation designed to validate 3 delirium assessments. Our sample size was also relatively small, causing our 95% CIs to overlap in most cases and limiting the statistical power to truly determine whether one measure is better than the other. We also asked the patient to recite the months backwards from December to July as well as recite the months backwards from December to January. It is possible that the patient may have performed better at going from December to January because of learning effect. Our reference standard for delirium was based upon DSM-IV-TR criteria. The new DSM-V criteria may be more restrictive and may slightly change the sensitivities and specificities of the inattention tasks. We enrolled a convenience sample and enrolled patients who were more likely to be male, have cardiovascular chief complaints, and be admitted to the hospital; as a result, selection bias may have been introduced. Lastly, this study was conducted in a single center and enrolled patients who were 65 years and older. Our findings may not be generalizable to other settings and in those who are less than 65 years of age.
CONCLUSIONS
The MOTYB-6 and MOTYB-12 tasks had very good sensitivities but modest specificities (approximately 50%) using any error made as a cutoff; increasing cutoff to 2 errors and 3 errors, respectively, improved their specificities (approximately 70%) with minimal impact to their sensitivities. Reciting the days of the week backwards, spelling the word “LUNCH” backwards, and the 10-letter vigilance “A” task appeared to perform the best in ruling out delirium but only moderately decreased the likelihood of delirium. The 10-letter Vigilance “A” and picture recognition task
Disclosure
This study was funded by the Emergency Medicine Foundation Career Development Award, National Institutes of Health K23AG032355, and National Center for Research Resources, Grant UL1 RR024975-01. The authors report no financial conflicts of interest.
1. American Psychiatric Association. Diagnostic and statistical manual of mental disorders: DSM-5. Washington, DC: American Psychiatric Association; 2013.
33. Hamrick I, Hafiz R, Cummings DM. Use of days of the week in a modified mini-mental state exam (M-MMSE) for detecting geriatric cognitive impairment. J Am Board Fam Med. 2013;26(4):429-435.
Delirium is an acute neurocognitive disorder1 that affects up to 25% of older emergency department (ED) and hospitalized patients.2-4 The relationship between delirium and adverse outcomes is well documented.5-7 Delirium is a strong predictor of increased length of mechanical ventilation, longer intensive care unit and hospital stays, increased risk of falls, long-term cognitive impairment, and mortality.8-13 Delirium is frequently missed by healthcare professionals2,14-16 and goes undetected in up to 3 out of 4 patients by bedside nurses and medical practitioners in many hospital settings.14,17-22 A significant barrier to recognizing delirium is the absence of brief delirium assessments.
In an effort to improve delirium recognition in the acute care setting, there has been a concerted effort to develop and validate brief delirium assessments. To address this unmet need, 4 ‘A’s Test (4AT), the Brief Confusion Assessment Method (bCAM), and the 3-minute diagnostic assessment for CAM-defined delirium (3D-CAM) are 1- to 3-minute delirium assessments that were validated in acutely ill older patients.23 However, 1 to 3 minutes may still be too long in busy clinical environments, and briefer (<30 seconds) delirium assessments may be needed.
One potential more-rapid method to screen for delirium is to specifically test for the presence of inattention, which is a cardinal feature of delirium.24,25 Inattention can be ascertained by having the patient recite the months backwards, recite the days of the week backwards, or spell a word backwards.26 Recent studies have evaluated the diagnostic accuracy of reciting the months of the year backwards for delirium. O’Regan et al.27 evaluated the diagnostic accuracy of the month of the year backwards from December to July (MOTYB-6) and observed that this task was 84% sensitive and 90% specific for delirium in older patients. However, they performed the reference standard delirium assessments in patients who had a positive MOTYB-6, which can overestimate sensitivity and underestimate specificity (verification bias).28 Fick et al.29 examined the diagnostic accuracy of 20 individual elements of the 3D-CAM and observed that reciting the months of the year backwards from December to January (MOTYB-12) was 83% sensitive and 69% specific for delirium. However, this was an exploratory study that was designed to identify an element of the 3D-CAM that had the best diagnostic accuracy.
To address these limitations, we sought to evaluate the diagnostic performance of the MOTYB-6 and MOTYB-12 for delirium as diagnosed by a reference standard. We also explored other brief tests of inattention such as spelling a word (“LUNCH”) backwards, reciting the days of the week backwards, 10-letter vigilance “A” task, and 5 picture recognition task.
METHODS
Study Design and Setting
This was a preplanned secondary analysis of a prospective observational study that validated 3 delirium assessments.30,31 This study was conducted at a tertiary care, academic ED. The local institutional review board (IRB) reviewed and approved this study. Informed consent from the patient or an authorized surrogate was obtained whenever possible. Because this was an observational study and posed minimal risk to the patient, the IRB granted a waiver of consent for patients who were both unable to provide consent and were without an authorized surrogate available in the ED or by phone.
Selection of Participants
We enrolled a convenience sample of patients between June 2010 and February 2012 Monday through Friday from 8
Research assistants approached patients who met inclusion criteria and determined if any exclusion criteria were present. If none of the exclusion criteria were present, then the research assistant reviewed the informed consent document with the patient or authorized surrogate if the patient was not capable of providing consent. If a patient was not capable of providing consent and no authorized surrogate was available, then the patient was enrolled (under the waiver of consent) as long as the patient assented to be a part of the study. Once the patient was enrolled, the research assistant contacted the physician rater and reference standard psychiatrists to approach the patient.
Measures of Inattention
An emergency physician (JHH) who had no formal training in the mental status assessment of elders administered a cognitive battery to the patient, including tests of inattention. The following inattention tasks were administered:
- Spell the word “LUNCH” backwards.30 Patients were initially allowed to spell the word “LUNCH” forwards. Patients who were unable to perform the task were assigned 5 errors.
- Recite the months of the year backwards from December to July.23,26,27,30,32 Patients who were unable to perform the task were assigned 6 errors.
- Recite the days of the week backwards.23,26,33 Patients who were unable to perform the task were assigned 7 errors.
- Ten-letter vigilance “A” task.34 The patient was given a series of 10 letters (“S-A-V-E-A-H-A-A-R-T”) every 3 seconds and was asked to squeeze the rater’s hand every time the patient heard the letter “A.” Patients who were unable to perform the task were assigned 10 errors.
- Five picture recognition task.34 Patients were shown 5 objects on picture cards. Afterwards, patients were shown 10 pictures with the previously shown objects intermingled. The patient had to identify which objects were seen previously in the first 5 pictures. Patients who were unable to perform the task were assigned 10 errors.
- Recite the months of the year backwards from December to January.29 Patients who were unable to perform the task were assigned 12 errors.
Reference Standard for Delirium
A comprehensive consultation-liaison psychiatrist assessment was the reference standard for delirium; the diagnosis of delirium was based on Diagnostic and Statistical Manual of Mental Disorders, Fourth Edition, Text Revision (DSM-IV-TR) criteria.35 Three psychiatrists who each had an average of 11 years of clinical experience and regularly diagnosed delirium as part of their daily clinical practice were available to perform these assessments. To arrive at the diagnosis of delirium, they interviewed those who best understood the patient’s mental status (eg, the patient’s family members or caregivers, physician, and nurses). They also reviewed the patient’s medical record and radiology and laboratory test results. They performed bedside cognitive testing that included, but was not limited to, the Mini-Mental State Examination, Clock Drawing Test, Luria hand sequencing task, and tests for verbal fluency. A focused neurological examination was also performed (ie, screening for paraphasic errors, tremors, tone, asterixis, frontal release signs, etc.), and they also evaluated the patient for affective lability, hallucinations, and level of alertness. If the presence of delirium was still questionable, then confrontational naming, proverb interpretation or similarities, and assessments for apraxias were performed at the discretion of the psychiatrist. The psychiatrists were blinded to the physician’s assessments, and the assessments were conducted within 3 hours of each other.
Additional Variables Collected
Using medical record review, comorbidity burden, severity of illness, and premorbid cognition were ascertained. The Charlson Comorbidity Index, a weighted index that takes into account the number and seriousness of 19 preexisting comorbid conditions, was used to quantify comorbidity burden; higher scores indicate higher comorbid burden.36,37 The Acute Physiology Score of the Acute Physiology and Chronic Health Evaluation II was used to quantify severity of illness.38 This score is based upon the initial values of 12 routine physiologic measurements such as vital sign and laboratory abnormalities; higher scores represent higher severities of illness.38 The medical record was reviewed to ascertain the presence of premorbid cognitive impairment; any documentation of dementia in the patient’s clinical problem list or physician history and physical examination from the outpatient or inpatient settings was considered positive. The medical record review was performed by a research assistant and was double-checked for accuracy by one of the investigators (JHH).
Data Analyses
Measures of central tendency and dispersion for continuous variables were reported as medians and interquartile ranges. Categorical variables were reported as proportions. Receiver operating characteristic curves were constructed for each inattention task. Area under the receiver operating characteristic curves (AUC) was reported to provide a global measure of diagnostic accuracy. Sensitivities, specificities, positive likelihood ratios (PLRs), and negative likelihood ratios (NLRs) with their 95% CIs were calculated using the psychiatrist’s assessment as the reference standard.39 Cut-points with PLRs greater than 10 (strongly increased the likelihood of delirium) or NLRs less than 0.1 (strongly decreased the likelihood of delirium) were preferentially reported whenever possible.
All statistical analyses were performed with open source R statistical software version 3.0.1 (http://www.r-project.org/), SAS 9.4 (SAS Institute, Cary, NC), and Microsoft Excel 2010 (Microsoft Inc., Redmond, WA).
RESULTS
DISCUSSION
Delirium is frequently missed by healthcare providers because it is not routinely screened for in the acute care setting. To help address this deficiency of care, we evaluated several brief measures of inattention that take less than 30 seconds to complete. We observed that any errors made on the MOTYB-6 and MOTYB-12 tasks had very good sensitivities (80% and 84%) but were limited by their modest specificities (approximately 50%) for delirium. As a result, these assessments have limited clinical utility as standalone delirium screens. We also explored other commonly used brief measures of inattention and at a variety of error cutoffs. Reciting the days of the week backwards appeared to best balance sensitivity and specificity. None of the inattention measures could convincingly rule out delirium (NLR < 0.10), but the vigilance “A” and picture recognition tasks may have clinical utility in ruling in delirium (PLR > 10). Overall, all the inattention tasks, including MOTYB-6 and MOTYB-12, had very good diagnostic performances based upon their AUC. However, achieving a high sensitivity often had to be sacrificed for specificity or, alternatively, achieving a high specificity had to be sacrificed for sensitivity.
Inattention has been shown to be the cardinal feature for delirium,40 and its assessment using cognitive testing has been recommended to help identify the presence of delirium according to an expert consensus panel.26 The diagnostic performance of the MOTYB-12 observed in our study is similar to a study by Fick et al., who reported that MOTYB-12 had very good sensitivity (83%) but had modest specificity (69%) with a cutoff of 1 or more errors. Hendry et al. observed that the MOTYB-12 was 91% sensitive and 50% specific using a cutoff of 4 or more errors. With regard to the MOTYB-6, our reported specificity was different from what was observed by O’Regan et al.27 Using 1 or more errors as a cutoff, they observed a much higher specificity for delirium than we did (90% vs 57%). Discordant observations regarding the diagnostic accuracy for other inattention tasks also exist. We observed that making any error on the days of the week backwards task was 84% sensitive and 82% specific for delirium, whereas Fick et al. observed a sensitivity and specificity of 50% and 94%, respectively. For the vigilance “A” task, we observed that making 2 or more errors over a series of 10 letters was 64.0% sensitive and 91.4% specific for delirium, whereas Pompei et al.41 observed that making 2 or more errors over a series of 60 letters was 51% sensitive and 77% specific for delirium.
The abovementioned discordant findings may be driven by spectrum bias, wherein the sensitivities and specificities for each inattention task may differ in different subgroups. As a result, differences in the age distribution, proportion of college graduates, history of dementia, and susceptibility to delirium can influence overall sensitivity and specificity. Objective measures of delirium, including the inattention screens studied, are particularly prone to spectrum bias.31,34 However, the strength of this approach is that the assessment of inattention becomes less reliant upon clinical judgment and allows it to be used by raters from a wide range of clinical backgrounds. On the other hand, a subjective interpretation of these inattention tasks may allow the rater to capture the subtleties of inattention (ie, decreased speed of performance in a highly intelligent and well-educated patient without dementia). The disadvantage of this approach, however, is that it is more dependent on clinical judgment and may have decreased diagnostic accuracy in those with less clinical experience or with limited training.14,42,43 These factors must be carefully considered when determining which delirium assessment to use.
Additional research is required to determine the clinical utility of these brief inattention assessments. These findings need to be further validated in larger studies, and the optimal cutoff of each task for different subgroup of patients (eg, demented vs nondemented) needs to be further clarified. It is not completely clear whether these inattention tests can serve as standalone assessments. Depending on the cutoff used, some of these assessments may have unacceptable false negative or false positive rates that may lead to increased adverse patient outcomes or increased resource utilization, respectively. Additional components or assessments may be needed to improve the diagnostic accuracy of these assessments. In addition to understanding these inattention assessments’ diagnostic accuracies, their ability to predict adverse outcomes also needs to be investigated. While a previous study observed that making any error on the MOTYB-12 task was associated with increased physical restraint use and prolonged hospital length of stay,44 these assessments’ ability to prognosticate long-term outcomes such as mortality or long-term cognition or function need to be studied. Lastly, studies should also evaluate how easily implementable these assessments are and whether improved delirium recognition leads to improved patient outcomes.
This study has several notable limitations. Though planned a priori, this was a secondary analysis of a larger investigation designed to validate 3 delirium assessments. Our sample size was also relatively small, causing our 95% CIs to overlap in most cases and limiting the statistical power to truly determine whether one measure is better than the other. We also asked the patient to recite the months backwards from December to July as well as recite the months backwards from December to January. It is possible that the patient may have performed better at going from December to January because of learning effect. Our reference standard for delirium was based upon DSM-IV-TR criteria. The new DSM-V criteria may be more restrictive and may slightly change the sensitivities and specificities of the inattention tasks. We enrolled a convenience sample and enrolled patients who were more likely to be male, have cardiovascular chief complaints, and be admitted to the hospital; as a result, selection bias may have been introduced. Lastly, this study was conducted in a single center and enrolled patients who were 65 years and older. Our findings may not be generalizable to other settings and in those who are less than 65 years of age.
CONCLUSIONS
The MOTYB-6 and MOTYB-12 tasks had very good sensitivities but modest specificities (approximately 50%) using any error made as a cutoff; increasing cutoff to 2 errors and 3 errors, respectively, improved their specificities (approximately 70%) with minimal impact to their sensitivities. Reciting the days of the week backwards, spelling the word “LUNCH” backwards, and the 10-letter vigilance “A” task appeared to perform the best in ruling out delirium but only moderately decreased the likelihood of delirium. The 10-letter Vigilance “A” and picture recognition task
Disclosure
This study was funded by the Emergency Medicine Foundation Career Development Award, National Institutes of Health K23AG032355, and National Center for Research Resources, Grant UL1 RR024975-01. The authors report no financial conflicts of interest.
1. American Psychiatric Association. Diagnostic and statistical manual of mental disorders: DSM-5. Washington, DC: American Psychiatric Association; 2013.
33. Hamrick I, Hafiz R, Cummings DM. Use of days of the week in a modified mini-mental state exam (M-MMSE) for detecting geriatric cognitive impairment. J Am Board Fam Med. 2013;26(4):429-435.
© 2018 Society of Hospital Medicine
Gabapentin Use in Acute Alcohol Withdrawal Management
The prevalence of alcohol dependence in the U.S. represents a significant public health concern. Alcohol use disorder (AUD) is estimated to affect 6.7% of Americans and is the fourth leading preventable cause of death.1 Men and women who have served in the military are at an even higher risk of excessive alcohol use. More than 20% of service members report binge drinking every week.2 This risk is further exacerbated in veterans who have experienced active combat or who have comorbid health conditions, such as posttraumatic stress disorder.3
Background
Individuals that regularly consume excessive amounts of alcohol can develop acute alcohol withdrawal syndrome (AWS) after abrupt discontinuation or significant reduction of alcohol intake. Patients admitted for acute alcohol withdrawal may experience complicated courses of treatment and extended lengths of hospitalization.4,5 Cessation from chronic alcohol intake elicits a pathophysiologic response from increased N-methyl-d-aspartate receptor activity and decreased γ-aminobutyric acid (GABA) receptor function.
Autonomic and psychomotor hyperactivity disturbances, such as anxiety, nausea, tremors, diaphoresis, and tachycardia, may occur as early as 6 to 8 hours after cessation of use. Within 48 to 72 hours of alcohol cessation, patients may be at an increased risk of experiencing tonic-clonic seizures, visual and auditory hallucinations, and delirium tremens (DTs), which may be accompanied by signs of extreme autonomic hyperactivity and agitation.6 Patients hospitalized within acute settings require frequent medical supervision for acute alcohol withdrawal, especially in patients at high risk for seizure or DTs because morbidity and mortality risk is increased.7
Benzodiazepines remain the standard of care for management of moderate-to-severe symptoms of AWS. Strong evidence supports the use of benzodiazepines to reduce withdrawal severity, incidence of delirium, and seizures in AWS by enhancing GABA activity.8 However, the adverse effect (AE) burden associated with benzodiazepines can be a major limitation throughout care. Benzodiazepines also may be limited in their use in select patient populations, such as in older adults or patients who present with hepatic dysfunction due to the risk of increased AEs or metabolite accumulation.6 A high dosing requirement of benzodiazepine for symptom management can lead to oversedation to the point of requiring intubation, increasing length of stay in the intensive care unit (ICU), and the risk of nosocomial infections.9
Anticonvulsants, such as carbamazepine, valproic acid, and gabapentin, have shown to be superior to placebo and equal in efficacy to benzodiazepines for symptom management in mild-to-moderate alcohol withdrawal in both inpatient and outpatient settings.6-8 However, these agents are not recommended as first-line monotherapy due to the limited number of randomized trials supporting their efficacy over benzodiazepines in preventing severe symptoms of withdrawal, such as seizures or delirium.10-12 Nonetheless, the mechanism of action of anticonvulsants may help raise seizure threshold in patients and provide a benzodiazepine-sparing effect by enhancing GABAergic activity and lowering neuronal excitability.13
Gabapentin makes an attractive agent for clinical use because of its anxiolytic and sedative properties that can be used to potentially target symptoms analogous with AWS when the use of benzodiazepines becomes a safety concern. Although similar in chemical structure, gabapentin is not metabolized to GABA and does not directly interact with the receptor. Gabapentin may increase GABA concentrations by direct synthesis of GABA and indirectly through interaction with voltage-gated calcium channels.13 In addition to its overall safety profile, gabapentin may be a viable adjuvant because emerging data may suggest a potential role in the management of acute alcohol withdrawal.12,14,15
Gabapentin for Alcohol Withdrawal at VAPORHCS
Although not currently included in the alcohol withdrawal protocol at Veterans Affairs Portland Health Care System (VAPORHCS), gabapentin has been added to the standard of care in select patients per the discretion of the attending physician. Anecdotal reports of patients experiencing milder symptoms and less benzodiazepine administration have facilitated use of gabapentin in alcohol withdrawal management at VAPORHCS. However, routine use of gabapentin is not consistent among all patients treated for acute alcohol withdrawal, and dosing schedules of gabapentin seem highly variable. Standard symptom management for acute alcohol withdrawal should be consistent for all affected individuals, using evidence-based medicine in order to achieve optimal outcomes and improve harm reduction.
The objective of this quality assurance/quality improvement (QA/QI) project was to assess the amount of lorazepam required for symptom management in acute alcohol withdrawal when gabapentin is used as an adjunct to treatment and to evaluate the impact on symptom management using the Clinical Institute Withdrawal Assessment for Alcohol scale, revised version (CIWA-Ar) in patients admitted to the ICU and general medicine wards for acute alcohol withdrawal at VAPORHCS.16 If a possible adjunct for the treatment of alcohol withdrawal has the potential to reduce benzodiazepine requirements and minimize AEs, a thorough evaluation of the treatment should be conducted before its practice is incorporated into the current standard of care.
Methods
The following QA/QI project was approved locally by the VAPORHCS associate chief of staff/Office of Research and Development and is considered to be nonresearch VHA operations activity and exempt from an institutional review board committee review. This project was a single-center, retrospective chart review of patients admitted to the ICU and general medicine wards at VAPORHCS with acute alcohol withdrawal. The CIWA-Ar protocol order sets between January 1, 2014 and December 31, 2015, were retrieved through the Computerized Patient Record System (CPRS) at VAPORHCS.
Patients with an alcohol withdrawal protocol order set who received gabapentin with or without lorazepam during hospitalization were identified for chart review. Patients were eligible for review if they were aged ≥ 18 years with a primary or secondary diagnosis of acute alcohol withdrawal and had a CIWA-Ar protocol order set placed during hospitalization. Patients must have been administered gabapentin, lorazepam, or both while the CIWA-Ar protocol was active. Patients with an active outpatient prescription for gabapentin or benzodiazepine filled within the previous 30 days, documented history of psychosis or epileptic seizure disorder, or other concomitant benzodiazepines or antiepileptics administered while on the CIWA-Ar protocol were excluded from the analysis.
Baseline characteristics for patients eligible for review were collected and included age; sex; race, body mass index (BMI); estimated creatinine clearance (CrCl); toxicology screen at admission (if available), history of substance use disorder, AWS, or history of withdrawal seizures; and history of a sedative hypnotics (not including benzodiazepines) prescription within 30 days prior to admission.17
The primary endpoint was the total amount of lorazepam administered from the time of admission to the time of discontinuation of the alcohol withdrawal protocol. The dose, frequency, and amount of lorazepam and gabapentin administered daily were collected for each patient while on the CIWA-Ar protocol. Secondary endpoints included rate of the CIWA-Ar score reduction, time to protocol discontinuation, as well as incidence and onset of peak delirium scores during hospitalization. Cumulative CIWA-Ar scores over 24 hours were averaged per patient per day while on CIWA-Ar protocol. Peak CIWA-Ar scores per patient per day on the protocol also were collected. Time to protocol termination was determined by date of order for discontinuation or by date when scoring had ceased and protocol order was inadvertently continued. Peak Intensive Care Delirium Screening Checklist (ICDSC) scores were collected for patients admitted to the ICU.18 Day of peak ICDSC scores also were evaluated.
Statistical Analysis
The sample size for this analysis was determined by the number of patients identified who met the inclusion criteria and did not meet any of the exclusion criteria. Power was not calculated to estimate sample size needed to determine statistical significance. One hundred patients treated for alcohol withdrawal was established as the target sample size for this project. Descriptive statistics were performed to analyze patient baseline characteristics and primary and secondary objective data.
Results
A total of 1,611 CIWA-Ar protocol orders were identified between January 1, 2014 and December 31, 2015. 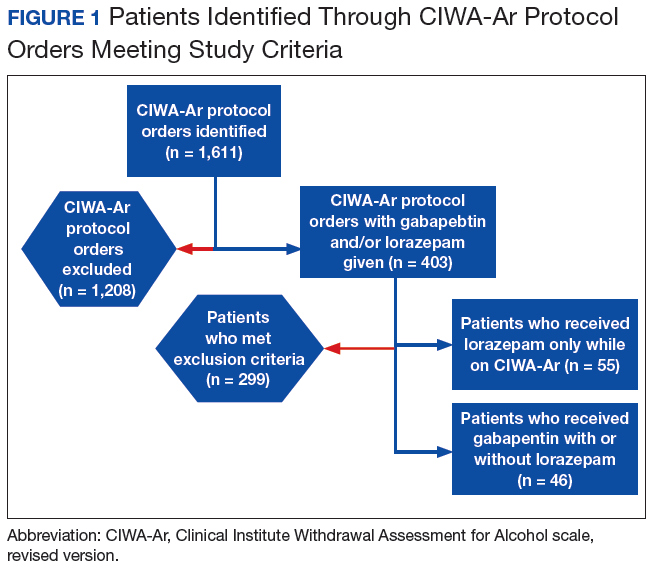
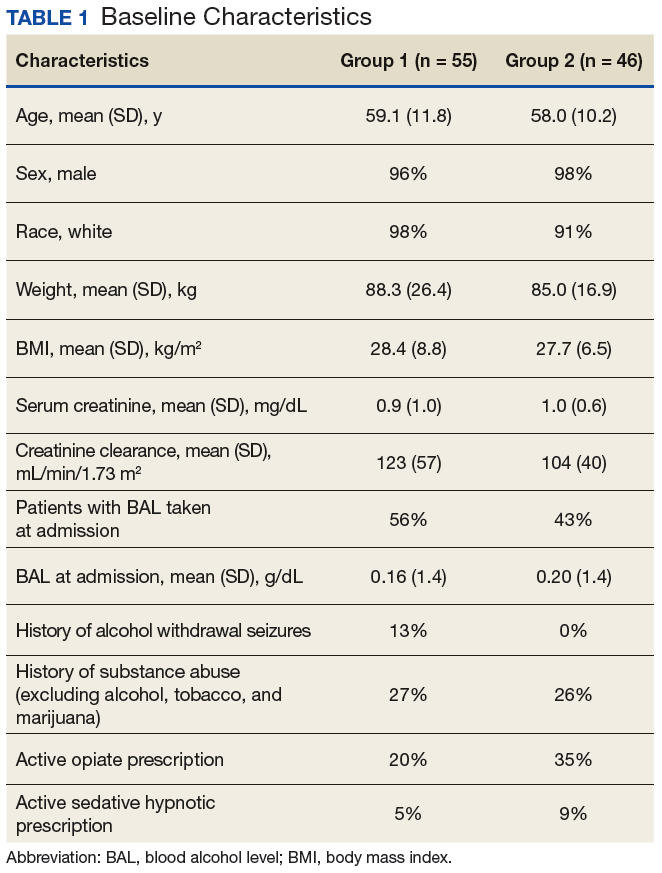
Primary Endpoint
The average amount of lorazepam administered for the total duration on CIWA-Ar protocol was 7.9 mg (median 6, ± 8.2) among 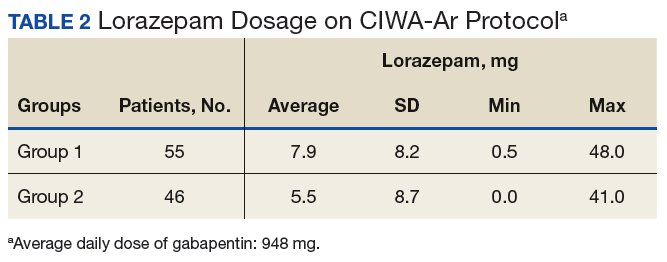
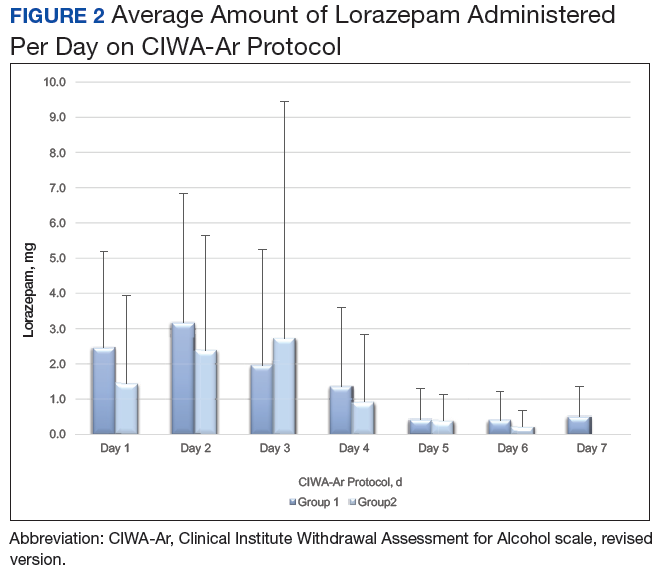
Secondary Endpoints
On average, the total number of days spent on CIWA-Ar protocol was 3.8 (median 4, ± 1.5) in group 1 compared with 4.1 (median 4, ± 1.6) in group 2. Rate of CIWA-Ar protocol discontinuation for patients in group 1 and group 2 is shown in Figure 3. 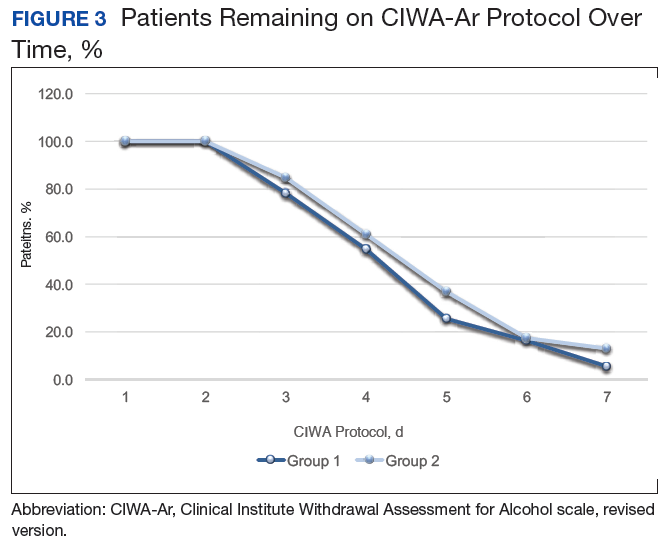
Discussion
The purpose of this project was to evaluate gabapentin use at VAPORHCS for alcohol withdrawal and evaluate the impact on symptom management. Patients who were started on gabapentin on the initiation of the alcohol withdrawal protocol received less lorazepam dosing compared with patients who received only lorazepam for symptom management for alcohol withdrawal. Except for day 3, average lorazepam dosage per day on the alcohol withdrawal protocol was lower in patients who were also taking gabapentin.
This trend also can be seen in the recorded peak CIWA-Ar scores per day as illustrated in Figures 4 and 5. 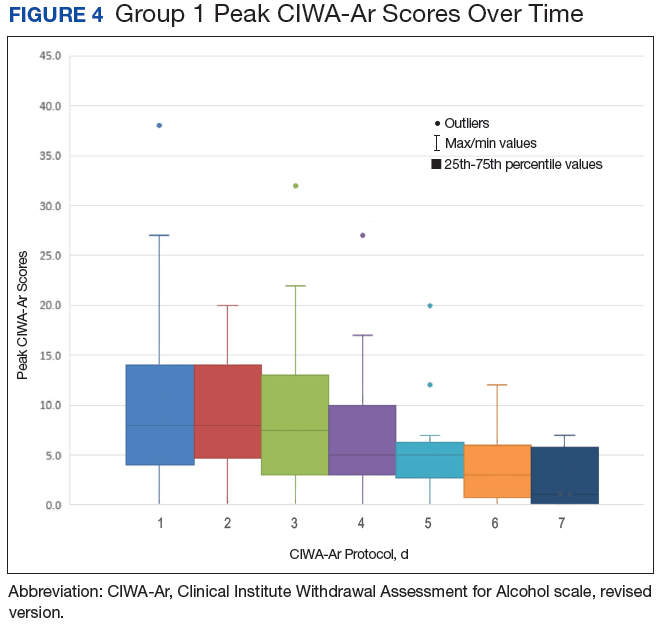
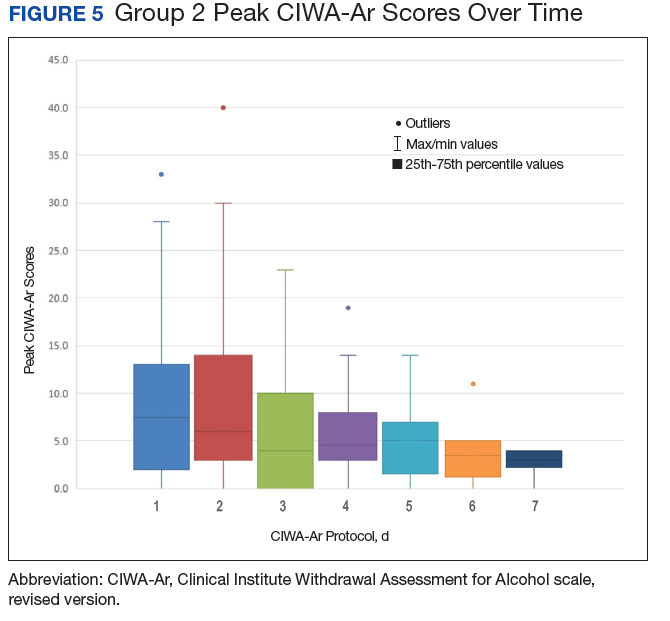
Limitations
Prior to evaluation, power analysis was not calculated to estimate an appropriate sample size necessary to determine statistical significance. Results from this evaluation are not definitive and are meant to be hypothesis generating for future analysis.
There were several limitations that were identified throughout this project. For this review, history and extent of patient’s prior alcohol use was not assessed. Therefore, the degree of symptom severity in which patients may have experienced during withdrawal may not have been adequately matched between groups. The inherent subjectivity of CIWA-Ar scoring was considered a limitation because scores were determined by clinical interpretation among various nursing staff. As this was a retrospective review, exact timing of medications administered as well as additional supportive care measures, such as ancillary medications for symptom management, were not accounted for and controlled between groups.
Patients presenting to the emergency department or from a facility outside of VAPORHCS for acute AWS may have had incomplete documentation of the onset of symptoms on presentation or of the medications administered prior to being admitted, which may have confounded initial CIWA-Ar scoring and total duration required to be on a withdrawal protocol. Some patients may have received benzodiazepines at initial presentation prior to gabapentin initiation and may have inaccurately reflected its efficacy potential to manage symptoms without the need for lorazepam.
There were 10 patients that were identified who received gabapentin on the alcohol withdrawal protocol and did not receive any lorazepam. This retrospective review could not be determined whether these patients did not require lorazepam because initiating gabapentin reduced severity or simply because their withdrawal symptoms were not severe enough to warrant the need for lorazepam, regardless of gabapentin use.
Gabapentin dosing was not standardized among patients, averaging from 100 mg to 3,600 mg per day. This wide variation in dose may have influenced the requirement of lorazepam needed for symptom management in patients receiving minimal doses or AEs experienced in patients who received large doses. Initiation and/or select dosing of gabapentin may have been dependent on the experience of the provider and familiarity with its use in alcohol withdrawal management. Interestingly, patients with a history of withdrawal seizures (13%) were identified only within the lorazepam-only group. This could suggest that patients with prior symptoms of severe alcohol withdrawal were selected to receive lorazepam-only at the discretion of the provider.
Existing literature investigating gabapentin utilization in alcohol withdrawal has demonstrated benefit for patients with mild-to-moderate symptoms in both inpatient and outpatient studies. However, supporting evidence is limited by the differences in design, methods, and comparators within each trial. Leung and colleagues identified 5 studies that utilized gabapentin as monotherapy or in combination with other agents in alcohol withdrawal.13 Three of these studies were performed within an inpatient setting, each differing in trial design, inclusion/exclusion criteria, intervention, and outcomes. Gabapentin dosing strategies were highly variable among studies. Collectively, the differences noted make it difficult to generalize that similar outcomes would result in other patient populations. The purpose of this project was to evaluate gabapentin use at VAPORHCS for alcohol withdrawal and evaluate the impact on symptom management. Future projects could be designed to draw more specific conclusions.
Conclusion
On average, the required benzodiazepine dosage was lower with concomitant use of gabapentin in acute AWS management. The duration for patients on alcohol withdrawal protocol was not reduced with use of gabapentin. Between group (ie, history of withdrawal seizures, blood alcohol level) and among group (ie, gabapentin administration) differences prevent direct correlations to be drawn from this evaluation. Future reviews should include power analysis to establish an appropriate sample size to determine statistical significance among identified covariates. Further evaluation of the use of gabapentin for withdrawal management is warranted prior to incorporating its routine use in the current standard of care for patients experiencing acute AWS.
Acknowledgments
The authors thank Ryan Bickel, PharmD, BCCCP, Critical Care Clinical Pharmacist; Stephen M. Smith, PhD, Director of Medical Critical Care; Gordon Wong, PharmD, Clinical Applications Coordinator; and Eileen Wilbur, RPh, Research Pharmacy Supervisor.
1. Stahre M, Roeber J, Kanny D, Brewer RD, Zhang X. Contribution of excessive alcohol consumption to deaths and years of potential life lost in the United States. Prev Chronic Dis. 2014;11:E109.
2. National Institute on Drug Abuse. Military. https://www.drugabuse.gov/related-topics/military. Updated April 2016. Accessed January 10, 2018.
3. Bohnert KM, Ilgen MA, Rosen CS, Desai RA, Austin K, Blow FC. The association between substance use disorders and mortality among a cohort of veterans with posttraumatic stress disorder: variation by age cohort and mortality type. Drug Alcohol Depend. 2013;128(1-2):98-103.
4. Foy A, Kay J, Taylor A. The course of alcohol withdrawal in a general hospital. QJM. 1997;90(4):253-261.
5. Carlson RW, Kumar NN, Wong-Mckinstry E, et al. Alcohol withdrawal syndrome. Crit Care Clin. 2012;28(4):549-585.
6. National Institute for Health and Care Excellence. Alcohol use disorders: diagnosis and clinical management of alcohol-related physical complications. https://www.nice.org.uk/guidance/cg100. Published June 2010. Updated April 2017. Accessed January 10, 2018.
7. Sarff MC, Gold JA. Alcohol withdrawal syndromes in the intensive care unit. Crit Care Med. 2010;38(suppl 9):494-501.
8. U.S. Department of Veteran Affairs, U.S. Department of Defense. VA/DoD clinical practice guideline for the management of substance use disorders. https://www.healthquality.va.gov/guidelines/MH/sud/VADODSUDCPGRevised22216.pdf. Published December 2015. Accessed January 10, 2018.
9. Gold JA, Rimal B, Nolan A, Nelson LS. A strategy of escalating doses of benzodiazepines and phenobarbital administration reduces the need for mechanical ventilation in delirium tremens. Crit Care Med. 2007;35(3):724-730.
10. Amato L, Minozzi S, Davoli M. Efficacy and safety of pharmacological interventions for the treatment of the alcohol withdrawal syndrome. Cochrane Database Syst Rev. 2011(6):D008537.
11. Ntais C, Pakos E, Kyzas P, Ioannidis JP. Benzodiazepines for alcohol withdrawal. Cochrane Database Syst Rev. 2005;20(3):CD005063.
12. Bonnet U, Hamzavi-Abedi R, Specka M, Wiltfang J, Lieb B, Scherbaum N. An open trial of gabapentin in acute alcohol withdrawal using an oral loading protocol. Alcohol Alcohol. 2010;45(2):143-145.
13. Leung JG, Hall-Flavin D, Nelson S, Schmidt KA, Schak KM. Role of gabapentin in the management of alcohol withdrawal and dependence. Ann Pharmacother. 2015;49(8):897-906.
14. Johnson BA, Swift RM, Addolorato G, Ciraulo DA, Myrick H. Safety and efficacy of GABAergic medications for treating alcoholism. Alcohol Clin Exp Res. 2005;29:248-254.
15. Myrick H, Malcolm R, Randall PK, et al. A double blind trial of gabapentin vs lorazepam in the treatment of alcohol withdrawal. Alcohol Clin Exp Res. 2009;33(9):1582-1588.
16. Sullivan JT, Sykora K, Schneiderman J, Naranjo CA, Sellers EM. Assessment of alcohol withdrawal: the revised clinical institute withdrawal assessment for alcohol scale (CIWA-Ar). Br J Addict. 1989;84(11):1353-1357.
17 Cockcroft DW, Gault MH. Prediction of creatinine clearance from serum creatinine. Nephron. 1976;16(1):31-41.
18. Bergeron N, Dubois MJ, Dumont M, Dial S, Skrobik Y. Intensive care delirium screening checklist: evaluation of a new screening tool. Intensive Care Med. 2001;27(5):859-864.
The prevalence of alcohol dependence in the U.S. represents a significant public health concern. Alcohol use disorder (AUD) is estimated to affect 6.7% of Americans and is the fourth leading preventable cause of death.1 Men and women who have served in the military are at an even higher risk of excessive alcohol use. More than 20% of service members report binge drinking every week.2 This risk is further exacerbated in veterans who have experienced active combat or who have comorbid health conditions, such as posttraumatic stress disorder.3
Background
Individuals that regularly consume excessive amounts of alcohol can develop acute alcohol withdrawal syndrome (AWS) after abrupt discontinuation or significant reduction of alcohol intake. Patients admitted for acute alcohol withdrawal may experience complicated courses of treatment and extended lengths of hospitalization.4,5 Cessation from chronic alcohol intake elicits a pathophysiologic response from increased N-methyl-d-aspartate receptor activity and decreased γ-aminobutyric acid (GABA) receptor function.
Autonomic and psychomotor hyperactivity disturbances, such as anxiety, nausea, tremors, diaphoresis, and tachycardia, may occur as early as 6 to 8 hours after cessation of use. Within 48 to 72 hours of alcohol cessation, patients may be at an increased risk of experiencing tonic-clonic seizures, visual and auditory hallucinations, and delirium tremens (DTs), which may be accompanied by signs of extreme autonomic hyperactivity and agitation.6 Patients hospitalized within acute settings require frequent medical supervision for acute alcohol withdrawal, especially in patients at high risk for seizure or DTs because morbidity and mortality risk is increased.7
Benzodiazepines remain the standard of care for management of moderate-to-severe symptoms of AWS. Strong evidence supports the use of benzodiazepines to reduce withdrawal severity, incidence of delirium, and seizures in AWS by enhancing GABA activity.8 However, the adverse effect (AE) burden associated with benzodiazepines can be a major limitation throughout care. Benzodiazepines also may be limited in their use in select patient populations, such as in older adults or patients who present with hepatic dysfunction due to the risk of increased AEs or metabolite accumulation.6 A high dosing requirement of benzodiazepine for symptom management can lead to oversedation to the point of requiring intubation, increasing length of stay in the intensive care unit (ICU), and the risk of nosocomial infections.9
Anticonvulsants, such as carbamazepine, valproic acid, and gabapentin, have shown to be superior to placebo and equal in efficacy to benzodiazepines for symptom management in mild-to-moderate alcohol withdrawal in both inpatient and outpatient settings.6-8 However, these agents are not recommended as first-line monotherapy due to the limited number of randomized trials supporting their efficacy over benzodiazepines in preventing severe symptoms of withdrawal, such as seizures or delirium.10-12 Nonetheless, the mechanism of action of anticonvulsants may help raise seizure threshold in patients and provide a benzodiazepine-sparing effect by enhancing GABAergic activity and lowering neuronal excitability.13
Gabapentin makes an attractive agent for clinical use because of its anxiolytic and sedative properties that can be used to potentially target symptoms analogous with AWS when the use of benzodiazepines becomes a safety concern. Although similar in chemical structure, gabapentin is not metabolized to GABA and does not directly interact with the receptor. Gabapentin may increase GABA concentrations by direct synthesis of GABA and indirectly through interaction with voltage-gated calcium channels.13 In addition to its overall safety profile, gabapentin may be a viable adjuvant because emerging data may suggest a potential role in the management of acute alcohol withdrawal.12,14,15
Gabapentin for Alcohol Withdrawal at VAPORHCS
Although not currently included in the alcohol withdrawal protocol at Veterans Affairs Portland Health Care System (VAPORHCS), gabapentin has been added to the standard of care in select patients per the discretion of the attending physician. Anecdotal reports of patients experiencing milder symptoms and less benzodiazepine administration have facilitated use of gabapentin in alcohol withdrawal management at VAPORHCS. However, routine use of gabapentin is not consistent among all patients treated for acute alcohol withdrawal, and dosing schedules of gabapentin seem highly variable. Standard symptom management for acute alcohol withdrawal should be consistent for all affected individuals, using evidence-based medicine in order to achieve optimal outcomes and improve harm reduction.
The objective of this quality assurance/quality improvement (QA/QI) project was to assess the amount of lorazepam required for symptom management in acute alcohol withdrawal when gabapentin is used as an adjunct to treatment and to evaluate the impact on symptom management using the Clinical Institute Withdrawal Assessment for Alcohol scale, revised version (CIWA-Ar) in patients admitted to the ICU and general medicine wards for acute alcohol withdrawal at VAPORHCS.16 If a possible adjunct for the treatment of alcohol withdrawal has the potential to reduce benzodiazepine requirements and minimize AEs, a thorough evaluation of the treatment should be conducted before its practice is incorporated into the current standard of care.
Methods
The following QA/QI project was approved locally by the VAPORHCS associate chief of staff/Office of Research and Development and is considered to be nonresearch VHA operations activity and exempt from an institutional review board committee review. This project was a single-center, retrospective chart review of patients admitted to the ICU and general medicine wards at VAPORHCS with acute alcohol withdrawal. The CIWA-Ar protocol order sets between January 1, 2014 and December 31, 2015, were retrieved through the Computerized Patient Record System (CPRS) at VAPORHCS.
Patients with an alcohol withdrawal protocol order set who received gabapentin with or without lorazepam during hospitalization were identified for chart review. Patients were eligible for review if they were aged ≥ 18 years with a primary or secondary diagnosis of acute alcohol withdrawal and had a CIWA-Ar protocol order set placed during hospitalization. Patients must have been administered gabapentin, lorazepam, or both while the CIWA-Ar protocol was active. Patients with an active outpatient prescription for gabapentin or benzodiazepine filled within the previous 30 days, documented history of psychosis or epileptic seizure disorder, or other concomitant benzodiazepines or antiepileptics administered while on the CIWA-Ar protocol were excluded from the analysis.
Baseline characteristics for patients eligible for review were collected and included age; sex; race, body mass index (BMI); estimated creatinine clearance (CrCl); toxicology screen at admission (if available), history of substance use disorder, AWS, or history of withdrawal seizures; and history of a sedative hypnotics (not including benzodiazepines) prescription within 30 days prior to admission.17
The primary endpoint was the total amount of lorazepam administered from the time of admission to the time of discontinuation of the alcohol withdrawal protocol. The dose, frequency, and amount of lorazepam and gabapentin administered daily were collected for each patient while on the CIWA-Ar protocol. Secondary endpoints included rate of the CIWA-Ar score reduction, time to protocol discontinuation, as well as incidence and onset of peak delirium scores during hospitalization. Cumulative CIWA-Ar scores over 24 hours were averaged per patient per day while on CIWA-Ar protocol. Peak CIWA-Ar scores per patient per day on the protocol also were collected. Time to protocol termination was determined by date of order for discontinuation or by date when scoring had ceased and protocol order was inadvertently continued. Peak Intensive Care Delirium Screening Checklist (ICDSC) scores were collected for patients admitted to the ICU.18 Day of peak ICDSC scores also were evaluated.
Statistical Analysis
The sample size for this analysis was determined by the number of patients identified who met the inclusion criteria and did not meet any of the exclusion criteria. Power was not calculated to estimate sample size needed to determine statistical significance. One hundred patients treated for alcohol withdrawal was established as the target sample size for this project. Descriptive statistics were performed to analyze patient baseline characteristics and primary and secondary objective data.
Results
A total of 1,611 CIWA-Ar protocol orders were identified between January 1, 2014 and December 31, 2015.
Primary Endpoint
The average amount of lorazepam administered for the total duration on CIWA-Ar protocol was 7.9 mg (median 6, ± 8.2) among
Secondary Endpoints
On average, the total number of days spent on CIWA-Ar protocol was 3.8 (median 4, ± 1.5) in group 1 compared with 4.1 (median 4, ± 1.6) in group 2. Rate of CIWA-Ar protocol discontinuation for patients in group 1 and group 2 is shown in Figure 3.
Discussion
The purpose of this project was to evaluate gabapentin use at VAPORHCS for alcohol withdrawal and evaluate the impact on symptom management. Patients who were started on gabapentin on the initiation of the alcohol withdrawal protocol received less lorazepam dosing compared with patients who received only lorazepam for symptom management for alcohol withdrawal. Except for day 3, average lorazepam dosage per day on the alcohol withdrawal protocol was lower in patients who were also taking gabapentin.
This trend also can be seen in the recorded peak CIWA-Ar scores per day as illustrated in Figures 4 and 5.
Limitations
Prior to evaluation, power analysis was not calculated to estimate an appropriate sample size necessary to determine statistical significance. Results from this evaluation are not definitive and are meant to be hypothesis generating for future analysis.
There were several limitations that were identified throughout this project. For this review, history and extent of patient’s prior alcohol use was not assessed. Therefore, the degree of symptom severity in which patients may have experienced during withdrawal may not have been adequately matched between groups. The inherent subjectivity of CIWA-Ar scoring was considered a limitation because scores were determined by clinical interpretation among various nursing staff. As this was a retrospective review, exact timing of medications administered as well as additional supportive care measures, such as ancillary medications for symptom management, were not accounted for and controlled between groups.
Patients presenting to the emergency department or from a facility outside of VAPORHCS for acute AWS may have had incomplete documentation of the onset of symptoms on presentation or of the medications administered prior to being admitted, which may have confounded initial CIWA-Ar scoring and total duration required to be on a withdrawal protocol. Some patients may have received benzodiazepines at initial presentation prior to gabapentin initiation and may have inaccurately reflected its efficacy potential to manage symptoms without the need for lorazepam.
There were 10 patients that were identified who received gabapentin on the alcohol withdrawal protocol and did not receive any lorazepam. This retrospective review could not be determined whether these patients did not require lorazepam because initiating gabapentin reduced severity or simply because their withdrawal symptoms were not severe enough to warrant the need for lorazepam, regardless of gabapentin use.
Gabapentin dosing was not standardized among patients, averaging from 100 mg to 3,600 mg per day. This wide variation in dose may have influenced the requirement of lorazepam needed for symptom management in patients receiving minimal doses or AEs experienced in patients who received large doses. Initiation and/or select dosing of gabapentin may have been dependent on the experience of the provider and familiarity with its use in alcohol withdrawal management. Interestingly, patients with a history of withdrawal seizures (13%) were identified only within the lorazepam-only group. This could suggest that patients with prior symptoms of severe alcohol withdrawal were selected to receive lorazepam-only at the discretion of the provider.
Existing literature investigating gabapentin utilization in alcohol withdrawal has demonstrated benefit for patients with mild-to-moderate symptoms in both inpatient and outpatient studies. However, supporting evidence is limited by the differences in design, methods, and comparators within each trial. Leung and colleagues identified 5 studies that utilized gabapentin as monotherapy or in combination with other agents in alcohol withdrawal.13 Three of these studies were performed within an inpatient setting, each differing in trial design, inclusion/exclusion criteria, intervention, and outcomes. Gabapentin dosing strategies were highly variable among studies. Collectively, the differences noted make it difficult to generalize that similar outcomes would result in other patient populations. The purpose of this project was to evaluate gabapentin use at VAPORHCS for alcohol withdrawal and evaluate the impact on symptom management. Future projects could be designed to draw more specific conclusions.
Conclusion
On average, the required benzodiazepine dosage was lower with concomitant use of gabapentin in acute AWS management. The duration for patients on alcohol withdrawal protocol was not reduced with use of gabapentin. Between group (ie, history of withdrawal seizures, blood alcohol level) and among group (ie, gabapentin administration) differences prevent direct correlations to be drawn from this evaluation. Future reviews should include power analysis to establish an appropriate sample size to determine statistical significance among identified covariates. Further evaluation of the use of gabapentin for withdrawal management is warranted prior to incorporating its routine use in the current standard of care for patients experiencing acute AWS.
Acknowledgments
The authors thank Ryan Bickel, PharmD, BCCCP, Critical Care Clinical Pharmacist; Stephen M. Smith, PhD, Director of Medical Critical Care; Gordon Wong, PharmD, Clinical Applications Coordinator; and Eileen Wilbur, RPh, Research Pharmacy Supervisor.
1. Stahre M, Roeber J, Kanny D, Brewer RD, Zhang X. Contribution of excessive alcohol consumption to deaths and years of potential life lost in the United States. Prev Chronic Dis. 2014;11:E109.
2. National Institute on Drug Abuse. Military. https://www.drugabuse.gov/related-topics/military. Updated April 2016. Accessed January 10, 2018.
3. Bohnert KM, Ilgen MA, Rosen CS, Desai RA, Austin K, Blow FC. The association between substance use disorders and mortality among a cohort of veterans with posttraumatic stress disorder: variation by age cohort and mortality type. Drug Alcohol Depend. 2013;128(1-2):98-103.
4. Foy A, Kay J, Taylor A. The course of alcohol withdrawal in a general hospital. QJM. 1997;90(4):253-261.
5. Carlson RW, Kumar NN, Wong-Mckinstry E, et al. Alcohol withdrawal syndrome. Crit Care Clin. 2012;28(4):549-585.
6. National Institute for Health and Care Excellence. Alcohol use disorders: diagnosis and clinical management of alcohol-related physical complications. https://www.nice.org.uk/guidance/cg100. Published June 2010. Updated April 2017. Accessed January 10, 2018.
7. Sarff MC, Gold JA. Alcohol withdrawal syndromes in the intensive care unit. Crit Care Med. 2010;38(suppl 9):494-501.
8. U.S. Department of Veteran Affairs, U.S. Department of Defense. VA/DoD clinical practice guideline for the management of substance use disorders. https://www.healthquality.va.gov/guidelines/MH/sud/VADODSUDCPGRevised22216.pdf. Published December 2015. Accessed January 10, 2018.
9. Gold JA, Rimal B, Nolan A, Nelson LS. A strategy of escalating doses of benzodiazepines and phenobarbital administration reduces the need for mechanical ventilation in delirium tremens. Crit Care Med. 2007;35(3):724-730.
10. Amato L, Minozzi S, Davoli M. Efficacy and safety of pharmacological interventions for the treatment of the alcohol withdrawal syndrome. Cochrane Database Syst Rev. 2011(6):D008537.
11. Ntais C, Pakos E, Kyzas P, Ioannidis JP. Benzodiazepines for alcohol withdrawal. Cochrane Database Syst Rev. 2005;20(3):CD005063.
12. Bonnet U, Hamzavi-Abedi R, Specka M, Wiltfang J, Lieb B, Scherbaum N. An open trial of gabapentin in acute alcohol withdrawal using an oral loading protocol. Alcohol Alcohol. 2010;45(2):143-145.
13. Leung JG, Hall-Flavin D, Nelson S, Schmidt KA, Schak KM. Role of gabapentin in the management of alcohol withdrawal and dependence. Ann Pharmacother. 2015;49(8):897-906.
14. Johnson BA, Swift RM, Addolorato G, Ciraulo DA, Myrick H. Safety and efficacy of GABAergic medications for treating alcoholism. Alcohol Clin Exp Res. 2005;29:248-254.
15. Myrick H, Malcolm R, Randall PK, et al. A double blind trial of gabapentin vs lorazepam in the treatment of alcohol withdrawal. Alcohol Clin Exp Res. 2009;33(9):1582-1588.
16. Sullivan JT, Sykora K, Schneiderman J, Naranjo CA, Sellers EM. Assessment of alcohol withdrawal: the revised clinical institute withdrawal assessment for alcohol scale (CIWA-Ar). Br J Addict. 1989;84(11):1353-1357.
17 Cockcroft DW, Gault MH. Prediction of creatinine clearance from serum creatinine. Nephron. 1976;16(1):31-41.
18. Bergeron N, Dubois MJ, Dumont M, Dial S, Skrobik Y. Intensive care delirium screening checklist: evaluation of a new screening tool. Intensive Care Med. 2001;27(5):859-864.
Prevalence and Impact of Self-Citation in Academic Orthopedic Surgery
ABSTRACT
The h-index is a commonly utilized metric for academic productivity. Previous studies have proposed that self-citation may limit the utility of the h-index. The purpose of this study is to evaluate the impact of self-citation on the h-index among orthopedic investigators. The study cohort consisted of program directors, chairpersons, and faculty at orthopedic surgery residency programs in the United States. The Scopus database was used to determine the h-index and number of citations ± self-citations. The total number of publications was correlated with the change in the h-index via self-citation. A total of 463 researchers were included (198 National Institutes of Health-funded faculty, 147 chairpersons, 118 program directors). Of these researchers, 83.8% cited previous work at least once (mean, 123.9 ± 277.6). Self-citations accounted for 5.8% of all citations. Including these citations increased the author h-index from 18.5 ± 14.9 to 19.2 ± 15.6 (P < .001). A minority of researchers (36.3%, P < .001) had increased their h-index via self-citation (range, 0-11). The proportional increase in the h-index via self-citation was positively related to the number of publications (P < .001). While the practice of self-citation is prevalent in orthopedics, its impact on the h-index is minimal for most researchers. With more publications, researchers can increase their h-index to a greater degree via self-citation.
Continue to: The competitive nature of academic research...
The competitive nature of academic research requires objective metrics to define career end points, such as promotion and funding procurement. While various criteria are used to assess performance in academia, publications and research funding are particularly regarded.1 Quantifying research dollars is relatively straightforward, but measuring research productivity is more complex. Not all articles are created equal, and disparities exist regarding effort and the ultimate impact of articles. In 2005, a physicist created the h-index to measure both research impact and productivity.2 As a bibliometric, the h-index equals the number of publications h that have been cited at least h times. Given its simplicity, the h-index has gained wide popularity in diverse medical specialties, including orthopedic surgery.3 Other recent studies have applied the h-index to hand surgery and spine surgery.4,5
Importantly, some authors have raised concerns regarding potential limitations of the h-index. One potentially significant limitation is the ability of authors to artificially inflate their h-index via self-citation. The impact of this practice is of particular interest as the h-index becomes widely adopted as a metric for promotion at many academic institutions.6-7 Furthermore, scholarly productivity has remained a critical component of successful grant funding procurement, and future grant funding applications may evaluate the h-index.8-10
The purpose of this study is to determine the prevalence and impact of self-citation on the h-index in a large cohort of orthopedic investigators. Given their high level of investment in academic orthopedic surgery, we focused on program directors, chairpersons, and National Institutes of Health (NIH)-funded research faculty at orthopedic surgery residency programs.
METHODS
INCLUSION CRITERIA
This study qualified as non-human and non-animal research and received exemption per the standing policy of the Institutional Review Board. The Fellowship and Residency Electronic Interactive Database (FREIDA) was accessed to generate a list of orthopedic residency program directors.11 This database was also used to generate a list of allopathic orthopedic surgery residency programs. Official program websites were accessed to generate a list of orthopedic chairpersons. Lastly, the NIH RePORTER was used to generate a list of basic science orthopedic investigators who received funding anytime during 2011 to 2014.12 This methodology was used due to the lack of reporting of basic science investigators on program websites. A list of NIH-funded orthopedic investigators was cross-referenced via an online search to isolate a cohort of PhD investigators.
Orthopedic faculty were defined as chairpersons, program directors, or NIH-funded investigators. In cases of overlap, preference was given in that order. Orthopedic investigators who had not published an article after 1995 were excluded (6 chairpersons, 1 program director).
BIBLIOMETRIC ANALYSIS
While several resources exist to calculate the h-index, the Scopus database (Elsevier) is one of the easiest programs to use.13 Author entries are created via institutional affiliations, thereby alleviating the need for manual reconciliations. Investigators were identified on Scopus via “author last name” and “first name, middle initial.” For each author, publications were screened for relevance to the field of orthopedics. Affiliated institutions were cross-referenced with information obtained from individual program websites. The “view h-graph” feature was used to calculate the number of publications, h-index, and number of citations. Then, the “Exclude self-citations” feature was used to calculate the number of corrected citations and the h-index excluding self-citations. Metrics were calculated over a 2-day period.
Continue to: STATISTICAL ANALYSIS
STATISTICAL ANALYSIS
Bibliometric analyses were presented descriptively with means ± standard deviation. After testing for normality, differences in the h-index between groups were assessed via analysis of variance tests. The proportional increase in the number of citations and the h-index were calculated by dividing the difference between the before and after exclusion of self-citations by the total number of citations before exclusion. The relationship between the number of publications and the proportional change in the h-index was assessed via calculation of the Spearman correlation coefficient. The independent variable was the number of publications, and the proportional increase in the h-index via self-citation was the dependent variable. Statistical tests were performed on STATA 13 (StataCorp) and the results considered significant if P < .05. Figures were created using GraphPad Prism 6.02 Software.
RESULTS
A total of 463 orthopedic investigators were included (147 chairpersons, 118 program directors, and 198 NIH-funded faculty) (Table 1). On average, these researchers produced 72.3 ± 83.0 articles and referenced 2139 ± 3222 articles (mean, 29.6 references per article). The cumulative h-index was 19.2 ± 15.6, and was the highest among NIH-funded researchers (24.3 ± 17.0) (P < .001). In all, 83.8% of orthopedic investigators self-cited their previous work at least once, and the total number of self-citations was highest among NIH-funded investigators (221 ± 355) (P < .001). After these self-citations were excluded, the h-index changed by 0.6 ± 1.1 for all investigators, and this change was greatest among NIH-funded researchers (1.1 ± 1.3) (P < .001).
Table 1. Effect of Self-Citation on NIH-funded Investigators, Chairpersons, and Program Directors in Orthopedics
| Investigator | N (%) | Articles, n (mean ± SD) |
Total Citations (mean ± SD)
| h-index | Self-Citations (mean ± SD) | Corrected h-index | ∆ h-index |
| NIH-funded | 198 (42.8) | 87.6 ± 84.9 | 3086 ± 3799 | 24.3 ± 17.0 | 221 ± 355 | 23.2 ± 16.3 | 1.1 ± 1.3 |
| Chairperson | 147 (31.7) | 85.3 ± 95.5 | 2151 ± 3098 | 19.9 ± 15.0 | 85.2 ± 221 | 19.5 ± 14.5 | 0.4 ± 0.8 |
| Program Director | 118 (25.5) | 30.5 ± 35.9 | 536.8 ± 785 | 9.6 ± 7.2 | 8.8 ± 19.9 | 9.5 ± 7.1 | 0.1 ± 0.3 |
| Total | 463 (100) | 72.3 ± 83.0 | 2139 ± 3222 | 19.2 ± 15.6 | 123.9 ± 277.6 | 18.5 ± 14.9 | 0.6 ± 1.1 |
Abbreviation: NIH, National Institutes of Health.
Most orthopedic investigators did not increase their h-index via self-citation (63.7%, P < .001). Table 2 categorizes investigators by changes in their h-index after excluding self-citations (range, 0-11). The maximal change in the h-index was seen in the most prolific group of investigators, who produced 261.0 ± 149.3 articles. In this group, the h-index increased by 11.1% ± 5.2%. The Figure investigates the relationship between the number of articles and the proportional increase in the h-index. The number of publications was positively correlated with the change in h-index after self-citations were excluded (r = 0.448, P < .001).
Table 2. Stratification of Orthopedic Researcher Investigators by Change in h-index After Self-Citation
∆ h-index
| N (%) |
Articles (mean ± SD)
| Self-Citations (mean ± SD) |
h-index (mean ± SD) | % Increase in h-index |
| 0 | 295 (63.7) | 43.8 ± 51.3 | 27.6 ± 58.4 | 13.1 ± 10.7 | 0 |
| 1 | 101 (21.8) | 87.9 ± 68.3 | 126.0 ± 130.6 | 24.0 ± 13.3 | 5.9 ± 4.1 |
| 2 | 42 (9.1) | 141.9 ± 111.1 | 331.6 ± 318.0 | 32.4 ± 16.6 | 8.4 ± 5.5 |
| 3 | 14 (3.0) | 203.1 ± 92.6 | 611.6 ± 332.9 | 45.4 ± 14.9 | 7.6 ± 3.6 |
| 4+ | 11 (2.4) | 261.0 ± 149.3 | 1277.1 ± 692.4 | 53.1 ± 18.9 | 11.1 ± 5.2 |
DISCUSSION
The practice of self-citation is widely prevalent among experienced orthopedic investigators. However, this practice seems to have minimal impact on the h-index for most investigators. Self-citation had a measurable impact on the h-index only after an investigator had many publications. At a mean of 87.9 ± 68.3 articles, investigators had a ∆h-index of 1. This represented a mean 5.9% increase. Overall, these findings underscore the utility of the h-index in assessing scholarly impact and ameliorate concerns over bibliometric manipulation.

Among a large group of experienced orthopedic investigators, self-citation has minimal effect on the h-index. Importantly, most investigators (63.7%) did not experience a full integer increase in their h-index. At a threshold of ∆ h-index increase of 1, investigators had impressive h-indices (24.0 ± 13.3), which eclipsed those of recent studies of hand surgeons (10.2 ± 9.9) and spine surgeons (13.6 ± 8.7).4,5 This finding suggests that committees for academic promotion in orthopedic surgery may disregard the impact of self-citation on the h-index. While the thresholds for promotion have not been defined in the orthopedic literature, a study in plastic surgery established an h-index threshold of 14.5 for promotion from associate to full professor.14 It may be, however, that h-indices are higher among orthopedic surgeons, as a previous study reported an h-index of 20 among full professors.15 Future research is needed to determine thresholds for promotion within orthopedic surgery, as the h-index varies by specialty according to unique citation patterns.
Continue to: It is worth highlighting...
It is worth highlighting the academic performance of NIH-funded PhD researchers in orthopedics. Even including training grant awardees in this group, this cohort exceeded the academic productivity of their orthopedic chairpersons, as measured by the h-index. Previous studies in urology, neurosurgery, and otolaryngology have demonstrated the impact of NIH-funding on academic productivity.8-10 Ultimately, orthopedic departments could increase academic productivity by recruiting more PhD investigators with NIH funding.
In contrast to academic radiology,16 this study demonstrated a correlation between the number of publications and the increase in h-index via self-citation. Several reasons may help explain this disparity. The first reason is a technical one, as at the time of this study, the Scopus database had been updated to include citations before 1996. Considering that the h-index increases over time as older publications are cited, the exclusion of older articles is a significant limitation of previous h-index studies. Applying the same logic, the mean h-index for chairpersons of 19.9 quoted in this study contradicts a recent study, which quoted a mean h-index of 15.3.3 This previous study utilized citations that were limited to articles published after 1996.
Previous work on self-citation in the field of orthopedics has been limited to its influence on journal impact factors. Our results build on this literature in several important ways. Firstly, the calculation of a journal’s impact factor is a highly scrutinized process, and authors have criticized the mechanisms employed by editors to inflate impact factors.17 One study reported that 20% of authors have been encouraged to cite a journal during the revision process.18 Self-citation practices have been demonstrated in journals of cardiology,19 diabetes,20 anesthesia,21 and medicine.22 A study using a hypothetical model to assess the maximum potential for h-index increase by self-citation demonstrated an h-index inflation of 5 points over 20 years (5/14, 35.7%) by publishing 3 papers per year with 3 self-citations each.23 This study highlights a potential limitation of the h-index, but our study observed an h-index inflation of ≥4 in only 11 researchers (2.4%). Thus, results from our study ameliorate self-citation concerns in academic orthopedic surgery.
There are several limitations to this study that offer future areas of research. First, the validity of the h-index academic promotion in orthopedic surgery has not been evaluated. This was a motivation for the present study, and the authors have ongoing efforts to characterize the h-index in a larger cohort of orthopedic investigators. Importantly, an appropriate amount of self-citation was not established. It may be necessary for orthopedic researchers to cite their works as they become experts on a specific topic. Lastly, our analyses are prone to limitations inherent in the h-index, which does not account for author contribution or journal impact factors. Despite these limitations, we show that for most orthopedic researchers, the practice of self-citation does not impact the h-index.
In summary, self-citation is a widely prevalent practice among orthopedic investigators, but this practice has minimal impact on an author’s h-index. Approximately one third of orthopedic faculty in our study had a higher h-index due to self-citation. Greater h-index inflation through self-citation correlated with more publications. For the majority of orthopedic faculty, however, self-citation did not inflate the h-index, suggesting that promotional committees may disregard this concern when using the h-index as an adjunct measure for career advancement.
1. Atasoylu AA, Wright SM, Beasley BW, et al. Promotion criteria for clinician-educators. J Gen Intern Med. 2003;18(9):711-716.
2. Hirsch JE. An index to quantify an individual's scientific research output. Proc Natl Acad Sci U S A. 2005;102(46):16569-16572.
3. Stavrakis AI, Patel AD, Burke ZD, et al. The role of chairman and research director in influencing scholarly productivity and research funding in academic orthopaedic surgery. J Orthop Res. 2015;33(10)1407-1411. doi:10.1002/jor.22919.
4. Lopez J, Susarla SM, Swanson EW, Calotta N, Lifchez SD. The association of the H-index and academic rank among full-time academic hand surgeons affiliated with fellowship programs. J Hand Surg Am. 2015;40(7):1434-1441. doi:10.1016/j.jhsa.2015.03.026.
5. Schoenfeld AJ, Bhalla A, George J, Harris MB, Bono CM. Academic productivity and contributions to the literature among spine surgery fellowship faculty. Spine J. 2015;15(10)2126-2131. doi:10.1016/j.spinee.2015.03.026.
6. Jackson JB. Promotion at the Johns Hopkins School of Medicine. Johns Hopkins Medicine. https://www.hopkinsmedicine.org/gim/useful_links/PPC%20Promotion.pdf. Accessed February 1, 2015.
7. Appointments, promotion, and tenure. The Ohio State University School of Medicine. https://oaa.osu.edu/sites/default/files/uploads/governance-documents/college-of-medicine/surgery/Surgery_APT_5-20-14.pdf. Accessed February 1, 2015.
8. Colaco M, Svider PF, Mauro KM, Eloy JA, Jackson-Rosario I. Is there a relationship between National Institutes of Health funding and research impact on academic urology? J Urol .2013;190(3):999-1003. doi:10.1016/j.juro.2013.02.3186.
9. Svider PF, Husain Q, Folbe AJ, Couldwell WT, Liu JK, Eloy JA. Assessing National Institutes of Health funding and scholarly impact in neurological surgery. J Neurosurg. 2014;120(1):191-196. doi:10.3171/2013.8.JNS13938.
10. Svider PF, Mauro KM, Sanghvi S, Setzen M, Baredes S, Eloy JA. Is NIH funding predictive of greater research productivity and impact among academic otolaryngologists? Laryngoscope. 2013;123(1):118-122. doi:10.1002/lary.23659.
11. American Medical Association. FREIDA Online. http://www.ama-assn.org/ama/pub/education-careers/graduate-medical-education/freida-online.page? Accessed February 1, 2015.
12. NIH. Research Portfolio Online Reporting Tools. https://projectreporter.nih.gov/reporter.cfm. Accessed February 1, 2015.
13. Falagas ME, Pitsouni EI, Malietzis GA, Pappas G. Comparison of PubMed, Scopus, Web of Science, and Google Scholar: strengths and weaknesses. FASEB Journal. 2008;22(2):338-342. doi:10.1096/fj.07-9492LSF.
14. Gast KM, Kuzon WM Jr, Waljee JF. Bibliometric indices and academic promotion within plastic surgery. Plast Reconstr Surg. 2014;134(5):838e-844e. doi:10.1097/PRS.0000000000000594.
15. Svider PF, Pashkova AA, Choudhry Z, et al. Comparison of scholarly impact among surgical specialties: an examination of 2429 academic surgeons. Laryngoscope. 2013;123(4):884-889. doi:10.1002/lary.23951.
16. Rad AE, Shahgholi L, Kallmes D. Impact of self-citation on the H index in the field of academic radiology. Acad Radiol. 2012;19(4):455-457. doi:10.1016/j.acra.2011.11.013.
17. Hakkalamani S, Rawal A, Hennessy MS, Parkinson RW. The impact factor of seven orthopaedic journals: factors influencing it. J Bone Joint Surg Br. 2006;88(2):159-162. doi:10.1302/0301-620X.88B2.16983.
18. Foley JA, Della Sala S. The impact of self-citation. Cortex. 2010;46(6):802-810. doi:10.1016/j.cortex.2010.01.004.
19. Opthof T. Inflation of impact factors by journal self-citation in cardiovascular science. Neth Heart J. 2013;21(4):163-165. doi:10.1007/s12471-013-0384-0.
20. Gami AS, Montori VM, Wilczynski NL, Haynes RB. Author self-citation in the diabetes literature. CMAJ. 2004;170(13):1925-1927.
21. Fassoulaki A, Paraskeva A, Papilas K, Karabinis G. Self-citations in six anaesthesia journals and their significance in determining the impact factor. Br J Anaesth. 2000;84(2):266-269.
22. Kulkarni AV, Aziz B, Shams I, Busse JW. Author self-citation in the general medicine literature. PloS One. 2011;6(6): e20885. doi:10.1371/journal.pone.0020885.
23. Bartneck C, Kokkelmans S. Detecting h-index manipulation through self-citation analysis. Scientometrics. 2011;87(1):85-98. doi:10.1007/s11192-010-0306-5.
ABSTRACT
The h-index is a commonly utilized metric for academic productivity. Previous studies have proposed that self-citation may limit the utility of the h-index. The purpose of this study is to evaluate the impact of self-citation on the h-index among orthopedic investigators. The study cohort consisted of program directors, chairpersons, and faculty at orthopedic surgery residency programs in the United States. The Scopus database was used to determine the h-index and number of citations ± self-citations. The total number of publications was correlated with the change in the h-index via self-citation. A total of 463 researchers were included (198 National Institutes of Health-funded faculty, 147 chairpersons, 118 program directors). Of these researchers, 83.8% cited previous work at least once (mean, 123.9 ± 277.6). Self-citations accounted for 5.8% of all citations. Including these citations increased the author h-index from 18.5 ± 14.9 to 19.2 ± 15.6 (P < .001). A minority of researchers (36.3%, P < .001) had increased their h-index via self-citation (range, 0-11). The proportional increase in the h-index via self-citation was positively related to the number of publications (P < .001). While the practice of self-citation is prevalent in orthopedics, its impact on the h-index is minimal for most researchers. With more publications, researchers can increase their h-index to a greater degree via self-citation.
Continue to: The competitive nature of academic research...
The competitive nature of academic research requires objective metrics to define career end points, such as promotion and funding procurement. While various criteria are used to assess performance in academia, publications and research funding are particularly regarded.1 Quantifying research dollars is relatively straightforward, but measuring research productivity is more complex. Not all articles are created equal, and disparities exist regarding effort and the ultimate impact of articles. In 2005, a physicist created the h-index to measure both research impact and productivity.2 As a bibliometric, the h-index equals the number of publications h that have been cited at least h times. Given its simplicity, the h-index has gained wide popularity in diverse medical specialties, including orthopedic surgery.3 Other recent studies have applied the h-index to hand surgery and spine surgery.4,5
Importantly, some authors have raised concerns regarding potential limitations of the h-index. One potentially significant limitation is the ability of authors to artificially inflate their h-index via self-citation. The impact of this practice is of particular interest as the h-index becomes widely adopted as a metric for promotion at many academic institutions.6-7 Furthermore, scholarly productivity has remained a critical component of successful grant funding procurement, and future grant funding applications may evaluate the h-index.8-10
The purpose of this study is to determine the prevalence and impact of self-citation on the h-index in a large cohort of orthopedic investigators. Given their high level of investment in academic orthopedic surgery, we focused on program directors, chairpersons, and National Institutes of Health (NIH)-funded research faculty at orthopedic surgery residency programs.
METHODS
INCLUSION CRITERIA
This study qualified as non-human and non-animal research and received exemption per the standing policy of the Institutional Review Board. The Fellowship and Residency Electronic Interactive Database (FREIDA) was accessed to generate a list of orthopedic residency program directors.11 This database was also used to generate a list of allopathic orthopedic surgery residency programs. Official program websites were accessed to generate a list of orthopedic chairpersons. Lastly, the NIH RePORTER was used to generate a list of basic science orthopedic investigators who received funding anytime during 2011 to 2014.12 This methodology was used due to the lack of reporting of basic science investigators on program websites. A list of NIH-funded orthopedic investigators was cross-referenced via an online search to isolate a cohort of PhD investigators.
Orthopedic faculty were defined as chairpersons, program directors, or NIH-funded investigators. In cases of overlap, preference was given in that order. Orthopedic investigators who had not published an article after 1995 were excluded (6 chairpersons, 1 program director).
BIBLIOMETRIC ANALYSIS
While several resources exist to calculate the h-index, the Scopus database (Elsevier) is one of the easiest programs to use.13 Author entries are created via institutional affiliations, thereby alleviating the need for manual reconciliations. Investigators were identified on Scopus via “author last name” and “first name, middle initial.” For each author, publications were screened for relevance to the field of orthopedics. Affiliated institutions were cross-referenced with information obtained from individual program websites. The “view h-graph” feature was used to calculate the number of publications, h-index, and number of citations. Then, the “Exclude self-citations” feature was used to calculate the number of corrected citations and the h-index excluding self-citations. Metrics were calculated over a 2-day period.
Continue to: STATISTICAL ANALYSIS
STATISTICAL ANALYSIS
Bibliometric analyses were presented descriptively with means ± standard deviation. After testing for normality, differences in the h-index between groups were assessed via analysis of variance tests. The proportional increase in the number of citations and the h-index were calculated by dividing the difference between the before and after exclusion of self-citations by the total number of citations before exclusion. The relationship between the number of publications and the proportional change in the h-index was assessed via calculation of the Spearman correlation coefficient. The independent variable was the number of publications, and the proportional increase in the h-index via self-citation was the dependent variable. Statistical tests were performed on STATA 13 (StataCorp) and the results considered significant if P < .05. Figures were created using GraphPad Prism 6.02 Software.
RESULTS
A total of 463 orthopedic investigators were included (147 chairpersons, 118 program directors, and 198 NIH-funded faculty) (Table 1). On average, these researchers produced 72.3 ± 83.0 articles and referenced 2139 ± 3222 articles (mean, 29.6 references per article). The cumulative h-index was 19.2 ± 15.6, and was the highest among NIH-funded researchers (24.3 ± 17.0) (P < .001). In all, 83.8% of orthopedic investigators self-cited their previous work at least once, and the total number of self-citations was highest among NIH-funded investigators (221 ± 355) (P < .001). After these self-citations were excluded, the h-index changed by 0.6 ± 1.1 for all investigators, and this change was greatest among NIH-funded researchers (1.1 ± 1.3) (P < .001).
Table 1. Effect of Self-Citation on NIH-funded Investigators, Chairpersons, and Program Directors in Orthopedics
| Investigator | N (%) | Articles, n (mean ± SD) |
Total Citations (mean ± SD)
| h-index | Self-Citations (mean ± SD) | Corrected h-index | ∆ h-index |
| NIH-funded | 198 (42.8) | 87.6 ± 84.9 | 3086 ± 3799 | 24.3 ± 17.0 | 221 ± 355 | 23.2 ± 16.3 | 1.1 ± 1.3 |
| Chairperson | 147 (31.7) | 85.3 ± 95.5 | 2151 ± 3098 | 19.9 ± 15.0 | 85.2 ± 221 | 19.5 ± 14.5 | 0.4 ± 0.8 |
| Program Director | 118 (25.5) | 30.5 ± 35.9 | 536.8 ± 785 | 9.6 ± 7.2 | 8.8 ± 19.9 | 9.5 ± 7.1 | 0.1 ± 0.3 |
| Total | 463 (100) | 72.3 ± 83.0 | 2139 ± 3222 | 19.2 ± 15.6 | 123.9 ± 277.6 | 18.5 ± 14.9 | 0.6 ± 1.1 |
Abbreviation: NIH, National Institutes of Health.
Most orthopedic investigators did not increase their h-index via self-citation (63.7%, P < .001). Table 2 categorizes investigators by changes in their h-index after excluding self-citations (range, 0-11). The maximal change in the h-index was seen in the most prolific group of investigators, who produced 261.0 ± 149.3 articles. In this group, the h-index increased by 11.1% ± 5.2%. The Figure investigates the relationship between the number of articles and the proportional increase in the h-index. The number of publications was positively correlated with the change in h-index after self-citations were excluded (r = 0.448, P < .001).
Table 2. Stratification of Orthopedic Researcher Investigators by Change in h-index After Self-Citation
∆ h-index
| N (%) |
Articles (mean ± SD)
| Self-Citations (mean ± SD) |
h-index (mean ± SD) | % Increase in h-index |
| 0 | 295 (63.7) | 43.8 ± 51.3 | 27.6 ± 58.4 | 13.1 ± 10.7 | 0 |
| 1 | 101 (21.8) | 87.9 ± 68.3 | 126.0 ± 130.6 | 24.0 ± 13.3 | 5.9 ± 4.1 |
| 2 | 42 (9.1) | 141.9 ± 111.1 | 331.6 ± 318.0 | 32.4 ± 16.6 | 8.4 ± 5.5 |
| 3 | 14 (3.0) | 203.1 ± 92.6 | 611.6 ± 332.9 | 45.4 ± 14.9 | 7.6 ± 3.6 |
| 4+ | 11 (2.4) | 261.0 ± 149.3 | 1277.1 ± 692.4 | 53.1 ± 18.9 | 11.1 ± 5.2 |
DISCUSSION
The practice of self-citation is widely prevalent among experienced orthopedic investigators. However, this practice seems to have minimal impact on the h-index for most investigators. Self-citation had a measurable impact on the h-index only after an investigator had many publications. At a mean of 87.9 ± 68.3 articles, investigators had a ∆h-index of 1. This represented a mean 5.9% increase. Overall, these findings underscore the utility of the h-index in assessing scholarly impact and ameliorate concerns over bibliometric manipulation.
Among a large group of experienced orthopedic investigators, self-citation has minimal effect on the h-index. Importantly, most investigators (63.7%) did not experience a full integer increase in their h-index. At a threshold of ∆ h-index increase of 1, investigators had impressive h-indices (24.0 ± 13.3), which eclipsed those of recent studies of hand surgeons (10.2 ± 9.9) and spine surgeons (13.6 ± 8.7).4,5 This finding suggests that committees for academic promotion in orthopedic surgery may disregard the impact of self-citation on the h-index. While the thresholds for promotion have not been defined in the orthopedic literature, a study in plastic surgery established an h-index threshold of 14.5 for promotion from associate to full professor.14 It may be, however, that h-indices are higher among orthopedic surgeons, as a previous study reported an h-index of 20 among full professors.15 Future research is needed to determine thresholds for promotion within orthopedic surgery, as the h-index varies by specialty according to unique citation patterns.
Continue to: It is worth highlighting...
It is worth highlighting the academic performance of NIH-funded PhD researchers in orthopedics. Even including training grant awardees in this group, this cohort exceeded the academic productivity of their orthopedic chairpersons, as measured by the h-index. Previous studies in urology, neurosurgery, and otolaryngology have demonstrated the impact of NIH-funding on academic productivity.8-10 Ultimately, orthopedic departments could increase academic productivity by recruiting more PhD investigators with NIH funding.
In contrast to academic radiology,16 this study demonstrated a correlation between the number of publications and the increase in h-index via self-citation. Several reasons may help explain this disparity. The first reason is a technical one, as at the time of this study, the Scopus database had been updated to include citations before 1996. Considering that the h-index increases over time as older publications are cited, the exclusion of older articles is a significant limitation of previous h-index studies. Applying the same logic, the mean h-index for chairpersons of 19.9 quoted in this study contradicts a recent study, which quoted a mean h-index of 15.3.3 This previous study utilized citations that were limited to articles published after 1996.
Previous work on self-citation in the field of orthopedics has been limited to its influence on journal impact factors. Our results build on this literature in several important ways. Firstly, the calculation of a journal’s impact factor is a highly scrutinized process, and authors have criticized the mechanisms employed by editors to inflate impact factors.17 One study reported that 20% of authors have been encouraged to cite a journal during the revision process.18 Self-citation practices have been demonstrated in journals of cardiology,19 diabetes,20 anesthesia,21 and medicine.22 A study using a hypothetical model to assess the maximum potential for h-index increase by self-citation demonstrated an h-index inflation of 5 points over 20 years (5/14, 35.7%) by publishing 3 papers per year with 3 self-citations each.23 This study highlights a potential limitation of the h-index, but our study observed an h-index inflation of ≥4 in only 11 researchers (2.4%). Thus, results from our study ameliorate self-citation concerns in academic orthopedic surgery.
There are several limitations to this study that offer future areas of research. First, the validity of the h-index academic promotion in orthopedic surgery has not been evaluated. This was a motivation for the present study, and the authors have ongoing efforts to characterize the h-index in a larger cohort of orthopedic investigators. Importantly, an appropriate amount of self-citation was not established. It may be necessary for orthopedic researchers to cite their works as they become experts on a specific topic. Lastly, our analyses are prone to limitations inherent in the h-index, which does not account for author contribution or journal impact factors. Despite these limitations, we show that for most orthopedic researchers, the practice of self-citation does not impact the h-index.
In summary, self-citation is a widely prevalent practice among orthopedic investigators, but this practice has minimal impact on an author’s h-index. Approximately one third of orthopedic faculty in our study had a higher h-index due to self-citation. Greater h-index inflation through self-citation correlated with more publications. For the majority of orthopedic faculty, however, self-citation did not inflate the h-index, suggesting that promotional committees may disregard this concern when using the h-index as an adjunct measure for career advancement.
1. Atasoylu AA, Wright SM, Beasley BW, et al. Promotion criteria for clinician-educators. J Gen Intern Med. 2003;18(9):711-716.
2. Hirsch JE. An index to quantify an individual's scientific research output. Proc Natl Acad Sci U S A. 2005;102(46):16569-16572.
3. Stavrakis AI, Patel AD, Burke ZD, et al. The role of chairman and research director in influencing scholarly productivity and research funding in academic orthopaedic surgery. J Orthop Res. 2015;33(10)1407-1411. doi:10.1002/jor.22919.
4. Lopez J, Susarla SM, Swanson EW, Calotta N, Lifchez SD. The association of the H-index and academic rank among full-time academic hand surgeons affiliated with fellowship programs. J Hand Surg Am. 2015;40(7):1434-1441. doi:10.1016/j.jhsa.2015.03.026.
5. Schoenfeld AJ, Bhalla A, George J, Harris MB, Bono CM. Academic productivity and contributions to the literature among spine surgery fellowship faculty. Spine J. 2015;15(10)2126-2131. doi:10.1016/j.spinee.2015.03.026.
6. Jackson JB. Promotion at the Johns Hopkins School of Medicine. Johns Hopkins Medicine. https://www.hopkinsmedicine.org/gim/useful_links/PPC%20Promotion.pdf. Accessed February 1, 2015.
7. Appointments, promotion, and tenure. The Ohio State University School of Medicine. https://oaa.osu.edu/sites/default/files/uploads/governance-documents/college-of-medicine/surgery/Surgery_APT_5-20-14.pdf. Accessed February 1, 2015.
8. Colaco M, Svider PF, Mauro KM, Eloy JA, Jackson-Rosario I. Is there a relationship between National Institutes of Health funding and research impact on academic urology? J Urol .2013;190(3):999-1003. doi:10.1016/j.juro.2013.02.3186.
9. Svider PF, Husain Q, Folbe AJ, Couldwell WT, Liu JK, Eloy JA. Assessing National Institutes of Health funding and scholarly impact in neurological surgery. J Neurosurg. 2014;120(1):191-196. doi:10.3171/2013.8.JNS13938.
10. Svider PF, Mauro KM, Sanghvi S, Setzen M, Baredes S, Eloy JA. Is NIH funding predictive of greater research productivity and impact among academic otolaryngologists? Laryngoscope. 2013;123(1):118-122. doi:10.1002/lary.23659.
11. American Medical Association. FREIDA Online. http://www.ama-assn.org/ama/pub/education-careers/graduate-medical-education/freida-online.page? Accessed February 1, 2015.
12. NIH. Research Portfolio Online Reporting Tools. https://projectreporter.nih.gov/reporter.cfm. Accessed February 1, 2015.
13. Falagas ME, Pitsouni EI, Malietzis GA, Pappas G. Comparison of PubMed, Scopus, Web of Science, and Google Scholar: strengths and weaknesses. FASEB Journal. 2008;22(2):338-342. doi:10.1096/fj.07-9492LSF.
14. Gast KM, Kuzon WM Jr, Waljee JF. Bibliometric indices and academic promotion within plastic surgery. Plast Reconstr Surg. 2014;134(5):838e-844e. doi:10.1097/PRS.0000000000000594.
15. Svider PF, Pashkova AA, Choudhry Z, et al. Comparison of scholarly impact among surgical specialties: an examination of 2429 academic surgeons. Laryngoscope. 2013;123(4):884-889. doi:10.1002/lary.23951.
16. Rad AE, Shahgholi L, Kallmes D. Impact of self-citation on the H index in the field of academic radiology. Acad Radiol. 2012;19(4):455-457. doi:10.1016/j.acra.2011.11.013.
17. Hakkalamani S, Rawal A, Hennessy MS, Parkinson RW. The impact factor of seven orthopaedic journals: factors influencing it. J Bone Joint Surg Br. 2006;88(2):159-162. doi:10.1302/0301-620X.88B2.16983.
18. Foley JA, Della Sala S. The impact of self-citation. Cortex. 2010;46(6):802-810. doi:10.1016/j.cortex.2010.01.004.
19. Opthof T. Inflation of impact factors by journal self-citation in cardiovascular science. Neth Heart J. 2013;21(4):163-165. doi:10.1007/s12471-013-0384-0.
20. Gami AS, Montori VM, Wilczynski NL, Haynes RB. Author self-citation in the diabetes literature. CMAJ. 2004;170(13):1925-1927.
21. Fassoulaki A, Paraskeva A, Papilas K, Karabinis G. Self-citations in six anaesthesia journals and their significance in determining the impact factor. Br J Anaesth. 2000;84(2):266-269.
22. Kulkarni AV, Aziz B, Shams I, Busse JW. Author self-citation in the general medicine literature. PloS One. 2011;6(6): e20885. doi:10.1371/journal.pone.0020885.
23. Bartneck C, Kokkelmans S. Detecting h-index manipulation through self-citation analysis. Scientometrics. 2011;87(1):85-98. doi:10.1007/s11192-010-0306-5.
TAKE-HOME POINTS
- In all, 83.8% of orthopedic surgeons cite previous work at least once.
- Self-citations account for only 5.8% of all citations.
- Including self-citations increases the mean h-index from 18.5 ± 14.9 to 19.2 ± 15.6 (P < .001).
- The magnitude of increase in h-index via self-citation is proportional to the career number of publications.
- Overall, while prevalent, the practice of self-citation has minimal impact on an academic orthopedic surgeon’s h-index.
