User login
FDA approves ‘game changer’ semaglutide for weight loss
The U.S. Food and Drug Administration has approved a 2.4 mg/week subcutaneous dose of the glucagonlike peptide–1 (GLP-1) receptor agonist semaglutide (Wegovy, Novo Nordisk) for weight loss.
Specifically, this drug format and dosage are approved as an adjunct to a reduced-calorie diet and increased physical activity to treat adults who have obesity (body mass index [BMI] ≥ 30 kg/m2) or are overweight (BMI ≥ 27 kg/m2) with at least one weight-related comorbidity.
Semaglutide “induces weight loss by reducing hunger, increasing feelings of fullness, and thereby helping people eat less and reduce their calorie intake,” according to a company statement.
Novo Nordisk plans to launch Wegovy later this month in the United States. The prescribing information can be found here.
This weight-loss drug is currently under review by the European Medicines Agency.
Several experts told Medscape that they believe the approval of this drug – as long as it is reimbursed – has the potential to change the paradigm of care when it comes to weight loss.
‘Game changer’ drug tested in STEP clinical trial program
The favorable FDA ruling is based on results from the Semaglutide Treatment Effect in People With Obesity (STEP) program of four phase 3 clinical trials that tested the drug’s safety and efficacy in more than 4,500 adults with overweight or obesity obesity who were randomized to receive a reduced a calorie meal plan and increased physical activity (placebo) or this lifestyle intervention plus semaglutide.
The four 68-week trials of subcutaneous semaglutide 2.4 mg/week versus placebo were published in February and March 2021.
As previously reported by this news organization, all trials were in adults with overweight or obesity:
- was in 1,961 adults (N Engl J Med. 2021 March 18;384:989-1002).
- was in 1,210 adults who also had diabetes (Lancet. 2021 Mar 13;397;971-84).
- was in 611 adults, where those in the treatment group also underwent an intensive lifestyle intervention (JAMA. 2021 Feb 24;325:1403-13.
- was in 803 adults who had reached a target dose of 2.4 mg semaglutide after a 20-week run-in (and the trial examined further weight loss in the subsequent 48 weeks) (JAMA 2021 Mar 23;325:1414-25).
In the STEP 1, 2, and 4 trials of individuals with overweight and obesity, those in the semaglutide groups attained a 15%-18% weight loss over 68 weeks.
The dosage was well-tolerated. The most common side effects were gastrointestinal, and they were transient and mild or moderate in severity.
The side effects, contraindications, and a black box warning about thyroid C-cell tumors are spelled out in the prescribing information.
A coauthor of the STEP 1 trial, Rachel Batterham, MBBS, PhD, of the Centre for Obesity Research at University College London, said at the time of publication: “The findings of this study represent a major breakthrough for improving the health of people with obesity.”
“No other drug has come close to producing this level of weight loss – this really is a gamechanger. For the first time, people can achieve through drugs what was only possible through weight-loss surgery,” she added.
Welcome Addition, But Will Insurance Coverage, Price Thwart Access?
Thomas A. Wadden, PhD, from the Perelman School of Medicine at the University of Pennsylvania, Philadelphia, and lead author of STEP 3, commented in an email to this news organization that “semaglutide 2.4 mg appears to be the breakthrough in weight management that healthcare providers and their patients with obesity have been waiting for.”
The mean 15% weight loss at 68 weeks is nearly twice what is seen with other FDA-approved anti-obesity medications, he noted, and moreover, 70% of patients taking semaglutide lost at least 10% of their initial weight, which is associated with clinically meaningful improvements in obesity-related type 2 diabetes, hypertension, obstructive sleep apnea, and impaired quality of life.
And “nearly one-third of users are likely to lose 20% or more of their starting weight, an outcome which eludes traditional diet and exercise interventions and which approaches weight losses produced by the most widely performed bariatric surgery, sleeve gastrectomy (with mean losses of 25% of initial weight at 1 year).” Dr. Wadden stressed.
Thus “the efficacy of semaglutide 2.4 mg, combined with its favorable safety profile, makes this medication a potential game changer,” he summarized, echoing Dr. Batterham.
However, insurance coverage and price could block uptake.
“I hope that the millions of people – in the U.S. and worldwide – who could benefit from this medication eventually will have access to it,” said Dr. Wadden. “In the U.S., the coverage of anti-obesity medications by insurers and employers will need to improve to ensure this happens, and the medication must be reasonably priced. These changes are critical to making this medication the game changer it could be.”
“This approval is an important development,” Scott Kahan, MD, director of the National Center for Weight and Wellness, Washington, who was not involved in the clinical trials of this drug, similarly wrote in an email.
“In a field with relatively few medication options, the availability of additional obesity pharmacotherapy agents is welcome,” he said. “In particular, semaglutide has shown impressive efficacy and safety data; as such it should be a valuable clinical option for many patients.”
However, it is concerning that “access to obesity treatments has traditionally been a challenge,” Dr. Kahan warned. “Novo Nordisk’s other obesity medication, Saxenda, has been a valuable tool, but one that exceedingly few patients are able to utilize due to minimal insurance reimbursement and very high cost.”
“It remains to be seen how accessible semaglutide will be for patients,” according to Dr. Kahan, “Still, if the challenge of limited coverage and high cost can be mitigated, this medication has a chance to significantly change the current paradigm of care, which until till now has included minimal use of pharmacotherapy outside specialty clinics,” he maintains.
Lower-dose injectable and pill already approved for diabetes
Subcutaneous semaglutide at doses up to 1 mg/week (Ozempic, Novo Nordisk), which comes as prefilled pens at doses of 0.5 mg or 1.0 mg, is already approved for the treatment of type 2 diabetes.
The company is also applying for approval for a higher dose of semaglutide, 2 mg/week, for use in type 2 diabetes, and has just resubmitted its label expansion application to the FDA, after the agency issued a refusal to file letter in March.
And in September 2019, the FDA approved oral semaglutide (Rybelsus, Novo Nordisk), in doses of 7 and 14 mg/day, to improve glycemic control in type 2 diabetes, making it the first GLP-1 receptor agonist available in tablet form.
CVOT and oral format trials for obesity on the horizon
The ongoing Semaglutide Effects on Heart Disease and Stroke in Patients With Overweight or Obesity (SELECT) trial will shed light on cardiovascular outcomes after 2.5-5 years in patients with cardiovascular disease and overweight or obesity but without type 2 diabetes. Participants will receive semaglutide in doses up to a maximum of 2.4 mg/week, or placebo, as an adjunct to lifestyle recommendations focused on cardiovascular risk reduction. The study is expected to complete in 2023.
And Novo Nordisk plans to initiate a global 68-week phase 3 trial in the second half of 2021 on the efficacy and safety of oral semaglutide 50 mg compared with placebo in 1000 people with obesity or overweight and comorbidities.
A version of this article first appeared on Medscape.com.
This article was updated 6/7/21.
Not your ordinary neuropathy
She has had a diagnosis of type 2 diabetes for the past 4 years. She initially presented with polyuria/polydipsia and a hemoglobin A1c level of 9.5. She has previously not tolerated metformin, and did not want to take any subsequent medications. She was seen 4 months ago and at that time had an A1c level of 12.5. She decided she wanted to really treat her diabetes as well as she could. She started consuming a low carbohydrate diet, restarted metformin and began using a continuous glucose monitor. She also started taking nighttime glargine insulin, and mealtime insulin apart. She reports she lost 20 pounds over the past 4 months, her blood sugars now run between 100-120 fasting, and up to 180 before meals. She has had a severe, sharp pain in both of her feet over the past month that is interfering with sleep and makes walking painful for her. An exam reveals hyperesthesia of both feet, and her A1c level is 7.5. What is the most likely cause of her neuropathic symptoms?

A. Vitamin B12 deficiency
B. Diabetic neuropathy
C. Insulin neuritis
D. Charcot-Marie-Tooth disease
The most likely cause
In this case, certainly considering vitamin B12 deficiency is reasonable. It is highly unlikely though, given the rapidity of onset of symptoms, and that the patient has been on metformin for a very short period of time. Chronic metformin use is associated with low B12 levels, and the American Diabetes Association has advised that regular monitoring of vitamin B12 levels should be done on patients who are on long-term metformin.1
Diabetic neuropathy is also unlikely, given the rapidity of symptoms in this patient. What is most likely in this patient is treatment-induced neuropathy (TIN), first described with the name “insulin neuritis”.
Research on TIN
Gibbons and colleagues evaluated 16 patients with diabetes with recent marked, rapid improvement in glycemic control who developed a sudden, painful neuropathy.2 All developed symptoms within 8 weeks of intensive glucose control, with 69% having autonomic dysfunction as well, and all developing worsening retinopathy.
Gibbons and Freeman did a retrospective study of patients referred to a diabetic neuropathy clinic over a 5-year period to try to understand how prevalent TIN is.3
A total of 954 patients were evaluated for diabetic neuropathy. Treatment induced neuropathy was defined as a painful neuropathy and/or autonomic dysfunction occurring within 8 weeks of intensified treatment and a drop of the A1c level greater than 2 over a 3-month period.
A total of 104 patients (10.9%) met the criteria for treatment induced neuropathy. Patients who had a decrease in A1c had a much greater chance of developing a painful or autonomic neuropathy than patients who had no change in A1c (P < .0001). The same patients had a much higher risk of developing retinopathy (P < .001). The greater the reduction in A1c, the greater the risk. Patients whose A1c decreased by 2%-3% over 3 months had an absolute risk of 20%, whereas those with a A1c decease of greater than 4% had an 80% absolute risk.
Siddique and colleagues reported on three cases with very different clinical presentations of TIN.4 One patient had an acute third nerve palsy, another patient had a lumbosacral radiculoplexus neuropathy, and the third patient presented with a diffuse painful sensory neuropathy and postural hypotension.
Most patients improve over time from their neuropathic symptoms, with better recovery in patients with type 1 diabetes.2
Pearl
Strongly consider treatment induced neuropathy in your patients with diabetes who present with acute painful neuropathy and/or autonomic dysfunction in the setting of rapid improvement of glucose control.
Dr. Paauw is professor of medicine in the division of general internal medicine at the University of Washington, Seattle, and serves as third-year medical student clerkship director at the University of Washington. He is a member of the editorial advisory board of Internal Medicine News. Dr. Paauw has no conflicts to disclose. Contact him at [email protected].
References
1. American Diabetes Association. Diabetes Care. 2019 Jan;42(Suppl 1):S90-102.
2. Gibbons CH and Freeman R. Ann Neurol 2010; 67:534–41.
3. Gibbons CH and Freeman R. Brain. 2015;138:43-52.
4. Siddique N et al. Endocrinol Diabetes Metab Case Rep. 2020 Feb 26;2020:19-0140.
She has had a diagnosis of type 2 diabetes for the past 4 years. She initially presented with polyuria/polydipsia and a hemoglobin A1c level of 9.5. She has previously not tolerated metformin, and did not want to take any subsequent medications. She was seen 4 months ago and at that time had an A1c level of 12.5. She decided she wanted to really treat her diabetes as well as she could. She started consuming a low carbohydrate diet, restarted metformin and began using a continuous glucose monitor. She also started taking nighttime glargine insulin, and mealtime insulin apart. She reports she lost 20 pounds over the past 4 months, her blood sugars now run between 100-120 fasting, and up to 180 before meals. She has had a severe, sharp pain in both of her feet over the past month that is interfering with sleep and makes walking painful for her. An exam reveals hyperesthesia of both feet, and her A1c level is 7.5. What is the most likely cause of her neuropathic symptoms?
A. Vitamin B12 deficiency
B. Diabetic neuropathy
C. Insulin neuritis
D. Charcot-Marie-Tooth disease
The most likely cause
In this case, certainly considering vitamin B12 deficiency is reasonable. It is highly unlikely though, given the rapidity of onset of symptoms, and that the patient has been on metformin for a very short period of time. Chronic metformin use is associated with low B12 levels, and the American Diabetes Association has advised that regular monitoring of vitamin B12 levels should be done on patients who are on long-term metformin.1
Diabetic neuropathy is also unlikely, given the rapidity of symptoms in this patient. What is most likely in this patient is treatment-induced neuropathy (TIN), first described with the name “insulin neuritis”.
Research on TIN
Gibbons and colleagues evaluated 16 patients with diabetes with recent marked, rapid improvement in glycemic control who developed a sudden, painful neuropathy.2 All developed symptoms within 8 weeks of intensive glucose control, with 69% having autonomic dysfunction as well, and all developing worsening retinopathy.
Gibbons and Freeman did a retrospective study of patients referred to a diabetic neuropathy clinic over a 5-year period to try to understand how prevalent TIN is.3
A total of 954 patients were evaluated for diabetic neuropathy. Treatment induced neuropathy was defined as a painful neuropathy and/or autonomic dysfunction occurring within 8 weeks of intensified treatment and a drop of the A1c level greater than 2 over a 3-month period.
A total of 104 patients (10.9%) met the criteria for treatment induced neuropathy. Patients who had a decrease in A1c had a much greater chance of developing a painful or autonomic neuropathy than patients who had no change in A1c (P < .0001). The same patients had a much higher risk of developing retinopathy (P < .001). The greater the reduction in A1c, the greater the risk. Patients whose A1c decreased by 2%-3% over 3 months had an absolute risk of 20%, whereas those with a A1c decease of greater than 4% had an 80% absolute risk.
Siddique and colleagues reported on three cases with very different clinical presentations of TIN.4 One patient had an acute third nerve palsy, another patient had a lumbosacral radiculoplexus neuropathy, and the third patient presented with a diffuse painful sensory neuropathy and postural hypotension.
Most patients improve over time from their neuropathic symptoms, with better recovery in patients with type 1 diabetes.2
Pearl
Strongly consider treatment induced neuropathy in your patients with diabetes who present with acute painful neuropathy and/or autonomic dysfunction in the setting of rapid improvement of glucose control.
Dr. Paauw is professor of medicine in the division of general internal medicine at the University of Washington, Seattle, and serves as third-year medical student clerkship director at the University of Washington. He is a member of the editorial advisory board of Internal Medicine News. Dr. Paauw has no conflicts to disclose. Contact him at [email protected].
References
1. American Diabetes Association. Diabetes Care. 2019 Jan;42(Suppl 1):S90-102.
2. Gibbons CH and Freeman R. Ann Neurol 2010; 67:534–41.
3. Gibbons CH and Freeman R. Brain. 2015;138:43-52.
4. Siddique N et al. Endocrinol Diabetes Metab Case Rep. 2020 Feb 26;2020:19-0140.
A1c below prediabetes cutoff linked to subclinical atherosclerosis
, according to an analysis of data on almost 4,000 middle-aged individuals.

“If one looks at the incidence of generalized subclinical atherosclerosis, we are not talking small numbers,” senior study author Valentin Fuster, MD, PhD, said in an interview. “We are talking about between 45% and 82% of this middle-age population that already has atherosclerotic disease subclinically.
“Actually,” he added, “the disease was extensive in 5%-30% of these individuals of middle age.”
The study included 3,973 participants from the Progression of Early Subclinical Atherosclerosis study who did not have diabetes. A1c showed an association with the prevalence and multiterritorial extent of subclinical atherosclerosis as measured by two-dimensional ultrasound and coronary artery calcium score (CACS; P < .001). For example, those with A1c above 6.1% (133 participants) had a 33.1% rate of generalized subclinical atherosclerosis, compared with 4.9% for those with A1c below 4.8% (243), the lowest-score group in the study.
Patients in the subprediabetes band, between 5.0% and 5.5%, had significantly higher rates of generalized subclinical atherosclerosis than did the lowest-score group: 8% in the 4.9%-5.0% group (375 participants); 9.9% in the 5.1%-5.2% range (687); 10.3% in the 5.3%-5.4% group (928); and 11.5% in the 5.5%-5.6% group (842).
Those in the 5.1%-5.2% and 5/3%-5.4% A1c groups had a 27% greater chance of having subclinical atherosclerosis, while those in the 5.5%-5.6% group had a 36% greater risk, according to an odds ratio analysis adjusted for established cardiovascular risk factors. The risks were even higher for patients with prediabetes, the researchers reported in the Journal of the American College of Cardiology.
A call for earlier intervention
Notably, the study found that fasting plasma glucose testing did not yield a similar association between A1c and atherosclerosis.
“The message is that we all talk about people when they are close to the development of cardiovascular events, and here we are talking about people who we should pay attention to much earlier,” said Dr. Fuster, physician-in-chief at Icahn School of Medicine at Mount Sinai in New York and director of the National Center for Cardiovascular Investigation in Madrid, where the observational study originated said. “People should be sensitized to HbA1c much more than they would’ve been in the past, and I think this study actually validates that.”
Christie Ballantyne, MD, noted in an interview that these findings support the utility of A1c for predicting CVD risk.

“I think more and more we should be ordering a HbA1c” during routine physical exams, Dr. Ballantyne said. “You don’t have to be obese to get it; there are lots of people, maybe they’re slightly overweight. It’s a reasonable test to be getting when you get to middle age and older to get an idea for assessing for both developing diabetes and also the presence of atherosclerosis and the risk for having cardiovascular events.”
Dr. Ballantyne, chief of cardiology at Baylor College of Medicine and director of cardiovascular disease prevention at Methodist DeBakey Heart Center in Houston, coauthored an editorial comment on the study.
Clinicians typically start to manage CVD and diabetes risk “late in the process,” Dr. Ballantyne said. This study suggested that earlier use of antidiabetes therapies, namely peptide-1 agonists and semisynthetic glucagon-like peptide-2 inhibitors, may be warranted in patients with intermediate risk of CVD.
“It’s just more data for the rationale that, perhaps we could end up doing trials to show we can take high-risk people and prevent them from getting both heart disease and diabetes,” Dr. Ballantyne added. “Could we start a little earlier with better precision?”
These finding don’t yet call for a change in how cardiologists and endocrinologists manage patients on the cusp of prediabetes, said Paul S. Jellinger, MD, of Hollywood, Fla., and a professor at the University of Miami. “The endpoint of subclinical atherosclerosis does not necessarily translate into the harder endpoint of CVD events, although there is certainly reason to believe it does,” he said in an interview, noting that he’s often used CACS to stratify atherosclerotic CVD risk in patients.

“I will now consider extending that assessment to patients with lower A1c levels,” he said.
If future studies validate this finding, he said, “serious consideration will have to be made for treating the very large numbers of patients with A1c levels in the prediabetic range and below with antidiabetic agents that have ASCVD prevention properties while lowering A1c. We have those agents today.”
The Progression of Early Subclinical Atherosclerosis study received funding from the National Center for Cardiovascular Investigation in Madrid, Santander Bank, and the Carlos III Health Institute in Madrid. Dr. Fuster had no disclosures. Dr. Ballantyne disclosed receiving research funding through his institution from Abbott Diagnostic, Akcea, Amgen, Esperion, Ionis, Novartis, Regeneron, and Roche Diagnostic; and has served as a consultant for Abbott Diagnostics, Althera, Amarin, Amgen, Arrowhead, AstraZeneca, Corvidia, Denka Seiken, Esperion, Genentech, Gilead, Matinas BioPharma, New Amsterdam, Novartis, Novo Nordisk, Pfizer, Regeneron, Roche Diagnostic and Sanofi-Synthélabo.
Dr. Jellinger had no disclosures.
, according to an analysis of data on almost 4,000 middle-aged individuals.
“If one looks at the incidence of generalized subclinical atherosclerosis, we are not talking small numbers,” senior study author Valentin Fuster, MD, PhD, said in an interview. “We are talking about between 45% and 82% of this middle-age population that already has atherosclerotic disease subclinically.
“Actually,” he added, “the disease was extensive in 5%-30% of these individuals of middle age.”
The study included 3,973 participants from the Progression of Early Subclinical Atherosclerosis study who did not have diabetes. A1c showed an association with the prevalence and multiterritorial extent of subclinical atherosclerosis as measured by two-dimensional ultrasound and coronary artery calcium score (CACS; P < .001). For example, those with A1c above 6.1% (133 participants) had a 33.1% rate of generalized subclinical atherosclerosis, compared with 4.9% for those with A1c below 4.8% (243), the lowest-score group in the study.
Patients in the subprediabetes band, between 5.0% and 5.5%, had significantly higher rates of generalized subclinical atherosclerosis than did the lowest-score group: 8% in the 4.9%-5.0% group (375 participants); 9.9% in the 5.1%-5.2% range (687); 10.3% in the 5.3%-5.4% group (928); and 11.5% in the 5.5%-5.6% group (842).
Those in the 5.1%-5.2% and 5/3%-5.4% A1c groups had a 27% greater chance of having subclinical atherosclerosis, while those in the 5.5%-5.6% group had a 36% greater risk, according to an odds ratio analysis adjusted for established cardiovascular risk factors. The risks were even higher for patients with prediabetes, the researchers reported in the Journal of the American College of Cardiology.
A call for earlier intervention
Notably, the study found that fasting plasma glucose testing did not yield a similar association between A1c and atherosclerosis.
“The message is that we all talk about people when they are close to the development of cardiovascular events, and here we are talking about people who we should pay attention to much earlier,” said Dr. Fuster, physician-in-chief at Icahn School of Medicine at Mount Sinai in New York and director of the National Center for Cardiovascular Investigation in Madrid, where the observational study originated said. “People should be sensitized to HbA1c much more than they would’ve been in the past, and I think this study actually validates that.”
Christie Ballantyne, MD, noted in an interview that these findings support the utility of A1c for predicting CVD risk.
“I think more and more we should be ordering a HbA1c” during routine physical exams, Dr. Ballantyne said. “You don’t have to be obese to get it; there are lots of people, maybe they’re slightly overweight. It’s a reasonable test to be getting when you get to middle age and older to get an idea for assessing for both developing diabetes and also the presence of atherosclerosis and the risk for having cardiovascular events.”
Dr. Ballantyne, chief of cardiology at Baylor College of Medicine and director of cardiovascular disease prevention at Methodist DeBakey Heart Center in Houston, coauthored an editorial comment on the study.
Clinicians typically start to manage CVD and diabetes risk “late in the process,” Dr. Ballantyne said. This study suggested that earlier use of antidiabetes therapies, namely peptide-1 agonists and semisynthetic glucagon-like peptide-2 inhibitors, may be warranted in patients with intermediate risk of CVD.
“It’s just more data for the rationale that, perhaps we could end up doing trials to show we can take high-risk people and prevent them from getting both heart disease and diabetes,” Dr. Ballantyne added. “Could we start a little earlier with better precision?”
These finding don’t yet call for a change in how cardiologists and endocrinologists manage patients on the cusp of prediabetes, said Paul S. Jellinger, MD, of Hollywood, Fla., and a professor at the University of Miami. “The endpoint of subclinical atherosclerosis does not necessarily translate into the harder endpoint of CVD events, although there is certainly reason to believe it does,” he said in an interview, noting that he’s often used CACS to stratify atherosclerotic CVD risk in patients.
“I will now consider extending that assessment to patients with lower A1c levels,” he said.
If future studies validate this finding, he said, “serious consideration will have to be made for treating the very large numbers of patients with A1c levels in the prediabetic range and below with antidiabetic agents that have ASCVD prevention properties while lowering A1c. We have those agents today.”
The Progression of Early Subclinical Atherosclerosis study received funding from the National Center for Cardiovascular Investigation in Madrid, Santander Bank, and the Carlos III Health Institute in Madrid. Dr. Fuster had no disclosures. Dr. Ballantyne disclosed receiving research funding through his institution from Abbott Diagnostic, Akcea, Amgen, Esperion, Ionis, Novartis, Regeneron, and Roche Diagnostic; and has served as a consultant for Abbott Diagnostics, Althera, Amarin, Amgen, Arrowhead, AstraZeneca, Corvidia, Denka Seiken, Esperion, Genentech, Gilead, Matinas BioPharma, New Amsterdam, Novartis, Novo Nordisk, Pfizer, Regeneron, Roche Diagnostic and Sanofi-Synthélabo.
Dr. Jellinger had no disclosures.
FROM THE JOURNAL OF THE AMERICAN COLLEGE OF CARDIOLOGY
Dapagliflozin’s cost-effectiveness ‘intermediate’ for HFrEF
Although recent trial results have established the sodium glucose cotransporter 2 inhibitors dapagliflozin and empagliflozin as a key new part of the recommended multidrug treatment regimen for patients with heart failure with reduced ejection fraction, the current U.S. cost for dapagliflozin means it has merely “intermediate” value when it comes to cost-effectiveness.

A typical regimen with dapagliflozin to treat patients with heart failure with reduced ejection fraction (HFrEF) costs about $474/month or roughly $5,700/year based on Medicare pricing. After factoring in the incremental clinical benefits producing by dapagliflozin seen in the DAPA-HF pivotal trial that helped establish its role, this price produces a cost per quality-adjusted life-year (QALY) gain of about $84,000, which puts dapagliflozin squarely in the intermediate range for value set in 2014 by a task force of the American College of Cardiology and the American Heart Association.
This cost-effectiveness value depends largely on the proven efficacy of dapagliflozin (Farxiga) for decreasing the incidence of cardiovascular death among treated patients with HFrEF, and puts the drug’s value roughly on par with another agent recently approved to treat such patients, sacubitril/valsartan (Entresto), which carries a cost-effectiveness value of about $45,000/QALY.
The U.S. cost per QALY for dapagliflozin treatment of patients with HFrEF dwarfed the value numbers calculated for several other countries that were generally one-tenth this size. This disparity stemmed from both the relatively high price for dapagliflozin in the U.S. compared with other countries – nearly tenfold higher – and relatively higher costs for all types of U.S. medical care, Justin T. Parizo, MD, and coauthors said in a recent report. But the cost, and hence the cost per QALY, of dapagliflozin may soon drop because certain patents on the drug expired in October 2020, added Dr. Parizo, a cardiologist at Stanford (Calif.) University, and associates. Despite the expired patents, as of June 2021 no generic form of dapagliflozin appeared available for U.S. sale.
Medicare patients pay about $1,630/year out-of-pocket
“A key caveat” to this finding for dapagliflozin is that being cost-effective “is not by itself a mandate for routine clinical use,” Derek S. Chew, MD, and Daniel B. Mark, MD, said in an editorial that accompanied the report.
A major stumbling block for widespread U.S. prescribing of dapagliflozin to patients with HFrEF is its overall price tag for U.S. patients, estimated at $12 billion/year, as well as an out-of-pocket annual cost for individual Medicare patients of roughly $1,630/year. Adding this out-of-pocket cost to the copay for sacubitril/valsartan and two other much less expensive drug classes that together form the current mainstay, quadruple-drug regimen for HFrEF treatment means a potential annual cost paid by each Medicare patient of about $3,000, wrote Dr. Chew, a cardiologist, and Dr. Mark, a cardiologist and professor, both at Duke University, Durham, N.C.
They cited the precedent of the “unexpectedly slow” and “anemic” uptake of sacubitril/valsartan since its U.S. approval in 2015, a cost-effective agent with “comparable clinical effectiveness” to dapagliflozin. “Even with full inclusion [of sacubitril/valsartan] on formularies and elimination of preapproval requirements, use remains very low, and patient-borne out-of-pocket costs may be a key factor,” wrote Dr. Chew and Dr. Mark. They cited a results from a study that showed abandonment of new prescriptions at retail U.S. pharmacies spiked to a 60% rate when out-of-pocket cost exceeded $500.
More than what patients ‘can afford or are willing to spend’
The estimated $3,000-plus total out-of-pocket cost currently borne by some Medicare beneficiaries with HFrEF who have to shell out for both sacubitril/valsartan and dapagliflozin “appears to substantially exceed what many patients with heart failure can afford or are willing to spend,” wrote Dr. Chew and Dr. Mark.
Dr. Parizo and coauthors developed their cost-effectiveness model for dapagliflozin in treating HFrEF using primarily data collected in the DAPA-HF trial, which proved the efficacy of the drug for reducing cardiovascular deaths or acute heart failure events that led to hospitalization or intravenous outpatient treatment in more than 4,700 randomized patients with HFrEF. The trial enrolled roughly similar numbers of patients with or without type 2 diabetes.
The model showed an overall incremental cost-effectiveness ratio of $83,650/QALY, which was about the same regardless of whether patients also had type 2 diabetes. On a more granular level, the cost-effectiveness value estimate was $78,483/QALY in patients with mild health-status impairment due to their heart failure, and $97,608/QALY in patients with moderate impairment, a finding that underscores the importance of starting dapagliflozin treatment early in the course of HFrEF when disease effects are less severe. The analysis could not address value in patients with more advanced heart failure and in New York Heart Association functional class IV because fewer than 1% of patients in DAPA-HF were in this category.
Drug cost was a major determinant of cost-effectiveness. A 50% drop in cost from the Medicare benchmark of $473.64/month resulted in an incremental cost-effectiveness ratio of about $45,000/QALY (putting it into the high-value category based on the 2014 ACC/AHA formula), while a 50% rise in price yielded a value of nearly $123,000/QALY (still in the intermediate range, which spans from $50,000/QALY to $150,000/QALY). No other cost parameters had a meaningful effect on the cost-effectiveness calculation. The analyses also showed that using the basic cost assumptions, treatment with dapagliflozin needs to persist and remain effective for at least 44 months to produce a cost per QALY that’s less than $150,000. The authors stressed that their analysis considered heart failure effects and did not account for added benefit from treatment with dapagliflozin on preservation of renal function.
While it’s indisputable that treatment with dapagliflozin decreases health care costs by, for example, reducing hospitalizations for heart failure, each hospitalization costs just over $12,000, according to the assumptions made by Dr. Parizo and coauthors. But given dapagliflozin’s impact on this outcome, this cost saving translates into about $500/patient during 18 months on treatment (the median duration of treatment in DAPA-HF), which means the savings barely counterbalances the current cost of dapagliflozin treatment for 1 month, noted Dr. Chew and Dr. Mark.
The DAPA-HF trial was sponsored by AstraZeneca, the company that markets dapagliflozin (Farxiga). Dr. Parizo had no disclosures and none of his coauthors had a relationship with AstraZeneca. Dr. Chew had no disclosures. Dr. Mark has received research grants from HeartFlow, Mayo Clinic, and Merck.
Although recent trial results have established the sodium glucose cotransporter 2 inhibitors dapagliflozin and empagliflozin as a key new part of the recommended multidrug treatment regimen for patients with heart failure with reduced ejection fraction, the current U.S. cost for dapagliflozin means it has merely “intermediate” value when it comes to cost-effectiveness.
A typical regimen with dapagliflozin to treat patients with heart failure with reduced ejection fraction (HFrEF) costs about $474/month or roughly $5,700/year based on Medicare pricing. After factoring in the incremental clinical benefits producing by dapagliflozin seen in the DAPA-HF pivotal trial that helped establish its role, this price produces a cost per quality-adjusted life-year (QALY) gain of about $84,000, which puts dapagliflozin squarely in the intermediate range for value set in 2014 by a task force of the American College of Cardiology and the American Heart Association.
This cost-effectiveness value depends largely on the proven efficacy of dapagliflozin (Farxiga) for decreasing the incidence of cardiovascular death among treated patients with HFrEF, and puts the drug’s value roughly on par with another agent recently approved to treat such patients, sacubitril/valsartan (Entresto), which carries a cost-effectiveness value of about $45,000/QALY.
The U.S. cost per QALY for dapagliflozin treatment of patients with HFrEF dwarfed the value numbers calculated for several other countries that were generally one-tenth this size. This disparity stemmed from both the relatively high price for dapagliflozin in the U.S. compared with other countries – nearly tenfold higher – and relatively higher costs for all types of U.S. medical care, Justin T. Parizo, MD, and coauthors said in a recent report. But the cost, and hence the cost per QALY, of dapagliflozin may soon drop because certain patents on the drug expired in October 2020, added Dr. Parizo, a cardiologist at Stanford (Calif.) University, and associates. Despite the expired patents, as of June 2021 no generic form of dapagliflozin appeared available for U.S. sale.
Medicare patients pay about $1,630/year out-of-pocket
“A key caveat” to this finding for dapagliflozin is that being cost-effective “is not by itself a mandate for routine clinical use,” Derek S. Chew, MD, and Daniel B. Mark, MD, said in an editorial that accompanied the report.
A major stumbling block for widespread U.S. prescribing of dapagliflozin to patients with HFrEF is its overall price tag for U.S. patients, estimated at $12 billion/year, as well as an out-of-pocket annual cost for individual Medicare patients of roughly $1,630/year. Adding this out-of-pocket cost to the copay for sacubitril/valsartan and two other much less expensive drug classes that together form the current mainstay, quadruple-drug regimen for HFrEF treatment means a potential annual cost paid by each Medicare patient of about $3,000, wrote Dr. Chew, a cardiologist, and Dr. Mark, a cardiologist and professor, both at Duke University, Durham, N.C.
They cited the precedent of the “unexpectedly slow” and “anemic” uptake of sacubitril/valsartan since its U.S. approval in 2015, a cost-effective agent with “comparable clinical effectiveness” to dapagliflozin. “Even with full inclusion [of sacubitril/valsartan] on formularies and elimination of preapproval requirements, use remains very low, and patient-borne out-of-pocket costs may be a key factor,” wrote Dr. Chew and Dr. Mark. They cited a results from a study that showed abandonment of new prescriptions at retail U.S. pharmacies spiked to a 60% rate when out-of-pocket cost exceeded $500.
More than what patients ‘can afford or are willing to spend’
The estimated $3,000-plus total out-of-pocket cost currently borne by some Medicare beneficiaries with HFrEF who have to shell out for both sacubitril/valsartan and dapagliflozin “appears to substantially exceed what many patients with heart failure can afford or are willing to spend,” wrote Dr. Chew and Dr. Mark.
Dr. Parizo and coauthors developed their cost-effectiveness model for dapagliflozin in treating HFrEF using primarily data collected in the DAPA-HF trial, which proved the efficacy of the drug for reducing cardiovascular deaths or acute heart failure events that led to hospitalization or intravenous outpatient treatment in more than 4,700 randomized patients with HFrEF. The trial enrolled roughly similar numbers of patients with or without type 2 diabetes.
The model showed an overall incremental cost-effectiveness ratio of $83,650/QALY, which was about the same regardless of whether patients also had type 2 diabetes. On a more granular level, the cost-effectiveness value estimate was $78,483/QALY in patients with mild health-status impairment due to their heart failure, and $97,608/QALY in patients with moderate impairment, a finding that underscores the importance of starting dapagliflozin treatment early in the course of HFrEF when disease effects are less severe. The analysis could not address value in patients with more advanced heart failure and in New York Heart Association functional class IV because fewer than 1% of patients in DAPA-HF were in this category.
Drug cost was a major determinant of cost-effectiveness. A 50% drop in cost from the Medicare benchmark of $473.64/month resulted in an incremental cost-effectiveness ratio of about $45,000/QALY (putting it into the high-value category based on the 2014 ACC/AHA formula), while a 50% rise in price yielded a value of nearly $123,000/QALY (still in the intermediate range, which spans from $50,000/QALY to $150,000/QALY). No other cost parameters had a meaningful effect on the cost-effectiveness calculation. The analyses also showed that using the basic cost assumptions, treatment with dapagliflozin needs to persist and remain effective for at least 44 months to produce a cost per QALY that’s less than $150,000. The authors stressed that their analysis considered heart failure effects and did not account for added benefit from treatment with dapagliflozin on preservation of renal function.
While it’s indisputable that treatment with dapagliflozin decreases health care costs by, for example, reducing hospitalizations for heart failure, each hospitalization costs just over $12,000, according to the assumptions made by Dr. Parizo and coauthors. But given dapagliflozin’s impact on this outcome, this cost saving translates into about $500/patient during 18 months on treatment (the median duration of treatment in DAPA-HF), which means the savings barely counterbalances the current cost of dapagliflozin treatment for 1 month, noted Dr. Chew and Dr. Mark.
The DAPA-HF trial was sponsored by AstraZeneca, the company that markets dapagliflozin (Farxiga). Dr. Parizo had no disclosures and none of his coauthors had a relationship with AstraZeneca. Dr. Chew had no disclosures. Dr. Mark has received research grants from HeartFlow, Mayo Clinic, and Merck.
FROM JAMA CARDIOLOGY
Prediabetes linked to higher CVD and CKD rates
in a study of nearly 337,000 people included in the UK Biobank database.
The findings suggest that people with prediabetes have “heightened risk even without progression to type 2 diabetes,” Michael C. Honigberg, MD, said at the annual scientific sessions of the American College of Cardiology.
“Hemoglobin A1c may be better considered as a continuous measure of risk rather than dichotomized” as either less than 6.5%, or 6.5% or higher, the usual threshold defining people with type 2 diabetes, said Dr. Honigberg, a cardiologist at Massachusetts General Hospital in Boston.
‘Prediabetes is not a benign entity’
“Our findings reinforce the notion that A1c represents a continuum of risk, with elevated risks observed, especially for atherosclerotic cardiovascular disease [ASCVD], at levels where some clinicians wouldn’t think twice about them. Prediabetes is not a benign entity in the middle-aged population we studied,” Dr. Honigberg said in an interview. “Risks are higher in individuals with type 2 diabetes,” he stressed, “however, prediabetes is so much more common that it appears to confer similar cardio, renal, and metabolic risks at a population level.”
Results from prior observational studies also showed elevated incidence rate of cardiovascular disease events in people with prediabetes, including a 2010 report based on data from about 11,000 U.S. residents, and in a more recent meta-analysis of 129 studies involving more than 10 million people. The new report by Dr. Honigberg “is the first to comprehensively evaluate diverse cardio-renal-metabolic outcomes across a range of A1c levels using a very large, contemporary database,” he noted. In addition, most prior reports did not include chronic kidney disease as an examined outcome.
The primary endpoint examined in the new analysis was the combined incidence during a median follow-up of just over 11 years of ASCVD events (coronary artery disease, ischemic stroke, or peripheral artery disease), CKD, or heart failure among 336,709 adults in the UK Biobank who at baseline had none of these conditions nor type 1 diabetes.
The vast majority, 82%, were normoglycemic at baseline, based on having an A1c of less than 5.7%; 14% had prediabetes, with an A1c of 5.7%-6.4%; and 4% had type 2 diabetes based on an A1c of at least 6.5% or on insulin treatment. Patients averaged about 57 years of age, slightly more than half were women, and average body mass index was in the overweight category except for those with type 2 diabetes.
The primary endpoint, the combined incidence of ASCVD, CKD, and heart failure, was 24% among those with type 2 diabetes, 14% in those with prediabetes, and 8% in those who were normoglycemic at entry. Concurrently with the report, the results appeared online. Most of these events involved ASCVD, which occurred in 11% of those in the prediabetes subgroup (roughly four-fifths of the events in this subgroup), and in 17% of those with type 2 diabetes (nearly three-quarters of the events in this subgroup).
In an analysis that adjusted for more than a dozen demographic and clinical factors, the presence of prediabetes linked with significant increases in the incidence rate of all three outcomes compared with people who were normoglycemic at baseline. The analysis also identified an A1c level of 5.0% as linked with the lowest incidence of each of the three adverse outcomes. And a very granular analysis suggested that a significantly elevated risk for ASCVD first appeared when A1c levels were in the range of 5.4%-5.7%; a significantly increased incidence of CKD became apparent once A1c was in the range of 6.2%-6.5%; and a significantly increased incidence of heart failure began to manifest once A1c levels reached at least 7.0%.
Need for comprehensive cardiometabolic risk management
The findings “highlight the importance of identifying and comprehensively managing cardiometabolic risk in people with prediabetes, including dietary modification, exercise, weight loss and obesity management, smoking cessation, and attention to hypertension and hypercholesterolemia,” Dr. Honigberg said. While these data cannot address the appropriateness of using novel drug interventions in people with prediabetes, they suggest that people with prediabetes should be the focus of future prevention trials testing agents such as sodium-glucose cotransporter 2 inhibitors.
“These data help us discuss risk with patients [with prediabetes], and reemphasize the importance of guideline-directed preventive care,” said Vijay Nambi, MD, PhD, a preventive cardiologist and lipid specialist at Baylor College of Medicine and the Michael E. DeBakey VA Medical Center in Houston, who was not involved with the study.
An additional analysis reported by Dr. Honigberg examined the risk among people with prediabetes who also were current or former smokers and in the top tertile of the prediabetes study population for systolic blood pressure, high non-HDL cholesterol, and C-reactive protein (a marker of inflammation). This very high-risk subgroup of people with prediabetes had incidence rates for ASCVD events and for heart failure that tracked identically to those with type 2 diabetes. However. the incidence rate for CKD in these high-risk people with prediabetes remained below that of patients with type 2 diabetes.
Dr. Honigberg had no disclosures. Dr. Nambi has received research funding from Amgen, Merck, and Roche.
FROM ACC 2021
Pericardial fat an independent risk factor for heart failure
Pericardial fat is associated with a heightened risk for heart failure, particularly in women, new research suggests.
In a prospective cohort study of nearly 7,000 individuals, excess pericardial fat was linked to a higher risk for heart failure, even after adjustment for established risk factors for heart failure.
Women with high pericardial fat volume (PFV), defined as more than 70 cm3 or 2.4 fluid ounces, had double the risk of developing heart failure. For men, high PFV, defined as more than 120 cm3 or 4.0 fluid ounces, was associated with a 50% increase in the risk for heart failure.
The findings were published in the Journal of the American College of Cardiology.
“People will ask why should they measure fat around the heart. Why can’t they just take the waist circumference or body mass index as a measure for increased risk?” lead author Satish Kenchaiah, MD, MPH, Icahn School of Medicine at Mount Sinai, New York, said in an interview.
“Yet, when we adjusted for waist circumference, hip circumference, waist to hip ratio, and other known variables, pericardial fat was still associated with an increased risk of heart failure. This tells me that it is not just overall fat in the body but something about its location around the heart that is playing a role,” Dr. Kenchaiah said.
“Now that we have found an association between any amount of fat around the pericardium and heart failure, it gives us an impetus to build future research on identifying how exactly these fat deposits influence the development of cardiomyopathy,” he said.
Dr. Kenchaiah and colleagues investigated the association of pericardial fat with incident heart failure by examining chest CT scans from 6,785 participants (3,584 women and 3,201 men aged 45-84 years) in the Multi-Ethnic Study of Atherosclerosis.
The participants were from four different ethnic groups: 38% were White; 28% were Black, 22% were Hispanic, and 12% were Chinese American. They were recruited between July 17, 2000, and Aug. 31, 2002, from six communities in the United States: Baltimore and Baltimore County; Chicago; Forsyth County, N.C.; Los Angeles County northern Manhattan and the Bronx, New York; and St. Paul, Minn.
All participants were free of cardiovascular disease at baseline.
The researchers followed participants for more than 17 years. During this time, 385 (5.7%; 164 women and 221 men) developed newly diagnosed heart failure.
In women, the hazard ratio for every 42 cm3 increase in PFV was 1.44 (95% confidence interval, 1.21-1.71; P < .001). In men, the HR was 1.13 (95% CI, 1.01-1.27; P = .03).
High PVF conferred a twofold greater risk for heart failure in women (HR, 2.06; 95% CI, 1.48-2.87; P < .001) and a 53% higher risk in men (HR, 1.53; 95% CI, 1.13-2.07; P = .006).
These associations remained significant after further adjustment for circulating markers of systemic inflammation (that is, C-reactive protein and interleukin-6), and abdominal subcutaneous or visceral fat.
They also found that the heightened risk persisted, even after adjustment for established risk factors for heart failure, such as age, cigarette smoking, alcohol consumption, sedentary lifestyle, high blood pressure, high blood sugar, high cholesterol, and myocardial infarction.
Results were similar among all of the ethnic groups studied.
A surprise finding
“The most surprising part of this study was that the risk for heart failure with increased pericardial fat does not seem to be explained by obesity and systemic inflammation alone,” Andreas P. Kalogeropoulos, MD, MPH, PhD, Stony Brook (N.Y.) University, said in an interview.
“If pericardial fat was merely a proxy for increased visceral fat, one would expect the association of pericardial fat with heart failure risk to go away after factoring in abdominal CT findings, which was not the case here. Also, accounting for inflammatory markers did not change things dramatically. However, we need to be careful here, as abdominal CT scans have not been done simultaneously with the pericardial fat scans in the study,” said Dr. Kalogeropoulos, who coauthored an accompanying editorial with Michael E. Hall, MD, University of Mississippi Medical Center, Jackson.
The other striking finding, although not entirely surprising, was the stronger association of pericardial fat with heart failure risk in women, he noted.
“Although several clues have been reported pointing to women being more sensitive to the adverse cardiac effects of pericardial fat, this is the first large prospective study to connect the dots and show much higher risk in women in a convincing way. For the record, this is the first prospective study to show the connection between pericardial fat and heart failure risk altogether,” Dr. Kalogeropoulos said.
“Obviously, we need to do more work to see how we can use the important findings of Kenchaiah and colleagues to reduce risk for heart failure among patients with increased pericardial fat, especially women. For starters, we would need a way to identify these patients,” he said. “In this aspect, it is encouraging that pericardial fat can be measured in low-radiation CT scans, similar to those used for coronary calcium, and that automation technology to speed up pericardial fat measurements is already in the pipeline.
“The next step would be to see what kind of interventions would reduce risk for heart failure in these patients,” he added. “Weight loss would be an obvious thing, but novel agents with favorable cardiometabolic effects, like newer antidiabetic medications, are intriguing options, too.”
The study was supported by the National Heart, Lung, and Blood Institute and the National Institutes of Health. Dr. Kenchaiah and Dr. Kalogeropoulos reported no relevant financial relationships.
A version of this article first appeared on Medscape.com.
‘A better picture’: First AACE guidelines on diabetes technology
The American Association of Clinical Endocrinology (AACE) has issued its first-ever official guidelines addressing the use of advanced technologies in the management of people with diabetes.

The guidelines cover use of continuous glucose monitoring (CGM), insulin pumps, connected pens, automated insulin delivery systems, telemedicine technologies, and smartphone apps. They also address safety considerations, special situations such as hospitalization, and implementation in clinical practice.
They were presented on May 28 at the annual scientific & clinical congress of the American Association of Clinical Endocrinologists and simultaneously published in Endocrine Practice.
Previous AACE guidance on the clinical use of insulin pumps and CGM over the past decade has been published in the form of consensus or position statements rather than official evidence-based guidelines, task force cochair George Grunberger, MD, of the Grunberger Diabetes Institute, Bloomfield Hills, Mich., explained.
“There’s never really been, until now, hardcore evidence, [with] peer-reviewed, quality trials published in the literature to go after the evidence that is required for guidelines. ... This is not an opinion piece or position statement.”
The problem with that strict approach to “guidelines” is how quickly the diabetes technology field is evolving, he acknowledged. “It’s frustrating because we know what’s [coming up], but we can’t put it in a guideline because it hasn’t been published yet.”
In an AACE podcast, Dr. Grunberger said the guidelines will likely become a “living” document, along the lines of the American Diabetes Association’s annual Standards of Care, as “any cutoff date is arbitrary. More and more papers will be published on these technologies. ... This is certainly not a static field.”
In the meantime, task force cochair and author Jennifer Sherr, MD, PhD, a pediatric endocrinologist, said she hopes the guidelines will help to reduce insurance company barriers to use of the currently available technologies.
“I am very hopeful that these guidelines will also encourage payers to change their stance. And I think that we as a community can continue to advocate and inform them of these guidelines so they can appropriately change their coverage practices,” added Dr. Sherr, of Yale University, New Haven, Conn.
Recommendations address CGM, pumps, and connected systems
In the guidelines, CGM is “strongly recommended for all persons with diabetes treated with intensive insulin therapy, defined as three or more injections of insulin per day or the use of an insulin pump.” For those with diabetes who use CGM, “priority metrics” include a “time in range” of greater than 70% from 14 days of active use. Targets for mean glucose should be individualized, with glycemic variability 36% or lower.
Further specific CGM target metrics are given for people with type 1 diabetes, older/high risk individuals, and for pregnant women. The recommendations align with those issued in a 2019 joint consensus statement on CGM time-in-range endorsed by several organizations, including AACE.
In response to an audience question about whether AACE is advising that time-in-range replace A1c for glycemia assessment, Dr. Sherr responded: “I think currently we’re not in a position where we can completely replace A1c with time in range. However, I’m hopeful that in future years we’ll see further data gathered ... to allow for that recommendation to occur.”
For now, she said, “What we really want to hone in on in the guidelines is that time-in-range and use of CGM truly allow clinicians to better understand how to optimize care for their persons with diabetes. It gives us a better picture. It’s not just a number of whether we’re hitting target. It tells us whether we need to attack time above range or time below range. So we really think it’s critical for clinical care.”
The document also provides specifics about real-time versus intermittently scanned CGM and use of diagnostic/professional CGM.
The “insulin delivery technologies” section covers use of connected pens, insulin pumps without CGM, insulin pumps with separate CGM, and the more advanced combined insulin pump-CGM systems including those with low-glucose suspend, predictive low-glucose suspend, and hybrid closed-loops (sometimes called the artificial pancreas).
In general, these automated insulin delivery systems (artificial pancreas), “are strongly recommended for all persons with [type 1 diabetes], since their use has been shown to increase time in range, especially in the overnight period, without causing an increased risk of hypoglycemia,” Dr. Sherr observed.
Other tech topics: Apps, telemedicine, and safety
The new guidelines say that “clinically validated” smartphone apps should be recommended to help teach or reinforce diabetes self-management skills and provide support and encouragement for healthy behaviors around food and exercise.
Dr. Grunberger pointed out: “As we know, there are tons of apps out there, and patients are using them. The problem is that very few of them have actually been validated in clinical trials in published peer-reviewed [journals].”
He recommended a joint statement on diabetes apps from the American Diabetes Association and the European Association for the Study of Diabetes that was initially discussed at the 2019 EASD meeting, as reported by this news organization, and subsequently published in January 2020 in Diabetes Care and Diabetologia.
“Telemedicine, including periodic phone calls, smartphone-web interactions ... by health care professionals ... is strongly recommended to treat persons with diabetes, provide diabetes education, remotely monitor glucose and/or insulin data to indicate the need for therapy adjustments, and improve diabetes-related outcomes/control with better engagement,” the document says.
Safety concerns addressed include the issue of certain medications interfering with CGM [readings] ... including acetaminophen, high-dose vitamin C, and hydroxyurea, as well as cautions about what to do in the event of device malfunction and assessing that the patient is sufficiently trained in proper device use. Criteria for insulin pump discontinuation are also given.
Implementation: Who will be prescribing? ‘This is not for amateurs’
A final section on implementation recommends that “initiation and use of diabetes technology should be implemented by health care professionals who are trained, committed, and experienced to prescribe and direct the use of these tools. Clinicians should have the infrastructure to support the needs of persons with diabetes using the technology.”
Dr. Grunberger commented: “I think the key is going to be who should be doing this? What is the role of a clinical endocrinologist in the future? What is our responsibility, [since] we don’t have the manpower and womanpower to take care of all these people as these technologies advance? It’s our responsibility to provide these hopefully valued recommendations as a resource for those who want to know more about it.”
However, he noted, “This is not for amateurs. If you want to actually use this in your practice, you need the infrastructure, the expertise, the training, the dedication, and the energy to be there for the patients all the time ... This clinical practice guideline is a foundation.”
Dr. Sherr added: “To me, it’s really thinking about ... changing our mindset from who is an appropriate candidate to who can benefit and how vast a group that entails ... I’m hopeful that we will see more technology use through continued conversations with our patients with diabetes, and hopefully through more clinicians being excited to be part of this revolution.”
Dr. Grunberger has reported being on speakers bureaus for Eli Lilly, Novo Nordisk, and Abbott. Dr. Sherr has reported being a consultant and speaker for Lilly and Medtronic Diabetes, a consultant for Insulet and Sanofi, and on advisory boards for Bigfoot Biomedical, Cecelia Health, Insulet, JDRF T1D fund, and Medtronic.
A version of this article first appeared on Medscape.com.
The American Association of Clinical Endocrinology (AACE) has issued its first-ever official guidelines addressing the use of advanced technologies in the management of people with diabetes.
The guidelines cover use of continuous glucose monitoring (CGM), insulin pumps, connected pens, automated insulin delivery systems, telemedicine technologies, and smartphone apps. They also address safety considerations, special situations such as hospitalization, and implementation in clinical practice.
They were presented on May 28 at the annual scientific & clinical congress of the American Association of Clinical Endocrinologists and simultaneously published in Endocrine Practice.
Previous AACE guidance on the clinical use of insulin pumps and CGM over the past decade has been published in the form of consensus or position statements rather than official evidence-based guidelines, task force cochair George Grunberger, MD, of the Grunberger Diabetes Institute, Bloomfield Hills, Mich., explained.
“There’s never really been, until now, hardcore evidence, [with] peer-reviewed, quality trials published in the literature to go after the evidence that is required for guidelines. ... This is not an opinion piece or position statement.”
The problem with that strict approach to “guidelines” is how quickly the diabetes technology field is evolving, he acknowledged. “It’s frustrating because we know what’s [coming up], but we can’t put it in a guideline because it hasn’t been published yet.”
In an AACE podcast, Dr. Grunberger said the guidelines will likely become a “living” document, along the lines of the American Diabetes Association’s annual Standards of Care, as “any cutoff date is arbitrary. More and more papers will be published on these technologies. ... This is certainly not a static field.”
In the meantime, task force cochair and author Jennifer Sherr, MD, PhD, a pediatric endocrinologist, said she hopes the guidelines will help to reduce insurance company barriers to use of the currently available technologies.
“I am very hopeful that these guidelines will also encourage payers to change their stance. And I think that we as a community can continue to advocate and inform them of these guidelines so they can appropriately change their coverage practices,” added Dr. Sherr, of Yale University, New Haven, Conn.
Recommendations address CGM, pumps, and connected systems
In the guidelines, CGM is “strongly recommended for all persons with diabetes treated with intensive insulin therapy, defined as three or more injections of insulin per day or the use of an insulin pump.” For those with diabetes who use CGM, “priority metrics” include a “time in range” of greater than 70% from 14 days of active use. Targets for mean glucose should be individualized, with glycemic variability 36% or lower.
Further specific CGM target metrics are given for people with type 1 diabetes, older/high risk individuals, and for pregnant women. The recommendations align with those issued in a 2019 joint consensus statement on CGM time-in-range endorsed by several organizations, including AACE.
In response to an audience question about whether AACE is advising that time-in-range replace A1c for glycemia assessment, Dr. Sherr responded: “I think currently we’re not in a position where we can completely replace A1c with time in range. However, I’m hopeful that in future years we’ll see further data gathered ... to allow for that recommendation to occur.”
For now, she said, “What we really want to hone in on in the guidelines is that time-in-range and use of CGM truly allow clinicians to better understand how to optimize care for their persons with diabetes. It gives us a better picture. It’s not just a number of whether we’re hitting target. It tells us whether we need to attack time above range or time below range. So we really think it’s critical for clinical care.”
The document also provides specifics about real-time versus intermittently scanned CGM and use of diagnostic/professional CGM.
The “insulin delivery technologies” section covers use of connected pens, insulin pumps without CGM, insulin pumps with separate CGM, and the more advanced combined insulin pump-CGM systems including those with low-glucose suspend, predictive low-glucose suspend, and hybrid closed-loops (sometimes called the artificial pancreas).
In general, these automated insulin delivery systems (artificial pancreas), “are strongly recommended for all persons with [type 1 diabetes], since their use has been shown to increase time in range, especially in the overnight period, without causing an increased risk of hypoglycemia,” Dr. Sherr observed.
Other tech topics: Apps, telemedicine, and safety
The new guidelines say that “clinically validated” smartphone apps should be recommended to help teach or reinforce diabetes self-management skills and provide support and encouragement for healthy behaviors around food and exercise.
Dr. Grunberger pointed out: “As we know, there are tons of apps out there, and patients are using them. The problem is that very few of them have actually been validated in clinical trials in published peer-reviewed [journals].”
He recommended a joint statement on diabetes apps from the American Diabetes Association and the European Association for the Study of Diabetes that was initially discussed at the 2019 EASD meeting, as reported by this news organization, and subsequently published in January 2020 in Diabetes Care and Diabetologia.
“Telemedicine, including periodic phone calls, smartphone-web interactions ... by health care professionals ... is strongly recommended to treat persons with diabetes, provide diabetes education, remotely monitor glucose and/or insulin data to indicate the need for therapy adjustments, and improve diabetes-related outcomes/control with better engagement,” the document says.
Safety concerns addressed include the issue of certain medications interfering with CGM [readings] ... including acetaminophen, high-dose vitamin C, and hydroxyurea, as well as cautions about what to do in the event of device malfunction and assessing that the patient is sufficiently trained in proper device use. Criteria for insulin pump discontinuation are also given.
Implementation: Who will be prescribing? ‘This is not for amateurs’
A final section on implementation recommends that “initiation and use of diabetes technology should be implemented by health care professionals who are trained, committed, and experienced to prescribe and direct the use of these tools. Clinicians should have the infrastructure to support the needs of persons with diabetes using the technology.”
Dr. Grunberger commented: “I think the key is going to be who should be doing this? What is the role of a clinical endocrinologist in the future? What is our responsibility, [since] we don’t have the manpower and womanpower to take care of all these people as these technologies advance? It’s our responsibility to provide these hopefully valued recommendations as a resource for those who want to know more about it.”
However, he noted, “This is not for amateurs. If you want to actually use this in your practice, you need the infrastructure, the expertise, the training, the dedication, and the energy to be there for the patients all the time ... This clinical practice guideline is a foundation.”
Dr. Sherr added: “To me, it’s really thinking about ... changing our mindset from who is an appropriate candidate to who can benefit and how vast a group that entails ... I’m hopeful that we will see more technology use through continued conversations with our patients with diabetes, and hopefully through more clinicians being excited to be part of this revolution.”
Dr. Grunberger has reported being on speakers bureaus for Eli Lilly, Novo Nordisk, and Abbott. Dr. Sherr has reported being a consultant and speaker for Lilly and Medtronic Diabetes, a consultant for Insulet and Sanofi, and on advisory boards for Bigfoot Biomedical, Cecelia Health, Insulet, JDRF T1D fund, and Medtronic.
A version of this article first appeared on Medscape.com.
Semaglutide boosts weight loss following endoscopic gastroplasty
Combining minimally invasive endoscopic sleeve gastroplasty with a weekly injection of the glucagonlike peptide–1 agonist semaglutide (Ozempic, Novo Nordisk) leads to significantly greater weight loss than ESG alone in patients with diabetes and excess weight who are not candidates for bariatric surgery, new research shows.
During minimally invasive ESG, a flexible endoscope equipped with an endoscopic suturing device is inserted down the esophagus and into the stomach. The endoscopist then applies the sutures to the upper portion of the stomach, minimizing its size to restrict the amount of food a patient can ingest.
“Our stomachs can stretch back a bit, but we can use the suturing device again,” explained the lead investigator of the research Anna Carolina Hoff, MD, founder and clinical director of Angioskope Brazil in São José dos Campos.
“It’s important that patients with diabetes lose as much weight as possible because, if they lose about 10% of their total body weight, they have a great improvement in their glycemic levels, and some patients can even stop taking their [antidiabetic] medications,” Dr. Hoff said in an interview.
“And we found that by adding the GLP-1 agonist [semaglutide], we could increase weight loss from, on average, about 16%-18% of total body weight with ESG alone to up to 27%, so it’s a great metabolic combination,” she noted.
Dr. Hoff presented the findings at the annual Digestive Disease Week® (DDW).
Asked to comment, Scott Kahan, MD, MPH, director, National Center for Weight and Wellness, George Washington University, Washington, cautioned that it’s still early days for minimally invasive ESG.
“It is reasonable to assume that the long-term outcomes [with ESG] won’t be as good or durable over time as with bariatric surgery, but ... we will have to see.”
However, “we know that, typically, combinations of therapeutic options work better than a one-off option, so I think the real benefit of this study – outside the specific procedure and this specific medication – is that it is a very valuable proof-of-principle study showing that combinations do work better,” Dr. Kahan said in an interview.
Minimally invasive endoscopic sleeve gastroplasty
ESG is a surrogate for laparoscopic sleeve gastrectomy that can offer the benefits of such a procedure to those who don’t qualify for, or don’t wish to pursue, bariatric surgery. It can be performed at an earlier stage of disease, in those with a body mass index of 30 mg/kg2, whereas generally people are not offered bariatric procedures unless they have a BMI of at least 35 with comorbidities or a BMI of at least 40 if they do not have comorbidities.
Subcutaneous semaglutide is already approved for the treatment of type 2 diabetes in adults at doses of up to 1 mg/week; higher doses are needed for weight loss. Novo Nordisk has been investigating higher doses for weight loss in the STEP trial program, which is now complete, and the company has submitted the data to the Food and Drug Administration and European Medicines Agency for an additional indication of adults with obesity (BMI ≥30) or who are overweight (BMI ≥27) and who have at least one weight-related comorbidity, as an adjunct to a reduced-calorie diet and increased physical activity, with a decision expected soon.
Novo Nordisk has also developed an oral form of semaglutide, which has been approved as a once-daily agent for type 2 diabetes (Rybelsus) in doses of 7 mg and 14 mg to improve glycemic control along with diet and exercise. It is the first GLP-1 agonist available in tablet form.
Patients lost fat mass as well as excess weight
The Brazilian study involved 58 patients with obesity or overweight who also had diabetes and were undergoing minimally invasive ESG; they were further randomized to receive semaglutide or placebo.
The GLP-1 agonist (or sham placebo) was initiated 1 month after participants had undergone the procedure and patients were monitored each month for weight loss and type of fat loss achieved with the combination versus ESG alone. The initial dose of semaglutide used was 0.25 mg subcutaneous a week but could be titrated up to a maximum dose of 1.5 mg.
At the end of 11 months of active treatment versus placebo (12 months after ESG), patients who received additional semaglutide lost 86.3% of their excess body weight – the amount of weight patients needed to lose to reach normal BMI – compared with only 60.4% for ESG controls.
Specifically, the mean percentage total body weight loss at the end of 12 months was 25.2% for those in the combination group, compared with 18.6% for those treated with ESG alone (P < .001).
More importantly, patients in the combination group lost 12.6% of their body fat mass, compared with 9% for ESG controls, while mean A1c levels fell more in those treated with additional semaglutide compared with controls (P = .0394).
Indeed, five patients in the combination group reverted to a nondiabetic state and were able to discontinue antidiabetic medications altogether, Dr. Hoff noted.
“Our main goal is not just to lose weight but to lose body mass fat, which is very different from just losing weight,” she explained.
If patients lose weight but still maintain a high percentage of body fat mass, they have what she refers to as “sarcopenic obesity” because in this state patients have lost a lot of muscle mass but still have high levels of metabolically active visceral fat. Among many other inflammatory complexes, metabolically active visceral fat contains a large number of inflammasomes, and it is the latter that have been associated with obesity-related cancers.
“Obesity is a progressive disease, so what we are trying to do here is buy time for patients so they do not progress to [bariatric] surgery, and this approach gives patients a chance to act earlier before obesity takes over and more metabolic consequences occur,” Dr. Hoff emphasized.
So, when combined with semaglutide, “we now have a minimally invasive procedure that can be just as successful [as surgery] and which can be made available to even more people looking to lose a significant amount of weight,” she concluded.
Dr. Hoff and Dr. Kahan have reported no relevant financial relationships.
A version of this article first appeared on Medscape.com.
FDA panel endorses teplizumab for delaying type 1 diabetes
in at-risk individuals.

The 10-7 vote of the FDA’s endocrinologic and metabolic drugs advisory committee on May 27 reflected a difficult decision-making process on the part of many members to weigh the benefits of a potential 2-year delay in the onset of type 1 diabetes against both observed and theoretical risks, as well as what most considered to be insufficient data.
Regardless of their vote, nearly all panel members advised the FDA that the company should be required to conduct at least one additional larger long-term efficacy and safety trial to satisfy what they felt were major gaps in the data. Some advised that use of the drug be restricted to a very narrow group of recipients until efficacy and safety can be better established.
If approved, teplizumab, which interferes with T cell–mediated autoimmune destruction of pancreatic beta cells, would be the first disease-modifying therapy for impeding progression of type 1 diabetes. The proposed indication is for individuals who have two or more type 1 diabetes-associated autoantibodies and subclinical dysglycemia.
That “stage 2” or “at-risk” condition is associated with a nearly 100% lifetime risk of progression to clinical (“stage 3”) type 1 diabetes and a 75% risk of developing the disease within 5 years. As of now, most such individuals are first-degree relatives of people with type 1 diabetes identified through TrialNet.
What’s the evidence to support approval so far?
In 2019, a pivotal phase 2 randomized, placebo-controlled TN-10 trial involving 76 at-risk children and adults ages 8 years and older showed that a single 14-day treatment of daily intravenous infusions of teplizumab in 44 patients resulted in a significant median 2-year delay to onset of clinical type 1 diabetes, compared with 32 who received placebo. Further follow-up data continue to show that fewer patients who received teplizumab have progressed to clinical type 1 diabetes.
While most advisory panelists agreed that the TN-10 study demonstrated efficacy, several also said that the sample size was insufficient and at least one additional randomized trial should be conducted to replicate the findings.
Although the FDA typically requires companies to demonstrate a drug’s effectiveness with at least two separate clinical trials, the agency allows companies to substitute other forms of data for a second randomized clinical trial, such as study results for the drug in a closely related condition, mechanistic data, or knowledge of other drugs from the same class.
In this case, Provention’s submission included as “confirmatory” evidence a meta-analysis of data from five earlier randomized trials (three placebo controlled, two open label) of a total 942 individuals with newly diagnosed type 1 diabetes (“stage 3”) who received either one or two 14-day teplizumab courses (n = 729) or placebo. These showed consistent preservation of C-peptide, a surrogate marker of beta-cell function, along with lower mean insulin use.
Several panel members expressed dissatisfaction with those confirmatory data, noting the patient population was different from those for which the company is currently seeking the indication, and that C-peptide is an inadequate endpoint for demonstrating efficacy.
Safety: Adverse events mostly transient, but unanswered questions
Adverse events reported in at least 10% of teplizumab recipients included lymphopenia (76.8% vs. 9.4% placebo; relative risk, 8.2), leukopenia (82.1% vs. 24.1%; RR, 3.4), and rash (44.5% vs. 9.0%; RR, 4.9).
“Most adverse events related to teplizumab were mechanism-based, predictable, transient, and manageable,” Chief Medical Officer of Provention Bio, Eleanor Ramos, MD, said.
Among other safety issues that concerned the panel, diabetic ketoacidosis (DKA) was seen in 2.3% of 773 teplizumab recipients with new-onset type 1 diabetes versus just 1% among the 245 controls, a significant, nearly sixfold increase. No DKA occurred in the TN-10 trial. No clear explanation was offered for the imbalance in the meta-analysis.
Cytokine release syndrome occurred in 0.6% of patients who received teplizumab versus no controls, and infections in 3.4% versus 2.0%, respectively.
Approximately 10% of patients were not able to complete the treatment course because of protocol-directed withdrawal criteria, which included elevations in bilirubin or liver enzymes, or drops in platelet count, neutrophils, or hemoglobin, FDA reviewer Lauren Wood Heickman, MD, noted.
There was only one malignancy, a melanoma in a patient with a preexisting lesion, but malignancy is a theoretical concern with long-term immunosuppression, Dr. Heickman said.
Despite the concerns about the data, panel members expressed unanimous appreciation for the 18 people who spoke during public comments attesting to the lifelong burdens involved in living with type 1 diabetes who urged the FDA to approve teplizumab.
Many of them noted that even a 2-year reprieve from the burden of constant attention to managing blood glucose can make a major difference in the life of a young person. The speakers included physicians, parents of children with type 1 diabetes, adults who have the condition themselves and who worry about their children getting it, and researchers in the field.
Panel members describe ‘struggle’ with vote decision
Panel member Michael Blaha, MD, of Johns Hopkins University, Baltimore, voted in favor of teplizumab approval. However, he said, “I was very conflicted on this one and my ‘yes’ is very qualified. In my opinion the risk-benefit is very narrow, and I would only approve this drug for the exact indication of the trial. ... Patients who don’t fit the criteria could hopefully be enrolled in a second confirmatory trial.”
He also advised an extensive Risk Evaluation and Mitigation Strategies program to look for both short- and long-term adverse effects.
“My overall take on this is that I do think it’s a promising paradigm-shifting therapy that really needs to move forward, at least scientifically. I’m excited about it, but I have a lot of skepticism about the entire body of data to make any more than the most narrow of approval,” Dr. Blaha said.
Susan S. Ellenberg, PhD, professor of biostatistics, medical ethics, and health policy at the University of Pennsylvania, Philadelphia, voted yes but also with difficulty.
“I really struggled with it. ... I was pushed by the very encouraging results of what is admittedly a very small study and something I can’t feel is completely definitive. But I would not like to deny the kind of people that we heard from today the opportunity to weigh their own risks and benefits to try this. And I would certainly agree that a very, very rigorous postmarketing program, preferably including another controlled trial, should be carried out.”
But David M. Nathan, MD, director of the Diabetes Center and Clinical Research Center, Massachusetts General Hospital, Boston, voted no.
“I struggled with this vote, tremendously, having listened carefully to the patients with type 1 diabetes ... but that said, having done clinical research for 40 years in type 1 diabetes, I think we need more data, both in terms of efficacy and of safety. I would hate a number of years down the road to figure out that we actually caused more harm than good, especially keeping in mind that the treatment of type 1 diabetes is evolving rapidly.”
A different perspective came from Mara L. Becker, MD, vice chair of the department of pediatric rheumatology at Duke University, Durham, N.C. She voted yes, pointing out that she’s accustomed to prescribing biologics for chronic conditions in children.
“I was unconflicted in my vote, which was yes. I thought the data ... were convincing and the need is great. I would support a label for children [aged 8 years] and older with at least stage 2 disease ... and I would require postmarketing safety surveillance to understand what the long-term side effects could be, but I would still be in favor of it.”
FDA advisory panel committee members are vetted for conflicts of interest and waivers granted for participation if necessary; none were granted for this meeting.
A version of this article first appeared on Medscape.com.
in at-risk individuals.
The 10-7 vote of the FDA’s endocrinologic and metabolic drugs advisory committee on May 27 reflected a difficult decision-making process on the part of many members to weigh the benefits of a potential 2-year delay in the onset of type 1 diabetes against both observed and theoretical risks, as well as what most considered to be insufficient data.
Regardless of their vote, nearly all panel members advised the FDA that the company should be required to conduct at least one additional larger long-term efficacy and safety trial to satisfy what they felt were major gaps in the data. Some advised that use of the drug be restricted to a very narrow group of recipients until efficacy and safety can be better established.
If approved, teplizumab, which interferes with T cell–mediated autoimmune destruction of pancreatic beta cells, would be the first disease-modifying therapy for impeding progression of type 1 diabetes. The proposed indication is for individuals who have two or more type 1 diabetes-associated autoantibodies and subclinical dysglycemia.
That “stage 2” or “at-risk” condition is associated with a nearly 100% lifetime risk of progression to clinical (“stage 3”) type 1 diabetes and a 75% risk of developing the disease within 5 years. As of now, most such individuals are first-degree relatives of people with type 1 diabetes identified through TrialNet.
What’s the evidence to support approval so far?
In 2019, a pivotal phase 2 randomized, placebo-controlled TN-10 trial involving 76 at-risk children and adults ages 8 years and older showed that a single 14-day treatment of daily intravenous infusions of teplizumab in 44 patients resulted in a significant median 2-year delay to onset of clinical type 1 diabetes, compared with 32 who received placebo. Further follow-up data continue to show that fewer patients who received teplizumab have progressed to clinical type 1 diabetes.
While most advisory panelists agreed that the TN-10 study demonstrated efficacy, several also said that the sample size was insufficient and at least one additional randomized trial should be conducted to replicate the findings.
Although the FDA typically requires companies to demonstrate a drug’s effectiveness with at least two separate clinical trials, the agency allows companies to substitute other forms of data for a second randomized clinical trial, such as study results for the drug in a closely related condition, mechanistic data, or knowledge of other drugs from the same class.
In this case, Provention’s submission included as “confirmatory” evidence a meta-analysis of data from five earlier randomized trials (three placebo controlled, two open label) of a total 942 individuals with newly diagnosed type 1 diabetes (“stage 3”) who received either one or two 14-day teplizumab courses (n = 729) or placebo. These showed consistent preservation of C-peptide, a surrogate marker of beta-cell function, along with lower mean insulin use.
Several panel members expressed dissatisfaction with those confirmatory data, noting the patient population was different from those for which the company is currently seeking the indication, and that C-peptide is an inadequate endpoint for demonstrating efficacy.
Safety: Adverse events mostly transient, but unanswered questions
Adverse events reported in at least 10% of teplizumab recipients included lymphopenia (76.8% vs. 9.4% placebo; relative risk, 8.2), leukopenia (82.1% vs. 24.1%; RR, 3.4), and rash (44.5% vs. 9.0%; RR, 4.9).
“Most adverse events related to teplizumab were mechanism-based, predictable, transient, and manageable,” Chief Medical Officer of Provention Bio, Eleanor Ramos, MD, said.
Among other safety issues that concerned the panel, diabetic ketoacidosis (DKA) was seen in 2.3% of 773 teplizumab recipients with new-onset type 1 diabetes versus just 1% among the 245 controls, a significant, nearly sixfold increase. No DKA occurred in the TN-10 trial. No clear explanation was offered for the imbalance in the meta-analysis.
Cytokine release syndrome occurred in 0.6% of patients who received teplizumab versus no controls, and infections in 3.4% versus 2.0%, respectively.
Approximately 10% of patients were not able to complete the treatment course because of protocol-directed withdrawal criteria, which included elevations in bilirubin or liver enzymes, or drops in platelet count, neutrophils, or hemoglobin, FDA reviewer Lauren Wood Heickman, MD, noted.
There was only one malignancy, a melanoma in a patient with a preexisting lesion, but malignancy is a theoretical concern with long-term immunosuppression, Dr. Heickman said.
Despite the concerns about the data, panel members expressed unanimous appreciation for the 18 people who spoke during public comments attesting to the lifelong burdens involved in living with type 1 diabetes who urged the FDA to approve teplizumab.
Many of them noted that even a 2-year reprieve from the burden of constant attention to managing blood glucose can make a major difference in the life of a young person. The speakers included physicians, parents of children with type 1 diabetes, adults who have the condition themselves and who worry about their children getting it, and researchers in the field.
Panel members describe ‘struggle’ with vote decision
Panel member Michael Blaha, MD, of Johns Hopkins University, Baltimore, voted in favor of teplizumab approval. However, he said, “I was very conflicted on this one and my ‘yes’ is very qualified. In my opinion the risk-benefit is very narrow, and I would only approve this drug for the exact indication of the trial. ... Patients who don’t fit the criteria could hopefully be enrolled in a second confirmatory trial.”
He also advised an extensive Risk Evaluation and Mitigation Strategies program to look for both short- and long-term adverse effects.
“My overall take on this is that I do think it’s a promising paradigm-shifting therapy that really needs to move forward, at least scientifically. I’m excited about it, but I have a lot of skepticism about the entire body of data to make any more than the most narrow of approval,” Dr. Blaha said.
Susan S. Ellenberg, PhD, professor of biostatistics, medical ethics, and health policy at the University of Pennsylvania, Philadelphia, voted yes but also with difficulty.
“I really struggled with it. ... I was pushed by the very encouraging results of what is admittedly a very small study and something I can’t feel is completely definitive. But I would not like to deny the kind of people that we heard from today the opportunity to weigh their own risks and benefits to try this. And I would certainly agree that a very, very rigorous postmarketing program, preferably including another controlled trial, should be carried out.”
But David M. Nathan, MD, director of the Diabetes Center and Clinical Research Center, Massachusetts General Hospital, Boston, voted no.
“I struggled with this vote, tremendously, having listened carefully to the patients with type 1 diabetes ... but that said, having done clinical research for 40 years in type 1 diabetes, I think we need more data, both in terms of efficacy and of safety. I would hate a number of years down the road to figure out that we actually caused more harm than good, especially keeping in mind that the treatment of type 1 diabetes is evolving rapidly.”
A different perspective came from Mara L. Becker, MD, vice chair of the department of pediatric rheumatology at Duke University, Durham, N.C. She voted yes, pointing out that she’s accustomed to prescribing biologics for chronic conditions in children.
“I was unconflicted in my vote, which was yes. I thought the data ... were convincing and the need is great. I would support a label for children [aged 8 years] and older with at least stage 2 disease ... and I would require postmarketing safety surveillance to understand what the long-term side effects could be, but I would still be in favor of it.”
FDA advisory panel committee members are vetted for conflicts of interest and waivers granted for participation if necessary; none were granted for this meeting.
A version of this article first appeared on Medscape.com.
HbA1c Change in Patients With and Without Gaps in Pharmacist Visits at a Safety-Net Resident Physician Primary Care Clinic
From Titus Family Department of Clinical Pharmacy, School of Pharmacy, University of Southern California, Los Angeles, CA (Drs. Chu and Ma and Mimi Lou), and Department of Family Medicine, Keck Medicine, University of Southern California, Los Angeles, CA (Dr. Suh).
Objective: The objective of this study is to describe HbA1c changes in patients who maintained continuous pharmacist care vs patients who had a gap in pharmacist care of 3 months or longer.
Methods: This retrospective study was conducted from October 1, 2018, to September 30, 2019. Electronic health record data from an academic-affiliated, safety-net resident physician primary care clinic were collected to observe HbA1c changes between patients with continuous pharmacist care and patients who had a gap of 3 months or longer in pharmacist care. A total of 189 patients met the inclusion criteria and were divided into 2 groups: those with continuous care and those with gaps in care. Data were analyzed using the Mann-Whitney test for continuous variables and the χ2 (or Fisher exact) test for categorical variables. The differences-in-differences model was used to compare the changes in HbA1c between the 2 groups.
Results: There was no significant difference in changes in HbA1c between the continuous care group and the gaps in care group, although the mean magnitude of HbA1c changes was numerically greater in the continuous care group (-1.48% vs -0.97%). Overall, both groups showed improvement in their HbA1c levels and had similar numbers of primary care physician visits and acute care utilizations, while the gaps in care group had longer duration with pharmacists and between the adjacent pharmacist visits.
Conclusion: Maintaining continuous, regular visits with a pharmacist at a safety-net resident physician primary care clinic did not show a significant difference in HbA1c changes compared to having gaps in pharmacist care. Future studies on socioeconomic and behavioral burden on HbA1c improvement and on pharmacist visits in these populations should be explored.
Keywords: clinical pharmacist; diabetes management; continuous visit; primary care clinic.
Pharmacists have unique skills in identifying and resolving problems related to the safety and efficacy of drug therapy while addressing medication adherence and access for patients. Their expertise is especially important to meet the care needs of a growing population with chronic conditions amidst a primary care physician shortage.1 As health care systems move toward value-based care, emphasis on improvement in quality and health measures have become central in care delivery. Pharmacists have been integrated into team-based care in primary care settings, but the value-based shift has opened more opportunities for pharmacists to address unmet quality standards.2-5
Many studies have reported that the integration of pharmacists into team-based care improves health outcomes and reduces overall health care costs.6-9 Specifically, when pharmacists were added to primary care teams to provide diabetes management, hemoglobin HbA1c levels were reduced compared to teams without pharmacists.10-13 Offering pharmacist visits as often as every 2 weeks to 3 months, with each patient having an average of 4.7 visits, resulted in improved therapeutic outcomes.3,7 During visits, pharmacists address the need for additional drug therapy, deprescribe unnecessary therapy, correct insufficient doses or durations, and switch patients to more cost-efficient drug therapy.9 Likewise, patients who visit pharmacists in addition to seeing their primary care physician can have medication-related concerns resolved and improve their therapeutic outcomes.10,11
Not much is known about the magnitude of HbA1c change based on the regularity of pharmacist visits. Although pharmacists offer follow-up appointments in reasonable time intervals, patients do not keep every appointment for a variety of reasons, including forgetfulness, personal issues, and a lack of transportation.14 Such missed appointments can negatively impact health outcomes.14-16 The purpose of this study is to describe HbA1c changes in patients who maintained continuous, regular pharmacist visits without a 3-month gap and in patients who had history of inconsistent pharmacist visits with a gap of 3 months or longer. Furthermore, this study describes the frequency of health care utilization for these 2 groups.
Methods
Setting
The Internal Medicine resident physician primary care clinic is 1 of 2 adult primary care clinics at an academic, urban, public medical center. It is in the heart of East Los Angeles, where predominantly Spanish-speaking and minority populations reside. The clinic has approximately 19000 empaneled patients and is the largest resident primary care clinic in the public health system. The clinical pharmacy service addresses unmet quality standards, specifically HbA1c. The clinical pharmacists are co-located and collaborate with resident physicians, attending physicians, care managers, nurses, social workers, and community health workers at the clinic. They operate under collaborative practice agreements with prescriptive authority, except for controlled substances, specialty drugs, and antipsychotic medications.
Pharmacist visit
Patients are primarily referred by resident physicians to clinical pharmacists when their HbA1c level is above 8% for an extended period, when poor adherence and low health literacy are evident regardless of HbA1c level, or when a complex medication regimen requires comprehensive medication review and reconciliation. The referral occurs through warm handoff by resident physicians as well as clinic nurses, and it is embedded in the clinic flow. Patients continue their visits with resident physicians for issues other than their referral to clinical pharmacists. The visits with pharmacists are appointment-based, occur independently from resident physician visits, and continue until the patient’s HbA1c level or adherence is optimized. Clinical pharmacists continue to follow up with patients who may have reached their target HbA1c level but still are deemed unstable due to inconsistency in their self-management and medication adherence.
After the desirable HbA1c target is achieved along with full adherence to medications and self-management, clinical pharmacists will hand off patients back to resident physicians. At each visit, pharmacists perform a comprehensive medication assessment and reconciliation that includes adjusting medication therapy, placing orders for necessary laboratory tests and prescriptions, and assessing medication adherence. They also evaluate patients’ signs and symptoms for hyperglycemic complications, hypoglycemia, and other potential treatment-related adverse events. These are all within the pharmacist’s scope of practice in comprehensive medication management. Patient education is provided with the teach-back method and includes lifestyle modifications and medication counseling (Table 1). Pharmacists offer face-to-face visits as frequently as every 1 to 2 weeks to every 4 to 6 weeks, depending on the level of complexity and the severity of a patient’s conditions and medications. For patients whose HbA1c has reached the target range but have not been deemed stable, pharmacists continue to check in with them every 2 months. Phone visits are also utilized as an additional care delivery method for patients having difficulty showing up for face-to-face visits or needing quick assessment of medication adherence and responses to changes in drug treatment in between the face-to-face visits. The maximal interval between pharmacist visits is offered no longer than every 8 weeks. Patients are contacted via phone or mail by the nursing staff to reschedule if they miss their appointments with pharmacists. Every pharmacy visit is documented in the patient’s electronic medical record.

Study design
This is a retrospective study describing the HbA1c changes in a patient group that maintained pharmacist visits, with each interval less than 3 months, and in another group, who had a history of a 3-month or longer gap between pharmacist visits. The data were obtained from patients’ electronic medical records during the study period of October 1, 2018, and September 30, 2019, and collected using a HIPAA-compliant, electronic data storage website, REDCap. The institutional review board approval was obtained under HS-19-00929. Patients 18 years and older who were referred by primary care resident physicians for diabetes management, and had 2 or more visits with a pharmacist within the study period, were included. Patients were excluded if they had only 1 HbA1c drawn during the study period, were referred to a pharmacist for reasons other than diabetes management, were concurrently managed by an endocrinologist, had only 1 visit with a pharmacist, or had no visits with their primary care resident physician for over a year. The patients were then divided into 2 groups: continuous care cohort (CCC) and gap in care cohort (GCC). Both face-to-face and phone visits were counted as pharmacist visits for each group.
Outcomes
The primary outcome was the change in HbA1c from baseline between the 2 groups. Baseline HbA1c was considered as the HbA1c value obtained within 3 months prior to, or within 1 month, of the first visit with the pharmacist during the study period. The final HbA1c was considered the value measured within 1 month of, or 3 months after, the patient’s last visit with the pharmacist during the study period.
Several subgroup analyses were conducted to examine the relationship between HbA1c and each group. Among patients whose baseline HbA1c was ≥ 8%, we looked at the percentage of patients reaching HbA1c < 8%, the percentage of patients showing any level of improvement in HbA1c, and the change in HbA1c for each group. We also looked at the percentage of patients with baseline HbA1c < 8% maintaining the level throughout the study period and the change in HbA1c for each group. Additionally, we looked at health care utilization, which included pharmacist visits, primary care physician visits, emergency room and urgent care visits, and hospitalizations for each group. The latter 3 types of utilization were grouped as acute care utilization and further analyzed for visit reasons, which were subsequently categorized as diabetes related and non-diabetes related. The diabetes related reasons linking to acute care utilization were defined as any episodes related to hypoglycemia, diabetic ketoacidosis (DKA), hyperosmolar hyperglycemic state (HHS), foot ulcers, retinopathy, and osteomyelitis infection. All other reasons leading to acute care utilization were categorized as non-diabetes related.
Statistical analysis
Descriptive analyses were conducted using the Mann-Whitney test for continuous data and χ2 (or Fisher exact) test for categorical data. A basic difference-in-differences (D-I-D) method was used to compare the changes of HbA1c between the CCC and GCC over 2 time points: baseline and final measurements. The repeated measures ANOVA was used for analyzing D-I-D. P < .05 was considered significant. Statistical analyses were performed using SAS version 9.4 (SAS Institute, Cary, NC).

Results
Baseline data
A total of 1272 patients were identified within the study period, and 189 met the study inclusion criteria. The CCC included 132 patients, the GCC 57. The mean age of patients in both groups was similar at 57 years old (P = .39). Most patients had Medicaid as their primary insurance. About one-third of patients in each group experienced clinical atherosclerotic cardiovascular disease, and about 12% overall had chronic kidney disease stage 3 and higher. The average number of days that patients were under pharmacist care during the study period was longer in the GCC compared to the CCC, and it was statistically significant (P < .001) (Table 2). The mean ± SD baseline HbA1c for the CCC and GCC was 10.0% ± 2.0% and 9.9% ± 1.7%, respectively, and the difference was not statistically significant (P = .93). About 86% of patients in the CCC and 90% in the GCC had a baseline HbA1c of ≥ 8%.

HbA1c
The mean change in HbA1c between the 2 groups was not statistically significant (-1.5% ± 2.0% in the CCC vs -1.0% ± 2.1% in the GCC, P = .36) (Table 3). However, an absolute mean HbA1c reduction of 1.3% was observed in both groups combined at the end of the study. Figure 1 shows a D-I-D model of the 2 groups. Based on the output, the P value of .11 on the interaction term (time*group) indicates that the D-I-D in HbA1c change from baseline to final between the CCC and GCC is not statistically different. However, the magnitude of the difference calculated from the LSMEANS results showed a trend. The HbA1c from baseline to final measurement of patients in the GCC declined by 0.97 percentage points (from 9.94% to 8.97%), while those in the CCC saw their HbA1c decline by 1.48 percentage points (from 9.96% to 8.48%), for a D-I-D of 0.51. In other words, those in the GCC had an HbA1c that decreased by 0.51% less than that of patients in the CCC, suggesting that the CCC shows a steeper line declining from baseline to final HbA1c compared to the GCC, whose line declines less sharply.

In the subgroup analysis of patients whose baseline HbA1c was ≥ 8%, about 42% in the CCC and 37% in the GCC achieved an HbA1c < 8% (P = .56) (Table 4). Approximately 83% of patients in the CCC had some degree of HbA1c improvement—the final HbA1c was lower than their baseline HbA1c—whereas this was observed in about 75% of patients in the GCC (P = .19). Of patients whose baseline HbA1c was < 8%, there was no significant difference in proportion of patients maintaining an HbA1c < 8% between the groups (P = .57), although some increases in HbA1c and HbA1c changes were observed in the GCC (Table 5).

Health care utilization
Patients in the CCC visited pharmacists 5 times on average over 12 months, whereas patients in the GCC had an average of 6 visits (5 ± 2.6 in the CCC vs 6 ± 2.6 in the GCC, P = .01) (Table 6). The mean length between any 2 adjacent visits was significantly different, averaging about 33 days in the CCC compared to 64 days in the GCC (33.2 ± 10 in the CCC vs 63.7 ± 39.4 in the GCC, P < .001). As shown in Figure 2, the GCC shows wider ranges between any adjacent pharmacy visits throughout until the 10th visit. Both groups had a similar number of visits with primary care physicians during the same time period (4.6 ± 1.86 in the CCC vs 4.3 ± 2.51 in the GCC, P = .44). About 30% of patients in the CCC and 47% in the GCC had at least 1 visit to the emergency room or urgent care or had at least 1 hospital admission, for a total of 124 acute care utilizations between the 2 groups combined. Only a small fraction of acute care visits with or without hospitalizations were related to diabetes and its complications (23.1% in the CCC vs 22.0% in the GCC).

Discussion
This is a real-world study that describes HbA1c changes in patients who maintained pharmacy visits regularly and in those who had a history of a 3-month or longer gap in pharmacy visits. Although the study did not show statistically significant differences in HbA1c reduction between the 2 groups, pharmacists’ care, overall, provided mean HbA1c reductions of 1.3%. This result is consistent with those from multiple previous studies.10-13 It is worth noting that the final HbA1c was numerically lower in patients who followed up with pharmacists regularly than in patients with gaps in visits, with a difference of about 0.5 percentage points. This difference is considered clinically significant,17 and potentially could be even greater if the study duration was longer, as depicted by the slope of HbA1c reductions in the D-I-D model (Figure 1).

Previous studies have shown that pharmacist visits are conducted in shorter intervals than primary care physician visits to provide closer follow-up and to resolve any medication-related problems that may hinder therapeutic outcome improvements.3-4,7-9 Increasing access via pharmacists is particularly important in this clinic, where resident physician continuity and access is challenging. The pharmacist-driven program described in this study does not deviate from the norm, and this study confirms that pharmacist care, regardless of gaps in pharmacist visits, may still be beneficial.
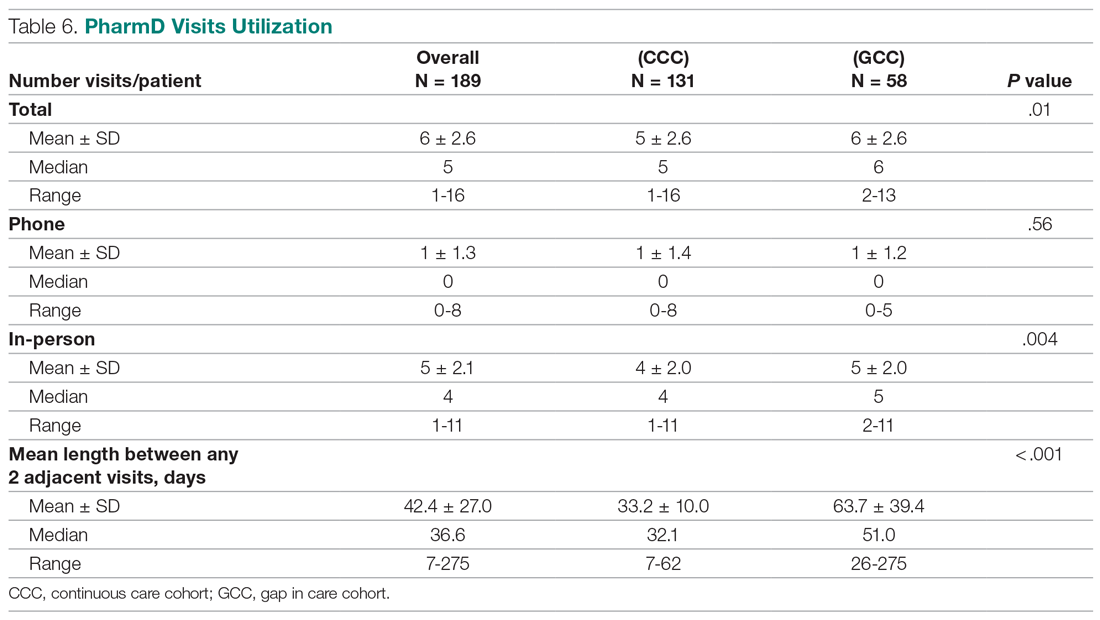
Another notable finding from this study was that although the average number of pharmacist visits per patient was significantly different, this difference of 1 visit did not result in a statistically significant improvement in HbA1c. In fact, the average number of pharmacist visits per patient seemed to be within the reported range by Choe et al in a similar setting.7 Conversely, patients with a history of a gap in pharmacist visits spent longer durations under pharmacist care compared to those who had continuous follow-up. This could mean that it may take longer times or 1 additional visit to achieve similar HbA1c results with continuous pharmacist care. Higher number of visits with pharmacists in the group with the history of gaps between pharmacist visits could have been facilitated by resident physicians, as both groups had a similar number of visits with them. Although this is not conclusive, identifying the optimal number of visits with pharmacists in this underserved population could be beneficial in strategizing pharmacist visits. Acute care utilization was not different between the 2 groups, and most cases that led to acute care utilization were not directly related to diabetes or its complications.
The average HbA1c at the end of the study did not measure < 8%, a target that was reached by less than half of patients from each group; however, this study is a snapshot of a series of ongoing clinical pharmacy services. About 25% of our patients started their first visit with a pharmacist less than 6 months from the study end date, and these patients may not have had enough time with pharmacists for their HbA1c to reach below the target goal. In addition, most patients in this clinic were enrolled in public health plans and may carry a significant burden of social and behavioral factors that can affect diabetes management.18,19 These patients may need longer care by pharmacists along with other integrated services, such as behavioral health and social work, to achieve optimal HbA1c levels.20
There are several limitations to this study, including the lack of a propensity matched control group of patients who only had resident physician visits; thus, it is hard to test the true impact of continuous or intermittent pharmacist visits on the therapeutic outcomes. The study also does not address potential social, economic, and physical environment factors that might have contributed to pharmacist visits and to overall diabetes care. These factors can negatively impact diabetes control and addressing them could help with an individualized diabetes management approach.17,18 Additionally, by nature of being a descriptive study, the results may be subject to undetermined confounding factors.
Conclusion
Patients maintaining continuous pharmacist visits do not have statistically significant differences in change in HbA1c compared to patients who had a history of 3-month or longer gaps in pharmacist visits at a resident physician primary care safety-net clinic. However, patients with diabetes will likely derive a benefit in HbA1c reduction regardless of regularity of pharmacist care. This finding still holds true in collaboration with resident physicians who also regularly meet with patients.
The study highlights that it is important to integrate clinical pharmacists into primary care teams for improved therapeutic outcomes. It is our hope that regular visits to pharmacists can be a gateway for behavioral health and social work referrals, thereby addressing pharmacist-identified social barriers. Furthermore, exploration of socioeconomic and behavioral barriers to pharmacist visits is necessary to address and improve the patient experience, health care delivery, and health outcomes.
Acknowledgments: The authors thank Roxanna Perez, PharmD, Amy Li, and Julie Dopheide, PharmD, BCPP, FASHP for their contributions to this project.
Corresponding author: Michelle Koun Lee Chu, PharmD, BCACP, APh, Titus Family Department of Clinical Pharmacy, School of Pharmacy, University of Southern California, 1985 Zonal Ave, Los Angeles, CA 90089-9121; [email protected].
Financial disclosures: None.
1. Manolakis PG, Skelton JB. Pharmacists’ contributions to primary care in the United States collaborating to address unmet patient care needs: the emerging role for pharmacists to address the shortage of primary care providers. Am J Pharm Educ. 2010;74(10):S7.
2. Scott MA, Hitch B, Ray L, Colvin G. Integration of pharmacists into a patient-centered medical home. J Am Pharm Assoc (2003). 2011;51(2):161‐166.
3. Wong SL, Barner JC, Sucic K, et al. Integration of pharmacists into patient-centered medical homes in federally qualified health centers in Texas. J Am Pharm Assoc (2003). 2017;57(3):375‐381.
4. Sapp ECH, Francis SM, Hincapie AL. Implementation of pharmacist-driven comprehensive medication management as part of an interdisciplinary team in primary care physicians’ offices. Am J Accountable Care. 2020;8(1):8-11.
5. Cowart K, Olson K. Impact of pharmacist care provision in value-based care settings: How are we measuring value-added services? J Am Pharm Assoc (2003). 2019;59(1):125-128.
6. Centers for Disease Control and Prevention. Pharmacy: Collaborative Practice Agreements to Enable Drug Therapy Management. January 16, 2018. Accessed April 17, 2021. https://www.cdc.gov/dhdsp/pubs/guides/best-practices/pharmacist-cdtm.htm
7. Choe HM, Farris KB, Stevenson JG, et al. Patient-centered medical home: developing, expanding, and sustaining a role for pharmacists. Am J Health Syst Pharm. 2012;69(12):1063-1071.
8. Coe AB, Choe HM. Pharmacists supporting population health in patient-centered medical homes. Am J Health Syst Pharm. 2017;74(18):1461-1466.
9. Luder HR, Shannon P, Kirby J, Frede SM. Community pharmacist collaboration with a patient-centered medical home: establishment of a patient-centered medical neighborhood and payment model. J Am Pharm Assoc (2003). 2018;58(1):44-50.
10. Matzke GR, Moczygemba LR, Williams KJ, et al. Impact of a pharmacist–physician collaborative care model on patient outcomes and health services utilization. 10.05Am J Health Syst Pharm. 2018;75(14):1039-1047.
11. Aneese NJ, Halalau A, Muench S, et al. Impact of a pharmacist-managed diabetes clinic on quality measures. Am J Manag Care. 2018;24(4 Spec No.):SP116-SP119.
12. Prudencio J, Cutler T, Roberts S, et al. The effect of clinical 10.05pharmacist-led comprehensive medication management on chronic disease state goal attainment in a patient-centered medical home. J Manag Care Spec Pharm. 2018;24(5):423-429.
13. Edwards HD, Webb RD, Scheid DC, et al. A pharmacist visit improves diabetes standards in a patient-centered medical home (PCMH). Am J Med Qual. 2012;27(6) 529-534.
14. Ullah S, Rajan S, Liu T, et al. Why do patients miss their appointments at primary care clinics? J Fam Med Dis Prev. 2018;4:090.
15. Moore CG, Wilson-Witherspoon P, Probst JC. Time and money: effects of no-shows at a family practice residency clinic. Fam Med. 2001;33(7):522-527.
16. Kheirkhah P, Feng Q, Travis LM, et al. Prevalence, predictors and economic consequences of no-shows. BMC Health Serv Res. 2016;16:13.
17. Little RR, Rohlfing C. The long and winding road to optimal HbA10.051c10.05 measurement. Clin Chim Acta. 2013;418:63-71.
18. Hill J, Nielsen M, Fox MH. Understanding the social factors that contribute to diabetes: a means to informing health care and social policies for the chronically ill. Perm J. 2013;17(2):67-72.
19. Gonzalez-Zacarias AA, Mavarez-Martinez A, Arias-Morales CE, et al. Impact of demographic, socioeconomic, and psychological factors on glycemic self-management in adults with type 2 diabetes mellitus. Front Public Health. 2016;4:195.
20. Pantalone KM, Misra-Hebert AD, Hobbs TD, et al. The probability of A1c goal attainment in patients with uncontrolled type 2 diabetes in a large integrated delivery system: a prediction model. Diabetes Care. 2020;43:1910-1919.
From Titus Family Department of Clinical Pharmacy, School of Pharmacy, University of Southern California, Los Angeles, CA (Drs. Chu and Ma and Mimi Lou), and Department of Family Medicine, Keck Medicine, University of Southern California, Los Angeles, CA (Dr. Suh).
Objective: The objective of this study is to describe HbA1c changes in patients who maintained continuous pharmacist care vs patients who had a gap in pharmacist care of 3 months or longer.
Methods: This retrospective study was conducted from October 1, 2018, to September 30, 2019. Electronic health record data from an academic-affiliated, safety-net resident physician primary care clinic were collected to observe HbA1c changes between patients with continuous pharmacist care and patients who had a gap of 3 months or longer in pharmacist care. A total of 189 patients met the inclusion criteria and were divided into 2 groups: those with continuous care and those with gaps in care. Data were analyzed using the Mann-Whitney test for continuous variables and the χ2 (or Fisher exact) test for categorical variables. The differences-in-differences model was used to compare the changes in HbA1c between the 2 groups.
Results: There was no significant difference in changes in HbA1c between the continuous care group and the gaps in care group, although the mean magnitude of HbA1c changes was numerically greater in the continuous care group (-1.48% vs -0.97%). Overall, both groups showed improvement in their HbA1c levels and had similar numbers of primary care physician visits and acute care utilizations, while the gaps in care group had longer duration with pharmacists and between the adjacent pharmacist visits.
Conclusion: Maintaining continuous, regular visits with a pharmacist at a safety-net resident physician primary care clinic did not show a significant difference in HbA1c changes compared to having gaps in pharmacist care. Future studies on socioeconomic and behavioral burden on HbA1c improvement and on pharmacist visits in these populations should be explored.
Keywords: clinical pharmacist; diabetes management; continuous visit; primary care clinic.
Pharmacists have unique skills in identifying and resolving problems related to the safety and efficacy of drug therapy while addressing medication adherence and access for patients. Their expertise is especially important to meet the care needs of a growing population with chronic conditions amidst a primary care physician shortage.1 As health care systems move toward value-based care, emphasis on improvement in quality and health measures have become central in care delivery. Pharmacists have been integrated into team-based care in primary care settings, but the value-based shift has opened more opportunities for pharmacists to address unmet quality standards.2-5
Many studies have reported that the integration of pharmacists into team-based care improves health outcomes and reduces overall health care costs.6-9 Specifically, when pharmacists were added to primary care teams to provide diabetes management, hemoglobin HbA1c levels were reduced compared to teams without pharmacists.10-13 Offering pharmacist visits as often as every 2 weeks to 3 months, with each patient having an average of 4.7 visits, resulted in improved therapeutic outcomes.3,7 During visits, pharmacists address the need for additional drug therapy, deprescribe unnecessary therapy, correct insufficient doses or durations, and switch patients to more cost-efficient drug therapy.9 Likewise, patients who visit pharmacists in addition to seeing their primary care physician can have medication-related concerns resolved and improve their therapeutic outcomes.10,11
Not much is known about the magnitude of HbA1c change based on the regularity of pharmacist visits. Although pharmacists offer follow-up appointments in reasonable time intervals, patients do not keep every appointment for a variety of reasons, including forgetfulness, personal issues, and a lack of transportation.14 Such missed appointments can negatively impact health outcomes.14-16 The purpose of this study is to describe HbA1c changes in patients who maintained continuous, regular pharmacist visits without a 3-month gap and in patients who had history of inconsistent pharmacist visits with a gap of 3 months or longer. Furthermore, this study describes the frequency of health care utilization for these 2 groups.
Methods
Setting
The Internal Medicine resident physician primary care clinic is 1 of 2 adult primary care clinics at an academic, urban, public medical center. It is in the heart of East Los Angeles, where predominantly Spanish-speaking and minority populations reside. The clinic has approximately 19000 empaneled patients and is the largest resident primary care clinic in the public health system. The clinical pharmacy service addresses unmet quality standards, specifically HbA1c. The clinical pharmacists are co-located and collaborate with resident physicians, attending physicians, care managers, nurses, social workers, and community health workers at the clinic. They operate under collaborative practice agreements with prescriptive authority, except for controlled substances, specialty drugs, and antipsychotic medications.
Pharmacist visit
Patients are primarily referred by resident physicians to clinical pharmacists when their HbA1c level is above 8% for an extended period, when poor adherence and low health literacy are evident regardless of HbA1c level, or when a complex medication regimen requires comprehensive medication review and reconciliation. The referral occurs through warm handoff by resident physicians as well as clinic nurses, and it is embedded in the clinic flow. Patients continue their visits with resident physicians for issues other than their referral to clinical pharmacists. The visits with pharmacists are appointment-based, occur independently from resident physician visits, and continue until the patient’s HbA1c level or adherence is optimized. Clinical pharmacists continue to follow up with patients who may have reached their target HbA1c level but still are deemed unstable due to inconsistency in their self-management and medication adherence.
After the desirable HbA1c target is achieved along with full adherence to medications and self-management, clinical pharmacists will hand off patients back to resident physicians. At each visit, pharmacists perform a comprehensive medication assessment and reconciliation that includes adjusting medication therapy, placing orders for necessary laboratory tests and prescriptions, and assessing medication adherence. They also evaluate patients’ signs and symptoms for hyperglycemic complications, hypoglycemia, and other potential treatment-related adverse events. These are all within the pharmacist’s scope of practice in comprehensive medication management. Patient education is provided with the teach-back method and includes lifestyle modifications and medication counseling (Table 1). Pharmacists offer face-to-face visits as frequently as every 1 to 2 weeks to every 4 to 6 weeks, depending on the level of complexity and the severity of a patient’s conditions and medications. For patients whose HbA1c has reached the target range but have not been deemed stable, pharmacists continue to check in with them every 2 months. Phone visits are also utilized as an additional care delivery method for patients having difficulty showing up for face-to-face visits or needing quick assessment of medication adherence and responses to changes in drug treatment in between the face-to-face visits. The maximal interval between pharmacist visits is offered no longer than every 8 weeks. Patients are contacted via phone or mail by the nursing staff to reschedule if they miss their appointments with pharmacists. Every pharmacy visit is documented in the patient’s electronic medical record.
Study design
This is a retrospective study describing the HbA1c changes in a patient group that maintained pharmacist visits, with each interval less than 3 months, and in another group, who had a history of a 3-month or longer gap between pharmacist visits. The data were obtained from patients’ electronic medical records during the study period of October 1, 2018, and September 30, 2019, and collected using a HIPAA-compliant, electronic data storage website, REDCap. The institutional review board approval was obtained under HS-19-00929. Patients 18 years and older who were referred by primary care resident physicians for diabetes management, and had 2 or more visits with a pharmacist within the study period, were included. Patients were excluded if they had only 1 HbA1c drawn during the study period, were referred to a pharmacist for reasons other than diabetes management, were concurrently managed by an endocrinologist, had only 1 visit with a pharmacist, or had no visits with their primary care resident physician for over a year. The patients were then divided into 2 groups: continuous care cohort (CCC) and gap in care cohort (GCC). Both face-to-face and phone visits were counted as pharmacist visits for each group.
Outcomes
The primary outcome was the change in HbA1c from baseline between the 2 groups. Baseline HbA1c was considered as the HbA1c value obtained within 3 months prior to, or within 1 month, of the first visit with the pharmacist during the study period. The final HbA1c was considered the value measured within 1 month of, or 3 months after, the patient’s last visit with the pharmacist during the study period.
Several subgroup analyses were conducted to examine the relationship between HbA1c and each group. Among patients whose baseline HbA1c was ≥ 8%, we looked at the percentage of patients reaching HbA1c < 8%, the percentage of patients showing any level of improvement in HbA1c, and the change in HbA1c for each group. We also looked at the percentage of patients with baseline HbA1c < 8% maintaining the level throughout the study period and the change in HbA1c for each group. Additionally, we looked at health care utilization, which included pharmacist visits, primary care physician visits, emergency room and urgent care visits, and hospitalizations for each group. The latter 3 types of utilization were grouped as acute care utilization and further analyzed for visit reasons, which were subsequently categorized as diabetes related and non-diabetes related. The diabetes related reasons linking to acute care utilization were defined as any episodes related to hypoglycemia, diabetic ketoacidosis (DKA), hyperosmolar hyperglycemic state (HHS), foot ulcers, retinopathy, and osteomyelitis infection. All other reasons leading to acute care utilization were categorized as non-diabetes related.
Statistical analysis
Descriptive analyses were conducted using the Mann-Whitney test for continuous data and χ2 (or Fisher exact) test for categorical data. A basic difference-in-differences (D-I-D) method was used to compare the changes of HbA1c between the CCC and GCC over 2 time points: baseline and final measurements. The repeated measures ANOVA was used for analyzing D-I-D. P < .05 was considered significant. Statistical analyses were performed using SAS version 9.4 (SAS Institute, Cary, NC).
Results
Baseline data
A total of 1272 patients were identified within the study period, and 189 met the study inclusion criteria. The CCC included 132 patients, the GCC 57. The mean age of patients in both groups was similar at 57 years old (P = .39). Most patients had Medicaid as their primary insurance. About one-third of patients in each group experienced clinical atherosclerotic cardiovascular disease, and about 12% overall had chronic kidney disease stage 3 and higher. The average number of days that patients were under pharmacist care during the study period was longer in the GCC compared to the CCC, and it was statistically significant (P < .001) (Table 2). The mean ± SD baseline HbA1c for the CCC and GCC was 10.0% ± 2.0% and 9.9% ± 1.7%, respectively, and the difference was not statistically significant (P = .93). About 86% of patients in the CCC and 90% in the GCC had a baseline HbA1c of ≥ 8%.
HbA1c
The mean change in HbA1c between the 2 groups was not statistically significant (-1.5% ± 2.0% in the CCC vs -1.0% ± 2.1% in the GCC, P = .36) (Table 3). However, an absolute mean HbA1c reduction of 1.3% was observed in both groups combined at the end of the study. Figure 1 shows a D-I-D model of the 2 groups. Based on the output, the P value of .11 on the interaction term (time*group) indicates that the D-I-D in HbA1c change from baseline to final between the CCC and GCC is not statistically different. However, the magnitude of the difference calculated from the LSMEANS results showed a trend. The HbA1c from baseline to final measurement of patients in the GCC declined by 0.97 percentage points (from 9.94% to 8.97%), while those in the CCC saw their HbA1c decline by 1.48 percentage points (from 9.96% to 8.48%), for a D-I-D of 0.51. In other words, those in the GCC had an HbA1c that decreased by 0.51% less than that of patients in the CCC, suggesting that the CCC shows a steeper line declining from baseline to final HbA1c compared to the GCC, whose line declines less sharply.
In the subgroup analysis of patients whose baseline HbA1c was ≥ 8%, about 42% in the CCC and 37% in the GCC achieved an HbA1c < 8% (P = .56) (Table 4). Approximately 83% of patients in the CCC had some degree of HbA1c improvement—the final HbA1c was lower than their baseline HbA1c—whereas this was observed in about 75% of patients in the GCC (P = .19). Of patients whose baseline HbA1c was < 8%, there was no significant difference in proportion of patients maintaining an HbA1c < 8% between the groups (P = .57), although some increases in HbA1c and HbA1c changes were observed in the GCC (Table 5).
Health care utilization
Patients in the CCC visited pharmacists 5 times on average over 12 months, whereas patients in the GCC had an average of 6 visits (5 ± 2.6 in the CCC vs 6 ± 2.6 in the GCC, P = .01) (Table 6). The mean length between any 2 adjacent visits was significantly different, averaging about 33 days in the CCC compared to 64 days in the GCC (33.2 ± 10 in the CCC vs 63.7 ± 39.4 in the GCC, P < .001). As shown in Figure 2, the GCC shows wider ranges between any adjacent pharmacy visits throughout until the 10th visit. Both groups had a similar number of visits with primary care physicians during the same time period (4.6 ± 1.86 in the CCC vs 4.3 ± 2.51 in the GCC, P = .44). About 30% of patients in the CCC and 47% in the GCC had at least 1 visit to the emergency room or urgent care or had at least 1 hospital admission, for a total of 124 acute care utilizations between the 2 groups combined. Only a small fraction of acute care visits with or without hospitalizations were related to diabetes and its complications (23.1% in the CCC vs 22.0% in the GCC).
Discussion
This is a real-world study that describes HbA1c changes in patients who maintained pharmacy visits regularly and in those who had a history of a 3-month or longer gap in pharmacy visits. Although the study did not show statistically significant differences in HbA1c reduction between the 2 groups, pharmacists’ care, overall, provided mean HbA1c reductions of 1.3%. This result is consistent with those from multiple previous studies.10-13 It is worth noting that the final HbA1c was numerically lower in patients who followed up with pharmacists regularly than in patients with gaps in visits, with a difference of about 0.5 percentage points. This difference is considered clinically significant,17 and potentially could be even greater if the study duration was longer, as depicted by the slope of HbA1c reductions in the D-I-D model (Figure 1).
Previous studies have shown that pharmacist visits are conducted in shorter intervals than primary care physician visits to provide closer follow-up and to resolve any medication-related problems that may hinder therapeutic outcome improvements.3-4,7-9 Increasing access via pharmacists is particularly important in this clinic, where resident physician continuity and access is challenging. The pharmacist-driven program described in this study does not deviate from the norm, and this study confirms that pharmacist care, regardless of gaps in pharmacist visits, may still be beneficial.
Another notable finding from this study was that although the average number of pharmacist visits per patient was significantly different, this difference of 1 visit did not result in a statistically significant improvement in HbA1c. In fact, the average number of pharmacist visits per patient seemed to be within the reported range by Choe et al in a similar setting.7 Conversely, patients with a history of a gap in pharmacist visits spent longer durations under pharmacist care compared to those who had continuous follow-up. This could mean that it may take longer times or 1 additional visit to achieve similar HbA1c results with continuous pharmacist care. Higher number of visits with pharmacists in the group with the history of gaps between pharmacist visits could have been facilitated by resident physicians, as both groups had a similar number of visits with them. Although this is not conclusive, identifying the optimal number of visits with pharmacists in this underserved population could be beneficial in strategizing pharmacist visits. Acute care utilization was not different between the 2 groups, and most cases that led to acute care utilization were not directly related to diabetes or its complications.
The average HbA1c at the end of the study did not measure < 8%, a target that was reached by less than half of patients from each group; however, this study is a snapshot of a series of ongoing clinical pharmacy services. About 25% of our patients started their first visit with a pharmacist less than 6 months from the study end date, and these patients may not have had enough time with pharmacists for their HbA1c to reach below the target goal. In addition, most patients in this clinic were enrolled in public health plans and may carry a significant burden of social and behavioral factors that can affect diabetes management.18,19 These patients may need longer care by pharmacists along with other integrated services, such as behavioral health and social work, to achieve optimal HbA1c levels.20
There are several limitations to this study, including the lack of a propensity matched control group of patients who only had resident physician visits; thus, it is hard to test the true impact of continuous or intermittent pharmacist visits on the therapeutic outcomes. The study also does not address potential social, economic, and physical environment factors that might have contributed to pharmacist visits and to overall diabetes care. These factors can negatively impact diabetes control and addressing them could help with an individualized diabetes management approach.17,18 Additionally, by nature of being a descriptive study, the results may be subject to undetermined confounding factors.
Conclusion
Patients maintaining continuous pharmacist visits do not have statistically significant differences in change in HbA1c compared to patients who had a history of 3-month or longer gaps in pharmacist visits at a resident physician primary care safety-net clinic. However, patients with diabetes will likely derive a benefit in HbA1c reduction regardless of regularity of pharmacist care. This finding still holds true in collaboration with resident physicians who also regularly meet with patients.
The study highlights that it is important to integrate clinical pharmacists into primary care teams for improved therapeutic outcomes. It is our hope that regular visits to pharmacists can be a gateway for behavioral health and social work referrals, thereby addressing pharmacist-identified social barriers. Furthermore, exploration of socioeconomic and behavioral barriers to pharmacist visits is necessary to address and improve the patient experience, health care delivery, and health outcomes.
Acknowledgments: The authors thank Roxanna Perez, PharmD, Amy Li, and Julie Dopheide, PharmD, BCPP, FASHP for their contributions to this project.
Corresponding author: Michelle Koun Lee Chu, PharmD, BCACP, APh, Titus Family Department of Clinical Pharmacy, School of Pharmacy, University of Southern California, 1985 Zonal Ave, Los Angeles, CA 90089-9121; [email protected].
Financial disclosures: None.
1. Manolakis PG, Skelton JB. Pharmacists’ contributions to primary care in the United States collaborating to address unmet patient care needs: the emerging role for pharmacists to address the shortage of primary care providers. Am J Pharm Educ. 2010;74(10):S7.
2. Scott MA, Hitch B, Ray L, Colvin G. Integration of pharmacists into a patient-centered medical home. J Am Pharm Assoc (2003). 2011;51(2):161‐166.
3. Wong SL, Barner JC, Sucic K, et al. Integration of pharmacists into patient-centered medical homes in federally qualified health centers in Texas. J Am Pharm Assoc (2003). 2017;57(3):375‐381.
4. Sapp ECH, Francis SM, Hincapie AL. Implementation of pharmacist-driven comprehensive medication management as part of an interdisciplinary team in primary care physicians’ offices. Am J Accountable Care. 2020;8(1):8-11.
5. Cowart K, Olson K. Impact of pharmacist care provision in value-based care settings: How are we measuring value-added services? J Am Pharm Assoc (2003). 2019;59(1):125-128.
6. Centers for Disease Control and Prevention. Pharmacy: Collaborative Practice Agreements to Enable Drug Therapy Management. January 16, 2018. Accessed April 17, 2021. https://www.cdc.gov/dhdsp/pubs/guides/best-practices/pharmacist-cdtm.htm
7. Choe HM, Farris KB, Stevenson JG, et al. Patient-centered medical home: developing, expanding, and sustaining a role for pharmacists. Am J Health Syst Pharm. 2012;69(12):1063-1071.
8. Coe AB, Choe HM. Pharmacists supporting population health in patient-centered medical homes. Am J Health Syst Pharm. 2017;74(18):1461-1466.
9. Luder HR, Shannon P, Kirby J, Frede SM. Community pharmacist collaboration with a patient-centered medical home: establishment of a patient-centered medical neighborhood and payment model. J Am Pharm Assoc (2003). 2018;58(1):44-50.
10. Matzke GR, Moczygemba LR, Williams KJ, et al. Impact of a pharmacist–physician collaborative care model on patient outcomes and health services utilization. 10.05Am J Health Syst Pharm. 2018;75(14):1039-1047.
11. Aneese NJ, Halalau A, Muench S, et al. Impact of a pharmacist-managed diabetes clinic on quality measures. Am J Manag Care. 2018;24(4 Spec No.):SP116-SP119.
12. Prudencio J, Cutler T, Roberts S, et al. The effect of clinical 10.05pharmacist-led comprehensive medication management on chronic disease state goal attainment in a patient-centered medical home. J Manag Care Spec Pharm. 2018;24(5):423-429.
13. Edwards HD, Webb RD, Scheid DC, et al. A pharmacist visit improves diabetes standards in a patient-centered medical home (PCMH). Am J Med Qual. 2012;27(6) 529-534.
14. Ullah S, Rajan S, Liu T, et al. Why do patients miss their appointments at primary care clinics? J Fam Med Dis Prev. 2018;4:090.
15. Moore CG, Wilson-Witherspoon P, Probst JC. Time and money: effects of no-shows at a family practice residency clinic. Fam Med. 2001;33(7):522-527.
16. Kheirkhah P, Feng Q, Travis LM, et al. Prevalence, predictors and economic consequences of no-shows. BMC Health Serv Res. 2016;16:13.
17. Little RR, Rohlfing C. The long and winding road to optimal HbA10.051c10.05 measurement. Clin Chim Acta. 2013;418:63-71.
18. Hill J, Nielsen M, Fox MH. Understanding the social factors that contribute to diabetes: a means to informing health care and social policies for the chronically ill. Perm J. 2013;17(2):67-72.
19. Gonzalez-Zacarias AA, Mavarez-Martinez A, Arias-Morales CE, et al. Impact of demographic, socioeconomic, and psychological factors on glycemic self-management in adults with type 2 diabetes mellitus. Front Public Health. 2016;4:195.
20. Pantalone KM, Misra-Hebert AD, Hobbs TD, et al. The probability of A1c goal attainment in patients with uncontrolled type 2 diabetes in a large integrated delivery system: a prediction model. Diabetes Care. 2020;43:1910-1919.