User login
Richard Franki is the associate editor who writes and creates graphs. He started with the company in 1987, when it was known as the International Medical News Group. In his years as a journalist, Richard has worked for Cap Cities/ABC, Disney, Harcourt, Elsevier, Quadrant, Frontline, and Internet Brands. In the 1990s, he was a contributor to the ill-fated Indications column, predecessor of Livin' on the MDedge.
Flu season showing its staying power
Like an unwelcome guest, the 2018-2019 flu season seems to be settling in for a lengthy stay as three more states have reached the highest level of influenza-like illness (ILI) activity, according to the Centers for Disease Control and Prevention.
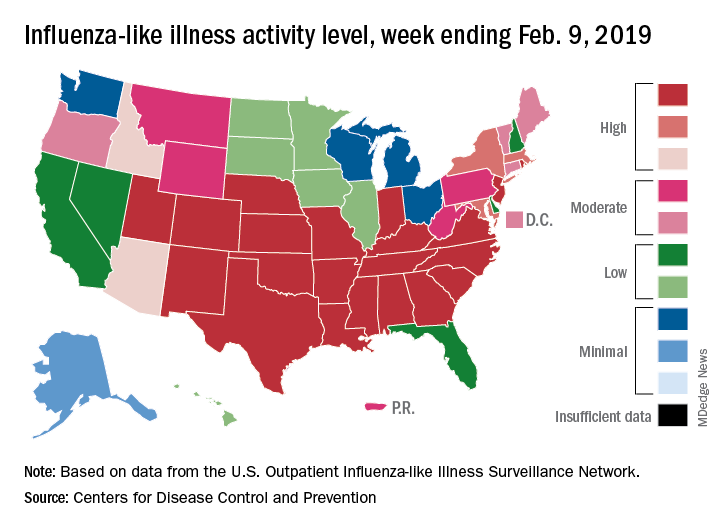
There are now 21 states at level 10 on the CDC’s 1-10 scale, with the South showing up almost solidly red on the flu activity map for the week ending Feb. 9. Another five states are at levels 8 and 9, bringing the total in the high range to 26 for the week, compared with 24 the previous week, the CDC’s influenza division reported Feb. 15.
National activity, reflected in the proportion of outpatient visits involving ILI, took a step up from 4.3% the week before to 4.8% for the week ending Feb. 9. The national baseline rate is 2.2% for ILI, which the CDC defines “as fever (temperature of 100°F [37.8°C] or greater) and cough and/or sore throat.”
Two flu-related pediatric deaths occurred during the week ending Feb. 9, and another four were reported from earlier weeks, which brings the total for the 2018-2019 season to 34, the CDC said. At the same point in last year’s flu season, there had been 84 flu-related deaths in children.
In a separate report, the CDC said that, based on data collected from Nov. 23, 2018 to Feb. 2, 2019, “the influenza vaccine has been 47% effective in preventing medically attended acute respiratory virus infection across all age groups and specifically was 46% effective in preventing medical visits associated with influenza A(H1N1)pdm09.” The effectiveness of the vaccine was 61% for children aged 6 months to 17 years, the CDC said (MMWR. 2019 Feb 15;68[6];135-9).
Flu vaccination during the 2017-2018 season prevented 7.1 million illnesses, 3.7 million medical visits, 109,000 hospitalizations, and 8,000 flu-related deaths, the CDC said, adding that “vaccination has been found to reduce deaths, intensive care unit admissions and length of stay, and overall duration of hospitalization among hospitalized influenza patients.”
Forecasts for the rest of the 2018-2019 season “predict that elevated influenza activity in parts of the United States will continue for several more weeks,” the CDC said.
Like an unwelcome guest, the 2018-2019 flu season seems to be settling in for a lengthy stay as three more states have reached the highest level of influenza-like illness (ILI) activity, according to the Centers for Disease Control and Prevention.
There are now 21 states at level 10 on the CDC’s 1-10 scale, with the South showing up almost solidly red on the flu activity map for the week ending Feb. 9. Another five states are at levels 8 and 9, bringing the total in the high range to 26 for the week, compared with 24 the previous week, the CDC’s influenza division reported Feb. 15.
National activity, reflected in the proportion of outpatient visits involving ILI, took a step up from 4.3% the week before to 4.8% for the week ending Feb. 9. The national baseline rate is 2.2% for ILI, which the CDC defines “as fever (temperature of 100°F [37.8°C] or greater) and cough and/or sore throat.”
Two flu-related pediatric deaths occurred during the week ending Feb. 9, and another four were reported from earlier weeks, which brings the total for the 2018-2019 season to 34, the CDC said. At the same point in last year’s flu season, there had been 84 flu-related deaths in children.
In a separate report, the CDC said that, based on data collected from Nov. 23, 2018 to Feb. 2, 2019, “the influenza vaccine has been 47% effective in preventing medically attended acute respiratory virus infection across all age groups and specifically was 46% effective in preventing medical visits associated with influenza A(H1N1)pdm09.” The effectiveness of the vaccine was 61% for children aged 6 months to 17 years, the CDC said (MMWR. 2019 Feb 15;68[6];135-9).
Flu vaccination during the 2017-2018 season prevented 7.1 million illnesses, 3.7 million medical visits, 109,000 hospitalizations, and 8,000 flu-related deaths, the CDC said, adding that “vaccination has been found to reduce deaths, intensive care unit admissions and length of stay, and overall duration of hospitalization among hospitalized influenza patients.”
Forecasts for the rest of the 2018-2019 season “predict that elevated influenza activity in parts of the United States will continue for several more weeks,” the CDC said.
Love hormone plein air, posh preused Kleenex, and dieting plague vectors
Paint me like one of your French girls
If you’re trying to think of a fun Valentine’s activity, look no further than paint night! Normally associated with a ladies night out (and heavy on the wine), a recent study found that painting releases high levels of the “love hormone”, a.k.a. oxytocin, in men.

Researchers compared the levels of oxytocin with partners painting and partners playing board games, and were surprised by the results: While all the couples released oxytocin during these activities, men in paint class had the highest levels – twice as much as any other group.
Feel free to cite this study next time your man complains about being dragged to a paint-and-sip. Painting partners also experienced more touching than the gaming group (unless you count throwing Monopoly pieces at your significant other as touching).
You won’t get me sick, I’ll get me sick!
There are certain items that, after being used once, you really wouldn’t want to reuse. A snotty, mucus-filled tissue is pretty high up on that list ... or so you would hope. But that’s not thinking with real American entrepreneurial spirit! Welcome to Vaev Tissue, a startup based in Los Angeles that sells used tissues containing germs from a sick person for the bargain price of $79.99.

Yes, you read that correctly. They sell an $80 used tissue. The purpose, according to Vaev’s mission statement, is “to get sick on your own terms,” as “using a tissue that carries a human sneeze is safer than needles or pills.”
As you might expect, the tissues are popular with young parents and adults who are “critical” of vaccines. Who else could hear advice from actual doctors who told Time magazine that “there is nothing positive that can come from this, only things that are adverse,” or that the tissues are an “incredible liability,” and continue on, regardless?
And if you’re thinking, “If these people want to get sick, why not just have someone sneeze on them?” Don’t be ridiculous. Focus testers responded highly negatively to simply being handed a dirty tissue. The premium packaging and high price tag are a necessity.
Our advice? Well, as tempting as all this sounds, we think we’ll stick with washing our hands and not sticking used tissues in our faces. You know, like reasonable people.
Why Bullwinkle thinks pink
Flying squirrels are secretly doing their best flamingo impression – who knew? A forestry professor discovered, by happy accident, that flying squirrels are fluorescent – they glow hot pink under ultraviolet light.
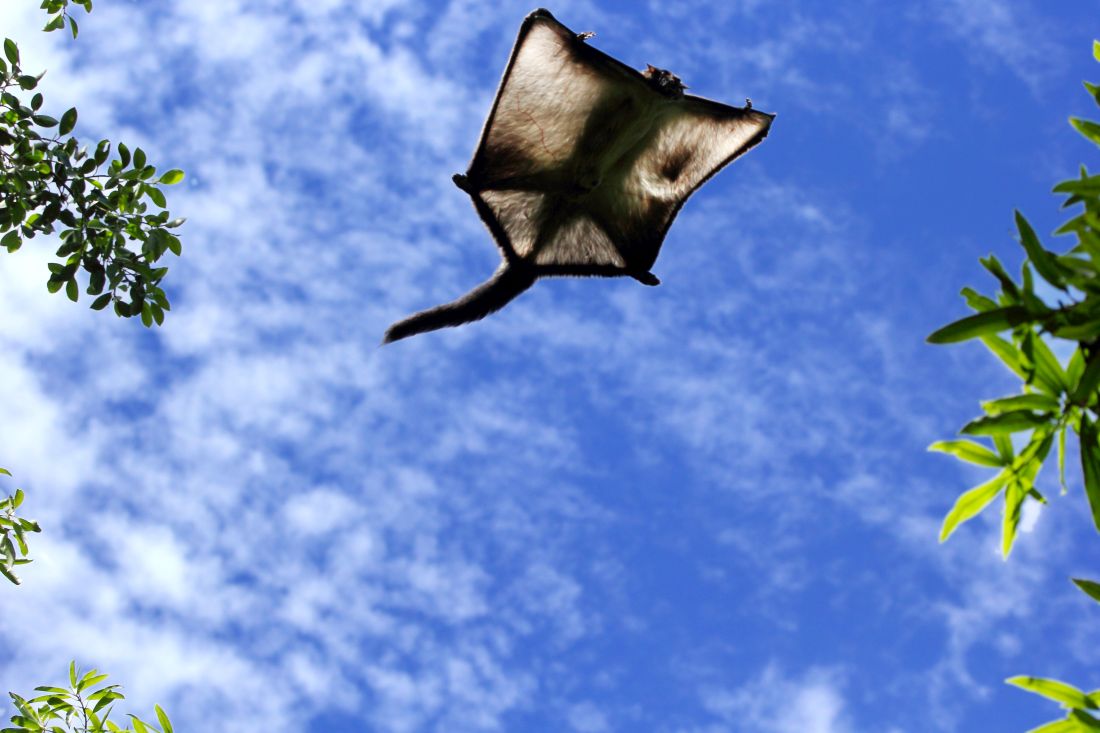
Turns out, almost all species of gliders – even blue-helmeted Rocket “Rocky” J. Squirrel – are members of the Pink Ladies. They are one of the very few glowing mammals; the only other known mammalian species to have fluorescent fur are certain opossums.
But why do these airborne rodents glow pink? Is it because of an overintake of bubblegum? Are flying squirrels just really flamboyant but also shy? Are they huge fans of the singer Pink?
A biologist involved in studying these colorful critters hypothesized that the reason is slightly more related to environment than musical preference. Flying squirrels are nocturnal, making them most active when UV light is most prominent. The garish glow might have something to do with nighttime perception.
However, we don’t know the answer for sure. And in the meantime, we can choose to believe flying squirrels eat way too much cotton candy.
Buzz, feed, diet. Repeat
Guns don’t hurt this mass murderer. Police can’t arrest it. Background checks are pointless. A border wall won’t keep it out. So, how do you stop a mosquito?
Diet drugs.
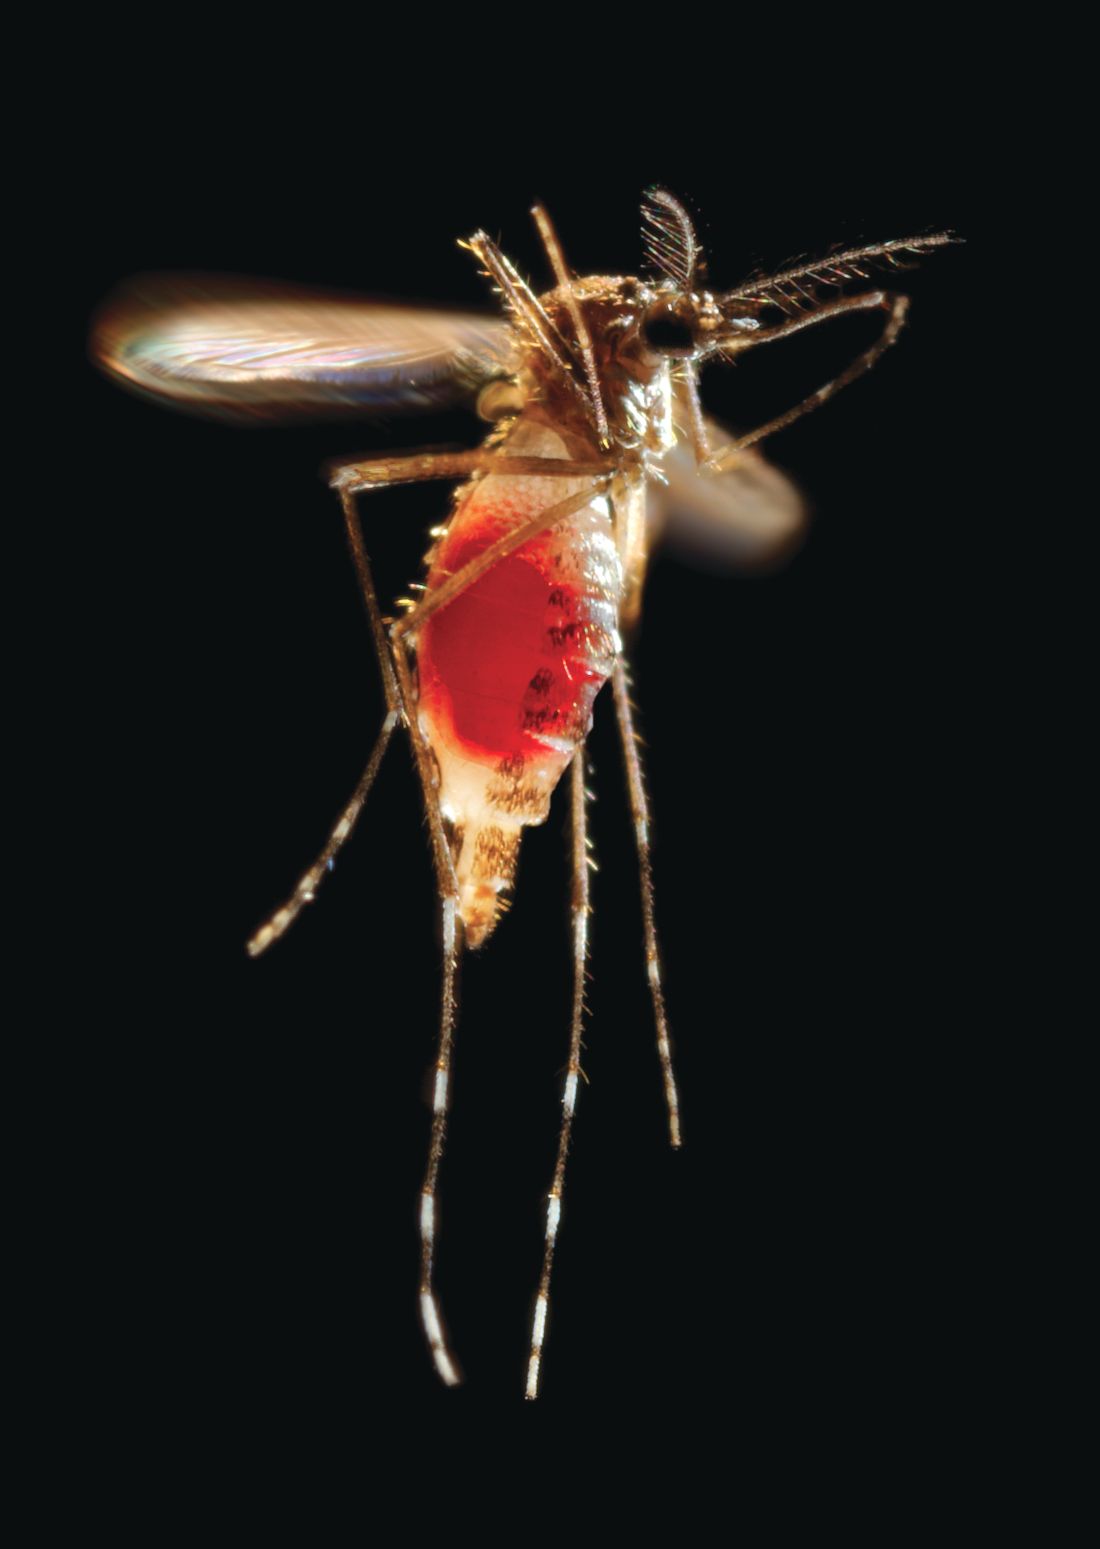
Because female mosquitoes transmit malaria, Zika, and other diseases when they move from person to person feeding on human blood, investigators sought to curb that appetite by chemically re-creating the feeling of fullness they get after a big meal.
The lady killers in their study – Aedes aegypti, to be exact – when given an antiobesity drug that suppresses human appetite by activating neuropeptide receptors that regulate food intake, turned away from a tempting piece of nylon stocking that had been worn by one of the researchers. Further work showed that treated mosquitoes were as disinterested in feeding on a live mouse as mosquitoes that had already enjoyed a full blood meal.
The LOTME research staff (What? Of course, we have a research staff. You don’t?) is working on the mosquito problem too, although we’ve taken a somewhat different approach: The “volunteers” who walk into the mosquito-filled room wear a sign that says, “My blood will make your butt look bigger.”
Paint me like one of your French girls
If you’re trying to think of a fun Valentine’s activity, look no further than paint night! Normally associated with a ladies night out (and heavy on the wine), a recent study found that painting releases high levels of the “love hormone”, a.k.a. oxytocin, in men.
Researchers compared the levels of oxytocin with partners painting and partners playing board games, and were surprised by the results: While all the couples released oxytocin during these activities, men in paint class had the highest levels – twice as much as any other group.
Feel free to cite this study next time your man complains about being dragged to a paint-and-sip. Painting partners also experienced more touching than the gaming group (unless you count throwing Monopoly pieces at your significant other as touching).
You won’t get me sick, I’ll get me sick!
There are certain items that, after being used once, you really wouldn’t want to reuse. A snotty, mucus-filled tissue is pretty high up on that list ... or so you would hope. But that’s not thinking with real American entrepreneurial spirit! Welcome to Vaev Tissue, a startup based in Los Angeles that sells used tissues containing germs from a sick person for the bargain price of $79.99.
Yes, you read that correctly. They sell an $80 used tissue. The purpose, according to Vaev’s mission statement, is “to get sick on your own terms,” as “using a tissue that carries a human sneeze is safer than needles or pills.”
As you might expect, the tissues are popular with young parents and adults who are “critical” of vaccines. Who else could hear advice from actual doctors who told Time magazine that “there is nothing positive that can come from this, only things that are adverse,” or that the tissues are an “incredible liability,” and continue on, regardless?
And if you’re thinking, “If these people want to get sick, why not just have someone sneeze on them?” Don’t be ridiculous. Focus testers responded highly negatively to simply being handed a dirty tissue. The premium packaging and high price tag are a necessity.
Our advice? Well, as tempting as all this sounds, we think we’ll stick with washing our hands and not sticking used tissues in our faces. You know, like reasonable people.
Why Bullwinkle thinks pink
Flying squirrels are secretly doing their best flamingo impression – who knew? A forestry professor discovered, by happy accident, that flying squirrels are fluorescent – they glow hot pink under ultraviolet light.
Turns out, almost all species of gliders – even blue-helmeted Rocket “Rocky” J. Squirrel – are members of the Pink Ladies. They are one of the very few glowing mammals; the only other known mammalian species to have fluorescent fur are certain opossums.
But why do these airborne rodents glow pink? Is it because of an overintake of bubblegum? Are flying squirrels just really flamboyant but also shy? Are they huge fans of the singer Pink?
A biologist involved in studying these colorful critters hypothesized that the reason is slightly more related to environment than musical preference. Flying squirrels are nocturnal, making them most active when UV light is most prominent. The garish glow might have something to do with nighttime perception.
However, we don’t know the answer for sure. And in the meantime, we can choose to believe flying squirrels eat way too much cotton candy.
Buzz, feed, diet. Repeat
Guns don’t hurt this mass murderer. Police can’t arrest it. Background checks are pointless. A border wall won’t keep it out. So, how do you stop a mosquito?
Diet drugs.
Because female mosquitoes transmit malaria, Zika, and other diseases when they move from person to person feeding on human blood, investigators sought to curb that appetite by chemically re-creating the feeling of fullness they get after a big meal.
The lady killers in their study – Aedes aegypti, to be exact – when given an antiobesity drug that suppresses human appetite by activating neuropeptide receptors that regulate food intake, turned away from a tempting piece of nylon stocking that had been worn by one of the researchers. Further work showed that treated mosquitoes were as disinterested in feeding on a live mouse as mosquitoes that had already enjoyed a full blood meal.
The LOTME research staff (What? Of course, we have a research staff. You don’t?) is working on the mosquito problem too, although we’ve taken a somewhat different approach: The “volunteers” who walk into the mosquito-filled room wear a sign that says, “My blood will make your butt look bigger.”
Survey: Health care costs, access unlikely to improve in 2019
but most predict that the Affordable Care Act will make it through the year despite government efforts to defund it, according to a survey by health care market research company InCrowd.

Over 80% of the 200 physicians surveyed Dec. 20-22, 2018, said that it was somewhat or very unlikely that health care costs would improve over the course of this year, and almost 70% expressed those opinions regarding improved access to care. More than 70% said that the federal government will find ways to defund the ACA, but 60% believe that it will remain in place and almost 70% said that coverage for preexisting conditions will continue, InCrowd reported. A minority of respondents (45%) predicted that the quality of health care was very likely or somewhat likely to improve in 2019.
A number of other issues were covered in the survey: 71% of physicians predicted that children up to age 26 years will be able to stay on their parents’ coverage, 69% expect the insurance mandate to be eliminated, 58% believe that mental health coverage will be allowed, and 56% said that it is unlikely for more states to expand Medicaid, according to data from the 100 primary care physicians and 100 specialists who responded to the InCrowd MicroSurvey.
but most predict that the Affordable Care Act will make it through the year despite government efforts to defund it, according to a survey by health care market research company InCrowd.
Over 80% of the 200 physicians surveyed Dec. 20-22, 2018, said that it was somewhat or very unlikely that health care costs would improve over the course of this year, and almost 70% expressed those opinions regarding improved access to care. More than 70% said that the federal government will find ways to defund the ACA, but 60% believe that it will remain in place and almost 70% said that coverage for preexisting conditions will continue, InCrowd reported. A minority of respondents (45%) predicted that the quality of health care was very likely or somewhat likely to improve in 2019.
A number of other issues were covered in the survey: 71% of physicians predicted that children up to age 26 years will be able to stay on their parents’ coverage, 69% expect the insurance mandate to be eliminated, 58% believe that mental health coverage will be allowed, and 56% said that it is unlikely for more states to expand Medicaid, according to data from the 100 primary care physicians and 100 specialists who responded to the InCrowd MicroSurvey.
United States now over 100 measles cases for the year
according to the Centers for Disease Control and Prevention.
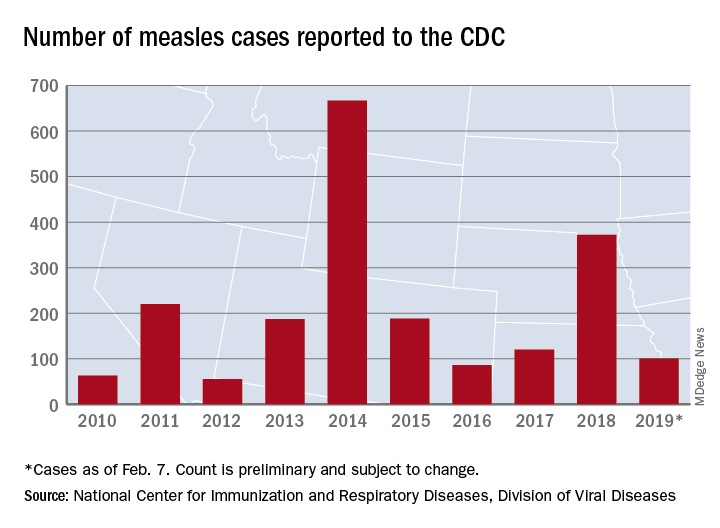
Just over half of the cases in 2019 have occurred in Clark County, Wash., which has reported 53 cases. That outbreak led Gov. Jay Inslee to declare a public health emergency for the entire state on Jan. 25.
The cases in Washington represent one of the five outbreaks – the CDC defines an outbreak as three or more cases – that have occurred so far this year, with three reported in New York State (Rockland County, Monroe County, and New York City) and one in Texas, which has been spread out over five counties, the CDC reported Feb. 11.
“These outbreaks are linked to travelers who brought measles back from other countries such as Israel and Ukraine, where large measles outbreaks are occurring,” the CDC noted. The other states with confirmed cases are California, Colorado, Connecticut, Georgia, Illinois, New Jersey, and Oregon.
In a video released Feb. 1, Surgeon General Jerome Adams stressed the importance of getting vaccinated and noted that an infected person can transmit the measles virus up to 4 days before he or she develops symptoms.
according to the Centers for Disease Control and Prevention.
Just over half of the cases in 2019 have occurred in Clark County, Wash., which has reported 53 cases. That outbreak led Gov. Jay Inslee to declare a public health emergency for the entire state on Jan. 25.
The cases in Washington represent one of the five outbreaks – the CDC defines an outbreak as three or more cases – that have occurred so far this year, with three reported in New York State (Rockland County, Monroe County, and New York City) and one in Texas, which has been spread out over five counties, the CDC reported Feb. 11.
“These outbreaks are linked to travelers who brought measles back from other countries such as Israel and Ukraine, where large measles outbreaks are occurring,” the CDC noted. The other states with confirmed cases are California, Colorado, Connecticut, Georgia, Illinois, New Jersey, and Oregon.
In a video released Feb. 1, Surgeon General Jerome Adams stressed the importance of getting vaccinated and noted that an infected person can transmit the measles virus up to 4 days before he or she develops symptoms.
Treatment missing for U.S. children with mental illness
according to data from a national survey of parents.

Among the estimated 7.7 million children with a treatable mental illness, 49.4% did not receive needed treatment from a psychiatrist, psychologist, psychiatric nurse, or clinical social worker in the previous 12 months, Daniel G. Whitney, PhD, and Mark D. Peterson, PhD, of the University of Michigan, Ann Arbor, wrote in JAMA Pediatrics.
State-level data from the National Survey of Children’s Health show considerable variation from the national average. North Carolina had the highest prevalence of nontreatment at 72.2% and Washington, D.C., had the lowest rate at 29.5%. The prevalence of at least one mental health disorder was highest in Maine (27.2%) and lowest in Hawaii (7.6%), the investigators reported.
Four states – Alabama, Mississippi, Oklahoma, and Utah – were in the top quartile for both mental health disorder prevalence and prevalence of children with a disorder who did not receive treatment, they noted.
“State-level practices and policies play a role in health care needs and use, which may help to explain the state variability observed in this study. Nevertheless, initiatives that assist systems of care coordination have demonstrated a reduction of mental health–related burdens across multiple domains,” Dr. Whitney and Dr. Peterson wrote.
SOURCE: Whitney DG et al. JAMA Pediatr. 2019 Feb 11. doi: 10.1001/jamapediatrics.2018.5399.
according to data from a national survey of parents.
Among the estimated 7.7 million children with a treatable mental illness, 49.4% did not receive needed treatment from a psychiatrist, psychologist, psychiatric nurse, or clinical social worker in the previous 12 months, Daniel G. Whitney, PhD, and Mark D. Peterson, PhD, of the University of Michigan, Ann Arbor, wrote in JAMA Pediatrics.
State-level data from the National Survey of Children’s Health show considerable variation from the national average. North Carolina had the highest prevalence of nontreatment at 72.2% and Washington, D.C., had the lowest rate at 29.5%. The prevalence of at least one mental health disorder was highest in Maine (27.2%) and lowest in Hawaii (7.6%), the investigators reported.
Four states – Alabama, Mississippi, Oklahoma, and Utah – were in the top quartile for both mental health disorder prevalence and prevalence of children with a disorder who did not receive treatment, they noted.
“State-level practices and policies play a role in health care needs and use, which may help to explain the state variability observed in this study. Nevertheless, initiatives that assist systems of care coordination have demonstrated a reduction of mental health–related burdens across multiple domains,” Dr. Whitney and Dr. Peterson wrote.
SOURCE: Whitney DG et al. JAMA Pediatr. 2019 Feb 11. doi: 10.1001/jamapediatrics.2018.5399.
FROM JAMA PEDIATRICS
Flu activity hits seasonal high
Influenza activity increased for the third consecutive week and has now reached its highest point for the 2018-2019 flu season, according to the Centers for Disease Control and Prevention.
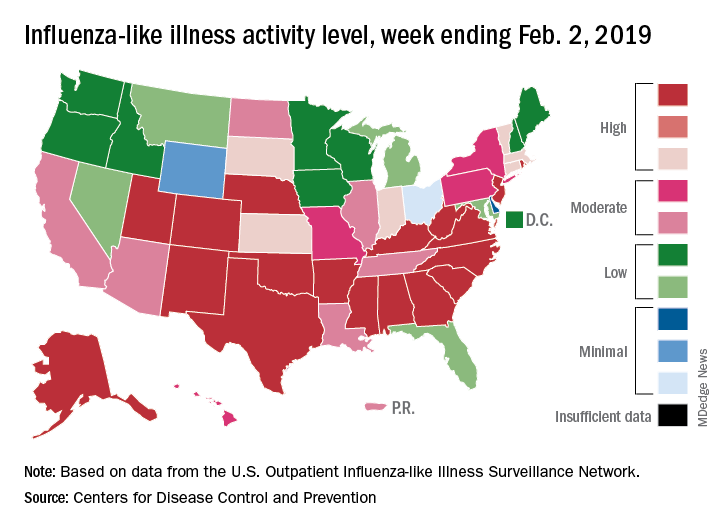
The proportion of outpatient visits for influenza-like illness (ILI) hit 4.3% for the week ending Feb. 2, which topped the previous high of 4.0% that was reached in late December (the national baseline rate is 2.2%). Outpatient ILI visits then dipped down to 3.1% after 2 weeks of decreases before rising again in mid-January, the CDC’s influenza division reported Feb. 8.
Season-high activity also was seen at the state level for the week ending Feb. 2. There were 18 states at level 10 on the CDC’s 1-10 scale of ILI activity, which was up from 16 the week before, and a total of 24 states were in the high range from 8-10, compared with 23 for the previous week. The geographic spread of influenza was reported as widespread in 47 states and Puerto Rico, the CDC said.
Four flu-related pediatric deaths were reported during the week ending Feb. 2, two of which occurred the previous week, which brings the total for the 2018-2019 season to 28, the CDC said.
There were 158 flu-related deaths among all ages during the week ending Jan. 26 – the latest for which such data are available – with reporting almost 75% complete. The previous week saw 177 overall flu deaths, with reporting for that week over 90% complete. During the corresponding weeks of the very severe 2017-2018 flu season, the overall death totals were 1,448 and 1,626, CDC data show.
Influenza activity increased for the third consecutive week and has now reached its highest point for the 2018-2019 flu season, according to the Centers for Disease Control and Prevention.
The proportion of outpatient visits for influenza-like illness (ILI) hit 4.3% for the week ending Feb. 2, which topped the previous high of 4.0% that was reached in late December (the national baseline rate is 2.2%). Outpatient ILI visits then dipped down to 3.1% after 2 weeks of decreases before rising again in mid-January, the CDC’s influenza division reported Feb. 8.
Season-high activity also was seen at the state level for the week ending Feb. 2. There were 18 states at level 10 on the CDC’s 1-10 scale of ILI activity, which was up from 16 the week before, and a total of 24 states were in the high range from 8-10, compared with 23 for the previous week. The geographic spread of influenza was reported as widespread in 47 states and Puerto Rico, the CDC said.
Four flu-related pediatric deaths were reported during the week ending Feb. 2, two of which occurred the previous week, which brings the total for the 2018-2019 season to 28, the CDC said.
There were 158 flu-related deaths among all ages during the week ending Jan. 26 – the latest for which such data are available – with reporting almost 75% complete. The previous week saw 177 overall flu deaths, with reporting for that week over 90% complete. During the corresponding weeks of the very severe 2017-2018 flu season, the overall death totals were 1,448 and 1,626, CDC data show.
Clown-tox, tattooed immunity, and cingulum-bundle comedy
Quit clowning around
Would you like a balloon giraffe, elephant, or hypodermic needle? A recently published study examined how the use of “medical clowns” eased the anxiety and pain of children during botulinum toxin injections. These injections are used to treat spasticity in children, and researchers hypothesized that a clown might be an effective distraction.

As anyone who has been to a circus can surmise, the clowns did not perform better than the control distractions.
Researchers concluded that the clowns were appreciated by the parents but not particularly effective on the children. Maybe that’s because the parents weren’t the ones being stuck with needles while some crazy person in clown makeup attempted to distract them. Or maybe they were all just big fans of Stephen King’s “It.”
Inked immunity
Starting to feel a bit under the weather? Head to the local tattoo artist for the cure! Research from the University of Alabama at Birmingham found evidence that the immune systems of heavily tattooed people are stronger than those without, proving once and for all that tats = toughness. Hell's Angels were on to something all along.

While your immune system can actually grow temporarily weaker after one tattoo, multiple tattoos create a stronger immunological response. Researchers tested the immunoglobulin A levels in those getting a first tattoo and those with many tattoos. They found that the latter group had higher IgA levels.
Maybe that’s why Adam Levine showed off his ink at the Super Bowl halftime show – he was just signaling his strong immune system to the rest of us.
Brain surgery is a laughing matter
This certainly came as a surprise to us, but as it turns out, undergoing brain surgery while conscious and awake can be extremely stressful and panic inducing to the patient. We’re sure most people (including us) would prefer to be asleep for their surgery, but sometimes when dealing with the brain, the surgeon needs to be able to talk to the patient to accurately assess their faculties in case they damage something important.

So the question is: How do you keep brain surgery patients from panicking? Why, with the power of laughter, of course! Specifically, a group at Emory University, Atlanta, published a case study in the Journal of Clinical Investigation about their treatment of a patient with moderate anxiety. When the patient woke up from initial anesthesia, she began to panic. However, after electrical stimulation of the cingulum bundle, the patient immediately turned her frown upside down and began laughing and joking with the surgeons.
Sadly, while the team did not report on the quality of the jokes being told, we can only assume the phrase “this isn’t brain surgery” was thrown around multiple times.
A male brain is a terrible thing to waste
In the future, comedy may mean pressing a button to stimulate your cingulum bundle, but for now we still have jokes. One old joke goes like this: Some aliens land on earth and want to learn about humans, so they go into a store to buy some brains. “Why does the male brain cost twice as much as the female brain?” one asks the store owner, who replies, “It’s hardly been used.”

There may be another explanation: Womens’ brains appear to age more slowly than mens’, investigators at Washington University, St. Louis, said in the Proceedings of the National Academy of Sciences.
They performed PET scans on 121 women and 84 men aged 20-82 years to determine the fraction of sugar committed to aerobic glycolysis in various regions of the brain, and then a machine-learning algorithm used those data to calculate metabolic ages.
The womens’ brains were younger than the mens’ brains, with various calculations producing average differences of 2.7-5.3 years, they reported.
The male brain, it seems, is used for something, and after one LOTME staffer spent 5 minutes explaining total quarterback rating (QBR) to his wife, we think we’ve figured out what it is: sports trivia.
Quit clowning around
Would you like a balloon giraffe, elephant, or hypodermic needle? A recently published study examined how the use of “medical clowns” eased the anxiety and pain of children during botulinum toxin injections. These injections are used to treat spasticity in children, and researchers hypothesized that a clown might be an effective distraction.
As anyone who has been to a circus can surmise, the clowns did not perform better than the control distractions.
Researchers concluded that the clowns were appreciated by the parents but not particularly effective on the children. Maybe that’s because the parents weren’t the ones being stuck with needles while some crazy person in clown makeup attempted to distract them. Or maybe they were all just big fans of Stephen King’s “It.”
Inked immunity
Starting to feel a bit under the weather? Head to the local tattoo artist for the cure! Research from the University of Alabama at Birmingham found evidence that the immune systems of heavily tattooed people are stronger than those without, proving once and for all that tats = toughness. Hell's Angels were on to something all along.
While your immune system can actually grow temporarily weaker after one tattoo, multiple tattoos create a stronger immunological response. Researchers tested the immunoglobulin A levels in those getting a first tattoo and those with many tattoos. They found that the latter group had higher IgA levels.
Maybe that’s why Adam Levine showed off his ink at the Super Bowl halftime show – he was just signaling his strong immune system to the rest of us.
Brain surgery is a laughing matter
This certainly came as a surprise to us, but as it turns out, undergoing brain surgery while conscious and awake can be extremely stressful and panic inducing to the patient. We’re sure most people (including us) would prefer to be asleep for their surgery, but sometimes when dealing with the brain, the surgeon needs to be able to talk to the patient to accurately assess their faculties in case they damage something important.
So the question is: How do you keep brain surgery patients from panicking? Why, with the power of laughter, of course! Specifically, a group at Emory University, Atlanta, published a case study in the Journal of Clinical Investigation about their treatment of a patient with moderate anxiety. When the patient woke up from initial anesthesia, she began to panic. However, after electrical stimulation of the cingulum bundle, the patient immediately turned her frown upside down and began laughing and joking with the surgeons.
Sadly, while the team did not report on the quality of the jokes being told, we can only assume the phrase “this isn’t brain surgery” was thrown around multiple times.
A male brain is a terrible thing to waste
In the future, comedy may mean pressing a button to stimulate your cingulum bundle, but for now we still have jokes. One old joke goes like this: Some aliens land on earth and want to learn about humans, so they go into a store to buy some brains. “Why does the male brain cost twice as much as the female brain?” one asks the store owner, who replies, “It’s hardly been used.”
There may be another explanation: Womens’ brains appear to age more slowly than mens’, investigators at Washington University, St. Louis, said in the Proceedings of the National Academy of Sciences.
They performed PET scans on 121 women and 84 men aged 20-82 years to determine the fraction of sugar committed to aerobic glycolysis in various regions of the brain, and then a machine-learning algorithm used those data to calculate metabolic ages.
The womens’ brains were younger than the mens’ brains, with various calculations producing average differences of 2.7-5.3 years, they reported.
The male brain, it seems, is used for something, and after one LOTME staffer spent 5 minutes explaining total quarterback rating (QBR) to his wife, we think we’ve figured out what it is: sports trivia.
Cloud of inconsistency hangs over cannabis data
More people are using medical cannabis as it becomes legal in more states, but the lack of standardization in states’ data collection hindered investigators’ efforts to track that use.
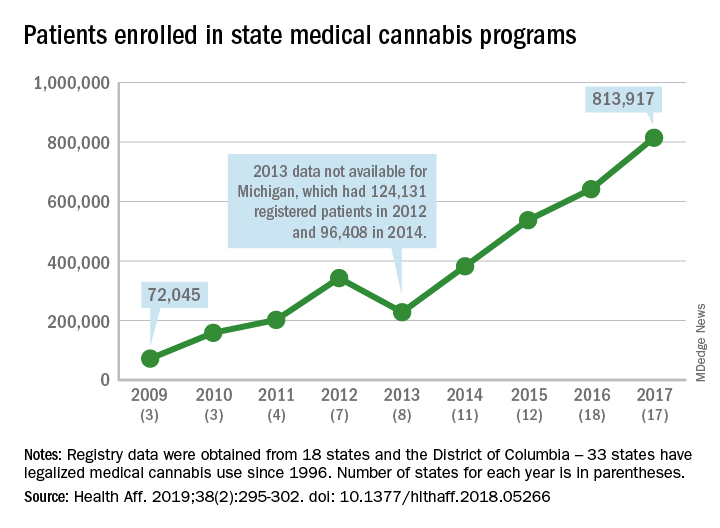
Legalized medical cannabis is now available in 33 states and the District of Columbia, and the number of users has risen from just over 72,000 in 2009 to almost 814,000 in 2017. That 814,000, however, covers only 16 states and D.C., since 1 state (Connecticut) does not publish reports on medical cannabis use, 12 did not have statistics available, 2 (New York and Vermont) didn’t report data for 2017, and 2 (California and Maine) have voluntary registries that are unlikely to be accurate, according to Kevin F. Boehnke, PhD, of the University of Michigan, Ann Arbor, and his associates.
Michigan had the largest reported number of patients enrolled in its medical cannabis program in 2017, almost 270,000. California – the state with the oldest medical cannabis legislation (passed in 1996) and the largest overall population but a voluntary cannabis registry – reported its highest number of enrollees, 12,659, in 2009-2010, the investigators said. Colorado had more than 116,000 patients in its medical cannabis program in 2010 (Health Aff. 2019;38[2]:295-302).
The “many inconsistencies in data quality across states [suggest] the need for further standardization of data collection. Such standardization would add transparency to understanding how medical cannabis programs are used, which would help guide both research and policy needs,” Dr. Boehnke and his associates wrote.
More consistency was seen in the reasons for using medical cannabis. Chronic pain made up 62.2% of all qualifying conditions reported by patients during 1999-2016, with the annual average varying between 33.3% and 73%. Multiple sclerosis spasticity symptoms had the second-highest number of reports over the study period, followed by chemotherapy-induced nausea and vomiting, posttraumatic stress disorder, and cancer, they reported.
The investigators also looked at the appropriateness of cannabis and determined that its use in 85.5% of patient-reported conditions was “supported by conclusive or substantial evidence of therapeutic effectiveness, according to the 2017 National Academies report” on the health effects of cannabis.
“We believe not only that it is inappropriate for cannabis to remain a Schedule I substance, but also that state and federal policy makers should begin evaluating evidence-based ways for safely integrating cannabis research and products into the health care system,” they concluded.
SOURCE: Boehnke KF et al. Health Aff. 2019;38(2):295-302.
More people are using medical cannabis as it becomes legal in more states, but the lack of standardization in states’ data collection hindered investigators’ efforts to track that use.
Legalized medical cannabis is now available in 33 states and the District of Columbia, and the number of users has risen from just over 72,000 in 2009 to almost 814,000 in 2017. That 814,000, however, covers only 16 states and D.C., since 1 state (Connecticut) does not publish reports on medical cannabis use, 12 did not have statistics available, 2 (New York and Vermont) didn’t report data for 2017, and 2 (California and Maine) have voluntary registries that are unlikely to be accurate, according to Kevin F. Boehnke, PhD, of the University of Michigan, Ann Arbor, and his associates.
Michigan had the largest reported number of patients enrolled in its medical cannabis program in 2017, almost 270,000. California – the state with the oldest medical cannabis legislation (passed in 1996) and the largest overall population but a voluntary cannabis registry – reported its highest number of enrollees, 12,659, in 2009-2010, the investigators said. Colorado had more than 116,000 patients in its medical cannabis program in 2010 (Health Aff. 2019;38[2]:295-302).
The “many inconsistencies in data quality across states [suggest] the need for further standardization of data collection. Such standardization would add transparency to understanding how medical cannabis programs are used, which would help guide both research and policy needs,” Dr. Boehnke and his associates wrote.
More consistency was seen in the reasons for using medical cannabis. Chronic pain made up 62.2% of all qualifying conditions reported by patients during 1999-2016, with the annual average varying between 33.3% and 73%. Multiple sclerosis spasticity symptoms had the second-highest number of reports over the study period, followed by chemotherapy-induced nausea and vomiting, posttraumatic stress disorder, and cancer, they reported.
The investigators also looked at the appropriateness of cannabis and determined that its use in 85.5% of patient-reported conditions was “supported by conclusive or substantial evidence of therapeutic effectiveness, according to the 2017 National Academies report” on the health effects of cannabis.
“We believe not only that it is inappropriate for cannabis to remain a Schedule I substance, but also that state and federal policy makers should begin evaluating evidence-based ways for safely integrating cannabis research and products into the health care system,” they concluded.
SOURCE: Boehnke KF et al. Health Aff. 2019;38(2):295-302.
FROM HEALTH AFFAIRS
Flu activity ticks up for second week in a row
Influenza activity increased for a second straight week after a 2-week drop and by one measure has topped the high reached in late December, according to the Centers for Disease Control and Prevention.
For the week ending Jan. 26, 2019, there were 16 states at level 10 on the CDC’s 1-10 scale of influenza-like illness (ILI) activity, compared with 12 states during the week ending Dec. 29. With another seven states at levels 8 and 9, that makes 23 in the high range for the week ending Jan. 26, again putting it above the 19 reported for Dec. 29, the CDC’s influenza division reported Feb. 1.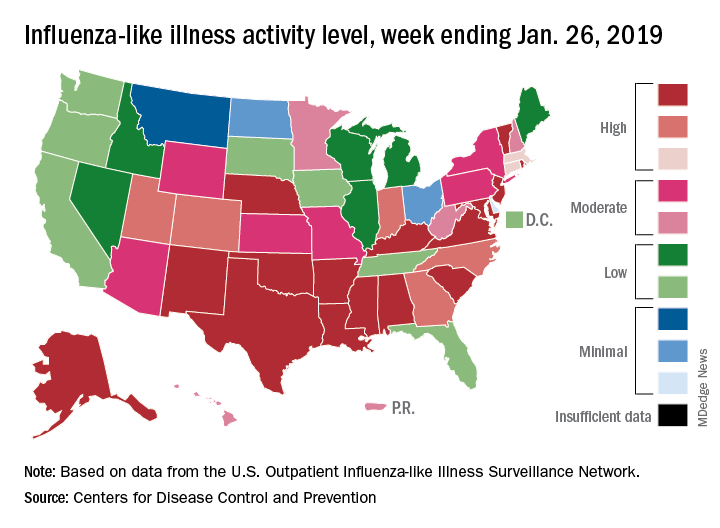
By another measure, however, that December peak in activity remains the seasonal high. The proportion of outpatient visits for ILI that week was 4.0%, compared with the 3.8% reported for Jan. 26. That’s up from 3.3% the week before and 3.1% the week before that, which in turn was the second week of a 2-week decline in activity in early January, CDC data show.
Two flu-related pediatric deaths were reported during the week ending Jan. 26, but both occurred the previous week. For the 2018-2019 flu season so far, a total of 24 pediatric flu deaths have been reported, the CDC said. At the same point in the 2017-2018 flu season, there had been 84 such deaths, according to the CDC’s Influenza-Associated Pediatric Mortality Surveillance System.
There were 143 overall flu-related deaths during the week of Jan. 19, which is the most recent week available. That is down from 189 the week before, but the Jan. 19 reporting is only 75% complete, data from the National Center for Health Statistics show.
Lifetime cost of tobacco use tops $1.9 million per smoker
according to the personal financial website WalletHub.
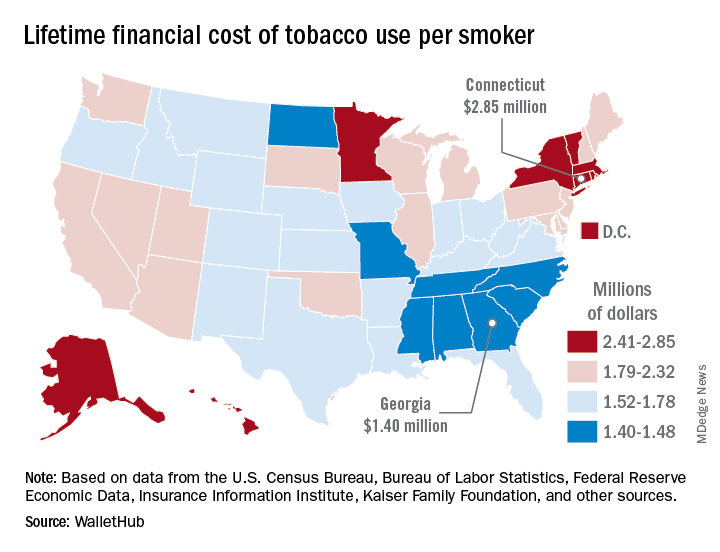
Economic and societal losses related to 37.8 million U.S. tobacco users – including out-of-pocket spending for cigarettes, health care expenses, and lost income – top $300 billion annually, but those costs vary considerably by state, WalletHub said in a recent report.
The state with the highest lifetime cost per smoker is Connecticut, with an estimated total of $2.85 million. That works out to just under $56,000 a year for 51 years because lifetime use was defined as one pack a day starting at age 18 years and continuing until age 69 years. New York has the second-highest lifetime cost, which also rounds off to $2.85 million, followed by the District of Columbia ($2.81 million), Massachusetts ($2.76 million), and Rhode Island ($2.68 million), WalletHub said.
Georgia has the lowest lifetime cost of any state – $1.40 million per smoker – followed by Missouri at $1.41 million, North Carolina at $1.42 million, Mississippi at $1.43 million, and South Carolina at $1.44 million, according to the report.
WalletHub’s formula for total lifetime cost has five components: out-of-pocket cost (one pack of cigarettes per day for 51 years), financial opportunity cost (defined as “the amount of return a person would have earned by instead investing that money in the stock market”), health care cost (spending on treatment for smoking-related health complications), income loss (an average 8% decrease caused by absenteeism and lost productivity), and other costs (loss of a homeowner’s insurance credit and costs of secondhand exposure).
The analysis was based on data from the U.S. Census Bureau, Bureau of Labor Statistics, Centers for Disease Control and Prevention, Insurance Information Institute, Campaign for Tobacco-Free Kids, NYsmokefree.com, Federal Reserve Economic Data, Kaiser Family Foundation, and the Independent Insurance Agents & Brokers of America.
according to the personal financial website WalletHub.
Economic and societal losses related to 37.8 million U.S. tobacco users – including out-of-pocket spending for cigarettes, health care expenses, and lost income – top $300 billion annually, but those costs vary considerably by state, WalletHub said in a recent report.
The state with the highest lifetime cost per smoker is Connecticut, with an estimated total of $2.85 million. That works out to just under $56,000 a year for 51 years because lifetime use was defined as one pack a day starting at age 18 years and continuing until age 69 years. New York has the second-highest lifetime cost, which also rounds off to $2.85 million, followed by the District of Columbia ($2.81 million), Massachusetts ($2.76 million), and Rhode Island ($2.68 million), WalletHub said.
Georgia has the lowest lifetime cost of any state – $1.40 million per smoker – followed by Missouri at $1.41 million, North Carolina at $1.42 million, Mississippi at $1.43 million, and South Carolina at $1.44 million, according to the report.
WalletHub’s formula for total lifetime cost has five components: out-of-pocket cost (one pack of cigarettes per day for 51 years), financial opportunity cost (defined as “the amount of return a person would have earned by instead investing that money in the stock market”), health care cost (spending on treatment for smoking-related health complications), income loss (an average 8% decrease caused by absenteeism and lost productivity), and other costs (loss of a homeowner’s insurance credit and costs of secondhand exposure).
The analysis was based on data from the U.S. Census Bureau, Bureau of Labor Statistics, Centers for Disease Control and Prevention, Insurance Information Institute, Campaign for Tobacco-Free Kids, NYsmokefree.com, Federal Reserve Economic Data, Kaiser Family Foundation, and the Independent Insurance Agents & Brokers of America.