User login
Bringing you the latest news, research and reviews, exclusive interviews, podcasts, quizzes, and more.
div[contains(@class, 'read-next-article')]
div[contains(@class, 'nav-primary')]
nav[contains(@class, 'nav-primary')]
section[contains(@class, 'footer-nav-section-wrapper')]
nav[contains(@class, 'nav-ce-stack nav-ce-stack__large-screen')]
header[@id='header']
div[contains(@class, 'header__large-screen')]
div[contains(@class, 'read-next-article')]
div[contains(@class, 'main-prefix')]
div[contains(@class, 'nav-primary')]
nav[contains(@class, 'nav-primary')]
section[contains(@class, 'footer-nav-section-wrapper')]
footer[@id='footer']
section[contains(@class, 'nav-hidden')]
div[contains(@class, 'ce-card-content')]
nav[contains(@class, 'nav-ce-stack')]
div[contains(@class, 'view-medstat-quiz-listing-panes')]
div[contains(@class, 'pane-article-sidebar-latest-news')]
AHA targets rising prevalence of obstructive sleep apnea in children
Obstructive sleep apnea is becoming more common in children and adolescents as the prevalence of obesity increases, but it may also be a preventable risk factor for cardiovascular disease, according to a new scientific statement from the American Heart Association.

The statement focuses on the links between OSA and CVD risk factors in children and adolescents, and reviews diagnostic strategies and treatments. The writing committee reported that 1%-6% of children and adolescents have OSA, as do up to 60% of adolescents considered obese.
The statement was created by the AHA’s Atherosclerosis, Hypertension, and Obesity in the Young subcommittee of the Council on Cardiovascular Disease in the Young and was published online in the Journal of the American Heart Association.
Carissa M. Baker-Smith, MD, chair of the writing group chair and director of pediatric preventive cardiology at Nemours Cardiac Center, Alfred I. duPont Hospital for Children, Wilmington, Del., explained the rationale for issuing the statement at this time, noting that the relationship between OSA and CVD in adults is well documented.
“There has been less focus on the importance of recognizing and treating sleep apnea in youth,” she said in an interview. “Thus, we felt that it was vitally important to get the word out to parents and to providers that paying attention to the quality and duration of your child’s sleep is vitally important to a child’s long-term heart health. Risk factors for heart disease, when present in childhood, can persist into adulthood.”
Clarity on polysomnography
For making the diagnosis of OSA in children, the statement provides clarity on the use of polysomnography and the role of the apnea-hypopnea index, which is lower in children with OSA than in adults. “One controversy, or at least as I saw it, was whether or not polysomnography testing is always required to make the diagnosis of OSA and before proceeding with tonsil and adenoid removal among children for whom enlarged tonsils and adenoids are present,” Dr. Baker-Smith said. “Polysomnography testing is not always needed before an ear, nose, and throat surgeon may recommend surgery.”
The statement also noted that history and physical examination may not yield enough reliable information to distinguish OSA from snoring.
In areas where sleep laboratories that work with children aren’t available, alternative tests such as daytime nap polysomnography, nocturnal oximetry, and nocturnal video recording may be used – with a caveat. “These alternative tests have weaker positive and negative predictive values when compared with polysomnography,” the writing committee noted. Home sleep apnea tests aren’t recommended in children. Questionnaires “are useful as screening, but not as diagnostic tools.”
Pediatric patients being evaluated for OSA should also be screened for hypertension and metabolic syndrome, as well as central nervous system and behavioral disorders. Diagnosing OSA in children and adolescents requires “a high index of suspicion,” the committee wrote.
Pediatricians and pediatric cardiologists should exercise that high index of suspicion when receiving referrals for cardiac evaluations for attention deficit hyperactivity disorder medication, Dr. Baker-Smith said. “Take the time to ask about a child’s sleep – snoring, apnea, etc. – especially if the child has obesity, difficulty focusing during the day, and if there is evidence of systemic hypertension or other signs of metabolic syndrome,” she said.
Risk factors for OSA in children
The statement also reviewed risk factors for OSA, among them obesity, particularly among children younger than 6 years. Other risk factors include upper and lower airway disease, hypotonia, parental history of hyperplasia of the adenoids and tonsils, craniofacial malformations, and neuromuscular disorders. However, the committee cited “limited data” to support that children with congenital heart disease may be at greater risk for OSA and sleep-disordered breathing (SDB).
Black children are at significantly greater risk, and socioeconomic factors “may be potential confounders,” the committee stated. Other risk factors include allergic rhinitis and sickle cell disease.
But the statement underscores that “obesity is the main risk factor” for OSA in children and adolescents, and that the presence of increased inflammation may explain this relationship. Steroids may alleviate these symptoms, even in nonobese children, and removal of the adenoids or tonsils is an option to reduce inflammation in children with OSA.
“Obesity is a significant risk factor for sleep disturbances and obstructive sleep apnea, and the severity of sleep apnea may be improved by weight-loss interventions, which then improves metabolic syndrome factors such as insulin sensitivity,” Dr. Baker-Smith said. “We need to increase awareness about how the rising prevalence of obesity may be impacting sleep quality in kids and recognize sleep-disordered breathing as something that could contribute to risks for hypertension and later cardiovascular disease.”
Children in whom OSA is suspected should also undergo screening for metabolic syndrome, and central nervous system and behavioral disorders.
Cardiovascular risks
The statement explores the connection between cardiovascular complications and SDB and OSA in depth.
“Inadequate sleep duration of < 5 hours per night in children and adolescents has been linked to an increased risk of hypertension and is also associated with an increased prevalence of obesity,” the committee wrote.
However, the statement left one question hanging: whether OSA alone or obesity cause higher BP in younger patients with OSA. But the committee concluded that BP levels increase with the severity of OSA, although the effects can vary with age. OSA in children peaks between ages 2 and 8, corresponding to the peak prevalence of hypertrophy of the tonsils and adenoids. Children aged 10-11 with more severe OSA may have BP dysregulation, while older adolescents develop higher sustained BP. Obesity may be a confounder for daytime BP elevations, while nighttime hypertension depends less on obesity and more on OSA severity.
“OSA is associated with abnormal BP in youth and, in particular, higher nighttime blood pressures and loss of the normal decline in BP that should occur during sleep,” Dr. Baker-Smith said. “Children with OSA appear to have higher BP than controls during both sleep and wake times, and BP levels increase with increasing severity of OSA.”
Nonetheless, children with OSA are at greater risk for other cardiovascular problems. Left ventricular hypertrophy may be a secondary outcome. “The presence of obstructive sleep apnea in children is associated with an 11-fold increased risk for LVH in children, a relationship not seen in the presence of primary snoring alone,” Dr. Baker-Smith said.
Dr. Baker-Smith had no relevant disclosures. Coauthor Amal Isaiah, MD, is coinventor of an imaging system for sleep apnea and receives royalties from the University of Maryland. The other coauthors have no relevant financial relationships to disclose.
Obstructive sleep apnea is becoming more common in children and adolescents as the prevalence of obesity increases, but it may also be a preventable risk factor for cardiovascular disease, according to a new scientific statement from the American Heart Association.
The statement focuses on the links between OSA and CVD risk factors in children and adolescents, and reviews diagnostic strategies and treatments. The writing committee reported that 1%-6% of children and adolescents have OSA, as do up to 60% of adolescents considered obese.
The statement was created by the AHA’s Atherosclerosis, Hypertension, and Obesity in the Young subcommittee of the Council on Cardiovascular Disease in the Young and was published online in the Journal of the American Heart Association.
Carissa M. Baker-Smith, MD, chair of the writing group chair and director of pediatric preventive cardiology at Nemours Cardiac Center, Alfred I. duPont Hospital for Children, Wilmington, Del., explained the rationale for issuing the statement at this time, noting that the relationship between OSA and CVD in adults is well documented.
“There has been less focus on the importance of recognizing and treating sleep apnea in youth,” she said in an interview. “Thus, we felt that it was vitally important to get the word out to parents and to providers that paying attention to the quality and duration of your child’s sleep is vitally important to a child’s long-term heart health. Risk factors for heart disease, when present in childhood, can persist into adulthood.”
Clarity on polysomnography
For making the diagnosis of OSA in children, the statement provides clarity on the use of polysomnography and the role of the apnea-hypopnea index, which is lower in children with OSA than in adults. “One controversy, or at least as I saw it, was whether or not polysomnography testing is always required to make the diagnosis of OSA and before proceeding with tonsil and adenoid removal among children for whom enlarged tonsils and adenoids are present,” Dr. Baker-Smith said. “Polysomnography testing is not always needed before an ear, nose, and throat surgeon may recommend surgery.”
The statement also noted that history and physical examination may not yield enough reliable information to distinguish OSA from snoring.
In areas where sleep laboratories that work with children aren’t available, alternative tests such as daytime nap polysomnography, nocturnal oximetry, and nocturnal video recording may be used – with a caveat. “These alternative tests have weaker positive and negative predictive values when compared with polysomnography,” the writing committee noted. Home sleep apnea tests aren’t recommended in children. Questionnaires “are useful as screening, but not as diagnostic tools.”
Pediatric patients being evaluated for OSA should also be screened for hypertension and metabolic syndrome, as well as central nervous system and behavioral disorders. Diagnosing OSA in children and adolescents requires “a high index of suspicion,” the committee wrote.
Pediatricians and pediatric cardiologists should exercise that high index of suspicion when receiving referrals for cardiac evaluations for attention deficit hyperactivity disorder medication, Dr. Baker-Smith said. “Take the time to ask about a child’s sleep – snoring, apnea, etc. – especially if the child has obesity, difficulty focusing during the day, and if there is evidence of systemic hypertension or other signs of metabolic syndrome,” she said.
Risk factors for OSA in children
The statement also reviewed risk factors for OSA, among them obesity, particularly among children younger than 6 years. Other risk factors include upper and lower airway disease, hypotonia, parental history of hyperplasia of the adenoids and tonsils, craniofacial malformations, and neuromuscular disorders. However, the committee cited “limited data” to support that children with congenital heart disease may be at greater risk for OSA and sleep-disordered breathing (SDB).
Black children are at significantly greater risk, and socioeconomic factors “may be potential confounders,” the committee stated. Other risk factors include allergic rhinitis and sickle cell disease.
But the statement underscores that “obesity is the main risk factor” for OSA in children and adolescents, and that the presence of increased inflammation may explain this relationship. Steroids may alleviate these symptoms, even in nonobese children, and removal of the adenoids or tonsils is an option to reduce inflammation in children with OSA.
“Obesity is a significant risk factor for sleep disturbances and obstructive sleep apnea, and the severity of sleep apnea may be improved by weight-loss interventions, which then improves metabolic syndrome factors such as insulin sensitivity,” Dr. Baker-Smith said. “We need to increase awareness about how the rising prevalence of obesity may be impacting sleep quality in kids and recognize sleep-disordered breathing as something that could contribute to risks for hypertension and later cardiovascular disease.”
Children in whom OSA is suspected should also undergo screening for metabolic syndrome, and central nervous system and behavioral disorders.
Cardiovascular risks
The statement explores the connection between cardiovascular complications and SDB and OSA in depth.
“Inadequate sleep duration of < 5 hours per night in children and adolescents has been linked to an increased risk of hypertension and is also associated with an increased prevalence of obesity,” the committee wrote.
However, the statement left one question hanging: whether OSA alone or obesity cause higher BP in younger patients with OSA. But the committee concluded that BP levels increase with the severity of OSA, although the effects can vary with age. OSA in children peaks between ages 2 and 8, corresponding to the peak prevalence of hypertrophy of the tonsils and adenoids. Children aged 10-11 with more severe OSA may have BP dysregulation, while older adolescents develop higher sustained BP. Obesity may be a confounder for daytime BP elevations, while nighttime hypertension depends less on obesity and more on OSA severity.
“OSA is associated with abnormal BP in youth and, in particular, higher nighttime blood pressures and loss of the normal decline in BP that should occur during sleep,” Dr. Baker-Smith said. “Children with OSA appear to have higher BP than controls during both sleep and wake times, and BP levels increase with increasing severity of OSA.”
Nonetheless, children with OSA are at greater risk for other cardiovascular problems. Left ventricular hypertrophy may be a secondary outcome. “The presence of obstructive sleep apnea in children is associated with an 11-fold increased risk for LVH in children, a relationship not seen in the presence of primary snoring alone,” Dr. Baker-Smith said.
Dr. Baker-Smith had no relevant disclosures. Coauthor Amal Isaiah, MD, is coinventor of an imaging system for sleep apnea and receives royalties from the University of Maryland. The other coauthors have no relevant financial relationships to disclose.
FROM JOURNAL OF THE AMERICAN HEART ASSOCIATION
COVID booster may benefit active-treatment cancer patients
A COVID-19 booster shot may be beneficial for patients with cancer who are undergoing treatment, according to new findings from an Israeli case-control study.
The seropositivity rate among the patients with cancer remained high (87%) about 4 months after the patients had received the second BNT162b2 (Pfizer/BioNTech) vaccination. However, the median IgG titer in the patients and the control persons who were without cancer decreased over time. Notably, in a previous analysis that the authors conducted and in the current one, the IgG titers were statistically significantly lower in the patients with cancer as compared to control persons.
The correlation between antibody levels following vaccination and clinical protection has yet to be proven, but the accumulating evidence supports antibody response as a possible correlate of disease protection.
“Our data can’t predict if a third booster dose is necessary,” said study author Salomon M. Stemmer, MD, professor at the Institute of Oncology of Rabin Medical Center, Petah Tikva, Israel. “It does seem quite logical that a booster dose will cause an increase in IgG levels.”
The findings were published Aug. 11, 2021, in a research letter in JAMA Oncology.
In their previous study, Dr. Stemmer and colleagues compared the rates of anti–spike antibody response to the initial shot of the BNT162b2 vaccine among 102 adults with solid-tumor cancers who were undergoing treatment with that of 78 healthy control persons. They found that a high percentage of patients undergoing treatment for cancer (90%) achieved a sufficient antibody response to the BNT162b2 vaccine.
Booster endorsed
Responses to COVID-19 vaccination have varied among patients with cancer. For patients with solid tumors, responses have been good even while the patients were receiving systemic therapy. However, among patients with blood cancers, particularly those receiving immunosuppressive therapies, responses have been poor. Studies have identified factors associated with a poor response, but it has been unclear whether to recommend booster shots.
In August the Food and Drug Administration authorized a third dose of either the Pfizer or the Moderna COVID-19 vaccine for all individuals with compromised immune systems. Those eligible for a third dose include solid-organ transplant recipients, those undergoing cancer treatments, and people with autoimmune diseases that suppress their immune systems.
IgG titers lower in cancer patients
In the current analysis, the authors evaluated the anti-S response in the patients with cancer approximately 4 months after they had received the second vaccine dose. They compared the responses in those patients with the responses in a control group.
The cohort included 95 patients from the prior study and 66 control persons. The most common malignancies were gastrointestinal (26%), lung (25%), and breast (18%).
All patients were receiving systemic therapy. Chemotherapy was the most common (28%), followed by immunotherapy (21%) and combination chemotherapy/biological therapy (20%).
At a median of 123 days after the second vaccination, 83 patients with cancer (87%) and all of the control patients (100%) were seropositive for anti-S IgG antibodies. The median titer levels were significantly lower among case patients as compared with control patients (417 AU/mL [interquartile range, 136-895] vs. 1,220 AU/mL [IQR, 588-1,987]; P < .001)
There was a 3.6-fold range in median titer values across tumor types and an even wider range (8.8-fold) across the different types of treatment. The lowest titers were observed among patients who had received immunotherapy plus chemotherapy/biological therapy (median [IQR], 94.4 [49.4-191] AU/mL vs. 147 [62.8-339] AU/mL).
In an exploratory multivariable analysis, treatments with chemotherapy plus immunotherapy and immunotherapy plus biological therapy were significantly associated with lower IgG titers.
No downside for cancer patients
The Biden administration announced a plan to begin booster COVID-19 vaccinations for all American adults in September, with recommendations that the third vaccine be given at least 8 months after the second mRNA vaccine dose.
Jeremy M. Levin, DPhil, the chairman and CEO of Ovid Therapeutics, explained that, concerning boosters, “it is inconceivable that we will have all data at this stage.
“Knowledge about how boosters work and don’t work and when you should ideally have them is imperfect,” he told this news organization. “However, we can have a lot of confidence in the fact that hundreds of millions of people have received the vaccine, so we know a lot about the safety and efficacy.”
Immunocompromised adults represent less than 5% of the total population, and most of the available data on vaccination are from patients who have undergone solid-organ transplant, Dr. Levin explained. Studies have shown that their response is less robust to vaccination in comparison with adults in the general population.
“Although it is still preliminary, the strongest data come from Israel,” he said, “where they found that the booster was highly effective and doubled the number of transplant patients who developed antibodies.”
But data are not yet available in the setting of cancer. “But even though we don’t have the data yet, the answer is that no matter, the booster process is essential,” he said. “The evidence we have is that boosters raise the immune response, and it is the best data we have now.”
Martin J. Edelman, MD, chair, department of hematology/oncology, Fox Chase Cancer Center, Philadelphia, noted that the current recommendation is that patients who are immunocompromised receive a booster immediately.
At his health system, this is interpreted to include patients who have undergone the following treatments: Transplant (solid-organ and bone marrow transplant), hemodialysis, hematologic malignancy treatment, active immunosuppressive (chemotherapy, chemoimmunotherapy, and nonhormonal or single-agent immunotherapy) treatment, rheumatology treatments, and high-dose steroids.
“As for cancer patients, we are making arrangements to vaccinate patients who meet the above criteria now,” he said. “There is no known downside to receiving booster immediately. While there may be less of a response than waiting for completion of treatment, we know that patients on active therapy are frequently able to mount a response, and any response is better than none.”
Dr. Edelman added that this area is changing very rapidly. “We will modify our approach as information and guidance from appropriate organizations, such as the FDA and CDC, become available.”
Dr. Stemmer has received institutional research grants from CAN-FITE, AstraZeneca, Bioline RX, BMS, Halozyme, Clovis Oncology, CTG Pharma, Exelixis, Geicam, Incyte, Lilly, Moderna, Teva Pharmaceuticals, and Roche, and owns stocks and options in CTG Pharma, DocBoxMD, Tyrnovo, VYPE, Cytora, and CAN-FITE. Dr. Edelman has received personal fees and other compensation from Windmil, Biomarker Strategies, AstraZeneca, Takeda, GlaxoSmithKline, Apexigen, Nektar, Bristol-Myers Squibb, Armo, Bergen Bio, and Apexigen outside the submitted work. He has submitted a patent for epigenetic modifications to increase susceptibility to radiopharmaceuticals and is a paid adviser for Kanaph and Flame. Dr. Levin is chairman and CEO of Ovid Therapeutics.
A version of this article first appeared on Medscape.com.
Children and COVID: New cases soar to near-record level
Weekly cases of COVID-19 in children jumped by nearly 50% in the United States, posting the highest count since hitting a pandemic high back in mid-January, a new report shows.
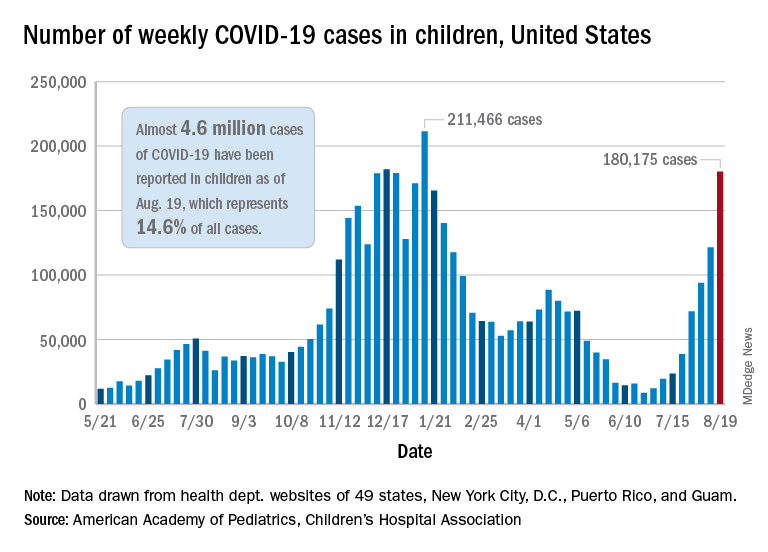
The latest weekly figure represents a 48% increase over the previous week and an increase of over 2,000% in the 8 weeks since the national count dropped to a low of 8,500 cases for the week of June 18-24, the American Academy of Pediatrics and the Children’s Hospital Association said in their weekly COVID report.
Vaccinations, in the meantime, appear to be headed in the opposite direction. Vaccine initiations were down for the second consecutive week, falling by 18% among 12- to 15-year-olds and by 15% in those aged 16-17 years, according to data from the Centers for Disease Control and Prevention.
Nationally, about 47% of children aged 12-15 and 56% of those aged 16-17 have received at least one dose of COVID vaccine as of Aug. 23, with 34% and 44%, respectively, reaching full vaccination. The total number of children with at least one dose is 11.6 million, including a relatively small number (about 200,000) of children under age 12 years, the CDC said on its COVID Data Tracker.
At the state level, vaccination is a source of considerable disparity. In Vermont, 73% of children aged 12-17 had received at least one dose by Aug. 18, and 63% were fully vaccinated. In Wyoming, however, just 25% of children had received at least one dose (17% are fully vaccinated), while Alabama has a lowest-in-the-nation full vaccination rate of 14%, based on a separate AAP analysis of CDC data.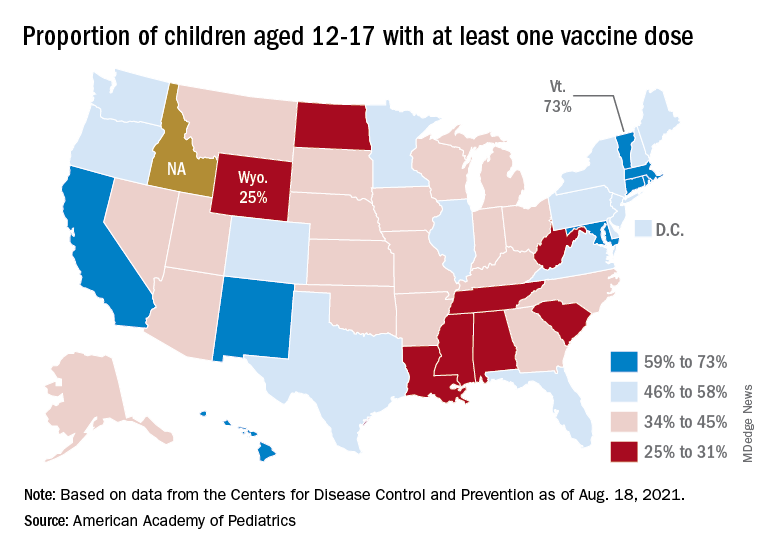
There are seven states in which over 60% of 12- to 17-year-olds have at least started the vaccine regimen and five states where less than 30% have received at least one dose, the AAP noted.
Back on the incidence side of the pandemic, Mississippi and Hawaii had the largest increases in new cases over the past 2 weeks, followed by Florida and West Virginia. Cumulative figures show that California has had the most cases overall in children (550,337), Vermont has the highest proportion of all cases in children (22.9%), and Rhode Island has the highest rate of cases per 100,000 (10,636), the AAP and CHA said in the joint report based on data from 49 states, the District of Columbia, New York City, Puerto Rico, and Guam.
Add up all those jurisdictions, and it works out to 4.6 million children infected with SARS-CoV-2 as of Aug. 19, with children representing 14.6% of all cases since the start of the pandemic. There have been over 18,000 hospitalizations so far, which is just 2.3% of the total for all ages in the 23 states (and New York City) that are reporting such data on their health department websites, the AAP and CHA said.
The number of COVID-related deaths in children is now 402 after the largest 1-week increase (24) since late May of 2020, when the AAP/CHA coverage began. Mortality data by age are available from 44 states, New York City, Puerto Rico, and Guam.
Weekly cases of COVID-19 in children jumped by nearly 50% in the United States, posting the highest count since hitting a pandemic high back in mid-January, a new report shows.
The latest weekly figure represents a 48% increase over the previous week and an increase of over 2,000% in the 8 weeks since the national count dropped to a low of 8,500 cases for the week of June 18-24, the American Academy of Pediatrics and the Children’s Hospital Association said in their weekly COVID report.
Vaccinations, in the meantime, appear to be headed in the opposite direction. Vaccine initiations were down for the second consecutive week, falling by 18% among 12- to 15-year-olds and by 15% in those aged 16-17 years, according to data from the Centers for Disease Control and Prevention.
Nationally, about 47% of children aged 12-15 and 56% of those aged 16-17 have received at least one dose of COVID vaccine as of Aug. 23, with 34% and 44%, respectively, reaching full vaccination. The total number of children with at least one dose is 11.6 million, including a relatively small number (about 200,000) of children under age 12 years, the CDC said on its COVID Data Tracker.
At the state level, vaccination is a source of considerable disparity. In Vermont, 73% of children aged 12-17 had received at least one dose by Aug. 18, and 63% were fully vaccinated. In Wyoming, however, just 25% of children had received at least one dose (17% are fully vaccinated), while Alabama has a lowest-in-the-nation full vaccination rate of 14%, based on a separate AAP analysis of CDC data.
There are seven states in which over 60% of 12- to 17-year-olds have at least started the vaccine regimen and five states where less than 30% have received at least one dose, the AAP noted.
Back on the incidence side of the pandemic, Mississippi and Hawaii had the largest increases in new cases over the past 2 weeks, followed by Florida and West Virginia. Cumulative figures show that California has had the most cases overall in children (550,337), Vermont has the highest proportion of all cases in children (22.9%), and Rhode Island has the highest rate of cases per 100,000 (10,636), the AAP and CHA said in the joint report based on data from 49 states, the District of Columbia, New York City, Puerto Rico, and Guam.
Add up all those jurisdictions, and it works out to 4.6 million children infected with SARS-CoV-2 as of Aug. 19, with children representing 14.6% of all cases since the start of the pandemic. There have been over 18,000 hospitalizations so far, which is just 2.3% of the total for all ages in the 23 states (and New York City) that are reporting such data on their health department websites, the AAP and CHA said.
The number of COVID-related deaths in children is now 402 after the largest 1-week increase (24) since late May of 2020, when the AAP/CHA coverage began. Mortality data by age are available from 44 states, New York City, Puerto Rico, and Guam.
U.S. kidney transplants grow in number and success

During 2016-2019, U.S. centers performed kidney transplants in nearly 77,000 patients, a jump of almost 25% compared with 4-year averages of about 62,000 patients throughout 2004-2015. That works out to about 15,000 more patients receiving donor kidneys, Sundaram Hariharan, MD, and associates reported in the New England Journal of Medicine in a review of all U.S. renal transplantations performed during 1996-2019.

Coupled with the volume uptick during this 24-year period were new lows in graft losses and patient deaths. By 2018, mortality during the first year following transplantation occurred at about a 1% rate among patients who had received a kidney from a living donor, and at about a 3% rate when the organ came from a deceased donor, nearly half the rate of 2 decades earlier, in 1996. Rates of first-year graft loss during 2017 were also about half of what they had been in 1996, occurring in about 2% of patients who received a living donor organ and in about 6% of those who got a kidney from a deceased donor during 2017.
“Twenty years ago, kidney transplantation was the preferred option compared with dialysis, and even more so now,” summed up Dr. Hariharan, a senior transplant nephrologist and professor of medicine and surgery at the University of Pittsburgh Medical Center and first author of the report. Kidney transplantation survival at U.S. centers “improved steadily over the past 24 years, despite patient variables becoming worse,” he said in an interview.
Kidney recipients are older, more obese, and have more prevalent diabetes
During the period studied, kidney transplant recipients became on average older and more obese, and had a higher prevalence of diabetes; the age of organ donors grew as well. The prevalence of diabetes among patients who received a kidney from a deceased donor increased from 24% during 1996-1999 to 36% during 2016-2019, while diabetes prevalence among recipients of an organ from a living donor rose from 25% in 1996-1999 to 29% during 2016-2019.
The improved graft and patient survival numbers “are very encouraging trends,” said Michelle A. Josephson, MD, professor and medical director of kidney transplantation at the University of Chicago, who was not involved with the report. “We have been hearing for a number of years that short-term graft survival had improved, but I’m thrilled to learn that long-term survival has also improved.”
The report documented 10-year survival of graft recipients during 2008-2011 of 67%, up from 61% during 1996-1999, and a 10-year overall graft survival rate of 54% in the 2008-2011 cohort, an improvement from the 42% rate in patients who received their organs in 1996-1999, changes Dr. Hariharan characterized as “modest.”
These improvements in long-term graft and patient survival are “meaningful, and particularly notable that outcomes improved despite increased complexity of the transplant population,” said Krista L. Lentine, MD, PhD, professor and medical director of living donation at Saint Louis University. But “despite these improvements, long-term graft survival remains limited,” she cautioned, especially because of risks for substantial complications from chronic immunosuppressive treatment including infection, cancer, glucose intolerance, and dyslipidemia.
The analysis reported by Dr. Hariharan and his associates used data collected by the Scientific Registry of Transplant Patients, run under contract with the U.S. Department of Health and Human Services, which has tracked all patients who have had kidney transplants at U.S. centers since the late 1980s, said Dr. Hariharan. The database included just over 362,000 total transplants during the 24-year period studied, with 36% of all transplants involving organs from living donors with the remaining patients receiving kidneys from deceased donors.
Living donations still stagnant; deceased-donor kidneys rise
The data showed that the rate of transplants from living donors was stagnant for 2 decades, with 22,525 patients transplanted during 2000-2003, and 23,746 transplanted during 2016-2019, with very similar rates during the intervening years. The recent spurt in transplants during 2016-2019 compared with the preceding decade depended almost entirely on kidneys from deceased donors. This rate jumped from the steady, slow rise it showed during 1996-2015, when deceased-donor transplants rose from about 30,000 during 1996-1999 to about 41,000 during 2012-2015, to a more dramatic increase of about 12,000 additional transplants during the most recent period, adding up to a total of more than 53,000 transplants from deceased donors during 2016-2019.
“I strongly recommend organs from living donors” when feasible, said Dr. Hariharan. “At some centers, a high proportion of transplants use living donors, but not at other centers,” he said.
It’s unknown why transplants using organs from deceased donors has shown this growth, but Dr. Hariharan suggested a multifactorial explanation. Those factors include growth in the number of patients with end-stage renal disease who require dialysis, increased numbers of patients listed for kidney transplant, new approaches that allow organs from older donors and those infected with pathogens such as hepatitis C virus or HIV, greater numbers of people and families agreeing to donate organs, and possibly the opioid crisis that may have led to increased organ donation. The number of U.S. centers performing kidney transplants rose from fewer than 200 about a quarter of a century ago to about 250 today, he added.
‘Immuno Bill’ guarantees Medicare coverage for immunosuppression
Dr. Hariharan voiced optimism that graft and patient survival rates will continue to improve going forward. One factor will likely be the passage in late 2020 of the “Immuno Bill” by the U.S. Congress, which among other things mandated ongoing coverage starting in 2023 for immunosuppressive drugs for all Medicare beneficiaries with a kidney transplant. Until then, Medicare provides coverage for only 36 months, a time limit that has resulted in nearly 400 kidney recipients annually losing coverage of their immunosuppression medications.
Dr. Hariharan and coauthors called the existing potential for discontinuation of immunosuppressive drug an “unnecessary impediment to long-term survival for which patients and society paid a heavy price.”
“Kidney transplantation, especially from living donors, offers patients with kidney failure the best chance for long-term survival and improved quality of life, with lower cost to the health care system,” Dr. Lentine said in an interview. Despite the many positive trends detailed in the report from Dr. Hariharan and coauthors, “the vast majority of the more than 700,000 people in the United States with kidney failure will not have an opportunity to receive a transplant due to limitations in organ supply.” And many patients who receive a kidney transplant eventually must resume dialysis because of “limited long-term graft survival resulting from allograft nephropathy, recurrent native disease, medication nonadherence, or other causes.” Plus many potentially transplantable organs go unused.
Dr. Lentine cited a position statement issued in July 2021 by the National Kidney Foundation that made several recommendations on how to improve access to kidney transplants and improve outcomes. “Expanding opportunities for safe living donation, eliminating racial disparities in living-donor access, improving wait-list access and transport readiness, maximizing use of deceased-donor organs, and extending graft longevity are critical priorities,” said Dr. Lentine, lead author on the statement.
“For many or even most patients with kidney failure transplantation is the optimal form of renal replacement. The better recent outcomes and evolving management strategies make transplantation an even more attractive option,” said Dr. Josephson. Improved outcomes among U.S. transplant patients also highlights the “importance of increasing access to kidney transplantation” for all people with kidney failure who could benefit from this treatment, she added.
Dr. Hariharan and Dr. Lentine had no relevant disclosures. Dr. Josephson has been a consultant to UCB and has an ownership interest in Seagen.
During 2016-2019, U.S. centers performed kidney transplants in nearly 77,000 patients, a jump of almost 25% compared with 4-year averages of about 62,000 patients throughout 2004-2015. That works out to about 15,000 more patients receiving donor kidneys, Sundaram Hariharan, MD, and associates reported in the New England Journal of Medicine in a review of all U.S. renal transplantations performed during 1996-2019.
Coupled with the volume uptick during this 24-year period were new lows in graft losses and patient deaths. By 2018, mortality during the first year following transplantation occurred at about a 1% rate among patients who had received a kidney from a living donor, and at about a 3% rate when the organ came from a deceased donor, nearly half the rate of 2 decades earlier, in 1996. Rates of first-year graft loss during 2017 were also about half of what they had been in 1996, occurring in about 2% of patients who received a living donor organ and in about 6% of those who got a kidney from a deceased donor during 2017.
“Twenty years ago, kidney transplantation was the preferred option compared with dialysis, and even more so now,” summed up Dr. Hariharan, a senior transplant nephrologist and professor of medicine and surgery at the University of Pittsburgh Medical Center and first author of the report. Kidney transplantation survival at U.S. centers “improved steadily over the past 24 years, despite patient variables becoming worse,” he said in an interview.
Kidney recipients are older, more obese, and have more prevalent diabetes
During the period studied, kidney transplant recipients became on average older and more obese, and had a higher prevalence of diabetes; the age of organ donors grew as well. The prevalence of diabetes among patients who received a kidney from a deceased donor increased from 24% during 1996-1999 to 36% during 2016-2019, while diabetes prevalence among recipients of an organ from a living donor rose from 25% in 1996-1999 to 29% during 2016-2019.
The improved graft and patient survival numbers “are very encouraging trends,” said Michelle A. Josephson, MD, professor and medical director of kidney transplantation at the University of Chicago, who was not involved with the report. “We have been hearing for a number of years that short-term graft survival had improved, but I’m thrilled to learn that long-term survival has also improved.”
The report documented 10-year survival of graft recipients during 2008-2011 of 67%, up from 61% during 1996-1999, and a 10-year overall graft survival rate of 54% in the 2008-2011 cohort, an improvement from the 42% rate in patients who received their organs in 1996-1999, changes Dr. Hariharan characterized as “modest.”
These improvements in long-term graft and patient survival are “meaningful, and particularly notable that outcomes improved despite increased complexity of the transplant population,” said Krista L. Lentine, MD, PhD, professor and medical director of living donation at Saint Louis University. But “despite these improvements, long-term graft survival remains limited,” she cautioned, especially because of risks for substantial complications from chronic immunosuppressive treatment including infection, cancer, glucose intolerance, and dyslipidemia.
The analysis reported by Dr. Hariharan and his associates used data collected by the Scientific Registry of Transplant Patients, run under contract with the U.S. Department of Health and Human Services, which has tracked all patients who have had kidney transplants at U.S. centers since the late 1980s, said Dr. Hariharan. The database included just over 362,000 total transplants during the 24-year period studied, with 36% of all transplants involving organs from living donors with the remaining patients receiving kidneys from deceased donors.
Living donations still stagnant; deceased-donor kidneys rise
The data showed that the rate of transplants from living donors was stagnant for 2 decades, with 22,525 patients transplanted during 2000-2003, and 23,746 transplanted during 2016-2019, with very similar rates during the intervening years. The recent spurt in transplants during 2016-2019 compared with the preceding decade depended almost entirely on kidneys from deceased donors. This rate jumped from the steady, slow rise it showed during 1996-2015, when deceased-donor transplants rose from about 30,000 during 1996-1999 to about 41,000 during 2012-2015, to a more dramatic increase of about 12,000 additional transplants during the most recent period, adding up to a total of more than 53,000 transplants from deceased donors during 2016-2019.
“I strongly recommend organs from living donors” when feasible, said Dr. Hariharan. “At some centers, a high proportion of transplants use living donors, but not at other centers,” he said.
It’s unknown why transplants using organs from deceased donors has shown this growth, but Dr. Hariharan suggested a multifactorial explanation. Those factors include growth in the number of patients with end-stage renal disease who require dialysis, increased numbers of patients listed for kidney transplant, new approaches that allow organs from older donors and those infected with pathogens such as hepatitis C virus or HIV, greater numbers of people and families agreeing to donate organs, and possibly the opioid crisis that may have led to increased organ donation. The number of U.S. centers performing kidney transplants rose from fewer than 200 about a quarter of a century ago to about 250 today, he added.
‘Immuno Bill’ guarantees Medicare coverage for immunosuppression
Dr. Hariharan voiced optimism that graft and patient survival rates will continue to improve going forward. One factor will likely be the passage in late 2020 of the “Immuno Bill” by the U.S. Congress, which among other things mandated ongoing coverage starting in 2023 for immunosuppressive drugs for all Medicare beneficiaries with a kidney transplant. Until then, Medicare provides coverage for only 36 months, a time limit that has resulted in nearly 400 kidney recipients annually losing coverage of their immunosuppression medications.
Dr. Hariharan and coauthors called the existing potential for discontinuation of immunosuppressive drug an “unnecessary impediment to long-term survival for which patients and society paid a heavy price.”
“Kidney transplantation, especially from living donors, offers patients with kidney failure the best chance for long-term survival and improved quality of life, with lower cost to the health care system,” Dr. Lentine said in an interview. Despite the many positive trends detailed in the report from Dr. Hariharan and coauthors, “the vast majority of the more than 700,000 people in the United States with kidney failure will not have an opportunity to receive a transplant due to limitations in organ supply.” And many patients who receive a kidney transplant eventually must resume dialysis because of “limited long-term graft survival resulting from allograft nephropathy, recurrent native disease, medication nonadherence, or other causes.” Plus many potentially transplantable organs go unused.
Dr. Lentine cited a position statement issued in July 2021 by the National Kidney Foundation that made several recommendations on how to improve access to kidney transplants and improve outcomes. “Expanding opportunities for safe living donation, eliminating racial disparities in living-donor access, improving wait-list access and transport readiness, maximizing use of deceased-donor organs, and extending graft longevity are critical priorities,” said Dr. Lentine, lead author on the statement.
“For many or even most patients with kidney failure transplantation is the optimal form of renal replacement. The better recent outcomes and evolving management strategies make transplantation an even more attractive option,” said Dr. Josephson. Improved outcomes among U.S. transplant patients also highlights the “importance of increasing access to kidney transplantation” for all people with kidney failure who could benefit from this treatment, she added.
Dr. Hariharan and Dr. Lentine had no relevant disclosures. Dr. Josephson has been a consultant to UCB and has an ownership interest in Seagen.
FROM THE NEW ENGLAND JOURNAL OF MEDICINE

Prevalence of youth-onset diabetes climbing, type 2 disease more so in racial/ethnic minorities
The prevalence of youth-onset diabetes in the United States rose significantly from 2001 to 2017, with rates of type 2 diabetes climbing disproportionately among racial/ethnic minorities, according to investigators.
In individuals aged 19 years or younger, prevalence rates of type 1 and type 2 diabetes increased 45.1% and 95.3%, respectively, reported lead author Jean M. Lawrence, ScD, MPH, MSSA, program director of the division of diabetes, endocrinology, and metabolic diseases at the National Institute of Diabetes and Digestive and Kidney Diseases, National Institutes of Health, Bethesda, Md., and colleagues.
“Elucidating differences in diabetes prevalence trends by diabetes type and demographic characteristics is essential to describe the burden of disease and to estimate current and future resource needs,” Dr. Lawrence and colleagues wrote in JAMA.
The retrospective analysis was a part of the ongoing SEARCH study, which includes data from individuals in six areas across the United States: Colorado, California, Ohio, South Carolina, Washington state, and Arizona/New Mexico (Indian Health Services). In the present report, three prevalence years were evaluated: 2001, 2009, and 2017. For each year, approximately 3.5 million youths were included. Findings were reported in terms of diabetes type, race/ethnicity, age at diagnosis, and sex.
Absolute prevalence of type 1 diabetes per 1,000 youths increased from 1.48 in 2001, to 1.93 in 2009, and finally 2.15 in 2017. Across the 16-year period, this represents an absolute increase of 0.67 (95% confidence interval, 0.64-0.70), and a relative increase of 45.1% (95% CI, 40.0%-50.4%). In absolute terms, prevalence increased most among non-Hispanic White (0.93 per 1,000) and non-Hispanic Black (0.89 per 1,000) youths.
While type 2 diabetes was comparatively less common than type 1 diabetes, absolute prevalence per 1,000 youths increased to a greater degree, rising from 0.34 in 2001 to 0.46 in 2009 and to 0.67 in 2017. This amounts to relative increase across the period of 95.3% (95% CI, 77.0%-115.4%). Absolute increases were disproportionate among racial/ethnic minorities, particularly Black and Hispanic youths, who had absolute increases per 1,000 youths of 0.85 (95% CI, 0.74-0.97) and 0.57 (95% CI, 0.51-0.64), respectively, compared with 0.05 (95% CI, 0.03-0.07) for White youths.
“Increases [among Black and Hispanic youths] were not linear,” the investigators noted. “Hispanic youths had a significantly greater increase in the first interval compared with the second interval, while Black youths had no significant increase in the first interval and a significant increase in the second interval.”
Dr. Lawrence and colleagues offered several possible factors driving these trends in type 2 diabetes.
“Changes in anthropometric risk factors appear to play a significant role,” they wrote, noting that “Black and Mexican American teenagers experienced the greatest increase in prevalence of obesity/severe obesity from 1999 to 2018, which may contribute to race and ethnicity differences. Other contributing factors may include increases in exposure to maternal obesity and diabetes (gestational and type 2 diabetes) and exposure to environmental chemicals.”

According to Megan Kelsey, MD, associate professor of pediatric endocrinology, director of lifestyle medicine endocrinology, and medical director of the bariatric surgery center at Children’s Hospital Colorado, Aurora, the increased rates of type 2 diabetes reported by the study are alarming, yet they pale in comparison with what’s been happening since the pandemic began.
“Individual institutions have reported anywhere between a 50% – which is basically what we’re seeing at our hospital – to a 300% increase in new diagnoses [of type 2 diabetes] in a single-year time period,” Dr. Kelsey said in an interview. “So what is reported [in the present study] doesn’t even get at what’s been going on over the past year and a half.”
Dr. Kelsey offered some speculative drivers of this recent surge in cases, including stress, weight gain caused by sedentary behavior and more access to food, and the possibility that SARS-CoV-2 may infect pancreatic islet beta cells, thereby interfering with insulin production.
Type 2 diabetes is particularly concerning among young people, Dr. Kelsey noted, as it is more challenging to manage than adult-onset disease.
Young patients “also develop complications much sooner than you’d expect,” she added. “So we really need to understand why these rates are increasing, how we can identify kids at risk, and how we can better prevent it, so we aren’t stuck with a disease that’s really difficult to treat.”
To this end, the NIH recently opened applications for investigators to participate in a prospective longitudinal study of youth-onset type 2 diabetes. Young people at risk of diabetes will be followed through puberty, a period of increased risk, according to Dr. Kelsey.
“The goal will be to take kids who don’t yet have [type 2] diabetes, but are at risk, and try to better understand, as some of them progress to developing diabetes, what is going on,” Dr. Kelsey said. “What are other factors that we can use to better predict who’s going to develop diabetes? And can we use the information from this [upcoming] study to understand how to better prevent it? Because nothing that has been tried so far has worked.”
The study was supported by the Centers for Disease Control and Prevention, NIDDK, and others. The investigators and Dr. Kelsey reported no conflicts of interest.
The prevalence of youth-onset diabetes in the United States rose significantly from 2001 to 2017, with rates of type 2 diabetes climbing disproportionately among racial/ethnic minorities, according to investigators.
In individuals aged 19 years or younger, prevalence rates of type 1 and type 2 diabetes increased 45.1% and 95.3%, respectively, reported lead author Jean M. Lawrence, ScD, MPH, MSSA, program director of the division of diabetes, endocrinology, and metabolic diseases at the National Institute of Diabetes and Digestive and Kidney Diseases, National Institutes of Health, Bethesda, Md., and colleagues.
“Elucidating differences in diabetes prevalence trends by diabetes type and demographic characteristics is essential to describe the burden of disease and to estimate current and future resource needs,” Dr. Lawrence and colleagues wrote in JAMA.
The retrospective analysis was a part of the ongoing SEARCH study, which includes data from individuals in six areas across the United States: Colorado, California, Ohio, South Carolina, Washington state, and Arizona/New Mexico (Indian Health Services). In the present report, three prevalence years were evaluated: 2001, 2009, and 2017. For each year, approximately 3.5 million youths were included. Findings were reported in terms of diabetes type, race/ethnicity, age at diagnosis, and sex.
Absolute prevalence of type 1 diabetes per 1,000 youths increased from 1.48 in 2001, to 1.93 in 2009, and finally 2.15 in 2017. Across the 16-year period, this represents an absolute increase of 0.67 (95% confidence interval, 0.64-0.70), and a relative increase of 45.1% (95% CI, 40.0%-50.4%). In absolute terms, prevalence increased most among non-Hispanic White (0.93 per 1,000) and non-Hispanic Black (0.89 per 1,000) youths.
While type 2 diabetes was comparatively less common than type 1 diabetes, absolute prevalence per 1,000 youths increased to a greater degree, rising from 0.34 in 2001 to 0.46 in 2009 and to 0.67 in 2017. This amounts to relative increase across the period of 95.3% (95% CI, 77.0%-115.4%). Absolute increases were disproportionate among racial/ethnic minorities, particularly Black and Hispanic youths, who had absolute increases per 1,000 youths of 0.85 (95% CI, 0.74-0.97) and 0.57 (95% CI, 0.51-0.64), respectively, compared with 0.05 (95% CI, 0.03-0.07) for White youths.
“Increases [among Black and Hispanic youths] were not linear,” the investigators noted. “Hispanic youths had a significantly greater increase in the first interval compared with the second interval, while Black youths had no significant increase in the first interval and a significant increase in the second interval.”
Dr. Lawrence and colleagues offered several possible factors driving these trends in type 2 diabetes.
“Changes in anthropometric risk factors appear to play a significant role,” they wrote, noting that “Black and Mexican American teenagers experienced the greatest increase in prevalence of obesity/severe obesity from 1999 to 2018, which may contribute to race and ethnicity differences. Other contributing factors may include increases in exposure to maternal obesity and diabetes (gestational and type 2 diabetes) and exposure to environmental chemicals.”
According to Megan Kelsey, MD, associate professor of pediatric endocrinology, director of lifestyle medicine endocrinology, and medical director of the bariatric surgery center at Children’s Hospital Colorado, Aurora, the increased rates of type 2 diabetes reported by the study are alarming, yet they pale in comparison with what’s been happening since the pandemic began.
“Individual institutions have reported anywhere between a 50% – which is basically what we’re seeing at our hospital – to a 300% increase in new diagnoses [of type 2 diabetes] in a single-year time period,” Dr. Kelsey said in an interview. “So what is reported [in the present study] doesn’t even get at what’s been going on over the past year and a half.”
Dr. Kelsey offered some speculative drivers of this recent surge in cases, including stress, weight gain caused by sedentary behavior and more access to food, and the possibility that SARS-CoV-2 may infect pancreatic islet beta cells, thereby interfering with insulin production.
Type 2 diabetes is particularly concerning among young people, Dr. Kelsey noted, as it is more challenging to manage than adult-onset disease.
Young patients “also develop complications much sooner than you’d expect,” she added. “So we really need to understand why these rates are increasing, how we can identify kids at risk, and how we can better prevent it, so we aren’t stuck with a disease that’s really difficult to treat.”
To this end, the NIH recently opened applications for investigators to participate in a prospective longitudinal study of youth-onset type 2 diabetes. Young people at risk of diabetes will be followed through puberty, a period of increased risk, according to Dr. Kelsey.
“The goal will be to take kids who don’t yet have [type 2] diabetes, but are at risk, and try to better understand, as some of them progress to developing diabetes, what is going on,” Dr. Kelsey said. “What are other factors that we can use to better predict who’s going to develop diabetes? And can we use the information from this [upcoming] study to understand how to better prevent it? Because nothing that has been tried so far has worked.”
The study was supported by the Centers for Disease Control and Prevention, NIDDK, and others. The investigators and Dr. Kelsey reported no conflicts of interest.
FROM JAMA
Prevalence of high-risk HPV types dwindled since vaccine approval
Young women who received the quadrivalent human papillomavirus (HPV) vaccine had fewer and fewer infections with high-risk HPV strains covered by the vaccine year after year, but the incidence of high-risk strains that were not covered by the vaccine increased over the same 12-year period, researchers report in a study published August 23 in JAMA Open Network.
“One of the unique contributions that this study provides is the evaluation of a real-world example of the HPV infection rates following immunization in a population of adolescent girls and young adult women at a single health center in a large U.S. city, reflecting strong evidence of vaccine effectiveness,” write Nicolas F. Schlecht, PhD, a professor of oncology at Roswell Park Comprehensive Cancer Center, Buffalo, and his colleagues. “Previous surveillance studies from the U.S. have involved older women and populations with relatively low vaccine coverage.”
In addition to supporting the value of continuing to vaccinate teens against HPV, the findings underscore the importance of continuing to screen women for cervical cancer, Dr. Schlecht said in an interview.
“HPV has not and is not going away,” he said. “We need to keep on our toes with screening and other measures to continue to prevent the development of cervix cancer,” including monitoring different high-risk HPV types and keeping a close eye on cervical precancer rates, particularly CIN3 and cervix cancer, he said. “The vaccines are definitely a good thing. Just getting rid of HPV16 is an amazing accomplishment.”
Kevin Ault, MD, a professor of ob/gyn and academic specialist director of clinical and translational research at the University of Kansas, Kansas City, told this news organization that other studies have had similar findings, but this one is larger with longer follow-up.
“The take-home message is that vaccines work, and this is especially true for the HPV vaccine,” said Dr. Ault, who was not involved in the research. “The vaccine prevents HPV infections and the consequences of these infections, such as cervical cancer. The results are consistent with other studies in different settings, so they are likely generalizable.”
The researchers collected data from October 2007, shortly after the vaccine was approved, through September 2019 on sexually active adolescent and young women aged 13 to 21 years who had received the HPV vaccine and had agreed to follow-up assessments every 6 months until they turned 26. Each follow-up included the collecting of samples of cervical and anal cells for polymerase chain reaction testing for the presence of HPV types.
More than half of the 1,453 participants were Hispanic (58.8%), and half were Black (50.4%), including 15% Hispanic and Black patients. The average age of the participants was 18 years. They were tracked for a median 2.4 years. Nearly half the participants (48%) received the HPV vaccine prior to sexual debut.
For the longitudinal study, the researchers adjusted for participants’ age, the year they received the vaccine, and the years since they were vaccinated. They also tracked breakthrough infections for the four types of HPV covered by the vaccine in participants who received the vaccine before sexual debut.
“We evaluated whether infection rates for HPV have changed since the administration of the vaccine by assessing longitudinally the probability of HPV detection over time among vaccinated participants while adjusting for changes in cohort characteristics over time,” the researchers write. In their statistical analysis, they made adjustments for the number of vaccine doses participants received before their first study visit, age at sexual debut, age at first vaccine dose, number of sexual partners in the preceding 6 months, consistency of condom use during sex, history of a positive chlamydia test, and, for anal HPV analyses, whether the participants had had anal sex in the previous 6 months.
The average age at first intercourse remained steady at 15 years throughout the study, but the average age of vaccination dropped from 18 years in 2008 to 12 years in 2019 (P < .001). More than half the participants (64%) had had at least three lifetime sexual partners at baseline.
After adjustment for age, the researchers found that the incidence of the four HPV types covered by the vaccine – HPV-6, HPV-11, HPV-16, and HPV-18 – dropped more each year, shifting from 9.1% from 2008-2010 to 4.7% from 2017-2019. The effect was even greater among those vaccinated prior to sexual debut; for those patients, the incidence of the four vaccine types dropped from 8.8% to 1.7% over the course of the study. Declines over time also occurred for anal types HPV-31 (adjusted odds ratio [aOR] = 0.76) and HPV-45 (aOR = 0.77). Those vaccinated prior to any sexual intercourse had 19% lower odds of infection per year with a vaccine-covered HPV type.
“We were really excited to see that the types targeted by the vaccines were considerably lower over time in our population,” Dr. Schlecht told this news organization. “This is an important observation, since most of these types are the most worrisome for cervical cancer.”
They were surprised, however, to see overall HPV prevalence increase over time, particularly with the high-risk HPV types that were not covered by the quadrivalent vaccine.
Prevalence of cervical high-risk types not in the vaccine increased from 25.1% from 2008-2010 to 30.5% from 2017-2019. Odds of detection of high-risk HPV types not covered by the vaccine increased 8% each year, particularly for HPV-56 and HPV-68; anal HPV types increased 11% each year. Neither age nor recent number of sexual partners affected the findings.
“The underlying mechanisms for the observed increased detection of specific non-vaccine HPV types over time are not yet clear.”
“We hope this doesn’t translate into some increase in cervical neoplasia that is unanticipated,” Dr. Schlecht said. He noted that the attributable risks for cancer associated with nonvaccine high-risk HPV types remain low. “Theoretical concerns are one thing; actual data is what drives the show,” he said.
The research was funded by the National Institutes of Health and the Icahn School of Medicine at Mount Sinai, New York. Dr. Schlecht has served on advisory boards for Merck, GlaxoSmithKline (GSK), and PDS Biotechnology. One author previously served on a GSK advisory board, and another worked with Merck on an early vaccine trial. Dr. Ault has disclosed no relevant financial relationships.
A version of this article first appeared on Medscape.com.
Flavonoid-rich foods, aided by gut bacteria, tied to lower BP
, an association that is partially explained by bacteria in an individual’s gut microbiome, new research suggests.

In a population-based study of more than 900 individuals, those with the highest intake of flavonoid-containing foods had significantly lower systolic blood pressure and pulse pressure, as well as greater gut microbial diversity, compared with those with the lowest intakes.
Up to 15% of this observed association was explained by the gut microbiome, suggesting that these microbes play a key role in metabolizing flavonoids to enhance their cardioprotective effects, according to the researchers.
The study was published online in the journal Hypertension.
“We know what we eat plays a critical role in shaping our gut microbiome, but little is known about the relative importance of plant foods and specific constituents called flavonoids,” lead researcher Aedin Cassidy, PhD, chair and professor of nutrition and medicine at the Institute for Global Food Security, Queen’s University, Belfast, Northern Ireland, said in an interview.
“Unlike many other food constituents, flavonoids are predominantly metabolized in the gut, suggesting that the gut microbiome may be more important in enhancing their biological activity than for other things we eat,” Dr. Cassidy said.
“There is mounting evidence from population-based studies and clinical trials that a higher intake of flavonoids and flavonoid-rich foods can improve heart health, but for the first time, we provide data highlighting the key role of the gut microbiome in explaining the association between such foods and blood pressure,” she noted. “This is one of the first studies to address this.”
For this analysis, Dr. Cassidy and her group sought to assess to what extent the composition of the gut microbiome might explain the association of habitual flavonoid and flavonoid-rich food intake with systolic and diastolic blood pressure in a community-based sample of 904 individuals aged 25-82 years from Germany’s PopGen biobank.
The researchers evaluated participants’ food intake, gut microbiome, and blood pressure levels together with other clinical and molecular phenotyping at regular follow-up examinations.
Participants’ intake of flavonoid-rich foods during the previous year was calculated from a self-reported food questionnaire detailing the frequency and quantity eaten of 112 foods, and flavonoid values were assigned to foods according to United States Department of Agriculture data on flavonoid content in food.
Participants’ gut microbiome was assessed by fecal bacterial DNA extracted from stool samples.
After an overnight fast, participants’ blood pressure levels were measured three times in 3-minute intervals after an initial 5-minute rest period. Researchers also collected participants’ diet and lifestyle information.
Analysis of the data showed the following:
- Eating 1.5 servings of berries per day (about 1 cup) was associated with a 4.1–mm Hg reduction in systolic BP; 12% of this association was explained by gut microbiome factors.
- Drinking three glasses of red wine per week was associated with a 3.7–mm Hg reduction in systolic BP; 15% of this association was explained by the gut microbiome.
“These blood pressure–lowering effects are achievable with simple changes to the daily diet,” Dr. Cassidy said.
“Incorporating flavonoid-rich foods into the diet can have clinically relevant reductions in systolic blood pressure and pulse pressure, and a healthy gut microbiome is important to break down flavonoids to a more cardioprotective form,” she said.
“Our findings indicate future trials should look at participants according to metabolic profile in order to more accurately study the roles of metabolism and the gut microbiome in regulating the effects of flavonoids on blood pressure,” said Dr. Cassidy.
“A better understanding of the highly individual variability of flavonoid metabolism could very well explain why some people have greater cardiovascular protection benefits from flavonoid-rich foods than others.”
‘Interesting’ data
“The data are interesting,” David Jenkins, MD, PhD, DSc, professor of medicine and nutrition at the University of Toronto, said in an interview.
“Berries and red wine appear to be associated with lower systolic blood pressures. Lower blood pressures have been found in general in people who consume more plant-based diets, especially those high in fruits and vegetables,” noted Dr. Jenkins, who was not involved with this study.
“Berries and grapes high in polyphenols may have many health benefits as antioxidants, and in a recent study have been shown to reduce cardiovascular mortality. The change in chronic microflora is also of interest as this will change with increased fruit and vegetable consumption,” he said.
Perhaps one word of caveat, Dr. Jenkins added: “Alcohol has been found to increase blood pressure and the risk of stroke. Presumably the beneficial effects as seen here were when wine is consumed in moderation.”
Supports recommendations
The study by Cassidy and colleagues supports the dietary recommendations from the American Heart Association (AHA) for heart health, Penny M. Kris-Etherton, PhD, RDN, professor of nutritional sciences, Penn State University, University Park, Pa., and chair, AHA Council on Lifestyle and Cardiometabolic Health, said in an interview.
“The AHA recommends a healthy dietary pattern that emphasizes a variety of plant foods including fruits, vegetables, whole grains, legumes, nuts, and seeds and is low in sodium, saturated fat, and added sugars. Lean protein foods, including plant protein foods, are recommended, and red meat should be limited. If alcohol is consumed it should be done in moderation,” Dr. Kris-Etherton said.
“Based on these AHA dietary recommendations, a wide variety of plant foods will promote consumption of many flavonoids that have demonstrated CVD benefits, such as lowering systolic blood pressure as reported by the authors, as well as promoting healthy endothelial function and having antithrombotic, anti-inflammatory and antioxidant effects,” she said in email.
“This recommended dietary pattern will have other cardiovascular health benefits, such as decreasing LDL cholesterol, due to its very healthy nutrient profile. The exciting new finding reported by Cassidy et al. is that the effects of dietary flavonoids on lowering systolic blood pressure are modulated by the gut microbiome,” Dr. Kris-Etherton said.
“Further research needs to be done to confirm these findings and to identify how different foods affect specific gut bacteria that benefit cardiovascular health.”
The research was funded by grants from the German Research Foundation and the German Federal Ministry of Education and Research. Dr. Cassidy and Dr. Jenkins have disclosed no relevant financial relationships. Dr. Kris-Etherton is a spokesperson for the AHA.
A version of this article first appeared on Medscape.com.
, an association that is partially explained by bacteria in an individual’s gut microbiome, new research suggests.
In a population-based study of more than 900 individuals, those with the highest intake of flavonoid-containing foods had significantly lower systolic blood pressure and pulse pressure, as well as greater gut microbial diversity, compared with those with the lowest intakes.
Up to 15% of this observed association was explained by the gut microbiome, suggesting that these microbes play a key role in metabolizing flavonoids to enhance their cardioprotective effects, according to the researchers.
The study was published online in the journal Hypertension.
“We know what we eat plays a critical role in shaping our gut microbiome, but little is known about the relative importance of plant foods and specific constituents called flavonoids,” lead researcher Aedin Cassidy, PhD, chair and professor of nutrition and medicine at the Institute for Global Food Security, Queen’s University, Belfast, Northern Ireland, said in an interview.
“Unlike many other food constituents, flavonoids are predominantly metabolized in the gut, suggesting that the gut microbiome may be more important in enhancing their biological activity than for other things we eat,” Dr. Cassidy said.
“There is mounting evidence from population-based studies and clinical trials that a higher intake of flavonoids and flavonoid-rich foods can improve heart health, but for the first time, we provide data highlighting the key role of the gut microbiome in explaining the association between such foods and blood pressure,” she noted. “This is one of the first studies to address this.”
For this analysis, Dr. Cassidy and her group sought to assess to what extent the composition of the gut microbiome might explain the association of habitual flavonoid and flavonoid-rich food intake with systolic and diastolic blood pressure in a community-based sample of 904 individuals aged 25-82 years from Germany’s PopGen biobank.
The researchers evaluated participants’ food intake, gut microbiome, and blood pressure levels together with other clinical and molecular phenotyping at regular follow-up examinations.
Participants’ intake of flavonoid-rich foods during the previous year was calculated from a self-reported food questionnaire detailing the frequency and quantity eaten of 112 foods, and flavonoid values were assigned to foods according to United States Department of Agriculture data on flavonoid content in food.
Participants’ gut microbiome was assessed by fecal bacterial DNA extracted from stool samples.
After an overnight fast, participants’ blood pressure levels were measured three times in 3-minute intervals after an initial 5-minute rest period. Researchers also collected participants’ diet and lifestyle information.
Analysis of the data showed the following:
- Eating 1.5 servings of berries per day (about 1 cup) was associated with a 4.1–mm Hg reduction in systolic BP; 12% of this association was explained by gut microbiome factors.
- Drinking three glasses of red wine per week was associated with a 3.7–mm Hg reduction in systolic BP; 15% of this association was explained by the gut microbiome.
“These blood pressure–lowering effects are achievable with simple changes to the daily diet,” Dr. Cassidy said.
“Incorporating flavonoid-rich foods into the diet can have clinically relevant reductions in systolic blood pressure and pulse pressure, and a healthy gut microbiome is important to break down flavonoids to a more cardioprotective form,” she said.
“Our findings indicate future trials should look at participants according to metabolic profile in order to more accurately study the roles of metabolism and the gut microbiome in regulating the effects of flavonoids on blood pressure,” said Dr. Cassidy.
“A better understanding of the highly individual variability of flavonoid metabolism could very well explain why some people have greater cardiovascular protection benefits from flavonoid-rich foods than others.”
‘Interesting’ data
“The data are interesting,” David Jenkins, MD, PhD, DSc, professor of medicine and nutrition at the University of Toronto, said in an interview.
“Berries and red wine appear to be associated with lower systolic blood pressures. Lower blood pressures have been found in general in people who consume more plant-based diets, especially those high in fruits and vegetables,” noted Dr. Jenkins, who was not involved with this study.
“Berries and grapes high in polyphenols may have many health benefits as antioxidants, and in a recent study have been shown to reduce cardiovascular mortality. The change in chronic microflora is also of interest as this will change with increased fruit and vegetable consumption,” he said.
Perhaps one word of caveat, Dr. Jenkins added: “Alcohol has been found to increase blood pressure and the risk of stroke. Presumably the beneficial effects as seen here were when wine is consumed in moderation.”
Supports recommendations
The study by Cassidy and colleagues supports the dietary recommendations from the American Heart Association (AHA) for heart health, Penny M. Kris-Etherton, PhD, RDN, professor of nutritional sciences, Penn State University, University Park, Pa., and chair, AHA Council on Lifestyle and Cardiometabolic Health, said in an interview.
“The AHA recommends a healthy dietary pattern that emphasizes a variety of plant foods including fruits, vegetables, whole grains, legumes, nuts, and seeds and is low in sodium, saturated fat, and added sugars. Lean protein foods, including plant protein foods, are recommended, and red meat should be limited. If alcohol is consumed it should be done in moderation,” Dr. Kris-Etherton said.
“Based on these AHA dietary recommendations, a wide variety of plant foods will promote consumption of many flavonoids that have demonstrated CVD benefits, such as lowering systolic blood pressure as reported by the authors, as well as promoting healthy endothelial function and having antithrombotic, anti-inflammatory and antioxidant effects,” she said in email.
“This recommended dietary pattern will have other cardiovascular health benefits, such as decreasing LDL cholesterol, due to its very healthy nutrient profile. The exciting new finding reported by Cassidy et al. is that the effects of dietary flavonoids on lowering systolic blood pressure are modulated by the gut microbiome,” Dr. Kris-Etherton said.
“Further research needs to be done to confirm these findings and to identify how different foods affect specific gut bacteria that benefit cardiovascular health.”
The research was funded by grants from the German Research Foundation and the German Federal Ministry of Education and Research. Dr. Cassidy and Dr. Jenkins have disclosed no relevant financial relationships. Dr. Kris-Etherton is a spokesperson for the AHA.
A version of this article first appeared on Medscape.com.
US Preventive Services Task Force lowers diabetes screening age for overweight
The United States Preventive Services Task Force has updated its recommendation on the age of screening for prediabetes and type 2 diabetes in the primary care setting – lowering the age from 40 to 35 years for asymptomatic patients who are overweight or obese and encouraging greater interventions when patients do show a risk.

“The USPSTF concludes with moderate certainty that screening for prediabetes and type 2 diabetes and offering or referring patients with prediabetes to effective preventive interventions has a moderate net benefit,” the task force concludes in its recommendation, published Aug. 24 in JAMA.
“Clinicians should offer or refer patients with prediabetes to effective preventive interventions,” they write.
Experts commenting on the issue strongly emphasize that it’s not just the screening, but the subsequent intervention that is needed to make a difference.
“If young adults newly identified with abnormal glucose metabolism do not receive the needed intensive behavioral change support, screening may provide no benefit,” write Richard W. Grant, MD, MPH, and colleagues in an editorial published with the recommendation.
“Given the role of our obesogenic and physically inactive society in the shift toward earlier onset of diabetes, efforts to increase screening and recognition of abnormal glucose metabolism must be coupled with robust public health measures to address the underlying contributors.”
BMI cutoff lower for at-risk ethnic populations
The recommendation, which updates the task force’s 2015 guideline, carries a “B” classification, meaning the USPSTF has high certainty that the net benefit is moderate. It now specifies screening from age 35to 70 for persons classified as overweight (body mass index at least 25) or obese (BMI at least 30) and recommends referral to preventive interventions when patients are found to have prediabetes.
In addition to recommendations of lifestyle changes, such as diet and physical activity, the task force also endorses the diabetes drug metformin as a beneficial intervention in the prevention or delay of diabetes, while noting fewer overall health benefits from metformin than from the lifestyle changes.
A lower BMI cutoff of at least 23 is recommended for diabetes screening of Asian Americans, and, importantly, screening for prediabetes and diabetes should be considered at an even earlier age if the patient is from a population with a disproportionately high prevalence of diabetes, including American Indian/Alaska Native, Black, Hawaiian/Pacific Islander, Hispanic/Latino, the task force recommends.
Screening tests should include fasting plasma glucose, hemoglobin A1c, or an oral glucose tolerance test. Although screening every 3 years “may be a reasonable approach for adults with normal blood glucose levels,” the task force adds that “the optimal screening interval for adults with an initial normal glucose test result is uncertain.”
Data review: Few with prediabetes know they have it
The need for the update was prompted by troubling data showing increasing diabetes rates despite early signs that can and should be identified and acted upon in the primary care setting to prevent disease progression.
Data from the Centers for Disease Control and Prevention, for instance, show that while 13% of all U.S. adults 18 years or older have diabetes and 35% meet criteria for prediabetes, as many as 21% of those with diabetes were not aware of or did not report having the disease. Furthermore, only a small fraction – 15% of those with prediabetes – said they had been told by a health professional that they had this condition, the task force notes.
The task force’s final recommendation was based on a systematic review of evidence regarding the screening of asymptomatic, nonpregnant adults and the harms and benefits of interventions, such as physical activity, behavioral counseling, or pharmacotherapy.
Among key evidence supporting the lower age was a 2014 study showing that the number of people necessary to obtain one positive test for diabetes with screening sharply drops from 80 among those aged 30-34 years to just 31 among those aged 36-39.
Opportunistic universal screening of eligible people aged 35 and older would yield a ratio of 1 out of just 15 to spot a positive test, the authors of that study reported.
In addition, a large cohort study in more than 77,000 people with prediabetes strongly links the risk of developing diabetes with increases in A1c level and with increasing BMI.
ADA recommendations differ
The new recommendations differ from American Diabetes Association guidelines, which call for diabetes screening at all ages for people who are overweight or obese and who have one or more risk factors, such as physical inactivity or a first-degree relative with diabetes. If results are normal, repeat screening at least every 3 years is recommended.
The ADA further recommends universal screening for all adults 45 years and older, regardless of their risk factors.
For the screening of adults over 45, the ADA recommends using a fasting plasma glucose level, 2-hour plasma glucose level during a 75-g oral glucose tolerance test, or A1c level, regardless of risk factors.
The American Association of Clinical Endocrinology also recommends universal screening for prediabetes and diabetes for all adults 45 years or older, regardless of risk factors, and also advises screening those who have risk factors for diabetes regardless of age.
Screening of little benefit without behavior change support
In an interview, Dr. Grant added that broad efforts are essential as those at the practice level have clearly not succeeded.

“The medical model of individual counseling and referral has not really been effective, and so we really need to think in terms of large-scale public health action,” said Dr. Grant, of the division of research, Kaiser Permanente Northern California, Oakland.
His editorial details the sweeping, multifactorial efforts that are needed.
“To turn this recommendation into action – that is, to translate screening activities into improved clinical outcomes – change is needed at the patient-clinician level (recognizing and encouraging eligible individuals to be screened), health care system level (reducing screening barriers and ensuring access to robust lifestyle programs), and societal level (applying effective public health interventions to reduce obesity and increase exercise),” they write.
A top priority has to be a focus on individuals of diverse backgrounds and issues such as access to healthy programs in minority communities, Dr. Grant noted.
“Newly diagnosed adults are more likely to be African-American and Latinx,” he said.
“We really need to invest in healthier communities for low-income, non-White communities to reverse the persistent health care disparities in these communities.”
While the challenges may appear daunting, history shows they are not necessarily insurmountable – as evidenced in the campaign to discourage tobacco smoking.
“National smoking cessation efforts are one example of a mostly successful public health campaign that has made a difference in health behaviors,” Grant noted.
The recommendation is also posted on the USPSTF web site .
Dr. Grant reports receiving grants from the National Institutes of Health and the Patient-Centered Outcomes Research Institute.
The United States Preventive Services Task Force has updated its recommendation on the age of screening for prediabetes and type 2 diabetes in the primary care setting – lowering the age from 40 to 35 years for asymptomatic patients who are overweight or obese and encouraging greater interventions when patients do show a risk.
“The USPSTF concludes with moderate certainty that screening for prediabetes and type 2 diabetes and offering or referring patients with prediabetes to effective preventive interventions has a moderate net benefit,” the task force concludes in its recommendation, published Aug. 24 in JAMA.
“Clinicians should offer or refer patients with prediabetes to effective preventive interventions,” they write.
Experts commenting on the issue strongly emphasize that it’s not just the screening, but the subsequent intervention that is needed to make a difference.
“If young adults newly identified with abnormal glucose metabolism do not receive the needed intensive behavioral change support, screening may provide no benefit,” write Richard W. Grant, MD, MPH, and colleagues in an editorial published with the recommendation.
“Given the role of our obesogenic and physically inactive society in the shift toward earlier onset of diabetes, efforts to increase screening and recognition of abnormal glucose metabolism must be coupled with robust public health measures to address the underlying contributors.”
BMI cutoff lower for at-risk ethnic populations
The recommendation, which updates the task force’s 2015 guideline, carries a “B” classification, meaning the USPSTF has high certainty that the net benefit is moderate. It now specifies screening from age 35to 70 for persons classified as overweight (body mass index at least 25) or obese (BMI at least 30) and recommends referral to preventive interventions when patients are found to have prediabetes.
In addition to recommendations of lifestyle changes, such as diet and physical activity, the task force also endorses the diabetes drug metformin as a beneficial intervention in the prevention or delay of diabetes, while noting fewer overall health benefits from metformin than from the lifestyle changes.
A lower BMI cutoff of at least 23 is recommended for diabetes screening of Asian Americans, and, importantly, screening for prediabetes and diabetes should be considered at an even earlier age if the patient is from a population with a disproportionately high prevalence of diabetes, including American Indian/Alaska Native, Black, Hawaiian/Pacific Islander, Hispanic/Latino, the task force recommends.
Screening tests should include fasting plasma glucose, hemoglobin A1c, or an oral glucose tolerance test. Although screening every 3 years “may be a reasonable approach for adults with normal blood glucose levels,” the task force adds that “the optimal screening interval for adults with an initial normal glucose test result is uncertain.”
Data review: Few with prediabetes know they have it
The need for the update was prompted by troubling data showing increasing diabetes rates despite early signs that can and should be identified and acted upon in the primary care setting to prevent disease progression.
Data from the Centers for Disease Control and Prevention, for instance, show that while 13% of all U.S. adults 18 years or older have diabetes and 35% meet criteria for prediabetes, as many as 21% of those with diabetes were not aware of or did not report having the disease. Furthermore, only a small fraction – 15% of those with prediabetes – said they had been told by a health professional that they had this condition, the task force notes.
The task force’s final recommendation was based on a systematic review of evidence regarding the screening of asymptomatic, nonpregnant adults and the harms and benefits of interventions, such as physical activity, behavioral counseling, or pharmacotherapy.
Among key evidence supporting the lower age was a 2014 study showing that the number of people necessary to obtain one positive test for diabetes with screening sharply drops from 80 among those aged 30-34 years to just 31 among those aged 36-39.
Opportunistic universal screening of eligible people aged 35 and older would yield a ratio of 1 out of just 15 to spot a positive test, the authors of that study reported.
In addition, a large cohort study in more than 77,000 people with prediabetes strongly links the risk of developing diabetes with increases in A1c level and with increasing BMI.
ADA recommendations differ
The new recommendations differ from American Diabetes Association guidelines, which call for diabetes screening at all ages for people who are overweight or obese and who have one or more risk factors, such as physical inactivity or a first-degree relative with diabetes. If results are normal, repeat screening at least every 3 years is recommended.
The ADA further recommends universal screening for all adults 45 years and older, regardless of their risk factors.
For the screening of adults over 45, the ADA recommends using a fasting plasma glucose level, 2-hour plasma glucose level during a 75-g oral glucose tolerance test, or A1c level, regardless of risk factors.
The American Association of Clinical Endocrinology also recommends universal screening for prediabetes and diabetes for all adults 45 years or older, regardless of risk factors, and also advises screening those who have risk factors for diabetes regardless of age.
Screening of little benefit without behavior change support
In an interview, Dr. Grant added that broad efforts are essential as those at the practice level have clearly not succeeded.
“The medical model of individual counseling and referral has not really been effective, and so we really need to think in terms of large-scale public health action,” said Dr. Grant, of the division of research, Kaiser Permanente Northern California, Oakland.
His editorial details the sweeping, multifactorial efforts that are needed.
“To turn this recommendation into action – that is, to translate screening activities into improved clinical outcomes – change is needed at the patient-clinician level (recognizing and encouraging eligible individuals to be screened), health care system level (reducing screening barriers and ensuring access to robust lifestyle programs), and societal level (applying effective public health interventions to reduce obesity and increase exercise),” they write.
A top priority has to be a focus on individuals of diverse backgrounds and issues such as access to healthy programs in minority communities, Dr. Grant noted.
“Newly diagnosed adults are more likely to be African-American and Latinx,” he said.
“We really need to invest in healthier communities for low-income, non-White communities to reverse the persistent health care disparities in these communities.”
While the challenges may appear daunting, history shows they are not necessarily insurmountable – as evidenced in the campaign to discourage tobacco smoking.
“National smoking cessation efforts are one example of a mostly successful public health campaign that has made a difference in health behaviors,” Grant noted.
The recommendation is also posted on the USPSTF web site .
Dr. Grant reports receiving grants from the National Institutes of Health and the Patient-Centered Outcomes Research Institute.
FROM JAMA
Health care workers eager for COVID booster shots
As COVID vaccine boosters move closer to reality, most physicians and nurses are ready and willing to get another shot in the arm, according to a new Medscape survey.
Altogether, 93% of physicians and 87% of nurses/advanced practice nurses (APNs) said they wanted to get a booster, although the timing of when they wanted the shots differed somewhat between the two groups surveyed Aug. 4-15.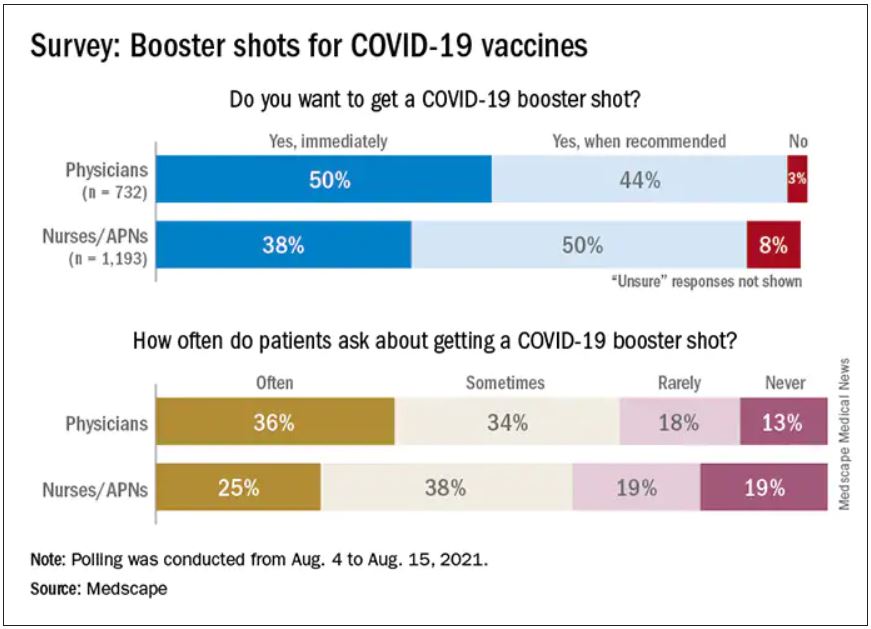
Among the 732 physicians polled, 50% wanted to get their shot immediately, compared with 38% of the 1,193 nurses/APNs who responded, while 44% of physicians and 50% of nurses/APNs said that they would wait until the vaccine booster was authorized and recommended.
At this point in time, almost all of the health care workers surveyed – 98% of physicians and 94% of nurses/APNs – have been fully vaccinated against COVID-19. A small proportion of each group, however, received the Johnson & Johnson vaccine (1% of physicians and 3% of nurses) and are not included in the current plan for booster shots.
The Medscape survey sample did include one group that is already eligible for a third dose: About 20% of physicians and 26% of nurses/ANPs said they have a condition or take a medication that compromises their immune system.
Respondents’ experiences with patient requests for boosters suggest a somewhat lower level of interest. About two-thirds of the health care workers (69% of physicians and 63% of nurses) said that patients frequently or sometimes asked about COVID boosters, compared with 13% (physicians) and 19% (nurses) who said their patients had never asked.
Interest lower among general population
In a separate survey conducted by WebMD, 82% of those who have been at least partially vaccinated said they want to get a COVID vaccine booster (14% immediately and 68% after authorization and recommendation). Of the remaining vaccinees, 7% said they do not want to get a booster and 11% were unsure.
The full sample of 592 respondents surveyed Aug. 5-10, however, included 19% who do not plan to get vaccinated and 6% who are planning to be vaccinated but have not yet done so.
The proportion of immunocompromised individuals in the two survey groups was similar, with about 25% of those in the WebMD survey reporting they have a condition or take a medication that compromises their immune system. Those respondents were more than twice as likely to want to get a booster immediately, compared to those with an uncompromised immune system (24% vs. 11%).
The distribution of vaccines received by brand was also comparable between the two groups surveyed. Of health care workers and readers, over half of each group received the Pfizer/BioNTech vaccine (59% vs. 54%), followed by Moderna (38% vs. 40%) and Johnson & Johnson (3% vs. 5%).
A version of this article first appeared on Medscape.com.
Q&A: Get flu shot early this year? Same time as COVID vaccine?
With first-time COVID-19 immunizations continuing and the plan to offer booster vaccines to most Americans starting next month, what are the considerations for getting COVID-19 and flu shots at the same time?
This news organization asked Andrew T. Pavia, MD, for his advice. He is the George and Esther Gross Presidential Professor and chief of the division of pediatric infectious diseases at the University of Utah, Salt Lake City, and a fellow of the Infectious Diseases Society of America.
Q: With COVID-19 cases surging, is it a good idea to get the flu shot early this season?
Dr. Pavia: I don’t think there is a rush to do it in August, but it is a good idea to get a flu shot this season. The consequences of getting the flu while COVID is circulating are serious.
Q: What are the implications?
There are some we know and some we don’t know. If you develop flu-like symptoms, you’re going to have to get tested. You’re going to have to stay home quite a bit longer if you get a definitive (positive COVID-19) test than you would simply with flu symptoms. Also, you’re probably going to miss work when your workplace is very stressed or your children are stressed by having COVID circulating in schools.
The part we know less about are the implications of getting the flu and COVID together. There is some reason to believe if you get them together, the illness will be more severe. We are seeing that with RSV (respiratory syncytial virus) and parainfluenza and COVID coinfections in children. They appear to be quite severe.
But for flu, we just don’t have the data yet. That’s because there really was no cocirculation of COVID and influenza with the exception of parts of China for a brief part of February and March.
Q: Will the planned administration of booster COVID-19 shots this fall affect the number of people who get the flu vaccine or how it’s distributed?
It creates a lot of logistical challenges, particularly for hospitals and other places that need to vaccinate a large number of their employees for flu and that will need to give COVID boosters at about the same time period. It also creates logistical challenges for doctors’ offices.
But we don’t know of any reason why you can’t give the two shots together.
Q: Is it possible flu season will be more severe because we isolated and wore masks, etc., last winter? Any science behind that?
The more you study flu, the less you can predict, and I’ve been studying flu for a long time. There are reasons that might suggest a severe flu season – there has been limited immunity, and some people are not wearing masks effectively and they are gathering again. Those are things we believe protected us from influenza last season.
But we have not seen flu emerge yet. Normally we look to Australia, New Zealand, and South Africa during their winter – which is our summer – to get some idea of what is over the horizon for the Northern Hemisphere. Flu activity in Australia has been very modest this year.
That might mean flu may not show up for a while, but I would be loathe to make a prediction.
Q: What are the chances we’ll see a flu outbreak like we’re seeing with RSV, which is normally a winter illness?
The fact that we had a summer RSV surge just gives you an idea of how the normal epidemiology of viral infections has been disrupted. It means anything could happen with influenza. It could show up late summer or fall or wait until next spring.
We really don’t understand how those interactions work. When a new flu strain emerges, it often ignores the traditional behavior and shows up in the spring or fall. It happened in the 2009 pandemic, it happened in 1918.
The one thing I would safely predict about the next flu wave is that it will surprise us.
Q: Are you hopeful that combination vaccines in development from a number of companies, such as Moderna, Novavax, and Vivaldi, will be effective?
It is beginning to look like COVID will be with us for the foreseeable future – maybe as a seasonal virus or maybe as an ongoing pandemic. We are going to need to protect (ourselves) simultaneously against the flu and COVID. A single shot is a great way to do that – nobody wants two needles; nobody wants two trips to get vaccinated.
An effective combination vaccine would be a really great tool.
We have to wait to see what the science shows us, because they are quite different viruses. We won’t know if a combination vaccine works well and has acceptable side effects until we do those studies.
Q. Do you know at this point whether the side effects from two vaccines would be additive? Is there any way to predict that?
There is no way to predict. There are so many things that go into whether someone has side effects that we don’t understand. With fairly reactogenic vaccines like the mRNA vaccines, lots of people have no side effects whatsoever and others are really uncomfortable for 24 hours.
Flu is generally a better tolerated vaccine. There are still people who get muscle aches and very sore arms. I don’t think we can predict if getting two will be additive or just the same as getting one vaccine.
Q: Other than convenience and the benefit for people who are needle-phobic, are there any other advantages of combining them into one shot?
The logistics alone are enough to justify having one effective product if we can make one. It should reduce the overall cost of administration and reduce time off from work.
The combination vaccines given by pediatricians have been very successful. They reduce the number of needles for kids and make it much easier for parents and the pediatricians administering them. The same principle should apply to adults, who sometimes are less brave about needles than kids are.
Historically, combined vaccines in general have worked as well as vaccines given alone, but there have been exceptions. We just have to see what the products look like.
Q: For now, the flu vaccine and COVID-19 vaccine are single products. If you get them separately, is it better to put some time between the two?
We don’t know. There are studies that probably won’t be out in time to decide in September. They are looking at whether you get an equivalent immune response if you give them together or apart.
For now, I would say the advantage of getting them together is if you do get side effects, you’ll only get them once – one day to suffer through them. Also, it’s one trip to the doctor.
The potential advantage of separating them is that is how we developed and tested the vaccines. If you do react to them, side effects could be milder, but it will be on two separate days.
I would recommend doing whatever works so that you get both vaccines in a timely manner.
I’m going to get my flu shot as soon as it’s available. If I’m due for a COVID booster at that time, I would probably do them together.
Q: Do you foresee a point in the future when the predominant strain of SARS-CoV-2 will be one of the components of a flu vaccine, like we did in the past with H1N1, etc?
It really remains to be seen, but it is very conceivable it could happen. The same companies that developed COVID-19 vaccines are working on flu vaccines.
Q: Any other advice for people concerned about getting immunized against both COVID-19 and influenza in the coming months?
There is no side effect of the vaccine that begins to approach the risk you face from either disease. It’s really one of the best things you can do to protect yourself is to get vaccinated.
In the case of flu, the vaccine is only modestly effective, but it still saves tens of thousands of lives each year. The SARS-CoV-2 vaccine is a much better vaccine and a deadlier disease.
Dr. Pavia consulted for GlaxoSmithKline on influenza testing.
A version of this article first appeared on Medscape.com.