User login
Bringing you the latest news, research and reviews, exclusive interviews, podcasts, quizzes, and more.
div[contains(@class, 'read-next-article')]
div[contains(@class, 'nav-primary')]
nav[contains(@class, 'nav-primary')]
section[contains(@class, 'footer-nav-section-wrapper')]
nav[contains(@class, 'nav-ce-stack nav-ce-stack__large-screen')]
header[@id='header']
div[contains(@class, 'header__large-screen')]
div[contains(@class, 'read-next-article')]
div[contains(@class, 'main-prefix')]
div[contains(@class, 'nav-primary')]
nav[contains(@class, 'nav-primary')]
section[contains(@class, 'footer-nav-section-wrapper')]
footer[@id='footer']
section[contains(@class, 'nav-hidden')]
div[contains(@class, 'ce-card-content')]
nav[contains(@class, 'nav-ce-stack')]
div[contains(@class, 'view-medstat-quiz-listing-panes')]
div[contains(@class, 'pane-article-sidebar-latest-news')]
Islatravir + doravirine maintains HIV viral suppression
according to new data.
ISL is a first-in-class nucleoside reverse transcriptase translocation inhibitor (NRTTI), Jean-Michel Molina, MD, PhD, of Saint‐Louis and Lariboisière Hospitals in Paris, explained at the annual HIV drug therapy meeting in Glasgow, Scotland. The randomized, double-blind, dose‐ranging trial compared ISL+DOR to a fixed‐dose combination of DOR, lamivudine, and tenofovir disoproxil fumarate (DOR/3TC/TDF) daily in 121 patients.
Patients in the ISL+DOR group initially received 0.25, 0.75, or 2.25 mg of ISL along with 100 mg of DOR and 200 mg of 3TC. Beginning at week 20, participants achieving HIV viral loads of 50 copies/mL or less discontinued 3TC but continued on their assigned dose of ISL+DOR for at least 24 weeks. At that point the investigators noted a greater number of discontinuations in the 2.25-mg group and settled on the 0.75-mg ISL dose. All patients in the ISL group were transitioned to that dose between weeks 60 and 72.
At week 96, 81.1% of the patients in the combined ISL group maintained viral loads <50 copies/mL, comparable to the 80.6% of those in the DOR/3TC/TDF group.
ISL+DOR appeared to be “well tolerated,” the investigators noted. They found drug-related adverse events in 7.8% of the patients in the ISL+DOR group compared with 22.6% of patients in the DOR/3TC/TDF group. In addition, among the 90 patients in the ISL+DOR group, no more than 5% of participants experienced any specific drug-related adverse event.
Source: HIV Glasgow 2020 Virtual Conference: Abstract O415. Oct. 5-8, 2020.
A version of this article originally appeared on Medscape.com.
Colonoscopy patients may get hit with a ‘surprise bill’
A colonoscopy screening for colorectal cancer should be covered by commercial health insurance, but a new study reports that some patients receive a “surprise” bill.
The study was published online Oct. 13 as a research letter in the Annals of Internal Medicine.
Nearly 1 in 8 commercially insured patients who had an elective colonoscopy between 2012 and 2017 received an out-of-network bill, resulting in hundreds of dollars more than the typical insurance payment.
The median surprise bill was $418 (range $152-$981).
The findings are “disconcerting” say the authors, “because Section 2713 of the Patient Protection and Affordable Care Act eliminates consumer cost sharing for screening colonoscopy, and because a recent Federal Reserve study reported that 40% of Americans do not have $400 to cover unnecessary expenses.”
Most of these surprise costs were incurred from the use of out-of network anesthesiologists and pathologists, the authors note.
“Doctors need to be aware of these out-of-network bills so that patients know what to expect when they undergo these screening procedures,” said study author Karan R. Chhabra, MD, MSc, a resident in general surgery at Brigham and Women’s Hospital, Boston, Massachusetts. “Ideally, they should do their colonoscopies at facilities where all providers participate in the same major insurance plans.”
“If gastroenterologists own their endoscopy facility, this is an obvious situation in which they should not be working with anesthesiologists or pathologists who are not in the same networks as them,” he told Medscape Medical News. “And as we point out in our paper, anesthesiology and pathology review are not necessary in every single case — endoscopists can perform their own sedation, and in certain settings, lesions can be discarded without pathological examination.”
But is it really that simple for physicians to make sure that all members of the team are in-network?
It’s not simple at all, and in fact it’s a rather difficult task, said Glenn Melnick, PhD, professor and chair in health care finance at USC and director of USC’s Center for Health Financing, Policy, and Management in Los Angeles.
“It would be really difficult for Dr Smith to know that Dr Jones is out of network, so it’s really hard to hold the doctors responsible,” Melnick told Medscape Medical News. “There are so many insurers and it may be difficult to know who is in-network and who isn’t.”
In this study, anesthesiologists and pathologists were a source of surprise bills, and they are behind the scenes, he pointed out. “The patient doesn’t select them directly and there is no opportunity to even find out who they are,” said Melnick.
Most patients have no idea that there may be other doctors involved with a colonoscopy, and Melnick highlighted his own recent experience. “I just had a colonoscopy and it never would have occurred to me. It never crossed my mind to even ask who is in network and who isn’t,” he said. “And I’m an expert on this.”
“The health plan could bear some responsibility here,” Melnick commented, although he added that patients need to be informed. Patients who are undergoing an elective procedure should be told that other doctors may be involved, and then to ask if these doctors are in the network. “If enough patients do this, maybe then the gastroenterologist will use people in network,” he commented.
Details of the surprise bills
Federal regulations eliminate consumer cost-sharing when screening colonoscopies are performed in-network, but there are no stipulations regarding expenses when out-of-network providers are used, the authors note.
To investigate this issue, the authors used a claims database from a large national insurer and identified patients aged 18 to 64 years who had undergone colonoscopy between 2012 and 2017.
The analysis was limited to cases where both the facility and the endoscopist were in-network, and the colonoscopies were stratified into those with visual inspection only and those during which an intervention was done, such as a biopsy. The primary outcome measure was the prevalence of out-of-network claims when the endoscopist and facility were in-network, and the secondary outcome was the amount of the potential surprise bills, which were calculated as the total out-of network charges less the typical in-network price.
A total of 1,118,769 elective colonoscopies with in-network endoscopists and facilities were identified and of these, 12.1% (n = 135,626) were involved with out-of-network claims. Out-of network anesthesiologists accounted for 64% of cases (median potential surprise bill, $488), while out-of-network pathologists were involved in 40% of cases (median potential surprise bill, $248). The likelihood of receiving an out-of-network claim was significantly higher if an intervention was performed during colonoscopy, as compared with those without intervention (13.9% vs. 8.2%; difference, 5.7%).
If an intervention was performed, 56% of potential surprise bills involved anesthesiologists and 51% pathologists. In cases with visual inspection only, 95% of out-of-network claims involved anesthesiologists.
The authors suggest that measures that can be taken to avoid surprise bills include having endoscopists and hospitals partner with anesthesia and pathology providers who are in-network. Another cost-saving strategy is the use of endoscopist-provided sedation rather than use of deeper anesthesia, and the authors also suggest that not all low-risk polyps need to be sent for pathological evaluation.
“Providers must realize many of our patients are at risk for considerable balance bills, and therefore they should provide resources that can provide reliable estimates for out-of-pocket costs relevant to site of service,” said lead author James Scheiman, MD, a professor of medicine at the University of Virginia School of Medicine in Charlottesville.
The study was funded by the University of Michigan. Chhabra reports personal fees from Blue Cross Blue Shield of Massachusetts, Inc. Scheiman and Melnick have no disclosures.
This article first appeared on Medscape.com.
C. difficile linked to surgery risk in pediatric Crohn’s
In pediatric Crohn’s disease, a Clostridioides difficile infection detected within the first year after diagnosis is associated with a shorter time to first bowel resection surgery, according to a study that included both a retrospective and prospective analysis. The researchers also found evidence that changes in methionine biosynthesis and depletion of beneficial bacteria may contribute to risk of surgery.
C. difficile infection (CDI) disproportionately affects individuals with inflammatory bowel disease (IBD). Pediatric IBD patients have a 34% risk of recurrent CDI infection, compared with 7.5% in the general population. Previous research found that adults with ulcerative colitis and CDI are at more risk of colectomy, but the finding has not been replicated in children.
In a study published in Inflammatory Bowel Diseases, researchers led by Jennifer Hellmann and Lee Denson of the University of Cincinnati conducted a single-center retrospective analysis of 75 pediatric Crohn’s disease patients. They also conducted a prospective study of 70 pediatric Crohn’s disease patients, using shotgun metagenome sequencing to examine the relationship between microbiota composition and C. difficile carriage or surgery history.
Nineteen percent of patients tested positive for C. difficile. Use of antibiotics was associated with C. difficile (odds ratio, 7.9; P = .02). Of patients who underwent C. difficile testing in the first year, 23 went on to have surgery: 21% who were C. difficile negative required surgery, compared with 67% of those who were positive (hazard ratio, 4.4; P = .0003). The mean time to surgery was 527 days for C. difficile–positive patients and 1,268 days for those who were negative.
A multivariate regression analysis on 54 patients with complete data sets showed that the presence of C. difficile was associated with increased risk of surgery (OR, 16.2; P = .0006). When the analysis was run on all 73 patients, using null value for missing data, the results were similar (OR, 9.17; P = .008).
Shotgun sequencing found that 47 of 114 bacterial species that were associated with the presence of C. difficile were also associated with prior surgery for Crohn’s disease. Species included some that may play a role in mucosal homeostasis, such as Bifidobacterium breve and several Alistipes and Ruminococcus species. That suggests that a reduction in the numbers of these taxa may be associated with C. difficile presence and surgical risk.
The researchers also found that methionine synthesis pathways were depressed in C. difficile–positive and surgery patients. Methionine may bolster antioxidant capacity and improve villus morphology. IBD patients with dysbiosis and those experiencing Crohn’s disease exacerbations have been shown to have decreased methionine pathway activity, suggesting methionine biosynthesis changes have clinical relevance.
The study was funded by the National Institutes of Health.
SOURCE: Hellmann J et al. Inflamm Bowel Dis. 2020. doi: 10.1093/ibd/izz263.
Medicare faces calls to stop physician pay cuts in E/M overhaul
A planned overhaul of reimbursement for evaluation and management (E/M) services emerged as perhaps the most contentious issue connected to Medicare’s 2021 payment policies for clinicians.
The Centers for Medicare & Medicaid Services (CMS) included the planned E/M overhaul — and accompanying offsets — in the draft 2021 physician fee schedule, released in August. The draft fee schedule drew at least 45,675 responses by October 5, the deadline for offering comments, with many of the responses addressing the E/M overhaul.
The influential Medicare Payment Advisory Commission (MedPAC) “strongly” endorsed the “budget-neutral” approach taken with the E/M overhaul. This planned reshuffling of payments is a step toward addressing a shortfall of primary care clinicians, inasmuch as it would help make this field more financially appealing, MedPAC said in an October 2 letter to CMS.
In contrast, physician organizations, including the American Medical Association (AMA), asked CMS to waive or revise the budget-neutral aspect of the E/M overhaul. Among the specialties slated for reductions are those deeply involved with the response to the pandemic, wrote James L. Madara, AMA’s chief executive officer, in an October 5 comment to CMS. Emergency medicine as a field would see a 6% cut, and infectious disease specialists, a 4% reduction.
“Payment reductions of this magnitude would be a major problem at any time, but to impose cuts of this magnitude during or immediately after the COVID-19 pandemic, including steep cuts to many of the specialties that have been on the front lines in efforts to treat patients in places with widespread infection, is unconscionable,” Madara wrote.
Madara also said specialties scheduled for payment reductions include those least able to make up for the lack of in-person care as a result of the uptick in telehealth during the pandemic.
A chart in the draft physician fee schedule (Table 90) shows reductions for many specialties that do not routinely bill for office visits. The table shows an 8% cut for anesthesiologists, a 7% cut for general surgeons, and a 6% cut for ophthalmologists. Table 90 also shows an estimated 11% reduction for radiologists and a 9% drop for pathologists.
The draft rule notes that these figures are based upon estimates of aggregate allowed charges across all services, so they may not reflect what any particular clinician might receive.
In total, Table 90 shows how the E/M changes and connected offsets would affect more than 50 fields of medicine. The proposal includes a 17% expected increase for endocrinologists and a 14% bump for those in hematology/oncology. There are expected increases of 13% for family practice and 4% for internal medicine.
This reshuffling of payments among specialties is only part of the 2021 E/M overhaul. There’s strong support for other aspects, making it unlikely that CMS would consider dropping the plan entirely.
“CMS’ new office visit policy will lead to significant administrative burden reduction and will better describe and recognize the resources involved in clinical office visits as they are performed today,” AMA’s Madara wrote in his comment.
Changes for the billing framework for E/M slated to start in 2021 are the result of substantial collaboration by an AMA-convened work group, which brought together more than 170 state medical and specialty societies, Madara said in his comment.
CMS has been developing this plan for several years. It outlined this 2021 E/M overhaul in the 2020 Medicare physician fee schedule finalized last year.
Madara urged CMS to proceed with the E/M changes but also “exercise the full breadth and depth of its administrative authority” to avoid or minimize the planned cuts.
“To be clear, we are not asking CMS to phase in implementation of the E/M changes but rather to phase in the payment reductions for certain specialties and health professionals in 2021 due to budget neutrality,” he wrote.
Other groups asking CMS to waive the budget-neutrality requirement include the American College of Physicians, the American College of Emergency Physicians, the American Society for Radiation Oncology, and the American Society of Neuroradiology.
The American Academy of Family Physicians (AAFP) asked CMS to temporarily waive the budget-neutrality requirement and pressed the agency to maintain the underlying principle of the E/M overhaul.
“Should HHS [Department of Health and Human Services] use its authority to waive budget neutrality, we also recommend that CMS finalize a reinstatement plan for the conversion factor reductions that provides physician practices with ample time to prepare and does not result in a financial cliff,” wrote John S. Cullen, MD, board chair for AAFP, in a September 28 comment to CMS.
Owing to the declaration of a public health emergency, HHS could use a special provision known as 1135 waiver authority to waive budget-neutrality requirements, Cullen wrote.
“The AAFP understands that HHS’ authority is limited by the timing of the end of the public health emergency, but we believe that this approach will provide Congress with needed time to enact an accompanying legislative solution,” he wrote.
Lawmakers weigh in
Lawmakers in both political parties have asked CMS to reconsider the offsets in the E/M overhaul.
Rep. Michael C. Burgess, MD (R-TX), who practiced as an obstetrician before joining Congress, in October introduced a bill with Rep. Bobby Rush (D-IL) that would provide for a 1-year waiver of budget-neutrality adjustments under the Medicare physician fee schedule.
Burgess and Rush were among the more than 160 members of Congress who signed a September letter to CMS asking the agency to act on its own to drop the budget-neutrality requirement. In the letter, led by Rep. Roger Marshall, MD (R-KS), the lawmakers acknowledge the usual legal requirements for CMS to offset payment increases in the physician fee schedule with cuts. But the lawmakers said the national public health emergency allows CMS to work around this.
“Given the effects of the COVID-19 pandemic, we believe you have the regulatory authority to immediately address these inequities,” the lawmakers wrote. “There is also the need to consider how the outbreak will be in the fall/winter months and if postponing certain elective procedures will go back into effect, per CMS’ recommendations.
“While we understand that legislative action may also be required to address this issue, given the January 1, 2021 effective date, we would ask you to take immediate actions to delay or mitigate these cuts while allowing the scheduled increases to go into effect,” the lawmakers said in closing their letter. “This approach will give Congress sufficient time to develop a meaningful solution and to address these looming needs.”
Another option might be for CMS to preserve the budget-neutrality claim for the 2021 physician fee schedule but soften the blow on specialties, Brian Fortune, president of the consulting firm Farragut Square Group, told Medscape Medical News. A former staffer for Republican leadership in the House of Representatives, Fortune has for more than 20 years followed Medicare policy.
The agency could redo some of the assumptions used in estimating the offsets, he said, adding that in the draft rule, CMS appears to be seeking feedback that could help it with new calculations.
“CMS has been looking for a way out,” Fortune said. “CMS could remodel the assumptions, and the cuts could drop by half or more.
“The agency has several options to get creative as the need arises,” he said.
“Overvalued” vs “devalued”
In its comment to CMS, though, MedPAC argued strongly for maintaining the offsets. The commission has for several years been investigating ways to use Medicare’s payment policies as a tool to boost the ranks of clinicians who provide primary care.
A reshuffling of payments among specialties is needed to address a known imbalance in which Medicare for many years has “overvalued” procedures at the expense of other medical care, wrote Michael E. Chernew, PhD, the chairman of MedPAC, in an October 2 comment to CMS.
“Some types of services — such as procedures, imaging, and tests — experience efficiency gains over time, as advances in technology, technique, and clinical practice enable clinicians to deliver them faster,” he wrote. “However, E&M office/outpatient visits do not lend themselves to such efficiency gains because they consist largely of activities that require the clinician’s time.”
Medicare’s payment policies have thus “passively devalued” the time many clinicians spend on office visits, helping to skew the decisions of young physicians toward specialties, according to Chernew.
Reshuffling payment away from specialties that are now “overvalued” is needed to “remedy several years of passive devaluation,” he wrote.
The median income in 2018 for primary care physicians was $243,000 in 2018, whereas that of specialists such as surgeons was $426,000, Chernew said in the letter, citing MedPAC research.
These figures echo the findings of Medscape’s most recent annual physician compensation report.
As one of the largest buyers of medical services, Medicare has significant influence on the practice of medicine in the United States. In 2018 alone, Medicare directly paid $70.5 billion for clinician services. Its payment policies already may have shaped the pool of clinicians available to treat people enrolled in Medicare, which covers those aged 65 years and older, Chernew said.
“The US has over three times as many specialists as primary care physicians, which could explain why MedPAC’s annual survey of Medicare beneficiaries has repeatedly found that beneficiaries who are looking for a new physician report having an easier time finding a new specialist than a new primary care provider,” he wrote.
“Access to primary care physicians could worsen in the future as the number of primary care physicians in the US, after remaining flat for several years, has actually started to decline,” Chernew said.
This article first appeared on Medscape.com.
Tobacco-free homes yield more tobacco-free youth
Tsu-Suan Wu and Benjamin W. Chaffee, DDS, PhD, of the University of California, San Francisco, advised in their study in Pediatrics.

Previous studies have shown that children who grow up in a nonsmoking household are less likely to begin smoking themselves, and active parental engagement in interventions shows promise overall in protecting children from drug, alcohol, and illicit drug use. Households with rigid rules against smoking offer a deterrent for children who might otherwise be tempted, the researchers noted.
Other studies have shown that while youth smoking is on the decline, use of noncigarette products is increasing sharply. The inconspicuous appearance and attractive scents these delivery devices afford make it easier to conceal them from parents.
In the current study, using data from the Population Assessment of Tobacco and Health (PATH) Study involving 23,170 parents and youth ages 9 and up, Mr. Wu and Dr. Chaffee sought to assess to what extent parents had knowledge or suspicions of tobacco use and also to evaluate the association between youth initiating tobacco use and the establishment of household rules and engaging in regular conversation about tobacco.
Study results revealed in three of the four groups evaluated that youth were most likely to engage in using several different types of tobacco (polytobacco) products; in the fourth group, e-cigarette use was most common. Among polytobacco users, fully 77%-80% reported cigarette usage.
Parental knowledge and actions
Overall, Mr. Wu and Dr. Chaffee “identified substantial lapses in parents’ awareness of their children’s tobacco use.” Parents were most likely to register awareness when their children smoked cigarettes; half as many parents were aware or suspected use when noncigarette products were used.
Parents who had heightened awareness about possible tobacco usage tended to be the child’s mother, had completed lower levels of education, parented children who were older, male and non-Hispanic, and lived with a tobacco user.
Noteworthy was the growing percentage of parents who report awareness or suspicions of cigarette usage – approximately 70% – compared with previous study findings – about 40%. The researchers speculated that this increase could be directly tied to growing social concern regarding youth smoking. Unfortunately, parents will continue to be challenged to keep up with constantly changing e-cigarette designs in maintaining their awareness, Mr. Wu and Dr. Chaffee noted.
Establishing strict household rules was found to be more effective than just talking with youth about usage, which half of the youth reported their parents did. At all time points, the risk of tobacco initiation was 20%-26% lower for children who lived in a house with strict household rules forbidding any tobacco use by anyone. The researchers observed that success with the household rules method was best achieved with children at younger ages.
The study did not measure the quality or frequency of antitobacco conversations but it should not be concluded definitively that all parental communication is unhelpful, the researchers cautioned.
To their knowledge, this study is the first to analyze the effects of household antitobacco strategies on discouraging initiation the use of tobacco and other smoking products as well as assessing parental awareness surrounding tobacco usage among youth.
What to tell parents
In a separate interview, Kelly Curran, MD, MA, assistant professor of pediatrics at the University of Oklahoma, Oklahoma City, commented on the explosive growth of e-cigarette use in the last 7 years.
What makes e-cigs so difficult to detect is that they “can resemble common objects such as flash drives or pens, and as a result, can often be hidden or overlooked by parents,” noted Dr. Curran.
The most important message for parents from this study is that they have the potential to have a large impact in the prevention of tobacco initiation, she said. “This effort requires parents to ‘walk the walk’ instead of just ‘talking the talk.”
As the study revealed, simply talking to teens about not using tobacco products doesn’t decrease use, but “creating strict household rules around no tobacco use for all visitors and inhabitants has a significant impact in decreasing youth tobacco initiation – by nearly 25%,” she added. “When counseling patients and families about tobacco prevention, clinicians should encourage them to create a tobacco-free home.”
The study was funded by a National Institutes of Health grant and the Delta Dental Community Care Foundation. The authors have no relevant financial disclosures. Dr. Curran, who is a member of the Pediatric News editorial advisory board, said she had no relevant financial disclosures.
SOURCE: Wu T-S and Chaffee BW. Pediatrics 2020 October. doi: 10.1542/peds.2019-4034.
Tsu-Suan Wu and Benjamin W. Chaffee, DDS, PhD, of the University of California, San Francisco, advised in their study in Pediatrics.
Previous studies have shown that children who grow up in a nonsmoking household are less likely to begin smoking themselves, and active parental engagement in interventions shows promise overall in protecting children from drug, alcohol, and illicit drug use. Households with rigid rules against smoking offer a deterrent for children who might otherwise be tempted, the researchers noted.
Other studies have shown that while youth smoking is on the decline, use of noncigarette products is increasing sharply. The inconspicuous appearance and attractive scents these delivery devices afford make it easier to conceal them from parents.
In the current study, using data from the Population Assessment of Tobacco and Health (PATH) Study involving 23,170 parents and youth ages 9 and up, Mr. Wu and Dr. Chaffee sought to assess to what extent parents had knowledge or suspicions of tobacco use and also to evaluate the association between youth initiating tobacco use and the establishment of household rules and engaging in regular conversation about tobacco.
Study results revealed in three of the four groups evaluated that youth were most likely to engage in using several different types of tobacco (polytobacco) products; in the fourth group, e-cigarette use was most common. Among polytobacco users, fully 77%-80% reported cigarette usage.
Parental knowledge and actions
Overall, Mr. Wu and Dr. Chaffee “identified substantial lapses in parents’ awareness of their children’s tobacco use.” Parents were most likely to register awareness when their children smoked cigarettes; half as many parents were aware or suspected use when noncigarette products were used.
Parents who had heightened awareness about possible tobacco usage tended to be the child’s mother, had completed lower levels of education, parented children who were older, male and non-Hispanic, and lived with a tobacco user.
Noteworthy was the growing percentage of parents who report awareness or suspicions of cigarette usage – approximately 70% – compared with previous study findings – about 40%. The researchers speculated that this increase could be directly tied to growing social concern regarding youth smoking. Unfortunately, parents will continue to be challenged to keep up with constantly changing e-cigarette designs in maintaining their awareness, Mr. Wu and Dr. Chaffee noted.
Establishing strict household rules was found to be more effective than just talking with youth about usage, which half of the youth reported their parents did. At all time points, the risk of tobacco initiation was 20%-26% lower for children who lived in a house with strict household rules forbidding any tobacco use by anyone. The researchers observed that success with the household rules method was best achieved with children at younger ages.
The study did not measure the quality or frequency of antitobacco conversations but it should not be concluded definitively that all parental communication is unhelpful, the researchers cautioned.
To their knowledge, this study is the first to analyze the effects of household antitobacco strategies on discouraging initiation the use of tobacco and other smoking products as well as assessing parental awareness surrounding tobacco usage among youth.
What to tell parents
In a separate interview, Kelly Curran, MD, MA, assistant professor of pediatrics at the University of Oklahoma, Oklahoma City, commented on the explosive growth of e-cigarette use in the last 7 years.
What makes e-cigs so difficult to detect is that they “can resemble common objects such as flash drives or pens, and as a result, can often be hidden or overlooked by parents,” noted Dr. Curran.
The most important message for parents from this study is that they have the potential to have a large impact in the prevention of tobacco initiation, she said. “This effort requires parents to ‘walk the walk’ instead of just ‘talking the talk.”
As the study revealed, simply talking to teens about not using tobacco products doesn’t decrease use, but “creating strict household rules around no tobacco use for all visitors and inhabitants has a significant impact in decreasing youth tobacco initiation – by nearly 25%,” she added. “When counseling patients and families about tobacco prevention, clinicians should encourage them to create a tobacco-free home.”
The study was funded by a National Institutes of Health grant and the Delta Dental Community Care Foundation. The authors have no relevant financial disclosures. Dr. Curran, who is a member of the Pediatric News editorial advisory board, said she had no relevant financial disclosures.
SOURCE: Wu T-S and Chaffee BW. Pediatrics 2020 October. doi: 10.1542/peds.2019-4034.
FROM PEDIATRICS
What’s in a number? 697,633 children with COVID-19
according to a report from the American Academy of Pediatrics and the Children’s Hospital Association.
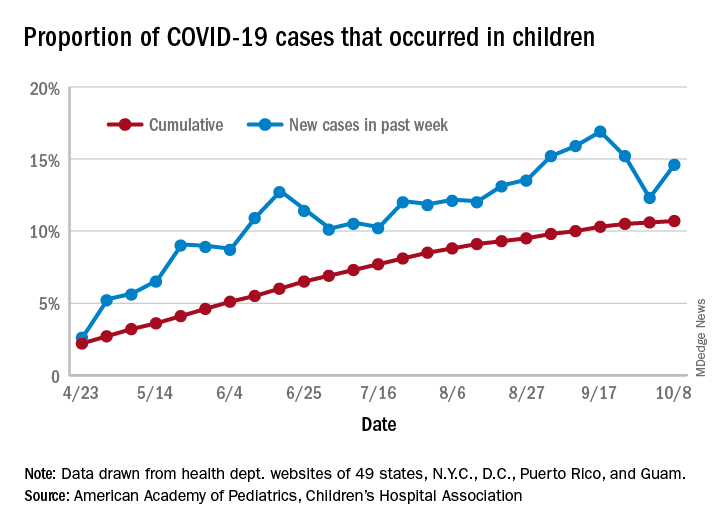
For the week, 14.6% of all COVID-19 cases reported in the United States occurred in children, after 2 consecutive weeks of declines that saw the proportion drop from 16.9% to 12.3%. The cumulative rate of child cases for the entire pandemic is 10.7%, with total child cases in the United States now up to 697,633 and cases among all ages at just over 6.5 million, the AAP and the CHA said Oct. 12 in their weekly COVID-19 report.
Nationally, there were 927 cases reported per 100,000 children as of Oct. 8, with rates at the state level varying from 176 per 100,000 in Vermont to 2,221 per 100,000 in North Dakota. Two other states were over 2,000 cases per 100,000 children: Tennessee (2,155) and South Carolina (2,116), based on data from the health departments of 49 states (New York does not report age distribution), as well as the District of Columbia, New York City, Puerto Rico, and Guam.
Severe illness continues to be rare in children, and national (25 states and New York City) hospitalization rates dropped in the last week. The proportion of hospitalizations occurring in children slipped from a pandemic high of 1.8% the previous week to 1.7% during the week of Oct. 8, and the rate of hospitalizations for children with COVID-19 was down to 1.4% from 1.6% the week before and 1.9% on Sept. 3, the AAP and the CHA said.
Mortality data from 42 states and New York City also show a decline. For the third consecutive week, children represented just 0.06% of all COVID-19 deaths in the United States, down from a high of 0.07% on Sept. 17. Only 0.02% of all cases in children have resulted in death, and that figure has been dropping since early June, when it reached 0.06%, according to the AAP/CHA report. As of Oct. 8, there have been 115 total deaths reported in children.
according to a report from the American Academy of Pediatrics and the Children’s Hospital Association.
For the week, 14.6% of all COVID-19 cases reported in the United States occurred in children, after 2 consecutive weeks of declines that saw the proportion drop from 16.9% to 12.3%. The cumulative rate of child cases for the entire pandemic is 10.7%, with total child cases in the United States now up to 697,633 and cases among all ages at just over 6.5 million, the AAP and the CHA said Oct. 12 in their weekly COVID-19 report.
Nationally, there were 927 cases reported per 100,000 children as of Oct. 8, with rates at the state level varying from 176 per 100,000 in Vermont to 2,221 per 100,000 in North Dakota. Two other states were over 2,000 cases per 100,000 children: Tennessee (2,155) and South Carolina (2,116), based on data from the health departments of 49 states (New York does not report age distribution), as well as the District of Columbia, New York City, Puerto Rico, and Guam.
Severe illness continues to be rare in children, and national (25 states and New York City) hospitalization rates dropped in the last week. The proportion of hospitalizations occurring in children slipped from a pandemic high of 1.8% the previous week to 1.7% during the week of Oct. 8, and the rate of hospitalizations for children with COVID-19 was down to 1.4% from 1.6% the week before and 1.9% on Sept. 3, the AAP and the CHA said.
Mortality data from 42 states and New York City also show a decline. For the third consecutive week, children represented just 0.06% of all COVID-19 deaths in the United States, down from a high of 0.07% on Sept. 17. Only 0.02% of all cases in children have resulted in death, and that figure has been dropping since early June, when it reached 0.06%, according to the AAP/CHA report. As of Oct. 8, there have been 115 total deaths reported in children.
Flu vaccine significantly cuts pediatric hospitalizations
Unlike previous studies focused on vaccine effectiveness (VE) in ambulatory care office visits, Angela P. Campbell, MD, MPH, and associates have uncovered evidence of the overall benefit influenza vaccines play in reducing hospitalizations and emergency department visits in pediatric influenza patients.

“Our data provide important VE estimates against severe influenza in children,” the researchers noted in Pediatrics, adding that the findings “provide important evidence supporting the annual recommendation that all children 6 months and older should receive influenza vaccination.”
Dr. Campbell and colleagues collected ongoing surveillance data from the New Vaccine Surveillance Network (NVSN), which is a network of pediatric hospitals across seven cities, including Kansas City, Mo.; Rochester, N.Y.; Cincinnati; Pittsburgh; Nashville, Tenn.; Houston; and Seattle. The influenza season encompassed the period Nov. 7, 2018 to June 21, 2019.
A total of 2,748 hospitalized children and 2,676 children who had completed ED visits that did not lead to hospitalization were included. Once those under 6 months were excluded, 1,792 hospitalized children were included in the VE analysis; of these, 226 (13%) tested positive for influenza infection, including 211 (93%) with influenza A viruses and 15 (7%) with influenza B viruses. Fully 1,611 of the patients (90%), had verified vaccine status, while 181 (10%) had solely parental reported vaccine status. The researchers reported 88 (5%) of the patients received mechanical ventilation and 7 (<1%) died.
Most noteworthy, They further estimated a significant reduction in hospitalizations linked to A(H3N2) and A(H1N1)pdm09 viruses, even in the presence of circulating A(H3N2) viruses that differed from the A(H3N2) vaccine component.
Studies from other countries during the same time period showed that while “significant protection against influenza-associated ambulatory care visits and hospitalizations among children infected with A(H1N1)pdm09 viruses” was observed, the same could not be said for protection against A(H3N2) viruses, which varied among pediatric outpatients in the United States (24%), in England (17% outpatient; 31% inpatient), Europe (46%), and Canada (48%). They explained that such variation in vaccine protection is multifactorial, and includes virus-, host-, and environment-related factors. They also noted that regional variations in circulating viruses, host factors including age, imprinting, and previous vaccination could explain the study’s finding of vaccine protection against both A(H1N1)pdm09 and A(H3N2) viruses.
When comparing VE estimates between ED visits and hospitalizations, the researchers observed one significant difference, that “hospitalized children likely represent more medically complex patients, with 58% having underlying medical conditions and 38% reporting at lease one hospitalization in the past year, compared with 28% and 14% respectively, among ED participants.”
Strengths of the study included the prospective multisite enrollment that provided data across diverse locations and representation from pediatric hospitalizations and ED care, which were not previously strongly represented in the literature. The single-season study with small sample size was considered a limitation, as was the inability to evaluate full and partial vaccine status. Vaccine data also were limited for many of the ED patients observed.
Dr. Campbell and colleagues did caution that while they consider their test-negative design optimal for evaluating both hospitalized and ED patients, they feel their results should not be “interpreted as VE against influenza-associated ambulatory care visits or infections that are not medically attended.”
In a separate interview, Michael E. Pichichero, MD, director of the Rochester General Hospital Research Institute and a clinical professor of pediatrics at the University of Rochester (N.Y.), observed: “There are really no surprises here. A well done contemporary study confirms again the benefits of annual influenza vaccinations for children. Viral coinfections involving SARS-CoV-2 and influenza have been reported from Australia to cause heightened illnesses. That observation provides further impetus for parents to have their children receive influenza vaccinations.”
The researchers cited multiple sources of financial support for their ongoing work, including Sanofi, Quidel, Moderna, Karius, GlaxoSmithKline, Merck, AstraZeneca, and Pfizer. Funding for this study was supported by the Centers for Disease Control and Prevention. Dr. Pichichero said he had no relevant financial disclosures.
SOURCE: Campbell AP et al. Pediatrics. 2020. doi: 10.1542/peds.2020-1368.
Unlike previous studies focused on vaccine effectiveness (VE) in ambulatory care office visits, Angela P. Campbell, MD, MPH, and associates have uncovered evidence of the overall benefit influenza vaccines play in reducing hospitalizations and emergency department visits in pediatric influenza patients.
“Our data provide important VE estimates against severe influenza in children,” the researchers noted in Pediatrics, adding that the findings “provide important evidence supporting the annual recommendation that all children 6 months and older should receive influenza vaccination.”
Dr. Campbell and colleagues collected ongoing surveillance data from the New Vaccine Surveillance Network (NVSN), which is a network of pediatric hospitals across seven cities, including Kansas City, Mo.; Rochester, N.Y.; Cincinnati; Pittsburgh; Nashville, Tenn.; Houston; and Seattle. The influenza season encompassed the period Nov. 7, 2018 to June 21, 2019.
A total of 2,748 hospitalized children and 2,676 children who had completed ED visits that did not lead to hospitalization were included. Once those under 6 months were excluded, 1,792 hospitalized children were included in the VE analysis; of these, 226 (13%) tested positive for influenza infection, including 211 (93%) with influenza A viruses and 15 (7%) with influenza B viruses. Fully 1,611 of the patients (90%), had verified vaccine status, while 181 (10%) had solely parental reported vaccine status. The researchers reported 88 (5%) of the patients received mechanical ventilation and 7 (<1%) died.
Most noteworthy, They further estimated a significant reduction in hospitalizations linked to A(H3N2) and A(H1N1)pdm09 viruses, even in the presence of circulating A(H3N2) viruses that differed from the A(H3N2) vaccine component.
Studies from other countries during the same time period showed that while “significant protection against influenza-associated ambulatory care visits and hospitalizations among children infected with A(H1N1)pdm09 viruses” was observed, the same could not be said for protection against A(H3N2) viruses, which varied among pediatric outpatients in the United States (24%), in England (17% outpatient; 31% inpatient), Europe (46%), and Canada (48%). They explained that such variation in vaccine protection is multifactorial, and includes virus-, host-, and environment-related factors. They also noted that regional variations in circulating viruses, host factors including age, imprinting, and previous vaccination could explain the study’s finding of vaccine protection against both A(H1N1)pdm09 and A(H3N2) viruses.
When comparing VE estimates between ED visits and hospitalizations, the researchers observed one significant difference, that “hospitalized children likely represent more medically complex patients, with 58% having underlying medical conditions and 38% reporting at lease one hospitalization in the past year, compared with 28% and 14% respectively, among ED participants.”
Strengths of the study included the prospective multisite enrollment that provided data across diverse locations and representation from pediatric hospitalizations and ED care, which were not previously strongly represented in the literature. The single-season study with small sample size was considered a limitation, as was the inability to evaluate full and partial vaccine status. Vaccine data also were limited for many of the ED patients observed.
Dr. Campbell and colleagues did caution that while they consider their test-negative design optimal for evaluating both hospitalized and ED patients, they feel their results should not be “interpreted as VE against influenza-associated ambulatory care visits or infections that are not medically attended.”
In a separate interview, Michael E. Pichichero, MD, director of the Rochester General Hospital Research Institute and a clinical professor of pediatrics at the University of Rochester (N.Y.), observed: “There are really no surprises here. A well done contemporary study confirms again the benefits of annual influenza vaccinations for children. Viral coinfections involving SARS-CoV-2 and influenza have been reported from Australia to cause heightened illnesses. That observation provides further impetus for parents to have their children receive influenza vaccinations.”
The researchers cited multiple sources of financial support for their ongoing work, including Sanofi, Quidel, Moderna, Karius, GlaxoSmithKline, Merck, AstraZeneca, and Pfizer. Funding for this study was supported by the Centers for Disease Control and Prevention. Dr. Pichichero said he had no relevant financial disclosures.
SOURCE: Campbell AP et al. Pediatrics. 2020. doi: 10.1542/peds.2020-1368.
FROM PEDIATRICS
‘Profound human toll’ in excess deaths from COVID-19 calculated in two studies
However, additional deaths could be indirectly related because people avoided emergency care during the pandemic, new research shows.
Deaths linked to COVID-19 varied by state and phase of the pandemic, as reported in a study from researchers at Virginia Commonwealth University and Yale University that was published online October 12 in JAMA.
Another study published online simultaneously in JAMA took more of an international perspective. Investigators from the University of Pennsylvania and Harvard University found that in America there were more excess deaths and there was higher all-cause mortality during the pandemic than in 18 other countries.
Although the ongoing number of deaths attributable to COVID-19 continues to garner attention, there can be a lag of weeks or months in how long it takes some public health agencies to update their figures.
“For the public at large, the take-home message is twofold: that the number of deaths caused by the pandemic exceeds publicly reported COVID-19 death counts by 20% and that states that reopened or lifted restrictions early suffered a protracted surge in excess deaths that extended into the summer,” lead author of the US-focused study, Steven H. Woolf, MD, MPH, told Medscape Medical News.
The take-away for physicians is in the bigger picture – it is likely that the COVID-19 pandemic is responsible for deaths from other conditions as well. “Surges in COVID-19 were accompanied by an increase in deaths attributed to other causes, such as heart disease and Alzheimer’s disease and dementia,” said Woolf, director emeritus and senior adviser at the Center on Society and Health and professor in the Department of Family Medicine and Population Health at the Virginia Commonwealth University School of Medicine in Richmond, Virginia.
The investigators identified 225,530 excess US deaths in the 5 months from March to July. They report that 67% were directly attributable to COVID-19.
Deaths linked to COVID-19 included those in which the disease was listed as an underlying or contributing cause. US total death rates are “remarkably consistent” year after year, and the investigators calculated a 20% overall jump in mortality.
The study included data from the National Center for Health Statistics and the US Census Bureau for 48 states and the District of Columbia. Connecticut and North Carolina were excluded because of missing data.
Woolf and colleagues also found statistically higher rates of deaths from two other causes, heart disease and Alzheimer’s disease/dementia.
Altered states
New York, New Jersey, Massachusetts, Louisiana, Arizona, Mississippi, Maryland, Delaware, Rhode Island, and Michigan had the highest per capita excess death rates. Three states experienced the shortest epidemics during the study period: New York, New Jersey, and Massachusetts.
Some lessons could be learned by looking at how individual states managed large numbers of people with COVID-19. “Although we suspected that states that reopened early might have put themselves at risk of a pandemic surge, the consistency with which that occurred and the devastating numbers of deaths they suffered was a surprise,” Woolf said.
“The goal of our study is not to look in the rearview mirror and lament what happened months ago but to learn the lesson going forward: Our country will be unable to take control of this pandemic without more robust efforts to control community spread,” Woolf said. “Our study found that states that did this well, such as New York and New Jersey, experienced large surges but bent the curve and were back to baseline in less than 10 weeks.
“If we could do this as a country, countless lives could be saved.”
A global perspective
The United States experienced high mortality linked to COVID-19, as well as high all-cause mortality, compared with 18 other countries, as reported in the study by University of Pennsylvania and Harvard University researchers.
The United States ranked third, with 72 deaths per 100,000 people, among countries with moderate or high mortality. Although perhaps not surprising given the state of SARS-CoV-2 infection across the United States, a question remains as to what extent the relatively high mortality rate is linked to early outbreaks vs “poor long-term response,” the researchers note.
Alyssa Bilinski, MSc, and lead author Ezekiel J. Emanuel, MD, PhD, chair of the Department of Medical Ethics and Health Policy at the University of Pennsylvania Perelman School of Medicine in Philadelphia, calculated the difference in COVID-19 deaths among countries through Sept. 19, 2020. On this date, the United States reported a total 198,589 COVID-19 deaths.
They calculated that, if the US death rates were similar to those in Australia, the United States would have experienced 187,661 fewer COVID-19 deaths. If similar to those of Canada, there would have been 117,622 fewer deaths in the United States.
The US death rate was lower than six other countries with high COVID-19 mortality in the early spring, including Belgium, Spain, and the United Kingdom. However, after May 10, the per capita mortality rate in the United States exceeded the others.
Between May 10 and Sept. 19, the death rate in Italy was 9.1 per 100,000, vs 36.9 per 100,000.
“After the first peak in early spring, US death rates from COVID-19 and from all causes remained higher than even countries with high COVID-19 mortality,” the researchers note. “This may have been a result of several factors, including weak public health infrastructure and a decentralized, inconsistent US response to the pandemic.”
“Mortifying and motivating”
Woolf and colleagues estimate that more than 225,000 excess deaths occurred in recent months; this represents a 20% increase over expected deaths, note Harvey V. Fineberg, MD, PhD, of the Gordon and Betty Moore Foundation, in an accompanying editorial in JAMA.
“Importantly, a condition such as COVID-19 can contribute both directly and indirectly to excess mortality,” he writes.
Although the direct contribution to the mortality rates by those infected is straightforward, “the indirect contribution may relate to circumstances or choices due to the COVID-19 pandemic: for example, a patient who develops symptoms of a stroke is too concerned about COVID-19 to go to the emergency department, and a potentially reversible condition becomes fatal.”
Fineberg notes that “a general indication of the death toll from COVID-19 and the excess deaths related to the pandemic, as presented by Woolf et al, are sufficiently mortifying and motivating.”
“Profound human toll”
“The importance of the estimate by Woolf et al – which suggests that for the entirety of 2020, more than 400,000 excess deaths will occur – cannot be overstated, because it accounts for what could be declines in some causes of death, like motor vehicle crashes, but increases in others, like myocardial infarction,” write Howard Bauchner, MD, editor in chief of JAMA, and Phil B. Fontanarosa, MD, MBA, executive editor of JAMA, in another accompanying editorial.
“These deaths reflect a true measure of the human cost of the Great Pandemic of 2020,” they add.
The study from Emanuel and Bilinski was notable for calculating the excess COVID-19 and all-cause mortality to Sept. 2020, they note. “After the initial peak in early spring, US death rates from COVID-19 and from all causes remained higher than rates in countries with high COVID-19 mortality.”
“Few people will forget the Great Pandemic of 2020, where and how they lived, how it substantially changed their lives, and for many, the profound human toll it has taken,” Bauchner and Fontanarosa write.
The study by Woolf and colleagues was supported by National Center for Advancing Translational Sciences, the National Institute on Aging, and the National Institute of Allergy and Infectious Diseases. The study by Bilinski and Emanuel was partially funded by the Colton Foundation. Woolf, Emanuel, Fineberg, Bauchner, and Fontanarosa have disclosed no relevant financial relationships.
This article first appeared on Medscape.com.
Ruling out PE in pregnancy
ILLUSTRATIVE CASE
A 28-year-old G2P1001 at 28 weeks’ gestation presents to your clinic with 1 day of dyspnea and palpitations. Her pregnancy has been otherwise uncomplicated. She reports worsening dyspnea with mild exertion but denies other symptoms, including leg swelling.
The current incidence of venous thromboembolism (VTE) in pregnant women is estimated to be a relatively low 5 to 12 events per 10,000 pregnancies, yet the condition is the leading cause of maternal mortality in developed countries.2,3,4 Currently, there are conflicting recommendations among relevant organization guidelines regarding the use of D-dimer testing to aid in the diagnosis of pulmonary embolism (PE) during pregnancy. Both the Working Group in Women’s Health of the Society of Thrombosis and Haemostasis (GTH) and the European Society of Cardiology (ESC) recommend using D-dimer testing to rule out PE in pregnant women (ESC Class IIa, level of evidence B based on small studies, retrospective studies, and observational studies; GTH provides no grade).5,6
Conversely, the Royal College of Obstetricians and Gynaecologists (RCOG), the Society of Obstetricians and Gynaecologists of Canada (SOGC), and the American Thoracic Society (ATS)/Society of Thoracic Radiology recommend against the use of D-dimer testing in pregnant women because pregnant women were excluded from D-dimer validation studies (RCOG and SOGC Grade D; ATS weak recommendation).4,7,8 The American College of Obstetricians and Gynecologists does not have specific recommendations regarding the use of D-dimer testing during pregnancy, but has endorsed the ATS guidelines.4,9 In addition, SOGC recommends against the use of clinical prediction scores (Grade D), and RCOG states that there is no evidence to support their use (Grade C).7,8 The remaining societies do not make a recommendation for or against the use of clinical prediction scores because of the absence of high-quality evidence regarding their use in the pregnant patient population.4,5,6
STUDY SUMMARY
Prospective validation of a strategy to diagnose PE in pregnant women
This multicenter, multinational, prospective diagnostic study involving 395 pregnant women evaluated the accuracy of PE diagnosis across 11 centers in France and Switzerland from August 2008 through July 2016.1 Patients with clinically suspected PE were evaluated in emergency departments. Patients were tested according to a diagnostic algorithm that included pretest clinical probability using the revised Geneva Score for Pulmonary Embolism (www.mdcalc.com/geneva-score-revised-pulmonary-embolism), a clinical prediction tool that uses patient history, presenting symptoms, and clinical signs to classify patients as being at low (0-3/25), intermediate (4-10/25), or high (≥ 11/25) risk;10 high-sensitivity D-dimer testing; bilateral lower limb compression ultrasonography (CUS); computed tomography pulmonary angiography (CTPA); and a ventilation-perfusion (V/Q) scan.
PE was excluded in patients who had a low or intermediate pretest clinical probability score and a negative D-dimer test result (< 500 mcg/L). Patients with a high pretest probability score or positive D-dimer test result underwent CUS, and, if negative, subsequent CTPA. A V/Q scan was performed if the CTPA was inconclusive. If the work-up was negative, PE was excluded.
Untreated pregnant women had clinical follow-up at 3 months. Any cases of suspected VTE were evaluated by a 3-member independent adjudication committee blinded to the initial diagnostic work-up. The primary outcome was the rate of adjudicated VTE events during the 3-month follow-up period. PE was diagnosed in 28 patients (7.1%) and excluded in 367 (clinical probability score and negative D-dimer test result [n = 46], negative CTPA result [n = 290], normal or low-probability V/Q scan [n = 17], and other reason [n = 14]). Twenty-two women received anticoagulation during the follow-up period for other reasons (mainly history of previous VTE disease). No symptomatic VTE events occurred in any of the women after the diagnostic work-up was negative, including among those patients who were ruled out with only the clinical prediction tool and a negative D-dimer test result (rate 0.0%; 95% confidence interval [CI], 0.0%-1%).
WHAT’S NEW
Clinical probability and D-dimer rule out PE in pregnant women
This study ruled out PE in patients with low/intermediate risk as determined by the revised Geneva score and a D-dimer test, enabling patients to avoid further diagnostic testing. This low-cost strategy can be applied easily to the pregnant population.
CAVEATS
Additional research is still needed
From the results of this study, 11.6% of patients (n = 46) had a PE ruled out utilizing the revised Geneva score in conjunction with a D-dimer test result, with avoidance of chest imaging. However, this study was powered for the entire treatment algorithm and was not specifically powered for patients with low- or intermediate-risk pretest probability scores. Since this is the first published prospective diagnostic study of VTE in pregnancy, further research is needed to confirm the findings that a clinical prediction tool and a negative D-dimer test result can safely rule out PE in pregnant women.
In addition, further research is needed to determine pregnancy-adapted D-dimer cut-off values, as the researchers of this study noted that < 500 mcg/L was useful in the first and second trimester, but that levels increased as gestational age increased.
CHALLENGES TO IMPLEMENTATION
None to speak of
Implementing a diagnostic algorithm that incorporates sequential assessment of pretest clinical probability based on the revised Geneva score and a D-dimer measurement should be relatively easy to implement, as both methods are readily available and relatively inexpensive.
ACKNOWLEDGEMENT
The PURLs Surveillance System was supported in part by Grant Number UL1RR024999 from the National Center For Research Resources, a Clinical Translational Science Award to the University of Chicago. The content is solely the responsibility of the authors and does not necessarily represent the official views of the National Center For Research Resources or the National Institutes of Health.
1. Righini M, Robert-Ebadi H, Elias A, et al. Diagnosis of pulmonary embolism during pregnancy. A multicenter prospective management outcome study. Ann Intern Med. 2018;169:766-773.
2. Knight M, Kenyon S, Brocklehurst P, et al. Saving lives, improving mothers’ care: lessons learned to inform future maternity care from the UK and Ireland confidential enquiries into maternal deaths and morbidity 2009-2012. Oxford: National Perinatal Epidemiology Unit, University of Oxford; 2014.
3. Bourjeily G, Paidas M, Khalil H, et al. Pulmonary embolism in pregnancy. Lancet. 2010;375:500-512.
4. Leung AN, Bull TM, Jaeschke R, et al. An official American Thoracic Society/Society of Thoracic Radiology clinical practice guideline: evaluation of suspected pulmonary embolism in pregnancy. Am J Resp Crit Care Med. 2011;184:1200-1208.
5. Konstantinides SV, Meyer G, Becattini C, et al. 2019 ESC Guidelines for the diagnosis and management of acute pulmonary embolism developed in collaboration with the European Respiratory Society (ERS). Eur Heart J. 2020;41:543-603.
6. Linnemann B, Bauersachs R, Rott H, et al. Working Group in Women’s Health of the Society of Thrombosis and Haemostasis. Diagnosis of pregnancy-associated venous thromboembolism-position paper of the Working Group in Women’s Health of the Society of Thrombosis and Haemostasis (GTH). Vasa. 2016;45:87-101.
7. Royal College of Obstetricians & Gynaecologists. Thromboembolic disease in pregnancy and the puerperium: acute management. Green‐top Guideline No. 37b. April 2015.
8. Chan WS, Rey E, Kent NE, et al. Venous thromboembolism and antithrombotic therapy in pregnancy. J Obstet Gynaecol Can. 2014;36:527-553.
9. James A, Birsner M, Kaimal A, American College of Obstetricians and Gynecologists’ Committee on Practice Bulletins‐Obstetrics. ACOG Practice Bulletin No. 196: thromboembolism in pregnancy. Obstet Gynecol. 2018;132:e1-e17.
10. Le Gal G, Righini M, Roy PM, et al. Prediction of pulmonary embolism in the emergency department: the revised Geneva score. Ann Intern Med. 2006;144:165-171.
ILLUSTRATIVE CASE
A 28-year-old G2P1001 at 28 weeks’ gestation presents to your clinic with 1 day of dyspnea and palpitations. Her pregnancy has been otherwise uncomplicated. She reports worsening dyspnea with mild exertion but denies other symptoms, including leg swelling.
The current incidence of venous thromboembolism (VTE) in pregnant women is estimated to be a relatively low 5 to 12 events per 10,000 pregnancies, yet the condition is the leading cause of maternal mortality in developed countries.2,3,4 Currently, there are conflicting recommendations among relevant organization guidelines regarding the use of D-dimer testing to aid in the diagnosis of pulmonary embolism (PE) during pregnancy. Both the Working Group in Women’s Health of the Society of Thrombosis and Haemostasis (GTH) and the European Society of Cardiology (ESC) recommend using D-dimer testing to rule out PE in pregnant women (ESC Class IIa, level of evidence B based on small studies, retrospective studies, and observational studies; GTH provides no grade).5,6
Conversely, the Royal College of Obstetricians and Gynaecologists (RCOG), the Society of Obstetricians and Gynaecologists of Canada (SOGC), and the American Thoracic Society (ATS)/Society of Thoracic Radiology recommend against the use of D-dimer testing in pregnant women because pregnant women were excluded from D-dimer validation studies (RCOG and SOGC Grade D; ATS weak recommendation).4,7,8 The American College of Obstetricians and Gynecologists does not have specific recommendations regarding the use of D-dimer testing during pregnancy, but has endorsed the ATS guidelines.4,9 In addition, SOGC recommends against the use of clinical prediction scores (Grade D), and RCOG states that there is no evidence to support their use (Grade C).7,8 The remaining societies do not make a recommendation for or against the use of clinical prediction scores because of the absence of high-quality evidence regarding their use in the pregnant patient population.4,5,6
STUDY SUMMARY
Prospective validation of a strategy to diagnose PE in pregnant women
This multicenter, multinational, prospective diagnostic study involving 395 pregnant women evaluated the accuracy of PE diagnosis across 11 centers in France and Switzerland from August 2008 through July 2016.1 Patients with clinically suspected PE were evaluated in emergency departments. Patients were tested according to a diagnostic algorithm that included pretest clinical probability using the revised Geneva Score for Pulmonary Embolism (www.mdcalc.com/geneva-score-revised-pulmonary-embolism), a clinical prediction tool that uses patient history, presenting symptoms, and clinical signs to classify patients as being at low (0-3/25), intermediate (4-10/25), or high (≥ 11/25) risk;10 high-sensitivity D-dimer testing; bilateral lower limb compression ultrasonography (CUS); computed tomography pulmonary angiography (CTPA); and a ventilation-perfusion (V/Q) scan.
PE was excluded in patients who had a low or intermediate pretest clinical probability score and a negative D-dimer test result (< 500 mcg/L). Patients with a high pretest probability score or positive D-dimer test result underwent CUS, and, if negative, subsequent CTPA. A V/Q scan was performed if the CTPA was inconclusive. If the work-up was negative, PE was excluded.
Untreated pregnant women had clinical follow-up at 3 months. Any cases of suspected VTE were evaluated by a 3-member independent adjudication committee blinded to the initial diagnostic work-up. The primary outcome was the rate of adjudicated VTE events during the 3-month follow-up period. PE was diagnosed in 28 patients (7.1%) and excluded in 367 (clinical probability score and negative D-dimer test result [n = 46], negative CTPA result [n = 290], normal or low-probability V/Q scan [n = 17], and other reason [n = 14]). Twenty-two women received anticoagulation during the follow-up period for other reasons (mainly history of previous VTE disease). No symptomatic VTE events occurred in any of the women after the diagnostic work-up was negative, including among those patients who were ruled out with only the clinical prediction tool and a negative D-dimer test result (rate 0.0%; 95% confidence interval [CI], 0.0%-1%).
WHAT’S NEW
Clinical probability and D-dimer rule out PE in pregnant women
This study ruled out PE in patients with low/intermediate risk as determined by the revised Geneva score and a D-dimer test, enabling patients to avoid further diagnostic testing. This low-cost strategy can be applied easily to the pregnant population.
CAVEATS
Additional research is still needed
From the results of this study, 11.6% of patients (n = 46) had a PE ruled out utilizing the revised Geneva score in conjunction with a D-dimer test result, with avoidance of chest imaging. However, this study was powered for the entire treatment algorithm and was not specifically powered for patients with low- or intermediate-risk pretest probability scores. Since this is the first published prospective diagnostic study of VTE in pregnancy, further research is needed to confirm the findings that a clinical prediction tool and a negative D-dimer test result can safely rule out PE in pregnant women.
In addition, further research is needed to determine pregnancy-adapted D-dimer cut-off values, as the researchers of this study noted that < 500 mcg/L was useful in the first and second trimester, but that levels increased as gestational age increased.
CHALLENGES TO IMPLEMENTATION
None to speak of
Implementing a diagnostic algorithm that incorporates sequential assessment of pretest clinical probability based on the revised Geneva score and a D-dimer measurement should be relatively easy to implement, as both methods are readily available and relatively inexpensive.
ACKNOWLEDGEMENT
The PURLs Surveillance System was supported in part by Grant Number UL1RR024999 from the National Center For Research Resources, a Clinical Translational Science Award to the University of Chicago. The content is solely the responsibility of the authors and does not necessarily represent the official views of the National Center For Research Resources or the National Institutes of Health.
1. Righini M, Robert-Ebadi H, Elias A, et al. Diagnosis of pulmonary embolism during pregnancy. A multicenter prospective management outcome study. Ann Intern Med. 2018;169:766-773.
2. Knight M, Kenyon S, Brocklehurst P, et al. Saving lives, improving mothers’ care: lessons learned to inform future maternity care from the UK and Ireland confidential enquiries into maternal deaths and morbidity 2009-2012. Oxford: National Perinatal Epidemiology Unit, University of Oxford; 2014.
3. Bourjeily G, Paidas M, Khalil H, et al. Pulmonary embolism in pregnancy. Lancet. 2010;375:500-512.
4. Leung AN, Bull TM, Jaeschke R, et al. An official American Thoracic Society/Society of Thoracic Radiology clinical practice guideline: evaluation of suspected pulmonary embolism in pregnancy. Am J Resp Crit Care Med. 2011;184:1200-1208.
5. Konstantinides SV, Meyer G, Becattini C, et al. 2019 ESC Guidelines for the diagnosis and management of acute pulmonary embolism developed in collaboration with the European Respiratory Society (ERS). Eur Heart J. 2020;41:543-603.
6. Linnemann B, Bauersachs R, Rott H, et al. Working Group in Women’s Health of the Society of Thrombosis and Haemostasis. Diagnosis of pregnancy-associated venous thromboembolism-position paper of the Working Group in Women’s Health of the Society of Thrombosis and Haemostasis (GTH). Vasa. 2016;45:87-101.
7. Royal College of Obstetricians & Gynaecologists. Thromboembolic disease in pregnancy and the puerperium: acute management. Green‐top Guideline No. 37b. April 2015.
8. Chan WS, Rey E, Kent NE, et al. Venous thromboembolism and antithrombotic therapy in pregnancy. J Obstet Gynaecol Can. 2014;36:527-553.
9. James A, Birsner M, Kaimal A, American College of Obstetricians and Gynecologists’ Committee on Practice Bulletins‐Obstetrics. ACOG Practice Bulletin No. 196: thromboembolism in pregnancy. Obstet Gynecol. 2018;132:e1-e17.
10. Le Gal G, Righini M, Roy PM, et al. Prediction of pulmonary embolism in the emergency department: the revised Geneva score. Ann Intern Med. 2006;144:165-171.
PRACTICE CHANGER
Use a clinical probability score to identify patients at low or intermediate risk for pulmonary embolism (PE) and combine that with a high-sensitivity D-dimer test to rule out PE in pregnant women.
STRENGTH OF RECOMMENDATION
B: Prospective diagnostic management outcome study.1
Righini M, Robert-Ebadi H, Elias A, et al. Diagnosis of pulmonary embolism during pregnancy: a multicenter prospective management outcome study. Ann Intern Med. 2018;169:766-773.1

Fourteen-day sports hiatus recommended for children after COVID-19
Children should not return to sports for 14 days after exposure to COVID-19, and those with moderate symptoms should undergo an electrocardiogram before returning, according to the American Academy of Pediatrics.
said Susannah Briskin, MD, a pediatric sports medicine specialist at Rainbow Babies and Children’s Hospital in Cleveland.
“There has been emerging evidence about cases of myocarditis occurring in athletes, including athletes who are asymptomatic with COVID-19,” she said in an interview.
The update aligns the AAP recommendations with those from the American College of Cardiologists, she added.
Recent imaging studies have turned up signs of myocarditis in athletes recovering from mild or asymptomatic cases of COVID-19 and have prompted calls for clearer guidelines about imaging studies and return to play.
Viral myocarditis poses a risk to athletes because it can lead to potentially fatal arrhythmias, Dr. Briskin said.
Although children benefit from participating in sports, these activities also put them at risk of contracting COVID-19 and spreading it to others, the guidance noted.
To balance the risks and benefits, the academy proposed guidelines that vary depending on the severity of the presentation.
In the first category are patients with a severe presentation (hypotension, arrhythmias, need for intubation or extracorporeal membrane oxygenation support, kidney or cardiac failure) or with multisystem inflammatory syndrome. Clinicians should treat these patients as though they have myocarditis. Patients should be restricted from engaging in sports and other exercise for 3-6 months, the guidance stated.
The primary care physician and “appropriate pediatric medical subspecialist, preferably in consultation with a pediatric cardiologist,” should clear them before they return to activities. In examining patients for return to play, clinicians should focus on cardiac symptoms, including chest pain, shortness of breath, fatigue, palpitations, or syncope, the guidance said.
In another category are patients with cardiac symptoms, those with concerning findings on examination, and those with moderate symptoms of COVID-19, including prolonged fever. These patients should undergo an ECG and possibly be referred to a pediatric cardiologist, the guidelines said. These symptoms must be absent for at least 14 days before these patients can return to sports, and the athletes should obtain clearance from their primary care physicians before they resume.
In a third category are patients who have been infected with SARS-CoV-2 or who have had close contact with someone who was infected but who have not themselves experienced symptoms. These athletes should refrain from sports for at least 14 days, the guidelines said.
Children who don’t fall into any of these categories should not be tested for the virus or antibodies to it before participation in sports, the academy said.
The guidelines don’t vary depending on the sport. But the academy has issued separate guidance for parents and guardians to help them evaluate the risk for COVID-19 transmission by sport.
Athletes participating in “sports that have greater amount of contact time or proximity to people would be at higher risk for contracting COVID-19,” Dr. Briskin said. “But I think that’s all fairly common sense, given the recommendations for non–sport-related activity just in terms of social distancing and masking.”
The new guidance called on sports organizers to minimize contact by, for example, modifying drills and conditioning. It recommended that athletes wear masks except during vigorous exercise or when participating in water sports, as well as in other circumstances in which the mask could become a safety hazard.
They also recommended using handwashing stations or hand sanitizer, avoiding contact with shared surfaces, and avoiding small rooms and areas with poor ventilation.
Dr. Briskin disclosed no relevant financial relationships.
A version of this article originally appeared on Medscape.com.