User login
Things We Do for No Reason™: Fluid Restriction for the Management of Acute Decompensated Heart Failure in Patients With Reduced Ejection Fraction
Inspired by the ABIM Foundation’s Choosing Wisely® campaign, the “Things We Do for No Reason™” (TWDFNR) series reviews practices that have become common parts of hospital care but may provide little value to our patients. Practices reviewed in the TWDFNR series do not represent clear-cut conclusions or clinical practice standards but are meant as a starting place for research and active discussions among hospitalists and patients. We invite you to be part of that discussion.
CLINICAL SCENARIO
The hospitalist enters admission orders for an 80-year-old woman with hypertension, coronary artery disease, and heart failure with reduced ejection fraction who presented to the emergency department with weight gain, lower extremity edema, and dyspnea on exertion. She has an elevated jugular venous pressure, crackles on pulmonary exam, and bilateral pitting edema with warm extremities. Labs show a sodium of 140 mmol/L and creatinine of 1.4 mg/dL. After ordering intravenous furosemide for management of acute decompensated heart failure (ADHF), the hospitalist arrives at the nutrition section of the CHF Admission Order Set and reflexively picks an option for a fluid-restricted diet.
BACKGROUND
Patients with ADHF, the leading cause of hospitalization for patients older than 65 years,1 may present with signs and symptoms of volume overload: shortness of breath, lower-extremity swelling, and end-organ dysfunction. Before the 1980s, treatment of ADHF relied on loop diuretics, bedrest, and fluid restriction to minimize congestive symptoms.2 Clinicians based this practice on early theories framing heart failure as primarily an issue of salt and water retention that could be counterbalanced by sodium and fluid restriction.2
Today, hospitalists understand heart failure with reduced ejection fraction (HFrEF) as a heterogenous disease with a shared pathophysiology in which reduced cardiac output, elevated systemic venous pressures, and/or shunting of blood away from the kidneys may all lead to decreased renal perfusion. These phenomena trigger the activation of the renin-angiotensin-aldosterone system (RAAS), leading to sodium and water retention and fluid redistribution.2 As part of the modern day treatment regimen, providers continue to place patients on fluid-restricted diets. Guidelines support this practice.3,4
Since most of the existing literature on the topic of fluid restriction in ADHF relates to HFrEF (left ventricular ejection fraction [LVEF] <40%), as opposed to heart failure with a preserved ejection fraction (HFpEF, LVEF ≥50%), this review will focus on HFrEF patients. Limited existing data support extrapolating these arguments to HFpEF patients as well.5
WHY YOU MIGHT THINK FLUID RESTRICTION IS IMPORTANT IN THE MANAGEMENT OF ADHF IN HFREF PATIENTS
Longstanding conventional wisdom and data extrapolation from the chronic heart failure population has undergirded the practice of fluid restriction for ADHF. Current iterations of the American and European heart failure guidelines recommend fluid restriction of 1.5 to 2.0 L/day in severe ADHF as a management strategy.3,4 The American guidelines recommend considering restricting fluid intake to 2 L/day for most hospitalized ADHF patients without hyponatremia or diuretic resistance. The guidelines base the recommendation on clinical experience and data from a single randomized trial evaluating the effects of sodium restriction on heart failure outcomes in outpatients recently admitted for ADHF.4,6 This trial randomly assigned 232 patients with compensated HFrEF to either a normal or low-sodium diet plus oral furosemide. Researchers instructed both groups to adhere to a 1000 mL/day fluid restriction. The authors found a high incidence of readmissions for worsening congestive heart failure among a cohort of patients (n = 54) with a normal sodium diet who were excluded from randomization due to inability to adhere to the prescribed fluid restriction.6 Notably, this study did not evaluate patients receiving treatment for ADHF and was not designed to investigate the role of fluid restriction for the treatment of ADHF.
A subsequent study by the same investigators looked more deliberately, although not singularly, at outpatient fluid restriction. This study randomly assigned 410 patients with compensated HFrEF into eight groups by fluid intake (1 L vs 2 L), salt intake (80 mmol vs 120 mmol), and furosemide dose (125 mg twice daily vs 250 mg twice daily). At 180 days, the group receiving the fluid-restricted diet with higher sodium intake and higher diuretic dose had the lowest risk of hospital readmission.7Results from these studies of the chronic, compensated heart failure population, in conjunction with longstanding conventional wisdom, have influenced the management of patients hospitalized with ADHF.
WHY FLUID RESTRICTION IN THE MANAGEMENT OF ADHF IN HFREF PATIENTS MIGHT NOT BE HELPFUL
From a pathophysiologic perspective, fluid restriction in ADHF may counterproductively lead to RAAS activation.8 Congestion develops when arterial underfilling leads to RAAS activation, triggering sodium and water retention.2 Furthermore, RAAS activation, as measured by plasma levels of renin, angiotensin II, and aldosterone, correlates with prognosis and mortality in chronic HFrEF.9 Analyses from one of the largest databases of biomarkers from ADHF suggest that RAAS is further upregulated during decongestive therapy.10 While researchers have not studied the effects of fluid restriction on RAAS activation in ADHF patients, extrapolating from these data one may question whether fluid restriction in ADHF patients may further drive RAAS activation. Further activation may contribute to adverse incident outcomes such as worsening renal function.
The most relevant and compelling evidence against fluid restriction to date comes from Travers et al,11 who conducted the first randomized controlled trial examining fluid restriction in ADHF patients. Their small study compared restricted (1 L fluid restriction) vs liberal (free fluid) intake in hospitalized patients with ADHF and demonstrated no difference in duration or daily dose of intravenous diuretics, time to symptomatic improvement, total daily fluid output, or average hospitalization weight loss between the two arms. Furthermore, researchers withdrew more patients in the fluid-restricted arm due to a sustained rise in serum creatinine, suggesting potential harm of this intervention.11 The sample size (N = 67) and fluid-intake difference of only 400 mL between the two groups limited the study results.
In a subsequent randomized controlled trial, Aliti et al12 examined the clinical outcomes of even more aggressive fluid restriction (800 mL/day) and sodium restriction (800 mg/day) versus liberal intake (at least 2.5 L fluid/day and approximately 3-5 g sodium/day) in hospitalized patients with ADHF (N = 75). While this study evaluated both fluid and sodium restriction, it produced relevant results. The study demonstrated no significant difference in weight loss, use of diuretics, or rehospitalization between the study arms.12 At 30-day follow-up, researchers found that patients in the intervention group had more congestion and an increased likelihood of having a B-type natriuretic peptide (BNP) level greater than 700 pg/mL. In the subset of all patients with an elevated BNP level greater than 700 pg/mL at the end of the study, patients in the intervention group had a significantly higher rate of readmission (7 out of 22) compared with controls (1 of 20). Moreover, the fluid-restricted group had 50% higher perceived thirst values compared to the control group.12 The sensation of thirst not only reduces quality of life, but, given that angiotensin II stimulates thirst, it may reflect RAAS activation.13 For these reasons, clinicians should consider this side effect seriously, especially when the literature lacks evidence of the benefits from fluid restriction.
WHEN FLUID RESTRICTION IS HELPFUL IN THE MANAGEMENT OF DECOMPENSATED HEART FAILURE IN HFREF PATIENTS
Fluid-restrict patients who have chronic hyponatremia (Na <135 mmol/L) due to end-stage HFrEF in select circumstances. Hyponatremia develops in heart failure primarily because of the body’s inability to excrete free water due to non-osmotic arginine vasopressin secretion.4 Other processes contribute to hyponatremia, including increased free water intake due to angiotensin II stimulating thirst and decreased glomerular filtration rate limiting the kidney’s ability to excrete free water. Since hyponatremia in heart failure primarily occurs due to derangements of free water regulation, limiting free water intake may help; the American College of Cardiology/American Heart Association and European heart failure guidelines explicitly recommend this strategy for patients with stage D heart failure.3,4 However, no available randomized data support this practice, and observational data suggest that fluid restriction has limited impact on hyponatremia in ADHF.14 Guidelines also suggest employing fluid restriction in patients with diuretic resistance as an adjunctive therapy.
Twenty-nine percent of patients with ADHF have comorbid chronic kidney disease (CKD).15 Providers often prescribe patients with advanced CKD salt- and fluid-restrictive diets due to more limited abilities in sodium and free water excretion. However, no studies have examined the effects of fluid restriction alone without salt restriction in the CKD/ADHF population.
WHAT YOU SHOULD DO INSTEAD
In the present day of evidence-based pharmacologic therapies, research indicates that fluid-restriction does not help and potentially may harm. Instead, treat hospitalized HFrEF patients with ADHF with modern, evidence-based pharmacologic therapies and allow the patients to drink when thirsty.
RECOMMENDATIONS
- Treat patients with ADHF and reduced ejection fraction with evidence-based neurohormonal blockade and initiate loop diuretics to alleviate congestion.
- Allow patients with ADHF and reduced ejection fraction to drink when thirsty in the absence of hyponatremia.
- Consider initiating fluid restriction in patients with ADHF and concurrent hyponatremia and/or diuretic resistance. There is little evidence to guide setting specific limits on fluid intake.
CONCLUSION
The hospitalist starts the patient admitted for ADHF on an intravenous loop diuretic, continues her home beta blocker and angiotensin-converting enzyme inhibitor, and does not impose any fluid restriction. Her symptoms of congestion resolve, and she is discharged.
Hospitalists often treat patients with ADHF and reduced ejection fraction with fluid restriction. However, limited evidence supports this practice as part of the management of ADHF. Fluid restriction may have unintended adverse effects of increasing thirst and worsening renal function and quality of life.
What do you do? Do you think this is a low-value practice? Is this truly a “Thing We Do for No Reason”? Let us know what you do in your practice and propose ideas for other “Things We Do for No Reason” topics. Please join in the conversation online at Twitter (#TWDFNR)/Facebook and don’t forget to “Like It” on Facebook or retweet it on Twitter.
1. Mozaffarian D, Benjamin EJ, Go AS, et al; American Heart Association Statistics Committee and Stroke Statistics Subcommittee. Heart disease and stroke statistics—2015 update: a report from the American Heart Association. Circulation. 2015;131(4):e29-322. https://doi.org/10.1161/cir.0000000000000152
2. Arrigo M, Parissis JT, Akiyama E, Mebazaa A. Understanding acute heart failure: pathophysiology and diagnosis. Eur Heart J Suppl. 2016;18(Suppl G):G11-G18. https://doi.org/10.1093/eurheartj/suw044
3. Ponikowski P, Voors AA, Anker SD, et al. 2016 ESC Guidelines for the diagnosis and treatment of acute and chronic heart failure. Eur J Heart Fail. 2016;18(8):891-975. https://doi.org/10.1002/ejhf.592
4. Yancy CW, Jessup M, Bozkurt B, et al; American College of Cardiology Foundation; American Heart Association Task Force on Practice Guidelines. 2013 ACCF/AHA guideline for the management of heart failure. J Am Coll Cardiol. 2013;62(16):e147-e239. https://doi.org/10.1016/j.jacc.2013.05.019
5. Machado d’Almeida KS, Rabelo-Silva ER, Souza GC, et al. Aggressive fluid and sodium restriction in decompensated heart failure with preserved ejection fraction: results from a randomized clinical trial. Nutrition. 2018;54:111-117. https://doi.org/10.1016/j.nut.2018.02.007
6. Paterna S, Gaspare P, Fasullo S, Sarullo FM, Di Pasquale P. Normal-sodium diet compared with low-sodium diet in compensated congestive heart failure: is sodium an old enemy or a new friend? Clin Sci (Lond). 2008;114(3):221-230. https://doi.org/10.1042/cs20070193
7. Paterna S, Parrinello G, Cannizzaro S, et al. Medium term effects of different dosage of diuretic, sodium, and fluid administration on neurohormonal and clinical outcome in patients with recently compensated heart failure. Am J Cardiol. 2009;103(1):93-102. https://doi.org/10.1016/j.amjcard.2008.08.043
8. Shore AC, Markandu ND, Sagnella GA, et al. Endocrine and renal response to water loading and water restriction in normal man. Clin Sci (Lond). 1988;75(2):171-177. https://doi.org/10.1042/cs0750171
9. Oliveros E, Oni ET, Shahzad A, et al. Benefits and risks of continuing angiotensin-converting enzyme inhibitors, angiotensin II receptor antagonists, and mineralocorticoid receptor antagonists during hospitalizations for acute heart failure. Cardiorenal Med. 2020;10(2):69-84. https://doi.org/10.1159/000504167
10. Mentz RJ, Stevens SR, DeVore AD, et al. Decongestion strategies and renin-angiotensin-aldosterone system activation in acute heart failure. JACC Heart Fail. 2015;3(2):97-107. https://doi.org/10.1016/j.jchf.2014.09.003
11. Travers B, O’Loughlin C, Murphy NF, et al. Fluid restriction in the management of decompensated heart failure: no impact on time to clinical stability. J Card Fail. 2007;13(2):128-132. https://doi.org/10.1016/j.cardfail.2006.10.012
12. Aliti GB, Rabelo ER, Clausell N, Rohde LE, Biolo A, Beck-da-Silva L. Aggressive fluid and sodium restriction in acute decompensated heart failure: a randomized clinical trial. JAMA Intern Med. 2013;173(12):1058-1064. https://doi.org/10.1001/jamainternmed.2013.552
13. Jao GT, Chiong JR. Hyponatremia in acute decompensated heart failure: mechanisms, prognosis, and treatment options. Clin Cardiol. 2010;33(11):666-671. https://doi.org/10.1002/clc.20822
14. Nagler EV, Haller MC, Van Biesen W, Vanholder R, Craig JC, Webster AC. Interventions for chronic non-hypovolaemic hypotonic hyponatraemia. Cochrane Database Syst Rev. 2018;28(6):CD010965. https://doi.org/10.1002/14651858.cd010965.pub2
15. Fonarow GC; ADHERE Scientific Advisory Committee. The Acute Decompensated Heart Failure National Registry (ADHERE): opportunities to improve care of patients hospitalized with acute decompensated heart failure. Rev Cardiovasc Med. 2003;4(Suppl 7):S21-S30.
Inspired by the ABIM Foundation’s Choosing Wisely® campaign, the “Things We Do for No Reason™” (TWDFNR) series reviews practices that have become common parts of hospital care but may provide little value to our patients. Practices reviewed in the TWDFNR series do not represent clear-cut conclusions or clinical practice standards but are meant as a starting place for research and active discussions among hospitalists and patients. We invite you to be part of that discussion.
CLINICAL SCENARIO
The hospitalist enters admission orders for an 80-year-old woman with hypertension, coronary artery disease, and heart failure with reduced ejection fraction who presented to the emergency department with weight gain, lower extremity edema, and dyspnea on exertion. She has an elevated jugular venous pressure, crackles on pulmonary exam, and bilateral pitting edema with warm extremities. Labs show a sodium of 140 mmol/L and creatinine of 1.4 mg/dL. After ordering intravenous furosemide for management of acute decompensated heart failure (ADHF), the hospitalist arrives at the nutrition section of the CHF Admission Order Set and reflexively picks an option for a fluid-restricted diet.
BACKGROUND
Patients with ADHF, the leading cause of hospitalization for patients older than 65 years,1 may present with signs and symptoms of volume overload: shortness of breath, lower-extremity swelling, and end-organ dysfunction. Before the 1980s, treatment of ADHF relied on loop diuretics, bedrest, and fluid restriction to minimize congestive symptoms.2 Clinicians based this practice on early theories framing heart failure as primarily an issue of salt and water retention that could be counterbalanced by sodium and fluid restriction.2
Today, hospitalists understand heart failure with reduced ejection fraction (HFrEF) as a heterogenous disease with a shared pathophysiology in which reduced cardiac output, elevated systemic venous pressures, and/or shunting of blood away from the kidneys may all lead to decreased renal perfusion. These phenomena trigger the activation of the renin-angiotensin-aldosterone system (RAAS), leading to sodium and water retention and fluid redistribution.2 As part of the modern day treatment regimen, providers continue to place patients on fluid-restricted diets. Guidelines support this practice.3,4
Since most of the existing literature on the topic of fluid restriction in ADHF relates to HFrEF (left ventricular ejection fraction [LVEF] <40%), as opposed to heart failure with a preserved ejection fraction (HFpEF, LVEF ≥50%), this review will focus on HFrEF patients. Limited existing data support extrapolating these arguments to HFpEF patients as well.5
WHY YOU MIGHT THINK FLUID RESTRICTION IS IMPORTANT IN THE MANAGEMENT OF ADHF IN HFREF PATIENTS
Longstanding conventional wisdom and data extrapolation from the chronic heart failure population has undergirded the practice of fluid restriction for ADHF. Current iterations of the American and European heart failure guidelines recommend fluid restriction of 1.5 to 2.0 L/day in severe ADHF as a management strategy.3,4 The American guidelines recommend considering restricting fluid intake to 2 L/day for most hospitalized ADHF patients without hyponatremia or diuretic resistance. The guidelines base the recommendation on clinical experience and data from a single randomized trial evaluating the effects of sodium restriction on heart failure outcomes in outpatients recently admitted for ADHF.4,6 This trial randomly assigned 232 patients with compensated HFrEF to either a normal or low-sodium diet plus oral furosemide. Researchers instructed both groups to adhere to a 1000 mL/day fluid restriction. The authors found a high incidence of readmissions for worsening congestive heart failure among a cohort of patients (n = 54) with a normal sodium diet who were excluded from randomization due to inability to adhere to the prescribed fluid restriction.6 Notably, this study did not evaluate patients receiving treatment for ADHF and was not designed to investigate the role of fluid restriction for the treatment of ADHF.
A subsequent study by the same investigators looked more deliberately, although not singularly, at outpatient fluid restriction. This study randomly assigned 410 patients with compensated HFrEF into eight groups by fluid intake (1 L vs 2 L), salt intake (80 mmol vs 120 mmol), and furosemide dose (125 mg twice daily vs 250 mg twice daily). At 180 days, the group receiving the fluid-restricted diet with higher sodium intake and higher diuretic dose had the lowest risk of hospital readmission.7Results from these studies of the chronic, compensated heart failure population, in conjunction with longstanding conventional wisdom, have influenced the management of patients hospitalized with ADHF.
WHY FLUID RESTRICTION IN THE MANAGEMENT OF ADHF IN HFREF PATIENTS MIGHT NOT BE HELPFUL
From a pathophysiologic perspective, fluid restriction in ADHF may counterproductively lead to RAAS activation.8 Congestion develops when arterial underfilling leads to RAAS activation, triggering sodium and water retention.2 Furthermore, RAAS activation, as measured by plasma levels of renin, angiotensin II, and aldosterone, correlates with prognosis and mortality in chronic HFrEF.9 Analyses from one of the largest databases of biomarkers from ADHF suggest that RAAS is further upregulated during decongestive therapy.10 While researchers have not studied the effects of fluid restriction on RAAS activation in ADHF patients, extrapolating from these data one may question whether fluid restriction in ADHF patients may further drive RAAS activation. Further activation may contribute to adverse incident outcomes such as worsening renal function.
The most relevant and compelling evidence against fluid restriction to date comes from Travers et al,11 who conducted the first randomized controlled trial examining fluid restriction in ADHF patients. Their small study compared restricted (1 L fluid restriction) vs liberal (free fluid) intake in hospitalized patients with ADHF and demonstrated no difference in duration or daily dose of intravenous diuretics, time to symptomatic improvement, total daily fluid output, or average hospitalization weight loss between the two arms. Furthermore, researchers withdrew more patients in the fluid-restricted arm due to a sustained rise in serum creatinine, suggesting potential harm of this intervention.11 The sample size (N = 67) and fluid-intake difference of only 400 mL between the two groups limited the study results.
In a subsequent randomized controlled trial, Aliti et al12 examined the clinical outcomes of even more aggressive fluid restriction (800 mL/day) and sodium restriction (800 mg/day) versus liberal intake (at least 2.5 L fluid/day and approximately 3-5 g sodium/day) in hospitalized patients with ADHF (N = 75). While this study evaluated both fluid and sodium restriction, it produced relevant results. The study demonstrated no significant difference in weight loss, use of diuretics, or rehospitalization between the study arms.12 At 30-day follow-up, researchers found that patients in the intervention group had more congestion and an increased likelihood of having a B-type natriuretic peptide (BNP) level greater than 700 pg/mL. In the subset of all patients with an elevated BNP level greater than 700 pg/mL at the end of the study, patients in the intervention group had a significantly higher rate of readmission (7 out of 22) compared with controls (1 of 20). Moreover, the fluid-restricted group had 50% higher perceived thirst values compared to the control group.12 The sensation of thirst not only reduces quality of life, but, given that angiotensin II stimulates thirst, it may reflect RAAS activation.13 For these reasons, clinicians should consider this side effect seriously, especially when the literature lacks evidence of the benefits from fluid restriction.
WHEN FLUID RESTRICTION IS HELPFUL IN THE MANAGEMENT OF DECOMPENSATED HEART FAILURE IN HFREF PATIENTS
Fluid-restrict patients who have chronic hyponatremia (Na <135 mmol/L) due to end-stage HFrEF in select circumstances. Hyponatremia develops in heart failure primarily because of the body’s inability to excrete free water due to non-osmotic arginine vasopressin secretion.4 Other processes contribute to hyponatremia, including increased free water intake due to angiotensin II stimulating thirst and decreased glomerular filtration rate limiting the kidney’s ability to excrete free water. Since hyponatremia in heart failure primarily occurs due to derangements of free water regulation, limiting free water intake may help; the American College of Cardiology/American Heart Association and European heart failure guidelines explicitly recommend this strategy for patients with stage D heart failure.3,4 However, no available randomized data support this practice, and observational data suggest that fluid restriction has limited impact on hyponatremia in ADHF.14 Guidelines also suggest employing fluid restriction in patients with diuretic resistance as an adjunctive therapy.
Twenty-nine percent of patients with ADHF have comorbid chronic kidney disease (CKD).15 Providers often prescribe patients with advanced CKD salt- and fluid-restrictive diets due to more limited abilities in sodium and free water excretion. However, no studies have examined the effects of fluid restriction alone without salt restriction in the CKD/ADHF population.
WHAT YOU SHOULD DO INSTEAD
In the present day of evidence-based pharmacologic therapies, research indicates that fluid-restriction does not help and potentially may harm. Instead, treat hospitalized HFrEF patients with ADHF with modern, evidence-based pharmacologic therapies and allow the patients to drink when thirsty.
RECOMMENDATIONS
- Treat patients with ADHF and reduced ejection fraction with evidence-based neurohormonal blockade and initiate loop diuretics to alleviate congestion.
- Allow patients with ADHF and reduced ejection fraction to drink when thirsty in the absence of hyponatremia.
- Consider initiating fluid restriction in patients with ADHF and concurrent hyponatremia and/or diuretic resistance. There is little evidence to guide setting specific limits on fluid intake.
CONCLUSION
The hospitalist starts the patient admitted for ADHF on an intravenous loop diuretic, continues her home beta blocker and angiotensin-converting enzyme inhibitor, and does not impose any fluid restriction. Her symptoms of congestion resolve, and she is discharged.
Hospitalists often treat patients with ADHF and reduced ejection fraction with fluid restriction. However, limited evidence supports this practice as part of the management of ADHF. Fluid restriction may have unintended adverse effects of increasing thirst and worsening renal function and quality of life.
What do you do? Do you think this is a low-value practice? Is this truly a “Thing We Do for No Reason”? Let us know what you do in your practice and propose ideas for other “Things We Do for No Reason” topics. Please join in the conversation online at Twitter (#TWDFNR)/Facebook and don’t forget to “Like It” on Facebook or retweet it on Twitter.
1. Mozaffarian D, Benjamin EJ, Go AS, et al; American Heart Association Statistics Committee and Stroke Statistics Subcommittee. Heart disease and stroke statistics—2015 update: a report from the American Heart Association. Circulation. 2015;131(4):e29-322. https://doi.org/10.1161/cir.0000000000000152
2. Arrigo M, Parissis JT, Akiyama E, Mebazaa A. Understanding acute heart failure: pathophysiology and diagnosis. Eur Heart J Suppl. 2016;18(Suppl G):G11-G18. https://doi.org/10.1093/eurheartj/suw044
3. Ponikowski P, Voors AA, Anker SD, et al. 2016 ESC Guidelines for the diagnosis and treatment of acute and chronic heart failure. Eur J Heart Fail. 2016;18(8):891-975. https://doi.org/10.1002/ejhf.592
4. Yancy CW, Jessup M, Bozkurt B, et al; American College of Cardiology Foundation; American Heart Association Task Force on Practice Guidelines. 2013 ACCF/AHA guideline for the management of heart failure. J Am Coll Cardiol. 2013;62(16):e147-e239. https://doi.org/10.1016/j.jacc.2013.05.019
5. Machado d’Almeida KS, Rabelo-Silva ER, Souza GC, et al. Aggressive fluid and sodium restriction in decompensated heart failure with preserved ejection fraction: results from a randomized clinical trial. Nutrition. 2018;54:111-117. https://doi.org/10.1016/j.nut.2018.02.007
6. Paterna S, Gaspare P, Fasullo S, Sarullo FM, Di Pasquale P. Normal-sodium diet compared with low-sodium diet in compensated congestive heart failure: is sodium an old enemy or a new friend? Clin Sci (Lond). 2008;114(3):221-230. https://doi.org/10.1042/cs20070193
7. Paterna S, Parrinello G, Cannizzaro S, et al. Medium term effects of different dosage of diuretic, sodium, and fluid administration on neurohormonal and clinical outcome in patients with recently compensated heart failure. Am J Cardiol. 2009;103(1):93-102. https://doi.org/10.1016/j.amjcard.2008.08.043
8. Shore AC, Markandu ND, Sagnella GA, et al. Endocrine and renal response to water loading and water restriction in normal man. Clin Sci (Lond). 1988;75(2):171-177. https://doi.org/10.1042/cs0750171
9. Oliveros E, Oni ET, Shahzad A, et al. Benefits and risks of continuing angiotensin-converting enzyme inhibitors, angiotensin II receptor antagonists, and mineralocorticoid receptor antagonists during hospitalizations for acute heart failure. Cardiorenal Med. 2020;10(2):69-84. https://doi.org/10.1159/000504167
10. Mentz RJ, Stevens SR, DeVore AD, et al. Decongestion strategies and renin-angiotensin-aldosterone system activation in acute heart failure. JACC Heart Fail. 2015;3(2):97-107. https://doi.org/10.1016/j.jchf.2014.09.003
11. Travers B, O’Loughlin C, Murphy NF, et al. Fluid restriction in the management of decompensated heart failure: no impact on time to clinical stability. J Card Fail. 2007;13(2):128-132. https://doi.org/10.1016/j.cardfail.2006.10.012
12. Aliti GB, Rabelo ER, Clausell N, Rohde LE, Biolo A, Beck-da-Silva L. Aggressive fluid and sodium restriction in acute decompensated heart failure: a randomized clinical trial. JAMA Intern Med. 2013;173(12):1058-1064. https://doi.org/10.1001/jamainternmed.2013.552
13. Jao GT, Chiong JR. Hyponatremia in acute decompensated heart failure: mechanisms, prognosis, and treatment options. Clin Cardiol. 2010;33(11):666-671. https://doi.org/10.1002/clc.20822
14. Nagler EV, Haller MC, Van Biesen W, Vanholder R, Craig JC, Webster AC. Interventions for chronic non-hypovolaemic hypotonic hyponatraemia. Cochrane Database Syst Rev. 2018;28(6):CD010965. https://doi.org/10.1002/14651858.cd010965.pub2
15. Fonarow GC; ADHERE Scientific Advisory Committee. The Acute Decompensated Heart Failure National Registry (ADHERE): opportunities to improve care of patients hospitalized with acute decompensated heart failure. Rev Cardiovasc Med. 2003;4(Suppl 7):S21-S30.
© 2021 Society of Hospital Medicine
Improving Healthcare Value: Managing Length of Stay and Improving the Hospital Medicine Value Proposition
Healthcare payment model reform has increased pressure on healthcare systems and hospitalists to improve efficiency and reduce the cost of care. These pressures on the healthcare system have been exacerbated by a global pandemic and an aging patient population straining hospital capacity and resources. Hospital capacity constraints may contribute to hospital crowding and can compromise patient outcomes.1 Increasing hospital capacity also contributes to an increase in hospitalist census. This increase in census is accompanied by proportional increases in hospitalist burnout, cost of care, and prolonged length of stay (LOS).2 Managing LOS reduces “waste” (or non–value-added inpatient days) and can improve outcomes and efficiency within the hospital system.
The benefits for LOS reduction when patients are managed by hospitalists compared with primary care practitioners are well described and are associated with decreases in average LOS and cost.3-5 The shorter LOS with hospitalist care is most pronounced in older patients with more complex disease processes, which has temporal importance. The Department of Health and Human Services expects the number of American adults aged >65 years to approach 72 million (20% of the US population) by 2030. Hospitalists are positioned to drive evidence-based care pathways and improve the quality of patient care in this growing patient population. We examine the reasons for managing LOS, summarize factors that contribute to an increased LOS (“waste”), and propose a list of evidence-based value drivers for LOS reduction (Table).2,6-17 Our experience utilizing this approach within Cleveland Clinic Florida following implementation of many of these evidence-based strategies to reduce non–value-added hospital days is also described in the Appendix Figure.

WHY MANAGE LOS?
Barriers to sustainable LOS-reduction strategies have evolved, in part, since the introduction of the Medicare Prospective Payment System, which moved hospital Medicare payments to a predetermined fixed rate for each diagnosis-related group. This led to financial pressures on healthcare systems to identify methods to reduce cost and, in turn, contributed to an increase in postacute facility utilization, with alternative payment models developing in parallel.18,19 These changes along with disaggregated payments between hospitals and postacute facilities have created a formidable challenge to LOS and cost-reduction plans.19
The usual “why” for reducing LOS includes improving constraints on hospital capacity, strains on resources, and deleterious outcomes. In our experience, an evidence-based approach to LOS management should focus on: (1) reduction in patient hospital days through decreased care variation; (2) stabilizing hospitalist workloads; (3) minimizing the fragmentation inherent to the hospitalist care delivery model; and (4) developing service lines to manage patients hospitalized in an observation status and for those patients undergoing procedures deemed medically complex. The literature is mixed on the impact of LOS reductions on other clinical end points, such as readmissions or mortality, with the preponderance indicating no deleterious impact.20-22 Managing LOS using an evidence-based approach that addresses the variability of individual patients is essential to the LOS strategies employed. These strategies should focus on process improvements to drive LOS reduction and utilize metrics under the individual hospitalist control to support their contribution to the hospitalist groups’ overall LOS.23
IMPROVING HOSPITALIST VALUE AROUND LOS MANAGEMENT
Intrinsic factors such as hospitalist staffing fragmentation, high rounding census, failing to prioritize patients ready to be discharged, variability in practice, number of consultants per patient, and hospitalist behaviors contribute to increased LOS.2,6,8 A first precept to management of LOS at the group level is to recognize all hospitalist services are not created equal, and “lumping” hospitalists into a single efficiency metric would not yield actionable information.
The literature is rife with examples of the significant variation in practice styles among hospitalists. A large study including more than 1000 hospitalists identified practice variation as the strongest predictor of variations in mean LOS.7 While Goodwin et al7 identified significant variation among hospitalists’ LOS and the discharge destination of patients, much of the variation could be attributable to the hospitals where they practice. These findings ostensibly highlight the importance of LOS strategies being developed collaboratively among hospitalist groups and the healthcare systems they serve. Similar variation exists among hospitalists on teaching services versus nonteaching services. Our experience parallels that of other studies with regard to teaching services that have found that hospitalists on teaching services often have additional responsibilities and are less able to gain the efficiency of nonresident hospitalists services.3 The impact of teaching services on hospitalist efficiencies is an important component when setting expectations at the hospitalist group level for providers on academic services.
Workload and staffing models for hospitalists have a significant impact on hospitalist efficiency and LOS management. As workload increased, Elliot and colleagues2 identified a proportional increase in LOS. For occupancies of 75% to 85%, LOS increased exponentially above a daily relative value unit of approximately 25 and a census value of approximately 15. The magnitude of this difference in LOS and cost across the range of hospitalist workloads was $262, with an average increase in LOS of 2 days for every unit increase in census. Higher workloads contributed to inferior discussion of treatment options with patients; delays in discharges; delays in placing discharge orders; and unnecessary testing, procedures, and consults.14 To mitigate inefficiency and adverse impacts of higher workloads, hospitalist groups should develop mechanisms to absorb surges in census and unanticipated changes to staffing maintaining the workload within a range appropriate to the patient population.
Decreasing fragmentation, when multiple hospitalists care for the patient during hospitalization, is a necessary component of any LOS-reduction strategy. Studies of pneumonia and heart failure have demonstrated that a 10% increase in hosptialist fragmentation is associated with significant increases in LOS.24 Schedules with hospitalists on 7-day rotating rounding blocks have the intuitive advantage of improving care continuity for patients compared with schedules with a shorter number of consecutive rounding days, resulting in fewer hospitalists caring for each patient and decreased “fragmentation.” Additional value drivers for LOS reduction strategies for hospitalists are listed in the Table.
The 2018 State of Hospital Medicine Report highlighted that, among patients discharged by hospitalist groups, 80.8% were inpatient and 19.2% were outpatient. With nearly one in five patients discharged in observation status, it behooves hospitalist programs to work to effectively manage these patients. Indeed, hospitalist-run observation units have been shown to decrease LOS significantly without an increase in return rates to the emergency department or hospital compared with patients managed prior to the introduction of a dedicated observation unit.9
Although an in-depth discussion is beyond the scope of the present article, it is worth noting the value of hospitalist comanagement (HCoM) strategies. The impact of HCoM teams is demonstrated by reductions in LOS and cost of care resulting from decreases in medical complications, number of consultants per patient, and a decrease in 30-day readmsissions.12 The Society of Hospital Medicine Perioperative Care Work Group has outlined a collaborative framework for hospitalists and healthcare systems to draw from.15
THE CLEVELAND CLINIC INDIAN RIVER HOSPITAL EXPERIENCE
Within the Cleveland Clinic Indian River Hospital (CCIRH) medicine department, many of the aforementioned strategies and tactics were standardized among hospitalist providers. Hospitalists at CCIRH are scheduled on 7-day rotating blocks to reduce fragmentation. In 2019, we targeted a range of 15 to 18 patient contacts per rounding hospitalist per day and utilized a back-up call system to stabilize the hospitalist census. The hospitalist service lines are enhanced through HCoM services with patients cohorted on dedicated HCoM teams. The follow-up to discharge ratio is used to provide feedback at the provider level as both a management and assessment tool.23 The rounding and admitting teams are dedicated to their responsibility (with the occasional exception necessitating the rounding team assist with admissions when the volumes are high). Direct admissions and transfers from outside hospitals are managed by a dedicated hospital medicine “quarterback” to minimize disruption of the admitting and rounding teams. Barriers to discharge are identified at the time of admission by care management and aggressively managed. Prolonged LOS reports are generated daily and disseminated to care managers and physician leadership. In January 2019, the average LOS for inpatients at CCIRH was 4.4 days. In December 2019, the average LOS for the calendar year to-date at CCIRH was 3.9 days (Appendix Figure).
The value proposition for managing LOS should be viewed in the context of the total cost of care over an extended period of time and not viewed in isolation. Readmission rates serve as a counterbalance to LOS-reduction strategies and contribute to higher costs of care when increased. The 30-day readmission rate for this cohort over this same time period was down slightly compared with the previous year to 12.1%. In addition, observation patients at CCIRH are managed in a closed, geographically cohorted unit, staffed by dedicated advanced-practice providers and physicians dedicated to observation medicine. Over this same time period, more than 5500 patients were managed in the observation unit. These patients had an average LOS of 19.2 hours, with approximately four out of every five patients being discharged to home from an observation status.
The impact of COVID-19 and higher hospital volumes are best visualized in the Appendix Figure. Increases in LOS were observed during periods of COVID-19–related “surges” in hospital volume. These reversals in LOS trends during periods of high occupancy echo earlier findings by Elliot et al2 showing that external factors that are not directly under the control of the hospitalist drive LOS and must be considered when developing LOS reduction strategies.
CONCLUSION
The shift toward value-based payment models provides a strong tailwind for healthcare systems to manage LOS. Hospitalists are well positioned to drive LOS-reduction strategies for the healthcare systems they serve and provide value by driving both quality and efficiency. A complete realization of the value proposition of hospitalist programs in driving LOS-reduction initiatives requires the healthcare systems they serve to provide these teams with the appropriate resources and tools.
1. Eriksson CO, Stoner RC, Eden KB, Newgard CD, Guise J-M. The association between hospital capacity strain and inpatient outcomes in highly developed countries: a systematic review. J Gen Intern Med. 2017;32(6):686-696. https://doi.org/10.1007/s11606-016-3936-3
2. Elliott DJ, Young RS, Brice J, Aguiar R, Kolm P. Effect of hospitalist workload on the quality and efficiency of care. JAMA Intern Med. 2014;174(5):786-793. https://doi.org/10.1001/jamainternmed.2014.300
3. Rachoin JS, Skaf J, Cerceo E, et al. The impact of hospitalists on length of stay and costs: systematic review and meta-analysis. Am J Manag Care. 2012;18(1):e23-30.
4. Kuo YF, Goodwin JS. Effect of hospitalists on length of stay in the medicare population: variation according to hospital and patient characteristics. J Am Geriatr Soc. 2010;58(9):1649-1657. https://doi.org/10.1111/j.1532-5415.2010.03007.x
5. Lindenauer PK, Rothberg MB, Pekow PS, Kenwood C, Benjamin EM, Auerbach AD. Outcomes of care by hospitalists, general internists, and family physicians. N Engl J Med. 2007;357(25):2589-2600. https://doi.org/10.1056/NEJMsa067735
6. Epstein K, Juarez E, Epstein A, Loya K, Singer A. The impact of fragmentation of hospitalist care on length of stay. J Hosp Med. 2010;5(6):335-338. https://doi.org/10.1002/jhm.675
7. Goodwin JS, Lin Y-L, Singh S, Kuo Y-F. Variation in length of stay and outcomes among hospitalized patients attributable to hospitals and hospitalists. J Gen Intern Med. 2013;28(3):370-376. https://doi.org/10.1007/s11606-012-2255-6
8. Johnson T, McNutt R, Odwazny R, Patel D, Baker S. Discrepancy between admission and discharge diagnoses as a predictor of hospital length of stay. J Hosp Med. 2009;4(4):234-239. https://doi.org/10.1002/jhm.453
9. Aplin KS, Coutinho McAllister S, Kupersmith E, Rachoin JS. Caring for patients in a hospitalist-run clinical decision unit is associated with decreased length of stay without increasing revisit rates. J Hosp Med. 2014;9(6):391-395. https://doi.org/10.1002/jhm.2188
10. Selker HP, Beshansky JR, Pauker SG, Kassirer JP. The epidemiology of delays in a teaching hospital. The development and use of a tool that detects unnecessary hospital days. Med Care. 1989;27(2):112-129. https://doi.org/10.1097/00005650-198902000-00003
11. Carey MR, Sheth H, Braithwaite RS. A prospective study of reasons for prolonged hospitalizations on a general medicine teaching service. J Gen Intern Med. 2005;20(2):108-115. https://doi.org/10.1111/j.1525-1497.2005.40269.x
12. Rohatgi N, Loftus P, Grujic O, Cullen M, Hopkins J, Ahuja N. Surgical comanagement by hospitalists improves patient outcomes: a propensity score analysis. Ann Surg. 2016;264(2):275-282. https://doi.org/10.1097/SLA.0000000000001629
13. Chen LM, Freitag MH, Franco M, Sullivan CD, Dickson C, Brancati FL. Natural history of late discharges from a general medical ward. J Hosp Med. 2009;4(4):226-233. https://doi.org/10.1002/jhm.413
14. Zoucha J, Hull M, Keniston A, et al. Barriers to early hospital discharge: a cross-sectional study at five academic hospitals. J Hosp Med. 2018;13(12):816-822. https://doi.org/10.12788/jhm.3074
15. Thompson RE, Pfeifer K, Grant PJ, et al. Hospital medicine and perioperative care: a framework for high-quality, high-value collaborative care. J Hosp Med. 2017;12(4):277-282. https://doi.org/10.12788/jhm.2717
16. Fail RE, Meier DE. Improving quality of care for seriously ill patients: opportunities for hospitalists. J Hosp Med. 2018;13(3):194-197. https://doi.org/10.12788/jhm.2896
17. Hoyer EH, Friedman M, Lavezza A, et al. Promoting mobility and reducing length of stay in hospitalized general medicine patients: a quality-improvement project. J Hosp Med. 2016;11(5):341-347. https://doi.org/10.1002/jhm.2546
18. Davis C, Rhodes DJ. The impact of DRGs on the cost and quality of health care in the United States. Health Policy. 1988;9(2):117-131. https://doi.org/10.1016/0168-8510(88)90029-2
19. Rothberg M, Lee N. Reducing readmissions or length of stay-Which is more important? J Hosp Med. 2017;12(8):685-686. https://doi.org/10.12788/jhm.2790
20. Kaboli PJ, Go JT, Hockenberry J, et al. Associations between reduced hospital length of stay and 30-day readmission rate and mortality: 14-year experience in 129 Veterans Affairs hospitals. Ann Intern Med. 2012;157(12):837-845. https://doi.org/10.7326/0003-4819-157-12-201212180-00003
21. Rinne ST, Graves MC, Bastian LA, et al. Association between length of stay and readmission for COPD. Am J Manag Care. 2017;23(8):e253-e258.
22. Sud M, Yu B, Wijeysundera HC, et al. Associations between short or long length of stay and 30-day readmission and mortality in hospitalized patients with heart failure. JACC Heart Fail. 2017;5(8):578-588. https://doi.org/10.1016/j.jchf.2017.03.012
23. Rothman RD, Whinney CM, Pappas MA, Zoller DM, Rosencrance JG, Peter DJ. The relationship between the follow-up to discharge ratio and length of stay. Am J Manag Care. 2020;26(9):396-399. https://doi.org/10.37765/ajmc.2020.88490
24. Epstein K, Juarez E, Epstein A, Loya K, Singer A. The impact of fragmentation of hospitalist care on length of stay. J Hosp Med. 2010;5(6):335-338. https://doi.org/10.1002/jhm.675
Healthcare payment model reform has increased pressure on healthcare systems and hospitalists to improve efficiency and reduce the cost of care. These pressures on the healthcare system have been exacerbated by a global pandemic and an aging patient population straining hospital capacity and resources. Hospital capacity constraints may contribute to hospital crowding and can compromise patient outcomes.1 Increasing hospital capacity also contributes to an increase in hospitalist census. This increase in census is accompanied by proportional increases in hospitalist burnout, cost of care, and prolonged length of stay (LOS).2 Managing LOS reduces “waste” (or non–value-added inpatient days) and can improve outcomes and efficiency within the hospital system.
The benefits for LOS reduction when patients are managed by hospitalists compared with primary care practitioners are well described and are associated with decreases in average LOS and cost.3-5 The shorter LOS with hospitalist care is most pronounced in older patients with more complex disease processes, which has temporal importance. The Department of Health and Human Services expects the number of American adults aged >65 years to approach 72 million (20% of the US population) by 2030. Hospitalists are positioned to drive evidence-based care pathways and improve the quality of patient care in this growing patient population. We examine the reasons for managing LOS, summarize factors that contribute to an increased LOS (“waste”), and propose a list of evidence-based value drivers for LOS reduction (Table).2,6-17 Our experience utilizing this approach within Cleveland Clinic Florida following implementation of many of these evidence-based strategies to reduce non–value-added hospital days is also described in the Appendix Figure.
WHY MANAGE LOS?
Barriers to sustainable LOS-reduction strategies have evolved, in part, since the introduction of the Medicare Prospective Payment System, which moved hospital Medicare payments to a predetermined fixed rate for each diagnosis-related group. This led to financial pressures on healthcare systems to identify methods to reduce cost and, in turn, contributed to an increase in postacute facility utilization, with alternative payment models developing in parallel.18,19 These changes along with disaggregated payments between hospitals and postacute facilities have created a formidable challenge to LOS and cost-reduction plans.19
The usual “why” for reducing LOS includes improving constraints on hospital capacity, strains on resources, and deleterious outcomes. In our experience, an evidence-based approach to LOS management should focus on: (1) reduction in patient hospital days through decreased care variation; (2) stabilizing hospitalist workloads; (3) minimizing the fragmentation inherent to the hospitalist care delivery model; and (4) developing service lines to manage patients hospitalized in an observation status and for those patients undergoing procedures deemed medically complex. The literature is mixed on the impact of LOS reductions on other clinical end points, such as readmissions or mortality, with the preponderance indicating no deleterious impact.20-22 Managing LOS using an evidence-based approach that addresses the variability of individual patients is essential to the LOS strategies employed. These strategies should focus on process improvements to drive LOS reduction and utilize metrics under the individual hospitalist control to support their contribution to the hospitalist groups’ overall LOS.23
IMPROVING HOSPITALIST VALUE AROUND LOS MANAGEMENT
Intrinsic factors such as hospitalist staffing fragmentation, high rounding census, failing to prioritize patients ready to be discharged, variability in practice, number of consultants per patient, and hospitalist behaviors contribute to increased LOS.2,6,8 A first precept to management of LOS at the group level is to recognize all hospitalist services are not created equal, and “lumping” hospitalists into a single efficiency metric would not yield actionable information.
The literature is rife with examples of the significant variation in practice styles among hospitalists. A large study including more than 1000 hospitalists identified practice variation as the strongest predictor of variations in mean LOS.7 While Goodwin et al7 identified significant variation among hospitalists’ LOS and the discharge destination of patients, much of the variation could be attributable to the hospitals where they practice. These findings ostensibly highlight the importance of LOS strategies being developed collaboratively among hospitalist groups and the healthcare systems they serve. Similar variation exists among hospitalists on teaching services versus nonteaching services. Our experience parallels that of other studies with regard to teaching services that have found that hospitalists on teaching services often have additional responsibilities and are less able to gain the efficiency of nonresident hospitalists services.3 The impact of teaching services on hospitalist efficiencies is an important component when setting expectations at the hospitalist group level for providers on academic services.
Workload and staffing models for hospitalists have a significant impact on hospitalist efficiency and LOS management. As workload increased, Elliot and colleagues2 identified a proportional increase in LOS. For occupancies of 75% to 85%, LOS increased exponentially above a daily relative value unit of approximately 25 and a census value of approximately 15. The magnitude of this difference in LOS and cost across the range of hospitalist workloads was $262, with an average increase in LOS of 2 days for every unit increase in census. Higher workloads contributed to inferior discussion of treatment options with patients; delays in discharges; delays in placing discharge orders; and unnecessary testing, procedures, and consults.14 To mitigate inefficiency and adverse impacts of higher workloads, hospitalist groups should develop mechanisms to absorb surges in census and unanticipated changes to staffing maintaining the workload within a range appropriate to the patient population.
Decreasing fragmentation, when multiple hospitalists care for the patient during hospitalization, is a necessary component of any LOS-reduction strategy. Studies of pneumonia and heart failure have demonstrated that a 10% increase in hosptialist fragmentation is associated with significant increases in LOS.24 Schedules with hospitalists on 7-day rotating rounding blocks have the intuitive advantage of improving care continuity for patients compared with schedules with a shorter number of consecutive rounding days, resulting in fewer hospitalists caring for each patient and decreased “fragmentation.” Additional value drivers for LOS reduction strategies for hospitalists are listed in the Table.
The 2018 State of Hospital Medicine Report highlighted that, among patients discharged by hospitalist groups, 80.8% were inpatient and 19.2% were outpatient. With nearly one in five patients discharged in observation status, it behooves hospitalist programs to work to effectively manage these patients. Indeed, hospitalist-run observation units have been shown to decrease LOS significantly without an increase in return rates to the emergency department or hospital compared with patients managed prior to the introduction of a dedicated observation unit.9
Although an in-depth discussion is beyond the scope of the present article, it is worth noting the value of hospitalist comanagement (HCoM) strategies. The impact of HCoM teams is demonstrated by reductions in LOS and cost of care resulting from decreases in medical complications, number of consultants per patient, and a decrease in 30-day readmsissions.12 The Society of Hospital Medicine Perioperative Care Work Group has outlined a collaborative framework for hospitalists and healthcare systems to draw from.15
THE CLEVELAND CLINIC INDIAN RIVER HOSPITAL EXPERIENCE
Within the Cleveland Clinic Indian River Hospital (CCIRH) medicine department, many of the aforementioned strategies and tactics were standardized among hospitalist providers. Hospitalists at CCIRH are scheduled on 7-day rotating blocks to reduce fragmentation. In 2019, we targeted a range of 15 to 18 patient contacts per rounding hospitalist per day and utilized a back-up call system to stabilize the hospitalist census. The hospitalist service lines are enhanced through HCoM services with patients cohorted on dedicated HCoM teams. The follow-up to discharge ratio is used to provide feedback at the provider level as both a management and assessment tool.23 The rounding and admitting teams are dedicated to their responsibility (with the occasional exception necessitating the rounding team assist with admissions when the volumes are high). Direct admissions and transfers from outside hospitals are managed by a dedicated hospital medicine “quarterback” to minimize disruption of the admitting and rounding teams. Barriers to discharge are identified at the time of admission by care management and aggressively managed. Prolonged LOS reports are generated daily and disseminated to care managers and physician leadership. In January 2019, the average LOS for inpatients at CCIRH was 4.4 days. In December 2019, the average LOS for the calendar year to-date at CCIRH was 3.9 days (Appendix Figure).
The value proposition for managing LOS should be viewed in the context of the total cost of care over an extended period of time and not viewed in isolation. Readmission rates serve as a counterbalance to LOS-reduction strategies and contribute to higher costs of care when increased. The 30-day readmission rate for this cohort over this same time period was down slightly compared with the previous year to 12.1%. In addition, observation patients at CCIRH are managed in a closed, geographically cohorted unit, staffed by dedicated advanced-practice providers and physicians dedicated to observation medicine. Over this same time period, more than 5500 patients were managed in the observation unit. These patients had an average LOS of 19.2 hours, with approximately four out of every five patients being discharged to home from an observation status.
The impact of COVID-19 and higher hospital volumes are best visualized in the Appendix Figure. Increases in LOS were observed during periods of COVID-19–related “surges” in hospital volume. These reversals in LOS trends during periods of high occupancy echo earlier findings by Elliot et al2 showing that external factors that are not directly under the control of the hospitalist drive LOS and must be considered when developing LOS reduction strategies.
CONCLUSION
The shift toward value-based payment models provides a strong tailwind for healthcare systems to manage LOS. Hospitalists are well positioned to drive LOS-reduction strategies for the healthcare systems they serve and provide value by driving both quality and efficiency. A complete realization of the value proposition of hospitalist programs in driving LOS-reduction initiatives requires the healthcare systems they serve to provide these teams with the appropriate resources and tools.
1. Eriksson CO, Stoner RC, Eden KB, Newgard CD, Guise J-M. The association between hospital capacity strain and inpatient outcomes in highly developed countries: a systematic review. J Gen Intern Med. 2017;32(6):686-696. https://doi.org/10.1007/s11606-016-3936-3
2. Elliott DJ, Young RS, Brice J, Aguiar R, Kolm P. Effect of hospitalist workload on the quality and efficiency of care. JAMA Intern Med. 2014;174(5):786-793. https://doi.org/10.1001/jamainternmed.2014.300
3. Rachoin JS, Skaf J, Cerceo E, et al. The impact of hospitalists on length of stay and costs: systematic review and meta-analysis. Am J Manag Care. 2012;18(1):e23-30.
4. Kuo YF, Goodwin JS. Effect of hospitalists on length of stay in the medicare population: variation according to hospital and patient characteristics. J Am Geriatr Soc. 2010;58(9):1649-1657. https://doi.org/10.1111/j.1532-5415.2010.03007.x
5. Lindenauer PK, Rothberg MB, Pekow PS, Kenwood C, Benjamin EM, Auerbach AD. Outcomes of care by hospitalists, general internists, and family physicians. N Engl J Med. 2007;357(25):2589-2600. https://doi.org/10.1056/NEJMsa067735
6. Epstein K, Juarez E, Epstein A, Loya K, Singer A. The impact of fragmentation of hospitalist care on length of stay. J Hosp Med. 2010;5(6):335-338. https://doi.org/10.1002/jhm.675
7. Goodwin JS, Lin Y-L, Singh S, Kuo Y-F. Variation in length of stay and outcomes among hospitalized patients attributable to hospitals and hospitalists. J Gen Intern Med. 2013;28(3):370-376. https://doi.org/10.1007/s11606-012-2255-6
8. Johnson T, McNutt R, Odwazny R, Patel D, Baker S. Discrepancy between admission and discharge diagnoses as a predictor of hospital length of stay. J Hosp Med. 2009;4(4):234-239. https://doi.org/10.1002/jhm.453
9. Aplin KS, Coutinho McAllister S, Kupersmith E, Rachoin JS. Caring for patients in a hospitalist-run clinical decision unit is associated with decreased length of stay without increasing revisit rates. J Hosp Med. 2014;9(6):391-395. https://doi.org/10.1002/jhm.2188
10. Selker HP, Beshansky JR, Pauker SG, Kassirer JP. The epidemiology of delays in a teaching hospital. The development and use of a tool that detects unnecessary hospital days. Med Care. 1989;27(2):112-129. https://doi.org/10.1097/00005650-198902000-00003
11. Carey MR, Sheth H, Braithwaite RS. A prospective study of reasons for prolonged hospitalizations on a general medicine teaching service. J Gen Intern Med. 2005;20(2):108-115. https://doi.org/10.1111/j.1525-1497.2005.40269.x
12. Rohatgi N, Loftus P, Grujic O, Cullen M, Hopkins J, Ahuja N. Surgical comanagement by hospitalists improves patient outcomes: a propensity score analysis. Ann Surg. 2016;264(2):275-282. https://doi.org/10.1097/SLA.0000000000001629
13. Chen LM, Freitag MH, Franco M, Sullivan CD, Dickson C, Brancati FL. Natural history of late discharges from a general medical ward. J Hosp Med. 2009;4(4):226-233. https://doi.org/10.1002/jhm.413
14. Zoucha J, Hull M, Keniston A, et al. Barriers to early hospital discharge: a cross-sectional study at five academic hospitals. J Hosp Med. 2018;13(12):816-822. https://doi.org/10.12788/jhm.3074
15. Thompson RE, Pfeifer K, Grant PJ, et al. Hospital medicine and perioperative care: a framework for high-quality, high-value collaborative care. J Hosp Med. 2017;12(4):277-282. https://doi.org/10.12788/jhm.2717
16. Fail RE, Meier DE. Improving quality of care for seriously ill patients: opportunities for hospitalists. J Hosp Med. 2018;13(3):194-197. https://doi.org/10.12788/jhm.2896
17. Hoyer EH, Friedman M, Lavezza A, et al. Promoting mobility and reducing length of stay in hospitalized general medicine patients: a quality-improvement project. J Hosp Med. 2016;11(5):341-347. https://doi.org/10.1002/jhm.2546
18. Davis C, Rhodes DJ. The impact of DRGs on the cost and quality of health care in the United States. Health Policy. 1988;9(2):117-131. https://doi.org/10.1016/0168-8510(88)90029-2
19. Rothberg M, Lee N. Reducing readmissions or length of stay-Which is more important? J Hosp Med. 2017;12(8):685-686. https://doi.org/10.12788/jhm.2790
20. Kaboli PJ, Go JT, Hockenberry J, et al. Associations between reduced hospital length of stay and 30-day readmission rate and mortality: 14-year experience in 129 Veterans Affairs hospitals. Ann Intern Med. 2012;157(12):837-845. https://doi.org/10.7326/0003-4819-157-12-201212180-00003
21. Rinne ST, Graves MC, Bastian LA, et al. Association between length of stay and readmission for COPD. Am J Manag Care. 2017;23(8):e253-e258.
22. Sud M, Yu B, Wijeysundera HC, et al. Associations between short or long length of stay and 30-day readmission and mortality in hospitalized patients with heart failure. JACC Heart Fail. 2017;5(8):578-588. https://doi.org/10.1016/j.jchf.2017.03.012
23. Rothman RD, Whinney CM, Pappas MA, Zoller DM, Rosencrance JG, Peter DJ. The relationship between the follow-up to discharge ratio and length of stay. Am J Manag Care. 2020;26(9):396-399. https://doi.org/10.37765/ajmc.2020.88490
24. Epstein K, Juarez E, Epstein A, Loya K, Singer A. The impact of fragmentation of hospitalist care on length of stay. J Hosp Med. 2010;5(6):335-338. https://doi.org/10.1002/jhm.675
© 2021 Society of Hospital Medicine
Factors Associated With COVID-19 Disease Severity in US Children and Adolescents
The COVID-19 pandemic has led to more than 40 million infections and more than 650,000 deaths in the United States alone.1 Morbidity and mortality have disproportionately affected older adults.2-4 However, acute infection and delayed effects, such as multisystem inflammatory syndrome in children (MIS-C), occur and can lead to severe complications, hospitalization, and death in pediatric patients.5,6 Due to higher clinical disease prevalence and morbidity in the adult population, we have learned much about the clinical factors associated with severe adult COVID-19 disease.5,7-9 Such clinical factors include older age, concurrent comorbidities, smoke exposure, and Black race or Hispanic ethnicity, among others.5,7-10 However, there is a paucity of data on severe COVID-19 disease in pediatric patients.5,11,12 In addition, most immunization strategies and pharmacologic treatments for COVID-19 have not been evaluated or approved for use in children.13 To guide targeted prevention and treatment strategies, there is a critical need to identify children and adolescents—who are among the most vulnerable patient populations—at high risk for severe disease.
Identifying the clinical factors associated with severe COVID-19 disease will help with prioritizing and allocating vaccines when they are approved for use in patients younger than 12 years.
METHODS
Study Design
We conducted a multicenter retrospective cohort study of patients presenting for care at pediatric hospitals that report data to the Pediatric Health Information System (PHIS) database. The PHIS administrative database includes billing and utilization data from 45 US tertiary care hospitals affiliated with the Children’s Hospital Association (Lenexa, Kansas). Data quality and reliability are ensured through a joint validation effort between the Children’s Hospital Association and participating hospitals. Hospitals submit discharge data, including demographics, diagnoses, and procedures using International Classification of Diseases, 10th Revision (ICD-10) codes, along with daily detailed information on pharmacy, location of care, and other services.
Study Population
Patients 30 days to 18 years of age discharged from the emergency department (ED) or inpatient setting with a primary diagnosis of COVID-19 (ICD-10 codes U.071 and U.072) between April 1, 2020, and September 30, 2020, were eligible for inclusion.14 In a prior study, the positive predictive value of an ICD-10–coded diagnosis of COVID-19 among hospitalized pediatric patients was 95.5%, compared with reverse transcription polymerase reaction results or presence of MIS-C.15 The diagnostic code for COVID-19 (ICD-10-CM) also had a high sensitivity (98.0%) in the hospitalized population.16 Acknowledging the increasing practice of screening patients upon admission, and in an attempt to minimize potential misclassification, we did not include encounters with secondary diagnoses of COVID-19 in our primary analyses. Pediatric patients with surgical diagnoses and neonates who never left the hospital were also excluded.
Factors Associated With Severe COVID-19 Disease
Exposures of interest were determined a priori based on current evidence in the literature and included patient age (0-4 years, 5-11 years, and 12-18 years), sex, race and ethnicity (non-Hispanic White, non-Hispanic Black, Hispanic, Asian, other non-White race [defined as Pacific Islander, Native American, or other]), payor type, cardiovascular complex chronic conditions (CCC), neuromuscular CCC, obesity/type 2 diabetes mellitus (DM), pulmonary CCC, asthma (defined using ICD-10 codes17), and immunocompromised CCC
Pediatric Complications and Conditions Associated With COVID-19
Based on current evidence and expert opinion of study members, associated diagnoses and complications co-occurring with a COVID-19 diagnosis were defined a priori and identified through ICD-10 codes (Appendix Table 1). These included acute kidney injury, acute liver injury, aseptic meningitis, asthma exacerbation, bronchiolitis, cerebral infarction, croup, encephalitis, encephalopathy, infant fever, febrile seizure, gastroenteritis/dehydration, Kawasaki disease/MIS-C, myocarditis/pericarditis, pneumonia, lung effusion or empyema, respiratory failure, sepsis, nonfebrile seizure, pancreatitis, sickle cell complications, and thrombotic complications.
Outcomes
COVID-19 severity outcomes were assessed as follows: (1) mild = ED discharge; (2) moderate = inpatient admission; (3) severe = intensive care unit (ICU) admission without mechanical ventilation, shock, or death; and (4) very severe = ICU admission with mechanical ventilation, shock, or death.19 This ordinal ranking system did not violate the proportional odds assumption. Potential reasons for admission to the ICU without mechanical ventilation, shock, or death include, but are not limited to, need for noninvasive ventilation, vital sign instability, dysrhythmias, respiratory insufficiency, or complications arising from concurrent conditions (eg, thrombotic events, need for continuous albuterol therapy). We examined several secondary, hospital-based outcomes, including associated diagnoses and complications, all-cause 30-day healthcare reutilization (ED visit or rehospitalization), length of stay (LOS), and ICU LOS.
Statistical Analysis
Demographic characteristics were summarized using frequencies and percentages for categorical variables and geometric means with SD and medians with interquartile ranges (IQR) for continuous variables, as appropriate. Factors associated with hospitalization (encompassing severity levels 2-4) vs ED discharge (severity level 1) were assessed using logistic regression. Factors associated with increasing severity among hospitalized pediatric patients (severity levels 2, 3, and 4) were assessed using ordinal logistic regression. Covariates in these analyses included race and ethnicity, age, sex, payor, cardiovascular CCC, neurologic/neuromuscular CCC, obesity/type 2 DM, pulmonary CCC, asthma, and immunocompromised CCC. Adjusted odds ratios (aOR) and corresponding 95% CI for each risk factor were generated using generalized linear mixed effects models and random intercepts for each hospital. Given the potential for diagnostic misclassification of pediatric patients with COVID-19 based on primary vs secondary diagnoses, we performed sensitivity analyses defining the study population as those with a primary diagnosis of COVID-19 and those with a secondary diagnosis of COVID-19 plus a concurrent primary diagnosis of a condition associated with COVID-19 (Appendix Table 1).
All analyses were performed using SAS version 9.4 (SAS Institute, Inc), and P < .05 was considered statistically significant. The Institutional Review Board at Vanderbilt University Medical Center determined that this study of de-identified data did not meet the criteria for human subjects research.
RESULTS
Study Population
A total of 19,976 encounters were included in the study. Of those, 15,913 (79.7%) were discharged from the ED and 4063 (20.3%) were hospitalized (Table 1). The most common race/ethnicity was Hispanic (9741, 48.8%), followed by non-Hispanic White (4217, 21.1%). Reference race/ethnicity data for the overall 2019 PHIS population can be found in Appendix Table 2.

The severity distribution among the hospitalized population was moderate (3222, 79.3%), severe (431, 11.3%), and very severe (380, 9.4%). The frequency of COVID-19 diagnoses increased late in the study period (Figure). Among those hospitalized, the median LOS for the index admission was 2 days (IQR, 1-4), while among those admitted to the ICU, the median LOS was 3 days (IQR, 2-5).

Overall, 10.1% (n = 2020) of the study population had an all-cause repeat encounter (ie, subsequent ED encounter or hospitalization) within 30 days following the index discharge. Repeat encounters were more frequent among patients hospitalized than among those discharged from the ED (Appendix Table 3).
Prevalence of Conditions and Complications Associated With COVID-19
Overall, 3257 (16.3%) patients had one or more co-occurring diagnoses categorized as a COVID-19–associated condition or complication. The most frequent diagnoses included lower respiratory tract disease (pneumonia, lung effusion, or empyema; n = 1415, 7.1%), gastroenteritis/dehydration (n = 1068, 5.3%), respiratory failure (n = 731, 3.7%), febrile infant (n = 413, 2.1%), and nonfebrile seizure (n = 425, 2.1%). Aside from nonfebrile seizure, neurological complications were less frequent and included febrile seizure (n = 155, 0.8%), encephalopathy (n = 63, 0.3%), aseptic meningitis (n = 16, 0.1%), encephalitis (n = 11, 0.1%), and cerebral infarction (n = 6, <0.1%). Kawasaki disease and MIS-C comprised 1.7% (n = 346) of diagnoses. Thrombotic complications occurred in 0.1% (n = 13) of patients. Overall, these conditions and complications associated with COVID-19 were more frequent in hospitalized patients than in those discharged from the ED (P < .001) (Table 2).

Factors Associated With COVID-19 Disease Severity
Compared to pediatric patients with COVID-19 discharged from the ED, factors associated with increased odds of hospitalization included private payor insurance; obesity/type 2 DM; asthma; and cardiovascular, immunocompromised, neurologic/neuromuscular, and pulmonary CCCs (Table 3). Factors associated with decreased risk of hospitalization included Black race or Hispanic ethnicity compared with White race; female sex; and age 5 to 11 years and age 12 to 17 years (vs age 0-4 years). Among children and adolescents hospitalized with COVID-19, factors associated with greater disease severity included Black or other non-White race; age 5 to 11 years; age 12 to 17 years; obesity/type 2 DM; immunocompromised conditions; and cardiovascular, neurologic/neuromuscular, and pulmonary CCCs (Table 3).

Sensitivity Analysis
We performed a sensitivity analysis that expanded the study population to include those with a secondary diagnosis of COVID-19 plus a diagnosis of a COVID-19–associated condition or complication. Analyses using the expanded population (N = 21,247) were similar to the primary analyses (Appendix Table 4 and Appendix Table 5).
DISCUSSION
In this large multicenter study evaluating COVID-19 disease severity in more than 19,000 patients presenting for emergency care at US pediatric hospitals, approximately 20% were hospitalized, and among those hospitalized almost a quarter required ICU care. Clinical risk factors associated with increased risk of hospitalization include private payor status and selected comorbidities (obesity/type 2 DM; asthma; and cardiovascular, pulmonary, immunocompromised, neurologic/neuromuscular CCCs), while those associated with decreased risk of hospitalization include older age, female sex, and Black race or Hispanic ethnicity. Factors associated with severe disease among hospitalized pediatric patients include Black or other non-White race, school age (≥5 years), and certain chronic conditions (cardiovascular disease, obesity/type 2 DM, neurologic or neuromuscular disease). Sixteen percent of patients had a concurrent diagnosis for a condition or complication associated with COVID-19.
While the study population (ie, children and adolescents presenting to the ED) represents a small fraction of children and adolescents in the community with SARS-CoV-2 infection, the results provide important insight into factors of severe COVID-19 in the pediatric population. A report from France suggested ventilatory or hemodynamic support or death were independently associated with older age (≥10 years), elevated C-reactive protein, and hypoxemia.12 An Italian study found that younger age (0-4 years) was associated with less severe disease, while preexisting conditions were more likely in patients with severe disease.11 A single-center case series of 50 patients (aged ≤21 years) hospitalized at a children’s hospital in New York City found respiratory failure (n = 9) was more common in children older than 1 year, patients with elevated inflammatory markers, and patients with obesity.20
Our study confirms several factors for severe COVID-19 found in these studies, including older age,11,12,20 obesity,20 and preexisting conditions.11 Our findings also expand on these reports, including identification of factors associated with hospitalization. Given the rate of 30-day re-encounters among pediatric patients with COVID-19 (10.1%), identifying risk factors for hospitalization may aid ED providers in determining optimal disposition (eg, home, hospital admission, ICU). We also identified specific comorbidities associated with more severe disease in those hospitalized with COVID-19, such as cardiovascular disease, obesity/type 2 DM, and pulmonary, neurologic, or neuromuscular conditions. We also found that asthma increased the risk for hospitalization but not more severe disease among those hospitalized. This latter finding also aligns with recent single-center studies,21,22 whereas a Turkish study of pediatric patients aged 0 to 18 years found no association between asthma and COVID-19 hospitalizations.23We also examined payor type and racial/ethnic factors in our analysis. In 2019, patients who identified as Black or Hispanic comprised 52.3% of all encounters and 40.7% of hospitalizations recorded in the PHIS database. During the same year, encounters for influenza among Black or Hispanic pediatric patients comprised 58.7% of all influenza diagnoses and 47.0% of pediatric influenza hospitalizations (Appendix Table 2). In this study, patients who identified as Black or Hispanic race represented a disproportionately large share of patients presenting to children’s hospitals (68.5%) and of those hospitalized (60.8%). Hispanic ethnicity, in particular, represented a disproportionate share of patients seeking care for COVID-19 compared to the overall PHIS population (47.7% and 27.1%, respectively). After accounting for other factors, we found Black and other non-White race—but not of Hispanic ethnicity—were independently associated with more disease severity among those hospitalized. This contrasts with findings from a recent adult study by Yehia et al,24 who found (after adjusting for other clinical factors) no significant difference in mortality between Black patients and White patients among adults hospitalized due to COVID-19. It also contrasts with a recent large population-based UK study wherein pediatric patients identifying as Asian, but not Black or mixed race or ethnicity, had an increased risk of hospital admission and admission to the ICU compared to children identifying as White. Children identifying as Black or mixed race had longer hospital admissions.25 However, as the authors of the study note, residual confounders and ascertainment bias due to differences in COVID testing may have influenced these findings.
Our findings of differences in hospitalization and disease severity among those hospitalized by race and ethnicity should be interpreted carefully. These may reflect a constellation of factors that are difficult to measure, including differences in healthcare access, inequalities in care (including hospital admission inequalities), and implicit bias—all of which may reflect structural racism. For example, it is possible that children who identify as Black or Hispanic have different access to care compared to children who identify as White, and this may affect disease severity on presentation.2 Alternatively, it is possible that White pediatric patients are more likely to be hospitalized as compared to non-White pediatric patients with similar illness severity. Our finding that pediatric patients who identify as Hispanic or Black had a lower risk of hospitalization should be also interpreted carefully, as this may reflect higher utilization of the ED for SARS-CoV-2 testing, increased use of nonemergency services among those without access to primary care, or systematic differences in provider decision-making among this segment of the population.2 Further study is needed to determine specific drivers for racial and ethnic differences in healthcare utilization in children and adolescents with COVID-19.26
Complications and co-occurring diagnoses in adults with COVID-19 are well documented.27-30 However, there is little information to date on the co-occurring diagnoses and complications associated with COVID-19 in children and adolescents. We found that complications and co-occurring conditions occurred in 16.3% of the study population, with the most frequent conditions including known complications of viral infections such as pneumonia, respiratory failure, and seizures. Acute kidney and liver injury, as well as thrombotic complications, occurred less commonly than in adults.26-29 Interestingly, neurologic complications were also uncommon compared to adult reports8,31 and less frequent than in other viral illnesses in children and adolescents. For example, neurologic complications occur in approximately 7.5% of children and adolescents hospitalized with influenza.32
Limitations of the present study include the retrospective design, as well as incomplete patient-level clinical data in the PHIS database. The PHIS database only includes children’s hospitals, which may limit the generalizability of findings to community hospitals. We also excluded newborns, and our findings may not be generalizable to this population. We only included children and adolescents with a primary diagnosis of COVID-19, which has the potential for misclassification in cases where COVID-19 was a secondary diagnosis. However, results of our sensitivity analysis, which incorporated secondary diagnoses of COVID-19, were consistent with findings from our main analyses. Our study was designed to examine associations between certain prespecified factors and COVID-19 severity among pediatric patients who visited the ED or were admitted to the hospital during the COVID-19 pandemic. Thus, our findings must be interpreted in light of these considerations and may not be generalizable outside the ED or hospital setting. For example, it could be that some segments of the population utilized ED resources for testing, whereas others avoided the ED and other healthcare settings for fear of exposure to SARS-CoV-2. We also relied on diagnosis codes to identify concurrent diagnoses, as well as mechanical ventilation in our very severe outcome cohort, which resulted in this classification for some of these diagnoses. Despite these limitations, our findings represent an important step in understanding the risk factors associated with severe clinical COVID-19 disease in pediatric patients.
Our findings may inform future research and clinical interventions. Future studies on antiviral therapies and immune modulators targeting SARS-CoV-2 infection in children and adolescents should focus on high-risk populations, such as those identified in the study, as these patients are most likely to benefit from therapeutic interventions. Similarly, vaccine-development efforts may benefit from additional evaluation in high-risk populations, some of which may have altered immune responses. Furthermore, with increasing vaccination among adults and changes in recommendations, societal mitigation efforts (eg, masking, physical distancing) will diminish. Continued vigilance and COVID-19–mitigation efforts among high-risk children, for whom vaccines are not yet available, are critical during this transition.
CONCLUSION
Among children with COVID-19 who received care at children’s hospitals and EDs, 20% were hospitalized, and, of those, 21% were admitted to the ICU. Older children and adolescent patients had a lower risk of hospitalization; however, when hospitalized, they had greater illness severity. Those with selected comorbidities (eg, cardiovascular, obesity/type 2 DM, pulmonary and neurologic or neuromuscular disease) had both increased odds of hospitalization and in-hospital illness severity. While there were observed differences in COVID-19 severity by race and ethnicity, additional research is needed to clarify the drivers of such disparities. These factors should be considered when prioritizing mitigation strategies to prevent infection (eg, remote learning, avoidance of group activities, prioritization of COVID-19 vaccine when approved for children aged <12 years).
1. Centers for Disease Control and Prevention. COVID data tracker. Accessed September 9, 2021. https://covid.cdc.gov/covid-data-tracker/#datatracker-home
2. Levy C, Basmaci R, Bensaid P, et al. Changes in reverse transcription polymerase chain reaction-positive severe acute respiratory syndrome coronavirus 2 rates in adults and children according to the epidemic stages. Pediatr Infect Dis J. 2020;39(11):e369-e372. https://doi.org/10.1097/inf.0000000000002861
3. Gudbjartsson DF, Helgason A, Jonsson H, et al. Spread of SARS-CoV-2 in the Icelandic population. N Engl J Med. 2020;382(24):2302-2315. https://doi.org/10.1056/nejmoa2006100
4. Garg S, Kim L, Whitaker M, et al. Hospitalization rates and characteristics of patients hospitalized with laboratory-confirmed coronavirus disease 2019 - COVID-NET, 14 States, March 1-30, 2020. MMWR Morb Mortal Wkly Rep. 2020;69(15):458-464. https://doi.org/10.15585/mmwr.mm6915e3
5. Castagnoli R, Votto M, Licari A, et al. Severe acute respiratory syndrome coronavirus 2 (SARS-CoV-2) infection in children and adolescents: a systematic review. JAMA Pediatr. 2020;174(9):882-889. https://doi.org/10.1001/jamapediatrics.2020.1467
6. Feldstein LR, Rose EB, Horwitz SM, et al; Overcoming COVID-19 Investigators; CDC COVID-19 Response Team. Multisystem inflammatory syndrome in U.S. children and adolescents. N Engl J Med. 2020;383(4):334-346. https://doi.org/10.1056/nejmoa2021680
7. Magro B, Zuccaro V, Novelli L, et al. Predicting in-hospital mortality from coronavirus disease 2019: a simple validated app for clinical use. PLoS One. 2021;16(1):e0245281. https://doi.org/10.1371/journal.pone.0245281
8. Helms J, Kremer S, Merdji H, et al. Neurologic features in severe SARS-CoV-2 infection. N Engl J Med. 2020;382(23):2268-2270. https://doi.org/10.1056/nejmc2008597
9. Severe Covid GWAS Group; Ellinghaus D, Degenhardt F, Bujanda L, et al. Genomewide association study of severe Covid-19 with respiratory failure. N Engl J Med. 2020;383(16):1522-1534.
10. Kabarriti R, Brodin NP, Maron MI, et al. association of race and ethnicity with comorbidities and survival among patients with COVID-19 at an urban medical center in New York. JAMA Netw Open. 2020;3(9):e2019795. https://doi.org/10.1001/jamanetworkopen.2020.19795
11. Bellino S, Punzo O, Rota MC, et al; COVID-19 Working Group. COVID-19 disease severity risk factors for pediatric patients in Italy. Pediatrics. 2020;146(4):e2020009399. https://doi.org/10.1542/peds.2020-009399
12. Ouldali N, Yang DD, Madhi F, et al; investigator group of the PANDOR study. Factors associated with severe SARS-CoV-2 infection. Pediatrics. 2020;147(3):e2020023432. https://doi.org/10.1542/peds.2020-023432
13. Castells MC, Phillips EJ. Maintaining safety with SARS-CoV-2 vaccines. N Engl J Med. 2021;384(7):643-649. https://doi.org/10.1056/nejmra2035343
14. Antoon JW, Williams DJ, Thurm C, et al. The COVID-19 pandemic and changes in healthcare utilization for pediatric respiratory and nonrespiratory illnesses in the United States. J Hosp Med. 2021;16(5):294-297. https://doi.org/10.12788/jhm.3608
15. Blatz AM, David MZ, Otto WR, Luan X, Gerber JS. Validation of International Classification of Disease-10 code for identifying children hospitalized with coronavirus disease-2019. J Pediatric Infect Dis Soc. 2020;10(4):547-548. https://doi.org/10.1093/jpids/piaa140
16. Kadri SS, Gundrum J, Warner S, et al. Uptake and accuracy of the diagnosis code for COVID-19 among US hospitalizations. JAMA. 2020;324(24):2553-2554. https://doi.org/10.1001/jama.2020.20323
17. Kaiser SV, Rodean J, Bekmezian A, et al; Pediatric Research in Inpatient Settings (PRIS) Network. Effectiveness of pediatric asthma pathways for hospitalized children: a multicenter, national analysis. J Pediatr. 2018;197:165-171.e162. https://doi.org/10.1016/j.jpeds.2018.01.084
18. Feudtner C, Feinstein JA, Zhong W, Hall M, Dai D. Pediatric complex chronic conditions classification system version 2: updated for ICD-10 and complex medical technology dependence and transplantation. BMC Pediatr. 2014;14:199. https://doi.org/10.1186/1471-2431-14-199.
19. Williams DJ, Zhu Y, Grijalva CG, et al. Predicting severe pneumonia outcomes in children. Pediatrics. 2016;138(4):e20161019. https://doi.org/10.1542/peds.2016-1019
20. Zachariah P, Johnson CL, Halabi KC, et al. Epidemiology, clinical features, and disease severity in patients with coronavirus disease 2019 (COVID-19) in a children’s hospital in New York City, New York. JAMA Pediatr. 2020;174(10):e202430. https://doi.org/10.1001/jamapediatrics.2020.2430
21. DeBiasi RL, Song X, Delaney M, et al. Severe coronavirus disease-2019 in children and young adults in the Washington, DC, metropolitan region. J Pediatr. 2020;223:199-203.e191. https://doi.org/10.1016/j.jpeds.2020.05.007
22. Lovinsky-Desir S, Deshpande DR, De A, et al. Asthma among hospitalized patients with COVID-19 and related outcomes. J Allergy Clin Immunol. 2020;146(5):1027-1034.e1024. https://doi.org/10.1016/j.jaci.2020.07.026
23. Beken B, Ozturk GK, Aygun FD, Aydogmus C, Akar HH. Asthma and allergic diseases are not risk factors for hospitalization in children with coronavirus disease 2019. Ann Allergy Asthma Immunol. 2021;126(5):569-575. https://doi.org/10.1016/j.anai.2021.01.018
24. Yehia BR, Winegar A, Fogel R, et al. Association of race with mortality among patients hospitalized with coronavirus disease 2019 (COVID-19) at 92 US hospitals. JAMA Netw Open. 2020;3(8):e2018039. https://doi.org/10.1001/jamanetworkopen.2020.18039
25. Saatci D, Ranger TA, Garriga C, et al. Association between race and COVID-19 outcomes among 2.6 million children in England. JAMA Pediatr. 2021;e211685. https://doi.org/10.1001/jamapediatrics.2021.1685
26. Lopez L, 3rd, Hart LH, 3rd, Katz MH. Racial and ethnic health disparities related to COVID-19. JAMA. 2021;325(8):719-720. https://doi.org/10.1001/jama.2020.26443
27. Altunok ES, Alkan M, Kamat S, et al. Clinical characteristics of adult patients hospitalized with laboratory-confirmed COVID-19 pneumonia. J Infect Chemother. 2020. https://doi.org/10.1016/j.jiac.2020.10.020
28. Ali H, Daoud A, Mohamed MM, et al. Survival rate in acute kidney injury superimposed COVID-19 patients: a systematic review and meta-analysis. Ren Fail. 2020;42(1):393-397. https://doi.org/10.1080/0886022x.2020.1756323
29. Anirvan P, Bharali P, Gogoi M, Thuluvath PJ, Singh SP, Satapathy SK. Liver injury in COVID-19: the hepatic aspect of the respiratory syndrome - what we know so far. World J Hepatol. 2020;12(12):1182-1197. https://doi.org/10.4254/wjh.v12.i12.1182
30. Moschonas IC, Tselepis AD. SARS-CoV-2 infection and thrombotic complications: a narrative review. J Thromb Thrombolysis. 2021;52(1):111-123. https://doi.org/10.1007/s11239-020-02374-3
31. Lee MH, Perl DP, Nair G, et al. Microvascular injury in the brains of patients with Covid-19. N Engl J Med. 2020;384(5):481-483. https://doi.org/10.1056/nejmc2033369
32. Antoon JW, Hall M, Herndon A, et al. Prevalence, risk factors, and outcomes of influenza-associated neurological Complications in Children. J Pediatr. 2021;S0022-3476(21)00657-0. https://doi.org/10.1016/j.jpeds.2021.06.075
The COVID-19 pandemic has led to more than 40 million infections and more than 650,000 deaths in the United States alone.1 Morbidity and mortality have disproportionately affected older adults.2-4 However, acute infection and delayed effects, such as multisystem inflammatory syndrome in children (MIS-C), occur and can lead to severe complications, hospitalization, and death in pediatric patients.5,6 Due to higher clinical disease prevalence and morbidity in the adult population, we have learned much about the clinical factors associated with severe adult COVID-19 disease.5,7-9 Such clinical factors include older age, concurrent comorbidities, smoke exposure, and Black race or Hispanic ethnicity, among others.5,7-10 However, there is a paucity of data on severe COVID-19 disease in pediatric patients.5,11,12 In addition, most immunization strategies and pharmacologic treatments for COVID-19 have not been evaluated or approved for use in children.13 To guide targeted prevention and treatment strategies, there is a critical need to identify children and adolescents—who are among the most vulnerable patient populations—at high risk for severe disease.
Identifying the clinical factors associated with severe COVID-19 disease will help with prioritizing and allocating vaccines when they are approved for use in patients younger than 12 years.
METHODS
Study Design
We conducted a multicenter retrospective cohort study of patients presenting for care at pediatric hospitals that report data to the Pediatric Health Information System (PHIS) database. The PHIS administrative database includes billing and utilization data from 45 US tertiary care hospitals affiliated with the Children’s Hospital Association (Lenexa, Kansas). Data quality and reliability are ensured through a joint validation effort between the Children’s Hospital Association and participating hospitals. Hospitals submit discharge data, including demographics, diagnoses, and procedures using International Classification of Diseases, 10th Revision (ICD-10) codes, along with daily detailed information on pharmacy, location of care, and other services.
Study Population
Patients 30 days to 18 years of age discharged from the emergency department (ED) or inpatient setting with a primary diagnosis of COVID-19 (ICD-10 codes U.071 and U.072) between April 1, 2020, and September 30, 2020, were eligible for inclusion.14 In a prior study, the positive predictive value of an ICD-10–coded diagnosis of COVID-19 among hospitalized pediatric patients was 95.5%, compared with reverse transcription polymerase reaction results or presence of MIS-C.15 The diagnostic code for COVID-19 (ICD-10-CM) also had a high sensitivity (98.0%) in the hospitalized population.16 Acknowledging the increasing practice of screening patients upon admission, and in an attempt to minimize potential misclassification, we did not include encounters with secondary diagnoses of COVID-19 in our primary analyses. Pediatric patients with surgical diagnoses and neonates who never left the hospital were also excluded.
Factors Associated With Severe COVID-19 Disease
Exposures of interest were determined a priori based on current evidence in the literature and included patient age (0-4 years, 5-11 years, and 12-18 years), sex, race and ethnicity (non-Hispanic White, non-Hispanic Black, Hispanic, Asian, other non-White race [defined as Pacific Islander, Native American, or other]), payor type, cardiovascular complex chronic conditions (CCC), neuromuscular CCC, obesity/type 2 diabetes mellitus (DM), pulmonary CCC, asthma (defined using ICD-10 codes17), and immunocompromised CCC
Pediatric Complications and Conditions Associated With COVID-19
Based on current evidence and expert opinion of study members, associated diagnoses and complications co-occurring with a COVID-19 diagnosis were defined a priori and identified through ICD-10 codes (Appendix Table 1). These included acute kidney injury, acute liver injury, aseptic meningitis, asthma exacerbation, bronchiolitis, cerebral infarction, croup, encephalitis, encephalopathy, infant fever, febrile seizure, gastroenteritis/dehydration, Kawasaki disease/MIS-C, myocarditis/pericarditis, pneumonia, lung effusion or empyema, respiratory failure, sepsis, nonfebrile seizure, pancreatitis, sickle cell complications, and thrombotic complications.
Outcomes
COVID-19 severity outcomes were assessed as follows: (1) mild = ED discharge; (2) moderate = inpatient admission; (3) severe = intensive care unit (ICU) admission without mechanical ventilation, shock, or death; and (4) very severe = ICU admission with mechanical ventilation, shock, or death.19 This ordinal ranking system did not violate the proportional odds assumption. Potential reasons for admission to the ICU without mechanical ventilation, shock, or death include, but are not limited to, need for noninvasive ventilation, vital sign instability, dysrhythmias, respiratory insufficiency, or complications arising from concurrent conditions (eg, thrombotic events, need for continuous albuterol therapy). We examined several secondary, hospital-based outcomes, including associated diagnoses and complications, all-cause 30-day healthcare reutilization (ED visit or rehospitalization), length of stay (LOS), and ICU LOS.
Statistical Analysis
Demographic characteristics were summarized using frequencies and percentages for categorical variables and geometric means with SD and medians with interquartile ranges (IQR) for continuous variables, as appropriate. Factors associated with hospitalization (encompassing severity levels 2-4) vs ED discharge (severity level 1) were assessed using logistic regression. Factors associated with increasing severity among hospitalized pediatric patients (severity levels 2, 3, and 4) were assessed using ordinal logistic regression. Covariates in these analyses included race and ethnicity, age, sex, payor, cardiovascular CCC, neurologic/neuromuscular CCC, obesity/type 2 DM, pulmonary CCC, asthma, and immunocompromised CCC. Adjusted odds ratios (aOR) and corresponding 95% CI for each risk factor were generated using generalized linear mixed effects models and random intercepts for each hospital. Given the potential for diagnostic misclassification of pediatric patients with COVID-19 based on primary vs secondary diagnoses, we performed sensitivity analyses defining the study population as those with a primary diagnosis of COVID-19 and those with a secondary diagnosis of COVID-19 plus a concurrent primary diagnosis of a condition associated with COVID-19 (Appendix Table 1).
All analyses were performed using SAS version 9.4 (SAS Institute, Inc), and P < .05 was considered statistically significant. The Institutional Review Board at Vanderbilt University Medical Center determined that this study of de-identified data did not meet the criteria for human subjects research.
RESULTS
Study Population
A total of 19,976 encounters were included in the study. Of those, 15,913 (79.7%) were discharged from the ED and 4063 (20.3%) were hospitalized (Table 1). The most common race/ethnicity was Hispanic (9741, 48.8%), followed by non-Hispanic White (4217, 21.1%). Reference race/ethnicity data for the overall 2019 PHIS population can be found in Appendix Table 2.
The severity distribution among the hospitalized population was moderate (3222, 79.3%), severe (431, 11.3%), and very severe (380, 9.4%). The frequency of COVID-19 diagnoses increased late in the study period (Figure). Among those hospitalized, the median LOS for the index admission was 2 days (IQR, 1-4), while among those admitted to the ICU, the median LOS was 3 days (IQR, 2-5).
Overall, 10.1% (n = 2020) of the study population had an all-cause repeat encounter (ie, subsequent ED encounter or hospitalization) within 30 days following the index discharge. Repeat encounters were more frequent among patients hospitalized than among those discharged from the ED (Appendix Table 3).
Prevalence of Conditions and Complications Associated With COVID-19
Overall, 3257 (16.3%) patients had one or more co-occurring diagnoses categorized as a COVID-19–associated condition or complication. The most frequent diagnoses included lower respiratory tract disease (pneumonia, lung effusion, or empyema; n = 1415, 7.1%), gastroenteritis/dehydration (n = 1068, 5.3%), respiratory failure (n = 731, 3.7%), febrile infant (n = 413, 2.1%), and nonfebrile seizure (n = 425, 2.1%). Aside from nonfebrile seizure, neurological complications were less frequent and included febrile seizure (n = 155, 0.8%), encephalopathy (n = 63, 0.3%), aseptic meningitis (n = 16, 0.1%), encephalitis (n = 11, 0.1%), and cerebral infarction (n = 6, <0.1%). Kawasaki disease and MIS-C comprised 1.7% (n = 346) of diagnoses. Thrombotic complications occurred in 0.1% (n = 13) of patients. Overall, these conditions and complications associated with COVID-19 were more frequent in hospitalized patients than in those discharged from the ED (P < .001) (Table 2).
Factors Associated With COVID-19 Disease Severity
Compared to pediatric patients with COVID-19 discharged from the ED, factors associated with increased odds of hospitalization included private payor insurance; obesity/type 2 DM; asthma; and cardiovascular, immunocompromised, neurologic/neuromuscular, and pulmonary CCCs (Table 3). Factors associated with decreased risk of hospitalization included Black race or Hispanic ethnicity compared with White race; female sex; and age 5 to 11 years and age 12 to 17 years (vs age 0-4 years). Among children and adolescents hospitalized with COVID-19, factors associated with greater disease severity included Black or other non-White race; age 5 to 11 years; age 12 to 17 years; obesity/type 2 DM; immunocompromised conditions; and cardiovascular, neurologic/neuromuscular, and pulmonary CCCs (Table 3).
Sensitivity Analysis
We performed a sensitivity analysis that expanded the study population to include those with a secondary diagnosis of COVID-19 plus a diagnosis of a COVID-19–associated condition or complication. Analyses using the expanded population (N = 21,247) were similar to the primary analyses (Appendix Table 4 and Appendix Table 5).
DISCUSSION
In this large multicenter study evaluating COVID-19 disease severity in more than 19,000 patients presenting for emergency care at US pediatric hospitals, approximately 20% were hospitalized, and among those hospitalized almost a quarter required ICU care. Clinical risk factors associated with increased risk of hospitalization include private payor status and selected comorbidities (obesity/type 2 DM; asthma; and cardiovascular, pulmonary, immunocompromised, neurologic/neuromuscular CCCs), while those associated with decreased risk of hospitalization include older age, female sex, and Black race or Hispanic ethnicity. Factors associated with severe disease among hospitalized pediatric patients include Black or other non-White race, school age (≥5 years), and certain chronic conditions (cardiovascular disease, obesity/type 2 DM, neurologic or neuromuscular disease). Sixteen percent of patients had a concurrent diagnosis for a condition or complication associated with COVID-19.
While the study population (ie, children and adolescents presenting to the ED) represents a small fraction of children and adolescents in the community with SARS-CoV-2 infection, the results provide important insight into factors of severe COVID-19 in the pediatric population. A report from France suggested ventilatory or hemodynamic support or death were independently associated with older age (≥10 years), elevated C-reactive protein, and hypoxemia.12 An Italian study found that younger age (0-4 years) was associated with less severe disease, while preexisting conditions were more likely in patients with severe disease.11 A single-center case series of 50 patients (aged ≤21 years) hospitalized at a children’s hospital in New York City found respiratory failure (n = 9) was more common in children older than 1 year, patients with elevated inflammatory markers, and patients with obesity.20
Our study confirms several factors for severe COVID-19 found in these studies, including older age,11,12,20 obesity,20 and preexisting conditions.11 Our findings also expand on these reports, including identification of factors associated with hospitalization. Given the rate of 30-day re-encounters among pediatric patients with COVID-19 (10.1%), identifying risk factors for hospitalization may aid ED providers in determining optimal disposition (eg, home, hospital admission, ICU). We also identified specific comorbidities associated with more severe disease in those hospitalized with COVID-19, such as cardiovascular disease, obesity/type 2 DM, and pulmonary, neurologic, or neuromuscular conditions. We also found that asthma increased the risk for hospitalization but not more severe disease among those hospitalized. This latter finding also aligns with recent single-center studies,21,22 whereas a Turkish study of pediatric patients aged 0 to 18 years found no association between asthma and COVID-19 hospitalizations.23We also examined payor type and racial/ethnic factors in our analysis. In 2019, patients who identified as Black or Hispanic comprised 52.3% of all encounters and 40.7% of hospitalizations recorded in the PHIS database. During the same year, encounters for influenza among Black or Hispanic pediatric patients comprised 58.7% of all influenza diagnoses and 47.0% of pediatric influenza hospitalizations (Appendix Table 2). In this study, patients who identified as Black or Hispanic race represented a disproportionately large share of patients presenting to children’s hospitals (68.5%) and of those hospitalized (60.8%). Hispanic ethnicity, in particular, represented a disproportionate share of patients seeking care for COVID-19 compared to the overall PHIS population (47.7% and 27.1%, respectively). After accounting for other factors, we found Black and other non-White race—but not of Hispanic ethnicity—were independently associated with more disease severity among those hospitalized. This contrasts with findings from a recent adult study by Yehia et al,24 who found (after adjusting for other clinical factors) no significant difference in mortality between Black patients and White patients among adults hospitalized due to COVID-19. It also contrasts with a recent large population-based UK study wherein pediatric patients identifying as Asian, but not Black or mixed race or ethnicity, had an increased risk of hospital admission and admission to the ICU compared to children identifying as White. Children identifying as Black or mixed race had longer hospital admissions.25 However, as the authors of the study note, residual confounders and ascertainment bias due to differences in COVID testing may have influenced these findings.
Our findings of differences in hospitalization and disease severity among those hospitalized by race and ethnicity should be interpreted carefully. These may reflect a constellation of factors that are difficult to measure, including differences in healthcare access, inequalities in care (including hospital admission inequalities), and implicit bias—all of which may reflect structural racism. For example, it is possible that children who identify as Black or Hispanic have different access to care compared to children who identify as White, and this may affect disease severity on presentation.2 Alternatively, it is possible that White pediatric patients are more likely to be hospitalized as compared to non-White pediatric patients with similar illness severity. Our finding that pediatric patients who identify as Hispanic or Black had a lower risk of hospitalization should be also interpreted carefully, as this may reflect higher utilization of the ED for SARS-CoV-2 testing, increased use of nonemergency services among those without access to primary care, or systematic differences in provider decision-making among this segment of the population.2 Further study is needed to determine specific drivers for racial and ethnic differences in healthcare utilization in children and adolescents with COVID-19.26
Complications and co-occurring diagnoses in adults with COVID-19 are well documented.27-30 However, there is little information to date on the co-occurring diagnoses and complications associated with COVID-19 in children and adolescents. We found that complications and co-occurring conditions occurred in 16.3% of the study population, with the most frequent conditions including known complications of viral infections such as pneumonia, respiratory failure, and seizures. Acute kidney and liver injury, as well as thrombotic complications, occurred less commonly than in adults.26-29 Interestingly, neurologic complications were also uncommon compared to adult reports8,31 and less frequent than in other viral illnesses in children and adolescents. For example, neurologic complications occur in approximately 7.5% of children and adolescents hospitalized with influenza.32
Limitations of the present study include the retrospective design, as well as incomplete patient-level clinical data in the PHIS database. The PHIS database only includes children’s hospitals, which may limit the generalizability of findings to community hospitals. We also excluded newborns, and our findings may not be generalizable to this population. We only included children and adolescents with a primary diagnosis of COVID-19, which has the potential for misclassification in cases where COVID-19 was a secondary diagnosis. However, results of our sensitivity analysis, which incorporated secondary diagnoses of COVID-19, were consistent with findings from our main analyses. Our study was designed to examine associations between certain prespecified factors and COVID-19 severity among pediatric patients who visited the ED or were admitted to the hospital during the COVID-19 pandemic. Thus, our findings must be interpreted in light of these considerations and may not be generalizable outside the ED or hospital setting. For example, it could be that some segments of the population utilized ED resources for testing, whereas others avoided the ED and other healthcare settings for fear of exposure to SARS-CoV-2. We also relied on diagnosis codes to identify concurrent diagnoses, as well as mechanical ventilation in our very severe outcome cohort, which resulted in this classification for some of these diagnoses. Despite these limitations, our findings represent an important step in understanding the risk factors associated with severe clinical COVID-19 disease in pediatric patients.
Our findings may inform future research and clinical interventions. Future studies on antiviral therapies and immune modulators targeting SARS-CoV-2 infection in children and adolescents should focus on high-risk populations, such as those identified in the study, as these patients are most likely to benefit from therapeutic interventions. Similarly, vaccine-development efforts may benefit from additional evaluation in high-risk populations, some of which may have altered immune responses. Furthermore, with increasing vaccination among adults and changes in recommendations, societal mitigation efforts (eg, masking, physical distancing) will diminish. Continued vigilance and COVID-19–mitigation efforts among high-risk children, for whom vaccines are not yet available, are critical during this transition.
CONCLUSION
Among children with COVID-19 who received care at children’s hospitals and EDs, 20% were hospitalized, and, of those, 21% were admitted to the ICU. Older children and adolescent patients had a lower risk of hospitalization; however, when hospitalized, they had greater illness severity. Those with selected comorbidities (eg, cardiovascular, obesity/type 2 DM, pulmonary and neurologic or neuromuscular disease) had both increased odds of hospitalization and in-hospital illness severity. While there were observed differences in COVID-19 severity by race and ethnicity, additional research is needed to clarify the drivers of such disparities. These factors should be considered when prioritizing mitigation strategies to prevent infection (eg, remote learning, avoidance of group activities, prioritization of COVID-19 vaccine when approved for children aged <12 years).
1. Centers for Disease Control and Prevention. COVID data tracker. Accessed September 9, 2021. https://covid.cdc.gov/covid-data-tracker/#datatracker-home
2. Levy C, Basmaci R, Bensaid P, et al. Changes in reverse transcription polymerase chain reaction-positive severe acute respiratory syndrome coronavirus 2 rates in adults and children according to the epidemic stages. Pediatr Infect Dis J. 2020;39(11):e369-e372. https://doi.org/10.1097/inf.0000000000002861
3. Gudbjartsson DF, Helgason A, Jonsson H, et al. Spread of SARS-CoV-2 in the Icelandic population. N Engl J Med. 2020;382(24):2302-2315. https://doi.org/10.1056/nejmoa2006100
4. Garg S, Kim L, Whitaker M, et al. Hospitalization rates and characteristics of patients hospitalized with laboratory-confirmed coronavirus disease 2019 - COVID-NET, 14 States, March 1-30, 2020. MMWR Morb Mortal Wkly Rep. 2020;69(15):458-464. https://doi.org/10.15585/mmwr.mm6915e3
5. Castagnoli R, Votto M, Licari A, et al. Severe acute respiratory syndrome coronavirus 2 (SARS-CoV-2) infection in children and adolescents: a systematic review. JAMA Pediatr. 2020;174(9):882-889. https://doi.org/10.1001/jamapediatrics.2020.1467
6. Feldstein LR, Rose EB, Horwitz SM, et al; Overcoming COVID-19 Investigators; CDC COVID-19 Response Team. Multisystem inflammatory syndrome in U.S. children and adolescents. N Engl J Med. 2020;383(4):334-346. https://doi.org/10.1056/nejmoa2021680
7. Magro B, Zuccaro V, Novelli L, et al. Predicting in-hospital mortality from coronavirus disease 2019: a simple validated app for clinical use. PLoS One. 2021;16(1):e0245281. https://doi.org/10.1371/journal.pone.0245281
8. Helms J, Kremer S, Merdji H, et al. Neurologic features in severe SARS-CoV-2 infection. N Engl J Med. 2020;382(23):2268-2270. https://doi.org/10.1056/nejmc2008597
9. Severe Covid GWAS Group; Ellinghaus D, Degenhardt F, Bujanda L, et al. Genomewide association study of severe Covid-19 with respiratory failure. N Engl J Med. 2020;383(16):1522-1534.
10. Kabarriti R, Brodin NP, Maron MI, et al. association of race and ethnicity with comorbidities and survival among patients with COVID-19 at an urban medical center in New York. JAMA Netw Open. 2020;3(9):e2019795. https://doi.org/10.1001/jamanetworkopen.2020.19795
11. Bellino S, Punzo O, Rota MC, et al; COVID-19 Working Group. COVID-19 disease severity risk factors for pediatric patients in Italy. Pediatrics. 2020;146(4):e2020009399. https://doi.org/10.1542/peds.2020-009399
12. Ouldali N, Yang DD, Madhi F, et al; investigator group of the PANDOR study. Factors associated with severe SARS-CoV-2 infection. Pediatrics. 2020;147(3):e2020023432. https://doi.org/10.1542/peds.2020-023432
13. Castells MC, Phillips EJ. Maintaining safety with SARS-CoV-2 vaccines. N Engl J Med. 2021;384(7):643-649. https://doi.org/10.1056/nejmra2035343
14. Antoon JW, Williams DJ, Thurm C, et al. The COVID-19 pandemic and changes in healthcare utilization for pediatric respiratory and nonrespiratory illnesses in the United States. J Hosp Med. 2021;16(5):294-297. https://doi.org/10.12788/jhm.3608
15. Blatz AM, David MZ, Otto WR, Luan X, Gerber JS. Validation of International Classification of Disease-10 code for identifying children hospitalized with coronavirus disease-2019. J Pediatric Infect Dis Soc. 2020;10(4):547-548. https://doi.org/10.1093/jpids/piaa140
16. Kadri SS, Gundrum J, Warner S, et al. Uptake and accuracy of the diagnosis code for COVID-19 among US hospitalizations. JAMA. 2020;324(24):2553-2554. https://doi.org/10.1001/jama.2020.20323
17. Kaiser SV, Rodean J, Bekmezian A, et al; Pediatric Research in Inpatient Settings (PRIS) Network. Effectiveness of pediatric asthma pathways for hospitalized children: a multicenter, national analysis. J Pediatr. 2018;197:165-171.e162. https://doi.org/10.1016/j.jpeds.2018.01.084
18. Feudtner C, Feinstein JA, Zhong W, Hall M, Dai D. Pediatric complex chronic conditions classification system version 2: updated for ICD-10 and complex medical technology dependence and transplantation. BMC Pediatr. 2014;14:199. https://doi.org/10.1186/1471-2431-14-199.
19. Williams DJ, Zhu Y, Grijalva CG, et al. Predicting severe pneumonia outcomes in children. Pediatrics. 2016;138(4):e20161019. https://doi.org/10.1542/peds.2016-1019
20. Zachariah P, Johnson CL, Halabi KC, et al. Epidemiology, clinical features, and disease severity in patients with coronavirus disease 2019 (COVID-19) in a children’s hospital in New York City, New York. JAMA Pediatr. 2020;174(10):e202430. https://doi.org/10.1001/jamapediatrics.2020.2430
21. DeBiasi RL, Song X, Delaney M, et al. Severe coronavirus disease-2019 in children and young adults in the Washington, DC, metropolitan region. J Pediatr. 2020;223:199-203.e191. https://doi.org/10.1016/j.jpeds.2020.05.007
22. Lovinsky-Desir S, Deshpande DR, De A, et al. Asthma among hospitalized patients with COVID-19 and related outcomes. J Allergy Clin Immunol. 2020;146(5):1027-1034.e1024. https://doi.org/10.1016/j.jaci.2020.07.026
23. Beken B, Ozturk GK, Aygun FD, Aydogmus C, Akar HH. Asthma and allergic diseases are not risk factors for hospitalization in children with coronavirus disease 2019. Ann Allergy Asthma Immunol. 2021;126(5):569-575. https://doi.org/10.1016/j.anai.2021.01.018
24. Yehia BR, Winegar A, Fogel R, et al. Association of race with mortality among patients hospitalized with coronavirus disease 2019 (COVID-19) at 92 US hospitals. JAMA Netw Open. 2020;3(8):e2018039. https://doi.org/10.1001/jamanetworkopen.2020.18039
25. Saatci D, Ranger TA, Garriga C, et al. Association between race and COVID-19 outcomes among 2.6 million children in England. JAMA Pediatr. 2021;e211685. https://doi.org/10.1001/jamapediatrics.2021.1685
26. Lopez L, 3rd, Hart LH, 3rd, Katz MH. Racial and ethnic health disparities related to COVID-19. JAMA. 2021;325(8):719-720. https://doi.org/10.1001/jama.2020.26443
27. Altunok ES, Alkan M, Kamat S, et al. Clinical characteristics of adult patients hospitalized with laboratory-confirmed COVID-19 pneumonia. J Infect Chemother. 2020. https://doi.org/10.1016/j.jiac.2020.10.020
28. Ali H, Daoud A, Mohamed MM, et al. Survival rate in acute kidney injury superimposed COVID-19 patients: a systematic review and meta-analysis. Ren Fail. 2020;42(1):393-397. https://doi.org/10.1080/0886022x.2020.1756323
29. Anirvan P, Bharali P, Gogoi M, Thuluvath PJ, Singh SP, Satapathy SK. Liver injury in COVID-19: the hepatic aspect of the respiratory syndrome - what we know so far. World J Hepatol. 2020;12(12):1182-1197. https://doi.org/10.4254/wjh.v12.i12.1182
30. Moschonas IC, Tselepis AD. SARS-CoV-2 infection and thrombotic complications: a narrative review. J Thromb Thrombolysis. 2021;52(1):111-123. https://doi.org/10.1007/s11239-020-02374-3
31. Lee MH, Perl DP, Nair G, et al. Microvascular injury in the brains of patients with Covid-19. N Engl J Med. 2020;384(5):481-483. https://doi.org/10.1056/nejmc2033369
32. Antoon JW, Hall M, Herndon A, et al. Prevalence, risk factors, and outcomes of influenza-associated neurological Complications in Children. J Pediatr. 2021;S0022-3476(21)00657-0. https://doi.org/10.1016/j.jpeds.2021.06.075
© 2021 Society of Hospital Medicine
How Organizations Can Build a Successful and Sustainable Social Media Presence
Horwitz and Detsky1 provide readers with a personal, experientially based primer on how healthcare professionals can more effectively engage on Twitter. As experienced physicians, researchers, and active social media users, the authors outline pragmatic and specific recommendations on how to engage misinformation and add value to social media discourse. We applaud the authors for offering best-practice approaches that are valuable to newcomers as well as seasoned social media users. In highlighting that social media is merely a modern tool for engagement and discussion, the authors underscore the time-held idea that only when a tool is used effectively will it yield the desired outcome. As a medical journal that regularly uses social media as a tool for outreach and dissemination, we could not agree more with the authors’ assertion.
Since 2015, the Journal of Hospital Medicine (JHM) has used social media to engage its readership and extend the impact of the work published in its pages. Like Horwitz and Detsky, JHM has developed insights and experience in how medical journals, organizations, institutions, and other academic programs can use social media effectively. Because of our experience in this area, we are often asked how to build a successful and sustainable social media presence. Here, we share five primary lessons on how to use social media as a tool to disseminate, connect, and engage.
ESTABLISH YOUR GOALS
As the flagship journal for the field of hospital medicine, we seek to disseminate the ideas and research that will inform health policy, optimize healthcare delivery, and improve patient outcomes while also building and sustaining an online community for professional engagement and growth. Our social media goals provide direction on how to interact, allow us to focus attention on what is important, and motivate our growth in this area. Simply put, we believe that using social media without defined goals would be like sailing a ship without a rudder.
KNOW YOUR AUDIENCE
As your organization establishes its goals, it is important to consider with whom you want to connect. Knowing your audience will allow you to better tailor the content you deliver through social media. For instance, we understand that as a journal focused on hospital medicine, our audience consists of busy clinicians, researchers, and medical educators who are trying to efficiently gather the most up-to-date information in our field. Recognizing this, we produce (and make available for download) Visual Abstracts and publish them on Twitter to help our followers assimilate information from new studies quickly and easily.2 Moreover, we recognize that our followers are interested in how to use social media in their professional lives and have published several articles in this topic area.3-5
BUILD YOUR TEAM
We have found that having multiple individuals on our social media team has led to greater creativity and thoughtfulness on how we engage our readership. Our teams span generations, clinical experience, institutions, and cultural backgrounds. This intentional approach has allowed for diversity in thoughts and opinions and has helped shape the JHM social media message. Additionally, we have not only formalized editorial roles through the creation of Digital Media Editor positions, but we have also created the JHM Digital Media Fellowship, a training program and development pipeline for those interested in cultivating organization-based social media experiences and skill sets.6
ENGAGE CONSISTENTLY
Many organizations believe that successful social media outreach means creating an account and posting content when convenient. Experience has taught us that daily postings and regular engagement will build your brand as a regular and reliable source of information for your followers. Additionally, while many academic journals and organizations only occasionally post material and rarely interact with their followers, we have found that engaging and facilitating conversations through our monthly Twitter discussion (#JHMChat) has established a community, created opportunities for professional networking, and further disseminated the work published in JHM.7 As an academic journal or organization entering this field, recognize the product for which people follow you and deliver that product on a consistent basis.
OWN YOUR MISTAKES
It will only be a matter of time before your organization makes a misstep on social media. Instead of hiding, we recommend stepping into that tension and owning the mistake. For example, we recently published an article that contained a culturally offensive term. As a journal, we reflected on our error and took concrete steps to correct it. Further, we shared our thoughts with our followers to ensure transparency.8 Moving forward, we have inserted specific stopgaps in our editorial review process to avoid such missteps in the future.
Although every organization will have different goals and reasons for engaging on social media, we believe these central tenets will help optimize the use of this platform. Although we have established specific objectives for our engagement on social media, we believe Horwitz and Detsky1 put it best when they note that, at the end of the day, our ultimate goal is in “…promoting knowledge and science in a way that helps us all live healthier and happier lives."
1. Horwitz LI, Detsky AS. Tweeting into the void: effective use of social media for healthcare professionals. J Hosp Med. 2021;16(10):581-582. https://doi.org/10.12788/jhm.3684
2. 2021 Visual Abstracts. Accessed September 8, 2021. https://www.journalofhospitalmedicine.com/jhospmed/page/2021-visual-abstracts
3. Kumar A, Chen N, Singh A. #ConsentObtained - patient privacy in the age of social media. J Hosp Med. 2020;15(11):702-704. https://doi.org/10.12788/jhm.3416
4. Minter DJ, Patel A, Ganeshan S, Nematollahi S. Medical communities go virtual. J Hosp Med. 2021;16(6):378-380. https://doi.org/10.12788/jhm.3532
5. Marcelin JR, Cawcutt KA, Shapiro M, Varghese T, O’Glasser A. Moment vs movement: mission-based tweeting for physician advocacy. J Hosp Med. 2021;16(8):507-509. https://doi.org/10.12788/jhm.3636
6. Editorial Fellowships (Digital Media and Editorial). Accessed September 8, 2021. https://www.journalofhospitalmedicine.com/content/editorial-fellowships-digital-media-and-editorial
7. Wray CM, Auerbach AD, Arora VM. The adoption of an online journal club to improve research dissemination and social media engagement among hospitalists. J Hosp Med. 2018;13(11):764-769. https://doi.org/10.12788/jhm.2987
8. Shah SS, Manning KD, Wray CM, Castellanos A, Jerardi KE. Microaggressions, accountability, and our commitment to doing better [editorial]. J Hosp Med. 2021;16(6):325. https://doi.org/10.12788/jhm.3646
Horwitz and Detsky1 provide readers with a personal, experientially based primer on how healthcare professionals can more effectively engage on Twitter. As experienced physicians, researchers, and active social media users, the authors outline pragmatic and specific recommendations on how to engage misinformation and add value to social media discourse. We applaud the authors for offering best-practice approaches that are valuable to newcomers as well as seasoned social media users. In highlighting that social media is merely a modern tool for engagement and discussion, the authors underscore the time-held idea that only when a tool is used effectively will it yield the desired outcome. As a medical journal that regularly uses social media as a tool for outreach and dissemination, we could not agree more with the authors’ assertion.
Since 2015, the Journal of Hospital Medicine (JHM) has used social media to engage its readership and extend the impact of the work published in its pages. Like Horwitz and Detsky, JHM has developed insights and experience in how medical journals, organizations, institutions, and other academic programs can use social media effectively. Because of our experience in this area, we are often asked how to build a successful and sustainable social media presence. Here, we share five primary lessons on how to use social media as a tool to disseminate, connect, and engage.
ESTABLISH YOUR GOALS
As the flagship journal for the field of hospital medicine, we seek to disseminate the ideas and research that will inform health policy, optimize healthcare delivery, and improve patient outcomes while also building and sustaining an online community for professional engagement and growth. Our social media goals provide direction on how to interact, allow us to focus attention on what is important, and motivate our growth in this area. Simply put, we believe that using social media without defined goals would be like sailing a ship without a rudder.
KNOW YOUR AUDIENCE
As your organization establishes its goals, it is important to consider with whom you want to connect. Knowing your audience will allow you to better tailor the content you deliver through social media. For instance, we understand that as a journal focused on hospital medicine, our audience consists of busy clinicians, researchers, and medical educators who are trying to efficiently gather the most up-to-date information in our field. Recognizing this, we produce (and make available for download) Visual Abstracts and publish them on Twitter to help our followers assimilate information from new studies quickly and easily.2 Moreover, we recognize that our followers are interested in how to use social media in their professional lives and have published several articles in this topic area.3-5
BUILD YOUR TEAM
We have found that having multiple individuals on our social media team has led to greater creativity and thoughtfulness on how we engage our readership. Our teams span generations, clinical experience, institutions, and cultural backgrounds. This intentional approach has allowed for diversity in thoughts and opinions and has helped shape the JHM social media message. Additionally, we have not only formalized editorial roles through the creation of Digital Media Editor positions, but we have also created the JHM Digital Media Fellowship, a training program and development pipeline for those interested in cultivating organization-based social media experiences and skill sets.6
ENGAGE CONSISTENTLY
Many organizations believe that successful social media outreach means creating an account and posting content when convenient. Experience has taught us that daily postings and regular engagement will build your brand as a regular and reliable source of information for your followers. Additionally, while many academic journals and organizations only occasionally post material and rarely interact with their followers, we have found that engaging and facilitating conversations through our monthly Twitter discussion (#JHMChat) has established a community, created opportunities for professional networking, and further disseminated the work published in JHM.7 As an academic journal or organization entering this field, recognize the product for which people follow you and deliver that product on a consistent basis.
OWN YOUR MISTAKES
It will only be a matter of time before your organization makes a misstep on social media. Instead of hiding, we recommend stepping into that tension and owning the mistake. For example, we recently published an article that contained a culturally offensive term. As a journal, we reflected on our error and took concrete steps to correct it. Further, we shared our thoughts with our followers to ensure transparency.8 Moving forward, we have inserted specific stopgaps in our editorial review process to avoid such missteps in the future.
Although every organization will have different goals and reasons for engaging on social media, we believe these central tenets will help optimize the use of this platform. Although we have established specific objectives for our engagement on social media, we believe Horwitz and Detsky1 put it best when they note that, at the end of the day, our ultimate goal is in “…promoting knowledge and science in a way that helps us all live healthier and happier lives."
1. Horwitz LI, Detsky AS. Tweeting into the void: effective use of social media for healthcare professionals. J Hosp Med. 2021;16(10):581-582. https://doi.org/10.12788/jhm.3684
2. 2021 Visual Abstracts. Accessed September 8, 2021. https://www.journalofhospitalmedicine.com/jhospmed/page/2021-visual-abstracts
3. Kumar A, Chen N, Singh A. #ConsentObtained - patient privacy in the age of social media. J Hosp Med. 2020;15(11):702-704. https://doi.org/10.12788/jhm.3416
4. Minter DJ, Patel A, Ganeshan S, Nematollahi S. Medical communities go virtual. J Hosp Med. 2021;16(6):378-380. https://doi.org/10.12788/jhm.3532
5. Marcelin JR, Cawcutt KA, Shapiro M, Varghese T, O’Glasser A. Moment vs movement: mission-based tweeting for physician advocacy. J Hosp Med. 2021;16(8):507-509. https://doi.org/10.12788/jhm.3636
6. Editorial Fellowships (Digital Media and Editorial). Accessed September 8, 2021. https://www.journalofhospitalmedicine.com/content/editorial-fellowships-digital-media-and-editorial
7. Wray CM, Auerbach AD, Arora VM. The adoption of an online journal club to improve research dissemination and social media engagement among hospitalists. J Hosp Med. 2018;13(11):764-769. https://doi.org/10.12788/jhm.2987
8. Shah SS, Manning KD, Wray CM, Castellanos A, Jerardi KE. Microaggressions, accountability, and our commitment to doing better [editorial]. J Hosp Med. 2021;16(6):325. https://doi.org/10.12788/jhm.3646
© 2021 Society of Hospital Medicine
Antipsychotics tied to increased breast cancer risk
Use of antipsychotics that increase prolactin levels is significantly associated with an increased risk for breast cancer in women with schizophrenia, new research suggests. However, at least one expert says that, at this point, clinical implications are premature.

Investigators compared data from Finnish nationwide registers on more than 30,000 women diagnosed with schizophrenia. Of those patients, 1,069 were diagnosed with breast cancer. Results showed that long-term exposure to prolactin-increasing antipsychotics was associated with a 56% increased risk of developing breast cancer in comparison with exposure of short duration. No significant association was found with cumulative exposure to prolactin-sparing antipsychotics.
“In case of planning for long-term antipsychotic [therapy], prefer non–prolactin-raising antipsychotics in females and inform patients about a potential risk to allow for informed shared decision-making,” study coauthor Christoph U. Correll, MD, professor of psychiatry and molecular medicine at Hofstra University, Hempstead, N.Y., told this news organization.
“ he said.
The study was published online Aug. 30, 2021, in The Lancet.
A ‘relevant contribution’
Breast cancer is 25% more prevalent among women with schizophrenia than among women in the general population. Antipsychotics have long been suspected as a potential culprit, but research results have been inconsistent, said Dr. Correll.
In addition, high concentrations of prolactin are associated with a higher risk of developing breast cancer, but most previous research did not distinguish between antipsychotics that increased prolactin levels those that did not.
Dr. Correll and colleagues “wanted to add to this literature by utilizing a generalizable nationwide sample with a sufficient large number of patients and sufficiently long follow-up to address the clinically very relevant question whether antipsychotic use could increase the risk of breast cancer.”
They also believed that grouping antipsychotics into prolactin-raising and non–prolactin-raising agents would be “a relevant contribution.”
The researchers drew on data from several large Finnish databases to conduct a nested case-control study of 30,785 women aged at least16 years who were diagnosed with schizophrenia between 1972 and 2014.
Of these patients, 1,069 received an initial diagnosis of invasive breast cancer (after being diagnosed with schizophrenia) between 2000 and 2017. These case patients were compared to 5,339 matched control patients. The mean age of the case patients and the control patients was 62 years. The mean time since initial diagnosis of schizophrenia was 24 years.
Antipsychotic use was divided into three periods: less than 1 year, 1-4 years, and ≥5 years. Antipsychotics were further divided into prolactin-increasing or prolactin-sparing drugs (for example, clozapine, quetiapine, or aripiprazole). Breast cancer was divided into either lobular or ductal adenocarcinoma.
In their statistical analyses, the researchers adjusted for an array of covariates, including previous diagnoses of other medical conditions, drugs that may modify the risk for breast cancer (for example, beta-blockers, calcium channel blockers, spironolactone, loop diuretics, and statins), substance misuse, suicide attempt, parity, and use of hormone replacement therapy (HRT).
‘Clinically meaningful’ risk
Ductal adenocarcinoma was more common than lobular adenocarcinoma (73% vs. 20% among case patients). A higher proportion of case patients used cardiovascular medications and HRT, compared with control patients.
A higher proportion of case patients had used prolactin-increasing antipsychotics for at least 5 years, compared with control patients (71.4% vs. 64.3%; adjusted odds ratio, 1.56; 95% CI, 1.27-1.92; P < .0001) in comparison with minimal exposure (<1 year) to prolactin-increasing antipsychotics.
On the other hand, a similar proportion of case patients and control patients used prolactin-sparing antipsychotics for at least 5 years (8.3 vs. 8.2%; aOR, 1.19; 95% CI, 0.90-1.58); the OR of 1.19 was not deemed significant.
Although exposure of ≥5 years to prolactin-increasing antipsychotics was associated with an increased risk for both types of adenocarcinoma, the risk was higher for lobular than for ductal disease (aOR, 2.36; 95% CI, 1.46-3.82 vs. aOR, 1.42; 95% CI, 1.12-1.80).
“Conservatively, if we subtract the 19% nonsignificantly increased odds with prolactin-sparing antipsychotics from the 56% significantly increased odds with prolactin-increasing antipsychotics, we obtain a 37% relative increase in odds,” the authors noted.
“Using a lifetime incidence of breast cancer in women in the general population of about 12%, with a somewhat higher lifetime incidence in patients with schizophrenia than the general population, this difference between prolactin-increasing versus prolactin-sparing antipsychotics in breast cancer risk upon exposure of 5 or more years would correspond to about a 4% (37% x 12%) increase in absolute breast cancer odds with prolactin-increasing antipsychotic treatment” – a difference the authors call “clinically meaningful.”
Correll noted that although the study was conducted in a Finnish population, the findings are generalizable to other populations.
Clinical implications premature?
Commenting on the study, Anton Pottegård, MScPharm, PhD, DMSc, professor of pharmacoepidemiology, department of public health, University of Southern Denmark, Odense, expressed concern that “this new study is fairly aggressive in its recommendation [that] we need to pay attention to hyperprolactinemia, as this seems to cause breast cancer.”
Dr. Pottegård, who is also the head of research, Hospital Pharmacy Funen, Odense University Hospital, who was not involved with the study, said he does not “think that the full body of the literature supports such a direct conclusion and/or direct inference to clinical practice.”
Although “this is an important study to further this work, I do not think we are at a place (yet) where it should lead to different action from clinicians,” Dr. Pottegård cautioned.
Also commenting on the study, Mary Seeman, MDCM, DSc, professor emeritus of neurosciences and clinical translation, department of psychiatry, University of Toronto, called the question of whether prolactin-increasing antipsychotics increase breast cancer risk “very complicated because the incidence of breast cancer ... is higher in women with schizophrenia than in other women.”
Dr. Seeman, who was not involved with the study, pointed to other reasons for the increased risk, including higher rates of obesity, substance abuse, cigarette smoking, stress, and sedentary behavior, all of which raise prolactin levels. Additionally, “protective factors such as pregnancies and breastfeeding are less frequent in women with schizophrenia than in their peers.” Women with schizophrenia also “tend not to do breast screening, see their doctors less often, follow doctors’ orders less rigorously, and obtain treatment less often.”
The take-home message “is to prescribe prolactin-sparing medication to women if at all possible – but until we know more, that is good advice, although not always possible because the illness for which the antipsychotics are prescribed may not respond to those particular medications,” Dr. Seeman said.
The study was funded by the Finnish Ministry of Social Affairs and Health through the developmental fund for Niuvanniemi Hospital. Funding was also provided to individual researchers by the Academy of Finland, the Finnish Medical Foundation, and the Emil Aaltonen foundation. Dr. Correll has been a consultant or advisor to or has received honoraria from numerous companies. He has provided expert testimony for Janssen and Otsuka; received royalties from UpToDate and is a stock option holder of LB Pharma; served on a data safety monitoring board for Lundbeck, Rovi, Supernus, and Teva; and received grant support from Janssen and Takeda. Dr. Pottegård and Dr. Seeman disclosed no relevant financial relationships.
A version of this article first appeared on Medscape.com.
Use of antipsychotics that increase prolactin levels is significantly associated with an increased risk for breast cancer in women with schizophrenia, new research suggests. However, at least one expert says that, at this point, clinical implications are premature.
Investigators compared data from Finnish nationwide registers on more than 30,000 women diagnosed with schizophrenia. Of those patients, 1,069 were diagnosed with breast cancer. Results showed that long-term exposure to prolactin-increasing antipsychotics was associated with a 56% increased risk of developing breast cancer in comparison with exposure of short duration. No significant association was found with cumulative exposure to prolactin-sparing antipsychotics.
“In case of planning for long-term antipsychotic [therapy], prefer non–prolactin-raising antipsychotics in females and inform patients about a potential risk to allow for informed shared decision-making,” study coauthor Christoph U. Correll, MD, professor of psychiatry and molecular medicine at Hofstra University, Hempstead, N.Y., told this news organization.
“ he said.
The study was published online Aug. 30, 2021, in The Lancet.
A ‘relevant contribution’
Breast cancer is 25% more prevalent among women with schizophrenia than among women in the general population. Antipsychotics have long been suspected as a potential culprit, but research results have been inconsistent, said Dr. Correll.
In addition, high concentrations of prolactin are associated with a higher risk of developing breast cancer, but most previous research did not distinguish between antipsychotics that increased prolactin levels those that did not.
Dr. Correll and colleagues “wanted to add to this literature by utilizing a generalizable nationwide sample with a sufficient large number of patients and sufficiently long follow-up to address the clinically very relevant question whether antipsychotic use could increase the risk of breast cancer.”
They also believed that grouping antipsychotics into prolactin-raising and non–prolactin-raising agents would be “a relevant contribution.”
The researchers drew on data from several large Finnish databases to conduct a nested case-control study of 30,785 women aged at least16 years who were diagnosed with schizophrenia between 1972 and 2014.
Of these patients, 1,069 received an initial diagnosis of invasive breast cancer (after being diagnosed with schizophrenia) between 2000 and 2017. These case patients were compared to 5,339 matched control patients. The mean age of the case patients and the control patients was 62 years. The mean time since initial diagnosis of schizophrenia was 24 years.
Antipsychotic use was divided into three periods: less than 1 year, 1-4 years, and ≥5 years. Antipsychotics were further divided into prolactin-increasing or prolactin-sparing drugs (for example, clozapine, quetiapine, or aripiprazole). Breast cancer was divided into either lobular or ductal adenocarcinoma.
In their statistical analyses, the researchers adjusted for an array of covariates, including previous diagnoses of other medical conditions, drugs that may modify the risk for breast cancer (for example, beta-blockers, calcium channel blockers, spironolactone, loop diuretics, and statins), substance misuse, suicide attempt, parity, and use of hormone replacement therapy (HRT).
‘Clinically meaningful’ risk
Ductal adenocarcinoma was more common than lobular adenocarcinoma (73% vs. 20% among case patients). A higher proportion of case patients used cardiovascular medications and HRT, compared with control patients.
A higher proportion of case patients had used prolactin-increasing antipsychotics for at least 5 years, compared with control patients (71.4% vs. 64.3%; adjusted odds ratio, 1.56; 95% CI, 1.27-1.92; P < .0001) in comparison with minimal exposure (<1 year) to prolactin-increasing antipsychotics.
On the other hand, a similar proportion of case patients and control patients used prolactin-sparing antipsychotics for at least 5 years (8.3 vs. 8.2%; aOR, 1.19; 95% CI, 0.90-1.58); the OR of 1.19 was not deemed significant.
Although exposure of ≥5 years to prolactin-increasing antipsychotics was associated with an increased risk for both types of adenocarcinoma, the risk was higher for lobular than for ductal disease (aOR, 2.36; 95% CI, 1.46-3.82 vs. aOR, 1.42; 95% CI, 1.12-1.80).
“Conservatively, if we subtract the 19% nonsignificantly increased odds with prolactin-sparing antipsychotics from the 56% significantly increased odds with prolactin-increasing antipsychotics, we obtain a 37% relative increase in odds,” the authors noted.
“Using a lifetime incidence of breast cancer in women in the general population of about 12%, with a somewhat higher lifetime incidence in patients with schizophrenia than the general population, this difference between prolactin-increasing versus prolactin-sparing antipsychotics in breast cancer risk upon exposure of 5 or more years would correspond to about a 4% (37% x 12%) increase in absolute breast cancer odds with prolactin-increasing antipsychotic treatment” – a difference the authors call “clinically meaningful.”
Correll noted that although the study was conducted in a Finnish population, the findings are generalizable to other populations.
Clinical implications premature?
Commenting on the study, Anton Pottegård, MScPharm, PhD, DMSc, professor of pharmacoepidemiology, department of public health, University of Southern Denmark, Odense, expressed concern that “this new study is fairly aggressive in its recommendation [that] we need to pay attention to hyperprolactinemia, as this seems to cause breast cancer.”
Dr. Pottegård, who is also the head of research, Hospital Pharmacy Funen, Odense University Hospital, who was not involved with the study, said he does not “think that the full body of the literature supports such a direct conclusion and/or direct inference to clinical practice.”
Although “this is an important study to further this work, I do not think we are at a place (yet) where it should lead to different action from clinicians,” Dr. Pottegård cautioned.
Also commenting on the study, Mary Seeman, MDCM, DSc, professor emeritus of neurosciences and clinical translation, department of psychiatry, University of Toronto, called the question of whether prolactin-increasing antipsychotics increase breast cancer risk “very complicated because the incidence of breast cancer ... is higher in women with schizophrenia than in other women.”
Dr. Seeman, who was not involved with the study, pointed to other reasons for the increased risk, including higher rates of obesity, substance abuse, cigarette smoking, stress, and sedentary behavior, all of which raise prolactin levels. Additionally, “protective factors such as pregnancies and breastfeeding are less frequent in women with schizophrenia than in their peers.” Women with schizophrenia also “tend not to do breast screening, see their doctors less often, follow doctors’ orders less rigorously, and obtain treatment less often.”
The take-home message “is to prescribe prolactin-sparing medication to women if at all possible – but until we know more, that is good advice, although not always possible because the illness for which the antipsychotics are prescribed may not respond to those particular medications,” Dr. Seeman said.
The study was funded by the Finnish Ministry of Social Affairs and Health through the developmental fund for Niuvanniemi Hospital. Funding was also provided to individual researchers by the Academy of Finland, the Finnish Medical Foundation, and the Emil Aaltonen foundation. Dr. Correll has been a consultant or advisor to or has received honoraria from numerous companies. He has provided expert testimony for Janssen and Otsuka; received royalties from UpToDate and is a stock option holder of LB Pharma; served on a data safety monitoring board for Lundbeck, Rovi, Supernus, and Teva; and received grant support from Janssen and Takeda. Dr. Pottegård and Dr. Seeman disclosed no relevant financial relationships.
A version of this article first appeared on Medscape.com.
Urticaria and edema in a 2-year-old boy
A 2-YEAR-OLD BOY presented to the emergency room with a 1-day history of a diffuse, mildly pruritic rash and swelling of his knees, ankles, and feet following treatment of acute otitis media with amoxicillin for the previous 8 days. He was mildly febrile and consolable, but he was refusing to walk. His medical history was unremarkable.
Physical examination revealed erythematous annular wheals on his chest, face, back, and extremities. Lymphadenopathy and mucous membrane involvement were not present. A complete blood count (CBC) with differential, inflammatory marker tests, and a comprehensive metabolic panel were ordered. Given the joint swelling and rash, the patient was admitted for observation.
During his second day in the hospital, his skin lesions enlarged and several formed dusky blue centers (FIGURE 1A). He also developed swelling of his hands (FIGURE 1B).

WHAT IS YOUR DIAGNOSIS?
HOW WOULD YOU TREAT THIS PATIENT?
Diagnosis: Urticaria multiforme
The patient’s lab work came back within normal range, except for an elevated white blood cell count (19,700/mm3; reference range, 4500-13,500/mm3). His mild systemic symptoms, skin lesions without blistering or necrosis, acral edema, and the absence of lymphadenopathy pointed to a diagnosis of urticaria multiforme.
Urticaria multiforme, also called acute annular urticaria or acute urticarial hypersensitivity syndrome, is a histamine-mediated hypersensitivity reaction characterized by transient annular, polycyclic, urticarial lesions with central ecchymosis. The incidence and prevalence are not known. Urticaria multiforme is considered common, but it is frequently misdiagnosed.1 It typically manifests in children ages 4 months to 4 years and begins with small erythematous macules, papules, and plaques that progress to large blanchable wheals with dusky blue centers.1-3 Lesions are usually located on the face, trunk, and extremities and are often pruritic (60%-94%).1-3 Individual lesions last less than 24 hours, but new ones may appear. The rash generally lasts 2 to 12 days.1,3
Patients often report a preceding viral illness, otitis media, recent use of antibiotics, or recent immunizations. Dermatographism due to mast cell–mediated cutaneous hypersensitivity at sites of minor skin trauma is common (44%).
The diagnosis is made clinically and should not require a skin biopsy or extensive laboratory testing.When performed, laboratory studies, including CBC, erythrocyte sedimentation rate, C-reactive protein, and urinalysis are routinely normal.
Erythema multiforme and urticarial vasculitis are part of the differential
The differential diagnosis in this case includes erythema multiforme, Henoch-Schönlein purpura, serum sickness-like reaction, and urticarial vasculitis (TABLE1,2,4).

Continue to: Erythema multiforme
Erythema multiforme is a common misdiagnosis in patients with urticaria multiforme.1,2 The erythema multiforme rash has a “target” lesion with outer erythema and central ecchymosis, which may develop blisters or necrosis. Lesions are fixed and last 2 to 3 weeks. Unlike urticaria multiforme, patients with erythema multiforme commonly have mucous membrane erosions and occasionally ulcerations. Facial and acral edema is rare. Treatment is largely symptomatic and can include glucocorticoids. Antiviral medications may be used to treat recurrences.1,2
Henoch-Schönlein purpura is an immunoglobulin A–mediated vasculitis that affects the skin, gastrointestinal tract, and joints.4,5 Patients often present with arthralgias, gastrointestinal symptoms such as abdominal pain and bleeding, and a nonpruritic, erythematous rash that progresses to palpable purpura in dependent areas of the body. Treatment is generally symptomatic, but steroids may be used in severe cases.4,5
Serum sickness-like reaction can manifest with angioedema and a similar urticarial rash (with central clearing) that lasts 1 to 6 weeks.1,2,6,7 However, patients tend to have a high-grade fever, arthralgias, myalgias, and lymphadenopathy while dermatographism is absent. Treatment includes discontinuing the offending agent and the use of H1 and H2 antihistamines and steroids, in severe cases.
Urticarial vasculitis manifests as plaques or wheals lasting 1 to 7 days that may cause burning and pain but not pruritis.2,5 Purpura or hypopigmentation may develop as the hives resolve. Angioedema and arthralgias are common, but dermatographism is not present. Triggers include infections, autoimmune disease, malignancy, and the use of certain medications. H1 and H2 blockers and nonsteroidal anti-inflammatory agents are first-line therapy.2
Step 1: Discontinue offending agents; Step 2: Recommend antihistamines
Treatment consists of discontinuing any offending agent (if suspected) and using systemic H1 or H2 antihistamines for symptom relief. Systemic steroids should only be given in refractory cases.
Continue to: Our patient's amoxicillin
Our patient’s amoxicillin was discontinued, and he was started on a 14-day course of cetirizine 5 mg bid and hydroxyzine 10 mg at bedtime. He was also started on triamcinolone 0.1% cream to be applied twice daily for 1 week. During his 3-day hospital stay, his fever resolved and his rash and edema improved.
During an outpatient follow-up visit with a pediatric dermatologist 2 weeks after discharge, the patient’s rash was still present and dermatographism was noted. In light of this, his parents were instructed to continue giving the cetirizine and hydroxyzine once daily for an additional 2 weeks and to return as needed.
1. Shah KN, Honig PJ, Yan AC. “Urticaria multiforme”: a case series and review of acute annular urticarial hypersensitivity syndromes in children. Pediatrics. 2007;119:e1177-e1183. doi: 10.1542/peds.2006-1553
2. Emer JJ, Bernardo SG, Kovalerchik O, et al. Urticaria multiforme. J Clin Aesthet Dermatol. 2013;6:34-39.
3. Starnes L, Patel T, Skinner RB. Urticaria multiforme – a case report. Pediatr Dermatol. 2011; 28:436-438. doi: 10.1111/j.1525-1470.2011.01311.x
4. Reamy BV, Williams PM, Lindsay TJ. Henoch-Schönlein purpura. Am Fam Physician. 2009;80:697-704.
5. Habif TP. Clinical Dermatology: A Color Guide to Diagnosis and Therapy. 6th ed. Mosby, Elsevier Inc; 2016.
6. King BA, Geelhoed GC. Adverse skin and joint reactions associated with oral antibiotics in children: the role of cefaclor in serum sickness-like reactions. J Paediatr Child Health. 2003;39:677-681. doi: 10.1046/j.1440-1754.2003.00267.x
7. Misirlioglu ED, Duman H, Ozmen S, et al. Serum sickness-like reaction in children due to cefditoren. Pediatr Dermatol. 2011;29:327-328. doi: 10.1111/j.1525-1470.2011.01539.x
A 2-YEAR-OLD BOY presented to the emergency room with a 1-day history of a diffuse, mildly pruritic rash and swelling of his knees, ankles, and feet following treatment of acute otitis media with amoxicillin for the previous 8 days. He was mildly febrile and consolable, but he was refusing to walk. His medical history was unremarkable.
Physical examination revealed erythematous annular wheals on his chest, face, back, and extremities. Lymphadenopathy and mucous membrane involvement were not present. A complete blood count (CBC) with differential, inflammatory marker tests, and a comprehensive metabolic panel were ordered. Given the joint swelling and rash, the patient was admitted for observation.
During his second day in the hospital, his skin lesions enlarged and several formed dusky blue centers (FIGURE 1A). He also developed swelling of his hands (FIGURE 1B).
WHAT IS YOUR DIAGNOSIS?
HOW WOULD YOU TREAT THIS PATIENT?
Diagnosis: Urticaria multiforme
The patient’s lab work came back within normal range, except for an elevated white blood cell count (19,700/mm3; reference range, 4500-13,500/mm3). His mild systemic symptoms, skin lesions without blistering or necrosis, acral edema, and the absence of lymphadenopathy pointed to a diagnosis of urticaria multiforme.
Urticaria multiforme, also called acute annular urticaria or acute urticarial hypersensitivity syndrome, is a histamine-mediated hypersensitivity reaction characterized by transient annular, polycyclic, urticarial lesions with central ecchymosis. The incidence and prevalence are not known. Urticaria multiforme is considered common, but it is frequently misdiagnosed.1 It typically manifests in children ages 4 months to 4 years and begins with small erythematous macules, papules, and plaques that progress to large blanchable wheals with dusky blue centers.1-3 Lesions are usually located on the face, trunk, and extremities and are often pruritic (60%-94%).1-3 Individual lesions last less than 24 hours, but new ones may appear. The rash generally lasts 2 to 12 days.1,3
Patients often report a preceding viral illness, otitis media, recent use of antibiotics, or recent immunizations. Dermatographism due to mast cell–mediated cutaneous hypersensitivity at sites of minor skin trauma is common (44%).
The diagnosis is made clinically and should not require a skin biopsy or extensive laboratory testing.When performed, laboratory studies, including CBC, erythrocyte sedimentation rate, C-reactive protein, and urinalysis are routinely normal.
Erythema multiforme and urticarial vasculitis are part of the differential
The differential diagnosis in this case includes erythema multiforme, Henoch-Schönlein purpura, serum sickness-like reaction, and urticarial vasculitis (TABLE1,2,4).
Continue to: Erythema multiforme
Erythema multiforme is a common misdiagnosis in patients with urticaria multiforme.1,2 The erythema multiforme rash has a “target” lesion with outer erythema and central ecchymosis, which may develop blisters or necrosis. Lesions are fixed and last 2 to 3 weeks. Unlike urticaria multiforme, patients with erythema multiforme commonly have mucous membrane erosions and occasionally ulcerations. Facial and acral edema is rare. Treatment is largely symptomatic and can include glucocorticoids. Antiviral medications may be used to treat recurrences.1,2
Henoch-Schönlein purpura is an immunoglobulin A–mediated vasculitis that affects the skin, gastrointestinal tract, and joints.4,5 Patients often present with arthralgias, gastrointestinal symptoms such as abdominal pain and bleeding, and a nonpruritic, erythematous rash that progresses to palpable purpura in dependent areas of the body. Treatment is generally symptomatic, but steroids may be used in severe cases.4,5
Serum sickness-like reaction can manifest with angioedema and a similar urticarial rash (with central clearing) that lasts 1 to 6 weeks.1,2,6,7 However, patients tend to have a high-grade fever, arthralgias, myalgias, and lymphadenopathy while dermatographism is absent. Treatment includes discontinuing the offending agent and the use of H1 and H2 antihistamines and steroids, in severe cases.
Urticarial vasculitis manifests as plaques or wheals lasting 1 to 7 days that may cause burning and pain but not pruritis.2,5 Purpura or hypopigmentation may develop as the hives resolve. Angioedema and arthralgias are common, but dermatographism is not present. Triggers include infections, autoimmune disease, malignancy, and the use of certain medications. H1 and H2 blockers and nonsteroidal anti-inflammatory agents are first-line therapy.2
Step 1: Discontinue offending agents; Step 2: Recommend antihistamines
Treatment consists of discontinuing any offending agent (if suspected) and using systemic H1 or H2 antihistamines for symptom relief. Systemic steroids should only be given in refractory cases.
Continue to: Our patient's amoxicillin
Our patient’s amoxicillin was discontinued, and he was started on a 14-day course of cetirizine 5 mg bid and hydroxyzine 10 mg at bedtime. He was also started on triamcinolone 0.1% cream to be applied twice daily for 1 week. During his 3-day hospital stay, his fever resolved and his rash and edema improved.
During an outpatient follow-up visit with a pediatric dermatologist 2 weeks after discharge, the patient’s rash was still present and dermatographism was noted. In light of this, his parents were instructed to continue giving the cetirizine and hydroxyzine once daily for an additional 2 weeks and to return as needed.
1. Shah KN, Honig PJ, Yan AC. “Urticaria multiforme”: a case series and review of acute annular urticarial hypersensitivity syndromes in children. Pediatrics. 2007;119:e1177-e1183. doi: 10.1542/peds.2006-1553
2. Emer JJ, Bernardo SG, Kovalerchik O, et al. Urticaria multiforme. J Clin Aesthet Dermatol. 2013;6:34-39.
3. Starnes L, Patel T, Skinner RB. Urticaria multiforme – a case report. Pediatr Dermatol. 2011; 28:436-438. doi: 10.1111/j.1525-1470.2011.01311.x
4. Reamy BV, Williams PM, Lindsay TJ. Henoch-Schönlein purpura. Am Fam Physician. 2009;80:697-704.
5. Habif TP. Clinical Dermatology: A Color Guide to Diagnosis and Therapy. 6th ed. Mosby, Elsevier Inc; 2016.
6. King BA, Geelhoed GC. Adverse skin and joint reactions associated with oral antibiotics in children: the role of cefaclor in serum sickness-like reactions. J Paediatr Child Health. 2003;39:677-681. doi: 10.1046/j.1440-1754.2003.00267.x
7. Misirlioglu ED, Duman H, Ozmen S, et al. Serum sickness-like reaction in children due to cefditoren. Pediatr Dermatol. 2011;29:327-328. doi: 10.1111/j.1525-1470.2011.01539.x

The benefits—and inequities—of improved diabetes care
Primary care clinicians care for the vast majority of the 34 million individuals in the United States with type 2 diabetes; these patients make up about 11% of visits in most practices.1,2 Maximizing their health requires that we make the most of the ever-growing number of medications and devices that can be used to manage diabetes, while being sensitive to the health care inequities that limit patient access to the best care we have to offer.
A growing number of effective Tx options. In the past few years, we have seen the number of new drug classes for treating type 2 diabetes climb steadily. Within-class effects and adverse effects vary widely, demanding familiarity with the proven benefits of each individual drug. The advent of oral and injectable agents that include glucagon-like peptide 1 (GLP-1) receptor agonists and sodium glucose cotransporter 2 (SGLT2) inhibitors now supplement an expanding list of reliable basal insulins. Never before have we had such effective drugs with fewer adverse effects to manage glycemic control. New evidence supports adding selected medicines from these categories to reduce the risk of cardiovascular disease, heart failure, or chronic kidney disease in patients at risk—regardless of the level of glucose control.
The benefit of more achievable goals. When the ACCORD (Action to Control Cardiovascular Risk in Diabetes) trial began in 1999, the UKPDS (United Kingdom Prospective Diabetes Study) had just demonstrated that lower blood sugars resulted in lower morbidity in patients with type 2 diabetes. Colleagues insisted that an extrapolation of UKPDS results suggested that low blood sugars were better, and that it would be unethical to allow a patient to maintain an A1C of 7.5% if less than 6.0% was possible.
By 2008, the ACCORD trial demonstrated that more lives were saved with a less aggressive approach, and family physicians could breathe a sigh of relief as they addressed other important comorbidities of diabetes. However, the tools we used in ACCORD were rudimentary compared to today’s approaches. As glycemic control becomes safer and more effective, demands for further normalizing glycemic control to minimize complications are inevitable.
Devices have transformed care, too. A wide variety of new continuous monitoring devices, delivery systems, and self-management tools provide more options for ensuring that treatment is less disruptive and more effective than ever before. Inevitably, the advent of these major advances also brings new and serious challenges. Practices will need to transform to support the demands and the needs of our patients.
Practice transformation is necessary if primary care is to continue the delivery of high-quality diabetes care. The link between practice diabetes performance measures and the introduction of enhanced patient-centered care teams providing proactive outreach is clear.3
Our biggest challenge. Despite advances in the science, perhaps the biggest challenge in diabetes care is the inevitable inequity in access to new medications. The average wholesale price of glargine has soared to $340 per month, while the most effective new GLP-1 receptor agonists are close to $1000 per month.4
Continue to: Although primary care doctors...
Although primary care doctors have always tried to accommodate the uninsured, the stark differences between new and old medicines now resembles a 2-tiered system. We can all celebrate advances in diabetes care and work hard to learn when and how to best use them, but those advances are accompanied by an uncomfortable awareness of the enormous inequity of prescribing regimens that haven't been considered best practice since the 1990s to patients who simply can’t afford better medicine.
We can expect amplified inequities in diabetes clinical outcomes to continue unless we develop a better system of distributing these life-changing medicines to those Americans who need them. Some state legislatures have made progress by supporting limited access to affordable insulin. However, ensuring that all patients with diabetes have access to modern insulin and effective medications is a national responsibility that needs a national response. Universal access to the modern tools of basic health care is a long-overdue treatment for an expanding epidemic of inequity.
1. CDC. National Diabetes Statistics Report, 2020. Accessed August 30, 2021. www.cdc.gov/diabetes/pdfs/data/statistics/national-diabetes-statistics-report.pdf
2. Ashman JJ, Talwalkar A, Taylor SA. Age differences in visits to office-based physicians by patients with diabetes: United States, 2010. NCHS data brief, no 161; July 2014. Accessed August 30, 2021. www.cdc.gov/nchs/data/databriefs/db161.pdf
3. Solberg LI, Peterson KA, Fu H, et al. Strategies and factors associated with top performance in primary care for diabetes: insights from a mixed methods study. Ann Fam Med. 2021;19:110-116. doi: 10.1370/afm.2646
4. American Diabetes Association. 9. Pharmacologic approaches to glycemic treatment: standards of medical care in diabetes–2021. Diabetes Care. 2021;44(suppl. 1):S111–S124.
Primary care clinicians care for the vast majority of the 34 million individuals in the United States with type 2 diabetes; these patients make up about 11% of visits in most practices.1,2 Maximizing their health requires that we make the most of the ever-growing number of medications and devices that can be used to manage diabetes, while being sensitive to the health care inequities that limit patient access to the best care we have to offer.
A growing number of effective Tx options. In the past few years, we have seen the number of new drug classes for treating type 2 diabetes climb steadily. Within-class effects and adverse effects vary widely, demanding familiarity with the proven benefits of each individual drug. The advent of oral and injectable agents that include glucagon-like peptide 1 (GLP-1) receptor agonists and sodium glucose cotransporter 2 (SGLT2) inhibitors now supplement an expanding list of reliable basal insulins. Never before have we had such effective drugs with fewer adverse effects to manage glycemic control. New evidence supports adding selected medicines from these categories to reduce the risk of cardiovascular disease, heart failure, or chronic kidney disease in patients at risk—regardless of the level of glucose control.
The benefit of more achievable goals. When the ACCORD (Action to Control Cardiovascular Risk in Diabetes) trial began in 1999, the UKPDS (United Kingdom Prospective Diabetes Study) had just demonstrated that lower blood sugars resulted in lower morbidity in patients with type 2 diabetes. Colleagues insisted that an extrapolation of UKPDS results suggested that low blood sugars were better, and that it would be unethical to allow a patient to maintain an A1C of 7.5% if less than 6.0% was possible.
By 2008, the ACCORD trial demonstrated that more lives were saved with a less aggressive approach, and family physicians could breathe a sigh of relief as they addressed other important comorbidities of diabetes. However, the tools we used in ACCORD were rudimentary compared to today’s approaches. As glycemic control becomes safer and more effective, demands for further normalizing glycemic control to minimize complications are inevitable.
Devices have transformed care, too. A wide variety of new continuous monitoring devices, delivery systems, and self-management tools provide more options for ensuring that treatment is less disruptive and more effective than ever before. Inevitably, the advent of these major advances also brings new and serious challenges. Practices will need to transform to support the demands and the needs of our patients.
Practice transformation is necessary if primary care is to continue the delivery of high-quality diabetes care. The link between practice diabetes performance measures and the introduction of enhanced patient-centered care teams providing proactive outreach is clear.3
Our biggest challenge. Despite advances in the science, perhaps the biggest challenge in diabetes care is the inevitable inequity in access to new medications. The average wholesale price of glargine has soared to $340 per month, while the most effective new GLP-1 receptor agonists are close to $1000 per month.4
Continue to: Although primary care doctors...
Although primary care doctors have always tried to accommodate the uninsured, the stark differences between new and old medicines now resembles a 2-tiered system. We can all celebrate advances in diabetes care and work hard to learn when and how to best use them, but those advances are accompanied by an uncomfortable awareness of the enormous inequity of prescribing regimens that haven't been considered best practice since the 1990s to patients who simply can’t afford better medicine.
We can expect amplified inequities in diabetes clinical outcomes to continue unless we develop a better system of distributing these life-changing medicines to those Americans who need them. Some state legislatures have made progress by supporting limited access to affordable insulin. However, ensuring that all patients with diabetes have access to modern insulin and effective medications is a national responsibility that needs a national response. Universal access to the modern tools of basic health care is a long-overdue treatment for an expanding epidemic of inequity.
1. CDC. National Diabetes Statistics Report, 2020. Accessed August 30, 2021. www.cdc.gov/diabetes/pdfs/data/statistics/national-diabetes-statistics-report.pdf
2. Ashman JJ, Talwalkar A, Taylor SA. Age differences in visits to office-based physicians by patients with diabetes: United States, 2010. NCHS data brief, no 161; July 2014. Accessed August 30, 2021. www.cdc.gov/nchs/data/databriefs/db161.pdf
3. Solberg LI, Peterson KA, Fu H, et al. Strategies and factors associated with top performance in primary care for diabetes: insights from a mixed methods study. Ann Fam Med. 2021;19:110-116. doi: 10.1370/afm.2646
4. American Diabetes Association. 9. Pharmacologic approaches to glycemic treatment: standards of medical care in diabetes–2021. Diabetes Care. 2021;44(suppl. 1):S111–S124.

78-year-old man • tail bone pain • unintended weight loss • history of diabetes and hypertension • Dx?
THE CASE
A 78-year-old man with a history of diabetes and hypertension was referred to the outpatient surgical office with a chief complaint of “tail bone pain” that had started after a fall a year earlier. The patient complained that the pain was worse when sitting and at nighttime. He also admitted to a 7-lb weight loss over the past 2 months without change in diet or appetite. He denied symptoms of incontinence, urinary retention, sharp stabbing pains in the lower extremities, night sweats, or anorexia.
The patient first visited an urgent care facility on the day after the fall because he was experiencing pain in his “tail bone” region while riding his lawn mower. A pelvic x-ray was performed at that time and showed no coccyx fracture. He received a steroid injection in the right sacroiliac joint, which provided some relief for a month. Throughout the course of the year, he was given 6 steroid injections into his sacroiliac joint by his primary care provider (PCP) and clinicians at his local urgent care facility. One year after the fall, the patient’s PCP ordered a computed tomography (CT) scan of the abdomen and pelvis, which revealed a 4.6 x 7.5–cm soft-tissue mass with bony destruction of the lower sacrum and coccyx that extended into the sacral and coccygeal canal (FIGURE 1).
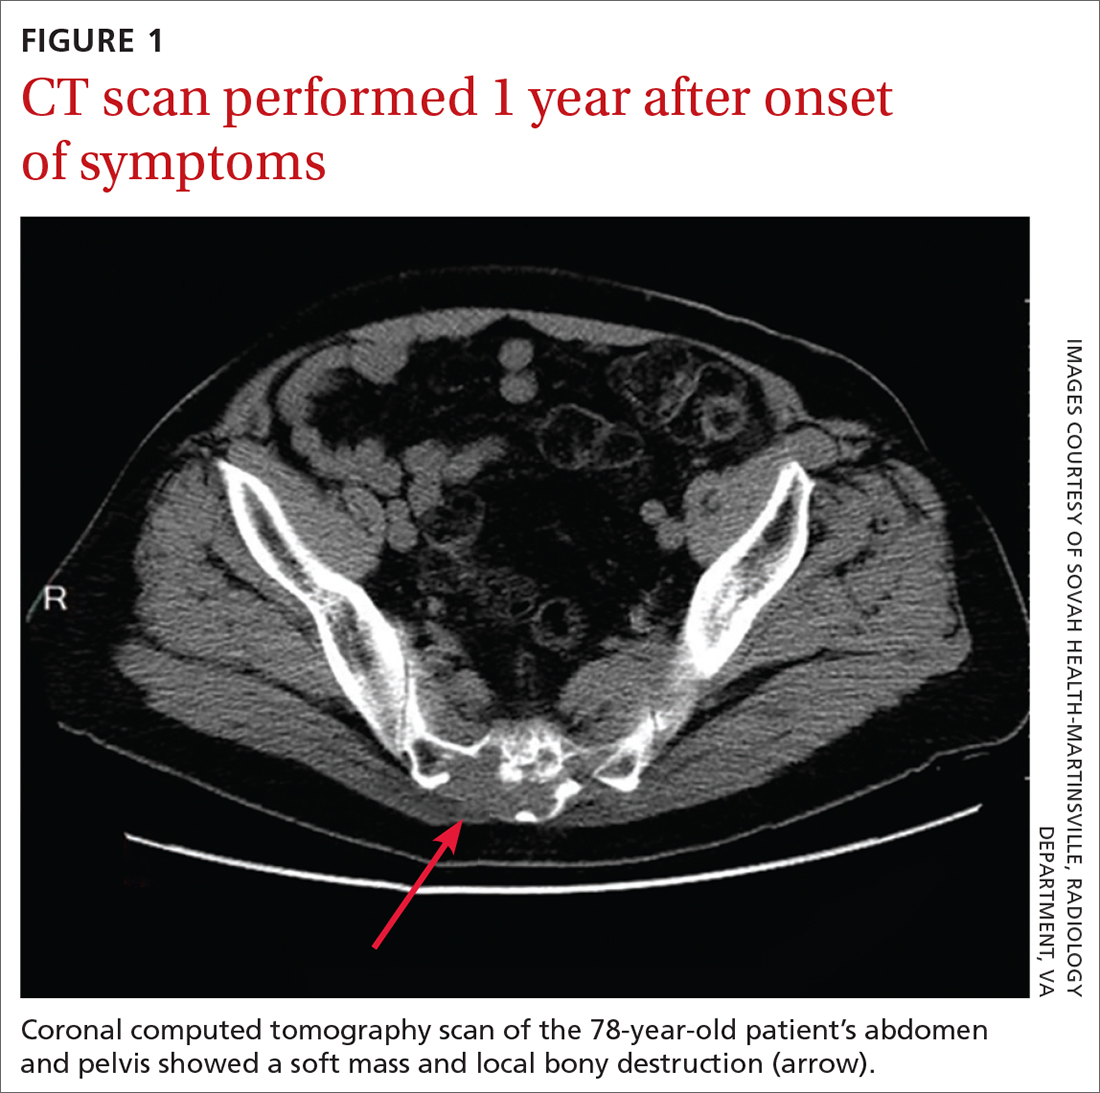
On exam in our surgical office, the patient was found to be alert and oriented. His neurologic exam was unremarkable, with an intact motor and sensory exam and no symptoms of cauda equina syndrome. During palpation over the lower sacrum and coccyx, both tenderness and a boggy, soft mass were observed. Nerve impingement was most likely caused by the size of the mass.
THE DIAGNOSIS
Biopsy revealed a large tan-gray, gelatinous, soft-tissue mass that was necrotizing through the lower sacrum. The diagnosis of a sacral chordoma was confirmed with magnetic resonance imaging of the pelvis, which demonstrated a 4.6 × 8.1–cm destructive expansile sacrococcygeal tumor with an exophytic soft-tissue component (FIGURE 2). The tumor also involved the piriformis and gluteus maximus muscles bilaterally.
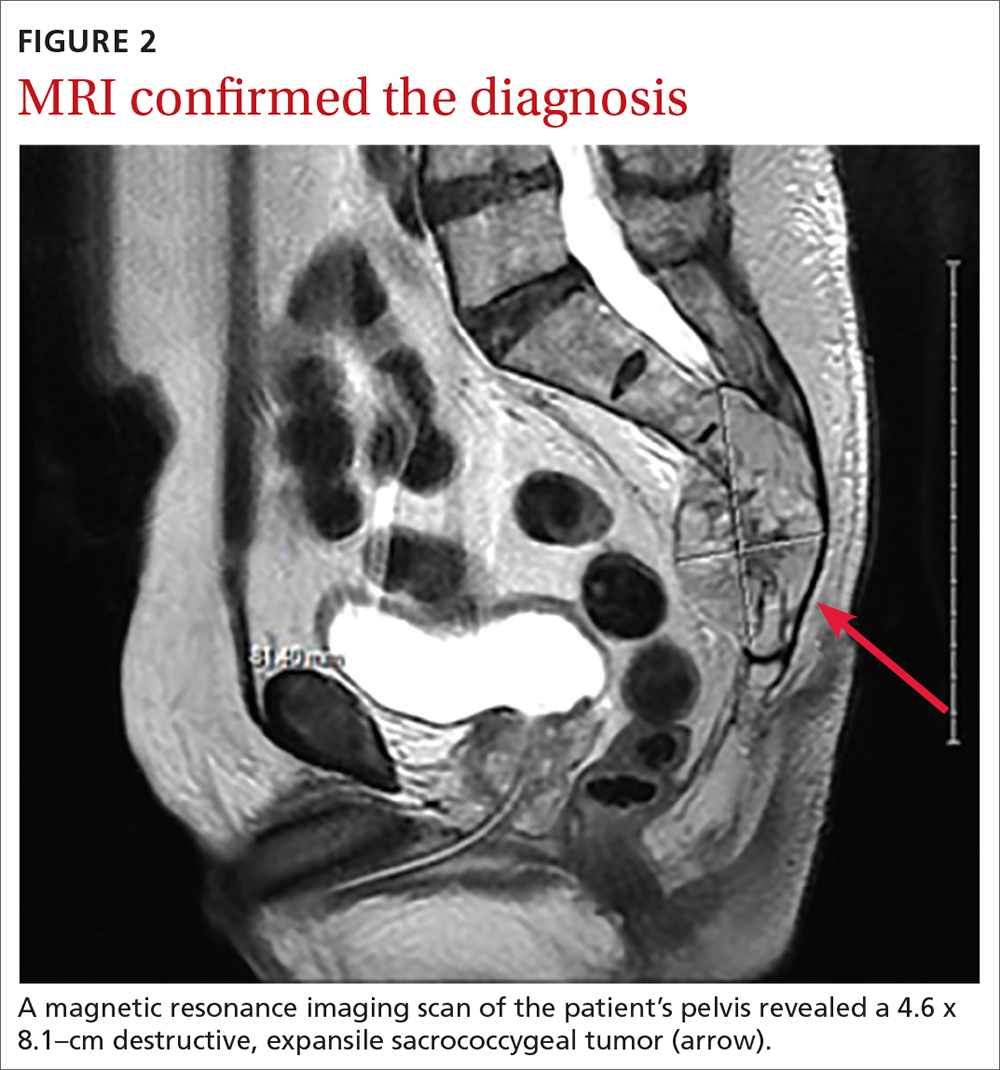
DISCUSSION
Chordomas are rare, malignant bone tumors that grow slowly and originate from embryonic remnants of the notochord.1 They are most commonly seen in the sacrococcygeal segment (50%) but are also seen in the spheno-occipital synchondrosis (30%-35%) and other spinal segments such as C2 and lumbar spine.2 Chordomas are typically seen in middle-aged patients, with sacral chordomas occurring predominantly in men compared to women (3:1).2
Slow to grow, slow to diagnose
The difficulty with diagnosing sacral chordomas lies in the tendency for these tumors to grow extremely slowly, making detection challenging due to a lack of symptoms in the early clinical course. Once the tumors cause noticeable symptoms, they are usually large and extensively locally invasive. As a result, most patients experience delayed diagnosis, with an average symptom duration of 2.3 years prior to diagnosis.3
Reexamining a common problem as a symptom of a rare condition
The most commonly manifesting symptom of sacral chordomas is lower back pain that is typically dull and worse with sitting.3,4 Since lower back pain is the leading cause of disability, it is difficult to determine when back pain is simply a benign consequence of aging or muscular pain and when it is, in fact, pathologic.5 A thorough history and physical are crucial in making the distinction.
Continue to: Clinical red flags...
Clinical red flags include pain with neurologic symptoms (including paresthesia, urinary or bowel disturbances, and weakness in the lower limbs), pain in the lower back with or without coccyx pain that persists and gradually worsens over time, and pain that fails to resolve.3 These symptoms are collectively strong indicators of underlying sacral pathology and should warrant further investigation, including a CT and MRI of the involved area.
Survival rate is improved by surgery
The gold standard for treatment of sacral chordomas is surgical resection with adequate margins, as these tumors are both radio- and chemo-insensitive.6 It is generally accepted that achieving a wide surgical margin is the most important predictor of survival and of reducing local recurrence in patients with sacrococcygeal chordoma.7-9
The survival rate varies after a posterior-only surgical approach; some studies cite the 5-year survival rate as 100% and others state the 7-year survival rate as 5%.4 The wide variation is likely due to small trial size, a lack of evidence, and how invasive the disease is at the time of surgery.
The recurrence rate 5 years after surgery is approximately 20%.4 The rate of urinary and fecal incontinence after surgery using a posterior-only approach is between 20% and 100%; some of this variation may be due to which spinal level is involved.4 If S3 is affected, there is almost always perineal anesthesia along with bowel and bladder incontinence.4
This patient was referred to Neurosurgery and underwent resection. He recovered well from surgery but suffered from some residual urinary incontinence. The patient did not receive chemotherapy or radiation, and further work-up revealed no evidence of metastasis.
Continue to: THE TAKEAWAY
THE TAKEAWAY
The diagnosis of sacral chordoma remains challenging. A history of clinical red flags, especially persistent lower back pain with neuropathy, should prompt an aggressive investigation to rule out underlying pathology. Other signs on physical exam could include urinary or bowel disturbances, weakness in the lower limbs, saddle anesthesia, new foot drop, and/or laxity of the anal sphincter.5 Early detection and surgical intervention are crucial for these patients to experience a better prognosis and preserve maximum function.
CORRESPONDENCE
Ginger Poulton, MD, 123 Hendersonville Road, Asheville, NC 28803; [email protected]
1. Zabel-du Bois A, Nikoghosyan A, Schwahofer A, et al. Intensity modulated radiotherapy in the management of sacral chordoma in primary versus recurrent disease. Radiother Oncol. 2010;97:408-412. doi: 10.1016/j.radonc.2010.10.008
2. Murphey MD, Andrews CL, Flemming DJ, et al. Primary tumors of the spine: radiologic pathologic correlation. Radiographics. 1996;1131-1158. doi: 10.1148/radiographics.16.5.8888395
3. Jeys L, Gibbins R, Evans G, et al. Sacral chordoma: a diagnosis not to be sat on? Int Orthopaedics. 2008;32:269-272. doi: 10.1007/s00264-006-0296-3
4. Pillai S, Govender, S. Sacral chordoma: a review of literature. J Orthop. 2018;15:679-684. doi: 10.1016/j.jor.2018.04.001
5. Traeger A, Buchbinder R, Harris I, et al. Diagnosis and management of low-back pain in primary care. CMAJ. 2017;189:E1386-E1395. doi: 10.1503/cmaj.170527
6. Walcott BP, Nahed BV, Mohyeldin A, et al. Chordoma: current concepts, management, and future directions. Lancet Oncol. 2012;13:e69-76. doi: 10.1016/S1470-2045(11)70337-0
7. Bergh P, Kindblom LG, Gunterberg B, et al. Prognostic factors in chordoma of the sacrum and mobile spine: a study of 39 patients. Cancer. 2000;88:2122-2134. doi: 10.1002/(sici)1097-0142(20000501)88:9<2122::aid-cncr19>3.0.co;2-1
8. Boriani S, Bandiera S, Biagini R, et al. Chordoma of the mobile spine: fifty years of experience. Spine. 2006;31:493-503. doi: 10.1097/01.brs.0000200038.30869.27
9. Hanna SA, Aston WJ, Briggs TW, et al. Sacral chordoma: can local recurrence after sacrectomy be predicted? Clin Orthop Relat Res. 2008;466:2217-2223. doi: 10.1007/s11999-008-0356-7
THE CASE
A 78-year-old man with a history of diabetes and hypertension was referred to the outpatient surgical office with a chief complaint of “tail bone pain” that had started after a fall a year earlier. The patient complained that the pain was worse when sitting and at nighttime. He also admitted to a 7-lb weight loss over the past 2 months without change in diet or appetite. He denied symptoms of incontinence, urinary retention, sharp stabbing pains in the lower extremities, night sweats, or anorexia.
The patient first visited an urgent care facility on the day after the fall because he was experiencing pain in his “tail bone” region while riding his lawn mower. A pelvic x-ray was performed at that time and showed no coccyx fracture. He received a steroid injection in the right sacroiliac joint, which provided some relief for a month. Throughout the course of the year, he was given 6 steroid injections into his sacroiliac joint by his primary care provider (PCP) and clinicians at his local urgent care facility. One year after the fall, the patient’s PCP ordered a computed tomography (CT) scan of the abdomen and pelvis, which revealed a 4.6 x 7.5–cm soft-tissue mass with bony destruction of the lower sacrum and coccyx that extended into the sacral and coccygeal canal (FIGURE 1).
On exam in our surgical office, the patient was found to be alert and oriented. His neurologic exam was unremarkable, with an intact motor and sensory exam and no symptoms of cauda equina syndrome. During palpation over the lower sacrum and coccyx, both tenderness and a boggy, soft mass were observed. Nerve impingement was most likely caused by the size of the mass.
THE DIAGNOSIS
Biopsy revealed a large tan-gray, gelatinous, soft-tissue mass that was necrotizing through the lower sacrum. The diagnosis of a sacral chordoma was confirmed with magnetic resonance imaging of the pelvis, which demonstrated a 4.6 × 8.1–cm destructive expansile sacrococcygeal tumor with an exophytic soft-tissue component (FIGURE 2). The tumor also involved the piriformis and gluteus maximus muscles bilaterally.
DISCUSSION
Chordomas are rare, malignant bone tumors that grow slowly and originate from embryonic remnants of the notochord.1 They are most commonly seen in the sacrococcygeal segment (50%) but are also seen in the spheno-occipital synchondrosis (30%-35%) and other spinal segments such as C2 and lumbar spine.2 Chordomas are typically seen in middle-aged patients, with sacral chordomas occurring predominantly in men compared to women (3:1).2
Slow to grow, slow to diagnose
The difficulty with diagnosing sacral chordomas lies in the tendency for these tumors to grow extremely slowly, making detection challenging due to a lack of symptoms in the early clinical course. Once the tumors cause noticeable symptoms, they are usually large and extensively locally invasive. As a result, most patients experience delayed diagnosis, with an average symptom duration of 2.3 years prior to diagnosis.3
Reexamining a common problem as a symptom of a rare condition
The most commonly manifesting symptom of sacral chordomas is lower back pain that is typically dull and worse with sitting.3,4 Since lower back pain is the leading cause of disability, it is difficult to determine when back pain is simply a benign consequence of aging or muscular pain and when it is, in fact, pathologic.5 A thorough history and physical are crucial in making the distinction.
Continue to: Clinical red flags...
Clinical red flags include pain with neurologic symptoms (including paresthesia, urinary or bowel disturbances, and weakness in the lower limbs), pain in the lower back with or without coccyx pain that persists and gradually worsens over time, and pain that fails to resolve.3 These symptoms are collectively strong indicators of underlying sacral pathology and should warrant further investigation, including a CT and MRI of the involved area.
Survival rate is improved by surgery
The gold standard for treatment of sacral chordomas is surgical resection with adequate margins, as these tumors are both radio- and chemo-insensitive.6 It is generally accepted that achieving a wide surgical margin is the most important predictor of survival and of reducing local recurrence in patients with sacrococcygeal chordoma.7-9
The survival rate varies after a posterior-only surgical approach; some studies cite the 5-year survival rate as 100% and others state the 7-year survival rate as 5%.4 The wide variation is likely due to small trial size, a lack of evidence, and how invasive the disease is at the time of surgery.
The recurrence rate 5 years after surgery is approximately 20%.4 The rate of urinary and fecal incontinence after surgery using a posterior-only approach is between 20% and 100%; some of this variation may be due to which spinal level is involved.4 If S3 is affected, there is almost always perineal anesthesia along with bowel and bladder incontinence.4
This patient was referred to Neurosurgery and underwent resection. He recovered well from surgery but suffered from some residual urinary incontinence. The patient did not receive chemotherapy or radiation, and further work-up revealed no evidence of metastasis.
Continue to: THE TAKEAWAY
THE TAKEAWAY
The diagnosis of sacral chordoma remains challenging. A history of clinical red flags, especially persistent lower back pain with neuropathy, should prompt an aggressive investigation to rule out underlying pathology. Other signs on physical exam could include urinary or bowel disturbances, weakness in the lower limbs, saddle anesthesia, new foot drop, and/or laxity of the anal sphincter.5 Early detection and surgical intervention are crucial for these patients to experience a better prognosis and preserve maximum function.
CORRESPONDENCE
Ginger Poulton, MD, 123 Hendersonville Road, Asheville, NC 28803; [email protected]
1. Zabel-du Bois A, Nikoghosyan A, Schwahofer A, et al. Intensity modulated radiotherapy in the management of sacral chordoma in primary versus recurrent disease. Radiother Oncol. 2010;97:408-412. doi: 10.1016/j.radonc.2010.10.008
2. Murphey MD, Andrews CL, Flemming DJ, et al. Primary tumors of the spine: radiologic pathologic correlation. Radiographics. 1996;1131-1158. doi: 10.1148/radiographics.16.5.8888395
3. Jeys L, Gibbins R, Evans G, et al. Sacral chordoma: a diagnosis not to be sat on? Int Orthopaedics. 2008;32:269-272. doi: 10.1007/s00264-006-0296-3
4. Pillai S, Govender, S. Sacral chordoma: a review of literature. J Orthop. 2018;15:679-684. doi: 10.1016/j.jor.2018.04.001
5. Traeger A, Buchbinder R, Harris I, et al. Diagnosis and management of low-back pain in primary care. CMAJ. 2017;189:E1386-E1395. doi: 10.1503/cmaj.170527
6. Walcott BP, Nahed BV, Mohyeldin A, et al. Chordoma: current concepts, management, and future directions. Lancet Oncol. 2012;13:e69-76. doi: 10.1016/S1470-2045(11)70337-0
7. Bergh P, Kindblom LG, Gunterberg B, et al. Prognostic factors in chordoma of the sacrum and mobile spine: a study of 39 patients. Cancer. 2000;88:2122-2134. doi: 10.1002/(sici)1097-0142(20000501)88:9<2122::aid-cncr19>3.0.co;2-1
8. Boriani S, Bandiera S, Biagini R, et al. Chordoma of the mobile spine: fifty years of experience. Spine. 2006;31:493-503. doi: 10.1097/01.brs.0000200038.30869.27
9. Hanna SA, Aston WJ, Briggs TW, et al. Sacral chordoma: can local recurrence after sacrectomy be predicted? Clin Orthop Relat Res. 2008;466:2217-2223. doi: 10.1007/s11999-008-0356-7

Dyspepsia: A stepwise approach to evaluation and management
The global prevalence of dyspepsia is approximately 20%,1 and it is often associated with other comorbidities and overlapping gastrointestinal complaints. The effects on the patient’s quality of life, including societal impacts, are considerable. Symptoms and their response to treatment are highly variable, necessitating individualized management. While some patients’ symptoms may be refractory to standard medical treatment initially, evidence suggests that the strategies summarized in our guidance here—including the use of tricyclic antidepressants (TCAs), prokinetics, and adjunctive therapies—may alleviate symptoms and improve patients’ quality of life.
What dyspepsia is—and what it isn’t
Dyspepsia is a poorly characterized disorder often associated with nausea, heartburn, early satiety, and bloating. The American College of Gastroenterology (ACG) now advocates using a clinically relevant definition of dyspepsia as “predominant epigastric pain lasting at least a month” as long as epigastric pain is the patient's primary complaint.2 Causes of dyspepsia are listed in TABLE 1.

Heartburn, a burning sensation in the chest, is not a dyspeptic symptom but the 2 may often coexist. In general, dyspepsia does not have a colicky or postural component. Symptoms that are relieved by evacuation of feces or gas generally should not be considered a part of dyspepsia.
Functional dyspepsia (FD) is a subset for which no structural pathology has been identified, accounting for up to 70% of all patients with dyspepsia.3 The Rome Foundation, in its recent update (Rome IV), has highlighted 4 key symptoms and 2 proposed subtypes (TABLE 2).4 The comorbidities of anxiety, depression, and somatization appear to be more prevalent in these dyspepsia patients than in those with organic issues. The incidence of gastric malignancy is low in this cohort.3,5 Dyspepsia occurring after an acute infection is referred to as postinfectious functional dyspepsia.

Pathophysiology of functional dyspepsia. Dysmotility, visceral hypersensitivity, mucosal immune dysfunction, altered gut microbiota, and disturbed central nervous system processing contribute in varying degrees to the pathophysiology of FD. There is evidence that luminal factors have the potential to trigger local neuronal excitability.6,7 Early life psychosocial factors may further influence illness behaviors, coping strategies, stress responses, and the intensity of symptoms perceived by the patient.8
Clues in the history and physical examination
Patients describe their discomfort using a variety of terms, including pain, gnawing, burning, gassiness, or queasiness. Although allergic reactions to food (swelling of lips and tongue with a rash) are rare in adults, food intolerances are common in patients with dyspepsia.9 Consumption of nonsteroidal anti-inflammatory drugs is a common cause of dyspepsia, even at over-the-counter strength, and may cause ulceration, gastrointestinal bleeding, and anemia. Narcotic and marijuana use and the anticholinergic effects of antidepressant medications are associated with gastrointestinal dysmotility, including gastroparesis.
Patients with FD often exhibit symptoms of other functional abdominal disorders including irritable bowel syndrome, functional heartburn, bloating, or chronic nausea, and may have been previously diagnosed with overlapping conditions suggestive of visceral hypersensitivity, including depression, anxiety, fibromyalgia, migraine, and pelvic pain. During the patient’s office visit, be alert to any indication of an underlying psychological issue.
Continue to: The initial diagnostic challenge
The initial diagnostic challenge is to identify those patients who may have a structural disorder requiring expedited and targeted investigation. Weight loss, night waking, and vomiting are unusual in the setting of either FD or Helicobacter pylori gastritis. These and other features of concern (TABLE 3) make a diagnosis of a functional disorder less likely and should prompt immediate consideration of abdominal imaging or endoscopic examination. Epigastric tenderness on palpation is common in patients with FD and is not necessarily predictive of structural pathology—unless accompanied by other findings of concern. Abdominal scars or a history of trauma may be suggestive of abdominal wall pain. Abdominal pain that remains unchanged or increases when the muscles of the abdominal wall are tensed (Carnett sign) suggests abdominal wall pain.

Initial testing and Tx assessments focus on H pylori
All 3 of the major US gastroenterology organizations recommend a stepwise approach in patients without alarm symptoms, generally beginning (in those < 60 years) by testing for H pylori with either the stool antigen or urea breath test (UBT)—and initiating appropriate treatment if results are positive.5,10 (The first step for those ≥ 60 years is discussed later.) Since the serum antibody test cannot differentiate between active and past infection, it is not recommended if other options are available.11 The stool antigen test is preferred; it is a cost-effective option used for both diagnosis and confirmation of H pylori eradication.
The UBT identifies active infection with a sensitivity and specificity of > 95%12 but is more labor intensive, employs an isotope, and is relatively expensive. Because proton pump inhibitors (PPIs), bismuth, and antibiotics may increase the false-negative rate for both the UBT and stool antigen test, we recommend that these medications be held for 2 to 4 weeks prior to testing.11 H2-receptor antagonists do not need to be restricted.
Treatment regimens containing clarithromycin have fallen into disfavor given the high rates of resistance that are now encountered. Fourteen-day regimens that can be used empirically (without susceptibility testing) are bismuth quadruple therapy (bismuth, metronidazole, tetracycline, and PPI) or rifabutin triple therapy (rifabutin, amoxicillin, and PPI).13 To confirm eradication, perform repeat testing with either stool antigen or UBT no sooner than 4 weeks after completion of therapy. If the first treatment fails, try a second regimen using different antibiotics.14 Although the impact of H pylori eradication on dyspeptic symptoms is only modest, this strategy is recommended also to reduce the risk of peptic ulceration and gastric neoplasia.
Next-step testing and Tx considerations
Given the heterogeneity of presenting symptoms of dyspepsia, some clinicians may be hesitant to diagnose a functional disorder at the first visit, preferring instead to conduct a limited range of investigations in concert with initial medical management. In these circumstances it would be reasonable, in addition to testing for H pylori, to order a complete blood count (CBC) and to measure serum lipase and liver enzymes. Keep in mind that liver enzymes may not be elevated in uncomplicated biliary colic.
Continue to: Consider ultrasound imaging...
Consider ultrasound imaging if gallstones are a consideration. A computerized tomography scan may not exclude uncomplicated and noncalcified gallstones, but it is an excellent modality for detecting suspected retroperitoneal pathology. Consider working with a gastroenterologist if the patient exhibits alarm features.
Empiric PPI therapy. A trial of daily PPI use over 4 weeks is recommended for patients without H pylori and for those whose symptoms continue despite eradication of the bacterium. A Cochrane meta-analysis found that PPI therapy was more effective than placebo (31% vs 26%; risk ratio, 0.88; number needed to treat [NNT] = 11; 95% CI 0.82 to 0.94; P < .001).15 PPI therapy appears to be slightly more effective than treatment with H2-receptor antagonists. Both are proposed in the United Kingdom guideline.16 Both are generally safe and well tolerated but are not without potential adverse effects when used long term.
Dietary modification. Patients with dyspepsia commonly report that meals exacerbate symptoms. This is likely due to a combination of gastric distension and underlying visceral hypersensitivity rather than food composition.
There is no reliable “dyspepsia diet,” although a systematic review implicated wheat and high-fat foods as the 2 most common contributors to symptom onset.17 Recommended dietary modifications would be to consume smaller, more frequent meals and to eliminate recognized trigger foods. Patients with postprandial distress syndrome, a subset of FD, may want to consider reducing fat intake to help alleviate discomfort. If symptoms continue, evaluate for lactose intolerance. Also, consider a trial of a gluten-free diet. The low-FODMAP diet (restricting fermentable oligo-, di- and monosaccharides, as well as polyols) has shown benefit in patients with irritable bowel syndrome and may be considered in those with intractable FD, given the overlap in physiology of the disorders.
Upper gastrointestinal endoscopy. The ACG has suggested that esophagogastroduodenoscopy (EGD) be performed as the first investigative step for patients ≥ 60 years, while testing for H pylori be considered as the first step in younger patients, even if alarm symptoms are present2 (FIGURE). This decision must be individualized, particularly in patients of Asian, Central or South American, or Caribbean descent, in whom the incidence of gastric cancer is higher with earlier onset.18

Continue to: Also consider EGD...
Also consider EGD for patients whose symptoms have not improved despite eradication of H pylori or an adequate trial of PPI therapy. While some guidelines do not require EGD in low-risk patients at this stage, other authorities would consider this step prudent, particularly when quality of life has been significantly impaired. An underlying organic cause, mainly erosive esophagitis or peptic ulcer disease, is found in 20% to 30% of patients with dyspepsia.5
Most patients without alarm features, with normal findings on upper endoscopy, who do not have H pylori gastritis, and whose symptoms continue despite a trial of PPI therapy, will have FD (FIGURE).2
Offer patients with functional dyspepsia supportive therapy
Neuromodulators
TCAs are superior to placebo in reducing dyspeptic symptoms with an NNT of 6 and are recommended for patients with ongoing symptoms despite PPI therapy or H pylori eradication.2 Begin with a low dose and increase as tolerated. It may take a few weeks for improvement to be seen. Exercise caution in the presence of cardiac arrhythmias.
Mirtazapine, 7.5 to 15 mg every night at bedtime, reduces fullness and bloating in postprandial distress syndrome and is useful for patients who have lost weight. It’s important to note that TCAs and mirtazapine both have the potential for QT prolongation, as well as depression and suicidality in younger patients.19 The anxiolytic buspirone, 10 mg before meals, augments fundic relaxation, improves overall symptom severity, and helps alleviate early satiety, postprandial fullness, and upper abdominal bloating.20
Prokinetics
A recent meta-analysis demonstrated significant benefit in symptom control in dyspeptic patients treated with prokinetics (NNT = 7).21 However, the benefit was predominantly due to cisapride, a drug that was withdrawn from the US market due to adverse effects. There are no clinical trials of metoclopramide or domperidone (not available in the United States) in FD. Nonetheless, the ACG has given a conditional recommendation, based on low-quality evidence, for the use of prokinetics in patients with FD not responding to PPI therapy, H pylori eradication, or TCA therapy.2
Continue to: A shortcoming of the established guidelines
A shortcoming of the established guidelines is that they do not provide guidance as to long-term management of those patients who respond to prescription medications. Our practice has been to continue medications for a minimum of 3 months, then begin a slow taper in order to establish the lowest efficacious dose. Some patients may relapse and require full dosage for a longer period of time.
Adjunctive therapies are worth considering
Complementary and alternative medicines. Products containing ginger, carraway oil, artichoke leaf extract, turmeric, and red pepper are readily available without prescription and have long been used with variable results for dyspepsia.22 The 9-herb combination STW-5 has demonstrated superiority over placebo in a number of studies and has a favorable safety profile.23 The recommended dose is 10 to 20 drops tid. The European manufacturer has recently modified the package insert noting rare cases of hepatotoxicity.24
A commercially available formulation (FDgard) containing L-menthol (a key component of peppermint oil) and caraway has been found to reduce the intensity of symptoms in patients with FD. Potential adverse effects include nausea, contact dermatitis, bronchospasm, and atrial fibrillation. Cayenne, a red pepper extract, is available over the counter for the benefit for epigastric pain and bloating. Begin with a 500-mg dose before breakfast and a 1000-mg dose before dinner, increasing to 2500 mg/d as tolerated. Cayenne preparations may trigger drug toxicities and are best avoided in patients taking antihypertensives, theophylline, or anticoagulants.
Cognitive behavioral therapy, acupuncture, and hypnosis. These modalities are time consuming, are often expensive, are not always covered by insurance, and require significant motivation. A systematic review found no benefit.25 Subsequent studies summarized in the ACG guidelines2 reported benefit; however, a lack of blinding and significant heterogeneity among the groups detract from the quality of the data. It remains unclear whether these are effective strategies for FD, and therefore they cannot be recommended on a routine basis.
CORRESPONDENCE
Norman H. Gilinsky, MD, Division of Digestive Diseases, University of Cincinnati College of Medicine, 231 Albert Sabin Way, Cincinnati, OH 45267-0595; norman.gilinsky@ uc.edu
1. Ford AC, Marwaha A, Sood R, et al. Global prevalence of, and risk factors for, uninvestigated dyspepsia: a meta-analysis. Gut. 2015;64:1049-1057.
2. Moayyedi P, Lacy BE, Andrews CN, et al. ACG and CAG clinical guideline: management of dyspepsia. Am J Gastroenterol. 2017;112:988-1013.
3. Ford AC, Marwaha A, Lim A, et al. What is the prevalence of clinically significant endoscopic findings in subjects with dyspepsia? Systematic review and meta-analysis. Clin Gastroenterol Hepatol. 2010;8:830-837.
4. Stanghellini V, Chan FKL, Hasler WL, et al. Gastroduodenal disorders. Gastroenterology. 2016;150:1380-1392.
5. Shaukat A, Wang A, Acosta RD, et al. The role of endoscopy in dyspepsia. Gastrointest Endosc. 2015;82:227-232.
6. Wauters L, Talley NJ, Walker MM, et al. Novel concepts in the pathophysiology and treatment of functional dyspepsia. Gut. 2020;69:591-600.
7. Weinstock LB, Pace LA, Rezaie A, et al. Mast cell activation syndrome: a primer for the gastroenterologist. Dig Dis Sci. 2021;66:965-982.
8. Drossman DA. Functional gastrointestinal disorders. History, pathophysiology, clinical features and Rome IV. 2016. Accessed August 16, 2021. www.gastrojournal.org/article/S0016-5085(16)00223-7/fulltext
9. Boettcher E, Crowe SE. Dietary proteins and functional gastrointestinal disorders. Am J Gastroenterol. 2013;108:728-736.
10. Talley NJ, AGA. American Gastroenterological Association medical position statement: evaluation of dyspepsia. Gastroenterol. 2005;129:1753-1755.
11. El-Serag HB, Kao JY, Kanwal F, et al. Houston Consensus Conference on testing for Helicobacter pylori infection in the United States. Clin Gastroenterol Hepatol. 2018;16:992-1002.
12. Ferwana M, Abdulmajeed I, Alhajiahmed A, et al. Accuracy of urea breath test in Helicobacter pylori infection: meta-analysis. World J Gastroenterol. 2015;21:1305-1314.
13. Howden CW, Graham DY. Recent developments pertaining to H. pylori infection. Am J Gastroenterol. 2021;116:1-3.
14. Chey WD, Leontiadis G, Howden W, et al. ACG clinical guideline: treatment of Helicobacter pylori infection. Am J Gastroenterol. 2017;112:212-239.
15. Pinto-Sanchez MI, Yuan Y, Hassan A, et al. Proton pump inhibitors for functional dyspepsia. Cochrane Database Syst Rev. 2017;11:CD011194.
16. National Institute for Health and Care Excellence. Gastro-oesophageal reflux disease and dyspepsia in adults: investigation and management. [Clinical guideline] Accessed August 6, 2021. www.ncbi.nlm.nih.gov/books/NBK552570/
17. Duncanson KR, Talley NJ, Walker MM, et al. Food and functional dyspepsia: a systematic review. J Hum Nutr Diet. 2018;31:390-407.
18. Lin JT. Screening of gastric cancer: who, when, and how. Clin Gastroenterol Hepatol. 2014;12:135-138.
19. Spielmans GI, Spence-Sing T, Parry P. Duty to warn: antidepressant black box suicidality warning is empirically justified. Front Psychiatry. 2020;11:1-18.
20. Tack J, Janssen P, Masaoka T, et al. Efficacy of buspirone, a fundus-relaxing drug, in patients with functional dyspepsia. Clin Gastroenterol Hepatol. 2012;10:1239-1245.
21. Pittayanon R, Yuan Y, Bollegala NP, et al. Prokinetics for functional dyspepsia: a systemic review and meta-analysis of randomized controlled trials. Am J Gastroenterol. 2019;114:233-243.
22. Deutsch JK, Levitt J, Hass DJ. Complementary and alternative medicine for functional gastrointestinal disorders. Am J Gastroenterol. 2020;115:350-364.
23. Malfertheiner P. STW 5 (iberogast) therapy in gastrointestinal functional disorders. Dig Dis. 2017;35:25-29.
24. Sáez-González E, Conde I, Díaz-Jaime FC, et al. Iberogast-induced severe hepatotoxicity leading to liver transplantation. Am J Gastroenterol. 2016;111:1364-1365.
25. Soo S, Forman D, Delaney B, et al. A systematic review of psychological therapies for nonulcer dyspepsia. Am J Gastroenterol. 2004;99:1817-1822.
The global prevalence of dyspepsia is approximately 20%,1 and it is often associated with other comorbidities and overlapping gastrointestinal complaints. The effects on the patient’s quality of life, including societal impacts, are considerable. Symptoms and their response to treatment are highly variable, necessitating individualized management. While some patients’ symptoms may be refractory to standard medical treatment initially, evidence suggests that the strategies summarized in our guidance here—including the use of tricyclic antidepressants (TCAs), prokinetics, and adjunctive therapies—may alleviate symptoms and improve patients’ quality of life.
What dyspepsia is—and what it isn’t
Dyspepsia is a poorly characterized disorder often associated with nausea, heartburn, early satiety, and bloating. The American College of Gastroenterology (ACG) now advocates using a clinically relevant definition of dyspepsia as “predominant epigastric pain lasting at least a month” as long as epigastric pain is the patient's primary complaint.2 Causes of dyspepsia are listed in TABLE 1.
Heartburn, a burning sensation in the chest, is not a dyspeptic symptom but the 2 may often coexist. In general, dyspepsia does not have a colicky or postural component. Symptoms that are relieved by evacuation of feces or gas generally should not be considered a part of dyspepsia.
Functional dyspepsia (FD) is a subset for which no structural pathology has been identified, accounting for up to 70% of all patients with dyspepsia.3 The Rome Foundation, in its recent update (Rome IV), has highlighted 4 key symptoms and 2 proposed subtypes (TABLE 2).4 The comorbidities of anxiety, depression, and somatization appear to be more prevalent in these dyspepsia patients than in those with organic issues. The incidence of gastric malignancy is low in this cohort.3,5 Dyspepsia occurring after an acute infection is referred to as postinfectious functional dyspepsia.
Pathophysiology of functional dyspepsia. Dysmotility, visceral hypersensitivity, mucosal immune dysfunction, altered gut microbiota, and disturbed central nervous system processing contribute in varying degrees to the pathophysiology of FD. There is evidence that luminal factors have the potential to trigger local neuronal excitability.6,7 Early life psychosocial factors may further influence illness behaviors, coping strategies, stress responses, and the intensity of symptoms perceived by the patient.8
Clues in the history and physical examination
Patients describe their discomfort using a variety of terms, including pain, gnawing, burning, gassiness, or queasiness. Although allergic reactions to food (swelling of lips and tongue with a rash) are rare in adults, food intolerances are common in patients with dyspepsia.9 Consumption of nonsteroidal anti-inflammatory drugs is a common cause of dyspepsia, even at over-the-counter strength, and may cause ulceration, gastrointestinal bleeding, and anemia. Narcotic and marijuana use and the anticholinergic effects of antidepressant medications are associated with gastrointestinal dysmotility, including gastroparesis.
Patients with FD often exhibit symptoms of other functional abdominal disorders including irritable bowel syndrome, functional heartburn, bloating, or chronic nausea, and may have been previously diagnosed with overlapping conditions suggestive of visceral hypersensitivity, including depression, anxiety, fibromyalgia, migraine, and pelvic pain. During the patient’s office visit, be alert to any indication of an underlying psychological issue.
Continue to: The initial diagnostic challenge
The initial diagnostic challenge is to identify those patients who may have a structural disorder requiring expedited and targeted investigation. Weight loss, night waking, and vomiting are unusual in the setting of either FD or Helicobacter pylori gastritis. These and other features of concern (TABLE 3) make a diagnosis of a functional disorder less likely and should prompt immediate consideration of abdominal imaging or endoscopic examination. Epigastric tenderness on palpation is common in patients with FD and is not necessarily predictive of structural pathology—unless accompanied by other findings of concern. Abdominal scars or a history of trauma may be suggestive of abdominal wall pain. Abdominal pain that remains unchanged or increases when the muscles of the abdominal wall are tensed (Carnett sign) suggests abdominal wall pain.
Initial testing and Tx assessments focus on H pylori
All 3 of the major US gastroenterology organizations recommend a stepwise approach in patients without alarm symptoms, generally beginning (in those < 60 years) by testing for H pylori with either the stool antigen or urea breath test (UBT)—and initiating appropriate treatment if results are positive.5,10 (The first step for those ≥ 60 years is discussed later.) Since the serum antibody test cannot differentiate between active and past infection, it is not recommended if other options are available.11 The stool antigen test is preferred; it is a cost-effective option used for both diagnosis and confirmation of H pylori eradication.
The UBT identifies active infection with a sensitivity and specificity of > 95%12 but is more labor intensive, employs an isotope, and is relatively expensive. Because proton pump inhibitors (PPIs), bismuth, and antibiotics may increase the false-negative rate for both the UBT and stool antigen test, we recommend that these medications be held for 2 to 4 weeks prior to testing.11 H2-receptor antagonists do not need to be restricted.
Treatment regimens containing clarithromycin have fallen into disfavor given the high rates of resistance that are now encountered. Fourteen-day regimens that can be used empirically (without susceptibility testing) are bismuth quadruple therapy (bismuth, metronidazole, tetracycline, and PPI) or rifabutin triple therapy (rifabutin, amoxicillin, and PPI).13 To confirm eradication, perform repeat testing with either stool antigen or UBT no sooner than 4 weeks after completion of therapy. If the first treatment fails, try a second regimen using different antibiotics.14 Although the impact of H pylori eradication on dyspeptic symptoms is only modest, this strategy is recommended also to reduce the risk of peptic ulceration and gastric neoplasia.
Next-step testing and Tx considerations
Given the heterogeneity of presenting symptoms of dyspepsia, some clinicians may be hesitant to diagnose a functional disorder at the first visit, preferring instead to conduct a limited range of investigations in concert with initial medical management. In these circumstances it would be reasonable, in addition to testing for H pylori, to order a complete blood count (CBC) and to measure serum lipase and liver enzymes. Keep in mind that liver enzymes may not be elevated in uncomplicated biliary colic.
Continue to: Consider ultrasound imaging...
Consider ultrasound imaging if gallstones are a consideration. A computerized tomography scan may not exclude uncomplicated and noncalcified gallstones, but it is an excellent modality for detecting suspected retroperitoneal pathology. Consider working with a gastroenterologist if the patient exhibits alarm features.
Empiric PPI therapy. A trial of daily PPI use over 4 weeks is recommended for patients without H pylori and for those whose symptoms continue despite eradication of the bacterium. A Cochrane meta-analysis found that PPI therapy was more effective than placebo (31% vs 26%; risk ratio, 0.88; number needed to treat [NNT] = 11; 95% CI 0.82 to 0.94; P < .001).15 PPI therapy appears to be slightly more effective than treatment with H2-receptor antagonists. Both are proposed in the United Kingdom guideline.16 Both are generally safe and well tolerated but are not without potential adverse effects when used long term.
Dietary modification. Patients with dyspepsia commonly report that meals exacerbate symptoms. This is likely due to a combination of gastric distension and underlying visceral hypersensitivity rather than food composition.
There is no reliable “dyspepsia diet,” although a systematic review implicated wheat and high-fat foods as the 2 most common contributors to symptom onset.17 Recommended dietary modifications would be to consume smaller, more frequent meals and to eliminate recognized trigger foods. Patients with postprandial distress syndrome, a subset of FD, may want to consider reducing fat intake to help alleviate discomfort. If symptoms continue, evaluate for lactose intolerance. Also, consider a trial of a gluten-free diet. The low-FODMAP diet (restricting fermentable oligo-, di- and monosaccharides, as well as polyols) has shown benefit in patients with irritable bowel syndrome and may be considered in those with intractable FD, given the overlap in physiology of the disorders.
Upper gastrointestinal endoscopy. The ACG has suggested that esophagogastroduodenoscopy (EGD) be performed as the first investigative step for patients ≥ 60 years, while testing for H pylori be considered as the first step in younger patients, even if alarm symptoms are present2 (FIGURE). This decision must be individualized, particularly in patients of Asian, Central or South American, or Caribbean descent, in whom the incidence of gastric cancer is higher with earlier onset.18
Continue to: Also consider EGD...
Also consider EGD for patients whose symptoms have not improved despite eradication of H pylori or an adequate trial of PPI therapy. While some guidelines do not require EGD in low-risk patients at this stage, other authorities would consider this step prudent, particularly when quality of life has been significantly impaired. An underlying organic cause, mainly erosive esophagitis or peptic ulcer disease, is found in 20% to 30% of patients with dyspepsia.5
Most patients without alarm features, with normal findings on upper endoscopy, who do not have H pylori gastritis, and whose symptoms continue despite a trial of PPI therapy, will have FD (FIGURE).2
Offer patients with functional dyspepsia supportive therapy
Neuromodulators
TCAs are superior to placebo in reducing dyspeptic symptoms with an NNT of 6 and are recommended for patients with ongoing symptoms despite PPI therapy or H pylori eradication.2 Begin with a low dose and increase as tolerated. It may take a few weeks for improvement to be seen. Exercise caution in the presence of cardiac arrhythmias.
Mirtazapine, 7.5 to 15 mg every night at bedtime, reduces fullness and bloating in postprandial distress syndrome and is useful for patients who have lost weight. It’s important to note that TCAs and mirtazapine both have the potential for QT prolongation, as well as depression and suicidality in younger patients.19 The anxiolytic buspirone, 10 mg before meals, augments fundic relaxation, improves overall symptom severity, and helps alleviate early satiety, postprandial fullness, and upper abdominal bloating.20
Prokinetics
A recent meta-analysis demonstrated significant benefit in symptom control in dyspeptic patients treated with prokinetics (NNT = 7).21 However, the benefit was predominantly due to cisapride, a drug that was withdrawn from the US market due to adverse effects. There are no clinical trials of metoclopramide or domperidone (not available in the United States) in FD. Nonetheless, the ACG has given a conditional recommendation, based on low-quality evidence, for the use of prokinetics in patients with FD not responding to PPI therapy, H pylori eradication, or TCA therapy.2
Continue to: A shortcoming of the established guidelines
A shortcoming of the established guidelines is that they do not provide guidance as to long-term management of those patients who respond to prescription medications. Our practice has been to continue medications for a minimum of 3 months, then begin a slow taper in order to establish the lowest efficacious dose. Some patients may relapse and require full dosage for a longer period of time.
Adjunctive therapies are worth considering
Complementary and alternative medicines. Products containing ginger, carraway oil, artichoke leaf extract, turmeric, and red pepper are readily available without prescription and have long been used with variable results for dyspepsia.22 The 9-herb combination STW-5 has demonstrated superiority over placebo in a number of studies and has a favorable safety profile.23 The recommended dose is 10 to 20 drops tid. The European manufacturer has recently modified the package insert noting rare cases of hepatotoxicity.24
A commercially available formulation (FDgard) containing L-menthol (a key component of peppermint oil) and caraway has been found to reduce the intensity of symptoms in patients with FD. Potential adverse effects include nausea, contact dermatitis, bronchospasm, and atrial fibrillation. Cayenne, a red pepper extract, is available over the counter for the benefit for epigastric pain and bloating. Begin with a 500-mg dose before breakfast and a 1000-mg dose before dinner, increasing to 2500 mg/d as tolerated. Cayenne preparations may trigger drug toxicities and are best avoided in patients taking antihypertensives, theophylline, or anticoagulants.
Cognitive behavioral therapy, acupuncture, and hypnosis. These modalities are time consuming, are often expensive, are not always covered by insurance, and require significant motivation. A systematic review found no benefit.25 Subsequent studies summarized in the ACG guidelines2 reported benefit; however, a lack of blinding and significant heterogeneity among the groups detract from the quality of the data. It remains unclear whether these are effective strategies for FD, and therefore they cannot be recommended on a routine basis.
CORRESPONDENCE
Norman H. Gilinsky, MD, Division of Digestive Diseases, University of Cincinnati College of Medicine, 231 Albert Sabin Way, Cincinnati, OH 45267-0595; norman.gilinsky@ uc.edu
1. Ford AC, Marwaha A, Sood R, et al. Global prevalence of, and risk factors for, uninvestigated dyspepsia: a meta-analysis. Gut. 2015;64:1049-1057.
2. Moayyedi P, Lacy BE, Andrews CN, et al. ACG and CAG clinical guideline: management of dyspepsia. Am J Gastroenterol. 2017;112:988-1013.
3. Ford AC, Marwaha A, Lim A, et al. What is the prevalence of clinically significant endoscopic findings in subjects with dyspepsia? Systematic review and meta-analysis. Clin Gastroenterol Hepatol. 2010;8:830-837.
4. Stanghellini V, Chan FKL, Hasler WL, et al. Gastroduodenal disorders. Gastroenterology. 2016;150:1380-1392.
5. Shaukat A, Wang A, Acosta RD, et al. The role of endoscopy in dyspepsia. Gastrointest Endosc. 2015;82:227-232.
6. Wauters L, Talley NJ, Walker MM, et al. Novel concepts in the pathophysiology and treatment of functional dyspepsia. Gut. 2020;69:591-600.
7. Weinstock LB, Pace LA, Rezaie A, et al. Mast cell activation syndrome: a primer for the gastroenterologist. Dig Dis Sci. 2021;66:965-982.
8. Drossman DA. Functional gastrointestinal disorders. History, pathophysiology, clinical features and Rome IV. 2016. Accessed August 16, 2021. www.gastrojournal.org/article/S0016-5085(16)00223-7/fulltext
9. Boettcher E, Crowe SE. Dietary proteins and functional gastrointestinal disorders. Am J Gastroenterol. 2013;108:728-736.
10. Talley NJ, AGA. American Gastroenterological Association medical position statement: evaluation of dyspepsia. Gastroenterol. 2005;129:1753-1755.
11. El-Serag HB, Kao JY, Kanwal F, et al. Houston Consensus Conference on testing for Helicobacter pylori infection in the United States. Clin Gastroenterol Hepatol. 2018;16:992-1002.
12. Ferwana M, Abdulmajeed I, Alhajiahmed A, et al. Accuracy of urea breath test in Helicobacter pylori infection: meta-analysis. World J Gastroenterol. 2015;21:1305-1314.
13. Howden CW, Graham DY. Recent developments pertaining to H. pylori infection. Am J Gastroenterol. 2021;116:1-3.
14. Chey WD, Leontiadis G, Howden W, et al. ACG clinical guideline: treatment of Helicobacter pylori infection. Am J Gastroenterol. 2017;112:212-239.
15. Pinto-Sanchez MI, Yuan Y, Hassan A, et al. Proton pump inhibitors for functional dyspepsia. Cochrane Database Syst Rev. 2017;11:CD011194.
16. National Institute for Health and Care Excellence. Gastro-oesophageal reflux disease and dyspepsia in adults: investigation and management. [Clinical guideline] Accessed August 6, 2021. www.ncbi.nlm.nih.gov/books/NBK552570/
17. Duncanson KR, Talley NJ, Walker MM, et al. Food and functional dyspepsia: a systematic review. J Hum Nutr Diet. 2018;31:390-407.
18. Lin JT. Screening of gastric cancer: who, when, and how. Clin Gastroenterol Hepatol. 2014;12:135-138.
19. Spielmans GI, Spence-Sing T, Parry P. Duty to warn: antidepressant black box suicidality warning is empirically justified. Front Psychiatry. 2020;11:1-18.
20. Tack J, Janssen P, Masaoka T, et al. Efficacy of buspirone, a fundus-relaxing drug, in patients with functional dyspepsia. Clin Gastroenterol Hepatol. 2012;10:1239-1245.
21. Pittayanon R, Yuan Y, Bollegala NP, et al. Prokinetics for functional dyspepsia: a systemic review and meta-analysis of randomized controlled trials. Am J Gastroenterol. 2019;114:233-243.
22. Deutsch JK, Levitt J, Hass DJ. Complementary and alternative medicine for functional gastrointestinal disorders. Am J Gastroenterol. 2020;115:350-364.
23. Malfertheiner P. STW 5 (iberogast) therapy in gastrointestinal functional disorders. Dig Dis. 2017;35:25-29.
24. Sáez-González E, Conde I, Díaz-Jaime FC, et al. Iberogast-induced severe hepatotoxicity leading to liver transplantation. Am J Gastroenterol. 2016;111:1364-1365.
25. Soo S, Forman D, Delaney B, et al. A systematic review of psychological therapies for nonulcer dyspepsia. Am J Gastroenterol. 2004;99:1817-1822.
PRACTICE RECOMMENDATIONS
› Test for Helicobacter pylori in patients who are < 60 years of age or who have no alarm symptoms. If results are negative, consider a trial of proton pump inhibitor therapy. C
› Arrange for esophagogastroduodenoscopy in individuals ≥ 60 years of age and all patients with alarm symptoms, to identify or rule out a structural cause. C
› Consider a diagnosis of functional dyspepsia if the work-up is negative. Supportive therapy, including the use of tricyclic antidepressants, prokinetics, and a holistic approach to lifestyle changes in select patients have shown encouraging results. C
Strength of recommendation (SOR)
A Good-quality patient-oriented evidence
B Inconsistent or limited-quality patient-oriented evidence
C Consensus, usual practice, opinion, disease-oriented evidence, case series

Strategies to identify and prevent penicillin allergy mislabeling and appropriately de-label patients
In North America and Europe, penicillin allergy is the most common drug-allergy label.1 Carrying a penicillin-allergy label, which has recently gained more attention in health care systems, leads to suboptimal outcomes, increased use of broad-spectrum antibiotics, increased risk of adverse reactions, and increased cost of care.2,3 Despite the high rate of reported reactions, clinically significant immunoglobulin E (IgE)-mediated and T cell–mediated hypersensitivity reactions to penicillins are uncommon.2
Through the Choosing Wisely initiative of the American Board of Internal Medicine Foundation, the American Academy of Allergy, Asthma, and Immunology has issued a recommendation: “Don’t overuse non-beta lactam antibiotics in patients with a history of penicillin allergy without an appropriate evaluation.”4 The primary care physician (PCP) plays a critical role in the appropriate evaluation and accurate initial labeling of penicillin allergy. Furthermore, the PCP plays an integral part, in conjunction with the allergist, in removing the “penicillin allergy” label from a patient’s chart when feasible.

The history of penicillin and prevalence of allergy
History. Penicillin, the first antibiotic, was discovered in 1928 by physician and microbiologist Alexander Fleming when he observed that a mold of the Penicillium genus inhibited growth of gram-positive pathogens.5 Along with pharmacologist Howard Florey and chemist Ernst Chain, both of whom assisted in the large-scale isolation and production of the antibiotic, Fleming won the Nobel Prize in Physiology or Medicine in 1945 for this discovery.5
Antibiotics transformed the practice of medicine across a spectrum, including safer childbirth, surgical procedures, and transplantation.6 Penicillin remains first-line therapy for many infections, such as streptococcal pharyngitis,7 and is the only recommended medication for treating syphilis during pregnancy.8 Continued effectiveness of penicillin in these cases allows broad-spectrum antibiotics to be reserved for more severe infections. Regrettably, incorrect antibiotic allergy labeling poses a significant risk to the patient and health care system.
Epidemiology. As with all medications, the potential for anaphylaxis exists after administration of penicillin. Because its use is widespread, penicillin is the most common cause of drug-induced anaphylaxis. However, the incidence of penicillin-induced anaphylaxis is low9: A 1968 World Health Organization report stated that the rate of penicillin anaphylaxis was between 0.015% and 0.04%.10 A more recent study reported an incidence of 1 in 207,191 patients after an oral dose and 1 in 95,298 after a parenteral dose.11 The most common reactions to penicillins are urticaria and delayed maculopapular rash.8
In the United States, the prevalence of reported penicillin allergy is approximately 10% (estimated range, 8% to 12%)3,12-15; among hospitalized patients, that prevalence is estimated to be as high as 15%.13,15 However, the prevalence of confirmed penicillin allergy is low and has decreased over time—demonstrated in a longitudinal study in which the rate of a positive skin test fell from 15% in 1995 to 0.8% in 2013.16,17
Studies have confirmed that as many as 90% of patients who report penicillin allergy are, in fact, able to tolerate penicillins.14,18-20 This finding might be a consequence of initial mislabeling of penicillin allergy; often, adverse reactions are documented as “allergy” when no risk of anaphylaxis exists. Furthermore, patients can outgrow IgE-mediated penicillin allergy because the presence of penicillin IgE antibodies wanes over time.14,15
Continue to: Consequences of mislabeling
Consequences of mislabeling
Clinical consequences. A multitude of clinical consequences result from carrying a “penicillin allergy” label.
Use of broad-spectrum antibiotics leads to increased risk of Clostridium difficile infection and to development of resistant bacteria, such as methicillin-resistant Staphylococcus aureus and vancomycin-resistant enterococcus.2,15
Alternative antibiotics used in the setting of a “penicillin allergy” label might be less efficacious and result in suboptimal outcomes. For example, vancomycin is less effective against methicillin-sensitive S aureus bacteremia than nafcillin or cefazolin.2,21 Beta-lactam antibiotics—in particular, cefazolin—are often first-line for perioperative prophylaxis; patients with reported penicillin allergy often receive a less-optimal alternative, such as clindamycin, vancomycin, or gentamicin.22 These patients are at increased risk of surgical site infection.2,22
In addition, using penicillin alternatives can result in greater risk of drug reactions and adverse effects.2
Increased health care costs. Primarily through observational studies, penicillin allergy has been associated with higher health care costs.23 Patients with reported penicillin allergy had, on average, a longer inpatient stay than patients without penicillin allergy, at a 3-year total estimated additional cost of $64.6 million.24 Inpatients with a listed penicillin allergy had direct drug costs ranging from “no difference” to $609 per patient more than patients without a listed penicillin allergy. Outpatient prescription costs were $14 to $193 higher per patient for patients with a listed penicillin allergy.23
Continue to: Considerations in special populations
Considerations in special populations. Evaluating penicillin allergy during routine care is key to decreasing the necessity for urgent penicillin evaluation and possible desensitization at the time of serious infection. Certain patient populations pose specific challenges:
- Pregnant patients. Unverified penicillin allergy during pregnancy is associated with an increased rate of cesarean section and longer postpartum hospitalization.25 Additionally, group B streptococcus-positive women have increased exposure to alternative antibiotics and an increased incidence of adverse drug reactions.25
- Elderly patients. Drug allergy increases with aging.1 Elderly patients in a long-term care facility are more likely to experience adverse drug effects or drug–drug interactions from the use of penicillin alternatives, such as clindamycin, vancomycin, and fluoroquinolones.2
- Oncology patients often require antibiotic prophylaxis as well as treatment for illnesses, such as neutropenic fever, for which beta-lactam antibiotics are often used as initial treatment.2,26
- Other important populations that present specific challenges include hospitalized patients, pediatric patients, and patients with a sexually transmitted infection.2
Active management of a penicillin-allergy label
Greater recognition of the consequences of penicillin allergy in recent years has led to efforts by hospitals and other health care organizations to develop processes by which patients can be successfully de-labeled as part of antibiotic stewardship programs9 and other initiatives. Ideally, every patient who has a “penicillin allergy” label would be referred to an allergist for evaluation; however, the number of allergy specialists is limited, and access to such specialists might be restricted in some areas, making this approach impracticable. Active management of penicillin allergy requires strategies to both test and de-label patients, as well as proactive approaches to prevent incorrect labeling. These proactive approaches require involvement of all members of the health care team—especially PCPs.
Preventing incorrect labeling. PCPs are the most likely to initially label a patient as allergic to penicillin.27 Most physicians rely on a reported history of allergy alone when selecting medication12; once a patient has been labeled “penicillin allergic,” they often retain that mislabel through adulthood.27,28 A qualitative study of PCPs’ views on prescribing penicillin found that many were aware that documented allergies were incorrect but were uncomfortable using their clinical judgment to prescribe a penicillin or change the record, for fear of a future anaphylactic reaction.29 The first step in the case of any reported reaction should be for you to elicit an accurate drug allergy history (TABLE 1).

As with other drug reactions, you should consider the context surrounding the reaction to a penicillin. Take care to review signs and symptoms of the reaction to look for clues that make a true allergic reaction more, or less, likely.
Symptoms can generally be divided into low-risk and high-risk categories27 (TABLE 2). An example of a commonly reported low-risk symptom is diarrhea that develops after several doses of a penicillin. In the absence of other symptoms, this finding is most likely due to elimination of normal gut flora,30 not to an allergic reaction to the medication. Symptoms of intolerance to the medication, such as headache and nausea, are also low risk.27,31 In contrast, immediate onset of abdominal pain after a dose of penicillin and lip or throat swelling are considered high risk.

Continue to: Patients presenting with urticaria...
Patients presenting with urticaria or maculopapular rash after taking penicillin are particularly challenging.30 A study of patients in a primary care pediatrics practice found that 7.4% of children receiving a prescription for a penicillin reported a rash.32 Here, timing of onset of symptoms provides some clarity about the likelihood of true allergy. Rashes that manifest during the first hours after exposure are more likely to be IgE mediated, particularly when accompanied by other systemic symptoms; they should be considered high risk. Delayed-onset rashes (> 72 hours after exposure) are usually non-IgE mediated and therefore are generally lower risk,8,30,33 except when associated with certain features, such as mucosal involvement and skin peeling.
Despite acknowledging viral exanthems in the differential, many physicians still label patients presenting with any rash as “allergic.”28 Take care to look for other potential causes of a rash; for example, patients taking amoxicillin who have concurrent Epstein-Barr virus infection frequently develop a maculopapular rash.34 Caubet and colleagues found that 56% of pediatric patients with a history of nonimmediate rash and a negative oral challenge to amoxicillin tested positive for viral infection.28
A family history of penicillin allergy alone should not preclude the use of penicillin.8,27,31 Similarly, if a patient has already received and tolerated a subsequent course of the same penicillin derivative after the initial reaction, the “penicillin allergy” label can be removed. If the reaction history is unknown, refer the patient to an allergist for further evaluation.
Accurate charting is key. With most hospital systems and physician practices now documenting in an electronic health record, there exists the ability to document, in great detail, patients’ reactions to medications. Previous studies have found, however, that such documentation is often done poorly, or not done at all. One such study found that (1) > 20% of patients with a “penicillin allergy” label did not have reaction details listed and (2) when reactions were listed, many were incorrectly labeled as “allergy,” not “intolerance.”35
Many electronic health record systems lump drug allergies, adverse effects, and food and environmental allergies into a single section, leading to a lack of distinction between adverse reactions and true allergy.31 Although many PCPs report that it is easy to change a patient’s allergy label in the record,29 more often, a nurse, resident, or consultant actually documents the reaction.35
Continue to: Documentation at the time of the reaction...
Documentation at the time of the reaction, within the encounter note and the allergy tab, is essential, so that other physicians caring for the patient, in the future, will be knowledgeable about the details of the reaction. Make it your responsibility to accurately document penicillin allergy in patients’ charts, including removing the “penicillin allergy” label from the chart of patients whose history is inconsistent with allergy, who have tolerated subsequent courses of the same penicillin derivative, or who have passed testing in an allergist’s office. In a study of 639 patients who tested negative for penicillin allergy, 51% still had a “penicillin allergy” label in their chart more than 4 years later.36
Penicillin allergy evaluation. When a patient cannot be cleared of a “penicillin allergy” label by history alone, and in the absence of severe features such as mucous membrane involvement, they should be further evaluated through objective testing for potential IgE-mediated allergy. This assessment includes penicillin skin testing or an oral challenge, or both.
Skin testing involves skin-prick testing of major and minor determinants of penicillin; when skin-prick testing is negative, intradermal testing of major and minor determinants should follow. The negative predictive value of penicillin skin testing is high: In a prospective, multicenter investigation, researchers demonstrated that, when both the major penicillin determinant and a minor determinant mixture were used, negative predictive value was 97.9%.37
However, a minor determinant mixture is not commercially available in the United States; therefore, penicillin G is often used alone as the minor determinant. Typically, if a patient passes skin testing, a challenge dose of penicillin or amoxicillin is administered, followed by an observation period. The risk of re-sensitization after oral penicillin is thought to be low and does not preclude future use.38
Although drug testing is most often performed in an allergist’s office, several groups have developed protocols that allow for limited testing of low-risk patients in a primary care setting.8,31 For example, several studies have demonstrated that patients presenting with low-risk skin rash can be safely tested with a supervised oral challenge alone.18,28 The FIGURE8,27,30,31,33,34 outlines our proposed workflow for risk stratification and subsequent management of patients with a “penicillin allergy” label.

Continue to: De-labeling requires a systems approach
De-labeling requires a systems approach. Given the mismatch between the large number of patients labeled “penicillin allergic” and the few allergy specialists, referral alone is not enough to solve the problem of mislabeling. Targeting specific populations for testing, such as patients presenting to an inner-city sexually transmitted infection clinic19 or preoperative patients, as is done at the Mayo Clinic,9 has been successful. Skin testing in an inpatient setting has also been shown to be safe and effective,13 allowing for protocol-driven testing under the supervision of trained pharmacists (and others), to relieve the burden on allergy specialists.9
CORRESPONDENCE
Andrew Lutzkanin, MD, 500 University Drive, PO Box 850, Hershey, PA 17033; [email protected]
1. Macy E. The clinical evaluation of penicillin allergy: what is necessary, sufficient and safe given the materials currently available? Clin Exp Allergy. 2011;41:1498-1501. doi: 10.1111/j.1365-2222.2011.03837.x
2. Shenoy ES, Macy E, Rowe T, et al. Evaluation and management of penicillin allergy: a review. JAMA. 2019;321:188-199. doi: 10.1001/jama.2018.19283
3. Blumenthal KG, Li Y, Banerji A, et al. The cost of penicillin allergy evaluation. J Allergy Clin Immunol Pract. 2018;6:1019-1027.e2. doi: 10.1016/j.jaip.2017.08.006
4. American Academy of Allergy, Asthma & Immunology: Ten things physicians and patients should question. American Board of Medicine Foundation Choosing Wisely website. 2018. Accessed July 7, 2021. www.choosingwisely.org/doctor-patient-lists/american-academy-of-allergy-asthma-immunology
5. Tan SY, Tatsumura Y. Alexander Fleming (1881-1955): discoverer of penicillin. Singapore Med J. 2015;56:366-367. doi: 10.11622/smedj.2015105
6. Marston HD, Dixon DM, Knisely JM, et al. Antimicrobial resistance. JAMA. 2016;316:1193-1204. doi: 10.1001/jama.2016.11764
7. Spinks A, Glasziou PP, Del Mar CB. Antibiotics for sore throat. Cochrane Database Syst Rev. 2013;2013:CD000023. doi: 10.1002/14651858.CD000023.pub4
8. Castells M, Khan DA, Phillips EJ. Penicillin allergy. N Engl J Med. 2019;381:2338-2351. doi: 10.1056/NEJMra1807761
9. Khan DA. Proactive management of penicillin and other antibiotic allergies. Allergy Asthma Proc. 2020;41:82-89. doi: 10.2500/aap.2020.41.190024
10. Idsoe O, Guthe T, Willcox RR, et al. Nature and extent of penicillin side-reactions, with particular reference to fatalities from anaphylactic shock. Bull World Health Organ. 1968;38:159-188.
11. Chiriac AM, Macy E. Large health system databases and drug hypersensitivity. J Allergy Clin Immunol Pract. 2019;7:2125-2131. doi: 10.1016/j.jaip.2019.04.014
12. Albin S, Agarwal S. Prevalence and characteristics of reported penicillin allergy in an urban outpatient adult population. Allergy Asthma Proc. 2014;35:489-494. doi: 10.2500/aap.2014.35.3791
13. Sacco KA, Bates A, Brigham TJ, et al. Clinical outcomes following inpatient penicillin allergy testing: a systematic review and meta-analysis. Allergy. 2017;72:1288-1296. doi: 10.1111/all.13168
14. Khan DA, Solensky R. Drug allergy. J Allergy Clin Immunol. 2010;125(2 suppl 2):S126-S137. doi: 10.1016/j.jaci.2009.10.028
15. Blumenthal KG, Shenoy ES, Varughese CA, et al. Impact of a clinical guideline for prescribing antibiotics to inpatients reporting penicillin or cephalosporin allergy. Ann Allergy Asthma Immunol. 2015;115:294-300.e2. doi: 10.1016/j.anai.2015.05.011
16. Macy E, Schatz M, Lin C, et al. The falling rate of positive penicillin skin tests from 1995 to 2007. Perm J. 2009;13:12-18. doi: 10.7812/tpp/08-073
17. Macy E, Ngor EW. Safely diagnosing clinically significant penicillin allergy using only penicilloyl-poly-lysine, penicillin, and oral amoxicillin. J Allergy Clin Immunol Pract. 2013;1:258-263. doi: 10.1016/j.jaip.2013.02.002
18. Bourke J, Pavlos R, James I, et al. Improving the effectiveness of penicillin allergy de-labeling. J Allergy Clin Immunol Pract. 2015;3:365-374.e1. doi: 10.1016/j.jaip.2014.11.002
19. Gadde J, Spence M, Wheeler B, et al. Clinical experience with penicillin skin testing in a large inner-city STD clinic. JAMA. 1993;270:2456-2463.
20. Klaustermeyer WB, Gowda VC. Penicillin skin testing: a 20-year study at the West Los Angeles Veterans Affairs Medical Center. Mil Med. 2005;170:701-704. doi: 10.7205/milmed.170.8.701.
21. McDanel JS, Perencevich EN, Diekema DJ, et al. Comparative effectiveness of beta-lactams versus vancomycin for treatment of methicillin-susceptible Staphylococcus aureus bloodstream infections among 122 hospitals. Clin Infect Dis. 2015;61:361-367. doi: 10.1093/cid/civ308
22. Blumenthal KG, Ryan EE, Li Y, et al. The impact of a reported penicillin allergy on surgical site infection risk. Clin Infect Dis. 2018;66:329-336. doi: 10.1093/cid/cix794
23. Mattingly TJ 2nd, Fulton A, Lumish RA, et al. The cost of self-reported penicillin allergy: a systematic review. J Allergy Clin Immunol Pract. 2018;6:1649-1654.e4. doi: 10.1016/j.jaip.2017.12.033
24. Macy E, Contreras R. Health care use and serious infection prevalence associated with penicillin “allergy” in hospitalized patients: a cohort study. J Allergy Clin Immunol. 2014;133:790-796. doi: 10.1016/j.jaci.2013.09.021
25. Desai SH, Kaplan MS, Chen Q, et al. Morbidity in pregnant women associated with unverified penicillin allergies, antibiotic use, and group B streptococcus infections. Perm J. 2017;21:16-80. doi: 10.7812/TPP/16-080
26. Freifeld AG, Bow EJ, Sepkowitz KA, et al. Clinical practice guideline for the use of antimicrobial agents in neutropenic patients with cancer: 2010 update by the Infectious Diseases Society of America. Clin Infect Dis. 2011;52:e56-e93. doi: 10.1093/cid/cir073
27. Vyles D, Mistry RD, Heffner V, et al. Reported knowledge and management of potential penicillin allergy in children. Acad Pediatr. 2019;19:684-690. doi: 10.1016/j.acap.2019.01.002
28. Caubet J-C, Kaiser L, Lemaître B, et al. The role of penicillin in benign skin rashes in childhood: a prospective study based on drug rechallenge. J Allergy Clin Immunol. 2011;127:218-222. doi: 10.1016/j.jaci.2010.08.025
29. Wanat M, Anthierens S, Butler CC, et al. Patient and primary care physician perceptions of penicillin allergy testing and subsequent use of penicillin-containing antibiotics: a qualitative study. J Allergy Clin Immunol Pract. 2019;7:1888-1893.e1. doi: 10.1016/j.jaip.2019.02.036
30. Norton AE, Konvinse K, Phillips EJ, et al. Antibiotic allergy in pediatrics. Pediatrics. 2018;141: e20172497. doi: 10.1542/peds.2017-2497
31. Collins C. The low risks and high rewards of penicillin allergy delabeling: an algorithm to expedite the evaluation. J Pediatr. 2019;212:216-223. doi: 10.1016/j.jpeds.2019.05.060
32. Ibia EO, Schwartz RH, Wiedermann BL. Antibiotic rashes in children: a survey in a private practice setting. Arch Dermatol. 2000;136:849-854. doi: 10.1001/archderm.136.7.849
33. Salkind AR, Cuddy PG, Foxworth JW. The rational clinical examination. Is this patient allergic to penicillin? An evidence-based analysis of the likelihood of penicillin allergy. JAMA. 2001;285:2498-2505. doi: 10.1001/jama.285.19.2498
34. Patel BM. Skin rash with infectious mononucleosis and ampicillin. Pediatrics. 1967;40:910-911.
35. Inglis JM, Caughey GE, Smith W, et al. Documentation of penicillin adverse drug reactions in electronic health records: inconsistent use of allergy and intolerance labels. Intern Med J. 2017;47:1292-1297. doi: 10.1111/imj.13558
36. Lachover-Roth I, Sharon S, Rosman Y, et al. Long-term follow-up after penicillin allergy delabeling in ambulatory patients. J Allergy Clin Immunol Pract. 2019;7:231-235.e1. doi: 10.1016/j.jaip.2018.04.042
37. Solensky R, Jacobs J, Lester M, et al. Penicillin allergy evaluation: a prospective, multicenter, open-label evaluation of a comprehensive penicillin skin test kit. J Allergy Clin Immunol Pract. 2019;7:1876-1885.e3. doi: 10.1016/j.jaip.2019.02.040
38. A; ; . Drug allergy: an updated practice parameter. Ann Allergy Asthma Immunol. 2010;105:259-273. doi: 10.1016/j.anai.2010.08.002
In North America and Europe, penicillin allergy is the most common drug-allergy label.1 Carrying a penicillin-allergy label, which has recently gained more attention in health care systems, leads to suboptimal outcomes, increased use of broad-spectrum antibiotics, increased risk of adverse reactions, and increased cost of care.2,3 Despite the high rate of reported reactions, clinically significant immunoglobulin E (IgE)-mediated and T cell–mediated hypersensitivity reactions to penicillins are uncommon.2
Through the Choosing Wisely initiative of the American Board of Internal Medicine Foundation, the American Academy of Allergy, Asthma, and Immunology has issued a recommendation: “Don’t overuse non-beta lactam antibiotics in patients with a history of penicillin allergy without an appropriate evaluation.”4 The primary care physician (PCP) plays a critical role in the appropriate evaluation and accurate initial labeling of penicillin allergy. Furthermore, the PCP plays an integral part, in conjunction with the allergist, in removing the “penicillin allergy” label from a patient’s chart when feasible.
The history of penicillin and prevalence of allergy
History. Penicillin, the first antibiotic, was discovered in 1928 by physician and microbiologist Alexander Fleming when he observed that a mold of the Penicillium genus inhibited growth of gram-positive pathogens.5 Along with pharmacologist Howard Florey and chemist Ernst Chain, both of whom assisted in the large-scale isolation and production of the antibiotic, Fleming won the Nobel Prize in Physiology or Medicine in 1945 for this discovery.5
Antibiotics transformed the practice of medicine across a spectrum, including safer childbirth, surgical procedures, and transplantation.6 Penicillin remains first-line therapy for many infections, such as streptococcal pharyngitis,7 and is the only recommended medication for treating syphilis during pregnancy.8 Continued effectiveness of penicillin in these cases allows broad-spectrum antibiotics to be reserved for more severe infections. Regrettably, incorrect antibiotic allergy labeling poses a significant risk to the patient and health care system.
Epidemiology. As with all medications, the potential for anaphylaxis exists after administration of penicillin. Because its use is widespread, penicillin is the most common cause of drug-induced anaphylaxis. However, the incidence of penicillin-induced anaphylaxis is low9: A 1968 World Health Organization report stated that the rate of penicillin anaphylaxis was between 0.015% and 0.04%.10 A more recent study reported an incidence of 1 in 207,191 patients after an oral dose and 1 in 95,298 after a parenteral dose.11 The most common reactions to penicillins are urticaria and delayed maculopapular rash.8
In the United States, the prevalence of reported penicillin allergy is approximately 10% (estimated range, 8% to 12%)3,12-15; among hospitalized patients, that prevalence is estimated to be as high as 15%.13,15 However, the prevalence of confirmed penicillin allergy is low and has decreased over time—demonstrated in a longitudinal study in which the rate of a positive skin test fell from 15% in 1995 to 0.8% in 2013.16,17
Studies have confirmed that as many as 90% of patients who report penicillin allergy are, in fact, able to tolerate penicillins.14,18-20 This finding might be a consequence of initial mislabeling of penicillin allergy; often, adverse reactions are documented as “allergy” when no risk of anaphylaxis exists. Furthermore, patients can outgrow IgE-mediated penicillin allergy because the presence of penicillin IgE antibodies wanes over time.14,15
Continue to: Consequences of mislabeling
Consequences of mislabeling
Clinical consequences. A multitude of clinical consequences result from carrying a “penicillin allergy” label.
Use of broad-spectrum antibiotics leads to increased risk of Clostridium difficile infection and to development of resistant bacteria, such as methicillin-resistant Staphylococcus aureus and vancomycin-resistant enterococcus.2,15
Alternative antibiotics used in the setting of a “penicillin allergy” label might be less efficacious and result in suboptimal outcomes. For example, vancomycin is less effective against methicillin-sensitive S aureus bacteremia than nafcillin or cefazolin.2,21 Beta-lactam antibiotics—in particular, cefazolin—are often first-line for perioperative prophylaxis; patients with reported penicillin allergy often receive a less-optimal alternative, such as clindamycin, vancomycin, or gentamicin.22 These patients are at increased risk of surgical site infection.2,22
In addition, using penicillin alternatives can result in greater risk of drug reactions and adverse effects.2
Increased health care costs. Primarily through observational studies, penicillin allergy has been associated with higher health care costs.23 Patients with reported penicillin allergy had, on average, a longer inpatient stay than patients without penicillin allergy, at a 3-year total estimated additional cost of $64.6 million.24 Inpatients with a listed penicillin allergy had direct drug costs ranging from “no difference” to $609 per patient more than patients without a listed penicillin allergy. Outpatient prescription costs were $14 to $193 higher per patient for patients with a listed penicillin allergy.23
Continue to: Considerations in special populations
Considerations in special populations. Evaluating penicillin allergy during routine care is key to decreasing the necessity for urgent penicillin evaluation and possible desensitization at the time of serious infection. Certain patient populations pose specific challenges:
- Pregnant patients. Unverified penicillin allergy during pregnancy is associated with an increased rate of cesarean section and longer postpartum hospitalization.25 Additionally, group B streptococcus-positive women have increased exposure to alternative antibiotics and an increased incidence of adverse drug reactions.25
- Elderly patients. Drug allergy increases with aging.1 Elderly patients in a long-term care facility are more likely to experience adverse drug effects or drug–drug interactions from the use of penicillin alternatives, such as clindamycin, vancomycin, and fluoroquinolones.2
- Oncology patients often require antibiotic prophylaxis as well as treatment for illnesses, such as neutropenic fever, for which beta-lactam antibiotics are often used as initial treatment.2,26
- Other important populations that present specific challenges include hospitalized patients, pediatric patients, and patients with a sexually transmitted infection.2
Active management of a penicillin-allergy label
Greater recognition of the consequences of penicillin allergy in recent years has led to efforts by hospitals and other health care organizations to develop processes by which patients can be successfully de-labeled as part of antibiotic stewardship programs9 and other initiatives. Ideally, every patient who has a “penicillin allergy” label would be referred to an allergist for evaluation; however, the number of allergy specialists is limited, and access to such specialists might be restricted in some areas, making this approach impracticable. Active management of penicillin allergy requires strategies to both test and de-label patients, as well as proactive approaches to prevent incorrect labeling. These proactive approaches require involvement of all members of the health care team—especially PCPs.
Preventing incorrect labeling. PCPs are the most likely to initially label a patient as allergic to penicillin.27 Most physicians rely on a reported history of allergy alone when selecting medication12; once a patient has been labeled “penicillin allergic,” they often retain that mislabel through adulthood.27,28 A qualitative study of PCPs’ views on prescribing penicillin found that many were aware that documented allergies were incorrect but were uncomfortable using their clinical judgment to prescribe a penicillin or change the record, for fear of a future anaphylactic reaction.29 The first step in the case of any reported reaction should be for you to elicit an accurate drug allergy history (TABLE 1).
As with other drug reactions, you should consider the context surrounding the reaction to a penicillin. Take care to review signs and symptoms of the reaction to look for clues that make a true allergic reaction more, or less, likely.
Symptoms can generally be divided into low-risk and high-risk categories27 (TABLE 2). An example of a commonly reported low-risk symptom is diarrhea that develops after several doses of a penicillin. In the absence of other symptoms, this finding is most likely due to elimination of normal gut flora,30 not to an allergic reaction to the medication. Symptoms of intolerance to the medication, such as headache and nausea, are also low risk.27,31 In contrast, immediate onset of abdominal pain after a dose of penicillin and lip or throat swelling are considered high risk.
Continue to: Patients presenting with urticaria...
Patients presenting with urticaria or maculopapular rash after taking penicillin are particularly challenging.30 A study of patients in a primary care pediatrics practice found that 7.4% of children receiving a prescription for a penicillin reported a rash.32 Here, timing of onset of symptoms provides some clarity about the likelihood of true allergy. Rashes that manifest during the first hours after exposure are more likely to be IgE mediated, particularly when accompanied by other systemic symptoms; they should be considered high risk. Delayed-onset rashes (> 72 hours after exposure) are usually non-IgE mediated and therefore are generally lower risk,8,30,33 except when associated with certain features, such as mucosal involvement and skin peeling.
Despite acknowledging viral exanthems in the differential, many physicians still label patients presenting with any rash as “allergic.”28 Take care to look for other potential causes of a rash; for example, patients taking amoxicillin who have concurrent Epstein-Barr virus infection frequently develop a maculopapular rash.34 Caubet and colleagues found that 56% of pediatric patients with a history of nonimmediate rash and a negative oral challenge to amoxicillin tested positive for viral infection.28
A family history of penicillin allergy alone should not preclude the use of penicillin.8,27,31 Similarly, if a patient has already received and tolerated a subsequent course of the same penicillin derivative after the initial reaction, the “penicillin allergy” label can be removed. If the reaction history is unknown, refer the patient to an allergist for further evaluation.
Accurate charting is key. With most hospital systems and physician practices now documenting in an electronic health record, there exists the ability to document, in great detail, patients’ reactions to medications. Previous studies have found, however, that such documentation is often done poorly, or not done at all. One such study found that (1) > 20% of patients with a “penicillin allergy” label did not have reaction details listed and (2) when reactions were listed, many were incorrectly labeled as “allergy,” not “intolerance.”35
Many electronic health record systems lump drug allergies, adverse effects, and food and environmental allergies into a single section, leading to a lack of distinction between adverse reactions and true allergy.31 Although many PCPs report that it is easy to change a patient’s allergy label in the record,29 more often, a nurse, resident, or consultant actually documents the reaction.35
Continue to: Documentation at the time of the reaction...
Documentation at the time of the reaction, within the encounter note and the allergy tab, is essential, so that other physicians caring for the patient, in the future, will be knowledgeable about the details of the reaction. Make it your responsibility to accurately document penicillin allergy in patients’ charts, including removing the “penicillin allergy” label from the chart of patients whose history is inconsistent with allergy, who have tolerated subsequent courses of the same penicillin derivative, or who have passed testing in an allergist’s office. In a study of 639 patients who tested negative for penicillin allergy, 51% still had a “penicillin allergy” label in their chart more than 4 years later.36
Penicillin allergy evaluation. When a patient cannot be cleared of a “penicillin allergy” label by history alone, and in the absence of severe features such as mucous membrane involvement, they should be further evaluated through objective testing for potential IgE-mediated allergy. This assessment includes penicillin skin testing or an oral challenge, or both.
Skin testing involves skin-prick testing of major and minor determinants of penicillin; when skin-prick testing is negative, intradermal testing of major and minor determinants should follow. The negative predictive value of penicillin skin testing is high: In a prospective, multicenter investigation, researchers demonstrated that, when both the major penicillin determinant and a minor determinant mixture were used, negative predictive value was 97.9%.37
However, a minor determinant mixture is not commercially available in the United States; therefore, penicillin G is often used alone as the minor determinant. Typically, if a patient passes skin testing, a challenge dose of penicillin or amoxicillin is administered, followed by an observation period. The risk of re-sensitization after oral penicillin is thought to be low and does not preclude future use.38
Although drug testing is most often performed in an allergist’s office, several groups have developed protocols that allow for limited testing of low-risk patients in a primary care setting.8,31 For example, several studies have demonstrated that patients presenting with low-risk skin rash can be safely tested with a supervised oral challenge alone.18,28 The FIGURE8,27,30,31,33,34 outlines our proposed workflow for risk stratification and subsequent management of patients with a “penicillin allergy” label.
Continue to: De-labeling requires a systems approach
De-labeling requires a systems approach. Given the mismatch between the large number of patients labeled “penicillin allergic” and the few allergy specialists, referral alone is not enough to solve the problem of mislabeling. Targeting specific populations for testing, such as patients presenting to an inner-city sexually transmitted infection clinic19 or preoperative patients, as is done at the Mayo Clinic,9 has been successful. Skin testing in an inpatient setting has also been shown to be safe and effective,13 allowing for protocol-driven testing under the supervision of trained pharmacists (and others), to relieve the burden on allergy specialists.9
CORRESPONDENCE
Andrew Lutzkanin, MD, 500 University Drive, PO Box 850, Hershey, PA 17033; [email protected]
1. Macy E. The clinical evaluation of penicillin allergy: what is necessary, sufficient and safe given the materials currently available? Clin Exp Allergy. 2011;41:1498-1501. doi: 10.1111/j.1365-2222.2011.03837.x
2. Shenoy ES, Macy E, Rowe T, et al. Evaluation and management of penicillin allergy: a review. JAMA. 2019;321:188-199. doi: 10.1001/jama.2018.19283
3. Blumenthal KG, Li Y, Banerji A, et al. The cost of penicillin allergy evaluation. J Allergy Clin Immunol Pract. 2018;6:1019-1027.e2. doi: 10.1016/j.jaip.2017.08.006
4. American Academy of Allergy, Asthma & Immunology: Ten things physicians and patients should question. American Board of Medicine Foundation Choosing Wisely website. 2018. Accessed July 7, 2021. www.choosingwisely.org/doctor-patient-lists/american-academy-of-allergy-asthma-immunology
5. Tan SY, Tatsumura Y. Alexander Fleming (1881-1955): discoverer of penicillin. Singapore Med J. 2015;56:366-367. doi: 10.11622/smedj.2015105
6. Marston HD, Dixon DM, Knisely JM, et al. Antimicrobial resistance. JAMA. 2016;316:1193-1204. doi: 10.1001/jama.2016.11764
7. Spinks A, Glasziou PP, Del Mar CB. Antibiotics for sore throat. Cochrane Database Syst Rev. 2013;2013:CD000023. doi: 10.1002/14651858.CD000023.pub4
8. Castells M, Khan DA, Phillips EJ. Penicillin allergy. N Engl J Med. 2019;381:2338-2351. doi: 10.1056/NEJMra1807761
9. Khan DA. Proactive management of penicillin and other antibiotic allergies. Allergy Asthma Proc. 2020;41:82-89. doi: 10.2500/aap.2020.41.190024
10. Idsoe O, Guthe T, Willcox RR, et al. Nature and extent of penicillin side-reactions, with particular reference to fatalities from anaphylactic shock. Bull World Health Organ. 1968;38:159-188.
11. Chiriac AM, Macy E. Large health system databases and drug hypersensitivity. J Allergy Clin Immunol Pract. 2019;7:2125-2131. doi: 10.1016/j.jaip.2019.04.014
12. Albin S, Agarwal S. Prevalence and characteristics of reported penicillin allergy in an urban outpatient adult population. Allergy Asthma Proc. 2014;35:489-494. doi: 10.2500/aap.2014.35.3791
13. Sacco KA, Bates A, Brigham TJ, et al. Clinical outcomes following inpatient penicillin allergy testing: a systematic review and meta-analysis. Allergy. 2017;72:1288-1296. doi: 10.1111/all.13168
14. Khan DA, Solensky R. Drug allergy. J Allergy Clin Immunol. 2010;125(2 suppl 2):S126-S137. doi: 10.1016/j.jaci.2009.10.028
15. Blumenthal KG, Shenoy ES, Varughese CA, et al. Impact of a clinical guideline for prescribing antibiotics to inpatients reporting penicillin or cephalosporin allergy. Ann Allergy Asthma Immunol. 2015;115:294-300.e2. doi: 10.1016/j.anai.2015.05.011
16. Macy E, Schatz M, Lin C, et al. The falling rate of positive penicillin skin tests from 1995 to 2007. Perm J. 2009;13:12-18. doi: 10.7812/tpp/08-073
17. Macy E, Ngor EW. Safely diagnosing clinically significant penicillin allergy using only penicilloyl-poly-lysine, penicillin, and oral amoxicillin. J Allergy Clin Immunol Pract. 2013;1:258-263. doi: 10.1016/j.jaip.2013.02.002
18. Bourke J, Pavlos R, James I, et al. Improving the effectiveness of penicillin allergy de-labeling. J Allergy Clin Immunol Pract. 2015;3:365-374.e1. doi: 10.1016/j.jaip.2014.11.002
19. Gadde J, Spence M, Wheeler B, et al. Clinical experience with penicillin skin testing in a large inner-city STD clinic. JAMA. 1993;270:2456-2463.
20. Klaustermeyer WB, Gowda VC. Penicillin skin testing: a 20-year study at the West Los Angeles Veterans Affairs Medical Center. Mil Med. 2005;170:701-704. doi: 10.7205/milmed.170.8.701.
21. McDanel JS, Perencevich EN, Diekema DJ, et al. Comparative effectiveness of beta-lactams versus vancomycin for treatment of methicillin-susceptible Staphylococcus aureus bloodstream infections among 122 hospitals. Clin Infect Dis. 2015;61:361-367. doi: 10.1093/cid/civ308
22. Blumenthal KG, Ryan EE, Li Y, et al. The impact of a reported penicillin allergy on surgical site infection risk. Clin Infect Dis. 2018;66:329-336. doi: 10.1093/cid/cix794
23. Mattingly TJ 2nd, Fulton A, Lumish RA, et al. The cost of self-reported penicillin allergy: a systematic review. J Allergy Clin Immunol Pract. 2018;6:1649-1654.e4. doi: 10.1016/j.jaip.2017.12.033
24. Macy E, Contreras R. Health care use and serious infection prevalence associated with penicillin “allergy” in hospitalized patients: a cohort study. J Allergy Clin Immunol. 2014;133:790-796. doi: 10.1016/j.jaci.2013.09.021
25. Desai SH, Kaplan MS, Chen Q, et al. Morbidity in pregnant women associated with unverified penicillin allergies, antibiotic use, and group B streptococcus infections. Perm J. 2017;21:16-80. doi: 10.7812/TPP/16-080
26. Freifeld AG, Bow EJ, Sepkowitz KA, et al. Clinical practice guideline for the use of antimicrobial agents in neutropenic patients with cancer: 2010 update by the Infectious Diseases Society of America. Clin Infect Dis. 2011;52:e56-e93. doi: 10.1093/cid/cir073
27. Vyles D, Mistry RD, Heffner V, et al. Reported knowledge and management of potential penicillin allergy in children. Acad Pediatr. 2019;19:684-690. doi: 10.1016/j.acap.2019.01.002
28. Caubet J-C, Kaiser L, Lemaître B, et al. The role of penicillin in benign skin rashes in childhood: a prospective study based on drug rechallenge. J Allergy Clin Immunol. 2011;127:218-222. doi: 10.1016/j.jaci.2010.08.025
29. Wanat M, Anthierens S, Butler CC, et al. Patient and primary care physician perceptions of penicillin allergy testing and subsequent use of penicillin-containing antibiotics: a qualitative study. J Allergy Clin Immunol Pract. 2019;7:1888-1893.e1. doi: 10.1016/j.jaip.2019.02.036
30. Norton AE, Konvinse K, Phillips EJ, et al. Antibiotic allergy in pediatrics. Pediatrics. 2018;141: e20172497. doi: 10.1542/peds.2017-2497
31. Collins C. The low risks and high rewards of penicillin allergy delabeling: an algorithm to expedite the evaluation. J Pediatr. 2019;212:216-223. doi: 10.1016/j.jpeds.2019.05.060
32. Ibia EO, Schwartz RH, Wiedermann BL. Antibiotic rashes in children: a survey in a private practice setting. Arch Dermatol. 2000;136:849-854. doi: 10.1001/archderm.136.7.849
33. Salkind AR, Cuddy PG, Foxworth JW. The rational clinical examination. Is this patient allergic to penicillin? An evidence-based analysis of the likelihood of penicillin allergy. JAMA. 2001;285:2498-2505. doi: 10.1001/jama.285.19.2498
34. Patel BM. Skin rash with infectious mononucleosis and ampicillin. Pediatrics. 1967;40:910-911.
35. Inglis JM, Caughey GE, Smith W, et al. Documentation of penicillin adverse drug reactions in electronic health records: inconsistent use of allergy and intolerance labels. Intern Med J. 2017;47:1292-1297. doi: 10.1111/imj.13558
36. Lachover-Roth I, Sharon S, Rosman Y, et al. Long-term follow-up after penicillin allergy delabeling in ambulatory patients. J Allergy Clin Immunol Pract. 2019;7:231-235.e1. doi: 10.1016/j.jaip.2018.04.042
37. Solensky R, Jacobs J, Lester M, et al. Penicillin allergy evaluation: a prospective, multicenter, open-label evaluation of a comprehensive penicillin skin test kit. J Allergy Clin Immunol Pract. 2019;7:1876-1885.e3. doi: 10.1016/j.jaip.2019.02.040
38. A; ; . Drug allergy: an updated practice parameter. Ann Allergy Asthma Immunol. 2010;105:259-273. doi: 10.1016/j.anai.2010.08.002
PRACTICE RECOMMENDATIONS
› Obtain an accurate drug allergy history from all patients who have a listed penicillin allergy. B
› De-label penicillin allergy in patients who report symptoms of an adverse reaction (diarrhea, headache, or nausea) but who (1) do not have other systemic symptoms; (2) do have a family history, but no personal history, of a reaction; or (3) have tolerated the same penicillin derivative since the initial reaction. B
› Refer patients whose reaction history includes hives, shortness of breath, or other allergic-type signs and symptoms for potential skin testing or oral challenge, or both. B
Strength of recommendation (SOR)
A Good-quality patient-oriented evidence
B Inconsistent or limited-quality patient-oriented evidence
C Consensus, usual practice, opinion, disease-oriented evidence, case series
