User login
Low RA flare rate reported after Pfizer COVID vaccination
Patients with rheumatoid arthritis in remission had a rate of flare following vaccination with the Pfizer/BioNtech COVID-19 vaccine that appears to be on par with rates seen with other vaccines in patients with RA, according to results from a small Italian cohort study.
“Our data show a very low flare rate [7.8% (6 of 77)] after the BNT162b2 COVID-19 vaccine in patients with RA in remission and are consistent with previous findings about varicella-zoster virus (6.7%) and hepatitis B virus (2.2%) vaccinations,” Riccardo Bixio, MD, and colleagues from University of Verona (Italy) Hospital Trust wrote in ACR Open Rheumatology. “Because remission is not commonly obtained in the real world, we are aware that our findings may not be generalizable to all patients with RA receiving COVID-19 vaccination.”
Other studies of flare rate after COVID-19 vaccination in patients with a variety of rheumatic and musculoskeletal diseases have reported rates ranging from 5% to 17%, they said.
The 77 consecutive patients from the University of Verona center that conducted the study were all in clinical remission in the 3 months before vaccination based on a 28-joint Disease Activity Score based on C-reactive protein (DAS28-CRP) of less than 2.6, and all had discontinued antirheumatic therapies according to American College of Rheumatology COVID-19 recommendations. The researchers defined flares as agreement between patient and rheumatologist assessments and a DAS28-CRP increase of more than 1.2.
Five of the six people with a flare had it occur after the second dose at a mean of 2.6 days later, and all flares were resolved within 2 weeks using glucocorticoids with or without anti-inflammatory drugs. One flare was called severe. The overall disease activity of the cohort after 3 months was not significantly changed after vaccination.
In noting that five out of the six patients with flares had withdrawn or delayed antirheumatic therapies around the time of vaccination according to ACR recommendations, the authors wrote that “Even if there is no direct evidence that holding therapies could occur in a higher proportion of disease flares, we suggest that clinicians consider this possibility when counseling patients about COVID-19 vaccination.”
The authors had no outside funding for the study and had no potential conflicts of interest to disclose.
FROM ACR OPEN RHEUMATOLOGY
Combo treatment for NSCLC with brain metastases extends survival by two years for some
The trial is noteworthy because to date, few patients with nonsquamous NSCLC and untreated asymptomatic brain metastases (or those treated with corticosteroids), were ever included in clinical trials that examine the efficacy and safety of chemotherapy and immunotherapy together as first-line treatment, said Ernest Nadal, MD, PhD, of the University of Barcelona Catalan Institute of Oncology at L’Hospitalet de Llobregat. He and his colleagues presented their findings at the meeting, which was organized by the International Association for the Study of Lung Cancer (IASLC).
With only 40 patients, the clinical trial was small, but the safety profile of atezolizumab combined with carboplatin and pemetrexed was favorable in patients with untreated brain metastases and those receiving corticosteroids (dexamethasone of 4 mg once a day or less).
At a median follow-up of 17.3 months, median intracranial and systemic progression-free survival – the co-primary study endpoints, along with safety – were 6.9 months and 8.9 months in 40 patients treated with the immune checkpoint inhibitor and chemotherapy combination, and the 18-month progression-free survival rates were 10.4% and 24.9%, respectively, Dr. Nadal said.
Secondary study endpoints included response rate and overall survival rate. The overall response rate was 40% at 12 weeks; 19 patients (47.5%) had stable disease in the central nervous system, and 19 (47.5%) had a systemic response. The median overall survival was 13.6 months, and 2-year overall survival was 32%.
“The 12-week progression-free survival rate was 60%, [which was] above the expected rate of 50%, and the grade 2-4 toxicity rate was 27.5%, [which was] below the threshold of 35%,” Dr. Nadal said.
Four patients achieved complete response in the brain, and four patients had discordance between systemic and central nervous system response: two with progressive disease in the body and stable disease in the brain, and two with progressive disease in the brain and stable disease in the body.
Study subjects were chemotherapy-naive patients with stage IV non-squamous NSCLC without estimated glomerular filtration rate (EGFR) or anaplastic lymphoma kinase (ALK) genetic alterations and with untreated brain metastases. They were enrolled from 11 clinical sites and treated with carboplatin (5 AUCs) and pemetrexed (500 mg/m2) plus atezolizumab (1,200 mg) every 3 weeks for four to six cycles, followed by maintenance with pemetrexed plus atezolizumab for 2 years or until disease progression or unacceptable toxicity.
Grade 3 treatment-related adverse events occurring in at least 5% of patients were anemia (eight patients), back pain (four patients), thrombocytopenia (two patients) and dyspnea, pneumonitis, and elevated alanine transaminase (one patient each). Grade 4 treatment-related adverse events occurred in three patients and included thrombocytopenia, neutropenia, and hallucinations.
“Brain metastases are the most frequent cancer-related neurological complication and have a major impact on the neurocognitive function, quality of life, and the patient’s prognosis,” Dr. Nadal said, adding that local therapy could add toxicity and delay systemic treatment.
The progression-free survival findings in this study are similar to those reported in the KEYNOTE-189 clinical trial in patients with brain metastases, which showed improved outcomes with pembrolizumab plus chemotherapy in patients with previously untreated metastatic nonsquamous NSCLC, Dr. Nadal said.
The safety profile was also favorable – even in the 17 patients receiving corticosteroids at baseline.
“This combination can result in clinical benefit in terms of overall survival in this population “Correlative studies with brain imaging and blood samples are currently ongoing,” he said.
Charu Aggarwal, MD, MPH, an oncologist with Penn Medicine who specializes in lung cancer, said the findings help address how patients with untreated, asymptomatic brain metastases should be treated.
Taken together with findings from other prospective and retrospective trials in this population, the outcomes demonstrate that “in patients with asymptomatic brain metastases, upfront immunochemotherapy is associated with intracranial response rates,” she said. Patients with asymptomatic brain metastases can be safely treated with chemoimmunotherapy, but “proper patient selection is going to be key.”
Unanswered questions from this study include the size of brain metastases at trial enrollment, whether programmed death-ligand 1 status matters, and whether there is an optimal dose of steroids that should be mandated for inclusion into trials, Dr. Aggarwal added, noting that several trials enrolling patients with lung cancer are seeking to answer these questions.
Dr. Nadal reported receiving research support, speaker bureau fees, and/or honoraria from multiple pharmaceutical companies. Dr. Aggarwal reported serving on an advisory board for multiple pharmaceutical companies. She also reported clinical trial funding to her institution from multiple companies.
REPORTING FROM WCLC 2021
Can reversing T-cell exhaustion benefit in B-cell lymphoma relapse?
Durable remissions have been obtained in around 30%-40% of relapsed/refractory large B-cell lymphomas (BCL) through the use of CD19-directed chimeric antigen receptor-modified T-cell (CAR T-cell) therapy. However, T cell exhaustion and/or an immunosuppressive tumor environment may contribute to CAR T cell failure and BCL relapse.
To counter this failure, researchers assessed the use PD1 blockade with pembrolizumab after CD19-directed CAR T-cell therapy. Such treatment appeared safe and was able to achieve clinical responses in some patients with B-cell lymphomas refractory to or relapsed after CAR T-cell therapy, according to the results of a small study (NCT02650999) reported in Blood.
Success for some
Twelve patients with BCL who were either refractory to (nine patients) or relapsed after (three patients) CD19-directed CAR T-cell therapy were treated with pembrolizumab at 200 mg IV every 3 weeks, according to Elise A. Chong, MD, of the University of Pennsylvania, Philadelphia, and colleagues.
Overall, 3 of the 12 patients showed a response after pembrolizumab: One complete response; two partial responses. In addition, 1 patient had stable disease; thus, 4 of the 12 patients showed clinical benefit, according to the researchers. After pembrolizumab, these four patients with clinical benefit showed an increase in the percentage of CAR T cells as assessed by mass cytometry, and three out of the four also showed increases in CAR19 transgene levels as determined by qPCR. In addition, immune profiling using mass cytometry revealed increased CAR T-cell activation and proliferation and less T-cell exhaustion in these clinical responders.
In terms of safety, pembrolizumab appeared to be well tolerated and the only ≥ grade 3 adverse events related to pembrolizumab were neutropenia in three patients, the researchers added.
Looking forward
“Although patient numbers are small, these data suggest potential differences in the biology of CAR T cells or in the overall immune landscape of responders and nonresponders that influence the clinical efficacy of PD-1 blockade administered in this setting. Future work aimed at improving immune health after CAR T-cell infusion, as well as work aimed at decreasing CD8+ CAR T-cell exhaustion in CAR T-cell products, may serve as potential platforms for enhancing the efficacy of immune checkpoint blockade in patients treated with CAR T cells,” the researchers concluded.
The study was sponsored by the Abramson Cancer Center of the University of Pennsylvania. The authors reported serving on advisory boards and receiving research funding from a variety of pharmaceutical and biotechnology companies.
FROM BLOOD
COVID is especially dangerous for mesothelioma
according to Susana Cedres, MD, PhD, a thoracic medical oncologist at Vall d’Hebron University Hospital, Barcelona.
At the annual World Conference on Lung Cancer, she reported on her institution’s experience during the first year of the pandemic before widespread vaccine rollouts.
Among 38 malignant pleural mesothelioma (MPM) patients, seven (18%) patients were diagnosed with COVID-19 and of these, three patients were asymptomatic, four (57%) died of complications including bilateral pneumonia within a median of less than half a month after diagnosis, and a fifth patient died from MPM progression.
The findings confirm the particular risk of COVID in MPM. According to researchers reporting in Scientific Reports, mesothelioma was the only cancer linked to significantly worse outcomes. Other risks included tuberculosis, drug use, hepatitis, HIV/AIDS, cardiomyopathy, and diabetes.
However, the Barcelona report only has seven patients, and it’s one of only a few to address the specifics of COVID in MPM.
“There really is a need for more inclusion of MPM patients in international [COVID] registries” to better characterize the course of infection and improve outcomes, said study discussant Francoise Galateau-Salle, MD, PhD, a mesothelioma expert at the Cancer Center Leon Berard in Lyon, France.
Among the seven positive cases in Barcelona, almost all had comorbidities, with the most common being cardiovascular disease in four patients (57%). Only two patients (29%) were on oncologic treatment at the time they were diagnosed, and the median age at diagnosis was 62 years. Four cases were in men, three in women. MPM stage was not reported.
WCLC 2021 was organized by the International Association for the Study of Lung Cancer.
No funding source was reported. Dr. Cedres is an adviser and/or reported travel expenses from a number of companies, including Merck, Pfizer, and Bristol-Myers Squibb. Dr. Galateau-Salle had no disclosures.
FROM WCLC 2021
Practicing High-Value Pediatric Care During a Pandemic: The Challenges and Opportunities
High-value care (HVC) is a philosophy and approach to medicine that focuses on achieving the best patient outcomes through evidence-based practice while minimizing harm to patients, wasted healthcare resources, and costs. Incorporating HVC principles in pediatric clinical decision-making is particularly important owing to the harms of hospitalization, overutilization, and overdiagnosis, as well as rising costs of pediatric care.1-4 How can we maintain these principles in the face of a global pandemic and new emerging syndrome, multisystem inflammatory syndrome in children (MIS-C), which has dramatically impacted healthcare systems for children?
In this article, we discuss the barriers and opportunities around practicing HVC in our evolving approach to novel COVID-19 management in hospitalized children. We also draw lessons from our experiences on how we can respond to future events that rapidly shift our approach to care.
BARRIERS TO PROVIDING HVC FOR HOSPITALIZED CHILDREN DURING COVID-19
As children’s hospitals and pediatric providers responded to the COVID-19 pandemic, practice recommendations were implemented rapidly and changed rapidly. A major challenge with an event like this is how we respond to the unknown and uncertainty, something most healthcare workers are not comfortable doing at baseline,5,6 particularly trainees and early-career physicians.7 With the benefit of hindsight, many early clinical approaches to care may now be seen as low-value care (LVC). For example, COVID-19 test availability was initially limited, and many hospitals utilized respiratory viral panels (RVPs) to potentially eliminate COVID-19 as an etiology of symptoms. RVP use increased during this time8; however, studies have shown that the co-infection rate of SARS-CoV2 with other respiratory viruses varies widely, so a positive RVP was of uncertain benefit.9 In addition, routine RVP use is often low value and may lead to overdiagnosis, additional overtesting cascades, and, at times, false reassurance and premature closure of the diagnostic workup.10
As our understanding of COVID-19 has expanded, rapid changes in treatment have also occurred. Early data were often preliminary and based on small trials of adults, and treatments ranged from inexpensive and available (dexamethasone) to quite expensive (remdesivir, monoclonal antibodies). Pragmatic randomized controlled trials (RCTs) are an important tool that may have been underutilized in pediatrics. Similar to our adult hospitalist colleagues’ experience,11 the rapid rise in cases provided an opportunity to collaborate across institutions to assess which treatments were most effective. In particular, the predictable rise in rates of MIS-C after a surge in COVID-19 cases could have provided an avenue to evaluate the relative effectiveness of the various treatments used.12 However, there were limited pediatric RCTs and thus a missed opportunity to establish an evidence-based pediatric standard of care for COVID-19 and MIS-C. This resulted in the development and dissemination of care practices before they were fully tested in children.
Similarly, the medical community has become increasingly aware of laboratory findings that may be predictive of clinical course.13 The outcomes of COVID and MIS-C are potentially severe, so looking for “early warning signs” with diagnostic testing is appealing. Clinicians responding to early data, and with a fear of missing something, may order a full panel of bloodwork for admitted patients to assist with decision-making and may underestimate the perceived minor harms and cost of unnecessary testing/admissions.3 However, most of the evidence regarding lab values came from the adult population. There is little understanding of how lab values impact pediatric-specific outcomes.14 Even for MIS-C, a pediatric-specific condition, early protocols emphasize broad testing approaches.15 A focus on grave (but rare) outcomes from a novel virus may also distract from more common causes of symptoms and lead to missed common diagnoses that are less severe.16 For both testing and treatment, having this early information before clear evidence on how it guided care may have caused more harm than benefit. Again, RCTs may have helped guide MIS-C therapies and protocol development.
Changing workflows may also create new barriers to HVC. One of the recommendations from Choosing Wisely® during the COVID-19 pandemic was to batch lab draws17 to reduce the risk of exposure to healthcare workers performing phlebotomy, as well as staff who transport, handle, and process bloodwork in the lab. This may inadvertently encourage the approach of getting a lab test “in case” we need it with a single daily blood draw. In trying to avoid multiple encounters (and conserve personal protective equipment [PPE]), we may be taking a less stepwise approach than in prepandemic times.
Finally, children’s hospitals witnessed significant financial challenges and reductions in patient volume related to the pandemic.18 Reductions in patient volume could present a potential opportunity for practicing HVC (eg, more time to discuss downstream effects) or alternatively could inadvertently incentivize low-value, low-priority care via messaging around preserving financial viability.
For clinicians and healthcare systems, these examples highlight why we may be predisposed to practicing LVC during a pandemic or similar emerging threat.
STRATEGIES FOR HVC PRACTICE DURING FUTURE MAJOR EVENTS
In light of these challenging clinical scenarios and nonclinical factors that predispose us to LVC, how can we reinforce a high-value approach to care during a pandemic or similar emerging threat? The following five specific concepts may help providers and organizations optimize HVC during this pandemic and in future situations:
- Utilize pediatric RCTs to provide evidence-based recommendations. In the face of a novel virus with unclear manifestations, treatment options were rapidly implemented without time for careful evaluation. In the future, collaboratively utilizing shared resources in the research community could help rapidly and rigorously evaluate outcomes in the pursuit of evidence-based practice.
- Use standardization as a tool to mitigate uncertainty. Knowing that uncertainty can be a driver of overuse and that during emerging threats, evidence is scarce and rapidly changing, a structured method for standardizing practice across your institution or multiple institutions can be helpful in many ways. Electronic health record–based orders and guidelines provide a standard of care to relieve uncertainty and have been shown to reduce overtesting.19 These resources can also be adapted rapidly as evidence emerges, reducing the burden on providers to know the latest evolving best practice. Experts who have reviewed the literature should have a method to quickly disseminate these findings through standardized practice, providing a venue for rapid learning and implementation.20
- Plan for active deimplementation from the outset. It is inevitable that some practices implemented early in pandemic response may need to be deimplemented later as the evidence and situation evolve. However, there is ample evidence that deimplementation can be difficult.21 Building in deimplementation mechanisms, such as standing educational sessions or hospital committees dedicated to value that review practices, from the beginning may ease these changes.
- Take advantage of novel opportunities to improve value. Early stop-gap interventions may be wasteful, but the upheaval from major events may also create novel opportunities to improve value in other ways. Some of these efforts, like PPE conservation and as-needed follow-up visits, may become useful methods to improve value even after the pandemic ends.22,23 The decreased pursuit of healthcare during the pandemic may also have given us an opportunity to better define when delayed diagnosis or even nondiagnosis for certain conditions is acceptable and when it may cause harm.
- Highlight harms of overuse. While avoiding unnecessary costs is an important aspect of reducing overuse, often the other human-centered harms of overuse are better motivators for HVC. Especially during the response to an emerging threat, the impacts of overuse may be compounded. Laboratory resources that are strained to meet COVID-19 testing demand will be further stretched by overuse of other laboratory testing. Overuse of ineffective treatments adds stress to nurses, pharmacists, and other front-line staff taking care of ill patients. Side effects of unnecessary interventions, including those that could prolong hospitalization, would also increase strain on the system. Reducing overuse is also a way to reduce workload for hospital staff during a time of crisis. Improved efficiency of practice and less time spent on practices that do not add value to patient care can insulate staff against burnout.24 Hospitalization and healthcare costs can add to the stress and financial burden of patients and families.25 Clinicians can highlight harms of overuse through openly talking about it on rounds with the patients, families, and entire care team and incorporating it into health system–wide messaging.
CONCLUSION
As vaccine distribution continues, like many clinicians, we are hopeful that the worst days of the pandemic are behind us. The crucible of the COVID-19 pandemic has undoubtedly changed us as clinicians and impacted our future practice patterns. We believe there is a need to challenge ourselves to continue to think from a value mindset even in times of crisis. Furthermore, there are important opportunities to learn from our response to the COVID-19 pandemic and find strategies for minimizing LVC outside the pandemic. We believe the lessons learned around improving value during this pandemic can strengthen our response to the next novel, widespread threat and reduce waste in our care systems, with a potential to increase the resilience of systems in the future.
1. Rokach A. Psychological, emotional and physical experiences of hospitalized children. Clin Case Rep Rev. 2016;2. https://doi.org/10.15761/CCRR.1000227
2. Stockwell DC, Landrigan CP, Toomey SL, et al. Adverse events in hospitalized pediatric patients. Pediatrics. 2018;142(2):e20173360. https://doi.org/10.1542/peds.2017-3360
3. Coon ER, Quinonez RA, Moyer VA, Schroeder AR. Overdiagnosis: how our compulsion for diagnosis may be harming children. Pediatrics. 2014;134(5):1013-1023. https://doi.org/10.1542/peds.2014-1778
4. Bui AL, Dieleman JL, Hamavid H, et al. Spending on children’s personal health care in the United States, 1996-2013. JAMA Pediatr. 2017;171(2):181-189. https://doi.org/10.1001/jamapediatrics.2016.4086
5. Ilgen JS, Eva KW, de Bruin A, Cook DA, Regehr G. Comfort with uncertainty: reframing our conceptions of how clinicians navigate complex clinical situations. Adv Health Sci Theory Pract. 2019;24(4):797-809. https://doi.org/10.1007/s10459-018-9859-5
6. Allison JJ, Kiefe CI, Cook EF, Gerrity MS, Orav EJ, Centor R. The association of physician attitudes about uncertainty and risk taking with resource use in a Medicare HMO. Med Decis Making. 1998;18(3):320-329. https://doi.org/10.1177/0272989X9801800310
7. Beck JB, Long M, Ryan MS. Into the unknown: helping learners become more comfortable with diagnostic uncertainty. Pediatrics. 2020;146(5):e2020027300. https://doi.org/10.1542/peds.2020-027300
8. Marshall NC, Kariyawasam RM, Zelyas N, Kanji JN, Diggle MA. Broad respiratory testing to identify SARS-CoV-2 viral co-circulation and inform diagnostic stewardship in the COVID-19 pandemic. Virol J. 2021;18(1):93. https://doi.org/10.1186/s12985-021-01545-9
9. Zimmermann P, Curtis N. Coronavirus infections in children including COVID-19: an overview of the epidemiology, clinical features, diagnosis, treatment and prevention options in children. Pediatr Infect Dis J. 2020;39(5):355-368. https://doi.org/10.1097/INF.0000000000002660
10. Morrison JM, Dudas RA, Collins K. The power and peril of panels. Hosp Pediatr. 2018;8(11):729-732. https://doi.org/10.1542/hpeds.2018-0093
11. Wise J, Coombes R. Covid-19: the inside story of the RECOVERY trial. BMJ. 2020;370:m2670. https://doi.org/10.1136/bmj.m2670.
12. Feldstein LR, Rose EB, Horwitz SM, et al. Multisystem inflammatory syndrome in U.S. children and adolescents. N Engl J Med. 2020;383(4):334-346.
13. Pourbagheri-Sigaroodi A, Bashash D, Fateh F, Abolghasemi H. Laboratory findings in COVID-19 diagnosis and prognosis. Clin Chim Acta. 2020;510:475-482. https://doi.org/10.1056/NEJMoa2021680
14. Henry BM, Benoit SW, de Oliveira MHS, et al. Laboratory abnormalities in children with mild and severe coronavirus disease 2019 (COVID-19): a pooled analysis and review. Clin Biochem. 2020;81:1-8. https://doi.org/10.1016/j.clinbiochem.2020.05.012
15. Centers for Disease Control and Prevention. Information for healthcare providers about multisystem inflammatory syndrome in children (MIS-C). Accessed July 7, 2021. https://www.cdc.gov/mis/hcp/index.html
16. Molloy M, Jerardi K, Marshall T. What are we missing in our search for MIS-C? Hosp Pediatr. 2021;11(4):e66-e69. https://doi.org/10.1542/hpeds.2020-005579
17. Cho HJ, Feldman LS, Keller S, Hoffman A, Pahwa AK, Krouss M. Choosing Wisely in the COVID-19 era: preventing harm to healthcare workers. J Hosp Med. 2020;15(6):360-362. https://doi.org/10.12788/jhm.3457
18. Synhorst DC, Bettenhausen JL, Hall M, et al. Healthcare encounter and financial impact of COVID-19 on children’s hospitals. J Hosp Med. 2021;16(4):223-226. https://doi.org/10.12788/jhm.3572
19. Algaze CA, Wood M, Pageler NM, Sharek PJ, Longhurst CA, Shin AY. Use of a checklist and clinical decision support tool reduces laboratory use and improves cost. Pediatrics. 2016;137(1). https://doi.org/10.1542/peds.2014-3019
20. Rao S, Kwan BM, Curtis DJ, et al. Implementation of a rapid evidence assessment infrastructure during the coronavirus disease 2019 (COVID-19) pandemic to develop policies, clinical pathways, stimulate academic research, and create educational opportunities. J Pediatr. 2021;230:4-8.e2. https://doi.org/10.1016/j.jpeds.2020.10.029
21. Gill PJ, Mahant S. Deimplementation of established medical practice without intervention: does it actually happen? J Hosp Med. 2020;15(12):765-766. https://doi.org/10.12788/jhm.3467
22. Coon ER, Destino LA, Greene TH, Vukin E, Stoddard G, Schroeder AR. Comparison of as-needed and scheduled posthospitalization follow-up for children hospitalized for bronchiolitis: the Bronchiolitis Follow-up Intervention Trial (BeneFIT) randomized clinical trial. JAMA Pediatr. 2020;174(9):e201937. https://doi.org/10.1001/jamapediatrics.2020.1937
23. Steuart R, Huang FS, Schaffzin JK, Thomson J. Finding the value in personal protective equipment for hospitalized patients during a pandemic and beyond. J Hosp Med. 2020;15(5):295-298. https://doi.org/10.12788/jhm.3429
24. Pierce RG, Diaz M, Kneeland P. Optimizing well-being, practice culture, and professional thriving in an era of turbulence. J Hosp Med. 2019;14(2):126-128. https://doi.org/10.12788/jhm.3101
25. Commodari E. Children staying in hospital: a research on psychological stress of caregivers. Ital J Pediatr. 2010;36:40. https://doi.org/10.1186/1824-7288-36-40
High-value care (HVC) is a philosophy and approach to medicine that focuses on achieving the best patient outcomes through evidence-based practice while minimizing harm to patients, wasted healthcare resources, and costs. Incorporating HVC principles in pediatric clinical decision-making is particularly important owing to the harms of hospitalization, overutilization, and overdiagnosis, as well as rising costs of pediatric care.1-4 How can we maintain these principles in the face of a global pandemic and new emerging syndrome, multisystem inflammatory syndrome in children (MIS-C), which has dramatically impacted healthcare systems for children?
In this article, we discuss the barriers and opportunities around practicing HVC in our evolving approach to novel COVID-19 management in hospitalized children. We also draw lessons from our experiences on how we can respond to future events that rapidly shift our approach to care.
BARRIERS TO PROVIDING HVC FOR HOSPITALIZED CHILDREN DURING COVID-19
As children’s hospitals and pediatric providers responded to the COVID-19 pandemic, practice recommendations were implemented rapidly and changed rapidly. A major challenge with an event like this is how we respond to the unknown and uncertainty, something most healthcare workers are not comfortable doing at baseline,5,6 particularly trainees and early-career physicians.7 With the benefit of hindsight, many early clinical approaches to care may now be seen as low-value care (LVC). For example, COVID-19 test availability was initially limited, and many hospitals utilized respiratory viral panels (RVPs) to potentially eliminate COVID-19 as an etiology of symptoms. RVP use increased during this time8; however, studies have shown that the co-infection rate of SARS-CoV2 with other respiratory viruses varies widely, so a positive RVP was of uncertain benefit.9 In addition, routine RVP use is often low value and may lead to overdiagnosis, additional overtesting cascades, and, at times, false reassurance and premature closure of the diagnostic workup.10
As our understanding of COVID-19 has expanded, rapid changes in treatment have also occurred. Early data were often preliminary and based on small trials of adults, and treatments ranged from inexpensive and available (dexamethasone) to quite expensive (remdesivir, monoclonal antibodies). Pragmatic randomized controlled trials (RCTs) are an important tool that may have been underutilized in pediatrics. Similar to our adult hospitalist colleagues’ experience,11 the rapid rise in cases provided an opportunity to collaborate across institutions to assess which treatments were most effective. In particular, the predictable rise in rates of MIS-C after a surge in COVID-19 cases could have provided an avenue to evaluate the relative effectiveness of the various treatments used.12 However, there were limited pediatric RCTs and thus a missed opportunity to establish an evidence-based pediatric standard of care for COVID-19 and MIS-C. This resulted in the development and dissemination of care practices before they were fully tested in children.
Similarly, the medical community has become increasingly aware of laboratory findings that may be predictive of clinical course.13 The outcomes of COVID and MIS-C are potentially severe, so looking for “early warning signs” with diagnostic testing is appealing. Clinicians responding to early data, and with a fear of missing something, may order a full panel of bloodwork for admitted patients to assist with decision-making and may underestimate the perceived minor harms and cost of unnecessary testing/admissions.3 However, most of the evidence regarding lab values came from the adult population. There is little understanding of how lab values impact pediatric-specific outcomes.14 Even for MIS-C, a pediatric-specific condition, early protocols emphasize broad testing approaches.15 A focus on grave (but rare) outcomes from a novel virus may also distract from more common causes of symptoms and lead to missed common diagnoses that are less severe.16 For both testing and treatment, having this early information before clear evidence on how it guided care may have caused more harm than benefit. Again, RCTs may have helped guide MIS-C therapies and protocol development.
Changing workflows may also create new barriers to HVC. One of the recommendations from Choosing Wisely® during the COVID-19 pandemic was to batch lab draws17 to reduce the risk of exposure to healthcare workers performing phlebotomy, as well as staff who transport, handle, and process bloodwork in the lab. This may inadvertently encourage the approach of getting a lab test “in case” we need it with a single daily blood draw. In trying to avoid multiple encounters (and conserve personal protective equipment [PPE]), we may be taking a less stepwise approach than in prepandemic times.
Finally, children’s hospitals witnessed significant financial challenges and reductions in patient volume related to the pandemic.18 Reductions in patient volume could present a potential opportunity for practicing HVC (eg, more time to discuss downstream effects) or alternatively could inadvertently incentivize low-value, low-priority care via messaging around preserving financial viability.
For clinicians and healthcare systems, these examples highlight why we may be predisposed to practicing LVC during a pandemic or similar emerging threat.
STRATEGIES FOR HVC PRACTICE DURING FUTURE MAJOR EVENTS
In light of these challenging clinical scenarios and nonclinical factors that predispose us to LVC, how can we reinforce a high-value approach to care during a pandemic or similar emerging threat? The following five specific concepts may help providers and organizations optimize HVC during this pandemic and in future situations:
- Utilize pediatric RCTs to provide evidence-based recommendations. In the face of a novel virus with unclear manifestations, treatment options were rapidly implemented without time for careful evaluation. In the future, collaboratively utilizing shared resources in the research community could help rapidly and rigorously evaluate outcomes in the pursuit of evidence-based practice.
- Use standardization as a tool to mitigate uncertainty. Knowing that uncertainty can be a driver of overuse and that during emerging threats, evidence is scarce and rapidly changing, a structured method for standardizing practice across your institution or multiple institutions can be helpful in many ways. Electronic health record–based orders and guidelines provide a standard of care to relieve uncertainty and have been shown to reduce overtesting.19 These resources can also be adapted rapidly as evidence emerges, reducing the burden on providers to know the latest evolving best practice. Experts who have reviewed the literature should have a method to quickly disseminate these findings through standardized practice, providing a venue for rapid learning and implementation.20
- Plan for active deimplementation from the outset. It is inevitable that some practices implemented early in pandemic response may need to be deimplemented later as the evidence and situation evolve. However, there is ample evidence that deimplementation can be difficult.21 Building in deimplementation mechanisms, such as standing educational sessions or hospital committees dedicated to value that review practices, from the beginning may ease these changes.
- Take advantage of novel opportunities to improve value. Early stop-gap interventions may be wasteful, but the upheaval from major events may also create novel opportunities to improve value in other ways. Some of these efforts, like PPE conservation and as-needed follow-up visits, may become useful methods to improve value even after the pandemic ends.22,23 The decreased pursuit of healthcare during the pandemic may also have given us an opportunity to better define when delayed diagnosis or even nondiagnosis for certain conditions is acceptable and when it may cause harm.
- Highlight harms of overuse. While avoiding unnecessary costs is an important aspect of reducing overuse, often the other human-centered harms of overuse are better motivators for HVC. Especially during the response to an emerging threat, the impacts of overuse may be compounded. Laboratory resources that are strained to meet COVID-19 testing demand will be further stretched by overuse of other laboratory testing. Overuse of ineffective treatments adds stress to nurses, pharmacists, and other front-line staff taking care of ill patients. Side effects of unnecessary interventions, including those that could prolong hospitalization, would also increase strain on the system. Reducing overuse is also a way to reduce workload for hospital staff during a time of crisis. Improved efficiency of practice and less time spent on practices that do not add value to patient care can insulate staff against burnout.24 Hospitalization and healthcare costs can add to the stress and financial burden of patients and families.25 Clinicians can highlight harms of overuse through openly talking about it on rounds with the patients, families, and entire care team and incorporating it into health system–wide messaging.
CONCLUSION
As vaccine distribution continues, like many clinicians, we are hopeful that the worst days of the pandemic are behind us. The crucible of the COVID-19 pandemic has undoubtedly changed us as clinicians and impacted our future practice patterns. We believe there is a need to challenge ourselves to continue to think from a value mindset even in times of crisis. Furthermore, there are important opportunities to learn from our response to the COVID-19 pandemic and find strategies for minimizing LVC outside the pandemic. We believe the lessons learned around improving value during this pandemic can strengthen our response to the next novel, widespread threat and reduce waste in our care systems, with a potential to increase the resilience of systems in the future.
1. Rokach A. Psychological, emotional and physical experiences of hospitalized children. Clin Case Rep Rev. 2016;2. https://doi.org/10.15761/CCRR.1000227
2. Stockwell DC, Landrigan CP, Toomey SL, et al. Adverse events in hospitalized pediatric patients. Pediatrics. 2018;142(2):e20173360. https://doi.org/10.1542/peds.2017-3360
3. Coon ER, Quinonez RA, Moyer VA, Schroeder AR. Overdiagnosis: how our compulsion for diagnosis may be harming children. Pediatrics. 2014;134(5):1013-1023. https://doi.org/10.1542/peds.2014-1778
4. Bui AL, Dieleman JL, Hamavid H, et al. Spending on children’s personal health care in the United States, 1996-2013. JAMA Pediatr. 2017;171(2):181-189. https://doi.org/10.1001/jamapediatrics.2016.4086
5. Ilgen JS, Eva KW, de Bruin A, Cook DA, Regehr G. Comfort with uncertainty: reframing our conceptions of how clinicians navigate complex clinical situations. Adv Health Sci Theory Pract. 2019;24(4):797-809. https://doi.org/10.1007/s10459-018-9859-5
6. Allison JJ, Kiefe CI, Cook EF, Gerrity MS, Orav EJ, Centor R. The association of physician attitudes about uncertainty and risk taking with resource use in a Medicare HMO. Med Decis Making. 1998;18(3):320-329. https://doi.org/10.1177/0272989X9801800310
7. Beck JB, Long M, Ryan MS. Into the unknown: helping learners become more comfortable with diagnostic uncertainty. Pediatrics. 2020;146(5):e2020027300. https://doi.org/10.1542/peds.2020-027300
8. Marshall NC, Kariyawasam RM, Zelyas N, Kanji JN, Diggle MA. Broad respiratory testing to identify SARS-CoV-2 viral co-circulation and inform diagnostic stewardship in the COVID-19 pandemic. Virol J. 2021;18(1):93. https://doi.org/10.1186/s12985-021-01545-9
9. Zimmermann P, Curtis N. Coronavirus infections in children including COVID-19: an overview of the epidemiology, clinical features, diagnosis, treatment and prevention options in children. Pediatr Infect Dis J. 2020;39(5):355-368. https://doi.org/10.1097/INF.0000000000002660
10. Morrison JM, Dudas RA, Collins K. The power and peril of panels. Hosp Pediatr. 2018;8(11):729-732. https://doi.org/10.1542/hpeds.2018-0093
11. Wise J, Coombes R. Covid-19: the inside story of the RECOVERY trial. BMJ. 2020;370:m2670. https://doi.org/10.1136/bmj.m2670.
12. Feldstein LR, Rose EB, Horwitz SM, et al. Multisystem inflammatory syndrome in U.S. children and adolescents. N Engl J Med. 2020;383(4):334-346.
13. Pourbagheri-Sigaroodi A, Bashash D, Fateh F, Abolghasemi H. Laboratory findings in COVID-19 diagnosis and prognosis. Clin Chim Acta. 2020;510:475-482. https://doi.org/10.1056/NEJMoa2021680
14. Henry BM, Benoit SW, de Oliveira MHS, et al. Laboratory abnormalities in children with mild and severe coronavirus disease 2019 (COVID-19): a pooled analysis and review. Clin Biochem. 2020;81:1-8. https://doi.org/10.1016/j.clinbiochem.2020.05.012
15. Centers for Disease Control and Prevention. Information for healthcare providers about multisystem inflammatory syndrome in children (MIS-C). Accessed July 7, 2021. https://www.cdc.gov/mis/hcp/index.html
16. Molloy M, Jerardi K, Marshall T. What are we missing in our search for MIS-C? Hosp Pediatr. 2021;11(4):e66-e69. https://doi.org/10.1542/hpeds.2020-005579
17. Cho HJ, Feldman LS, Keller S, Hoffman A, Pahwa AK, Krouss M. Choosing Wisely in the COVID-19 era: preventing harm to healthcare workers. J Hosp Med. 2020;15(6):360-362. https://doi.org/10.12788/jhm.3457
18. Synhorst DC, Bettenhausen JL, Hall M, et al. Healthcare encounter and financial impact of COVID-19 on children’s hospitals. J Hosp Med. 2021;16(4):223-226. https://doi.org/10.12788/jhm.3572
19. Algaze CA, Wood M, Pageler NM, Sharek PJ, Longhurst CA, Shin AY. Use of a checklist and clinical decision support tool reduces laboratory use and improves cost. Pediatrics. 2016;137(1). https://doi.org/10.1542/peds.2014-3019
20. Rao S, Kwan BM, Curtis DJ, et al. Implementation of a rapid evidence assessment infrastructure during the coronavirus disease 2019 (COVID-19) pandemic to develop policies, clinical pathways, stimulate academic research, and create educational opportunities. J Pediatr. 2021;230:4-8.e2. https://doi.org/10.1016/j.jpeds.2020.10.029
21. Gill PJ, Mahant S. Deimplementation of established medical practice without intervention: does it actually happen? J Hosp Med. 2020;15(12):765-766. https://doi.org/10.12788/jhm.3467
22. Coon ER, Destino LA, Greene TH, Vukin E, Stoddard G, Schroeder AR. Comparison of as-needed and scheduled posthospitalization follow-up for children hospitalized for bronchiolitis: the Bronchiolitis Follow-up Intervention Trial (BeneFIT) randomized clinical trial. JAMA Pediatr. 2020;174(9):e201937. https://doi.org/10.1001/jamapediatrics.2020.1937
23. Steuart R, Huang FS, Schaffzin JK, Thomson J. Finding the value in personal protective equipment for hospitalized patients during a pandemic and beyond. J Hosp Med. 2020;15(5):295-298. https://doi.org/10.12788/jhm.3429
24. Pierce RG, Diaz M, Kneeland P. Optimizing well-being, practice culture, and professional thriving in an era of turbulence. J Hosp Med. 2019;14(2):126-128. https://doi.org/10.12788/jhm.3101
25. Commodari E. Children staying in hospital: a research on psychological stress of caregivers. Ital J Pediatr. 2010;36:40. https://doi.org/10.1186/1824-7288-36-40
© 2021 Society of Hospital Medicine
Things We Do for No Reason™: Emergent Hemodialysis After Intravascular Iodinated Contrast Exposure in Chronic Hemodialysis Patients
Inspired by the ABIM Foundation’s Choosing Wisely® campaign, the “Things We Do for No Reason™" (TWDFNR) series reviews practices that have become common parts of hospital care but may provide little value to our patients. Practices reviewed in the TWDFNR series do not represent clear-cut conclusions or clinical practice standards but are meant as a starting place for research and active discussions among hospitalists and patients. We invite you to be part of that discussion.
CLINICAL SCENARIO
The hospitalist admits a 56-year-old anuric man with end-stage renal disease (ESRD) on maintenance hemodialysis (HD) for an acute coronary syndrome. He received his regularly scheduled HD the day before admission. Cardiology delays his coronary catheterization until nephrology can arrange for HD immediately after angiography. After angiography, the patient receives emergent HD even though he had acceptable metabolic parameters and did not show signs or symptoms of volume overload. The hospitalist wonders whether arranging emergent HD after the procedure with intravascular (IV) contrast was necessary for this patient.
BACKGROUND
Of the approximately 600 million radiological examinations performed annually, 75 million require iodinated contrast material (ICM).1 ICM are small, highly diffusible, minimally protein-bound molecules. They are not metabolized by humans, with healthy kidneys excreting approximately 99.8% of the administered dose within 24 hours.2 ICM has been associated with acute kidney injury (AKI), but its deleterious effects have not been thoroughly described, and the incidence and severity of contrast-associated nephropathy vary among studies.3 Not surprisingly, the strongest independent patient-related risk factor for developing contrast-induced AKI is preexisting chronic kidney disease.4 In patients with ESRD, the biliary system slowly clears the contrast, leading to long-standing retention. Newer low- or iso-osmolar contrast material is now used rather than older, conventional high-osmolality agents. These agents are less likely to lead to AKI.5
Recent studies have challenged the association between AKI and ICM administration.6-8 In 2015, the American College of Radiology endorsed the terms contrast-associated acute kidney injury and contrast-induced acute kidney injury, instead of the contrast-induced nephropathy, to avoid the uncertainty about the causal relationship between AKI and ICM.9 ESRD patients have little or no functional renal tissue and are on renal replacement therapy, either HD or peritoneal dialysis. However, physicians apprehensive about the renal and cardiovascular toxicity caused by retained ICM might request postprocedural HD to promote quicker contrast clearance in patients with ESRD.
WHY YOU MIGHT THINK PERFORMING EMERGENT HEMODIALYSIS AFTER IV CONTRAST IS NECESSARY
Clinicians divide patients with ESRD into two groups depending on their ability to produce urine. Those who produce urine have residual renal function (RRF), which independently predicts survival.10 Among a cohort of peritoneal and HD patients, Maiorca et al described a 40% reduction in the risk of death for each 1 mL/min increase in glomerular filtration rate (GFR).10 Therefore, patients on maintenance dialysis who have RRF are considered similar to patients with AKI and eGFR <30 mL/min/1.73 m2.9 Clinicians might worry that contrast retention could reduce RRF by inducing AKI.2,4,11
Volume overload is a second concern with ICM administration in ESRD patients. In mice, higher-osmolality ICM produced acute pulmonary edema, leading to death.12 A rapid bolus of diatrizoate caused transient intravascular expansion as reflected by an average decrease in hemoglobin of 0.5 to 0.8 g/dL, depending on the osmolality of the agent.12
Conventional high-osmolar ICM also depresses myocardial contractile force, sinoatrial automaticity, and atrioventricular nodal conduction, resulting in bradycardia, transient heart blocks, and increased risk of ventricular fibrillation.12 High-osmolar calcium-binding ICM transiently reduces systemic vascular resistance, resulting in transient hypotension and increased cardiac output. Researchers linked these adverse cardiac effects to the high-osmolality ionic ICM, not newer agents.12 In one study of adverse outcomes linked to ICM, 36% of patients with normal kidney function exposed to contrast developed an adverse reaction; 2% of patients developed level 4 (severe) adverse reactions.13 The study noted a significantly increased risk of bradycardia (relative risk [RR], 17.9), hypotension (RR, 6.3), and angina (RR, 3.4) among those who received high-osmolality contrast agents.
HD removes 72% to 82% of ICM at 4 hours.14 Armed with data from mice or small-population studies that demonstrated the toxic effects of conventional high-osmolar ICM, many radiologists and clinicians recommend post-contrast HD for patients at high risk for contrast-induced AKI and chronic HD patients.2 Moon et al suggested prophylactic HD for quicker removal of the iodinated contrast medium to prevent reduction in renal function among high-risk patients after angiographic interventions.15
WHY THERE IS LITTLE REASON TO HEMODIALYZE AFTER CONTRAST EXPOSURE
Over the last 3 decades, we have transitioned from conventional radiocontrast to low-osmolality agents that are not directly toxic to the kidneys. Iodixanol, iohexol, and iopromide exposure during intravascular radiological procedures did not result in a decline of RRF among well-hydrated peritoneal dialysis patients with RRF.16,17 The limited analysis of HD trials in the systematic review by Cruz et al concluded that periprocedural HD in patients with chronic kidney disease did not decrease the incidence of radiocontrast-associated nephropathy.18 A meta-analysis of nine studies (434 patients) concluded that ICM administration does not cause significant reduction of residual function in dialysis patients.19 Because anuric ESRD patients have no salvageable renal function and are on HD, managing AKI seems irrelevant.
Although volume overload is an important consideration, the theoretical increase in intravascular volume with administration of 100 mL of 1500 mOsm/L of conventional ICM to a 70 kg-patient is only 120 mL.14 More importantly, use of low-osmolar ICM substantially reduces any significant volume shifts.
Studies have not associated low-osmolality ICM with cardiovascular adverse effects.20-23 A retrospective study by Takebayashi et al showed an absence of serious adverse reactions to low-osmolar contrast media when HD was performed on their regular HD schedule.22 Older, smaller prospective trials did not show a need for periprocedural HD after ICM exposure.20,21,23 In a prospective study of 10 ESRD patients, Younathan et al assessed for postprocedural adverse effects of non-ionic contrast material and found that none required emergent HD.23 Similarly, Hamani et al and Harasawa et al did not observe hemodynamic and cardiopulmonary effects of IV contrast in chronic HD patients (Table).20,21 Injection of non-ionic contrast material in patients on chronic HD did not produce significant changes in blood pressure, electrocardiogram results, osmolality, extracellular fluid volume, or body weight.23 Finally, the vasoconstrictor-mediated ischemic injury of ICM occurs within minutes of administration, making dialysis performed hours later of little benefit.

HD is associated with adverse effects, including hypotension, which can jeopardize cardiovascular recovery after a myocardial infarction.24 The retrospective study performed by Fujimoto et al demonstrated dialytic complications in 24% of patients dialyzed the day of angiography.25 They noted that the amount of contrast agent administered independently predicted intradialytic hypotension.25,26
Delays in performing cardiac revascularizations are associated with an increase in 30-day mortality. The 30-day mortality rates of patients diagnosed with ST-elevation myocardial infarction who underwent revascularization in <60 minutes, 61 to 75 minutes, 76 to 90 minutes, and >90 minutes from study enrollment were 1%, 3.7%, 4%, and 6.7%, respectively.27 Delayed diagnosis of pulmonary embolism or acute limb ischemia was associated with increased rates of complications and mortality.28,29 The benefits of essential radiocontrast procedures outweigh the potential cardiovascular and cerebrovascular complications for HD patients. Considering the evidence, the American College of Radiology’s 2020 Manual on Contrast Media and the European Society for Urogenital Radiology’s 2018 guidelines on contrast medium administration in patients on HD concluded that an extra session or a change in the usual timing of HD is unnecessary.13,30
WHAT YOU SHOULD DO INSTEAD
HD performed post-contrast exposure does not provide any protective benefit, regardless of the degree of RRF (anuric ESRD or otherwise), making the timing of HD irrelevant. Do not delay studies that provide essential information for clinical management of high-risk conditions. The decision to perform HD in a patient who needs contrast-enhanced studies should be made independent of whether they will receive contrast.
RECOMMENDATIONS
- Immediate post-procedural HD after ICM exposure in ESRD patients is not required.
- Do not delay vital diagnostic or therapeutic procedures requiring ICM in ESRD patients.
- The indication for HD is independent of contrast exposure in ESRD patients.
CONCLUSION
The hospitalist did not need to arrange emergent post-procedural HD because it does not improve clinical outcomes. Delaying potentially lifesaving diagnostic and therapeutic measures involving the use of radiocontrast to secure post-radiocontrast HD could lead to worse outcomes.
Do you think this is a low-value practice? Is this truly a “Thing We Do for No Reason™”? Share what you do in your practice and join in the conversation online by retweeting it on Twitter (#TWDFNR) and liking it on Facebook. We invite you to propose ideas for other “Things We Do for No Reason™” topics by emailing [email protected].
1. Christiansen C. X-ray contrast media--an overview. Toxicology. 2005;209(2):185-187. https://doi.org/10.1016/j.tox.2004.12.020
2. Deray G. Dialysis and iodinated contrast media. Kidney Int Suppl. 2006(100):S25-29. https://doi.org/ 10.1038/sj.ki.5000371
3. American College of Radiology. ACR manual on contrast media. Published 2020. Accessed July 18, 2021. https://www.acr.org/-/media/ACR/files/clinical-resources/contrast_media.pdf
4. Mehran R, Dangas GD, Weisbord SD. Contrast-associated acute kidney injury. N Engl J Med. 2019;380(22):2146-2155. https://doi.org/10.1056/NEJMra1805256
5. Rudnick MR, Leonberg-Yoo AK, Litt HI, Cohen RM, Hilton S, Reese PP. The controversy of contrast-induced nephropathy with intravenous contrast: what is the risk? Am J Kidney Dis. 2020;75(1):105-113. https://doi.org/10.1053/j.ajkd.2019.05.022
6. Ehrmann S, Aronson D, Hinson JS. Contrast-associated acute kidney injury is a myth: yes. Intensive Care Med. 2018;44(1):104-106. https://doi.org/10.1007/s00134-017-4950-6
7. Kashani K, Levin A, Schetz M. Contrast-associated acute kidney injury is a myth: we are not sure. Intensive Care Med. 2018;44(1):110-114. https://doi.org/10.1007/s00134-017-4970-2
8. Weisbord SD, du Cheryon D. Contrast-associated acute kidney injury is a myth: no. Intensive Care Med. 2018;44(1):107-109. https://doi.org/10.1007/s00134-017-5015-6
9. Davenport MS, Perazella MA, Yee J, et al. Use of intravenous iodinated contrast media in patients with kidney disease: consensus statements from the American College of Radiology and the National Kidney Foundation. Radiology. 2020;294(3):660-668. https://doi.org/10.1148/radiol.2019192094
10. Perl J, Bargman JM. The importance of residual kidney function for patients on dialysis: a critical review. Am J Kidney Dis. 2009;53(6):1068-1081. https://doi.org/10.1053/j.ajkd.2009.02.012
11. Hsieh MS, Chiu CS, How CK, et al. Contrast medium exposure during computed tomography and risk of development of end-stage renal disease in patients with chronic kidney disease: a nationwide population-based, propensity score-matched, longitudinal follow-up study. Medicine (Baltimore). 2016;95(16):e3388. https://doi.org/10.1097/MD.0000000000003388
12. Hirshfeld JW, Jr. Cardiovascular effects of iodinate contrast agents. Am J Cardiol. 1990;66(14):9F-17F. https://doi.org/10.1016/0002-9149(90)90635-e
13. Steinberg EP, Moore RD, Powe NR, et al. Safety and cost effectiveness of high-osmolality as compared with low-osmolality contrast material in patients undergoing cardiac angiography. N Engl J Med. 1992;326(7):425-430. https://doi.org/10.1056/NEJM199202133260701
14. Rodby RA. Preventing complications of radiographic contrast media: Is there a role for dialysis? Sem Dial. 2007;20(1):19-23. https://doi.org/10.1111/j.1525-139X.2007.00233.x
15. Moon SS, Bäck SE, Kurkus J, Nilsson-Ehle P. Hemodialysis for elimination of the nonionic contrast medium iohexol after angiography in patients with impaired renal function. Nephron. 1995;70(4):430-437. https://doi.org/10.1159/000188641
16. Dittrich E, Puttinger H, Schillinger M, et al. Effect of radio contrast media on residual renal function in peritoneal dialysis patients—a prospective study. Nephrol Dial Transplant. 2006;21(5):1334-1339. https://doi.org/10.1093/ndt/gfi023
17. Moranne O, Willoteaux S, Pagniez D, Dequiedt P, Boulanger E. Effect of iodinated contrast agents on residual renal function in PD patients. Nephrol Dial Transplant. 2006;21(4):1040-1045. https://doi.org/10.1093/ndt/gfi327
18. Cruz DN, Perazella MA, Bellomo R, et al. Extracorporeal blood purification therapies for prevention of radiocontrast-induced nephropathy: a systematic review. Am J Kidney Dis. 2006;48(3):361-371. https://doi.org/10.1053/j.ajkd.2006.05.023
19. Oloko A, Talreja H, Davis A, et al. Does iodinated contrast affect residual renal function in dialysis patients? a systematic review and meta-analysis. Nephron. 2020;144(4):176-184. https://doi.org/10.1159/000505576
20. Hamani A, Petitclerc T, Jacobs C, Deray G. Is dialysis indicated immediately after administration of iodinated contrast agents in patients on haemodialysis? Nephrol Dial Transplant. 1998;13:1051-1052.
21. Harasawa H, Yamazaki C, Masuko K. Side effects and pharmacokinetics of nonionic iodinated contrast medium in hemodialized patients. Nihon Igaku Hoshasen Gakkai Zasshi. 1990;50(12):1524-1531.
22. Takebayashi S, Hidai H, Chiba T. No need for immediate dialysis after administration of low-osmolarity contrast medium in patients undergoing hemodialysis. Am J Kidney Dis. 2000;36(1):226. https://doi.org/10.1053/ajkd.2000.8301
23. Younathan CM, Kaude JV, Cook MD, Shaw GS, Peterson JC. Dialysis not indicated immediately after administration of nonionic contrast agents in patients with end-stage renal disease treated by maintenance dialysis. AJR. Am J Roentgenol. 1994;163:969-971. https://doi.org/10.2214/ajr.163.4.8092045
24. Coritsidis G, Sutariya D, Stern A, et al. Does timing of dialysis in patients with ESRD and acute myocardial infarcts affect morbidity or mortality? Clin J Am Soc Nephrol. 2009;4(8):1324-1330. https://doi.org/10.2215/CJN.04470908
25. Fujimoto M, Ishikawa E, Haruki A, et al. Hemodialysis complications after angiography and its risk factors. Nihon Toseki Igakkai Zasshi. 2015;48(5):269-274. https://doi.org/10.4009/jsdt.48.269
26. Tachibana K, Kida H, Uenoyama M, Nakamura T, Yamada T, Hayahi T. Risk factors for intradialytic hypotension after percutaneous coronary interventions. Nihon Toseki Igakkai Zasshi. 2019;52(4):227-232. https://doi.org/10.4009/jsdt.52.227
27. Berger PB, Ellis SG, Holmes DR Jr, et al. Relationship between delay in performing direct coronary angioplasty and early clinical outcome in patients with acute myocardial infarction. Circulation. 1999;100(1):14-20. https://doi.org/10.1161/01.cir.100.1.14
28. Nagasheth K, Nassiri N, Shafritz R, Rahimi S. Delayed revascularization for acute lower extremity ischemia leads to increased mortality. J Vasc Surg. 2016;63(6S):121S-122S.
29. Kline JA, Hernandez-Nino J, Jones AE, Rose GA, Norton HJ, Camargo CA Jr. Prospective study of the clinical features and outcomes of emergency department patients with delayed diagnosis of pulmonary embolism. Acad Emerg Med. 2007;14(7):592-598. https://doi.org/10.1197/j.aem.2007.03.1356
30. European Society of Urogenital Radiology. ESUR guidelines on contrast agents. Accessed July 20, 2021. http://www.esur.org/fileadmin/content/2019/ESUR_Guidelines_10.0_Final_Version.pdf
Inspired by the ABIM Foundation’s Choosing Wisely® campaign, the “Things We Do for No Reason™" (TWDFNR) series reviews practices that have become common parts of hospital care but may provide little value to our patients. Practices reviewed in the TWDFNR series do not represent clear-cut conclusions or clinical practice standards but are meant as a starting place for research and active discussions among hospitalists and patients. We invite you to be part of that discussion.
CLINICAL SCENARIO
The hospitalist admits a 56-year-old anuric man with end-stage renal disease (ESRD) on maintenance hemodialysis (HD) for an acute coronary syndrome. He received his regularly scheduled HD the day before admission. Cardiology delays his coronary catheterization until nephrology can arrange for HD immediately after angiography. After angiography, the patient receives emergent HD even though he had acceptable metabolic parameters and did not show signs or symptoms of volume overload. The hospitalist wonders whether arranging emergent HD after the procedure with intravascular (IV) contrast was necessary for this patient.
BACKGROUND
Of the approximately 600 million radiological examinations performed annually, 75 million require iodinated contrast material (ICM).1 ICM are small, highly diffusible, minimally protein-bound molecules. They are not metabolized by humans, with healthy kidneys excreting approximately 99.8% of the administered dose within 24 hours.2 ICM has been associated with acute kidney injury (AKI), but its deleterious effects have not been thoroughly described, and the incidence and severity of contrast-associated nephropathy vary among studies.3 Not surprisingly, the strongest independent patient-related risk factor for developing contrast-induced AKI is preexisting chronic kidney disease.4 In patients with ESRD, the biliary system slowly clears the contrast, leading to long-standing retention. Newer low- or iso-osmolar contrast material is now used rather than older, conventional high-osmolality agents. These agents are less likely to lead to AKI.5
Recent studies have challenged the association between AKI and ICM administration.6-8 In 2015, the American College of Radiology endorsed the terms contrast-associated acute kidney injury and contrast-induced acute kidney injury, instead of the contrast-induced nephropathy, to avoid the uncertainty about the causal relationship between AKI and ICM.9 ESRD patients have little or no functional renal tissue and are on renal replacement therapy, either HD or peritoneal dialysis. However, physicians apprehensive about the renal and cardiovascular toxicity caused by retained ICM might request postprocedural HD to promote quicker contrast clearance in patients with ESRD.
WHY YOU MIGHT THINK PERFORMING EMERGENT HEMODIALYSIS AFTER IV CONTRAST IS NECESSARY
Clinicians divide patients with ESRD into two groups depending on their ability to produce urine. Those who produce urine have residual renal function (RRF), which independently predicts survival.10 Among a cohort of peritoneal and HD patients, Maiorca et al described a 40% reduction in the risk of death for each 1 mL/min increase in glomerular filtration rate (GFR).10 Therefore, patients on maintenance dialysis who have RRF are considered similar to patients with AKI and eGFR <30 mL/min/1.73 m2.9 Clinicians might worry that contrast retention could reduce RRF by inducing AKI.2,4,11
Volume overload is a second concern with ICM administration in ESRD patients. In mice, higher-osmolality ICM produced acute pulmonary edema, leading to death.12 A rapid bolus of diatrizoate caused transient intravascular expansion as reflected by an average decrease in hemoglobin of 0.5 to 0.8 g/dL, depending on the osmolality of the agent.12
Conventional high-osmolar ICM also depresses myocardial contractile force, sinoatrial automaticity, and atrioventricular nodal conduction, resulting in bradycardia, transient heart blocks, and increased risk of ventricular fibrillation.12 High-osmolar calcium-binding ICM transiently reduces systemic vascular resistance, resulting in transient hypotension and increased cardiac output. Researchers linked these adverse cardiac effects to the high-osmolality ionic ICM, not newer agents.12 In one study of adverse outcomes linked to ICM, 36% of patients with normal kidney function exposed to contrast developed an adverse reaction; 2% of patients developed level 4 (severe) adverse reactions.13 The study noted a significantly increased risk of bradycardia (relative risk [RR], 17.9), hypotension (RR, 6.3), and angina (RR, 3.4) among those who received high-osmolality contrast agents.
HD removes 72% to 82% of ICM at 4 hours.14 Armed with data from mice or small-population studies that demonstrated the toxic effects of conventional high-osmolar ICM, many radiologists and clinicians recommend post-contrast HD for patients at high risk for contrast-induced AKI and chronic HD patients.2 Moon et al suggested prophylactic HD for quicker removal of the iodinated contrast medium to prevent reduction in renal function among high-risk patients after angiographic interventions.15
WHY THERE IS LITTLE REASON TO HEMODIALYZE AFTER CONTRAST EXPOSURE
Over the last 3 decades, we have transitioned from conventional radiocontrast to low-osmolality agents that are not directly toxic to the kidneys. Iodixanol, iohexol, and iopromide exposure during intravascular radiological procedures did not result in a decline of RRF among well-hydrated peritoneal dialysis patients with RRF.16,17 The limited analysis of HD trials in the systematic review by Cruz et al concluded that periprocedural HD in patients with chronic kidney disease did not decrease the incidence of radiocontrast-associated nephropathy.18 A meta-analysis of nine studies (434 patients) concluded that ICM administration does not cause significant reduction of residual function in dialysis patients.19 Because anuric ESRD patients have no salvageable renal function and are on HD, managing AKI seems irrelevant.
Although volume overload is an important consideration, the theoretical increase in intravascular volume with administration of 100 mL of 1500 mOsm/L of conventional ICM to a 70 kg-patient is only 120 mL.14 More importantly, use of low-osmolar ICM substantially reduces any significant volume shifts.
Studies have not associated low-osmolality ICM with cardiovascular adverse effects.20-23 A retrospective study by Takebayashi et al showed an absence of serious adverse reactions to low-osmolar contrast media when HD was performed on their regular HD schedule.22 Older, smaller prospective trials did not show a need for periprocedural HD after ICM exposure.20,21,23 In a prospective study of 10 ESRD patients, Younathan et al assessed for postprocedural adverse effects of non-ionic contrast material and found that none required emergent HD.23 Similarly, Hamani et al and Harasawa et al did not observe hemodynamic and cardiopulmonary effects of IV contrast in chronic HD patients (Table).20,21 Injection of non-ionic contrast material in patients on chronic HD did not produce significant changes in blood pressure, electrocardiogram results, osmolality, extracellular fluid volume, or body weight.23 Finally, the vasoconstrictor-mediated ischemic injury of ICM occurs within minutes of administration, making dialysis performed hours later of little benefit.
HD is associated with adverse effects, including hypotension, which can jeopardize cardiovascular recovery after a myocardial infarction.24 The retrospective study performed by Fujimoto et al demonstrated dialytic complications in 24% of patients dialyzed the day of angiography.25 They noted that the amount of contrast agent administered independently predicted intradialytic hypotension.25,26
Delays in performing cardiac revascularizations are associated with an increase in 30-day mortality. The 30-day mortality rates of patients diagnosed with ST-elevation myocardial infarction who underwent revascularization in <60 minutes, 61 to 75 minutes, 76 to 90 minutes, and >90 minutes from study enrollment were 1%, 3.7%, 4%, and 6.7%, respectively.27 Delayed diagnosis of pulmonary embolism or acute limb ischemia was associated with increased rates of complications and mortality.28,29 The benefits of essential radiocontrast procedures outweigh the potential cardiovascular and cerebrovascular complications for HD patients. Considering the evidence, the American College of Radiology’s 2020 Manual on Contrast Media and the European Society for Urogenital Radiology’s 2018 guidelines on contrast medium administration in patients on HD concluded that an extra session or a change in the usual timing of HD is unnecessary.13,30
WHAT YOU SHOULD DO INSTEAD
HD performed post-contrast exposure does not provide any protective benefit, regardless of the degree of RRF (anuric ESRD or otherwise), making the timing of HD irrelevant. Do not delay studies that provide essential information for clinical management of high-risk conditions. The decision to perform HD in a patient who needs contrast-enhanced studies should be made independent of whether they will receive contrast.
RECOMMENDATIONS
- Immediate post-procedural HD after ICM exposure in ESRD patients is not required.
- Do not delay vital diagnostic or therapeutic procedures requiring ICM in ESRD patients.
- The indication for HD is independent of contrast exposure in ESRD patients.
CONCLUSION
The hospitalist did not need to arrange emergent post-procedural HD because it does not improve clinical outcomes. Delaying potentially lifesaving diagnostic and therapeutic measures involving the use of radiocontrast to secure post-radiocontrast HD could lead to worse outcomes.
Do you think this is a low-value practice? Is this truly a “Thing We Do for No Reason™”? Share what you do in your practice and join in the conversation online by retweeting it on Twitter (#TWDFNR) and liking it on Facebook. We invite you to propose ideas for other “Things We Do for No Reason™” topics by emailing [email protected].
1. Christiansen C. X-ray contrast media--an overview. Toxicology. 2005;209(2):185-187. https://doi.org/10.1016/j.tox.2004.12.020
2. Deray G. Dialysis and iodinated contrast media. Kidney Int Suppl. 2006(100):S25-29. https://doi.org/ 10.1038/sj.ki.5000371
3. American College of Radiology. ACR manual on contrast media. Published 2020. Accessed July 18, 2021. https://www.acr.org/-/media/ACR/files/clinical-resources/contrast_media.pdf
4. Mehran R, Dangas GD, Weisbord SD. Contrast-associated acute kidney injury. N Engl J Med. 2019;380(22):2146-2155. https://doi.org/10.1056/NEJMra1805256
5. Rudnick MR, Leonberg-Yoo AK, Litt HI, Cohen RM, Hilton S, Reese PP. The controversy of contrast-induced nephropathy with intravenous contrast: what is the risk? Am J Kidney Dis. 2020;75(1):105-113. https://doi.org/10.1053/j.ajkd.2019.05.022
6. Ehrmann S, Aronson D, Hinson JS. Contrast-associated acute kidney injury is a myth: yes. Intensive Care Med. 2018;44(1):104-106. https://doi.org/10.1007/s00134-017-4950-6
7. Kashani K, Levin A, Schetz M. Contrast-associated acute kidney injury is a myth: we are not sure. Intensive Care Med. 2018;44(1):110-114. https://doi.org/10.1007/s00134-017-4970-2
8. Weisbord SD, du Cheryon D. Contrast-associated acute kidney injury is a myth: no. Intensive Care Med. 2018;44(1):107-109. https://doi.org/10.1007/s00134-017-5015-6
9. Davenport MS, Perazella MA, Yee J, et al. Use of intravenous iodinated contrast media in patients with kidney disease: consensus statements from the American College of Radiology and the National Kidney Foundation. Radiology. 2020;294(3):660-668. https://doi.org/10.1148/radiol.2019192094
10. Perl J, Bargman JM. The importance of residual kidney function for patients on dialysis: a critical review. Am J Kidney Dis. 2009;53(6):1068-1081. https://doi.org/10.1053/j.ajkd.2009.02.012
11. Hsieh MS, Chiu CS, How CK, et al. Contrast medium exposure during computed tomography and risk of development of end-stage renal disease in patients with chronic kidney disease: a nationwide population-based, propensity score-matched, longitudinal follow-up study. Medicine (Baltimore). 2016;95(16):e3388. https://doi.org/10.1097/MD.0000000000003388
12. Hirshfeld JW, Jr. Cardiovascular effects of iodinate contrast agents. Am J Cardiol. 1990;66(14):9F-17F. https://doi.org/10.1016/0002-9149(90)90635-e
13. Steinberg EP, Moore RD, Powe NR, et al. Safety and cost effectiveness of high-osmolality as compared with low-osmolality contrast material in patients undergoing cardiac angiography. N Engl J Med. 1992;326(7):425-430. https://doi.org/10.1056/NEJM199202133260701
14. Rodby RA. Preventing complications of radiographic contrast media: Is there a role for dialysis? Sem Dial. 2007;20(1):19-23. https://doi.org/10.1111/j.1525-139X.2007.00233.x
15. Moon SS, Bäck SE, Kurkus J, Nilsson-Ehle P. Hemodialysis for elimination of the nonionic contrast medium iohexol after angiography in patients with impaired renal function. Nephron. 1995;70(4):430-437. https://doi.org/10.1159/000188641
16. Dittrich E, Puttinger H, Schillinger M, et al. Effect of radio contrast media on residual renal function in peritoneal dialysis patients—a prospective study. Nephrol Dial Transplant. 2006;21(5):1334-1339. https://doi.org/10.1093/ndt/gfi023
17. Moranne O, Willoteaux S, Pagniez D, Dequiedt P, Boulanger E. Effect of iodinated contrast agents on residual renal function in PD patients. Nephrol Dial Transplant. 2006;21(4):1040-1045. https://doi.org/10.1093/ndt/gfi327
18. Cruz DN, Perazella MA, Bellomo R, et al. Extracorporeal blood purification therapies for prevention of radiocontrast-induced nephropathy: a systematic review. Am J Kidney Dis. 2006;48(3):361-371. https://doi.org/10.1053/j.ajkd.2006.05.023
19. Oloko A, Talreja H, Davis A, et al. Does iodinated contrast affect residual renal function in dialysis patients? a systematic review and meta-analysis. Nephron. 2020;144(4):176-184. https://doi.org/10.1159/000505576
20. Hamani A, Petitclerc T, Jacobs C, Deray G. Is dialysis indicated immediately after administration of iodinated contrast agents in patients on haemodialysis? Nephrol Dial Transplant. 1998;13:1051-1052.
21. Harasawa H, Yamazaki C, Masuko K. Side effects and pharmacokinetics of nonionic iodinated contrast medium in hemodialized patients. Nihon Igaku Hoshasen Gakkai Zasshi. 1990;50(12):1524-1531.
22. Takebayashi S, Hidai H, Chiba T. No need for immediate dialysis after administration of low-osmolarity contrast medium in patients undergoing hemodialysis. Am J Kidney Dis. 2000;36(1):226. https://doi.org/10.1053/ajkd.2000.8301
23. Younathan CM, Kaude JV, Cook MD, Shaw GS, Peterson JC. Dialysis not indicated immediately after administration of nonionic contrast agents in patients with end-stage renal disease treated by maintenance dialysis. AJR. Am J Roentgenol. 1994;163:969-971. https://doi.org/10.2214/ajr.163.4.8092045
24. Coritsidis G, Sutariya D, Stern A, et al. Does timing of dialysis in patients with ESRD and acute myocardial infarcts affect morbidity or mortality? Clin J Am Soc Nephrol. 2009;4(8):1324-1330. https://doi.org/10.2215/CJN.04470908
25. Fujimoto M, Ishikawa E, Haruki A, et al. Hemodialysis complications after angiography and its risk factors. Nihon Toseki Igakkai Zasshi. 2015;48(5):269-274. https://doi.org/10.4009/jsdt.48.269
26. Tachibana K, Kida H, Uenoyama M, Nakamura T, Yamada T, Hayahi T. Risk factors for intradialytic hypotension after percutaneous coronary interventions. Nihon Toseki Igakkai Zasshi. 2019;52(4):227-232. https://doi.org/10.4009/jsdt.52.227
27. Berger PB, Ellis SG, Holmes DR Jr, et al. Relationship between delay in performing direct coronary angioplasty and early clinical outcome in patients with acute myocardial infarction. Circulation. 1999;100(1):14-20. https://doi.org/10.1161/01.cir.100.1.14
28. Nagasheth K, Nassiri N, Shafritz R, Rahimi S. Delayed revascularization for acute lower extremity ischemia leads to increased mortality. J Vasc Surg. 2016;63(6S):121S-122S.
29. Kline JA, Hernandez-Nino J, Jones AE, Rose GA, Norton HJ, Camargo CA Jr. Prospective study of the clinical features and outcomes of emergency department patients with delayed diagnosis of pulmonary embolism. Acad Emerg Med. 2007;14(7):592-598. https://doi.org/10.1197/j.aem.2007.03.1356
30. European Society of Urogenital Radiology. ESUR guidelines on contrast agents. Accessed July 20, 2021. http://www.esur.org/fileadmin/content/2019/ESUR_Guidelines_10.0_Final_Version.pdf
© 2021 Society of Hospital Medicine
Things We Do for No Reason™: Routine Inclusion of Race in the History of Present Illness
Inspired by the ABIM Foundation’s Choosing Wisely® campaign, the “Things We Do for No Reason™” (TWDFNR) series reviews practices that have become common parts of hospital care but may provide little value to our patients. Practices reviewed in the TWDFNR series do not represent clear-cut conclusions or clinical practice standards but are meant as a starting place for research and active discussions among hospitalists and patients. We invite you to be part of that discussion.
CLINICAL SCENARIO
On teaching rounds, a medical student presents the following case to the attending hospitalist: “Mrs. L is a 54-year-old Black female with chronic kidney disease who was admitted with community-acquired pneumonia. She continues to improve symptomatically on ceftriaxone. Currently, she is afebrile and her vitals are stable. Supplemental oxygen has been weaned to 2 L/min by nasal cannula. Exam reveals improved crackles in the left lower chest without dullness to percussion. Labs are notable for down-trending leukocytosis and a stable serum creatinine of 2.8 mg/dL.” The hospitalist considers how including racial descriptors in clinical presentations may influence the care of the patient.
WHY YOU MIGHT THINK INCLUDING RACE IN THE HISTORY OF PRESENT ILLNESS IS HELPFUL
For decades, medical educators have taught learners to include sociopolitical constructs such as race in the opening sentence of the history of present illness (HPI). This practice presumably stems from the assumption that race accurately reflects biogenetic information about patients and serves as a key attribute in problem representations.1 Proponents of including race in the HPI suggest doing so aids the clinical assessment of patients’ risks for particular diseases and may inform the selection of race-appropriate therapies.2
The construct of race does sometimes correlate with the risk of disease or response to therapies. For example, sickle cell disease (SCD) occurs more commonly among patients who identify as Black rather than White. Specifically, ancestry from African nations such as Nigeria or the Democratic Republic of Congo increases the likelihood of having the disease-associated hemoglobin gene variant HbS.1 Popular genomic ancestry tests often report ancestral groupings that map to racial categories and may reinforce the perception that race has a genetic basis.3
WHY IT IS NOT HELPFUL TO INCLUDE RACE IN THE HPI
Race, a construct of sociopolitical origins, incorrectly conflates skin color with genetic variation. Associations between race and disease have the potential to cause diagnostic and therapeutic errors and inequitable allocation of resources. Increased illness burden in minority populations results primarily from social factors such as environment, access to care, housing instability, food insecurity, and experiences of discrimination, rather than genetic differences. The resulting chronic and recurrent physiologic stress—known as allostatic load—also contributes to the inequitable health outcomes observed in vulnerable populations, including patients who identify as Black.4
Historically, race evolved as a sociopolitical framework stemming from colonialism, discrimination, and exploitation.5 Numerous studies reveal a lack of genetic precision in racial categories. In fact, genetic data compared across major continental groups found greater variation of microsatellite loci and restriction fragment length polymorphisms within racial groups than between them.6 The evidence indicates that racial categories do not reflect homogenous population groups but rather “arbitrary division[s] of continuous variation” that cannot serve as a surrogate to genetic diversity.5 Not only are racial categories genetically inaccurate, but data on race within the electronic health record often differ from patients’ self-description of race, underscoring the problematic nature of even identifying race.7 In one study, up to 41% of patients self-reported identification with at least one other racial or ethnic group than the race or ethnicity documented in their electronic health record.7
Additionally, conflating race with genetic variation can lead to diagnostic errors. As an example, the incidence of cystic fibrosis (CF) varies widely across populations of European ancestry. The primary focus on CF’s occurrence in patients of European descent may divert attention from the identification of mutations causing CF in populations of African descent or the decreased survival observed in the United States among CF patients of Hispanic descent.8,9 Similarly, India represents one of the countries largely affected by SCD, suggesting that a myopic focus on SCD among those identifying as Black can lead to underdiagnosis of SCD among those with Indian ancestry.
Perhaps more insidiously, linking disease to race or other social constructs can result in differential support for affected individuals. SCD offers a striking illustration of this point. Reflecting the legacy of transatlantic slave trading, the majority of people with SCD in the United States are Black and face interpersonal and structural racism within society and healthcare that amplify the effects of this devastating illness.10 Compulsory screening programs for sickle cell trait introduced by many states in the 1970s targeted Black Americans and resulted in stigmatization and the denial of insurance, educational opportunities, and jobs for many identified with sickle cell trait. Federal funding for SCD research remains low, particularly in comparison to the tenfold higher funding for CF, which afflicts fewer, but primarily White, Americans.10
The incorporation of race into risk models and guidelines—alongside biologically relevant variables such as age and comorbid conditions—has received increasing attention for its potential to compound racial disparities in health outcomes. The American Heart Association Heart Failure Risk Score, for instance, may lead to the exclusion of some Black patients from necessary care because “Black” race, for no clear physiologic reason, serves as a protective factor against heart failure mortality.11 Likewise, race adjustments in pulmonary function tests, breast cancer risk models, and estimated glomerular filtration rate calculations, among others, have limited biological basis and the potential to divert care disproportionately from minority populations.11
Researchers have even called into question the application of race to pharmacotherapies. A 2001 investigation on geographic patterns of genetic variation in drug response concluded that common racial and ethnic labels were “insufficient and inaccurate representations” of the individual genetic clusters.12 Further, numerous experts have criticized two landmark studies of vasodilators and angiotensin-converting enzyme inhibitors in Black patients with heart failure for inconsistent results and nonsignificant associations between race and major outcomes, such as the development of heart failure or death.13
Race-based labels can also divert attention from true causes of health inequities. The National Academy of Sciences concluded that social determinants of health and structural racism are the root causes of health inequities, rather than genetics.14 Medical professionals may perpetuate these disparities: Most US physicians demonstrate an unconscious preference—or implicit bias—for White Americans over Black Americans.15 Beyond obscuring the role of social determinants of health and structural racism in health outcomes, race-based labels may exacerbate the ways in which physicians’ implicit biases contribute to racial and ethnic health disparities, primarily affecting Black Americans.2 In a recent study, clinicians documented race in the HPI for 33% of Black patients compared with 16% of White patients, and White clinicians were twice as likely to document race as Black physicians.16 Moreover, training medical students to view race as an independent risk factor of disease without discussing structural inequities can pathologize race and reinforce implicit biases linking race and disease.15
Based on the current evidence, we believe routine use of race-based labels in clinical presentations confuses providers at a minimum and potentially produces far more damage by obscuring or perpetuating the role of racism in health inequities.
WHAT YOU SHOULD DO INSTEAD
Instead of routinely presenting race in the HPI, we recommend including racial or ethnic information in the social history only when the patient reports it as a meaningful identity or when it informs health disparities stemming from structural or interpersonal racism. Clinicians should include physical characteristics pertaining to race, such as skin tone, in the physical exam only if required to describe exam findings accurately. When presenting race, clinicians should explicitly justify its use and take care to avoid obfuscatory, inaccurate, or stigmatizing mention of associations between race and disease. Clinicians should not use race in clinical algorithms. Medical educators should emphasize the role of social determinants of health and structural racism in health outcomes to inform the use of race in medicine, in hopes that doing so will help students minimize implicit biases and learn to mitigate racial inequities in healthcare.2,16 In short, clinicians and medical educators alike should ensure that clinical care and the medical curriculum avoid presenting race as a proxy for pathology.
There is little evidence to guide proper inclusion of race in clinical interviews. In the absence of clear guidance about how to approach patients about race, we suggest not asking about it unless there is a reasonable probability that doing so will improve clinical care. If a clinician decides to ask about race, it is important to provide a rationale—such as explaining that the information can be used to assure high-quality care for all patients—since many patients are uncomfortable with questions about race.17 If clinicians report information about race in the social history, we advise using the patient’s description of race rather than traditional racial categories.
Clinicians who ask their patients about race should approach every patient in a uniform manner to avoid perpetuating biases. We hope future studies will inform equitable, inclusive, and person-centered approaches to discussing race with patients and promote a shared understanding of how racism contributes to illness.
RECOMMENDATIONS
- Avoid using racial descriptors in the HPI.
- Include racial and ethnic information in the social history only when it serves as a meaningful identity or it informs disparities stemming from racism.
- If racial or ethnic information is asked for, explain to patients why and how it will be used.
- Mention physical characteristics such as skin tone, rather than race, in the physical exam if required to describe findings accurately.
- Advocate for the replacement of race or race-adjusted algorithms in patient care.
- Expand the medical curriculum in the social determinants of health and structural racism, and develop systems to avoid the use of stigmatizing, race-based labels.
CONCLUSION
Race, a sociopolitical construct, does not accurately represent genetic variation. The routine use of race in the HPI can perpetuate racial biases and muddle both diagnoses and treatment. Only mention race in the social history if it is meaningful to the patient’s self-identity or explains health disparities arising from racism. All documentation and presentations should avoid the use of stigmatizing, race-based labels.
In the clinical scenario mentioned earlier, the attending hospitalist raises the issue of race-based labels in patient care in a nonjudgmental fashion. To provide illustrative specificity, she notes how the incorporation of race in formulas of glomerular filtration rate can lead to under-referral for renal transplant. The hospitalist then facilitates an open and inclusive discussion with the team regarding the use of race in clinical presentations and its potential impact on health disparities.
Do you think this is a low-value practice? Is this truly a “Thing We Do for No Reason™”? Let us know what you do in your practice and propose ideas for other “Things We Do for No Reason™” topics. Please join in the conversation online at Twitter (#TWDFNR)/Facebook and don’t forget to “Like It” on Facebook or retweet it on Twitter.
1. Burchard EG, Ziv E, Coyle N, et al. The importance of race and ethnic background in biomedical research and clinical practice. N Engl J Med. 2003;348(12):1170-1175. https://doi.org/10.1056/NEJMsb025007
2. Tsai J, Ucik L, Baldwin N, et al. Race matters? Examining and rethinking race portrayal in preclinical medical education. Acad Med. 2016;91(7):916-920. https://doi.org/10.1097/ACM.0000000000001232
3. Roth WD, Yaylacı S, Jaffe K, et al. Do genetic ancestry tests increase racial essentialism? Findings from a randomized controlled trial. PLoS One. 2020;15(1):e0227399. https://doi.org/10.1371/journal.pone.0227399
4. Beckie TM. A systematic review of allostatic load, health, and health disparities. Biol Res Nurs. 2012;14(4):311-346. https://doi.org/10.1177/1099800412455688
5. Fuentes A, Ackermann RR, Athreya S, et al. AAPA Statement on race and racism. Am J Phys Anthropol. 2019;169(3):400-402. https://doi.org/10.1002/ajpa.23882
6. Barbujani G, Magagni A, Minch E, et al. An apportionment of human DNA diversity. Proc Natl Acad Sci U S A. 1997;94(9):4516-4519. https://doi.org/10.1073/pnas.94.9.4516
7. Klinger EV, Carlini SV, Gonzalez I, et al. Accuracy of race, ethnicity, and language preference in an electronic health record. J Gen Intern Med. 2015;30(6):719-723. https://doi.org/10.1007/s11606-014-3102-8
8. Stewart C, Pepper MS. Cystic fibrosis in the African diaspora. Ann Am Thorac Soc. 2017;14(1):1-7. https://doi.org/10.1513/AnnalsATS.201606-481FR
9. Rho J, Ahn C, Gao A, et al. Disparities in mortality of Hispanic patients with cystic fibrosis in the United States. A national and regional cohort study. Am J Respir Crit Care Med. 2018;198(8):1055-1063. https://doi.org/10.1164/rccm.201711-2357OC
10. Power-Hays A, McGann PT. When actions speak louder than words—racism and sickle cell disease. N Engl J Med. 2020;383(20):1902-1903. https://doi.org/10.1056/NEJMp2022125
11. Vyas DA, Eisenstein LG, Jones DS. Hidden in plain sight—reconsidering the use of race correction in clinical algorithms. N Engl J Med. 2020;383(9):874-882. https://doi.org/10.1056/NEJMms2004740
12. Wilson JF, Weale ME, Smith AC, et al. Population genetic structure of variable drug response. Nat Genet. 2001;29(3):265-269. https://doi.org/10.1038/ng761
13. Cooper RS, Kaufman JS, Ward R. Race and genomics. N Engl J Med. 2003;348(12):1166-1170. https://doi.org/10.1056/NEJMsb022863
14. National Academies of Sciences, Engineering, and Medicine. Communities in Action: Pathways to Health Equity. National Academies Press; 2017.
15. Chapman EN, Kaatz A, Carnes M. Physicians and implicit bias: how doctors may unwittingly perpetuate health care disparities. J Gen Intern Med. 2013;28(11):1504-1510. https://doi.org/10.1007/s11606-013-2441-1
16. Balderston JR, Gertz ZM, Seedat R, et al. Differential documentation of race in the first line of the history of present illness. JAMA Intern Med. 2021;181(3):386-388. https://doi.org/10.1001/jamainternmed.2020.5792
17. Baker DW, Hasnain-Wynia R, Kandula NR, Thompson JA, Brown ER. Attitudes toward health care providers, collecting information about patients’ race, ethnicity, and language. Med Care. 2007;45(11):1034-1042. https://doi.org/10.1097/MLR.0b013e318127148f
Inspired by the ABIM Foundation’s Choosing Wisely® campaign, the “Things We Do for No Reason™” (TWDFNR) series reviews practices that have become common parts of hospital care but may provide little value to our patients. Practices reviewed in the TWDFNR series do not represent clear-cut conclusions or clinical practice standards but are meant as a starting place for research and active discussions among hospitalists and patients. We invite you to be part of that discussion.
CLINICAL SCENARIO
On teaching rounds, a medical student presents the following case to the attending hospitalist: “Mrs. L is a 54-year-old Black female with chronic kidney disease who was admitted with community-acquired pneumonia. She continues to improve symptomatically on ceftriaxone. Currently, she is afebrile and her vitals are stable. Supplemental oxygen has been weaned to 2 L/min by nasal cannula. Exam reveals improved crackles in the left lower chest without dullness to percussion. Labs are notable for down-trending leukocytosis and a stable serum creatinine of 2.8 mg/dL.” The hospitalist considers how including racial descriptors in clinical presentations may influence the care of the patient.
WHY YOU MIGHT THINK INCLUDING RACE IN THE HISTORY OF PRESENT ILLNESS IS HELPFUL
For decades, medical educators have taught learners to include sociopolitical constructs such as race in the opening sentence of the history of present illness (HPI). This practice presumably stems from the assumption that race accurately reflects biogenetic information about patients and serves as a key attribute in problem representations.1 Proponents of including race in the HPI suggest doing so aids the clinical assessment of patients’ risks for particular diseases and may inform the selection of race-appropriate therapies.2
The construct of race does sometimes correlate with the risk of disease or response to therapies. For example, sickle cell disease (SCD) occurs more commonly among patients who identify as Black rather than White. Specifically, ancestry from African nations such as Nigeria or the Democratic Republic of Congo increases the likelihood of having the disease-associated hemoglobin gene variant HbS.1 Popular genomic ancestry tests often report ancestral groupings that map to racial categories and may reinforce the perception that race has a genetic basis.3
WHY IT IS NOT HELPFUL TO INCLUDE RACE IN THE HPI
Race, a construct of sociopolitical origins, incorrectly conflates skin color with genetic variation. Associations between race and disease have the potential to cause diagnostic and therapeutic errors and inequitable allocation of resources. Increased illness burden in minority populations results primarily from social factors such as environment, access to care, housing instability, food insecurity, and experiences of discrimination, rather than genetic differences. The resulting chronic and recurrent physiologic stress—known as allostatic load—also contributes to the inequitable health outcomes observed in vulnerable populations, including patients who identify as Black.4
Historically, race evolved as a sociopolitical framework stemming from colonialism, discrimination, and exploitation.5 Numerous studies reveal a lack of genetic precision in racial categories. In fact, genetic data compared across major continental groups found greater variation of microsatellite loci and restriction fragment length polymorphisms within racial groups than between them.6 The evidence indicates that racial categories do not reflect homogenous population groups but rather “arbitrary division[s] of continuous variation” that cannot serve as a surrogate to genetic diversity.5 Not only are racial categories genetically inaccurate, but data on race within the electronic health record often differ from patients’ self-description of race, underscoring the problematic nature of even identifying race.7 In one study, up to 41% of patients self-reported identification with at least one other racial or ethnic group than the race or ethnicity documented in their electronic health record.7
Additionally, conflating race with genetic variation can lead to diagnostic errors. As an example, the incidence of cystic fibrosis (CF) varies widely across populations of European ancestry. The primary focus on CF’s occurrence in patients of European descent may divert attention from the identification of mutations causing CF in populations of African descent or the decreased survival observed in the United States among CF patients of Hispanic descent.8,9 Similarly, India represents one of the countries largely affected by SCD, suggesting that a myopic focus on SCD among those identifying as Black can lead to underdiagnosis of SCD among those with Indian ancestry.
Perhaps more insidiously, linking disease to race or other social constructs can result in differential support for affected individuals. SCD offers a striking illustration of this point. Reflecting the legacy of transatlantic slave trading, the majority of people with SCD in the United States are Black and face interpersonal and structural racism within society and healthcare that amplify the effects of this devastating illness.10 Compulsory screening programs for sickle cell trait introduced by many states in the 1970s targeted Black Americans and resulted in stigmatization and the denial of insurance, educational opportunities, and jobs for many identified with sickle cell trait. Federal funding for SCD research remains low, particularly in comparison to the tenfold higher funding for CF, which afflicts fewer, but primarily White, Americans.10
The incorporation of race into risk models and guidelines—alongside biologically relevant variables such as age and comorbid conditions—has received increasing attention for its potential to compound racial disparities in health outcomes. The American Heart Association Heart Failure Risk Score, for instance, may lead to the exclusion of some Black patients from necessary care because “Black” race, for no clear physiologic reason, serves as a protective factor against heart failure mortality.11 Likewise, race adjustments in pulmonary function tests, breast cancer risk models, and estimated glomerular filtration rate calculations, among others, have limited biological basis and the potential to divert care disproportionately from minority populations.11
Researchers have even called into question the application of race to pharmacotherapies. A 2001 investigation on geographic patterns of genetic variation in drug response concluded that common racial and ethnic labels were “insufficient and inaccurate representations” of the individual genetic clusters.12 Further, numerous experts have criticized two landmark studies of vasodilators and angiotensin-converting enzyme inhibitors in Black patients with heart failure for inconsistent results and nonsignificant associations between race and major outcomes, such as the development of heart failure or death.13
Race-based labels can also divert attention from true causes of health inequities. The National Academy of Sciences concluded that social determinants of health and structural racism are the root causes of health inequities, rather than genetics.14 Medical professionals may perpetuate these disparities: Most US physicians demonstrate an unconscious preference—or implicit bias—for White Americans over Black Americans.15 Beyond obscuring the role of social determinants of health and structural racism in health outcomes, race-based labels may exacerbate the ways in which physicians’ implicit biases contribute to racial and ethnic health disparities, primarily affecting Black Americans.2 In a recent study, clinicians documented race in the HPI for 33% of Black patients compared with 16% of White patients, and White clinicians were twice as likely to document race as Black physicians.16 Moreover, training medical students to view race as an independent risk factor of disease without discussing structural inequities can pathologize race and reinforce implicit biases linking race and disease.15
Based on the current evidence, we believe routine use of race-based labels in clinical presentations confuses providers at a minimum and potentially produces far more damage by obscuring or perpetuating the role of racism in health inequities.
WHAT YOU SHOULD DO INSTEAD
Instead of routinely presenting race in the HPI, we recommend including racial or ethnic information in the social history only when the patient reports it as a meaningful identity or when it informs health disparities stemming from structural or interpersonal racism. Clinicians should include physical characteristics pertaining to race, such as skin tone, in the physical exam only if required to describe exam findings accurately. When presenting race, clinicians should explicitly justify its use and take care to avoid obfuscatory, inaccurate, or stigmatizing mention of associations between race and disease. Clinicians should not use race in clinical algorithms. Medical educators should emphasize the role of social determinants of health and structural racism in health outcomes to inform the use of race in medicine, in hopes that doing so will help students minimize implicit biases and learn to mitigate racial inequities in healthcare.2,16 In short, clinicians and medical educators alike should ensure that clinical care and the medical curriculum avoid presenting race as a proxy for pathology.
There is little evidence to guide proper inclusion of race in clinical interviews. In the absence of clear guidance about how to approach patients about race, we suggest not asking about it unless there is a reasonable probability that doing so will improve clinical care. If a clinician decides to ask about race, it is important to provide a rationale—such as explaining that the information can be used to assure high-quality care for all patients—since many patients are uncomfortable with questions about race.17 If clinicians report information about race in the social history, we advise using the patient’s description of race rather than traditional racial categories.
Clinicians who ask their patients about race should approach every patient in a uniform manner to avoid perpetuating biases. We hope future studies will inform equitable, inclusive, and person-centered approaches to discussing race with patients and promote a shared understanding of how racism contributes to illness.
RECOMMENDATIONS
- Avoid using racial descriptors in the HPI.
- Include racial and ethnic information in the social history only when it serves as a meaningful identity or it informs disparities stemming from racism.
- If racial or ethnic information is asked for, explain to patients why and how it will be used.
- Mention physical characteristics such as skin tone, rather than race, in the physical exam if required to describe findings accurately.
- Advocate for the replacement of race or race-adjusted algorithms in patient care.
- Expand the medical curriculum in the social determinants of health and structural racism, and develop systems to avoid the use of stigmatizing, race-based labels.
CONCLUSION
Race, a sociopolitical construct, does not accurately represent genetic variation. The routine use of race in the HPI can perpetuate racial biases and muddle both diagnoses and treatment. Only mention race in the social history if it is meaningful to the patient’s self-identity or explains health disparities arising from racism. All documentation and presentations should avoid the use of stigmatizing, race-based labels.
In the clinical scenario mentioned earlier, the attending hospitalist raises the issue of race-based labels in patient care in a nonjudgmental fashion. To provide illustrative specificity, she notes how the incorporation of race in formulas of glomerular filtration rate can lead to under-referral for renal transplant. The hospitalist then facilitates an open and inclusive discussion with the team regarding the use of race in clinical presentations and its potential impact on health disparities.
Do you think this is a low-value practice? Is this truly a “Thing We Do for No Reason™”? Let us know what you do in your practice and propose ideas for other “Things We Do for No Reason™” topics. Please join in the conversation online at Twitter (#TWDFNR)/Facebook and don’t forget to “Like It” on Facebook or retweet it on Twitter.
1. Burchard EG, Ziv E, Coyle N, et al. The importance of race and ethnic background in biomedical research and clinical practice. N Engl J Med. 2003;348(12):1170-1175. https://doi.org/10.1056/NEJMsb025007
2. Tsai J, Ucik L, Baldwin N, et al. Race matters? Examining and rethinking race portrayal in preclinical medical education. Acad Med. 2016;91(7):916-920. https://doi.org/10.1097/ACM.0000000000001232
3. Roth WD, Yaylacı S, Jaffe K, et al. Do genetic ancestry tests increase racial essentialism? Findings from a randomized controlled trial. PLoS One. 2020;15(1):e0227399. https://doi.org/10.1371/journal.pone.0227399
4. Beckie TM. A systematic review of allostatic load, health, and health disparities. Biol Res Nurs. 2012;14(4):311-346. https://doi.org/10.1177/1099800412455688
5. Fuentes A, Ackermann RR, Athreya S, et al. AAPA Statement on race and racism. Am J Phys Anthropol. 2019;169(3):400-402. https://doi.org/10.1002/ajpa.23882
6. Barbujani G, Magagni A, Minch E, et al. An apportionment of human DNA diversity. Proc Natl Acad Sci U S A. 1997;94(9):4516-4519. https://doi.org/10.1073/pnas.94.9.4516
7. Klinger EV, Carlini SV, Gonzalez I, et al. Accuracy of race, ethnicity, and language preference in an electronic health record. J Gen Intern Med. 2015;30(6):719-723. https://doi.org/10.1007/s11606-014-3102-8
8. Stewart C, Pepper MS. Cystic fibrosis in the African diaspora. Ann Am Thorac Soc. 2017;14(1):1-7. https://doi.org/10.1513/AnnalsATS.201606-481FR
9. Rho J, Ahn C, Gao A, et al. Disparities in mortality of Hispanic patients with cystic fibrosis in the United States. A national and regional cohort study. Am J Respir Crit Care Med. 2018;198(8):1055-1063. https://doi.org/10.1164/rccm.201711-2357OC
10. Power-Hays A, McGann PT. When actions speak louder than words—racism and sickle cell disease. N Engl J Med. 2020;383(20):1902-1903. https://doi.org/10.1056/NEJMp2022125
11. Vyas DA, Eisenstein LG, Jones DS. Hidden in plain sight—reconsidering the use of race correction in clinical algorithms. N Engl J Med. 2020;383(9):874-882. https://doi.org/10.1056/NEJMms2004740
12. Wilson JF, Weale ME, Smith AC, et al. Population genetic structure of variable drug response. Nat Genet. 2001;29(3):265-269. https://doi.org/10.1038/ng761
13. Cooper RS, Kaufman JS, Ward R. Race and genomics. N Engl J Med. 2003;348(12):1166-1170. https://doi.org/10.1056/NEJMsb022863
14. National Academies of Sciences, Engineering, and Medicine. Communities in Action: Pathways to Health Equity. National Academies Press; 2017.
15. Chapman EN, Kaatz A, Carnes M. Physicians and implicit bias: how doctors may unwittingly perpetuate health care disparities. J Gen Intern Med. 2013;28(11):1504-1510. https://doi.org/10.1007/s11606-013-2441-1
16. Balderston JR, Gertz ZM, Seedat R, et al. Differential documentation of race in the first line of the history of present illness. JAMA Intern Med. 2021;181(3):386-388. https://doi.org/10.1001/jamainternmed.2020.5792
17. Baker DW, Hasnain-Wynia R, Kandula NR, Thompson JA, Brown ER. Attitudes toward health care providers, collecting information about patients’ race, ethnicity, and language. Med Care. 2007;45(11):1034-1042. https://doi.org/10.1097/MLR.0b013e318127148f
© 2021 Society of Hospital Medicine
Racial and Ethnic Disparities in Discharge Opioid Prescribing From a Hospital Medicine Service
Within the nationwide effort to combat the opioid epidemic and reduce opioid prescribing, researchers have described different prescribing patterns for non-White racial and ethnic groups, including Black and LatinX populations. This remains a largely unexplored area within hospital medicine. Earlier studies of racial disparities demonstrate how some patients are assessed less often for pain and prescribed fewer opioids from the emergency department, surgical settings, and outpatient primary care practices. Researchers also have documented racial and ethnic disparities in analgesia for cancer pain and chronic noncancer pain.1-11 Studies have demonstrated that White patients are more likely to receive opioid prescriptions compared with Black patients. Even with similar documented pain scores, there is evidence that Black patients receive fewer analgesics compared with White patients. For example, a recent study found that Black and Hispanic patients presenting to the emergency room for renal colic received less opioid medication compared with White patients.3 A study across 22 sites in Northern California found that racial minorities with long-bone fractures received fewer opioids at discharge than White patients.1
It is unknown whether differential prescribing patterns by race exist among patients hospitalized on general medicine services. The objective of our study was to assess whether race and ethnicity were associated with the likelihood of opioids being prescribed and the duration of opioids prescribed when these patients are discharged from the hospital. Quantifying and seeking to understand these differences are the first steps toward ensuring racial and ethnic health equity in patient care.
METHODS
Study Population and Data Sources
We identified all adults (age ≥18 years) discharged from the acute care inpatient general medicine services between June 1, 2012, and November 30, 2018, at the University of California, San Francisco (UCSF) Helen Diller Medical Center at Parnassus Heights, a 785-bed urban academic teaching hospital. All data were obtained from the hospital’s Epic-based electronic medical record (Epic Systems Corporation). Data elements were extracted from Clarity, the relationship database that stores Epic inpatient data. Patients discharged from the inpatient cardiology or bone marrow transplant services were not included. We excluded patients who did not receive opioids in the last 24 hours of their hospitalization. Patients with cancer-related pain diagnoses or sickle cell disease pain crises and patients who were discharged to hospice or followed by palliative care were excluded from the study based on International Classification of Diseases, Tenth Revision (ICD-10) codes (available on request) or service codes, when available, or admitting provider electronic health record documentation (Appendix Figure 1). Palliative care and hospice patients have significantly different pain needs, with management often directed by specialists. Patients with sickle cell disease are disproportionately Black and have distinct opioid prescribing patterns.12,13 We also excluded discharge opioid prescriptions that were a resumption of the patient’s opioid prescription before admission based on medication documentation. Only new prescriptions signed by the discharging hospitalist, including different doses and formulations, were included in this study.
We performed a subgroup analysis of patients who were not prescribed opioids before their admission based on medication reconciliation but were started on opioids while hospitalized.
Primary Outcomes
We examined two primary outcomes: whether a patient received an opioid prescription at discharge, and, for patients prescribed opioids, the number of days prescribed. Days of opioids at discharge were calculated as total morphine milligram equivalents (MMEs) prescribed divided by MMEs administered during the final 24 hours of hospitalization. This metric was used as a patient-specific approach to calculating how long an opioid prescription will last after discharge, standardized according to the actual opioid requirements from hospitalization.14 If a patient was discharged with prescriptions for several opioids, the longest single prescription duration was used.
Primary Predictors
The primary predictor was the patient’s primary self-reported race/ethnicity, categorized as White, Black, LatinX, Asian, Native Hawaiian or other Pacific Islander, American Indian or Alaska Native, and other/unknown. Other/unknown included patients who were listed as other, declined, or who were otherwise unspecified. Self-reported race/ethnicity is obtained through reporting to the registrar. These race/ethnicity groupings were done in concordance with US Census Bureau definitions. Researchers classified patients as LatinX if they had Hispanic documented as their ethnicity, no matter their racial identification. These categorizations were chosen to be consistent with the existing literature, recognizing the role of a combined race/ethnicity definition for Hispanic or LatinX populations.15 These definitions of race/ethnicity are self-reported and reflect socially—not genetically defined—groupings.16 This variable serves as a surrogate for the structural factors that contribute to racism, the determining factor for racially disparate outcomes.17
Covariate Data Collection
Additional data were obtained regarding patient demographics, hospitalization factors, and medical diagnoses. Demographic factors included age, sex, and limited English proficiency (LEP) status. LEP was defined as having a primary language other than English and requiring an interpreter. Hospitalization factors included length of stay, whether they required intensive care unit (ICU) management, average daily MMEs administered during their entire hospitalization, MMEs administered during the final 24 hours of their hospitalization, whether the patient was on a teaching service or direct-care hospitalist service, their disposition on discharge, and year. Medical diagnosis variables included the adjusted Elixhauser Comorbidity Index based on ICD-10 codes; whether the patient was taking opioids at admission; and specific diagnoses of cancer, posttraumatic stress disorder (PTSD), and mood, anxiety, or psychotic disorder based on ICD-10 documentation.18
Statistical Analysis
All statistical analyses were performed using Stata software version 16 (StataCorp LP). Baseline demographic variables, hospitalization factors, and medical diagnosis variables were stratified by race/ethnicity. Within group comparisons were performed using chi-square or analysis of varianace (ANOVA) testing. For regression analyses, we fit two models. First, we fit a multivariable logistic regression model on all patients who received opioids during the last 24 hours of their hospitalization to examine the association between patient race/ethnicity and whether a patient received opioids at discharge, adjusting for additional patient, hospitalization, and medical covariates. Then we fit a negative binomial regression model on patients who were prescribed opioids at discharge to examine the association between patient race/ethnicity and the amount of opioids prescribed at discharge, adjusting for covariates. We used a negative binomial model because of the overdispersed distribution of discharge opioid prescriptions and only examined patients with an opioid prescription at discharge. We included the listed variables in our model because they were all found a priori to be associated with discharge opioid prescriptions.19 Instead of using days of opioids based on the last 24 hours, we performed a secondary analysis using the actual days of opioids supplied as the outcome. For example, a prescription of 12 tablets with every 6 hours dosing would be 3 days’ duration.
For both models, subgroup analyses were performed using the adjusted models restricted to patients newly prescribed opioids during their hospitalization and who were not previously taking opioids based on admission medication reconciliation. After testing for effect modification, this subgroup analysis was performed to reduce selection bias associated with earlier opioid use.
For all models, we reported predicted population opioid prescribing rates from the average marginal effects (AME).20 Marginal effects were used because ours was a population level study and the outcome of interest was relatively common, limiting the effective interpretation of odds ratios.21 Marginal effects allow us to observe the instantaneous effect a given independent variable has on a dependent variable, while holding all other variables constant. It is implemented using the margins command in Stata. Marginal effects enable us to present our results as differences in probabilities, which is a more accurate way to describe the differences found among patient groups. Further, marginal effects are less sensitive to changes in model specifications.22The UCSF Institutional Review Board for Human Subjects Research approved this study with a waiver of informed consent.
RESULTS
Unadjusted Results
We identified 10,953 patients who received opioids during the last 24 hours of hospitalization (see Appendix Figure 1 for study consort diagram). The patient population was 52.2% White, 18.4% Black, 11.5% Latinx, 10.1% Asian, 6.2% other/unknown, 0.9% Native Hawaiian/Other Pacific Islander, and 0.8% American Indian/Alaska Native (Table 1, Appendix Table 1). Black patients had fewer cancer diagnoses and the highest rate of prescribed opioids on admission. Asian patients were older and more likely to be female, and had higher rates of cancer, the highest median comorbidity index, and the smallest median daily MME during both the last 24 hours and total duration of hospitalization. Representative of general medicine patients, the most common principal discharge diagnoses in our dataset were pneumonia, cellulitis, altered mental status, sepsis, and abdominal pain.

Overall, 5541 (50.6%) patients who received opioids in the last 24 hours of their hospitalization received an opioid prescription at discharge. There were significant differences among racial/ethnic groups receiving an opioid prescription at discharge. Black patients were less likely to be discharged with an opioid compared with White patients (47.7% vs 50.3%; P < .001) (Table 2). The median discharge prescription duration for all patients was 9.3 days (interquartile range [IQR], 3.8-20.0). Black patients received the fewest median days of opioids at 7.5 days (IQR, 3.2-16.7) compared with White patients at 8.8 days (IQR, 3.7-20.0; P < .001) (Table 2).

Adjusted Regression Results
Demographic, clinical, and diagnosis specific factors were significantly associated with opioid prescriptions, including previous opioid use, sex, and a concurrent cancer diagnosis. There were fewer opioid prescriptions over time (Figure).
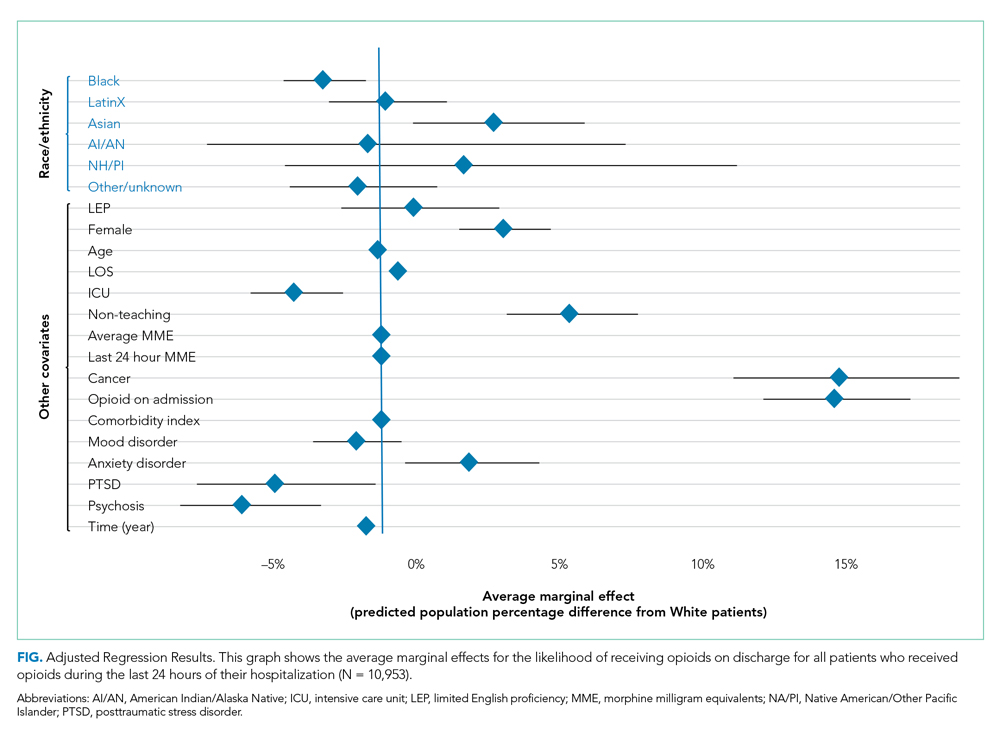
Following multivariable logistic regression for the association between race/ethnicity and opioid on discharge and controlling for covariates, we found that Black patients were less likely to receive an opioid prescription on discharge compared with White patients (predicted population rate, 47.6% vs 50.7%; AME −3.1%; 95% CI, −5.5% to −0.8%). Asian patients were more likely to receive a prescription on discharge compared with White patients (predicted population rate, 55.6% vs 50.7%; AME +4.9; 95% CI, 1.5%-8.3%).
Following multivariable negative binomial regression for the association between race/ethnicity and the number of opioid days on discharge, we found that Black patients received a shorter duration of opioid days compared with White patients (predicted days of opioids on discharge, 15.7 days vs 17.8 days; AME −2.1 days; 95% CI, −3.3 to −0.87) (Table 3). There were no significant differences among patients and the other racial/ethnic groups.
 and Multivariable Negative Binomial Regression between Race/Ethnicity and Days of Opioids Prescribed on Discharge (n = 5541)")
Our secondary analysis from the negative binomial regression with the days of opioids supplied metric yielded similar results to our primary analysis showing that Black patients received statically significantly fewer days of opioid therapy compared with White patients (Appendix Table 2).
Subgroup Regression Results
After testing for effect modification, which was negative, we examined the relationships for patients started on opioids during their hospitalization (Appendix Table 3 and Appendix Table 4). There were 5101 patients with newly prescribed opioids during their hospitalization. Adjusting for covariates, we found that Black patients were less likely to receive opioids at discharge compared with White patients (predicted population rate, 34.9% vs 40.4%; AME −5.5%; 95% CI, −9.2% to −1.9%). American Indian or Alaska Native patients were more likely to receive opioids on discharge (predicted population rate, 58.3% vs 40.4%; AME +17.9%; 95% CI, 1.0%-34.8%). We also found that Asian patients received more days of opioids on discharge (predicted days of opioid on discharge, 16.7 vs 13.7 days; AME +3.0 days; 95% CI, 0.6-5.3 days) (Appendix Table 4, Appendix Figure 2).
DISCUSSION
We found that Black patients discharged from the general medicine service were less likely to receive opioids and received shorter courses on discharge compared with White patients, adjusting for demographic, hospitalization, and medical diagnosis variables. Asian patients were more likely to receive an opioid prescription at discharge—a finding not reported in the literature on opioid prescribing disparities in most other practice settings.1
Previous studies have shown racial disparities in pain management in emergency and surgical settings, but these relationships have not been characterized in an inpatient medicine population. Medicine patients comprise the majority of admitted patients in the United States and reflect a wide diversity of medical conditions, many requiring opioids for pain management. Determining the etiology of these differential prescribing patterns was not within the scope of our study, but earlier studies demonstrate a number of reasons why these patterns exist across racial and ethnic groups in other practice settings.23,24 These reports give us insight into potential mechanisms for our study population.
Differences in pain management likely represent the multiple structural mechanisms by which racism operates.17 Drawing from the existing literature and the socioecological model, we hypothesize the ways that individual, interpersonal relationships, organizations, communities, and public policy impact opioid prescribing.25,26 Using this model and considering the framework of Critical Race Theory (CRT), we can work towards understanding how race and ethnicity stand in as surrogates for racism and how this manifests in different outcomes and identify areas for intervention. CRT draws attention to race consciousness, contemporary orientation, centering in the margins, and praxis. In the context of this analysis, we recognize race consciousness and the interactions among factors such as race/ethnicity, language, and diagnoses such as PTSD.27 This approach is necessary because racism is a multilevel construct influenced by macrolevel factors.28
Individually and interpersonally, there is clinician-driven bias in pain assessment, which is activated under times of stress and diagnostic uncertainty and is amplified by a lack of clear guidelines for pain management prescriptions.23,29-32 Institutional and organizational culture contribute to disparities through ingrained culture, practice patterns, and resource allocation.29,33 Last, public policy and the larger sociopolitical environment worsen disparities through nondiverse workforces, state and federal guidelines, criminal justice policy, supply chain regulation, and access to care.
As individual clinicians, departments, and health systems leaders, we must identify areas for intervention. At the individual and interpersonal levels, there is evidence that taking implicit association tests could help clinicians become more aware of their negative associations, and empathy-inducing, perspective-taking interventions can reduce pain treatment bias.31,34 At the institutional level, we must report data on disparities, create guidelines for pain management, and reevaluate the educational curriculum and culture to assess how certain biases could be propagated. The lack of straightforward guidelines leads to unclear indications for opioid prescriptions, exacerbating provider-level differences in prescribing. At the policy level, legislation that promotes workplace diversity, increases training for and access to pain specialists, and incentivizes data collection and reporting could help reduce disparities.35 Equitable access to prescriptions and care is essential. Pharmacies often understock opioids in minority neighborhoods, meaning that even if a patient is prescribed an opioid on discharge, he or she might have difficulty filling the prescription.36
One could question whether fewer opioid prescriptions for Black patients protects against the harms of opioid overprescribing, and therefore is not reflective of harmful inequity.37 Ongoing national programs aim to reduce the harmful effects of opioids, which is reflected in the reduction in opioid prescribing over time in our institution. Our point is that differences in prescribing could reflect practices that do result in patient harm, such as less adequately controlled pain among Black patients.1,3 Undertreated pain has negative health and social consequences and further contributes to substance-use stigma within minority communities.38 Moreover, Black people who describe more discrimination in medical settings were more likely to report subsequent opioid misuse.39
Although the above mechanisms might partially explain our findings among Black patients, the higher rate of prescribing for Asian patients is more challenging to explain. Our models adjusted for clinical factors. Notably, our Asian patients had the highest baseline comorbidity index, oldest mean age, and highest cancer rates, and it is possible that we were unable to fully account for illness severity or related pain needs (Table 1). It also is possible—although speculative—that factors such as language, provider concordance, and the type of disease process all contribute.40 Some researchers have proposed a “stereotype content model” that seeks to establish a pathway among social structure (status of a patient) to clinician stereotypes (is this patient warm and/or competent) to emotional prejudices (envy, pride) and ultimately to discrimination (active/passive, help/harm).23Our study has limitations. Our model was limited by the available data collected on our patients. Covariates including primary care follow-up, pain scores, and overdose history were not available. Furthermore, our categorization of race/ethnicity was based on self-reported data. We had 676 patients with race/ethnicity specified as other/unknown. We recognize the heterogeneity within these racial/ethnic categorizations. For example, within the LatinX or Asian communities, there are large differences based on region, country, ethnic, or cultural groups. Our study only included patients presenting to a hospital in San Francisco, which is different from the racial/ethnic makeup of other cities across the nation. Our electronic health record capture of history of opioid use disorder and mood disorders is contingent on individual clinician documentation. We did not account for provider-level differences, which is an important part of variation in prescribing differences. We also did not examine differences at the diagnosis-specific level. Finally, we could not determine the indication or appropriateness of opioid prescriptions.
Future studies will be necessary to characterize this relationship at a diagnosis-specific level and to describe causal pathways. Within our own institution, these findings present an opportunity for positive change. We hope to continue to explore the etiology of these disparities and identify areas where differences could impact patient outcomes, such as pain control. It is essential to develop appropriate recommendations for inpatient and discharge opioid prescribing to help minimize disparities and to mitigate potential harms of overprescribing. All health systems should continue to collect data on their own disparities in opioid prescribing and educate clinicians on promoting more equitable practices.
Acknowledgments
The authors thank Sneha Daya, MD, Sachin Shah, MD, MPH, and the UCSF Division of Hospital Medicine Data Core.
1. Romanelli RJ, Shen Z, Szwerinski N, Scott A, Lockhart S, Pressman AR. Racial and ethnic disparities in opioid prescribing for long bone fractures at discharge from the emergency department: a cross-sectional analysis of 22 centers from a health care delivery system in northern California. Ann Emerg Med. 2019;74(5):622-631. https://doi.org/10.1016/j.annemergmed.2019.05.018
2. Tamayo-Sarver JH, Hinze SW, Cydulka RK, Baker DW. Racial and ethnic disparities in emergency department analgesic prescription. Am J Public Health. 2003;93(12):2067-2073. https://doi.org/10.2105/ajph.93.12.2067
3. Berger AJ, Wang Y, Rowe C, Chung B, Chang S, Haleblian G. Racial disparities in analgesic use amongst patients presenting to the emergency department for kidney stones in the United States. Am J Emerg Med. 2021;39:71-74. https://doi.org/10.1016/j.ajem.2020.01.017
4. Dickason RM, Chauhan V, Mor A, et al. Racial differences in opiate administration for pain relief at an academic emergency department. West J Emerg Med. 2015;16(3):372-380. https://doi.org/10.5811/westjem.2015.3.23893
5. Singhal A, Tien Y-Y, Hsia RY. Racial-ethnic disparities in opioid prescriptions at emergency department visits for conditions commonly associated with prescription drug abuse. PloS One. 2016;11(8):e0159224. https://doi.org/10.1371/journal.pone.0159224
6. Green CR, Anderson KO, Baker TA, et al. The unequal burden of pain: confronting racial and ethnic disparities in pain. Pain Med Malden Mass. 2003;4(3):277-294. https://doi.org/10.1046/j.1526-4637.2003.03034.x
7. Hoffman KM, Trawalter S, Axt JR, Oliver MN. Racial bias in pain assessment and treatment recommendations, and false beliefs about biological differences between blacks and whites. Proc Natl Acad Sci U S A. 2016;113(16):4296-4301. https://doi.org/10.1073/pnas.1516047113
8. Anderson KO, Green CR, Payne R. Racial and ethnic disparities in pain: causes and consequences of unequal care. J Pain. 2009;10(12):1187-1204. https://doi.org/10.1016/j.jpain.2009.10.002
9. Cintron A, Morrison RS. Pain and ethnicity in the United States: a systematic review. J Palliat Med. 2006;9(6):1454-1473. https://doi.org/10.1089/jpm.2006.9.1454
10. Pletcher MJ, Kertesz SG, Kohn MA, Gonzales R. Trends in opioid prescribing by race/ethnicity for patients seeking care in US emergency departments. JAMA. 2008;299(1):70-78. https://doi.org/10.1001/jama.2007.64
11. Campbell CM, Edwards RR. Ethnic differences in pain and pain management. Pain Manag. 2012;2(3):219-230. https://doi.org/10.2217/pmt.12.7
12. Yawn BP, Buchanan GR, Afenyi-Annan AN, et al. Management of sickle cell disease: summary of the 2014 evidence-based report by expert panel members. JAMA. 2014;312(10):1033-1048. https://doi.org/10.1001/jama.2014.10517
13. Brown W. Opioid use in dying patients in hospice and hospital, with and without specialist palliative care team involvement. Eur J Cancer Care (Engl). 2008;17(1):65-71. https://doi.org/10.1111/j.1365-2354.2007.00810.x
14. Iverson N, Lau CY, Abe-Jones Y, et al. Evaluating a novel metric for personalized opioid prescribing after hospitalization: a retrospective cohort study. PloS One. 2020;15(12):e0244735. https://doi.org/ 10.1371/journal.pone.0244735
15. Howell J, Emerson MO. So what “ should ” we use? Evaluating the impact of five racial measures on markers of social inequality. Sociol Race Ethn (Thousand Oaks). 2017;3(1):14-30. https://doi.org/10.1177/2332649216648465
16. Kaplan JB, Bennett T. Use of race and ethnicity in biomedical publication. JAMA. 2003;289(20):2709-2716. https://doi.org/10.1001/jama.289.20.2709
17. Boyd RW, Lindo EG, Weeks LD, McLemore MR. On racism: a new standard for publishing on racial health inequities. Health Affairs. Published July 2, 2020. Accessed August 20, 2021. https://www.healthaffairs.org/do/10.1377/hblog20200630.939347/full
18. van Walraven C, Austin PC, Jennings A, Quan H, Forster AJ. A modification of the Elixhauser comorbidity measures into a point system for hospital death using administrative data. Med Care. 2009;47(6):626-633. https://doi.org/10.1097/MLR.0b013e31819432e5
19. Sun GW, Shook TL, Kay GL. Inappropriate use of bivariable analysis to screen risk factors for use in multivariable analysis. J Clin Epidemiol. 1996;49(8):907-916. https://doi.org/10.1016/0895-4356(96)00025-x
20. Norton EC, Dowd BE, Maciejewski ML. Marginal effects-quantifying the effect of changes in risk factors in logistic regression models. JAMA. 2019;321(13):1304-1305. https://doi.org/10.1001/jama.2019.1954
21. Zhang J, Yu KF. What’s the relative risk? A method of correcting the odds ratio in cohort studies of common outcomes. JAMA. 1998;280(19):1690-1691. https://doi.org/10.1001/jama.280.19.1690
22. Norton EC, Dowd BE. Log odds and the interpretation of logit models. Health Serv Res. 2018;53(2):859-878. https://doi.org/10.1111/1475-6773.12712
23. Dovidio JF, Fiske ST. Under the radar: how unexamined biases in decision-making processes in clinical interactions can contribute to health care disparities. Am J Public Health. 2012;102(5):945-952. https://doi.org/10.2105/AJPH.2011.300601
24. van Ryn M. Research on the provider contribution to race/ethnicity disparities in medical care. Med Care. 2002;40(1 Suppl):I140-151. https://doi.org/10.1097/00005650-200201001-00015
25. Krieger N. Theories for social epidemiology in the 21st century: an ecosocial perspective. Int J Epidemiol. 2001;30(4):668-677. https://doi.org/10.1093/ije/30.4.668
26. Golden SD, Earp JAL. Social ecological approaches to individuals and their contexts: twenty years of health education & behavior health promotion interventions. Health Educ Behav Off Publ Soc Public Health Educ. 2012;39(3):364-372. https://doi.org/10.1177/1090198111418634
27. Ford CL, Airhihenbuwa CO. Critical race theory, race equity, and public health: toward antiracism praxis. Am J Public Health. 2010;100 Suppl 1(Suppl 1):S30-5. https://doi.org/10.2105/AJPH.2009.171058
28. Ford CL, Daniel M, Earp JAL, Kaufman JS, Golin CE, Miller WC. Perceived everyday racism, residential segregation, and HIV testing among patients at a sexually transmitted disease clinic. Am J Public Health. 2009;99 Suppl 1:S137-143. https://doi.org/10.2105/AJPH.2007.120865
29. Hall WJ, Chapman MV, Lee KM, et al. Implicit racial/ethnic bias among health care professionals and its influence on health care outcomes: a systematic review. Am J Public Health. 2015;105(12):e60-76. https://doi.org/10.2105/AJPH.2015.302903
30. Staton LJ, Panda M, Chen I, et al. When race matters: disagreement in pain perception between patients and their physicians in primary care. J Natl Med Assoc. 2007;99(5):532-538.
31. Drwecki BB, Moore CF, Ward SE, Prkachin KM. Reducing racial disparities in pain treatment: the role of empathy and perspective-taking. Pain. 2011;152(5):1001-1006. https://doi.org/10.1016/j.pain.2010.12.005
32. Mende-Siedlecki P, Qu-Lee J, Backer R, Van Bavel JJ. Perceptual contributions to racial bias in pain recognition. J Exp Psychol Gen. 2019;148(5):863-889. https://doi.org/10.1037/xge0000600
33. King G. Institutional racism and the medical/health complex: a conceptual analysis. Ethn Dis. 1996;6(1-2):30-46.
34. Maina IW, Belton TD, Ginzberg S, Singh A, Johnson TJ. A decade of studying implicit racial/ethnic bias in healthcare providers using the implicit association test. Soc Sci Med. 2018;199:219-229. https://doi.org/10.1016/j.socscimed.2017.05.009
35. Meghani SH, Byun E, Gallagher RM. Time to take stock: a meta-analysis and systematic review of analgesic treatment disparities for pain in the United States. Pain Med. 2012;13(2):150-174. https://doi.org/10.1111/j.1526-4637.2011.01310.x
36. Morrison RS, Wallenstein S, Natale DK, Senzel RS, Huang LL. “We don’t carry that”—failure of pharmacies in predominantly nonwhite neighborhoods to stock opioid analgesics. N Engl J Med. 2000;342(14):1023-1026. https://doi.org/10.1056/NEJM200004063421406
37. Frakt A, Monkovic T. A ‘rare case where racial biases’ protected African-Americans. The New York Times. November 25, 2019. Updated December 2, 2019. Accessed July 5, 2021. https://www.nytimes.com/2019/11/25/upshot/opioid-epidemic-blacks.html
38. Khatri U, Shoshana Aronowitz S, South E. The opioid crisis shows why racism in health care is always harmful, never ‘protective’. The Philadelphia Inquirer. Updated December 26, 2019. Accessed July 5, 2021. https://www.inquirer.com/health/expert-opinions/opioid-crisis-racism-healthcare-buprenorphine-20191223.html
39. Swift SL, Glymour MM, Elfassy T, et al. Racial discrimination in medical care settings and opioid pain reliever misuse in a U.S. cohort: 1992 to 2015. PloS One. 2019;14(12):e0226490. https://journals.plos.org/plosone/article?id=10.1371/journal.pone.0226490
40. Hsieh AY, Tripp DA, Ji L-J. The influence of ethnic concordance and discordance on verbal reports and nonverbal behaviours of pain. Pain. 2011;152(9):2016-2022. https://doi.org/10.1016/j.pain.2011.04.023
Within the nationwide effort to combat the opioid epidemic and reduce opioid prescribing, researchers have described different prescribing patterns for non-White racial and ethnic groups, including Black and LatinX populations. This remains a largely unexplored area within hospital medicine. Earlier studies of racial disparities demonstrate how some patients are assessed less often for pain and prescribed fewer opioids from the emergency department, surgical settings, and outpatient primary care practices. Researchers also have documented racial and ethnic disparities in analgesia for cancer pain and chronic noncancer pain.1-11 Studies have demonstrated that White patients are more likely to receive opioid prescriptions compared with Black patients. Even with similar documented pain scores, there is evidence that Black patients receive fewer analgesics compared with White patients. For example, a recent study found that Black and Hispanic patients presenting to the emergency room for renal colic received less opioid medication compared with White patients.3 A study across 22 sites in Northern California found that racial minorities with long-bone fractures received fewer opioids at discharge than White patients.1
It is unknown whether differential prescribing patterns by race exist among patients hospitalized on general medicine services. The objective of our study was to assess whether race and ethnicity were associated with the likelihood of opioids being prescribed and the duration of opioids prescribed when these patients are discharged from the hospital. Quantifying and seeking to understand these differences are the first steps toward ensuring racial and ethnic health equity in patient care.
METHODS
Study Population and Data Sources
We identified all adults (age ≥18 years) discharged from the acute care inpatient general medicine services between June 1, 2012, and November 30, 2018, at the University of California, San Francisco (UCSF) Helen Diller Medical Center at Parnassus Heights, a 785-bed urban academic teaching hospital. All data were obtained from the hospital’s Epic-based electronic medical record (Epic Systems Corporation). Data elements were extracted from Clarity, the relationship database that stores Epic inpatient data. Patients discharged from the inpatient cardiology or bone marrow transplant services were not included. We excluded patients who did not receive opioids in the last 24 hours of their hospitalization. Patients with cancer-related pain diagnoses or sickle cell disease pain crises and patients who were discharged to hospice or followed by palliative care were excluded from the study based on International Classification of Diseases, Tenth Revision (ICD-10) codes (available on request) or service codes, when available, or admitting provider electronic health record documentation (Appendix Figure 1). Palliative care and hospice patients have significantly different pain needs, with management often directed by specialists. Patients with sickle cell disease are disproportionately Black and have distinct opioid prescribing patterns.12,13 We also excluded discharge opioid prescriptions that were a resumption of the patient’s opioid prescription before admission based on medication documentation. Only new prescriptions signed by the discharging hospitalist, including different doses and formulations, were included in this study.
We performed a subgroup analysis of patients who were not prescribed opioids before their admission based on medication reconciliation but were started on opioids while hospitalized.
Primary Outcomes
We examined two primary outcomes: whether a patient received an opioid prescription at discharge, and, for patients prescribed opioids, the number of days prescribed. Days of opioids at discharge were calculated as total morphine milligram equivalents (MMEs) prescribed divided by MMEs administered during the final 24 hours of hospitalization. This metric was used as a patient-specific approach to calculating how long an opioid prescription will last after discharge, standardized according to the actual opioid requirements from hospitalization.14 If a patient was discharged with prescriptions for several opioids, the longest single prescription duration was used.
Primary Predictors
The primary predictor was the patient’s primary self-reported race/ethnicity, categorized as White, Black, LatinX, Asian, Native Hawaiian or other Pacific Islander, American Indian or Alaska Native, and other/unknown. Other/unknown included patients who were listed as other, declined, or who were otherwise unspecified. Self-reported race/ethnicity is obtained through reporting to the registrar. These race/ethnicity groupings were done in concordance with US Census Bureau definitions. Researchers classified patients as LatinX if they had Hispanic documented as their ethnicity, no matter their racial identification. These categorizations were chosen to be consistent with the existing literature, recognizing the role of a combined race/ethnicity definition for Hispanic or LatinX populations.15 These definitions of race/ethnicity are self-reported and reflect socially—not genetically defined—groupings.16 This variable serves as a surrogate for the structural factors that contribute to racism, the determining factor for racially disparate outcomes.17
Covariate Data Collection
Additional data were obtained regarding patient demographics, hospitalization factors, and medical diagnoses. Demographic factors included age, sex, and limited English proficiency (LEP) status. LEP was defined as having a primary language other than English and requiring an interpreter. Hospitalization factors included length of stay, whether they required intensive care unit (ICU) management, average daily MMEs administered during their entire hospitalization, MMEs administered during the final 24 hours of their hospitalization, whether the patient was on a teaching service or direct-care hospitalist service, their disposition on discharge, and year. Medical diagnosis variables included the adjusted Elixhauser Comorbidity Index based on ICD-10 codes; whether the patient was taking opioids at admission; and specific diagnoses of cancer, posttraumatic stress disorder (PTSD), and mood, anxiety, or psychotic disorder based on ICD-10 documentation.18
Statistical Analysis
All statistical analyses were performed using Stata software version 16 (StataCorp LP). Baseline demographic variables, hospitalization factors, and medical diagnosis variables were stratified by race/ethnicity. Within group comparisons were performed using chi-square or analysis of varianace (ANOVA) testing. For regression analyses, we fit two models. First, we fit a multivariable logistic regression model on all patients who received opioids during the last 24 hours of their hospitalization to examine the association between patient race/ethnicity and whether a patient received opioids at discharge, adjusting for additional patient, hospitalization, and medical covariates. Then we fit a negative binomial regression model on patients who were prescribed opioids at discharge to examine the association between patient race/ethnicity and the amount of opioids prescribed at discharge, adjusting for covariates. We used a negative binomial model because of the overdispersed distribution of discharge opioid prescriptions and only examined patients with an opioid prescription at discharge. We included the listed variables in our model because they were all found a priori to be associated with discharge opioid prescriptions.19 Instead of using days of opioids based on the last 24 hours, we performed a secondary analysis using the actual days of opioids supplied as the outcome. For example, a prescription of 12 tablets with every 6 hours dosing would be 3 days’ duration.
For both models, subgroup analyses were performed using the adjusted models restricted to patients newly prescribed opioids during their hospitalization and who were not previously taking opioids based on admission medication reconciliation. After testing for effect modification, this subgroup analysis was performed to reduce selection bias associated with earlier opioid use.
For all models, we reported predicted population opioid prescribing rates from the average marginal effects (AME).20 Marginal effects were used because ours was a population level study and the outcome of interest was relatively common, limiting the effective interpretation of odds ratios.21 Marginal effects allow us to observe the instantaneous effect a given independent variable has on a dependent variable, while holding all other variables constant. It is implemented using the margins command in Stata. Marginal effects enable us to present our results as differences in probabilities, which is a more accurate way to describe the differences found among patient groups. Further, marginal effects are less sensitive to changes in model specifications.22The UCSF Institutional Review Board for Human Subjects Research approved this study with a waiver of informed consent.
RESULTS
Unadjusted Results
We identified 10,953 patients who received opioids during the last 24 hours of hospitalization (see Appendix Figure 1 for study consort diagram). The patient population was 52.2% White, 18.4% Black, 11.5% Latinx, 10.1% Asian, 6.2% other/unknown, 0.9% Native Hawaiian/Other Pacific Islander, and 0.8% American Indian/Alaska Native (Table 1, Appendix Table 1). Black patients had fewer cancer diagnoses and the highest rate of prescribed opioids on admission. Asian patients were older and more likely to be female, and had higher rates of cancer, the highest median comorbidity index, and the smallest median daily MME during both the last 24 hours and total duration of hospitalization. Representative of general medicine patients, the most common principal discharge diagnoses in our dataset were pneumonia, cellulitis, altered mental status, sepsis, and abdominal pain.
Overall, 5541 (50.6%) patients who received opioids in the last 24 hours of their hospitalization received an opioid prescription at discharge. There were significant differences among racial/ethnic groups receiving an opioid prescription at discharge. Black patients were less likely to be discharged with an opioid compared with White patients (47.7% vs 50.3%; P < .001) (Table 2). The median discharge prescription duration for all patients was 9.3 days (interquartile range [IQR], 3.8-20.0). Black patients received the fewest median days of opioids at 7.5 days (IQR, 3.2-16.7) compared with White patients at 8.8 days (IQR, 3.7-20.0; P < .001) (Table 2).
Adjusted Regression Results
Demographic, clinical, and diagnosis specific factors were significantly associated with opioid prescriptions, including previous opioid use, sex, and a concurrent cancer diagnosis. There were fewer opioid prescriptions over time (Figure).
Following multivariable logistic regression for the association between race/ethnicity and opioid on discharge and controlling for covariates, we found that Black patients were less likely to receive an opioid prescription on discharge compared with White patients (predicted population rate, 47.6% vs 50.7%; AME −3.1%; 95% CI, −5.5% to −0.8%). Asian patients were more likely to receive a prescription on discharge compared with White patients (predicted population rate, 55.6% vs 50.7%; AME +4.9; 95% CI, 1.5%-8.3%).
Following multivariable negative binomial regression for the association between race/ethnicity and the number of opioid days on discharge, we found that Black patients received a shorter duration of opioid days compared with White patients (predicted days of opioids on discharge, 15.7 days vs 17.8 days; AME −2.1 days; 95% CI, −3.3 to −0.87) (Table 3). There were no significant differences among patients and the other racial/ethnic groups.
Our secondary analysis from the negative binomial regression with the days of opioids supplied metric yielded similar results to our primary analysis showing that Black patients received statically significantly fewer days of opioid therapy compared with White patients (Appendix Table 2).
Subgroup Regression Results
After testing for effect modification, which was negative, we examined the relationships for patients started on opioids during their hospitalization (Appendix Table 3 and Appendix Table 4). There were 5101 patients with newly prescribed opioids during their hospitalization. Adjusting for covariates, we found that Black patients were less likely to receive opioids at discharge compared with White patients (predicted population rate, 34.9% vs 40.4%; AME −5.5%; 95% CI, −9.2% to −1.9%). American Indian or Alaska Native patients were more likely to receive opioids on discharge (predicted population rate, 58.3% vs 40.4%; AME +17.9%; 95% CI, 1.0%-34.8%). We also found that Asian patients received more days of opioids on discharge (predicted days of opioid on discharge, 16.7 vs 13.7 days; AME +3.0 days; 95% CI, 0.6-5.3 days) (Appendix Table 4, Appendix Figure 2).
DISCUSSION
We found that Black patients discharged from the general medicine service were less likely to receive opioids and received shorter courses on discharge compared with White patients, adjusting for demographic, hospitalization, and medical diagnosis variables. Asian patients were more likely to receive an opioid prescription at discharge—a finding not reported in the literature on opioid prescribing disparities in most other practice settings.1
Previous studies have shown racial disparities in pain management in emergency and surgical settings, but these relationships have not been characterized in an inpatient medicine population. Medicine patients comprise the majority of admitted patients in the United States and reflect a wide diversity of medical conditions, many requiring opioids for pain management. Determining the etiology of these differential prescribing patterns was not within the scope of our study, but earlier studies demonstrate a number of reasons why these patterns exist across racial and ethnic groups in other practice settings.23,24 These reports give us insight into potential mechanisms for our study population.
Differences in pain management likely represent the multiple structural mechanisms by which racism operates.17 Drawing from the existing literature and the socioecological model, we hypothesize the ways that individual, interpersonal relationships, organizations, communities, and public policy impact opioid prescribing.25,26 Using this model and considering the framework of Critical Race Theory (CRT), we can work towards understanding how race and ethnicity stand in as surrogates for racism and how this manifests in different outcomes and identify areas for intervention. CRT draws attention to race consciousness, contemporary orientation, centering in the margins, and praxis. In the context of this analysis, we recognize race consciousness and the interactions among factors such as race/ethnicity, language, and diagnoses such as PTSD.27 This approach is necessary because racism is a multilevel construct influenced by macrolevel factors.28
Individually and interpersonally, there is clinician-driven bias in pain assessment, which is activated under times of stress and diagnostic uncertainty and is amplified by a lack of clear guidelines for pain management prescriptions.23,29-32 Institutional and organizational culture contribute to disparities through ingrained culture, practice patterns, and resource allocation.29,33 Last, public policy and the larger sociopolitical environment worsen disparities through nondiverse workforces, state and federal guidelines, criminal justice policy, supply chain regulation, and access to care.
As individual clinicians, departments, and health systems leaders, we must identify areas for intervention. At the individual and interpersonal levels, there is evidence that taking implicit association tests could help clinicians become more aware of their negative associations, and empathy-inducing, perspective-taking interventions can reduce pain treatment bias.31,34 At the institutional level, we must report data on disparities, create guidelines for pain management, and reevaluate the educational curriculum and culture to assess how certain biases could be propagated. The lack of straightforward guidelines leads to unclear indications for opioid prescriptions, exacerbating provider-level differences in prescribing. At the policy level, legislation that promotes workplace diversity, increases training for and access to pain specialists, and incentivizes data collection and reporting could help reduce disparities.35 Equitable access to prescriptions and care is essential. Pharmacies often understock opioids in minority neighborhoods, meaning that even if a patient is prescribed an opioid on discharge, he or she might have difficulty filling the prescription.36
One could question whether fewer opioid prescriptions for Black patients protects against the harms of opioid overprescribing, and therefore is not reflective of harmful inequity.37 Ongoing national programs aim to reduce the harmful effects of opioids, which is reflected in the reduction in opioid prescribing over time in our institution. Our point is that differences in prescribing could reflect practices that do result in patient harm, such as less adequately controlled pain among Black patients.1,3 Undertreated pain has negative health and social consequences and further contributes to substance-use stigma within minority communities.38 Moreover, Black people who describe more discrimination in medical settings were more likely to report subsequent opioid misuse.39
Although the above mechanisms might partially explain our findings among Black patients, the higher rate of prescribing for Asian patients is more challenging to explain. Our models adjusted for clinical factors. Notably, our Asian patients had the highest baseline comorbidity index, oldest mean age, and highest cancer rates, and it is possible that we were unable to fully account for illness severity or related pain needs (Table 1). It also is possible—although speculative—that factors such as language, provider concordance, and the type of disease process all contribute.40 Some researchers have proposed a “stereotype content model” that seeks to establish a pathway among social structure (status of a patient) to clinician stereotypes (is this patient warm and/or competent) to emotional prejudices (envy, pride) and ultimately to discrimination (active/passive, help/harm).23Our study has limitations. Our model was limited by the available data collected on our patients. Covariates including primary care follow-up, pain scores, and overdose history were not available. Furthermore, our categorization of race/ethnicity was based on self-reported data. We had 676 patients with race/ethnicity specified as other/unknown. We recognize the heterogeneity within these racial/ethnic categorizations. For example, within the LatinX or Asian communities, there are large differences based on region, country, ethnic, or cultural groups. Our study only included patients presenting to a hospital in San Francisco, which is different from the racial/ethnic makeup of other cities across the nation. Our electronic health record capture of history of opioid use disorder and mood disorders is contingent on individual clinician documentation. We did not account for provider-level differences, which is an important part of variation in prescribing differences. We also did not examine differences at the diagnosis-specific level. Finally, we could not determine the indication or appropriateness of opioid prescriptions.
Future studies will be necessary to characterize this relationship at a diagnosis-specific level and to describe causal pathways. Within our own institution, these findings present an opportunity for positive change. We hope to continue to explore the etiology of these disparities and identify areas where differences could impact patient outcomes, such as pain control. It is essential to develop appropriate recommendations for inpatient and discharge opioid prescribing to help minimize disparities and to mitigate potential harms of overprescribing. All health systems should continue to collect data on their own disparities in opioid prescribing and educate clinicians on promoting more equitable practices.
Acknowledgments
The authors thank Sneha Daya, MD, Sachin Shah, MD, MPH, and the UCSF Division of Hospital Medicine Data Core.
1. Romanelli RJ, Shen Z, Szwerinski N, Scott A, Lockhart S, Pressman AR. Racial and ethnic disparities in opioid prescribing for long bone fractures at discharge from the emergency department: a cross-sectional analysis of 22 centers from a health care delivery system in northern California. Ann Emerg Med. 2019;74(5):622-631. https://doi.org/10.1016/j.annemergmed.2019.05.018
2. Tamayo-Sarver JH, Hinze SW, Cydulka RK, Baker DW. Racial and ethnic disparities in emergency department analgesic prescription. Am J Public Health. 2003;93(12):2067-2073. https://doi.org/10.2105/ajph.93.12.2067
3. Berger AJ, Wang Y, Rowe C, Chung B, Chang S, Haleblian G. Racial disparities in analgesic use amongst patients presenting to the emergency department for kidney stones in the United States. Am J Emerg Med. 2021;39:71-74. https://doi.org/10.1016/j.ajem.2020.01.017
4. Dickason RM, Chauhan V, Mor A, et al. Racial differences in opiate administration for pain relief at an academic emergency department. West J Emerg Med. 2015;16(3):372-380. https://doi.org/10.5811/westjem.2015.3.23893
5. Singhal A, Tien Y-Y, Hsia RY. Racial-ethnic disparities in opioid prescriptions at emergency department visits for conditions commonly associated with prescription drug abuse. PloS One. 2016;11(8):e0159224. https://doi.org/10.1371/journal.pone.0159224
6. Green CR, Anderson KO, Baker TA, et al. The unequal burden of pain: confronting racial and ethnic disparities in pain. Pain Med Malden Mass. 2003;4(3):277-294. https://doi.org/10.1046/j.1526-4637.2003.03034.x
7. Hoffman KM, Trawalter S, Axt JR, Oliver MN. Racial bias in pain assessment and treatment recommendations, and false beliefs about biological differences between blacks and whites. Proc Natl Acad Sci U S A. 2016;113(16):4296-4301. https://doi.org/10.1073/pnas.1516047113
8. Anderson KO, Green CR, Payne R. Racial and ethnic disparities in pain: causes and consequences of unequal care. J Pain. 2009;10(12):1187-1204. https://doi.org/10.1016/j.jpain.2009.10.002
9. Cintron A, Morrison RS. Pain and ethnicity in the United States: a systematic review. J Palliat Med. 2006;9(6):1454-1473. https://doi.org/10.1089/jpm.2006.9.1454
10. Pletcher MJ, Kertesz SG, Kohn MA, Gonzales R. Trends in opioid prescribing by race/ethnicity for patients seeking care in US emergency departments. JAMA. 2008;299(1):70-78. https://doi.org/10.1001/jama.2007.64
11. Campbell CM, Edwards RR. Ethnic differences in pain and pain management. Pain Manag. 2012;2(3):219-230. https://doi.org/10.2217/pmt.12.7
12. Yawn BP, Buchanan GR, Afenyi-Annan AN, et al. Management of sickle cell disease: summary of the 2014 evidence-based report by expert panel members. JAMA. 2014;312(10):1033-1048. https://doi.org/10.1001/jama.2014.10517
13. Brown W. Opioid use in dying patients in hospice and hospital, with and without specialist palliative care team involvement. Eur J Cancer Care (Engl). 2008;17(1):65-71. https://doi.org/10.1111/j.1365-2354.2007.00810.x
14. Iverson N, Lau CY, Abe-Jones Y, et al. Evaluating a novel metric for personalized opioid prescribing after hospitalization: a retrospective cohort study. PloS One. 2020;15(12):e0244735. https://doi.org/ 10.1371/journal.pone.0244735
15. Howell J, Emerson MO. So what “ should ” we use? Evaluating the impact of five racial measures on markers of social inequality. Sociol Race Ethn (Thousand Oaks). 2017;3(1):14-30. https://doi.org/10.1177/2332649216648465
16. Kaplan JB, Bennett T. Use of race and ethnicity in biomedical publication. JAMA. 2003;289(20):2709-2716. https://doi.org/10.1001/jama.289.20.2709
17. Boyd RW, Lindo EG, Weeks LD, McLemore MR. On racism: a new standard for publishing on racial health inequities. Health Affairs. Published July 2, 2020. Accessed August 20, 2021. https://www.healthaffairs.org/do/10.1377/hblog20200630.939347/full
18. van Walraven C, Austin PC, Jennings A, Quan H, Forster AJ. A modification of the Elixhauser comorbidity measures into a point system for hospital death using administrative data. Med Care. 2009;47(6):626-633. https://doi.org/10.1097/MLR.0b013e31819432e5
19. Sun GW, Shook TL, Kay GL. Inappropriate use of bivariable analysis to screen risk factors for use in multivariable analysis. J Clin Epidemiol. 1996;49(8):907-916. https://doi.org/10.1016/0895-4356(96)00025-x
20. Norton EC, Dowd BE, Maciejewski ML. Marginal effects-quantifying the effect of changes in risk factors in logistic regression models. JAMA. 2019;321(13):1304-1305. https://doi.org/10.1001/jama.2019.1954
21. Zhang J, Yu KF. What’s the relative risk? A method of correcting the odds ratio in cohort studies of common outcomes. JAMA. 1998;280(19):1690-1691. https://doi.org/10.1001/jama.280.19.1690
22. Norton EC, Dowd BE. Log odds and the interpretation of logit models. Health Serv Res. 2018;53(2):859-878. https://doi.org/10.1111/1475-6773.12712
23. Dovidio JF, Fiske ST. Under the radar: how unexamined biases in decision-making processes in clinical interactions can contribute to health care disparities. Am J Public Health. 2012;102(5):945-952. https://doi.org/10.2105/AJPH.2011.300601
24. van Ryn M. Research on the provider contribution to race/ethnicity disparities in medical care. Med Care. 2002;40(1 Suppl):I140-151. https://doi.org/10.1097/00005650-200201001-00015
25. Krieger N. Theories for social epidemiology in the 21st century: an ecosocial perspective. Int J Epidemiol. 2001;30(4):668-677. https://doi.org/10.1093/ije/30.4.668
26. Golden SD, Earp JAL. Social ecological approaches to individuals and their contexts: twenty years of health education & behavior health promotion interventions. Health Educ Behav Off Publ Soc Public Health Educ. 2012;39(3):364-372. https://doi.org/10.1177/1090198111418634
27. Ford CL, Airhihenbuwa CO. Critical race theory, race equity, and public health: toward antiracism praxis. Am J Public Health. 2010;100 Suppl 1(Suppl 1):S30-5. https://doi.org/10.2105/AJPH.2009.171058
28. Ford CL, Daniel M, Earp JAL, Kaufman JS, Golin CE, Miller WC. Perceived everyday racism, residential segregation, and HIV testing among patients at a sexually transmitted disease clinic. Am J Public Health. 2009;99 Suppl 1:S137-143. https://doi.org/10.2105/AJPH.2007.120865
29. Hall WJ, Chapman MV, Lee KM, et al. Implicit racial/ethnic bias among health care professionals and its influence on health care outcomes: a systematic review. Am J Public Health. 2015;105(12):e60-76. https://doi.org/10.2105/AJPH.2015.302903
30. Staton LJ, Panda M, Chen I, et al. When race matters: disagreement in pain perception between patients and their physicians in primary care. J Natl Med Assoc. 2007;99(5):532-538.
31. Drwecki BB, Moore CF, Ward SE, Prkachin KM. Reducing racial disparities in pain treatment: the role of empathy and perspective-taking. Pain. 2011;152(5):1001-1006. https://doi.org/10.1016/j.pain.2010.12.005
32. Mende-Siedlecki P, Qu-Lee J, Backer R, Van Bavel JJ. Perceptual contributions to racial bias in pain recognition. J Exp Psychol Gen. 2019;148(5):863-889. https://doi.org/10.1037/xge0000600
33. King G. Institutional racism and the medical/health complex: a conceptual analysis. Ethn Dis. 1996;6(1-2):30-46.
34. Maina IW, Belton TD, Ginzberg S, Singh A, Johnson TJ. A decade of studying implicit racial/ethnic bias in healthcare providers using the implicit association test. Soc Sci Med. 2018;199:219-229. https://doi.org/10.1016/j.socscimed.2017.05.009
35. Meghani SH, Byun E, Gallagher RM. Time to take stock: a meta-analysis and systematic review of analgesic treatment disparities for pain in the United States. Pain Med. 2012;13(2):150-174. https://doi.org/10.1111/j.1526-4637.2011.01310.x
36. Morrison RS, Wallenstein S, Natale DK, Senzel RS, Huang LL. “We don’t carry that”—failure of pharmacies in predominantly nonwhite neighborhoods to stock opioid analgesics. N Engl J Med. 2000;342(14):1023-1026. https://doi.org/10.1056/NEJM200004063421406
37. Frakt A, Monkovic T. A ‘rare case where racial biases’ protected African-Americans. The New York Times. November 25, 2019. Updated December 2, 2019. Accessed July 5, 2021. https://www.nytimes.com/2019/11/25/upshot/opioid-epidemic-blacks.html
38. Khatri U, Shoshana Aronowitz S, South E. The opioid crisis shows why racism in health care is always harmful, never ‘protective’. The Philadelphia Inquirer. Updated December 26, 2019. Accessed July 5, 2021. https://www.inquirer.com/health/expert-opinions/opioid-crisis-racism-healthcare-buprenorphine-20191223.html
39. Swift SL, Glymour MM, Elfassy T, et al. Racial discrimination in medical care settings and opioid pain reliever misuse in a U.S. cohort: 1992 to 2015. PloS One. 2019;14(12):e0226490. https://journals.plos.org/plosone/article?id=10.1371/journal.pone.0226490
40. Hsieh AY, Tripp DA, Ji L-J. The influence of ethnic concordance and discordance on verbal reports and nonverbal behaviours of pain. Pain. 2011;152(9):2016-2022. https://doi.org/10.1016/j.pain.2011.04.023
© 2021 Society of Hospital Medicine
Tweeting Into the Void: Effective Use of Social Media for Healthcare Professionals
Communication has always played a central role in facilitating technological advances and social progress. The printing press, mail, telegraph, radio, television, electronic mail, and social media have all allowed for the exchange of ideas that led to progress, and have done so with increasing speed. But some people are beginning to question whether we are experiencing diminishing returns from making such communication easier, faster, and more widespread. Disinformation, conspiracies, inappropriate messages, and personal attacks are just as easy to communicate as truth, good ideas, and empathy. In many cases, truth and falsehood are nearly indistinguishable. Raw, nasty emotions contained in personal attacks are often provocative, thus generating even more engagement, which many people view as the purpose of social media. In this context, it is more important than ever for trusted voices, such as those of scientists and physicians, to play a role in the public sphere.
In this essay, we offer our personal recommendations on how healthcare professionals, who in our view have outsized authority and responsibility on healthcare topics, might improve communication on social media. We focus particularly on Twitter given its prominent role in the public exchange of ideas and its recognized benefits (and challenges) for scientific communication.1 We make these recommendations with some trepidation because we are sure readers will be able to find times when we have not followed our own advice. And we are sure many will disagree or feel that our advice raises the bar too high. We divide our recommendations into lists of Do’s and Don’ts. Let’s start with the Do’s.
DO
DO separate facts from inferences, ideally labeling them as such. For example, you can report that public health has found five cases of the delta variant in people in a specific nursing home as a fact. You might then infer that the variant is widespread in that facility, and that community spread in the region is likely. Stating the source of your facts helps the reader evaluate their reliability and precision.
DO state when you are quoting preliminary evidence. If posting a preprint, press release, or other non-peer-reviewed paper (even if it is your own!), make its preliminary status clear to the reader (Figure, part A).

DO read the full article before posting. If you are posting an article, make sure you understand the whole context of any results you are highlighting. Avoid exaggerating, fear-mongering, or selectively picking facts or results to bolster your opinion.DO seek to add value to the public discourse. Rather than simply retweeting popular posts, consider taking the time to collate evidence (including contrary evidence) into a thread if seeking to prove a point or to teach, especially when it relates to something in your field. You likely are more knowledgeable about topics in your field than 99% of readers; use Twitter to spread your expertise. Clinical “tweetorials,” such as those popularized by @tony_breu, can be very effective teaching tools (Figure, part B).
DO make recommendations as specific as possible. If your goal is to improve adherence to evidence-based medicine or support disadvantaged people, be explicit about how you would achieve these goals. Tell readers exactly what you have in mind so that individuals and leaders can operationalize the recommendations. Use threads to expand on your advice and its rationale.
DO consider engaging with misinformation. We suggest doing so if the misinformation is posted by someone prominent who is likely to have broad reach, but only once per post and in a factual manner. You are unlikely to convince persons who post disinformation that they are wrong; extended arguments are unhelpful. Your role here is simply to inform readers of the post, who may be more open to reason. Occasionally, you may even convince the initial poster, as seen in Figure, part C, to delete certain misinformation. But don’t count on it.
DO consider your obligation to the general public. It is fine to engage explicitly with the medical community (ie, through tweetchats),2 but also consider that your comments will be accessible to everyone. Now more than ever the public is looking to healthcare professionals for clarity, reassurance, and evidence about medical matters.
DO acknowledge when you were wrong. Update your opinions as facts change or when you realize you made a mistake. The COVID-19 pandemic has brought home the rapidity with which we can gain scientific knowledge. Many of the things we thought were right early on—and posted about on Twitter—we now know to be wrong. Be forthright about this, while making it clear that the fact that we know more now doesn’t mean no information can be trusted. (A corollary: Don’t overstate what we know to be true at any time, so that it does not feel as much of a surprise if we later learn more and need to revise an opinion or a statement.)
DO be kind. This is perhaps the most important thing. We are all experiencing stress as physicians, parents, children, and colleagues. Spend your time focusing on people’s actions rather than impugning their motives or intelligence. Most of the time you don’t really know what their motives are. We recognize that kindness may not generate the same amount of engagement as sarcasm, but at least take time to consider whether you want to be seen as mean-spirited forever.
DO pause before sending. Twitter creates a false perception of the need for speed (and doesn’t really lend itself to revising drafts). But in reality, there is no rush. The torrent of Twitter posts means that people typically only see what has been posted around the time they log in; an early post is not necessarily more likely to be noticed. So, take your time and avoid falling into a trap of writing something you will regret, or, in extreme cases, that will get you fired or otherwise ruin your career. There is no rush to be first; Twitter will still be there tomorrow.
DON’T
For some time, mentors have warned physicians (and others whose careers depend on their reputation) to be careful in their use of social media. Electronic dissemination of inappropriate words or images can come back to haunt people—sometimes immediately, sometimes many years later.3 Physicians are also at risk of falling into some pitfalls specific to the profession. That said, here are some Don’ts to avoid or be cautious about.
DON’T reveal information about patients in a recognizable fashion. Journals ask for written consent from patients when authors submit a manuscript about individual cases so readers can be sure consent has been obtained. The same standard should apply to social media; if not, you are clearly violating a professional standard. Yet, on Twitter, people may assume you have not obtained consent, conveying a false sense of invasion of privacy and undermining confidence in the profession. The safest thing to do is not tell stories about patients, or to completely disguise the story so even the patients can’t recognize themselves. If you do choose to post about a patient, obtain written permission that you save, and clearly indicate that you have that permission in the Tweet.
DON’T claim to have expertise in areas where you have little training or education. For example, just because you are an expert in critical care and have seen the ravages of COVID-19 on your patients doesn’t mean you are an expert in how to stop a pandemic, though your observations may be helpful to those who are. This does not mean you shouldn’t speak out on important moral issues like climate change, nuclear war, or injustices, which clearly reflect personal opinion and values. Rather, be cautious about commenting authoritatively on areas in which the lay reader might mistakenly think you have specific expertise.
DON’T make yourself the hero of every story. Implicitly seeking praise for doing your job (Look at me, I’m working on Christmas!) may breed resentment and undercut professionalism. Rather, state what it is about your job that works well and what doesn’t (for example, teaching tips, wellness advice, and organizational strategies) in a way that helps others emulate your successes.
DON’T let emotions get the better of you. This past year has been full of outrageous and appalling events and behavior. We do not suggest that you ignore these. Rather, make sure that if you are blaming an individual for something that it really was their fault, because they had control of the factors that led to the disastrous outcome. Consider focusing on systemic and structural explanations for unacceptable phenomena to minimize defensiveness and maximize the potential for identifying solutions. And yes, sometimes you just have to let it rip, but be selective—maybe show your post to someone else and sleep on it before you send it.
CONCLUSION
We hope that you will find these suggestions helpful in both creating and reading social media posts on important topics. We recognize that some people like the spontaneity of the social media platform and will thus find our suggestions stunting. But at least everyone ought to consider what they are trying to achieve when they make public statements. The exchange of ideas has always been a key ingredient in creating progress. Let’s optimize the usefulness of those exchanges for that purpose, and to promote knowledge and science in a way that helps us all live healthier and happier lives.
1. Choo EK, Ranney ML, Chan TM, et al. Twitter as a tool for communication and knowledge exchange in academic medicine: a guide for skeptics and novices. Med Teach. 2015;37(5):411-416. https://doi.org/10.3109/0142159X.2014.993371
2. Admon AJ, Kaul V, Cribbs SK, Guzman E, Jimenez O, Richards JB. Twelve tips for developing and implementing a medical education Twitter chat. Med Teach. 2020;42(5):500-506. https://doi.org/10.1080/0142159X.2019.1598553
3. Langenfeld SJ, Batra R. How can social media get us in trouble? Clin Colon Rectal Surg. 2017;30(4):264-269. https://doi.org/10.1055/s-0037-1604255
Communication has always played a central role in facilitating technological advances and social progress. The printing press, mail, telegraph, radio, television, electronic mail, and social media have all allowed for the exchange of ideas that led to progress, and have done so with increasing speed. But some people are beginning to question whether we are experiencing diminishing returns from making such communication easier, faster, and more widespread. Disinformation, conspiracies, inappropriate messages, and personal attacks are just as easy to communicate as truth, good ideas, and empathy. In many cases, truth and falsehood are nearly indistinguishable. Raw, nasty emotions contained in personal attacks are often provocative, thus generating even more engagement, which many people view as the purpose of social media. In this context, it is more important than ever for trusted voices, such as those of scientists and physicians, to play a role in the public sphere.
In this essay, we offer our personal recommendations on how healthcare professionals, who in our view have outsized authority and responsibility on healthcare topics, might improve communication on social media. We focus particularly on Twitter given its prominent role in the public exchange of ideas and its recognized benefits (and challenges) for scientific communication.1 We make these recommendations with some trepidation because we are sure readers will be able to find times when we have not followed our own advice. And we are sure many will disagree or feel that our advice raises the bar too high. We divide our recommendations into lists of Do’s and Don’ts. Let’s start with the Do’s.
DO
DO separate facts from inferences, ideally labeling them as such. For example, you can report that public health has found five cases of the delta variant in people in a specific nursing home as a fact. You might then infer that the variant is widespread in that facility, and that community spread in the region is likely. Stating the source of your facts helps the reader evaluate their reliability and precision.
DO state when you are quoting preliminary evidence. If posting a preprint, press release, or other non-peer-reviewed paper (even if it is your own!), make its preliminary status clear to the reader (Figure, part A).
DO read the full article before posting. If you are posting an article, make sure you understand the whole context of any results you are highlighting. Avoid exaggerating, fear-mongering, or selectively picking facts or results to bolster your opinion.DO seek to add value to the public discourse. Rather than simply retweeting popular posts, consider taking the time to collate evidence (including contrary evidence) into a thread if seeking to prove a point or to teach, especially when it relates to something in your field. You likely are more knowledgeable about topics in your field than 99% of readers; use Twitter to spread your expertise. Clinical “tweetorials,” such as those popularized by @tony_breu, can be very effective teaching tools (Figure, part B).
DO make recommendations as specific as possible. If your goal is to improve adherence to evidence-based medicine or support disadvantaged people, be explicit about how you would achieve these goals. Tell readers exactly what you have in mind so that individuals and leaders can operationalize the recommendations. Use threads to expand on your advice and its rationale.
DO consider engaging with misinformation. We suggest doing so if the misinformation is posted by someone prominent who is likely to have broad reach, but only once per post and in a factual manner. You are unlikely to convince persons who post disinformation that they are wrong; extended arguments are unhelpful. Your role here is simply to inform readers of the post, who may be more open to reason. Occasionally, you may even convince the initial poster, as seen in Figure, part C, to delete certain misinformation. But don’t count on it.
DO consider your obligation to the general public. It is fine to engage explicitly with the medical community (ie, through tweetchats),2 but also consider that your comments will be accessible to everyone. Now more than ever the public is looking to healthcare professionals for clarity, reassurance, and evidence about medical matters.
DO acknowledge when you were wrong. Update your opinions as facts change or when you realize you made a mistake. The COVID-19 pandemic has brought home the rapidity with which we can gain scientific knowledge. Many of the things we thought were right early on—and posted about on Twitter—we now know to be wrong. Be forthright about this, while making it clear that the fact that we know more now doesn’t mean no information can be trusted. (A corollary: Don’t overstate what we know to be true at any time, so that it does not feel as much of a surprise if we later learn more and need to revise an opinion or a statement.)
DO be kind. This is perhaps the most important thing. We are all experiencing stress as physicians, parents, children, and colleagues. Spend your time focusing on people’s actions rather than impugning their motives or intelligence. Most of the time you don’t really know what their motives are. We recognize that kindness may not generate the same amount of engagement as sarcasm, but at least take time to consider whether you want to be seen as mean-spirited forever.
DO pause before sending. Twitter creates a false perception of the need for speed (and doesn’t really lend itself to revising drafts). But in reality, there is no rush. The torrent of Twitter posts means that people typically only see what has been posted around the time they log in; an early post is not necessarily more likely to be noticed. So, take your time and avoid falling into a trap of writing something you will regret, or, in extreme cases, that will get you fired or otherwise ruin your career. There is no rush to be first; Twitter will still be there tomorrow.
DON’T
For some time, mentors have warned physicians (and others whose careers depend on their reputation) to be careful in their use of social media. Electronic dissemination of inappropriate words or images can come back to haunt people—sometimes immediately, sometimes many years later.3 Physicians are also at risk of falling into some pitfalls specific to the profession. That said, here are some Don’ts to avoid or be cautious about.
DON’T reveal information about patients in a recognizable fashion. Journals ask for written consent from patients when authors submit a manuscript about individual cases so readers can be sure consent has been obtained. The same standard should apply to social media; if not, you are clearly violating a professional standard. Yet, on Twitter, people may assume you have not obtained consent, conveying a false sense of invasion of privacy and undermining confidence in the profession. The safest thing to do is not tell stories about patients, or to completely disguise the story so even the patients can’t recognize themselves. If you do choose to post about a patient, obtain written permission that you save, and clearly indicate that you have that permission in the Tweet.
DON’T claim to have expertise in areas where you have little training or education. For example, just because you are an expert in critical care and have seen the ravages of COVID-19 on your patients doesn’t mean you are an expert in how to stop a pandemic, though your observations may be helpful to those who are. This does not mean you shouldn’t speak out on important moral issues like climate change, nuclear war, or injustices, which clearly reflect personal opinion and values. Rather, be cautious about commenting authoritatively on areas in which the lay reader might mistakenly think you have specific expertise.
DON’T make yourself the hero of every story. Implicitly seeking praise for doing your job (Look at me, I’m working on Christmas!) may breed resentment and undercut professionalism. Rather, state what it is about your job that works well and what doesn’t (for example, teaching tips, wellness advice, and organizational strategies) in a way that helps others emulate your successes.
DON’T let emotions get the better of you. This past year has been full of outrageous and appalling events and behavior. We do not suggest that you ignore these. Rather, make sure that if you are blaming an individual for something that it really was their fault, because they had control of the factors that led to the disastrous outcome. Consider focusing on systemic and structural explanations for unacceptable phenomena to minimize defensiveness and maximize the potential for identifying solutions. And yes, sometimes you just have to let it rip, but be selective—maybe show your post to someone else and sleep on it before you send it.
CONCLUSION
We hope that you will find these suggestions helpful in both creating and reading social media posts on important topics. We recognize that some people like the spontaneity of the social media platform and will thus find our suggestions stunting. But at least everyone ought to consider what they are trying to achieve when they make public statements. The exchange of ideas has always been a key ingredient in creating progress. Let’s optimize the usefulness of those exchanges for that purpose, and to promote knowledge and science in a way that helps us all live healthier and happier lives.
1. Choo EK, Ranney ML, Chan TM, et al. Twitter as a tool for communication and knowledge exchange in academic medicine: a guide for skeptics and novices. Med Teach. 2015;37(5):411-416. https://doi.org/10.3109/0142159X.2014.993371
2. Admon AJ, Kaul V, Cribbs SK, Guzman E, Jimenez O, Richards JB. Twelve tips for developing and implementing a medical education Twitter chat. Med Teach. 2020;42(5):500-506. https://doi.org/10.1080/0142159X.2019.1598553
3. Langenfeld SJ, Batra R. How can social media get us in trouble? Clin Colon Rectal Surg. 2017;30(4):264-269. https://doi.org/10.1055/s-0037-1604255
© 2021 Society of Hospital Medicine
Delving Deeper
This icon represents the patient’s case. Each paragraph that follows represents the discussant’s thoughts.
A 32-year-old, previously healthy woman presented to the emergency department (ED) with 3 days of nasal pain, congestion, and cough. A day prior, she had consulted with her primary care provider by phone and had been prescribed amoxicillin-clavulanate for presumed bacterial sinusitis. She subsequently developed fever (39 oC) and pleuritic, left-upper-quadrant abdominal pain. In the ED, chest radiograph demonstrated right hilar opacification. Laboratory studies and computed tomography (CT) of the abdomen and pelvis did not identify a cause for her pain. Given the pleuritic nature of her left-upper-quadrant pain, CT pulmonary angiography was ordered. The CT revealed “mass-like” right hilar opacification and lymphadenopathy. No pulmonary emboli were identified. Levofloxacin was prescribed for presumed pneumonia, and the patient was discharged home. The following week, mediastinal biopsy was arranged for evaluation of the right hilar abnormality.
This is a young woman presenting with upper respiratory symptoms, abdominal pain, fever, and hilar lymphadenopathy. Upper respiratory symptoms are common and usually indicate an inflammatory response to allergens or infection, though autoimmune disorders may affect the upper airways. Fever and hilar lymphadenopathy likely also signify an inflammatory response. Taken together, these findings can be associated with mycobacterial or fungal infection, malignancy, and, particularly in a young woman, sarcoidosis, which could explain her abdominal pain if her presentation included splenomegaly. At this point she likely has a systemic illness involving at least the upper, and possibly the lower, respiratory tract.
Within days, her symptoms resolved. Mediastinal biopsy of the hilar node revealed scant pus. Pathology demonstrated suppurative granulomata. Gram stain; bacterial, mycobacterial, and fungal cultures; and 16S ribosomal analyses for bacteria and fungi from the biopsy were unrevealing. For unclear reasons, prior to the biopsy, she was given intramuscular Haemophilus influenzae type B and tetanus, diphtheria, and pertussis vaccines. Two weeks later, she presented again with fever and left-upper-quadrant pain as well as painful skin nodules at her biopsy and vaccination sites. She was admitted for further evaluation. Chest CT showed expansion of the mediastinal lesion and splenic enlargement. Biopsy of a skin lesion revealed suppurative granulomatous dermatitis and panniculitis. Repeat blood cultures were negative, though serum β-D-glucan was weakly positive at 173 pg/mL (reference range, <60 pg/mL). Tissue cultures and Gram, acid-fast, Fite, and Warthin-Starry stains from the skin biopsy were negative. She was discharged on fluconazole and then readmitted 2 days later with dyspnea, fever, and leukocytosis.
The young woman’s symptoms resolved, only to recur days later; her granulomatous hilar lesions grew larger, and new cutaneous and splenic findings appeared. The granulomatous lesions prompt consideration of infectious, malignant, and immune-mediated processes. The negative cultures make infection less likely, although the elevated β-D-glucan may suggest fungal infection. By description, the skin lesions are consistent with pathergy, a phenomenon characterized by trauma-provoked cutaneous lesions or ulcers, which is associated with numerous syndromes, including Behçet syndrome, inflammatory bowel disease, and neutrophilic dermatoses such as pyoderma gangrenosum (PG) and Sweet syndrome. In addition to details about her medical history, it is important to seek evidence of oral ulcers or vasculitis, as Behçet syndrome may be associated with cutaneous, visceral, and ophthalmologic vasculitis.
Her medical history included hypertension and active, 10-pack-year cigarette use. During childhood, she had occasional ingrown hairs and folliculitis. She did not take medications prior to this acute illness. Family history was notable for cardiovascular disease. She rarely consumed alcohol and did not use illicit drugs. She lived in a rural town in the mid–Willamette Valley of Oregon and worked as an administrative assistant. She spent time outdoors, including trail running and golfing. A case of tularemia was recently reported in an area near her home. Her only travel outside of Oregon was to Puerto Vallarta, Mexico, 16 years previously. She grew up on a farm and had no known tuberculosis exposure.
Tularemia is an interesting diagnostic consideration and could explain her fever, cutaneous lesions, and hilar adenopathy. It is plausible that she had clinically mild pneumonic tularemia at the outset and that her cutaneous lesions are variants of ulceroglandular tularemia. Positive antibodies for Francisella tularensis would be expected if this were the cause of her illness. The ingrown hairs raise the possibility of a primary immune deficiency syndrome predisposing her to abscesses. However, they seem to have been of trivial significance to her, making an immune deficiency syndrome unlikely.
On readmission, she was afebrile, normotensive, and tachycardic (114 beats/min), with a normal respiratory rate and oxygen saturation. She was not ill appearing. She had noninjected conjunctiva and no oral lesions. Apart from tachycardia, cardiovascular examination was unremarkable. Abdominal examination was notable for mild distension and a palpable, tender spleen. Musculoskeletal and neurologic examinations were normal. Her skin was notable for various sized (8 cm × 4 cm to 10 cm × 15 cm) painful ulcers with violaceous, friable borders—some with fluctuance and purulent drainage—on her right hand, bilateral arms, right axilla, sternum, and legs (Figure 1).

Laboratory studies were notable for normocytic anemia (hemoglobin, 8.9 g/dL; range, 12.0-16.0 g/dL), leukocytosis (white blood cells, 24,900/µL; range, 4500-11,000/µL), thrombocytosis (platelet count, 690,000/µL; range, 150,000-400,000/µL), and elevated inflammatory markers (C-reactive protein, 33 mg/dL; range, <0.5 mg/dL; erythrocyte sedimentation rate, 78 mm/h; range, <20 mm/h). A complete metabolic panel was within normal limits. Repeat blood cultures and β -D-glucan and 16S ribosomal assays were negative. Polymerase chain reaction testing for Bartonella henselae was negative. Urine probes for Neisseria gonorrhoeae and Chlamydia trachomatis were negative. Rapid plasma regain (RPR) was negative. Antibodies to toxoplasmosis, histoplasmosis, blastomycosis, and aspergillosis were unrevealing. A Coccidioides test by immunodiffusion was negative. Serum antigen tests for Cryptococcus and Epstein-Barr virus (EBV) were negative. EBV, HIV, and hepatitis antibody tests were negative. Rheumatologic studies, including antinuclear, anti-double-stranded DNA, anti-Smith, anti–Sjögren syndrome antigens A and B, anticentromere, anti-topoisomerase (anti-Scl-70), anti-histidyl-transfer-RNA-synthetase (anti-Jo-1), and anti-nucleosome (anti-chromatic) antibodies, were unrevealing. Levels of angiotensin-converting enzyme, rheumatoid factor, complement, cytoplasmic, and perinuclear antineutrophil cytoplasmic antibodies were also normal. A neutrophil oxidative burst test was negative. In addition, peripheral flow cytology and serum and urine protein electrophoresis were negative. Chest CT revealed bilateral lower lobe consolidations concerning for necrotizing pneumonia, splenic enlargement, numerous hypodense splenic lesions, and a 1.3-cm right hilar node, which had decreased in size compared with 1 month prior.
In summary, the patient presented with recurrent upper respiratory symptoms, fever, and abdominal pain; expanding granulomatous hilar lesions, splenomegaly, and cutaneous lesions consistent with pathergy; elevated inflammatory markers and leukocytosis; and a possible exposure to F tularensis. She has had extensive negative infectious workups, except for a weakly positive β-D-glucan, and completed several courses of apparently unhelpful antimicrobials. At this point, the most notable findings are her splenomegaly and inflammatory masses suggesting an inflammatory process, which may be autoimmune in nature. Both vasculitis and sarcoidosis remain possibilities, and malignancy is possible. Given her possible exposure to F tularensis, obtaining serum antibodies to F tularensis, in addition to biopsies of the skin lesions, is advisable.
Laboratory studies revealed a positive F tularensis antibody with a titer of 1:320 and an IgM of 7 U/mL and IgG of 30 U/mL. This was repeated, revealing a titer of 1:540 and an IgM and IgG of 5 U/mL and 20 U/mL, respectively. Given the potential exposure history, the clinical syndrome compatible with tularemia, and an otherwise extensive yet unrevealing evaluation, she was treated with a 10-day course of streptomycin. Her fever persisted, and the splenic lesions increased in size and number, prompting addition of moxifloxacin without apparent benefit. Skin biopsies taken from the patient’s arm were notable for nodular, suppurative, neutrophilic infiltrates and histiocytes in the medium and deep dermis without multinucleated histiocytes or evidence of vasculitis. Fungal, mycobacterial, and bacterial stains from the biopsy were negative. The findings were consistent with but not diagnostic of an acute neutrophilic dermatosis.
At this point, the patient has a confirmed exposure to F tularensis; she also has persistent fever, progressive splenomegaly, and new skin biopsies consistent with neutrophilic dermatosis. Despite the F tularensis antibody positivity, her negative cultures and lack of improvement with multiple courses of antimicrobials argue against an infectious etiology. Accordingly, malignancy should be considered but seems less likely given that no laboratory, imaging, or tissue samples support it. This leaves immune-mediated etiologies, especially autoimmune conditions associated with neutrophilic dermatoses, as the most likely explanation of her inflammatory syndrome. Neutrophilic dermatoses include some vasculitides, Sweet syndrome, PG, Behçet syndrome, and other inflammatory entities. She has no evidence of vasculitis on biopsy. Given the evidence of inflammation and the history of pathergy, Behçet syndrome and PG should be seriously considered.
She underwent incision and drainage of the left leg and mediastinal lesions. A follow-up chest CT revealed stable cutaneous and deep tissue lesions and continued splenic enlargement. She was started on prednisone and dapsone for presumed cutaneous and visceral PG. The lesions improved dramatically and, following a month-long hospitalization, she was discharged on dapsone and a slow prednisone taper. Three weeks after discharge, while on dapsone and prednisone, she developed a new skin lesion. Cyclosporine was added, with improvement. Eight weeks after discharge, she developed fever, acute left-upper-quadrant pain, and marked splenomegaly with abscesses seen on CT imaging (Figure 2).

This continues to be a very puzzling case, and it is worth revisiting her clinical course once again. This is a previously healthy 32-year-old woman with multiple hospital presentations for upper-respiratory symptoms, persistent fever, abdominal pain, and painful cutaneous lesions consistent with pathergy; she was found to have granulomatous hilar lesions, progressive splenomegaly, and skin biopsies consistent with neutrophilic dermatosis. Exhaustive infectious and rheumatologic workup was negative, and no evident malignancy was found. Finally, despite multiple courses of antimicrobials, including standard treatments for tularemia (for which she had positive antibodies), her clinical course failed to improve until the addition of systemic anti-inflammatory agents, which resulted in rapid improvement. She then presented 8 weeks later with recurrent fever and splenomegaly. Given the recurrence and the severity of the splenic pathology, a diagnostic splenectomy is advisable for what appears to be visceral PG. In addition, attempting to identify a trigger of her syndrome is important. PG can be associated with inflammatory bowel disease, hematologic disorders (eg, leukemia, myeloma, myelodysplastic syndrome, and myelofibrosis), and autoimmune diseases, especially inflammatory arthritis.1 Therefore, a diagnostic colonoscopy and bone marrow biopsy should be considered. With no history or examination supporting inflammatory arthritis and a broad, unrevealing workup, her rheumatologic evaluation is sufficient.
The patient underwent splenectomy. Gross description of the spleen was notable for multiple abscesses, consisting on microscopy of large areas of necrosis with islands of dense neutrophil collections (Figure 3). Microscopic examination failed to demonstrate microorganisms on multiple stains, and there was no microscopic or flow cytometric evidence of lymphoma. The final pathologic diagnosis was multiple sterile splenic abscesses with siderosis, which, in the context of her overall syndrome, was consistent with an entity termed aseptic abscess syndrome (AAS). After discharge, she underwent a slow steroid taper and was ultimately maintained on daily low-dose prednisone. Cyclosporine and dapsone were discontinued in favor of infliximab infusions. She underwent additional diagnostic workup, including an unremarkable colonoscopy and a bone marrow biopsy, which showed monoclonal gammopathy of undetermined significance (MGUS) with an insignificant IgA monoclonal gammopathy. All cutaneous lesions healed. Three years after the splenectomy, while still on infliximab and prednisone, she developed a new aseptic lung abscess, which resolved after increasing her prednisone dose. Six years after splenectomy, she developed an aseptic liver abscess, which resolved after again increasing the frequency of her infliximab infusions.

DISCUSSION
Diagnostic uncertainty is an intrinsic feature of medical practice—in part because patients often present with undifferentiated and evolving symptoms.2 When faced with uncertainty, clinicians are well served by prioritizing a thoughtful differential diagnosis, adopting a stepwise management strategy, and engaging in iterative reassessments of the patient. In this case, a 32-year-old, previously healthy woman presented with an array of symptoms, including abdominal pain, fever, leukocytosis, necrotic skin lesions, necrotizing mediastinal lymphadenitis, pathergy, and splenomegaly. Elements of the history, examination, and diagnostic studies supported a differential diagnosis of tularemia, PG, and AAS. Through stepwise management and ongoing reassessment, she was ultimately diagnosed with AAS.
Tularemia was initially an important diagnostic consideration in this patient, given her potential exposure and positive F tularensis serum antibodies. Francisella tularensis is a Gram-negative coccobacillus found in more than 250 species of fish, ticks, birds, and mammals. In humans, an incubation period of 3 to 5 days is typical. Although clinical manifestations vary, they often include fever, headache, and malaise.3 Other findings may include lymphadenopathy with or without ulcerative cutaneous lesions (glandular or ulceroglandular tularemia) and cough, dyspnea, pleuritic chest pain, and hilar adenopathy (pneumonic tularemia). As noted by the discussant, a pneumonic tularemia syndrome could have explained this patient’s fever, respiratory symptoms, and hilar adenopathy; ulceroglandular tularemia might have explained her cutaneous lesions. Since splenomegaly may be seen in tularemia, this finding was also consistent with the diagnosis. Serum antibody testing is supportive of the diagnosis, while culture confirms it. Standard treatment consists of a 10- to 14-day course of streptomycin, and combination therapy with a fluoroquinolone is recommended in severe cases.4 In this patient, however, F tularensis was not demonstrated on culture. Furthermore, she did not experience the expected clinical improvement with treatment. Finally, because both IgG and IgM tularemia antibodies may co-occur up to 10 years following infection, her positive F tularensis serum antibodies did not provide evidence of acute infection.5
Recognizing inconsistencies in the diagnosis of tularemia, the focus shifted to PG owing to the patient’s neutrophilic cutaneous lesions, negative infectious workup, and pathergy. Pyoderma gangrenosum is a neutrophilic dermatosis—one of a heterogeneous group of skin conditions characterized by perivascular and diffuse neutrophilic infiltrates without an identifiable infectious agent.6 It is a chronic, recurrent cutaneous disease with several variants.7 The classic presentation includes painful lower-extremity ulcers with violaceous undermined borders and may be associated with pathergy. Guiding principles for the management of PG include controlling inflammation, optimizing wound healing, and minimizing exacerbating factors.1 As such, treatment mainstays include local and systemic anti-inflammatory agents and wound care. As the discussant highlighted, in this case the inflammatory skin lesions were suggestive of PG. However, other features of the case, notably, splenomegaly, splenic abscesses, and necrotizing mediastinal lymphadenitis, were more consistent with another diagnosis: AAS. Aseptic abscess syndrome is an autoinflammatory disorder defined by deep, noninfectious abscesses that preferentially affect the spleen.8 Additional clinical manifestations include weight loss, fever, abdominal pain, and leukocytosis. Lesions may also affect bone, kidney, liver, lung, lymph node, and skin. In one case series, neutrophilic dermatoses were seen in 20% of AAS cases.8 In all cases of AAS, extensive infectious workup is unrevealing, and antibiotics are ineffective. The pathophysiology of AAS is unknown.
Similar to PG, the majority of AAS cases are associated with inflammatory bowel disease, especially Crohn disease.9 However, AAS also has associations with conditions such as MGUS, rheumatoid arthritis, spondyloarthritis, and relapsing polychondritis. Histologically, early lesions demonstrate a necrotic core of neutrophils, with or without surrounding palisading histiocytes, and giant cells. In older lesions, neutrophils may be absent; fibrous tissue may be present.8 Treatment regimens include splenectomy, corticosteroids, colchicine, thalidomide, tumor necrosis factor (TNF) antagonists, and cyclophosphamide. The discussant astutely recommended a splenectomy for this patient, which was both diagnostic and therapeutic. As in this case, relapse is common. Optimal maintenance therapy is yet to be determined.9
Given the overlapping clinical manifestations, shared disease associations, and similar responsiveness to immunosuppression, it is unclear whether AAS represents a new disease entity or a variant of known autoinflammatory disorders. Aseptic abscess syndrome is likely part of a spectrum of autoinflammatory disorders with inflammatory bowel diseases, neutrophilic dermatoses, and other similar diseases.8 While infectious visceral abscesses remain more common, this case highlights the clinical manifestation of an emerging and likely underrecognized entity.
TEACHING POINTS
- Aseptic abscess syndrome should be considered in patients who present with visceral (particularly splenic) abscesses and negative infectious workup.
- Aseptic abscess syndrome is commonly associated with other autoinflammatory disorders; the majority of reported cases are associated with inflammatory bowel disease, especially Crohn disease.
- Up to 20% of AAS cases are associated with neutrophilic dermatoses such as PG.
- The initial treatment for this syndrome is high-dose intravenous glucocorticoids; maintenance treatment regimens include corticosteroids, colchicine, thalidomide, TNF antagonists, and cyclophosphamide.
Acknowledgments
The authors would thank Dr Bob Pelz and Dr John Townes for their contributions to the case.
1. Ahronowitz I, Harp J, Shinkai K. Etiology and management of pyoderma gangrenosum: a comprehensive review. Am J Clin Dermatol. 2012;13(3):191-211. https://doi.org/10.2165/11595240-000000000-00000
2. Bhise V, Rajan SS, Sittig DF, Morgan RO, Chaudhary P, Singh H. Defining and measuring diagnostic uncertainty in medicine: a systematic review. J Gen Intern Med. 2018;33(1):103-115. https://doi.org/10.1007/s11606-017-4164-1
3. Penn RL. Francisella tualerensis (Tularemia). In: Bennett JE, Dolin R, Blaser MJ, eds. Mandell, Douglas, and Bennett’s Principles and Practice of Infectious Diseases. 8th ed. Elsevier Saunders; 2015:2590-2602.
4. Eliasson H, Broman T, Forsman M, Bäck E. Tularemia: current epidemiology and disease management. Infect Dis Clin North Am. 2006;20(2):289-311. https://doi.org/10.1016/j.idc.2006.03.002
5. Bevanger L, Maeland JA, Kvan AI. Comparative analysis of antibodies to Francisella tularensis antigens during the acute phase of tularemia and eight years later. Clin Diagn Lab Immunol. 1994;1(2):238-240.
6. Moschella SL, Davis MDP. Neutrophilic dermatoses. In: Bolognia JL, Jorizzo JL, Schaffer JV, eds. Dermatology. 3rd ed. Saunders; 2012:424-438.
7. Dabade TS, Davis MDP. Diagnosis and treatment of the neutrophilic dermatoses (pyoderma gangrenosum, Sweet’s syndrome). Dermatol Ther. 2011;24(2):273-284. https://doi/org/10.1111/j.1529-8019.2011.01403.x
8. André MFJ, Piette JC, Kémény JL, et al. Aseptic abscesses: a study of 30 patients with or without inflammatory bowel disease and review of the literature. Medicine (Baltimore). 2007;86(3):145-161. https://doi/org/10.1097/md.0b013e18064f9f3
9. Fillman H, Riquelme P, Sullivan PD, Mansoor AM. Aseptic abscess syndrome. BMJ Case Rep. 2020;13(10):e236437. https://doi.org/10.1136/bcr-2020-236437
This icon represents the patient’s case. Each paragraph that follows represents the discussant’s thoughts.
A 32-year-old, previously healthy woman presented to the emergency department (ED) with 3 days of nasal pain, congestion, and cough. A day prior, she had consulted with her primary care provider by phone and had been prescribed amoxicillin-clavulanate for presumed bacterial sinusitis. She subsequently developed fever (39 oC) and pleuritic, left-upper-quadrant abdominal pain. In the ED, chest radiograph demonstrated right hilar opacification. Laboratory studies and computed tomography (CT) of the abdomen and pelvis did not identify a cause for her pain. Given the pleuritic nature of her left-upper-quadrant pain, CT pulmonary angiography was ordered. The CT revealed “mass-like” right hilar opacification and lymphadenopathy. No pulmonary emboli were identified. Levofloxacin was prescribed for presumed pneumonia, and the patient was discharged home. The following week, mediastinal biopsy was arranged for evaluation of the right hilar abnormality.
This is a young woman presenting with upper respiratory symptoms, abdominal pain, fever, and hilar lymphadenopathy. Upper respiratory symptoms are common and usually indicate an inflammatory response to allergens or infection, though autoimmune disorders may affect the upper airways. Fever and hilar lymphadenopathy likely also signify an inflammatory response. Taken together, these findings can be associated with mycobacterial or fungal infection, malignancy, and, particularly in a young woman, sarcoidosis, which could explain her abdominal pain if her presentation included splenomegaly. At this point she likely has a systemic illness involving at least the upper, and possibly the lower, respiratory tract.
Within days, her symptoms resolved. Mediastinal biopsy of the hilar node revealed scant pus. Pathology demonstrated suppurative granulomata. Gram stain; bacterial, mycobacterial, and fungal cultures; and 16S ribosomal analyses for bacteria and fungi from the biopsy were unrevealing. For unclear reasons, prior to the biopsy, she was given intramuscular Haemophilus influenzae type B and tetanus, diphtheria, and pertussis vaccines. Two weeks later, she presented again with fever and left-upper-quadrant pain as well as painful skin nodules at her biopsy and vaccination sites. She was admitted for further evaluation. Chest CT showed expansion of the mediastinal lesion and splenic enlargement. Biopsy of a skin lesion revealed suppurative granulomatous dermatitis and panniculitis. Repeat blood cultures were negative, though serum β-D-glucan was weakly positive at 173 pg/mL (reference range, <60 pg/mL). Tissue cultures and Gram, acid-fast, Fite, and Warthin-Starry stains from the skin biopsy were negative. She was discharged on fluconazole and then readmitted 2 days later with dyspnea, fever, and leukocytosis.
The young woman’s symptoms resolved, only to recur days later; her granulomatous hilar lesions grew larger, and new cutaneous and splenic findings appeared. The granulomatous lesions prompt consideration of infectious, malignant, and immune-mediated processes. The negative cultures make infection less likely, although the elevated β-D-glucan may suggest fungal infection. By description, the skin lesions are consistent with pathergy, a phenomenon characterized by trauma-provoked cutaneous lesions or ulcers, which is associated with numerous syndromes, including Behçet syndrome, inflammatory bowel disease, and neutrophilic dermatoses such as pyoderma gangrenosum (PG) and Sweet syndrome. In addition to details about her medical history, it is important to seek evidence of oral ulcers or vasculitis, as Behçet syndrome may be associated with cutaneous, visceral, and ophthalmologic vasculitis.
Her medical history included hypertension and active, 10-pack-year cigarette use. During childhood, she had occasional ingrown hairs and folliculitis. She did not take medications prior to this acute illness. Family history was notable for cardiovascular disease. She rarely consumed alcohol and did not use illicit drugs. She lived in a rural town in the mid–Willamette Valley of Oregon and worked as an administrative assistant. She spent time outdoors, including trail running and golfing. A case of tularemia was recently reported in an area near her home. Her only travel outside of Oregon was to Puerto Vallarta, Mexico, 16 years previously. She grew up on a farm and had no known tuberculosis exposure.
Tularemia is an interesting diagnostic consideration and could explain her fever, cutaneous lesions, and hilar adenopathy. It is plausible that she had clinically mild pneumonic tularemia at the outset and that her cutaneous lesions are variants of ulceroglandular tularemia. Positive antibodies for Francisella tularensis would be expected if this were the cause of her illness. The ingrown hairs raise the possibility of a primary immune deficiency syndrome predisposing her to abscesses. However, they seem to have been of trivial significance to her, making an immune deficiency syndrome unlikely.
On readmission, she was afebrile, normotensive, and tachycardic (114 beats/min), with a normal respiratory rate and oxygen saturation. She was not ill appearing. She had noninjected conjunctiva and no oral lesions. Apart from tachycardia, cardiovascular examination was unremarkable. Abdominal examination was notable for mild distension and a palpable, tender spleen. Musculoskeletal and neurologic examinations were normal. Her skin was notable for various sized (8 cm × 4 cm to 10 cm × 15 cm) painful ulcers with violaceous, friable borders—some with fluctuance and purulent drainage—on her right hand, bilateral arms, right axilla, sternum, and legs (Figure 1).
Laboratory studies were notable for normocytic anemia (hemoglobin, 8.9 g/dL; range, 12.0-16.0 g/dL), leukocytosis (white blood cells, 24,900/µL; range, 4500-11,000/µL), thrombocytosis (platelet count, 690,000/µL; range, 150,000-400,000/µL), and elevated inflammatory markers (C-reactive protein, 33 mg/dL; range, <0.5 mg/dL; erythrocyte sedimentation rate, 78 mm/h; range, <20 mm/h). A complete metabolic panel was within normal limits. Repeat blood cultures and β -D-glucan and 16S ribosomal assays were negative. Polymerase chain reaction testing for Bartonella henselae was negative. Urine probes for Neisseria gonorrhoeae and Chlamydia trachomatis were negative. Rapid plasma regain (RPR) was negative. Antibodies to toxoplasmosis, histoplasmosis, blastomycosis, and aspergillosis were unrevealing. A Coccidioides test by immunodiffusion was negative. Serum antigen tests for Cryptococcus and Epstein-Barr virus (EBV) were negative. EBV, HIV, and hepatitis antibody tests were negative. Rheumatologic studies, including antinuclear, anti-double-stranded DNA, anti-Smith, anti–Sjögren syndrome antigens A and B, anticentromere, anti-topoisomerase (anti-Scl-70), anti-histidyl-transfer-RNA-synthetase (anti-Jo-1), and anti-nucleosome (anti-chromatic) antibodies, were unrevealing. Levels of angiotensin-converting enzyme, rheumatoid factor, complement, cytoplasmic, and perinuclear antineutrophil cytoplasmic antibodies were also normal. A neutrophil oxidative burst test was negative. In addition, peripheral flow cytology and serum and urine protein electrophoresis were negative. Chest CT revealed bilateral lower lobe consolidations concerning for necrotizing pneumonia, splenic enlargement, numerous hypodense splenic lesions, and a 1.3-cm right hilar node, which had decreased in size compared with 1 month prior.
In summary, the patient presented with recurrent upper respiratory symptoms, fever, and abdominal pain; expanding granulomatous hilar lesions, splenomegaly, and cutaneous lesions consistent with pathergy; elevated inflammatory markers and leukocytosis; and a possible exposure to F tularensis. She has had extensive negative infectious workups, except for a weakly positive β-D-glucan, and completed several courses of apparently unhelpful antimicrobials. At this point, the most notable findings are her splenomegaly and inflammatory masses suggesting an inflammatory process, which may be autoimmune in nature. Both vasculitis and sarcoidosis remain possibilities, and malignancy is possible. Given her possible exposure to F tularensis, obtaining serum antibodies to F tularensis, in addition to biopsies of the skin lesions, is advisable.
Laboratory studies revealed a positive F tularensis antibody with a titer of 1:320 and an IgM of 7 U/mL and IgG of 30 U/mL. This was repeated, revealing a titer of 1:540 and an IgM and IgG of 5 U/mL and 20 U/mL, respectively. Given the potential exposure history, the clinical syndrome compatible with tularemia, and an otherwise extensive yet unrevealing evaluation, she was treated with a 10-day course of streptomycin. Her fever persisted, and the splenic lesions increased in size and number, prompting addition of moxifloxacin without apparent benefit. Skin biopsies taken from the patient’s arm were notable for nodular, suppurative, neutrophilic infiltrates and histiocytes in the medium and deep dermis without multinucleated histiocytes or evidence of vasculitis. Fungal, mycobacterial, and bacterial stains from the biopsy were negative. The findings were consistent with but not diagnostic of an acute neutrophilic dermatosis.
At this point, the patient has a confirmed exposure to F tularensis; she also has persistent fever, progressive splenomegaly, and new skin biopsies consistent with neutrophilic dermatosis. Despite the F tularensis antibody positivity, her negative cultures and lack of improvement with multiple courses of antimicrobials argue against an infectious etiology. Accordingly, malignancy should be considered but seems less likely given that no laboratory, imaging, or tissue samples support it. This leaves immune-mediated etiologies, especially autoimmune conditions associated with neutrophilic dermatoses, as the most likely explanation of her inflammatory syndrome. Neutrophilic dermatoses include some vasculitides, Sweet syndrome, PG, Behçet syndrome, and other inflammatory entities. She has no evidence of vasculitis on biopsy. Given the evidence of inflammation and the history of pathergy, Behçet syndrome and PG should be seriously considered.
She underwent incision and drainage of the left leg and mediastinal lesions. A follow-up chest CT revealed stable cutaneous and deep tissue lesions and continued splenic enlargement. She was started on prednisone and dapsone for presumed cutaneous and visceral PG. The lesions improved dramatically and, following a month-long hospitalization, she was discharged on dapsone and a slow prednisone taper. Three weeks after discharge, while on dapsone and prednisone, she developed a new skin lesion. Cyclosporine was added, with improvement. Eight weeks after discharge, she developed fever, acute left-upper-quadrant pain, and marked splenomegaly with abscesses seen on CT imaging (Figure 2).
This continues to be a very puzzling case, and it is worth revisiting her clinical course once again. This is a previously healthy 32-year-old woman with multiple hospital presentations for upper-respiratory symptoms, persistent fever, abdominal pain, and painful cutaneous lesions consistent with pathergy; she was found to have granulomatous hilar lesions, progressive splenomegaly, and skin biopsies consistent with neutrophilic dermatosis. Exhaustive infectious and rheumatologic workup was negative, and no evident malignancy was found. Finally, despite multiple courses of antimicrobials, including standard treatments for tularemia (for which she had positive antibodies), her clinical course failed to improve until the addition of systemic anti-inflammatory agents, which resulted in rapid improvement. She then presented 8 weeks later with recurrent fever and splenomegaly. Given the recurrence and the severity of the splenic pathology, a diagnostic splenectomy is advisable for what appears to be visceral PG. In addition, attempting to identify a trigger of her syndrome is important. PG can be associated with inflammatory bowel disease, hematologic disorders (eg, leukemia, myeloma, myelodysplastic syndrome, and myelofibrosis), and autoimmune diseases, especially inflammatory arthritis.1 Therefore, a diagnostic colonoscopy and bone marrow biopsy should be considered. With no history or examination supporting inflammatory arthritis and a broad, unrevealing workup, her rheumatologic evaluation is sufficient.
The patient underwent splenectomy. Gross description of the spleen was notable for multiple abscesses, consisting on microscopy of large areas of necrosis with islands of dense neutrophil collections (Figure 3). Microscopic examination failed to demonstrate microorganisms on multiple stains, and there was no microscopic or flow cytometric evidence of lymphoma. The final pathologic diagnosis was multiple sterile splenic abscesses with siderosis, which, in the context of her overall syndrome, was consistent with an entity termed aseptic abscess syndrome (AAS). After discharge, she underwent a slow steroid taper and was ultimately maintained on daily low-dose prednisone. Cyclosporine and dapsone were discontinued in favor of infliximab infusions. She underwent additional diagnostic workup, including an unremarkable colonoscopy and a bone marrow biopsy, which showed monoclonal gammopathy of undetermined significance (MGUS) with an insignificant IgA monoclonal gammopathy. All cutaneous lesions healed. Three years after the splenectomy, while still on infliximab and prednisone, she developed a new aseptic lung abscess, which resolved after increasing her prednisone dose. Six years after splenectomy, she developed an aseptic liver abscess, which resolved after again increasing the frequency of her infliximab infusions.
DISCUSSION
Diagnostic uncertainty is an intrinsic feature of medical practice—in part because patients often present with undifferentiated and evolving symptoms.2 When faced with uncertainty, clinicians are well served by prioritizing a thoughtful differential diagnosis, adopting a stepwise management strategy, and engaging in iterative reassessments of the patient. In this case, a 32-year-old, previously healthy woman presented with an array of symptoms, including abdominal pain, fever, leukocytosis, necrotic skin lesions, necrotizing mediastinal lymphadenitis, pathergy, and splenomegaly. Elements of the history, examination, and diagnostic studies supported a differential diagnosis of tularemia, PG, and AAS. Through stepwise management and ongoing reassessment, she was ultimately diagnosed with AAS.
Tularemia was initially an important diagnostic consideration in this patient, given her potential exposure and positive F tularensis serum antibodies. Francisella tularensis is a Gram-negative coccobacillus found in more than 250 species of fish, ticks, birds, and mammals. In humans, an incubation period of 3 to 5 days is typical. Although clinical manifestations vary, they often include fever, headache, and malaise.3 Other findings may include lymphadenopathy with or without ulcerative cutaneous lesions (glandular or ulceroglandular tularemia) and cough, dyspnea, pleuritic chest pain, and hilar adenopathy (pneumonic tularemia). As noted by the discussant, a pneumonic tularemia syndrome could have explained this patient’s fever, respiratory symptoms, and hilar adenopathy; ulceroglandular tularemia might have explained her cutaneous lesions. Since splenomegaly may be seen in tularemia, this finding was also consistent with the diagnosis. Serum antibody testing is supportive of the diagnosis, while culture confirms it. Standard treatment consists of a 10- to 14-day course of streptomycin, and combination therapy with a fluoroquinolone is recommended in severe cases.4 In this patient, however, F tularensis was not demonstrated on culture. Furthermore, she did not experience the expected clinical improvement with treatment. Finally, because both IgG and IgM tularemia antibodies may co-occur up to 10 years following infection, her positive F tularensis serum antibodies did not provide evidence of acute infection.5
Recognizing inconsistencies in the diagnosis of tularemia, the focus shifted to PG owing to the patient’s neutrophilic cutaneous lesions, negative infectious workup, and pathergy. Pyoderma gangrenosum is a neutrophilic dermatosis—one of a heterogeneous group of skin conditions characterized by perivascular and diffuse neutrophilic infiltrates without an identifiable infectious agent.6 It is a chronic, recurrent cutaneous disease with several variants.7 The classic presentation includes painful lower-extremity ulcers with violaceous undermined borders and may be associated with pathergy. Guiding principles for the management of PG include controlling inflammation, optimizing wound healing, and minimizing exacerbating factors.1 As such, treatment mainstays include local and systemic anti-inflammatory agents and wound care. As the discussant highlighted, in this case the inflammatory skin lesions were suggestive of PG. However, other features of the case, notably, splenomegaly, splenic abscesses, and necrotizing mediastinal lymphadenitis, were more consistent with another diagnosis: AAS. Aseptic abscess syndrome is an autoinflammatory disorder defined by deep, noninfectious abscesses that preferentially affect the spleen.8 Additional clinical manifestations include weight loss, fever, abdominal pain, and leukocytosis. Lesions may also affect bone, kidney, liver, lung, lymph node, and skin. In one case series, neutrophilic dermatoses were seen in 20% of AAS cases.8 In all cases of AAS, extensive infectious workup is unrevealing, and antibiotics are ineffective. The pathophysiology of AAS is unknown.
Similar to PG, the majority of AAS cases are associated with inflammatory bowel disease, especially Crohn disease.9 However, AAS also has associations with conditions such as MGUS, rheumatoid arthritis, spondyloarthritis, and relapsing polychondritis. Histologically, early lesions demonstrate a necrotic core of neutrophils, with or without surrounding palisading histiocytes, and giant cells. In older lesions, neutrophils may be absent; fibrous tissue may be present.8 Treatment regimens include splenectomy, corticosteroids, colchicine, thalidomide, tumor necrosis factor (TNF) antagonists, and cyclophosphamide. The discussant astutely recommended a splenectomy for this patient, which was both diagnostic and therapeutic. As in this case, relapse is common. Optimal maintenance therapy is yet to be determined.9
Given the overlapping clinical manifestations, shared disease associations, and similar responsiveness to immunosuppression, it is unclear whether AAS represents a new disease entity or a variant of known autoinflammatory disorders. Aseptic abscess syndrome is likely part of a spectrum of autoinflammatory disorders with inflammatory bowel diseases, neutrophilic dermatoses, and other similar diseases.8 While infectious visceral abscesses remain more common, this case highlights the clinical manifestation of an emerging and likely underrecognized entity.
TEACHING POINTS
- Aseptic abscess syndrome should be considered in patients who present with visceral (particularly splenic) abscesses and negative infectious workup.
- Aseptic abscess syndrome is commonly associated with other autoinflammatory disorders; the majority of reported cases are associated with inflammatory bowel disease, especially Crohn disease.
- Up to 20% of AAS cases are associated with neutrophilic dermatoses such as PG.
- The initial treatment for this syndrome is high-dose intravenous glucocorticoids; maintenance treatment regimens include corticosteroids, colchicine, thalidomide, TNF antagonists, and cyclophosphamide.
Acknowledgments
The authors would thank Dr Bob Pelz and Dr John Townes for their contributions to the case.
1. Ahronowitz I, Harp J, Shinkai K. Etiology and management of pyoderma gangrenosum: a comprehensive review. Am J Clin Dermatol. 2012;13(3):191-211. https://doi.org/10.2165/11595240-000000000-00000
2. Bhise V, Rajan SS, Sittig DF, Morgan RO, Chaudhary P, Singh H. Defining and measuring diagnostic uncertainty in medicine: a systematic review. J Gen Intern Med. 2018;33(1):103-115. https://doi.org/10.1007/s11606-017-4164-1
3. Penn RL. Francisella tualerensis (Tularemia). In: Bennett JE, Dolin R, Blaser MJ, eds. Mandell, Douglas, and Bennett’s Principles and Practice of Infectious Diseases. 8th ed. Elsevier Saunders; 2015:2590-2602.
4. Eliasson H, Broman T, Forsman M, Bäck E. Tularemia: current epidemiology and disease management. Infect Dis Clin North Am. 2006;20(2):289-311. https://doi.org/10.1016/j.idc.2006.03.002
5. Bevanger L, Maeland JA, Kvan AI. Comparative analysis of antibodies to Francisella tularensis antigens during the acute phase of tularemia and eight years later. Clin Diagn Lab Immunol. 1994;1(2):238-240.
6. Moschella SL, Davis MDP. Neutrophilic dermatoses. In: Bolognia JL, Jorizzo JL, Schaffer JV, eds. Dermatology. 3rd ed. Saunders; 2012:424-438.
7. Dabade TS, Davis MDP. Diagnosis and treatment of the neutrophilic dermatoses (pyoderma gangrenosum, Sweet’s syndrome). Dermatol Ther. 2011;24(2):273-284. https://doi/org/10.1111/j.1529-8019.2011.01403.x
8. André MFJ, Piette JC, Kémény JL, et al. Aseptic abscesses: a study of 30 patients with or without inflammatory bowel disease and review of the literature. Medicine (Baltimore). 2007;86(3):145-161. https://doi/org/10.1097/md.0b013e18064f9f3
9. Fillman H, Riquelme P, Sullivan PD, Mansoor AM. Aseptic abscess syndrome. BMJ Case Rep. 2020;13(10):e236437. https://doi.org/10.1136/bcr-2020-236437
© 2021 Society of Hospital Medicine