User login
Mood stabilizers: Balancing tolerability, serum levels, and dosage

Mr. B, age 32, was diagnosed with bipolar disorder 10 years ago after experiencing a manic episode that resulted in his first psychiatric hospitalization. He was prescribed quetiapine, 400 mg/d, and remained stable for the next several years. Unfortunately, Mr. B developed significant metabolic adverse effects, including diabetes and a 30-pound weight gain, so he was switched from quetiapine to lithium. Mr. B was unable to tolerate the sedation and cognitive effects of lithium, and the dose could not be titrated to within the therapeutic window. As a result, Mr. B experienced a moderate depressive episode. His current clinician would like to initiate lamotrigine at a starting dose of 25 mg/d. Mr. B has not had a manic episode since the index hospitalization, and this is his first depressive episode.
The term “mood stabilizer” has come to refer to medications that treat a depressive and/or manic episode without inducing the other. In conventional terms, it refers to non-antipsychotic medications such as lithium, divalproex, and lamotrigine. Except for lithium, mood stabilizers are also antiepileptic drugs (AEDs). The role of AEDs for treating psychiatric conditions was discovered after they were originally FDA-approved for treating seizures. Following this discovery, the recommended doses and therapeutic ranges for these agents when applied to psychiatric treatment fell into a gray area.
Every patient is different and requires an individualized treatment plan, but this often leaves the clinician wondering, “How high is too high for this mood stabilizer?” or “My patient is responding well, but could a higher dose be even more effective?” In the case of Mr. B, who has trialed 2 medications with poor tolerability, how high can the lamotrigine dose be titrated to achieve a therapeutic response without adverse effects? The literature on this topic does not provide an exact answer, but does shed some light on key considerations for such decisions.
Which mood stabilizers are recommended?
One of the most recently updated guidelines for the treatment of bipolar disorder was released in 2018 by the Canadian Network for Mood and Anxiety Treatments (CANMAT).1 Lithium, divalproex, and lamotrigine were each recommended as a first-line option for treating bipolar disorder. For lithium and divalproex, the CANMAT guidelines recommend serum level monitoring for efficacy and tolerability; however, they do not recommend serum level monitoring for lamotrigine. Lithium and divalproex each have safety and tolerability concerns, particularly when selected for maintenance therapy, whereas lamotrigine is typically much better tolerated.1 Divalproex and lithium can cause weight gain, gastrointestinal adverse effects (nausea, vomiting, diarrhea), and tremor. Additional tolerability concerns with lithium include renal toxicity, electrocardiogram abnormalities, hypothyroidism, cognitive impairment, and dermatologic reactions. Divalproex can produce greater levels of sedation and may impact reproductive function (oligomenorrhea or hyperandrogenism). One of the most common adverse effects of lamotrigine is a non-serious rash; however, slow dose titration is necessary to decrease the risk of a serious, life-threatening rash such as Stevens-Johnson syndrome.
Lithium
Lithium continues to be regarded as a gold-standard therapy for bipolar disorder. The exact serum levels corresponding to efficacy and tolerability vary. The Lithiumeter: Version 2.0 is a schematic that incorporates the various levels recommended by different clinical guidelines.2 The recommended serum levels range from 0.6 to 1.0 mEq/L for mania and 0.4 to 0.8 mEq/L for depression.2 One of the main issues with lithium dosing is balancing a therapeutic level with tolerability and toxicity. Toxicity may begin when lithium levels exceed 1.2 mEq/L, and levels >2.0 mEq/L can be lethal. Signs of acute toxicity include tremor, headache, arrhythmia, nausea, vomiting, diarrhea, polyuria, and polydipsia. Conversely, chronic lithium use may lead to chronic toxicity as patients age and their physical health changes. Signs of chronic toxicity include ataxia, confusion, renal dysfunction, and tremor. There is no “one size fits all” when it comes to lithium dosing. Individualized dosing is necessary to balance efficacy and tolerability.
Divalproex
Divalproex was initially studied for use as an AED, and its therapeutic levels as an AED are not the same as those indicated for bipolar disorder. Generally, patients with bipolar disorder require a divalproex serum level >50 µg/mL. Ranges closer to 100 µg/mL have been found to be most effective for treating acute mania.3 A loading dose of 20 to 30 mg/kg/d can be administered to help achieve mood stabilization. Again, efficacy must be balanced against toxicity. The maximum dose of divalproex is 60 mg/kg/d, which is rarely seen in psychiatric practice. Early studies of divalproex found adverse effects greatest in individuals with plasma levels >100 µg/mL. Reported adverse effects included alopecia, weight gain, tremor, and mental status changes.4
Lamotrigine
Unlike lithium and divalproex, lamotrigine therapeutic drug monitoring is not common. The accepted therapeutic reference range (TRR) for lamotrigine as an AED is 3,000 to 14,000 ng/mL. Unholzer et al5 evaluated the dose and TRR for individuals with bipolar disorder treated with lamotrigine. No statistically significant difference in lamotrigine serum levels was found in responders vs nonresponders.5 Most patients were prescribed ≤200 mg/d; however, some were prescribed higher doses. The maximum dose recommended when lamotrigine is used as an AED is 400 mg/d; however, this study furthered the evidence that lower doses tend to be effective in bipolar disorder.
Continue to: CASE
CASE CONTINUED
It has been 3 months since Mr. B was initiated on lamotrigine, and he has since been titrated to his current, stable dose of 100 mg/d. Mr. B is no longer experiencing the sedation he had with lithium and has the energy to commit to an exercise routine. This has allowed him to lose 15 pounds so far and greatly improve control of his diabetes.

Dosage summary
Most available evidence supports dosing lithium and divalproex to effect, typically seen between 0.6 to 1.0 mEq/L and 50 to 125 µg/mL, respectively. Higher plasma levels tend to correspond to more adverse effects and toxicity. Lamotrigine does not have such a narrow therapeutic window. Lamotrigine for psychiatric treatment yields greatest efficacy at approximately 200 mg/d, but doses can be increased if warranted, which could be the case in Mr. B.

Table 11-5 outlines dosing strategies and therapeutic serum levels for lithium, divalproex, and lamotrigine. Table 22 lists signs and symptoms of lithium toxicity, and Table 31,2 describes strategies for managing adverse effects of lithium and divalproex.

1. Yatham LN, Kennedy SH, Parikh SV, et al. Canadian Network for Mood and Anxiety Treatments (CANMAT) and International Society for Bipolar Disorders (ISBD) 2018 guidelines for the management of patients with bipolar disorder. Bipolar Disord. 2018;20(2):97-170.
2. Malhi GS, Gershon S, Outhred T. Lithiumeter: version 2.0. Bipolar Disord. 2016;18(8):631-641.
3. Allen MH, Hirschfeld RM, Wozniak PJ, et al. Linear relationship of valproate serum concentration to response and optimal serum levels for acute mania. Am J Psychiatry. 2006;163(2):272-275.
4. Turnbull DM, Rawlins MD, Weightman D, et al. Plasma concentrations of sodium valproate: their clinical value. Ann Neurol. 1983;14(1):38-42.
5. Unholzer S, Haen E. Retrospective analysis of therapeutic drug monitoring data for treatment of bipolar disorder with lamotrigine. Pharmacopsychiatry. 2015;48(7):296.
Mr. B, age 32, was diagnosed with bipolar disorder 10 years ago after experiencing a manic episode that resulted in his first psychiatric hospitalization. He was prescribed quetiapine, 400 mg/d, and remained stable for the next several years. Unfortunately, Mr. B developed significant metabolic adverse effects, including diabetes and a 30-pound weight gain, so he was switched from quetiapine to lithium. Mr. B was unable to tolerate the sedation and cognitive effects of lithium, and the dose could not be titrated to within the therapeutic window. As a result, Mr. B experienced a moderate depressive episode. His current clinician would like to initiate lamotrigine at a starting dose of 25 mg/d. Mr. B has not had a manic episode since the index hospitalization, and this is his first depressive episode.
The term “mood stabilizer” has come to refer to medications that treat a depressive and/or manic episode without inducing the other. In conventional terms, it refers to non-antipsychotic medications such as lithium, divalproex, and lamotrigine. Except for lithium, mood stabilizers are also antiepileptic drugs (AEDs). The role of AEDs for treating psychiatric conditions was discovered after they were originally FDA-approved for treating seizures. Following this discovery, the recommended doses and therapeutic ranges for these agents when applied to psychiatric treatment fell into a gray area.
Every patient is different and requires an individualized treatment plan, but this often leaves the clinician wondering, “How high is too high for this mood stabilizer?” or “My patient is responding well, but could a higher dose be even more effective?” In the case of Mr. B, who has trialed 2 medications with poor tolerability, how high can the lamotrigine dose be titrated to achieve a therapeutic response without adverse effects? The literature on this topic does not provide an exact answer, but does shed some light on key considerations for such decisions.
Which mood stabilizers are recommended?
One of the most recently updated guidelines for the treatment of bipolar disorder was released in 2018 by the Canadian Network for Mood and Anxiety Treatments (CANMAT).1 Lithium, divalproex, and lamotrigine were each recommended as a first-line option for treating bipolar disorder. For lithium and divalproex, the CANMAT guidelines recommend serum level monitoring for efficacy and tolerability; however, they do not recommend serum level monitoring for lamotrigine. Lithium and divalproex each have safety and tolerability concerns, particularly when selected for maintenance therapy, whereas lamotrigine is typically much better tolerated.1 Divalproex and lithium can cause weight gain, gastrointestinal adverse effects (nausea, vomiting, diarrhea), and tremor. Additional tolerability concerns with lithium include renal toxicity, electrocardiogram abnormalities, hypothyroidism, cognitive impairment, and dermatologic reactions. Divalproex can produce greater levels of sedation and may impact reproductive function (oligomenorrhea or hyperandrogenism). One of the most common adverse effects of lamotrigine is a non-serious rash; however, slow dose titration is necessary to decrease the risk of a serious, life-threatening rash such as Stevens-Johnson syndrome.
Lithium
Lithium continues to be regarded as a gold-standard therapy for bipolar disorder. The exact serum levels corresponding to efficacy and tolerability vary. The Lithiumeter: Version 2.0 is a schematic that incorporates the various levels recommended by different clinical guidelines.2 The recommended serum levels range from 0.6 to 1.0 mEq/L for mania and 0.4 to 0.8 mEq/L for depression.2 One of the main issues with lithium dosing is balancing a therapeutic level with tolerability and toxicity. Toxicity may begin when lithium levels exceed 1.2 mEq/L, and levels >2.0 mEq/L can be lethal. Signs of acute toxicity include tremor, headache, arrhythmia, nausea, vomiting, diarrhea, polyuria, and polydipsia. Conversely, chronic lithium use may lead to chronic toxicity as patients age and their physical health changes. Signs of chronic toxicity include ataxia, confusion, renal dysfunction, and tremor. There is no “one size fits all” when it comes to lithium dosing. Individualized dosing is necessary to balance efficacy and tolerability.
Divalproex
Divalproex was initially studied for use as an AED, and its therapeutic levels as an AED are not the same as those indicated for bipolar disorder. Generally, patients with bipolar disorder require a divalproex serum level >50 µg/mL. Ranges closer to 100 µg/mL have been found to be most effective for treating acute mania.3 A loading dose of 20 to 30 mg/kg/d can be administered to help achieve mood stabilization. Again, efficacy must be balanced against toxicity. The maximum dose of divalproex is 60 mg/kg/d, which is rarely seen in psychiatric practice. Early studies of divalproex found adverse effects greatest in individuals with plasma levels >100 µg/mL. Reported adverse effects included alopecia, weight gain, tremor, and mental status changes.4
Lamotrigine
Unlike lithium and divalproex, lamotrigine therapeutic drug monitoring is not common. The accepted therapeutic reference range (TRR) for lamotrigine as an AED is 3,000 to 14,000 ng/mL. Unholzer et al5 evaluated the dose and TRR for individuals with bipolar disorder treated with lamotrigine. No statistically significant difference in lamotrigine serum levels was found in responders vs nonresponders.5 Most patients were prescribed ≤200 mg/d; however, some were prescribed higher doses. The maximum dose recommended when lamotrigine is used as an AED is 400 mg/d; however, this study furthered the evidence that lower doses tend to be effective in bipolar disorder.
Continue to: CASE
CASE CONTINUED
It has been 3 months since Mr. B was initiated on lamotrigine, and he has since been titrated to his current, stable dose of 100 mg/d. Mr. B is no longer experiencing the sedation he had with lithium and has the energy to commit to an exercise routine. This has allowed him to lose 15 pounds so far and greatly improve control of his diabetes.
Dosage summary
Most available evidence supports dosing lithium and divalproex to effect, typically seen between 0.6 to 1.0 mEq/L and 50 to 125 µg/mL, respectively. Higher plasma levels tend to correspond to more adverse effects and toxicity. Lamotrigine does not have such a narrow therapeutic window. Lamotrigine for psychiatric treatment yields greatest efficacy at approximately 200 mg/d, but doses can be increased if warranted, which could be the case in Mr. B.
Table 11-5 outlines dosing strategies and therapeutic serum levels for lithium, divalproex, and lamotrigine. Table 22 lists signs and symptoms of lithium toxicity, and Table 31,2 describes strategies for managing adverse effects of lithium and divalproex.
1. Yatham LN, Kennedy SH, Parikh SV, et al. Canadian Network for Mood and Anxiety Treatments (CANMAT) and International Society for Bipolar Disorders (ISBD) 2018 guidelines for the management of patients with bipolar disorder. Bipolar Disord. 2018;20(2):97-170.
2. Malhi GS, Gershon S, Outhred T. Lithiumeter: version 2.0. Bipolar Disord. 2016;18(8):631-641.
3. Allen MH, Hirschfeld RM, Wozniak PJ, et al. Linear relationship of valproate serum concentration to response and optimal serum levels for acute mania. Am J Psychiatry. 2006;163(2):272-275.
4. Turnbull DM, Rawlins MD, Weightman D, et al. Plasma concentrations of sodium valproate: their clinical value. Ann Neurol. 1983;14(1):38-42.
5. Unholzer S, Haen E. Retrospective analysis of therapeutic drug monitoring data for treatment of bipolar disorder with lamotrigine. Pharmacopsychiatry. 2015;48(7):296.

COVID-19’s impact on internet gaming disorder among children and adolescents
The impact of the COVID-19 pandemic on the well-being of youth has been significant. Its possible effects range from boredom, depression, anxiety, and suicidal ideation to potential increased rates of internet gaming disorder (IGD), which may have worsened during a nationwide shutdown and extended period of limited social interactions. Presently, there is a paucity of research on the impact of internet gaming on children and adolescents’ mental health and well-being during COVID-19. This article aims to bring awareness to the possible rising impact of the COVID-19 pandemic on IGD and mental health in youth.
Gaming offers benefits—and risks
The gaming industry has grown immensely over the past several years. While many businesses were impacted negatively during the pandemic, the gaming industry grew. It was estimated to be worth $159.3 billion in 2020, an increase of 9.3% from 2019.1
Stay-at-home orders and quarantine protocols during the COVID-19 pandemic have significantly disrupted normal activities, resulting in increased time for digital entertainment, including online gaming and related activities. Internet gaming offers some benefits for children and adolescents, including socialization and connection with peers, which was especially important for avoiding isolation during the pandemic. Empirical evidence of the positive effects of internet gaming can be seen in studies of youth undergoing chemotherapy, those receiving psychotherapy for anxiety or depression, and those having emotional and behavioral problems.2 Internet gaming also provides participants with a platform to communicate with the outside world while maintaining social distancing, and might reduce anxiety, and in some cases, depression.3
Despite these benefits, for some youth, excessive internet gaming can have adverse effects. Due to its addictive properties, internet gaming can be dangerous for vulnerable individuals and lead to unhealthy habits, such as disturbed sleep patterns and increased anxiety.4 In a cross-sectional study conducted in China, Yu et al5 examined the association between IGD and suicidal ideation. They concluded that IGD was positively associated with insomnia and then depression, which in turn contributed to suicide ideation.5 A study based on a survey conducted in Iran from May to August 2020 in individuals age 13 to 18 years found that depression, anxiety, and stress were significant mediators in the association between IGD and self-reported quality of life.2
Internet gaming disorder is included in DSM-5 as a “condition for further study” and in ICD-11.6 Before the COVID-19 pandemic, a study of 1,178 American youth age 8 to 18 years revealed that 8.5% of gamers met the criteria for IGD.7 In a meta-analysis that included 16 studies, the pooled prevalence of IGD among adolescents was 4.6%.8 Some countries, including China and South Korea, have developed treatment plans for IGD,6 but in the United States treatment guidelines have not been established due to insufficient evidence.9
The COVID-19 pandemic has likely led to an increased number of children and adolescents with IGD and its adverse effects on their mental health and well-being. It remains to be seen whether these youth will improve as the pandemic resolves and they resume normal activities, or if impairments will persist.
In conclusion, while internet gaming during the COVID-19 pandemic has provided benefits for many children and adolescents, the negative impact for those who develop IGD may be significant. We should be prepared to detect and address the needs of these youth and their families. Additional research is needed on the post-pandemic prevalence of IGD, its impact on youth mental health, and treatment strategies.
1. WePC. Video game industry statistics, trends and data in 2021. Accessed June 7, 2021. https://www.wepc.com/news/video-game-statistics/
2. Fazeli S, Mohammadi Zeidi I, Lin CY, et al. Depression, anxiety, and stress mediate the associations between internet gaming disorder, insomnia, and quality of life during the COVID-19 outbreak. Addict Behav Rep. 2020;12:100307. doi: 10.1016/j.abrep.2020.100307
3. Özçetin M, Gümüstas F, Çag˘ Y, et al. The relationships between video game experience and cognitive abilities in adolescents. Neuropsychiatr Dis Treat. 2019;15:1171-1180. doi: 10.2147/NDT.S206271
4. Männikkö N, Ruotsalainen H, Miettunen J, et al. Problematic gaming behaviour and health-related outcomes: a systematic review and meta-analysis. J Health Psychol. 2020;25(1):67-81. doi: 10.1177/1359105317740414
5. Yu Y, Yang X, Wang S, et al. Serial multiple mediation of the association between internet gaming disorder and suicidal ideation by insomnia and depression in adolescents in Shanghai, China. BMC Psychiatry. 2020;20(1):460. doi: 10.1186/s12888-020-02870-zz
6. American Psychiatric Association. Internet gaming. Published June 2018. Accessed June 7, 2021. www.psychiatry.org/patients-families/internet-gaming
7. Gentile D. Pathological video-game use among youth ages 8 to 18: a national study. Psychol Sci. 2009;20(5):594-602. doi: 10.1111/j.1467-9280.2009.02340.x
8. Fam JY. Prevalence of internet gaming disorder in adolescents: A meta-analysis across three decades. Scand J Psychol. 2018;59(5):524-531. doi: 10.1111/sjop.12459
9. Gentile DA, Bailey K, Bavelier D, et al. Internet gaming disorder in children and adolescents. Pediatrics. 2017;140(suppl 2):S81-S85. doi: 10.1542/peds.2016-1758H
The impact of the COVID-19 pandemic on the well-being of youth has been significant. Its possible effects range from boredom, depression, anxiety, and suicidal ideation to potential increased rates of internet gaming disorder (IGD), which may have worsened during a nationwide shutdown and extended period of limited social interactions. Presently, there is a paucity of research on the impact of internet gaming on children and adolescents’ mental health and well-being during COVID-19. This article aims to bring awareness to the possible rising impact of the COVID-19 pandemic on IGD and mental health in youth.
Gaming offers benefits—and risks
The gaming industry has grown immensely over the past several years. While many businesses were impacted negatively during the pandemic, the gaming industry grew. It was estimated to be worth $159.3 billion in 2020, an increase of 9.3% from 2019.1
Stay-at-home orders and quarantine protocols during the COVID-19 pandemic have significantly disrupted normal activities, resulting in increased time for digital entertainment, including online gaming and related activities. Internet gaming offers some benefits for children and adolescents, including socialization and connection with peers, which was especially important for avoiding isolation during the pandemic. Empirical evidence of the positive effects of internet gaming can be seen in studies of youth undergoing chemotherapy, those receiving psychotherapy for anxiety or depression, and those having emotional and behavioral problems.2 Internet gaming also provides participants with a platform to communicate with the outside world while maintaining social distancing, and might reduce anxiety, and in some cases, depression.3
Despite these benefits, for some youth, excessive internet gaming can have adverse effects. Due to its addictive properties, internet gaming can be dangerous for vulnerable individuals and lead to unhealthy habits, such as disturbed sleep patterns and increased anxiety.4 In a cross-sectional study conducted in China, Yu et al5 examined the association between IGD and suicidal ideation. They concluded that IGD was positively associated with insomnia and then depression, which in turn contributed to suicide ideation.5 A study based on a survey conducted in Iran from May to August 2020 in individuals age 13 to 18 years found that depression, anxiety, and stress were significant mediators in the association between IGD and self-reported quality of life.2
Internet gaming disorder is included in DSM-5 as a “condition for further study” and in ICD-11.6 Before the COVID-19 pandemic, a study of 1,178 American youth age 8 to 18 years revealed that 8.5% of gamers met the criteria for IGD.7 In a meta-analysis that included 16 studies, the pooled prevalence of IGD among adolescents was 4.6%.8 Some countries, including China and South Korea, have developed treatment plans for IGD,6 but in the United States treatment guidelines have not been established due to insufficient evidence.9
The COVID-19 pandemic has likely led to an increased number of children and adolescents with IGD and its adverse effects on their mental health and well-being. It remains to be seen whether these youth will improve as the pandemic resolves and they resume normal activities, or if impairments will persist.
In conclusion, while internet gaming during the COVID-19 pandemic has provided benefits for many children and adolescents, the negative impact for those who develop IGD may be significant. We should be prepared to detect and address the needs of these youth and their families. Additional research is needed on the post-pandemic prevalence of IGD, its impact on youth mental health, and treatment strategies.
1. WePC. Video game industry statistics, trends and data in 2021. Accessed June 7, 2021. https://www.wepc.com/news/video-game-statistics/
2. Fazeli S, Mohammadi Zeidi I, Lin CY, et al. Depression, anxiety, and stress mediate the associations between internet gaming disorder, insomnia, and quality of life during the COVID-19 outbreak. Addict Behav Rep. 2020;12:100307. doi: 10.1016/j.abrep.2020.100307
3. Özçetin M, Gümüstas F, Çag˘ Y, et al. The relationships between video game experience and cognitive abilities in adolescents. Neuropsychiatr Dis Treat. 2019;15:1171-1180. doi: 10.2147/NDT.S206271
4. Männikkö N, Ruotsalainen H, Miettunen J, et al. Problematic gaming behaviour and health-related outcomes: a systematic review and meta-analysis. J Health Psychol. 2020;25(1):67-81. doi: 10.1177/1359105317740414
5. Yu Y, Yang X, Wang S, et al. Serial multiple mediation of the association between internet gaming disorder and suicidal ideation by insomnia and depression in adolescents in Shanghai, China. BMC Psychiatry. 2020;20(1):460. doi: 10.1186/s12888-020-02870-zz
6. American Psychiatric Association. Internet gaming. Published June 2018. Accessed June 7, 2021. www.psychiatry.org/patients-families/internet-gaming
7. Gentile D. Pathological video-game use among youth ages 8 to 18: a national study. Psychol Sci. 2009;20(5):594-602. doi: 10.1111/j.1467-9280.2009.02340.x
8. Fam JY. Prevalence of internet gaming disorder in adolescents: A meta-analysis across three decades. Scand J Psychol. 2018;59(5):524-531. doi: 10.1111/sjop.12459
9. Gentile DA, Bailey K, Bavelier D, et al. Internet gaming disorder in children and adolescents. Pediatrics. 2017;140(suppl 2):S81-S85. doi: 10.1542/peds.2016-1758H

Stuck in a rut with the wrong diagnosis
CASE Aggressive behaviors, psychosis
Ms. N, age 58, has a long history of bipolar disorder with psychotic features. She presents to our emergency department (ED) after an acute fall and frequent violent behaviors at her nursing home, where she had resided since being diagnosed with an unspecified neurocognitive disorder. For several weeks before her fall, she was physically aggressive, throwing objects at nursing home staff, and was unable to have her behavior redirected.
While in the ED, Ms. N rambles and appears to be responding to internal stimuli. Suddenly, she stops responding and begins to stare.
HISTORY Severe, chronic psychosis and hospitalization
Ms. N is well-known at our inpatient psychiatry and electroconvulsive therapy (ECT) services. During the last 10 years, she has had worsening manic, psychotic, and catatonic (both excited and stuporous subtype) episodes. Three years ago, she had experienced a period of severe, chronic psychosis and excited catatonia that required extended inpatient treatment. While hospitalized, Ms. N had marginal responses to clozapine and benzodiazepines, but improved dramatically with ECT. After Ms. N left the hospital, she went to live with her boyfriend. She remained stable on monthly maintenance ECT treatments (bifrontal) before she was lost to follow-up 14 months prior to the current presentation. Ms. N’s family reports that she needed a cardiac clearance before continuing ECT treatment; however, she was hospitalized at another hospital with pneumonia and subsequent complications that interrupted the maintenance ECT treatments.
Approximately 3 months after medical issues requiring hospitalization began, Ms. N received a diagnosis of neurocognitive disorder due to difficulty with activities of daily living and cognitive decline. She was transferred to a nursing home by the outside hospital. When Ms. N’s symptoms of psychosis returned and she required inpatient psychiatric care, she was transferred to a nearby facility that did not have ECT available or knowledge of her history of catatonia resistant to pharmacologic management. Ms. N had a documented history of catatonia that spanned 10 years. During the last 4 years, Ms. N often required ECT treatment. Her current medication regimen prescribed by an outpatient psychiatrist includes clozapine, 300 mg twice daily, and clonazepam, 0.5 mg twice daily, both for bipolar disorder.
EVALUATION An unusual mix of symptoms
In the ED, Ms. N undergoes a CT of the head, which is found to be nonacute. Laboratory results show that her white blood cell count is 14.3 K/µL, which is mildly elevated. Results from a urinalysis and electrocardiogram (ECG) are unremarkable.
After Ms. N punches a radiology technician, she is administered IV lorazepam, 2 mg once, for her agitation. Twenty minutes after receiving IV lorazepam, she is calm and cooperative. However, approximately 4 hours later, Ms. N is yelling, tearful, and expressing delusions of grandeur—she believes she is God.
After she is admitted to the medical floor, Ms. N is seen by our consultation and liaison psychiatry service. She exhibits several signs of catatonia, including grasp reflex, gegenhalten (oppositional paratonia), waxy flexibility, and echolalia. Ms. N also has an episode of urinary incontinence. At some parts of the day, she is alert and oriented to self and location; at other times, she is somnolent and disoriented. The treatment team continues Ms. N’s previous medication regimen of clozapine, 300 mg twice daily, and clonazepam, 0.5 mg twice daily. Unfortunately, at times Ms. N spits out and hides her administered oral medications, which leads to the decision to discontinue clozapine. Once medically cleared, Ms. N is transferred to the psychiatric floor.
[polldaddy:10869949]
Continue to: TREATMENT
TREATMENT Bifrontal ECT initiated
On hospital Day 3 Ms. N is administered a trial of IM lorazepam, titrated up to 6 mg/d (maximum tolerated dose) while the treatment team initiates the legal process to conduct ECT because she is unable to give consent. Once Ms. N begins tolerating oral medications, amantadine, 100 mg twice daily, is added to treat her catatonia. As in prior hospitalizations, Ms. N is unresponsive to pharmacotherapy alone for her catatonic symptoms. On hospital Day 8, forced ECT is granted, which is 5 days after the process of filing paperwork was started. Bifrontal ECT is utilized with the following settings: frequency 70 Hz, pulse width 1.5 ms, 100% energy dose, 504 mC. Ms. N does not experience a significant improvement until she receives 10 ECT treatments as part of a 3-times-per-week acute series protocol. The Bush-Francis Catatonia Rating Scale (BFCRS) and the KANNER scale are used to monitor her progress. Her initial BFCRS score is 17 and initial KANNER scale, part 2 score is 26.
Ms. N spends a total of 61 days in the hospital, which is significantly longer than her previous hospital admissions on our psychiatric unit; these previous admissions were for treatment of both stuporous and excited subtypes of catatonia. This increased length of stay coincides with a significantly longer duration of untreated catatonia. Knowledge of her history of both the stuporous and excited subtypes of catatonia would have allowed for faster diagnosis and treatment.1
The authors’ observations
Originally conceptualized as a separate syndrome by Karl Kahlbaum, catatonia was considered only as a specifier for neuropsychiatric conditions (primarily schizophrenia) as recently as DSM-IV-TR.2 DSM-5 describes catatonia as a marked psychomotor disturbance and acknowledges its connection to schizophrenia by keeping it in the same chapter.3 DSM-5 includes separate diagnoses for catatonia, catatonia due to a general medical condition, and unspecified catatonia (for catatonia without a known underlying disorder).3 A recent meta-analysis found the prevalence of catatonia is higher in patients with medical/neurologic illness, bipolar disorder, and autism than in those with schizophrenia.4
Table 13 highlights the DSM-5 criteria for catatonia. DSM-5 requires 3 of 12 symptoms to be present, although symptoms may fluctuate with time.3 If a clinician is not specifically looking for catatonia, it can be a difficult syndrome to diagnose. Does rigidity indicate catatonia, or excessive dopamine blockade from an antipsychotic? How can seemingly contradictory symptoms be part of the same syndrome? Many clinicians associate catatonia with the stuporous subtype (immobility, posturing, catalepsy), which is more prevalent, but the excited subtype, which may involve severe agitation, autonomic dysfunction, and impaired consciousness, can be lethal.2 The diversity in presentation of catatonia is not unlike the challenging variety of symptoms of heart attacks.

A retrospective study of all adults admitted to a hospital found that only 41% of patients who met criteria for catatonia received this diagnosis.5 Further complicating the diagnosis, delirium and catatonia can co-exist; one study found this was the case in 1 of 3 critically ill patients.6 DSM-5 criteria for catatonia due to another medical condition exclude the diagnosis if delirium is present, but this study and others suggest this needs to be reconsidered.3
Continue to: A standardized evaluation is key
A standardized evaluation is key
Just as a patient who presents with chest pain requires a standardized evaluation, including a pertinent history, laboratory workup, and ECG, psychiatrists may also use standardized diagnostic instruments to aid in the diagnosis of catatonia. One study of hospitalized patients with schizophrenia found that using a standardized diagnostic procedure for catatonia resulted in a 7-fold increase in the diagnosis.7 The BFCRS is the most common standardized instrument for catatonia, likely due to its high inter-rater reliability.8 Other scales include the KANNER scale and Northoff Catatonia Scale, which emphasize different aspects of the disease or for certain clinical populations (eg, the KANNER scale adjusts for patients who are nonverbal at baseline). One study suggested that BFCRS has lower reliability for less-severe illness.9 These differences emphasize that psychiatry does not have a thorough understanding of the intricacies of catatonia. However, using validated screening tools can lead to more consistent diagnoses and continue important research on this often-misunderstood illness.
Dangers of untreated catatonia
Rapid treatment of catatonia is necessary to prevent mortality. A study of patients in Kentucky’s state psychiatric hospitals found that untreated catatonia with resultant death from pulmonary embolism was the leading cause of preventable death.10 A 17-year retrospective study of patients with schizophrenia admitted to 1 hospital found that those with catatonia were >4 times as likely to die during hospitalization than those without catatonia.11 The significant morbidity and mortality from untreated catatonia are typically attributed to the consequences of poorly controlled movements, immobility, autonomic instability, and poor/no oral intake. Reduced oral intake can result in malnutrition, dehydration, arrhythmias, and increased risk of infections. Furthermore, chronic catatonic episodes are more difficult to treat.12 In addition to the aggressive management of neuropsychiatric symptoms, it is vital to evaluate relevant medical etiologies that may be contributing to the syndrome (Table 213). Tracking vital signs and laboratory values, such as creatine kinase, electrolytes, and complete blood count, is required to ensure the medical condition does not become life-threatening.

Treatment options
Studies and expert opinion suggest that benzodiazepines (specifically lorazepam, because it is the most studied agent) are the first-line treatment for catatonia. A lorazepam challenge test—providing 1 or 2 mg of IV lorazepam—is considered diagnostic and therapeutic given the high rate of response within 10 minutes.14 Patients with limited response to lorazepam or who are medically compromised should undergo ECT. Electroconvulsive therapy is considered the gold-standard treatment for catatonia; estimated response rates range from 59% to 100%, even in patients who fail to respond to pharmacotherapy.15 Although highly effective, ECT is often hindered by the time required to initiate treatment, stigma, lack of access, and other logistical challenges.
Table 314-18 highlights the advantages and disadvantages of treatment options for catatonia. Some researchers have suggested a zolpidem challenge test could augment lorazepam because some patients respond only to zolpidem.14 The efficacy of these medications along with some evidence of anti-N-methyl-

Ms. N was ultimately diagnosed with bipolar disorder, current episode mixed, with psychotic and catatonic features. Ms. N had symptoms of mania including grandiosity, periods of lack of sleep, delusions as well as depressive symptoms of tearfulness and low mood. The treatment team had considered that Ms. N had delirious mania because she had fluctuating sensorium, which included varying degrees of orientation and ability to answer questioning. However, the literature supporting the differentiation between delirious mania and excited catatonia is unclear, and both conditions may respond to ECT.18 A diagnosis of catatonia allowed the team to use rating scales to track Ms. N’s progress by monitoring for specific signs, such as grasp reflex and waxy flexibility.
Continue to: OUTCOME
OUTCOME Return to baseline
Before discharge, Ms. N’s BFCRS score decreases from the initial score of 17 to 0, and her KANNER scale score decreases from the initial score of 26 to 4, which correlates with vast improvement in clinical presentation. Once Ms. N completes the acute ECT treatment, she returns to her baseline level of functioning, and is discharged to live with her boyfriend. She is advised to continue weekly ECT for the first several months to ensure clinical stability. This regimen is later transitioned to biweekly and then monthly. Electroconvulsive therapy protocols from previous research were utilized in Ms. N’s case, but ultimately the lowest number of ECT treatments needed to maintain stability is determined clinically over many years.19 Ms. N is discharged on aripiprazole, 15 mg/d; bupropion ER, 300 mg/d (added after depressive symptoms emerge while catatonia symptoms improve midway through her lengthy hospitalization); and memantine, 10 mg/d. Ideally, clozapine would have been continued; however, due to her history of nonadherence and frequent restarting of the medication at a low dose, clozapine was discontinued and aripiprazole initiated.
More than 1 year later, Ms. N remains stable and continues to receive monthly ECT maintenance treatments.
Bottom Line
Catatonia should always be considered in a patient who presents with acute neuropsychiatric symptoms. Rapid diagnosis with standardized screening instruments and aggressive treatment are vital to prevent morbidity and mortality.
Related Resource
- Freudenreich O, Francis A, Fricchione GL. Chapter 9. Psychosis, mania, and catatonia. In: Levenson, James L, ed. The American Psychiatric Association Publishing textbook of psychosomatic medicine and consultation-liaison psychiatry. 3rd ed. American Psychiatric Association Publishing; 2019.
Drug Brand Names
Amantadine • Symmetrel
Aripiprazole • Abilify
Baclofen • Ozobax
Bupropion ER • Wellbutrin XL
Clonazepam • Klonopin
Clozapine • Clozaril
Lithium • Eskalith, Lithobid
Lorazepam • Ativan
Metoclopramide • Reglan
Memantine • Namenda
Topiramate • Topamax
Zolpidem • Ambien
1. Carroll BT. The universal field hypothesis of catatonia and neuroleptic malignant syndrome. CNS Spectrums. 2000;5(7):26-33.
2. Rasmussen SA, Mazurek MF, Rosebush PI. Catatonia: our current understanding of its diagnosis, treatment and pathophysiology. World J Psychiatry. 2016;6(4):391‐398.
3. Diagnostic and statistical manual of mental disorders, 5th ed. American Psychiatric Association; 2013. 119-121.
4. Solmi M, Pigato GG, Roiter B, et al. Prevalence of catatonia and its moderators in clinical samples: results from a meta-analysis and meta-regression analysis. Schizophrenia Bulletin. 2017;44(5):1133-1150.
5. Llesuy JR, Medina M, Jacobson KC, et al. Catatonia under-diagnosis in the general hospital. J Neuropsychiatry Clin Neurosci. 2018;30(2):145-151.
6. Wilson JE, Carlson R, Duggan MC, et al. Delirium and catatonia in critically ill patients. Crit Care Med. 2017;45(11):1837-1844.
7. Heijden FVD, Tuinier S, Arts N, et al. Catatonia: disappeared or under-diagnosed? Psychopathology. 2005;38(1):3-8.
8. Sarkar S, Sakey S, Mathan K, et al. Assessing catatonia using four different instruments: inter-rater reliability and prevalence in inpatient clinical population. Asian J Psychiatr. 2016;23:27-31.
9. Wilson JE, Niu K, Nicolson SE, et al. The diagnostic criteria and structure of catatonia. Schizophr Res. 2015;164(1-3):256-262.
10. Puentes R, Brenzel A, Leon JD. Pulmonary embolism during stuporous episodes of catatonia was found to be the most frequent cause of preventable death according to a state mortality review: 6 deaths in 15 years. Clin Schizophr Relat Psychoses. 2017; doi:10.3371/csrp.rpab.071317
11. Funayama M, Takata T, Koreki A, et al. Catatonic stupor in schizophrenic disorders and subsequent medical complications and mortality. Psychosomatic Medicine. 2018:80(4):370-376.
12. Perugi G, Medda P, Toni C, et al. The role of electroconvulsive therapy (ECT) in bipolar disorder: effectiveness in 522 patients with bipolar depression, mixed-state, mania and catatonic features. Curr Neuropharmacol. 2017;15(3):359-371.
13. Freudenreich O, Francis A, Fricchione GL. Chapter 9. Psychosis, mania, and catatonia. In: Levenson, James L, ed. The American Psychiatric Association Publishing Textbook of Psychosomatic medicine and Consultation-Liaison Psychiatry. 3rd ed. American Psychiatric Association Publishing; 2019.
14. Sienaert P, Dhossche DM, Vancampfort D, et al. A clinical review of the treatment of catatonia. Front Psychiatry. 2014;5:181.
15. Pelzer A, Heijden FVD, Boer ED. Systematic review of catatonia treatment. Neuropsychiatr Dis Treat. 2018;14:317-326.
16. Carroll BT, Goforth HW, Thomas C, et al. Review of adjunctive glutamate antagonist therapy in the treatment of catatonic syndromes. J Neuropsychiatry and Clin Neurosci. 2007;19(4):406-412.
17. Fink M. Rediscovering catatonia: the biography of a treatable syndrome. Acta Psychiatr Scand Suppl. 2013;(441):1-47.
18. Fink M, Taylor MA. Catatonia: a clinician’s guide to diagnosis and treatment. Cambridge University Press; 2006.
19. Petrides G, Tobias KG, Kellner CH, et al. Continuation and maintenance electroconvulsive therapy for mood disorders: review of the literature. Neuropsychobiology. 2011;64(3):129-140.
CASE Aggressive behaviors, psychosis
Ms. N, age 58, has a long history of bipolar disorder with psychotic features. She presents to our emergency department (ED) after an acute fall and frequent violent behaviors at her nursing home, where she had resided since being diagnosed with an unspecified neurocognitive disorder. For several weeks before her fall, she was physically aggressive, throwing objects at nursing home staff, and was unable to have her behavior redirected.
While in the ED, Ms. N rambles and appears to be responding to internal stimuli. Suddenly, she stops responding and begins to stare.
HISTORY Severe, chronic psychosis and hospitalization
Ms. N is well-known at our inpatient psychiatry and electroconvulsive therapy (ECT) services. During the last 10 years, she has had worsening manic, psychotic, and catatonic (both excited and stuporous subtype) episodes. Three years ago, she had experienced a period of severe, chronic psychosis and excited catatonia that required extended inpatient treatment. While hospitalized, Ms. N had marginal responses to clozapine and benzodiazepines, but improved dramatically with ECT. After Ms. N left the hospital, she went to live with her boyfriend. She remained stable on monthly maintenance ECT treatments (bifrontal) before she was lost to follow-up 14 months prior to the current presentation. Ms. N’s family reports that she needed a cardiac clearance before continuing ECT treatment; however, she was hospitalized at another hospital with pneumonia and subsequent complications that interrupted the maintenance ECT treatments.
Approximately 3 months after medical issues requiring hospitalization began, Ms. N received a diagnosis of neurocognitive disorder due to difficulty with activities of daily living and cognitive decline. She was transferred to a nursing home by the outside hospital. When Ms. N’s symptoms of psychosis returned and she required inpatient psychiatric care, she was transferred to a nearby facility that did not have ECT available or knowledge of her history of catatonia resistant to pharmacologic management. Ms. N had a documented history of catatonia that spanned 10 years. During the last 4 years, Ms. N often required ECT treatment. Her current medication regimen prescribed by an outpatient psychiatrist includes clozapine, 300 mg twice daily, and clonazepam, 0.5 mg twice daily, both for bipolar disorder.
EVALUATION An unusual mix of symptoms
In the ED, Ms. N undergoes a CT of the head, which is found to be nonacute. Laboratory results show that her white blood cell count is 14.3 K/µL, which is mildly elevated. Results from a urinalysis and electrocardiogram (ECG) are unremarkable.
After Ms. N punches a radiology technician, she is administered IV lorazepam, 2 mg once, for her agitation. Twenty minutes after receiving IV lorazepam, she is calm and cooperative. However, approximately 4 hours later, Ms. N is yelling, tearful, and expressing delusions of grandeur—she believes she is God.
After she is admitted to the medical floor, Ms. N is seen by our consultation and liaison psychiatry service. She exhibits several signs of catatonia, including grasp reflex, gegenhalten (oppositional paratonia), waxy flexibility, and echolalia. Ms. N also has an episode of urinary incontinence. At some parts of the day, she is alert and oriented to self and location; at other times, she is somnolent and disoriented. The treatment team continues Ms. N’s previous medication regimen of clozapine, 300 mg twice daily, and clonazepam, 0.5 mg twice daily. Unfortunately, at times Ms. N spits out and hides her administered oral medications, which leads to the decision to discontinue clozapine. Once medically cleared, Ms. N is transferred to the psychiatric floor.
[polldaddy:10869949]
Continue to: TREATMENT
TREATMENT Bifrontal ECT initiated
On hospital Day 3 Ms. N is administered a trial of IM lorazepam, titrated up to 6 mg/d (maximum tolerated dose) while the treatment team initiates the legal process to conduct ECT because she is unable to give consent. Once Ms. N begins tolerating oral medications, amantadine, 100 mg twice daily, is added to treat her catatonia. As in prior hospitalizations, Ms. N is unresponsive to pharmacotherapy alone for her catatonic symptoms. On hospital Day 8, forced ECT is granted, which is 5 days after the process of filing paperwork was started. Bifrontal ECT is utilized with the following settings: frequency 70 Hz, pulse width 1.5 ms, 100% energy dose, 504 mC. Ms. N does not experience a significant improvement until she receives 10 ECT treatments as part of a 3-times-per-week acute series protocol. The Bush-Francis Catatonia Rating Scale (BFCRS) and the KANNER scale are used to monitor her progress. Her initial BFCRS score is 17 and initial KANNER scale, part 2 score is 26.
Ms. N spends a total of 61 days in the hospital, which is significantly longer than her previous hospital admissions on our psychiatric unit; these previous admissions were for treatment of both stuporous and excited subtypes of catatonia. This increased length of stay coincides with a significantly longer duration of untreated catatonia. Knowledge of her history of both the stuporous and excited subtypes of catatonia would have allowed for faster diagnosis and treatment.1
The authors’ observations
Originally conceptualized as a separate syndrome by Karl Kahlbaum, catatonia was considered only as a specifier for neuropsychiatric conditions (primarily schizophrenia) as recently as DSM-IV-TR.2 DSM-5 describes catatonia as a marked psychomotor disturbance and acknowledges its connection to schizophrenia by keeping it in the same chapter.3 DSM-5 includes separate diagnoses for catatonia, catatonia due to a general medical condition, and unspecified catatonia (for catatonia without a known underlying disorder).3 A recent meta-analysis found the prevalence of catatonia is higher in patients with medical/neurologic illness, bipolar disorder, and autism than in those with schizophrenia.4
Table 13 highlights the DSM-5 criteria for catatonia. DSM-5 requires 3 of 12 symptoms to be present, although symptoms may fluctuate with time.3 If a clinician is not specifically looking for catatonia, it can be a difficult syndrome to diagnose. Does rigidity indicate catatonia, or excessive dopamine blockade from an antipsychotic? How can seemingly contradictory symptoms be part of the same syndrome? Many clinicians associate catatonia with the stuporous subtype (immobility, posturing, catalepsy), which is more prevalent, but the excited subtype, which may involve severe agitation, autonomic dysfunction, and impaired consciousness, can be lethal.2 The diversity in presentation of catatonia is not unlike the challenging variety of symptoms of heart attacks.
A retrospective study of all adults admitted to a hospital found that only 41% of patients who met criteria for catatonia received this diagnosis.5 Further complicating the diagnosis, delirium and catatonia can co-exist; one study found this was the case in 1 of 3 critically ill patients.6 DSM-5 criteria for catatonia due to another medical condition exclude the diagnosis if delirium is present, but this study and others suggest this needs to be reconsidered.3
Continue to: A standardized evaluation is key
A standardized evaluation is key
Just as a patient who presents with chest pain requires a standardized evaluation, including a pertinent history, laboratory workup, and ECG, psychiatrists may also use standardized diagnostic instruments to aid in the diagnosis of catatonia. One study of hospitalized patients with schizophrenia found that using a standardized diagnostic procedure for catatonia resulted in a 7-fold increase in the diagnosis.7 The BFCRS is the most common standardized instrument for catatonia, likely due to its high inter-rater reliability.8 Other scales include the KANNER scale and Northoff Catatonia Scale, which emphasize different aspects of the disease or for certain clinical populations (eg, the KANNER scale adjusts for patients who are nonverbal at baseline). One study suggested that BFCRS has lower reliability for less-severe illness.9 These differences emphasize that psychiatry does not have a thorough understanding of the intricacies of catatonia. However, using validated screening tools can lead to more consistent diagnoses and continue important research on this often-misunderstood illness.
Dangers of untreated catatonia
Rapid treatment of catatonia is necessary to prevent mortality. A study of patients in Kentucky’s state psychiatric hospitals found that untreated catatonia with resultant death from pulmonary embolism was the leading cause of preventable death.10 A 17-year retrospective study of patients with schizophrenia admitted to 1 hospital found that those with catatonia were >4 times as likely to die during hospitalization than those without catatonia.11 The significant morbidity and mortality from untreated catatonia are typically attributed to the consequences of poorly controlled movements, immobility, autonomic instability, and poor/no oral intake. Reduced oral intake can result in malnutrition, dehydration, arrhythmias, and increased risk of infections. Furthermore, chronic catatonic episodes are more difficult to treat.12 In addition to the aggressive management of neuropsychiatric symptoms, it is vital to evaluate relevant medical etiologies that may be contributing to the syndrome (Table 213). Tracking vital signs and laboratory values, such as creatine kinase, electrolytes, and complete blood count, is required to ensure the medical condition does not become life-threatening.
Treatment options
Studies and expert opinion suggest that benzodiazepines (specifically lorazepam, because it is the most studied agent) are the first-line treatment for catatonia. A lorazepam challenge test—providing 1 or 2 mg of IV lorazepam—is considered diagnostic and therapeutic given the high rate of response within 10 minutes.14 Patients with limited response to lorazepam or who are medically compromised should undergo ECT. Electroconvulsive therapy is considered the gold-standard treatment for catatonia; estimated response rates range from 59% to 100%, even in patients who fail to respond to pharmacotherapy.15 Although highly effective, ECT is often hindered by the time required to initiate treatment, stigma, lack of access, and other logistical challenges.
Table 314-18 highlights the advantages and disadvantages of treatment options for catatonia. Some researchers have suggested a zolpidem challenge test could augment lorazepam because some patients respond only to zolpidem.14 The efficacy of these medications along with some evidence of anti-N-methyl-
Ms. N was ultimately diagnosed with bipolar disorder, current episode mixed, with psychotic and catatonic features. Ms. N had symptoms of mania including grandiosity, periods of lack of sleep, delusions as well as depressive symptoms of tearfulness and low mood. The treatment team had considered that Ms. N had delirious mania because she had fluctuating sensorium, which included varying degrees of orientation and ability to answer questioning. However, the literature supporting the differentiation between delirious mania and excited catatonia is unclear, and both conditions may respond to ECT.18 A diagnosis of catatonia allowed the team to use rating scales to track Ms. N’s progress by monitoring for specific signs, such as grasp reflex and waxy flexibility.
Continue to: OUTCOME
OUTCOME Return to baseline
Before discharge, Ms. N’s BFCRS score decreases from the initial score of 17 to 0, and her KANNER scale score decreases from the initial score of 26 to 4, which correlates with vast improvement in clinical presentation. Once Ms. N completes the acute ECT treatment, she returns to her baseline level of functioning, and is discharged to live with her boyfriend. She is advised to continue weekly ECT for the first several months to ensure clinical stability. This regimen is later transitioned to biweekly and then monthly. Electroconvulsive therapy protocols from previous research were utilized in Ms. N’s case, but ultimately the lowest number of ECT treatments needed to maintain stability is determined clinically over many years.19 Ms. N is discharged on aripiprazole, 15 mg/d; bupropion ER, 300 mg/d (added after depressive symptoms emerge while catatonia symptoms improve midway through her lengthy hospitalization); and memantine, 10 mg/d. Ideally, clozapine would have been continued; however, due to her history of nonadherence and frequent restarting of the medication at a low dose, clozapine was discontinued and aripiprazole initiated.
More than 1 year later, Ms. N remains stable and continues to receive monthly ECT maintenance treatments.
Bottom Line
Catatonia should always be considered in a patient who presents with acute neuropsychiatric symptoms. Rapid diagnosis with standardized screening instruments and aggressive treatment are vital to prevent morbidity and mortality.
Related Resource
- Freudenreich O, Francis A, Fricchione GL. Chapter 9. Psychosis, mania, and catatonia. In: Levenson, James L, ed. The American Psychiatric Association Publishing textbook of psychosomatic medicine and consultation-liaison psychiatry. 3rd ed. American Psychiatric Association Publishing; 2019.
Drug Brand Names
Amantadine • Symmetrel
Aripiprazole • Abilify
Baclofen • Ozobax
Bupropion ER • Wellbutrin XL
Clonazepam • Klonopin
Clozapine • Clozaril
Lithium • Eskalith, Lithobid
Lorazepam • Ativan
Metoclopramide • Reglan
Memantine • Namenda
Topiramate • Topamax
Zolpidem • Ambien
1. Carroll BT. The universal field hypothesis of catatonia and neuroleptic malignant syndrome. CNS Spectrums. 2000;5(7):26-33.
2. Rasmussen SA, Mazurek MF, Rosebush PI. Catatonia: our current understanding of its diagnosis, treatment and pathophysiology. World J Psychiatry. 2016;6(4):391‐398.
3. Diagnostic and statistical manual of mental disorders, 5th ed. American Psychiatric Association; 2013. 119-121.
4. Solmi M, Pigato GG, Roiter B, et al. Prevalence of catatonia and its moderators in clinical samples: results from a meta-analysis and meta-regression analysis. Schizophrenia Bulletin. 2017;44(5):1133-1150.
5. Llesuy JR, Medina M, Jacobson KC, et al. Catatonia under-diagnosis in the general hospital. J Neuropsychiatry Clin Neurosci. 2018;30(2):145-151.
6. Wilson JE, Carlson R, Duggan MC, et al. Delirium and catatonia in critically ill patients. Crit Care Med. 2017;45(11):1837-1844.
7. Heijden FVD, Tuinier S, Arts N, et al. Catatonia: disappeared or under-diagnosed? Psychopathology. 2005;38(1):3-8.
8. Sarkar S, Sakey S, Mathan K, et al. Assessing catatonia using four different instruments: inter-rater reliability and prevalence in inpatient clinical population. Asian J Psychiatr. 2016;23:27-31.
9. Wilson JE, Niu K, Nicolson SE, et al. The diagnostic criteria and structure of catatonia. Schizophr Res. 2015;164(1-3):256-262.
10. Puentes R, Brenzel A, Leon JD. Pulmonary embolism during stuporous episodes of catatonia was found to be the most frequent cause of preventable death according to a state mortality review: 6 deaths in 15 years. Clin Schizophr Relat Psychoses. 2017; doi:10.3371/csrp.rpab.071317
11. Funayama M, Takata T, Koreki A, et al. Catatonic stupor in schizophrenic disorders and subsequent medical complications and mortality. Psychosomatic Medicine. 2018:80(4):370-376.
12. Perugi G, Medda P, Toni C, et al. The role of electroconvulsive therapy (ECT) in bipolar disorder: effectiveness in 522 patients with bipolar depression, mixed-state, mania and catatonic features. Curr Neuropharmacol. 2017;15(3):359-371.
13. Freudenreich O, Francis A, Fricchione GL. Chapter 9. Psychosis, mania, and catatonia. In: Levenson, James L, ed. The American Psychiatric Association Publishing Textbook of Psychosomatic medicine and Consultation-Liaison Psychiatry. 3rd ed. American Psychiatric Association Publishing; 2019.
14. Sienaert P, Dhossche DM, Vancampfort D, et al. A clinical review of the treatment of catatonia. Front Psychiatry. 2014;5:181.
15. Pelzer A, Heijden FVD, Boer ED. Systematic review of catatonia treatment. Neuropsychiatr Dis Treat. 2018;14:317-326.
16. Carroll BT, Goforth HW, Thomas C, et al. Review of adjunctive glutamate antagonist therapy in the treatment of catatonic syndromes. J Neuropsychiatry and Clin Neurosci. 2007;19(4):406-412.
17. Fink M. Rediscovering catatonia: the biography of a treatable syndrome. Acta Psychiatr Scand Suppl. 2013;(441):1-47.
18. Fink M, Taylor MA. Catatonia: a clinician’s guide to diagnosis and treatment. Cambridge University Press; 2006.
19. Petrides G, Tobias KG, Kellner CH, et al. Continuation and maintenance electroconvulsive therapy for mood disorders: review of the literature. Neuropsychobiology. 2011;64(3):129-140.

Improving nonverbal communication during telepsychiatry sessions
Telepsychiatry appointments (eg, video conferencing) initially replaced face-to-face outpatient encounters during the first phase of the COVID-19 pandemic. However, as offices reopened for in-person appointments, many patients still prefer “virtual” appointments. Telepsychiatry allows for easier delivery of mental health services, including psychotherapy, and may become the new normal.
Although therapy conducted via video conferencing allows you to connect with patients at a safe distance, it alters the basic conditions under which therapy occurs, such as being in the same room.1 While focusing on preserving the verbal elements of communication, you might inadvertently forget the nonverbal elements, which at times might render your words ineffective.1 The main elements of nonverbal communication are facial expression, gaze, posture, gesture, and proxemics (ie, how much space you take up, and your distance from others).2 The following tips can help you preserve the nonverbal elements of communication when conducting telepsychiatry sessions.
Reduce gaze error. Gaze error is the deviation from direct eye contact that occurs during video conferencing. It results from the distance between the image of the person on your screen and the camera above it.1 Gaze error can muddy intended cues and communicate unintended cues.2 Examples of gaze errors include downcast eyes (the most common gaze error), sideways gaze, or gazing over the person’s head.2 These errors can communicate social deference, evasion, insincerity, or even boredom.2 To lessen gaze error, move the patient’s image as close as possible to your camera.1 In addition, avoid looking at yourself on the screen; some video conferencing platforms allow users to hide their self-view.
Create distance and incorporate upper body language. In the office, sitting very close to your patient and staring directly at their face for an hour would be awkward and intrusive.1 Doing so online is no different. While you may be tempted to move close to the screen to compensate for feeling distant or having difficulty hearing or seeing your patient, you should back away from the camera. Doing so will help both parties feel less self-conscious, more at ease, and more focused on the session.1 Backing up from the camera will allow patients to see your upper body language (eg, hand gestures, posture) as well as your facial expressions.1 Empathy improves when patients can see your upper-body cues.2 Keep in mind that the angle of your camera is just as important as the distance. For example, if your camera is positioned so that it is looking up toward your eyes, patients may perceive that you are looking down at them.1 This problem can be remedied by stacking books under the monitor to raise the camera.
Be aware of your facial expressions, posture, gestures, and proxemics. Ensure that your face does not go slack when you are listening to patients talk.3 Just as you would do in person, a slight head tilt and occasional head nod lets patients know that you are engaged and actively listening.3 Maintain an open body posture by keeping your feet firmly on the ground and putting your hands on the table in front of you.3 Lean in when patients share intimate information, just as you would in person. Avoid hunching over the laptop/keyboard because this could make you seem tired or tense.3 Pay attention to your arm and hand movements so that you do not exaggerate them.
Maintain office professionalism. The office setting conveys a therapeutic formality that can get lost online.1 As tempting as it may be to conduct online sessions in pajamas or sweatpants, continue to dress as if you were in the office. Be mindful of your backdrop, set all cell phones to silent, turn off your email alerts, and lock the room.1,3 Stick to the clock as you would in the office, and encourage patients to do the same.
Minor technological improvements—such as headphones with a built-in microphone, a high-definition camera, a larger monitor, or a faster internet connection—might be needed to improve your nonverbal communication during telepsychiatry sessions.1 Although this is not an exhaustive list, these tips can serve as a starting point to ensure effective communication while you are physically distanced from your patients.
1. Arnold C, Franklin T. Seven tips for maintaining the frame in online therapy. Psychiatric News. Published June 25, 2020. Accessed May 26, 2021. https://psychnews.psychiatryonline.org/doi/10.1176/appi.pn.2020.7a21
2. Nguyen DT, Canny J. More than face-to-face: empathy effects of video framing. CHI 2009: Proceedings of the SGCHI Conference on Human Factors in Computing Systems. Published April 6, 2009. Accessed July 31, 2020. https://dl.acm.org/doi/10.1145/1518701.1518770
3. Cossar R, Navarro J. Tips for improving communication during video conferencing: do’s and don’ts for a more professional video-conference. Published March 31, 2020. Accessed July 31, 2020. https://www.psychologytoday.com/us/blog/spycatcher/202003/tips-improving-communication-during-video-conferencing
Telepsychiatry appointments (eg, video conferencing) initially replaced face-to-face outpatient encounters during the first phase of the COVID-19 pandemic. However, as offices reopened for in-person appointments, many patients still prefer “virtual” appointments. Telepsychiatry allows for easier delivery of mental health services, including psychotherapy, and may become the new normal.
Although therapy conducted via video conferencing allows you to connect with patients at a safe distance, it alters the basic conditions under which therapy occurs, such as being in the same room.1 While focusing on preserving the verbal elements of communication, you might inadvertently forget the nonverbal elements, which at times might render your words ineffective.1 The main elements of nonverbal communication are facial expression, gaze, posture, gesture, and proxemics (ie, how much space you take up, and your distance from others).2 The following tips can help you preserve the nonverbal elements of communication when conducting telepsychiatry sessions.
Reduce gaze error. Gaze error is the deviation from direct eye contact that occurs during video conferencing. It results from the distance between the image of the person on your screen and the camera above it.1 Gaze error can muddy intended cues and communicate unintended cues.2 Examples of gaze errors include downcast eyes (the most common gaze error), sideways gaze, or gazing over the person’s head.2 These errors can communicate social deference, evasion, insincerity, or even boredom.2 To lessen gaze error, move the patient’s image as close as possible to your camera.1 In addition, avoid looking at yourself on the screen; some video conferencing platforms allow users to hide their self-view.
Create distance and incorporate upper body language. In the office, sitting very close to your patient and staring directly at their face for an hour would be awkward and intrusive.1 Doing so online is no different. While you may be tempted to move close to the screen to compensate for feeling distant or having difficulty hearing or seeing your patient, you should back away from the camera. Doing so will help both parties feel less self-conscious, more at ease, and more focused on the session.1 Backing up from the camera will allow patients to see your upper body language (eg, hand gestures, posture) as well as your facial expressions.1 Empathy improves when patients can see your upper-body cues.2 Keep in mind that the angle of your camera is just as important as the distance. For example, if your camera is positioned so that it is looking up toward your eyes, patients may perceive that you are looking down at them.1 This problem can be remedied by stacking books under the monitor to raise the camera.
Be aware of your facial expressions, posture, gestures, and proxemics. Ensure that your face does not go slack when you are listening to patients talk.3 Just as you would do in person, a slight head tilt and occasional head nod lets patients know that you are engaged and actively listening.3 Maintain an open body posture by keeping your feet firmly on the ground and putting your hands on the table in front of you.3 Lean in when patients share intimate information, just as you would in person. Avoid hunching over the laptop/keyboard because this could make you seem tired or tense.3 Pay attention to your arm and hand movements so that you do not exaggerate them.
Maintain office professionalism. The office setting conveys a therapeutic formality that can get lost online.1 As tempting as it may be to conduct online sessions in pajamas or sweatpants, continue to dress as if you were in the office. Be mindful of your backdrop, set all cell phones to silent, turn off your email alerts, and lock the room.1,3 Stick to the clock as you would in the office, and encourage patients to do the same.
Minor technological improvements—such as headphones with a built-in microphone, a high-definition camera, a larger monitor, or a faster internet connection—might be needed to improve your nonverbal communication during telepsychiatry sessions.1 Although this is not an exhaustive list, these tips can serve as a starting point to ensure effective communication while you are physically distanced from your patients.
1. Arnold C, Franklin T. Seven tips for maintaining the frame in online therapy. Psychiatric News. Published June 25, 2020. Accessed May 26, 2021. https://psychnews.psychiatryonline.org/doi/10.1176/appi.pn.2020.7a21
2. Nguyen DT, Canny J. More than face-to-face: empathy effects of video framing. CHI 2009: Proceedings of the SGCHI Conference on Human Factors in Computing Systems. Published April 6, 2009. Accessed July 31, 2020. https://dl.acm.org/doi/10.1145/1518701.1518770
3. Cossar R, Navarro J. Tips for improving communication during video conferencing: do’s and don’ts for a more professional video-conference. Published March 31, 2020. Accessed July 31, 2020. https://www.psychologytoday.com/us/blog/spycatcher/202003/tips-improving-communication-during-video-conferencing

Treating psychosis in pregnant women: A measured approach
The peak age of onset of schizophrenia coincides with the peak childbearing age of 25 to 35 years.1 So it would not be unusual for your patient with schizophrenia to tell you she is trying to get pregnant, or thinks she might be pregnant. In these situations, you must carefully weigh the risks to the mother (eg, relapse, complications) and to the fetus (eg, possible miscarriage, teratogenesis) when deciding whether to continue or change her treatment regimen. When faced with making these decisions, keep the following factors in mind.
1. Most importantly: Do not make knee-jerk changes. Do not suddenly stop medications. Proceed in a thoughtful and measured way.
2. Discuss the risks with your patient. There is no such thing as a risk-free decision. There are potential risks from untreated psychosis as well as from medications. Mothers with untreated psychosis have an increased risk of suicide and violence, as well as poor self-care. Schizophrenia may be associated with an increased risk of poor birth outcomes, including preterm delivery, low birthweight, and neonatal complications.2 Avoid making absolute statements about specific medications during pregnancy; there needs to be an individualized risk-benefit discussion for each patient, and for each medication.
3. Involve the patient’s partner and family in treatment planning if possible. The patient’s family can be important in promoting mental health during pregnancy and the postpartum. Educating the family as well as the patient regarding medications and the risks of untreated mental illness can go a long way toward compliance.
4. Do not rely on what pregnancy category a medication was. There are multiple dimensions to evaluate when considering the use of an antipsychotic agent during pregnancy. Does it increase the risk of miscarriage? Malformations? Preterm birth? Perinatal toxicity? Behavioral teratogenesis (neurodevelopmental sequelae)? Looking for a simple summary or single letter grade minimizes the understanding of the specific outcome of concern in the specific mother. Instead, look at the Pregnancy section under Use in Specific Populations on the medication’s package insert (prescribing information), consult a web site such as MotherToBaby (mothertobaby.org/healthcare-professionals/), and/or search for the latest research on PubMed.
5. Collaborate with the patient’s obstetrician or family medicine physician. Make sure that you are on the same page regarding treating the patient’s psychosis. Other clinicians often will agree with your treatment plan because they understand the risks of untreated psychosis compared with other risks the patient is facing. However, if you don’t communicate with your patient’s other health care professionals, she might receive mixed messages.
6. As for medication choice, pregnancy is the most important time to conduct a careful medication history to inform your choice of medication. Was Medication X ineffective, or did the patient not pick it up from the pharmacy? Did she really have a trial of 3 months, or did she only take it for a week before she decided to stop?
Continue to: Determine which medication has worked for the patient in the past
7. Determine which medication has worked for the patient in the past. If Medication Y worked before she was pregnant, it is likely to still work during pregnancy. If it is a relatively safe option, it may be the best choice.
8. Avoid multiple medication exposures wherever possible. If a patient is taking Medication Z, it is working, and she tells you she is 3 months pregnant, it is often better to continue it (assuming it is a relatively safe medication) than to switch to Medication A, which has slightly better “safety data.” By switching to a different antipsychotic, you would be exposing the fetus to a second agent that may not even work for the mother.
9. Focus on treating the patient’s present symptoms. Medication doses may need to change due to pregnancy-related changes in symptoms, drug distribution, and/or metabolism.
10. Remain vigilant for other risks. Keep in mind that pregnant women with psychosis often face risks other than psychiatric medications and psychosis. Comorbidities such as substance use disorders, obesity, and poor prenatal care must also be addressed.3
11. Follow your patient more closely during pregnancy. Pregnancy is an uncertain time for any new mother. Be sure to have an open line of communication with the patient, and be responsive to her concerns.
Continue to: Provide psychoeducation about the postpartum period
12. Provide psychoeducation about the postpartum period. Pregnancy is the time to educate your patient about the importance of sleep, warning signs of exacerbation of psychosis, and breastfeeding safety.
13. Be proactive with future female patients of childbearing age, regardless of whether they tell you they are sexually active. Women with psychosis have higher rates of unplanned pregnancy.3,4 When initiating treatment of psychosis in a woman of childbearing age, rather than treating her with the newest available medication that does not yet have safety data in pregnancy, it is best to start with a medication already known to be relatively safe in pregnancy. This way, if she were to become pregnant, your treatment plan would already be safe and appropriate.
14. Consult a reproductive psychiatrist if needed.
1. Einarson A, Boskovic R. Use and safety of antipsychotic drugs during pregnancy. J Psychiatr Pract. 2009;15(3):183-192.
2. Galbally M, Crabb C. Schizophrenia and psychotic disorders. O&G. 2018;20(3). https://www.ogmagazine.org.au/20/3-20/schizophrenia-and-psychotic-disorders/
3. Miller LJ. Sexuality, reproduction, and family planning in women with schizophrenia. Schizophr Bull. 1997;23(4):623-635.
4. Friedman SH, Hall RCW, Sorrentino RM. Involuntary treatment of psychosis in pregnancy. J Am Acad Psychiatry Law. 2018;46(2):217-223.
The peak age of onset of schizophrenia coincides with the peak childbearing age of 25 to 35 years.1 So it would not be unusual for your patient with schizophrenia to tell you she is trying to get pregnant, or thinks she might be pregnant. In these situations, you must carefully weigh the risks to the mother (eg, relapse, complications) and to the fetus (eg, possible miscarriage, teratogenesis) when deciding whether to continue or change her treatment regimen. When faced with making these decisions, keep the following factors in mind.
1. Most importantly: Do not make knee-jerk changes. Do not suddenly stop medications. Proceed in a thoughtful and measured way.
2. Discuss the risks with your patient. There is no such thing as a risk-free decision. There are potential risks from untreated psychosis as well as from medications. Mothers with untreated psychosis have an increased risk of suicide and violence, as well as poor self-care. Schizophrenia may be associated with an increased risk of poor birth outcomes, including preterm delivery, low birthweight, and neonatal complications.2 Avoid making absolute statements about specific medications during pregnancy; there needs to be an individualized risk-benefit discussion for each patient, and for each medication.
3. Involve the patient’s partner and family in treatment planning if possible. The patient’s family can be important in promoting mental health during pregnancy and the postpartum. Educating the family as well as the patient regarding medications and the risks of untreated mental illness can go a long way toward compliance.
4. Do not rely on what pregnancy category a medication was. There are multiple dimensions to evaluate when considering the use of an antipsychotic agent during pregnancy. Does it increase the risk of miscarriage? Malformations? Preterm birth? Perinatal toxicity? Behavioral teratogenesis (neurodevelopmental sequelae)? Looking for a simple summary or single letter grade minimizes the understanding of the specific outcome of concern in the specific mother. Instead, look at the Pregnancy section under Use in Specific Populations on the medication’s package insert (prescribing information), consult a web site such as MotherToBaby (mothertobaby.org/healthcare-professionals/), and/or search for the latest research on PubMed.
5. Collaborate with the patient’s obstetrician or family medicine physician. Make sure that you are on the same page regarding treating the patient’s psychosis. Other clinicians often will agree with your treatment plan because they understand the risks of untreated psychosis compared with other risks the patient is facing. However, if you don’t communicate with your patient’s other health care professionals, she might receive mixed messages.
6. As for medication choice, pregnancy is the most important time to conduct a careful medication history to inform your choice of medication. Was Medication X ineffective, or did the patient not pick it up from the pharmacy? Did she really have a trial of 3 months, or did she only take it for a week before she decided to stop?
Continue to: Determine which medication has worked for the patient in the past
7. Determine which medication has worked for the patient in the past. If Medication Y worked before she was pregnant, it is likely to still work during pregnancy. If it is a relatively safe option, it may be the best choice.
8. Avoid multiple medication exposures wherever possible. If a patient is taking Medication Z, it is working, and she tells you she is 3 months pregnant, it is often better to continue it (assuming it is a relatively safe medication) than to switch to Medication A, which has slightly better “safety data.” By switching to a different antipsychotic, you would be exposing the fetus to a second agent that may not even work for the mother.
9. Focus on treating the patient’s present symptoms. Medication doses may need to change due to pregnancy-related changes in symptoms, drug distribution, and/or metabolism.
10. Remain vigilant for other risks. Keep in mind that pregnant women with psychosis often face risks other than psychiatric medications and psychosis. Comorbidities such as substance use disorders, obesity, and poor prenatal care must also be addressed.3
11. Follow your patient more closely during pregnancy. Pregnancy is an uncertain time for any new mother. Be sure to have an open line of communication with the patient, and be responsive to her concerns.
Continue to: Provide psychoeducation about the postpartum period
12. Provide psychoeducation about the postpartum period. Pregnancy is the time to educate your patient about the importance of sleep, warning signs of exacerbation of psychosis, and breastfeeding safety.
13. Be proactive with future female patients of childbearing age, regardless of whether they tell you they are sexually active. Women with psychosis have higher rates of unplanned pregnancy.3,4 When initiating treatment of psychosis in a woman of childbearing age, rather than treating her with the newest available medication that does not yet have safety data in pregnancy, it is best to start with a medication already known to be relatively safe in pregnancy. This way, if she were to become pregnant, your treatment plan would already be safe and appropriate.
14. Consult a reproductive psychiatrist if needed.
1. Einarson A, Boskovic R. Use and safety of antipsychotic drugs during pregnancy. J Psychiatr Pract. 2009;15(3):183-192.
2. Galbally M, Crabb C. Schizophrenia and psychotic disorders. O&G. 2018;20(3). https://www.ogmagazine.org.au/20/3-20/schizophrenia-and-psychotic-disorders/
3. Miller LJ. Sexuality, reproduction, and family planning in women with schizophrenia. Schizophr Bull. 1997;23(4):623-635.
4. Friedman SH, Hall RCW, Sorrentino RM. Involuntary treatment of psychosis in pregnancy. J Am Acad Psychiatry Law. 2018;46(2):217-223.

Recommending esketamine? 4 factors to consider
Since receiving FDA approval in March 2019, intranasal esketamine—the S-enantiomer of ketamine—has become a valuable treatment option for adults with treatment-resistant depression (TRD), owing to its limited adverse effects profile, rapid onset, and potential for significant improvement in depressive symptoms. In August 2020, the FDA expanded esketamine’s indication to include treatment of depressive symptoms in adults with acute suicidal ideation or behavior, thus providing psychiatrists with an additional option for improving the care of their most seriously ill patients. In this article, we review 4 factors to consider before recommending esketamine.
1. Confirm that the patient’s depression qualifies as treatment-resistant. A patient is considered to have TRD if they have long-standing depression that meets DSM-5 criteria for major depressive disorder, and have not adequately responded to at least 2 antidepressant trials of adequate dose and duration.
2. Confirm that the patient’s suicidal ideation and/or suicidal behavior does not require acute hospitalization. The time between the onset of suicidal ideation and a suicide attempt typically is short, which highlights the need to intervene quickly in these patients.1 Being able to provide a treatment that works quickly and effectively may be lifesaving. However, to receive esketamine, patients must be enrolled in the Risk Evaluation Mitigation Strategy (REMS) patient registry through a certified treatment center, and prior authorization from insurance generally is required. These steps take time, so patients at high or imminent risk for suicide may initially require psychiatric hospitalization before they are able to begin esketamine treatment. Parsing out whether the suicidal ideation is chronic or acute can help clinicians assess current dangerousness and determine if esketamine treatment might be appropriate. If a patient with chronic suicidal ideation is stable for outpatient treatment with close monitoring, esketamine might provide an effective treatment option for treating both depression and suicidality. Esketamine’s rapid effect may be an integral part of the treatment for a suicidal patient by bridging the gap caused by the delayed onset of action in typical antidepressants.2
3. Identify a local certified treatment center. Use the online database at www.spravato.com/find-a-center to locate a nearby certified esketamine treatment center. Choosing a center that you can collaborate with regularly is important to determine if the treatment is effective, to provide updates on the treatment course, and to consider tailoring of ongoing treatment.
4. Ensure the patient is also treated with an oral antidepressant. Esketamine should be administered in conjunction with an oral antidepressant. As such, patients must be willing and able to tolerate treatment with a medication that can be construed as an antidepressant while undergoing esketamine treatment. A long-term maintenance trial found that patients with TRD who experienced remission or response after esketamine treatment had a delayed relapse of symptoms when they continued esketamine in addition to an oral antidepressant.3
Considering its rapid onset of action and low adverse effects profile with manageable tolerability, esketamine adjunctive to an oral antidepressant is a reasonable option to consider for patients with TRD, including those with suicidality.
1. Deisenhammer EA, Ing CM, Strauss R, et al. The duration of the suicidal process: how much time is left for intervention between consideration and accomplishment of a suicide attempt? J Clin Psychiatry. 2009;70(1):19-24.
2. Canuso CM, Singh JB, Fedgchin M, et al. Efficacy and safety of intranasal esketamine for the rapid reduction of symptoms of depression and suicidality in patients at imminent risk for suicide: results of a double-blind, randomized, placebo-controlled study. Am J Psychiatry. 2018;175(7):620-630.
3. Daly EJ, Trivedi MH, Janik A, et al. Efficacy of esketamine nasal spray plus oral antidepressant treatment for relapse prevention in patients with treatment-resistant depression. JAMA Psychiatry. 2019;76(9):893-903.
Since receiving FDA approval in March 2019, intranasal esketamine—the S-enantiomer of ketamine—has become a valuable treatment option for adults with treatment-resistant depression (TRD), owing to its limited adverse effects profile, rapid onset, and potential for significant improvement in depressive symptoms. In August 2020, the FDA expanded esketamine’s indication to include treatment of depressive symptoms in adults with acute suicidal ideation or behavior, thus providing psychiatrists with an additional option for improving the care of their most seriously ill patients. In this article, we review 4 factors to consider before recommending esketamine.
1. Confirm that the patient’s depression qualifies as treatment-resistant. A patient is considered to have TRD if they have long-standing depression that meets DSM-5 criteria for major depressive disorder, and have not adequately responded to at least 2 antidepressant trials of adequate dose and duration.
2. Confirm that the patient’s suicidal ideation and/or suicidal behavior does not require acute hospitalization. The time between the onset of suicidal ideation and a suicide attempt typically is short, which highlights the need to intervene quickly in these patients.1 Being able to provide a treatment that works quickly and effectively may be lifesaving. However, to receive esketamine, patients must be enrolled in the Risk Evaluation Mitigation Strategy (REMS) patient registry through a certified treatment center, and prior authorization from insurance generally is required. These steps take time, so patients at high or imminent risk for suicide may initially require psychiatric hospitalization before they are able to begin esketamine treatment. Parsing out whether the suicidal ideation is chronic or acute can help clinicians assess current dangerousness and determine if esketamine treatment might be appropriate. If a patient with chronic suicidal ideation is stable for outpatient treatment with close monitoring, esketamine might provide an effective treatment option for treating both depression and suicidality. Esketamine’s rapid effect may be an integral part of the treatment for a suicidal patient by bridging the gap caused by the delayed onset of action in typical antidepressants.2
3. Identify a local certified treatment center. Use the online database at www.spravato.com/find-a-center to locate a nearby certified esketamine treatment center. Choosing a center that you can collaborate with regularly is important to determine if the treatment is effective, to provide updates on the treatment course, and to consider tailoring of ongoing treatment.
4. Ensure the patient is also treated with an oral antidepressant. Esketamine should be administered in conjunction with an oral antidepressant. As such, patients must be willing and able to tolerate treatment with a medication that can be construed as an antidepressant while undergoing esketamine treatment. A long-term maintenance trial found that patients with TRD who experienced remission or response after esketamine treatment had a delayed relapse of symptoms when they continued esketamine in addition to an oral antidepressant.3
Considering its rapid onset of action and low adverse effects profile with manageable tolerability, esketamine adjunctive to an oral antidepressant is a reasonable option to consider for patients with TRD, including those with suicidality.
1. Deisenhammer EA, Ing CM, Strauss R, et al. The duration of the suicidal process: how much time is left for intervention between consideration and accomplishment of a suicide attempt? J Clin Psychiatry. 2009;70(1):19-24.
2. Canuso CM, Singh JB, Fedgchin M, et al. Efficacy and safety of intranasal esketamine for the rapid reduction of symptoms of depression and suicidality in patients at imminent risk for suicide: results of a double-blind, randomized, placebo-controlled study. Am J Psychiatry. 2018;175(7):620-630.
3. Daly EJ, Trivedi MH, Janik A, et al. Efficacy of esketamine nasal spray plus oral antidepressant treatment for relapse prevention in patients with treatment-resistant depression. JAMA Psychiatry. 2019;76(9):893-903.

Does MELD need an update?
Dear colleagues and friends,
The Perspectives series continues! There are few issues in our discipline that are as challenging, and controversial, as liver transplant prioritization. The Model for End-Stage Liver Disease (MELD) has been the mainstay for organ allocation for nearly 2 decades, and there has been vigorous debate as to whether it should remain so. In this issue, Dr. Jasmohan Bajaj and Dr. Julie Heimbach discuss the strengths and limitations of MELD and provide a vision of upcoming developments. As always, I welcome your feedback and suggestions for future topics at [email protected].
Charles J. Kahi, MD, MS, AGAF, is professor of medicine at Indiana University, Indianapolis. He is an associate editor for GI & Hepatology News.
Yes, it’s time for an update
BY JASMOHAN S. BAJAJ, MD, AGAF
Since February 2002, the U.S.-based liver transplant system has adopted the MELD score for transplant priority. Initially developed to predict outcomes after transjugular intrahepatic porto-systemic shunt, it was modified to exclude etiology for the purpose of listing patients.1

There were several advantages with MELD including objectivity, ease of calculation using a website, and over time, a burgeoning experience nationwide that extended even beyond transplant. Moreover, it focused on “sickest-first,” did away with the extremely “manipulable” waiting list, and left off hepatic encephalopathy (HE) and ascites severity.1 However, even earlier on, there were concerns regarding not capturing hepatocellular cancer (HCC) and some complications of cirrhosis that required exceptions. The points awarded to all these exceptions also changed with time, with lower priority and reincorporation of the waiting list time for HCC. Over time, the addition of serum sodium led it to be converted to “MELD-Na,” which now remains the primary method for transplant listing priority.
But the population with cirrhosis that existed 20 years ago has shifted radically. Patients with cirrhosis currently tend to either be much older with more comorbid conditions that predispose them to chronic kidney disease and cerebrovascular and cardiovascular compromise or be younger with an earlier presentation of alcohol-associated hepatitis. Moreover, the widespread availability of hepatitis C virus (HCV) eradication has changed the landscape and stopped the progression of cirrhosis organically by virtually removing that etiology. This is relevant because a recent United Network for Organ Sharing (UNOS) analysis showed that the concordance between MELD score and 90-day mortality was the lowest in the rapidly increasing population with alcohol-related and nonalcoholic fatty liver disease etiologies, but conversely, this concordance was the highest in the population with hepatitis C–related cirrhosis.2 These demographic shifts in age and changes in etiology likely lessen the predictive power of the current MELD score iteration.
There is also increasing evidence that MELD is “stuck in the middle.” This means that both patients at low MELD score and those with organ failures may be underserved with respect to transplant listing with the current MELD score iteration.
Among patients with a MELD score disproportionately lower than their complications of cirrhosis several studies demonstrate the improvement in prognostication with addition of covert HE, history of overt HE, frailty, and sarcopenia indices. These are independently prognostic variables that affect daily function, affect patient-reported outcomes, and can influence readmissions. The burden of impending falls, readmissions, infections, and overall ill health is not captured even though relatively objective methods such as cognitive tests and documented admissions for overt HE can be utilized.3 This relative mistrust in including HE and covariables likely harkens back to a dramatic reduction in grade III/IV HE severity seen the year after MELD introduction, when compared with the year before, during which that designation was added to the listing priority.4 However, objective additions to the MELD score that capture the distress of patients and their families with multiple readmissions for HE worsened by sarcopenia are desperately needed (see table).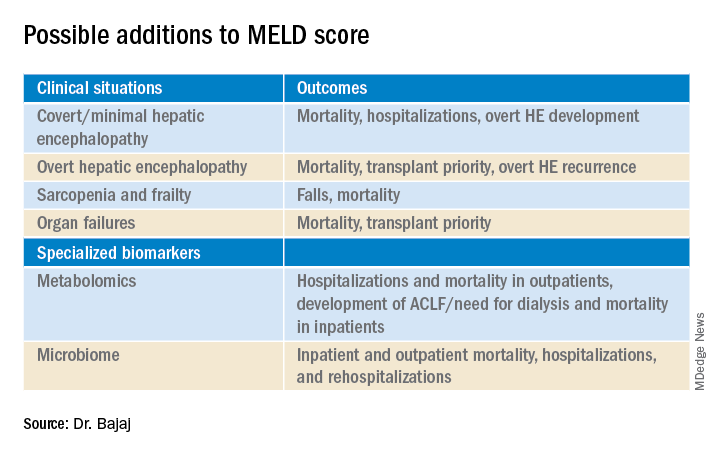
On the other extreme, there is an increasing recognition of acute-on-chronic liver failure (ACLF) and higher acceptability for transplanting alcohol-associated hepatitis (AAH).5 Prognostic variables in AAH have relied on Maddrey’s score and MELD score as well as the dynamic Lille score. The ability of MELD to predict outcomes is variable, but it is still required for listing these critical patients. A relatively newer entity, ACLF is defined variably across the world. In retrospective studies of the UNOS database in which patients were listed based on native MELD score rather than ACLF grades, there was a cut-off beyond which transplant was not useful. However, there is evidence that organ failures that do not involve creatinine or INR can influence survival independent of the MELD score.5 The rapidly increasing burden of critical illness may force a rethink of allocation policies, but a recent survey among U.S.-based transplant providers found little appetite to do so currently.
Objectivity is a major strength of the MELD score, but several systemic issues, including creatinine variability by sex, interlaboratory inconsistencies in laboratory results, and lack of accounting for international normalized ratio (INR) changes in those on warfarin or other INR-prolonging medications, to name a few that still exist.6 However, in our zeal to list patients and get the maximum chance for organ offers, there is a tendency to maximize or inflate the listing scores. This hope to provide the best care for patients under our specific care could come at the expense of patients listed elsewhere, but no score, however objective, is going to completely eliminate this possibility.
So, does this mean MELD-Na should be abandoned?
Absolutely not. An ecosystem of practitioners has now grown up under this system in the U.S., and it is rapidly being exported to other parts of the world. As with everything else, we need to keep up with the times, and for the popular MELD score, it needs to be responsive to issues at both extremes of cirrhosis severity. Studies on specialized markers such as serum, urine, and stool metabolomics as well as microbiome could be an objective addition to MELD score, but further studies are needed. It is also likely that artificial intelligence approaches could be used to not only improve access but also geographic equity that has plagued liver transplant in the U.S.
In the immortal words of Bob Dylan, “The times, they are a-changin’ …” We have to make sure the MELD score does too.
Jasmohan S. Bajaj, MD, AGAF, is with the division of gastroenterology, hepatology, and nutrition at Virginia Commonwealth University, Richmond, and Richmond VA Medical Center. He has no conflicts of interest.
References
1. Kamath PS and Kim WR. Hepatology. 2007;45:797-805.
2. Godfrey EL et al. Am J Transplant. 2019;19:3299-307.
3. Acharya C and Bajaj JS. Liver Transpl. 2021 May 21. doi:10.1002/lt.26099.
4. Bajaj JS and Saeian K. Dig Dis Sci 2005;50:753-6.
5. Artru F and Samuel D. JHEP Rep 2019 May;1(1):53-65.
6. Bernardi M et al. J Hepatol 2010 Dec 9;54:1297-306.
Maybe, but take it slow
BY JULIE K. HEIMBACH, MD
Even though 2020 was another record year for organ donation in the United States, a truly remarkable feat considering the profound impact of COVID-19 on health care as well as the population at large, there remains a critical shortage of available liver allografts.1 Last year in the U.S., of the approximately 13,000 patients waiting for a liver transplant, just under 9,000 patients underwent liver transplantation from a deceased or a living donor, while 2,345 either died waiting on the list or were removed for being too sick, and the rest remained waiting.1 In a perfect system, we would transplant every wait-listed patient at a time that would provide them the greatest benefit with the least amount of distress. However, because of the shortage of available organs for transplantation, an allocation system to rank wait-listed candidates is required. Because organ transplantation relies on the incredible altruism of individuals and their family members who make this ultimate gift on their behalf, it is crucial both for donor families and for waiting recipients that organ allocation be transparent, as fair and equitable as possible, and compliant with federal law, which is currently determined by the “Final Rule” that states that organ allocation be based in order of urgency.2

Since February 2002, U.S. liver allocation policy has been based on MELD.3 Prior to that time, liver allocation was based in part on the Child-Turcot-Pugh classification of liver disease, which included subjective components (ascites and encephalopathy) that are difficult to measure, as well as increased priority based on admission to the intensive care unit, also subjective and open to interpretation or abuse. Most crucially, the system defaulted to length of waiting time with large numbers of patients in the same category, which led to higher death rates for patients whose disease progressed more quickly or who were referred very late in their disease course.
MELD relies on a simple set of laboratory values that are easily obtained at any clinical lab and are already being routinely monitored as part of standard care for patients with end-stage liver disease.3 MELD initially required just three variables (bilirubin, creatinine, INR) and was updated to include just four variables with the adoption of MELD-Na in 2016, which added sodium levels. The MELD- and MELD-Na–based approach is a highly reliable, accurate way to rank patients who are most at risk of death in the next 3 months, with a C statistic of approximately 0.83-0.84.3,4 Perhaps the greatest testament to the strength of MELD is that, following the adoption of MELD-based liver allocation, MELD has gradually been adopted as the system of liver allocation by most countries around the world.
With the adoption of MELD and subsequently MELD-Na, which prioritize deceased donor liver allografts to the sickest patients first and is therefore compliant with the Final Rule, outcomes for patients waiting for liver transplant have steadily improved.3,4 In addition, MELD has provided an easily obtainable, objective measure to guide decisions about timing of liver transplant, especially in the setting of potential living donor liver transplantation. MELD is also predictive of outcome for patients undergoing nontransplant elective and emergent surgical procedures, and because of the ease in calculating the score, it allows for an objective comparison of patients with cirrhosis across a variety of clinical and research settings.
The MELD system has many additional strengths, though perhaps the most important is that it is adaptable. While the MELD score accurately predicts death from chronic liver disease, the MELD score is not able to predict mortality or risk of wait-list dropout due to disease progression from certain complications of chronic liver disease such as the development of HCC or hepatopulmonary syndrome, in which access to timely transplantation has been proven to be beneficial. This has required an adaption to the system whereby candidates with conditions, such as HCC, that meet specific criteria receive an assigned MELD score, rather than a calculated score. Determining which patients should qualify for MELD exceptions, as well as what the assigned priority score should be, has required careful analysis and ongoing revision. An additional issue for MELD, which was identified more than a decade ago and is overdue for adjustment, is the disparity in access to transplant for women who continue to experience a lower transplant rate (14.4% according to the most recent analysis) and approximately 8.6% higher death rate than men with the same MELD score.5 This is due, in part, to the use of creatinine in the MELD equation, which as a by-product of muscle metabolism, underestimates the degree of renal dysfunction in women and thus underestimates their risk of wait-list mortality.5 A potential modification to the MELD-Na score that corrects for this sex-based disparity is currently being studied by the OPTN Liver-Intestine committee, which is further evidence of the strength and adaptability of a MELD-based allocation system.
While it is tempting to conclude that a system that requires on-going monitoring and revision is best discarded in favor of a new model such as an artificial intelligence–based solution, policy development requires a tremendous amount of time for consensus-building, as well as effort to ensure that unexpected negative effects are not created. Whereas a novel system could be identified and determined to be superior down the road, the amount of effort and expense that would be needed to build consensus around such a new model should not be underestimated. Considering the challenges to health care and the population at large that are already occurring as we emerge from the COVID pandemic, as well as the short-term need to monitor the impact from the recent adoption of the acuity circle model which went live in February 2020 and allocates according to MELD but over a broader geographic area based on a circle around the donor hospital, building consensus around incremental changes to a MELD-based allocation system likely represents the best option in our continued quest for the optimal liver allocation system.
Julie K. Heimbach, MD, is a transplant surgeon and the surgical director of liver transplantation at Mayo Clinic in Rochester, Minn. She has no conflicts to report.
References
1. Organ Procurement and Transplantation Network data. Available at https://optn.transplant.hrsa.gov/data/view-data-reports/national-data. Accessed May 1, 2021.
2. Organ Procurement and Transplantation Network. Final rule. Available at https://optn.transplant.hrsa.gov/governance/about-the-optn/final-rule. Accessed May 1, 2021.
3. Wiesner R et al; United Network for Organ Sharing Liver Disease Severity Score Committee. Gastroenterology. 2003 Jan;124(1):91-6.
4. Nagai S et al. Gastroenterology. 2018 Nov;155(5):1451-62.e3.
5. Locke JE et al. JAMA Surg. 2020 Jul 1;155(7):e201129.
Dear colleagues and friends,
The Perspectives series continues! There are few issues in our discipline that are as challenging, and controversial, as liver transplant prioritization. The Model for End-Stage Liver Disease (MELD) has been the mainstay for organ allocation for nearly 2 decades, and there has been vigorous debate as to whether it should remain so. In this issue, Dr. Jasmohan Bajaj and Dr. Julie Heimbach discuss the strengths and limitations of MELD and provide a vision of upcoming developments. As always, I welcome your feedback and suggestions for future topics at [email protected].
Charles J. Kahi, MD, MS, AGAF, is professor of medicine at Indiana University, Indianapolis. He is an associate editor for GI & Hepatology News.
Yes, it’s time for an update
BY JASMOHAN S. BAJAJ, MD, AGAF
Since February 2002, the U.S.-based liver transplant system has adopted the MELD score for transplant priority. Initially developed to predict outcomes after transjugular intrahepatic porto-systemic shunt, it was modified to exclude etiology for the purpose of listing patients.1
There were several advantages with MELD including objectivity, ease of calculation using a website, and over time, a burgeoning experience nationwide that extended even beyond transplant. Moreover, it focused on “sickest-first,” did away with the extremely “manipulable” waiting list, and left off hepatic encephalopathy (HE) and ascites severity.1 However, even earlier on, there were concerns regarding not capturing hepatocellular cancer (HCC) and some complications of cirrhosis that required exceptions. The points awarded to all these exceptions also changed with time, with lower priority and reincorporation of the waiting list time for HCC. Over time, the addition of serum sodium led it to be converted to “MELD-Na,” which now remains the primary method for transplant listing priority.
But the population with cirrhosis that existed 20 years ago has shifted radically. Patients with cirrhosis currently tend to either be much older with more comorbid conditions that predispose them to chronic kidney disease and cerebrovascular and cardiovascular compromise or be younger with an earlier presentation of alcohol-associated hepatitis. Moreover, the widespread availability of hepatitis C virus (HCV) eradication has changed the landscape and stopped the progression of cirrhosis organically by virtually removing that etiology. This is relevant because a recent United Network for Organ Sharing (UNOS) analysis showed that the concordance between MELD score and 90-day mortality was the lowest in the rapidly increasing population with alcohol-related and nonalcoholic fatty liver disease etiologies, but conversely, this concordance was the highest in the population with hepatitis C–related cirrhosis.2 These demographic shifts in age and changes in etiology likely lessen the predictive power of the current MELD score iteration.
There is also increasing evidence that MELD is “stuck in the middle.” This means that both patients at low MELD score and those with organ failures may be underserved with respect to transplant listing with the current MELD score iteration.
Among patients with a MELD score disproportionately lower than their complications of cirrhosis several studies demonstrate the improvement in prognostication with addition of covert HE, history of overt HE, frailty, and sarcopenia indices. These are independently prognostic variables that affect daily function, affect patient-reported outcomes, and can influence readmissions. The burden of impending falls, readmissions, infections, and overall ill health is not captured even though relatively objective methods such as cognitive tests and documented admissions for overt HE can be utilized.3 This relative mistrust in including HE and covariables likely harkens back to a dramatic reduction in grade III/IV HE severity seen the year after MELD introduction, when compared with the year before, during which that designation was added to the listing priority.4 However, objective additions to the MELD score that capture the distress of patients and their families with multiple readmissions for HE worsened by sarcopenia are desperately needed (see table).
On the other extreme, there is an increasing recognition of acute-on-chronic liver failure (ACLF) and higher acceptability for transplanting alcohol-associated hepatitis (AAH).5 Prognostic variables in AAH have relied on Maddrey’s score and MELD score as well as the dynamic Lille score. The ability of MELD to predict outcomes is variable, but it is still required for listing these critical patients. A relatively newer entity, ACLF is defined variably across the world. In retrospective studies of the UNOS database in which patients were listed based on native MELD score rather than ACLF grades, there was a cut-off beyond which transplant was not useful. However, there is evidence that organ failures that do not involve creatinine or INR can influence survival independent of the MELD score.5 The rapidly increasing burden of critical illness may force a rethink of allocation policies, but a recent survey among U.S.-based transplant providers found little appetite to do so currently.
Objectivity is a major strength of the MELD score, but several systemic issues, including creatinine variability by sex, interlaboratory inconsistencies in laboratory results, and lack of accounting for international normalized ratio (INR) changes in those on warfarin or other INR-prolonging medications, to name a few that still exist.6 However, in our zeal to list patients and get the maximum chance for organ offers, there is a tendency to maximize or inflate the listing scores. This hope to provide the best care for patients under our specific care could come at the expense of patients listed elsewhere, but no score, however objective, is going to completely eliminate this possibility.
So, does this mean MELD-Na should be abandoned?
Absolutely not. An ecosystem of practitioners has now grown up under this system in the U.S., and it is rapidly being exported to other parts of the world. As with everything else, we need to keep up with the times, and for the popular MELD score, it needs to be responsive to issues at both extremes of cirrhosis severity. Studies on specialized markers such as serum, urine, and stool metabolomics as well as microbiome could be an objective addition to MELD score, but further studies are needed. It is also likely that artificial intelligence approaches could be used to not only improve access but also geographic equity that has plagued liver transplant in the U.S.
In the immortal words of Bob Dylan, “The times, they are a-changin’ …” We have to make sure the MELD score does too.
Jasmohan S. Bajaj, MD, AGAF, is with the division of gastroenterology, hepatology, and nutrition at Virginia Commonwealth University, Richmond, and Richmond VA Medical Center. He has no conflicts of interest.
References
1. Kamath PS and Kim WR. Hepatology. 2007;45:797-805.
2. Godfrey EL et al. Am J Transplant. 2019;19:3299-307.
3. Acharya C and Bajaj JS. Liver Transpl. 2021 May 21. doi:10.1002/lt.26099.
4. Bajaj JS and Saeian K. Dig Dis Sci 2005;50:753-6.
5. Artru F and Samuel D. JHEP Rep 2019 May;1(1):53-65.
6. Bernardi M et al. J Hepatol 2010 Dec 9;54:1297-306.
Maybe, but take it slow
BY JULIE K. HEIMBACH, MD
Even though 2020 was another record year for organ donation in the United States, a truly remarkable feat considering the profound impact of COVID-19 on health care as well as the population at large, there remains a critical shortage of available liver allografts.1 Last year in the U.S., of the approximately 13,000 patients waiting for a liver transplant, just under 9,000 patients underwent liver transplantation from a deceased or a living donor, while 2,345 either died waiting on the list or were removed for being too sick, and the rest remained waiting.1 In a perfect system, we would transplant every wait-listed patient at a time that would provide them the greatest benefit with the least amount of distress. However, because of the shortage of available organs for transplantation, an allocation system to rank wait-listed candidates is required. Because organ transplantation relies on the incredible altruism of individuals and their family members who make this ultimate gift on their behalf, it is crucial both for donor families and for waiting recipients that organ allocation be transparent, as fair and equitable as possible, and compliant with federal law, which is currently determined by the “Final Rule” that states that organ allocation be based in order of urgency.2
Since February 2002, U.S. liver allocation policy has been based on MELD.3 Prior to that time, liver allocation was based in part on the Child-Turcot-Pugh classification of liver disease, which included subjective components (ascites and encephalopathy) that are difficult to measure, as well as increased priority based on admission to the intensive care unit, also subjective and open to interpretation or abuse. Most crucially, the system defaulted to length of waiting time with large numbers of patients in the same category, which led to higher death rates for patients whose disease progressed more quickly or who were referred very late in their disease course.
MELD relies on a simple set of laboratory values that are easily obtained at any clinical lab and are already being routinely monitored as part of standard care for patients with end-stage liver disease.3 MELD initially required just three variables (bilirubin, creatinine, INR) and was updated to include just four variables with the adoption of MELD-Na in 2016, which added sodium levels. The MELD- and MELD-Na–based approach is a highly reliable, accurate way to rank patients who are most at risk of death in the next 3 months, with a C statistic of approximately 0.83-0.84.3,4 Perhaps the greatest testament to the strength of MELD is that, following the adoption of MELD-based liver allocation, MELD has gradually been adopted as the system of liver allocation by most countries around the world.
With the adoption of MELD and subsequently MELD-Na, which prioritize deceased donor liver allografts to the sickest patients first and is therefore compliant with the Final Rule, outcomes for patients waiting for liver transplant have steadily improved.3,4 In addition, MELD has provided an easily obtainable, objective measure to guide decisions about timing of liver transplant, especially in the setting of potential living donor liver transplantation. MELD is also predictive of outcome for patients undergoing nontransplant elective and emergent surgical procedures, and because of the ease in calculating the score, it allows for an objective comparison of patients with cirrhosis across a variety of clinical and research settings.
The MELD system has many additional strengths, though perhaps the most important is that it is adaptable. While the MELD score accurately predicts death from chronic liver disease, the MELD score is not able to predict mortality or risk of wait-list dropout due to disease progression from certain complications of chronic liver disease such as the development of HCC or hepatopulmonary syndrome, in which access to timely transplantation has been proven to be beneficial. This has required an adaption to the system whereby candidates with conditions, such as HCC, that meet specific criteria receive an assigned MELD score, rather than a calculated score. Determining which patients should qualify for MELD exceptions, as well as what the assigned priority score should be, has required careful analysis and ongoing revision. An additional issue for MELD, which was identified more than a decade ago and is overdue for adjustment, is the disparity in access to transplant for women who continue to experience a lower transplant rate (14.4% according to the most recent analysis) and approximately 8.6% higher death rate than men with the same MELD score.5 This is due, in part, to the use of creatinine in the MELD equation, which as a by-product of muscle metabolism, underestimates the degree of renal dysfunction in women and thus underestimates their risk of wait-list mortality.5 A potential modification to the MELD-Na score that corrects for this sex-based disparity is currently being studied by the OPTN Liver-Intestine committee, which is further evidence of the strength and adaptability of a MELD-based allocation system.
While it is tempting to conclude that a system that requires on-going monitoring and revision is best discarded in favor of a new model such as an artificial intelligence–based solution, policy development requires a tremendous amount of time for consensus-building, as well as effort to ensure that unexpected negative effects are not created. Whereas a novel system could be identified and determined to be superior down the road, the amount of effort and expense that would be needed to build consensus around such a new model should not be underestimated. Considering the challenges to health care and the population at large that are already occurring as we emerge from the COVID pandemic, as well as the short-term need to monitor the impact from the recent adoption of the acuity circle model which went live in February 2020 and allocates according to MELD but over a broader geographic area based on a circle around the donor hospital, building consensus around incremental changes to a MELD-based allocation system likely represents the best option in our continued quest for the optimal liver allocation system.
Julie K. Heimbach, MD, is a transplant surgeon and the surgical director of liver transplantation at Mayo Clinic in Rochester, Minn. She has no conflicts to report.
References
1. Organ Procurement and Transplantation Network data. Available at https://optn.transplant.hrsa.gov/data/view-data-reports/national-data. Accessed May 1, 2021.
2. Organ Procurement and Transplantation Network. Final rule. Available at https://optn.transplant.hrsa.gov/governance/about-the-optn/final-rule. Accessed May 1, 2021.
3. Wiesner R et al; United Network for Organ Sharing Liver Disease Severity Score Committee. Gastroenterology. 2003 Jan;124(1):91-6.
4. Nagai S et al. Gastroenterology. 2018 Nov;155(5):1451-62.e3.
5. Locke JE et al. JAMA Surg. 2020 Jul 1;155(7):e201129.
Get to know this year’s Julius Friedenwald Medal recipient: Dr. Michael Camilleri
In last month’s Gastroenterology, Vijay H. Shah, MD, and colleagues share a commentary on the esteemed career of this year’s Julius Friedenwald Medal recipient, Michael Camilleri, MD, of the Mayo Clinic in Rochester, Minnesota. Here are some fun facts about this year’s honoree:
- While growing up in Malta, he was influenced by a combination of his uncle, a kindly family physician, and by watching the shows Dr. Kildare and Marcus Welby, M.D., on a black-and-white television set during his childhood, which led Dr. Camilleri to commit to a career in medicine by the age of 8.
- Dr. Camilleri started his journey at the Mayo Clinic as a research fellow in 1983 conducting fundamental clinical research in GI motility.
- With 660 peer-reviewed original articles and 290 published invited reviews and editorial publications, Dr. Camilleri has redefined the understanding and treatment of disorders covering the entire GI tract from rumination syndrome to pelvic dyssynergia.
- Dr. Camilleri has mentored 79 postdoctoral fellows since he joined the faculty at Mayo Clinic 35 years ago.
Read more about Dr. Camilleri’s life and contribution to the GI community in this Gastroenterology commentary, written by his colleagues and friends, including Dr. Shah and Adil E. Bharucha, MBBS, MD; David A. Katzka, MD; and Gregory J. Gores, MD.
A new world awaits us all
July is typically the month when new students/physicians arrive at academic medical centers, schools, and hospitals to begin the next phase of training. July also marks the beginning of practice for graduating fellows. In the post-COVID world, these settings will have changed dramatically from the past.

Community practices are consolidating rapidly, with many being acquired by private equity firms, hospitals, and health systems. Private equity made its first investment in GI in 2016, when Audax acquired Miami-based Gastro Health. It was announced this past May that Audax sold Gastro Health to Omers (a larger, Canadian PE firm), marking the first PE sale of a practice (second bite) (Newitt P. “Gastro Health sold to private equity company.” Becker’s GI & Endoscopy. 2021 May 19). The financial success of this model has not been lost on any community practice, so expect more such transactions.
Health systems are bouncing back from 2020, with balance sheets that are recovering quickly. But operating margins are still narrow so physician productivity is being pushed and burnout is a hot-button issue. Older workers are retiring at increasing rates, and low-wage workers are often reluctant to return to the workforce. Both trends increase Medicare and Medicaid rolls. As more patients enter government insurance programs, provider reimbursement falls. “Manage to Medicare” (bringing costs down to levels that are sustainable on Medicare rates) has again become a common goal. The historic reaction to these financial pressures has been to push commercial rates higher thru market consolidation and emphasize margin-producing services.
COVID has changed medicine. We will deliver care differently, and health inequities inherent in the current system will not be tolerable. We now can analyze population-level health outcomes by mining data from enormous databases containing both administrative and health records. Imagine the information we could derive by analyzing IBD populations scattered across multiple states, all cared for by 1,000 gastroenterologists working in a mega practice that uses a single electronic medical record. That might break down the town-gown barrier quickly.
John I. Allen, MD, MBA, AGAF
Editor in Chief
July is typically the month when new students/physicians arrive at academic medical centers, schools, and hospitals to begin the next phase of training. July also marks the beginning of practice for graduating fellows. In the post-COVID world, these settings will have changed dramatically from the past.
Community practices are consolidating rapidly, with many being acquired by private equity firms, hospitals, and health systems. Private equity made its first investment in GI in 2016, when Audax acquired Miami-based Gastro Health. It was announced this past May that Audax sold Gastro Health to Omers (a larger, Canadian PE firm), marking the first PE sale of a practice (second bite) (Newitt P. “Gastro Health sold to private equity company.” Becker’s GI & Endoscopy. 2021 May 19). The financial success of this model has not been lost on any community practice, so expect more such transactions.
Health systems are bouncing back from 2020, with balance sheets that are recovering quickly. But operating margins are still narrow so physician productivity is being pushed and burnout is a hot-button issue. Older workers are retiring at increasing rates, and low-wage workers are often reluctant to return to the workforce. Both trends increase Medicare and Medicaid rolls. As more patients enter government insurance programs, provider reimbursement falls. “Manage to Medicare” (bringing costs down to levels that are sustainable on Medicare rates) has again become a common goal. The historic reaction to these financial pressures has been to push commercial rates higher thru market consolidation and emphasize margin-producing services.
COVID has changed medicine. We will deliver care differently, and health inequities inherent in the current system will not be tolerable. We now can analyze population-level health outcomes by mining data from enormous databases containing both administrative and health records. Imagine the information we could derive by analyzing IBD populations scattered across multiple states, all cared for by 1,000 gastroenterologists working in a mega practice that uses a single electronic medical record. That might break down the town-gown barrier quickly.
John I. Allen, MD, MBA, AGAF
Editor in Chief

July 2021 - What's the diagnosis?
Answer: Erythropoietic protoporphyria.Figure B demonstrated massive cholestasis with brown deposits that represented protoporphyrin precipitates, which plugged the bile ducts and led to a cholestatic pattern of liver injury. Under polarized light, protoporhyrin precipitates produced Maltese crosses (Figure C), which are pathognomonic of erythropoietic protoporphyria (EPP). Porphyria is a rare group of inherited heme biosynthesis disorders. EPP is an uncommon type of porphyria and is secondary to a ferrochelatase (FECH) gene mutation, which results in deficient activity of the mitochondrial enzyme FECH.1
FECH catalyzes chelation of iron into proptoporphyrin IX to form heme. The inability of protoporphyrins to be transformed into heme inhibits hepatic elimination and results in hepatocyte accumulation of protoporphyrins, leading to protoporphyrin precipitation in bile canaliculi. Painful photosensitivity (Figure A) is the most common manifestation of EPP, beginning in childhood.2 Only a small proportion of patients with EPP develop liver dysfunction but the consequences can be severe.2 Therefore, therapeutic decisions are based on limited published experience without randomized, controlled data.2 One treatment method is to attempt to remove protoporphyrins from the blood via therapeutic plasma exchange.2Our patient underwent one session of therapeutic plasma exchange; however, after this initial course of treatment, the patient’s goals of care changed and she elected to enroll in hospice. Patients with severe liver dysfunction as a result of EPP require consideration of liver transplantation in the setting of fulminant hepatic failure. Liver transplantation does not cure EPP; the graft is at risk for similar EPP-related changes.1 Only bone marrow transplantation can correct the underlying enzymatic defect in FECH.1 Although physicians are often taught “common things are common,” this case highlights a rare complication of a rare disease such as porphyria is an often forgotten or missed condition. Vigilance should be kept for other rare conditions, especially ones with curative treatments or fatal consequences. In an era where the role of liver biopsy is often questioned in favor of prediction models or noninvasive testing, we must have a low threshold to safely perform a liver biopsy when the diagnosis is unclear or a patient is deteriorating.
The quiz authors disclosed no conflicts of interest.
References
1. Windon AL et al. Am J Transplant. 2018 Mar;18(3):745-9.
2. Pagano MB et al. J Clin Apher. 2012;27(6):336-41.
A 66-year-old White woman with tetralogy of Fallot status after remote pulmonic valve surgery, hypothyroidism, and previous cholecystectomy presented to her primary care provider with 2 days of constant, dull, right upper quadrant pain with nausea but without fever, association with meals, or association with defecation. Her home medications included low-dose aspirin and levothyroxine. Her physical examination revealed normal vital signs, a body mass index of 29 kg/m2, right upper quadrant tenderness to palpation without peritoneal signs, and normal bowel sounds. The remainder of her examination was normal.
The patient underwent an exhaustive evaluation beginning with laboratory tests, which revealed a normal complete blood count, basic metabolic panel, lipase, international normalized ratio, and urinalysis. Her liver function tests results showed aspartate aminotransferase 118 international IU/L, alanine aminotransferase 117 IU/L, alkaline phosphatase 147 IU/L, and total bilirubin 17.6 mg/dL, with a direct bilirubin of 11.9 mg/dL.
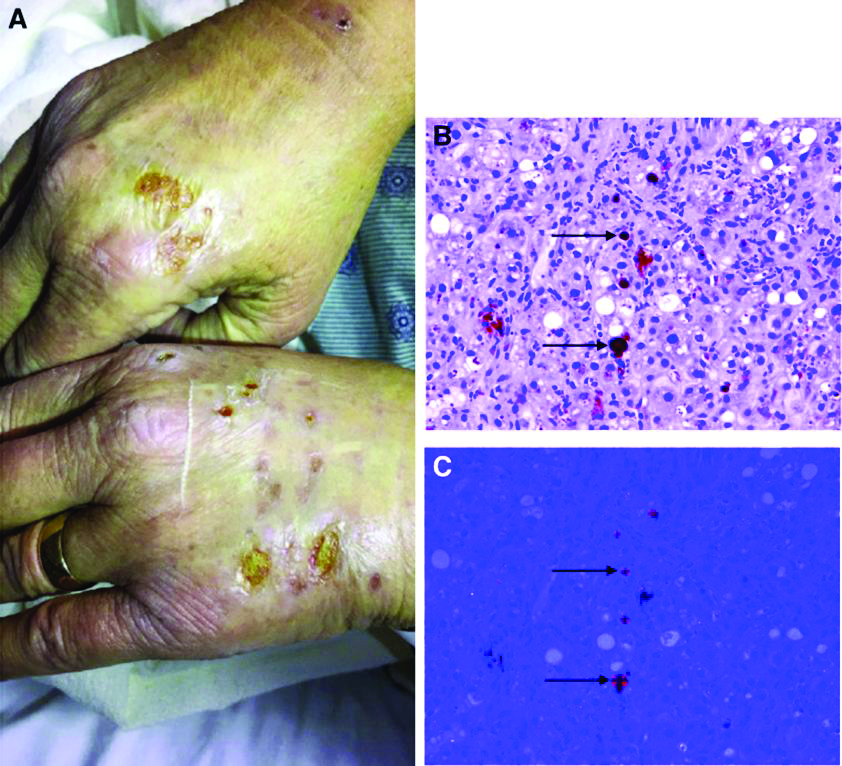
Her liver function tests were last checked 18 months prior and were normal. A liver ultrasound examination revealed cirrhotic morphology without ascites or hepatic or portal vein thrombosis. A magnetic resonance imaging study of the liver revealed morphologic changes of hepatic cirrhosis without portal hypertension, biliary dilation, or stricturing. Additionally, hepatitis A IgM, hepatitis B surface antigen, hepatitis B core IgM and IgG, hepatitis C antibody, ceruloplasmin, antinuclear antibody, anti-smooth muscle antibody, anti-liver-kidney-microsomal antibody, quantitative immunoglobulins, antimitochondrial antibody, alpha-1 antitrypsin phenotype, phosphatidylethanolamine, serum protein electrophoresis, and alpha fetoprotein were reassuring. Later, the patient reported sensitivity to the sun, described as a "sun allergy" with irritation on her hands (Figure A). Mentation remained normal; however, given progressive worsening hepatic function evidenced by international normalized ratio of 1.7 and bilirubin of 27.6 mg/dL, the patient was urgently admitted for expedited portal manometry with transjugular liver biopsy. The hepatic venous pressure gradient was 23 mm Hg. The liver biopsy images are shown in Figure B, C.