User login
Infective endocarditis: Refer for expert team care as soon as possible
In this issue of the Journal, Soud et al discuss the timing of referral of patients with infective endocarditis to surgery.1 When having this discussion, it is important to understand the nature of the disease and the role of surgery in its treatment.
Unless successfully treated and cured, infective endocarditis is fatal. It is associated with septic embolism (systemic with left-sided infective endocarditis and pulmonary with right-sided infective endocarditis), destruction of valve tissue, and invasion outside the aortic root or into the atrioventricular groove. Antimicrobials kill sensitive and exposed organisms but cannot reach those hiding in vegetations or biofilm, on foreign material, or in invaded extravascular tissue.
The objectives of surgery are to eliminate the source of embolism, debride and remove infected tissue and foreign material, expose and make residual organisms vulnerable to antimicrobials, and restore functional valves and cardiac integrity. Surgery to treat infective endocarditis is difficult and high-risk and requires an experienced surgeon. But final cure of the infection is still by antimicrobial treatment.
INFECTIVE ENDOCARDITIS NEEDS MULTIDISCIPLINARY CARE
Every aspect of infective endocarditis—diagnosis, medical management, management of complications, and surgery—is difficult. Recent guidelines2–6 therefore favor care by a multidisciplinary team that includes an infectious disease specialist, cardiologist, and cardiac surgeon from the very beginning, with access to any other needed discipline, often including neurology, neurosurgery, nephrology, and dependence specialists. Patients with infective endocarditis should be referred early to a center with access to a full endocarditis treatment team. The need for surgery and the optimal timing of it are team decisions. The American Association for Thoracic Surgery infective endocarditis guidelines are question-based and address most aspects that surgeons must consider before, during, and after operation.2
IF SURGERY IS INDICATED, IT IS BEST DONE SOONER
Once there is an indication to operate, the operation should be expedited. Delays mean continued risk of disease progression, invasion, heart block, and embolic events. Determining the timing of surgery is difficult in patients who have suffered an embolic stroke—nonhemorrhagic or hemorrhagic—or who have suffered brain bleeding; management of these issues has recently triggered expert opinion and review articles.7,8 The recommendation for early surgery is based on the conviction that once the patient has been stabilized (or has overwhelming mechanical hemodynamic problems requiring emergency surgery) and adequate antimicrobial coverage is on board, there are no additional benefits to delaying surgery.9 When the indication to operate is large mobile vegetations associated with a high risk of stroke, surgery before another event can make all the difference.
In the operating room, the first aspect addressed is adequate debridement. There is wide agreement that repair is preferable to replacement for the mitral and tricuspid valves, but there is no agreement that an allograft (although favored by our team) is the best replacement alternative for a destroyed aortic root. The key is that surgeons and their surgical teams must have the experience and tools that work for them.
Our recommendation is to refer all patients with infective endocarditis to a center with access to a full team of experienced experts able to address all aspects of the disease and its complications.
- Soud M, Pacha HM, Alraies MC. How soon should patients with infective endocarditis be referred for valve surgery? Cleve Clin J Med 2018; 85(5):362–364. doi:10.3949/ccjm.85a:17052
- Pettersson GB, Coselli JS, Pettersson GB, et al. 2016 The American Association for Thoracic Surgery (AATS) consensus guidelines: surgical treatment of infective endocarditis: executive summary. J Thorac Cardiovasc Surg 2017; 153(6):1241–1258.e29. doi:10.1016/j.jtcvs.2016.09.093
- Baddour LM, Wilson WR, Bayer AS, et al. Infective endocarditis in adults: diagnosis, antimicrobial therapy, and management of complications: a scientific statement for healthcare professionals from the American Heart Association. Circulation 2015; 132(15):1435–1486. doi:10.1161/CIR.0000000000000296
- Habib G, Lancellotti P, Antunes MJ, et al. 2015 ESC guidelines for the management of infective endocarditis: the Task Force for the Management of Infective Endocarditis of the European Society of Cardiology (ESC). Endorsed by: European Association for Cardio-Thoracic Surgery (EACTS), the European Association of Nuclear Medicine (EANM). Eur Heart J 2015; 36(44):3075–3128. doi:10.1093/eurheartj/ehv319
- Nishimura RA, Otto CM, Bonow RO, et al. 2014 AHA/ACC guideline for the management of patients with valvular heart disease:executive summary: a report of the American College of Cardiology/American Heart Association Task Force on Practice Guidelines. Circulation 2014;129(23):2440–2492. doi:10.1161/CIR.0000000000000029
- Byrne JG, Rezai K, Sanchez JA, et al. Surgical management of endocarditis: the Society of Thoracic Surgeons clinical practice guideline. Ann Thorac Surg 2011; 91(6):2012–2019. doi:10.1016/j.athoracsur.2011.01.106
- Yanagawa B, Pettersson GB, Habib G, et al. Surgical management of infective endocarditis complicated by embolic stroke: practical recommendations for clinicians. Circulation 2016; 134(17):1280–1292. doi:10.1161/CIRCULATIONAHA.116.024156
- Cahill TJ , Baddour LM, Habib G, et al. Challenges in infective endocarditis. J Am Coll Cardiol 2017; 69(3):325–344. doi:10.1016/j.jacc.2016.10.066
- Kang DH, Kim YJ, Kim SH, et al. Early surgery versus conventional treatment for infective endocarditis. N Engl J Med 2012; 366(26):2466–2473. doi:10.1056/NEJMoa1112843
In this issue of the Journal, Soud et al discuss the timing of referral of patients with infective endocarditis to surgery.1 When having this discussion, it is important to understand the nature of the disease and the role of surgery in its treatment.
Unless successfully treated and cured, infective endocarditis is fatal. It is associated with septic embolism (systemic with left-sided infective endocarditis and pulmonary with right-sided infective endocarditis), destruction of valve tissue, and invasion outside the aortic root or into the atrioventricular groove. Antimicrobials kill sensitive and exposed organisms but cannot reach those hiding in vegetations or biofilm, on foreign material, or in invaded extravascular tissue.
The objectives of surgery are to eliminate the source of embolism, debride and remove infected tissue and foreign material, expose and make residual organisms vulnerable to antimicrobials, and restore functional valves and cardiac integrity. Surgery to treat infective endocarditis is difficult and high-risk and requires an experienced surgeon. But final cure of the infection is still by antimicrobial treatment.
INFECTIVE ENDOCARDITIS NEEDS MULTIDISCIPLINARY CARE
Every aspect of infective endocarditis—diagnosis, medical management, management of complications, and surgery—is difficult. Recent guidelines2–6 therefore favor care by a multidisciplinary team that includes an infectious disease specialist, cardiologist, and cardiac surgeon from the very beginning, with access to any other needed discipline, often including neurology, neurosurgery, nephrology, and dependence specialists. Patients with infective endocarditis should be referred early to a center with access to a full endocarditis treatment team. The need for surgery and the optimal timing of it are team decisions. The American Association for Thoracic Surgery infective endocarditis guidelines are question-based and address most aspects that surgeons must consider before, during, and after operation.2
IF SURGERY IS INDICATED, IT IS BEST DONE SOONER
Once there is an indication to operate, the operation should be expedited. Delays mean continued risk of disease progression, invasion, heart block, and embolic events. Determining the timing of surgery is difficult in patients who have suffered an embolic stroke—nonhemorrhagic or hemorrhagic—or who have suffered brain bleeding; management of these issues has recently triggered expert opinion and review articles.7,8 The recommendation for early surgery is based on the conviction that once the patient has been stabilized (or has overwhelming mechanical hemodynamic problems requiring emergency surgery) and adequate antimicrobial coverage is on board, there are no additional benefits to delaying surgery.9 When the indication to operate is large mobile vegetations associated with a high risk of stroke, surgery before another event can make all the difference.
In the operating room, the first aspect addressed is adequate debridement. There is wide agreement that repair is preferable to replacement for the mitral and tricuspid valves, but there is no agreement that an allograft (although favored by our team) is the best replacement alternative for a destroyed aortic root. The key is that surgeons and their surgical teams must have the experience and tools that work for them.
Our recommendation is to refer all patients with infective endocarditis to a center with access to a full team of experienced experts able to address all aspects of the disease and its complications.
- Soud M, Pacha HM, Alraies MC. How soon should patients with infective endocarditis be referred for valve surgery? Cleve Clin J Med 2018; 85(5):362–364. doi:10.3949/ccjm.85a:17052
- Pettersson GB, Coselli JS, Pettersson GB, et al. 2016 The American Association for Thoracic Surgery (AATS) consensus guidelines: surgical treatment of infective endocarditis: executive summary. J Thorac Cardiovasc Surg 2017; 153(6):1241–1258.e29. doi:10.1016/j.jtcvs.2016.09.093
- Baddour LM, Wilson WR, Bayer AS, et al. Infective endocarditis in adults: diagnosis, antimicrobial therapy, and management of complications: a scientific statement for healthcare professionals from the American Heart Association. Circulation 2015; 132(15):1435–1486. doi:10.1161/CIR.0000000000000296
- Habib G, Lancellotti P, Antunes MJ, et al. 2015 ESC guidelines for the management of infective endocarditis: the Task Force for the Management of Infective Endocarditis of the European Society of Cardiology (ESC). Endorsed by: European Association for Cardio-Thoracic Surgery (EACTS), the European Association of Nuclear Medicine (EANM). Eur Heart J 2015; 36(44):3075–3128. doi:10.1093/eurheartj/ehv319
- Nishimura RA, Otto CM, Bonow RO, et al. 2014 AHA/ACC guideline for the management of patients with valvular heart disease:executive summary: a report of the American College of Cardiology/American Heart Association Task Force on Practice Guidelines. Circulation 2014;129(23):2440–2492. doi:10.1161/CIR.0000000000000029
- Byrne JG, Rezai K, Sanchez JA, et al. Surgical management of endocarditis: the Society of Thoracic Surgeons clinical practice guideline. Ann Thorac Surg 2011; 91(6):2012–2019. doi:10.1016/j.athoracsur.2011.01.106
- Yanagawa B, Pettersson GB, Habib G, et al. Surgical management of infective endocarditis complicated by embolic stroke: practical recommendations for clinicians. Circulation 2016; 134(17):1280–1292. doi:10.1161/CIRCULATIONAHA.116.024156
- Cahill TJ , Baddour LM, Habib G, et al. Challenges in infective endocarditis. J Am Coll Cardiol 2017; 69(3):325–344. doi:10.1016/j.jacc.2016.10.066
- Kang DH, Kim YJ, Kim SH, et al. Early surgery versus conventional treatment for infective endocarditis. N Engl J Med 2012; 366(26):2466–2473. doi:10.1056/NEJMoa1112843

An unusual complication of peritoneal dialysis
A 45-year-old man with end-stage renal disease secondary to hypertension presented with abdominal pain, nausea, vomiting, and fever. He had been on peritoneal dialysis for 15 years.
Results of initial laboratory testing were as follows:
- Sodium 137 mmol/L (reference range 136–144)
- Potassium 3.7 mmol/L (3.5–5.0)
- Bicarbonate 31 mmol/L (22–30)
- Creatinine 17.5 mg/dL (0.58–0.96)
- Blood urea nitrogen 57 mg/dL (7–21)
- Lactic acid 1.7 mmol/L (0.5–2.2)
- White blood cell count 14.34 × 10⁹/L (3.70–11.0).
Blood cultures were negative. Peritoneal fluid analysis showed a white blood cell count of 1.2 × 10⁹/L (reference range < 0.5 × 10⁹/L) with 89% neutrophils, and an amylase level less than 3 U/L (reference range < 100). Fluid cultures were positive for coagulase-negative staphylococci and Staphylococcus epidermidis.
CAUSES AND CLINICAL FEATURES
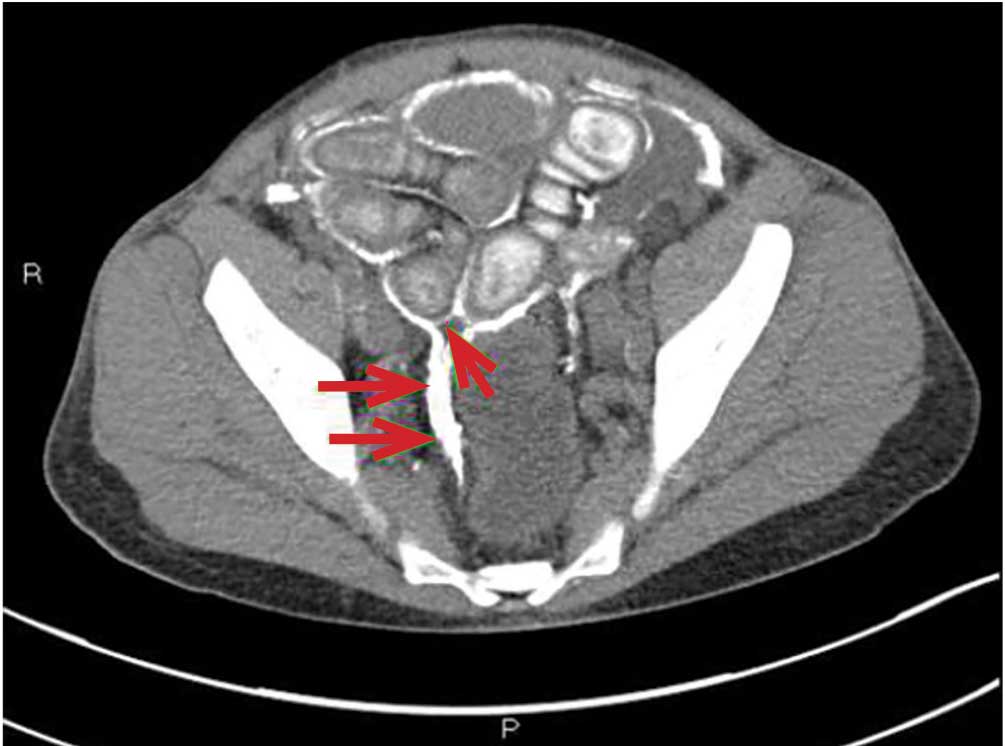
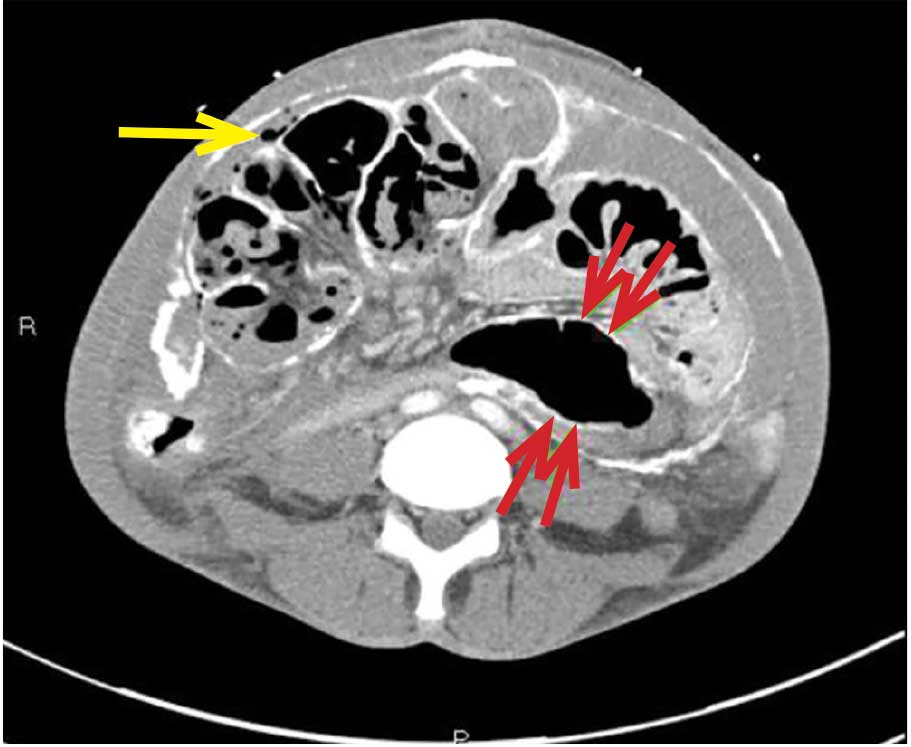
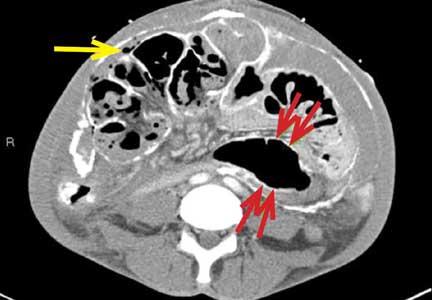
Encapsulating peritoneal sclerosis is a devastating complication of peritoneal dialysis, occurring in 3% of patients on peritoneal dialysis. The mortality rate is above 40%.1,2 It is characterized by an initial inflammatory phase followed by extensive intraperitoneal fibrosis and encasement of bowel. Causes include prolonged exposure to peritoneal dialysis or glucose degradation products, a history of severe peritonitis, use of acetate as a dialysate buffer, and reaction to medications such as beta-blockers.3
Clinical features result from inflammation, ileus, and peritoneal adhesions and include abdominal pain, nausea, and vomiting. A high peritoneal transport rate, which often heralds development of encapsulating peritoneal sclerosis, leads to failure of ultrafiltration and to fluid retention.
CT is recommended for diagnosis and demonstrates peritoneal calcification with bowel thickening and dilation.
TREATMENT
Treatment entails stopping peritoneal dialysis, changing to hemodialysis, bowel rest, and corticosteroids. Successful treatment has been reported with a combination of corticosteroids and azathioprine.4,5 A retrospective study showed that adding the antifibrotic agent tamoxifen was associated with a decrease in the mortality rate.6 Bowel obstruction is a common complication, and surgery may be indicated. Enterolysis is a new surgical technique that has shown improved outcomes.7
- Kawaguchi Y, Saito A, Kawanishi H, et al. Recommendations on the management of encapsulating peritoneal sclerosis in Japan, 2005: diagnosis, predictive markers, treatment, and preventive measures. Perit Dial Int 2005; 25(suppl 4):S83–S95. pmid:16300277
- Lee HY, Kim BS, Choi HY, et al. Sclerosing encapsulating peritonitis as a complication of long-term continuous ambulatory peritoneal dialysis in Korea. Nephrology (Carlton) 2003; 8(suppl 2):S33–S39. doi:10.1046/J.1440-1797.8.S.11.X
- Kawaguchi Y, Tranaeus A. A historical review of encapsulating peritoneal sclerosis. Perit Dial Int 2005; 25(suppl 4):S7–S13. pmid:16300267
- Martins LS, Rodrigues AS, Cabrita AN, Guimaraes S. Sclerosing encapsulating peritonitis: a case successfully treated with immunosuppression. Perit Dial Int 1999; 19(5):478–481. pmid:11379862
- Wong CF, Beshir S, Khalil A, Pai P, Ahmad R. Successful treatment of encapsulating peritoneal sclerosis with azathioprine and prednisolone. Perit Dial Int 2005; 25(3):285–287. pmid:15981777
- Korte MR, Fieren MW, Sampimon DE, Lingsma HF, Weimar W, Betjes MG; investigators of the Dutch Multicentre EPS Study. Tamoxifen is associated with lower mortality of encapsulating peritoneal sclerosis: results of the Dutch Multicentre EPS Study. Nephrol Dial Transplant 2011; 26(2):691–697. doi:10.1093/ndt/gfq362
- Kawanishi H, Watanabe H, Moriishi M, Tsuchiya S. Successful surgical management of encapsulating peritoneal sclerosis. Perit Dial Int 2005; 25(suppl 4):S39–S47. pmid:16300271
A 45-year-old man with end-stage renal disease secondary to hypertension presented with abdominal pain, nausea, vomiting, and fever. He had been on peritoneal dialysis for 15 years.
Results of initial laboratory testing were as follows:
- Sodium 137 mmol/L (reference range 136–144)
- Potassium 3.7 mmol/L (3.5–5.0)
- Bicarbonate 31 mmol/L (22–30)
- Creatinine 17.5 mg/dL (0.58–0.96)
- Blood urea nitrogen 57 mg/dL (7–21)
- Lactic acid 1.7 mmol/L (0.5–2.2)
- White blood cell count 14.34 × 10⁹/L (3.70–11.0).
Blood cultures were negative. Peritoneal fluid analysis showed a white blood cell count of 1.2 × 10⁹/L (reference range < 0.5 × 10⁹/L) with 89% neutrophils, and an amylase level less than 3 U/L (reference range < 100). Fluid cultures were positive for coagulase-negative staphylococci and Staphylococcus epidermidis.
CAUSES AND CLINICAL FEATURES
Encapsulating peritoneal sclerosis is a devastating complication of peritoneal dialysis, occurring in 3% of patients on peritoneal dialysis. The mortality rate is above 40%.1,2 It is characterized by an initial inflammatory phase followed by extensive intraperitoneal fibrosis and encasement of bowel. Causes include prolonged exposure to peritoneal dialysis or glucose degradation products, a history of severe peritonitis, use of acetate as a dialysate buffer, and reaction to medications such as beta-blockers.3
Clinical features result from inflammation, ileus, and peritoneal adhesions and include abdominal pain, nausea, and vomiting. A high peritoneal transport rate, which often heralds development of encapsulating peritoneal sclerosis, leads to failure of ultrafiltration and to fluid retention.
CT is recommended for diagnosis and demonstrates peritoneal calcification with bowel thickening and dilation.
TREATMENT
Treatment entails stopping peritoneal dialysis, changing to hemodialysis, bowel rest, and corticosteroids. Successful treatment has been reported with a combination of corticosteroids and azathioprine.4,5 A retrospective study showed that adding the antifibrotic agent tamoxifen was associated with a decrease in the mortality rate.6 Bowel obstruction is a common complication, and surgery may be indicated. Enterolysis is a new surgical technique that has shown improved outcomes.7
- Kawaguchi Y, Saito A, Kawanishi H, et al. Recommendations on the management of encapsulating peritoneal sclerosis in Japan, 2005: diagnosis, predictive markers, treatment, and preventive measures. Perit Dial Int 2005; 25(suppl 4):S83–S95. pmid:16300277
- Lee HY, Kim BS, Choi HY, et al. Sclerosing encapsulating peritonitis as a complication of long-term continuous ambulatory peritoneal dialysis in Korea. Nephrology (Carlton) 2003; 8(suppl 2):S33–S39. doi:10.1046/J.1440-1797.8.S.11.X
- Kawaguchi Y, Tranaeus A. A historical review of encapsulating peritoneal sclerosis. Perit Dial Int 2005; 25(suppl 4):S7–S13. pmid:16300267
- Martins LS, Rodrigues AS, Cabrita AN, Guimaraes S. Sclerosing encapsulating peritonitis: a case successfully treated with immunosuppression. Perit Dial Int 1999; 19(5):478–481. pmid:11379862
- Wong CF, Beshir S, Khalil A, Pai P, Ahmad R. Successful treatment of encapsulating peritoneal sclerosis with azathioprine and prednisolone. Perit Dial Int 2005; 25(3):285–287. pmid:15981777
- Korte MR, Fieren MW, Sampimon DE, Lingsma HF, Weimar W, Betjes MG; investigators of the Dutch Multicentre EPS Study. Tamoxifen is associated with lower mortality of encapsulating peritoneal sclerosis: results of the Dutch Multicentre EPS Study. Nephrol Dial Transplant 2011; 26(2):691–697. doi:10.1093/ndt/gfq362
- Kawanishi H, Watanabe H, Moriishi M, Tsuchiya S. Successful surgical management of encapsulating peritoneal sclerosis. Perit Dial Int 2005; 25(suppl 4):S39–S47. pmid:16300271
What you can do for your fibromyalgia patient
Fibromyalgia may seem like a nebulous diagnosis, with its array of symptoms and pain refractory to medications. But fibromyalgia is a defined syndrome of neuronal dysregulation. It can be diagnosed from the history and physical examination and managed in a primary care setting.
CASE 1: MANY SYMPTOMS
A 43-year-old woman presents to her primary care physician with multiple complaints: pain in all joints and in her back and hips, swelling of her hands and feet, morning stiffness, chest pain and shortness of breath (not necessarily related to exertion), fatigue, generalized weakness, headaches, difficulty with memory and concentration, dry mouth and dry eyes, feeling weak and faint in the sun, cold intolerance with purple discoloration of her extremities, a self-described “butterfly” rash on the face, and hair that is thinning and falling out in clumps.
Because many of her symptoms could reflect an inflammatory process or an autoimmune disease,1 her primary care physician orders multiple tests. Her C-reactive protein level, Westergren sedimentation rate, complete blood cell count, and comprehensive metabolic panel are normal. Urinalysis shows trace leukocyte esterase. Indirect immunofluorescence assay on human laryngeal tumor (HEp-2) cells is positive for antinuclear antibody (ANA), with a titer of 1:320 (reference range ≤ 1:40) and a nuclear dense fine-speckled pattern.
In view of the positive ANA test, the patient is informed that she may have systemic lupus erythematosus (SLE) and will be referred to a rheumatologist. In the days before her rheumatology appointment, she becomes extremely anxious. Obsessively researching SLE online, she becomes convinced that SLE is the correct diagnosis.
Rheumatology evaluation
The rheumatologist assesses the patient’s pain and reports the following:
Location and duration: Hands, wrists, elbows, shoulders, upper and lower back, sides of hips, knees, and feet; has been ongoing for 10 years, but worse in the past 3 months.
Character: The patient describes her pain as “like an ice pick being driven through my joints,” “sometimes unbearable,” and “like being hit by a truck.” She also reports numb, tingly, burning pain in her upper neck and back.
Variation with time, activity, and weather: Worse at night, causing her to wake and toss and turn all night; better with exertion, but after activity or exercise, she is exhausted for the rest of the day and sometimes for up to a week; worse with weather changes, especially during cold or humid weather.
Associated symptoms: Occasional perceived swelling of hands and feet, especially upon wakening in the morning, and 2 to 3 hours of stiffness in the morning that sometimes lasts all day.
Physical examination. Her findings are inconsistent with her symptoms.
The patient exhibits limited range of motion. When asked to bend forward, rotate her neck, or flex and extend her neck and back, she does so only slightly. However, passive range of motion is normal in all joints.
When her joints are examined, she anticipates pain and withdraws her hands. But when she is distracted, examination reveals no evidence of swollen joints or synovitis. She has tenderness in 12 of 18 tender points. Her peripheral pulses are good, strength is normal, and reflexes are brisk.
Her facial rash looks more like rosacea than the butterfly rash of SLE. There is no indication of patchy hair loss. Heart and lung examinations are normal. She appears to have a good salivary pool without glossitis.
History reveals long-standing psychological issues
The patient reports a history of panic attacks and a prior diagnosis of anxiety. She is tested with the Generalized Anxiety Disorder 7-item scale (www.mdcalc.com/gad-7-general-anxiety-disorder-7) and scores 17 out of 21, indicating severe anxiety.
DISCUSSION: CHARACTERIZING PAIN
Understanding categories of pain syndromes can help us understand fibromyalgia. Pain can be categorized into 3 types that sometimes overlap2:
Nociceptive or peripheral pain is related to damage of tissue by trauma or inflammation. Syndromes include osteoarthritis, rheumatoid arthritis, and SLE.
Neuropathic pain is associated with damage of peripheral or central nerves. Examples are neuropathy from herpes, diabetes, or spinal stenosis.
Centralized pain has no identifiable nerve or tissue damage and is thought to result from persistent neuronal dysregulation, overactive ascending pain pathways, and a deficiency of descending inhibitory pain pathways. There is evidence of biochemical changes in muscles, possibly related to chronic ischemia and an overactive sympathetic nervous system. Dysregulation of the sympathoadrenal system and hypothalamic-pituitary axis has also been implicated. And genetic predisposition is possible. Examples of centralized pain syndromes include fibromyalgia, irritable bowel syndrome, pelvic pain syndrome, neurogenic bladder, and interstitial cystitis.
Clues to a centralized pain syndrome

For patients with suspected fibromyalgia, distinguishing peripheral pain from centralized pain can be a challenge (Table 1). For example, SLE does not cause inflammation of the spine, so neck or back pain is not typical. Although both nociceptive and centralized pain syndromes improve with exertion, only patients with centralized pain are typically exhausted and bedbound for days after activity. Patients with centralized pain tend to describe their pain in much more dramatic language than do patients with inflammatory pain. Centralized pain tends to be intermittent; inflammatory pain tends to be constant. Patients with centralized pain often have had pain for many years without a diagnosis, but this is rare for patients with an inflammatory condition.
A patient with fibromyalgia typically has a normal physical examination, although allodynia (experiencing pain from normally nonpainful stimulation), hyperalgesia (increased pain perception), and brisk reflexes may be present. Fibromyalgia may involve discoloration of the fingertips resulting from an overactive sympathetic nervous system. Laboratory results are typically normal with fibromyalgia.
Patients with either nociceptive or centralized pain report stiffness, but the cause likely differs. We typically think of stiffness as arising from swollen joints caused by inflammation, but stiffness can also be caused by abnormally tight muscles, as occurs in fibromyalgia.
FIBROMYALGIA IS A CLINICAL DIAGNOSIS
Diagnosing fibromyalgia does not require multiple laboratory and imaging tests. The key indicators are derived from the patient history and physical examination.
Diagnostic criteria for fibromyalgia published by the American College of Rheumatology have evolved over the years. The 2011 criteria, in the form of a self-reported patient questionnaire, have 2 components3:
- The Widespread Pain Index measures the extent of pain in 19 areas.
- The Symptom Severity scale assesses 3 key symptoms associated with fibromyalgia, ie, fatigue, cognitive problems, and nonrestorative sleep (scale of 0–3 for each symptom).
There are also questions about symptoms of irritable bowel syndrome, depression, and headache.
Fibromyalgia is diagnosed if a patient reports at least 7 painful areas and has a symptom severity score of at least 5. A patient may also meet the 20113 and the 2016 criteria4 if he or she has 4 painful areas and the pain is perceived in 4 of 5 areas and the Symptom Severity Scale score is 9 or higher.4 This questionnaire is not only a rapid diagnostic tool for fibromyalgia, it also helps identify and focus on specific issues—for example, having severe pain in a few localized areas, or having headache as a predominant problem.
These criteria are useful for a variety of patients, eg, a patient with hip arthritis may score high on the questionnaire, indicating that a component of centralized pain is also present. Also, people who have undergone orthopedic surgery who score high tend to require more narcotics to meet the goals of pain improvement.
The 2016 criteria,4 the most recent, maintain that pain must be generalized, ie, present in at least 4 of 5 body areas. They also emphasize that fibromyalgia is a valid diagnosis irrespective of other conditions.
CASE 1 CONTINUED: THE PATIENT REJECTS THE DIAGNOSIS
Our patient meets the definition of fibromyalgia by each iteration of the American College of Rheumatology clinical criteria. She also has generalized anxiety disorder and a positive ANA test. She is advised to participate in a fibromyalgia educational program, start an aerobic exercise program, and consider taking an antidepressant medication with anxiolytic effects.
However, the patient rejects the diagnosis of fibromyalgia. She believes that the diagnosis of SLE has been overlooked and that her symptom severity is being discounted.
In response, the rheumatologist orders additional tests to evaluate for an autoimmune disorder: extractable nuclear antigen panel, complement C3 and C4, double-stranded DNA antibodies, and protein electrophoresis. Results are all in the normal range. The patient is still concerned that she has SLE or another autoimmune disease because of her abnormal ANA test result and remains dissatisfied with her evaluation. She states that she will complain to the clinic ombudsman.
SIGNIFICANCE OF ANA TESTING
Patients with positive test results increasingly go online to get information. The significance of ANA testing can be confusing, and it is critical to understand and be able to explain abnormal results to worried patients. Following are answers to some common questions about ANA testing:
Is ANA positivity specific for SLE or another autoimmune disease?
No. ANA is usually tested by indirect immunofluorescence assay on HEp-2 cells. The test can identify about 150 antigens targeted by antibodies, but only a small percentage are associated with an autoimmune disease, and the others do not have a known clinical association. Enzyme-linked immunosorbent assay (ELISA) ANA testing is also available but is considered less sensitive.
Abeles and Abeles5 retrospectively assessed 232 patients between 2007 and 2009 who were referred to rheumatologists for evaluation because of an elevated ANA test result. No ANA-associated rheumatic disease was found in patients who had a result of less than 1:160, and more than 90% of referrals for a positive ANA test had no evidence of ANA-associated disease. The positive predictive value was 9% for any connective tissue disease, and only 2% for SLE. The most common reason for ordering the test was widespread pain (23%). The authors concluded that ANA testing is often ordered inappropriately for patients with a low pretest probability of an ANA-associated rheumatic disease.
Screening with ANA testing generates many false-positive results and unnecessary anxiety for patients. The prevalence of SLE in the general population is about 0.1%, and other autoimmune diseases total about 5% to 7%. By indirect immunofluorescence assay, using a cutoff of 1:80 (the standard at Cleveland Clinic), about 15% of the general population test positive. By ELISA, with a cutoff of 20 ELISA units, 25% of healthy controls test positive.
It is true that ANA positivity may precede the onset of SLE.6,7 Arbuckle et al8 evaluated serum samples from the US Department of Defense Serum Repository obtained from 130 people before they received a diagnosis of SLE; in 115 (88%), at least 1 SLE-related autoantibody was present before diagnosis (up to 9.4 years earlier). However, in those who test positive for ANA, the percentage who eventually develop autoimmune disease is small.5
Is the titer of ANA significant and of diagnostic value?
The likelihood of autoimmune disease increases with increasing titer. But high titers can be seen in healthy people. Mariz et al9 examined ANA test results from 918 healthy controls and 153 patients with an autoimmune rheumatic disease. Of these, ANA was positive in 13% of healthy people and 90% of patients with an autoimmune disease. High titers were more likely in patients with an autoimmune disease, but also occurred in healthy controls.
Does the immunofluorescence pattern provide diagnostic information?

It can. There are 28 identified patterns of ANA, including nuclear, cytoplasmic, and mitotic patterns. The most common, the nuclear fine-speckled pattern, is seen in healthy controls and patients with an autoimmune disease. But other patterns are either characteristic of an autoimmune disease or, conversely, of not having an autoimmune disease (Table 2).9
Our patient has a nuclear dense fine-speckled pattern, further reducing the likelihood that she has an autoimmune disease.
CASE 2: POORLY CONTROLLED,
LONG-STANDING FIBROMYALGIA
A 43-year-old woman who has had fibromyalgia for 15 years is referred to a new primary care provider. She reports severe pain all over, low back pain, fatigue, nonrefreshing sleep, chronic migraine, constipation alternating with diarrhea, heartburn, intermittent numbness and tingling in her hands and feet, and depression. At this time, she rates her pain on a visual analog scale as 9 out of 10, and her fatigue as 8 out of 10.
During the past 6 months, she has made 25 visits to specialists in 8 departments: spine, pain management, anesthesia, neurology, headache clinic, gastroenterology, sleep medicine, and physical therapy.
Her daily medications are duloxetine 120 mg, bupropion 300 mg, pregabalin 450 mg, cyclobenzaprine 30 mg, tramadol 200 mg, zolpidem 10 mg, nortriptyline 50 mg, acetaminophen 3,000 mg, and oxycodone 30 mg. She has also tried gabapentin and milnacipran without success. She reported previously taking different selective serotonin reuptake inhibitors and tricyclic antidepressants but cannot remember why they were stopped.
How should this complex patient be managed?
BIOPSYCHOSOCIAL MANAGEMENT
Managing the pain of fibromyalgia requires a different model than used for peripheral pain from injury, in which the source of pain can be identified and treated with injections or oral therapy.
Neuronal dysregulation is not amenable to clinical measurement or treatment by medications at this time. But fortunately, many factors associated with fibromyalgia can be addressed: stressful life events, sleep disturbance, physical deconditioning, mood disorders, and maladaptive pain responses, including “catastrophizing” behavior (coping with pain in a highly dramatic and obsessive way). Modifying these factors can be much more productive than focusing on treating pain.
The goal for care providers is to change the focus from reducing pain to a biopsychosocial model of pain control aimed at increasing function.10
Mood modification
Not only are mood disorders common in patients with fibromyalgia, but the prevalence of complex psychiatric conditions is also elevated. Up to 80% of patients with fibromyalgia meet criteria for axis I (clinical psychological) disorders, and up to about 30% of patients meet criteria for axis II (personality) disorders. About 22% of patients have existing major depression, and about 58% develop it during their lifetime. In a study of 678 patients with fibromyalgia, 21% had bipolar disorder.11–15
The severity of fibromyalgia increases linearly with the severity of depression.16 Patients with fibromyalgia and a “depressive affect balance style” have worse outcomes across all Outcome Measures in Rheumatology (OMERACT) core symptom domains, reporting more pain, fatigue, insomnia, anxiety, depression, and function.17,18
Fibromyalgia combined with mood disorders can also be costly. In one study, the mean annual employer payments (direct and indirect costs) per patient were $5,200 for patients with fibromyalgia only, $8,100 for patients with depression only, and $11,900 for patients with both.19
Obtaining a psychiatric history is important when evaluating a patient with fibromyalgia symptoms. Patients should be asked if they have a history of depression, anxiety, posttraumatic stress disorder, or other conditions. The Patient Health Questionnaire – Depression 9 and the Generalized Anxiety Disorder Assessment (GAD-7) (both available at www.mdcalc.com) can be useful for evaluating mood disorders.
Patients with moderate depression and fibromyalgia who have not yet been treated should be prescribed duloxetine for its potential benefits for both conditions.
Patients who have already been treated with multiple drugs at high doses without benefit, such as our patient, should be referred to a psychiatrist. There is no additional benefit to referring this patient to a rheumatologist or spine clinic.
Addressing sleep problems
Sleep problems are not easy to manage but can often be helped. Epidemiologic studies indicate that poor sleep quality leads to chronic widespread pain in otherwise healthy people.20–22 In addition, experimental sleep deprivation leads to fatigue, cognitive difficulty, and a reduced pain threshold.23 In our patients with fibromyalgia, we have observed an inverse relationship between the number of hours slept and the severity of depression.
Sleep quantity and quality can be assessed by asking patients whether they have trouble sleeping, how many hours they sleep, and whether they have been diagnosed with a sleep disorder.
Because many patients with fibromyalgia are overweight or obese, they should also be evaluated for sleep apnea, narcolepsy, and restless leg syndrome.24,25
Medications shown to improve sleep include pregabalin or gabapentin (taken at bedtime), low-dose amitriptyline, trazodone, cyclobenzaprine, melatonin, and nabilone.26–29
Patients should be counseled about sleep hygiene.30 Exercise can also help sleep.
Targeting maladaptive pain responses
Patients who catastrophize tend to have higher tender point counts, a hyperalgesic response, more depression and anxiety, and more self-reported disability. They are also less likely to return to work.31 They usually respond poorly to medications and are good candidates for cognitive behavioral therapy.
A high score on a self-reported Pain Catastrophizing Scale32 can help determine whether a multidisciplinary approach is advisable, although no threshold defines an abnormal score.
Educating patients about the neurobiology underlying their pain can be therapeutic.33–37 Cognitive behavioral therapy can help patients recognize their faulty thought processes and the relationship between pain and stress, and learn better coping mechanisms.38,39 Patients who achieve the highest improvements in pain catastrophizing tend to derive the greatest benefit from cognitive behavioral therapy.40
Exercise improves symptoms
Exercise improves fibromyalgia on many fronts and is associated with a host of positive effects in the brain and peripheral muscles. Exercise improves Fibromyalgia Impact Questionnaire scores, increases physical function and fitness, and reduces tender point counts, depression, and catastrophizing.41–52 There is no consensus on the best type of exercise, but both strengthening and aerobic exercises appear to be important.
I tell patients that fibromyalgia is an exercise-deprivation syndrome. Many are afraid to exercise because they associate it with pain and exhaustion afterwards. Patients should be encouraged to start with something very low-impact, such as gentle exercise in a warm-water pool. It should be emphasized that exercise is a lifelong treatment.
Drug therapy
The US Food and Drug Administration has approved 3 drugs for fibromyalgia management: 2 serotonin-norepinephrine reuptake inhibitors (duloxetine and milnacipran) and 1 gabapentinoid (pregabalin). Our patient in Case 2 is taking 2 of them without apparent benefit and has previously had no success with the third. This is not surprising. A summary of published treatment research on these drugs found that only 50% to 60% of patients tested reported more than 30% pain reduction.53 The studies also showed a placebo response of 30% to 40%. Depending on the study, the number needed to treat to see a benefit from these drugs is 8 to 14.53
EVALUATING THE SEVERITY OF FIBROMYALGIA

Focusing on key characteristics of the patient’s history can help evaluate fibromyalgia and determine a treatment strategy (Table 3). The Fibromyalgia Impact Questionnaire is also a useful evaluation tool.
It is important to assess the severity of fibromyalgia because patients with severe fibromyalgia are not good candidates for further referral to other specialists. They instead need chronic rehabilitation services, where they can learn to better function with a chronic pain syndrome.
In general, patients with the following features have conditions with high severity:
Symptoms: High burden and intensity
Function: Disabled, unemployed, interference with activities of daily living
Mood: Severe depression, bipolar disorder, axis II disorder, posttraumatic stress disorder
Medications: Polypharmacy, opioid drugs, multiple failed interventions
Maladaptive attitudes: High catastrophizing, refusal to accept diagnosis
Fibromyalgia Impact Questionnaire score: 60 or above.
The fibromyalgia of our patient in Case 2 would be categorized as severe.
MULTIFACETED MANAGEMENT
Patients with fibromyalgia are a heterogeneous group, and the syndrome does not lend itself to a single management strategy.54 Multiple guidelines have been published for managing fibromyalgia.55–57 Thieme et al58 reviewed existing guidelines and the strength of their recommendations. The guidelines unanimously strongly favor exercise, and most also strongly favor cognitive behavioral therapy. Most favor treating with amitriptyline and duloxetine; recommendations for other antidepressants vary. Nonsteroidal anti-inflammatory drugs, opioid drugs, and benzodiazepines are not recommended.
We offer a monthly 1-day clinic for patients and family members to provide education about fibromyalgia, discuss the importance of exercise, counsel on maladaptive responses, and demonstrate mindfulness techniques. We focus on function rather than pain. Interactive online-based interventions using cognitive behavioral techniques, such as FibroGuide: A Symptom Management Program for People Living With Fibromyalgia, developed at the University of Michigan, have proven helpful.59
RECOMMENDATIONS
For most patients, do not focus on pain reduction, as that is ineffective. Instead, target reversible factors, eg, mood, sleep, exercise status, stressors, and maladaptive attitudes toward pain. Possible treatment combinations include:
- A serotonin and norepinephrine reuptake inhibitor (eg, duloxetine)
- A low-dose tricyclic antidepressant at bedtime (eg, amitriptyline)
- A gabapentinoid (pregabalin or gabapentin).
If a medication within a class does not work, stop it and try another rather than add on.
Treat mild to moderate fibromyalgia with multidisciplinary interventions, with or without centrally acting medications. Treat severe fibromyalgia with more intensive psychiatric or psychologic interventions, multidisciplinary care, and medications targeted at comorbidities. Provide all patients with education and advice on exercise.
Keep laboratory tests and imaging studies to a minimum: a complete blood cell count with differential, comprehensive metabolic panel, thyroid-stimulating hormone, C-reactive protein, and Westergren sedimentation rate. Do not test for ANA unless the patient has objective features suggesting SLE.
- Petri M, Orbai AM, Alarcón GS, et al. Derivation and validation of the Systemic Lupus International Collaborating Clinics classification criteria for systemic lupus erythematosus. Arthritis Rheum 2012; 64(8):2677–2686. doi:10.1002/art.34473
- Stanos S, Brodsky M, Argoff C, et al. Rethinking chronic pain in primary care setting. Postgraduate Med 2016; 128(5):502–513. doi:10.1080/00325481.2016.1188319
- Wolfe F, Clauw DJ, Fitzcharles M, et al. Fibromyalgia criteria and severity scales for clinical and epidemiological studies: a modification of the ACR Preliminary Diagnostic Criteria for Fibromyalgia. J Rheumatol 2011; 38(6):1113–1122. doi:10.3899/jrheum.100594
- Wolfe F, Clauw DJ, Fitzcharles MA, et al. 2016 Revisions to the 2010/2011 fibromyalgia diagnostic criteria. Semin Arthritis Rheum 2016; 46(3):319–329. doi:10.1016/j.semarthrit.2016.08.012
- Abeles AM, Abeles M. The clinical utility of a positive antinuclear antibody test result. Am J Med 2013; 126(4):342–348. doi:10.1016/j.amjmed.2012.09.014
- Li QZ, Karp DR, Quan J, et al. Risk factors for ANA positivity in healthy persons. Arthritis Res Ther 2011; 13(2):R38. doi:10.1186/ar3271
- Slight-Webb S, Lu R, Ritterhouse LL, et al. Autoantibody-positive healthy individuals display unique immune profiles that may regulate autoimmunity. Arthritis Rheumatol 2016; 68(1):2492–2502. doi:10.1002/art.39706
- Arbuckle MR, McClain MT, Rubertone MV, et al. Development of autoantibodies before the clinical onset of systemic lupus erythematosus. N Engl J Med 2003; 349(16):1526–1533. doi:10.1056/NEJMoa021933
- Mariz HA, Sato EI, Barbosa SH, Rodrigues SH, Dellavance A, Andrade LE. Pattern of antinuclear antibody-HEp 2 test is a critical parameter for discriminating antinuclear antibody-positive healthy individuals and patients with autoimmune diseases. Arthritis Rheum 2011; 63(1):191–200. doi:10.1002/art.30084
- Häuser W, Clauw DJ, Fitzcharles MA. Treat to target in fibromyalgia: opening the dialogue. Arthritis Care Res (Hoboken) 2017; 69(4):462–466. doi:10.1002/acr.22970
- Forseth KO, Husby G, Gran JT, Fórre O. Prognostic factors for the development of fibromyalgia in women with self-reported musculoskeletal pain. A prospective study. J Rheumatol 1999; 26(11):2458–2567. pmid:10555910
- Thieme K, Turk DC, Flor H. Comorbid depression and anxiety in fibromyalgia syndrome: relationship to somatic and psychosocial variables. Psychosom Med 2004; 66(6):837–844. doi:10.1097/01.psy.0000146329.63158.40
- Fuller-Thomson E, Mimigon-Young J, Brennenstuhl S. Individuals with fibromyalgia and depression: findings from a nationally representative Canadian survey. Rheumatol Int 2012; 32(4):853–862. doi:10.1007/s00296-010-1713-x
- Kudlow PA, Rosenblat JD, Weissman CR, et al. Prevalence of fibromyalgia and co-morbid bipolar disorder: a systematic review and meta-analysis. J Affect Disord 2015; 188:134–142. doi:10.1016/j.jad.2015.08.030
- Corruble E, Guelfi JD. Pain complaints in depressed inpatients. Psychopathology 2000; 33(6):307–309. doi:10.1159/000029163
- Gota CE, Kaouk S, Wilke WS. The impact of depressive and bipolar symptoms on socioeconomic status, core symptoms, function and severity of fibromyalgia. Int J Rheum Dis 2017; 20(3):326–339. doi:10.1111/1756-185X.12603
- Toussaint LL, Vincent A, McAlister SJ, Oh TH, Hassett AL. A comparison of fibromyalgia symptoms in patients with healthy versus depressive, low and reactive affect balance styles. Scand J Pain 2014; 5(3):161–166. doi:10.1016/j.sjpain.2014.05.001
- Vincent A, Hoskin TL, Whipple MO, et al. OMERACT-based fibromyalgia symptom subgroups: an exploratory cluster analysis. Arthritis Res Ther 2014; 16(5):463. doi:10.1186/s13075-014-0463-7
- Robinson RL, Birnbaum HG, Morley MA, Sisitsky T, Greenberg PE, Wolfe F. Depression and fibromyalgia: treatment and cost when diagnosed separately or concurrently. J Rheumatol 2004; 31(8):1621–1629. pmid:5290744
- Choy EH. The role of sleep in pain and fibromyalgia. Nature Rev Rheumatol 2015; 11(9):513–520. doi:10.1038/nrrheum.2015.56
- Mork PJ, Nilsen TI. Sleep problems and risk of fibromyalgia: longitudinal data of an adult female population in Norway. Arthritis Rheum 2012; 64(1):281–284. doi:10.1002/art.33346
- McBeth J, Lacey RJ, Wilkie R. Predictors of new-onset widespread pain in older adults: results from a population-based prospective cohort study in the UK. Arthritis Rheumatol 2014; 66(3):757–767. doi:10.1002/art.38284
- Ablin JN, Clauw DJ, Lyden AK, et al. Effects of sleep restriction and exercise deprivation on somatic symptoms and mood in healthy adults. Clin Exp Rheumatol 2013; 31(6 suppl 79):S53–S59. pmid:24373363
- Russell IJ, Perkins AT, Michalek JE; Oxybate SXB-26 Fibromyalgia Syndrome Study Group. Sodium oxybate relieves pain and improves function in fibromyalgia syndrome: a randomized, double-blind, placebo-controlled, multicenter clinical trial. Arthritis Rheum 2009; 60(1):299–309. doi:10.1002/art.24142
- Spaeth M, Bennett RM, Benson BA, Wang YG, Lai C, Choy EH. Sodium oxybate therapy provides multidimensional improvement in fibromyalgia: results of an international phase 3 trial. Ann Rheum Dis 2012; 71(6):935–942. doi:10.1136/annrheumdis-2011-200418
- Roth T, Bhadra-Brown P, Pitman VW, Resnick EM. Pregabalin improves fibromyalgia-related sleep disturbance. Clin J Pain 2016; 32(4):308–312. doi:10.1097/AJP.0000000000000262
- Moldofsky H, Harris HW, Archambault WT, Kwong T, Lederman S. Effects of bedtime very low dose cyclobenzaprine on symptoms and sleep physiology in patients with fibromyalgia syndrome: a double-blind randomized placebo-controlled study. J Rheumatol 2011; 38(12):2653–2663. doi:10.3899/jrheum.110194
- Feracioli-Oda E, Qawasmi A, Bloch MH. Meta-analysis: melatonin for the treatment of primary sleep disorders. PLoS One 2013; 8(5):e63773. doi:10.1371/journal.pone.0063773
- Ware MA, Fitzcharles MA, Joseph L, Shir Y. The effects of nabilone on sleep in fibromyalgia: results of a randomized controlled trial. Anesth Analg 2010; 110(2):604–610. doi:10.1213/ANE.0b013e3181c76f70
- Martínez M, Miró E, Sánchez AI, et al. Cognitive-behavioral therapy for insomnia and sleep hygiene in fibromyalgia: a randomized controlled trial. J Behav Med 2014; 37(4):683–697. doi:10.1007/s10865-013-9520-y
- Edwards RP, Cahalan C, Mensin G, Smith M, Haythornwaite JA. Pain, catastrophizing, and depression in the rheumatic diseases. Nature Rev Rheumatol 2011; 7(4):216–224. doi:10.1038/nrrheum.2011.2
- Sullivan MJL. The pain catastrophizing scale. User manual. McGill University, Montreal, Quebec, 2009. http://sullivan-painresearch.mcgill.ca/pdf/pcs/PCSManual_English.pdf. Accessed April 10, 2018.
- Louw A, Zimney K, O’Hotto C, Hilton S. The clinical application of teaching people about pain. Physiother Theory Pract 2016; 32(5):385–395. doi:10.1080/09593985.2016.1194652
- Burckhardt CS, Mannerkorpi K, Hedenberg L, Bjelle A. A randomized, controlled clinical trial of education and physical training for women with fibromyalgia. J Rheumatol 1994; 21(4):714–720. pmid:8035399
- King SJ, Wessel J, Bhambhani Y, Sholter D, Maksymowych W. The effects of exercise and education, individually or combined, in women with fibromyalgia. J Rheumatol 2002; 29(12):2620–2627. pmid:12465163
- Rooks DS, Gautam S, Romeling M, et al. Group exercise, education, and combination self-management in women with fibromyalgia: a randomized trial. Arch Intern Med 2007; 167(20):2192–2200. doi:10.1001/archinte.167.20.2192
- White KP, Nielson WR, Harth M, Ostbye T, Speechley M. Does the label ”fibromyalgia” alter health care status, function, and health service utilization? A prospective, within-group comparison in a community cohort of adults with chronic widespread pain. Arthritis Rheum 2002; 47(3):260–265. doi:10.1002/art.10400
- Bernardy K, Klose P, Busch AJ, Choy EH, Häuser W. Cognitive behavioural therapies for fibromyalgia. Cochrane Database Syst Rev 2013; 9:CD009796. doi:10.1002/14651858.CD009796.pub2
- Lazridou A, Kim J, Cahalan CM, et al. Effects of cognitive-behavioral therapy on brain connectivity supporting catastrophizing in fibromyalgia. Clin J Pain 2017; 33(3):215–221. doi:10.1097/AJP.0000000000000422
- Campbell CM, McCauley L, Bounds SC, et al. Changes in pain catastrophizing predict later changes in fibromyalgia clinical and experimental pain report: cross-lagged panel analyses of dispositional and situational catastrophizing. Arthritis Res Ther 2012; 14(5):R231. doi:10.1186/ar4073
- Vierck CJ. A mechanism-based approach to prevention of and therapy for fibromyalgia. Pain Res Treat 2012; 2012:951354. doi:10.1155/2012/951354
- Gerdle B, Ernberg M, Mannerkorpi K, et al. Increased interstitial concentrations of glutamate and pyruvate in vastus lateralis of women with fibromyalgia syndrome are normalized after exercise intervention—a case-control study. PLoS One 2016; 11(10):e0162010. doi:10.1371/journal.pone.0162010
- Jones J, Rutledge DN, Jones KD, Matallana L, Rooks DS. Self-assessed physical function levels of women with fibromyalgia: a national survey. Womens Health Issues 2008; 18(5):406–412. doi:10.1016/j.whi.2008.04.005
- Kelley GA, Kelley KS, Jones DL. Efficacy and effectiveness of exercise on tender points in adults with fibromyalgia: a meta-analysis of randomized controlled trials. Arthritis 2011; 2011:125485. doi:10.1155/2011/125485
- Valim V, Natour J, Ziao Y, et al. Effects of physical exercise on serum levels of serotonin and its metabolite in fibromyalgia: a randomized pilot study. Rev Bras Reumatol 2013; 53(6):538–541. doi:10.1016/j.rbr.2013.02.001
- Bidonde J, Busch AJ, Webber SC, et al. Aquatic exercise training for fibromyalgia. Cochrane Database Syst Rev 2014; 10:CD011336. doi:10.1002/14651858.CD011336
- Busch AJ, Webber SC, Richards RS, et al. Resistance exercise training for fibromyalgia. Cochrane Database Syst Rev 2013; 12:CD010884. doi:10.1002/14651858.CD010884
- Soriano-Maldonado A, Ruiz JR, Aparicio VA, et al. Association of physical fitness with pain in women with fibromyalgia: the al-Ándalus Project. Arthritis Care Res (Hoboken) 2015; 67(11):1561–1570. doi:10.1002/acr.22610
- Häuser W, Klose P, Langhorst J, et al. Efficacy of different types of aerobic exercise in fibromyalgia syndrome: a systematic review and meta-analysis of randomized controlled trials. Arthritis Res Ther 2010; 12(3):R79. doi:10.1186/ar3002
- Häuser W, Perrot S, Clauw DJ, Fitzcharles MA. Unraveling fibromyalgia—steps towards individualized management. J Pain 2018; 19(2):125–134. doi:10.1016/j.jpain.2017.08.009
- Flodin P, Martinsen S, Mannerkorpi K, et al. Normalization of aberrant resting state functional connectivity in fibromyalgia patients following a three month physical exercise therapy. Neuroimage Clin 2015; 9:134–139. doi:10.1016/j.nicl.2015.08.004
- Dinoff A, Herrmann N, Swardfager W, et al. The effect of exercise training on resting concentrations of peripheral brain-derived neurotrophic factor (BDNF): a meta-analysis. PLOS One 2016. 11(9):e0163037. doi:10.1371/journal.pone.0163037
- Okifuji A, Gao J, Bokat C, Hare BD. Management of fibromyalgia syndrome in 2016. Pain Manag 2016; 6(4):383–400. doi:10.2217/pmt-2016-0006
- Masi AT, Vincent A. A historical and clinical perspective endorsing person-centered management of fibromyalgia syndrome. Curr Rheumatol Rev 2015; 11(2):86–95. pmid:26088217
- Fitzcharles MA, Ste-Marie PA, Goldenberg DL, et al; National Fibromyalgia Guideline Advisory Panel. 2012 Canadian guidelines for the diagnosis and management of fibromyalgia syndrome: executive summary. Pain Res Manag 2013: 18(3):119–126. pmid:23748251
- Ablin J, Fitzcharles MA, Buskila D, Shir Y, Sommer C, Häuser W. Treatment of fibromyalgia syndrome: recommendations of recent evidence-based interdisciplinary guidelines with special emphasis on complementary and alternative therapies. Evid Based Complement Alternat Med 2013; 2013:485272. doi:10.1155/2013/485272
- MacFarlane GJ, Kronisch C, Dean LE, et al. EULAR revised recommendations for the management of fibromyalgia. Ann Rheum Dis 2017; 76(2)318–328. doi:10.1136/annrheumdis-2016-209724
- Thieme K, Mathys M, Turk DC. Evidence-based guidelines on the treatment of fibromyalgia patients: are they consistent and if not, why not? Have effective psychological treatments been overlooked? J Pain 2017; 18(7):747–756. doi:10.1016/j.jpain.2016.12.006
- Williams DA, Kuper D, Segar M, Mohan N, Sheth M, Clauw DJ. Internet-enhanced management of fibromyalgia: a randomized controlled trial. Pain 2010; 151(3):694–702. doi:10.1016/j.pain.2010.08.034
Fibromyalgia may seem like a nebulous diagnosis, with its array of symptoms and pain refractory to medications. But fibromyalgia is a defined syndrome of neuronal dysregulation. It can be diagnosed from the history and physical examination and managed in a primary care setting.
CASE 1: MANY SYMPTOMS
A 43-year-old woman presents to her primary care physician with multiple complaints: pain in all joints and in her back and hips, swelling of her hands and feet, morning stiffness, chest pain and shortness of breath (not necessarily related to exertion), fatigue, generalized weakness, headaches, difficulty with memory and concentration, dry mouth and dry eyes, feeling weak and faint in the sun, cold intolerance with purple discoloration of her extremities, a self-described “butterfly” rash on the face, and hair that is thinning and falling out in clumps.
Because many of her symptoms could reflect an inflammatory process or an autoimmune disease,1 her primary care physician orders multiple tests. Her C-reactive protein level, Westergren sedimentation rate, complete blood cell count, and comprehensive metabolic panel are normal. Urinalysis shows trace leukocyte esterase. Indirect immunofluorescence assay on human laryngeal tumor (HEp-2) cells is positive for antinuclear antibody (ANA), with a titer of 1:320 (reference range ≤ 1:40) and a nuclear dense fine-speckled pattern.
In view of the positive ANA test, the patient is informed that she may have systemic lupus erythematosus (SLE) and will be referred to a rheumatologist. In the days before her rheumatology appointment, she becomes extremely anxious. Obsessively researching SLE online, she becomes convinced that SLE is the correct diagnosis.
Rheumatology evaluation
The rheumatologist assesses the patient’s pain and reports the following:
Location and duration: Hands, wrists, elbows, shoulders, upper and lower back, sides of hips, knees, and feet; has been ongoing for 10 years, but worse in the past 3 months.
Character: The patient describes her pain as “like an ice pick being driven through my joints,” “sometimes unbearable,” and “like being hit by a truck.” She also reports numb, tingly, burning pain in her upper neck and back.
Variation with time, activity, and weather: Worse at night, causing her to wake and toss and turn all night; better with exertion, but after activity or exercise, she is exhausted for the rest of the day and sometimes for up to a week; worse with weather changes, especially during cold or humid weather.
Associated symptoms: Occasional perceived swelling of hands and feet, especially upon wakening in the morning, and 2 to 3 hours of stiffness in the morning that sometimes lasts all day.
Physical examination. Her findings are inconsistent with her symptoms.
The patient exhibits limited range of motion. When asked to bend forward, rotate her neck, or flex and extend her neck and back, she does so only slightly. However, passive range of motion is normal in all joints.
When her joints are examined, she anticipates pain and withdraws her hands. But when she is distracted, examination reveals no evidence of swollen joints or synovitis. She has tenderness in 12 of 18 tender points. Her peripheral pulses are good, strength is normal, and reflexes are brisk.
Her facial rash looks more like rosacea than the butterfly rash of SLE. There is no indication of patchy hair loss. Heart and lung examinations are normal. She appears to have a good salivary pool without glossitis.
History reveals long-standing psychological issues
The patient reports a history of panic attacks and a prior diagnosis of anxiety. She is tested with the Generalized Anxiety Disorder 7-item scale (www.mdcalc.com/gad-7-general-anxiety-disorder-7) and scores 17 out of 21, indicating severe anxiety.
DISCUSSION: CHARACTERIZING PAIN
Understanding categories of pain syndromes can help us understand fibromyalgia. Pain can be categorized into 3 types that sometimes overlap2:
Nociceptive or peripheral pain is related to damage of tissue by trauma or inflammation. Syndromes include osteoarthritis, rheumatoid arthritis, and SLE.
Neuropathic pain is associated with damage of peripheral or central nerves. Examples are neuropathy from herpes, diabetes, or spinal stenosis.
Centralized pain has no identifiable nerve or tissue damage and is thought to result from persistent neuronal dysregulation, overactive ascending pain pathways, and a deficiency of descending inhibitory pain pathways. There is evidence of biochemical changes in muscles, possibly related to chronic ischemia and an overactive sympathetic nervous system. Dysregulation of the sympathoadrenal system and hypothalamic-pituitary axis has also been implicated. And genetic predisposition is possible. Examples of centralized pain syndromes include fibromyalgia, irritable bowel syndrome, pelvic pain syndrome, neurogenic bladder, and interstitial cystitis.
Clues to a centralized pain syndrome
For patients with suspected fibromyalgia, distinguishing peripheral pain from centralized pain can be a challenge (Table 1). For example, SLE does not cause inflammation of the spine, so neck or back pain is not typical. Although both nociceptive and centralized pain syndromes improve with exertion, only patients with centralized pain are typically exhausted and bedbound for days after activity. Patients with centralized pain tend to describe their pain in much more dramatic language than do patients with inflammatory pain. Centralized pain tends to be intermittent; inflammatory pain tends to be constant. Patients with centralized pain often have had pain for many years without a diagnosis, but this is rare for patients with an inflammatory condition.
A patient with fibromyalgia typically has a normal physical examination, although allodynia (experiencing pain from normally nonpainful stimulation), hyperalgesia (increased pain perception), and brisk reflexes may be present. Fibromyalgia may involve discoloration of the fingertips resulting from an overactive sympathetic nervous system. Laboratory results are typically normal with fibromyalgia.
Patients with either nociceptive or centralized pain report stiffness, but the cause likely differs. We typically think of stiffness as arising from swollen joints caused by inflammation, but stiffness can also be caused by abnormally tight muscles, as occurs in fibromyalgia.
FIBROMYALGIA IS A CLINICAL DIAGNOSIS
Diagnosing fibromyalgia does not require multiple laboratory and imaging tests. The key indicators are derived from the patient history and physical examination.
Diagnostic criteria for fibromyalgia published by the American College of Rheumatology have evolved over the years. The 2011 criteria, in the form of a self-reported patient questionnaire, have 2 components3:
- The Widespread Pain Index measures the extent of pain in 19 areas.
- The Symptom Severity scale assesses 3 key symptoms associated with fibromyalgia, ie, fatigue, cognitive problems, and nonrestorative sleep (scale of 0–3 for each symptom).
There are also questions about symptoms of irritable bowel syndrome, depression, and headache.
Fibromyalgia is diagnosed if a patient reports at least 7 painful areas and has a symptom severity score of at least 5. A patient may also meet the 20113 and the 2016 criteria4 if he or she has 4 painful areas and the pain is perceived in 4 of 5 areas and the Symptom Severity Scale score is 9 or higher.4 This questionnaire is not only a rapid diagnostic tool for fibromyalgia, it also helps identify and focus on specific issues—for example, having severe pain in a few localized areas, or having headache as a predominant problem.
These criteria are useful for a variety of patients, eg, a patient with hip arthritis may score high on the questionnaire, indicating that a component of centralized pain is also present. Also, people who have undergone orthopedic surgery who score high tend to require more narcotics to meet the goals of pain improvement.
The 2016 criteria,4 the most recent, maintain that pain must be generalized, ie, present in at least 4 of 5 body areas. They also emphasize that fibromyalgia is a valid diagnosis irrespective of other conditions.
CASE 1 CONTINUED: THE PATIENT REJECTS THE DIAGNOSIS
Our patient meets the definition of fibromyalgia by each iteration of the American College of Rheumatology clinical criteria. She also has generalized anxiety disorder and a positive ANA test. She is advised to participate in a fibromyalgia educational program, start an aerobic exercise program, and consider taking an antidepressant medication with anxiolytic effects.
However, the patient rejects the diagnosis of fibromyalgia. She believes that the diagnosis of SLE has been overlooked and that her symptom severity is being discounted.
In response, the rheumatologist orders additional tests to evaluate for an autoimmune disorder: extractable nuclear antigen panel, complement C3 and C4, double-stranded DNA antibodies, and protein electrophoresis. Results are all in the normal range. The patient is still concerned that she has SLE or another autoimmune disease because of her abnormal ANA test result and remains dissatisfied with her evaluation. She states that she will complain to the clinic ombudsman.
SIGNIFICANCE OF ANA TESTING
Patients with positive test results increasingly go online to get information. The significance of ANA testing can be confusing, and it is critical to understand and be able to explain abnormal results to worried patients. Following are answers to some common questions about ANA testing:
Is ANA positivity specific for SLE or another autoimmune disease?
No. ANA is usually tested by indirect immunofluorescence assay on HEp-2 cells. The test can identify about 150 antigens targeted by antibodies, but only a small percentage are associated with an autoimmune disease, and the others do not have a known clinical association. Enzyme-linked immunosorbent assay (ELISA) ANA testing is also available but is considered less sensitive.
Abeles and Abeles5 retrospectively assessed 232 patients between 2007 and 2009 who were referred to rheumatologists for evaluation because of an elevated ANA test result. No ANA-associated rheumatic disease was found in patients who had a result of less than 1:160, and more than 90% of referrals for a positive ANA test had no evidence of ANA-associated disease. The positive predictive value was 9% for any connective tissue disease, and only 2% for SLE. The most common reason for ordering the test was widespread pain (23%). The authors concluded that ANA testing is often ordered inappropriately for patients with a low pretest probability of an ANA-associated rheumatic disease.
Screening with ANA testing generates many false-positive results and unnecessary anxiety for patients. The prevalence of SLE in the general population is about 0.1%, and other autoimmune diseases total about 5% to 7%. By indirect immunofluorescence assay, using a cutoff of 1:80 (the standard at Cleveland Clinic), about 15% of the general population test positive. By ELISA, with a cutoff of 20 ELISA units, 25% of healthy controls test positive.
It is true that ANA positivity may precede the onset of SLE.6,7 Arbuckle et al8 evaluated serum samples from the US Department of Defense Serum Repository obtained from 130 people before they received a diagnosis of SLE; in 115 (88%), at least 1 SLE-related autoantibody was present before diagnosis (up to 9.4 years earlier). However, in those who test positive for ANA, the percentage who eventually develop autoimmune disease is small.5
Is the titer of ANA significant and of diagnostic value?
The likelihood of autoimmune disease increases with increasing titer. But high titers can be seen in healthy people. Mariz et al9 examined ANA test results from 918 healthy controls and 153 patients with an autoimmune rheumatic disease. Of these, ANA was positive in 13% of healthy people and 90% of patients with an autoimmune disease. High titers were more likely in patients with an autoimmune disease, but also occurred in healthy controls.
Does the immunofluorescence pattern provide diagnostic information?
It can. There are 28 identified patterns of ANA, including nuclear, cytoplasmic, and mitotic patterns. The most common, the nuclear fine-speckled pattern, is seen in healthy controls and patients with an autoimmune disease. But other patterns are either characteristic of an autoimmune disease or, conversely, of not having an autoimmune disease (Table 2).9
Our patient has a nuclear dense fine-speckled pattern, further reducing the likelihood that she has an autoimmune disease.
CASE 2: POORLY CONTROLLED,
LONG-STANDING FIBROMYALGIA
A 43-year-old woman who has had fibromyalgia for 15 years is referred to a new primary care provider. She reports severe pain all over, low back pain, fatigue, nonrefreshing sleep, chronic migraine, constipation alternating with diarrhea, heartburn, intermittent numbness and tingling in her hands and feet, and depression. At this time, she rates her pain on a visual analog scale as 9 out of 10, and her fatigue as 8 out of 10.
During the past 6 months, she has made 25 visits to specialists in 8 departments: spine, pain management, anesthesia, neurology, headache clinic, gastroenterology, sleep medicine, and physical therapy.
Her daily medications are duloxetine 120 mg, bupropion 300 mg, pregabalin 450 mg, cyclobenzaprine 30 mg, tramadol 200 mg, zolpidem 10 mg, nortriptyline 50 mg, acetaminophen 3,000 mg, and oxycodone 30 mg. She has also tried gabapentin and milnacipran without success. She reported previously taking different selective serotonin reuptake inhibitors and tricyclic antidepressants but cannot remember why they were stopped.
How should this complex patient be managed?
BIOPSYCHOSOCIAL MANAGEMENT
Managing the pain of fibromyalgia requires a different model than used for peripheral pain from injury, in which the source of pain can be identified and treated with injections or oral therapy.
Neuronal dysregulation is not amenable to clinical measurement or treatment by medications at this time. But fortunately, many factors associated with fibromyalgia can be addressed: stressful life events, sleep disturbance, physical deconditioning, mood disorders, and maladaptive pain responses, including “catastrophizing” behavior (coping with pain in a highly dramatic and obsessive way). Modifying these factors can be much more productive than focusing on treating pain.
The goal for care providers is to change the focus from reducing pain to a biopsychosocial model of pain control aimed at increasing function.10
Mood modification
Not only are mood disorders common in patients with fibromyalgia, but the prevalence of complex psychiatric conditions is also elevated. Up to 80% of patients with fibromyalgia meet criteria for axis I (clinical psychological) disorders, and up to about 30% of patients meet criteria for axis II (personality) disorders. About 22% of patients have existing major depression, and about 58% develop it during their lifetime. In a study of 678 patients with fibromyalgia, 21% had bipolar disorder.11–15
The severity of fibromyalgia increases linearly with the severity of depression.16 Patients with fibromyalgia and a “depressive affect balance style” have worse outcomes across all Outcome Measures in Rheumatology (OMERACT) core symptom domains, reporting more pain, fatigue, insomnia, anxiety, depression, and function.17,18
Fibromyalgia combined with mood disorders can also be costly. In one study, the mean annual employer payments (direct and indirect costs) per patient were $5,200 for patients with fibromyalgia only, $8,100 for patients with depression only, and $11,900 for patients with both.19
Obtaining a psychiatric history is important when evaluating a patient with fibromyalgia symptoms. Patients should be asked if they have a history of depression, anxiety, posttraumatic stress disorder, or other conditions. The Patient Health Questionnaire – Depression 9 and the Generalized Anxiety Disorder Assessment (GAD-7) (both available at www.mdcalc.com) can be useful for evaluating mood disorders.
Patients with moderate depression and fibromyalgia who have not yet been treated should be prescribed duloxetine for its potential benefits for both conditions.
Patients who have already been treated with multiple drugs at high doses without benefit, such as our patient, should be referred to a psychiatrist. There is no additional benefit to referring this patient to a rheumatologist or spine clinic.
Addressing sleep problems
Sleep problems are not easy to manage but can often be helped. Epidemiologic studies indicate that poor sleep quality leads to chronic widespread pain in otherwise healthy people.20–22 In addition, experimental sleep deprivation leads to fatigue, cognitive difficulty, and a reduced pain threshold.23 In our patients with fibromyalgia, we have observed an inverse relationship between the number of hours slept and the severity of depression.
Sleep quantity and quality can be assessed by asking patients whether they have trouble sleeping, how many hours they sleep, and whether they have been diagnosed with a sleep disorder.
Because many patients with fibromyalgia are overweight or obese, they should also be evaluated for sleep apnea, narcolepsy, and restless leg syndrome.24,25
Medications shown to improve sleep include pregabalin or gabapentin (taken at bedtime), low-dose amitriptyline, trazodone, cyclobenzaprine, melatonin, and nabilone.26–29
Patients should be counseled about sleep hygiene.30 Exercise can also help sleep.
Targeting maladaptive pain responses
Patients who catastrophize tend to have higher tender point counts, a hyperalgesic response, more depression and anxiety, and more self-reported disability. They are also less likely to return to work.31 They usually respond poorly to medications and are good candidates for cognitive behavioral therapy.
A high score on a self-reported Pain Catastrophizing Scale32 can help determine whether a multidisciplinary approach is advisable, although no threshold defines an abnormal score.
Educating patients about the neurobiology underlying their pain can be therapeutic.33–37 Cognitive behavioral therapy can help patients recognize their faulty thought processes and the relationship between pain and stress, and learn better coping mechanisms.38,39 Patients who achieve the highest improvements in pain catastrophizing tend to derive the greatest benefit from cognitive behavioral therapy.40
Exercise improves symptoms
Exercise improves fibromyalgia on many fronts and is associated with a host of positive effects in the brain and peripheral muscles. Exercise improves Fibromyalgia Impact Questionnaire scores, increases physical function and fitness, and reduces tender point counts, depression, and catastrophizing.41–52 There is no consensus on the best type of exercise, but both strengthening and aerobic exercises appear to be important.
I tell patients that fibromyalgia is an exercise-deprivation syndrome. Many are afraid to exercise because they associate it with pain and exhaustion afterwards. Patients should be encouraged to start with something very low-impact, such as gentle exercise in a warm-water pool. It should be emphasized that exercise is a lifelong treatment.
Drug therapy
The US Food and Drug Administration has approved 3 drugs for fibromyalgia management: 2 serotonin-norepinephrine reuptake inhibitors (duloxetine and milnacipran) and 1 gabapentinoid (pregabalin). Our patient in Case 2 is taking 2 of them without apparent benefit and has previously had no success with the third. This is not surprising. A summary of published treatment research on these drugs found that only 50% to 60% of patients tested reported more than 30% pain reduction.53 The studies also showed a placebo response of 30% to 40%. Depending on the study, the number needed to treat to see a benefit from these drugs is 8 to 14.53
EVALUATING THE SEVERITY OF FIBROMYALGIA
Focusing on key characteristics of the patient’s history can help evaluate fibromyalgia and determine a treatment strategy (Table 3). The Fibromyalgia Impact Questionnaire is also a useful evaluation tool.
It is important to assess the severity of fibromyalgia because patients with severe fibromyalgia are not good candidates for further referral to other specialists. They instead need chronic rehabilitation services, where they can learn to better function with a chronic pain syndrome.
In general, patients with the following features have conditions with high severity:
Symptoms: High burden and intensity
Function: Disabled, unemployed, interference with activities of daily living
Mood: Severe depression, bipolar disorder, axis II disorder, posttraumatic stress disorder
Medications: Polypharmacy, opioid drugs, multiple failed interventions
Maladaptive attitudes: High catastrophizing, refusal to accept diagnosis
Fibromyalgia Impact Questionnaire score: 60 or above.
The fibromyalgia of our patient in Case 2 would be categorized as severe.
MULTIFACETED MANAGEMENT
Patients with fibromyalgia are a heterogeneous group, and the syndrome does not lend itself to a single management strategy.54 Multiple guidelines have been published for managing fibromyalgia.55–57 Thieme et al58 reviewed existing guidelines and the strength of their recommendations. The guidelines unanimously strongly favor exercise, and most also strongly favor cognitive behavioral therapy. Most favor treating with amitriptyline and duloxetine; recommendations for other antidepressants vary. Nonsteroidal anti-inflammatory drugs, opioid drugs, and benzodiazepines are not recommended.
We offer a monthly 1-day clinic for patients and family members to provide education about fibromyalgia, discuss the importance of exercise, counsel on maladaptive responses, and demonstrate mindfulness techniques. We focus on function rather than pain. Interactive online-based interventions using cognitive behavioral techniques, such as FibroGuide: A Symptom Management Program for People Living With Fibromyalgia, developed at the University of Michigan, have proven helpful.59
RECOMMENDATIONS
For most patients, do not focus on pain reduction, as that is ineffective. Instead, target reversible factors, eg, mood, sleep, exercise status, stressors, and maladaptive attitudes toward pain. Possible treatment combinations include:
- A serotonin and norepinephrine reuptake inhibitor (eg, duloxetine)
- A low-dose tricyclic antidepressant at bedtime (eg, amitriptyline)
- A gabapentinoid (pregabalin or gabapentin).
If a medication within a class does not work, stop it and try another rather than add on.
Treat mild to moderate fibromyalgia with multidisciplinary interventions, with or without centrally acting medications. Treat severe fibromyalgia with more intensive psychiatric or psychologic interventions, multidisciplinary care, and medications targeted at comorbidities. Provide all patients with education and advice on exercise.
Keep laboratory tests and imaging studies to a minimum: a complete blood cell count with differential, comprehensive metabolic panel, thyroid-stimulating hormone, C-reactive protein, and Westergren sedimentation rate. Do not test for ANA unless the patient has objective features suggesting SLE.
- Petri M, Orbai AM, Alarcón GS, et al. Derivation and validation of the Systemic Lupus International Collaborating Clinics classification criteria for systemic lupus erythematosus. Arthritis Rheum 2012; 64(8):2677–2686. doi:10.1002/art.34473
- Stanos S, Brodsky M, Argoff C, et al. Rethinking chronic pain in primary care setting. Postgraduate Med 2016; 128(5):502–513. doi:10.1080/00325481.2016.1188319
- Wolfe F, Clauw DJ, Fitzcharles M, et al. Fibromyalgia criteria and severity scales for clinical and epidemiological studies: a modification of the ACR Preliminary Diagnostic Criteria for Fibromyalgia. J Rheumatol 2011; 38(6):1113–1122. doi:10.3899/jrheum.100594
- Wolfe F, Clauw DJ, Fitzcharles MA, et al. 2016 Revisions to the 2010/2011 fibromyalgia diagnostic criteria. Semin Arthritis Rheum 2016; 46(3):319–329. doi:10.1016/j.semarthrit.2016.08.012
- Abeles AM, Abeles M. The clinical utility of a positive antinuclear antibody test result. Am J Med 2013; 126(4):342–348. doi:10.1016/j.amjmed.2012.09.014
- Li QZ, Karp DR, Quan J, et al. Risk factors for ANA positivity in healthy persons. Arthritis Res Ther 2011; 13(2):R38. doi:10.1186/ar3271
- Slight-Webb S, Lu R, Ritterhouse LL, et al. Autoantibody-positive healthy individuals display unique immune profiles that may regulate autoimmunity. Arthritis Rheumatol 2016; 68(1):2492–2502. doi:10.1002/art.39706
- Arbuckle MR, McClain MT, Rubertone MV, et al. Development of autoantibodies before the clinical onset of systemic lupus erythematosus. N Engl J Med 2003; 349(16):1526–1533. doi:10.1056/NEJMoa021933
- Mariz HA, Sato EI, Barbosa SH, Rodrigues SH, Dellavance A, Andrade LE. Pattern of antinuclear antibody-HEp 2 test is a critical parameter for discriminating antinuclear antibody-positive healthy individuals and patients with autoimmune diseases. Arthritis Rheum 2011; 63(1):191–200. doi:10.1002/art.30084
- Häuser W, Clauw DJ, Fitzcharles MA. Treat to target in fibromyalgia: opening the dialogue. Arthritis Care Res (Hoboken) 2017; 69(4):462–466. doi:10.1002/acr.22970
- Forseth KO, Husby G, Gran JT, Fórre O. Prognostic factors for the development of fibromyalgia in women with self-reported musculoskeletal pain. A prospective study. J Rheumatol 1999; 26(11):2458–2567. pmid:10555910
- Thieme K, Turk DC, Flor H. Comorbid depression and anxiety in fibromyalgia syndrome: relationship to somatic and psychosocial variables. Psychosom Med 2004; 66(6):837–844. doi:10.1097/01.psy.0000146329.63158.40
- Fuller-Thomson E, Mimigon-Young J, Brennenstuhl S. Individuals with fibromyalgia and depression: findings from a nationally representative Canadian survey. Rheumatol Int 2012; 32(4):853–862. doi:10.1007/s00296-010-1713-x
- Kudlow PA, Rosenblat JD, Weissman CR, et al. Prevalence of fibromyalgia and co-morbid bipolar disorder: a systematic review and meta-analysis. J Affect Disord 2015; 188:134–142. doi:10.1016/j.jad.2015.08.030
- Corruble E, Guelfi JD. Pain complaints in depressed inpatients. Psychopathology 2000; 33(6):307–309. doi:10.1159/000029163
- Gota CE, Kaouk S, Wilke WS. The impact of depressive and bipolar symptoms on socioeconomic status, core symptoms, function and severity of fibromyalgia. Int J Rheum Dis 2017; 20(3):326–339. doi:10.1111/1756-185X.12603
- Toussaint LL, Vincent A, McAlister SJ, Oh TH, Hassett AL. A comparison of fibromyalgia symptoms in patients with healthy versus depressive, low and reactive affect balance styles. Scand J Pain 2014; 5(3):161–166. doi:10.1016/j.sjpain.2014.05.001
- Vincent A, Hoskin TL, Whipple MO, et al. OMERACT-based fibromyalgia symptom subgroups: an exploratory cluster analysis. Arthritis Res Ther 2014; 16(5):463. doi:10.1186/s13075-014-0463-7
- Robinson RL, Birnbaum HG, Morley MA, Sisitsky T, Greenberg PE, Wolfe F. Depression and fibromyalgia: treatment and cost when diagnosed separately or concurrently. J Rheumatol 2004; 31(8):1621–1629. pmid:5290744
- Choy EH. The role of sleep in pain and fibromyalgia. Nature Rev Rheumatol 2015; 11(9):513–520. doi:10.1038/nrrheum.2015.56
- Mork PJ, Nilsen TI. Sleep problems and risk of fibromyalgia: longitudinal data of an adult female population in Norway. Arthritis Rheum 2012; 64(1):281–284. doi:10.1002/art.33346
- McBeth J, Lacey RJ, Wilkie R. Predictors of new-onset widespread pain in older adults: results from a population-based prospective cohort study in the UK. Arthritis Rheumatol 2014; 66(3):757–767. doi:10.1002/art.38284
- Ablin JN, Clauw DJ, Lyden AK, et al. Effects of sleep restriction and exercise deprivation on somatic symptoms and mood in healthy adults. Clin Exp Rheumatol 2013; 31(6 suppl 79):S53–S59. pmid:24373363
- Russell IJ, Perkins AT, Michalek JE; Oxybate SXB-26 Fibromyalgia Syndrome Study Group. Sodium oxybate relieves pain and improves function in fibromyalgia syndrome: a randomized, double-blind, placebo-controlled, multicenter clinical trial. Arthritis Rheum 2009; 60(1):299–309. doi:10.1002/art.24142
- Spaeth M, Bennett RM, Benson BA, Wang YG, Lai C, Choy EH. Sodium oxybate therapy provides multidimensional improvement in fibromyalgia: results of an international phase 3 trial. Ann Rheum Dis 2012; 71(6):935–942. doi:10.1136/annrheumdis-2011-200418
- Roth T, Bhadra-Brown P, Pitman VW, Resnick EM. Pregabalin improves fibromyalgia-related sleep disturbance. Clin J Pain 2016; 32(4):308–312. doi:10.1097/AJP.0000000000000262
- Moldofsky H, Harris HW, Archambault WT, Kwong T, Lederman S. Effects of bedtime very low dose cyclobenzaprine on symptoms and sleep physiology in patients with fibromyalgia syndrome: a double-blind randomized placebo-controlled study. J Rheumatol 2011; 38(12):2653–2663. doi:10.3899/jrheum.110194
- Feracioli-Oda E, Qawasmi A, Bloch MH. Meta-analysis: melatonin for the treatment of primary sleep disorders. PLoS One 2013; 8(5):e63773. doi:10.1371/journal.pone.0063773
- Ware MA, Fitzcharles MA, Joseph L, Shir Y. The effects of nabilone on sleep in fibromyalgia: results of a randomized controlled trial. Anesth Analg 2010; 110(2):604–610. doi:10.1213/ANE.0b013e3181c76f70
- Martínez M, Miró E, Sánchez AI, et al. Cognitive-behavioral therapy for insomnia and sleep hygiene in fibromyalgia: a randomized controlled trial. J Behav Med 2014; 37(4):683–697. doi:10.1007/s10865-013-9520-y
- Edwards RP, Cahalan C, Mensin G, Smith M, Haythornwaite JA. Pain, catastrophizing, and depression in the rheumatic diseases. Nature Rev Rheumatol 2011; 7(4):216–224. doi:10.1038/nrrheum.2011.2
- Sullivan MJL. The pain catastrophizing scale. User manual. McGill University, Montreal, Quebec, 2009. http://sullivan-painresearch.mcgill.ca/pdf/pcs/PCSManual_English.pdf. Accessed April 10, 2018.
- Louw A, Zimney K, O’Hotto C, Hilton S. The clinical application of teaching people about pain. Physiother Theory Pract 2016; 32(5):385–395. doi:10.1080/09593985.2016.1194652
- Burckhardt CS, Mannerkorpi K, Hedenberg L, Bjelle A. A randomized, controlled clinical trial of education and physical training for women with fibromyalgia. J Rheumatol 1994; 21(4):714–720. pmid:8035399
- King SJ, Wessel J, Bhambhani Y, Sholter D, Maksymowych W. The effects of exercise and education, individually or combined, in women with fibromyalgia. J Rheumatol 2002; 29(12):2620–2627. pmid:12465163
- Rooks DS, Gautam S, Romeling M, et al. Group exercise, education, and combination self-management in women with fibromyalgia: a randomized trial. Arch Intern Med 2007; 167(20):2192–2200. doi:10.1001/archinte.167.20.2192
- White KP, Nielson WR, Harth M, Ostbye T, Speechley M. Does the label ”fibromyalgia” alter health care status, function, and health service utilization? A prospective, within-group comparison in a community cohort of adults with chronic widespread pain. Arthritis Rheum 2002; 47(3):260–265. doi:10.1002/art.10400
- Bernardy K, Klose P, Busch AJ, Choy EH, Häuser W. Cognitive behavioural therapies for fibromyalgia. Cochrane Database Syst Rev 2013; 9:CD009796. doi:10.1002/14651858.CD009796.pub2
- Lazridou A, Kim J, Cahalan CM, et al. Effects of cognitive-behavioral therapy on brain connectivity supporting catastrophizing in fibromyalgia. Clin J Pain 2017; 33(3):215–221. doi:10.1097/AJP.0000000000000422
- Campbell CM, McCauley L, Bounds SC, et al. Changes in pain catastrophizing predict later changes in fibromyalgia clinical and experimental pain report: cross-lagged panel analyses of dispositional and situational catastrophizing. Arthritis Res Ther 2012; 14(5):R231. doi:10.1186/ar4073
- Vierck CJ. A mechanism-based approach to prevention of and therapy for fibromyalgia. Pain Res Treat 2012; 2012:951354. doi:10.1155/2012/951354
- Gerdle B, Ernberg M, Mannerkorpi K, et al. Increased interstitial concentrations of glutamate and pyruvate in vastus lateralis of women with fibromyalgia syndrome are normalized after exercise intervention—a case-control study. PLoS One 2016; 11(10):e0162010. doi:10.1371/journal.pone.0162010
- Jones J, Rutledge DN, Jones KD, Matallana L, Rooks DS. Self-assessed physical function levels of women with fibromyalgia: a national survey. Womens Health Issues 2008; 18(5):406–412. doi:10.1016/j.whi.2008.04.005
- Kelley GA, Kelley KS, Jones DL. Efficacy and effectiveness of exercise on tender points in adults with fibromyalgia: a meta-analysis of randomized controlled trials. Arthritis 2011; 2011:125485. doi:10.1155/2011/125485
- Valim V, Natour J, Ziao Y, et al. Effects of physical exercise on serum levels of serotonin and its metabolite in fibromyalgia: a randomized pilot study. Rev Bras Reumatol 2013; 53(6):538–541. doi:10.1016/j.rbr.2013.02.001
- Bidonde J, Busch AJ, Webber SC, et al. Aquatic exercise training for fibromyalgia. Cochrane Database Syst Rev 2014; 10:CD011336. doi:10.1002/14651858.CD011336
- Busch AJ, Webber SC, Richards RS, et al. Resistance exercise training for fibromyalgia. Cochrane Database Syst Rev 2013; 12:CD010884. doi:10.1002/14651858.CD010884
- Soriano-Maldonado A, Ruiz JR, Aparicio VA, et al. Association of physical fitness with pain in women with fibromyalgia: the al-Ándalus Project. Arthritis Care Res (Hoboken) 2015; 67(11):1561–1570. doi:10.1002/acr.22610
- Häuser W, Klose P, Langhorst J, et al. Efficacy of different types of aerobic exercise in fibromyalgia syndrome: a systematic review and meta-analysis of randomized controlled trials. Arthritis Res Ther 2010; 12(3):R79. doi:10.1186/ar3002
- Häuser W, Perrot S, Clauw DJ, Fitzcharles MA. Unraveling fibromyalgia—steps towards individualized management. J Pain 2018; 19(2):125–134. doi:10.1016/j.jpain.2017.08.009
- Flodin P, Martinsen S, Mannerkorpi K, et al. Normalization of aberrant resting state functional connectivity in fibromyalgia patients following a three month physical exercise therapy. Neuroimage Clin 2015; 9:134–139. doi:10.1016/j.nicl.2015.08.004
- Dinoff A, Herrmann N, Swardfager W, et al. The effect of exercise training on resting concentrations of peripheral brain-derived neurotrophic factor (BDNF): a meta-analysis. PLOS One 2016. 11(9):e0163037. doi:10.1371/journal.pone.0163037
- Okifuji A, Gao J, Bokat C, Hare BD. Management of fibromyalgia syndrome in 2016. Pain Manag 2016; 6(4):383–400. doi:10.2217/pmt-2016-0006
- Masi AT, Vincent A. A historical and clinical perspective endorsing person-centered management of fibromyalgia syndrome. Curr Rheumatol Rev 2015; 11(2):86–95. pmid:26088217
- Fitzcharles MA, Ste-Marie PA, Goldenberg DL, et al; National Fibromyalgia Guideline Advisory Panel. 2012 Canadian guidelines for the diagnosis and management of fibromyalgia syndrome: executive summary. Pain Res Manag 2013: 18(3):119–126. pmid:23748251
- Ablin J, Fitzcharles MA, Buskila D, Shir Y, Sommer C, Häuser W. Treatment of fibromyalgia syndrome: recommendations of recent evidence-based interdisciplinary guidelines with special emphasis on complementary and alternative therapies. Evid Based Complement Alternat Med 2013; 2013:485272. doi:10.1155/2013/485272
- MacFarlane GJ, Kronisch C, Dean LE, et al. EULAR revised recommendations for the management of fibromyalgia. Ann Rheum Dis 2017; 76(2)318–328. doi:10.1136/annrheumdis-2016-209724
- Thieme K, Mathys M, Turk DC. Evidence-based guidelines on the treatment of fibromyalgia patients: are they consistent and if not, why not? Have effective psychological treatments been overlooked? J Pain 2017; 18(7):747–756. doi:10.1016/j.jpain.2016.12.006
- Williams DA, Kuper D, Segar M, Mohan N, Sheth M, Clauw DJ. Internet-enhanced management of fibromyalgia: a randomized controlled trial. Pain 2010; 151(3):694–702. doi:10.1016/j.pain.2010.08.034
KEY POINTS
- Fibromyalgia is a clinical diagnosis, and specialized testing beyond basic laboratory tests is not indicated.
- Antinuclear antibody test results can be confusing, and the test should not be ordered unless a patient has objective features suggesting systemic lupus erythematosus.
- Treatment should be tailored to comorbidities such as depression, anxiety, and sleep disturbance. Options include serotonin-norepinephrine reuptake inhibitors (eg, duloxetine), selective serotonin reuptake inhibitors, low-dose tricyclic antidepressants (eg, amitriptyline), and gabapentinoids (pregabalin or gabapentin). These drugs can be used singly or in combination.
- Medications that do not work should be discontinued.
- “Catastrophizing” by the patient is common in fibromyalgia and can be addressed by education, cognitive behavioral therapy, and anxiolytic or antidepressant drugs.
- Sustained, lifelong exercise is the treatment strategy most associated with improvement.

Cardiorenal syndrome
To the Editor: I read with interest the thoughtful review of cardiorenal syndrome by Drs. Thind, Loehrke, and Wilt1 and the accompanying editorial by Dr. Grodin.2 These articles certainly add to our growing knowledge of the syndrome and the importance of treating volume overload in these complex patients.
Indeed, we and others have stressed the primary importance of renal dysfunction in patients with volume overload and acute decompensated heart failure.3,4 We have learned that even small rises in serum creatinine predict poor outcomes in these patients. And even if the serum creatinine level comes back down during hospitalization, acute kidney injury (AKI) is still associated with risk.5
Nevertheless, clinicians remain frustrated with the practical management of patients with volume overload and worsening AKI. When faced with a rising serum creatinine level in a patient being treated for decompensated heart failure with signs or symptoms of volume overload, I suggest the following:
Perform careful bedside and chart review searching for evidence of AKI related to causes other than cardiorenal syndrome. Ask whether the rise in serum creatinine could be caused by new obstruction (eg, urinary retention, upper urinary tract obstruction), a nephrotoxin (eg, nonsteroidal anti-inflammatory drugs), a primary tubulointerstitial or glomerular process (eg, drug-induced acute interstitial nephritis, acute glomerulonephritis), acute tubular necrosis, or a new hemodynamic event threatening renal perfusion (eg, hypotension, a new arrhythmia). It is often best to arrive at a diagnosis of AKI due to cardiorenal dysfunction by exclusion, much like the working definitions of hepatorenal syndrome.6 This requires review of the urine sediment (looking for evidence of granular casts of acute tubular necrosis, or evidence of glomerulonephritis or interstitial nephritis), electronic medical record, vital signs, telemetry, and perhaps renal ultrasonography.
In the absence of frank evidence of “overdiuresis” such as worsening hypernatremia, with dropping blood pressure, clinical hypoperfusion, and contraction alkalosis, avoid the temptation to suspend diuretics. Alternatively, an increase in diuretic dose, or addition of a distal diuretic (ie, metolazone) may be needed to address persistent renal venous congestion as the cause of the AKI.3 In this situation, be sure to monitor electrolytes, volume status, and renal function closely while diuretic treatment is augmented. In many such cases, the serum creatinine may actually start to decrease after a more robust diuresis is generated. In these patients, it may also be prudent to temporarily suspend antagonists of the renin-angiotensin-aldosterone system, although this remains controversial.
Management of such patients should be done collaboratively with cardiologists well versed in the treatment of cardiorenal syndrome. It may be possible that the worsening renal function in these patients represents important changes in cardiac rhythm or function (eg, low cardiac output state, new or worsening valvular disease, ongoing myocardial ischemia, cardiac tamponade, uncontrolled bradycardia or tachyarrythmia). Interventions aimed at reversing such perturbations could be the most important steps in improving cardiorenal function and reversing AKI.
- Thind GS, Loehrke M, Wilt JL. Acute cardiorenal syndrome: mechanisms and clinical implications. Cleve Clin J Med 2018; 85(3):231–239. doi:10.3949/ccjm.85a.17019
- Grodin JL. Hemodynamically, the kidney is at the heart of cardiorenal syndrome. Cleve Clin J Med 2018; 85(3):240–242. doi:10.3949/ccjm.85a.17126
- Freda BJ, Slawsky M, Mallidi J, Braden GL. Decongestive treatment of acute decompensated heart failure: cardiorenal implications of ultrafiltration and diuretics. Am J Kid Dis 2011; 58(6):1005–1017. doi:10.1053/j.ajkd.2011.07.023
- Tang WH, Kitai T. Intrarenal blood flow: a window into the congestive kidney failure phenotype of heart failure? JACC Heart Fail 2016; 4(8):683–686. doi:10.1016/j.jchf.2016.05.009
- Freda BJ, Knee AB, Braden GL, Visintainer PF, Thakaer CV. Effect of transient and sustained acute kidney injury on readmissions in acute decompensated heart failure. Am J Cardiol 2017; 119(11):1809–1814. doi:10.1016/j.amjcard.2017.02.044
- Bucsics T, Krones E. Renal dysfunction in cirrhosis: acute kidney injury and the hepatorenal syndrome. Gastroenterol Rep (Oxf) 2017; 5(2):127–137. doi:10.1093/gastro/gox009
To the Editor: I read with interest the thoughtful review of cardiorenal syndrome by Drs. Thind, Loehrke, and Wilt1 and the accompanying editorial by Dr. Grodin.2 These articles certainly add to our growing knowledge of the syndrome and the importance of treating volume overload in these complex patients.
Indeed, we and others have stressed the primary importance of renal dysfunction in patients with volume overload and acute decompensated heart failure.3,4 We have learned that even small rises in serum creatinine predict poor outcomes in these patients. And even if the serum creatinine level comes back down during hospitalization, acute kidney injury (AKI) is still associated with risk.5
Nevertheless, clinicians remain frustrated with the practical management of patients with volume overload and worsening AKI. When faced with a rising serum creatinine level in a patient being treated for decompensated heart failure with signs or symptoms of volume overload, I suggest the following:
Perform careful bedside and chart review searching for evidence of AKI related to causes other than cardiorenal syndrome. Ask whether the rise in serum creatinine could be caused by new obstruction (eg, urinary retention, upper urinary tract obstruction), a nephrotoxin (eg, nonsteroidal anti-inflammatory drugs), a primary tubulointerstitial or glomerular process (eg, drug-induced acute interstitial nephritis, acute glomerulonephritis), acute tubular necrosis, or a new hemodynamic event threatening renal perfusion (eg, hypotension, a new arrhythmia). It is often best to arrive at a diagnosis of AKI due to cardiorenal dysfunction by exclusion, much like the working definitions of hepatorenal syndrome.6 This requires review of the urine sediment (looking for evidence of granular casts of acute tubular necrosis, or evidence of glomerulonephritis or interstitial nephritis), electronic medical record, vital signs, telemetry, and perhaps renal ultrasonography.
In the absence of frank evidence of “overdiuresis” such as worsening hypernatremia, with dropping blood pressure, clinical hypoperfusion, and contraction alkalosis, avoid the temptation to suspend diuretics. Alternatively, an increase in diuretic dose, or addition of a distal diuretic (ie, metolazone) may be needed to address persistent renal venous congestion as the cause of the AKI.3 In this situation, be sure to monitor electrolytes, volume status, and renal function closely while diuretic treatment is augmented. In many such cases, the serum creatinine may actually start to decrease after a more robust diuresis is generated. In these patients, it may also be prudent to temporarily suspend antagonists of the renin-angiotensin-aldosterone system, although this remains controversial.
Management of such patients should be done collaboratively with cardiologists well versed in the treatment of cardiorenal syndrome. It may be possible that the worsening renal function in these patients represents important changes in cardiac rhythm or function (eg, low cardiac output state, new or worsening valvular disease, ongoing myocardial ischemia, cardiac tamponade, uncontrolled bradycardia or tachyarrythmia). Interventions aimed at reversing such perturbations could be the most important steps in improving cardiorenal function and reversing AKI.
- Thind GS, Loehrke M, Wilt JL. Acute cardiorenal syndrome: mechanisms and clinical implications. Cleve Clin J Med 2018; 85(3):231–239. doi:10.3949/ccjm.85a.17019
- Grodin JL. Hemodynamically, the kidney is at the heart of cardiorenal syndrome. Cleve Clin J Med 2018; 85(3):240–242. doi:10.3949/ccjm.85a.17126
- Freda BJ, Slawsky M, Mallidi J, Braden GL. Decongestive treatment of acute decompensated heart failure: cardiorenal implications of ultrafiltration and diuretics. Am J Kid Dis 2011; 58(6):1005–1017. doi:10.1053/j.ajkd.2011.07.023
- Tang WH, Kitai T. Intrarenal blood flow: a window into the congestive kidney failure phenotype of heart failure? JACC Heart Fail 2016; 4(8):683–686. doi:10.1016/j.jchf.2016.05.009
- Freda BJ, Knee AB, Braden GL, Visintainer PF, Thakaer CV. Effect of transient and sustained acute kidney injury on readmissions in acute decompensated heart failure. Am J Cardiol 2017; 119(11):1809–1814. doi:10.1016/j.amjcard.2017.02.044
- Bucsics T, Krones E. Renal dysfunction in cirrhosis: acute kidney injury and the hepatorenal syndrome. Gastroenterol Rep (Oxf) 2017; 5(2):127–137. doi:10.1093/gastro/gox009

In reply: Cardiorenal syndrome
In Reply: We thank Dr. Freda for his remarks and observations. Certainly, the clinical importance of this entity and the challenge it poses to clinicians cannot be overemphasized. We concur with the overall message and reply to his specific comments:
We completely agree that clinical data-gathering is of paramount importance. This includes careful history-taking, physical examination, electronic medical record review, laboratory data review, and imaging. As discussed in our article, renal electrolytes will reveal a prerenal state in acute cardiorenal syndrome, and other causes of prerenal acute kidney injury (AKI) should be ruled out. The role of point-of-care ultrasonography (eg, to measure the size and respirophasic variation of the inferior vena cava) as a vital diagnostic tool has been well described, and we endorse it.1 Moreover, apart from snapshot values, trends are also very important. This is especially pertinent when the patient care is being transferred to a new service (eg, from hospitalist service to the critical care service). In this case, careful review of diuretic dosage, renal function trend, intake and output, and weight trend would help in the diagnosis.
Inadequate diuretic therapy is perhaps one of the most common errors made in the management of patients with acute cardiorenal syndrome. As mentioned in our article, diuretics should be correctly dosed based on the patient’s renal function. It is a common misconception that diuretics are nephrotoxic: in reality, there is no direct renal toxicity from the drug itself. Certainly, overdiuresis may lead to AKI, but this is not a valid concern in patients with acute cardiorenal syndrome, who are fluid-overloaded by definition.
Another challenging clinical scenario is when a patient is diagnosed with acute cardiorenal syndrome but renal function worsens with diuretic therapy. In our experience, this is a paradoxical situation and often stems from misinterpretation of clinical data. The most common example is diuretic underdosage leading to inadequate diuretic response. Renal function will continue to decline in these patients, as renal congestion has not yet been relieved. This reiterates the importance of paying close attention to urine output and intake-output data. When the diuretic regimen is strengthened and a robust diuretic response is achieved, renal function should improve as systemic congestion diminishes.
Acute cardiorenal syndrome stems from hemodynamic derangements, and a multidisciplinary approach may certainly lead to better outcomes. Although we described the general theme of hemodynamic disturbances, patients with acute cardiorenal syndrome may have certain unique and complex hemodynamic “phenotypes” that we did not discuss due to the limited scope of the paper. One such phenotype worth mentioning is decompensated right heart failure, as seen in patients with severe pulmonary hypertension. Acute cardiorenal syndrome due to renal congestion is often seen in these patients, but they also have certain other unique characteristics such as ventricular interdependence.2 Giving intravenous fluids to these patients not only will worsen renal function but can also cause catastrophic reduction in cardiac output and blood pressure due to worsening interventricular septal bowing. Certain treatments (eg, pulmonary vasodilators) are unique to this patient population, and these patients should hence be managed by experienced clinicians.
- Blehar DJ, Dickman E, Gaspari R. Identification of congestive heart failure via respiratory variation of inferior vena cava diameter. Am J Emerg Med 2009; 27(1):71–75. doi:10.1016/j.ajem.2008.01.002
- Piazza G, Goldhaber SZ. The acutely decompensated right ventricle: pathways for diagnosis and management. Chest 2005128(3):1836–1852. doi:10.1378/chest.128.3.1836
In Reply: We thank Dr. Freda for his remarks and observations. Certainly, the clinical importance of this entity and the challenge it poses to clinicians cannot be overemphasized. We concur with the overall message and reply to his specific comments:
We completely agree that clinical data-gathering is of paramount importance. This includes careful history-taking, physical examination, electronic medical record review, laboratory data review, and imaging. As discussed in our article, renal electrolytes will reveal a prerenal state in acute cardiorenal syndrome, and other causes of prerenal acute kidney injury (AKI) should be ruled out. The role of point-of-care ultrasonography (eg, to measure the size and respirophasic variation of the inferior vena cava) as a vital diagnostic tool has been well described, and we endorse it.1 Moreover, apart from snapshot values, trends are also very important. This is especially pertinent when the patient care is being transferred to a new service (eg, from hospitalist service to the critical care service). In this case, careful review of diuretic dosage, renal function trend, intake and output, and weight trend would help in the diagnosis.
Inadequate diuretic therapy is perhaps one of the most common errors made in the management of patients with acute cardiorenal syndrome. As mentioned in our article, diuretics should be correctly dosed based on the patient’s renal function. It is a common misconception that diuretics are nephrotoxic: in reality, there is no direct renal toxicity from the drug itself. Certainly, overdiuresis may lead to AKI, but this is not a valid concern in patients with acute cardiorenal syndrome, who are fluid-overloaded by definition.
Another challenging clinical scenario is when a patient is diagnosed with acute cardiorenal syndrome but renal function worsens with diuretic therapy. In our experience, this is a paradoxical situation and often stems from misinterpretation of clinical data. The most common example is diuretic underdosage leading to inadequate diuretic response. Renal function will continue to decline in these patients, as renal congestion has not yet been relieved. This reiterates the importance of paying close attention to urine output and intake-output data. When the diuretic regimen is strengthened and a robust diuretic response is achieved, renal function should improve as systemic congestion diminishes.
Acute cardiorenal syndrome stems from hemodynamic derangements, and a multidisciplinary approach may certainly lead to better outcomes. Although we described the general theme of hemodynamic disturbances, patients with acute cardiorenal syndrome may have certain unique and complex hemodynamic “phenotypes” that we did not discuss due to the limited scope of the paper. One such phenotype worth mentioning is decompensated right heart failure, as seen in patients with severe pulmonary hypertension. Acute cardiorenal syndrome due to renal congestion is often seen in these patients, but they also have certain other unique characteristics such as ventricular interdependence.2 Giving intravenous fluids to these patients not only will worsen renal function but can also cause catastrophic reduction in cardiac output and blood pressure due to worsening interventricular septal bowing. Certain treatments (eg, pulmonary vasodilators) are unique to this patient population, and these patients should hence be managed by experienced clinicians.
- Blehar DJ, Dickman E, Gaspari R. Identification of congestive heart failure via respiratory variation of inferior vena cava diameter. Am J Emerg Med 2009; 27(1):71–75. doi:10.1016/j.ajem.2008.01.002
- Piazza G, Goldhaber SZ. The acutely decompensated right ventricle: pathways for diagnosis and management. Chest 2005128(3):1836–1852. doi:10.1378/chest.128.3.1836

Patient-Centered, Payer-Centered, or Both? The 30-Day Readmission Metric
There is little doubt that preventing 30-day readmissions to the hospital results in lower costs for payers. However, reducing costs alone does not make this metric a measure of “high value” care.1 Rather, it is the improvement in the effectiveness of the discharge process that occurs alongside lower costs that makes readmission reduction efforts “high value” – or a “win-win” for patients and payers.
However, the article by Nuckols and colleagues in this month’s issue of the Journal of Hospital Medicine (JHM) suggests that it might not be that simple and adds nuance to the ongoing discussion about the 30-day readmission metric.2 The study used data collected by the federal government to examine changes not only in 30-day readmission rates between 2009-2010 and 2013-2014 but also changes in emergency department (ED) and observation unit visits. What they found is important. In general, despite reductions in 30-day readmissions for patients served by Medicare and private insurance, there were increases in observation unit and ED visits across all payer types (including Medicare and private insurance). These increases in observation unit and ED visits resulted in statistically higher overall “revisit” rates for the uninsured and those insured by Medicaid and offset any improvements in the “revisit” rates resulting from reductions in 30-day readmissions for those with private insurance. Those insured by Medicare—representing about 300,000 of the 420,000 visits analyzed—still had a statistically lower “revisit” rate, but it was only marginally lower (25.0% in 2013-2014 versus 25.3% in 2009-2010).2
The generalizability of the Nuckols’ study was limited in that it examined only index admissions for acute myocardial infarction (AMI), heart failure (HF), and pneumonia and used data from only Georgia, Nebraska, South Carolina, and Tennessee—the four states where observation and ED visit data were available in the federal database.2 The study also did not examine hospital-level revisit data; hence, it was not able to determine if hospitals with greater reductions in readmission rates had greater increases in observation or ED visits, as one might predict. Despite these limitations, the rigor of the study was noteworthy. The authors used matching techniques to ensure that the populations examined in the two time periods were comparable. Unlike previous research,3,4 they also used a comprehensive definition of a hospital “revisit” (including both observation and ED visits) and measured “revisit” rates across several payer types, rather than focusing exclusively on those covered by fee for service Medicare, as in past studies.4,5
What the study by Nuckols and colleagues suggests is that even though patients may be readmitted less, they may be coming back to the ED or getting admitted to the observation unit more, resulting in overall “revisit” rates that are marginally lower for Medicare patients, but often the same or even higher for other payer groups, particularly disadvantaged payer groups who are uninsured or insured by Medicaid.2 Although the authors do not assert causality for these trends, it is worth noting that the much-discussed Hospital Readmission Reduction Program (or “readmission penalty”) applies only to Medicare patients aged more than 65 years. It is likely that this program influenced the differences identified between payer groups in this article.
Beyond the policy implications of these findings, the experience of patients cared for in these different settings is of paramount importance. Unfortunately, there are limited data comparing patient perceptions, preferences, or outcomes resulting from readmission to an inpatient service versus an observation unit or ED visit within 30 days of discharge. However, there is reason to believe that costs could be higher for some patients treated in the ED or an observation unit as compared to those in the inpatient setting,6 and that care continuity and quality may be different across these settings. In a recent white paper on observation care published by the Society of Hospital Medicine (SHM) Public Policy Committee,7 the SHM reported the results of a 2017 survey of its members about observation care. The results were concerning. An overwhelming majority of respondents (87%) believed that the rules for observation are unclear for patients, and 68% of respondents believed that policy changes mandating informing patients of their observation status have created conflict between the provider and the patient.7 As shared by one respondent, “the observation issue can severely damage the therapeutic bond with patient/family, who may conclude that the hospitalist has more interest in saving someone money at the expense of patient care.”7 Thus, there is significant concern about the nature of observation stays and the experience for patients and providers. We should take care to better understand these experiences given that readmission reduction efforts may funnel more patients into observation care.
As a next step, we recommend further examination of how “revisit” rates have changed over time for patients with any discharge diagnosis, and not just those with pneumonia, AMI, or HF.8 Such examinations should be stratified by payer to identify differential impacts on those with lower socioeconomic status. Analyses should also examine changes in “revisit” types at the hospital level to better understand if hospitals with reductions in readmission rates are simply shifting revisits to the observation unit or ED. It is possible that inpatient readmissions for any given hospital are decreasing without concomitant increases in observation visits, as there are forces independent of the readmission penalty, such as the Recovery Audit Contractor program, that are driving hospitals to more frequently code patients as observation visits rather than inpatient admissions.9 Thus, readmissions could decrease and observation unit visits could increase independent of one another. We also recommend further research to examine differences in care quality, clinical outcomes, and costs for those readmitted to the hospital within 30 days of discharge versus those cared for in observation units or the ED. The challenge of such studies will be to identify and examine comparable populations of patients across these three settings. Examining patient perceptions and preferences across these settings is also critical. Finally, when assessing interventions to reduce inpatient readmissions, we need to consider “revisits” as a whole, not simply readmissions.10 Otherwise, we may simply be promoting the use of interventions that shift inpatient readmissions to observation unit or ED revisits, and there is little that is patient-centered or high value about that.9
Disclosures
The authors have nothing to disclose.
1. Smith M, Saunders R, Stuckhardt L, McGinnis JM, eds. Best care at lower cost: the path to continuously learning health care in America. Washington, DC: National Academies Press; 2013. PubMed
2. Nuckols TK, Fingar KR, Barrett ML, et al. Returns to emergency department, observation, or inpatient care within 30 days after hospitalization in 4 states, 2009 and 2010 versus 2013 and 2014. J Hosp Med. 2018;13(5):296-303. PubMed
3. Fingar KR, Washington R. Trends in Hospital Readmissions for Four High-Volume Conditions, 2009–2013. Statistical Brief No. 196. https://www.hcup-us.ahrq.gov/reports/statbriefs/sb196-Readmissions-Trends-High-Volume-Conditions.pdf. Accessed March 5, 2018.
4. Zuckerman RB, Sheingold SH, Orav EJ, Ruhter J, Epstein AM. Readmissions, observation, and the Hospital Readmissions Reduction Program. N Engl J Med. 2016;374(16):1543-1551. DOI: 10.1056/NEJMsa1513024. PubMed
5. Gerhardt G, Yemane A, Apostle K, Oelschlaeger A, Rollins E, Brennan N. Evaluating whether changes in utilization of hospital outpatient services contributed to lower Medicare readmission rate. Medicare Medicaid Res Rev. 2014;4(1). DOI: 10.5600/mmrr2014-004-01-b03 PubMed
6. Kangovi S, Cafardi SG, Smith RA, Kulkarni R, Grande D. Patient financial responsibility for observation care. J Hosp Med. 2015;10(11):718-723. DOI: 10.1002/jhm.2436. PubMed
7. The Hospital Observation Care Problem: Perspectives and Solutions from the Society of Hospital Medicine. Society of Hospital Medicine Public Policy Committee. https://www.hospitalmedicine.org/globalassets/policy-and-advocacy/advocacy-pdf/shms-observation-white-paper-2017. Accessed February 12, 2018.
8. Rosen AK, Chen Q, Shwartz M, et al. Does use of a hospital-wide readmission measure versus condition-specific readmission measures make a difference for hospital profiling and payment penalties? Medical Care. 2016;54(2):155-161. DOI: 10.1097/MLR.0000000000000455. PubMed
9. Baugh CW, Schuur JD. Observation care-high-value care or a cost-shifting loophole? N Engl J Med. 2013;369(4):302-305. DOI: 10.1056/NEJMp1304493. PubMed
10. Cassel CK, Conway PH, Delbanco SF, Jha AK, Saunders RS, Lee TH. Getting more performance from performance measurement. N Engl J Med. 2014;371(23):2145-2147. DOI: 10.1056/NEJMp1408345. PubMed
There is little doubt that preventing 30-day readmissions to the hospital results in lower costs for payers. However, reducing costs alone does not make this metric a measure of “high value” care.1 Rather, it is the improvement in the effectiveness of the discharge process that occurs alongside lower costs that makes readmission reduction efforts “high value” – or a “win-win” for patients and payers.
However, the article by Nuckols and colleagues in this month’s issue of the Journal of Hospital Medicine (JHM) suggests that it might not be that simple and adds nuance to the ongoing discussion about the 30-day readmission metric.2 The study used data collected by the federal government to examine changes not only in 30-day readmission rates between 2009-2010 and 2013-2014 but also changes in emergency department (ED) and observation unit visits. What they found is important. In general, despite reductions in 30-day readmissions for patients served by Medicare and private insurance, there were increases in observation unit and ED visits across all payer types (including Medicare and private insurance). These increases in observation unit and ED visits resulted in statistically higher overall “revisit” rates for the uninsured and those insured by Medicaid and offset any improvements in the “revisit” rates resulting from reductions in 30-day readmissions for those with private insurance. Those insured by Medicare—representing about 300,000 of the 420,000 visits analyzed—still had a statistically lower “revisit” rate, but it was only marginally lower (25.0% in 2013-2014 versus 25.3% in 2009-2010).2
The generalizability of the Nuckols’ study was limited in that it examined only index admissions for acute myocardial infarction (AMI), heart failure (HF), and pneumonia and used data from only Georgia, Nebraska, South Carolina, and Tennessee—the four states where observation and ED visit data were available in the federal database.2 The study also did not examine hospital-level revisit data; hence, it was not able to determine if hospitals with greater reductions in readmission rates had greater increases in observation or ED visits, as one might predict. Despite these limitations, the rigor of the study was noteworthy. The authors used matching techniques to ensure that the populations examined in the two time periods were comparable. Unlike previous research,3,4 they also used a comprehensive definition of a hospital “revisit” (including both observation and ED visits) and measured “revisit” rates across several payer types, rather than focusing exclusively on those covered by fee for service Medicare, as in past studies.4,5
What the study by Nuckols and colleagues suggests is that even though patients may be readmitted less, they may be coming back to the ED or getting admitted to the observation unit more, resulting in overall “revisit” rates that are marginally lower for Medicare patients, but often the same or even higher for other payer groups, particularly disadvantaged payer groups who are uninsured or insured by Medicaid.2 Although the authors do not assert causality for these trends, it is worth noting that the much-discussed Hospital Readmission Reduction Program (or “readmission penalty”) applies only to Medicare patients aged more than 65 years. It is likely that this program influenced the differences identified between payer groups in this article.
Beyond the policy implications of these findings, the experience of patients cared for in these different settings is of paramount importance. Unfortunately, there are limited data comparing patient perceptions, preferences, or outcomes resulting from readmission to an inpatient service versus an observation unit or ED visit within 30 days of discharge. However, there is reason to believe that costs could be higher for some patients treated in the ED or an observation unit as compared to those in the inpatient setting,6 and that care continuity and quality may be different across these settings. In a recent white paper on observation care published by the Society of Hospital Medicine (SHM) Public Policy Committee,7 the SHM reported the results of a 2017 survey of its members about observation care. The results were concerning. An overwhelming majority of respondents (87%) believed that the rules for observation are unclear for patients, and 68% of respondents believed that policy changes mandating informing patients of their observation status have created conflict between the provider and the patient.7 As shared by one respondent, “the observation issue can severely damage the therapeutic bond with patient/family, who may conclude that the hospitalist has more interest in saving someone money at the expense of patient care.”7 Thus, there is significant concern about the nature of observation stays and the experience for patients and providers. We should take care to better understand these experiences given that readmission reduction efforts may funnel more patients into observation care.
As a next step, we recommend further examination of how “revisit” rates have changed over time for patients with any discharge diagnosis, and not just those with pneumonia, AMI, or HF.8 Such examinations should be stratified by payer to identify differential impacts on those with lower socioeconomic status. Analyses should also examine changes in “revisit” types at the hospital level to better understand if hospitals with reductions in readmission rates are simply shifting revisits to the observation unit or ED. It is possible that inpatient readmissions for any given hospital are decreasing without concomitant increases in observation visits, as there are forces independent of the readmission penalty, such as the Recovery Audit Contractor program, that are driving hospitals to more frequently code patients as observation visits rather than inpatient admissions.9 Thus, readmissions could decrease and observation unit visits could increase independent of one another. We also recommend further research to examine differences in care quality, clinical outcomes, and costs for those readmitted to the hospital within 30 days of discharge versus those cared for in observation units or the ED. The challenge of such studies will be to identify and examine comparable populations of patients across these three settings. Examining patient perceptions and preferences across these settings is also critical. Finally, when assessing interventions to reduce inpatient readmissions, we need to consider “revisits” as a whole, not simply readmissions.10 Otherwise, we may simply be promoting the use of interventions that shift inpatient readmissions to observation unit or ED revisits, and there is little that is patient-centered or high value about that.9
Disclosures
The authors have nothing to disclose.
1. Smith M, Saunders R, Stuckhardt L, McGinnis JM, eds. Best care at lower cost: the path to continuously learning health care in America. Washington, DC: National Academies Press; 2013. PubMed
2. Nuckols TK, Fingar KR, Barrett ML, et al. Returns to emergency department, observation, or inpatient care within 30 days after hospitalization in 4 states, 2009 and 2010 versus 2013 and 2014. J Hosp Med. 2018;13(5):296-303. PubMed
3. Fingar KR, Washington R. Trends in Hospital Readmissions for Four High-Volume Conditions, 2009–2013. Statistical Brief No. 196. https://www.hcup-us.ahrq.gov/reports/statbriefs/sb196-Readmissions-Trends-High-Volume-Conditions.pdf. Accessed March 5, 2018.
4. Zuckerman RB, Sheingold SH, Orav EJ, Ruhter J, Epstein AM. Readmissions, observation, and the Hospital Readmissions Reduction Program. N Engl J Med. 2016;374(16):1543-1551. DOI: 10.1056/NEJMsa1513024. PubMed
5. Gerhardt G, Yemane A, Apostle K, Oelschlaeger A, Rollins E, Brennan N. Evaluating whether changes in utilization of hospital outpatient services contributed to lower Medicare readmission rate. Medicare Medicaid Res Rev. 2014;4(1). DOI: 10.5600/mmrr2014-004-01-b03 PubMed
6. Kangovi S, Cafardi SG, Smith RA, Kulkarni R, Grande D. Patient financial responsibility for observation care. J Hosp Med. 2015;10(11):718-723. DOI: 10.1002/jhm.2436. PubMed
7. The Hospital Observation Care Problem: Perspectives and Solutions from the Society of Hospital Medicine. Society of Hospital Medicine Public Policy Committee. https://www.hospitalmedicine.org/globalassets/policy-and-advocacy/advocacy-pdf/shms-observation-white-paper-2017. Accessed February 12, 2018.
8. Rosen AK, Chen Q, Shwartz M, et al. Does use of a hospital-wide readmission measure versus condition-specific readmission measures make a difference for hospital profiling and payment penalties? Medical Care. 2016;54(2):155-161. DOI: 10.1097/MLR.0000000000000455. PubMed
9. Baugh CW, Schuur JD. Observation care-high-value care or a cost-shifting loophole? N Engl J Med. 2013;369(4):302-305. DOI: 10.1056/NEJMp1304493. PubMed
10. Cassel CK, Conway PH, Delbanco SF, Jha AK, Saunders RS, Lee TH. Getting more performance from performance measurement. N Engl J Med. 2014;371(23):2145-2147. DOI: 10.1056/NEJMp1408345. PubMed
© 2018 Society of Hospital Medicine
Improving Teamwork and Patient Outcomes with Daily Structured Interdisciplinary Bedside Rounds: A Multimethod Evaluation
Evidence has emerged over the last decade of the importance of the front line patient care team in improving quality and safety of patient care.1-3 Improving collaboration and workflow is thought to increase reliability of care delivery.1 One promising method to improve collaboration is the interdisciplinary ward round (IDR), whereby medical, nursing, and allied health staff attend ward rounds together. IDRs have been shown to reduce the average cost and length of hospital stay,4,5 although a recent systematic review found inconsistent improvements across studies.6 Using the term “interdisciplinary,” however, does not necessarily imply the inclusion of all disciplines necessary for patient care. The challenge of conducting interdisciplinary rounds is considerable in today’s busy clinical environment: health professionals who are spread across multiple locations within the hospital, and who have competing hospital responsibilities and priorities, must come together at the same time and for a set period each day. A survey with respondents from Australia, the United States, and Canada found that only 65% of rounds labelled “interdisciplinary” included a physician.7
While IDRs are not new, structured IDRs involve the purposeful inclusion of all disciplinary groups relevant to a patient’s care, alongside a checklist tool to aid comprehensive but concise daily assessment of progress and treatment planning. Novel, structured IDR interventions have been tested recently in various settings, resulting in improved teamwork, hospital performance, and patient outcomes in the US, including the Structured Interdisciplinary Bedside Round (SIBR) model.8-12
The aim of this study was to assess the impact of the new structure and the associated practice changes on interprofessional working and a set of key patient and hospital outcome measures. As part of the intervention, the hospital established an Acute Medical Unit (AMU) based on the Accountable Care Unit model.13
METHODS
Description of the Intervention
The AMU brought together 2 existing medical wards, a general medical ward and a 48-hour turnaround Medical Assessment Unit (MAU), into 1 geographical location with 26 beds. Prior to the merger, the MAU and general medical ward had separate and distinct cultures and workflows. The MAU was staffed with experienced nurses; nurses worked within a patient allocation model, the workload was shared, and relationships were collegial. In contrast, the medical ward was more typical of the remainder of the hospital: nurses had a heavy workload, managed a large group of longer-term complex patients, and they used a team-based nursing model of care in which senior nurses supervised junior staff. It was decided that because of the seniority of the MAU staff, they should be in charge of the combined AMU, and the patient allocation model of care would be used to facilitate SIBR.
Consultants, junior doctors, nurses, and allied health professionals (including a pharmacist, physiotherapist, occupational therapist, and social worker) were geographically aligned to the new ward, allowing them to participate as a team in daily structured ward rounds. Rounds are scheduled at the same time each day to enable family participation. The ward round is coordinated by a registrar or intern, with input from patient, family, nursing staff, pharmacy, allied health, and other doctors (intern, registrar, and consultant) based on the unit. The patient load is distributed between 2 rounds: 1 scheduled for 10
Data Collection Strategy
The study was set in an AMU in a large tertiary care hospital in regional Australia and used a convergent parallel multimethod approach14 to evaluate the implementation and effect of SIBR in the AMU. The study population consisted of 32 clinicians employed at the study hospital: (1) the leadership team involved in the development and implementation of the intervention and (2) members of clinical staff who were part of the AMU team.
Qualitative Data
Qualitative measures consisted of semistructured interviews. We utilized multiple strategies to recruit interviewees, including a snowball technique, criterion sampling,15 and emergent sampling, so that we could seek the views of both the leadership team responsible for the implementation and “frontline” clinical staff whose daily work was directly affected by it. Everyone who was initially recruited agreed to be interviewed, and additional frontline staff asked to be interviewed once they realized that we were asking about how staff experienced the changes in practice.
The research team developed a semistructured interview guide based on an understanding of the merger of the 2 units as well as an understanding of changes in practice of the rounds (provided in Appendix 1). The questions were pilot tested on a separate unit and revised. Questions were structured into 5 topic areas: planning and implementation of AMU/SIBR model, changes in work practices because of the new model, team functioning, job satisfaction, and perceived impact of the new model on patients and families. All interviews were audio-recorded and transcribed verbatim for analysis.
Quantitative Data
Quantitative data were collected on patient outcome measures: length of stay (LOS), discharge date and time, mode of separation (including death), primary diagnostic category, total hospital stay cost and “clinical response calls,” and patient demographic data (age, gender, and Patient Clinical Complexity Level [PCCL]). The PCCL is a standard measure used in Australian public inpatient facilities and is calculated for each episode of care.16 It measures the cumulative effect of a patient’s complications and/or comorbidities and takes an integer value between 0 (no clinical complexity effect) and 4 (catastrophic clinical complexity effect).
Data regarding LOS, diagnosis (Australian Refined Diagnosis Related Groups [AR-DRG], version 7), discharge date, and mode of separation (including death) were obtained from the New South Wales Ministry of Health’s Health Information Exchange for patients discharged during the year prior to the intervention through 1 year after the implementation of the intervention. The total hospital stay cost for these individuals was obtained from the local Health Service Organizational Performance Management unit. Inclusion criteria were inpatients aged over 15 years experiencing acute episodes of care; patients with a primary diagnostic category of mental diseases and disorders were excluded. LOS was calculated based on ward stay. AMU data were compared with the remaining hospital ward data (the control group). Data on “clinical response calls” per month per ward were also obtained for the 12 months prior to intervention and the 12 months of the intervention.
Analysis
Qualitative Analysis
Qualitative data analysis consisted of a hybrid form of textual analysis, combining inductive and deductive logics.17,18 Initially, 3 researchers (J.P., J.J., and R.C.W.) independently coded the interview data inductively to identify themes. Discrepancies were resolved through discussion until consensus was reached. Then, to further facilitate analysis, the researchers deductively imposed a matrix categorization, consisting of 4 a priori categories: context/conditions, practices/processes, professional interactions, and consequences.19,20 Additional a priori categories were used to sort the themes further in terms of experiences prior to, during, and following implementation of the intervention. To compare changes in those different time periods, we wanted to know what themes were related to implementation and whether those themes continued to be applicable to sustainability of the changes.
Quantitative analysis. Distribution of continuous data was examined by using the one-sample Kolmogorov-Smirnov test. We compared pre-SIBR (baseline) measures using the Student t test for normally distributed data, the Mann-Whitney U z test for nonparametric data (denoted as M-W U z), and χ2 tests for categorical data. Changes in monthly “clinical response calls” between the AMU and the control wards over time were explored by using analysis of variance (ANOVA). Changes in LOS and cost of stay from the year prior to the intervention to the first year of the intervention were analyzed by using generalized linear models, which are a form of linear regression. Factors, or independent variables, included in the models were time period (before or during intervention), ward (AMU or control), an interaction term (time by ward), patient age, gender, primary diagnosis (major diagnostic categories of the AR-DRG version 7.0), and acuity (PCCL). The estimated marginal means for cost of stay for the 12-month period prior to the intervention and for the first 12 months of the intervention were produced. All statistical analyses were performed by using IBM SPSS version 21 (IBM Corp., Armonk, New York) and with alpha set at P < .05.
RESULTS
Qualitative Evaluation of the Intervention
Participants.
Three researchers (RCW, JP, and JJ) conducted in-person, semistructured interviews with 32 clinicians (9 male, 23 female) during a 3-day period. The duration of the interviews ranged from 19 minutes to 68 minutes. Participants consisted of 8 doctors, 18 nurses, 5 allied health professionals, and an administrator. Ten of the participants were involved in the leadership group that drove the planning and implementation of SIBR and the AMU.
Themes
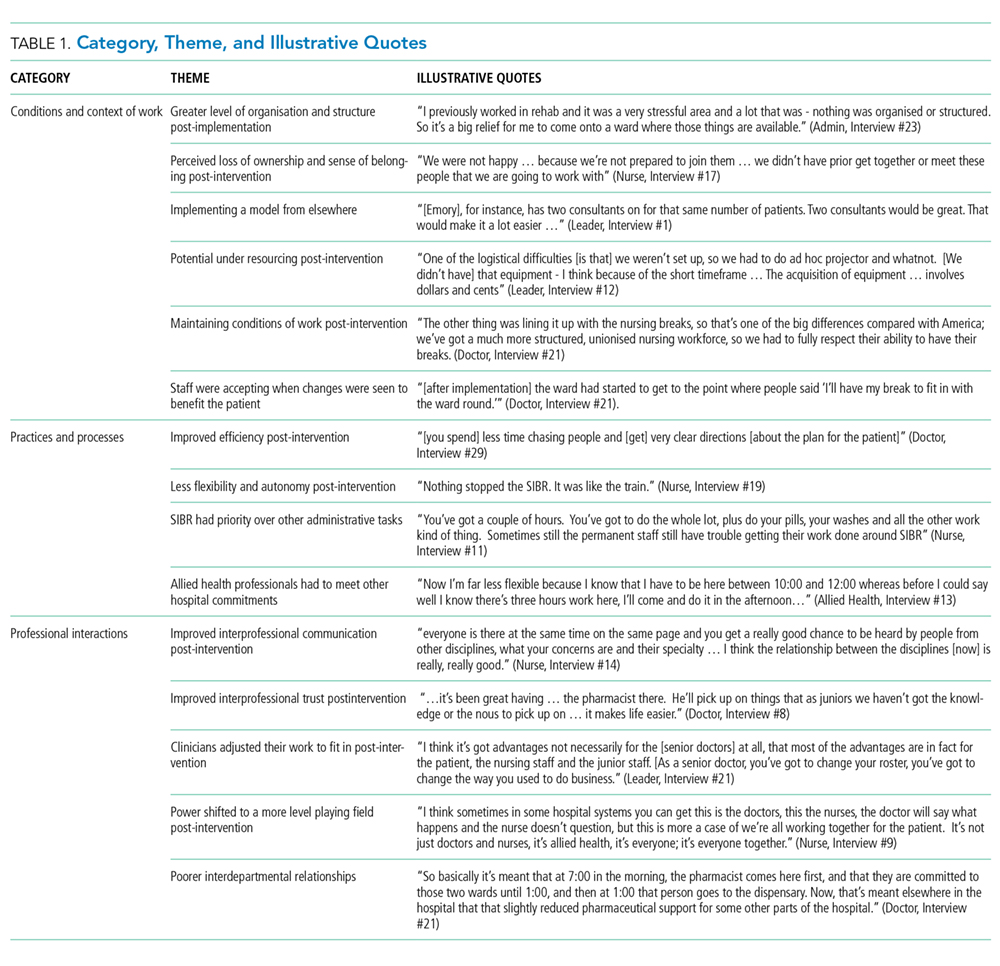
Context and Conditions of Work
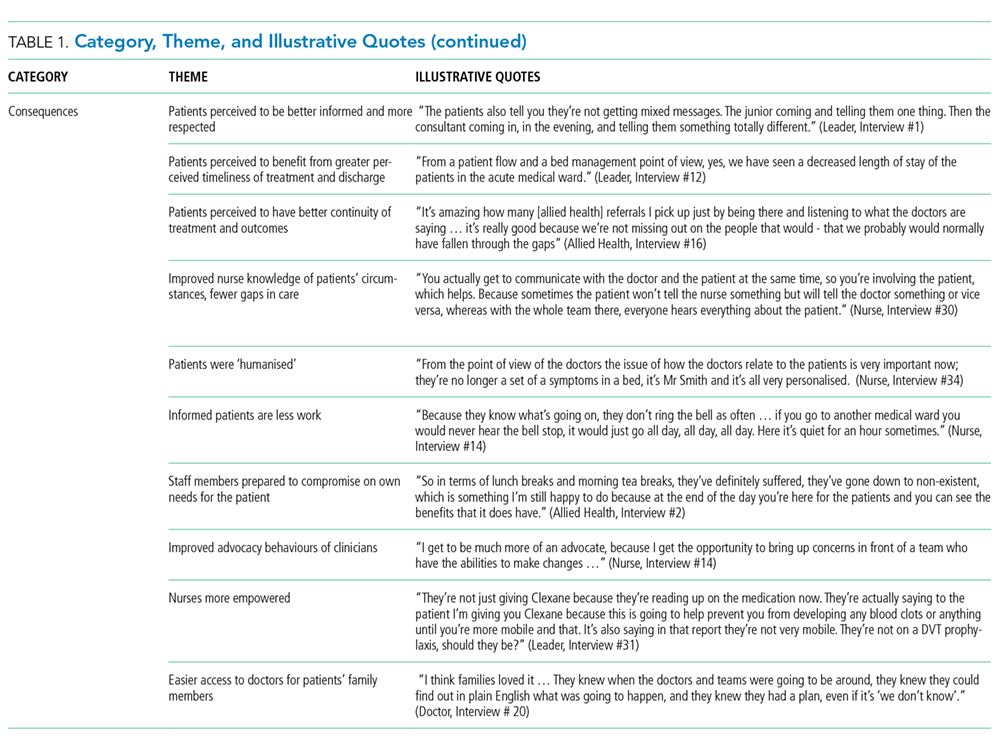
Practices and Processes
Participants perceived postintervention work processes to be more efficient. A primary example was a near-universal approval of the time saved from not “chasing” other professionals now that they were predictably available on the ward. More timely decision-making was thought to result from this predicted availability and associated improvements in communication.
The SIBR enforced a workflow on all staff, who felt there was less flexibility to work autonomously (doctors) or according to patients’ needs (nurses). More junior staff expressed anxiety about delayed completion of discharge-related administrative tasks because of the midday completion of the round. Allied health professionals who had commitments in other areas of the hospital often faced a dilemma about how to prioritize SIBR attendance and activities on other wards. This was managed differently depending on the specific allied health profession and the individuals within that profession.
Professional Interactions
In terms of interprofessional dynamics on the AMU, the implementation of SIBR resulted in a shift in power between the doctors and the nurses. In the old ward, doctors largely controlled the timing of medical rounding processes. In the new AMU, doctors had to relinquish some control over the timing of personal workflow to comply with the requirements of SIBR. Furthermore, there was evidence that this had some impact on traditional hierarchical models of communication and created a more level playing field, as nonmedical professionals felt more empowered to voice their thoughts during and outside of rounds.
The rounds provided much greater visibility of the “big picture” and each profession’s role within it; this allowed each clinician to adjust their work to fit in and take account of others. The process was not instantaneous, and trust developed over a period of weeks. Better communication meant fewer misunderstandings, and workload dropped.
The participation of allied health professionals in the round enhanced clinician interprofessional skills and knowledge. The more inclusive approach facilitated greater trust between clinical disciplines and a development of increased confidence among nursing, allied health, and administrative professionals.
In contrast to the positive impacts of the new model of care on communication and relationships within the AMU, interdepartmental relationships were seen to have suffered. The processes and practices of the new AMU are different to those in the other hospital departments, resulting in some isolation of the unit and difficulties interacting with other areas of the hospital. For example, the trade-offs that allied health professionals made to participate in SIBR often came at the expense of other units or departments.
Consequences
All interviewees lauded the benefits of the SIBR intervention for patients. Patients were perceived to be better informed and more respected, and they benefited from greater perceived timeliness of treatment and discharge, easier access to doctors, better continuity of treatment and outcomes, improved nurse knowledge of their circumstances, and fewer gaps in their care. Clinicians spoke directly to the patient during SIBR, rather than consulting with professional colleagues over the patient’s head. Some staff felt that doctors were now thinking of patients as “people” rather than “a set of symptoms.” Nurses discovered that informed patients are easier to manage.
Staff members were prepared to compromise on their own needs in the interests of the patient. The emphasis on the patient during rounds resulted in improved advocacy behaviors of clinicians. The nurses became more empowered and able to show greater initiative. Families appeared to find it much easier to access the doctors and obtain information about the patient, resulting in less distress and a greater sense of control and trust in the process.
Quantitative Evaluation of the Intervention
Hospital Outcomes
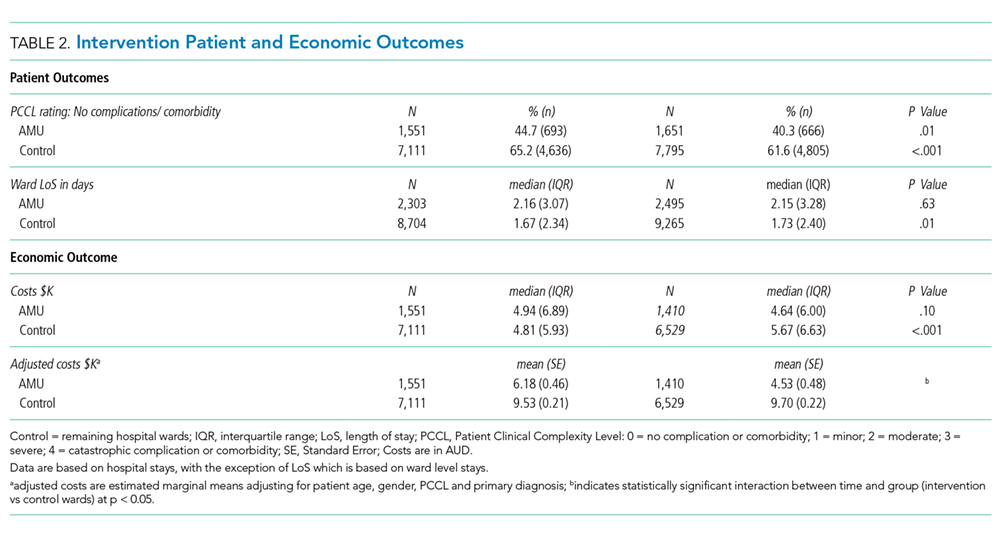
Patient demographics did not change over time within either the AMU or control wards. However, there were significant increases in Patient Clinical Complexity Level (PCCL) ratings for both the AMU (44.7% to 40.3%; P<0.05) and the control wards (65.2% to 61.6%; P < .001). There was not a statistically significant shift over time in median LoS on the ward prior to (2.16 days, IQR 3.07) and during SIBR in the AMU (2.15 days; IQR 3.28), while LoS increased in the control (pre-SIBR: 1.67, 2.34; during SIBR 1.73, 2.40; M-W U z = -2.46, P = .014). Mortality rates were stable across time for both the AMU (pre-SIBR 2.6% [95% confidence interval {CI}, 1.9-3.5]; during SIBR 2.8% [95% CI, 2.1-3.7]) and the control (pre-SIBR 1.3% [95% CI, 1.0-1.5]; during SIBR 1.2% [95% CI, 1.0-1.4]).
The total number of “clinical response calls” or “flags” per month dropped significantly from pre-SIBR to during SIBR for the AMU from a mean of 63.1 (standard deviation 15.1) to 31.5 (10.8), but remained relatively stable in the control (pre-SIBR 72.5 [17.6]; during SIBR 74.0 [28.3]), and this difference was statistically significant (F (1,44) = 9.03; P = .004). There was no change in monthly “red flags” or “rapid response calls” over time (AMU: 10.5 [3.6] to 9.1 [4.7]; control: 40.3 [11.7] to 41.8 [10.8]). The change in total “clinical response calls” over time was attributable to the “yellow flags” or the decline in “calls for clinical review” in the AMU (from 52.6 [13.5] to 22.4 [9.2]). The average monthly “yellow flags” remained stable in the control (pre-SIBR 32.2 [11.6]; during SIBR 32.3 [22.4]). The AMU and the control wards differed significantly in how the number of monthly “calls for clinical review” changed from pre-SIBR to during SIBR (F (1,44) = 12.18; P = .001).
The 2 main outcome measures, LOS and costs, were analyzed to determine whether changes over time differed between the AMU and the control wards after accounting for age, gender, and PCCL. There was no statistically significant difference between the AMU and control wards in terms of change in LOS over time (Wald χ2 = 1.05; degrees of freedom [df] = 1; P = .31). There was a statistically significant interaction for cost of stay, indicating that ward types differed in how they changed over time (with a drop in cost over time observed in the AMU and an increase observed in the control) (Wald χ2 = 6.34; df = 1; P = .012.
DISCUSSION
We report on the implementation of an AMU model of care, including the reorganization of a nursing unit, implementation of IDR, and geographical localization. Our study design allowed a more comprehensive assessment of the implementation of system redesign to include provider perceptions and clinical outcomes.
The 2 very different cultures of the old wards that were combined into the AMU, as well as the fact that the teams had not previously worked together, made the merger of the 2 wards difficult. Historically, the 2 teams had worked in very different ways, and this created barriers to implementation. The SIBR also demanded new ways of working closely with other disciplines, which disrupted older clinical cultures and relationships. While organizational culture is often discussed, and even measured, the full impact of cultural factors when making workplace changes is frequently underestimated.21 The development of a new culture takes time, and it can lag organizational structural changes by months or even years.22 As our interviewees expressed, often emotionally, there was a sense of loss during the merger of the 2 units. While this is a potential consequence of any large organizational change, it could be addressed during the planning stages, prior to implementation, by acknowledging and perhaps honoring what is being left behind. It is safe to assume that future units implementing the rounding intervention will not fully realize commensurate levels of culture change until well after the structural and process changes are finalized, and only then if explicit effort is made to engender cultural change.
Overall, however, the interviewees perceived that the SIBR intervention led to improved teamwork and team functioning. These improvements were thought to benefit task performance and patient safety. Our study is consistent with other research in the literature that reported that greater staff empowerment and commitment is associated with interdisciplinary patient care interventions in front line caregiving teams.23,24 The perception of a more equal nurse-physician relationship resulted in improved job satisfaction, better interprofessional relationships, and perceived improvements in patient care. A flatter power gradient across professions and increased interdisciplinary teamwork has been shown to be associated with improved patient outcomes.25,26
Changes to clinician workflow can significantly impact the introduction of new models of care. A mandated time each day for structured rounds meant less flexibility in workflow for clinicians and made greater demands on their time management and communication skills. Furthermore, the need for human resource negotiations with nurse representatives was an unexpected component of successfully introducing the changes to workflow. Once the benefits of saved time and better communication became evident, changes to workflow were generally accepted. These challenges can be managed if stakeholders are engaged and supportive of the changes.13
Finally, our findings emphasize the importance of combining qualitative and quantitative data when evaluating an intervention. In this case, the qualitative outcomes that include “intangible” positive effects, such as cultural change and improved staff understanding of one another’s roles, might encourage us to continue with the SIBR intervention, which would allow more time to see if the trend of reduced LOS identified in the statistical analysis would translate to a significant effect over time.
We are unable to identify which aspects of the intervention led to the greatest impact on our outcomes. A recent study found that interdisciplinary rounds had no impact on patients’ perceptions of shared decision-making or care satisfaction.27 Although our findings indicated many potential benefits for patients, we were not able to interview patients or their carers to confirm these findings. In addition, we do not have any patient-centered outcomes, which would be important to consider in future work. Although our data on clinical response calls might be seen as a proxy for adverse events, we do not have data on adverse events or errors, and these are important to consider in future work. Finally, our findings are based on data from a single institution.
CONCLUSIONS
While there were some criticisms, participants expressed overwhelmingly positive reactions to the SIBR. The biggest reported benefit was perceived improved communication and understanding between and within the clinical professions, and between clinicians and patients. Improved communication was perceived to have fostered improved teamwork and team functioning, with most respondents feeling that they were a valued part of the new team. Improved teamwork was thought to contribute to improved task performance and led interviewees to perceive a higher level of patient safety. This research highlights the need for multimethod evaluations that address contextual factors as well as clinical outcomes.
Acknowledgments
The authors would like to acknowledge the clinicians and staff members who participated in this study. We would also like to acknowledge the support from the NSW Clinical Excellence Commission, in particular, Dr. Peter Kennedy, Mr. Wilson Yeung, Ms. Tracy Clarke, and Mr. Allan Zhang, and also from Ms. Karen Storey and Mr. Steve Shea of the Organisational Performance Management team at the Orange Health Service.
Disclosures
None of the authors had conflicts of interest in relation to the conduct or reporting of this study, with the exception that the lead author’s institution, the Australian Institute of Health Innovation, received a small grant from the New South Wales Clinical Excellence Commission to conduct the work. Ethics approval for the research was granted by the Greater Western Area Health Service Human Research Ethics Committee (HREC/13/GWAHS/22). All interviewees consented to participate in the study. For patient data, consent was not obtained, but presented data are anonymized. The full dataset is available from the corresponding author with restrictions. This research was funded by the NSW Clinical Excellence Commission, who also encouraged submission of the article for publication. The funding source did not have any role in conduct or reporting of the study. R.C.W., J.P., and J.J. conceptualized and conducted the qualitative component of the study, including method, data collection, data analysis, and writing of the manuscript. G.L., C.H., and H.D. conceptualized the quantitative component of the study, including method, data collection, data analysis, and writing of the manuscript. G.S. contributed to conceptualization of the study, and significantly contributed to the revision of the manuscript. All authors, external and internal, had full access to all of the data (including statistical reports and tables) in the study and can take responsibility for the integrity of the data and the accuracy of the data analysis. As the lead author, R.C.W. affirms that the manuscript is an honest, accurate, and transparent account of the study being reported, that no important aspects of the study have been omitted, and that any discrepancies from the study as planned have been explained.
1. Johnson JK, Batalden PB. Educating health professionals to improve care within the clinical microsystem. McLaughlin and Kaluzny’s Continuous Quality Improvement In Health Care. Burlington: Jones & Bartlett Learning; 2013.
2. Mohr JJ, Batalden P, Barach PB. Integrating patient safety into the clinical microsystem. Qual Saf Health Care. 2004;13:ii34-ii38. PubMed
3. Sanchez JA, Barach PR. High reliability organizations and surgical microsystems: re-engineering surgical care. Surg Clin North Am. 2012;92:1-14. PubMed
4. Curley C, McEachern JE, Speroff T. A firm trial of interdisciplinary rounds on the inpatient medical wards: an intervention designed using continuous quality improvement. Med Care. 1998;36:AS4-AS12. PubMed
5. O’Mahony S, Mazur E, Charney P, Wang Y, Fine J. Use of multidisciplinary rounds to simultaneously improve quality outcomes, enhance resident education, and shorten length of stay. J Gen Intern Med. 2007;22:1073-1079. PubMed
6. Pannick S, Beveridge I, Wachter RM, Sevdalis N. Improving the quality and safety of care on the medical ward: a review and synthesis of the evidence base. Eur J Intern Med. 2014;25:874-887. PubMed
7. Halm MA, Gagner S, Goering M, Sabo J, Smith M, Zaccagnini M. Interdisciplinary rounds: impact on patients, families, and staff. Clin Nurse Spec. 2003;17:133-142. PubMed
8. Stein J, Murphy D, Payne C, et al. A remedy for fragmented hospital care. Harvard Business Review. 2013.
9. O’Leary KJ, Buck R, Fligiel HM, et al. Structured interdisciplinary rounds in a medical teaching unit: improving patient safety. Arch Intern Med. 2010;171:678-684. PubMed
10. O’Leary KJ, Haviley C, Slade ME, Shah HM, Lee J, Williams MV. Improving teamwork: impact of structured interdisciplinary rounds on a hospitalist unit. J Hosp Med. 2011;6:88-93. PubMed
11. O’Leary KJ, Ritter CD, Wheeler H, Szekendi MK, Brinton TS, Williams MV. Teamwork on inpatient medical units: assessing attitudes and barriers. Qual Saf Health Care. 2011;19:117-121. PubMed
12. O’Leary KJ, Creden AJ, Slade ME, et al. Implementation of unit-based interventions to improve teamwork and patient safety on a medical service. Am J Med Qual. 2014;30:409-416. PubMed
13. Stein J, Payne C, Methvin A, et al. Reorganizing a hospital ward as an accountable care unit. J Hosp Med. 2015;10:36-40. PubMed
14. Creswell JW. Research Design: Qualitative, Quantitative, and Mixed Methods Approaches. Thousand Oaks: SAGE Publications; 2013.
15. Palinkas LA, Horwitz SM, Green CA, Wisdom JP, Duan N, Hoagwood K. Purposeful sampling for qualitative data collection and analysis in mixed method implementation research. Adm Pol Ment Health. 2015;42:533-544. PubMed
16. Australian Consortium for Classification Development (ACCD). Review of the AR-DRG classification Case Complexity Process: Final Report; 2014.
http://ihpa.gov.au/internet/ihpa/publishing.nsf/Content/admitted-acute. Accessed September 21, 2015.
17. Lofland J, Lofland LH. Analyzing Social Settings. Belmont: Wadsworth Publishing Company; 2006.
18. Miles MB, Huberman AM, Saldaña J. Qualitative Data Analysis: A Methods Sourcebook. Los Angeles: SAGE Publications; 2014.
19. Corbin J, Strauss A. Basics of Qualitative Research: Techniques and Procedures for Developing Grounded Theory. Thousand Oaks: SAGE Publications; 2008.
20. Corbin JM, Strauss A. Grounded theory research: procedures, canons, and evaluative criteria. Qual Sociol. 1990;13:3-21.
21. O’Leary KJ, Johnson JK, Auerbach AD. Do interdisciplinary rounds improve patient outcomes? only if they improve teamwork. J Hosp Med. 2016;11:524-525. PubMed
22. Clay-Williams R. Restructuring and the resilient organisation: implications for health care. In: Hollnagel E, Braithwaite J, Wears R, editors. Resilient health care. Surrey: Ashgate Publishing Limited; 2013.
23. Williams I, Dickinson H, Robinson S, Allen C. Clinical microsystems and the NHS: a sustainable method for improvement? J Health Organ and Manag. 2009;23:119-132. PubMed
24. Nelson EC, Godfrey MM, Batalden PB, et al. Clinical microsystems, part 1. The building blocks of health systems. Jt Comm J Qual Patient Saf. 2008;34:367-378. PubMed
25. Chisholm-Burns MA, Lee JK, Spivey CA, et al. US pharmacists’ effect as team members on patient care: systematic review and meta-analyses. Med Care. 2010;48:923-933. PubMed
26. Zwarenstein M, Goldman J, Reeves S. Interprofessional collaboration: effects of practice-based interventions on professional practice and healthcare outcomes. Cochrane Database Syst Rev. 2009;3:CD000072. PubMed
27. O’Leary KJ, Killarney A, Hansen LO, et al. Effect of patient-centred bedside rounds on hospitalised patients’ decision control, activation and satisfaction with care. BMJ Qual Saf. 2015;25:921-928. PubMed
Evidence has emerged over the last decade of the importance of the front line patient care team in improving quality and safety of patient care.1-3 Improving collaboration and workflow is thought to increase reliability of care delivery.1 One promising method to improve collaboration is the interdisciplinary ward round (IDR), whereby medical, nursing, and allied health staff attend ward rounds together. IDRs have been shown to reduce the average cost and length of hospital stay,4,5 although a recent systematic review found inconsistent improvements across studies.6 Using the term “interdisciplinary,” however, does not necessarily imply the inclusion of all disciplines necessary for patient care. The challenge of conducting interdisciplinary rounds is considerable in today’s busy clinical environment: health professionals who are spread across multiple locations within the hospital, and who have competing hospital responsibilities and priorities, must come together at the same time and for a set period each day. A survey with respondents from Australia, the United States, and Canada found that only 65% of rounds labelled “interdisciplinary” included a physician.7
While IDRs are not new, structured IDRs involve the purposeful inclusion of all disciplinary groups relevant to a patient’s care, alongside a checklist tool to aid comprehensive but concise daily assessment of progress and treatment planning. Novel, structured IDR interventions have been tested recently in various settings, resulting in improved teamwork, hospital performance, and patient outcomes in the US, including the Structured Interdisciplinary Bedside Round (SIBR) model.8-12
The aim of this study was to assess the impact of the new structure and the associated practice changes on interprofessional working and a set of key patient and hospital outcome measures. As part of the intervention, the hospital established an Acute Medical Unit (AMU) based on the Accountable Care Unit model.13
METHODS
Description of the Intervention
The AMU brought together 2 existing medical wards, a general medical ward and a 48-hour turnaround Medical Assessment Unit (MAU), into 1 geographical location with 26 beds. Prior to the merger, the MAU and general medical ward had separate and distinct cultures and workflows. The MAU was staffed with experienced nurses; nurses worked within a patient allocation model, the workload was shared, and relationships were collegial. In contrast, the medical ward was more typical of the remainder of the hospital: nurses had a heavy workload, managed a large group of longer-term complex patients, and they used a team-based nursing model of care in which senior nurses supervised junior staff. It was decided that because of the seniority of the MAU staff, they should be in charge of the combined AMU, and the patient allocation model of care would be used to facilitate SIBR.
Consultants, junior doctors, nurses, and allied health professionals (including a pharmacist, physiotherapist, occupational therapist, and social worker) were geographically aligned to the new ward, allowing them to participate as a team in daily structured ward rounds. Rounds are scheduled at the same time each day to enable family participation. The ward round is coordinated by a registrar or intern, with input from patient, family, nursing staff, pharmacy, allied health, and other doctors (intern, registrar, and consultant) based on the unit. The patient load is distributed between 2 rounds: 1 scheduled for 10
Data Collection Strategy
The study was set in an AMU in a large tertiary care hospital in regional Australia and used a convergent parallel multimethod approach14 to evaluate the implementation and effect of SIBR in the AMU. The study population consisted of 32 clinicians employed at the study hospital: (1) the leadership team involved in the development and implementation of the intervention and (2) members of clinical staff who were part of the AMU team.
Qualitative Data
Qualitative measures consisted of semistructured interviews. We utilized multiple strategies to recruit interviewees, including a snowball technique, criterion sampling,15 and emergent sampling, so that we could seek the views of both the leadership team responsible for the implementation and “frontline” clinical staff whose daily work was directly affected by it. Everyone who was initially recruited agreed to be interviewed, and additional frontline staff asked to be interviewed once they realized that we were asking about how staff experienced the changes in practice.
The research team developed a semistructured interview guide based on an understanding of the merger of the 2 units as well as an understanding of changes in practice of the rounds (provided in Appendix 1). The questions were pilot tested on a separate unit and revised. Questions were structured into 5 topic areas: planning and implementation of AMU/SIBR model, changes in work practices because of the new model, team functioning, job satisfaction, and perceived impact of the new model on patients and families. All interviews were audio-recorded and transcribed verbatim for analysis.
Quantitative Data
Quantitative data were collected on patient outcome measures: length of stay (LOS), discharge date and time, mode of separation (including death), primary diagnostic category, total hospital stay cost and “clinical response calls,” and patient demographic data (age, gender, and Patient Clinical Complexity Level [PCCL]). The PCCL is a standard measure used in Australian public inpatient facilities and is calculated for each episode of care.16 It measures the cumulative effect of a patient’s complications and/or comorbidities and takes an integer value between 0 (no clinical complexity effect) and 4 (catastrophic clinical complexity effect).
Data regarding LOS, diagnosis (Australian Refined Diagnosis Related Groups [AR-DRG], version 7), discharge date, and mode of separation (including death) were obtained from the New South Wales Ministry of Health’s Health Information Exchange for patients discharged during the year prior to the intervention through 1 year after the implementation of the intervention. The total hospital stay cost for these individuals was obtained from the local Health Service Organizational Performance Management unit. Inclusion criteria were inpatients aged over 15 years experiencing acute episodes of care; patients with a primary diagnostic category of mental diseases and disorders were excluded. LOS was calculated based on ward stay. AMU data were compared with the remaining hospital ward data (the control group). Data on “clinical response calls” per month per ward were also obtained for the 12 months prior to intervention and the 12 months of the intervention.
Analysis
Qualitative Analysis
Qualitative data analysis consisted of a hybrid form of textual analysis, combining inductive and deductive logics.17,18 Initially, 3 researchers (J.P., J.J., and R.C.W.) independently coded the interview data inductively to identify themes. Discrepancies were resolved through discussion until consensus was reached. Then, to further facilitate analysis, the researchers deductively imposed a matrix categorization, consisting of 4 a priori categories: context/conditions, practices/processes, professional interactions, and consequences.19,20 Additional a priori categories were used to sort the themes further in terms of experiences prior to, during, and following implementation of the intervention. To compare changes in those different time periods, we wanted to know what themes were related to implementation and whether those themes continued to be applicable to sustainability of the changes.
Quantitative analysis. Distribution of continuous data was examined by using the one-sample Kolmogorov-Smirnov test. We compared pre-SIBR (baseline) measures using the Student t test for normally distributed data, the Mann-Whitney U z test for nonparametric data (denoted as M-W U z), and χ2 tests for categorical data. Changes in monthly “clinical response calls” between the AMU and the control wards over time were explored by using analysis of variance (ANOVA). Changes in LOS and cost of stay from the year prior to the intervention to the first year of the intervention were analyzed by using generalized linear models, which are a form of linear regression. Factors, or independent variables, included in the models were time period (before or during intervention), ward (AMU or control), an interaction term (time by ward), patient age, gender, primary diagnosis (major diagnostic categories of the AR-DRG version 7.0), and acuity (PCCL). The estimated marginal means for cost of stay for the 12-month period prior to the intervention and for the first 12 months of the intervention were produced. All statistical analyses were performed by using IBM SPSS version 21 (IBM Corp., Armonk, New York) and with alpha set at P < .05.
RESULTS
Qualitative Evaluation of the Intervention
Participants.
Three researchers (RCW, JP, and JJ) conducted in-person, semistructured interviews with 32 clinicians (9 male, 23 female) during a 3-day period. The duration of the interviews ranged from 19 minutes to 68 minutes. Participants consisted of 8 doctors, 18 nurses, 5 allied health professionals, and an administrator. Ten of the participants were involved in the leadership group that drove the planning and implementation of SIBR and the AMU.
Themes
Context and Conditions of Work
Practices and Processes
Participants perceived postintervention work processes to be more efficient. A primary example was a near-universal approval of the time saved from not “chasing” other professionals now that they were predictably available on the ward. More timely decision-making was thought to result from this predicted availability and associated improvements in communication.
The SIBR enforced a workflow on all staff, who felt there was less flexibility to work autonomously (doctors) or according to patients’ needs (nurses). More junior staff expressed anxiety about delayed completion of discharge-related administrative tasks because of the midday completion of the round. Allied health professionals who had commitments in other areas of the hospital often faced a dilemma about how to prioritize SIBR attendance and activities on other wards. This was managed differently depending on the specific allied health profession and the individuals within that profession.
Professional Interactions
In terms of interprofessional dynamics on the AMU, the implementation of SIBR resulted in a shift in power between the doctors and the nurses. In the old ward, doctors largely controlled the timing of medical rounding processes. In the new AMU, doctors had to relinquish some control over the timing of personal workflow to comply with the requirements of SIBR. Furthermore, there was evidence that this had some impact on traditional hierarchical models of communication and created a more level playing field, as nonmedical professionals felt more empowered to voice their thoughts during and outside of rounds.
The rounds provided much greater visibility of the “big picture” and each profession’s role within it; this allowed each clinician to adjust their work to fit in and take account of others. The process was not instantaneous, and trust developed over a period of weeks. Better communication meant fewer misunderstandings, and workload dropped.
The participation of allied health professionals in the round enhanced clinician interprofessional skills and knowledge. The more inclusive approach facilitated greater trust between clinical disciplines and a development of increased confidence among nursing, allied health, and administrative professionals.
In contrast to the positive impacts of the new model of care on communication and relationships within the AMU, interdepartmental relationships were seen to have suffered. The processes and practices of the new AMU are different to those in the other hospital departments, resulting in some isolation of the unit and difficulties interacting with other areas of the hospital. For example, the trade-offs that allied health professionals made to participate in SIBR often came at the expense of other units or departments.
Consequences
All interviewees lauded the benefits of the SIBR intervention for patients. Patients were perceived to be better informed and more respected, and they benefited from greater perceived timeliness of treatment and discharge, easier access to doctors, better continuity of treatment and outcomes, improved nurse knowledge of their circumstances, and fewer gaps in their care. Clinicians spoke directly to the patient during SIBR, rather than consulting with professional colleagues over the patient’s head. Some staff felt that doctors were now thinking of patients as “people” rather than “a set of symptoms.” Nurses discovered that informed patients are easier to manage.
Staff members were prepared to compromise on their own needs in the interests of the patient. The emphasis on the patient during rounds resulted in improved advocacy behaviors of clinicians. The nurses became more empowered and able to show greater initiative. Families appeared to find it much easier to access the doctors and obtain information about the patient, resulting in less distress and a greater sense of control and trust in the process.
Quantitative Evaluation of the Intervention
Hospital Outcomes
Patient demographics did not change over time within either the AMU or control wards. However, there were significant increases in Patient Clinical Complexity Level (PCCL) ratings for both the AMU (44.7% to 40.3%; P<0.05) and the control wards (65.2% to 61.6%; P < .001). There was not a statistically significant shift over time in median LoS on the ward prior to (2.16 days, IQR 3.07) and during SIBR in the AMU (2.15 days; IQR 3.28), while LoS increased in the control (pre-SIBR: 1.67, 2.34; during SIBR 1.73, 2.40; M-W U z = -2.46, P = .014). Mortality rates were stable across time for both the AMU (pre-SIBR 2.6% [95% confidence interval {CI}, 1.9-3.5]; during SIBR 2.8% [95% CI, 2.1-3.7]) and the control (pre-SIBR 1.3% [95% CI, 1.0-1.5]; during SIBR 1.2% [95% CI, 1.0-1.4]).
The total number of “clinical response calls” or “flags” per month dropped significantly from pre-SIBR to during SIBR for the AMU from a mean of 63.1 (standard deviation 15.1) to 31.5 (10.8), but remained relatively stable in the control (pre-SIBR 72.5 [17.6]; during SIBR 74.0 [28.3]), and this difference was statistically significant (F (1,44) = 9.03; P = .004). There was no change in monthly “red flags” or “rapid response calls” over time (AMU: 10.5 [3.6] to 9.1 [4.7]; control: 40.3 [11.7] to 41.8 [10.8]). The change in total “clinical response calls” over time was attributable to the “yellow flags” or the decline in “calls for clinical review” in the AMU (from 52.6 [13.5] to 22.4 [9.2]). The average monthly “yellow flags” remained stable in the control (pre-SIBR 32.2 [11.6]; during SIBR 32.3 [22.4]). The AMU and the control wards differed significantly in how the number of monthly “calls for clinical review” changed from pre-SIBR to during SIBR (F (1,44) = 12.18; P = .001).
The 2 main outcome measures, LOS and costs, were analyzed to determine whether changes over time differed between the AMU and the control wards after accounting for age, gender, and PCCL. There was no statistically significant difference between the AMU and control wards in terms of change in LOS over time (Wald χ2 = 1.05; degrees of freedom [df] = 1; P = .31). There was a statistically significant interaction for cost of stay, indicating that ward types differed in how they changed over time (with a drop in cost over time observed in the AMU and an increase observed in the control) (Wald χ2 = 6.34; df = 1; P = .012.
DISCUSSION
We report on the implementation of an AMU model of care, including the reorganization of a nursing unit, implementation of IDR, and geographical localization. Our study design allowed a more comprehensive assessment of the implementation of system redesign to include provider perceptions and clinical outcomes.
The 2 very different cultures of the old wards that were combined into the AMU, as well as the fact that the teams had not previously worked together, made the merger of the 2 wards difficult. Historically, the 2 teams had worked in very different ways, and this created barriers to implementation. The SIBR also demanded new ways of working closely with other disciplines, which disrupted older clinical cultures and relationships. While organizational culture is often discussed, and even measured, the full impact of cultural factors when making workplace changes is frequently underestimated.21 The development of a new culture takes time, and it can lag organizational structural changes by months or even years.22 As our interviewees expressed, often emotionally, there was a sense of loss during the merger of the 2 units. While this is a potential consequence of any large organizational change, it could be addressed during the planning stages, prior to implementation, by acknowledging and perhaps honoring what is being left behind. It is safe to assume that future units implementing the rounding intervention will not fully realize commensurate levels of culture change until well after the structural and process changes are finalized, and only then if explicit effort is made to engender cultural change.
Overall, however, the interviewees perceived that the SIBR intervention led to improved teamwork and team functioning. These improvements were thought to benefit task performance and patient safety. Our study is consistent with other research in the literature that reported that greater staff empowerment and commitment is associated with interdisciplinary patient care interventions in front line caregiving teams.23,24 The perception of a more equal nurse-physician relationship resulted in improved job satisfaction, better interprofessional relationships, and perceived improvements in patient care. A flatter power gradient across professions and increased interdisciplinary teamwork has been shown to be associated with improved patient outcomes.25,26
Changes to clinician workflow can significantly impact the introduction of new models of care. A mandated time each day for structured rounds meant less flexibility in workflow for clinicians and made greater demands on their time management and communication skills. Furthermore, the need for human resource negotiations with nurse representatives was an unexpected component of successfully introducing the changes to workflow. Once the benefits of saved time and better communication became evident, changes to workflow were generally accepted. These challenges can be managed if stakeholders are engaged and supportive of the changes.13
Finally, our findings emphasize the importance of combining qualitative and quantitative data when evaluating an intervention. In this case, the qualitative outcomes that include “intangible” positive effects, such as cultural change and improved staff understanding of one another’s roles, might encourage us to continue with the SIBR intervention, which would allow more time to see if the trend of reduced LOS identified in the statistical analysis would translate to a significant effect over time.
We are unable to identify which aspects of the intervention led to the greatest impact on our outcomes. A recent study found that interdisciplinary rounds had no impact on patients’ perceptions of shared decision-making or care satisfaction.27 Although our findings indicated many potential benefits for patients, we were not able to interview patients or their carers to confirm these findings. In addition, we do not have any patient-centered outcomes, which would be important to consider in future work. Although our data on clinical response calls might be seen as a proxy for adverse events, we do not have data on adverse events or errors, and these are important to consider in future work. Finally, our findings are based on data from a single institution.
CONCLUSIONS
While there were some criticisms, participants expressed overwhelmingly positive reactions to the SIBR. The biggest reported benefit was perceived improved communication and understanding between and within the clinical professions, and between clinicians and patients. Improved communication was perceived to have fostered improved teamwork and team functioning, with most respondents feeling that they were a valued part of the new team. Improved teamwork was thought to contribute to improved task performance and led interviewees to perceive a higher level of patient safety. This research highlights the need for multimethod evaluations that address contextual factors as well as clinical outcomes.
Acknowledgments
The authors would like to acknowledge the clinicians and staff members who participated in this study. We would also like to acknowledge the support from the NSW Clinical Excellence Commission, in particular, Dr. Peter Kennedy, Mr. Wilson Yeung, Ms. Tracy Clarke, and Mr. Allan Zhang, and also from Ms. Karen Storey and Mr. Steve Shea of the Organisational Performance Management team at the Orange Health Service.
Disclosures
None of the authors had conflicts of interest in relation to the conduct or reporting of this study, with the exception that the lead author’s institution, the Australian Institute of Health Innovation, received a small grant from the New South Wales Clinical Excellence Commission to conduct the work. Ethics approval for the research was granted by the Greater Western Area Health Service Human Research Ethics Committee (HREC/13/GWAHS/22). All interviewees consented to participate in the study. For patient data, consent was not obtained, but presented data are anonymized. The full dataset is available from the corresponding author with restrictions. This research was funded by the NSW Clinical Excellence Commission, who also encouraged submission of the article for publication. The funding source did not have any role in conduct or reporting of the study. R.C.W., J.P., and J.J. conceptualized and conducted the qualitative component of the study, including method, data collection, data analysis, and writing of the manuscript. G.L., C.H., and H.D. conceptualized the quantitative component of the study, including method, data collection, data analysis, and writing of the manuscript. G.S. contributed to conceptualization of the study, and significantly contributed to the revision of the manuscript. All authors, external and internal, had full access to all of the data (including statistical reports and tables) in the study and can take responsibility for the integrity of the data and the accuracy of the data analysis. As the lead author, R.C.W. affirms that the manuscript is an honest, accurate, and transparent account of the study being reported, that no important aspects of the study have been omitted, and that any discrepancies from the study as planned have been explained.
1. Johnson JK, Batalden PB. Educating health professionals to improve care within the clinical microsystem. McLaughlin and Kaluzny’s Continuous Quality Improvement In Health Care. Burlington: Jones & Bartlett Learning; 2013.
2. Mohr JJ, Batalden P, Barach PB. Integrating patient safety into the clinical microsystem. Qual Saf Health Care. 2004;13:ii34-ii38. PubMed
3. Sanchez JA, Barach PR. High reliability organizations and surgical microsystems: re-engineering surgical care. Surg Clin North Am. 2012;92:1-14. PubMed
4. Curley C, McEachern JE, Speroff T. A firm trial of interdisciplinary rounds on the inpatient medical wards: an intervention designed using continuous quality improvement. Med Care. 1998;36:AS4-AS12. PubMed
5. O’Mahony S, Mazur E, Charney P, Wang Y, Fine J. Use of multidisciplinary rounds to simultaneously improve quality outcomes, enhance resident education, and shorten length of stay. J Gen Intern Med. 2007;22:1073-1079. PubMed
6. Pannick S, Beveridge I, Wachter RM, Sevdalis N. Improving the quality and safety of care on the medical ward: a review and synthesis of the evidence base. Eur J Intern Med. 2014;25:874-887. PubMed
7. Halm MA, Gagner S, Goering M, Sabo J, Smith M, Zaccagnini M. Interdisciplinary rounds: impact on patients, families, and staff. Clin Nurse Spec. 2003;17:133-142. PubMed
8. Stein J, Murphy D, Payne C, et al. A remedy for fragmented hospital care. Harvard Business Review. 2013.
9. O’Leary KJ, Buck R, Fligiel HM, et al. Structured interdisciplinary rounds in a medical teaching unit: improving patient safety. Arch Intern Med. 2010;171:678-684. PubMed
10. O’Leary KJ, Haviley C, Slade ME, Shah HM, Lee J, Williams MV. Improving teamwork: impact of structured interdisciplinary rounds on a hospitalist unit. J Hosp Med. 2011;6:88-93. PubMed
11. O’Leary KJ, Ritter CD, Wheeler H, Szekendi MK, Brinton TS, Williams MV. Teamwork on inpatient medical units: assessing attitudes and barriers. Qual Saf Health Care. 2011;19:117-121. PubMed
12. O’Leary KJ, Creden AJ, Slade ME, et al. Implementation of unit-based interventions to improve teamwork and patient safety on a medical service. Am J Med Qual. 2014;30:409-416. PubMed
13. Stein J, Payne C, Methvin A, et al. Reorganizing a hospital ward as an accountable care unit. J Hosp Med. 2015;10:36-40. PubMed
14. Creswell JW. Research Design: Qualitative, Quantitative, and Mixed Methods Approaches. Thousand Oaks: SAGE Publications; 2013.
15. Palinkas LA, Horwitz SM, Green CA, Wisdom JP, Duan N, Hoagwood K. Purposeful sampling for qualitative data collection and analysis in mixed method implementation research. Adm Pol Ment Health. 2015;42:533-544. PubMed
16. Australian Consortium for Classification Development (ACCD). Review of the AR-DRG classification Case Complexity Process: Final Report; 2014.
http://ihpa.gov.au/internet/ihpa/publishing.nsf/Content/admitted-acute. Accessed September 21, 2015.
17. Lofland J, Lofland LH. Analyzing Social Settings. Belmont: Wadsworth Publishing Company; 2006.
18. Miles MB, Huberman AM, Saldaña J. Qualitative Data Analysis: A Methods Sourcebook. Los Angeles: SAGE Publications; 2014.
19. Corbin J, Strauss A. Basics of Qualitative Research: Techniques and Procedures for Developing Grounded Theory. Thousand Oaks: SAGE Publications; 2008.
20. Corbin JM, Strauss A. Grounded theory research: procedures, canons, and evaluative criteria. Qual Sociol. 1990;13:3-21.
21. O’Leary KJ, Johnson JK, Auerbach AD. Do interdisciplinary rounds improve patient outcomes? only if they improve teamwork. J Hosp Med. 2016;11:524-525. PubMed
22. Clay-Williams R. Restructuring and the resilient organisation: implications for health care. In: Hollnagel E, Braithwaite J, Wears R, editors. Resilient health care. Surrey: Ashgate Publishing Limited; 2013.
23. Williams I, Dickinson H, Robinson S, Allen C. Clinical microsystems and the NHS: a sustainable method for improvement? J Health Organ and Manag. 2009;23:119-132. PubMed
24. Nelson EC, Godfrey MM, Batalden PB, et al. Clinical microsystems, part 1. The building blocks of health systems. Jt Comm J Qual Patient Saf. 2008;34:367-378. PubMed
25. Chisholm-Burns MA, Lee JK, Spivey CA, et al. US pharmacists’ effect as team members on patient care: systematic review and meta-analyses. Med Care. 2010;48:923-933. PubMed
26. Zwarenstein M, Goldman J, Reeves S. Interprofessional collaboration: effects of practice-based interventions on professional practice and healthcare outcomes. Cochrane Database Syst Rev. 2009;3:CD000072. PubMed
27. O’Leary KJ, Killarney A, Hansen LO, et al. Effect of patient-centred bedside rounds on hospitalised patients’ decision control, activation and satisfaction with care. BMJ Qual Saf. 2015;25:921-928. PubMed
© 2018 Society of Hospital Medicine
Things We Do for No Reason – The “48 Hour Rule-out” for Well-Appearing Febrile Infants
The “Things We Do for No Reason” (TWDFNR) series reviews practices that have become common parts of hospital care but may provide little value to our patients. Practices reviewed in the TWDFNR series do not represent “black and white” conclusions or clinical practice standards but are meant as a starting place for research and active discussions among hospitalists and patients. We invite you to be part of that discussion. https://www.choosingwisely.org/

CASE PRESENTATION
A 3-week-old, full-term term male febrile infant was evaluated in the emergency department (ED). On the day of admission, he was noted to feel warm to the touch and was found to have a rectal temperature of 101.3°F (38.3°C) at home.
In the ED, the patient was well appearing and had normal physical exam findings. His workup in the ED included a normal chest radiograph, complete blood count (CBC) with differential count, cerebrospinal fluid (CSF) analysis (cell count, protein, and glucose), and urinalysis. Blood, CSF, and catheterized urine cultures were collected, and he was admitted to the hospital on parenteral antibiotics. His provider informed the parents that the infant would be observed in the hospital for 48 hours while monitoring the bacterial cultures. Is it necessary for the hospitalization of this child to last a full 48 hours?
INTRODUCTION
Evaluation and management of fever (T ≥ 38°C) is a common cause of emergency department visits and accounts for up to 20% of pediatric emergency visits.2
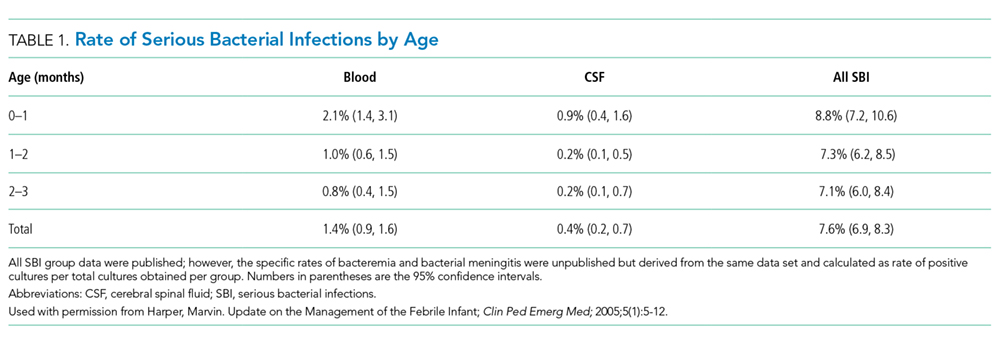
Why You Might Think Hospitalization for at Least 48 Hours is Necessary
The evaluation and management of fever in infants aged less than 90 days is challenging due to concern for occult serious bacterial infections. In particular, providers may be concerned that the physical exam lacks sensitivity.9
There is also a perceived risk of poor outcomes in young infants if a serious bacterial infection is missed. For these reasons, the evaluation and management of febrile infants has been characterized by practice variability in both outpatient10 and ED3 settings.
Commonly used febrile infant management protocols vary in approach and do not provide clear guidelines on the recommended duration of hospitalization and empiric antimicrobial treatment.11-14 Length of hospitalization was widely studied in infants between 1979 and 1999, and results showed that the majority of clinically important bacterial pathogens can be detected within 48 hours.15-17 Many textbooks and online references, based on this literature, continue to support 48 to 72 hours of observation and empiric antimicrobial treatment for febrile infants.18,19 A 2012 AAP Clinical Report advocated for limiting the antimicrobial treatment in low-risk infants suspected of early-onset sepsis to 48 hours.20
Why Shorten the Period of In-Hospital Observation to a Maximum of 36 Hours of Culture Incubation
Discharge of low-risk infants with negative enhanced urinalysis and negative bacterial cultures at 36 hours or earlier can reduce costs21 and potentially preventable harm (eg, intravenous catheter complications, nosocomial infections) without negatively impacting patient outcomes.22 Early discharge is also patient-centered, given the stress and indirect costs associated with hospitalization, including potential separation of a breastfeeding infant and mother, lost wages from time off work, or childcare for well siblings.23
Initial studies that evaluated the time-to-positivity (TTP) of bacterial cultures in febrile infants predate the use of continuous monitoring systems for blood cultures. Traditional bacterial culturing techniques require direct observation of broth turbidity and subsequent subculturing onto chocolate and sheep blood agar, typically occurring only once daily.24 Current commercially available continuous monitoring bacterial culture systems decrease TTP by immediately alerting laboratory technicians to bacterial growth through the detection of 14CO2 released by organisms utilizing radiolabeled glucose in growth media.24 In addition, many studies supporting the evaluation of febrile infants in the hospital for a 48-hour period include those in ICU settings,25 with medically complex histories,24 and aged < 28 days admitted in the NICU,15 where pathogens with longer incubation times are frequently seen.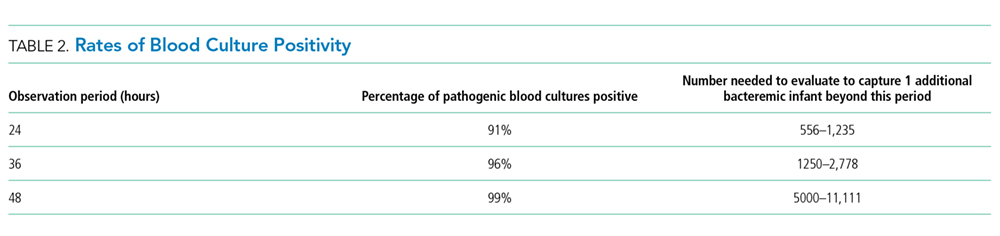
In a recent single-center retrospective study, infant blood cultures with TTP longer than 36 hours are 7.8 times more likely to be identified as contaminant bacteria compared with cultures that tested positive in <36 hours.26 Even if bacterial cultures were unexpectedly positive after 36 hours, which occurs in less than 1.1% of all infants and 0.3% of low-risk infants,1 these patients do not have adverse outcomes. Infants who were deemed low risk based on established criteria and who had bacterial cultures positive for pathogenic bacteria were treated at that time and recovered uneventfully.7, 31
CSF and urine cultures are often reviewed only once or twice daily in most institutions, and this practice artificially prolongs the TTP for pathogenic bacteria. Small sample-sized studies have demonstrated the low detection rate of pathogens in CSF and urine cultures beyond 36 hours. Evans et al. found that in infants aged 0-28 days, 0.03% of urine cultures and no CSF cultures tested positive after 36 hours.26 In a retrospective study of infants aged 28-90 days in the ED setting, Kaplan et al. found that 0.9% of urine cultures and no CSF cultures were positive at >24 hours.1 For well-appearing infants who have reassuring initial CSF studies, the risk of meningitis is extremely low.7 Management criteria for febrile infants provide guidance for determining those infants with abnormal CSF results who may benefit from longer periods of observation.
Urinary tract infections are common serious bacterial infections in this age group. Enhanced urinalysis, in which cell count and Gram stain analysis are performed on uncentrifuged urine, shows 96% sensitivity of predicting urinary tract infection and can provide additional reassurance for well-appearing infants who are discharged prior to 48 hours.27
When a Longer Observation Period May Be Warranted
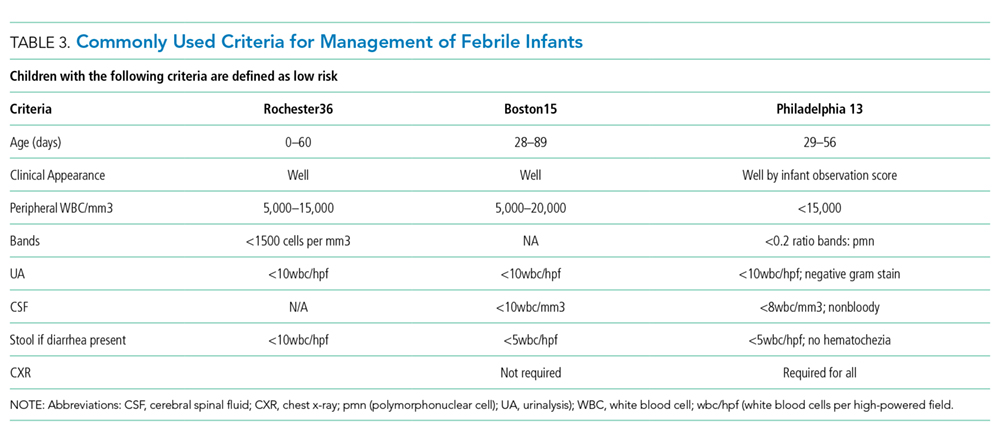
What You Should Do Instead: Limit Hospitalization to a Maximum of 36 Hours
For well-appearing febrile infants between 0–90 days of age hospitalized for observation and awaiting bacterial culture results, providers should consider discharge at 36 hours or less, rather than 48 hours, if blood, urine, and CSF cultures do not show bacterial growth. In a large health system, researchers implemented an evidence-based care process model for febrile infants to provide specific guidelines for laboratory testing, criteria for admission, and recommendation for discontinuation of empiric antibiotics and discharge after 36 hours in infants with negative bacterial cultures. These changes led to a 27% reduction in the length of hospital stay and 23% reduction in inpatient costs without any cases of missed bacteremia.21 The reduction in the in-hospital observation duration to 24 hours of culture incubation for well-appearing febrile infants has been advocated 32 and is a common practice for infants with appropriate follow up and parental assurance. This recommendation is supported by the following:
- Recent data showing the overwhelming majority of pathogens will be identified by blood culture <24 hours in infants aged 0-90 days32 with blood culture TTP in infants aged 0-30 days being either no different26 or potentially shorter32
- Studies showing that infants meeting low-risk clinical and laboratory profiles further reduce the likelihood of identifying serious bacterial infection after 24 hours to 0.3%.1
RECOMMENDATIONS
- Determine if febrile infants aged 0-90 days are at low risk for serious bacterial infection and obtain appropriate bacterial cultures.
- If hospitalized for observation, discharge low-risk febrile infants aged 0–90 days after 36 hours or less if bacterial cultures remain negative.
- If hospitalized for observation, consider reducing the length of inpatient observation for low-risk febrile infants aged 0–90 days with reliable follow-up to 24 hours or less when the culture results are negative.
CONCLUSION
Monitoring patients in the hospital for greater than 36 hours of bacterial culture incubation is unnecessary for patients similar to the 3 week-old full-term infant in the case presentation, who are at low risk for serious bacterial infection based on available scoring systems and have negative cultures. If patients are not deemed low risk, have an incomplete laboratory evaluation, or have had prior antibiotic treatment, longer observation in the hospital may be warranted. Close reassessment of the rare patients whose blood cultures return positive after 36 hours is necessary, but their outcomes are excellent, especially in well-appearing infants.7,33
What do you do?
Do you think this is a low-value practice? Is this truly a “Thing We Do for No Reason”? Let us know what you do in your practice and propose ideas for other “Things We Do for No Reason” topics. Please join in the conversation online at Twitter (#TWDFNR)/Facebook and don’t forget to “Like It” on Facebook or retweet it on Twitter. We invite you to propose ideas for other “Things We Do for No Reason” topics by emailing[email protected].
Disclosures
There are no conflicts of interest relevant to this work reported by any of the authors.
1. Kaplan RL, Harper MB, Baskin MN, Macone AB, Mandl KD. Time to detection of positive cultures in 28- to 90-day-old febrile infants. Pediatrics 2000;106(6):E74. PubMed
2. Fleisher GR, Ludwig S, Henretig FM. Textbook of Pediatric Emergency Medicine: Lippincott Williams & Wilkins; 2006.
3. Aronson PL, Thurm C, Williams DJ, et al. Association of clinical practice guidelines with emergency department management of febrile infants </=56 days of age. J Hosp Med. 2015;10(6):358-365. PubMed
4. Hui C, Neto G, Tsertsvadze A, et al. Diagnosis and management of febrile infants (0-3 months). Evid Rep Technol Assess. 2012;205:1-297. PubMed
5. Garcia S, Mintegi S, Gomez B, et al. Is 15 days an appropriate cut-off age for considering serious bacterial infection in the management of febrile infants? Pediatr Infect Dis J. 2012;31(5):455-458. PubMed
6. Schwartz S, Raveh D, Toker O, Segal G, Godovitch N, Schlesinger Y. A week-by-week analysis of the low-risk criteria for serious bacterial infection in febrile neonates. Arch Dis Child. 2009;94(4):287-292. PubMed
7. Huppler AR, Eickhoff JC, Wald ER. Performance of low-risk criteria in the evaluation of young infants with fever: review of the literature. Pediatrics 2010;125(2):228-233. PubMed
8. Baskin MN. The prevalence of serious bacterial infections by age in febrile infants during the first 3 months of life. Pediatr Ann. 1993;22(8):462-466. PubMed
9. Nigrovic LE, Mahajan PV, Blumberg SM, et al. The Yale Observation Scale Score and the risk of serious bacterial infections in febrile infants. Pediatrics 2017;140(1):e20170695. PubMed
10. Bergman DA, Mayer ML, Pantell RH, Finch SA, Wasserman RC. Does clinical presentation explain practice variability in the treatment of febrile infants? Pediatrics 2006;117(3):787-795. PubMed
11. Baker MD, Bell LM, Avner JR. Outpatient management without antibiotics of fever in selected infants. N Engl J Med. 1993;329(20):1437-1441. PubMed
12. Jaskiewicz JA, McCarthy CA, Richardson AC, et al. Febrile infants at low risk for serious bacterial infection--an appraisal of the Rochester criteria and implications for management. Febrile Infant Collaborative Study Group. Pediatrics 1994;94(3):390-396. PubMed
13. Baskin MN, O’Rourke EJ, Fleisher GR. Outpatient treatment of febrile infants 28 to 89 days of age with intramuscular administration of ceftriaxone. J Pediatr. 1992;120(1):22-27. PubMed
14. Bachur RG, Harper MB. Predictive model for serious bacterial infections among infants younger than 3 months of age. Pediatrics 2001;108(2):311-316. PubMed
15. Pichichero ME, Todd JK. Detection of neonatal bacteremia. J Pediatr. 1979;94(6):958-960. PubMed
16. Hurst MK, Yoder BA. Detection of bacteremia in young infants: is 48 hours adequate? Pediatr Infect Dis J. 1995;14(8):711-713. PubMed
17. Friedman J, Matlow A. Time to identification of positive bacterial cultures in infants under three months of age hospitalized to rule out sepsis. Paediatr Child Health 1999;4(5):331-334. PubMed
18. Kliegman R, Behrman RE, Nelson WE. Nelson textbook of pediatrics. Edition 20 / ed. Philadelphia, PA: Elsevier; 2016.
19. Fever in infants and children. Merck Sharp & Dohme Corp, 2016. (Accessed 27 Nov 2016, 2016, at https://www.merckmanuals.com/professional/pediatrics/symptoms-in-infants-and-children/fever-in-infants-and-children.)
20. Polin RA, Committee on F, Newborn. Management of neonates with suspected or proven early-onset bacterial sepsis. Pediatrics 2012;129(5):1006-1015. PubMed
21. Byington CL, Reynolds CC, Korgenski K, et al. Costs and infant outcomes after implementation of a care process model for febrile infants. Pediatrics 2012;130(1):e16-e24. PubMed
22. DeAngelis C, Joffe A, Wilson M, Willis E. Iatrogenic risks and financial costs of hospitalizing febrile infants. Am J Dis Child. 1983;137(12):1146-1149. PubMed
23. Nizam M, Norzila MZ. Stress among parents with acutely ill children. Med J Malaysia. 2001;56(4):428-434. PubMed
24. Rowley AH, Wald ER. The incubation period necessary for detection of bacteremia in immunocompetent children with fever. Implications for the clinician. Clin Pediatr (Phila). 1986;25(10):485-489. PubMed
25. La Scolea LJ, Jr., Dryja D, Sullivan TD, Mosovich L, Ellerstein N, Neter E. Diagnosis of bacteremia in children by quantitative direct plating and a radiometric procedure. J Clin Microbiol. 1981;13(3):478-482. PubMed
26. Evans RC, Fine BR. Time to detection of bacterial cultures in infants aged 0 to 90 days. Hosp Pediatr. 2013;3(2):97-102. PubMed
27. Herr SM, Wald ER, Pitetti RD, Choi SS. Enhanced urinalysis improves identification of febrile infants ages 60 days and younger at low risk for serious bacterial illness. Pediatrics 2001;108(4):866-871. PubMed
28. Nigrovic LE, Kuppermann N, Macias CG, et al. Clinical prediction rule for identifying children with cerebrospinal fluid pleocytosis at very low risk of bacterial meningitis. JAMA. 2007;297(1):52-60. PubMed
29. Doby EH, Stockmann C, Korgenski EK, Blaschke AJ, Byington CL. Cerebrospinal fluid pleocytosis in febrile infants 1-90 days with urinary tract infection. Pediatr Infect Dis J. 2013;32(9):1024-1026. PubMed
30. Bhansali P, Wiedermann BL, Pastor W, McMillan J, Shah N. Management of hospitalized febrile neonates without CSF analysis: A study of US pediatric hospitals. Hosp Pediatr. 2015;5(10):528-533. PubMed
31. Kanegaye JT, Soliemanzadeh P, Bradley JS. Lumbar puncture in pediatric bacterial meningitis: defining the time interval for recovery of cerebrospinal fluid pathogens after parenteral antibiotic pretreatment. Pediatrics 2001;108(5):1169-1174. PubMed
32. Biondi EA, Mischler M, Jerardi KE, et al. Blood culture time to positivity in febrile infants with bacteremia. JAMA Pediatr. 2014;168(9):844-849. PubMed
33. Moher D HC, Neto G, Tsertsvadze A. Diagnosis and Management of Febrile Infants (0–3 Months). Evidence Report/Technology Assessment No. 205. In: Center OE-bP, ed. Rockville, MD: Agency for Healthcare Research and Quality; 2012. PubMed
The “Things We Do for No Reason” (TWDFNR) series reviews practices that have become common parts of hospital care but may provide little value to our patients. Practices reviewed in the TWDFNR series do not represent “black and white” conclusions or clinical practice standards but are meant as a starting place for research and active discussions among hospitalists and patients. We invite you to be part of that discussion. https://www.choosingwisely.org/
CASE PRESENTATION
A 3-week-old, full-term term male febrile infant was evaluated in the emergency department (ED). On the day of admission, he was noted to feel warm to the touch and was found to have a rectal temperature of 101.3°F (38.3°C) at home.
In the ED, the patient was well appearing and had normal physical exam findings. His workup in the ED included a normal chest radiograph, complete blood count (CBC) with differential count, cerebrospinal fluid (CSF) analysis (cell count, protein, and glucose), and urinalysis. Blood, CSF, and catheterized urine cultures were collected, and he was admitted to the hospital on parenteral antibiotics. His provider informed the parents that the infant would be observed in the hospital for 48 hours while monitoring the bacterial cultures. Is it necessary for the hospitalization of this child to last a full 48 hours?
INTRODUCTION
Evaluation and management of fever (T ≥ 38°C) is a common cause of emergency department visits and accounts for up to 20% of pediatric emergency visits.2
Why You Might Think Hospitalization for at Least 48 Hours is Necessary
The evaluation and management of fever in infants aged less than 90 days is challenging due to concern for occult serious bacterial infections. In particular, providers may be concerned that the physical exam lacks sensitivity.9
There is also a perceived risk of poor outcomes in young infants if a serious bacterial infection is missed. For these reasons, the evaluation and management of febrile infants has been characterized by practice variability in both outpatient10 and ED3 settings.
Commonly used febrile infant management protocols vary in approach and do not provide clear guidelines on the recommended duration of hospitalization and empiric antimicrobial treatment.11-14 Length of hospitalization was widely studied in infants between 1979 and 1999, and results showed that the majority of clinically important bacterial pathogens can be detected within 48 hours.15-17 Many textbooks and online references, based on this literature, continue to support 48 to 72 hours of observation and empiric antimicrobial treatment for febrile infants.18,19 A 2012 AAP Clinical Report advocated for limiting the antimicrobial treatment in low-risk infants suspected of early-onset sepsis to 48 hours.20
Why Shorten the Period of In-Hospital Observation to a Maximum of 36 Hours of Culture Incubation
Discharge of low-risk infants with negative enhanced urinalysis and negative bacterial cultures at 36 hours or earlier can reduce costs21 and potentially preventable harm (eg, intravenous catheter complications, nosocomial infections) without negatively impacting patient outcomes.22 Early discharge is also patient-centered, given the stress and indirect costs associated with hospitalization, including potential separation of a breastfeeding infant and mother, lost wages from time off work, or childcare for well siblings.23
Initial studies that evaluated the time-to-positivity (TTP) of bacterial cultures in febrile infants predate the use of continuous monitoring systems for blood cultures. Traditional bacterial culturing techniques require direct observation of broth turbidity and subsequent subculturing onto chocolate and sheep blood agar, typically occurring only once daily.24 Current commercially available continuous monitoring bacterial culture systems decrease TTP by immediately alerting laboratory technicians to bacterial growth through the detection of 14CO2 released by organisms utilizing radiolabeled glucose in growth media.24 In addition, many studies supporting the evaluation of febrile infants in the hospital for a 48-hour period include those in ICU settings,25 with medically complex histories,24 and aged < 28 days admitted in the NICU,15 where pathogens with longer incubation times are frequently seen.
In a recent single-center retrospective study, infant blood cultures with TTP longer than 36 hours are 7.8 times more likely to be identified as contaminant bacteria compared with cultures that tested positive in <36 hours.26 Even if bacterial cultures were unexpectedly positive after 36 hours, which occurs in less than 1.1% of all infants and 0.3% of low-risk infants,1 these patients do not have adverse outcomes. Infants who were deemed low risk based on established criteria and who had bacterial cultures positive for pathogenic bacteria were treated at that time and recovered uneventfully.7, 31
CSF and urine cultures are often reviewed only once or twice daily in most institutions, and this practice artificially prolongs the TTP for pathogenic bacteria. Small sample-sized studies have demonstrated the low detection rate of pathogens in CSF and urine cultures beyond 36 hours. Evans et al. found that in infants aged 0-28 days, 0.03% of urine cultures and no CSF cultures tested positive after 36 hours.26 In a retrospective study of infants aged 28-90 days in the ED setting, Kaplan et al. found that 0.9% of urine cultures and no CSF cultures were positive at >24 hours.1 For well-appearing infants who have reassuring initial CSF studies, the risk of meningitis is extremely low.7 Management criteria for febrile infants provide guidance for determining those infants with abnormal CSF results who may benefit from longer periods of observation.
Urinary tract infections are common serious bacterial infections in this age group. Enhanced urinalysis, in which cell count and Gram stain analysis are performed on uncentrifuged urine, shows 96% sensitivity of predicting urinary tract infection and can provide additional reassurance for well-appearing infants who are discharged prior to 48 hours.27
When a Longer Observation Period May Be Warranted
What You Should Do Instead: Limit Hospitalization to a Maximum of 36 Hours
For well-appearing febrile infants between 0–90 days of age hospitalized for observation and awaiting bacterial culture results, providers should consider discharge at 36 hours or less, rather than 48 hours, if blood, urine, and CSF cultures do not show bacterial growth. In a large health system, researchers implemented an evidence-based care process model for febrile infants to provide specific guidelines for laboratory testing, criteria for admission, and recommendation for discontinuation of empiric antibiotics and discharge after 36 hours in infants with negative bacterial cultures. These changes led to a 27% reduction in the length of hospital stay and 23% reduction in inpatient costs without any cases of missed bacteremia.21 The reduction in the in-hospital observation duration to 24 hours of culture incubation for well-appearing febrile infants has been advocated 32 and is a common practice for infants with appropriate follow up and parental assurance. This recommendation is supported by the following:
- Recent data showing the overwhelming majority of pathogens will be identified by blood culture <24 hours in infants aged 0-90 days32 with blood culture TTP in infants aged 0-30 days being either no different26 or potentially shorter32
- Studies showing that infants meeting low-risk clinical and laboratory profiles further reduce the likelihood of identifying serious bacterial infection after 24 hours to 0.3%.1
RECOMMENDATIONS
- Determine if febrile infants aged 0-90 days are at low risk for serious bacterial infection and obtain appropriate bacterial cultures.
- If hospitalized for observation, discharge low-risk febrile infants aged 0–90 days after 36 hours or less if bacterial cultures remain negative.
- If hospitalized for observation, consider reducing the length of inpatient observation for low-risk febrile infants aged 0–90 days with reliable follow-up to 24 hours or less when the culture results are negative.
CONCLUSION
Monitoring patients in the hospital for greater than 36 hours of bacterial culture incubation is unnecessary for patients similar to the 3 week-old full-term infant in the case presentation, who are at low risk for serious bacterial infection based on available scoring systems and have negative cultures. If patients are not deemed low risk, have an incomplete laboratory evaluation, or have had prior antibiotic treatment, longer observation in the hospital may be warranted. Close reassessment of the rare patients whose blood cultures return positive after 36 hours is necessary, but their outcomes are excellent, especially in well-appearing infants.7,33
What do you do?
Do you think this is a low-value practice? Is this truly a “Thing We Do for No Reason”? Let us know what you do in your practice and propose ideas for other “Things We Do for No Reason” topics. Please join in the conversation online at Twitter (#TWDFNR)/Facebook and don’t forget to “Like It” on Facebook or retweet it on Twitter. We invite you to propose ideas for other “Things We Do for No Reason” topics by emailing[email protected].
Disclosures
There are no conflicts of interest relevant to this work reported by any of the authors.
1. Kaplan RL, Harper MB, Baskin MN, Macone AB, Mandl KD. Time to detection of positive cultures in 28- to 90-day-old febrile infants. Pediatrics 2000;106(6):E74. PubMed
2. Fleisher GR, Ludwig S, Henretig FM. Textbook of Pediatric Emergency Medicine: Lippincott Williams & Wilkins; 2006.
3. Aronson PL, Thurm C, Williams DJ, et al. Association of clinical practice guidelines with emergency department management of febrile infants </=56 days of age. J Hosp Med. 2015;10(6):358-365. PubMed
4. Hui C, Neto G, Tsertsvadze A, et al. Diagnosis and management of febrile infants (0-3 months). Evid Rep Technol Assess. 2012;205:1-297. PubMed
5. Garcia S, Mintegi S, Gomez B, et al. Is 15 days an appropriate cut-off age for considering serious bacterial infection in the management of febrile infants? Pediatr Infect Dis J. 2012;31(5):455-458. PubMed
6. Schwartz S, Raveh D, Toker O, Segal G, Godovitch N, Schlesinger Y. A week-by-week analysis of the low-risk criteria for serious bacterial infection in febrile neonates. Arch Dis Child. 2009;94(4):287-292. PubMed
7. Huppler AR, Eickhoff JC, Wald ER. Performance of low-risk criteria in the evaluation of young infants with fever: review of the literature. Pediatrics 2010;125(2):228-233. PubMed
8. Baskin MN. The prevalence of serious bacterial infections by age in febrile infants during the first 3 months of life. Pediatr Ann. 1993;22(8):462-466. PubMed
9. Nigrovic LE, Mahajan PV, Blumberg SM, et al. The Yale Observation Scale Score and the risk of serious bacterial infections in febrile infants. Pediatrics 2017;140(1):e20170695. PubMed
10. Bergman DA, Mayer ML, Pantell RH, Finch SA, Wasserman RC. Does clinical presentation explain practice variability in the treatment of febrile infants? Pediatrics 2006;117(3):787-795. PubMed
11. Baker MD, Bell LM, Avner JR. Outpatient management without antibiotics of fever in selected infants. N Engl J Med. 1993;329(20):1437-1441. PubMed
12. Jaskiewicz JA, McCarthy CA, Richardson AC, et al. Febrile infants at low risk for serious bacterial infection--an appraisal of the Rochester criteria and implications for management. Febrile Infant Collaborative Study Group. Pediatrics 1994;94(3):390-396. PubMed
13. Baskin MN, O’Rourke EJ, Fleisher GR. Outpatient treatment of febrile infants 28 to 89 days of age with intramuscular administration of ceftriaxone. J Pediatr. 1992;120(1):22-27. PubMed
14. Bachur RG, Harper MB. Predictive model for serious bacterial infections among infants younger than 3 months of age. Pediatrics 2001;108(2):311-316. PubMed
15. Pichichero ME, Todd JK. Detection of neonatal bacteremia. J Pediatr. 1979;94(6):958-960. PubMed
16. Hurst MK, Yoder BA. Detection of bacteremia in young infants: is 48 hours adequate? Pediatr Infect Dis J. 1995;14(8):711-713. PubMed
17. Friedman J, Matlow A. Time to identification of positive bacterial cultures in infants under three months of age hospitalized to rule out sepsis. Paediatr Child Health 1999;4(5):331-334. PubMed
18. Kliegman R, Behrman RE, Nelson WE. Nelson textbook of pediatrics. Edition 20 / ed. Philadelphia, PA: Elsevier; 2016.
19. Fever in infants and children. Merck Sharp & Dohme Corp, 2016. (Accessed 27 Nov 2016, 2016, at https://www.merckmanuals.com/professional/pediatrics/symptoms-in-infants-and-children/fever-in-infants-and-children.)
20. Polin RA, Committee on F, Newborn. Management of neonates with suspected or proven early-onset bacterial sepsis. Pediatrics 2012;129(5):1006-1015. PubMed
21. Byington CL, Reynolds CC, Korgenski K, et al. Costs and infant outcomes after implementation of a care process model for febrile infants. Pediatrics 2012;130(1):e16-e24. PubMed
22. DeAngelis C, Joffe A, Wilson M, Willis E. Iatrogenic risks and financial costs of hospitalizing febrile infants. Am J Dis Child. 1983;137(12):1146-1149. PubMed
23. Nizam M, Norzila MZ. Stress among parents with acutely ill children. Med J Malaysia. 2001;56(4):428-434. PubMed
24. Rowley AH, Wald ER. The incubation period necessary for detection of bacteremia in immunocompetent children with fever. Implications for the clinician. Clin Pediatr (Phila). 1986;25(10):485-489. PubMed
25. La Scolea LJ, Jr., Dryja D, Sullivan TD, Mosovich L, Ellerstein N, Neter E. Diagnosis of bacteremia in children by quantitative direct plating and a radiometric procedure. J Clin Microbiol. 1981;13(3):478-482. PubMed
26. Evans RC, Fine BR. Time to detection of bacterial cultures in infants aged 0 to 90 days. Hosp Pediatr. 2013;3(2):97-102. PubMed
27. Herr SM, Wald ER, Pitetti RD, Choi SS. Enhanced urinalysis improves identification of febrile infants ages 60 days and younger at low risk for serious bacterial illness. Pediatrics 2001;108(4):866-871. PubMed
28. Nigrovic LE, Kuppermann N, Macias CG, et al. Clinical prediction rule for identifying children with cerebrospinal fluid pleocytosis at very low risk of bacterial meningitis. JAMA. 2007;297(1):52-60. PubMed
29. Doby EH, Stockmann C, Korgenski EK, Blaschke AJ, Byington CL. Cerebrospinal fluid pleocytosis in febrile infants 1-90 days with urinary tract infection. Pediatr Infect Dis J. 2013;32(9):1024-1026. PubMed
30. Bhansali P, Wiedermann BL, Pastor W, McMillan J, Shah N. Management of hospitalized febrile neonates without CSF analysis: A study of US pediatric hospitals. Hosp Pediatr. 2015;5(10):528-533. PubMed
31. Kanegaye JT, Soliemanzadeh P, Bradley JS. Lumbar puncture in pediatric bacterial meningitis: defining the time interval for recovery of cerebrospinal fluid pathogens after parenteral antibiotic pretreatment. Pediatrics 2001;108(5):1169-1174. PubMed
32. Biondi EA, Mischler M, Jerardi KE, et al. Blood culture time to positivity in febrile infants with bacteremia. JAMA Pediatr. 2014;168(9):844-849. PubMed
33. Moher D HC, Neto G, Tsertsvadze A. Diagnosis and Management of Febrile Infants (0–3 Months). Evidence Report/Technology Assessment No. 205. In: Center OE-bP, ed. Rockville, MD: Agency for Healthcare Research and Quality; 2012. PubMed
© 2018 Society of Hospital Medicine
May 2018 Digital Edition
Click here to access the May 2018 Digital Edition.
Table of Contents
- Association of Dioxin and Dioxinlike Congeners With Hypertension
- The Clinical Pathophysiology of Chronic Systemic Sclerosis
- The Effects of Ranolazine on Hemoglobin A1c in a Veteran Population
- A Forgotten Cause of Cardiac Tamponade
- Be Part of the (Larger) Conversation
- NOVA Updates
Islet Transplantation Improves Diabetes-Related Quality of Life
Participants reported the greatest improvements in diabetes-related quality of life (QOL) and better overall health status even though they would need lifelong immune-suppressing drugs to prevent transplant rejection.
The study, conducted by the Clinical Islet Transplantation Consortium, involved 48 people with hypoglycemia unawareness who experienced frequent episodes of severe hypoglycemia despite receiving expert care. Each participant received at least 1 islet transplant.
One year after the first transplant, 42 participants (88%) were free of severe hypoglycemic events, had near-normal blood glucose control, and had restored awareness of hypoglycemia. About half of the recipients needed to continue on insulin to control blood glucose, but the reported improvements in QOL were similar between those who did and those who did not. The researchers say the elimination of severe hypoglycemia and the associated fears outweighed concerns about the need for continued insulin treatment.
Islet transplantation is investigational in the US. Although the results are promising, the National Institutes of Health cautions that the process is not appropriate for all patients with type 1 diabetes mellitus due to risks and adverse effects.