User login
PPI use not linked to cognitive decline
Use of proton pump inhibitors (PPIs) is not associated with cognitive decline in two prospective, population-based studies of identical twins published in the May issue of Clinical Gastroenterology and Hepatology.
“No stated differences in [mean cognitive] scores between PPI users and nonusers were significant,” wrote Mette Wod, PhD, of the University of Southern Denmark, Odense, with her associates.
Past research has yielded mixed findings about whether using PPIs affects the risk of dementia. Preclinical data suggest that exposure to these drugs affects amyloid levels in mice, but “the evidence is equivocal, [and] the results of epidemiologic studies [of humans] have also been inconclusive, with more recent studies pointing toward a null association,” the investigators wrote. Furthermore, there are only “scant” data on whether long-term PPI use affects cognitive function, they noted.
To help clarify the issue, they analyzed prospective data from two studies of twins in Denmark: the Study of Middle-Aged Danish Twins, in which individuals underwent a five-part cognitive battery at baseline and then 10 years later, and the Longitudinal Study of Aging Danish Twins, in which participants underwent the same test at baseline and 2 years later. The cognitive test assessed verbal fluency, forward and backward digit span, and immediate and delayed recall of a 12-item list. Using data from a national prescription registry, the investigators also estimated individuals’ PPI exposure starting 2 years before study enrollment.
In the study of middle-aged twins, participants who used high-dose PPIs before study enrollment had cognitive scores that were slightly lower at baseline, compared with PPI nonusers. Mean baseline scores were 43.1 (standard deviation, 13.1) and 46.8 (SD, 10.2), respectively. However, after researchers adjusted for numerous clinical and demographic variables, the between-group difference in baseline scores narrowed to just 0.69 (95% confidence interval, –4.98 to 3.61), which was not statistically significant.
The longitudinal study of older twins yielded similar results. Individuals who used high doses of PPIs had slightly higher adjusted mean baseline cognitive score than did nonusers, but the difference did not reach statistical significance (0.95; 95% CI, –1.88 to 3.79).
Furthermore, prospective assessments of cognitive decline found no evidence of an effect. In the longitudinal aging study, high-dose PPI users had slightly less cognitive decline (based on a smaller change in test scores over time) than did nonusers, but the adjusted difference in decline between groups was not significant (1.22 points; 95% CI, –3.73 to 1.29). In the middle-aged twin study, individuals with the highest levels of PPI exposure (at least 1,600 daily doses) had slightly less cognitive decline than did nonusers, with an adjusted difference of 0.94 points (95% CI, –1.63 to 3.50) between groups, but this did not reach statistical significance.
“This study is the first to examine the association between long-term PPI use and cognitive decline in a population-based setting,” the researchers concluded. “Cognitive scores of more than 7,800 middle-aged and older Danish twins at baseline did not indicate an association with previous PPI use. Follow-up data on more than 4,000 of these twins did not indicate that use of this class of drugs was correlated to cognitive decline.”
Odense University Hospital provided partial funding. Dr. Wod had no disclosures. Three coinvestigators disclosed ties to AstraZeneca and Bayer AG.
SOURCE: Wod M et al. Clin Gastro Hepatol. 2018 Feb 3. doi: 10.1016/j.cgh.2018.01.034.
Over the last 20 years, there have been multiple retrospective studies which have shown associations between the use of proton pump inhibitors (PPIs) and a wide constellation of serious medical complications. However, detecting an association between a drug and a complication does not necessarily indicate that the drug was indeed responsible.

This well-done study by Wod et al, which shows no significant association between PPI use and decreased cognition and cognitive decline will, I hope, serve to allay any misplaced concerns that may exist among clinicians and patients about PPI use in this population. This paper has notable strengths, most importantly having access to results of a direct, unbiased assessment of changes in cognitive function over time and accurate assessment of PPI exposure. Short of performing a controlled, prospective trial, we are unlikely to see better evidence indicating a lack of a causal relationship between PPI use and changes in cognitive function. This provides assurance that patients with indications for PPI use can continue to use them.
Laura E. Targownik, MD, MSHS, FRCPC, is section head, section of gastroenterology, University of Manitoba, Winnipeg, Canada; Gastroenterology and Endoscopy Site Lead, Health Sciences Centre, Winnipeg; associate director, University of Manitoba Inflammatory Bowel Disease Research Centre; associate professor, department of internal medicine, section of gastroenterology, University of Manitoba. She has no conflicts of interest.
Over the last 20 years, there have been multiple retrospective studies which have shown associations between the use of proton pump inhibitors (PPIs) and a wide constellation of serious medical complications. However, detecting an association between a drug and a complication does not necessarily indicate that the drug was indeed responsible.
This well-done study by Wod et al, which shows no significant association between PPI use and decreased cognition and cognitive decline will, I hope, serve to allay any misplaced concerns that may exist among clinicians and patients about PPI use in this population. This paper has notable strengths, most importantly having access to results of a direct, unbiased assessment of changes in cognitive function over time and accurate assessment of PPI exposure. Short of performing a controlled, prospective trial, we are unlikely to see better evidence indicating a lack of a causal relationship between PPI use and changes in cognitive function. This provides assurance that patients with indications for PPI use can continue to use them.
Laura E. Targownik, MD, MSHS, FRCPC, is section head, section of gastroenterology, University of Manitoba, Winnipeg, Canada; Gastroenterology and Endoscopy Site Lead, Health Sciences Centre, Winnipeg; associate director, University of Manitoba Inflammatory Bowel Disease Research Centre; associate professor, department of internal medicine, section of gastroenterology, University of Manitoba. She has no conflicts of interest.
Use of proton pump inhibitors (PPIs) is not associated with cognitive decline in two prospective, population-based studies of identical twins published in the May issue of Clinical Gastroenterology and Hepatology.
“No stated differences in [mean cognitive] scores between PPI users and nonusers were significant,” wrote Mette Wod, PhD, of the University of Southern Denmark, Odense, with her associates.
Past research has yielded mixed findings about whether using PPIs affects the risk of dementia. Preclinical data suggest that exposure to these drugs affects amyloid levels in mice, but “the evidence is equivocal, [and] the results of epidemiologic studies [of humans] have also been inconclusive, with more recent studies pointing toward a null association,” the investigators wrote. Furthermore, there are only “scant” data on whether long-term PPI use affects cognitive function, they noted.
To help clarify the issue, they analyzed prospective data from two studies of twins in Denmark: the Study of Middle-Aged Danish Twins, in which individuals underwent a five-part cognitive battery at baseline and then 10 years later, and the Longitudinal Study of Aging Danish Twins, in which participants underwent the same test at baseline and 2 years later. The cognitive test assessed verbal fluency, forward and backward digit span, and immediate and delayed recall of a 12-item list. Using data from a national prescription registry, the investigators also estimated individuals’ PPI exposure starting 2 years before study enrollment.
In the study of middle-aged twins, participants who used high-dose PPIs before study enrollment had cognitive scores that were slightly lower at baseline, compared with PPI nonusers. Mean baseline scores were 43.1 (standard deviation, 13.1) and 46.8 (SD, 10.2), respectively. However, after researchers adjusted for numerous clinical and demographic variables, the between-group difference in baseline scores narrowed to just 0.69 (95% confidence interval, –4.98 to 3.61), which was not statistically significant.
The longitudinal study of older twins yielded similar results. Individuals who used high doses of PPIs had slightly higher adjusted mean baseline cognitive score than did nonusers, but the difference did not reach statistical significance (0.95; 95% CI, –1.88 to 3.79).
Furthermore, prospective assessments of cognitive decline found no evidence of an effect. In the longitudinal aging study, high-dose PPI users had slightly less cognitive decline (based on a smaller change in test scores over time) than did nonusers, but the adjusted difference in decline between groups was not significant (1.22 points; 95% CI, –3.73 to 1.29). In the middle-aged twin study, individuals with the highest levels of PPI exposure (at least 1,600 daily doses) had slightly less cognitive decline than did nonusers, with an adjusted difference of 0.94 points (95% CI, –1.63 to 3.50) between groups, but this did not reach statistical significance.
“This study is the first to examine the association between long-term PPI use and cognitive decline in a population-based setting,” the researchers concluded. “Cognitive scores of more than 7,800 middle-aged and older Danish twins at baseline did not indicate an association with previous PPI use. Follow-up data on more than 4,000 of these twins did not indicate that use of this class of drugs was correlated to cognitive decline.”
Odense University Hospital provided partial funding. Dr. Wod had no disclosures. Three coinvestigators disclosed ties to AstraZeneca and Bayer AG.
SOURCE: Wod M et al. Clin Gastro Hepatol. 2018 Feb 3. doi: 10.1016/j.cgh.2018.01.034.
FROM CLINICAL GASTROENTEROLOGY AND HEPATOLOGY
Key clinical point: Use of proton pump inhibitors was not associated with cognitive decline.
Major finding: Mean baseline cognitive scores did not significantly differ between PPI users and nonusers, nor did changes in cognitive scores over time.
Study details: Two population-based studies of twins in Denmark.
Disclosures: Odense University Hospital provided partial funding. Dr. Wod had no disclosures. Three coinvestigators disclosed ties to AstraZeneca and Bayer AG.
Source: Wod M et al. Clin Gastro Hepatol. 2018 Feb 3. doi: 10.1016/j.cgh.2018.01.034.
Alpha fetoprotein boosted detection of early-stage liver cancer
For patients with cirrhosis, adding serum alpha fetoprotein testing to ultrasound significantly boosted its ability to detect early-stage hepatocellular carcinoma, according to the results of a systematic review and meta-analysis reported in the May issue of Gastroenterology.
Used alone, ultrasound detected only 45% of early-stage hepatocellular carcinomas (95% confidence interval, 30%-62%), reported Kristina Tzartzeva, MD, of the University of Texas, Dallas, with her associates. Adding alpha fetoprotein (AFP) increased this sensitivity to 63% (95% CI, 48%-75%; P = .002). Few studies evaluated alternative surveillance tools, such as CT or MRI.
Diagnosing liver cancer early is key to survival and thus is a central issue in cirrhosis management. However, the best surveillance strategy remains uncertain, hinging as it does on sensitivity, specificity, and cost. The American Association for the Study of Liver Diseases and the European Association for the Study of the Liver recommend that cirrhotic patients undergo twice-yearly ultrasound to screen for hepatocellular carcinoma (HCC), but they disagree about the value of adding serum biomarker AFP testing. Meanwhile, more and more clinics are using CT and MRI because of concerns about the unreliability of ultrasound. “Given few direct comparative studies, we are forced to primarily rely on indirect comparisons across studies,” the reviewers wrote.
To do so, they searched MEDLINE and Scopus and identified 32 studies of HCC surveillance that comprised 13,367 patients, nearly all with baseline cirrhosis. The studies were published from 1990 to August 2016.
Ultrasound detected HCC of any stage with a sensitivity of 84% (95% CI, 76%-92%), but its sensitivity for detecting early-stage disease was less than 50%. In studies that performed direct comparisons, ultrasound alone was significantly less sensitive than ultrasound plus AFP for detecting all stages of HCC (relative risk, 0.80; 95% CI, 0.72-0.88) and early-stage disease (0.78; 0.66-0.92). However, ultrasound alone was more specific than ultrasound plus AFP (RR, 1.08; 95% CI, 1.05-1.09).
Four studies of about 900 patients evaluated cross-sectional imaging with CT or MRI. In one single-center, randomized trial, CT had a sensitivity of 63% for detecting early-stage disease, but the 95% CI for this estimate was very wide (30%-87%) and CT did not significantly outperform ultrasound (Aliment Pharmacol Ther. 2013;38:303-12). In another study, MRI and ultrasound had significantly different sensitivities of 84% and 26% for detecting (usually) early-stage disease (JAMA Oncol. 2017;3[4]:456-63).
“Ultrasound currently forms the backbone of professional society recommendations for HCC surveillance; however, our meta-analysis highlights its suboptimal sensitivity for detection of hepatocellular carcinoma at an early stage. Using ultrasound in combination with AFP appears to significantly improve sensitivity for detecting early HCC with a small, albeit statistically significant, trade-off in specificity. There are currently insufficient data to support routine use of CT- or MRI-based surveillance in all patients with cirrhosis,” the reviewers concluded.
The National Cancer Institute and Cancer Prevention Research Institute of Texas provided funding. None of the reviewers had conflicts of interest.
SOURCE: Tzartzeva K et al. Gastroenterology. 2018 Feb 6. doi: 10.1053/j.gastro.2018.01.064.
FROM GASTROENTEROLOGY
Key clinical point: Ultrasound unreliably detects hepatocellular carcinoma, but adding alpha fetoprotein increases its sensitivity.
Major finding: Used alone, ultrasound detected only 47% of early-stage cases. Adding alpha fetoprotein increased this sensitivity to 63% (P = .002).
Study details: Systematic review and meta-analysis of 32 studies comprising 13,367 patients and spanning from 1990 to August 2016.
Disclosures: The National Cancer Institute and Cancer Prevention Research Institute of Texas provided funding. None of the researchers had conflicts of interest.
Source: Tzartzeva K et al. Gastroenterology. 2018 Feb 6. doi: 10.1053/j.gastro.2018.01.064.
DDW is a celebration of diversity
Digestive Disease Week® (DDW) is approaching rapidly. One might say, with strong justification, that the overarching theme for DDW is a celebration of diversity. We are entering the era of “omics” and current research suggests a microbiome rich in diversity is associated with health, while a less-diverse biome is associated with digestive disorders – inflammatory bowel disease for example. Multiple abstracts and presentations will be related to research into microbiome alterations in disease. In nature, diversity is a key to survival.

Farmers know the value of diversity and the devastating effects of restricted diversity. When fields are restricted to a single crop year after year, artificial fertilizers must be used to restore fertility. Organic farmers understand the need for diversity in the form of crop rotation. No forest can survive for long without rich biological diversity. Even cancer reminds us of the importance of diversity. Restricted diversity in the form of cellular monoclonality is one of the hallmarks of malignant growth.
DDW, our annual hallmark meeting, emphasizes our need for diverse thoughts and intellectual discourse as we advance the science of gastroenterology, endoscopy, hepatology, and surgery. Biology does not tolerate restrictions on diversity for long. Diversity makes DDW great.
In this month’s issue of GI & Hepatology News, we are reassured that PPIs are not linked to cognitive decline. Sessile serrated polyps, often missed at colonoscopy and CT colography might be detected with noninvasive testing as the field of blood-based cancer screening advances. Pay attention to the exciting bleeding-edge technology emerging from the AGA Tech Summit – especially technologies to treat obesity. Read about some of the continuing barriers to CRC screening in underserved populations – if we are to achieve 80% screening rates we must focus on people challenged to access our health care system.
Finally, consider the AGA Clinical Practice Update about Barrett’s esophagus. I spent a morning with Joel Richter, MD, last month and he reminded me that our current surveillance system is failing to impact annual incidence of esophageal adenocarcinoma. Perhaps we should focus on a one-time screen for those most at risk, catching prevalent disease at an early stage.
John I. Allen, MD, MBA, AGAF
Editor in Chief
Digestive Disease Week® (DDW) is approaching rapidly. One might say, with strong justification, that the overarching theme for DDW is a celebration of diversity. We are entering the era of “omics” and current research suggests a microbiome rich in diversity is associated with health, while a less-diverse biome is associated with digestive disorders – inflammatory bowel disease for example. Multiple abstracts and presentations will be related to research into microbiome alterations in disease. In nature, diversity is a key to survival.
Farmers know the value of diversity and the devastating effects of restricted diversity. When fields are restricted to a single crop year after year, artificial fertilizers must be used to restore fertility. Organic farmers understand the need for diversity in the form of crop rotation. No forest can survive for long without rich biological diversity. Even cancer reminds us of the importance of diversity. Restricted diversity in the form of cellular monoclonality is one of the hallmarks of malignant growth.
DDW, our annual hallmark meeting, emphasizes our need for diverse thoughts and intellectual discourse as we advance the science of gastroenterology, endoscopy, hepatology, and surgery. Biology does not tolerate restrictions on diversity for long. Diversity makes DDW great.
In this month’s issue of GI & Hepatology News, we are reassured that PPIs are not linked to cognitive decline. Sessile serrated polyps, often missed at colonoscopy and CT colography might be detected with noninvasive testing as the field of blood-based cancer screening advances. Pay attention to the exciting bleeding-edge technology emerging from the AGA Tech Summit – especially technologies to treat obesity. Read about some of the continuing barriers to CRC screening in underserved populations – if we are to achieve 80% screening rates we must focus on people challenged to access our health care system.
Finally, consider the AGA Clinical Practice Update about Barrett’s esophagus. I spent a morning with Joel Richter, MD, last month and he reminded me that our current surveillance system is failing to impact annual incidence of esophageal adenocarcinoma. Perhaps we should focus on a one-time screen for those most at risk, catching prevalent disease at an early stage.
John I. Allen, MD, MBA, AGAF
Editor in Chief
Predicting response to CAR T-cell therapy in CLL

Researchers may have discovered why some patients with advanced chronic lymphocytic leukemia (CLL) don’t respond to chimeric antigen receptor (CAR) T-cell therapy.
The team found that CLL patients with elevated levels of “early memory” T cells prior to receiving CAR T-cell therapy had a partial or complete response to treatment, while patients with lower levels of these T cells did not respond.
The early memory T cells were marked by the expression of CD8 and CD27, as well as the absence of CD45RO.
The researchers validated the association between the early memory T cells and response in a small group of patients, predicting with 100% accuracy which patients would achieve a complete response.
Joseph A. Fraietta, PhD, of the University of Pennsylvania in Philadelphia, and his colleagues reported these findings in Nature Medicine. This research was supported, in part, by Novartis.
For this study, the researchers retrospectively analyzed 41 patients with advanced, heavily pretreated, high-risk CLL who received at least 1 dose of CD19-directed CAR T cells.
Consistent with the team’s previously reported findings, they were not able to identify patient or disease-specific factors that predict who responds best to the therapy.
Therefore, the researchers compared the gene expression profiles and phenotypes of T cells in patients who had a complete response, partial response, or no response to therapy.
The CAR T cells that persisted and expanded in complete responders were enriched in genes that regulate early memory and effector T cells and possess the IL-6/STAT3 signature.
Non-responders, on the other hand, expressed genes involved in late T-cell differentiation, glycolysis, exhaustion, and apoptosis. These characteristics make for a weaker set of T cells to persist, expand, and fight the CLL.
“Pre-existing T-cell qualities have previously been associated with poor clinical response to cancer therapy, as well differentiation in the T cells,” Dr Fraietta said. “What is special about what we have done here is finding that critical cell subset and signature.”
Elevated levels of the IL-6/STAT3 signaling pathway in these early T cells correlated with clinical responses to CAR T-cell therapy.
To validate these findings, the researchers screened for the early memory T cells in a group of 8 CLL patients, before and after CAR T-cell therapy. The team identified the complete responders with 100% specificity and sensitivity.
“With a very robust biomarker like this, we can take a blood sample, measure the frequency of this T-cell population, and decide with a degree of confidence whether we can apply this therapy and know the patient would have a response,” Dr Fraietta said.
“The ability to select patients most likely to respond would have tremendous clinical impact, as this therapy would be applied only to patients most likely to benefit, allowing patients unlikely to respond to pursue other options.”
These findings also suggest the possibility of improving CAR T-cell therapy by selecting for cell manufacturing the subpopulation of T cells responsible for driving responses. However, this approach would come with challenges.
“What we’ve seen in these non-responders is that the frequency of these T cells is low, so it would be very hard to infuse them as starting populations,” said study author J. Joseph Melenhorst, PhD, also of the University of Pennsylvania.
“But one way to potentially boost their efficacy is by adding checkpoint inhibitors with the therapy to block the negative regulation prior to CAR T-cell therapy, which a past, separate study has shown can help elicit responses in these patients.”
The researchers also noted that it’s unclear why some patients’ T cells are suboptimal prior to treatment. However, the team believes this could have to do with prior therapies.
Future studies with a larger group of CLL patients should be conducted to help answer these questions and validate the findings from this study, the researchers said.
One in seven Americans had fecal incontinence
One in seven respondents to a national survey reported a history of fecal incontinence, including one-third within the preceding week, investigators reported.
“Fecal incontinence [FI] is age-related and more prevalent among individuals with inflammatory bowel disease, celiac disease, irritable bowel syndrome, or diabetes than people without these disorders. Proactive screening for FI among these groups is warranted,” Stacy B. Menees, MD, and her associates wrote in the May issue of Gastroenterology (doi: 10.1053/j.gastro.2018.01.062).
Accurately determining the prevalence of FI is difficult because patients are reluctant to disclose symptoms and physicians often do not ask. In one study of HMO enrollees, about a third of patients had a history of FI but fewer than 3% had a medical diagnosis. In other studies, the prevalence of FI has ranged from 2% to 21%. Population aging fuels the need to narrow these estimates because FI becomes more common with age, the investigators noted.
Accordingly, in October 2015, they used a mobile app called MyGIHealth to survey nearly 72,000 individuals about fecal incontinence and other GI symptoms. The survey took about 15 minutes to complete, in return for which respondents could receive cash, shop online, or donate to charity. The investigators assessed FI severity by analyzing responses to the National Institutes of Health FI Patient Reported Outcomes Measurement Information System questionnaire.
Of the 10,033 respondents reporting a history of fecal incontinence (14.4%), 33.3% had experienced at least one episode in the past week. About a third of individuals with FI said it interfered with their daily activities. “Increasing age and concomitant diarrhea and constipation were associated with increased odds [of] FI,” the researchers wrote. Compared with individuals aged 18-24 years, the odds of having ever experienced FI rose by 29% among those aged 25-45 years, by 72% among those aged 45-64 years, and by 118% among persons aged 65 years and older.
Self-reported FI also was significantly more common among individuals with Crohn’s disease (41%), ulcerative colitis (37%), celiac disease (34%), irritable bowel syndrome (13%), or diabetes (13%) than it was among persons without these conditions. Corresponding odds ratios ranged from about 1.5 (diabetes) to 2.8 (celiac disease).
For individuals reporting FI within the past week, greater severity (based on their responses to the NIH FI Patient Reported Outcomes Measurement Information System questionnaire) significantly correlated with being non-Hispanic black (P = .03) or Latino (P = .02) and with having Crohn’s disease (P less than .001), celiac disease (P less than .001), diabetes (P = .04), human immunodeficiency syndrome (P = .001), or chronic idiopathic constipation (P less than .001). “Our study is the first to find differences among racial/ethnic groups regarding FI severity,” the researchers noted. They did not speculate on reasons for the finding, but stressed the importance of screening for FI and screening patients with FI for serious GI diseases.
Ironwood Pharmaceuticals funded the National GI Survey, but the investigators received no funding for this study. Three coinvestigators reported ties to Ironwood Pharmaceuticals and My Total Health.
SOURCE: Menees SB et al. Gastroenterology. 2018 Feb 3. doi: 10.1053/j.gastro.2018.01.062.
Fecal incontinence (FI) is a common problem associated with significant social anxiety and decreased quality of life for patients who experience it. Unfortunately, patients are not always forthcoming regarding their symptoms, and physicians often fail to inquire directly about incontinence symptoms.
Previous studies have shown the prevalence of FI to vary widely across different populations. Using novel technology through a mobile app, researchers at the University of Michigan, Ann Arbor, and Cedars-Sinai Medical Center, Los Angeles, have been able to perform the largest population-based study of community-dwelling Americans. They confirmed that FI is indeed a common problem experienced across the spectrum of age, sex, race, and socioeconomic status and interferes with the daily activities of more than one-third of those who experience it.
This study supports previous findings of an age-related increase in FI, with the highest prevalence in patients over age 65 years. Interestingly, males were more likely than female to have experienced FI within the past week, but not more likely to have ever experienced FI. While FI is often thought of as a primarily female problem (related to past obstetrical injury), it is important to remember that it likely affects both sexes equally.
Other significant risk factors include diabetes and gastrointestinal disorders. This study also confirms prior population-based findings that patients with chronic constipation are more likely to suffer FI. Finally, this study also identified risk factors associated with FI symptom severity including diabetes, HIV/AIDS, Crohn’s disease, celiac disease, and chronic constipation. This is also the first study to show differences between racial/ethnic groups, suggesting higher FI symptom scores in Latinos and African-Americans.
The strengths of this study include its size and the anonymity provided by an internet-based survey regarding a potentially embarrassing topic; however, it also may have led to the potential exclusion of older individuals or those without regular internet access.
In summary, I believe this is an important study which confirms that FI is a common among Americans while helping to identify potential risk factors for the presence and severity of FI. I am hopeful that with increased awareness, health care providers will become more prudent in screening their patients for FI, particularly in these higher-risk populations.
Stephanie A. McAbee, MD, is an assistant professor of medicine in the division of gastroenterology, hepatology, and nutrition at Vanderbilt University Medical Center, Nashville, Tenn. She has no conflicts of interest.
One in seven respondents to a national survey reported a history of fecal incontinence, including one-third within the preceding week, investigators reported.
“Fecal incontinence [FI] is age-related and more prevalent among individuals with inflammatory bowel disease, celiac disease, irritable bowel syndrome, or diabetes than people without these disorders. Proactive screening for FI among these groups is warranted,” Stacy B. Menees, MD, and her associates wrote in the May issue of Gastroenterology (doi: 10.1053/j.gastro.2018.01.062).
Accurately determining the prevalence of FI is difficult because patients are reluctant to disclose symptoms and physicians often do not ask. In one study of HMO enrollees, about a third of patients had a history of FI but fewer than 3% had a medical diagnosis. In other studies, the prevalence of FI has ranged from 2% to 21%. Population aging fuels the need to narrow these estimates because FI becomes more common with age, the investigators noted.
Accordingly, in October 2015, they used a mobile app called MyGIHealth to survey nearly 72,000 individuals about fecal incontinence and other GI symptoms. The survey took about 15 minutes to complete, in return for which respondents could receive cash, shop online, or donate to charity. The investigators assessed FI severity by analyzing responses to the National Institutes of Health FI Patient Reported Outcomes Measurement Information System questionnaire.
Of the 10,033 respondents reporting a history of fecal incontinence (14.4%), 33.3% had experienced at least one episode in the past week. About a third of individuals with FI said it interfered with their daily activities. “Increasing age and concomitant diarrhea and constipation were associated with increased odds [of] FI,” the researchers wrote. Compared with individuals aged 18-24 years, the odds of having ever experienced FI rose by 29% among those aged 25-45 years, by 72% among those aged 45-64 years, and by 118% among persons aged 65 years and older.
Self-reported FI also was significantly more common among individuals with Crohn’s disease (41%), ulcerative colitis (37%), celiac disease (34%), irritable bowel syndrome (13%), or diabetes (13%) than it was among persons without these conditions. Corresponding odds ratios ranged from about 1.5 (diabetes) to 2.8 (celiac disease).
For individuals reporting FI within the past week, greater severity (based on their responses to the NIH FI Patient Reported Outcomes Measurement Information System questionnaire) significantly correlated with being non-Hispanic black (P = .03) or Latino (P = .02) and with having Crohn’s disease (P less than .001), celiac disease (P less than .001), diabetes (P = .04), human immunodeficiency syndrome (P = .001), or chronic idiopathic constipation (P less than .001). “Our study is the first to find differences among racial/ethnic groups regarding FI severity,” the researchers noted. They did not speculate on reasons for the finding, but stressed the importance of screening for FI and screening patients with FI for serious GI diseases.
Ironwood Pharmaceuticals funded the National GI Survey, but the investigators received no funding for this study. Three coinvestigators reported ties to Ironwood Pharmaceuticals and My Total Health.
SOURCE: Menees SB et al. Gastroenterology. 2018 Feb 3. doi: 10.1053/j.gastro.2018.01.062.
FROM GASTROENTEROLOGY
Key clinical point: One in seven (14%) individuals had experienced fecal incontinence (FI), one-third within the past week.
Major finding: Self-reported FI was significantly more common among individuals with Crohn’s disease (41%), ulcerative colitis (37%), celiac disease (34%), irritable bowel syndrome (13%), or diabetes (13%) than among individuals without these diagnoses.
Study details: Analysis of 71,812 responses to the National GI Survey, conducted in October 2015.
Disclosures: Although Ironwood Pharmaceuticals funded the National GI Survey, the investigators received no funding for this study. Three coinvestigators reported ties to Ironwood Pharmaceuticals and My Total Health.
Source: Menees SB et al. Gastroenterology. 2018 Feb 3. doi: 10.1053/j.gastro.2018.01.062.
Team identifies 5 subtypes of DLBCL
New research has revealed 5 genetic subtypes of diffuse large B-cell lymphoma (DLBCL).
Researchers identified a group of low-risk activated B-cell (ABC) DLBCLs, 2 subsets of germinal center B-cell (GCB) DLBCLs, a group of ABC/GCB-independent DLBCLs, and a group of ABC DLBCLs with genetic characteristics found in primary central nervous system lymphoma and testicular lymphoma.
The researchers believe these findings may have revealed new therapeutic targets for DLBCL, some of which could be inhibited by drugs that are already approved or under investigation in clinical trials.
Margaret Shipp, MD, of the Dana-Farber Cancer Institute in Boston, Massachusetts, and her colleagues conducted this research and reported the results in Nature Medicine.
The team performed genetic analyses on samples from 304 DLBCL patients and observed great genetic diversity. The median number of genetic driver alterations in individual tumors was 17.
The researchers integrated data on 3 types of genetic alterations—recurrent mutations, somatic copy number alterations, and structural variants—to define previously unappreciated DLBCL subtypes.
“Specific genes that were perturbed by mutations could also be altered by changes in gene copy numbers or by chromosomal rearrangements, underscoring the importance of evaluating all 3 types of genetic alterations,” Dr Shipp noted.
“Most importantly, we saw that there were 5 discrete types of DLBCL that were distinguished one from another on the basis of the specific types of genetic alterations that occurred in combination.”
The researchers classified these subtypes as clusters (C) 1 to 5.
C1 consisted of largely ABC-DLBCLs with genetic features of an extra-follicular, possibly marginal zone origin.
C2 included both ABC and GCB DLBCLs with biallelic inactivation of TP53, 9p21.3/CDKN2A, and associated genomic instability.
Most DLBCLs in C3 were of the GCB subtype and were characterized by BCL2 structural variants and alterations of PTEN and epigenetic enzymes.
C4 consisted largely of GCB DLBCLs with alterations in BCR/PI3K, JAK/STAT, and BRAF pathway components and multiple histones.
Most C5 DLBCLs were of the ABC subtype, and the researchers said the major components of the C5 signature—BCL2 gain, concordant MYD88L265P/CD79B mutations, and mutations of ETV6, PIM1, GRHPR, TBL1XR1, and BTG1—were similar to those observed in primary central nervous system and testicular lymphoma.
Dr Shipp and her colleagues also identified a sixth cluster of DLBCLs (dubbed C0) that “lacked defining genetic drivers.”
Finally, the team found that patients with C0, C1, and C4 DLBCLs had more favorable outcomes, while patients with C2, C3, and C5 DLBCLs had less favorable outcomes.
“We feel this research opens the door to a whole series of additional investigations to understand how the combinations of these genetic alterations work together, and then to use that information to benefit patients with targeted therapies,” Dr Shipp said.
She and her colleagues are now working on creating a clinical tool to identify these genetic signatures in patients. The team is also developing clinical trials that will match patients with given genetic signatures to targeted treatments.
Another group of researchers recently identified 4 genetic subtypes of DLBCL.
Parkinson’s disease: A treatment guide
Parkinson’s disease (PD) can be a tough diagnosis to navigate. Patients with this neurologic movement disorder can present with a highly variable constellation of symptoms,1 ranging from the well-known tremor and bradykinesia to difficulties with activities of daily living (particularly dressing and getting out of a car2) to nonspecific symptoms, such as pain, fatigue, hyposmia, and erectile dysfunction.3
Furthermore, medications more recently approved by the US Food and Drug Administration (FDA) have left many health care providers confused about what constitutes appropriate first-, second-, and third-line therapies, as well as add-on therapy for symptoms secondary to dopaminergic agents. What follows is a stepwise approach to managing PD that incorporates these newer therapies so that you can confidently and effectively manage patients with PD with little or no consultation.
First, though, we review who’s at greatest risk—and what you’ll see.
Family history tops list of risk factors for PD
While PD occurs in less than 1% of the population ≥40 years of age, its prevalence increases with age, becoming significantly higher by age 60 years, with a slight predominance toward males.4
A variety of factors increase the risk of developing PD. A well-conducted meta-analysis showed that the strongest risk factor is having a family member, particularly a first-degree relative, with a history of PD or tremor.5 Repeated head injury, with or without loss of consciousness, is also a factor;5 risk increases with each occurrence.6 Other risk factors include exposure to pesticides, rural living, and exposure to well water.5
Researchers have conducted several studies regarding the effects of elevated cholesterol and hypertension on the risk of PD, but results are still without consensus.5 A study published in 2017 reported a significantly increased risk of PD associated with having hepatitis B or C, but the mechanism for the association—including whether it is a consequence of treatment—is unknown.7

Smoking and coffee drinking. Researchers have found that cigarette smoking, beer consumption, and high coffee intake are protective against PD,5 but the benefits are outweighed by the risks associated with these strategies.8 The most practical protective factors are a high dietary intake of vitamin E and increased nut consumption.9 Dietary vitamin E can be found in almonds, spinach, sweet potatoes, sunflower seeds, and avocados. Studies have not found the same benefit with vitamin E supplements.9
Dx seldom requires testing, but may take time to come into focus
Motor symptoms. The key diagnostic criterium for PD is bradykinesia with at least one of the following: muscular rigidity, resting tremor (particularly a pill-rolling tremor) that improves with purposeful function, or postural instability.2 Other physical findings may include masking of facies and speech changes, such as becoming quiet, stuttering, or speaking monotonously without inflection.1 Cogwheeling, stooped posture, and a shuffling gait or difficulty initiating gait (freezing) are all neurologic signs that point toward a PD diagnosis.2
A systematic review found that the clinical features most strongly associated with a diagnosis of PD were trouble turning in bed, a shuffling gait, tremor, difficulty opening jars, micrographia, and loss of balance.10 Typically these symptoms are asymmetric.1
Symptoms that point to other causes. Falling within the first year of symptoms is strongly associated with movement disorders other than PD—notably progressive supranuclear palsy.11 Other symptoms that point toward an alternate diagnosis include a poor response to levodopa, symmetry at the onset of symptoms, rapid progression of disease, and the absence of a tremor.11 It is important to ensure that the patient is not experiencing drug-induced symptoms as can occur with some antipsychotics and antiemetics.
Nonmotor symptoms. Neuropsychiatric symptoms are common in patients with PD. Up to 58% of patients experience depression, and 49% complain of anxiety.12 Hallucinations are present in many patients and are more commonly visual than auditory in nature.13 Patients experience fatigue, daytime sleepiness, and inner restlessness at higher rates than do age-matched controls.3 Research also shows that symptoms such as constipation, mood disorders, erectile dysfunction, and hyposmia may predate the onset of motor symptoms.5
Insomnia is a common symptom that is likely multifactorial in etiology. Causes to consider include motor disturbance, nocturia, reversal of sleep patterns, and reemergence of PD symptoms after a period of quiescence.14 Additionally, hypersalivation and PD dementia can develop as complications of PD.
A clinical diagnosis. Although PD can be difficult to diagnose in the early stages, the diagnosis seldom requires testing.2 A recent systematic review concluded that a clinical diagnosis of PD, when compared with pathology, was correct 74% of the time when the diagnosis was made by nonexperts and correct 84% of the time when the diagnosis was made by movement disorder experts.15
Imaging. Computed tomography and magnetic resonance imaging can be useful in ruling out other diagnoses in the differential, including vascular disease and normal pressure hydrocephalus,2 but will not reveal findings suggestive of PD.
Other diagnostic tests. A levodopa challenge can confirm PD if the diagnosis is unclear.11 In addition, an olfactory test (presenting various odors to the patient for identification) can differentiate PD from progressive supranuclear palsy and corticobasal degeneration; however, it will not distinguish PD from multiple system atrophy.11 If the diagnosis remains unclear, consider a consultation with a neurologist.
Treatment centers on alleviating motor symptoms
The general guiding principle of therapy (TABLE16,17) is to alleviate the motor symptoms (bradykinesia, rigidity, and postural instability) associated with the disease. Experts recommend that treatment commence when symptoms begin to have disabling effects or become a source of discomfort for the patient.1
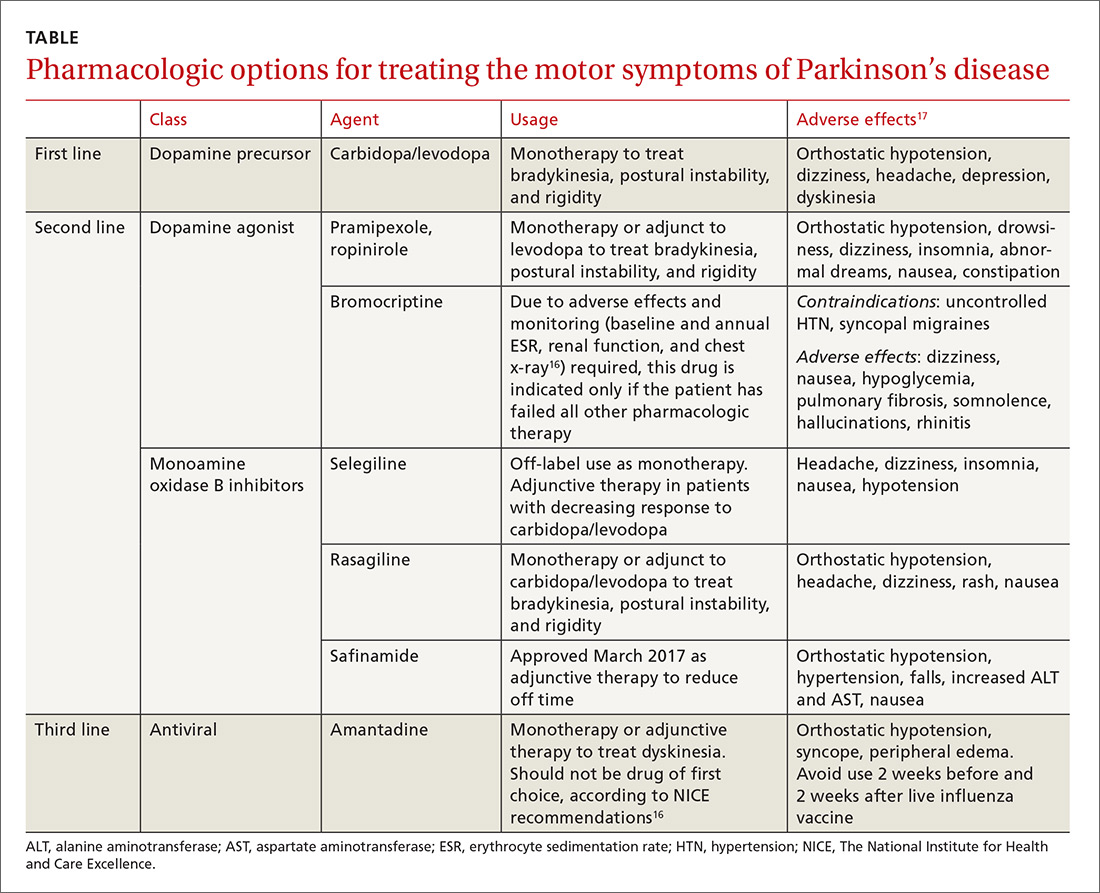
Carbidopa/levodopa is still often the first choice
Multiple systematic reviews support the use of carbidopa/levodopa as first-line treatment, with the dose kept as low as possible to maintain function, while minimizing motor fluctuations (also referred to as “off” time symptoms) and dyskinesia.11,16 Initial dosing is carbidopa 25 mg/levodopa 100 mg tid. Each can be titrated up to address symptoms to a maximum daily dosing of carbidopa 200 mg/levodopa 2000 mg.17
“Off” time—the return of Parkinson symptoms when the medication’s effect wanes—can become more unpredictable and more difficult to manage as the disease advances.11 Of note: The American Academy of Neurology (AAN) says there is no improvement in the amount of off time a patient experiences by changing to a sustained-release form of carbidopa/levodopa compared with an immediate-release version.11 In addition to the on-off phenomenon, common adverse effects associated with carbidopa/levodopa include nausea, somnolence, dizziness, and headaches. Less common adverse effects include orthostatic hypotension, confusion, and hallucinations.17
Other medications for the treatment of motor symptoms
Second-line agents include dopamine agonists (pramipexole, ropinirole, and bromocriptine) and monoamine oxidase type B (MAO-B) inhibitors (selegiline, rasagiline) (TABLE16,17). The dopamine agonists work by directly stimulating dopamine receptors, while the MAO-B inhibitors block dopamine metabolism, thus enhancing dopaminergic activity in the substantia nigra.
The pros/cons of these 2 classes. Research shows that both dopamine agonists and MAO-B inhibitors are less effective than carbidopa/levodopa at quelling the motor symptoms associated with PD. They can, however, delay the onset of motor complications when compared with carbidopa/levodopa.16
One randomized trial found no long-term benefits to beginning treatment with a levodopa-sparing therapy; however, few patients with earlier disease onset (<60 years of age) were included in the study.18 Given the typically longer duration of their illness, there is potential for this group of patients to develop a higher rate of motor symptoms secondary to carbidopa/levodopa. Thus, considering dopamine agonists and MAO-B inhibitors as initial therapy in patients ages <60 years may be helpful, since they typically will be taking medication longer.
Dopamine agonists. Pramipexole and ropinirole can be used as monotherapy or as an adjunct to levodopa to treat bradykinesia, postural instability, and rigidity. Bromocriptine, an ergot-derived dopamine agonist, is considered an agent of last resort because additional monitoring is required. Potential adverse effects mandate baseline testing and annual repeat testing, including measures of erythrocyte sedimentation rate and renal function and a chest x-ray.16 Consider this agent only if all second- and third-line therapies have provided inadequate control.16
Adverse effects. Dopamine agonists cause such adverse effects as orthostatic hypotension, drowsiness, dizziness, insomnia, abnormal dreams, nausea, constipation, and hallucinations. A Cochrane review notes that these adverse effects have led to higher drop-out rates than seen for carbidopa/levodopa in studies that compared the 2.19
Patients should be counseled about an additional adverse effect associated with dopamine agonists—the possible development of an impulse-control disorder, such as gambling, binge eating, or hypersexuality.1 If a patient develops any of these behaviors, promptly lower the dose of the dopamine agonist or stop the medication.16
The MAO-B inhibitors selegiline and rasagiline may also be considered for initial therapy but are more commonly used as adjunct therapy. Use of selegiline as monotherapy for PD is an off-label indication. Adverse effects for this class of agents include headache, dizziness, insomnia, nausea, and hypotension.
Add-on therapy to treat the adverse effects of primary therapy
Dopaminergic therapies come at the price of the development of off-time motor symptoms and dyskinesia.1,20 In general, these complications are managed by the addition of a dopamine agonist, MAO-B inhibitor, or a catechol-O-methyltransferase (COMT) inhibitor (entacapone).1
Rasagiline and entacapone are a good place to start and should be offered to patients to reduce off-time symptoms, according to the AAN (a Level A recommendation based on multiple high-level studies; see here for an explanation of Strength of Recommendation).
The newest medication, safinamide, has been shown to increase “on” time by one hour per day when compared with placebo; however, it has not yet been tested against existing therapies.21 Other medications that can be considered to reduce drug-induced motor complications include pergolide, pramipexole, ropinirole, and tolcapone.20 Carbidopa/levodopa and bromocriptine are not recommended for the treatment of dopaminergic motor complications.20 Both sustained-release carbidopa/levodopa and bromocriptine are no longer recommended to decrease off time due to ineffectiveness.20
The only medication that has evidence for reducing dyskinesias in patients with PD is amantadine;20 however, it has no effect on other motor symptoms and should not be considered first line.16 Additionally, as an antiviral agent active against some strains of influenza, it should not be taken 2 weeks before or after receiving the influenza vaccine.
When tremor dominates …
For many patients with PD, tremor is more difficult to treat than is bradykinesia, rigidity, and gait disturbance.16 For patients with tremor-predominant PD (characterized by prominent tremor of one or more limbs and a relative lack of significant rigidity and bradykinesia), first-line treatment choices are dopamine agonists (ropinirole, pramipexole), carbidopa/levodopa, and anticholinergic medications, including benztropine and trihexyphenidyl.22 Second-line choices include clozapine, amantadine, clonazepam, and propranolol.22
Treating nonmotor symptoms
Treatment of hypersalivation should start with an evaluation by a speech pathologist. If it doesn’t improve, then adjuvant treatment with glycopyrrolate may be considered.16 Carbidopa/levodopa has the best evidence for treating periodic limb movements of sleep,14 although dopamine agonists may also be considered.16 More research is needed to find an effective therapy to improve insomnia in patients with PD, but for now consider a nighttime dose of carbidopa/levodopa or melatonin.14
Treating cognitive disorders associated with PD
Depression. Treatment of depression in patients with PD is difficult. Multiple systematic reviews have been unable to find a difference in those treated with antidepressants and those not.23 In practice, the use of tricyclic antidepressants, selective serotonin reuptake inhibitors (SSRIs), and a combination of an SSRI and a norepinephrine reuptake inhibitor are commonly used. Additionally, some evidence suggests that pramipexole improves depressive symptoms, but additional research is needed.1
Dementia. Dementia occurs in up to 83% of those who have had PD for more than 20 years.1 Treatment includes the use of rivastigmine (a cholinesterase inhibitor).1 Further research is needed to determine whether donepezil improves dementia symptoms in patients with PD.1
Psychotic symptoms. Query patients and their families periodically about hallucinations and delusions.16 If such symptoms are present and not well tolerated by the patient and/or family, treatment options include quetiapine and clozapine.1 While clozapine is more effective, it requires frequent hematologic monitoring due to the risk of agranulocytosis.1 And quetiapine carries a black box warning about early death. Exercise caution when prescribing these medications, particularly if a patient is cognitively impaired, and always start with low doses.1
A newer medication, pimavanserin (a second-generation antipsychotic), was recently approved by the FDA to treat hallucinations and delusions of PD psychosis, although any improvement this agent provides may not be clinically significant.24 Unlike clozapine, no additional monitoring is needed and there are no significant safety concerns with the use of pimavanserin, which makes it a reasonable first choice for hallucinations and delusions. Other neuroleptic medications should not be used as they tend to worsen Parkinson symptoms.1
Consider tai chi, physical therapy to reduce falls
One study showed that tai chi, performed for an hour twice weekly, was significantly more effective at reducing falls when compared to the same amount of resistance training and strength training, and that the benefits remained 3 months after the completion of the 24-week study.25 To date, tai chi is the only intervention that has been shown to affect fall risk.
Guidelines recommend that physical therapy be available to all patients.16 A Cochrane review performed in 2013 determined that physical therapy improves walking endurance and balance but does not affect quality of life in terms of fear of falling.26
When meds no longer help, consider deep brain stimulation as a last resort
Deep brain stimulation consists of surgical implantation of a device to deliver electrical current to a targeted area of the brain. It can be considered for patients with PD who are no longer responsive to carbidopa/levodopa, not experiencing neuropsychiatric symptoms, and are experiencing significant motor complications despite optimal medical management.14 Referral to a specialist is recommended for these patients to assess their candidacy for this procedure.
Prognosis: Largely unchanged
While medications can improve quality of life and function, PD remains a chronic and progressive disorder that is associated with significant morbidity. A study performed in 2013 showed that older age at onset, cognitive dysfunction, and motor symptoms nonresponsive to levodopa were associated with faster progression toward disability.27
Keep an eye on patients’ bone mineral density (BMD), as patients with PD tend to have lower BMD,28 a 2-fold increase in the risk of fracture for both men and women,29 and a higher prevalence of vitamin D deficiency.30
Also, watch for signs of infection because the most commonly cited cause of death in those with PD is pneumonia rather than a complication of the disease itself.11
CORRESPONDENCE
Michael Mendoza, MD, MPH, MS, FAAFP, 777 South Clinton Avenue, Rochester, NY 14620; [email protected].
1. Kalia LV, Lang AE. Parkinson’s disease. Lancet. 2015;386:896-912.
2. Lees AJ, Hardy J, Revesz T. Parkinson’s disease. Lancet. 2009;373:2055-2066.
3. Todorova A, Jenner P, Chaudhuri K. Non-motor Parkinson’s: integral to motor Parkinson’s, yet often neglected. Pract Neurol. 2014;14:310-322.
4. Pringsheim T, Jette N, Frolkis A, et al. The prevalence of Parkinson’s disease: a systematic review and meta-analysis. Mov Disord. 2014;29:1583-1590.
5. Noyce AJ, Bestwick JP, Silveira-Moriyama L, et al. Meta-analysis of early nonmotor features and risk factors for Parkinson disease. Ann Neurol. 2012;72:893-901.
6. Dick FD, De Palma G, Ahmadi A, et al. Environmental risk factors for Parkinson’s disease and parkinsonism: the Geoparkinson study. Occup Environ Med. 2007;64:666-672.
7. Pakpoor J, Noyce A, Goldacre R, et al. Viral hepatitis and Parkinson disease: a national record-linkage study. Neurology. 2017;88:1630-1633.
8. Hern T, Newton W. Does coffee protect against the development of Parkinson disease (PD)? J Fam Pract. 2000;49:685-686.
9. Zhang SM, Hernán MA, Chen H, et al. Intakes of vitamins E and C, carotenoids, vitamin supplements, and PD risk. Neurology. 2002;59:1161-1169.
10. Rao G, Fisch L, Srinivasan S, et al. Does this patient have Parkinson disease? JAMA. 2003;289:347-353.
11. Suchowersky O, Reich S, Perlmutter J, et al. Practice Parameter: diagnosis and prognosis of new onset Parkinson disease (an evidence-based review): report of the Quality Standards Subcommittee of the American Academy of Neurology. Neurology. 2006;66:968-975.
12. Aarsland D, Brønnick K, Ehrt U, et al. Neuropsychiatric symptoms in patients with Parkinson’s disease and dementia: frequency, profile and associated care giver stress. J Neurol Neurosurg Psychiatry. 2007;78:36-42.
13. Inzelberg R, Kipervasser S, Korczyn AD. Auditory hallucinations in Parkinson’s disease. J Neurol Neurosurg Psychiatry. 1998;64:533-535.
14. Zesiewicz TA, Sullivan KL, Arnulf I, et al. Practice Parameter: treatment of nonmotor symptoms of Parkinson disease: report of the Quality Standards Subcommittee of the American Academy of Neurology. Neurology. 2010;74:924-931.
15. Rizzo G, Copetti M, Arcuti S, et al. Accuracy of clinical diagnosis of Parkinson disease: a systematic review and meta-analysis. Neurology. 2016;86:566-576.
16. National Institute for Heath and Care Excellence. Parkinson’s disease in adults. NICE guideline NG 71. 2017. Available at: https://www.nice.org.uk/guidance/ng71. Accessed March 27, 2018.
17. Lexicomp version 4.0.1. Wolters Kluwer; Copyright 2017. Available at: https://online.lexi.com/lco/action/home. Accessed March 27, 2018.
18. Lang AE, Marras C. Initiating dopaminergic treatment in Parkinson’s disease. Lancet. 2014;384:1164-1166.
19. Stowe RL, Ives NJ, Clarke C, et al. Dopamine agonist therapy in early Parkinson’s disease. Cochrane Database Syst Rev. 2008;CD006564.
20. Pahwa R, Factor SA, Lyons KE, et al. Practice Parameter: treatment of Parkinson disease with motor fluctuations and dyskinesia (an evidence-based review): report of the Quality Standards Subcommittee of the American Academy of Neurology. Neurology. 2006;66:983-995.
21. Schapira AH, Fox SH, Hauser RA, et al. Assessment of safety and efficacy of safinamide as a levodopa adjunct in patients with Parkinson disease and motor fluctuations: a randomized clinical trial. JAMA Neurol. 2017;74:216-224.
22. Marjama-Lyons J, Koller W. Tremor-predominant Parkinson’s disease. Approaches to treatment. Drugs Aging. 2000;16:273-278.
23. Price A, Rayner L, Okon-Rocha E, et al. Antidepressants for the treatment of depression in neurological disorders: a systematic review and meta-analysis of randomised controlled trials. J Neurol Neurosurg Psychiatry. 2011;82:914-923.
24. Cummings J, Isaacson S, Mills R, et al. Pimavanserin for patients with Parkinson’s disease psychosis: a randomized placebo-controlled phase 3 trial. Lancet. 2014;383:533-540.
25. Li F, Harmer P, Fitzgerald K, et al. Tai chi and postural stability in patients with Parkinson’s disease. N Engl J Med. 2012;366:511-519.
26. Tomlinson CL, Patel S, Meek C, et al. Physiotherapy versus placebo or no intervention in Parkinson’s disease. Cochrane Database Syst Rev. 2012;CD002817.
27. Velseboer DC, Broeders M, Post B, et al. Prognostic factors of motor impairment, disability, and quality of life in newly diagnosed PD. Neurology. 2013;80:627-633.
28. Cronin H, Casey MC, Inderhaugh J, et al. Osteoporosis in patients with Parkinson’s disease. J Am Geriatr Soc. 2006;54:1797-1798.
29. Tan L, Wang Y, Zhou L, et al. Parkinson’s disease and risk of fracture: a meta-analysis of prospective cohort studies. PLoS One. 2014;9:e94379.
30. Evatt ML, Delong MR, Khazai N, et al. Prevalence of vitamin D insufficiency in patients with Parkinson disease and Alzheimer disease. Arch Neurol. 2008;65:1348-1352.
Parkinson’s disease (PD) can be a tough diagnosis to navigate. Patients with this neurologic movement disorder can present with a highly variable constellation of symptoms,1 ranging from the well-known tremor and bradykinesia to difficulties with activities of daily living (particularly dressing and getting out of a car2) to nonspecific symptoms, such as pain, fatigue, hyposmia, and erectile dysfunction.3
Furthermore, medications more recently approved by the US Food and Drug Administration (FDA) have left many health care providers confused about what constitutes appropriate first-, second-, and third-line therapies, as well as add-on therapy for symptoms secondary to dopaminergic agents. What follows is a stepwise approach to managing PD that incorporates these newer therapies so that you can confidently and effectively manage patients with PD with little or no consultation.
First, though, we review who’s at greatest risk—and what you’ll see.
Family history tops list of risk factors for PD
While PD occurs in less than 1% of the population ≥40 years of age, its prevalence increases with age, becoming significantly higher by age 60 years, with a slight predominance toward males.4
A variety of factors increase the risk of developing PD. A well-conducted meta-analysis showed that the strongest risk factor is having a family member, particularly a first-degree relative, with a history of PD or tremor.5 Repeated head injury, with or without loss of consciousness, is also a factor;5 risk increases with each occurrence.6 Other risk factors include exposure to pesticides, rural living, and exposure to well water.5
Researchers have conducted several studies regarding the effects of elevated cholesterol and hypertension on the risk of PD, but results are still without consensus.5 A study published in 2017 reported a significantly increased risk of PD associated with having hepatitis B or C, but the mechanism for the association—including whether it is a consequence of treatment—is unknown.7
Smoking and coffee drinking. Researchers have found that cigarette smoking, beer consumption, and high coffee intake are protective against PD,5 but the benefits are outweighed by the risks associated with these strategies.8 The most practical protective factors are a high dietary intake of vitamin E and increased nut consumption.9 Dietary vitamin E can be found in almonds, spinach, sweet potatoes, sunflower seeds, and avocados. Studies have not found the same benefit with vitamin E supplements.9
Dx seldom requires testing, but may take time to come into focus
Motor symptoms. The key diagnostic criterium for PD is bradykinesia with at least one of the following: muscular rigidity, resting tremor (particularly a pill-rolling tremor) that improves with purposeful function, or postural instability.2 Other physical findings may include masking of facies and speech changes, such as becoming quiet, stuttering, or speaking monotonously without inflection.1 Cogwheeling, stooped posture, and a shuffling gait or difficulty initiating gait (freezing) are all neurologic signs that point toward a PD diagnosis.2
A systematic review found that the clinical features most strongly associated with a diagnosis of PD were trouble turning in bed, a shuffling gait, tremor, difficulty opening jars, micrographia, and loss of balance.10 Typically these symptoms are asymmetric.1
Symptoms that point to other causes. Falling within the first year of symptoms is strongly associated with movement disorders other than PD—notably progressive supranuclear palsy.11 Other symptoms that point toward an alternate diagnosis include a poor response to levodopa, symmetry at the onset of symptoms, rapid progression of disease, and the absence of a tremor.11 It is important to ensure that the patient is not experiencing drug-induced symptoms as can occur with some antipsychotics and antiemetics.
Nonmotor symptoms. Neuropsychiatric symptoms are common in patients with PD. Up to 58% of patients experience depression, and 49% complain of anxiety.12 Hallucinations are present in many patients and are more commonly visual than auditory in nature.13 Patients experience fatigue, daytime sleepiness, and inner restlessness at higher rates than do age-matched controls.3 Research also shows that symptoms such as constipation, mood disorders, erectile dysfunction, and hyposmia may predate the onset of motor symptoms.5
Insomnia is a common symptom that is likely multifactorial in etiology. Causes to consider include motor disturbance, nocturia, reversal of sleep patterns, and reemergence of PD symptoms after a period of quiescence.14 Additionally, hypersalivation and PD dementia can develop as complications of PD.
A clinical diagnosis. Although PD can be difficult to diagnose in the early stages, the diagnosis seldom requires testing.2 A recent systematic review concluded that a clinical diagnosis of PD, when compared with pathology, was correct 74% of the time when the diagnosis was made by nonexperts and correct 84% of the time when the diagnosis was made by movement disorder experts.15
Imaging. Computed tomography and magnetic resonance imaging can be useful in ruling out other diagnoses in the differential, including vascular disease and normal pressure hydrocephalus,2 but will not reveal findings suggestive of PD.
Other diagnostic tests. A levodopa challenge can confirm PD if the diagnosis is unclear.11 In addition, an olfactory test (presenting various odors to the patient for identification) can differentiate PD from progressive supranuclear palsy and corticobasal degeneration; however, it will not distinguish PD from multiple system atrophy.11 If the diagnosis remains unclear, consider a consultation with a neurologist.
Treatment centers on alleviating motor symptoms
The general guiding principle of therapy (TABLE16,17) is to alleviate the motor symptoms (bradykinesia, rigidity, and postural instability) associated with the disease. Experts recommend that treatment commence when symptoms begin to have disabling effects or become a source of discomfort for the patient.1
Carbidopa/levodopa is still often the first choice
Multiple systematic reviews support the use of carbidopa/levodopa as first-line treatment, with the dose kept as low as possible to maintain function, while minimizing motor fluctuations (also referred to as “off” time symptoms) and dyskinesia.11,16 Initial dosing is carbidopa 25 mg/levodopa 100 mg tid. Each can be titrated up to address symptoms to a maximum daily dosing of carbidopa 200 mg/levodopa 2000 mg.17
“Off” time—the return of Parkinson symptoms when the medication’s effect wanes—can become more unpredictable and more difficult to manage as the disease advances.11 Of note: The American Academy of Neurology (AAN) says there is no improvement in the amount of off time a patient experiences by changing to a sustained-release form of carbidopa/levodopa compared with an immediate-release version.11 In addition to the on-off phenomenon, common adverse effects associated with carbidopa/levodopa include nausea, somnolence, dizziness, and headaches. Less common adverse effects include orthostatic hypotension, confusion, and hallucinations.17
Other medications for the treatment of motor symptoms
Second-line agents include dopamine agonists (pramipexole, ropinirole, and bromocriptine) and monoamine oxidase type B (MAO-B) inhibitors (selegiline, rasagiline) (TABLE16,17). The dopamine agonists work by directly stimulating dopamine receptors, while the MAO-B inhibitors block dopamine metabolism, thus enhancing dopaminergic activity in the substantia nigra.
The pros/cons of these 2 classes. Research shows that both dopamine agonists and MAO-B inhibitors are less effective than carbidopa/levodopa at quelling the motor symptoms associated with PD. They can, however, delay the onset of motor complications when compared with carbidopa/levodopa.16
One randomized trial found no long-term benefits to beginning treatment with a levodopa-sparing therapy; however, few patients with earlier disease onset (<60 years of age) were included in the study.18 Given the typically longer duration of their illness, there is potential for this group of patients to develop a higher rate of motor symptoms secondary to carbidopa/levodopa. Thus, considering dopamine agonists and MAO-B inhibitors as initial therapy in patients ages <60 years may be helpful, since they typically will be taking medication longer.
Dopamine agonists. Pramipexole and ropinirole can be used as monotherapy or as an adjunct to levodopa to treat bradykinesia, postural instability, and rigidity. Bromocriptine, an ergot-derived dopamine agonist, is considered an agent of last resort because additional monitoring is required. Potential adverse effects mandate baseline testing and annual repeat testing, including measures of erythrocyte sedimentation rate and renal function and a chest x-ray.16 Consider this agent only if all second- and third-line therapies have provided inadequate control.16
Adverse effects. Dopamine agonists cause such adverse effects as orthostatic hypotension, drowsiness, dizziness, insomnia, abnormal dreams, nausea, constipation, and hallucinations. A Cochrane review notes that these adverse effects have led to higher drop-out rates than seen for carbidopa/levodopa in studies that compared the 2.19
Patients should be counseled about an additional adverse effect associated with dopamine agonists—the possible development of an impulse-control disorder, such as gambling, binge eating, or hypersexuality.1 If a patient develops any of these behaviors, promptly lower the dose of the dopamine agonist or stop the medication.16
The MAO-B inhibitors selegiline and rasagiline may also be considered for initial therapy but are more commonly used as adjunct therapy. Use of selegiline as monotherapy for PD is an off-label indication. Adverse effects for this class of agents include headache, dizziness, insomnia, nausea, and hypotension.
Add-on therapy to treat the adverse effects of primary therapy
Dopaminergic therapies come at the price of the development of off-time motor symptoms and dyskinesia.1,20 In general, these complications are managed by the addition of a dopamine agonist, MAO-B inhibitor, or a catechol-O-methyltransferase (COMT) inhibitor (entacapone).1
Rasagiline and entacapone are a good place to start and should be offered to patients to reduce off-time symptoms, according to the AAN (a Level A recommendation based on multiple high-level studies; see here for an explanation of Strength of Recommendation).
The newest medication, safinamide, has been shown to increase “on” time by one hour per day when compared with placebo; however, it has not yet been tested against existing therapies.21 Other medications that can be considered to reduce drug-induced motor complications include pergolide, pramipexole, ropinirole, and tolcapone.20 Carbidopa/levodopa and bromocriptine are not recommended for the treatment of dopaminergic motor complications.20 Both sustained-release carbidopa/levodopa and bromocriptine are no longer recommended to decrease off time due to ineffectiveness.20
The only medication that has evidence for reducing dyskinesias in patients with PD is amantadine;20 however, it has no effect on other motor symptoms and should not be considered first line.16 Additionally, as an antiviral agent active against some strains of influenza, it should not be taken 2 weeks before or after receiving the influenza vaccine.
When tremor dominates …
For many patients with PD, tremor is more difficult to treat than is bradykinesia, rigidity, and gait disturbance.16 For patients with tremor-predominant PD (characterized by prominent tremor of one or more limbs and a relative lack of significant rigidity and bradykinesia), first-line treatment choices are dopamine agonists (ropinirole, pramipexole), carbidopa/levodopa, and anticholinergic medications, including benztropine and trihexyphenidyl.22 Second-line choices include clozapine, amantadine, clonazepam, and propranolol.22
Treating nonmotor symptoms
Treatment of hypersalivation should start with an evaluation by a speech pathologist. If it doesn’t improve, then adjuvant treatment with glycopyrrolate may be considered.16 Carbidopa/levodopa has the best evidence for treating periodic limb movements of sleep,14 although dopamine agonists may also be considered.16 More research is needed to find an effective therapy to improve insomnia in patients with PD, but for now consider a nighttime dose of carbidopa/levodopa or melatonin.14
Treating cognitive disorders associated with PD
Depression. Treatment of depression in patients with PD is difficult. Multiple systematic reviews have been unable to find a difference in those treated with antidepressants and those not.23 In practice, the use of tricyclic antidepressants, selective serotonin reuptake inhibitors (SSRIs), and a combination of an SSRI and a norepinephrine reuptake inhibitor are commonly used. Additionally, some evidence suggests that pramipexole improves depressive symptoms, but additional research is needed.1
Dementia. Dementia occurs in up to 83% of those who have had PD for more than 20 years.1 Treatment includes the use of rivastigmine (a cholinesterase inhibitor).1 Further research is needed to determine whether donepezil improves dementia symptoms in patients with PD.1
Psychotic symptoms. Query patients and their families periodically about hallucinations and delusions.16 If such symptoms are present and not well tolerated by the patient and/or family, treatment options include quetiapine and clozapine.1 While clozapine is more effective, it requires frequent hematologic monitoring due to the risk of agranulocytosis.1 And quetiapine carries a black box warning about early death. Exercise caution when prescribing these medications, particularly if a patient is cognitively impaired, and always start with low doses.1
A newer medication, pimavanserin (a second-generation antipsychotic), was recently approved by the FDA to treat hallucinations and delusions of PD psychosis, although any improvement this agent provides may not be clinically significant.24 Unlike clozapine, no additional monitoring is needed and there are no significant safety concerns with the use of pimavanserin, which makes it a reasonable first choice for hallucinations and delusions. Other neuroleptic medications should not be used as they tend to worsen Parkinson symptoms.1
Consider tai chi, physical therapy to reduce falls
One study showed that tai chi, performed for an hour twice weekly, was significantly more effective at reducing falls when compared to the same amount of resistance training and strength training, and that the benefits remained 3 months after the completion of the 24-week study.25 To date, tai chi is the only intervention that has been shown to affect fall risk.
Guidelines recommend that physical therapy be available to all patients.16 A Cochrane review performed in 2013 determined that physical therapy improves walking endurance and balance but does not affect quality of life in terms of fear of falling.26
When meds no longer help, consider deep brain stimulation as a last resort
Deep brain stimulation consists of surgical implantation of a device to deliver electrical current to a targeted area of the brain. It can be considered for patients with PD who are no longer responsive to carbidopa/levodopa, not experiencing neuropsychiatric symptoms, and are experiencing significant motor complications despite optimal medical management.14 Referral to a specialist is recommended for these patients to assess their candidacy for this procedure.
Prognosis: Largely unchanged
While medications can improve quality of life and function, PD remains a chronic and progressive disorder that is associated with significant morbidity. A study performed in 2013 showed that older age at onset, cognitive dysfunction, and motor symptoms nonresponsive to levodopa were associated with faster progression toward disability.27
Keep an eye on patients’ bone mineral density (BMD), as patients with PD tend to have lower BMD,28 a 2-fold increase in the risk of fracture for both men and women,29 and a higher prevalence of vitamin D deficiency.30
Also, watch for signs of infection because the most commonly cited cause of death in those with PD is pneumonia rather than a complication of the disease itself.11
CORRESPONDENCE
Michael Mendoza, MD, MPH, MS, FAAFP, 777 South Clinton Avenue, Rochester, NY 14620; [email protected].
1. Kalia LV, Lang AE. Parkinson’s disease. Lancet. 2015;386:896-912.
2. Lees AJ, Hardy J, Revesz T. Parkinson’s disease. Lancet. 2009;373:2055-2066.
3. Todorova A, Jenner P, Chaudhuri K. Non-motor Parkinson’s: integral to motor Parkinson’s, yet often neglected. Pract Neurol. 2014;14:310-322.
4. Pringsheim T, Jette N, Frolkis A, et al. The prevalence of Parkinson’s disease: a systematic review and meta-analysis. Mov Disord. 2014;29:1583-1590.
5. Noyce AJ, Bestwick JP, Silveira-Moriyama L, et al. Meta-analysis of early nonmotor features and risk factors for Parkinson disease. Ann Neurol. 2012;72:893-901.
6. Dick FD, De Palma G, Ahmadi A, et al. Environmental risk factors for Parkinson’s disease and parkinsonism: the Geoparkinson study. Occup Environ Med. 2007;64:666-672.
7. Pakpoor J, Noyce A, Goldacre R, et al. Viral hepatitis and Parkinson disease: a national record-linkage study. Neurology. 2017;88:1630-1633.
8. Hern T, Newton W. Does coffee protect against the development of Parkinson disease (PD)? J Fam Pract. 2000;49:685-686.
9. Zhang SM, Hernán MA, Chen H, et al. Intakes of vitamins E and C, carotenoids, vitamin supplements, and PD risk. Neurology. 2002;59:1161-1169.
10. Rao G, Fisch L, Srinivasan S, et al. Does this patient have Parkinson disease? JAMA. 2003;289:347-353.
11. Suchowersky O, Reich S, Perlmutter J, et al. Practice Parameter: diagnosis and prognosis of new onset Parkinson disease (an evidence-based review): report of the Quality Standards Subcommittee of the American Academy of Neurology. Neurology. 2006;66:968-975.
12. Aarsland D, Brønnick K, Ehrt U, et al. Neuropsychiatric symptoms in patients with Parkinson’s disease and dementia: frequency, profile and associated care giver stress. J Neurol Neurosurg Psychiatry. 2007;78:36-42.
13. Inzelberg R, Kipervasser S, Korczyn AD. Auditory hallucinations in Parkinson’s disease. J Neurol Neurosurg Psychiatry. 1998;64:533-535.
14. Zesiewicz TA, Sullivan KL, Arnulf I, et al. Practice Parameter: treatment of nonmotor symptoms of Parkinson disease: report of the Quality Standards Subcommittee of the American Academy of Neurology. Neurology. 2010;74:924-931.
15. Rizzo G, Copetti M, Arcuti S, et al. Accuracy of clinical diagnosis of Parkinson disease: a systematic review and meta-analysis. Neurology. 2016;86:566-576.
16. National Institute for Heath and Care Excellence. Parkinson’s disease in adults. NICE guideline NG 71. 2017. Available at: https://www.nice.org.uk/guidance/ng71. Accessed March 27, 2018.
17. Lexicomp version 4.0.1. Wolters Kluwer; Copyright 2017. Available at: https://online.lexi.com/lco/action/home. Accessed March 27, 2018.
18. Lang AE, Marras C. Initiating dopaminergic treatment in Parkinson’s disease. Lancet. 2014;384:1164-1166.
19. Stowe RL, Ives NJ, Clarke C, et al. Dopamine agonist therapy in early Parkinson’s disease. Cochrane Database Syst Rev. 2008;CD006564.
20. Pahwa R, Factor SA, Lyons KE, et al. Practice Parameter: treatment of Parkinson disease with motor fluctuations and dyskinesia (an evidence-based review): report of the Quality Standards Subcommittee of the American Academy of Neurology. Neurology. 2006;66:983-995.
21. Schapira AH, Fox SH, Hauser RA, et al. Assessment of safety and efficacy of safinamide as a levodopa adjunct in patients with Parkinson disease and motor fluctuations: a randomized clinical trial. JAMA Neurol. 2017;74:216-224.
22. Marjama-Lyons J, Koller W. Tremor-predominant Parkinson’s disease. Approaches to treatment. Drugs Aging. 2000;16:273-278.
23. Price A, Rayner L, Okon-Rocha E, et al. Antidepressants for the treatment of depression in neurological disorders: a systematic review and meta-analysis of randomised controlled trials. J Neurol Neurosurg Psychiatry. 2011;82:914-923.
24. Cummings J, Isaacson S, Mills R, et al. Pimavanserin for patients with Parkinson’s disease psychosis: a randomized placebo-controlled phase 3 trial. Lancet. 2014;383:533-540.
25. Li F, Harmer P, Fitzgerald K, et al. Tai chi and postural stability in patients with Parkinson’s disease. N Engl J Med. 2012;366:511-519.
26. Tomlinson CL, Patel S, Meek C, et al. Physiotherapy versus placebo or no intervention in Parkinson’s disease. Cochrane Database Syst Rev. 2012;CD002817.
27. Velseboer DC, Broeders M, Post B, et al. Prognostic factors of motor impairment, disability, and quality of life in newly diagnosed PD. Neurology. 2013;80:627-633.
28. Cronin H, Casey MC, Inderhaugh J, et al. Osteoporosis in patients with Parkinson’s disease. J Am Geriatr Soc. 2006;54:1797-1798.
29. Tan L, Wang Y, Zhou L, et al. Parkinson’s disease and risk of fracture: a meta-analysis of prospective cohort studies. PLoS One. 2014;9:e94379.
30. Evatt ML, Delong MR, Khazai N, et al. Prevalence of vitamin D insufficiency in patients with Parkinson disease and Alzheimer disease. Arch Neurol. 2008;65:1348-1352.
From The Journal of Family Practice | 2018;67(5):276-279,284-286.
PRACTICE RECOMMENDATIONS
› Use carbidopa/levodopa as first-line treatment for most patients with Parkinson's disease. A
› Prescribe rasagiline or entacapone for the treatment of motor fluctuations secondary to dopaminergic therapies. A
Strength of recommendation (SOR)
A Good-quality patient-oriented evidence
B Inconsistent or limited-quality patient-oriented evidence
C Consensus, usual practice, opinion, disease-oriented evidence, case series

Fostamatinib produces responses in ITP

Fostamatinib has produced “clinically meaningful” responses in adults with persistent or chronic immune thrombocytopenia (ITP), according to researchers.
In a pair of phase 3 trials, 18% of patients who received fostamatinib had a stable response, which was defined as having a platelet count of at least 50,000/µL for at least 4 of 6 clinic visits.
In comparison, 2% of patients who received placebo achieved a stable response.
The most common adverse events (AEs) in these trials were diarrhea, hypertension, and nausea. Most AEs were deemed mild or moderate.
These results were published in the American Journal of Hematology. The trials—known as FIT1 and FIT2—were sponsored by Rigel Pharmaceuticals, Inc., the company marketing fostamatinib.
Fostamatinib is an oral Syk inhibitor that was recently approved by the US Food and Drug Administration.
Patients and treatment
Researchers evaluated fostamatinib in the parallel FIT1 and FIT2 trials, which included 150 patients with persistent or chronic ITP who had an insufficient response to previous treatment.
In each study, patients were randomized 2:1 to receive fostamatinib or placebo for 24 weeks. In FIT1, 76 patients were randomized—51 to fostamatinib and 25 to placebo. In FIT2, 74 patients were randomized—50 to fostamatinib and 24 to placebo.
All patients initially received fostamatinib at 100 mg twice daily. Most (88%) were escalated to 150 mg twice daily at week 4 or later. Patients could also receive stable concurrent ITP therapy—glucocorticoids (< 20 mg prednisone equivalent per day), azathioprine, or danazol—and rescue therapy if needed.
The median age was 54 (range, 20-88) in the fostamatinib recipients and 53 (range, 20-78) in the placebo recipients. Sixty-one percent and 60%, respectively, were female. And 93% and 92%, respectively, were white.
The median duration of ITP was 8.7 years for fostamatinib recipients and 7.8 years for placebo recipients. Both fostamatinib and placebo recipients had a median of 3 prior unique treatments for ITP (range, 1-13 and 1-10, respectively).
Prior ITP treatments (in the fostamatinib and placebo arms, respectively) included corticosteroids (93% vs 96%), immunoglobulins (51% vs 55%), thrombopoietin receptor agonists (47% vs 51%), immunosuppressants (44% vs 45%), splenectomy (34% vs 39%), and rituximab (34% vs 29%), among other treatments.
Overall, the patients’ median platelet count at baseline was 16,000/µL. Mean baseline platelet counts were 16,052/µL (range, 1000-51,000) in fostamatinib recipients and 19,818/µL (range, 1000-156,000) in placebo recipients.
Response
The efficacy of fostamatinib was based on stable platelet response, defined as a platelet count of at least 50,000/µL on at least 4 of 6 biweekly clinic visits between weeks 14 and 24, without the use of rescue therapy.
Overall, 18% (18/101) of patients on fostamatinib and 2% (1/49) of those on placebo achieved this endpoint (P=0.0003).
In FIT1, 18% of patients in the fostamatinib arm and 0% of those in the placebo arm achieved a stable platelet response (P=0.026). In FIT2, rates of stable response were 18% and 4%, respectively (P=0.152).
A secondary endpoint was overall response, which was defined retrospectively as at least 1 platelet count ≥ 50,000/μL within the first 12 weeks on treatment.
Forty-three percent (43/101) of fostamatinib recipients achieved an overall response, as did 14% (7/49) of patients on placebo (P=0.0006).
In FIT1, the rate of overall response was 37% in the fostamatinib arm and 8% in the placebo arm (P=0.007). In FIT2, overall response rates were 48% and 21%, respectively (P=0.025).
The researchers said they observed responses to fostamatinib across all patient subgroups, regardless of age, sex, prior therapy, baseline platelet count, or duration of ITP at study entry.
Role of concomitant therapy
The researchers noted that 2 of the 18 patients with a stable platelet response were on concomitant treatment. Both were on steroids, one of them for 62 days before the first dose of fostamatinib and the other for 14 years.
Four of the 43 patients with an overall platelet response were on concomitant therapy. Three were on steroids—for 62 days, 67 days, and 14 years prior to first dose of fostamatinib—and 1 was on azathioprine—for 197 days prior to the first dose of fostamatinib.
The researchers said the effects of these therapies probably would have been evident prior to study entry, so they aren’t likely to have influenced the results.
Safety
In both trials, the rate of AEs was 83% in the fostamatinib recipients (32% mild, 35% moderate, and 16% severe AEs) and 75% in the placebo recipients (42% mild, 19% moderate, and 15% severe AEs.).
AEs occurring in at least 5% of patients (in the fostamatinib and placebo arms, respectively) included diarrhea (31% vs 15%), hypertension (28% vs 13%), nausea (19% vs 8%), dizziness (11% vs 8%), ALT increase (11% vs 0%), AST increase (9% vs 0%), respiratory infection (11% vs 6%), rash (9% vs 2%), abdominal pain (6% vs 2%), fatigue (6% vs 2%), chest pain (6% vs 2%), and neutropenia (6% vs 0%).
Moderate or severe bleeding-related AEs occurred in 9% of patients who had an overall response to fostamatinib and 16% of patients on placebo.
Serious AEs considered related to study drug occurred in 4 patients on fostamatinib and 1 patient on placebo. The placebo recipient experienced a bleeding event, and the fostamatinib-related events were consistent with the AE profile of the drug (hypertension, diarrhea, etc.), according to Rigel Pharmaceuticals.
There were 2 deaths. One placebo recipient died of probable sepsis 19 days after withdrawing from the study due to epistaxis. One fostamatinib recipient developed plasma cell myeloma, stopped treatment on day 19, and died 71 days later.
Chief complaint: Homicidal. Assessing violence risk
Mr. F, age 35, is homeless and has a history of cocaine and alcohol use disorders. He is admitted voluntarily to the psychiatric unit because he has homicidal thoughts toward Ms. S, who works in the shelter where he has been staying. Mr. F reports that he is thinking of killing Ms. S if he is discharged because she has been rude to him. He states that he has access to several firearms, but he will not disclose the location. He has been diagnosed with unspecified depressive disorder and exhibited antisocial personality disorder traits. He is being treated with sertraline. However, his mood appears to be relatively stable, except for occasional angry verbal outbursts. The outbursts have been related to intrusive peers or staff turning the television off for group meetings. Mr. F has been joking with peers, eating well, and sleeping appropriately. He reports no suicidal thoughts and has not been physically violent on the unit. However, Mr. F has had a history of violence since his teenage years. He has been incarcerated twice for assault and once for drug possession.
How would you approach assessing and managing Mr. F’s risk for violence?
We all have encountered a patient similar to Mr. F on the psychiatric unit or in the emergency department—a patient who makes violent threats and appears angry, intimidating, manipulative, and/or demanding, despite exhibiting no evidence of mania or psychosis. This patient often has a history of substance abuse and a lifelong pattern of viewing violence as an acceptable way of addressing life’s problems. Many psychiatrists suspect that more time on the inpatient unit is unlikely to reduce this patient’s risk of violence. Why? Because the violence risk does not stem from a treatable mental illness. Further, psychiatrists may be apprehensive about this patient’s potential for violence after discharge and their liability in the event of a bad outcome. No one wants their name associated with a headline that reads “Psychiatrist discharged man less than 24 hours before he killed 3 people.”
The purported relationship between mental illness and violence often is sensationalized in the media. However, research reveals that the vast majority of violence is in fact not due to symptoms of mental illness.1,2 A common clinical challenge in psychiatry involves evaluating individuals at elevated risk of violence and determining how to address their risk factors for violence. When the risk is primarily due to psychosis and can be reduced with antipsychotic medication, the job is easy. But how should we proceed when the risk stems from factors other than mental illness?
This article
Violence and mental illness: A tenuous link
Violence is a major public health concern in the United States. Although in recent years the rates of homicide and aggravated assault have decreased dramatically, there are approximately 16,000 homicides annually in the United States, and more than 1.6 million injuries from assaults treated in emergency departments each year.3 Homicide continues to be one of the leading causes of death among teenagers and young adults.4
The most effective methods of preventing widespread violence are public health approaches, such as parent- and family-focused programs, early childhood education, programs in school, and public policy changes.3 However, as psychiatrists, we are routinely asked to assess the risk of violence for an individual patient and devise strategies to mitigate violence risk.
Continue to: Although certain mental illnesses...
Although certain mental illnesses increase the relative risk of violence (compared with people without mental illness),5,6 recent studies suggest that mental illness plays only a “minor role in explaining violence in populations.”7 It is estimated that as little as 4% of the violence in the United States can be attributed to mental illness.1 According to a 1998 meta-analysis of 48 studies of criminal recidivism, the risk factors for violent recidivism were “almost identical” among offenders who had a mental disorder and those who did not.8
Approaches to assessing violence risk
Psychiatrists can assess the risk of future violence via 3 broad approaches.9,10
Unaided clinical judgment is when a mental health professional estimates violence risk based on his or her own experience and intuition, with knowledge of violence risk factors, but without the use of structured tools.
Actuarial tools are statistical models that use formulae to show relationships between data (risk factors) and outcomes (violence).10,11
Continue to: Structured professional judgment
Structured professional judgment is a hybrid of unaided clinical judgment and actuarial methods. Structured professional judgment tools help the evaluator identify empirically established risk factors. Once the information is collected, it is combined with clinical judgment in decision making.9,10 There are now more than 200 structured tools available for assessing violence risk in criminal justice and forensic mental health populations.12
Clinical judgment, although commonly used in practice, is less accurate than actuarial tools or structured professional judgment.10,11 In general, risk assessment tools offer moderate levels of accuracy in categorizing people at low risk vs high risk.5,13 The tools have better ability to accurately categorize individuals at low risk, compared with high risk, where false positives are common.12,14
Two types of risk factors
Risk factors for violence are commonly categorized as static or dynamic factors. Static factors are historical factors that cannot be changed with intervention (eg, age, sex, history of abuse). Dynamic factors can be changed with intervention (eg, substance abuse).15
Static risk factors. The best predictor of future violence is past violent behavior.5,16,17 Violence risk increases with each prior episode of violence.5 Prior arrests for any crime, especially if the individual was a juvenile at the time of arrest for his or her first violent offense, increase future violence risk.5 Other important static violence risk factors include demographic factors such as age, sex, and socioeconomic status. Swanson et al6 reviewed a large pool of data (approximately 10,000 respondents) from the Epidemiologic Catchment Area survey. Being young, male, and of low socioeconomic status were all associated with violence in the community.6 The highest-risk age group for violence is age 15 to 24.5 Males perpetrate violence in the community at a rate 10 times that of females.18 However, among individuals with severe mental illness, men and women have similar rates of violence.19,20 Unstable employment,21 less education,22 low intelligence,16 and a history of a significant head injury5 also are risk factors for violence.5
Continue to: Being abused as a child...
Being abused as a child, witnessing violence in the home,5,16 and growing up with an unstable parental situation (eg, parental loss or separation) has been linked to violence.16,23,24 Early disruptive behavior in childhood (eg, fighting, lying and stealing, truancy, and school problems) increases violence risk.21,23
Personality factors are important static risk factors for violence. Antisocial personality disorder is the most common personality disorder linked with violence.17 Several studies consistently show psychopathy to be a strong predictor of both violence and criminal behavior.5,25 A psychopath is a person who lacks empathy and close relationships, behaves impulsively, has superficially charming qualities, and is primarily interested in self-gratification.26 Harris et al27 studied 169 released forensic patients and found that 77% of the psychopaths (according to Psychopathy Checklist-Revised [PCL-R] scores) violently recidivated. In contrast, only 21% of the non-psychopaths violently recidivated.27
Other personality factors associated with violence include a predisposition toward feelings of anger and hatred (as opposed to empathy, anxiety, or guilt, which may reduce risk), hostile attributional biases (a tendency to interpret benign behavior of others as intentionally antagonistic), violent fantasies, poor anger control, and impulsivity.5 Although personality factors tend to be longstanding and more difficult to modify, in the outpatient setting, therapeutic efforts can be made to modify hostile attribution biases, poor anger control, and impulsive behavior.
Dynamic risk factors. Substance abuse is strongly associated with violence.6,17 The prevalence of violence is 12 times greater among individuals with alcohol use disorder and 16 times greater among individuals with other substance use disorders, compared with those with no such diagnoses.5,6
Continue to: Steadman et al...
Steadman et al28 compared 1,136 adult patients with mental disorders discharged from psychiatric hospitals with 519 individuals living in the same neighborhoods as the hospitalized patients. They found that the prevalence of violence among discharged patients without substance abuse was “statistically indistinguishable” from the prevalence of violence among community members, in the same neighborhood, who did not have symptoms of substance abuse.28 Swanson et al6 found that the combination of a mental disorder plus an alcohol or substance use disorder substantially increased the risk of violence.
Other dynamic risk factors for violence include mental illness symptoms such as psychosis, especially threat/control-override delusions, where the individual believes that they are being threatened or controlled by an external force.17
Contextual factors to consider in violence risk assessments include current stressors, lack of social support, availability of weapons, access to drugs and alcohol, and the presence of similar circumstances that led to violent behavior in the past.5
How to assess the risk of targeted violence
Targeted violence is a predatory act of violence intentionally committed against a preselected person, group of people, or place.29 Due to the low base rates of these incidents, targeted violence is difficult to study.7,30 These risk assessments require a more specialized approach.
Continue to: In their 1999 article...
In their 1999 article, Borum et al30 discussed threat assessment strategies utilized by the U.S. Secret Service and recommended investigating “pathways of ideas and behaviors that may lead to violent action.” Borum et al30 summarized 3 fundamental principles of threat assessment (Table 130).
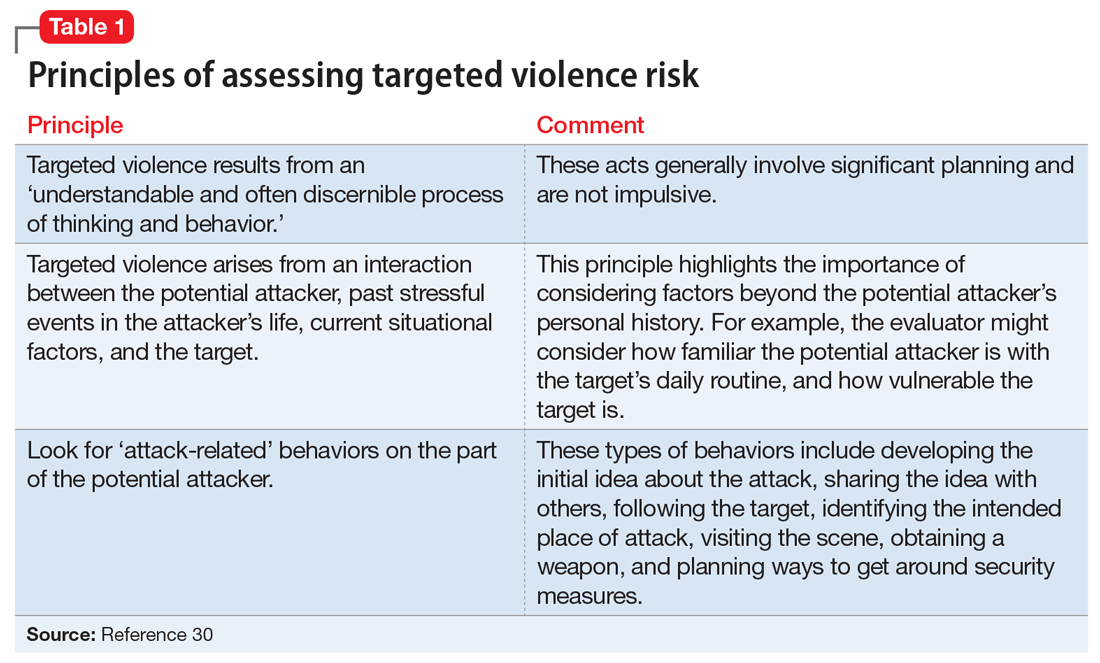
What to do when violence risk is not due to mental illness
Based on the information in Mr. F’s case scenario, it is likely that his homicidal ideation is not due to mental illness. Despite this, several risk factors for violence are present. Where do we go from here?
Scott and Resnick17 recommend considering the concept of dangerousness as 5 components (Table 217). When this model of dangerousness is applied to Mr. F’s case, one can see that the magnitude of the harm is great because of threatened homicide. With regard to the imminence of the harm, it would help to clarify whether Mr. F plans to kill Ms. S immediately after discharge, or sometime in the next few months. Is his threat contingent on further provocations by Ms. S? Alternatively, does he intend to kill her for past grievances, regardless of further perceived insults?
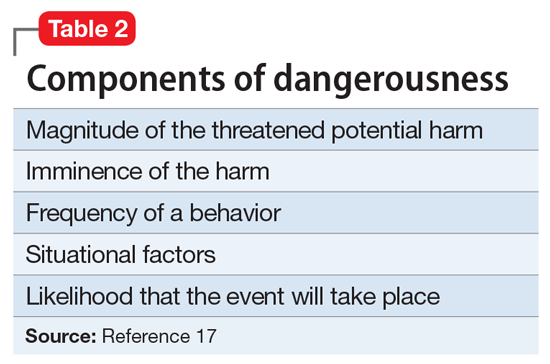
Next, the frequency of a behavior relates to how often Mr. F has been aggressive in the past. The severity of his past aggression is also important. What is the most violent act he has ever done? Situational factors in this case include Mr. F’s access to weapons, financial problems, housing problems, and access to drugs and alcohol.17 Mr. F should be asked about what situations previously provoked his violent behavior. Consider how similar the present conditions are to past conditions to which Mr. F responded violently.5 The likelihood that a homicide will occur should take into account Mr. F’s risk factors for violence, as well as the seriousness of his intent to cause harm.
Continue to: Consider using a structured tool...
Consider using a structured tool, such as the Classification of Violence Risk, to help identify Mr. F’s risk factors for violence, or some other formal method to ensure that the proper data are collected. Violence risk assessments are more accurate when structured risk assessment tools are used, compared with clinical judgment alone.
It is important to review collateral sources of information. In Mr. F’s case, useful collateral sources may include his criminal docket (usually available online), past medical records, information from the shelter where he lives, and, potentially, friends or family.
Because Mr. F is making threats of targeted violence, be sure to ask about attack-related behaviors (Table 130).
Regarding the seriousness of Mr. F’s intent to cause harm, it may be helpful to ask him the following questions:
- How likely are you to carry out this act of violence?
- Do you have a plan? Have you taken any steps toward this plan?
- Do you see other, nonviolent solutions to this problem?
- What do you hope that we can do for you to help with this problem?
Continue to: Mr. F's answers...
Mr. F’s answers may suggest the possibility of a hidden agenda. Some patients express homicidal thoughts in order to stay in the hospital. If Mr. F expresses threats that are contingent on discharge and declines to engage in problem-solving discussions, this would cast doubt on the genuineness of his threat. However, doubt about the genuineness of the threat alone is not sufficient to simply discharge Mr. F. Assessment of his intent needs to be considered with other relevant risk factors, risk reduction strategies, and any Tarasoff duties that may apply.
In addition to risk factors, consider mitigating factors. For example, does Mr. F express concern over prison time as a reason to not engage in violence? It would be more ominous if Mr. F says that he does not care if he goes to prison because life is lousy being homeless and unemployed. At this point, an estimation can be made regarding whether Mr. F is a low-, moderate-, or high-risk of violence.
The next step is to organize Mr. F’s risk factors into static (historical) and dynamic (subject to intervention) factors. This will be helpful in formulating a strategy to manage risk because continued hospitalization can only address dynamic risk factors. Often in these cases, the static risk factors are far more numerous than the dynamic risk factors.
Once the data are collected and organized, the final step is to devise a risk management strategy. Some interventions, such as substance use treatment, will be straightforward. A mood-stabilizing medication could be considered, if clinically appropriate, to help reduce aggression and irritability.31 Efforts should be made to eliminate Mr. F’s access to firearms; however, in this case, it sounds unlikely that he will cooperate with those efforts. Ultimately, you may find yourself with a list of risk factors that are unlikely to be altered with further hospitalization, particularly if Mr. F’s homicidal thoughts and intent are due to antisocial personality traits.
Continue to: In that case...
In that case, the most important step will be to carry out your duty to warn/protect others prior to Mr. F’s discharge. Most states either require or permit mental health professionals to take reasonable steps to protect victims from violence when certain conditions are present, such as an explicit threat or identifiable victim (see Related Resources).
Once dynamic risk factors have been addressed, and duty to warn/protect is carried out, if there is no further clinical indication for hospitalization, it would be appropriate to discharge Mr. F. Continued homicidal threats stemming from antisocial personality traits, in the absence of a treatable mental illness (or other modifiable risk factors for violence that can be actively addressed), is not a reason for continued hospitalization. It may be useful to obtain a second opinion from a colleague in such scenarios. A second opinion may offer additional risk management ideas. In the event of a bad outcome, this will also help to show that the decision to discharge the patient was not taken lightly.
The psychiatrist should document a thoughtful risk assessment, the strategies that were implemented to reduce risk, the details of the warning, and the reasoning why continued hospitalization was not indicated (Table 3).
CASE CONTINUED
Decision to discharge
In Mr. F’s case, the treating psychiatrist determined that Mr. F’s risk of violence toward Ms. S was moderate. The psychiatrist identified several static risk factors for violence that raised Mr. F’s risk, but also noted that Mr. F’s threats were likely a manipulative effort to prolong his hospital stay. The psychiatrist carried out his duty to protect by notifying police and Ms. S of the nature of the threat prior to Mr. F’s discharge. The unit social worker helped Mr. F schedule an intake appointment for a substance use disorder treatment facility. Mr. F ultimately stated that he no longer experienced homicidal ideas once a bed was secured for him in a substance use treatment program. The psychiatrist carefully documented Mr. F’s risk assessment and the reasons why Mr. F’s risk would not be significantly altered by further inpatient hospitalization. Mr. F was discharged, and Ms. S remained unharmed.
Continue to: Bottom Line
Bottom Line
Use a structured approach to identify risk factors for violence. Address dynamic risk factors, including access to weapons. Carry out the duty to warn/protect if applicable. Document your decisions and actions carefully, and then discharge the patient if clinically indicated. Do not be “held hostage” by a patient’s homicidal ideation.
Related Resources
- Dolan M, Doyle M. Violence risk prediction. Clinical and actuarial measures and the role of the psychopathy checklist. Br J Psychiatry. 2000;177:303-311.
- Douglas KS, Hart SD, Webster CD, et al. HCR-20V3: Assessing risk of violence–user guide. Burnaby, Canada: Mental Health, Law, and Policy Institute, Simon Fraser University; 2013.
- National Conference of State Legislatures. Mental health professionals’ duty to warn. http://www.ncsl.org/research/health/mental-health-professionals-duty-to-warn.aspx. Published September 28, 2015.
Drug Brand Names
Sertraline • Zoloft
1. Skeem J, Kennealy P, Monahan J, et al. Psychosis uncommonly and inconsistently precedes violence among high-risk individuals. Clin Psychol Sci. 2016;4(1):40-49.
2. McGinty E, Frattaroli S, Appelbaum PS, et al. Using research evidence to reframe the policy debate around mental illness and guns: process and recommendations. Am J Public Health. 2014;104(11):e22-e26.
3. Sumner SA, Mercy JA, Dahlberg LL, et al. Violence in the United States: status, challenges, and opportunities. JAMA. 2015;314(5):478-488.
4. Heron M. Deaths: leading causes for 2014. Natl Vital Stat Rep. 2016;65(5):1-96.
5. Borum R, Swartz M, Swanson J. Assessing and managing violence risk in clinical practice. J Prac Psychiatry Behav Health. 1996;2(4):205-215.
6. Swanson JW, Holzer CE 3rd, Ganju VK, et al. Violence and psychiatric disorder in the community: Evidence from the epidemiologic catchment area surveys. Hosp Community Psychiatry. 1990;41(7):761-770.
7. Swanson JW. Explaining rare acts of violence: the limits of evidence from population research. Psychiatr Serv. 2011;62(11):1369-1371.
8. Bonta J, Law M, Hanson K. The prediction of criminal and violent recidivism among mentally disordered offenders: a meta-analysis. Psychol Bull. 1998;123(2):123-142.
9. Monahan J. The inclusion of biological risk factors in violence risk assessments. In: Singh I, Sinnott-Armstrong W, Savulescu J, eds. Bioprediction, biomarkers, and bad behavior: scientific, legal, and ethical implications. New York, NY: Oxford University Press; 2014:57-76.
10. Murray J, Thomson ME. Clinical judgement in violence risk assessment. Eur J Psychol. 2010;6(1):128-149.
11. Mossman D. Violence risk: is clinical judgment enough? Current Psychiatry. 2008;7(6):66-72.
12. Douglas T, Pugh J, Singh I, et al. Risk assessment tools in criminal justice and forensic psychiatry: the need for better data. Eur Psychiatry. 2017;42:134-137.
13. Dolan M, Doyle M. Violence risk prediction. Clinical and actuarial measures and the role of the psychopathy checklist. Br J Psychiatry. 2000;177:303-311.
14. Fazel S, Singh J, Doll H, et al. Use of risk assessment instruments to predict violence and antisocial behaviour in 73 samples involving 24 827 people: systematic review and meta-analysis. BMJ. 2012;345:e4692. doi: 10.1136/bmj.e4692.
15. National Collaborating Centre for Mental Health (UK). Violence and aggression: short- term management in mental health, health, and community settings: updated edition. London: British Psychological Society; 2015. NICE Guideline, No 10.
16. Klassen D, O’Connor WA. Predicting violence in schizophrenic and non-schizophrenic patients: a prospective study. J Community Psychol. 1988;16(2):217-227.
17. Scott C, Resnick P. Clinical assessment of aggression and violence. In: Rosner R, Scott C, eds. Principles and practice of forensic psychiatry, 3rd ed. Boca Raton, FL: CRC Press; 2017:623-631.
18. Tardiff K, Sweillam A. Assault, suicide, and mental illness. Arch Gen Psychiatry. 1980;37(2):164-169.
19. Lidz CW, Mulvey EP, Gardner W. The accuracy of predictions of violence to others. JAMA. 1993;269(8):1007-1011.
20. Newhill CE, Mulvey EP, Lidz CW. Characteristics of violence in the community by female patients seen in a psychiatric emergency service. Psychiatric Serv. 1995;46(8):785-789.
21. Mulvey E, Lidz C. Clinical considerations in the prediction of dangerousness in mental patients. Clin Psychol Rev. 1984;4(4):379-401.
22. Link BG, Andrews H, Cullen FT. The violent and illegal behavior of mental patients reconsidered. Am Sociol Rev. 1992;57(3):275-292.
23. Harris GT, Rice ME, Quinsey VL. Violent recidivism of mentally disordered offenders: the development of a statistical prediction instrument. Crim Justice and Behav. 1993;20(4):315-335.
24. Klassen D, O’Connor W. Demographic and case history variables in risk assessment. In: Monahan J, Steadman H, eds. Violence and mental disorder: developments in risk assessment. Chicago, IL: University of Chicago Press; 1994:229-257.
25. Hart SD, Hare RD, Forth AE. Psychopathy as a risk marker for violence: development and validation of a screening version of the revised Psychopathy Checklist. In: Monahan J, Steadman HJ, eds. Violence and mental disorder: developments in risk assessment. Chicago, IL: University of Chicago Press; 1994:81-98.
26. Cleckley H. The mask of sanity. St. Louis, MO: Mosby; 1941.
27. Harris GT, Rice ME, Cormier CA. Psychopathy and violent recidivism. Law Hum Behav. 1991;15(6):625-637.
28. Steadman HJ, Mulvey EP, Monahan J. Violence by people discharged from acute psychiatric inpatient facilities and by others in the same neighborhoods. Arch Gen Psychiatry. 1998;55:393-401.
29. Meloy JR, White SG, Hart S. Workplace assessment of targeted violence risk: the development and reliability of the WAVR-21. J Forensic Sci. 2013;58(5):1353-1358.
30. Borum R, Fein R, Vossekuil B, et al. Threat assessment: defining an approach for evaluating risk of targeted violence. Behav Sci Law. 1999;17(3):323-337.
31. Tyrer P, Bateman AW. Drug treatment for personality disorders. Adv Psychiatr Treat. 2004;10(5):389-398.
Mr. F, age 35, is homeless and has a history of cocaine and alcohol use disorders. He is admitted voluntarily to the psychiatric unit because he has homicidal thoughts toward Ms. S, who works in the shelter where he has been staying. Mr. F reports that he is thinking of killing Ms. S if he is discharged because she has been rude to him. He states that he has access to several firearms, but he will not disclose the location. He has been diagnosed with unspecified depressive disorder and exhibited antisocial personality disorder traits. He is being treated with sertraline. However, his mood appears to be relatively stable, except for occasional angry verbal outbursts. The outbursts have been related to intrusive peers or staff turning the television off for group meetings. Mr. F has been joking with peers, eating well, and sleeping appropriately. He reports no suicidal thoughts and has not been physically violent on the unit. However, Mr. F has had a history of violence since his teenage years. He has been incarcerated twice for assault and once for drug possession.
How would you approach assessing and managing Mr. F’s risk for violence?
We all have encountered a patient similar to Mr. F on the psychiatric unit or in the emergency department—a patient who makes violent threats and appears angry, intimidating, manipulative, and/or demanding, despite exhibiting no evidence of mania or psychosis. This patient often has a history of substance abuse and a lifelong pattern of viewing violence as an acceptable way of addressing life’s problems. Many psychiatrists suspect that more time on the inpatient unit is unlikely to reduce this patient’s risk of violence. Why? Because the violence risk does not stem from a treatable mental illness. Further, psychiatrists may be apprehensive about this patient’s potential for violence after discharge and their liability in the event of a bad outcome. No one wants their name associated with a headline that reads “Psychiatrist discharged man less than 24 hours before he killed 3 people.”
The purported relationship between mental illness and violence often is sensationalized in the media. However, research reveals that the vast majority of violence is in fact not due to symptoms of mental illness.1,2 A common clinical challenge in psychiatry involves evaluating individuals at elevated risk of violence and determining how to address their risk factors for violence. When the risk is primarily due to psychosis and can be reduced with antipsychotic medication, the job is easy. But how should we proceed when the risk stems from factors other than mental illness?
This article
Violence and mental illness: A tenuous link
Violence is a major public health concern in the United States. Although in recent years the rates of homicide and aggravated assault have decreased dramatically, there are approximately 16,000 homicides annually in the United States, and more than 1.6 million injuries from assaults treated in emergency departments each year.3 Homicide continues to be one of the leading causes of death among teenagers and young adults.4
The most effective methods of preventing widespread violence are public health approaches, such as parent- and family-focused programs, early childhood education, programs in school, and public policy changes.3 However, as psychiatrists, we are routinely asked to assess the risk of violence for an individual patient and devise strategies to mitigate violence risk.
Continue to: Although certain mental illnesses...
Although certain mental illnesses increase the relative risk of violence (compared with people without mental illness),5,6 recent studies suggest that mental illness plays only a “minor role in explaining violence in populations.”7 It is estimated that as little as 4% of the violence in the United States can be attributed to mental illness.1 According to a 1998 meta-analysis of 48 studies of criminal recidivism, the risk factors for violent recidivism were “almost identical” among offenders who had a mental disorder and those who did not.8
Approaches to assessing violence risk
Psychiatrists can assess the risk of future violence via 3 broad approaches.9,10
Unaided clinical judgment is when a mental health professional estimates violence risk based on his or her own experience and intuition, with knowledge of violence risk factors, but without the use of structured tools.
Actuarial tools are statistical models that use formulae to show relationships between data (risk factors) and outcomes (violence).10,11
Continue to: Structured professional judgment
Structured professional judgment is a hybrid of unaided clinical judgment and actuarial methods. Structured professional judgment tools help the evaluator identify empirically established risk factors. Once the information is collected, it is combined with clinical judgment in decision making.9,10 There are now more than 200 structured tools available for assessing violence risk in criminal justice and forensic mental health populations.12
Clinical judgment, although commonly used in practice, is less accurate than actuarial tools or structured professional judgment.10,11 In general, risk assessment tools offer moderate levels of accuracy in categorizing people at low risk vs high risk.5,13 The tools have better ability to accurately categorize individuals at low risk, compared with high risk, where false positives are common.12,14
Two types of risk factors
Risk factors for violence are commonly categorized as static or dynamic factors. Static factors are historical factors that cannot be changed with intervention (eg, age, sex, history of abuse). Dynamic factors can be changed with intervention (eg, substance abuse).15
Static risk factors. The best predictor of future violence is past violent behavior.5,16,17 Violence risk increases with each prior episode of violence.5 Prior arrests for any crime, especially if the individual was a juvenile at the time of arrest for his or her first violent offense, increase future violence risk.5 Other important static violence risk factors include demographic factors such as age, sex, and socioeconomic status. Swanson et al6 reviewed a large pool of data (approximately 10,000 respondents) from the Epidemiologic Catchment Area survey. Being young, male, and of low socioeconomic status were all associated with violence in the community.6 The highest-risk age group for violence is age 15 to 24.5 Males perpetrate violence in the community at a rate 10 times that of females.18 However, among individuals with severe mental illness, men and women have similar rates of violence.19,20 Unstable employment,21 less education,22 low intelligence,16 and a history of a significant head injury5 also are risk factors for violence.5
Continue to: Being abused as a child...
Being abused as a child, witnessing violence in the home,5,16 and growing up with an unstable parental situation (eg, parental loss or separation) has been linked to violence.16,23,24 Early disruptive behavior in childhood (eg, fighting, lying and stealing, truancy, and school problems) increases violence risk.21,23
Personality factors are important static risk factors for violence. Antisocial personality disorder is the most common personality disorder linked with violence.17 Several studies consistently show psychopathy to be a strong predictor of both violence and criminal behavior.5,25 A psychopath is a person who lacks empathy and close relationships, behaves impulsively, has superficially charming qualities, and is primarily interested in self-gratification.26 Harris et al27 studied 169 released forensic patients and found that 77% of the psychopaths (according to Psychopathy Checklist-Revised [PCL-R] scores) violently recidivated. In contrast, only 21% of the non-psychopaths violently recidivated.27
Other personality factors associated with violence include a predisposition toward feelings of anger and hatred (as opposed to empathy, anxiety, or guilt, which may reduce risk), hostile attributional biases (a tendency to interpret benign behavior of others as intentionally antagonistic), violent fantasies, poor anger control, and impulsivity.5 Although personality factors tend to be longstanding and more difficult to modify, in the outpatient setting, therapeutic efforts can be made to modify hostile attribution biases, poor anger control, and impulsive behavior.
Dynamic risk factors. Substance abuse is strongly associated with violence.6,17 The prevalence of violence is 12 times greater among individuals with alcohol use disorder and 16 times greater among individuals with other substance use disorders, compared with those with no such diagnoses.5,6
Continue to: Steadman et al...
Steadman et al28 compared 1,136 adult patients with mental disorders discharged from psychiatric hospitals with 519 individuals living in the same neighborhoods as the hospitalized patients. They found that the prevalence of violence among discharged patients without substance abuse was “statistically indistinguishable” from the prevalence of violence among community members, in the same neighborhood, who did not have symptoms of substance abuse.28 Swanson et al6 found that the combination of a mental disorder plus an alcohol or substance use disorder substantially increased the risk of violence.
Other dynamic risk factors for violence include mental illness symptoms such as psychosis, especially threat/control-override delusions, where the individual believes that they are being threatened or controlled by an external force.17
Contextual factors to consider in violence risk assessments include current stressors, lack of social support, availability of weapons, access to drugs and alcohol, and the presence of similar circumstances that led to violent behavior in the past.5
How to assess the risk of targeted violence
Targeted violence is a predatory act of violence intentionally committed against a preselected person, group of people, or place.29 Due to the low base rates of these incidents, targeted violence is difficult to study.7,30 These risk assessments require a more specialized approach.
Continue to: In their 1999 article...
In their 1999 article, Borum et al30 discussed threat assessment strategies utilized by the U.S. Secret Service and recommended investigating “pathways of ideas and behaviors that may lead to violent action.” Borum et al30 summarized 3 fundamental principles of threat assessment (Table 130).
What to do when violence risk is not due to mental illness
Based on the information in Mr. F’s case scenario, it is likely that his homicidal ideation is not due to mental illness. Despite this, several risk factors for violence are present. Where do we go from here?
Scott and Resnick17 recommend considering the concept of dangerousness as 5 components (Table 217). When this model of dangerousness is applied to Mr. F’s case, one can see that the magnitude of the harm is great because of threatened homicide. With regard to the imminence of the harm, it would help to clarify whether Mr. F plans to kill Ms. S immediately after discharge, or sometime in the next few months. Is his threat contingent on further provocations by Ms. S? Alternatively, does he intend to kill her for past grievances, regardless of further perceived insults?
Next, the frequency of a behavior relates to how often Mr. F has been aggressive in the past. The severity of his past aggression is also important. What is the most violent act he has ever done? Situational factors in this case include Mr. F’s access to weapons, financial problems, housing problems, and access to drugs and alcohol.17 Mr. F should be asked about what situations previously provoked his violent behavior. Consider how similar the present conditions are to past conditions to which Mr. F responded violently.5 The likelihood that a homicide will occur should take into account Mr. F’s risk factors for violence, as well as the seriousness of his intent to cause harm.
Continue to: Consider using a structured tool...
Consider using a structured tool, such as the Classification of Violence Risk, to help identify Mr. F’s risk factors for violence, or some other formal method to ensure that the proper data are collected. Violence risk assessments are more accurate when structured risk assessment tools are used, compared with clinical judgment alone.
It is important to review collateral sources of information. In Mr. F’s case, useful collateral sources may include his criminal docket (usually available online), past medical records, information from the shelter where he lives, and, potentially, friends or family.
Because Mr. F is making threats of targeted violence, be sure to ask about attack-related behaviors (Table 130).
Regarding the seriousness of Mr. F’s intent to cause harm, it may be helpful to ask him the following questions:
- How likely are you to carry out this act of violence?
- Do you have a plan? Have you taken any steps toward this plan?
- Do you see other, nonviolent solutions to this problem?
- What do you hope that we can do for you to help with this problem?
Continue to: Mr. F's answers...
Mr. F’s answers may suggest the possibility of a hidden agenda. Some patients express homicidal thoughts in order to stay in the hospital. If Mr. F expresses threats that are contingent on discharge and declines to engage in problem-solving discussions, this would cast doubt on the genuineness of his threat. However, doubt about the genuineness of the threat alone is not sufficient to simply discharge Mr. F. Assessment of his intent needs to be considered with other relevant risk factors, risk reduction strategies, and any Tarasoff duties that may apply.
In addition to risk factors, consider mitigating factors. For example, does Mr. F express concern over prison time as a reason to not engage in violence? It would be more ominous if Mr. F says that he does not care if he goes to prison because life is lousy being homeless and unemployed. At this point, an estimation can be made regarding whether Mr. F is a low-, moderate-, or high-risk of violence.
The next step is to organize Mr. F’s risk factors into static (historical) and dynamic (subject to intervention) factors. This will be helpful in formulating a strategy to manage risk because continued hospitalization can only address dynamic risk factors. Often in these cases, the static risk factors are far more numerous than the dynamic risk factors.
Once the data are collected and organized, the final step is to devise a risk management strategy. Some interventions, such as substance use treatment, will be straightforward. A mood-stabilizing medication could be considered, if clinically appropriate, to help reduce aggression and irritability.31 Efforts should be made to eliminate Mr. F’s access to firearms; however, in this case, it sounds unlikely that he will cooperate with those efforts. Ultimately, you may find yourself with a list of risk factors that are unlikely to be altered with further hospitalization, particularly if Mr. F’s homicidal thoughts and intent are due to antisocial personality traits.
Continue to: In that case...
In that case, the most important step will be to carry out your duty to warn/protect others prior to Mr. F’s discharge. Most states either require or permit mental health professionals to take reasonable steps to protect victims from violence when certain conditions are present, such as an explicit threat or identifiable victim (see Related Resources).
Once dynamic risk factors have been addressed, and duty to warn/protect is carried out, if there is no further clinical indication for hospitalization, it would be appropriate to discharge Mr. F. Continued homicidal threats stemming from antisocial personality traits, in the absence of a treatable mental illness (or other modifiable risk factors for violence that can be actively addressed), is not a reason for continued hospitalization. It may be useful to obtain a second opinion from a colleague in such scenarios. A second opinion may offer additional risk management ideas. In the event of a bad outcome, this will also help to show that the decision to discharge the patient was not taken lightly.
The psychiatrist should document a thoughtful risk assessment, the strategies that were implemented to reduce risk, the details of the warning, and the reasoning why continued hospitalization was not indicated (Table 3).
CASE CONTINUED
Decision to discharge
In Mr. F’s case, the treating psychiatrist determined that Mr. F’s risk of violence toward Ms. S was moderate. The psychiatrist identified several static risk factors for violence that raised Mr. F’s risk, but also noted that Mr. F’s threats were likely a manipulative effort to prolong his hospital stay. The psychiatrist carried out his duty to protect by notifying police and Ms. S of the nature of the threat prior to Mr. F’s discharge. The unit social worker helped Mr. F schedule an intake appointment for a substance use disorder treatment facility. Mr. F ultimately stated that he no longer experienced homicidal ideas once a bed was secured for him in a substance use treatment program. The psychiatrist carefully documented Mr. F’s risk assessment and the reasons why Mr. F’s risk would not be significantly altered by further inpatient hospitalization. Mr. F was discharged, and Ms. S remained unharmed.
Continue to: Bottom Line
Bottom Line
Use a structured approach to identify risk factors for violence. Address dynamic risk factors, including access to weapons. Carry out the duty to warn/protect if applicable. Document your decisions and actions carefully, and then discharge the patient if clinically indicated. Do not be “held hostage” by a patient’s homicidal ideation.
Related Resources
- Dolan M, Doyle M. Violence risk prediction. Clinical and actuarial measures and the role of the psychopathy checklist. Br J Psychiatry. 2000;177:303-311.
- Douglas KS, Hart SD, Webster CD, et al. HCR-20V3: Assessing risk of violence–user guide. Burnaby, Canada: Mental Health, Law, and Policy Institute, Simon Fraser University; 2013.
- National Conference of State Legislatures. Mental health professionals’ duty to warn. http://www.ncsl.org/research/health/mental-health-professionals-duty-to-warn.aspx. Published September 28, 2015.
Drug Brand Names
Sertraline • Zoloft
1. Skeem J, Kennealy P, Monahan J, et al. Psychosis uncommonly and inconsistently precedes violence among high-risk individuals. Clin Psychol Sci. 2016;4(1):40-49.
2. McGinty E, Frattaroli S, Appelbaum PS, et al. Using research evidence to reframe the policy debate around mental illness and guns: process and recommendations. Am J Public Health. 2014;104(11):e22-e26.
3. Sumner SA, Mercy JA, Dahlberg LL, et al. Violence in the United States: status, challenges, and opportunities. JAMA. 2015;314(5):478-488.
4. Heron M. Deaths: leading causes for 2014. Natl Vital Stat Rep. 2016;65(5):1-96.
5. Borum R, Swartz M, Swanson J. Assessing and managing violence risk in clinical practice. J Prac Psychiatry Behav Health. 1996;2(4):205-215.
6. Swanson JW, Holzer CE 3rd, Ganju VK, et al. Violence and psychiatric disorder in the community: Evidence from the epidemiologic catchment area surveys. Hosp Community Psychiatry. 1990;41(7):761-770.
7. Swanson JW. Explaining rare acts of violence: the limits of evidence from population research. Psychiatr Serv. 2011;62(11):1369-1371.
8. Bonta J, Law M, Hanson K. The prediction of criminal and violent recidivism among mentally disordered offenders: a meta-analysis. Psychol Bull. 1998;123(2):123-142.
9. Monahan J. The inclusion of biological risk factors in violence risk assessments. In: Singh I, Sinnott-Armstrong W, Savulescu J, eds. Bioprediction, biomarkers, and bad behavior: scientific, legal, and ethical implications. New York, NY: Oxford University Press; 2014:57-76.
10. Murray J, Thomson ME. Clinical judgement in violence risk assessment. Eur J Psychol. 2010;6(1):128-149.
11. Mossman D. Violence risk: is clinical judgment enough? Current Psychiatry. 2008;7(6):66-72.
12. Douglas T, Pugh J, Singh I, et al. Risk assessment tools in criminal justice and forensic psychiatry: the need for better data. Eur Psychiatry. 2017;42:134-137.
13. Dolan M, Doyle M. Violence risk prediction. Clinical and actuarial measures and the role of the psychopathy checklist. Br J Psychiatry. 2000;177:303-311.
14. Fazel S, Singh J, Doll H, et al. Use of risk assessment instruments to predict violence and antisocial behaviour in 73 samples involving 24 827 people: systematic review and meta-analysis. BMJ. 2012;345:e4692. doi: 10.1136/bmj.e4692.
15. National Collaborating Centre for Mental Health (UK). Violence and aggression: short- term management in mental health, health, and community settings: updated edition. London: British Psychological Society; 2015. NICE Guideline, No 10.
16. Klassen D, O’Connor WA. Predicting violence in schizophrenic and non-schizophrenic patients: a prospective study. J Community Psychol. 1988;16(2):217-227.
17. Scott C, Resnick P. Clinical assessment of aggression and violence. In: Rosner R, Scott C, eds. Principles and practice of forensic psychiatry, 3rd ed. Boca Raton, FL: CRC Press; 2017:623-631.
18. Tardiff K, Sweillam A. Assault, suicide, and mental illness. Arch Gen Psychiatry. 1980;37(2):164-169.
19. Lidz CW, Mulvey EP, Gardner W. The accuracy of predictions of violence to others. JAMA. 1993;269(8):1007-1011.
20. Newhill CE, Mulvey EP, Lidz CW. Characteristics of violence in the community by female patients seen in a psychiatric emergency service. Psychiatric Serv. 1995;46(8):785-789.
21. Mulvey E, Lidz C. Clinical considerations in the prediction of dangerousness in mental patients. Clin Psychol Rev. 1984;4(4):379-401.
22. Link BG, Andrews H, Cullen FT. The violent and illegal behavior of mental patients reconsidered. Am Sociol Rev. 1992;57(3):275-292.
23. Harris GT, Rice ME, Quinsey VL. Violent recidivism of mentally disordered offenders: the development of a statistical prediction instrument. Crim Justice and Behav. 1993;20(4):315-335.
24. Klassen D, O’Connor W. Demographic and case history variables in risk assessment. In: Monahan J, Steadman H, eds. Violence and mental disorder: developments in risk assessment. Chicago, IL: University of Chicago Press; 1994:229-257.
25. Hart SD, Hare RD, Forth AE. Psychopathy as a risk marker for violence: development and validation of a screening version of the revised Psychopathy Checklist. In: Monahan J, Steadman HJ, eds. Violence and mental disorder: developments in risk assessment. Chicago, IL: University of Chicago Press; 1994:81-98.
26. Cleckley H. The mask of sanity. St. Louis, MO: Mosby; 1941.
27. Harris GT, Rice ME, Cormier CA. Psychopathy and violent recidivism. Law Hum Behav. 1991;15(6):625-637.
28. Steadman HJ, Mulvey EP, Monahan J. Violence by people discharged from acute psychiatric inpatient facilities and by others in the same neighborhoods. Arch Gen Psychiatry. 1998;55:393-401.
29. Meloy JR, White SG, Hart S. Workplace assessment of targeted violence risk: the development and reliability of the WAVR-21. J Forensic Sci. 2013;58(5):1353-1358.
30. Borum R, Fein R, Vossekuil B, et al. Threat assessment: defining an approach for evaluating risk of targeted violence. Behav Sci Law. 1999;17(3):323-337.
31. Tyrer P, Bateman AW. Drug treatment for personality disorders. Adv Psychiatr Treat. 2004;10(5):389-398.

Treating psychosis in patients with HIV/AIDS
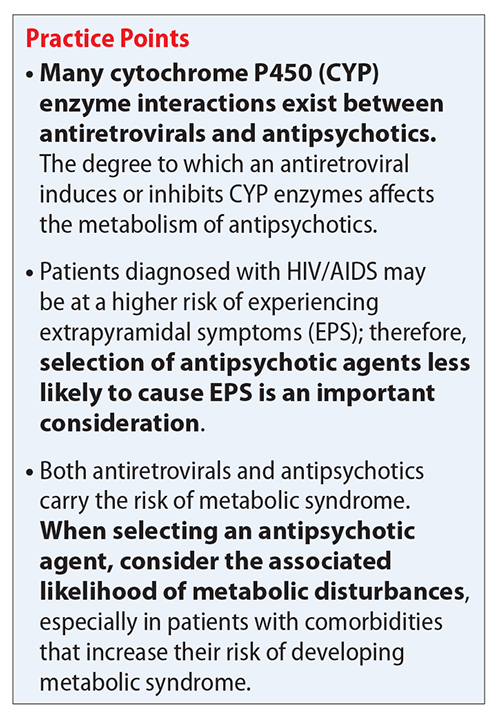
Mr. S, age 56, has human immunodeficiency virus (HIV) and schizoaffective disorder. He presents to your clinic with increased auditory hallucinations, disorganized behavior, and worsened tremors that have begun to seriously disrupt his daily life. Mr. S is prescribed risperidone; however, he reports that he has not been taking it lately due to the tremor despite being controlled on his medication regimen for nearly 1 year. His Abnormal Involuntary Movement Scale (AIMS) score reveals an increased wrist rigidity compared with previous clinic visits. Mr. S has a 40 pack-year history of smoking and history of IV drug use. Furthermore, he has a medical history of type 2 diabetes mellitus, hypertension, and hyperlipidemia.
His medication regimen includes atazanavir sulfate, 200 mg/d, ritonavir, 100 mg/d, efavirenz/emtricitabine/tenofovir disoproxil fumarate, 600/200/300 mg/d, risperidone, 6 mg/d, bupropion extended-release, 300 mg/d, gabapentin, 600 mg/d, amlodipine, 5 mg/d, pravastatin, 40 mg/d, metformin, 1000 mg twice daily, and glipizide, 10 mg twice daily. Today, his laboratory findings show that his CD4 count is 405 cell/mm3, and his viral load is <40 copies/mL, indicating his HIV is well managed. A hepatitis C virus antibody test result is negative and serum creatinine level is 1.0 mg/dL. Total cholesterol is 212 mg/dL, high-density lipoprotein cholesterol is 43 mg/dL, low-density lipoprotein cholesterol is 121 mg/dL, and triglycerides level is 238 mg/dL. Electrocardiography reveals a QTc interval of 426 ms. Mr. S’s blood pressure is 105/65 mm Hg. Based on this clinic visit, the treatment team decides to change Mr. S’s antipsychotic.
Psychiatric illness and HIV/AIDS
There is a strong link between mental illness and HIV/AIDS; 50% or more of patients with HIV/AIDS have a comorbid psychiatric disorder.1 The prevalence of mental illness in patients with HIV/AIDS is reported to be 8 times higher than in those without HIV/AIDS.2 Depression, bipolar disorder, anxiety disorders, delirium, substance abuse, and schizophrenia have all been identified in persons receiving highly active antiretroviral therapy (HAART). Patients with HIV/AIDS and psychiatric illness have a decreased quality of life, poor adherence to medications, faster disease progression, and increased mortality. Care of these individuals is complicated by the stigma of HIV/AIDS and the prevalence of the illness in underserved populations, as well as the need for complex medication regimens and the possibility of drug–drug interactions (DDIs).1,2 If left untreated, psychiatric illness in patients with HIV/AIDS may lead to further transmission of HIV as a result of patients engaging in high-risk behaviors, along with poor adherence to HAART.3
Individuals diagnosed with schizophrenia, schizoaffective disorder, and bipolar disorder are at greater risk for HIV infection.3 Patients with HIV/AIDS with primary psychosis may have poor medication adherence rates due to illness-related confusion or paranoia about medications. Furthermore, they may lack the resources to manage the complications and stress related to living with HIV/AIDS.
New-onset, or secondary psychosis, has been reported in individuals with late-stage HIV/AIDS with CD4 counts <200 who have not been diagnosed with a psychotic disorder previously.3 These patients may experience more persecutory and grandiose delusions rather than hallucinations. Neuropsychiatric symptoms in patients with HIV/AIDS may be due to the presence of HIV or other infections in the CNS, tumors, or other inflammatory illnesses. Medications that have been implicated in neuropsychiatric symptoms include efavirenz, rilpivirine, and other HAART regimens; interferon; metoclopramide; corticosteroids; muscle relaxants; and clonidine. It is possible that symptoms may continue even after the medications are discontinued.3
Antipsychotics remain the treatment of choice for psychosis in HIV/AIDS, regardless of the cause of the symptoms. Many factors must be taken into consideration when choosing an antipsychotic, such as DDIs, adverse effect profiles, patient history of antipsychotic use, cost, and patient preference. Here we focus primarily on DDIs and adverse effect profiles.
When treating psychosis in patients with HIV/AIDS, it is crucial to consider potential DDIs. Many antipsychotics and antiretroviral medications utilize cytochrome P450 (CYP) enzymes for their metabolism. The CYP enzyme system is responsible for the oxidative reactions that constitute the phase I reactions necessary for the metabolism of most drugs. Inhibition and induction of CYP enzymes are among the most common causes of pharmacokinetic DDIs. Antipsychotics are predominately metabolized by CYP3A4, CYP1A2, and CYP2D6.4
Continue to: The DDIs arise because...
The DDIs arise because many antiretroviral medications inhibit, or in some cases, induce, these CYP enzymes, thereby altering substrate-drug metabolism. Inhibiting a CYP enzyme pathway can decrease substrate-drug clearance and lead to increased levels of that drug. This, in turn, can cause an increased risk of adverse effects, such as extrapyramidal symptoms (EPS) or QTc prolongation, which are both types of pharmacodynamic DDIs.4-28 However, because antipsychotics often have more than one pathway of metabolism, it can be challenging to understand the full effect of CYP-related DDIs. Furthermore, CYP enzyme inducers can decrease drug levels, and in the case of antipsychotics, lead to subtherapeutic responses.
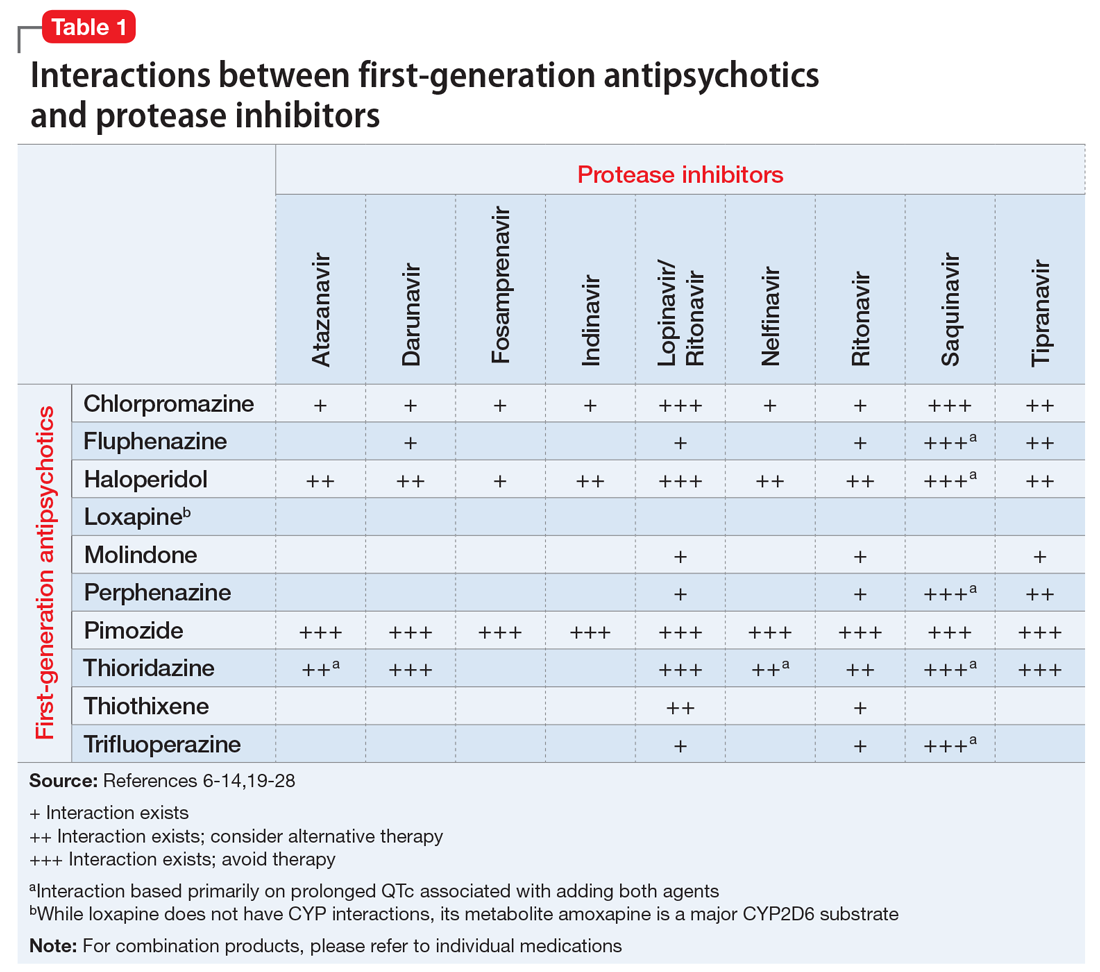
Table 1,6-14,19-28 Table 2,15-28 Table 3,6-14,19-28 and Table 415-28 list many of the known CYP enzyme-related DDIs that may occur with combination antipsychotic and antiretroviral medication therapy and aim to predict CYP induction or inhibition based on a particular combination. The following antiretroviral medications do not have any CYP-related interactions and therefore are not included in the Tables: abacavir, didanosine, emtricitabine, lamivudine, stavudine, tenofovir disoproxil, zidovudine, enfuvirtide, maraviroc, and raltegravir.
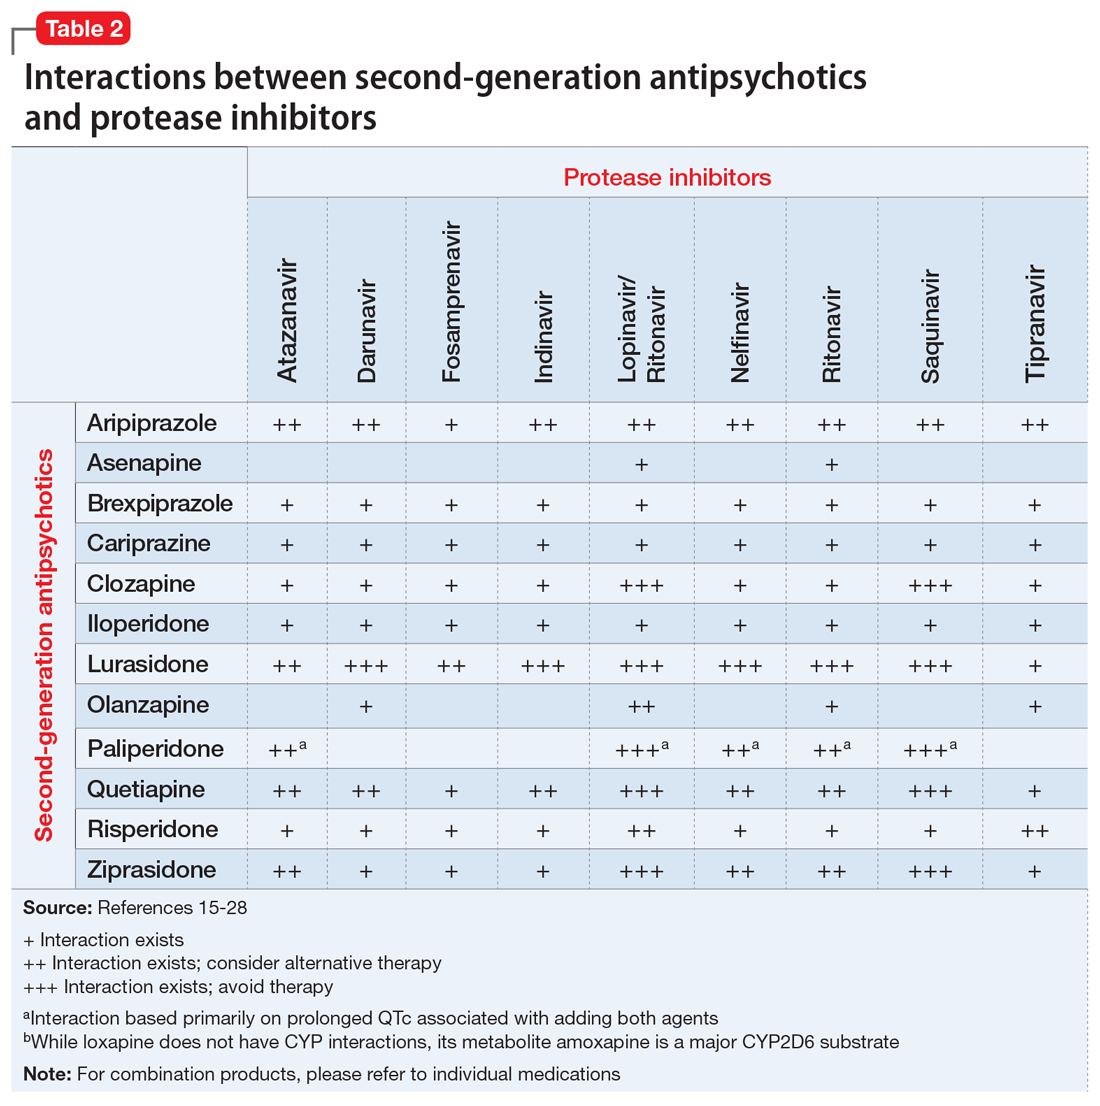
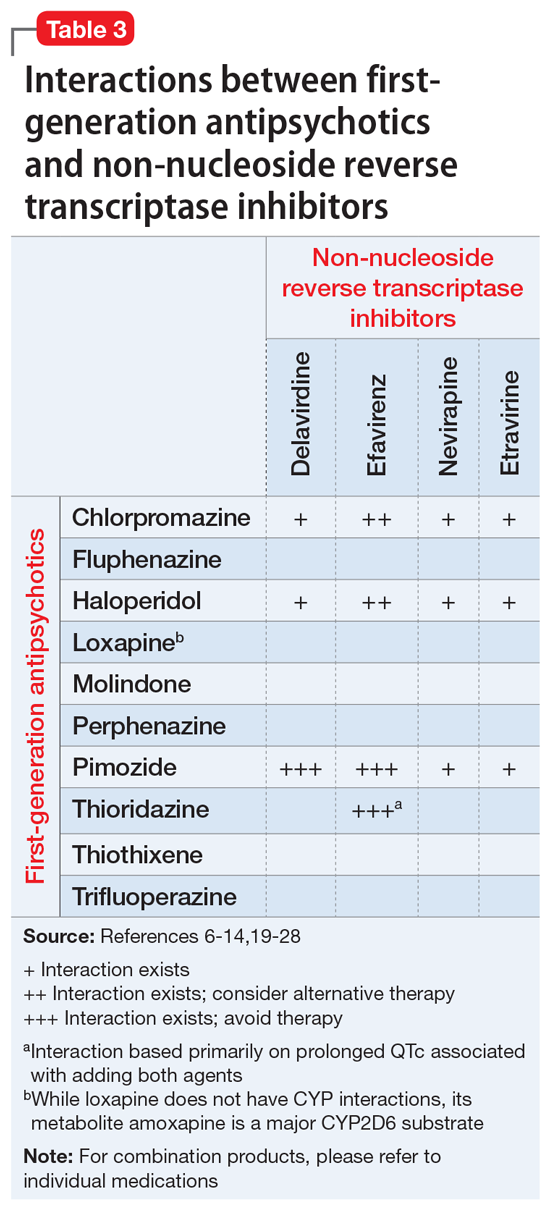
These Tables include the risk ratings for all D-rated (consider alternative therapy) and X-rated (avoid therapy) combinations. The majority of D-rated interactions are caused by CYP inhibition or induction that could potentially lead to altered antipsychotic levels. The majority of X-rated interactions are caused by increased QTc prolongation that may or may not be due to CYP-related DDIs. For example, paliperidone is not believed to be affected by the CYP enzyme system, but it does present a high risk of QTc prolongation on its own. When combined with an antiretroviral that also has a high risk of QTc prolongation, such as lopinavir, then the risk further increases.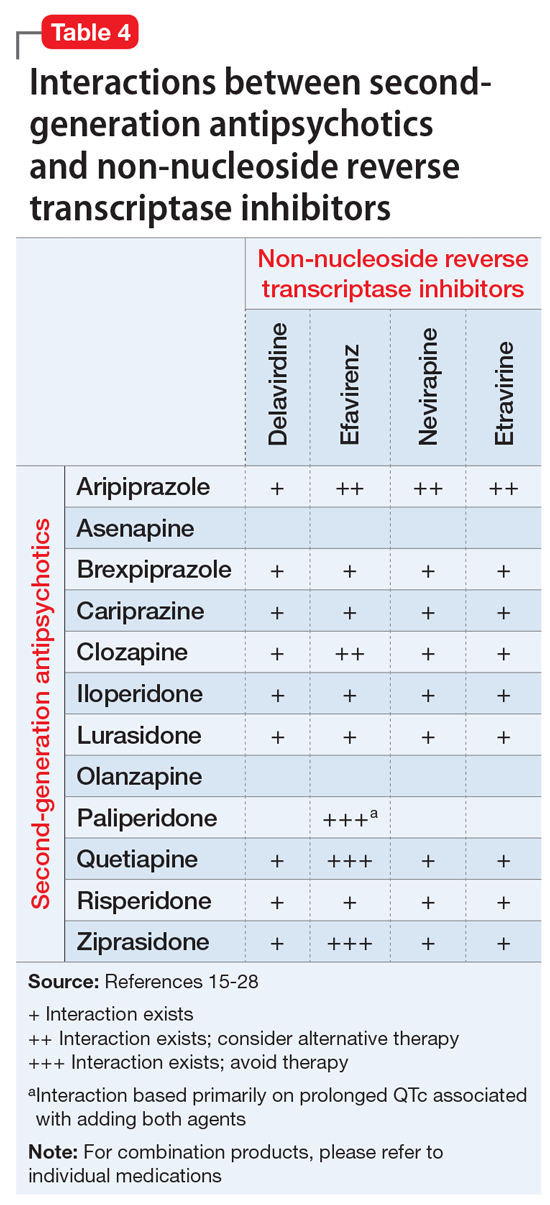
Non-nucleoside reverse transcriptase inhibitors and protease inhibitors (PIs) are the antiretroviral medications most likely to cause DDIs with antipsychotics. Other antiretroviral classes, such as nucleoside/nucleotide reverse transcriptase inhibitors (NRTIs), fusion inhibitors, chemokine receptor 5 inhibitors, and integrase inhibitors, are not associated with CYP-related DDIs.19-28 For the most part, the severity of the CYP-related DDIs have not been well studied; therefore, most recommendations call for closer patient monitoring when combining antiretroviral medications and antipsychotics.6-18 The goal is to monitor for any changes in medication efficacy or adverse effects.
Continue to: Consider adverse effect profiles
Consider adverse effect profiles
When selecting an antipsychotic agent for a patient receiving HIV therapy, also consider adverse effect profiles. The emergence of adverse effects can greatly impact patients’ quality of life, leading to consequences of medication nonadherence and exacerbation of mental illness.
Extrapyramidal symptoms. Patients with HIV have a higher sensitivity to treatment-emergent EPS from antipsychotics.2 This sensitivity is generally thought to arise from the involvement of HIV on the basal ganglia. Historically, psychotic symptoms in HIV have been managed with second-generation antipsychotics (SGAs) at the lowest effective dose because these medications are less likely to cause EPS.1,29 The antipsychotic with the lowest rate of EPS is clozapine, followed by quetiapine, olanzapine, ziprasidone, and aripiprazole. Conversely, high-potency first-generation antipsychotics (FGAs) have the highest rates of EPS, followed by intermediate-potency FGAs and risperidone.30
Metabolic disturbances are another concern with concomitant antipsychotic/antiretroviral therapy. Patients with HIV who are receiving NRTIs or PIs can present with drug-induced lipodystrophy syndrome, which is associated with hyperglycemia, hyperinsulinemia, hyperlipidemia, and hypertension, and ultimately may cause metabolic syndrome.29 The prevalence of metabolic syndrome in patients receiving PI therapy has a vast range—2% to 84%—which can be attributed to inconsistent definitions, criteria, and assessment methodology.29 Use of a PI is considered to be the most prominent risk factor for developing lipodystrophy.29 Among the PIs, metabolic disturbances in regards to lipids are most often seen with lopinavir/ritonavir (LPV/r), saquinavir/ritonavir, tipranavir/ritonavir, and fosamprenavir/ritonavir.31 In comparison with LPV/r, darunavir showed improvement in lipids.32 Atazanavir (ATV) boosted with ritonavir has not shown clinically significant adverse effects on lipids.31 Additionally, amprenavir, LPV/r, and ritonavir demonstrated more glucose uptake inhibition via blockade of the glucose transporter type 4 than ATV.31 Of the NRTIs, lipodystrophy syndrome is most commonly seen with stavudine, which is used minimally in practice.2
The rates of metabolic disturbance with antipsychotic use range from 2% to 36%.2 The American Psychiatric Association recommends selecting one of the SGAs least likely to affect metabolic parameters.29 Aripiprazole and ziprasidone are associated with the lowest risk of weight gain, hyperglycemia, and hyperlipidemia. They are followed by risperidone and quetiapine, which are associated with moderate risk, and then clozapine and olanzapine, which are associated with high risk.2,30,33
Continue to: Management of metabolic adverse effects involves...
Management of metabolic adverse effects involves switching the antiretroviral agent and/or antipsychotic agent to an alternative associated with lower metabolic risk. Antipsychotics with low metabolic risk include aripiprazole, lurasidone, and ziprasidone. Lifestyle modifications are encouraged. Additionally, medication interventions, such as metformin, are also recommended in patients meeting criteria for pre-diabetes or type 2 diabetes mellitus.2 Lipid panels and metabolic parameters should be monitored periodically, according to guidelines.25,34
Bone marrow toxicity and blood dyscrasias. Lastly, consider the risk of bone marrow suppression. Patients receiving clozapine for treatment-resistant schizophrenia should be closely monitored for neutropenia and agranulocytosis. Although zidovudine is rarely used, its use is associated with adverse myelosuppressive effects, and the combination of clozapine and zidovudine could pose danger to the patient.2,35,36
CASE CONTINUED
Because Mr. S’s diagnosis of HIV puts him at a higher risk of developing EPS, and because he is already experiencing increased wrist rigidity, the treatment team decides to switch his antipsychotic therapy to an agent with a lower risk of EPS. His comorbidities, including type 2 diabetes mellitus, hypertension, and hyperlipidemia, are taken into account, and an SGA with a benign metabolic profile is considered. Aripiprazole and ziprasidone are favorable options. However, because efavirenz, ATZ, and ritonavir may cause QTc prolongation, ziprasidone, the SGA with the highest rate of QTc prolongation, is not the preferred option.
Mr. S’s SGA therapy is switched from risperidone to aripiprazole. Because potential CYP-related interactions between aripiprazole and Mr. S’s current antiretroviral therapy could lead to increased aripiprazole levels. Mr. S is started on a low dose (5 mg/d) with the goal to titrate based on response and tolerability. Increased levels of aripiprazole may increase the risk of akathisia, drowsiness, headaches, and fatigue. Mr. S is monitored closely for improvement of EPS, adverse effects of medication, and metabolic parameters. Furthermore, if the treatment team believes there is a more preferred antipsychotic for the patient that it did not prescribe because of the risk of DDIs, it may be worthwhile to consider discussing the HAART regimen with the patient’s infectious disease treatment team.
Continue to: Acknowledgements
Acknowledgements
This material is the result of work supported with resources and the use of facilities at the Chillicothe Veterans Affairs Medical Center in Chillicothe, Ohio. The contents of this paper do not represent the views of the U.S. Department of Veterans Affairs or the U.S. government.
Related Resources
- Cohen MA. HIV: How to provide compassionate care. Current Psychiatry. 2013;12(6):19-23,A,B.
- Khan AY, Zaidi SN. Reducing morbidity and mortality from common medical conditions in schizophrenia. Current Psychiatry. 2016;15(3):30-32,34-38,40.
Drug Brand Names
Abacavir • Ziagen
Amlodipine • Norvasc
Amprenavir • Agenerase
Aripiprazole • Abilify
Asenapine • Saphris
Atazanavir • Reyataz
Brexpiprazole • Rexulti
Bupropion ER • Wellbutrin SR
Cariprazine • Vraylar
Chlorpromazine • Thorazine
Clonidine • Catapres
Clozapine • Clozaril
Darunavir • Prezista
Delavirdine • Rescriptor
Didanosine • Videx EC
Efavirenz • Sustiva
Efavirenz/emtricitabine/tenofovir disoproxil fumarate • Atripla
Enfuvirtide • Fuzeon
Emtricitabine • Emtriva
Etravirine • Intelence
Fluphenazine • Prolixin
Fosamprenavir • Lexiva
Gabapentin • Neurontin
Glipizide • Glucotrol
Haloperidol • Haldol
Iloperidone • Fanapt
Indinavir • Crixivan
Lamivudine • Epivir
Lopinavir/ritonavir • Kaletra
Loxapine • Loxitane
Lurasidone • Latuda
Maraviroc • Selzentry
Metformin • Glucophage
Metoclopramide • Reglan
Molindone • Moban
Nelfinavir • Viracept
Nevirapine • Viramune
Olanzapine • Zyprexa
Paliperidone • Invega
Perphenazine • Trilafon
Pimozide • Orap
Pravastatin • Pravachol
Quetiapine • Seroquel
Raltegravir • Isentress
Rilpivirine • Edurant
Risperidone • Risperdal
Ritonavir • Norvir
Saquinavir • Invirase
Stavudine • Zerit
Tenofovir disoproxil • Viread
Thioridazine • Mellaril
Thiothixene • Navane
Tipranavir • Aptivus
Trifluoperazine • Stelazine
Zidovudine • Retrovir
Ziprasidone • Geodon
1. Freudenreich O, Goforth HW, Cozza KL, et al. Psychiatric treatment of persons with HIV/AIDS: An HIV-psychiatry consensus survey of current practices. Psychosomatics. 2010;51(6):480-488.
2. Hill L, Lee KC. Pharmacotherapy considerations in patients with HIV and psychiatric disorders: Focus on antidepressants and antipsychotics. Ann Pharmacother. 2013;47(1):75-89.
3. Watkins CC, Treisman GJ. Neuropsychiatric complications of aging with HIV. J Neurovirol. 2012;18(4):277-290.
4. Prior TI, Baker GB. Interactions between the cytochrome P450 system and the second-generation antipsychotics. J Psychiatry Neurosci. 2003;28(2):99-112.
5. Ponte ML, Keller GA, Di Girolamo G. Mechanisms of drug induced QT interval prolongation. Curr Drug Saf. 2010;5(1):44-53
6. Reyataz [package insert]. Princeton, NJ: Bristol-Myers Squibb Company; 2017.
7. Prezista [package insert]. Toronto, ON: Janssen Inc.; 2017.
8. Lexiva [package insert]. Research Triangle Park, NC: Viiv Healthcare; 2017
9. Crixivan [package insert]. Whitehouse Station, NJ; Merck; 2016.
10. Kaletra [package insert]. North Chicago, IL: AbbVie Inc; 2017
11. Viracept [package insert]. Kirkland, QC: Pfizer Canada Inc.; 201
12. Norvir tablets and oral solution [package insert]. North Chicago, IL: AbbVie Inc; 2017
13. Invirase [package insert]. South San Francisco, CA: Genentech USA, Inc.; 2016.
14. Aptivus [package insert]. Ridgefield, CT: Boehringer Ingelheim Pharmaceuticals Inc.; 2016.
15. Sustiva [package insert]. Princeton, NJ: Bristol-Myers Squibb Company; 2017
16. Intelence [package insert]. Titusville, NJ: Tibotec Pharmaceuticals; 2014.
17. Viramune [package insert]. Ridgefield, CT: Boehringer Ingelheim Pharmaceuticals Inc.; 2017.
18. Rescriptor [package insert]. Laval, QC: ViiV Healthcare ULC; 2013.
19. Ziagen [package insert]. Research Triangle Park, NC: GlaxoSmithKline; 2017.
20. Videx EC [package insert]. Princeton, NJ: Bristol-Myers Squibb; 2015.
21. Emtriva [package insert]. Foster City, CA: Gilead Sciences, Inc.; 2017.
22. Epivir [package insert]. Research Triangle Park, NC: ViiV Healthcare; 2017.
23. Zerit [package insert]. Princeton, NJ: Bristol-Myers Squibb; 2017.
24. Viread [package insert]. Foster City, CA: Gilead Sciences, Inc.; 2017.
25. Retrovir [package insert]. Research Triangle Park, NC: ViiV Healthcare; 2015.
26. Fuzeon [package insert]. South San Francisco, CA: Genentech USA, Inc; 2017.
27. Selzentry [package insert]. Research Triangle Park, NC: ViiV Healthcare; 2016.
28. Isentress [package insert]. Whitehouse Station, NJ: Merck Sharp & Dohme Corp.; 2017.
29. American Psychiatry Association. Practice guidelines for treatment of patients with HIV/AIDS. http://psychiatryonline.org/pb/assets/raw/sitewide/practice_guidelines/guidelines/hivaids.pdf. Published 2010. Accessed March 1, 2018.
30. Buchanan RW, Kreyenbuhl J, Kelly DL, et al; Schizophrenia Patient Outcomes Research Team (PORT). The 2009 Schizophrenia PORT psychopharmacological treatment recommendations and summary statements. Schizophr Bull. 2010;36(1):71-93.
31. Hughes PJ, Cretton-Scott E, Teague A, et al. Protease inhibitors for patients with HIV-1 infection. P T. 2011;36(6):332-336,341-345.
32. Ortiz R, Dejesus E, Khanlou H, et al. Efficacy and safety of once-daily darunavir/ritonavir versus lopinavir/ritonavir in treatment-naive HIV-1-infected patients at week 48. AIDS. 2008;22(12):1389-1397.
33. Leucht S, Cipriani A, Spineli L, et al. Comparative efficacy and tolerability of 15 antipsychotic drugs in schizophrenia: a multiple-treatments meta-analysis. Lancet. 2013;382(9896):951-962.
34. Zeier K, Connell R, Resch W, et al. Recommendations for lab monitoring of atypical antipsychotics. Current Psychiatry. 2013;12(9):51-54.
35. Singh D, Goodkin K. Choice of antipsychotic in HIV-infected patients. J Clin Psychiatry. 2007;68(3):479-480.
36. Max B, Sherer R. Management of the adverse effects of antiretroviral therapy and medication adherence. Clin Infect Dis. 2000;30(suppl 2):S96-S116.
Mr. S, age 56, has human immunodeficiency virus (HIV) and schizoaffective disorder. He presents to your clinic with increased auditory hallucinations, disorganized behavior, and worsened tremors that have begun to seriously disrupt his daily life. Mr. S is prescribed risperidone; however, he reports that he has not been taking it lately due to the tremor despite being controlled on his medication regimen for nearly 1 year. His Abnormal Involuntary Movement Scale (AIMS) score reveals an increased wrist rigidity compared with previous clinic visits. Mr. S has a 40 pack-year history of smoking and history of IV drug use. Furthermore, he has a medical history of type 2 diabetes mellitus, hypertension, and hyperlipidemia.
His medication regimen includes atazanavir sulfate, 200 mg/d, ritonavir, 100 mg/d, efavirenz/emtricitabine/tenofovir disoproxil fumarate, 600/200/300 mg/d, risperidone, 6 mg/d, bupropion extended-release, 300 mg/d, gabapentin, 600 mg/d, amlodipine, 5 mg/d, pravastatin, 40 mg/d, metformin, 1000 mg twice daily, and glipizide, 10 mg twice daily. Today, his laboratory findings show that his CD4 count is 405 cell/mm3, and his viral load is <40 copies/mL, indicating his HIV is well managed. A hepatitis C virus antibody test result is negative and serum creatinine level is 1.0 mg/dL. Total cholesterol is 212 mg/dL, high-density lipoprotein cholesterol is 43 mg/dL, low-density lipoprotein cholesterol is 121 mg/dL, and triglycerides level is 238 mg/dL. Electrocardiography reveals a QTc interval of 426 ms. Mr. S’s blood pressure is 105/65 mm Hg. Based on this clinic visit, the treatment team decides to change Mr. S’s antipsychotic.
Psychiatric illness and HIV/AIDS
There is a strong link between mental illness and HIV/AIDS; 50% or more of patients with HIV/AIDS have a comorbid psychiatric disorder.1 The prevalence of mental illness in patients with HIV/AIDS is reported to be 8 times higher than in those without HIV/AIDS.2 Depression, bipolar disorder, anxiety disorders, delirium, substance abuse, and schizophrenia have all been identified in persons receiving highly active antiretroviral therapy (HAART). Patients with HIV/AIDS and psychiatric illness have a decreased quality of life, poor adherence to medications, faster disease progression, and increased mortality. Care of these individuals is complicated by the stigma of HIV/AIDS and the prevalence of the illness in underserved populations, as well as the need for complex medication regimens and the possibility of drug–drug interactions (DDIs).1,2 If left untreated, psychiatric illness in patients with HIV/AIDS may lead to further transmission of HIV as a result of patients engaging in high-risk behaviors, along with poor adherence to HAART.3
Individuals diagnosed with schizophrenia, schizoaffective disorder, and bipolar disorder are at greater risk for HIV infection.3 Patients with HIV/AIDS with primary psychosis may have poor medication adherence rates due to illness-related confusion or paranoia about medications. Furthermore, they may lack the resources to manage the complications and stress related to living with HIV/AIDS.
New-onset, or secondary psychosis, has been reported in individuals with late-stage HIV/AIDS with CD4 counts <200 who have not been diagnosed with a psychotic disorder previously.3 These patients may experience more persecutory and grandiose delusions rather than hallucinations. Neuropsychiatric symptoms in patients with HIV/AIDS may be due to the presence of HIV or other infections in the CNS, tumors, or other inflammatory illnesses. Medications that have been implicated in neuropsychiatric symptoms include efavirenz, rilpivirine, and other HAART regimens; interferon; metoclopramide; corticosteroids; muscle relaxants; and clonidine. It is possible that symptoms may continue even after the medications are discontinued.3
Antipsychotics remain the treatment of choice for psychosis in HIV/AIDS, regardless of the cause of the symptoms. Many factors must be taken into consideration when choosing an antipsychotic, such as DDIs, adverse effect profiles, patient history of antipsychotic use, cost, and patient preference. Here we focus primarily on DDIs and adverse effect profiles.
When treating psychosis in patients with HIV/AIDS, it is crucial to consider potential DDIs. Many antipsychotics and antiretroviral medications utilize cytochrome P450 (CYP) enzymes for their metabolism. The CYP enzyme system is responsible for the oxidative reactions that constitute the phase I reactions necessary for the metabolism of most drugs. Inhibition and induction of CYP enzymes are among the most common causes of pharmacokinetic DDIs. Antipsychotics are predominately metabolized by CYP3A4, CYP1A2, and CYP2D6.4
Continue to: The DDIs arise because...
The DDIs arise because many antiretroviral medications inhibit, or in some cases, induce, these CYP enzymes, thereby altering substrate-drug metabolism. Inhibiting a CYP enzyme pathway can decrease substrate-drug clearance and lead to increased levels of that drug. This, in turn, can cause an increased risk of adverse effects, such as extrapyramidal symptoms (EPS) or QTc prolongation, which are both types of pharmacodynamic DDIs.4-28 However, because antipsychotics often have more than one pathway of metabolism, it can be challenging to understand the full effect of CYP-related DDIs. Furthermore, CYP enzyme inducers can decrease drug levels, and in the case of antipsychotics, lead to subtherapeutic responses.
Table 1,6-14,19-28 Table 2,15-28 Table 3,6-14,19-28 and Table 415-28 list many of the known CYP enzyme-related DDIs that may occur with combination antipsychotic and antiretroviral medication therapy and aim to predict CYP induction or inhibition based on a particular combination. The following antiretroviral medications do not have any CYP-related interactions and therefore are not included in the Tables: abacavir, didanosine, emtricitabine, lamivudine, stavudine, tenofovir disoproxil, zidovudine, enfuvirtide, maraviroc, and raltegravir.
These Tables include the risk ratings for all D-rated (consider alternative therapy) and X-rated (avoid therapy) combinations. The majority of D-rated interactions are caused by CYP inhibition or induction that could potentially lead to altered antipsychotic levels. The majority of X-rated interactions are caused by increased QTc prolongation that may or may not be due to CYP-related DDIs. For example, paliperidone is not believed to be affected by the CYP enzyme system, but it does present a high risk of QTc prolongation on its own. When combined with an antiretroviral that also has a high risk of QTc prolongation, such as lopinavir, then the risk further increases.
Non-nucleoside reverse transcriptase inhibitors and protease inhibitors (PIs) are the antiretroviral medications most likely to cause DDIs with antipsychotics. Other antiretroviral classes, such as nucleoside/nucleotide reverse transcriptase inhibitors (NRTIs), fusion inhibitors, chemokine receptor 5 inhibitors, and integrase inhibitors, are not associated with CYP-related DDIs.19-28 For the most part, the severity of the CYP-related DDIs have not been well studied; therefore, most recommendations call for closer patient monitoring when combining antiretroviral medications and antipsychotics.6-18 The goal is to monitor for any changes in medication efficacy or adverse effects.
Continue to: Consider adverse effect profiles
Consider adverse effect profiles
When selecting an antipsychotic agent for a patient receiving HIV therapy, also consider adverse effect profiles. The emergence of adverse effects can greatly impact patients’ quality of life, leading to consequences of medication nonadherence and exacerbation of mental illness.
Extrapyramidal symptoms. Patients with HIV have a higher sensitivity to treatment-emergent EPS from antipsychotics.2 This sensitivity is generally thought to arise from the involvement of HIV on the basal ganglia. Historically, psychotic symptoms in HIV have been managed with second-generation antipsychotics (SGAs) at the lowest effective dose because these medications are less likely to cause EPS.1,29 The antipsychotic with the lowest rate of EPS is clozapine, followed by quetiapine, olanzapine, ziprasidone, and aripiprazole. Conversely, high-potency first-generation antipsychotics (FGAs) have the highest rates of EPS, followed by intermediate-potency FGAs and risperidone.30
Metabolic disturbances are another concern with concomitant antipsychotic/antiretroviral therapy. Patients with HIV who are receiving NRTIs or PIs can present with drug-induced lipodystrophy syndrome, which is associated with hyperglycemia, hyperinsulinemia, hyperlipidemia, and hypertension, and ultimately may cause metabolic syndrome.29 The prevalence of metabolic syndrome in patients receiving PI therapy has a vast range—2% to 84%—which can be attributed to inconsistent definitions, criteria, and assessment methodology.29 Use of a PI is considered to be the most prominent risk factor for developing lipodystrophy.29 Among the PIs, metabolic disturbances in regards to lipids are most often seen with lopinavir/ritonavir (LPV/r), saquinavir/ritonavir, tipranavir/ritonavir, and fosamprenavir/ritonavir.31 In comparison with LPV/r, darunavir showed improvement in lipids.32 Atazanavir (ATV) boosted with ritonavir has not shown clinically significant adverse effects on lipids.31 Additionally, amprenavir, LPV/r, and ritonavir demonstrated more glucose uptake inhibition via blockade of the glucose transporter type 4 than ATV.31 Of the NRTIs, lipodystrophy syndrome is most commonly seen with stavudine, which is used minimally in practice.2
The rates of metabolic disturbance with antipsychotic use range from 2% to 36%.2 The American Psychiatric Association recommends selecting one of the SGAs least likely to affect metabolic parameters.29 Aripiprazole and ziprasidone are associated with the lowest risk of weight gain, hyperglycemia, and hyperlipidemia. They are followed by risperidone and quetiapine, which are associated with moderate risk, and then clozapine and olanzapine, which are associated with high risk.2,30,33
Continue to: Management of metabolic adverse effects involves...
Management of metabolic adverse effects involves switching the antiretroviral agent and/or antipsychotic agent to an alternative associated with lower metabolic risk. Antipsychotics with low metabolic risk include aripiprazole, lurasidone, and ziprasidone. Lifestyle modifications are encouraged. Additionally, medication interventions, such as metformin, are also recommended in patients meeting criteria for pre-diabetes or type 2 diabetes mellitus.2 Lipid panels and metabolic parameters should be monitored periodically, according to guidelines.25,34
Bone marrow toxicity and blood dyscrasias. Lastly, consider the risk of bone marrow suppression. Patients receiving clozapine for treatment-resistant schizophrenia should be closely monitored for neutropenia and agranulocytosis. Although zidovudine is rarely used, its use is associated with adverse myelosuppressive effects, and the combination of clozapine and zidovudine could pose danger to the patient.2,35,36
CASE CONTINUED
Because Mr. S’s diagnosis of HIV puts him at a higher risk of developing EPS, and because he is already experiencing increased wrist rigidity, the treatment team decides to switch his antipsychotic therapy to an agent with a lower risk of EPS. His comorbidities, including type 2 diabetes mellitus, hypertension, and hyperlipidemia, are taken into account, and an SGA with a benign metabolic profile is considered. Aripiprazole and ziprasidone are favorable options. However, because efavirenz, ATZ, and ritonavir may cause QTc prolongation, ziprasidone, the SGA with the highest rate of QTc prolongation, is not the preferred option.
Mr. S’s SGA therapy is switched from risperidone to aripiprazole. Because potential CYP-related interactions between aripiprazole and Mr. S’s current antiretroviral therapy could lead to increased aripiprazole levels. Mr. S is started on a low dose (5 mg/d) with the goal to titrate based on response and tolerability. Increased levels of aripiprazole may increase the risk of akathisia, drowsiness, headaches, and fatigue. Mr. S is monitored closely for improvement of EPS, adverse effects of medication, and metabolic parameters. Furthermore, if the treatment team believes there is a more preferred antipsychotic for the patient that it did not prescribe because of the risk of DDIs, it may be worthwhile to consider discussing the HAART regimen with the patient’s infectious disease treatment team.
Continue to: Acknowledgements
Acknowledgements
This material is the result of work supported with resources and the use of facilities at the Chillicothe Veterans Affairs Medical Center in Chillicothe, Ohio. The contents of this paper do not represent the views of the U.S. Department of Veterans Affairs or the U.S. government.
Related Resources
- Cohen MA. HIV: How to provide compassionate care. Current Psychiatry. 2013;12(6):19-23,A,B.
- Khan AY, Zaidi SN. Reducing morbidity and mortality from common medical conditions in schizophrenia. Current Psychiatry. 2016;15(3):30-32,34-38,40.
Drug Brand Names
Abacavir • Ziagen
Amlodipine • Norvasc
Amprenavir • Agenerase
Aripiprazole • Abilify
Asenapine • Saphris
Atazanavir • Reyataz
Brexpiprazole • Rexulti
Bupropion ER • Wellbutrin SR
Cariprazine • Vraylar
Chlorpromazine • Thorazine
Clonidine • Catapres
Clozapine • Clozaril
Darunavir • Prezista
Delavirdine • Rescriptor
Didanosine • Videx EC
Efavirenz • Sustiva
Efavirenz/emtricitabine/tenofovir disoproxil fumarate • Atripla
Enfuvirtide • Fuzeon
Emtricitabine • Emtriva
Etravirine • Intelence
Fluphenazine • Prolixin
Fosamprenavir • Lexiva
Gabapentin • Neurontin
Glipizide • Glucotrol
Haloperidol • Haldol
Iloperidone • Fanapt
Indinavir • Crixivan
Lamivudine • Epivir
Lopinavir/ritonavir • Kaletra
Loxapine • Loxitane
Lurasidone • Latuda
Maraviroc • Selzentry
Metformin • Glucophage
Metoclopramide • Reglan
Molindone • Moban
Nelfinavir • Viracept
Nevirapine • Viramune
Olanzapine • Zyprexa
Paliperidone • Invega
Perphenazine • Trilafon
Pimozide • Orap
Pravastatin • Pravachol
Quetiapine • Seroquel
Raltegravir • Isentress
Rilpivirine • Edurant
Risperidone • Risperdal
Ritonavir • Norvir
Saquinavir • Invirase
Stavudine • Zerit
Tenofovir disoproxil • Viread
Thioridazine • Mellaril
Thiothixene • Navane
Tipranavir • Aptivus
Trifluoperazine • Stelazine
Zidovudine • Retrovir
Ziprasidone • Geodon
1. Freudenreich O, Goforth HW, Cozza KL, et al. Psychiatric treatment of persons with HIV/AIDS: An HIV-psychiatry consensus survey of current practices. Psychosomatics. 2010;51(6):480-488.
2. Hill L, Lee KC. Pharmacotherapy considerations in patients with HIV and psychiatric disorders: Focus on antidepressants and antipsychotics. Ann Pharmacother. 2013;47(1):75-89.
3. Watkins CC, Treisman GJ. Neuropsychiatric complications of aging with HIV. J Neurovirol. 2012;18(4):277-290.
4. Prior TI, Baker GB. Interactions between the cytochrome P450 system and the second-generation antipsychotics. J Psychiatry Neurosci. 2003;28(2):99-112.
5. Ponte ML, Keller GA, Di Girolamo G. Mechanisms of drug induced QT interval prolongation. Curr Drug Saf. 2010;5(1):44-53
6. Reyataz [package insert]. Princeton, NJ: Bristol-Myers Squibb Company; 2017.
7. Prezista [package insert]. Toronto, ON: Janssen Inc.; 2017.
8. Lexiva [package insert]. Research Triangle Park, NC: Viiv Healthcare; 2017
9. Crixivan [package insert]. Whitehouse Station, NJ; Merck; 2016.
10. Kaletra [package insert]. North Chicago, IL: AbbVie Inc; 2017
11. Viracept [package insert]. Kirkland, QC: Pfizer Canada Inc.; 201
12. Norvir tablets and oral solution [package insert]. North Chicago, IL: AbbVie Inc; 2017
13. Invirase [package insert]. South San Francisco, CA: Genentech USA, Inc.; 2016.
14. Aptivus [package insert]. Ridgefield, CT: Boehringer Ingelheim Pharmaceuticals Inc.; 2016.
15. Sustiva [package insert]. Princeton, NJ: Bristol-Myers Squibb Company; 2017
16. Intelence [package insert]. Titusville, NJ: Tibotec Pharmaceuticals; 2014.
17. Viramune [package insert]. Ridgefield, CT: Boehringer Ingelheim Pharmaceuticals Inc.; 2017.
18. Rescriptor [package insert]. Laval, QC: ViiV Healthcare ULC; 2013.
19. Ziagen [package insert]. Research Triangle Park, NC: GlaxoSmithKline; 2017.
20. Videx EC [package insert]. Princeton, NJ: Bristol-Myers Squibb; 2015.
21. Emtriva [package insert]. Foster City, CA: Gilead Sciences, Inc.; 2017.
22. Epivir [package insert]. Research Triangle Park, NC: ViiV Healthcare; 2017.
23. Zerit [package insert]. Princeton, NJ: Bristol-Myers Squibb; 2017.
24. Viread [package insert]. Foster City, CA: Gilead Sciences, Inc.; 2017.
25. Retrovir [package insert]. Research Triangle Park, NC: ViiV Healthcare; 2015.
26. Fuzeon [package insert]. South San Francisco, CA: Genentech USA, Inc; 2017.
27. Selzentry [package insert]. Research Triangle Park, NC: ViiV Healthcare; 2016.
28. Isentress [package insert]. Whitehouse Station, NJ: Merck Sharp & Dohme Corp.; 2017.
29. American Psychiatry Association. Practice guidelines for treatment of patients with HIV/AIDS. http://psychiatryonline.org/pb/assets/raw/sitewide/practice_guidelines/guidelines/hivaids.pdf. Published 2010. Accessed March 1, 2018.
30. Buchanan RW, Kreyenbuhl J, Kelly DL, et al; Schizophrenia Patient Outcomes Research Team (PORT). The 2009 Schizophrenia PORT psychopharmacological treatment recommendations and summary statements. Schizophr Bull. 2010;36(1):71-93.
31. Hughes PJ, Cretton-Scott E, Teague A, et al. Protease inhibitors for patients with HIV-1 infection. P T. 2011;36(6):332-336,341-345.
32. Ortiz R, Dejesus E, Khanlou H, et al. Efficacy and safety of once-daily darunavir/ritonavir versus lopinavir/ritonavir in treatment-naive HIV-1-infected patients at week 48. AIDS. 2008;22(12):1389-1397.
33. Leucht S, Cipriani A, Spineli L, et al. Comparative efficacy and tolerability of 15 antipsychotic drugs in schizophrenia: a multiple-treatments meta-analysis. Lancet. 2013;382(9896):951-962.
34. Zeier K, Connell R, Resch W, et al. Recommendations for lab monitoring of atypical antipsychotics. Current Psychiatry. 2013;12(9):51-54.
35. Singh D, Goodkin K. Choice of antipsychotic in HIV-infected patients. J Clin Psychiatry. 2007;68(3):479-480.
36. Max B, Sherer R. Management of the adverse effects of antiretroviral therapy and medication adherence. Clin Infect Dis. 2000;30(suppl 2):S96-S116.