User login
Don’t Miss the Celebration: AATS Centennial
Help us celebrate the AATS Centennial. Experience activities, events, historical artifacts and memorabilia commemorating the 100th anniversary of the American Association for Thoracic Surgery and the field of cardiothoracic surgery.
April 29 – May 3, 2017
Boston Hynes Convention Center
Boston, MA
A unique aspect of this year’s meeting is our collaboration with the American Society of Extracorporeal Technology (AmSECT). During the didactic portion of the program, the two organizations will be conducting joint panel sessions of interest to all members of the team.
AATS President & Annual Meeting Chair
Thoralf M. Sundt, III
AATS Annual Meeting Co-Chairs
Robert D. Jaquiss & Bryan F. Meyers
AmSECT President
Kenneth Shann
AmSECT International Conference Co-Chairs
Emily Saulitis & Larissa M.V. Teresi
Saturday Courses
Adult Cardiac Skills Chairs
Volkmar Falk, David Fitzgerald, Kenton Zehr
Congenital Skills Chairs
Ron Angona, David Bichell, Bohdan Maruszewski
General Thoracic Skills Chairs
Virginia Litle, Kazuhiro Yasufuku
Cardiothoracic Transplant and Mechanical Circulatory Support of Heart and Lung Failure Chairs
Matthew Bacchetta, Carmelo Milano, Rich Walczak
Surgical Ethics Forum Chairs
Bill DeBois, Martin McKneally, Robert Sade
Sunday Symposia
AATS/STS Adult Cardiac Surgery Symposium Chairs
David Fitzgerald, Hitoshi Ognio, Vinod Thourani
AATS/STS Congenital Heart Disease Symposium Chairs
Ron Angona, Michael Mitchell, Giovanni Stellin
AATS/STS General Thoracic Surgery Symposium Chairs
Seth Force, Moishe Liberman
Interprofessional Cardiothoracic Team Symposium Chairs
Steven Gottesfeld, Katherine Hoercher, Bruce Searles, Glenn Whitman
Saturday Course/Sunday Symposia Program
Share:
2014-2015 influenza vaccine ineffective against predominant strain
The 2014-2015 influenza vaccines offered little protection against the predominant influenza A/H3N2 virus, but were effective against influenza B, according to the vaccine effectiveness estimates provided by the U.S. Flu Vaccine Effectiveness Network.
Preferential use of the live attenuated influenza vaccine (LAIV) among young children, a recommendation previously published by the Advisory Committee on Immunization Practices, was not supported.
During the 2014-2015 influenza season, a total of 9,710 patients seeking outpatient medical treatment for acute respiratory infection with cough were enrolled into the U.S. Flu Vaccine Effectiveness study, reported Richard Zimmerman, MD, of the University of Pittsburgh, and his colleagues (Clin Infect Dis. 2016 Oct 4. doi: 10.1093/cid/ciw635).
Of these, 9,311 participants had complete data, and 7,078 (76%) tested negative for influenza. A total of 1,840 participants tested positive for influenza A – 99% of these cases were strain A/H3N2 – and 395 participants tested positive for influenza B.
Of the 4,360 vaccinated participants with known vaccine type, 39.7% received standard dose trivalent, 1.6% received high dose trivalent, 46.8% received standard dose quadrivalent, and 11.9% received quadrivalent live-attenuated vaccines. 
For influenza A and B combined, the overall adjusted vaccine effectiveness was 19% (95% Confidence Interval, 10-27%) against all medically attended influenza and was statistically significant in all age groups except 18-49 years.
Across all vaccine types, the vaccine effectiveness for the A/H3N2 strain was 6% (95% CI, -5-17%), estimates were similar across all age groups, and all vaccine types were similarly ineffective. These estimates were “consistent with a mismatch between the vaccine and circulating viruses,” the researchers noted.
Overall vaccine effectiveness for influenza B/Yamagata was 55% (95% CI, 43% to 65%) and was similarly significant in all age strata except 50-64 year olds. Trivalent vaccines were more effective at preventing influenza B and, of note, no cases of influenza B occurred among those who received a high dose trivalent flu vaccine.
The study was supported by the Centers for Disease Control and Prevention and the National Institutes of Health. Dr. Zimmerman and four other investigators reported receiving research funding from several pharmaceutical companies.
[email protected]
On Twitter @jessnicolecraig
The 2014-2015 influenza vaccines offered little protection against the predominant influenza A/H3N2 virus, but were effective against influenza B, according to the vaccine effectiveness estimates provided by the U.S. Flu Vaccine Effectiveness Network.
Preferential use of the live attenuated influenza vaccine (LAIV) among young children, a recommendation previously published by the Advisory Committee on Immunization Practices, was not supported.
During the 2014-2015 influenza season, a total of 9,710 patients seeking outpatient medical treatment for acute respiratory infection with cough were enrolled into the U.S. Flu Vaccine Effectiveness study, reported Richard Zimmerman, MD, of the University of Pittsburgh, and his colleagues (Clin Infect Dis. 2016 Oct 4. doi: 10.1093/cid/ciw635).
Of these, 9,311 participants had complete data, and 7,078 (76%) tested negative for influenza. A total of 1,840 participants tested positive for influenza A – 99% of these cases were strain A/H3N2 – and 395 participants tested positive for influenza B.
Of the 4,360 vaccinated participants with known vaccine type, 39.7% received standard dose trivalent, 1.6% received high dose trivalent, 46.8% received standard dose quadrivalent, and 11.9% received quadrivalent live-attenuated vaccines.
For influenza A and B combined, the overall adjusted vaccine effectiveness was 19% (95% Confidence Interval, 10-27%) against all medically attended influenza and was statistically significant in all age groups except 18-49 years.
Across all vaccine types, the vaccine effectiveness for the A/H3N2 strain was 6% (95% CI, -5-17%), estimates were similar across all age groups, and all vaccine types were similarly ineffective. These estimates were “consistent with a mismatch between the vaccine and circulating viruses,” the researchers noted.
Overall vaccine effectiveness for influenza B/Yamagata was 55% (95% CI, 43% to 65%) and was similarly significant in all age strata except 50-64 year olds. Trivalent vaccines were more effective at preventing influenza B and, of note, no cases of influenza B occurred among those who received a high dose trivalent flu vaccine.
The study was supported by the Centers for Disease Control and Prevention and the National Institutes of Health. Dr. Zimmerman and four other investigators reported receiving research funding from several pharmaceutical companies.
[email protected]
On Twitter @jessnicolecraig
Key clinical point:
Major finding: Across all vaccine types, the vaccine effectiveness for the A/H3N2 strain was 6%.
Data source: Retrospective analysis of 9,710 patients who sought outpatient medical treatment during the 2014-2015 influenza season.
Disclosures: The study was supported by the Centers for Disease Control and Prevention and the National Institutes of Health. Dr. Zimmerman and four other investigators reported receiving research funding from several pharmaceutical companies.
Treated bacteremia that clears, then recurs, termed ‘skip phenomenon’
NEW ORLEANS – When Mayo Clinic physicians noticed some patients on appropriate antibiotic treatment for Staphylococcus aureus bacteremia cleared the infection, only to see it recur a few days later, Justin A. Fiala, MD and his colleagues grew curious.
Dr. Fiala, an infectious diseases internist at Mayo Clinic, Rochester, Minn., was intrigued by the possibility of fluctuating blood culture positivity in this subset of bacteremia patients.
“We wanted first to see whether or not this is a real entity and determine the prevalence of this ‘skip pattern,’” Dr. Fiala said at IDWeek 2016, the annual combined meetings of the Infectious Diseases Society of America, the Society for Healthcare Epidemiology of America, the HIV Medicine Association and the Pediatric Infectious Diseases Society. He said identifying predictors and finding any differences in clinical outcomes compared to control S. aureus bacteremia (SAB) patients were additional aims.
Dr. Fiala and his colleagues assessed a hospitalized cohort of 726 adults with SAB at Mayo Clinic between July 2006 and June 2011. Patients with one or more negative blood cultures followed by a positive culture were identified within this group, and compared with 2 to 4 patients matched for age, sex and duration of bacteremia who served as controls.
The investigators found 29 patients – or 4% – of the 726 had this ‘skip pattern’ of infection, clearance, and reinfection. Those with the phenomenon were 90% male and tended to be older, with a mean age of 69 years, compared to the controls. They had index bacteremia about two days longer than controls. The study also revealed a significant difference in mean number of central venous catheters: 2.7 in the skip phenomenon group versus 1.7 in controls.

Given the predominance of the skip phenomenon in older, immunosuppressed males, “the takeaway … is that serial negative blood cultures may be warranted in these patient groups,” Dr. Fiala said.
The groups did not differ significantly by presence of implants or foreign bodies or by whether SAB was nosocomial or acquired in the community. “We thought it was interesting that 90% had immune suppression, although it was not statistically significant,” Dr. Fiala said.
With no prior reports in the medical literature, the researchers named this clinical entity “skip phenomenon.” Dr. Fiala noted that published studies have assessed recurrence of SAB after completion of antibiotics, but not specifically during treatment.
“We think this is a topic that is quite clinically prevalent and applicable,” Dr. Fiala said. He pointed out that SAB is common, accounting for about 20% of all nosocomial bacteremia cases. SAB also highly virulent with a mortality rate estimated between 20% and 35%. Although the study did not reveal significant mortality differences in the subgroup with skip phenomenon, “we can say there is increased morbidity.”
The most recent IDSA guidelines state that a single set of negative blood cultures is sufficient to demonstrate clearance of SAB, Dr. Fiala said. “Could this be falsely reassuring if Staphylococcus aureus does have a tendency to exhibit this fluctuating pattern?”
The retrospective design of the study and the relatively small number of patients with the skip phenomenon were limitations, the investigators acknowledged. Dr. Fiala had no relevant disclosures.
NEW ORLEANS – When Mayo Clinic physicians noticed some patients on appropriate antibiotic treatment for Staphylococcus aureus bacteremia cleared the infection, only to see it recur a few days later, Justin A. Fiala, MD and his colleagues grew curious.
Dr. Fiala, an infectious diseases internist at Mayo Clinic, Rochester, Minn., was intrigued by the possibility of fluctuating blood culture positivity in this subset of bacteremia patients.
“We wanted first to see whether or not this is a real entity and determine the prevalence of this ‘skip pattern,’” Dr. Fiala said at IDWeek 2016, the annual combined meetings of the Infectious Diseases Society of America, the Society for Healthcare Epidemiology of America, the HIV Medicine Association and the Pediatric Infectious Diseases Society. He said identifying predictors and finding any differences in clinical outcomes compared to control S. aureus bacteremia (SAB) patients were additional aims.
Dr. Fiala and his colleagues assessed a hospitalized cohort of 726 adults with SAB at Mayo Clinic between July 2006 and June 2011. Patients with one or more negative blood cultures followed by a positive culture were identified within this group, and compared with 2 to 4 patients matched for age, sex and duration of bacteremia who served as controls.
The investigators found 29 patients – or 4% – of the 726 had this ‘skip pattern’ of infection, clearance, and reinfection. Those with the phenomenon were 90% male and tended to be older, with a mean age of 69 years, compared to the controls. They had index bacteremia about two days longer than controls. The study also revealed a significant difference in mean number of central venous catheters: 2.7 in the skip phenomenon group versus 1.7 in controls.
Given the predominance of the skip phenomenon in older, immunosuppressed males, “the takeaway … is that serial negative blood cultures may be warranted in these patient groups,” Dr. Fiala said.
The groups did not differ significantly by presence of implants or foreign bodies or by whether SAB was nosocomial or acquired in the community. “We thought it was interesting that 90% had immune suppression, although it was not statistically significant,” Dr. Fiala said.
With no prior reports in the medical literature, the researchers named this clinical entity “skip phenomenon.” Dr. Fiala noted that published studies have assessed recurrence of SAB after completion of antibiotics, but not specifically during treatment.
“We think this is a topic that is quite clinically prevalent and applicable,” Dr. Fiala said. He pointed out that SAB is common, accounting for about 20% of all nosocomial bacteremia cases. SAB also highly virulent with a mortality rate estimated between 20% and 35%. Although the study did not reveal significant mortality differences in the subgroup with skip phenomenon, “we can say there is increased morbidity.”
The most recent IDSA guidelines state that a single set of negative blood cultures is sufficient to demonstrate clearance of SAB, Dr. Fiala said. “Could this be falsely reassuring if Staphylococcus aureus does have a tendency to exhibit this fluctuating pattern?”
The retrospective design of the study and the relatively small number of patients with the skip phenomenon were limitations, the investigators acknowledged. Dr. Fiala had no relevant disclosures.
Key clinical point:
Major finding: About 4% of S. aureus bacteremia cases may not clear completely, as judged by one negative blood culture, contrary to recent IDSA guidelines.
Data source: Nested case-control study of 726 adult inpatients at Mayo Clinic between July 2006 and June 2011 with ≥3 days of S. aureus bacteremia.
Disclosures: Dr. Fiala had no relevant disclosures.
Adaptive servo ventilation cuts atrial fib burden
ORLANDO – Adaptive servo ventilation produced a significant and clinically meaningful reduction in atrial fibrillation burden in patients with heart failure and sleep apnea in results from an exploratory, prospective, randomized study with 35 patients.
Adaptive servo ventilation (ASV) “may be an effective antiarrhythmic treatment producing a significant reduction in atrial fibrillation without clear evidence of being proarrhythmogenic,” Jonathan P. Piccini, MD, said at the annual scientific meeting of the Heart Failure Society of America. “Given the potential importance of this finding further studies should validate and quantify the efficacy of ASV for reducing atrial fibrillation in patients with or without heart failure.”
“A mound of data has shown that treating sleep apnea reduced arrhythmias, but until now it’s all been observational and retrospective,” Dr. Piccini, an electrophysiologist at Duke University in Durham, N.C., said in an interview. The study he reported is “the first time” the arrhythmia effects of a sleep apnea intervention, in this case ASV, was studied in a prospective, randomized way while using implanted devices to measure the antiarrhythmic effect of the treatment.
The new finding means that additional, larger studies are now needed, he said. “If patients have sleep apnea, treating the apnea may be an incredibly important way to prevent AF or reduce its burden”
The CAT-HF (Cardiovascular Improvements With Minute Ventilation-Targeted ASV Therapy in Heart Failure) trial was originally designed to randomize 215 heart failure patients with sleep disordered breathing – and who were hospitalized for heart failure – to optimal medical therapy with or without ASV at any of 15 centers in the United States and Germany. But in August 2015, results from the SERVE-HF (Treatment of Sleep-Disordered Breathing with Predominant Central Sleep Apnea by Adaptive Servo Ventilation in Patients with Heart Failure) trial, which generally had a similar design to CAT-HF, showed an unexpected danger from ASV in patients with central sleep apnea and heart failure with reduced ejection fraction (N Engl J Med. 2015 Sept 17;373[12]:1095-105). In SERVE-HF, ASV was associated with significant increases in all-cause and cardiovascular mortality. As a result, enrollment into CAT-HF stopped prematurely with just 126 patients entered, and ASV treatment of patients already enrolled came to a halt.
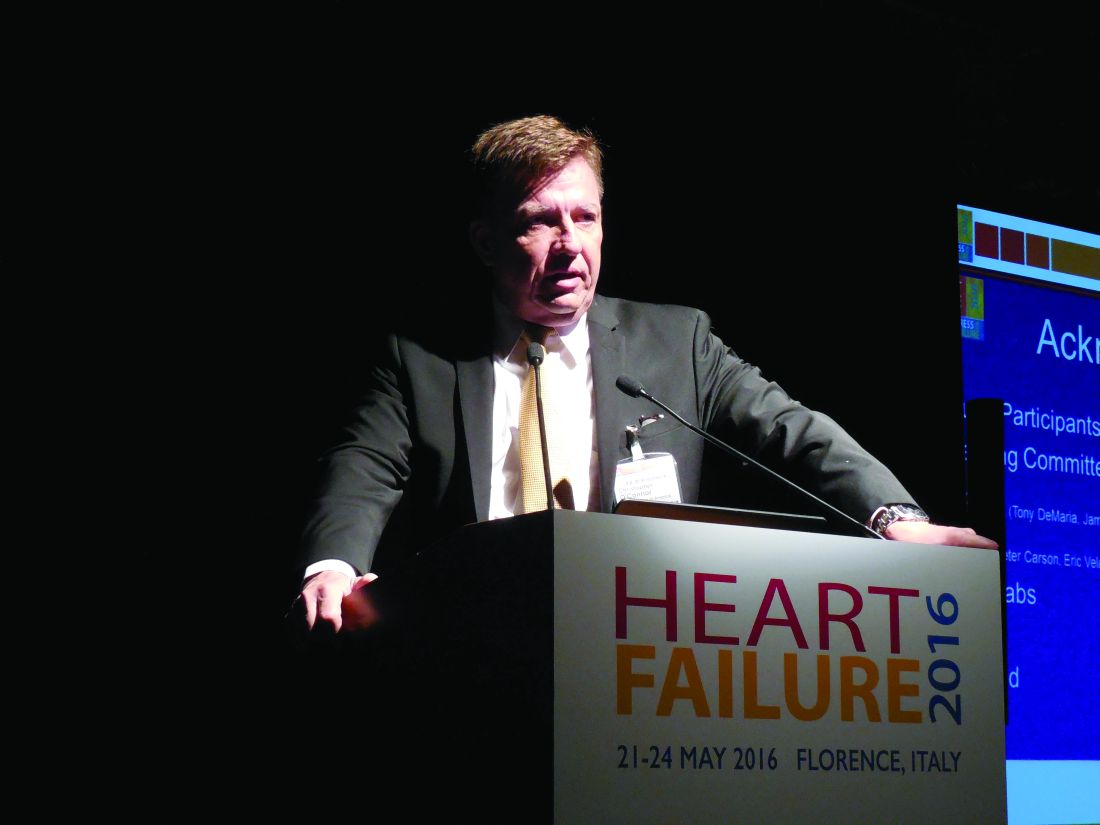
The primary endpoint in the underpowered and shortened CAT-HF study, survival without cardiovascular hospitalization and with improved functional capacity measured on a 6-minute walk test, showed similar outcomes in both the ASV and control arms. But in a prespecified subgroup analysis by baseline ejection fraction, the 24 patients with heart failure with preserved ejection fraction (19% of the CAT-HF enrollment) showed a statistically significant, 62% relative improvement in the primary endpoint linked with ASV treatment compared with similar patients who did not receive ASV, Christopher M. O’Connor, MD, professor of medicine at Duke University, reported in May 2016 at the European Heart Failure meeting in Florence.
Dr. Piccini’s report focused on a prespecified subgroup analysis of CAT-HF designed to examine the impact of ASV on arrhythmias. Assessment of the impact of ASV on atrial fibrillation was possible in 35 of the 126 patients in CAT-HF who had an implanted cardiac device (pacemaker, defibrillator, or cardiac resynchronization device) with an atrial lead, and assessment of ventricular arrhythmias occurred in 46 of the CAT-HF patients with an implanted high-voltage device (a defibrillator or resynchronization device) that allowed monitoring of ventricular arrhythmias.
For the atrial fibrillation analysis, the 35 patients averaged 60 years of age, and about 90% had a reduced ejection fraction. About two-thirds had an apnea-hypopnea index greater than 30.
The results showed that the 19 patients randomized to receive ASV had an average atrial fibrillation burden of 30% at baseline that dropped to 14% after 6 months of treatment. In contrast, the 16 patients in the control arm had a AF burden of 6% at baseline and 8% after 6 months. The between-group difference for change in AF burden was statistically significant, Dr. Piccini reported, with a burden that decreased by a relative 21% with ASV treatment and increased by a relative 31% in the control arm.
Analysis of the ventricular arrhythmia subgroup showed that ASV had no statistically significant impact for either lowering or raising ventricular tachyarrhythmias or fibrillations.
Trying to reconcile this AF benefit and lack of ventricular arrhythmia harm from ASV in CAT-HF with the excess in cardiovascular deaths seen with ASV in SERVE-HF, Dr. Piccini speculated that some of the SERVE-HF deaths may not have been related to arrhythmia.
“Sudden cardiac death adjudication is profoundly difficult, and does not always equal ventricular arrhythmia,” he said. “We need to consider that some of the adverse events in patients with severe central sleep apnea and low left ventricular ejection fraction [enrolled in SERVE-HF] may have been due to causes other than arrhythmias. The CAT-HF results should motivate investigations of alternative mechanisms of death in SERVE-HF.”
The CAT-HF trial was funded by ResMed, a company that markets adaptive servo ventilation equipment. Dr. Piccini has received research support from ResMed and from Janssen, Gilead, St. Jude, Spectranetics, and he has been a consultant to Janssen, Spectranetics, Medtronic, GSK and BMS-Pfizer. Dr. O’Connor has been a consultant to ResMed and to several other drug and device companies.
[email protected]
On Twitter @mitchelzoler
A small prespecified sub-group of patients in the CAT-HF (Cardiovascuar improvements with minute ventilation-targeted ASV therapy in heart failure) trial randomized to adaptive servo ventilation (ASV) showed a 21% relative reduction in atrial fibrillation burden as compared to the control arm which had only 31% relative reduction. While the CAT-HF study was discontinued following results of SERVE-HF trial, this subgroup analysis included 35 patients (19 ASV arm; 16 control arm), the majority of whom had a reduced ejection fraction. This report poses interesting questions about effects of ASV on atrial fibrillation burden in those with reduced EF given the finding that central sleep apnea and Cheyne-Stokes respiration are shown to be associated with incident atrial fibrillation in older men (May et al. Am J Respir Crit Care Med 2016).
A small prespecified sub-group of patients in the CAT-HF (Cardiovascuar improvements with minute ventilation-targeted ASV therapy in heart failure) trial randomized to adaptive servo ventilation (ASV) showed a 21% relative reduction in atrial fibrillation burden as compared to the control arm which had only 31% relative reduction. While the CAT-HF study was discontinued following results of SERVE-HF trial, this subgroup analysis included 35 patients (19 ASV arm; 16 control arm), the majority of whom had a reduced ejection fraction. This report poses interesting questions about effects of ASV on atrial fibrillation burden in those with reduced EF given the finding that central sleep apnea and Cheyne-Stokes respiration are shown to be associated with incident atrial fibrillation in older men (May et al. Am J Respir Crit Care Med 2016).
A small prespecified sub-group of patients in the CAT-HF (Cardiovascuar improvements with minute ventilation-targeted ASV therapy in heart failure) trial randomized to adaptive servo ventilation (ASV) showed a 21% relative reduction in atrial fibrillation burden as compared to the control arm which had only 31% relative reduction. While the CAT-HF study was discontinued following results of SERVE-HF trial, this subgroup analysis included 35 patients (19 ASV arm; 16 control arm), the majority of whom had a reduced ejection fraction. This report poses interesting questions about effects of ASV on atrial fibrillation burden in those with reduced EF given the finding that central sleep apnea and Cheyne-Stokes respiration are shown to be associated with incident atrial fibrillation in older men (May et al. Am J Respir Crit Care Med 2016).
ORLANDO – Adaptive servo ventilation produced a significant and clinically meaningful reduction in atrial fibrillation burden in patients with heart failure and sleep apnea in results from an exploratory, prospective, randomized study with 35 patients.
Adaptive servo ventilation (ASV) “may be an effective antiarrhythmic treatment producing a significant reduction in atrial fibrillation without clear evidence of being proarrhythmogenic,” Jonathan P. Piccini, MD, said at the annual scientific meeting of the Heart Failure Society of America. “Given the potential importance of this finding further studies should validate and quantify the efficacy of ASV for reducing atrial fibrillation in patients with or without heart failure.”
“A mound of data has shown that treating sleep apnea reduced arrhythmias, but until now it’s all been observational and retrospective,” Dr. Piccini, an electrophysiologist at Duke University in Durham, N.C., said in an interview. The study he reported is “the first time” the arrhythmia effects of a sleep apnea intervention, in this case ASV, was studied in a prospective, randomized way while using implanted devices to measure the antiarrhythmic effect of the treatment.
The new finding means that additional, larger studies are now needed, he said. “If patients have sleep apnea, treating the apnea may be an incredibly important way to prevent AF or reduce its burden”
The CAT-HF (Cardiovascular Improvements With Minute Ventilation-Targeted ASV Therapy in Heart Failure) trial was originally designed to randomize 215 heart failure patients with sleep disordered breathing – and who were hospitalized for heart failure – to optimal medical therapy with or without ASV at any of 15 centers in the United States and Germany. But in August 2015, results from the SERVE-HF (Treatment of Sleep-Disordered Breathing with Predominant Central Sleep Apnea by Adaptive Servo Ventilation in Patients with Heart Failure) trial, which generally had a similar design to CAT-HF, showed an unexpected danger from ASV in patients with central sleep apnea and heart failure with reduced ejection fraction (N Engl J Med. 2015 Sept 17;373[12]:1095-105). In SERVE-HF, ASV was associated with significant increases in all-cause and cardiovascular mortality. As a result, enrollment into CAT-HF stopped prematurely with just 126 patients entered, and ASV treatment of patients already enrolled came to a halt.
The primary endpoint in the underpowered and shortened CAT-HF study, survival without cardiovascular hospitalization and with improved functional capacity measured on a 6-minute walk test, showed similar outcomes in both the ASV and control arms. But in a prespecified subgroup analysis by baseline ejection fraction, the 24 patients with heart failure with preserved ejection fraction (19% of the CAT-HF enrollment) showed a statistically significant, 62% relative improvement in the primary endpoint linked with ASV treatment compared with similar patients who did not receive ASV, Christopher M. O’Connor, MD, professor of medicine at Duke University, reported in May 2016 at the European Heart Failure meeting in Florence.
Dr. Piccini’s report focused on a prespecified subgroup analysis of CAT-HF designed to examine the impact of ASV on arrhythmias. Assessment of the impact of ASV on atrial fibrillation was possible in 35 of the 126 patients in CAT-HF who had an implanted cardiac device (pacemaker, defibrillator, or cardiac resynchronization device) with an atrial lead, and assessment of ventricular arrhythmias occurred in 46 of the CAT-HF patients with an implanted high-voltage device (a defibrillator or resynchronization device) that allowed monitoring of ventricular arrhythmias.
For the atrial fibrillation analysis, the 35 patients averaged 60 years of age, and about 90% had a reduced ejection fraction. About two-thirds had an apnea-hypopnea index greater than 30.
The results showed that the 19 patients randomized to receive ASV had an average atrial fibrillation burden of 30% at baseline that dropped to 14% after 6 months of treatment. In contrast, the 16 patients in the control arm had a AF burden of 6% at baseline and 8% after 6 months. The between-group difference for change in AF burden was statistically significant, Dr. Piccini reported, with a burden that decreased by a relative 21% with ASV treatment and increased by a relative 31% in the control arm.
Analysis of the ventricular arrhythmia subgroup showed that ASV had no statistically significant impact for either lowering or raising ventricular tachyarrhythmias or fibrillations.
Trying to reconcile this AF benefit and lack of ventricular arrhythmia harm from ASV in CAT-HF with the excess in cardiovascular deaths seen with ASV in SERVE-HF, Dr. Piccini speculated that some of the SERVE-HF deaths may not have been related to arrhythmia.
“Sudden cardiac death adjudication is profoundly difficult, and does not always equal ventricular arrhythmia,” he said. “We need to consider that some of the adverse events in patients with severe central sleep apnea and low left ventricular ejection fraction [enrolled in SERVE-HF] may have been due to causes other than arrhythmias. The CAT-HF results should motivate investigations of alternative mechanisms of death in SERVE-HF.”
The CAT-HF trial was funded by ResMed, a company that markets adaptive servo ventilation equipment. Dr. Piccini has received research support from ResMed and from Janssen, Gilead, St. Jude, Spectranetics, and he has been a consultant to Janssen, Spectranetics, Medtronic, GSK and BMS-Pfizer. Dr. O’Connor has been a consultant to ResMed and to several other drug and device companies.
[email protected]
On Twitter @mitchelzoler
Key clinical point:
Major finding: After 6 months, ASV produced a relative 21% drop in atrial fibrillation burden, compared with increased burden in control patients.
Data source: CAT-HF, a multicenter randomized trial that enrolled 126 heart failure patients with sleep apnea.
Disclosures: The CAT-HF trial was funded by ResMed, a company that markets adaptive servo ventilation equipment. Dr. Piccini has received research support and/or consultant fees from ResMed, Janssen, Gilead, St. Jude, Spectranetics, Medtronic, GSK and BMS-Pfizer.
HIV research update: Early October 2016
A great volume of HIV and AIDS research enters the medical literature every month. It’s difficult to monitor everything, so here’s a quick look at some notable news items and journal articles published over the past few weeks.
A recent neurocognitive study found that executive dysfunction persists among young adults with perinatal HIV infection in comparison to controls.
Interventions designed for the prevention of mother-to-child transmission of HIV infection have prevented nearly 22,000 cases of perinatal HIV transmission in the United States since 1994.
HIV pre-exposure prophylaxis (PrEP) use reduced fear and shame associated with sex and facilitated greater sexual satisfaction and intimacy among men who have sex with men, according to a study by investigators at the University of Washington.
A study in HIV Medicine found that several of the World Health Organization’s HIV drug resistance (HIVDR) early warning indicators (EWIs) were associated with and predictive of HIVDR, supporting the WHO EWIs as a component of the HIVDR prevention method in settings where HIVDR testing is not routinely or widely available.
Findings from a large multi-center Ethiopian study suggest that sub-optimal adherence to combination antiretroviral therapy (cART) was present in up to a quarter of HIV patients, despite a high degree of average adherence to cART.
Developing strategies and interventions to facilitate parent–adolescent communication about sex-related topics, particularly HIV prevention and condom use, may be important to increase HIV testing among young women and men, according to a study in AIDS Care.
A French study found that comorbidities and coprescriptions are highly prevalent in ageing HIV-infected patients, especially those with a long history of HIV infection.
A review article in AIDS Research and Therapy noted that HIV-associated pulmonary tuberculosis treatment mandates a committed approach that encompasses both effective as well as enduring therapy originating from newer drug combinations, evolving ideas and emerging concepts from clinical trials globally.
Home-based HIV testing remains an efficient strategy to diagnose and link to care in settings with high levels of HIV awareness, according to a recent study in Chiradzulu District, Malawi.
A recent study suggests that obesity is an additional health burden to people living with HIV and that their daily dietary practices are not meeting the U.S. government-recommended nutritional standards.
Implementation of the Affordable Care Act was followed by HIV-positive patient enrollment growth and improved viral control in Kaiser Permanente Northern California, according to a study in JAIDS.
A pediatric study found that the statin drug atorvastatin lowered total cholesterol, LDL cholesterol, non-HDL cholesterol and apolipoprotein B in HIV-infected youth with antiretroviral-associated hyperlipidemia. The authors said atorvastatin could be considered for HIV-infected children with hyperlipidemia.
Subsequent to the initiation of combination antiretroviral therapy (cART) in HIV patients, immunological recovery rather than type of antiretroviral therapy is the major driver of changes in cognitive function.
Among malnourished antiretroviral-eligible HIV-positive adults in Zambia and Tanzania, pre-ART mortality was twice that in the early post-ART period, suggesting many early ART deaths represent advanced HIV disease rather than treatment-related events.
A study in JAIDS found that drug regimen simplification from a 5-tablet regimen to the 2-tablet, once-daily combination of elvitegravir/cobicistat/emtricitabine/tenofovir alafenamide plus darunavir has durable maintenance of virologic suppression and improvements in specific markers of renal safety.
An analysis in BMC Infectious Diseases revealed that the clinical outcomes of generic version of abacavir/lamivudine and efavirenz in HIV treatment naïve patients showed the expected safety and effectiveness profile of proprietary antiretroviral drugs.
Implementation of proper and integrated malaria preventive measures as well as frequent monitoring of anemia on prescription of antiretroviral therapy could likely improve the health conditions of HIV-infected children.
[email protected]
On Twitter @richpizzi
Drug approved to treat hemophilia B in Switzerland

Photo courtesy of Biogen
The Swiss Agency for Therapeutic Products, Swissmedic, has approved eftrenonacog alfa (Alprolix®) for the treatment of hemophilia B.
Eftrenonacog alfa is a recombinant factor IX Fc fusion protein indicated for both on-demand treatment and prophylaxis in previously treated patients with hemophilia B.
For prophylaxis, 1 dose of eftrenonacog alfa can be given every 7 days or every 10 days, with the ability to adjust the dosing interval based on individual response.
Eftrenonacog alfa is the only recombinant factor IX Fc fusion protein therapy approved in Switzerland for the treatment of hemophilia B.
“The Swiss approval of Alprolix is an important milestone for the hemophilia community, offering the opportunity for people with hemophilia B to experience prolonged protection from bleeds,” said Krassimir Mitchev, MD, PhD, vice president and medical therapeutic area head of hemophilia at Sobi, the company developing eftrenonacog alfa in collaboration with Biogen.
“We will now focus on ensuring timely and sustainable access to Alprolix in Switzerland.”
About eftrenonacog alfa
Eftrenonacog alfa is a recombinant clotting factor therapy developed by fusing factor IX to the Fc portion of immunoglobulin G subclass 1 (IgG1). This enables eftrenonacog alfa to use a naturally occurring pathway to prolong the time the therapy remains in the body.
Eftrenonacog alfa is currently approved for the treatment of hemophilia B in the European Economic Area, the US, Canada, Japan, Australia, New Zealand, and other countries.
Sobi and Biogen collaborate on the development and commercialization of eftrenonacog alfa.
The product has been evaluated in two phase 3 trials of patients with hemophilia B: the B-LONG study and the Kids B-LONG study.
B-LONG study
The B-LONG study included 123 male subjects with severe hemophilia B who were 12 years of age or older. They had no current or previous factor IX inhibitors and a history of 100 or more documented prior exposure days to factor IX products.
Patients received eftrenonacog alfa in 1 of 4 treatment arms:
- Weekly prophylaxis starting at 50 IU/kg, with pharmacokinetic (PK)-driven dose adjustments (n=63)
- Individualized interval prophylaxis starting at 100 IU/kg every 10 days, with PK-driven interval adjustments (n=29)
- On-demand treatment at 20 IU/kg to 100 IU/kg (n=27)
- Perioperative management (n=12, including 8 from arms 1-3).
Researchers assessed control of bleeding in all patients who experienced
a bleeding episode while on study. In total, 90.4% of bleeding episodes
were controlled by a single injection of eftrenonacog alfa.
The overall median annualized bleeding rates (ABRs)—including spontaneous and traumatic bleeds—were 2.95 in the weekly prophylaxis arm, 1.38 in the individualized interval prophylaxis arm, and 17.69 in the episodic treatment arm.
The perioperative management arm consisted of 12 patients undergoing 14 major surgical procedures. The treating physicians rated the hemostatic efficacy of eftrenonacog alfa as “excellent” or “good” in all surgeries.
Eftrenonacog alfa was considered generally well-tolerated. None of the patients developed inhibitors, and none reported anaphylaxis.
The most common adverse events—with an incidence of 5% or greater—occurring outside of the perioperative management arm were nasopharyngitis, influenza, arthralgia, upper respiratory infection, hypertension, and headache.
One serious adverse event may have been drug-related. The patient experienced obstructive uropathy in the setting of hematuria. However, he continued to receive eftrenonacog alfa, and the event resolved with medical management.
Kids B-LONG
In Kids B-LONG, researchers tested eftrenonacog alfa in 30 previously treated children younger than 12 who had severe hemophilia B. Patients had at least 50 prior exposure days to factor IX therapies.
Children who received eftrenonacog alfa prophylactically had an overall median ABR of 1.97. The median ABR for spontaneous joint bleeds was 0.
Approximately 33% of patients did not experience any bleeding episodes. About 92% of bleeding episodes were controlled by 1 or 2 injections of eftrenonacog alfa.
None of the patients developed inhibitors. Researchers said there were no treatment-related serious adverse events and no cases of serious allergic reactions or vascular thrombotic events.
None of the patients discontinued the study due to an adverse event. One adverse event—decreased appetite occurring in 1 patient—was considered related to eftrenonacog alfa.
The pattern of treatment-emergent adverse events in this study was generally consistent with results seen in adolescents and adults in the B-LONG study. ![]()
Surgical treatment tops medical management of prosthetic valve endocarditis
NEW ORLEANS – Over the years patients with prosthetic valve endocarditis treated at Cleveland Clinic tended to fare better with surgery compared to medical management, some clinicians noted. However, there was no data to confirm their observations.
“It was not recognized widely. A lot of our colleagues continued to believe it could be adequately treated with the right antibiotic,” Nabin K. Shrestha, MD, said at the IDWeek 2016 annual meeting on infectious diseases.
So Dr Shrestha and his colleagues conducted a retrospective cohort study to compare outcomes between 253 surgically treated adults and 77 others treated medically between April 2008 and December 2012. Survival from the time of treatment decision was the primary outcome.
The groups differed on some demographic and clinical factors. For example, the medically treated group was older, had fewer men, and more patients with mitral valves. “We might think the medical patients might be too sick for surgery, and that could certainly be true, but … they could have been too well for surgery too,” Dr. Shrestha said. To control for these differences between groups, the investigators performed a number of statistical analyses, including a propensity score adjusted model and reduced Cox proportion hazards model.
“Patients with PVE have a high hazard of death if treated medically,” Dr. Shrestha said, based on a 6.68 hazard ratio. The higher risk of death associated with medical treatment remained significant when adjusted for age, sex, and other factors. “Compared to surgical treatment, medical treatment was associated with a seven-fold higher hazard of death overall,” Dr. Shrestha said at the combined annual meetings of the Infectious Diseases Society of America, the Society for Healthcare Epidemiology of America, the HIV Medicine Association, and the Pediatric Infectious Diseases Society.
The medical treatment group also fared worse on a number of secondary outcomes. For example, this group had a five-fold higher risk of death during hospitalization compared to the surgery group (odds ratio, 4.65); a 12-fold higher risk of death within one year (OR, 11.70); a seven-fold higher risk of subsequent surgery for infective endocarditis (OR, 6.57); and an eight-fold higher odds of surgery for the same episode of infective endocarditis at a subsequent hospitalization (OR, 8.02).
A large sample size and setting the date of management decision as time zero to avoid survival selection bias “give us confidence in our findings.” Limitations include an inability to look at some important variables because of the retrospective design.
A meeting attendee commented that surgeons often request a patient be optimized medically prior to surgery, and asked if investigators looked at time from hospitalization to the operation.
“The median date from admission to surgery was six days in our database,” said Dr. Shrestha, who is a staff physician at the Cleveland Clinic in Ohio.
“Medical treatment overall is associated with significantly poorer outcomes in patients with PVE compared with surgical treatment,” Dr. Shrestha said. “Although some patients are not candidates for surgery, a definite diagnosis of PVE should prompt a surgical evaluation in the majority of patients.”
Dr. Shrestha reported having no disclosures.
Key clinical point:
Major finding: Compared to surgery, odds of death within one year higher were almost 7 times greater with medical treatment (hazard ratio, 6.68).
Data source: Presentation at IDWeek 2016
Disclosures: Dr. Nabin K. Shrestha had no relevant disclosures.
Homeless youth and risk: Untangling role of executive function
NEW YORK – Researchers studying the executive functioning ability of homeless youth have found that individuals with poor executive function report more alcohol abuse and dependence than do those with higher EF.
The results are from a study of 149 youth aged 18-22 years (53% female) living in shelters in Chicago. Subjects self-reported behaviors in a series of interviews that used three validated measures of executive function.
Scott J. Hunter, Ph.D., director of neuropsychology at the University of Chicago, presented the findings at the annual meeting of the American Academy of Child and Adolescent Psychiatry. Dr. Hunter said in an interview that the results help identify low executive functioning as both a likely contributor to risk-taking behavior and a potential target of interventions.
“We believe that the EF may be the primary concern, although the interaction [with drugs and alcohol] is something that we have to take into account,” he said. “One of the biggest issues here is how do you disentangle that executive piece with the use of substances?”
In this cohort, Dr. Hunter said, about 75% of subjects were African American and an additional 25% or so were mixed race or Latino. About half comprised a sexual minority (gay, lesbian, bisexual, or transgender). “Many had been kicked out of their homes,” he said.
Close to 80% of the youth in the study used cannabis regularly, and three-quarters used alcohol. The group with low EF used the greatest level of substances regularly. Admission of unprotected sexual intercourse was highest among the heavier substance users as well, suggesting “a reliance on substances to reduce sensitivity to the risks they were taking,” said Dr. Hunter, also a professor in the departments of psychiatry and behavioral neuroscience, and pediatrics at the university.
He said the study “is providing some support for our hypothesis that the less successful these young people are in their development of EF, particularly around inhibition, the more likely it is they are going to be engaging in risk-taking behaviors that lead to cycles of more challenge” and development of psychopathology.
The researchers are considering an intervention for this population derived from EF interventions for use with adolescents with attention-deficit/hyperactivity disorder. In their current shelter environments, he said, the youth are “already undergoing programs to learn adaptive functioning to be more successful, and we’re thinking of adding an executive component where they tie the decision-making component to what they want as outcomes.”
The prefrontal cortex of the brain, which controls executive function, is not yet fully developed in adolescence, and studies have shown that youth growing up in impoverished environments have decreases or alterations in cortical development (Front Hum Neurosci. 2012 Aug 17;6:238). “What we have to think about is that we’re still at a [developmental] point where this enhancement and myelination is taking place – into the mid-20s, in fact. We may find that [an intervention] can help them better activate that,” Dr. Hunter said.
The lead author on this study was Joshua Piche, a medical student at the University of Chicago.
Dr. Hunter also is collaborating with epidemiologist John Schneider, MD, MPH, of the University of Chicago, in a study of 600 young black men who have sex with men. The researchers are looking at drug-, alcohol-related, and sexual decision-making in that cohort, about a quarter of whom are homeless. The study includes functional magnetic resonance imaging in a subgroup of subjects.
Currently, as many as 2 million U.S. youth are estimated to be living on the streets, in shelters, or in other temporary housing environments.
Mediterranean diet for secondary prevention cuts all-cause mortality
ROME – Adherence to the traditional Mediterranean diet by patients with known heart or cerebrovascular disease was independently linked with a marked reduction in their risk of all-cause mortality in the Italian Moli-Sani Study, Giovanni de Gaetano, MD, reported at the annual congress of the European Society of Cardiology.
Subjects in the top tertile in terms of food intake consistent with the Mediterranean diet were 37% less likely to die during more than 7 years of follow-up than were those in the bottom tertile, according to Dr. de Gaetano, head of the department of epidemiology and prevention at the IRCCS Mediterranean Neurologic Institute in Pozzilli, Italy.
The Moli-Sani Study is an ongoing population-based epidemiologic study of 25,000 adults in the mountainous, heavily agricultural Molise region of southern Italy. Dr. de Gaetano, who directs the study, presented a substudy involving 1,197 participants with established coronary heart disease or cerebrovascular disease at entry. Their average age at enrollment was 66 years. Subjects with coronary heart disease outnumbered those with cerebrovascular disease by roughly 2:1.
Food intake was recorded using the European Prospective Investigation into Cancer (EPIC) food-frequency questionnaire. Dr. de Gaetano and his coinvestigators assessed adherence to the traditional Mediterranean diet using the Mediterranean Diet Score (MDS), a validated 0-9 scoring system developed as part of the famous Seven Countries Study pioneered by the late Ancel Keys.
During a median 7.3 years of prospective follow-up, 208 deaths occurred in the study population. A 2-point increase in the MDS was independently associated with a 21% reduction in the risk of mortality in a multivariate Cox proportional hazards analysis adjusted for “everything we could think of,” according to Dr. de Gaetano, including baseline demographics, socioeconomic status, energy intake, body mass index, leisure time physical activity, waist-to-hip ratio, smoking status, diabetes, standard cardiovascular risk factors, and use of cardiovascular medications.
Subjects in the top tertile for adherence to the Mediterranean diet, with an MDS of 6-9, had an adjusted 37% relative risk reduction in all-cause mortality, compared with those having an MDS of 0-3.
The number of deaths is too small at this point in the prospective study to permit analysis of specific causes of death in a statistically valid manner. With another 3 years or so of follow-up, that analysis can and will be done, Dr. de Gaetano said.
The traditional Mediterranean diet is an eating pattern characteristic of the Mediterranean basin, he explained. It encourages large intake of vegetables, legumes, fruits, nuts, and cereals, along with moderately high consumption of fish, olive oil as the primary fat source, and moderate alcohol intake during meals, but low-to-moderate intake of dairy products and low consumption of meat and poultry.
As a sobering aside, he said that in the Molise region, far and away the biggest obstacle to adherence to the Mediterranean diet is economic.
“There was no difference in adherence to the Mediterranean diet between different socioeconomic classes in the Moli-Sani Study until 2007-2008, when the Italian economic crisis began. Since then there are significant differences according to socioeconomic condition. Poor people are obliged to follow the Mediterranean diet less,” Dr. de Gaetano said.
Telling a patient with cardiovascular disease who is in a low-income family of four to eat fish at least twice per week is impractical advice, he explained.
The ongoing Moli-Sani Study is funded by the Italian government. Dr. de Gaetano reported having no financial conflicts of interest.
Key clinical point:
Major finding: Italian patients with known cardiovascular disease who were in the top third in terms of adherence to the traditional Mediterranean diet were a fully adjusted 37% less likely to die of any cause during follow-up than those in the bottom tertile.
Data source: This substudy of the prospective, observational Italian Moli-Sani Study included 1,197 participants with coronary heart disease or cerebrovascular disease at baseline who were followed for a median of 7.3 years.
Disclosures: The ongoing Moli-Sani Study is funded by the Italian government. The presenter reported having no financial conflicts of interest.
Recognizing anti-NMDA receptor encephalitis psychosis on the psych ward
VIENNA – Prominent psychiatric symptoms are common in patients with anti-N-methyl-D-asparate receptor (NMDAR) encephalitis and often occur prior to onset of obvious neurologic symptoms, Maarten J. Titulaer, MD, PhD, said at the annual congress of the European College of Neuropsychopharmacology.
Moreover, occasionally the psychiatric symptoms occur in isolation without neurologic involvement, as was the case in 4% of a series of 501 patients with confirmed anti-NMDAR encephalitis reported by Dr. Titulaer and coinvestigators. The most prominent symptoms included delusional thinking, aggression, and mood disturbances, which were usually manic (JAMA Neurol. 2013 Sep 1;70[9]:1133-9).

Anti-NMDAR encephalitis is an autoimmune disorder in which autoantibodies directed at NMDA receptors on neuronal plasma membranes induce severe neurologic and often psychiatric symptoms.
Red flags that raise the chance that a patient on the psychiatric ward with new-onset psychosis or mania might have primary anti-NMDAR encephalitis and should undergo diagnostic testing include autonomic disturbances such as tachycardia, fever, or hypertension, mild neurologic symptoms such as facial twitching, as well as catatonia, seizures, mutism, or development of extrapyramidal symptoms when placed on an antipsychotic agent. Anti-NMDAR encephalitis can have a relapsing course, so any behavioral change in a patient with a history of the disorder might signal relapse.
Certain cancers are strongly associated with anti-NMDAR encephalitis. New-onset psychotic or manic patients with a history of ovarian teratoma, small cell lung cancer, breast cancer, or thymoma should be tested for anti-NMDAR encephalitis. And conversely, screening for those tumors in occult form is warranted in patients with confirmed anti-NMDAR encephalitis, according to Dr. Titulaer.
Systematic screening for anti-NMDAR encephalitis should also be considered in women with severe acute psychosis during the postpartum period, particularly in the setting of extrapyramidal side effects of antipsychotic agents. Two of 96 consecutive women with acute-onset postpartum psychosis in a series reported by Dr. Titulaer and colleagues were antibody-positive for the disorder, and neither had an ovarian teratoma (Am J Psychiatry. 2015 Sep 1;172[9]:901-8).
If a patient hasn’t developed neurologic symptoms within 4 weeks after onset of psychiatric symptoms, anti-NMDAR psychosis becomes far less likely.
Some neurologists have suggested the presence of other autoimmune disorders in psychiatric patients is associated with increased likelihood that the psychiatric symptoms are secondary to anti-NMDAR encephalitis, but Dr. Titulaer doesn’t find the evidence to date persuasive.
The diagnosis of anti-NMDAR encephalitis hinges on the finding of IgG antibodies against the NR1 subunit of the NMDAR. But Dr. Titulaer and coinvestigators have shown there are testing pitfalls: The first-line commercially available cell-based serum assays have a sensitivity of roughly 75% along with 97%-99% specificity, so by relying solely on the cell-based assays a physician might miss one in four cases of anti-NMDAR encephalitis and wrongly diagnose the disease in 0.4%-3% of healthy individuals (Lancet Neurol. 2014 Feb;13[2]:167-77).
For this reason, a positive serum test should be confirmed by a cell-based assay of a cerebrospinal fluid (CSF) sample, which has 100% sensitivity and specificity. And if the serum assay is negative but anti-NMDAR is suspected based on clinical grounds or history, go ahead and test the CSF, the neurologist advised.
Other tools that can be helpful in making the diagnosis include the EEG, which is abnormal in 89% of patients with anti-NMDAR encephalitis. Thirty percent of affected patients will display a highly specific EEG abnormality called extreme delta brushes (Neurology. 2012 Sep 11;79[11]:1094-100).
Dr. Titulaer said that this extreme delta brushes pattern is not seen on the regular psychiatry ward, but only in the ICU, when the patient is severely ill. He has yet to see the first convincing extreme delta brushes pattern in a patient outside the ICU.
Brain MRI has proved “very disappointing,” as it’s abnormal in only one-third of patients with anti-NMDAR encephalitis, he continued.
First-line immunotherapy is corticosteroids, plasmapheresis, and/or intravenous immunoglobulin. In a series of 501 patients who received first-line immunotherapy or tumor removal, 53% improved within 4 weeks. Fifty-seven percent of those who didn’t then got second-line immunotherapy with rituximab (Rituxan) or cyclophosphamide. Outcomes continued to improve for up to 18 months following symptom onset. At 24 months of follow-up, just over 80% of patients in this observational study had a good outcome as defined by a modified Rankin scale score of 0-2, meaning they were living independently with no or minimal disability.
“Not bad, especially considering that the patients who didn’t improve on first-line therapy were in the ICU for a median of 6 weeks,” the neurologist observed.
“It’s important to diagnose patients with anti-NMDAR encephalitis,” he stressed. “Treatment might be difficult. You might need to be very aggressive. But in the end there are very good outcomes. It’s very rewarding to treat these patients.”
In multivariate analysis, Dr. Titulaer and coworkers identified earlier treatment and milder illness as reflected in no ICU admission as significant predictors of good outcome in the study population. Also, the use of second-line immunotherapy in nonresponders to first-line therapy was independently associated with a 2.69-fold increased likelihood of good outcome (Lancet Neurol. 2013 Feb;12[2]:157-65).
Twelve percent of patients experienced one or more relapses within 2 years.
In a separate study of 661 patients with anti-NMDAR encephalitis, only 31 were aged 45 years or older. They had less severe disease than the younger adults but a paradoxically worse outcome, possibly because their median time to diagnosis was twice as long. At 2 years, 60% of the patients aged 45 and up had full or substantial recovery (Neurology. 2013 Sep 17;81[12]:1058-63).
He stressed that treatment of anti-NMDAR encephalitis ought to be an interdisciplinary effort. Psychiatrists will typically not be the ones who administer the potent immunotherapy. But most patients will have behavioral problems in the very early and late phases that warrant psychiatric therapy. Dr. Titulaer suggested psychiatrists steer clear of haloperidol in these patients because it can exacerbate motor symptoms.
Asked if there are any specific patterns of movement disorders linked to anti-NMDAR encephalitis that might raise a psychiatrist’s index of suspicion, the neurologist replied no. Almost all the movement disorders have been seen in psychiatric patients with anti-NMDAR encephalitis. The one specific movement disorder that strongly suggests anti-NMDAR encephalitis is post–herpes simplex virus (HSV) encephalitis choreoathetosis. It appears that HSV encephalitis can trigger formation of NMDAR autoantibodies, resulting in onset of choreoathetosis 3-6 weeks after the HSV encephalopathy.
Dr. Titulaer reported having no financial conflicts of interest in regard to his presentation.
*This story was updated 1/26/2017.
VIENNA – Prominent psychiatric symptoms are common in patients with anti-N-methyl-D-asparate receptor (NMDAR) encephalitis and often occur prior to onset of obvious neurologic symptoms, Maarten J. Titulaer, MD, PhD, said at the annual congress of the European College of Neuropsychopharmacology.
Moreover, occasionally the psychiatric symptoms occur in isolation without neurologic involvement, as was the case in 4% of a series of 501 patients with confirmed anti-NMDAR encephalitis reported by Dr. Titulaer and coinvestigators. The most prominent symptoms included delusional thinking, aggression, and mood disturbances, which were usually manic (JAMA Neurol. 2013 Sep 1;70[9]:1133-9).
Anti-NMDAR encephalitis is an autoimmune disorder in which autoantibodies directed at NMDA receptors on neuronal plasma membranes induce severe neurologic and often psychiatric symptoms.
Red flags that raise the chance that a patient on the psychiatric ward with new-onset psychosis or mania might have primary anti-NMDAR encephalitis and should undergo diagnostic testing include autonomic disturbances such as tachycardia, fever, or hypertension, mild neurologic symptoms such as facial twitching, as well as catatonia, seizures, mutism, or development of extrapyramidal symptoms when placed on an antipsychotic agent. Anti-NMDAR encephalitis can have a relapsing course, so any behavioral change in a patient with a history of the disorder might signal relapse.
Certain cancers are strongly associated with anti-NMDAR encephalitis. New-onset psychotic or manic patients with a history of ovarian teratoma, small cell lung cancer, breast cancer, or thymoma should be tested for anti-NMDAR encephalitis. And conversely, screening for those tumors in occult form is warranted in patients with confirmed anti-NMDAR encephalitis, according to Dr. Titulaer.
Systematic screening for anti-NMDAR encephalitis should also be considered in women with severe acute psychosis during the postpartum period, particularly in the setting of extrapyramidal side effects of antipsychotic agents. Two of 96 consecutive women with acute-onset postpartum psychosis in a series reported by Dr. Titulaer and colleagues were antibody-positive for the disorder, and neither had an ovarian teratoma (Am J Psychiatry. 2015 Sep 1;172[9]:901-8).
If a patient hasn’t developed neurologic symptoms within 4 weeks after onset of psychiatric symptoms, anti-NMDAR psychosis becomes far less likely.
Some neurologists have suggested the presence of other autoimmune disorders in psychiatric patients is associated with increased likelihood that the psychiatric symptoms are secondary to anti-NMDAR encephalitis, but Dr. Titulaer doesn’t find the evidence to date persuasive.
The diagnosis of anti-NMDAR encephalitis hinges on the finding of IgG antibodies against the NR1 subunit of the NMDAR. But Dr. Titulaer and coinvestigators have shown there are testing pitfalls: The first-line commercially available cell-based serum assays have a sensitivity of roughly 75% along with 97%-99% specificity, so by relying solely on the cell-based assays a physician might miss one in four cases of anti-NMDAR encephalitis and wrongly diagnose the disease in 0.4%-3% of healthy individuals (Lancet Neurol. 2014 Feb;13[2]:167-77).
For this reason, a positive serum test should be confirmed by a cell-based assay of a cerebrospinal fluid (CSF) sample, which has 100% sensitivity and specificity. And if the serum assay is negative but anti-NMDAR is suspected based on clinical grounds or history, go ahead and test the CSF, the neurologist advised.
Other tools that can be helpful in making the diagnosis include the EEG, which is abnormal in 89% of patients with anti-NMDAR encephalitis. Thirty percent of affected patients will display a highly specific EEG abnormality called extreme delta brushes (Neurology. 2012 Sep 11;79[11]:1094-100).
Dr. Titulaer said that this extreme delta brushes pattern is not seen on the regular psychiatry ward, but only in the ICU, when the patient is severely ill. He has yet to see the first convincing extreme delta brushes pattern in a patient outside the ICU.
Brain MRI has proved “very disappointing,” as it’s abnormal in only one-third of patients with anti-NMDAR encephalitis, he continued.
First-line immunotherapy is corticosteroids, plasmapheresis, and/or intravenous immunoglobulin. In a series of 501 patients who received first-line immunotherapy or tumor removal, 53% improved within 4 weeks. Fifty-seven percent of those who didn’t then got second-line immunotherapy with rituximab (Rituxan) or cyclophosphamide. Outcomes continued to improve for up to 18 months following symptom onset. At 24 months of follow-up, just over 80% of patients in this observational study had a good outcome as defined by a modified Rankin scale score of 0-2, meaning they were living independently with no or minimal disability.
“Not bad, especially considering that the patients who didn’t improve on first-line therapy were in the ICU for a median of 6 weeks,” the neurologist observed.
“It’s important to diagnose patients with anti-NMDAR encephalitis,” he stressed. “Treatment might be difficult. You might need to be very aggressive. But in the end there are very good outcomes. It’s very rewarding to treat these patients.”
In multivariate analysis, Dr. Titulaer and coworkers identified earlier treatment and milder illness as reflected in no ICU admission as significant predictors of good outcome in the study population. Also, the use of second-line immunotherapy in nonresponders to first-line therapy was independently associated with a 2.69-fold increased likelihood of good outcome (Lancet Neurol. 2013 Feb;12[2]:157-65).
Twelve percent of patients experienced one or more relapses within 2 years.
In a separate study of 661 patients with anti-NMDAR encephalitis, only 31 were aged 45 years or older. They had less severe disease than the younger adults but a paradoxically worse outcome, possibly because their median time to diagnosis was twice as long. At 2 years, 60% of the patients aged 45 and up had full or substantial recovery (Neurology. 2013 Sep 17;81[12]:1058-63).
He stressed that treatment of anti-NMDAR encephalitis ought to be an interdisciplinary effort. Psychiatrists will typically not be the ones who administer the potent immunotherapy. But most patients will have behavioral problems in the very early and late phases that warrant psychiatric therapy. Dr. Titulaer suggested psychiatrists steer clear of haloperidol in these patients because it can exacerbate motor symptoms.
Asked if there are any specific patterns of movement disorders linked to anti-NMDAR encephalitis that might raise a psychiatrist’s index of suspicion, the neurologist replied no. Almost all the movement disorders have been seen in psychiatric patients with anti-NMDAR encephalitis. The one specific movement disorder that strongly suggests anti-NMDAR encephalitis is post–herpes simplex virus (HSV) encephalitis choreoathetosis. It appears that HSV encephalitis can trigger formation of NMDAR autoantibodies, resulting in onset of choreoathetosis 3-6 weeks after the HSV encephalopathy.
Dr. Titulaer reported having no financial conflicts of interest in regard to his presentation.
*This story was updated 1/26/2017.