User login
Hospital costs higher for patients discharged to postacute care
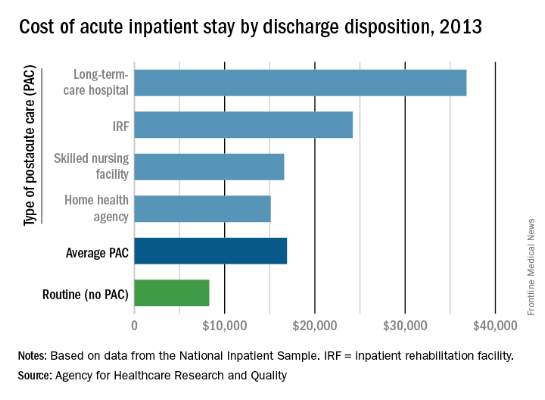
The average cost of U.S. hospital stays for injury or illness in patients discharged to postacute care is more than double that of visits with routine discharges, according to the Agency for Healthcare Research and Quality.
For patients who were discharged from hospitals to PAC, the average cost of an inpatient visit in 2013 was $16,900, compared with $8,300 for patients with routine discharges. The inpatient visits with PAC were almost twice as long as those with routine discharge – 7.0 days vs. 3.6 days – and patients with PAC-discharge visits were much older – 69.5% were aged 65 years or older, compared with 22.4% of visits with routine discharges, the AHRQ reported.

The AHRQ used data from the 2013 National Inpatient Sample (NIS) to estimates discharges to PAC for all types of payers and describe these discharges from the perspective of payers, patients, hospitals, conditions/procedures, and geographic regions.
The cost of stays varied considerably among the various PAC settings in 2013. Inpatient stays with discharge to home health agencies had the lowest average cost at $15,100, with skilled nursing facilities next at $16,600, followed by inpatient rehabilitation facilities at $24,200 and long-term-care hospitals at $36,800. Length of stays by PAC setting showed the same trend: those with discharge to home health agencies were shortest (6.2 days) and those with discharge to long-term-care hospitals were longest (13.5 days), the AHRQ said in the report.
Inpatient stays with discharge to PAC made up 22.3% of all hospital discharges in 2013, with the bulk being discharges to home health agencies (50.1%) and skilled nursing facilities (40.5%). Discharges to inpatient rehabilitation facilities made up 7.2% of all PAC visits, while those to long-term-care hospitals were just 2.2%, the data from the NIS show.
The average cost of U.S. hospital stays for injury or illness in patients discharged to postacute care is more than double that of visits with routine discharges, according to the Agency for Healthcare Research and Quality.
For patients who were discharged from hospitals to PAC, the average cost of an inpatient visit in 2013 was $16,900, compared with $8,300 for patients with routine discharges. The inpatient visits with PAC were almost twice as long as those with routine discharge – 7.0 days vs. 3.6 days – and patients with PAC-discharge visits were much older – 69.5% were aged 65 years or older, compared with 22.4% of visits with routine discharges, the AHRQ reported.
The AHRQ used data from the 2013 National Inpatient Sample (NIS) to estimates discharges to PAC for all types of payers and describe these discharges from the perspective of payers, patients, hospitals, conditions/procedures, and geographic regions.
The cost of stays varied considerably among the various PAC settings in 2013. Inpatient stays with discharge to home health agencies had the lowest average cost at $15,100, with skilled nursing facilities next at $16,600, followed by inpatient rehabilitation facilities at $24,200 and long-term-care hospitals at $36,800. Length of stays by PAC setting showed the same trend: those with discharge to home health agencies were shortest (6.2 days) and those with discharge to long-term-care hospitals were longest (13.5 days), the AHRQ said in the report.
Inpatient stays with discharge to PAC made up 22.3% of all hospital discharges in 2013, with the bulk being discharges to home health agencies (50.1%) and skilled nursing facilities (40.5%). Discharges to inpatient rehabilitation facilities made up 7.2% of all PAC visits, while those to long-term-care hospitals were just 2.2%, the data from the NIS show.
Hospital costs higher for patients discharged to postacute care
The average cost of U.S. hospital stays for injury or illness in patients discharged to postacute care is more than double that of visits with routine discharges, according to the Agency for Healthcare Research and Quality.
For patients who were discharged from hospitals to PAC, the average cost of an inpatient visit in 2013 was $16,900, compared with $8,300 for patients with routine discharges. The inpatient visits with PAC were almost twice as long as those with routine discharge – 7.0 days vs. 3.6 days – and patients with PAC-discharge visits were much older – 69.5% were aged 65 years or older, compared with 22.4% of visits with routine discharges, the AHRQ reported.
The AHRQ used data from the 2013 National Inpatient Sample (NIS) to estimates discharges to PAC for all types of payers and describe these discharges from the perspective of payers, patients, hospitals, conditions/procedures, and geographic regions.
The cost of stays varied considerably among the various PAC settings in 2013. Inpatient stays with discharge to home health agencies had the lowest average cost at $15,100, with skilled nursing facilities next at $16,600, followed by inpatient rehabilitation facilities at $24,200 and long-term-care hospitals at $36,800. Length of stays by PAC setting showed the same trend: those with discharge to home health agencies were shortest (6.2 days) and those with discharge to long-term-care hospitals were longest (13.5 days), the AHRQ said in the report.
Inpatient stays with discharge to PAC made up 22.3% of all hospital discharges in 2013, with the bulk being discharges to home health agencies (50.1%) and skilled nursing facilities (40.5%). Discharges to inpatient rehabilitation facilities made up 7.2% of all PAC visits, while those to long-term-care hospitals were just 2.2%, the data from the NIS show.

Genital bumps

The FP diagnosed this patient with condyloma acuminata, also known as genital warts. The warts were well-keratinized since the patient was circumcised and the warts were not under foreskin. Genital warts found in the moist area under the foreskin of uncircumcised men tend to look more cauliflower-like.
Genital warts are caused by human papillomavirus infection, which encompasses a family of primarily sexually transmitted double-stranded DNA viruses. The incubation period after exposure ranges from 3 weeks to 8 months.
Anogenital warts are the most common viral sexually transmitted disease (STD) in the United States. There are approximately one million new cases of genital warts per year in the United States. Most infections are transient and clear up within 2 years, but some infections persist and recur, causing a great deal of distress for patients.
The diagnosis is usually clinical. Genital warts are typically asymptomatic and present as flesh-colored, exophytic lesions on the genitalia, including the penis, vulva, vagina, scrotum, perineum, and perianal skin. External warts can appear as small bumps, or they may be flat, verrucous, or pedunculated.
The FP discussed the patient’s history of unsafe sex and recommended that he receive screening for other STDs. The patient did not believe he had human immunodeficiency virus (HIV), but was willing to be tested for it and for syphilis. He denied any urethral discharge or burning on urination, but wanted to be screened for gonorrhea and chlamydia, as well. The FP ordered blood tests for syphilis and HIV and a urine screen for gonorrhea and chlamydia which were all negative.
After discussing treatment options, the patient opted to pursue cryotherapy. The FP sprayed the condyloma with liquid nitrogen using a freeze/thaw/freeze cycle and offered the patient a prescription for imiquimod cream. However, the patient preferred to return for additional cryotherapy. A follow-up appointment was set for 3 weeks.
Photos and text for Photo Rounds Friday courtesy of Richard P. Usatine, MD. This case was adapted from: Mayeaux EJ, Usatine R. In: Usatine R, Smith M, Mayeaux EJ, et al, eds. Color Atlas of Family Medicine. 2nd ed. New York, NY: McGraw-Hill; 2013:759-765.
To learn more about the Color Atlas of Family Medicine, see: www.amazon.com/Color-Family-Medicine-Richard-Usatine/dp/0071769641/
You can now get the second edition of the Color Atlas of Family Medicine as an app by clicking on this link: usatinemedia.com

MPT64 rapid test may miss TB caused by M. africanum strain
Tuberculosis caused by Mycobacterium africanum West Africa 2 is significantly less likely to be detected by a MPT64 rapid antigen test than is M. tuberculosis, according to a research team based in the Gambia.
A total of 173 MGIT culture-positive sputum samples were included in the study, and the initial MPT64 test was negative in 23 samples. Just over 90% of M. tuberculosis (MTB) samples converted to positive on day 0, while only 78.4% of M. africanum West Africa 2 (MAF2) samples converted. After 10 days, 97.5% of MTB samples were positive, while conversion of MAF2 samples remained low at 84.3%.

In a comparison of the mRNA transcript from samples of six MTB and five MAF2 patients who had not been treated for TB, the MTP64 gene was about 2.5 times more abundant in the MTB samples than the MAF2 samples. No association was found between conversion to positivity and sex, age, therapy, or mycobacterial growth units.
“Given the relatively low cost, limited technical expertise, and shorter turnaround time associated with using rapid speciation tests, compared to alternative speciation methods, MPT64 rapid tests will likely remain one of the preferred options for timely diagnosis of suspected TB despite the possibility of false negative results. Therefore, a negative MPT64 result would require confirmation by an alternative method, such as molecular tests or culture on p-nitrobenzoic acid, depending on laboratory infrastructure and resources,” the investigators noted.
Read the full study in PLoS Neglected Tropical Diseases (doi:10.1371/journal.pntd.0004801).
Tuberculosis caused by Mycobacterium africanum West Africa 2 is significantly less likely to be detected by a MPT64 rapid antigen test than is M. tuberculosis, according to a research team based in the Gambia.
A total of 173 MGIT culture-positive sputum samples were included in the study, and the initial MPT64 test was negative in 23 samples. Just over 90% of M. tuberculosis (MTB) samples converted to positive on day 0, while only 78.4% of M. africanum West Africa 2 (MAF2) samples converted. After 10 days, 97.5% of MTB samples were positive, while conversion of MAF2 samples remained low at 84.3%.
In a comparison of the mRNA transcript from samples of six MTB and five MAF2 patients who had not been treated for TB, the MTP64 gene was about 2.5 times more abundant in the MTB samples than the MAF2 samples. No association was found between conversion to positivity and sex, age, therapy, or mycobacterial growth units.
“Given the relatively low cost, limited technical expertise, and shorter turnaround time associated with using rapid speciation tests, compared to alternative speciation methods, MPT64 rapid tests will likely remain one of the preferred options for timely diagnosis of suspected TB despite the possibility of false negative results. Therefore, a negative MPT64 result would require confirmation by an alternative method, such as molecular tests or culture on p-nitrobenzoic acid, depending on laboratory infrastructure and resources,” the investigators noted.
Read the full study in PLoS Neglected Tropical Diseases (doi:10.1371/journal.pntd.0004801).
FROM PLOS NEGLECTED TROPICAL DISEASES

MPT64 rapid test may miss TB caused by M. africanum strain
Tuberculosis caused by Mycobacterium africanum West Africa 2 is significantly less likely to be detected by a MPT64 rapid antigen test than is M. tuberculosis, according to a research team based in the Gambia.
A total of 173 MGIT culture-positive sputum samples were included in the study, and the initial MPT64 test was negative in 23 samples. Just over 90% of M. tuberculosis (MTB) samples converted to positive on day 0, while only 78.4% of M. africanum West Africa 2 (MAF2) samples converted. After 10 days, 97.5% of MTB samples were positive, while conversion of MAF2 samples remained low at 84.3%.
In a comparison of the mRNA transcript from samples of six MTB and five MAF2 patients who had not been treated for TB, the MTP64 gene was about 2.5 times more abundant in the MTB samples than the MAF2 samples. No association was found between conversion to positivity and sex, age, therapy, or mycobacterial growth units.
“Given the relatively low cost, limited technical expertise, and shorter turnaround time associated with using rapid speciation tests, compared to alternative speciation methods, MPT64 rapid tests will likely remain one of the preferred options for timely diagnosis of suspected TB despite the possibility of false negative results. Therefore, a negative MPT64 result would require confirmation by an alternative method, such as molecular tests or culture on p-nitrobenzoic acid, depending on laboratory infrastructure and resources,” the investigators noted.
Read the full study in PLoS Neglected Tropical Diseases (doi:10.1371/journal.pntd.0004801).
FROM PLOS NEGLECTED TROPICAL DISEASES

The nightmare of opioid addiction
You start your day refreshed, enthusiastic, and ready to take on every challenge that comes your way.
You print your list of patients for the day – not too bad, a mere 15; quite doable for a seasoned hospitalist. You scan your list: a hypertensive crisis – piece of cake; 3 patients with acute systolic heart failure – just follow the guidelines; 2 with a COPD exacerbation – no worries. You know how to treat these conditions, almost with your eyes closed. But, of course, all conditions do not have such straightforward treatments.

The next patient on your list is a 35-year-old on a methadone maintenance program admitted with an accidental heroin overdose. So sad. Then there is a 59-year-old with chronic back pain and known drug-seeking behavior, well known to you and your entire team. So frustrating. Next, you read about a healthy 24-year-old mother of two who slipped on a baby bottle and tumbled down two flights of stairs, breaking both femurs, a clavicle, and nine ribs.
As you mull over your approach to the first two, you cannot help but be concerned about the likelihood that this young mother will require strong narcotics to manage her pain for a considerable time, long after discharge. She has a legitimate reason to receive opioid analgesics, but how can you minimize her chances of becoming another statistic?
In 2012, an estimated 2.1 million Americans suffered from substance use disorders due to prescription opioid pain relievers while close to 467,000 were addicted to heroin.
To complicate matters, many who were legitimately prescribed painkillers go on to abuse heroin when they can no longer get prescription opiates from their health care providers. Naturally, we want to take away our patients’ pain, but in 2016 we must be keenly aware that every time we prescribe opiates for our patients there is a risk, whether great or small, that individual may some day suffer from a substance abuse disorder.
Evidence shows that the way the human brain deals with opiates, and subsequent opiate dependence, necessitates that we rethink how we view addiction. Addicts simply cannot be stereotyped as derelicts, always looking for their next high. They have a real disease.
According to the American Society of Addiction Medicine, addiction is a primary, chronic, and relapsing disease of the brain. When one thinks of addiction as a true disease, and not simply as a weakness of pleasure seekers with morals we deem beneath our own, it paints the addict in a completely different light.
We would never order a procedure or prescribe a medication that had more than a negligible risk of causing diabetes or hypertension. Remember, “First, do no harm?” Perhaps we should approach opiate prescribing by considering not only the immediate benefit our patients will receive, and thus how quickly they can be discharged, but the potential long term pain they may experience in the future should they become addicted.
The heroin epidemic has hit America with a vengeance. It is an equal opportunity destroyer with an unprecedented predilection to decimate lives in all communities – affluent, impoverished, and everyplace in between. It has no regard for race or ethnicity and knows no boundaries whatsoever.
No doubt, some of our most challenging patients are the ones who are least sick, medically speaking, but suffer from addictions that are beyond our expertise. They often require us to reach down much deeper than a textbook to find more understanding, more insight, more wisdom, and a huge helping of compassion, even in the midst of own frustration.
Sure, we want to relieve pain and suffering. There are few things as rewarding as doing so. Yet, because we have not understood the long-term consequences of writing an opioid prescription, health care professionals have played a tremendous role in the epidemic of addiction that is decimating lives. In the past, we simply didn’t know, but now we do and this knowledge empowers us to take the lead in turning around this monstrous epidemic.
I believe 3 simple steps can help us all become more responsible opiate prescribers and thus begin the long process of conquering the beast of addiction.
1. Think before you order. Is it possible that pain can be controlled with a non-narcotic medication, such as tramadol or NSAIDs?
2. Hone your prescribing skills by taking CMEs or simply reading reputable journal articles and other noteworthy resources.
3. Do not hesitate to consult your pain management service. Doing so does not denote weakness; it signifies wisdom and humility when you put your patient’s best interest above your pride. It’s honorable to “know what you don’t know” and seek help when needed.
Finally, I would like to dedicate this article to Mark, my 25-year-old, athletic father-to-be who accidentally overdosed on heroin long before his baby was born. May your child grow up in an America that rids itself of this drug nightmare long before he is old enough to know what drug addiction means. Rest in peace, Mark.
Dr. Hester is a hospitalist at Baltimore-Washington Medical Center in Glen Burnie, Md. She is the creator of the Patient Whiz, a patient-engagement app for iOS. Reach her at [email protected].
You start your day refreshed, enthusiastic, and ready to take on every challenge that comes your way.
You print your list of patients for the day – not too bad, a mere 15; quite doable for a seasoned hospitalist. You scan your list: a hypertensive crisis – piece of cake; 3 patients with acute systolic heart failure – just follow the guidelines; 2 with a COPD exacerbation – no worries. You know how to treat these conditions, almost with your eyes closed. But, of course, all conditions do not have such straightforward treatments.
The next patient on your list is a 35-year-old on a methadone maintenance program admitted with an accidental heroin overdose. So sad. Then there is a 59-year-old with chronic back pain and known drug-seeking behavior, well known to you and your entire team. So frustrating. Next, you read about a healthy 24-year-old mother of two who slipped on a baby bottle and tumbled down two flights of stairs, breaking both femurs, a clavicle, and nine ribs.
As you mull over your approach to the first two, you cannot help but be concerned about the likelihood that this young mother will require strong narcotics to manage her pain for a considerable time, long after discharge. She has a legitimate reason to receive opioid analgesics, but how can you minimize her chances of becoming another statistic?
In 2012, an estimated 2.1 million Americans suffered from substance use disorders due to prescription opioid pain relievers while close to 467,000 were addicted to heroin.
To complicate matters, many who were legitimately prescribed painkillers go on to abuse heroin when they can no longer get prescription opiates from their health care providers. Naturally, we want to take away our patients’ pain, but in 2016 we must be keenly aware that every time we prescribe opiates for our patients there is a risk, whether great or small, that individual may some day suffer from a substance abuse disorder.
Evidence shows that the way the human brain deals with opiates, and subsequent opiate dependence, necessitates that we rethink how we view addiction. Addicts simply cannot be stereotyped as derelicts, always looking for their next high. They have a real disease.
According to the American Society of Addiction Medicine, addiction is a primary, chronic, and relapsing disease of the brain. When one thinks of addiction as a true disease, and not simply as a weakness of pleasure seekers with morals we deem beneath our own, it paints the addict in a completely different light.
We would never order a procedure or prescribe a medication that had more than a negligible risk of causing diabetes or hypertension. Remember, “First, do no harm?” Perhaps we should approach opiate prescribing by considering not only the immediate benefit our patients will receive, and thus how quickly they can be discharged, but the potential long term pain they may experience in the future should they become addicted.
The heroin epidemic has hit America with a vengeance. It is an equal opportunity destroyer with an unprecedented predilection to decimate lives in all communities – affluent, impoverished, and everyplace in between. It has no regard for race or ethnicity and knows no boundaries whatsoever.
No doubt, some of our most challenging patients are the ones who are least sick, medically speaking, but suffer from addictions that are beyond our expertise. They often require us to reach down much deeper than a textbook to find more understanding, more insight, more wisdom, and a huge helping of compassion, even in the midst of own frustration.
Sure, we want to relieve pain and suffering. There are few things as rewarding as doing so. Yet, because we have not understood the long-term consequences of writing an opioid prescription, health care professionals have played a tremendous role in the epidemic of addiction that is decimating lives. In the past, we simply didn’t know, but now we do and this knowledge empowers us to take the lead in turning around this monstrous epidemic.
I believe 3 simple steps can help us all become more responsible opiate prescribers and thus begin the long process of conquering the beast of addiction.
1. Think before you order. Is it possible that pain can be controlled with a non-narcotic medication, such as tramadol or NSAIDs?
2. Hone your prescribing skills by taking CMEs or simply reading reputable journal articles and other noteworthy resources.
3. Do not hesitate to consult your pain management service. Doing so does not denote weakness; it signifies wisdom and humility when you put your patient’s best interest above your pride. It’s honorable to “know what you don’t know” and seek help when needed.
Finally, I would like to dedicate this article to Mark, my 25-year-old, athletic father-to-be who accidentally overdosed on heroin long before his baby was born. May your child grow up in an America that rids itself of this drug nightmare long before he is old enough to know what drug addiction means. Rest in peace, Mark.
Dr. Hester is a hospitalist at Baltimore-Washington Medical Center in Glen Burnie, Md. She is the creator of the Patient Whiz, a patient-engagement app for iOS. Reach her at [email protected].

The nightmare of opioid addiction
You start your day refreshed, enthusiastic, and ready to take on every challenge that comes your way.
You print your list of patients for the day – not too bad, a mere 15; quite doable for a seasoned hospitalist. You scan your list: a hypertensive crisis – piece of cake; 3 patients with acute systolic heart failure – just follow the guidelines; 2 with a COPD exacerbation – no worries. You know how to treat these conditions, almost with your eyes closed. But, of course, all conditions do not have such straightforward treatments.
The next patient on your list is a 35-year-old on a methadone maintenance program admitted with an accidental heroin overdose. So sad. Then there is a 59-year-old with chronic back pain and known drug-seeking behavior, well known to you and your entire team. So frustrating. Next, you read about a healthy 24-year-old mother of two who slipped on a baby bottle and tumbled down two flights of stairs, breaking both femurs, a clavicle, and nine ribs.
As you mull over your approach to the first two, you cannot help but be concerned about the likelihood that this young mother will require strong narcotics to manage her pain for a considerable time, long after discharge. She has a legitimate reason to receive opioid analgesics, but how can you minimize her chances of becoming another statistic?
In 2012, an estimated 2.1 million Americans suffered from substance use disorders due to prescription opioid pain relievers while close to 467,000 were addicted to heroin.
To complicate matters, many who were legitimately prescribed painkillers go on to abuse heroin when they can no longer get prescription opiates from their health care providers. Naturally, we want to take away our patients’ pain, but in 2016 we must be keenly aware that every time we prescribe opiates for our patients there is a risk, whether great or small, that individual may some day suffer from a substance abuse disorder.
Evidence shows that the way the human brain deals with opiates, and subsequent opiate dependence, necessitates that we rethink how we view addiction. Addicts simply cannot be stereotyped as derelicts, always looking for their next high. They have a real disease.
According to the American Society of Addiction Medicine, addiction is a primary, chronic, and relapsing disease of the brain. When one thinks of addiction as a true disease, and not simply as a weakness of pleasure seekers with morals we deem beneath our own, it paints the addict in a completely different light.
We would never order a procedure or prescribe a medication that had more than a negligible risk of causing diabetes or hypertension. Remember, “First, do no harm?” Perhaps we should approach opiate prescribing by considering not only the immediate benefit our patients will receive, and thus how quickly they can be discharged, but the potential long term pain they may experience in the future should they become addicted.
The heroin epidemic has hit America with a vengeance. It is an equal opportunity destroyer with an unprecedented predilection to decimate lives in all communities – affluent, impoverished, and everyplace in between. It has no regard for race or ethnicity and knows no boundaries whatsoever.
No doubt, some of our most challenging patients are the ones who are least sick, medically speaking, but suffer from addictions that are beyond our expertise. They often require us to reach down much deeper than a textbook to find more understanding, more insight, more wisdom, and a huge helping of compassion, even in the midst of own frustration.
Sure, we want to relieve pain and suffering. There are few things as rewarding as doing so. Yet, because we have not understood the long-term consequences of writing an opioid prescription, health care professionals have played a tremendous role in the epidemic of addiction that is decimating lives. In the past, we simply didn’t know, but now we do and this knowledge empowers us to take the lead in turning around this monstrous epidemic.
I believe 3 simple steps can help us all become more responsible opiate prescribers and thus begin the long process of conquering the beast of addiction.
1. Think before you order. Is it possible that pain can be controlled with a non-narcotic medication, such as tramadol or NSAIDs?
2. Hone your prescribing skills by taking CMEs or simply reading reputable journal articles and other noteworthy resources.
3. Do not hesitate to consult your pain management service. Doing so does not denote weakness; it signifies wisdom and humility when you put your patient’s best interest above your pride. It’s honorable to “know what you don’t know” and seek help when needed.
Finally, I would like to dedicate this article to Mark, my 25-year-old, athletic father-to-be who accidentally overdosed on heroin long before his baby was born. May your child grow up in an America that rids itself of this drug nightmare long before he is old enough to know what drug addiction means. Rest in peace, Mark.
Dr. Hester is a hospitalist at Baltimore-Washington Medical Center in Glen Burnie, Md. She is the creator of the Patient Whiz, a patient-engagement app for iOS. Reach her at [email protected].

What difference would an empagliflozin CVD indication make?
When a Food and Drug Administration advisory committee met on June 28 to consider a new indication for the type 2 diabetes drug empagliflozin – reduction of cardiovascular mortality in patients with type 2 diabetes with existing cardiovascular disease or at high risk for cardiovascular disease – an inevitable question was, How will this matter to empagliflozin?
Empagliflozin (Jardiance) received FDA approval in 2014 for treating patients with type 2 diabetes. In 2015, an unexpected result from the EMPA-REG OUTCOME trial showed that treatment of such high-risk diabetes patients with empagliflozin led to a dramatic and still unexplained 38% relative risk reduction in cardiovascular disease (CVD) death, compared with placebo (a 2.2% absolute risk reduction) during a median 2.6 years of treatment and 3.1 years of total follow-up. This surprising result from a trial designed to test empagliflozin’s CVD safety but not its preventive efficacy first went public in a report at the European Association for the Study of Diabetes annual meeting in Stockholm in September 2015 and in a simultaneously published article (N Engl J Med. 2015;373:2117-28).
So the drug is already on the U.S. market, and its remarkable effect on CVD mortality in a selected population is already on record. Will translating this into a FDA-approved indication mean anything more?
The short answer is it probably will, especially for persuading health insurance payers to cover the substantial cost for prescribing empagliflozin. The other end an added FDA indication achieves is objective confirmation that the CVD mortality benefit seen in the EMPA-REG OUTCOME trial was real and could be anticipated in routine practice.
Some clinicians have already concluded this was a believable result, and that it gives empagliflozin an edge above other oral hypoglycemic drugs for patients who match the study’s enrollment criteria.
“Based on available evidence, the sodium-glucose cotransporter-2 inhibitors [the class that includes empagliflozin] are the preferred therapy for patients with type 2 diabetes and CVD or at high risk for CVD in patients treated with metformin or where metformin is not tolerated. It also should be given preference in patients with or at risk for heart failure,” Gregg C. Fonarow, MD, professor and associate chief of cardiology at the University of California, Los Angeles, said in an interview.
“I am using [empagliflozin] in addition to metformin and aggressive lifestyle changes in patients with established CVD and uncontrolled type 2 diabetes,” said another cardiologist, Alison L. Bailey, MD.
But Dr. Bailey also highlighted her concern about the extra cost to patients for empagliflozin, especially if their insurer wouldn’t pay for it.

“Metformin should be the first step based on it’s documented efficacy and cost. I would then add empagliflozin to most of my patients who can get the drug without financial burden,” she told me in an interview.
If an insurer balks at paying for empagliflozin, or if the patient has little or no drug insurance, the financial burden could be substantial. The cost of a month on empagliflozin at the dosage used in the EMPA-REG OUTCOME study is about $415 from one web-based drug supplier, compared with a monthly price of about $6 for a typical monthly regimen of generic metformin. Over the course of a year, that’s about $5,000, compared with $72.
Empagliflozin is “an expensive drug with limited experience,” commented Prakash Deedwania, MD, a cardiologist at the University of California, San Francisco, in Fresno. Metformin, the current linchpin oral agent for treating most patients with type 2 diabetes, has the advantages of low cost and a large, worldwide track record of efficacy and safety, he added.
An FDA indication for reducing cardiovascular disease mortality in selected patients with type 2 diabetes would set empagliflozin apart as the only oral hypoglycemic drug recognized to have this activity and might help grease the wheels for reimbursement.
“Patients can only get the medications their insurance covers. I have a feeling that this indication might help drive coverage,” commented Abraham Thomas, MD, an endocrinologist at New York University, when explaining his vote in favor of the new indication as a member of the FDA advisory committee.

The other consequence from a positive FDA decision would be a strong statement of confidence that the EMPA-REG OUTCOME result is real. Clearly not everyone on the advisory panel was convinced. The panel’s vote split 12 in favor of the FDA granting the indication and 11 votes against, and many panelists said they found it very hard to balance the powerful result on the one hand against the inexplicable mechanism of the effect and the fact that the mortality benefit came from left field, without prespecification in the study’s design. Now it’s on the FDA’s shoulders to make a decision after parsing the vote, the panelists’ comments, the data, and concerns.
“An FDA-approved indication for reduction in cardiovascular death would be influential with physicians and patients,” predicted Dr. Fonarow.
A FDA imprimatur on the cardiovascular mortality benefit would help buttress belief in the EMPA-REG OUTCOME result and might help drive better reimbursement coverage. A thumbs down will likely dampen enthusiasm in and practicality of the treatment until additional, corroborative data appear.
On Twitter @mitchelzoler
When a Food and Drug Administration advisory committee met on June 28 to consider a new indication for the type 2 diabetes drug empagliflozin – reduction of cardiovascular mortality in patients with type 2 diabetes with existing cardiovascular disease or at high risk for cardiovascular disease – an inevitable question was, How will this matter to empagliflozin?
Empagliflozin (Jardiance) received FDA approval in 2014 for treating patients with type 2 diabetes. In 2015, an unexpected result from the EMPA-REG OUTCOME trial showed that treatment of such high-risk diabetes patients with empagliflozin led to a dramatic and still unexplained 38% relative risk reduction in cardiovascular disease (CVD) death, compared with placebo (a 2.2% absolute risk reduction) during a median 2.6 years of treatment and 3.1 years of total follow-up. This surprising result from a trial designed to test empagliflozin’s CVD safety but not its preventive efficacy first went public in a report at the European Association for the Study of Diabetes annual meeting in Stockholm in September 2015 and in a simultaneously published article (N Engl J Med. 2015;373:2117-28).
So the drug is already on the U.S. market, and its remarkable effect on CVD mortality in a selected population is already on record. Will translating this into a FDA-approved indication mean anything more?
The short answer is it probably will, especially for persuading health insurance payers to cover the substantial cost for prescribing empagliflozin. The other end an added FDA indication achieves is objective confirmation that the CVD mortality benefit seen in the EMPA-REG OUTCOME trial was real and could be anticipated in routine practice.
Some clinicians have already concluded this was a believable result, and that it gives empagliflozin an edge above other oral hypoglycemic drugs for patients who match the study’s enrollment criteria.
“Based on available evidence, the sodium-glucose cotransporter-2 inhibitors [the class that includes empagliflozin] are the preferred therapy for patients with type 2 diabetes and CVD or at high risk for CVD in patients treated with metformin or where metformin is not tolerated. It also should be given preference in patients with or at risk for heart failure,” Gregg C. Fonarow, MD, professor and associate chief of cardiology at the University of California, Los Angeles, said in an interview.
“I am using [empagliflozin] in addition to metformin and aggressive lifestyle changes in patients with established CVD and uncontrolled type 2 diabetes,” said another cardiologist, Alison L. Bailey, MD.
But Dr. Bailey also highlighted her concern about the extra cost to patients for empagliflozin, especially if their insurer wouldn’t pay for it.
“Metformin should be the first step based on it’s documented efficacy and cost. I would then add empagliflozin to most of my patients who can get the drug without financial burden,” she told me in an interview.
If an insurer balks at paying for empagliflozin, or if the patient has little or no drug insurance, the financial burden could be substantial. The cost of a month on empagliflozin at the dosage used in the EMPA-REG OUTCOME study is about $415 from one web-based drug supplier, compared with a monthly price of about $6 for a typical monthly regimen of generic metformin. Over the course of a year, that’s about $5,000, compared with $72.
Empagliflozin is “an expensive drug with limited experience,” commented Prakash Deedwania, MD, a cardiologist at the University of California, San Francisco, in Fresno. Metformin, the current linchpin oral agent for treating most patients with type 2 diabetes, has the advantages of low cost and a large, worldwide track record of efficacy and safety, he added.
An FDA indication for reducing cardiovascular disease mortality in selected patients with type 2 diabetes would set empagliflozin apart as the only oral hypoglycemic drug recognized to have this activity and might help grease the wheels for reimbursement.
“Patients can only get the medications their insurance covers. I have a feeling that this indication might help drive coverage,” commented Abraham Thomas, MD, an endocrinologist at New York University, when explaining his vote in favor of the new indication as a member of the FDA advisory committee.
The other consequence from a positive FDA decision would be a strong statement of confidence that the EMPA-REG OUTCOME result is real. Clearly not everyone on the advisory panel was convinced. The panel’s vote split 12 in favor of the FDA granting the indication and 11 votes against, and many panelists said they found it very hard to balance the powerful result on the one hand against the inexplicable mechanism of the effect and the fact that the mortality benefit came from left field, without prespecification in the study’s design. Now it’s on the FDA’s shoulders to make a decision after parsing the vote, the panelists’ comments, the data, and concerns.
“An FDA-approved indication for reduction in cardiovascular death would be influential with physicians and patients,” predicted Dr. Fonarow.
A FDA imprimatur on the cardiovascular mortality benefit would help buttress belief in the EMPA-REG OUTCOME result and might help drive better reimbursement coverage. A thumbs down will likely dampen enthusiasm in and practicality of the treatment until additional, corroborative data appear.
On Twitter @mitchelzoler

Study tracks distant metastatic patterns of Merkel cell carcinoma
SCOTTSDALE, ARIZ. – Distant metastatic sites of Merkel cell carcinoma most often involved the supraclavicular, retroperitoneal, and iliac lymph nodes, in a single center retrospective study of 305 patients.
Merkel cell carcinoma metastases “clearly favored distant nodes, but the distribution of other metastatic sites was distinct from other cancers, such as melanoma,” Jamiluddin Qazi, an undergraduate student at the University of Washington, Seattle, said at the annual meeting of the Society for Investigative Dermatology. The findings could help guide imaging and other surveillance of patients after they develop a primary Merkel cell tumor, he added.

About 2,000 individuals in the United States are diagnosed with Merkel cell carcinoma every year. About 40% of these patients develop metastatic disease, which has a 5-year survival rate of less than 25%, Mr. Qazi noted. Indeed, median survival after diagnosis of metastatic Merkel cell carcinoma was only 9.5 months in one recent study (J Cutan Pathol. 2010;37:20-7). Programmed death 1 (PD-1) blockade with pembrolizumab (Keytruda) can potentially improve survival (N Engl J Med. 2016; 374:2542-52), “but there is no consensus regarding follow-up for Merkel cell carcinoma. The 2016 National Comprehensive Cancer Network (NCCN) guidelines recommend ‘follow up as clinically indicated,’ and a lack of data has led to ambiguity,” Mr. Qazi said.
Working with oncologists and radiologists at the Seattle Cancer Care Alliance, he analyzed a tissue and clinical database of 442 initial distant Merkel cell carcinoma metastases among 305 patients. Initial distant metastases were defined as the first lesions detected beyond the regional lymph nodes of the primary tumor. A total of 69% of patients had one initial distant metastasis, 19% had two concurrently identified lesions, 9% had three lesions, and 4% had at least four lesions, Mr. Qazi reported.
“Merkel cell carcinoma seemed to metastasize to unusual places, but clearly preferred the distant lymph nodes. In all, 26% of metastases localized there, most commonly to the supraclavicular, retroperitoneal, and iliac nodes,” he said. The next most common site of distant metastasis was the liver (15% of lesions), followed by the skin and bone (13% of lesions each), lung (6%), and pancreas (5%). Less common sites included the heart, spleen, abdominal muscle, brain, kidneys, adrenal glands, gonad, chest wall, and stomach.
Comparing these findings with a similar study in melanoma (J Oncol 2012. doi: 10.1155/2012/647684) showed that both cancers have about the same chances of metastasizing to the liver, bone, kidneys, adrenal glands, and stomach, Mr. Qazi said. However, Merkel cell carcinoma was less likely to metastasize to the brain (3% of lesions, vs. 12% for melanoma) and lung (6% vs. 14%), and was more likely to metastasize to the pancreas (5% vs. 1%).
Now the investigators are working to link metastatic sites with factors such as the location of the primary tumor, the presence or absence of lymphovascular invasion, and the status of the immune system and Merkel polyomavirus infection, said Mr. Qazi. They also are analyzing time from diagnosis or treatment to metastasis to help guide decisions about when to order follow-up imaging. Ultimately, they hope to create an online tool that enables clinicians to describe a primary Merkel cell carcinoma and rapidly receive automated information about the most likely timing and location of metastasis.
The National Institutes of Health supported the study. Mr. Qazi had no conflicts of interest.
SCOTTSDALE, ARIZ. – Distant metastatic sites of Merkel cell carcinoma most often involved the supraclavicular, retroperitoneal, and iliac lymph nodes, in a single center retrospective study of 305 patients.
Merkel cell carcinoma metastases “clearly favored distant nodes, but the distribution of other metastatic sites was distinct from other cancers, such as melanoma,” Jamiluddin Qazi, an undergraduate student at the University of Washington, Seattle, said at the annual meeting of the Society for Investigative Dermatology. The findings could help guide imaging and other surveillance of patients after they develop a primary Merkel cell tumor, he added.
About 2,000 individuals in the United States are diagnosed with Merkel cell carcinoma every year. About 40% of these patients develop metastatic disease, which has a 5-year survival rate of less than 25%, Mr. Qazi noted. Indeed, median survival after diagnosis of metastatic Merkel cell carcinoma was only 9.5 months in one recent study (J Cutan Pathol. 2010;37:20-7). Programmed death 1 (PD-1) blockade with pembrolizumab (Keytruda) can potentially improve survival (N Engl J Med. 2016; 374:2542-52), “but there is no consensus regarding follow-up for Merkel cell carcinoma. The 2016 National Comprehensive Cancer Network (NCCN) guidelines recommend ‘follow up as clinically indicated,’ and a lack of data has led to ambiguity,” Mr. Qazi said.
Working with oncologists and radiologists at the Seattle Cancer Care Alliance, he analyzed a tissue and clinical database of 442 initial distant Merkel cell carcinoma metastases among 305 patients. Initial distant metastases were defined as the first lesions detected beyond the regional lymph nodes of the primary tumor. A total of 69% of patients had one initial distant metastasis, 19% had two concurrently identified lesions, 9% had three lesions, and 4% had at least four lesions, Mr. Qazi reported.
“Merkel cell carcinoma seemed to metastasize to unusual places, but clearly preferred the distant lymph nodes. In all, 26% of metastases localized there, most commonly to the supraclavicular, retroperitoneal, and iliac nodes,” he said. The next most common site of distant metastasis was the liver (15% of lesions), followed by the skin and bone (13% of lesions each), lung (6%), and pancreas (5%). Less common sites included the heart, spleen, abdominal muscle, brain, kidneys, adrenal glands, gonad, chest wall, and stomach.
Comparing these findings with a similar study in melanoma (J Oncol 2012. doi: 10.1155/2012/647684) showed that both cancers have about the same chances of metastasizing to the liver, bone, kidneys, adrenal glands, and stomach, Mr. Qazi said. However, Merkel cell carcinoma was less likely to metastasize to the brain (3% of lesions, vs. 12% for melanoma) and lung (6% vs. 14%), and was more likely to metastasize to the pancreas (5% vs. 1%).
Now the investigators are working to link metastatic sites with factors such as the location of the primary tumor, the presence or absence of lymphovascular invasion, and the status of the immune system and Merkel polyomavirus infection, said Mr. Qazi. They also are analyzing time from diagnosis or treatment to metastasis to help guide decisions about when to order follow-up imaging. Ultimately, they hope to create an online tool that enables clinicians to describe a primary Merkel cell carcinoma and rapidly receive automated information about the most likely timing and location of metastasis.
The National Institutes of Health supported the study. Mr. Qazi had no conflicts of interest.
AT THE 2016 SID ANNUAL MEETING
Key clinical point: Distant metastases of Merkel cell carcinoma most often involve the lymph nodes, followed by the liver, skin, and bone.
Major finding: Distant lymph node metastases comprised 26% of lesions, the liver comprised 15%, and skin and bone made up 13% each.
Data source: A single-center retrospective study of 442 initial distant metastases of Merkel cell carcinoma among 305 patients.
Disclosures: The National Institutes of Health supported the study. Mr. Qazi had no conflicts of interest.

Study tracks distant metastatic patterns of Merkel cell carcinoma
SCOTTSDALE, ARIZ. – Distant metastatic sites of Merkel cell carcinoma most often involved the supraclavicular, retroperitoneal, and iliac lymph nodes, in a single center retrospective study of 305 patients.
Merkel cell carcinoma metastases “clearly favored distant nodes, but the distribution of other metastatic sites was distinct from other cancers, such as melanoma,” Jamiluddin Qazi, an undergraduate student at the University of Washington, Seattle, said at the annual meeting of the Society for Investigative Dermatology. The findings could help guide imaging and other surveillance of patients after they develop a primary Merkel cell tumor, he added.
About 2,000 individuals in the United States are diagnosed with Merkel cell carcinoma every year. About 40% of these patients develop metastatic disease, which has a 5-year survival rate of less than 25%, Mr. Qazi noted. Indeed, median survival after diagnosis of metastatic Merkel cell carcinoma was only 9.5 months in one recent study (J Cutan Pathol. 2010;37:20-7). Programmed death 1 (PD-1) blockade with pembrolizumab (Keytruda) can potentially improve survival (N Engl J Med. 2016; 374:2542-52), “but there is no consensus regarding follow-up for Merkel cell carcinoma. The 2016 National Comprehensive Cancer Network (NCCN) guidelines recommend ‘follow up as clinically indicated,’ and a lack of data has led to ambiguity,” Mr. Qazi said.
Working with oncologists and radiologists at the Seattle Cancer Care Alliance, he analyzed a tissue and clinical database of 442 initial distant Merkel cell carcinoma metastases among 305 patients. Initial distant metastases were defined as the first lesions detected beyond the regional lymph nodes of the primary tumor. A total of 69% of patients had one initial distant metastasis, 19% had two concurrently identified lesions, 9% had three lesions, and 4% had at least four lesions, Mr. Qazi reported.
“Merkel cell carcinoma seemed to metastasize to unusual places, but clearly preferred the distant lymph nodes. In all, 26% of metastases localized there, most commonly to the supraclavicular, retroperitoneal, and iliac nodes,” he said. The next most common site of distant metastasis was the liver (15% of lesions), followed by the skin and bone (13% of lesions each), lung (6%), and pancreas (5%). Less common sites included the heart, spleen, abdominal muscle, brain, kidneys, adrenal glands, gonad, chest wall, and stomach.
Comparing these findings with a similar study in melanoma (J Oncol 2012. doi: 10.1155/2012/647684) showed that both cancers have about the same chances of metastasizing to the liver, bone, kidneys, adrenal glands, and stomach, Mr. Qazi said. However, Merkel cell carcinoma was less likely to metastasize to the brain (3% of lesions, vs. 12% for melanoma) and lung (6% vs. 14%), and was more likely to metastasize to the pancreas (5% vs. 1%).
Now the investigators are working to link metastatic sites with factors such as the location of the primary tumor, the presence or absence of lymphovascular invasion, and the status of the immune system and Merkel polyomavirus infection, said Mr. Qazi. They also are analyzing time from diagnosis or treatment to metastasis to help guide decisions about when to order follow-up imaging. Ultimately, they hope to create an online tool that enables clinicians to describe a primary Merkel cell carcinoma and rapidly receive automated information about the most likely timing and location of metastasis.
The National Institutes of Health supported the study. Mr. Qazi had no conflicts of interest.
AT THE 2016 SID ANNUAL MEETING
Key clinical point: Distant metastases of Merkel cell carcinoma most often involve the lymph nodes, followed by the liver, skin, and bone.
Major finding: Distant lymph node metastases comprised 26% of lesions, the liver comprised 15%, and skin and bone made up 13% each.
Data source: A single-center retrospective study of 442 initial distant metastases of Merkel cell carcinoma among 305 patients.
Disclosures: The National Institutes of Health supported the study. Mr. Qazi had no conflicts of interest.