User login
Results support INR self-monitoring/management

Results of a systematic review support self-monitoring and self-management for patients on long-term oral anticoagulation therapy.
Researchers found that both self-monitoring and self-management were associated with a reduction in thromboembolic events when compared to standard monitoring.
Self-management, but not self-monitoring, was associated with a reduction in all-cause mortality.
And neither practice appeared to have an effect on major bleeding.
These results were published in the Cochrane Database of Systematic Reviews.
Point-of-care testing has made it possible for patients on long-term oral anticoagulation therapy to monitor their own international normalized ratio (INR).
Patients can either adjust their own medication according to a pre-determined dose-INR schedule, which is known as self-management, or they can call into a clinic to be told the appropriate dose adjustment, which is known as self-monitoring.
For the current review, Carl Heneghan, BM BCh, DPhil, of the University of Oxford in the UK, and his colleagues evaluated data from 28 randomized trials including 8950 patients. The trials compared self-monitoring and self-management with standard monitoring.
The researchers said pooled estimates showed a reduction in thromboembolic events with both self-management and self-monitoring, compared to standard monitoring.
Eleven studies including 3497 patients showed the relative risk (RR) of thromboembolic events was 0.47 (95% CI 0.31 to 0.70) for self-management compared to standard monitoring.
Seven studies including 4097 patients showed the RR of thromboembolic events was 0.69 (95% CI 0.49 to 0.97) for self-monitoring compared to standard monitoring.
Eight studies including 3058 patients suggested that self-management caused a reduction in all-cause mortality (RR=0.55, 95% CI 0.36 to 0.84) when compared to standard monitoring.
But 3 studies of 3300 patients indicated that self-monitoring did not reduce all-cause mortality (RR=0.94, 95% CI 0.78 to 1.15).
In 20 trials of 8018 patients, neither self-monitoring nor self-management reduced major hemorrhage (RR=0.95, 95% CI, 0.80 to 1.12) when compared to standard monitoring.
For all of these analyses, the quality of evidence was moderate.
“Our review of the latest research finds that self-monitoring alone does indeed result in a statistically significant reduction in thromboembolic events, whereas our previous review did not find this effect,” Dr Heneghan said.
“Suitable patients still need to be identified and educated for self-monitoring as it is not feasible for everyone, but the evidence clearly demonstrates that self-monitoring can improve the quality of oral anticoagulation therapy and adds weight to the argument that more patients should be given the opportunity to benefit from this treatment approach.”
The current review is an update on a previous review carried out by the same researchers in 2010. It includes 10 new studies of 4227 participants. ![]()
Can Mindfulness Components Added To A Diet-Exercise Program Improve Weight Loss Outcomes?
Study Overview
Objective. To determine whether weight loss and cardiometabolic risk factors are improved when mindfulness training is added to a diet-exercise program.
Design. 2-arm randomized controlled trial.
Setting and participants. Study participants were recruited through fliers, newspaper advertisements, online postings, and referrals at University of California, San Francisco clinics, and were enrolled from July 2009 to February 2012. Inclusion criteria were body mass index (BMI) between 30 and 45.9, abdominal obesity (waist circumference > 102 cm for men and > 88 cm for women), and age 18 or older. Exclusion criteria were current involvement with diet program or diet mediation, diabetes mellitus, fasting glucose ≥ 126 mg/dL, or hemoglobin A1c (HbA1C) between 6.0% and 6.5% with abnormal oral glucose tolerance test. Participants were randomized in a 1:1 ratio to one of 2 weight loss program arms using a computer-generated randomization sequence.
Intervention. In both arms, participants received general diet and exercise guidelines prescribing healthy eating and frequent exercise delivered in 16 sessions lasting 2 to 2½ hours and one all-day session over 5.5 months. Participants in the mindfulness intervention additionally received mindfulness training for eating, physical activity, and stress management from mindfulness mediation instructors and a registered dietician. They also followed guidelines at home, which included practicing meditation for up to 30 minutes 6 days a week, mini-meditations, and eating mindfully. To control for the activities and attention inherent in the mindfulness arm (eg, social support, expectation of benefit, snacks provided during mindful eating exercises, at home practice), the control arm was an “active control” and included additional nutritional and physical activity information, snacks, strength training, home activities, conversations about society and weight loss, and low-dose progressive muscle relaxation and cognitive-behavioral training. Active control materials were delivered by one of 3 registered dieticians.
Main outcomes measures. The primary outcome was 18-month weight change. Participants’ weight, height, blood pressure, and weight circumference were measured at baseline and 3, 6, 12, and 18 months between 8 am and 10 am. Measurements were taken under fasting conditions and by arm-blinded staff. Blood samples were taken to assess secondary outcome changes in glucose, lipid, HbA1C, insulin, and C-reactive protein. Researchers also collected anonymous qualitative feedback from participants and supervisors to do a secondary analysis assessing differences in effectiveness and helpfulness of mindfulness teachings among instructors.
Main results. Of the potential participants that contacted the study team in response to recruitment efforts (n = 1485), 216 were fully eligible based on criteria and a screening visit. Participants that consented to participate (n = 194) were randomized. Participants across both groups were predominantly female, of European ethnic origin, and similar in age: mindfulness group, 47.2 years (13.0) and active control group, 47.8 years (12.4). At baseline, the mindfulness and active control arms had average BMIs of 35.4 (3.5) and 35.6 (3.8), respectively. Baseline characteristics, session attendance, and 18-month retention were similar for both arms. Participants in the mindfulness arm reported completing 70% (2.1 hours per week, SD = 1.2) of the recommended meditation time and eating 57% (SD = 29) of meals mindfully.
Weight loss outcomes between groups favored the mindfulness arms, but results were not significant. The largest difference of –1.9 kg (95% CI –4.5 to 0.8; P = 0.17) was at 12 months. The difference persisted at 18 months with –1.7 kg (95% CI –4.7 to 1.2 kg; P = 0.24). The mindfulness arm lost 4.2 kg (95% CI –6.2 to 2.2 kg) while the active control arm lost 2.4 kg (95% CI –4.5 to –0.3 kg).
Cardiometabolic outcomes at 12 months showed group differences in fasting glucose that favored the mindfulness arm, –3.1 mg/dL (95% CI 26.3 to 0.1; P = 0.06), while there was a significant group difference at 18 months, –4.1 mg/dL (95% CI –7.3 to –0.9; P = 0.01). Data at 18-months showed that normal glucose changed minimally in the mindfulness arm, –0.31 mg/dL (95% CI –2.5 to 1.9), but increased in the active control arm 3.8 mg/dL (95% CI 1.5 to 6.1). Other cardiometabolic outcomes (ie, triglyceride/HDL ratio and triglycerides) showed significance at 12 months, favoring the mindfulness arm, but not at 18 months. Although not all were statistically significant, 9 of 11 outcomes favored the mindfulness arm at 18 months.
Significant interactions (P < 0.05) were found between arm and enrollment rounds categorized by mindfulness instructor on weight, BMI, fasting glucose, homeostatic homeostasis model assessment of insulin resistance (defined as [glucose x insulin/{40 × 33.25}]), and HbA1c, with a marginally significant effect for waist circumference (P = 0.08). Qualitative feedback on mindfulness instructors showed that in the group with a lowly rated instructor, participants lost less weight at 18 months (–2.0 kg [95% CI –4.7 to 0.7]), compared to participants in groups with highly rated instructors (–6.3 kg [95% CI –9.1 to –3.6]; P = 0.02). Similar trends followed for reductions in BMI and waist circumference.
Conclusions. With regard to weight loss outcomes, a mindfulness-enhanced diet-exercise program and an active control arm did not show substantial differences. Some evidence, however, suggests modest benefit of added mindfulness components, which may lead to long-term maintenance of fasting glucose levels and improved atherogenic lipid profiles.
Commentary
Mindfulness, or nonjudgmental focus on the present moment, has been utilized by many interventions targeted at self-regulated behavior [1]. Mindfulness interventions aim to promote healthy behavior changes by encouraging careful monitoring of behavior reactivity. Weight loss and weight loss maintenance have been of particular interest with this approach because mindfulness-based interventions may promote long-term maintenance of weight loss [2]. This maintenance is achieved through a focus on modifying health behaviors, rather than a focus on weight loss alone [3]. Mindfulness has been incorporated into weight loss interventions through yoga practices [4] and mindfulness meditation [5].
Several studies have explored the relationship between mindfulness and weight loss in various populations, highlighting mindfulness’s role in weight loss and behavior change. Most notably, mindfulness interventions have shown improvements in fasting glucose levels [6], psychological distress [7], self-efficacy, weight loss, eating behaviors, and physical activity [8–10]. Despite being well designed, this study by Daubenmier et al did not find significant changes in weight loss. However, secondary outcomes related to weight, metabolic, syndrome, and cardiovascular risk showed modest improvements with mindfulness. These results may correlate to previous findings showing that lifestyle changes many not result in weight loss but can reverse or reduce disorders related to obesity [11].
The study was strengthened by randomization, intention-to-treat analysis, objective measures by arm-blinded staff, standardized measuring conditions, balanced participant allocation to each arm, 1-year follow-up, and qualitative feedback on instructors to assess whether weight loss may be instructor-dependent. In addition, the authors made an effort to mask their intention to test the effects of a mindfulness-enhanced intervention. They designed a rigorous active control intervention arm by controlling for attention, social support, expectations of benefit, diet-exercise guidelines, and elements of a mindfulness approach to stress management. An additional strength included a cost-analysis of adding mindfulness components. The generalizability of the results may be limited as the study population were predominantly white females and most had a bachelor’s degree. The study sample was also disproportionately menopausal women, a group that especially struggles with weight loss. This demographic factor may be responsible for the lack of significant weight loss. Other limitations of this study include participant dropout and variability between instructor styles, although the latter was explored in a secondary analysis of weight loss differences between instructors.
The researchers discussed how the active control intervention arm may have contributed to the lack of significant weight loss difference between groups. The researchers also highlighted that participants randomized to the mindfulness arm that were not interested in mindfulness practices may have benefitted less than those who were interested. This combined with the modest diet and exercise components of the intervention may also explain the lack of significance in results. It may also explain why some outcomes were significant at earlier months but attenuated by 18 months. Future studies should assess incorporating more intense exercise and diet approaches, as well as continuous contact throughout the 18-month time period.
Applications for Clinical Practice
This study demonstrated that mindfulness components added to a diet-exercise program can be helpful in promoting metabolic changes but not necessarily weight loss. Since metabolic changes can be protective against morbidities (eg, type 2 diabetes), mindfulness can be a powerful and cost-effective approach within clinical practice. Mindfulness practices can also be easily implemented in various settings and with diverse populations. Future studies should explore adding mindfulness components to more intensive weight loss interventions. Providers and health care settings should consider incorporating mindfulness practices into weight management counseling and programs.
—Michelle J. Williamson and Katrina F. Mateo, MPH
1. Caldwell KL, Baime MJ, Wolever RQ. Mindfulness based approaches to obesity and weight loss maintenance. J Ment Health Couns 2012;34:26982.
2. O’Reilly GA, Cook L, Spruijt-Metz D, Black DS. Mindfulness-based interventions for obesity-related eating behaviours: A literature review. Obes Rev 2014;15:453–61.
3. Robison J. Health at every size: Toward a new paradigm of weight and health. MedGenMed 2005;7:13.
4. Godsey J. The role of mindfulness based interventions in the treatment of obesity and eating disorders: An integrative review. Complement Ther Med 2013;21:430–9.
5. Keune PM, Forintos DP. Mindfulness meditation: A preliminary study on meditation practice during everyday life activities and its association with well-being. Psychol Top 2010;19:373–86.
6. Mason AE, Epel ES, Kristeller J, et al. Effects of a mindfulness-based intervention on mindful eating, sweets consumption, and fasting glucose levels in obese adults: data from the SHINE randomized controlled trial. J Behav Med 2016;39:201–13.
7. Dalen J, Smith BW, Shelley BM, et al. Pilot study: Mindful Eating and Living (MEAL): Weight, eating behavior, and psychological outcomes associated with a mindfulness-based intervention for people with obesity. Complement Ther Med 2010;18:260–64.
8. Kristeller JL, Wolever RQ, Sheets V. Mindfulness-based eating awareness training (MB-EAT) for binge eating: A randomized clinical trial. Mindfulness 2013;5:282–97.
9. Miller C, Kristeller JL, Headings A, Nagaraja H. Comparison of a mindful eating intervention to a diabetes self- management intervention among adults with type 2 diabetes: a randomized controlled trial. Health Educ Behav 2013;41:145–54.
10. Timmerman GM, Brown A. The effect of a mindful restaurant eating intervention on weight management in women. J Nutr Educ Behav 2012;44:22–8.
11. Bacon L, Stern JS, Van Loan MD, Keim NL. Size acceptance and intuitive eating improve health for obese, female chronic dieters. J Am Diet Assoc 2005;105:929–36.
Study Overview
Objective. To determine whether weight loss and cardiometabolic risk factors are improved when mindfulness training is added to a diet-exercise program.
Design. 2-arm randomized controlled trial.
Setting and participants. Study participants were recruited through fliers, newspaper advertisements, online postings, and referrals at University of California, San Francisco clinics, and were enrolled from July 2009 to February 2012. Inclusion criteria were body mass index (BMI) between 30 and 45.9, abdominal obesity (waist circumference > 102 cm for men and > 88 cm for women), and age 18 or older. Exclusion criteria were current involvement with diet program or diet mediation, diabetes mellitus, fasting glucose ≥ 126 mg/dL, or hemoglobin A1c (HbA1C) between 6.0% and 6.5% with abnormal oral glucose tolerance test. Participants were randomized in a 1:1 ratio to one of 2 weight loss program arms using a computer-generated randomization sequence.
Intervention. In both arms, participants received general diet and exercise guidelines prescribing healthy eating and frequent exercise delivered in 16 sessions lasting 2 to 2½ hours and one all-day session over 5.5 months. Participants in the mindfulness intervention additionally received mindfulness training for eating, physical activity, and stress management from mindfulness mediation instructors and a registered dietician. They also followed guidelines at home, which included practicing meditation for up to 30 minutes 6 days a week, mini-meditations, and eating mindfully. To control for the activities and attention inherent in the mindfulness arm (eg, social support, expectation of benefit, snacks provided during mindful eating exercises, at home practice), the control arm was an “active control” and included additional nutritional and physical activity information, snacks, strength training, home activities, conversations about society and weight loss, and low-dose progressive muscle relaxation and cognitive-behavioral training. Active control materials were delivered by one of 3 registered dieticians.
Main outcomes measures. The primary outcome was 18-month weight change. Participants’ weight, height, blood pressure, and weight circumference were measured at baseline and 3, 6, 12, and 18 months between 8 am and 10 am. Measurements were taken under fasting conditions and by arm-blinded staff. Blood samples were taken to assess secondary outcome changes in glucose, lipid, HbA1C, insulin, and C-reactive protein. Researchers also collected anonymous qualitative feedback from participants and supervisors to do a secondary analysis assessing differences in effectiveness and helpfulness of mindfulness teachings among instructors.
Main results. Of the potential participants that contacted the study team in response to recruitment efforts (n = 1485), 216 were fully eligible based on criteria and a screening visit. Participants that consented to participate (n = 194) were randomized. Participants across both groups were predominantly female, of European ethnic origin, and similar in age: mindfulness group, 47.2 years (13.0) and active control group, 47.8 years (12.4). At baseline, the mindfulness and active control arms had average BMIs of 35.4 (3.5) and 35.6 (3.8), respectively. Baseline characteristics, session attendance, and 18-month retention were similar for both arms. Participants in the mindfulness arm reported completing 70% (2.1 hours per week, SD = 1.2) of the recommended meditation time and eating 57% (SD = 29) of meals mindfully.
Weight loss outcomes between groups favored the mindfulness arms, but results were not significant. The largest difference of –1.9 kg (95% CI –4.5 to 0.8; P = 0.17) was at 12 months. The difference persisted at 18 months with –1.7 kg (95% CI –4.7 to 1.2 kg; P = 0.24). The mindfulness arm lost 4.2 kg (95% CI –6.2 to 2.2 kg) while the active control arm lost 2.4 kg (95% CI –4.5 to –0.3 kg).
Cardiometabolic outcomes at 12 months showed group differences in fasting glucose that favored the mindfulness arm, –3.1 mg/dL (95% CI 26.3 to 0.1; P = 0.06), while there was a significant group difference at 18 months, –4.1 mg/dL (95% CI –7.3 to –0.9; P = 0.01). Data at 18-months showed that normal glucose changed minimally in the mindfulness arm, –0.31 mg/dL (95% CI –2.5 to 1.9), but increased in the active control arm 3.8 mg/dL (95% CI 1.5 to 6.1). Other cardiometabolic outcomes (ie, triglyceride/HDL ratio and triglycerides) showed significance at 12 months, favoring the mindfulness arm, but not at 18 months. Although not all were statistically significant, 9 of 11 outcomes favored the mindfulness arm at 18 months.
Significant interactions (P < 0.05) were found between arm and enrollment rounds categorized by mindfulness instructor on weight, BMI, fasting glucose, homeostatic homeostasis model assessment of insulin resistance (defined as [glucose x insulin/{40 × 33.25}]), and HbA1c, with a marginally significant effect for waist circumference (P = 0.08). Qualitative feedback on mindfulness instructors showed that in the group with a lowly rated instructor, participants lost less weight at 18 months (–2.0 kg [95% CI –4.7 to 0.7]), compared to participants in groups with highly rated instructors (–6.3 kg [95% CI –9.1 to –3.6]; P = 0.02). Similar trends followed for reductions in BMI and waist circumference.
Conclusions. With regard to weight loss outcomes, a mindfulness-enhanced diet-exercise program and an active control arm did not show substantial differences. Some evidence, however, suggests modest benefit of added mindfulness components, which may lead to long-term maintenance of fasting glucose levels and improved atherogenic lipid profiles.
Commentary
Mindfulness, or nonjudgmental focus on the present moment, has been utilized by many interventions targeted at self-regulated behavior [1]. Mindfulness interventions aim to promote healthy behavior changes by encouraging careful monitoring of behavior reactivity. Weight loss and weight loss maintenance have been of particular interest with this approach because mindfulness-based interventions may promote long-term maintenance of weight loss [2]. This maintenance is achieved through a focus on modifying health behaviors, rather than a focus on weight loss alone [3]. Mindfulness has been incorporated into weight loss interventions through yoga practices [4] and mindfulness meditation [5].
Several studies have explored the relationship between mindfulness and weight loss in various populations, highlighting mindfulness’s role in weight loss and behavior change. Most notably, mindfulness interventions have shown improvements in fasting glucose levels [6], psychological distress [7], self-efficacy, weight loss, eating behaviors, and physical activity [8–10]. Despite being well designed, this study by Daubenmier et al did not find significant changes in weight loss. However, secondary outcomes related to weight, metabolic, syndrome, and cardiovascular risk showed modest improvements with mindfulness. These results may correlate to previous findings showing that lifestyle changes many not result in weight loss but can reverse or reduce disorders related to obesity [11].
The study was strengthened by randomization, intention-to-treat analysis, objective measures by arm-blinded staff, standardized measuring conditions, balanced participant allocation to each arm, 1-year follow-up, and qualitative feedback on instructors to assess whether weight loss may be instructor-dependent. In addition, the authors made an effort to mask their intention to test the effects of a mindfulness-enhanced intervention. They designed a rigorous active control intervention arm by controlling for attention, social support, expectations of benefit, diet-exercise guidelines, and elements of a mindfulness approach to stress management. An additional strength included a cost-analysis of adding mindfulness components. The generalizability of the results may be limited as the study population were predominantly white females and most had a bachelor’s degree. The study sample was also disproportionately menopausal women, a group that especially struggles with weight loss. This demographic factor may be responsible for the lack of significant weight loss. Other limitations of this study include participant dropout and variability between instructor styles, although the latter was explored in a secondary analysis of weight loss differences between instructors.
The researchers discussed how the active control intervention arm may have contributed to the lack of significant weight loss difference between groups. The researchers also highlighted that participants randomized to the mindfulness arm that were not interested in mindfulness practices may have benefitted less than those who were interested. This combined with the modest diet and exercise components of the intervention may also explain the lack of significance in results. It may also explain why some outcomes were significant at earlier months but attenuated by 18 months. Future studies should assess incorporating more intense exercise and diet approaches, as well as continuous contact throughout the 18-month time period.
Applications for Clinical Practice
This study demonstrated that mindfulness components added to a diet-exercise program can be helpful in promoting metabolic changes but not necessarily weight loss. Since metabolic changes can be protective against morbidities (eg, type 2 diabetes), mindfulness can be a powerful and cost-effective approach within clinical practice. Mindfulness practices can also be easily implemented in various settings and with diverse populations. Future studies should explore adding mindfulness components to more intensive weight loss interventions. Providers and health care settings should consider incorporating mindfulness practices into weight management counseling and programs.
—Michelle J. Williamson and Katrina F. Mateo, MPH
1. Caldwell KL, Baime MJ, Wolever RQ. Mindfulness based approaches to obesity and weight loss maintenance. J Ment Health Couns 2012;34:26982.
2. O’Reilly GA, Cook L, Spruijt-Metz D, Black DS. Mindfulness-based interventions for obesity-related eating behaviours: A literature review. Obes Rev 2014;15:453–61.
3. Robison J. Health at every size: Toward a new paradigm of weight and health. MedGenMed 2005;7:13.
4. Godsey J. The role of mindfulness based interventions in the treatment of obesity and eating disorders: An integrative review. Complement Ther Med 2013;21:430–9.
5. Keune PM, Forintos DP. Mindfulness meditation: A preliminary study on meditation practice during everyday life activities and its association with well-being. Psychol Top 2010;19:373–86.
6. Mason AE, Epel ES, Kristeller J, et al. Effects of a mindfulness-based intervention on mindful eating, sweets consumption, and fasting glucose levels in obese adults: data from the SHINE randomized controlled trial. J Behav Med 2016;39:201–13.
7. Dalen J, Smith BW, Shelley BM, et al. Pilot study: Mindful Eating and Living (MEAL): Weight, eating behavior, and psychological outcomes associated with a mindfulness-based intervention for people with obesity. Complement Ther Med 2010;18:260–64.
8. Kristeller JL, Wolever RQ, Sheets V. Mindfulness-based eating awareness training (MB-EAT) for binge eating: A randomized clinical trial. Mindfulness 2013;5:282–97.
9. Miller C, Kristeller JL, Headings A, Nagaraja H. Comparison of a mindful eating intervention to a diabetes self- management intervention among adults with type 2 diabetes: a randomized controlled trial. Health Educ Behav 2013;41:145–54.
10. Timmerman GM, Brown A. The effect of a mindful restaurant eating intervention on weight management in women. J Nutr Educ Behav 2012;44:22–8.
11. Bacon L, Stern JS, Van Loan MD, Keim NL. Size acceptance and intuitive eating improve health for obese, female chronic dieters. J Am Diet Assoc 2005;105:929–36.
Help for Active Surveillance Anxiety in Men with Prostate Cancer
Study Overview
Objective. To examine the feasibility, acceptability and benefits of mindfulness meditation training in men with low-grade prostate cancer on active surveillance.
Design. Randomized controlled pilot trial.
Setting and participants. Participants were men with low-risk localized prostate cancer who were on an IRB-approved active surveillance protocol within a medium-sized community hospital system in suburban Chicago. Enrolled patients were randomized to the active intervention or a control condition where participants received a book on mindfulness but no specific instructions to read it.
Intervention. Patients in the intervention arm attended an 8-week mindfulness-based stress reduction intervention, consisting of weekly sessions lasting 2½ hours held at their local primary hospital. Sessions were conducted by a trained and experienced mindfulness instructor. The intervention also included a half day retreat near the end of the intervention period to practice the skills that were taught.
Main outcome measures. Main outcome measures were prostate cancer anxiety (measured using the 18-item Memorial Anxiety Scale for Prostate Cancer), uncertainty tolerance (measured using the 12-item Intolerance of Uncertainty Short Form), mindfulness (measured via the 15-item Mindful Attention Awareness Scale), and health-related quality of life (measured using 10-item PROMIS Global Health-10). Researchers also measured “posttraumatic growth” using the Posttraumatic Growth Inventory, a 21-item self-report scale used to assess growth or benefits after a specific traumatic life event, such as a diagnosis of cancer. Participants completed instruments at baseline, 8 weeks, 6 months, and 12 months. At 12 months they also complete a brief feasibility and acceptance survey.
Main results. Over a 3-year period, 115 men were approached to participate and 54 enrolled. 11 withdrew prior to randomization citing lack of time as the primary reason. Ultimately, 24 men were randomized to the mindfulness arm and 19 to control. Average age was 70 years and 95% were white. Over 90% had never previously meditated or had never meditated on a regular basis. There were no significant differences between enrollees and decliners on baseline clinical or sociodemographic variables, and there were no significant differences between mindfulness and control patients on sociodemographic or clinical variables or outcome measures.
Participants in the intervention group reported decreased prostate cancer anxiety at 6 months (P = 0.02, effect size ([ES] 0.30) and uncertainty intolerance at 12 months (P = 0.02, ES 0.32) and increased quality of life at 8 weeks (P = 0.05, ES 0.17), mindfulness at 8 weeks (P < 0.04, ES 0.35) and 12 months (P < 0.01, ES 0.17), and posttraumatic growth (P < 0.05 for all follow-up measurements). When measuring changes between the groups, the only outcome that was significant was posttraumatic growth (P = 0.01, ES 0.73). Written responses to the open-ended survey questions regarding participants’ experience with the course cited increased emotional regulation and self-awareness and positive health behavior change.
Conclusion. An 8-week mindfulness training is feasible and acceptable to men with prostate cancer on active surveillance and may help men cope more effectively with stress and anxiety related to their cancer experience.
Commentary
Prostate cancer is the most common nonskin malignancy in men. More than 180,000 men are diagnosed per year, with over 26,000 prostate cancer deaths annually [1]. The optimal approach to treating newly diagnosed prostate cancer can be variable, but for most patients with low-risk (Gleason score ≤ 6) localized prostate cancer, active surveillance is the recommended disease management strategy [2]. Despite the favorable prognosis of low-risk prostate cancer, men who choose active surveillance may experience anxiety and uncertainty, which can cause many to request definitive therapy even when there is no tumor progression [3].
Mindfulness-based meditation is a practice that is increasingly being investigated for a wide array of health conditions. Mindfulness has been defined as being intentionally aware of internal and external experiences that occur at the present moment, without judgment. Behavioral interventions such as mindfulness training may lessen anxiety related to uncertainty intolerance and help maintain patient engagement in active surveillance [4].
This small pilot study by Victorson et al evaluated an 8-week mindfulness meditation intervention intended to help men in active surveillance manage cancer-related uncertainty intolerance. They found the meditation training to be generally feasible and acceptable among participants. Men in the active intervention demonstrated statistically significant within-group changes that included decreased prostate cancer anxiety and increased mental well-being and posttraumatic growth, but there were no differences between groups except for posttraumatic growth. Interestingly, the control group also reported a moderate increase in mindfulness at 12 months, which was found (in an exploratory follow-up analysis) to be unrelated to reading the mindfulness book they were given (eg, those who did not open the book had higher average mindfulness scores than those who read the book from cover to cover).
Limitations of the study include the small sample size and lack of diversity among the participants, who were 95% white and well educated. In addition, the response rate prior to randomization was low: out of 115 men approached, 43 were ultimately randomized. Retention rates at 12 months were similar: 71% for intervention and 74% for control.
Applications for Clinical Practice
A growing body of research demonstrates that mindfulness practice may aid in improving psychological well-being. Further research is necessary before a clinical recommendation can be offered regarding use of mindfulness instruction to alleviate anxiety in men with low-grade prostate cancer being managed with active surveillance.
1. Siegel RL, Miller KD, Jemal A. Cancer statistics, 2016. CA Cancer J Clin 2016;66:7-–30.
2. Chen RC, Rumble RB, Loblaw DA, et al. Active surveillance for the management of localized prostate cancer (Cancer Care Ontario Guideline): American Society of Clinical Oncology Clinical Practice Guideline Endorsement. J Clin Oncol 2016;34:2182–90.
3. Latini DM, Hart SL, Knight SJ, et al; CaPSURE Investigators. The relationship between anxiety and time to treatment for patients with prostate cancer on surveillance. J Urol 2007;178(3 Pt 1):826–31; discussion 831–2.
4. Tan HJ, Marks LS, Hoyt MA, et al. The relationship between intolerance of uncertainty and anxiety in men on active surveillance for prostate cancer. J Urol 2016;195:1724–30.
Study Overview
Objective. To examine the feasibility, acceptability and benefits of mindfulness meditation training in men with low-grade prostate cancer on active surveillance.
Design. Randomized controlled pilot trial.
Setting and participants. Participants were men with low-risk localized prostate cancer who were on an IRB-approved active surveillance protocol within a medium-sized community hospital system in suburban Chicago. Enrolled patients were randomized to the active intervention or a control condition where participants received a book on mindfulness but no specific instructions to read it.
Intervention. Patients in the intervention arm attended an 8-week mindfulness-based stress reduction intervention, consisting of weekly sessions lasting 2½ hours held at their local primary hospital. Sessions were conducted by a trained and experienced mindfulness instructor. The intervention also included a half day retreat near the end of the intervention period to practice the skills that were taught.
Main outcome measures. Main outcome measures were prostate cancer anxiety (measured using the 18-item Memorial Anxiety Scale for Prostate Cancer), uncertainty tolerance (measured using the 12-item Intolerance of Uncertainty Short Form), mindfulness (measured via the 15-item Mindful Attention Awareness Scale), and health-related quality of life (measured using 10-item PROMIS Global Health-10). Researchers also measured “posttraumatic growth” using the Posttraumatic Growth Inventory, a 21-item self-report scale used to assess growth or benefits after a specific traumatic life event, such as a diagnosis of cancer. Participants completed instruments at baseline, 8 weeks, 6 months, and 12 months. At 12 months they also complete a brief feasibility and acceptance survey.
Main results. Over a 3-year period, 115 men were approached to participate and 54 enrolled. 11 withdrew prior to randomization citing lack of time as the primary reason. Ultimately, 24 men were randomized to the mindfulness arm and 19 to control. Average age was 70 years and 95% were white. Over 90% had never previously meditated or had never meditated on a regular basis. There were no significant differences between enrollees and decliners on baseline clinical or sociodemographic variables, and there were no significant differences between mindfulness and control patients on sociodemographic or clinical variables or outcome measures.
Participants in the intervention group reported decreased prostate cancer anxiety at 6 months (P = 0.02, effect size ([ES] 0.30) and uncertainty intolerance at 12 months (P = 0.02, ES 0.32) and increased quality of life at 8 weeks (P = 0.05, ES 0.17), mindfulness at 8 weeks (P < 0.04, ES 0.35) and 12 months (P < 0.01, ES 0.17), and posttraumatic growth (P < 0.05 for all follow-up measurements). When measuring changes between the groups, the only outcome that was significant was posttraumatic growth (P = 0.01, ES 0.73). Written responses to the open-ended survey questions regarding participants’ experience with the course cited increased emotional regulation and self-awareness and positive health behavior change.
Conclusion. An 8-week mindfulness training is feasible and acceptable to men with prostate cancer on active surveillance and may help men cope more effectively with stress and anxiety related to their cancer experience.
Commentary
Prostate cancer is the most common nonskin malignancy in men. More than 180,000 men are diagnosed per year, with over 26,000 prostate cancer deaths annually [1]. The optimal approach to treating newly diagnosed prostate cancer can be variable, but for most patients with low-risk (Gleason score ≤ 6) localized prostate cancer, active surveillance is the recommended disease management strategy [2]. Despite the favorable prognosis of low-risk prostate cancer, men who choose active surveillance may experience anxiety and uncertainty, which can cause many to request definitive therapy even when there is no tumor progression [3].
Mindfulness-based meditation is a practice that is increasingly being investigated for a wide array of health conditions. Mindfulness has been defined as being intentionally aware of internal and external experiences that occur at the present moment, without judgment. Behavioral interventions such as mindfulness training may lessen anxiety related to uncertainty intolerance and help maintain patient engagement in active surveillance [4].
This small pilot study by Victorson et al evaluated an 8-week mindfulness meditation intervention intended to help men in active surveillance manage cancer-related uncertainty intolerance. They found the meditation training to be generally feasible and acceptable among participants. Men in the active intervention demonstrated statistically significant within-group changes that included decreased prostate cancer anxiety and increased mental well-being and posttraumatic growth, but there were no differences between groups except for posttraumatic growth. Interestingly, the control group also reported a moderate increase in mindfulness at 12 months, which was found (in an exploratory follow-up analysis) to be unrelated to reading the mindfulness book they were given (eg, those who did not open the book had higher average mindfulness scores than those who read the book from cover to cover).
Limitations of the study include the small sample size and lack of diversity among the participants, who were 95% white and well educated. In addition, the response rate prior to randomization was low: out of 115 men approached, 43 were ultimately randomized. Retention rates at 12 months were similar: 71% for intervention and 74% for control.
Applications for Clinical Practice
A growing body of research demonstrates that mindfulness practice may aid in improving psychological well-being. Further research is necessary before a clinical recommendation can be offered regarding use of mindfulness instruction to alleviate anxiety in men with low-grade prostate cancer being managed with active surveillance.
1. Siegel RL, Miller KD, Jemal A. Cancer statistics, 2016. CA Cancer J Clin 2016;66:7-–30.
2. Chen RC, Rumble RB, Loblaw DA, et al. Active surveillance for the management of localized prostate cancer (Cancer Care Ontario Guideline): American Society of Clinical Oncology Clinical Practice Guideline Endorsement. J Clin Oncol 2016;34:2182–90.
3. Latini DM, Hart SL, Knight SJ, et al; CaPSURE Investigators. The relationship between anxiety and time to treatment for patients with prostate cancer on surveillance. J Urol 2007;178(3 Pt 1):826–31; discussion 831–2.
4. Tan HJ, Marks LS, Hoyt MA, et al. The relationship between intolerance of uncertainty and anxiety in men on active surveillance for prostate cancer. J Urol 2016;195:1724–30.
I-MOVE: Inpatient Pre-Discharge Mobility Score As a Predictor of Post-Discharge Mortality
From the Mayo Clinic Center for Innovation (Dr. Romero-Brufau) Department of Medicine (Drs. Manning, Borrud, Keller, Kashiwagi, Huddleston, and Croghan) Department of Health Sciences Research (Mr. Cha), Mayo Clinic, Rochester, MN.
Abstract
- Objective: To determine whether a score of 8 or greater on the I-MOVE, a bedside instrument that evaluates the need for assistance in turning, sitting, standing, transferring from bed to a chair, and ambulating, predicts lower risk for 30-day readmission or mortality.
- Design: Retrospective cohort study of patients discharged from 2003 to 2011 from a referral hospital in Southeastern Minnesota. We used a convenience sample of 426 inpatients who had at least one documented calculation of the I-MOVE score performed as part of the clinical process during the study.
- Results: Overall 30-day mortality rate, readmission rate, and rate of the combined death/readmission outcome were 6.1% (26 patients), 15% (64 patients) and 19.7% (84 patients), respectively. After controlling for confounding variables, an I-MOVE score ≥ 8 was a significant predictive factor for 30-day mortality (OR = 0.136, P < 0.01) but not 30-day readmission (OR = 1.143, P = 0.62) or the combined outcome death/readmission (OR = 0.682, P = 0.13).
- Conclusion: The clinical information provided by a patient's I-MOVE score before discharge does not provide information about readmission risk but may offer incremental information about 30-day mortality risk.
Risk factors for hospital 30-day readmission have been studied by Hasan et al [1], van Walraven et al [2], Allaudeen et al [3], and more recently, Donze et al [4]. Risk factors found to be associated with readmission include race, length of stay, and number of hospitalizations in the last 12 months. Additionally, patients identified “feeling unprepared for discharge” and “difficulty performing activities of daily living” as top issues contributing to readmission. The Affordable Care Act established the Value-Based Purchasing (VBP) model for defined hospital illnesses such as acute myocardial infarction, heart failure, and community acquired pneumonia. This has focused more attention on post-discharge 30-day mortality and readmissions as publicly reported metrics that in part determine the Centers for Medicare and Medicaid Services care reimbursement rates [5].
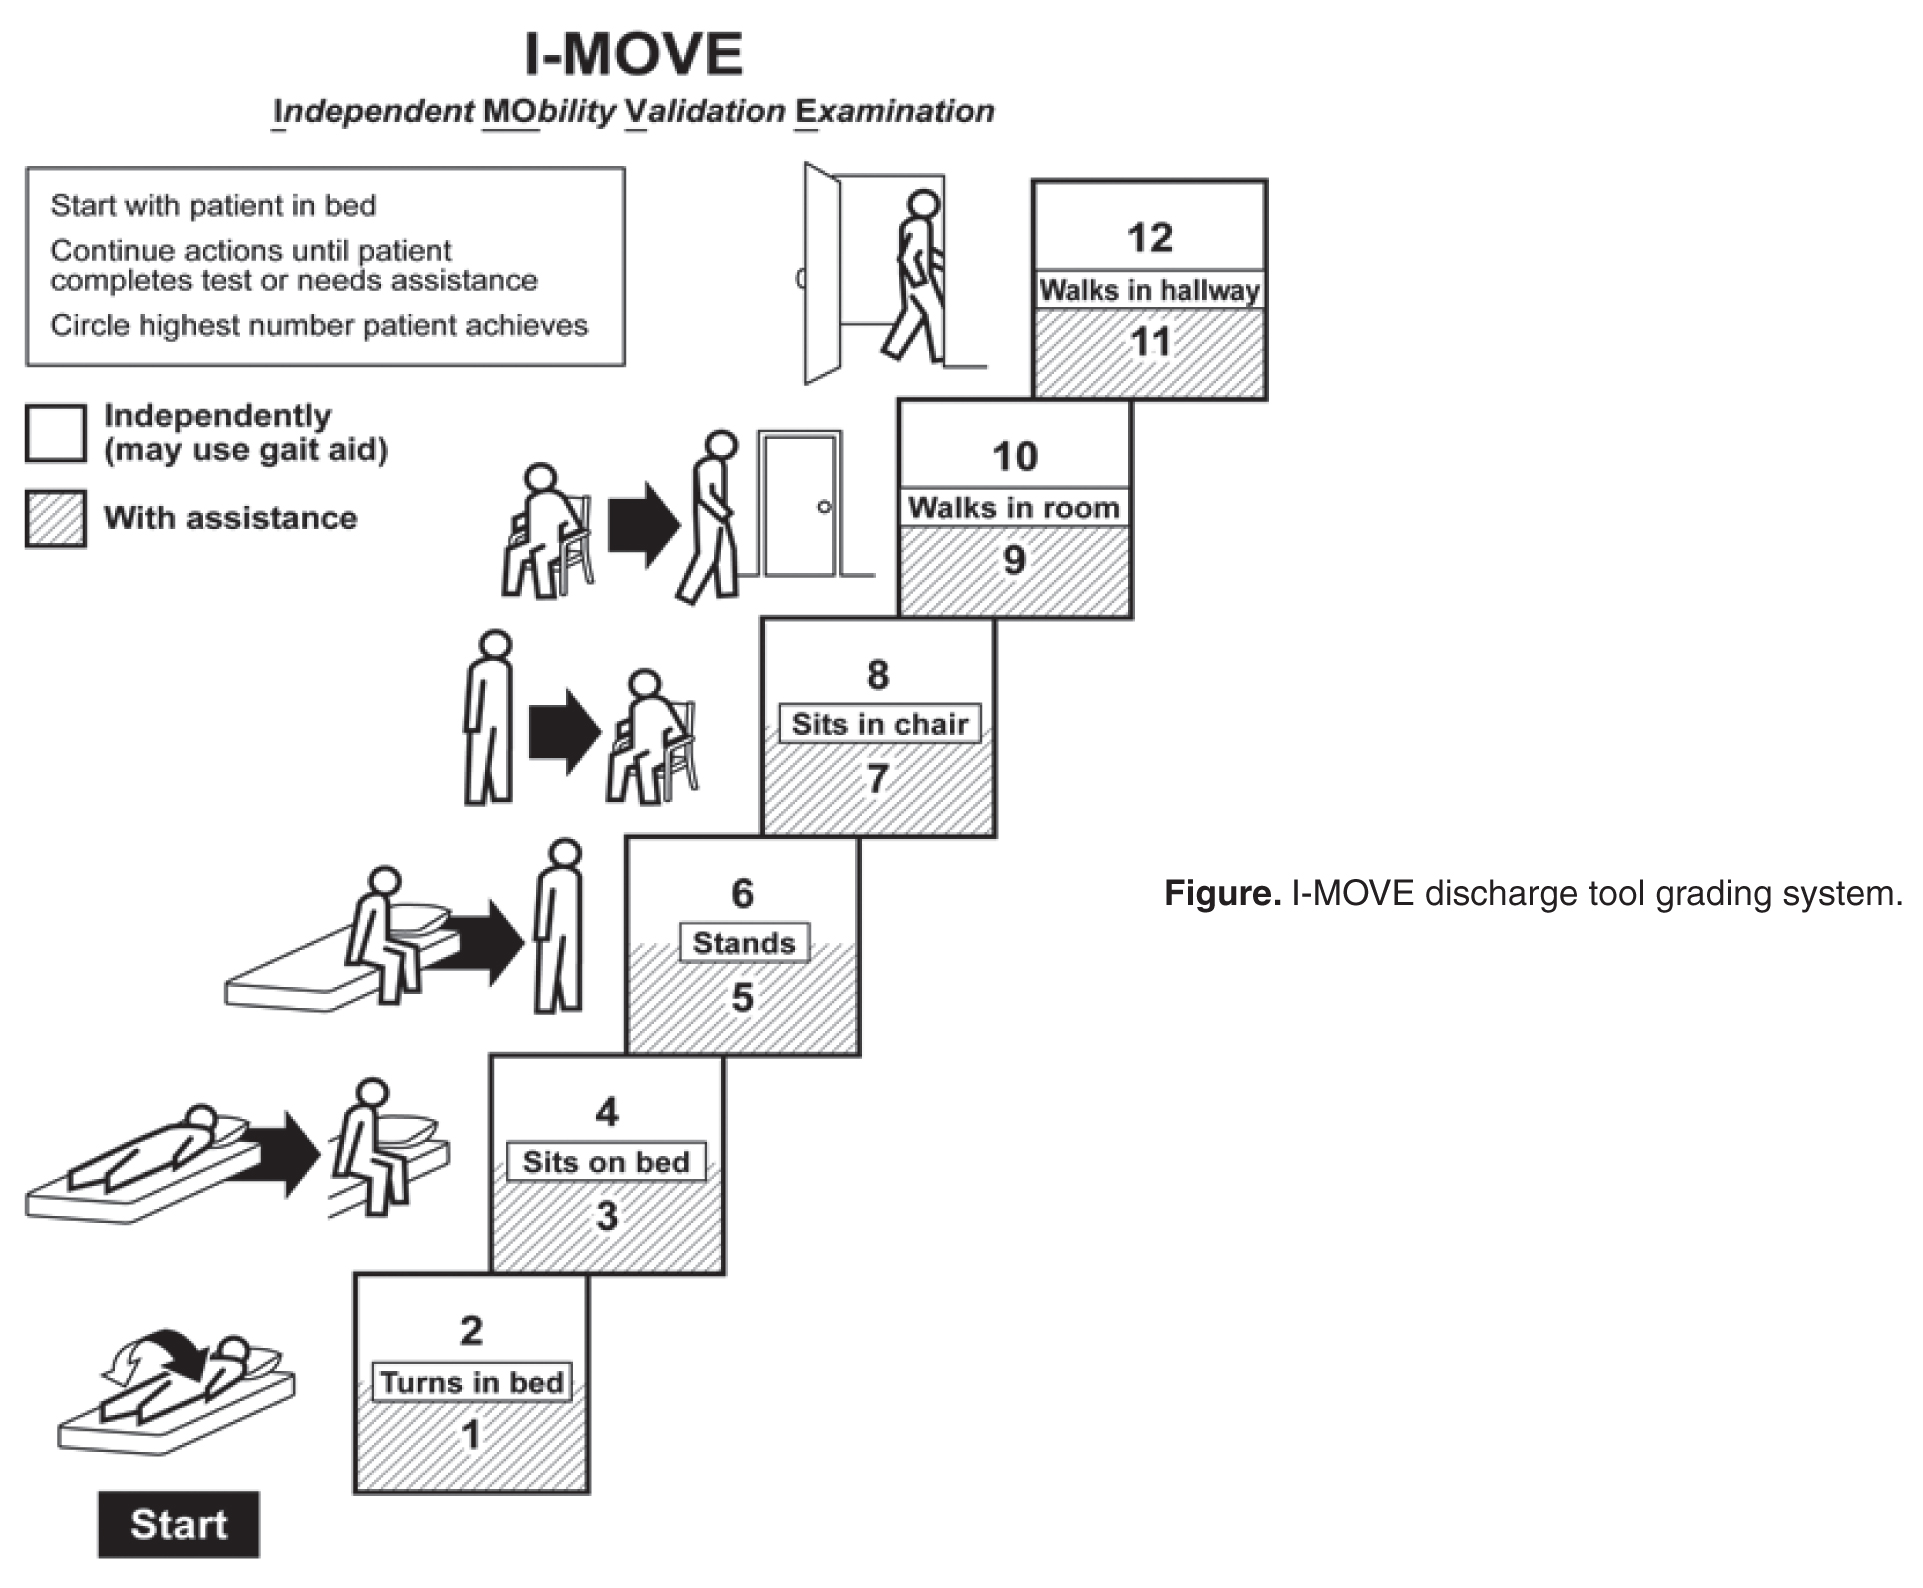
In our hospital, over 400 inpatients have been evaluated since 2004 using the I-MOVE scoring system in the course of their usual care. I-MOVE was most commonly employed by geriatricians in the division of hospital internal medicine, who collectively endorsed the tool in their practice meetings, especially for elderly patients returning to home alone whose mobility independence was uncertain.
Although it was initially designed to help clinicians understand the mobility independence of a patient before discharge, it may provide incremental value discerning risk of 30-day readmission and/or death. We therefore hypothesized that an I-MOVE score of less than 8 (not being able to transfer from a bed to a chair without assistance) would be a significant predictor of 30-day readmission and/or death.
Methods
Study Design
We performed a retrospective cohort study using a convenience sample including the patients in which the I-MOVE score had been calculated as part of the clinical process of care.
Setting and Participants
Participants were any inpatients discharged from the general medicine unit at Mayo Clinic Rochester from January 2003 to May 2011 who had at least one documented calculation of the I-MOVE score performed as part of the clinical process. Patients in the general medicine unit are adults not requiring subspecialty cardiovascular or neurology, coronary care unit, surgical, psychiatry, or rehabilitation. Patients were excluded if there was missing key outcome information or if they died during the hospitalization. For patients with more than one I-MOVE assessment, only the one closest to discharge was used. Data were abstracted from the electronic medical records between July and August 2011.
Variables
Outcome variables were 30-day readmission, 30-day mortality, and the combined outcome of mortality or readmission. We used the last I-MOVE score as a dichotomous variable with a cut-off of 8, which corresponds to the ability to transfer from bed to a chair unaided, for predicting the 2 outcomes. Only readmissions to the study hospital were captured. Deaths were identified from the electronic medical record. Mayo Clinic patient records are updated monthly with external reports of confirmed, actuarial records of deaths reported from public databases.
To control for possible confounding variables, we included the following covariates: age, gender, race/ethnicity, dates of admission and discharge, insurance (Medicare, Medicaid, self-pay, or private), marital status (currently married/not currently married), length of hospital stay, emergent admission, number of hospital admissions in the last 12 months, number of visits to the emergency department in the last 6 months and Charlson Index. All variables were abstracted from the electronic medical record.
Sample
A search was performed in the electronic medical record to find clinical documents (admission notes, progress notes, and hospital summaries) that mentioned the term “I-MOVE.” Manual review of the records was performed to confirm inclusion criteria.
Statistical Analysis
Separate analyses were performed for the 2 outcomes considered. First, a univariate analysis was performed with all covariates for variable selection. Variables that were significantly predictive with P < 0.1 were included in the multivariate model. Variables included in the first run of the multivariate model were excluded from the final multivariate model if they were not independently significant with P < 0.05. The I-MOVE variable was then added to that model to check its predictive power beyond that of the included covariates.
Results
Patient Characteristics
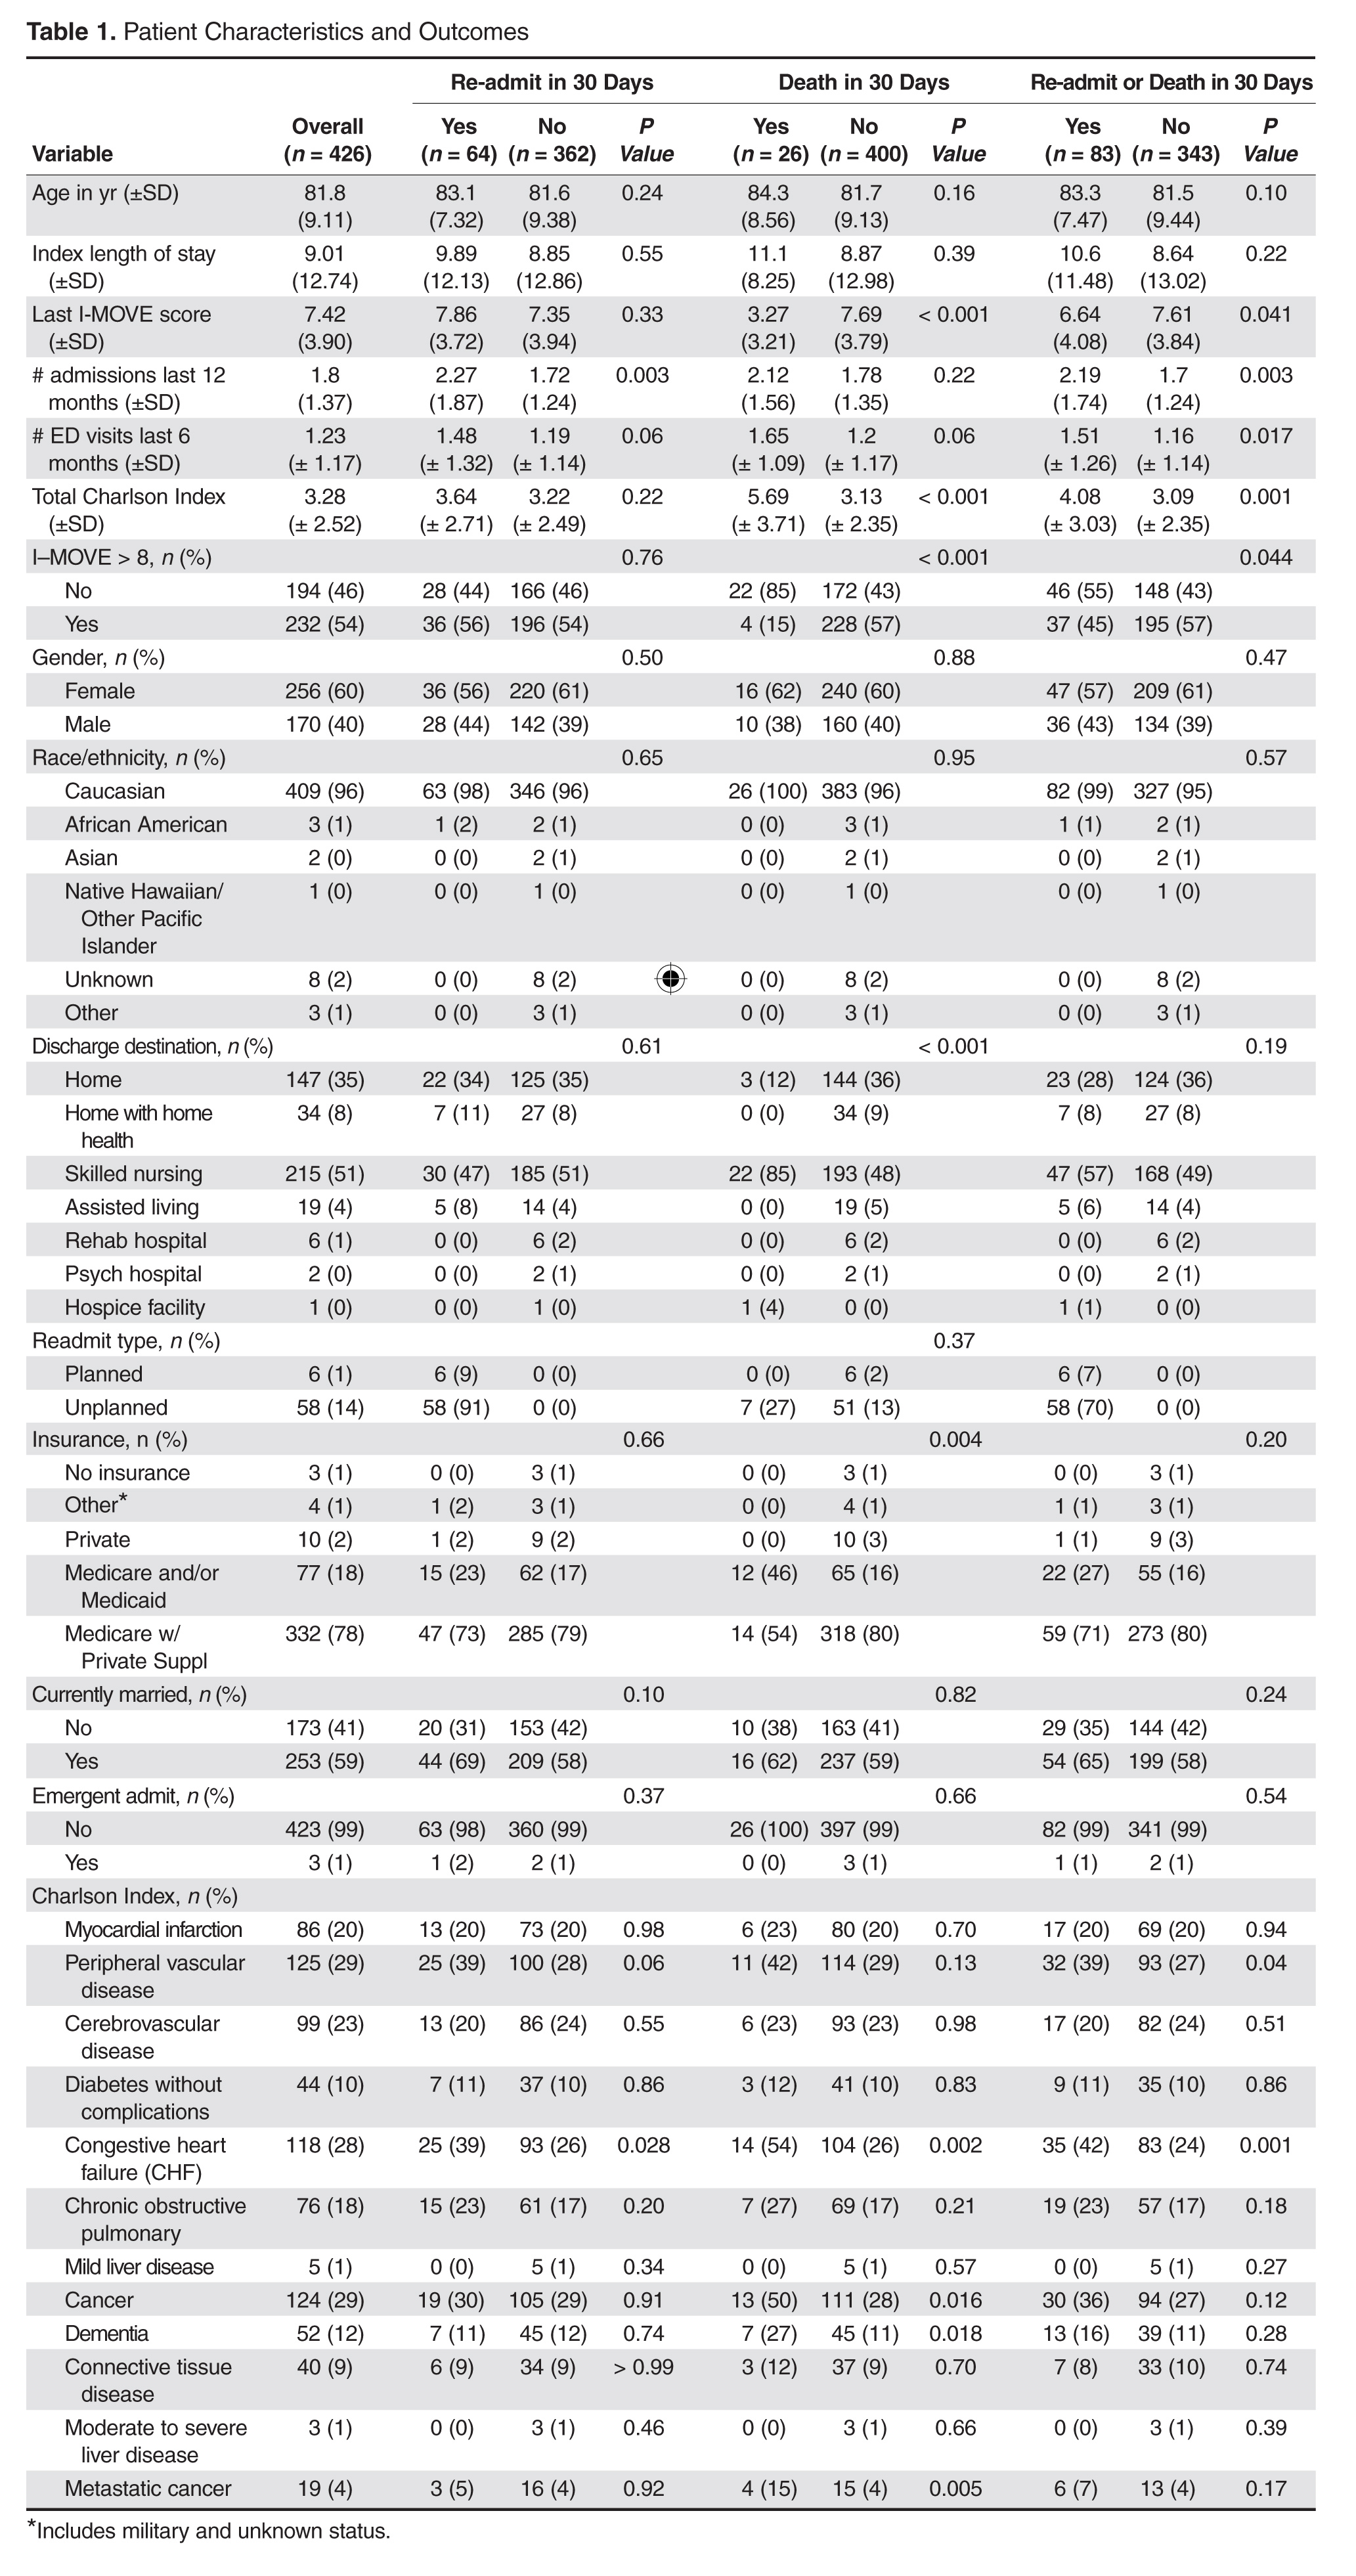
For the final dataset of 426 patients, 30-day mortality rate, readmission rate, and rate of the combined death/readmission outcome were 6.1% (26 patients), 15% (64 patients) and 19.7% (84 patients), respectively. A total of 6 patients were readmitted and died within 30 days after the initial discharge. The number of patients that had an I-MOVE score greater than or equal to 8 was 232 (54.4%). Table 2 presents the mean, standard deviation, and median I-MOVE score by patient discharge destination. Patients discharged home had an average I-MOVE score of 11.98, versus 7.24 for patients discharge to a skilled nursing facility (P = 0.2).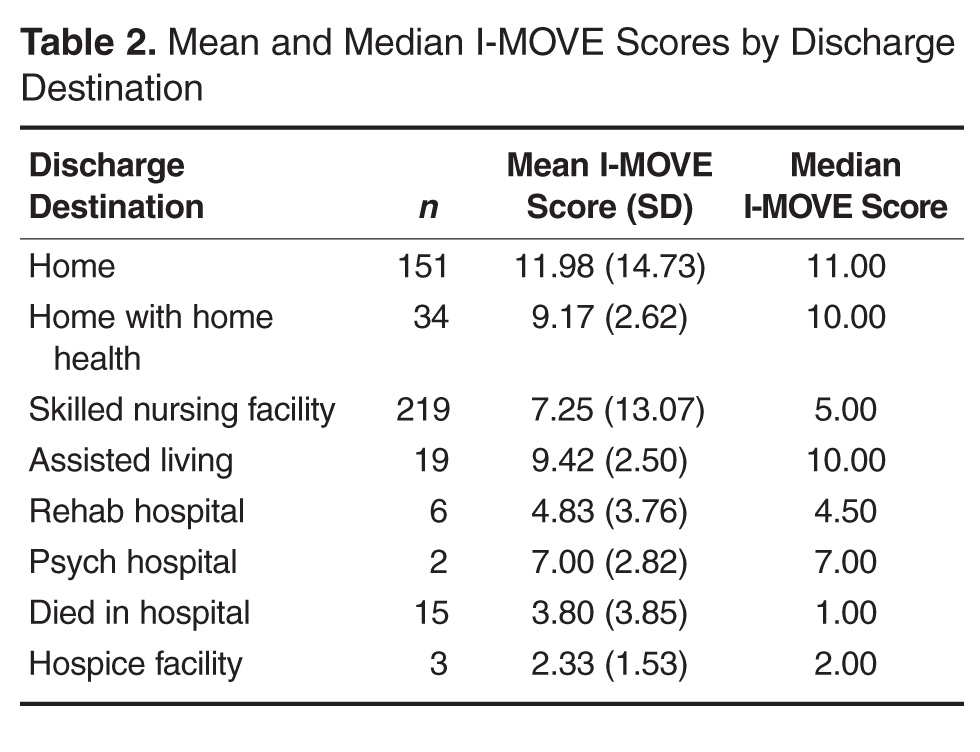
Analysis
Table 3 presents the odds ratios and coefficient estimate of the models. In the univariate analysis, an I-MOVE score greater than or equal to 8 was significantly correlated with 30-day mortality (P < 0.001), and the combined outcome (P = 0.044) but not with 30-day readmission (P = 0.76). After controlling for confounding variables, I-MOVE greater than or equal to 8 was a significant predictor of 30-day mortality (P < 0.01) but not 30-day readmission (P = 0.75) 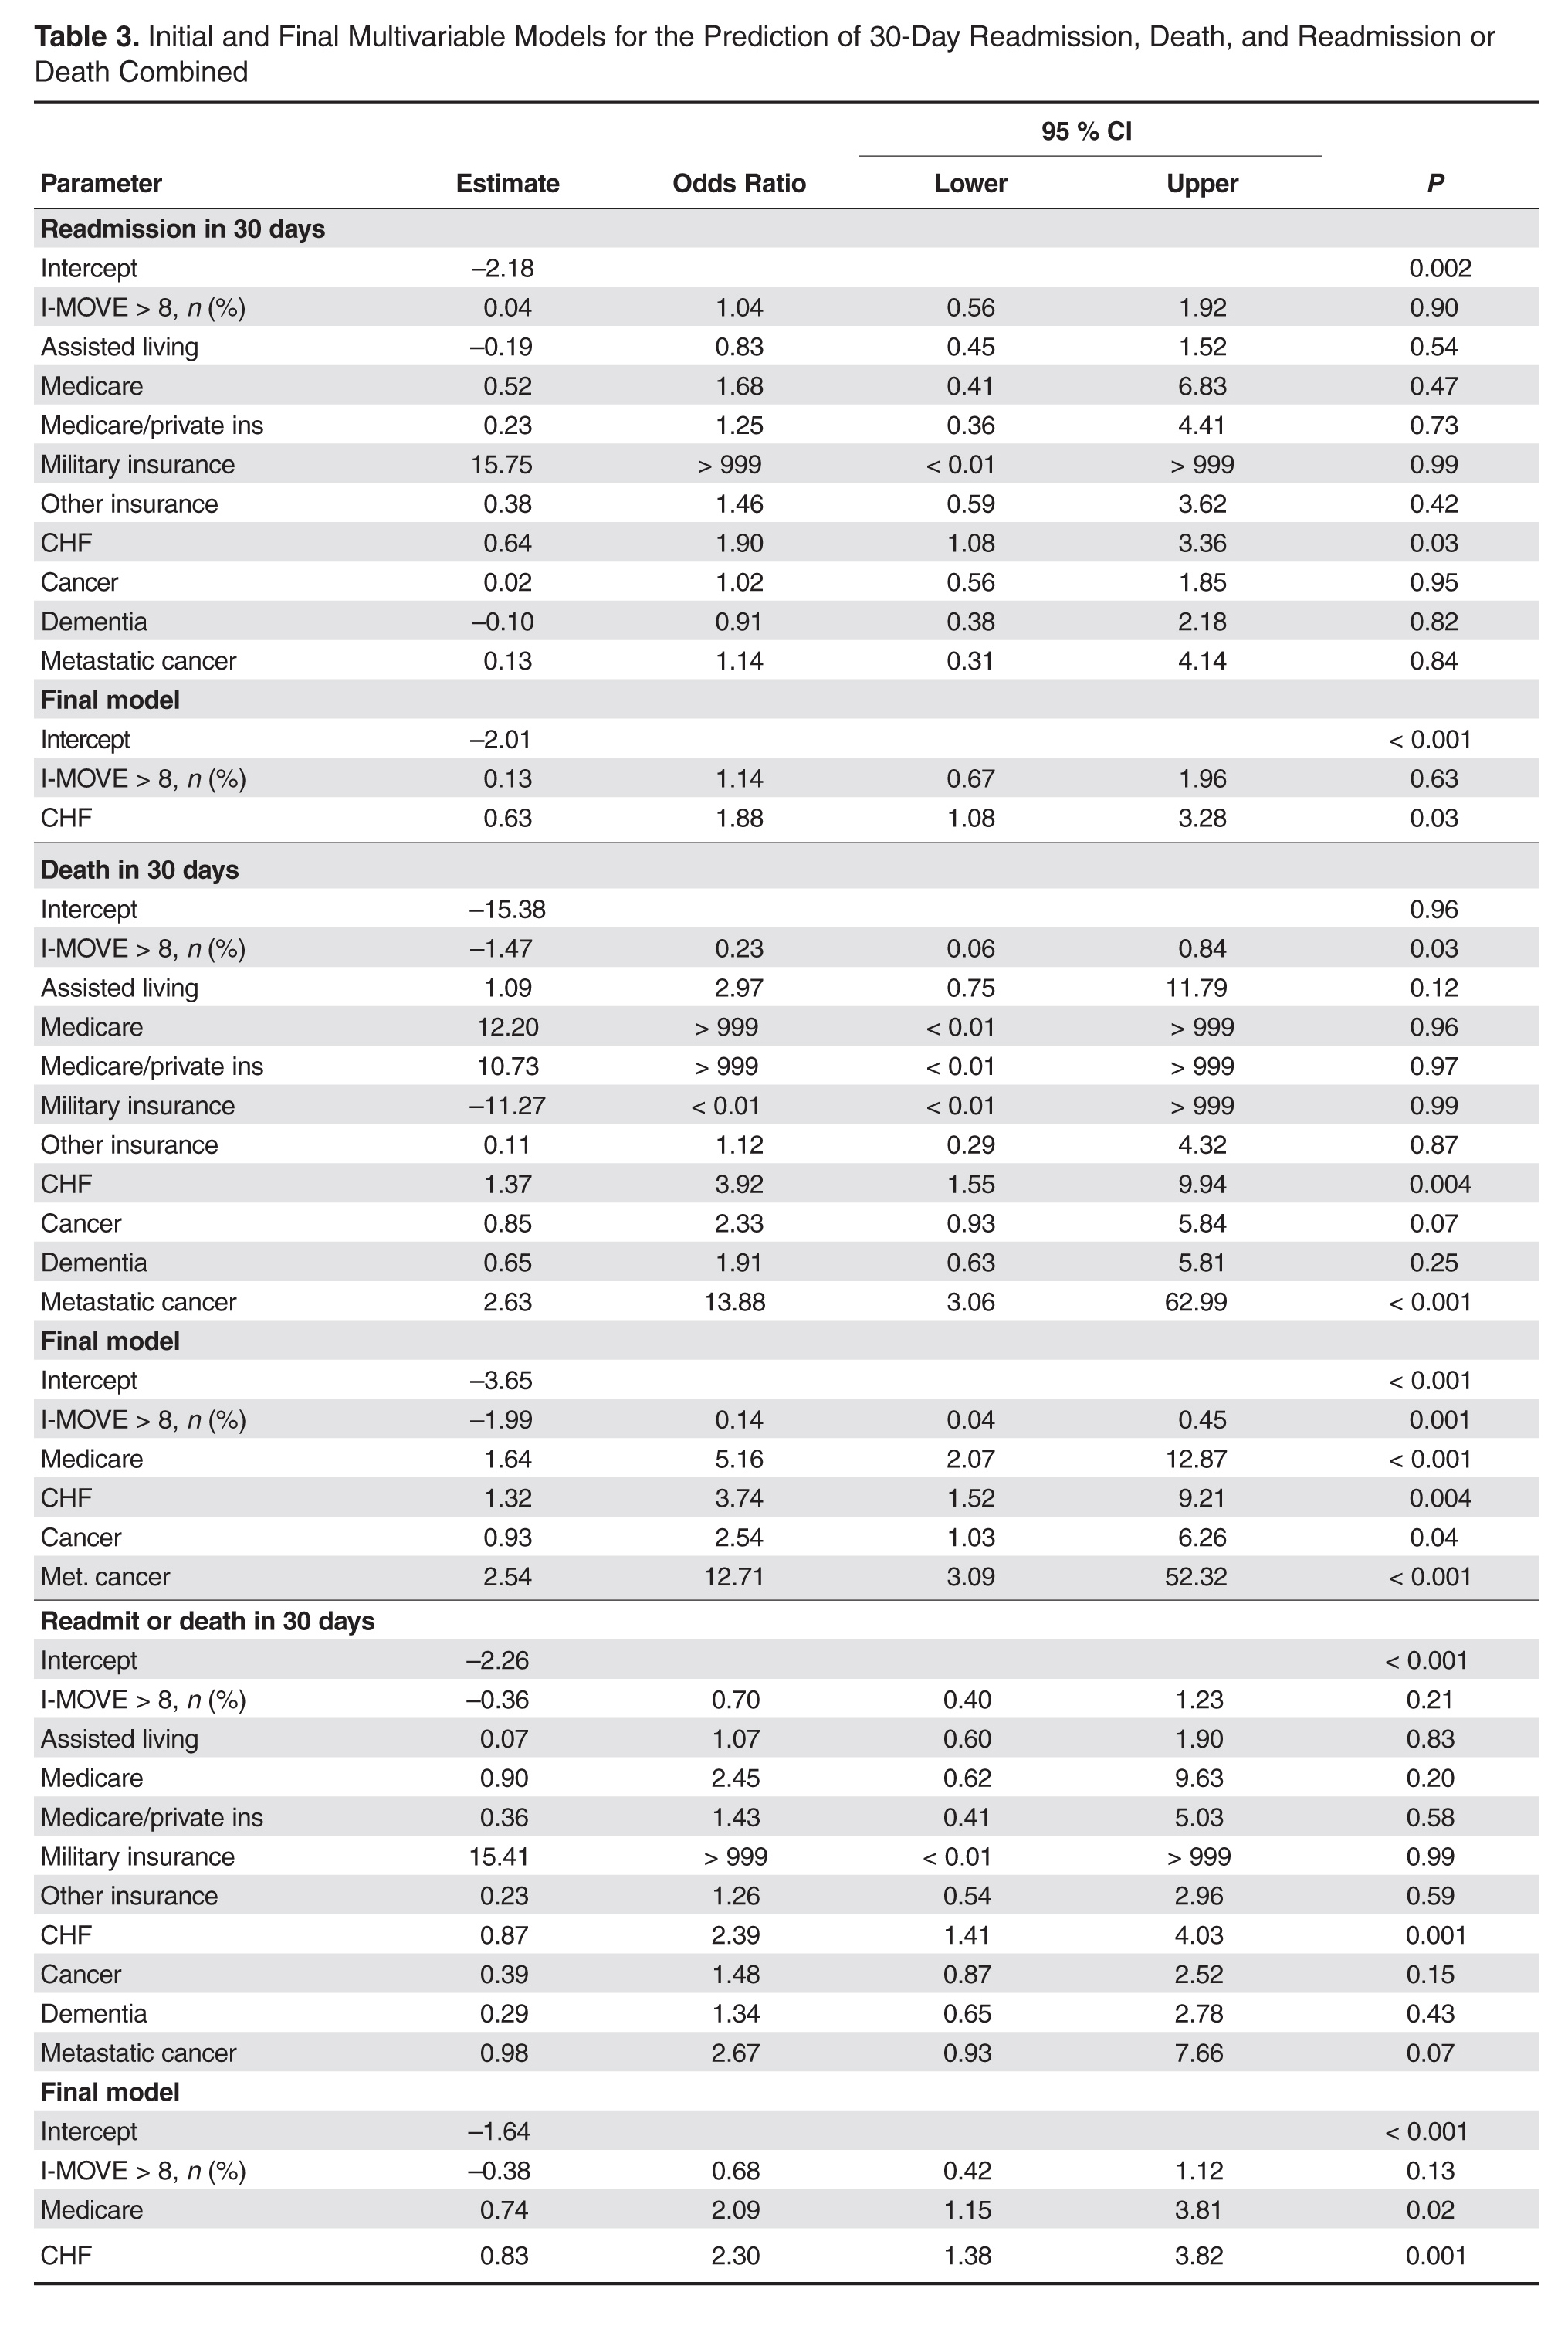
Discussion
An I-MOVE score of less than 8 (inability to transfer from bed to a chair unassisted) is a statistically significant predictor of 30-day post-discharge mortality but not readmission or the combined outcome of death/readmission.
A recent review that evaluated published models that attempted to predict readmissions concluded that most current readmission risk prediction models designed for either comparative or clinical purposes perform poorly and that efforts are needed to improve their performance as use becomes more widespread [8]. Health care providers’ ability to predict which patients would be readmitted within 30 days was also shown by a recent study to be very poor, with C-statistics around 0.60 [9]. This inability of both experts and statistical methods to accurately predict readmissions may reflect some inherent randomness or unpredictability of readmissions, or the fact that a paradigm shift is still needed in the identification of the most important risk factors for readmissions. Along the same line, a recent evaluation of interventions aimed at reducing readmissions found that none of those identified in the literature managed to consistently reduce readmission rates long-term [10]. In addition, hospitals with greater adherence to recommended care processes did not achieve meaningfully better 30-day hospital readmission rates compared to those with lower levels of performance.
Conceptually, readmissions are an example of what is called “complexity science,” where many agents or factors (including the patient’s underlying illness, quality of care delivered, continuity and coordination of care, and resources available in the patient’s environment) and their interactions all play a role in the outcome [11,12]. Since I-MOVE primarily evaluates the physical capacity of the patient, and not any of the other variables that strongly affect readmission, it is perhaps not surprising that it did not predict readmission. It can be argued, on the other hand, that short term (30-day) mortality is more dependent on the patient’s physical and functional status [13] and so more likely to correlate with a measure such as I-MOVE. Inouye et al [13] found that pre-hospital, self-reported need for assistance in 7 basic “activities of daily living” (among which are transfers and ambulation) correlated with 90-day, and 2-year, post-hospital mortality.
The study has the advantage of a relatively large sample size, and the fact that the I-MOVE score was assessed before discharge eliminates the possibility of assessor bias. However, it has some limitations. We used a convenience sample, which may have introduced selection bias. Although we have no data on how providers selected patients for I-MOVE assessment, it would be reasonable to assume that patients were selected from among those whose activity level was, in terms of independence, doubtful or uncertain. That is, those who were not clearly vigorous (up and walking easily), nor clearly debilitated (in need of great assistance) may have been more likely to be assessed using I-MOVE. A more systematic selection of subjects might increase or decrease the predictive performance of the I-MOVE assessment. In addition, although we attempted to control for potential confounders, it is possible that additional confounders were left out of our analysis.
In summary, although the predictive performance of I-MOVE still needs to be confirmed by prospective studies with a comprehensive selection of subjects, the I-MOVE score at discharge appears to be associated with 30-day post-discharge mortality.
Acknowledgments: We thank the Department of Medicine’s clinical research office for their help in study design, data acquisition, and statistical analysis.
Corresponding author: Santiago Romero-Brufau, MD, Mayo Clinic Center for Innovation, 200 First St. SW, Rochester, MN 55905, [email protected].
Funding/support: This publication was supported by grant number UL1 TR000135 from the National Center for Advancing Translational Sciences (NCATS). Its contents are solely the responsibility of the authors and do not necessarily represent the official views of the NIH.
1. Hasan O, Meltzer DO, Shaykevich SA, et al. Hospital readmission in general medicine patients: a prediction model.
J Gen Intern Med 2010;25:211–9.
2. van Walraven C, Dhalla IA, Bell C, et al. Derivation and validation of an index to predict early death or unplanned readmission after discharge from hospital to the community. CMAJ 2010;182:551–7.
3. Allaudeen N, Vidyarthi A, Maselli J, Auerbach A. Redefining readmission risk factors for general medicine patients. J Hosp Med 2011;6:54–60.
4. Donze J, Aujesky D, Williams D, Schnipper JL. Potentially avoidable 30-day hospital readmissions in medical patients: derivation and validation of a prediction model. JAMA Intern Med 2013;173:632–8.
5. Kocher RP, Adashi EY. Hospital readmissions and the Affordable Care Act: paying for coordinated quality care. JAMA 2011;306:1794–5.
6. Manning DM, Keller AS, Frank DL. Home alone: assessing mobility independence before discharge. J Hosp Med 2009;4:252–4.
7. Cook DJ, Manning DM, Holland DE, et al. Patient engagement and reported outcomes in surgical recovery: effectiveness of an e-health platform. J Am Coll Surg 2013;217:648–55.
8. Kansagara D, Englander H, Salanitro A, et al. Risk prediction models for hospital readmission: a systematic review. JAMA 2011;306:1688–98.
9. Allaudeen N, Schnipper JL, Orav EJ, et al. Inability of providers to predict unplanned readmissions. J Gen Intern Med 2011;26:771–6.
10. Hansen LO, Young RS, Hinami K, et al. Interventions to reduce 30-day rehospitalization: a systematic review. Ann Intern Med 2011;155:520–8.
11. Marks E. Complexity science and the readmission dilemma. JAMA Intern Med 2013;173:629–31.
12. Lindquist LA, Baker DW. Understanding preventable hospital readmissions: masqueraders, markers, and true causal factors. J Hosp Med 2011;6:51–3.
13. Inouye SK, Peduzzi PN, Robison JT, et al. Importance of functional measures in predicting mortality among older hospitalized patients. JAMA 1998;279:1187–93.
From the Mayo Clinic Center for Innovation (Dr. Romero-Brufau) Department of Medicine (Drs. Manning, Borrud, Keller, Kashiwagi, Huddleston, and Croghan) Department of Health Sciences Research (Mr. Cha), Mayo Clinic, Rochester, MN.
Abstract
- Objective: To determine whether a score of 8 or greater on the I-MOVE, a bedside instrument that evaluates the need for assistance in turning, sitting, standing, transferring from bed to a chair, and ambulating, predicts lower risk for 30-day readmission or mortality.
- Design: Retrospective cohort study of patients discharged from 2003 to 2011 from a referral hospital in Southeastern Minnesota. We used a convenience sample of 426 inpatients who had at least one documented calculation of the I-MOVE score performed as part of the clinical process during the study.
- Results: Overall 30-day mortality rate, readmission rate, and rate of the combined death/readmission outcome were 6.1% (26 patients), 15% (64 patients) and 19.7% (84 patients), respectively. After controlling for confounding variables, an I-MOVE score ≥ 8 was a significant predictive factor for 30-day mortality (OR = 0.136, P < 0.01) but not 30-day readmission (OR = 1.143, P = 0.62) or the combined outcome death/readmission (OR = 0.682, P = 0.13).
- Conclusion: The clinical information provided by a patient's I-MOVE score before discharge does not provide information about readmission risk but may offer incremental information about 30-day mortality risk.
Risk factors for hospital 30-day readmission have been studied by Hasan et al [1], van Walraven et al [2], Allaudeen et al [3], and more recently, Donze et al [4]. Risk factors found to be associated with readmission include race, length of stay, and number of hospitalizations in the last 12 months. Additionally, patients identified “feeling unprepared for discharge” and “difficulty performing activities of daily living” as top issues contributing to readmission. The Affordable Care Act established the Value-Based Purchasing (VBP) model for defined hospital illnesses such as acute myocardial infarction, heart failure, and community acquired pneumonia. This has focused more attention on post-discharge 30-day mortality and readmissions as publicly reported metrics that in part determine the Centers for Medicare and Medicaid Services care reimbursement rates [5].
In our hospital, over 400 inpatients have been evaluated since 2004 using the I-MOVE scoring system in the course of their usual care. I-MOVE was most commonly employed by geriatricians in the division of hospital internal medicine, who collectively endorsed the tool in their practice meetings, especially for elderly patients returning to home alone whose mobility independence was uncertain.
Although it was initially designed to help clinicians understand the mobility independence of a patient before discharge, it may provide incremental value discerning risk of 30-day readmission and/or death. We therefore hypothesized that an I-MOVE score of less than 8 (not being able to transfer from a bed to a chair without assistance) would be a significant predictor of 30-day readmission and/or death.
Methods
Study Design
We performed a retrospective cohort study using a convenience sample including the patients in which the I-MOVE score had been calculated as part of the clinical process of care.
Setting and Participants
Participants were any inpatients discharged from the general medicine unit at Mayo Clinic Rochester from January 2003 to May 2011 who had at least one documented calculation of the I-MOVE score performed as part of the clinical process. Patients in the general medicine unit are adults not requiring subspecialty cardiovascular or neurology, coronary care unit, surgical, psychiatry, or rehabilitation. Patients were excluded if there was missing key outcome information or if they died during the hospitalization. For patients with more than one I-MOVE assessment, only the one closest to discharge was used. Data were abstracted from the electronic medical records between July and August 2011.
Variables
Outcome variables were 30-day readmission, 30-day mortality, and the combined outcome of mortality or readmission. We used the last I-MOVE score as a dichotomous variable with a cut-off of 8, which corresponds to the ability to transfer from bed to a chair unaided, for predicting the 2 outcomes. Only readmissions to the study hospital were captured. Deaths were identified from the electronic medical record. Mayo Clinic patient records are updated monthly with external reports of confirmed, actuarial records of deaths reported from public databases.
To control for possible confounding variables, we included the following covariates: age, gender, race/ethnicity, dates of admission and discharge, insurance (Medicare, Medicaid, self-pay, or private), marital status (currently married/not currently married), length of hospital stay, emergent admission, number of hospital admissions in the last 12 months, number of visits to the emergency department in the last 6 months and Charlson Index. All variables were abstracted from the electronic medical record.
Sample
A search was performed in the electronic medical record to find clinical documents (admission notes, progress notes, and hospital summaries) that mentioned the term “I-MOVE.” Manual review of the records was performed to confirm inclusion criteria.
Statistical Analysis
Separate analyses were performed for the 2 outcomes considered. First, a univariate analysis was performed with all covariates for variable selection. Variables that were significantly predictive with P < 0.1 were included in the multivariate model. Variables included in the first run of the multivariate model were excluded from the final multivariate model if they were not independently significant with P < 0.05. The I-MOVE variable was then added to that model to check its predictive power beyond that of the included covariates.
Results
Patient Characteristics
For the final dataset of 426 patients, 30-day mortality rate, readmission rate, and rate of the combined death/readmission outcome were 6.1% (26 patients), 15% (64 patients) and 19.7% (84 patients), respectively. A total of 6 patients were readmitted and died within 30 days after the initial discharge. The number of patients that had an I-MOVE score greater than or equal to 8 was 232 (54.4%). Table 2 presents the mean, standard deviation, and median I-MOVE score by patient discharge destination. Patients discharged home had an average I-MOVE score of 11.98, versus 7.24 for patients discharge to a skilled nursing facility (P = 0.2).
Analysis
Table 3 presents the odds ratios and coefficient estimate of the models. In the univariate analysis, an I-MOVE score greater than or equal to 8 was significantly correlated with 30-day mortality (P < 0.001), and the combined outcome (P = 0.044) but not with 30-day readmission (P = 0.76). After controlling for confounding variables, I-MOVE greater than or equal to 8 was a significant predictor of 30-day mortality (P < 0.01) but not 30-day readmission (P = 0.75)
Discussion
An I-MOVE score of less than 8 (inability to transfer from bed to a chair unassisted) is a statistically significant predictor of 30-day post-discharge mortality but not readmission or the combined outcome of death/readmission.
A recent review that evaluated published models that attempted to predict readmissions concluded that most current readmission risk prediction models designed for either comparative or clinical purposes perform poorly and that efforts are needed to improve their performance as use becomes more widespread [8]. Health care providers’ ability to predict which patients would be readmitted within 30 days was also shown by a recent study to be very poor, with C-statistics around 0.60 [9]. This inability of both experts and statistical methods to accurately predict readmissions may reflect some inherent randomness or unpredictability of readmissions, or the fact that a paradigm shift is still needed in the identification of the most important risk factors for readmissions. Along the same line, a recent evaluation of interventions aimed at reducing readmissions found that none of those identified in the literature managed to consistently reduce readmission rates long-term [10]. In addition, hospitals with greater adherence to recommended care processes did not achieve meaningfully better 30-day hospital readmission rates compared to those with lower levels of performance.
Conceptually, readmissions are an example of what is called “complexity science,” where many agents or factors (including the patient’s underlying illness, quality of care delivered, continuity and coordination of care, and resources available in the patient’s environment) and their interactions all play a role in the outcome [11,12]. Since I-MOVE primarily evaluates the physical capacity of the patient, and not any of the other variables that strongly affect readmission, it is perhaps not surprising that it did not predict readmission. It can be argued, on the other hand, that short term (30-day) mortality is more dependent on the patient’s physical and functional status [13] and so more likely to correlate with a measure such as I-MOVE. Inouye et al [13] found that pre-hospital, self-reported need for assistance in 7 basic “activities of daily living” (among which are transfers and ambulation) correlated with 90-day, and 2-year, post-hospital mortality.
The study has the advantage of a relatively large sample size, and the fact that the I-MOVE score was assessed before discharge eliminates the possibility of assessor bias. However, it has some limitations. We used a convenience sample, which may have introduced selection bias. Although we have no data on how providers selected patients for I-MOVE assessment, it would be reasonable to assume that patients were selected from among those whose activity level was, in terms of independence, doubtful or uncertain. That is, those who were not clearly vigorous (up and walking easily), nor clearly debilitated (in need of great assistance) may have been more likely to be assessed using I-MOVE. A more systematic selection of subjects might increase or decrease the predictive performance of the I-MOVE assessment. In addition, although we attempted to control for potential confounders, it is possible that additional confounders were left out of our analysis.
In summary, although the predictive performance of I-MOVE still needs to be confirmed by prospective studies with a comprehensive selection of subjects, the I-MOVE score at discharge appears to be associated with 30-day post-discharge mortality.
Acknowledgments: We thank the Department of Medicine’s clinical research office for their help in study design, data acquisition, and statistical analysis.
Corresponding author: Santiago Romero-Brufau, MD, Mayo Clinic Center for Innovation, 200 First St. SW, Rochester, MN 55905, [email protected].
Funding/support: This publication was supported by grant number UL1 TR000135 from the National Center for Advancing Translational Sciences (NCATS). Its contents are solely the responsibility of the authors and do not necessarily represent the official views of the NIH.
1. Hasan O, Meltzer DO, Shaykevich SA, et al. Hospital readmission in general medicine patients: a prediction model.
J Gen Intern Med 2010;25:211–9.
2. van Walraven C, Dhalla IA, Bell C, et al. Derivation and validation of an index to predict early death or unplanned readmission after discharge from hospital to the community. CMAJ 2010;182:551–7.
3. Allaudeen N, Vidyarthi A, Maselli J, Auerbach A. Redefining readmission risk factors for general medicine patients. J Hosp Med 2011;6:54–60.
4. Donze J, Aujesky D, Williams D, Schnipper JL. Potentially avoidable 30-day hospital readmissions in medical patients: derivation and validation of a prediction model. JAMA Intern Med 2013;173:632–8.
5. Kocher RP, Adashi EY. Hospital readmissions and the Affordable Care Act: paying for coordinated quality care. JAMA 2011;306:1794–5.
6. Manning DM, Keller AS, Frank DL. Home alone: assessing mobility independence before discharge. J Hosp Med 2009;4:252–4.
7. Cook DJ, Manning DM, Holland DE, et al. Patient engagement and reported outcomes in surgical recovery: effectiveness of an e-health platform. J Am Coll Surg 2013;217:648–55.
8. Kansagara D, Englander H, Salanitro A, et al. Risk prediction models for hospital readmission: a systematic review. JAMA 2011;306:1688–98.
9. Allaudeen N, Schnipper JL, Orav EJ, et al. Inability of providers to predict unplanned readmissions. J Gen Intern Med 2011;26:771–6.
10. Hansen LO, Young RS, Hinami K, et al. Interventions to reduce 30-day rehospitalization: a systematic review. Ann Intern Med 2011;155:520–8.
11. Marks E. Complexity science and the readmission dilemma. JAMA Intern Med 2013;173:629–31.
12. Lindquist LA, Baker DW. Understanding preventable hospital readmissions: masqueraders, markers, and true causal factors. J Hosp Med 2011;6:51–3.
13. Inouye SK, Peduzzi PN, Robison JT, et al. Importance of functional measures in predicting mortality among older hospitalized patients. JAMA 1998;279:1187–93.
Severe Psoriasis Upped Lymphoma Risk in Large Cohort Study
SCOTTSDALE, ARIZ. – Psoriasis of all severities was linked to a 3.5-fold increase in risk of cutaneous T-cell lymphoma, and severe psoriasis upped the associated risk of Hodgkin lymphoma by about 2.5 times, in a large, longitudinal, population-based cohort study.
Psoriasis also was tied to a smaller but statistically significant increase in the risk of non-Hodgkin lymphoma, said Zelma Chiesa Fuxench, MD, of the department of dermatology, the University of Pennsylvania, Philadelphia. Overall, lymphoma risk was highest in people with severe psoriasis, independent of traditional risk factors and exposure to immunosuppressive medications, Dr. Fuxench said at the annual meeting of the Society for Investigative Dermatology.

Psoriasis affects more than 125 million people worldwide, and severe cases are a major cause of cancer-related mortality. “Prior studies have suggested an increased risk of lymphoma in psoriasis patients, but it is unclear if this due to chronic inflammation, exposure to immunosuppressive therapies, or a combination of both factors,” Dr. Fuxench said.
To further explore these links, she and her associates analyzed electronic medical records from THIN (The Health Information Network), which includes about 12 million patients across the United Kingdom. Adults with psoriasis were matched to up to five nonpsoriatic controls based on date and clinic location. Patients who needed systemic medications or phototherapy were categorized as having severe psoriasis. The final dataset included more than 12,000 such patients, as well as 184,000 patients with mild psoriasis and more than 965,000 patients without psoriasis.
Psoriasis patients were younger and more likely to be overweight, male, and smoke and drink alcohol than patients without psoriasis, Dr. Fuxench said. Almost 80% of patients with severe disease had received systemic therapies, most often methotrexate (70% of systemic treatments) or cyclosporine (10%), while only 1% had received biologics.
Patients with severe psoriasis were more likely to be diagnosed with Hodgkin disease, non-Hodgkin lymphoma, and cutaneous T-cell lymphoma than were patients with mild psoriasis or controls. Over a median follow-up of 5.3 years, 34 patients with severe psoriasis were diagnosed with any type of lymphoma, for an incidence of 5.2 cases per 10,000 person-years (95% confidence interval, 3.7-7.3). In contrast, incidence rates for patients with mild psoriasis and controls were 3.3 and 3.2 cases per 10,000 person-years, respectively, Dr. Fuxench said.
In the multivariable analysis, patients with psoriasis were about 18% more likely to develop any type of lymphoma than were controls, an association that reached statistical significance (adjusted hazard ratio, 1.18; 95% CI, 1.06-1.31). Mild psoriasis increased lymphoma risk by 14%, and severe psoriasis upped it by about 83%, and both associations were statistically significant.
The increase in risk of non-Hodgkin lymphoma was 13% greater with mild psoriasis and 56% greater with severe disease, compared with controls, and these associations also reached statistical significance. Mild psoriasis was not linked to Hodgkin lymphoma, but patients with severe psoriasis were about 250% more likely to develop it than controls, with a trend toward statistical significance (aHR, 2.54; 95% CI, 0.94-6.87).
Finally, severe psoriasis was linked to a more than ninefold increase in risk of cutaneous T-cell lymphoma (aHR, 9.3; 95% CI, 4.1-21.4), while mild psoriasis was linked to about a threefold increase in risk.
“These results were robust in multiple sensitivity analyses, including analyses that excluded patients with rheumatoid arthritis, psoriatic arthritis, or a history of exposure to methotrexate, cyclosporine, or biologics,” Dr. Fuxench said. Future studies should explore the effect of treatment timing and selection on cancer risk, she added. “For those of us who care for these patients, we are increasingly using systemic agents that selectively target the immune system, and these questions will arise in clinics.”
The study’s design made it possible to pinpoint dates of diagnosis more effectively than investigators could estimate disease duration or confirm whether patients initially diagnosed with psoriasis actually had cutaneous T-cell lymphoma, Dr. Fuxench noted. “Ideally, we could have another cohort study of incident psoriasis with prospective follow-up, but lymphoma is so rare that there is currently not enough power [in the THIN database] to determine associations.”
The study was funded by grants from the National Institutes of Health and the National Institute of Arthritis and Musculoskeletal and Skin Diseases. Dr. Fuxench disclosed unrestricted research funding from Pfizer outside the submitted work.
SCOTTSDALE, ARIZ. – Psoriasis of all severities was linked to a 3.5-fold increase in risk of cutaneous T-cell lymphoma, and severe psoriasis upped the associated risk of Hodgkin lymphoma by about 2.5 times, in a large, longitudinal, population-based cohort study.
Psoriasis also was tied to a smaller but statistically significant increase in the risk of non-Hodgkin lymphoma, said Zelma Chiesa Fuxench, MD, of the department of dermatology, the University of Pennsylvania, Philadelphia. Overall, lymphoma risk was highest in people with severe psoriasis, independent of traditional risk factors and exposure to immunosuppressive medications, Dr. Fuxench said at the annual meeting of the Society for Investigative Dermatology.
Psoriasis affects more than 125 million people worldwide, and severe cases are a major cause of cancer-related mortality. “Prior studies have suggested an increased risk of lymphoma in psoriasis patients, but it is unclear if this due to chronic inflammation, exposure to immunosuppressive therapies, or a combination of both factors,” Dr. Fuxench said.
To further explore these links, she and her associates analyzed electronic medical records from THIN (The Health Information Network), which includes about 12 million patients across the United Kingdom. Adults with psoriasis were matched to up to five nonpsoriatic controls based on date and clinic location. Patients who needed systemic medications or phototherapy were categorized as having severe psoriasis. The final dataset included more than 12,000 such patients, as well as 184,000 patients with mild psoriasis and more than 965,000 patients without psoriasis.
Psoriasis patients were younger and more likely to be overweight, male, and smoke and drink alcohol than patients without psoriasis, Dr. Fuxench said. Almost 80% of patients with severe disease had received systemic therapies, most often methotrexate (70% of systemic treatments) or cyclosporine (10%), while only 1% had received biologics.
Patients with severe psoriasis were more likely to be diagnosed with Hodgkin disease, non-Hodgkin lymphoma, and cutaneous T-cell lymphoma than were patients with mild psoriasis or controls. Over a median follow-up of 5.3 years, 34 patients with severe psoriasis were diagnosed with any type of lymphoma, for an incidence of 5.2 cases per 10,000 person-years (95% confidence interval, 3.7-7.3). In contrast, incidence rates for patients with mild psoriasis and controls were 3.3 and 3.2 cases per 10,000 person-years, respectively, Dr. Fuxench said.
In the multivariable analysis, patients with psoriasis were about 18% more likely to develop any type of lymphoma than were controls, an association that reached statistical significance (adjusted hazard ratio, 1.18; 95% CI, 1.06-1.31). Mild psoriasis increased lymphoma risk by 14%, and severe psoriasis upped it by about 83%, and both associations were statistically significant.
The increase in risk of non-Hodgkin lymphoma was 13% greater with mild psoriasis and 56% greater with severe disease, compared with controls, and these associations also reached statistical significance. Mild psoriasis was not linked to Hodgkin lymphoma, but patients with severe psoriasis were about 250% more likely to develop it than controls, with a trend toward statistical significance (aHR, 2.54; 95% CI, 0.94-6.87).
Finally, severe psoriasis was linked to a more than ninefold increase in risk of cutaneous T-cell lymphoma (aHR, 9.3; 95% CI, 4.1-21.4), while mild psoriasis was linked to about a threefold increase in risk.
“These results were robust in multiple sensitivity analyses, including analyses that excluded patients with rheumatoid arthritis, psoriatic arthritis, or a history of exposure to methotrexate, cyclosporine, or biologics,” Dr. Fuxench said. Future studies should explore the effect of treatment timing and selection on cancer risk, she added. “For those of us who care for these patients, we are increasingly using systemic agents that selectively target the immune system, and these questions will arise in clinics.”
The study’s design made it possible to pinpoint dates of diagnosis more effectively than investigators could estimate disease duration or confirm whether patients initially diagnosed with psoriasis actually had cutaneous T-cell lymphoma, Dr. Fuxench noted. “Ideally, we could have another cohort study of incident psoriasis with prospective follow-up, but lymphoma is so rare that there is currently not enough power [in the THIN database] to determine associations.”
The study was funded by grants from the National Institutes of Health and the National Institute of Arthritis and Musculoskeletal and Skin Diseases. Dr. Fuxench disclosed unrestricted research funding from Pfizer outside the submitted work.
AT THE 2016 SID ANNUAL MEETING

Severe psoriasis upped lymphoma risk in large cohort study
SCOTTSDALE, ARIZ. – Psoriasis of all severities was linked to a 3.5-fold increase in risk of cutaneous T-cell lymphoma, and severe psoriasis upped the associated risk of Hodgkin lymphoma by about 2.5 times, in a large, longitudinal, population-based cohort study.
Psoriasis also was tied to a smaller but statistically significant increase in the risk of non-Hodgkin lymphoma, said Zelma Chiesa Fuxench, MD, of the department of dermatology, the University of Pennsylvania, Philadelphia. Overall, lymphoma risk was highest in people with severe psoriasis, independent of traditional risk factors and exposure to immunosuppressive medications, Dr. Fuxench said at the annual meeting of the Society for Investigative Dermatology.

Psoriasis affects more than 125 million people worldwide, and severe cases are a major cause of cancer-related mortality. “Prior studies have suggested an increased risk of lymphoma in psoriasis patients, but it is unclear if this due to chronic inflammation, exposure to immunosuppressive therapies, or a combination of both factors,” Dr. Fuxench said.
To further explore these links, she and her associates analyzed electronic medical records from THIN (The Health Information Network), which includes about 12 million patients across the United Kingdom. Adults with psoriasis were matched to up to five nonpsoriatic controls based on date and clinic location. Patients who needed systemic medications or phototherapy were categorized as having severe psoriasis. The final dataset included more than 12,000 such patients, as well as 184,000 patients with mild psoriasis and more than 965,000 patients without psoriasis.
Psoriasis patients were younger and more likely to be overweight, male, and smoke and drink alcohol than patients without psoriasis, Dr. Fuxench said. Almost 80% of patients with severe disease had received systemic therapies, most often methotrexate (70% of systemic treatments) or cyclosporine (10%), while only 1% had received biologics.
Patients with severe psoriasis were more likely to be diagnosed with Hodgkin disease, non-Hodgkin lymphoma, and cutaneous T-cell lymphoma than were patients with mild psoriasis or controls. Over a median follow-up of 5.3 years, 34 patients with severe psoriasis were diagnosed with any type of lymphoma, for an incidence of 5.2 cases per 10,000 person-years (95% confidence interval, 3.7-7.3). In contrast, incidence rates for patients with mild psoriasis and controls were 3.3 and 3.2 cases per 10,000 person-years, respectively, Dr. Fuxench said.
In the multivariable analysis, patients with psoriasis were about 18% more likely to develop any type of lymphoma than were controls, an association that reached statistical significance (adjusted hazard ratio, 1.18; 95% CI, 1.06-1.31). Mild psoriasis increased lymphoma risk by 14%, and severe psoriasis upped it by about 83%, and both associations were statistically significant.
The increase in risk of non-Hodgkin lymphoma was 13% greater with mild psoriasis and 56% greater with severe disease, compared with controls, and these associations also reached statistical significance. Mild psoriasis was not linked to Hodgkin lymphoma, but patients with severe psoriasis were about 250% more likely to develop it than controls, with a trend toward statistical significance (aHR, 2.54; 95% CI, 0.94-6.87).
Finally, severe psoriasis was linked to a more than ninefold increase in risk of cutaneous T-cell lymphoma (aHR, 9.3; 95% CI, 4.1-21.4), while mild psoriasis was linked to about a threefold increase in risk.
“These results were robust in multiple sensitivity analyses, including analyses that excluded patients with rheumatoid arthritis, psoriatic arthritis, or a history of exposure to methotrexate, cyclosporine, or biologics,” Dr. Fuxench said. Future studies should explore the effect of treatment timing and selection on cancer risk, she added. “For those of us who care for these patients, we are increasingly using systemic agents that selectively target the immune system, and these questions will arise in clinics.”
The study’s design made it possible to pinpoint dates of diagnosis more effectively than investigators could estimate disease duration or confirm whether patients initially diagnosed with psoriasis actually had cutaneous T-cell lymphoma, Dr. Fuxench noted. “Ideally, we could have another cohort study of incident psoriasis with prospective follow-up, but lymphoma is so rare that there is currently not enough power [in the THIN database] to determine associations.”
The study was funded by grants from the National Institutes of Health and the National Institute of Arthritis and Musculoskeletal and Skin Diseases. Dr. Fuxench disclosed unrestricted research funding from Pfizer outside the submitted work.
SCOTTSDALE, ARIZ. – Psoriasis of all severities was linked to a 3.5-fold increase in risk of cutaneous T-cell lymphoma, and severe psoriasis upped the associated risk of Hodgkin lymphoma by about 2.5 times, in a large, longitudinal, population-based cohort study.
Psoriasis also was tied to a smaller but statistically significant increase in the risk of non-Hodgkin lymphoma, said Zelma Chiesa Fuxench, MD, of the department of dermatology, the University of Pennsylvania, Philadelphia. Overall, lymphoma risk was highest in people with severe psoriasis, independent of traditional risk factors and exposure to immunosuppressive medications, Dr. Fuxench said at the annual meeting of the Society for Investigative Dermatology.
Psoriasis affects more than 125 million people worldwide, and severe cases are a major cause of cancer-related mortality. “Prior studies have suggested an increased risk of lymphoma in psoriasis patients, but it is unclear if this due to chronic inflammation, exposure to immunosuppressive therapies, or a combination of both factors,” Dr. Fuxench said.
To further explore these links, she and her associates analyzed electronic medical records from THIN (The Health Information Network), which includes about 12 million patients across the United Kingdom. Adults with psoriasis were matched to up to five nonpsoriatic controls based on date and clinic location. Patients who needed systemic medications or phototherapy were categorized as having severe psoriasis. The final dataset included more than 12,000 such patients, as well as 184,000 patients with mild psoriasis and more than 965,000 patients without psoriasis.
Psoriasis patients were younger and more likely to be overweight, male, and smoke and drink alcohol than patients without psoriasis, Dr. Fuxench said. Almost 80% of patients with severe disease had received systemic therapies, most often methotrexate (70% of systemic treatments) or cyclosporine (10%), while only 1% had received biologics.
Patients with severe psoriasis were more likely to be diagnosed with Hodgkin disease, non-Hodgkin lymphoma, and cutaneous T-cell lymphoma than were patients with mild psoriasis or controls. Over a median follow-up of 5.3 years, 34 patients with severe psoriasis were diagnosed with any type of lymphoma, for an incidence of 5.2 cases per 10,000 person-years (95% confidence interval, 3.7-7.3). In contrast, incidence rates for patients with mild psoriasis and controls were 3.3 and 3.2 cases per 10,000 person-years, respectively, Dr. Fuxench said.
In the multivariable analysis, patients with psoriasis were about 18% more likely to develop any type of lymphoma than were controls, an association that reached statistical significance (adjusted hazard ratio, 1.18; 95% CI, 1.06-1.31). Mild psoriasis increased lymphoma risk by 14%, and severe psoriasis upped it by about 83%, and both associations were statistically significant.
The increase in risk of non-Hodgkin lymphoma was 13% greater with mild psoriasis and 56% greater with severe disease, compared with controls, and these associations also reached statistical significance. Mild psoriasis was not linked to Hodgkin lymphoma, but patients with severe psoriasis were about 250% more likely to develop it than controls, with a trend toward statistical significance (aHR, 2.54; 95% CI, 0.94-6.87).
Finally, severe psoriasis was linked to a more than ninefold increase in risk of cutaneous T-cell lymphoma (aHR, 9.3; 95% CI, 4.1-21.4), while mild psoriasis was linked to about a threefold increase in risk.
“These results were robust in multiple sensitivity analyses, including analyses that excluded patients with rheumatoid arthritis, psoriatic arthritis, or a history of exposure to methotrexate, cyclosporine, or biologics,” Dr. Fuxench said. Future studies should explore the effect of treatment timing and selection on cancer risk, she added. “For those of us who care for these patients, we are increasingly using systemic agents that selectively target the immune system, and these questions will arise in clinics.”
The study’s design made it possible to pinpoint dates of diagnosis more effectively than investigators could estimate disease duration or confirm whether patients initially diagnosed with psoriasis actually had cutaneous T-cell lymphoma, Dr. Fuxench noted. “Ideally, we could have another cohort study of incident psoriasis with prospective follow-up, but lymphoma is so rare that there is currently not enough power [in the THIN database] to determine associations.”
The study was funded by grants from the National Institutes of Health and the National Institute of Arthritis and Musculoskeletal and Skin Diseases. Dr. Fuxench disclosed unrestricted research funding from Pfizer outside the submitted work.
AT THE 2016 SID ANNUAL MEETING
Key clinical point: Psoriasis was identified as an independent risk factor for lymphoma, with the risk of lymphoma increasing with disease severity.
Major finding: The strongest association was between severe psoriasis and cutaneous T-cell lymphoma (aHR, 9.3; 95% CI, 4.1-21.4).
Data source: A population-based longitudinal cohort study of 12,198 patients with severe psoriasis, 184,870 patients with mild psoriasis, and 965,730 nonpsoriatic controls.
Disclosures: The study was funded by grants from the National Institutes of Health and the National Institute of Arthritis and Musculoskeletal and Skin Diseases. Dr. Fuxench disclosed unrestricted research support from Pfizer outside the submitted work.

Sleep apnea in pregnancy linked to preterm birth
DENVER – Pregnant women with sleep apnea are more likely to have planned obstetric interventions, results of an Australian population-based cohort study suggest.
The study included all 636,227 in-hospital births during 2002-2012 in New South Wales, Australia’s most populous state. Maternal sleep apnea was also associated with increased rates of planned preterm birth, even though preterm birth is widely considered the greatest contributor to neonatal morbidity and mortality, Yu Sun Bin, PhD, said at the annual meeting of the Associated Professional Sleep Societies.

“Somewhere along the line, clinicians decided that the risks of preterm birth to the baby were outweighed by the risks to the mother of delivering at term,” said Dr. Bin of the University of Sydney.
She and her coinvestigators undertook this study because even though previous studies have linked maternal sleep apnea to increased risks of gestational diabetes and gestational hypertension, most of the prior studies were small, cross-sectional, and/or relied upon snoring as a proxy for sleep apnea, which many sleep specialists consider invalid.
The investigators compared maternal and infant outcomes for mothers with a documented diagnosis of sleep apnea – either central or obstructive – in the year before or during pregnancy with outcomes for mothers without that diagnosis.
There were 519 mothers with diagnosed sleep apnea, for a prevalence of 0.08%. That figure is low in light of other evidence, making it likely that the 635,708 women in the no-sleep-apnea group actually included a substantial number of mothers with undiagnosed sleep apnea. Thus, the investigators’ estimates of the adverse impacts of sleep apnea in pregnancy are “rather conservative,” according to Dr. Bin.
Australian women with sleep apnea were older and less healthy than mothers without sleep apnea were. They had higher baseline rates of obesity, preexisting diabetes, chronic hypertension, and were more likely to be smokers.
The incidence of pregnancy hypertension was 19.7% in the sleep apnea group and 8.7% in controls. In a multivariate regression analysis adjusted for potential confounders, the maternal sleep apnea group had a 40% greater risk of developing hypertension than did controls. However, contrary to previous smaller studies, they did not have a significantly increased rate of gestational diabetes.
Even after controlling for both pregnancy hypertension and gestational diabetes, the sleep apnea group still had a significant 15% increase in the relative likelihood of a planned delivery.
The rate of preterm birth at 36 weeks or earlier was 14.5% in the maternal sleep apnea group, compared with 6.9% in controls, for an adjusted 1.5-fold increased relative risk.
Perinatal death occurred in 1.9% of the sleep apnea group and 0.9% of controls; however, the resultant adjusted 1.73-fold increased risk didn’t attain statistical significance because of the small number of deaths in the study. Dr. Bin said she and her colleagues plan to further investigate this signal to learn whether it is real or an artifact of small numbers.
The incidence of 5-minute Apgar scores below 7 was 4.6% in the sleep apnea group, compared with 2.4% in controls, for an adjusted 1.6-fold increased risk. The rate of neonatal intensive care unit admission in the sleep apnea group was 27.9%, versus 16% in controls, for a 1.61-fold increased relative risk.
The NICU admission rate for preterm infants didn’t differ between the two groups. The difference occurred in term babies, whose NICU admission rate was 20.3% if they were in the sleep apnea group, but just 12.1% in the control group.
“This suggests that maternal sleep apnea is contributing to some condition in the baby that requires additional support,” Dr. Bin observed.
The nature of that condition, however, remains unclear, since all patient data available to the investigators was deidentified.
The incidence of small-for-gestational-age babies was similar in the sleep apnea and control groups. In contrast, the large-for-gestational-age rate was 15.2% in the sleep apnea group, compared with 9.1% in controls, for an adjusted 1.27-fold increased risk.
The two main limitations of the Australian study were the likely underdiagnosis of sleep apnea and the lack of any information on treatment of affected patients, according to Dr. Bin. A key unresolved question, she added, is whether interventions for maternal sleep apnea reduce the risks identified in the New South Wales study. She noted that one 16-patient randomized study of nasal continuous positive airway pressure suggests the answer is yes (Sleep Med. 2007 Dec;9:15-21).
The Australian National Health and Medical Research Council supported the study. Dr. Bin reported having no financial conflicts.
DENVER – Pregnant women with sleep apnea are more likely to have planned obstetric interventions, results of an Australian population-based cohort study suggest.
The study included all 636,227 in-hospital births during 2002-2012 in New South Wales, Australia’s most populous state. Maternal sleep apnea was also associated with increased rates of planned preterm birth, even though preterm birth is widely considered the greatest contributor to neonatal morbidity and mortality, Yu Sun Bin, PhD, said at the annual meeting of the Associated Professional Sleep Societies.
“Somewhere along the line, clinicians decided that the risks of preterm birth to the baby were outweighed by the risks to the mother of delivering at term,” said Dr. Bin of the University of Sydney.
She and her coinvestigators undertook this study because even though previous studies have linked maternal sleep apnea to increased risks of gestational diabetes and gestational hypertension, most of the prior studies were small, cross-sectional, and/or relied upon snoring as a proxy for sleep apnea, which many sleep specialists consider invalid.
The investigators compared maternal and infant outcomes for mothers with a documented diagnosis of sleep apnea – either central or obstructive – in the year before or during pregnancy with outcomes for mothers without that diagnosis.
There were 519 mothers with diagnosed sleep apnea, for a prevalence of 0.08%. That figure is low in light of other evidence, making it likely that the 635,708 women in the no-sleep-apnea group actually included a substantial number of mothers with undiagnosed sleep apnea. Thus, the investigators’ estimates of the adverse impacts of sleep apnea in pregnancy are “rather conservative,” according to Dr. Bin.
Australian women with sleep apnea were older and less healthy than mothers without sleep apnea were. They had higher baseline rates of obesity, preexisting diabetes, chronic hypertension, and were more likely to be smokers.
The incidence of pregnancy hypertension was 19.7% in the sleep apnea group and 8.7% in controls. In a multivariate regression analysis adjusted for potential confounders, the maternal sleep apnea group had a 40% greater risk of developing hypertension than did controls. However, contrary to previous smaller studies, they did not have a significantly increased rate of gestational diabetes.
Even after controlling for both pregnancy hypertension and gestational diabetes, the sleep apnea group still had a significant 15% increase in the relative likelihood of a planned delivery.
The rate of preterm birth at 36 weeks or earlier was 14.5% in the maternal sleep apnea group, compared with 6.9% in controls, for an adjusted 1.5-fold increased relative risk.
Perinatal death occurred in 1.9% of the sleep apnea group and 0.9% of controls; however, the resultant adjusted 1.73-fold increased risk didn’t attain statistical significance because of the small number of deaths in the study. Dr. Bin said she and her colleagues plan to further investigate this signal to learn whether it is real or an artifact of small numbers.
The incidence of 5-minute Apgar scores below 7 was 4.6% in the sleep apnea group, compared with 2.4% in controls, for an adjusted 1.6-fold increased risk. The rate of neonatal intensive care unit admission in the sleep apnea group was 27.9%, versus 16% in controls, for a 1.61-fold increased relative risk.
The NICU admission rate for preterm infants didn’t differ between the two groups. The difference occurred in term babies, whose NICU admission rate was 20.3% if they were in the sleep apnea group, but just 12.1% in the control group.
“This suggests that maternal sleep apnea is contributing to some condition in the baby that requires additional support,” Dr. Bin observed.
The nature of that condition, however, remains unclear, since all patient data available to the investigators was deidentified.
The incidence of small-for-gestational-age babies was similar in the sleep apnea and control groups. In contrast, the large-for-gestational-age rate was 15.2% in the sleep apnea group, compared with 9.1% in controls, for an adjusted 1.27-fold increased risk.
The two main limitations of the Australian study were the likely underdiagnosis of sleep apnea and the lack of any information on treatment of affected patients, according to Dr. Bin. A key unresolved question, she added, is whether interventions for maternal sleep apnea reduce the risks identified in the New South Wales study. She noted that one 16-patient randomized study of nasal continuous positive airway pressure suggests the answer is yes (Sleep Med. 2007 Dec;9:15-21).
The Australian National Health and Medical Research Council supported the study. Dr. Bin reported having no financial conflicts.
AT SLEEP 2016
Key clinical point: Maternal sleep apnea is associated with increased rates of obstetric intervention and preterm birth.
Major finding: The rate of preterm birth at 36 weeks or earlier was 14.5% in the group with maternal sleep apnea, compared with 6.9% in controls.
Data source: A population-based cohort study of 636,227 women who gave birth in a New South Wales, Australia, hospital during 2002-2012.
Disclosures: The Australian National Health and Medical Research Council supported the study. Dr. Bin reported having no financial conflicts.

Highlights From the 2016 CMSC Annual Meeting
Click here to download the digital edition.
Click here to download the digital edition.
Click here to download the digital edition.
Engaging Patients as Partners in Practice Improvement: A Survey of Community Health Centers
From the Department of Family and Community Medicine, University of California San Francisco, San Francisco, CA (Ms. Willard-Grace, Dr. Sharma, Dr. Potter) and the California Primary Care Association, Sacramento, CA (Ms. Parker).
Abstract
- Objective: To explore how community health centers engage patients in practice improvement and factors associated with patient involvement on clinic-level strategies, policies, and programs.
- Methods: Cross-sectional web-based survey of community health centers in California, Arizona, Nevada, and Hawaii (n = 97).
- Results: The most common mechanisms used by community health centers to obtain patient feedback were surveys (94%; 91/97) and advisory councils (69%; 67/97). Patient-centered medical home recognition and dedicated funding for patient engagement activities were not associated with reported patient influence on the clinic’s strategic goals, policies, or programs. When other factors were controlled for in multivariable modeling, leadership support (β = 0.31, 95% confidence interval [CI] 0.10–0.53) and having a formal strategy to identify and engage patients as advisors (β = 0.17, 95% CI 0.02–0.31) were positively associated with patient influence on strategic goals. Having a formal strategy to identify and engage patients also was associated with patient impact on polices and programss (β = 0.17, 95% CI 0.01–0.34). The clinic process of setting aside time to discuss patient feedback appeared to be a mechanism by which formal patient engagement strategies resulted in patients having an impact on practice improvement activities (β = 0.35, 95% CI 0.17–0.54 for influence on strategic goals and β = 0.44, 95% CI 0.23–0.65 for influence on policies and programs).
- Conclusion: These findings may provide guidance for primary care practices that wish to engage patients in practice improvement. The relatively simple steps of developing a formal strategy to identify and engage patients and setting aside time in meetings to discuss patient feedback appear to be important prerequisites for success in these activities.
Patient engagement is becoming an increasingly prominent concept within primary care redesign. Called the “next blockbuster drug of the century” and the “holy grail” of health care [1,2], patient engagement has become a key goal for funders such as the Patient-Centered Outcomes Research Institute [3] and accrediting agencies such as the National Committee for Quality Assurance (NCQA).
Patient engagement has been defined as patients working in active partnership at various levels across the health care system to improve health and health care [1]. It can be conceptualized as occurring at 3 levels: at the level of direct care (eg, a clinical encounter), at the level of organizational design and governance, and at the level of policy making [1]. For example, engagement at the level of direct care might involve a patient working with her care team to identify a treatment option that matches her values and preferences. At the level of the health care organization, a patient might provide feedback through a survey or serve on a patient advisory council to improve clinic operations. Patients engaged at the level of policy making might share their opinions with their elected representatives or sit on a national committee. Although research has examined engagement at the direct care level, for example, in studies of shared decision making, there is a paucity of research addressing the impact of patient engagement on clinic-level organizational redesign and practice improvement [4,5].
Relatively few studies describe what primary care practice teams are currently doing at the basic level of soliciting and acting on patient input on the way that their care is delivered. A survey of 112 NCQA-certified patient-centered medical home (PCMH) practices found that 78% conducted patient surveys, 63% gathered qualitative input through focus groups or other feedback, 52% provided a suggestion box, and 32% included patients on advisory councils or teams [6]. Fewer than one-third of PCMH-certified practices were engaging patients or families in more intensive roles as ongoing advisors on practice design or practice improvement [6]. Randomized controlled trials have shown that patient involvement in developing informational materials results in more readable and relevant information [7]. Patient and family involvement in identifying organizational priorities within clinical practice settings resulted in greater alignment with the chronic care model and the PCMH when compared with control groups and resulted in greater agreement between patients and health care professionals [4]. Moreover, a number of innovative health care organizations credit their success in transformation to their patient partnerships [8–10].
Within this context, current practices at community health centers (CHCs) are of particular interest. CHCs are not-for-profit organizations that deliver primary and preventive care to more than 22 million people in the United States [11]. A large proportion of their patients are poor and live in medically underserved communities. More than one-third (37.5%) of CHC patients are uninsured and 38.5% are on Medicaid [12]. Perhaps because of their commitment to caring for medically vulnerable populations that have often had difficulty obtaining needed medical services, some CHCs have been on the forefront of patient engagement [8]. In addition, many CHCs are federally qualified health care centers, which are mandated to engage members of their communities within their governing boards [13]. However, relatively little is known about how CHCs are engaging patients as practice improvement partners or the perceived impact of this engagement on CHC strategic goals, policies, and programs. This study explores these factors and examines the organizational characteristics and processes associated with patients having an impact on practice improvement activities.
Methods
We conducted a cross-sectional, web-based survey of primary care clinician and staff leaders at CHCs in July–August 2014 to assess current strategies, attitudes, facilitators, and barriers toward engaging patients in practice improvement efforts. The study protocol was developed jointly by the San Francisco Bay Area Collaborative Research Network (SFBayCRN), the University of California San Francisco Center for Excellence in Primary Care (CEPC), and the Western Clinicians Network (WCN). The protocol was reviewed by the University of California San Francisco Committee on Human Research and determined to be exempt research (study number 14-13662).
Survey Participants
Participants in the web-based survey were members of the WCN, a peer-led, volunteer, membership-based association of medical leaders of community health centers in California, Arizona, Nevada, and Hawaii. An invitation and link to a web-based survey was sent by email to members working at WCN CHC, who received up to 3 reminders to complete the survey. We allowed one response per CHC surveyed; in cases where more than one CHC leader was a member of WCN, we requested that the person most familiar with patient engagement activities respond to the survey. In the event of multiple respondents from an organization, incomplete responses were dropped and one complete response was randomly selected to represent the organization. Participants in the survey were entered into a drawing for ten $50 gift cards and one iPad.
Conceptual Model
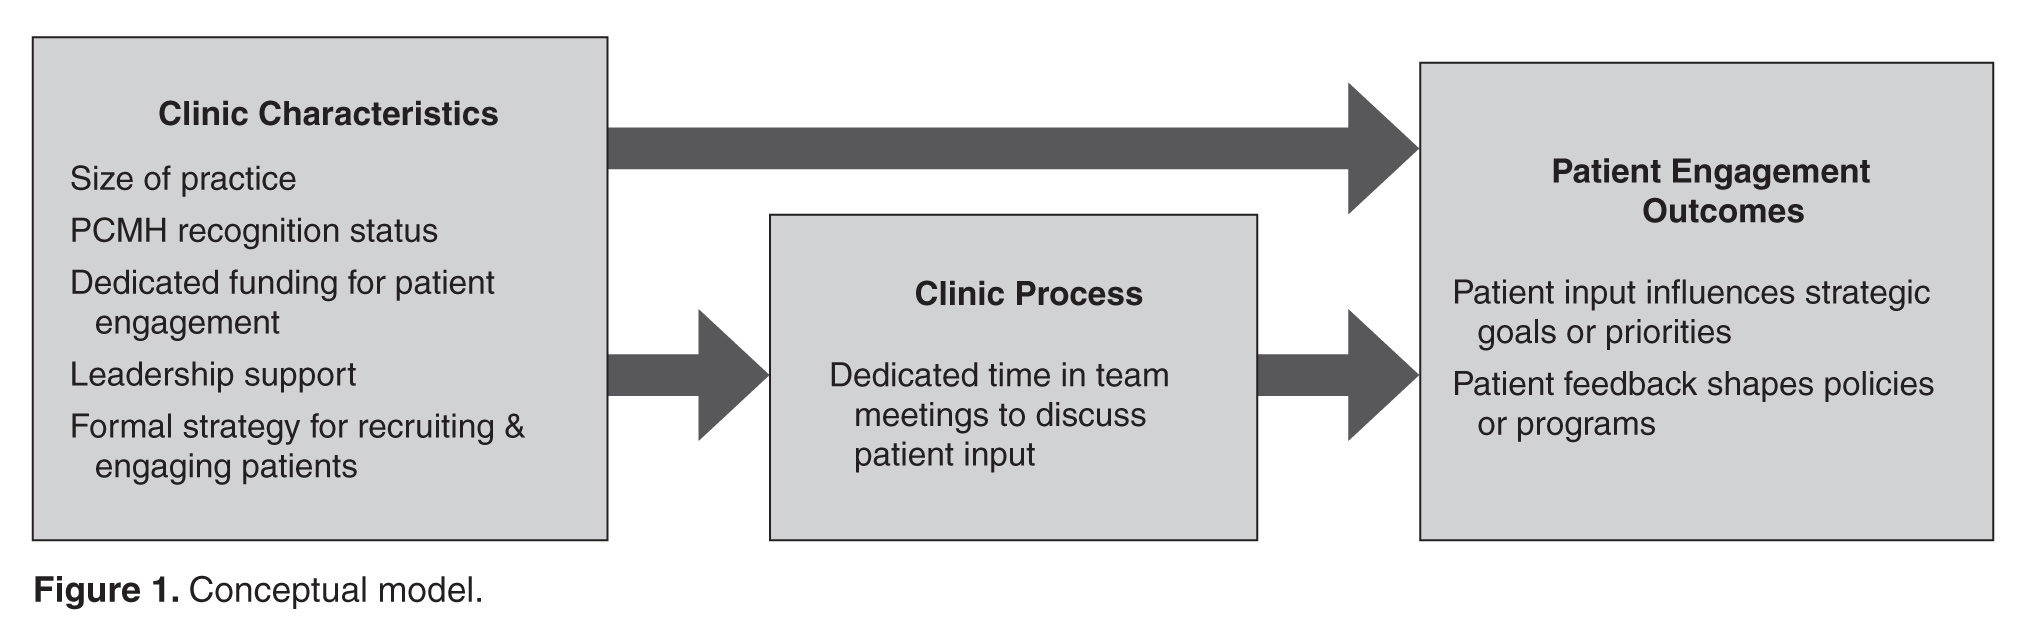
Measures
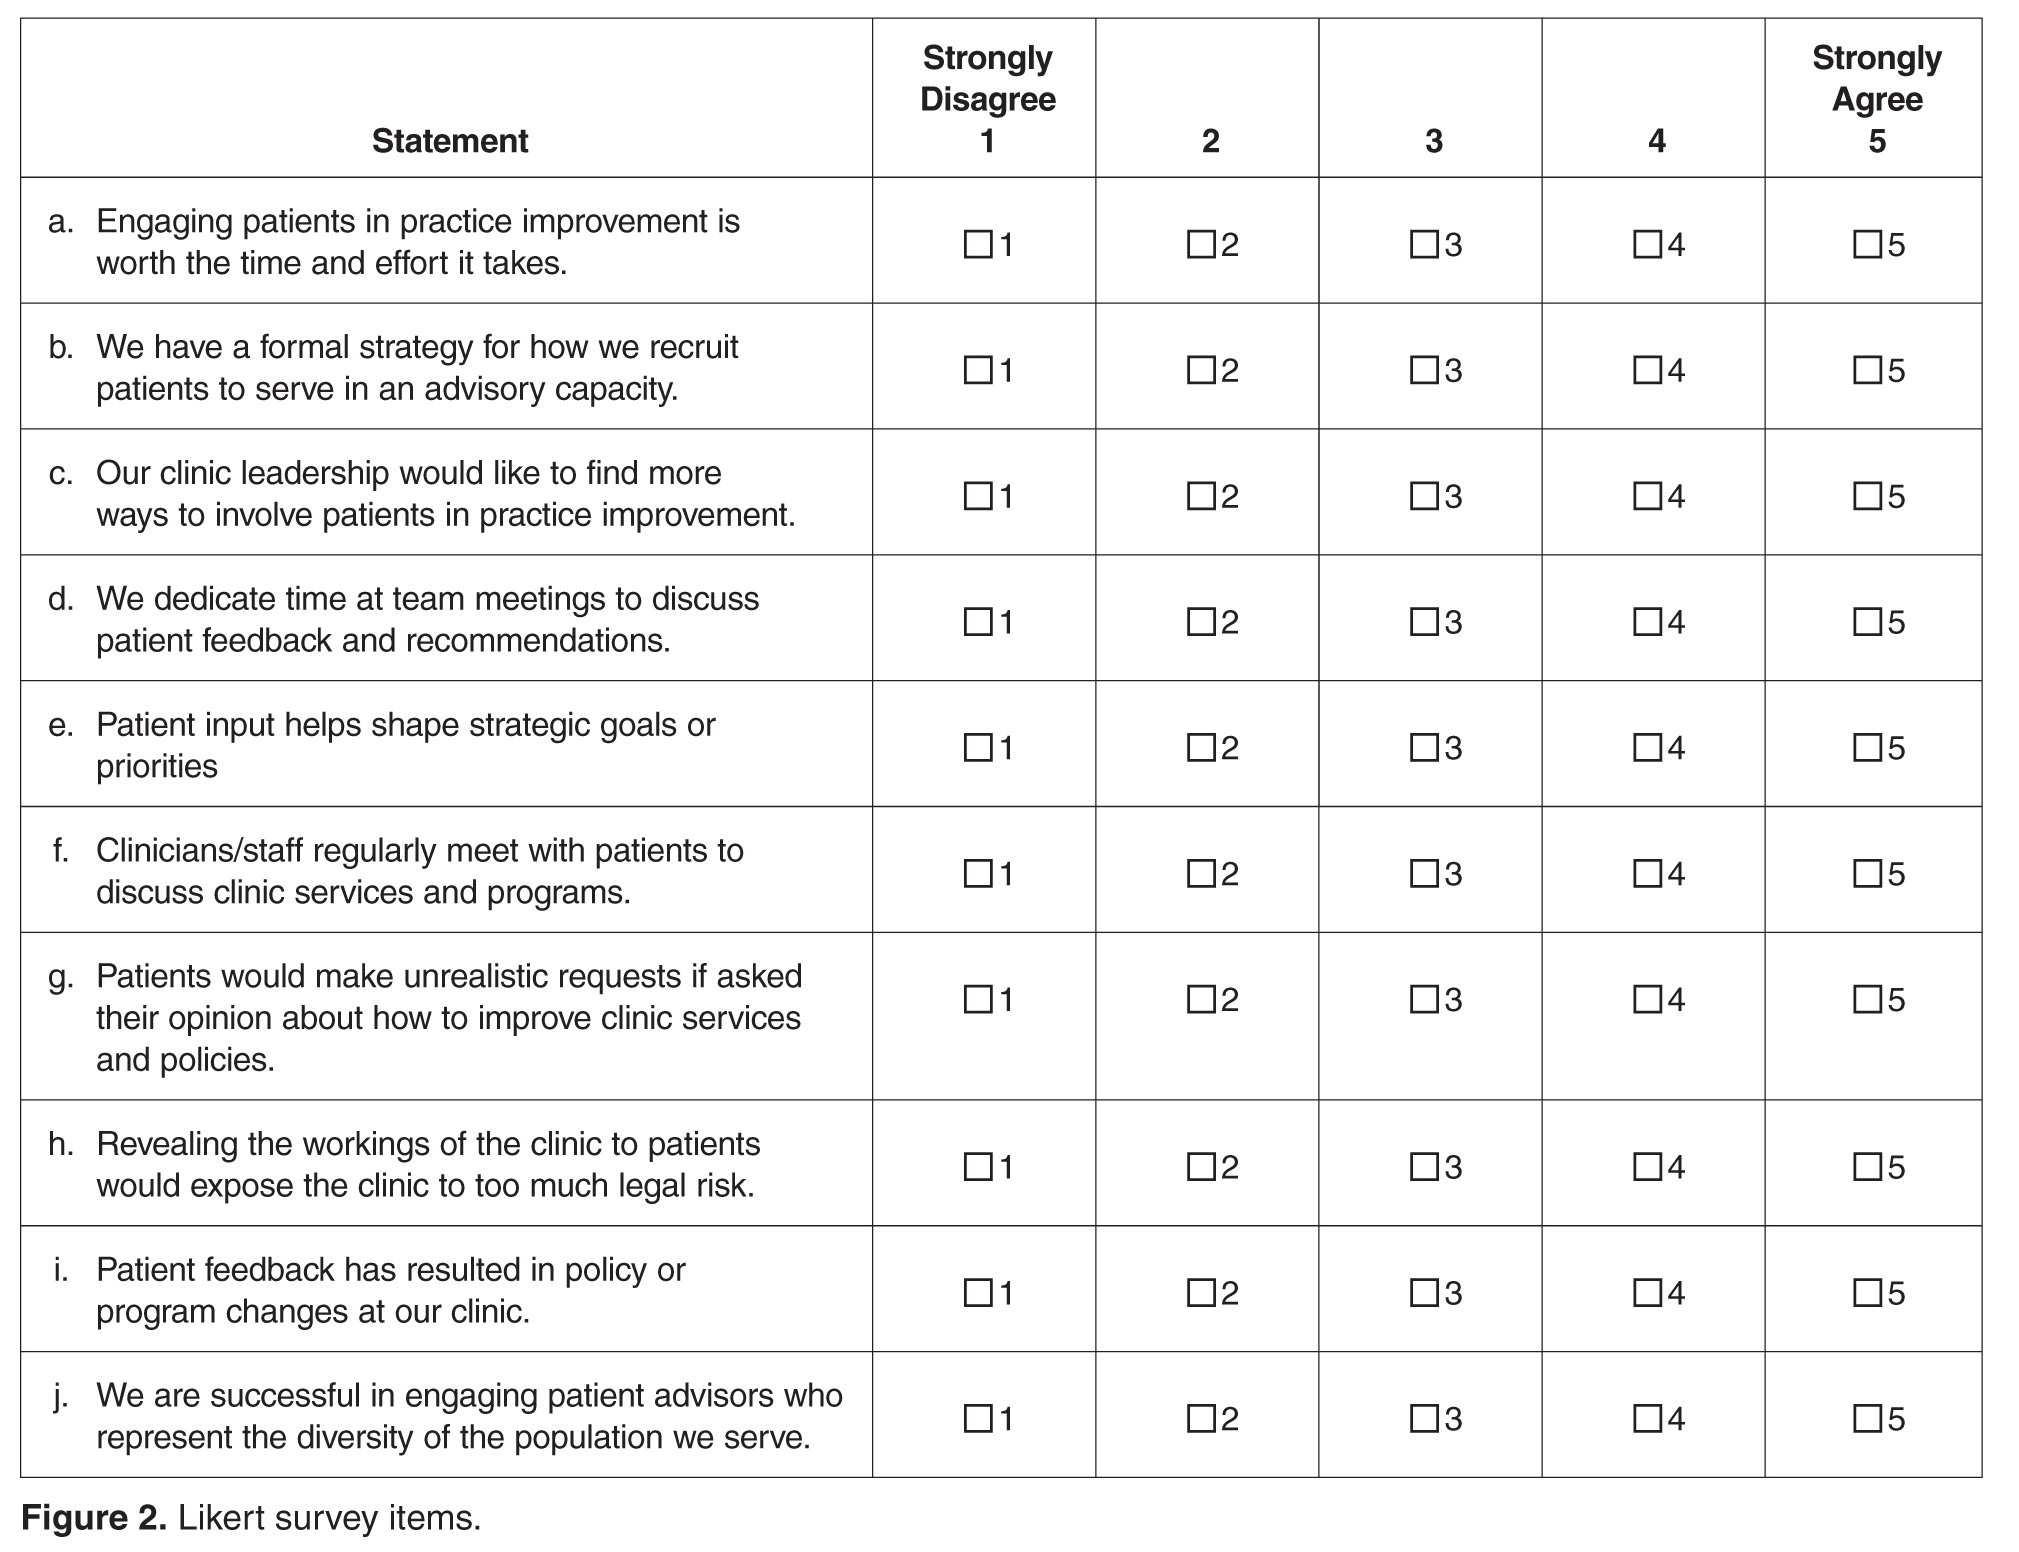
The primary outcomes of interest were respondents’ perception of patient impact on strategic priorities, policies, and programs. These outcomes were measured by 2 items: “Patient input helps shape strategic goals or priorities” and “Patient feedback has resulted in policy or program changes at our clinic.” Responses were measured on a 5-item Likert scale (1 = Strongly Disagree to 5 = Strongly Agree). Leadership support was measured using a single item that stated, “Our clinic leadership would like to find more ways to involve patients in practice improvement.” Having a formal strategy was measured using a single item that stated, “We have a formal strategy for how we recruit patients to serve in an advisory capacity.” Clinic processes included having dedicated time in meetings to discuss patient input, as measured by the item, “We dedicate time at team meetings to discuss patient feedback and recommendations.”
In addition to the 10 Likert-type items that captured attitudes, beliefs, and practices, we also asked participants to endorse strategies they used to obtain feedback and suggestions from patients (checklist of options including advisory councils, surveys, suggestion box, etc.). In addition, we assessed practice characteristics such as PCMH recognition status (not applying; in process of applying; received recognition), size of practice (< 5; 5–10; > 10 FTE clinicians), and having dedicated funding such as grant support to pay for patient engagement activities (yes; no).
Data Analysis
Data was analyzed in Stata version 13.0 (College Station, TX). Means and frequencies were used to characterize the sample. Stepwise multivariate modeling was used to identify factors associated with patient engagement outcomes. Organizational characteristics (size of the practice, PCMH recognition status, dedicated funding, leadership support, and having a formal strategy) were included as potential independent variables in Step 1 of the model for each of the 2 hypothesized patient engagement outcomes. Because we theorized that it might be a factor associated with the outcomes that was in turn influenced by clinic characteristics, the process of allocating dedicated time in team meetings to discuss and consider actions to take in response to patient feedback was included as a predictor in Step 2 of each model. Survey items that were not answered were treated as missing data (not imputed). We tested for multiple collinearity using variance influence factors.
Results
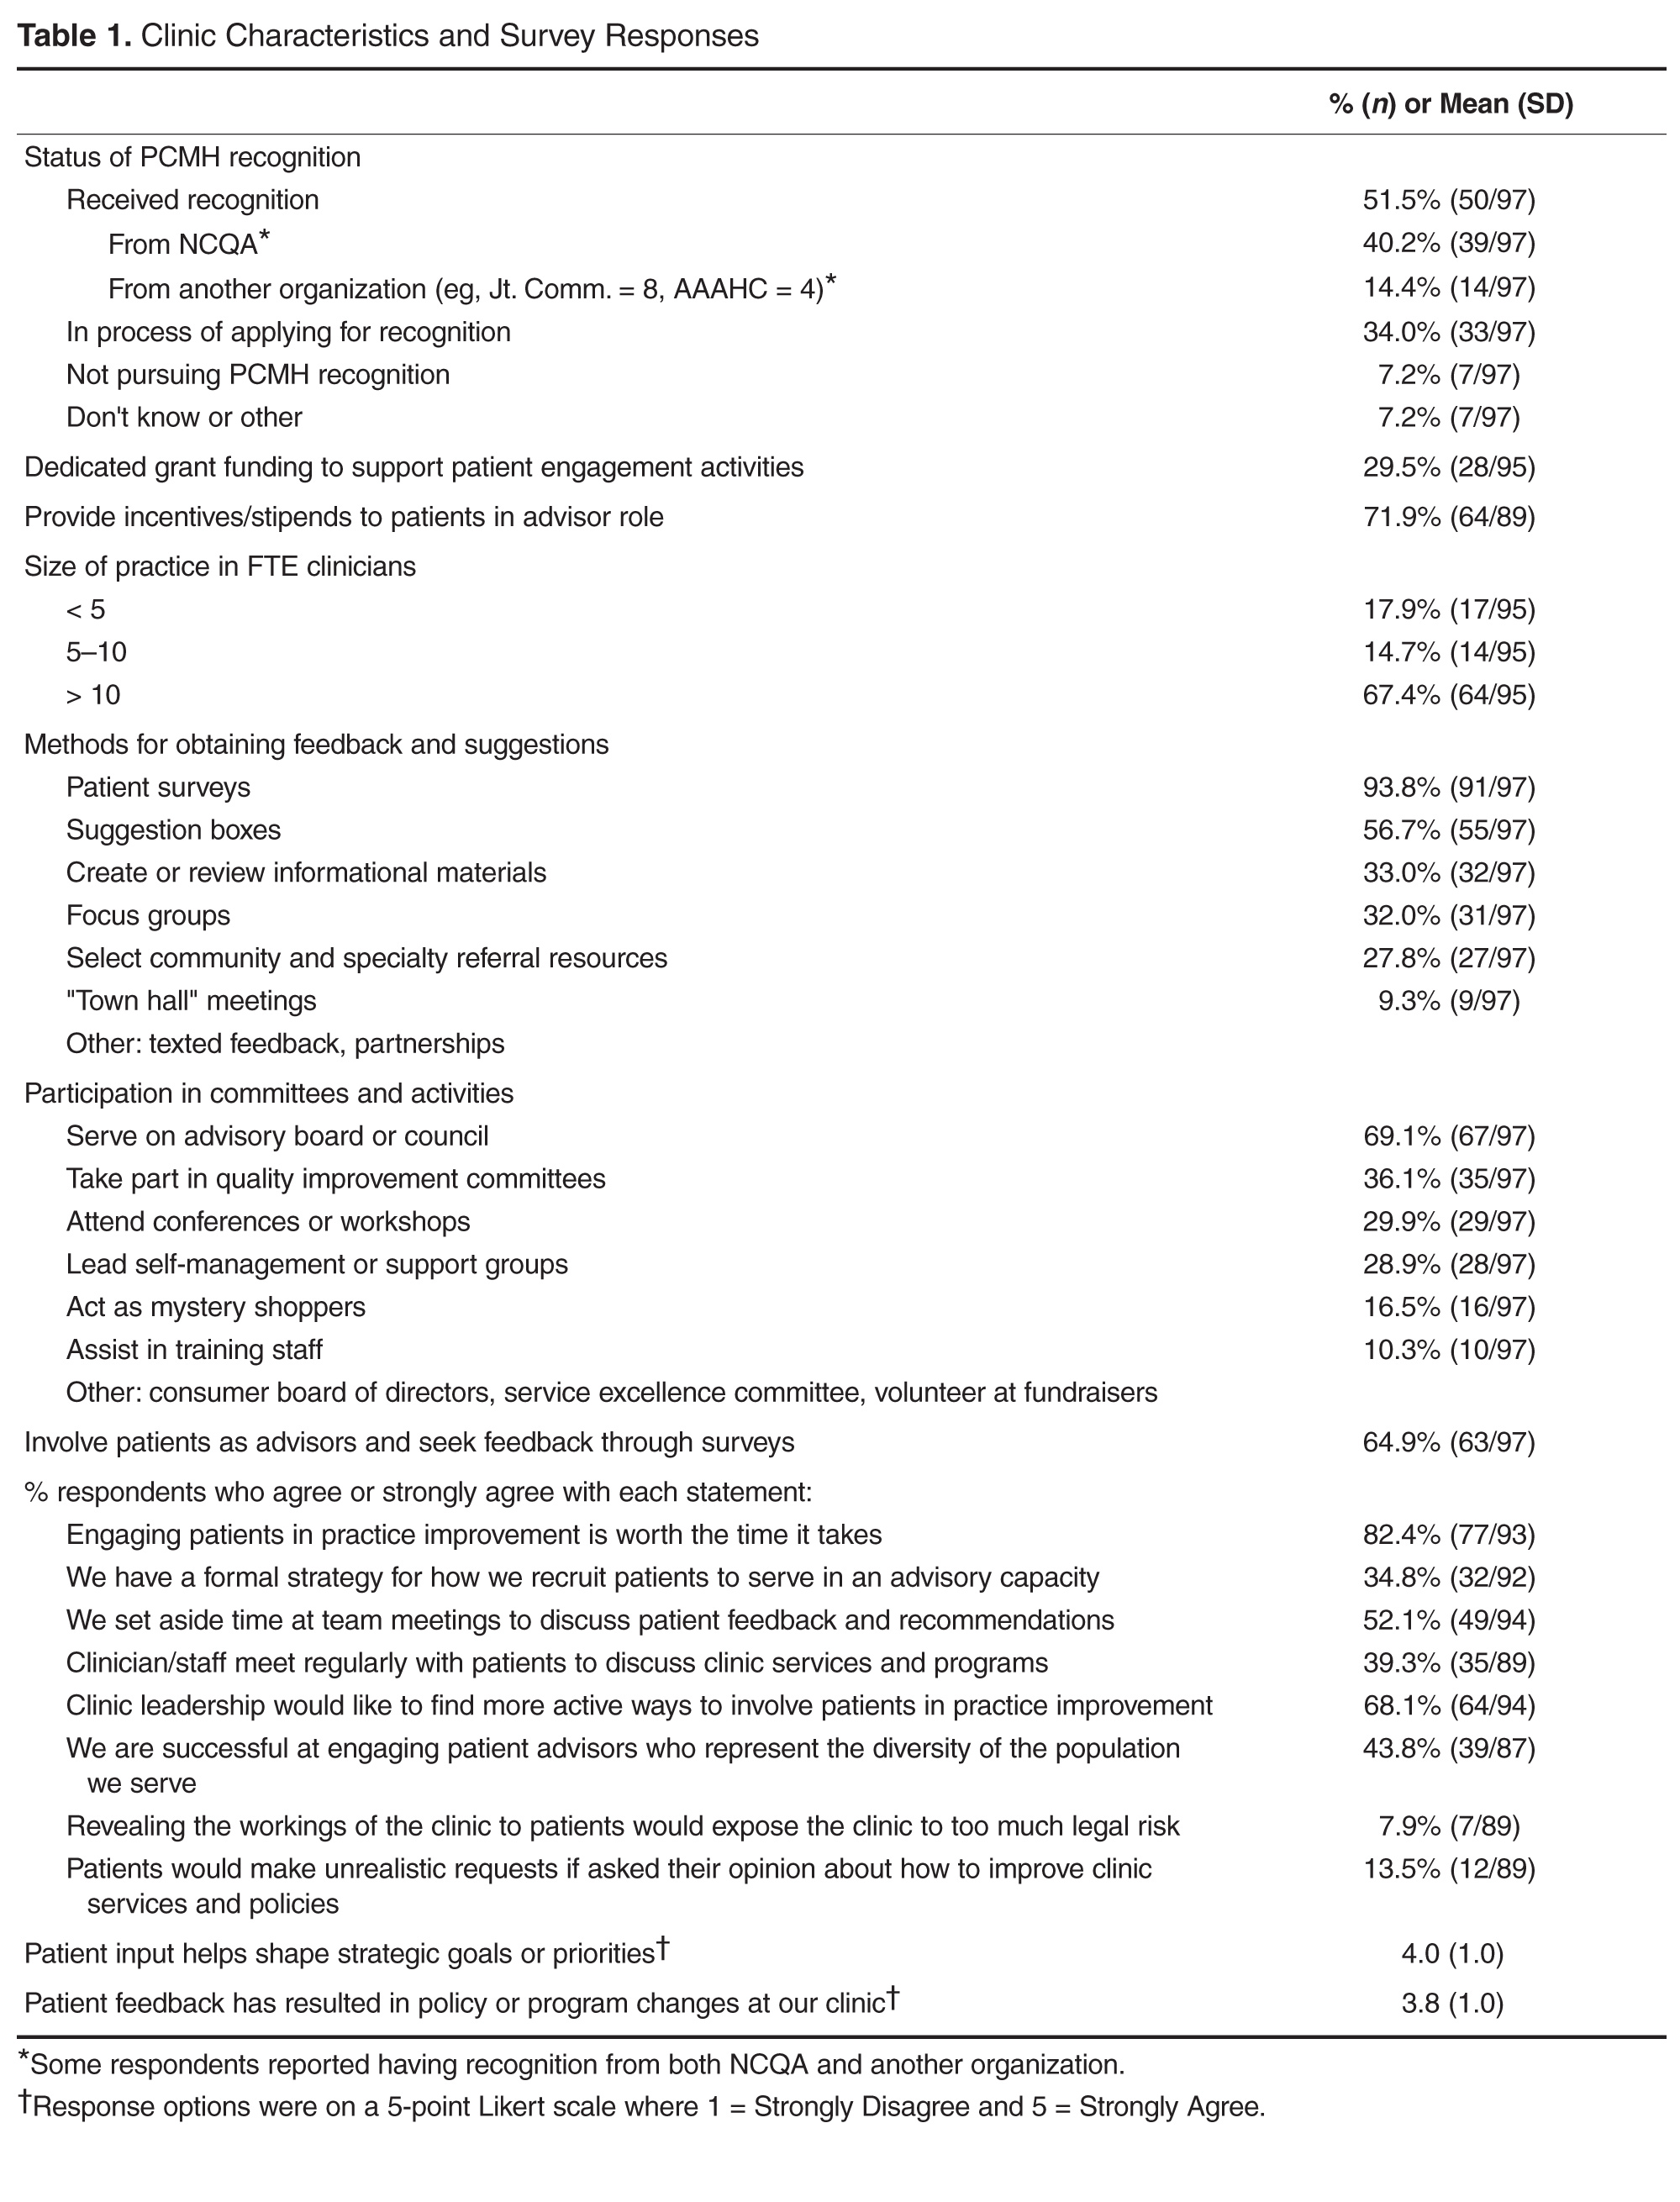
The most common mechanisms for receiving patient feedback were surveys (94% of respondents; 91/97) and suggestion boxes (57%; 55/97; Table 1). A third of respondents reported soliciting patient feedback on information materials (33%; 32/97), and almost a third involved patients in selecting referral resources (28%; 27/97). As for ongoing participation, 69% (67/97) of respondents reported involving patients on advisory boards or councils, and 36% (35/97) invited patients to take part in quality improvement committees. Other common activities included inviting patients to conferences or workshops (30%; 29/97) and asking patients to lead self-management or support groups (29%; 28/97).
Most respondents (82%; 77/93) agreed or strongly agreed that patient engagement was worth the time it required. About a third (35%; 32/92) reported having a formal strategy for recruiting and engaging patients in an advisory capacity. About half (52%; 49/94) reported setting aside time in team meetings to discuss patient feedback, although fewer (39%; 35/89) reported that their front line staff met regularly with patients to discuss clinic services and programs. Two-thirds of respondents (68%; 64/94) reported that their leadership would like to find more active ways to involve patients in practice improvement. Less than half (44%; 39/89) felt that they were successful at engaging patient advisors who represented the diversity of the population served. When considering downsides of patient engagement, few agreed that revealing the workings of the clinics to patients would expose the clinic to too much risk (8%; 7/89) or that patients would make unrealistic requests if asked their opinions (14%; 12/89).
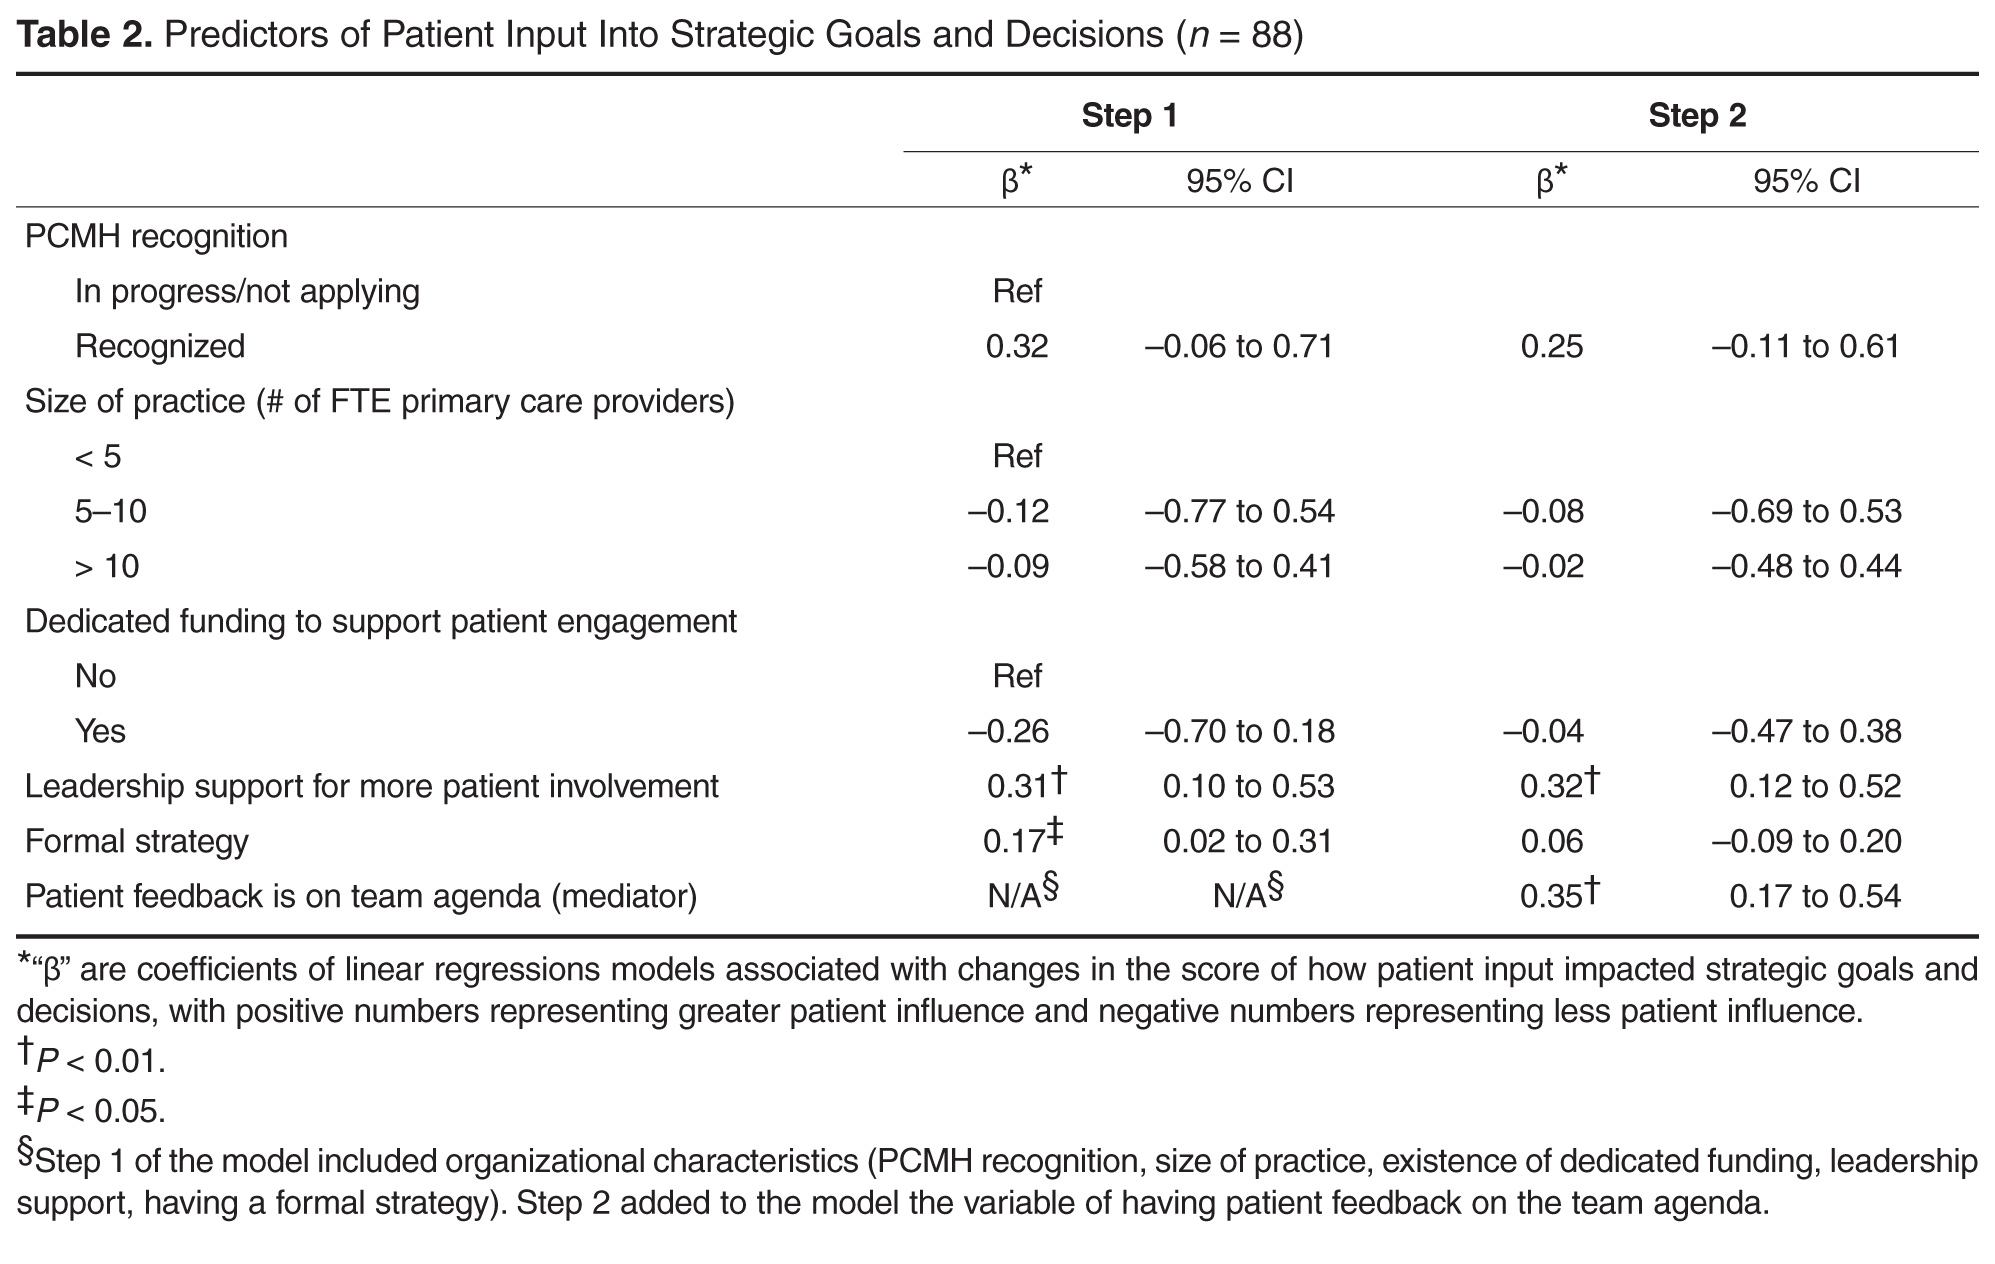
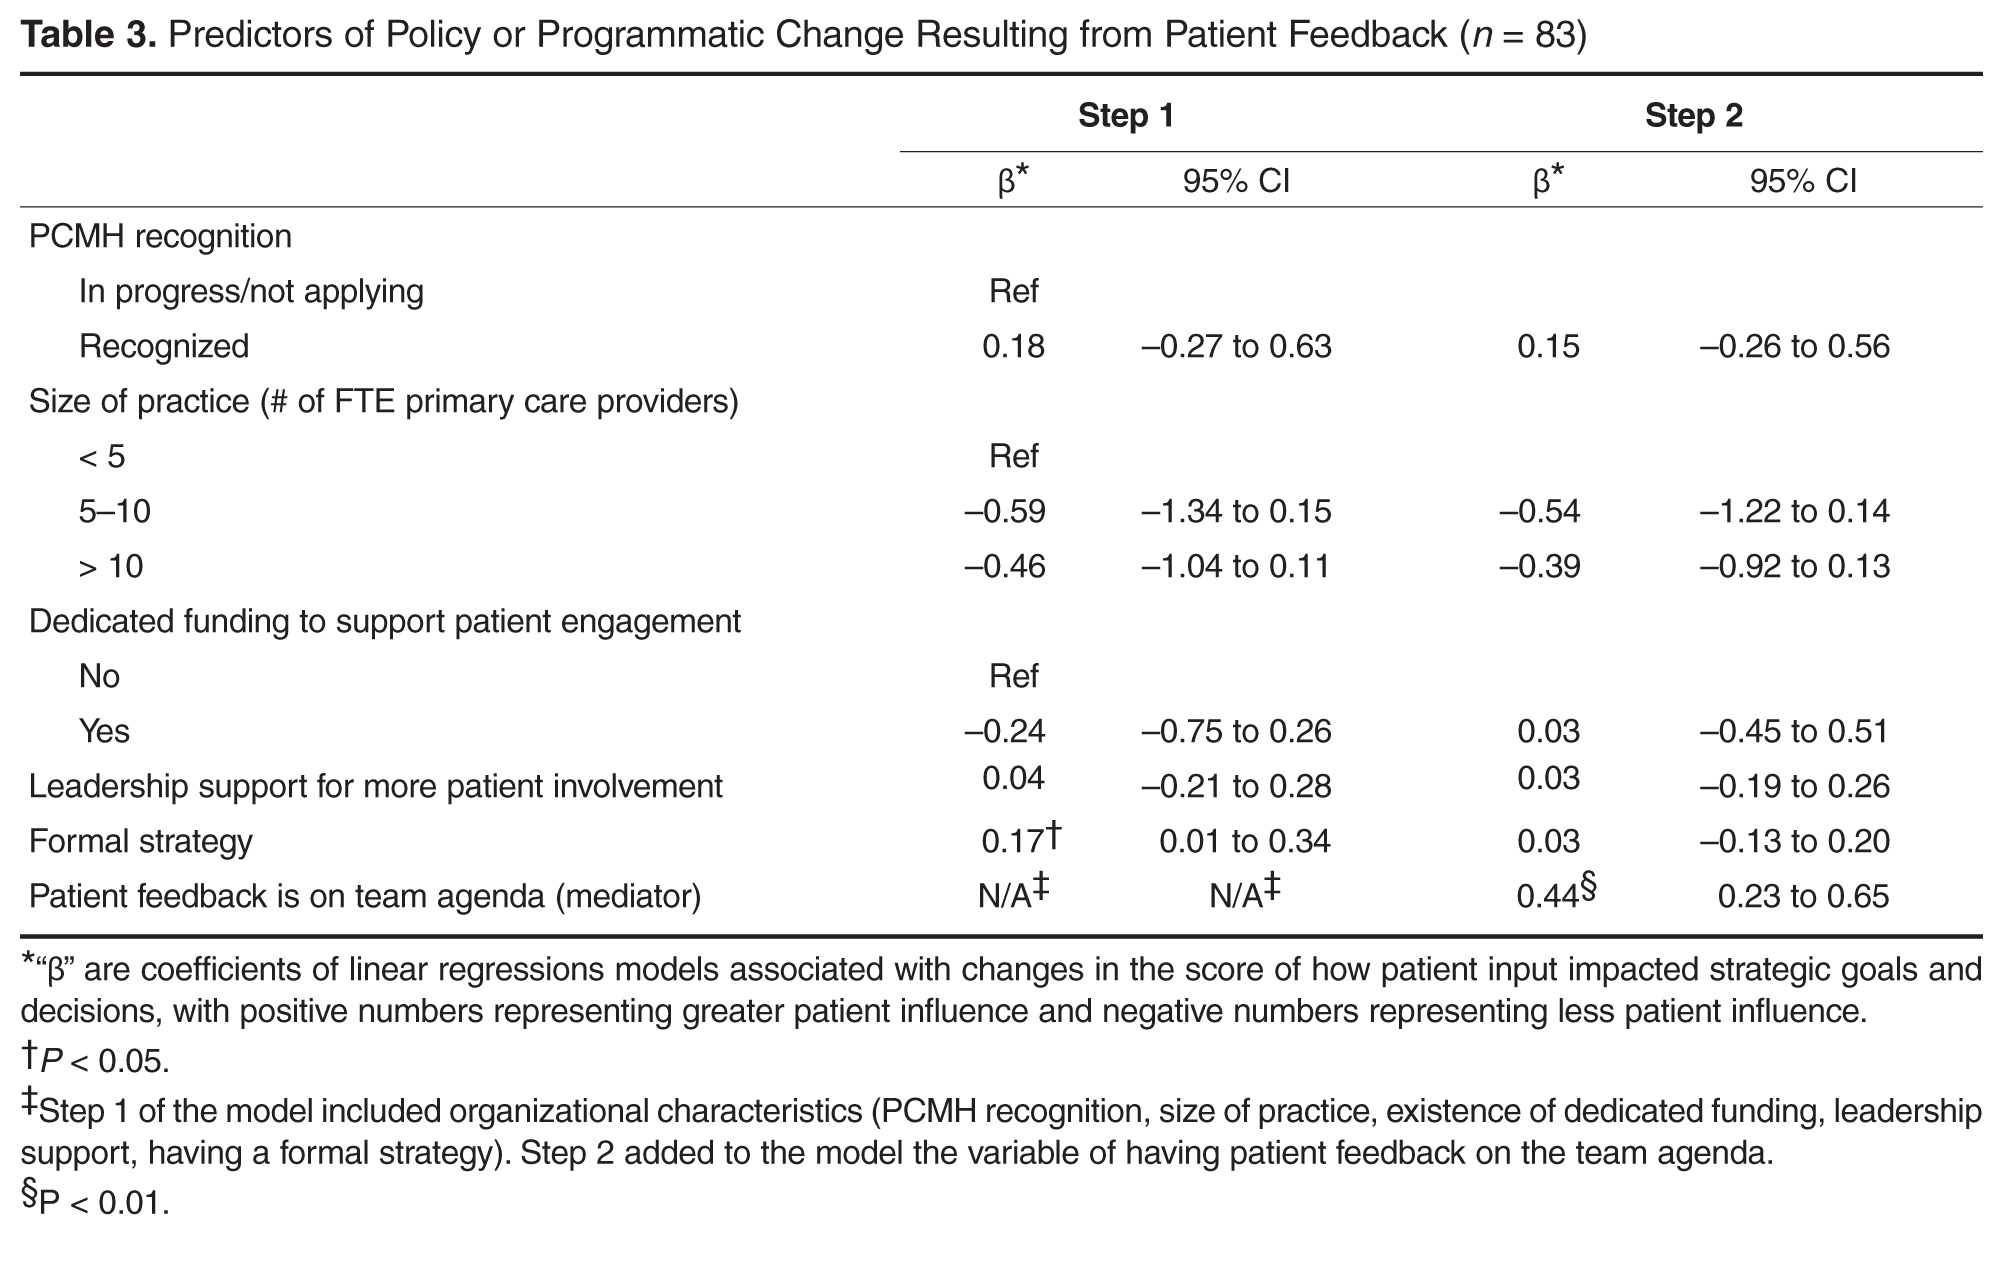
Discussion
Among the CHCs surveyed, we found that having a formal strategy for recruiting and engaging patients in practice improvement efforts was associated with patient input shaping strategic goals, programs, and policies. Devoting time in staff team meetings to discuss feedback from patients, such as that received through advisory councils or patient surveys, appeared to be the mechanism by which having a formal strategy for engaging patients influenced the outcomes. Leadership support for patient engagement was also associated with patient input in strategic goals. In contrast, anticipated predictors such as PCMH recognition status, the size of a practice, and having dedicated funding for patient engagement were not associated with these outcomes.
This is the first study known to the authors that examines factors associated with patient engagement outcomes such as patient involvement in clinic-level strategies, policies, and programs. The finding that having a formal process for recruiting and engaging patients and devoting time in team meetings to discuss patient input are significantly associated with patient engagement outcomes is encouraging, because it suggests relatively practical and straightforward actions for primary care leaders interested in engaging patients productively in practice improvement.
The level of patient engagement reported by these respondents is higher than that reported by some other studies. For example, 65% of respondents in this study reported conducting patient surveys and involving patients in ongoing roles as patient advisors, compared to 29% in a 2013 study by Han and colleagues for 112 practices that had received PCMH recognition [6]. This could be partially explained by the fact that many CHCs are federally qualified health centers, which are mandated to have consumer members on their board of directors, and in many cases patient board members may be invited to participate actively in practice improvement. In this study, it is also interesting to note that more than 80% of respondents agreed with the statement that “engaging patients in practice improvement is worth the time and effort it takes,” suggesting that this is a group that valued and prioritized patient engagement.
A lack of time or resources to support patient engagement has been reported as a barrier to effective engagement [15], so it was surprising that having dedicated funding to support patient engagement was not associated with the study outcomes. Only 30% of CHC leaders reported having dedicated funding for patient engagement, while over 80% reported soliciting patient input through longitudinal, bidirectional activities such as committees or advisory councils. While financial support for this vital work is likely important to catalyze and sustain patient engagement at the practice level, it would appear many of the practices surveyed in this study are engaging their patients as partners in practice transformation despite a lack of dedicated resources.
The lack of association that we found between PCMH recognition status and patient influence on strategies, programs, and policies is corroborated by work by Han and colleagues [6], in which they found that the level of PCMH status was not associated with the degree of patient engagement in practice improvement and that only 32% of practices were engaging patients in ongoing roles as advisors.
Devoting time in team meetings to discussing patient feedback seemed to be the mechanism through with having a formal strategy for patient engagement predicted outcomes. Although it may seem self-evident that taking time to discuss patient input could make it more likely to affect clinic practices, we have observed through regular interaction with dozens of health centers that many have comment boxes set up but have no mechanism for systematically reviewing that feedback and considering it as a team. This is also borne out by our survey finding that fewer than 60% of sites that report conducting surveys or having suggestion boxes agree that they set aside time in team meetings to discuss the feedback gleaned from these sources. Thus, the results of this survey suggest that there are simple decisions and structures that may help to turn input from patients into clinic actions.
This study has several limitations. Causation cannot be inferred from this cross-sectional study; additional research is required to understand if helping clinics develop formal strategies for patient recruitment or set aside time in meetings to discuss patient feedback would lead to greater influence of patients on strategic goals, policies, and programs. Data were self-reported by a single person from each CHC, and although members of WCN typically represent clinic leaders who are actively engaged in PCMH-related activities, it is not clear if respondents were aware of the full range of patient engagement strategies used at their clinical site. Front-line clinicians and staff could provide a different perspective on patient engagement. There was no external validation of survey instrument statements regarding the impact of patient input on strategic goals, policies, or programs. The number of respondents (n = 97) is limited, but it is comparable to that in other existing studies [6]. The response rate for this survey was 21%, and respondents may have differed from non-respondents in important ways. When respondents of this study are compared to national samples reporting to the Uniform Data System, the proportion of CHCs with PCMH recognition is lower in our sample (52% versus 65%) [16]. The high level of patient engagement reported by CHC leaders in this study compared to other studies suggests that highly engaged practices may have been more likely to respond than those with lower levels of engagement with their patients. There may have been differences in how patient engagement and advisory roles were interpreted by respondents.
Conclusion
CHC leaders who reported a formal strategy for engaging patients in practice improvement and dedicated time to discuss patient input during team meetings were more likely to report patient input on policies, programs, and strategic goals. Developing a formal strategy to engage patients and establishing protected time on team agendas to discuss patient feedback may be practical ways to promote greater patient engagement in primary care transformation.
Acknowledgements: The authors wish to thank the leadership of Western Clinicians Network. A special thanks to Dr. Carl Heard, Dr. Mike Witte, Dr. Eric Henley, Dr. Kevin Grumbach, Dr. David Thom, Dr. Quynh Bui, Lucia Angel, and Dr. Thomas Bodenheimer for their feedback on survey and manuscript development. Valuable input on the survey questions were also received from the UCSF Lakeshore Family Medicine Center Patient Advisory Council, the San Francisco General Hospital Patient Advisory Council, and the Malden Family Health Center Patient Advisory Council. Finally, thanks to the community health centers who shared their time and experiences through our survey.
Corresponding author: Rachel Willard-Grace, MPH, Department of Family & Community Medicine, UCSF, 1001 Potrero Hill, Ward 83, Building 80, 3rd Fl, San Francisco, CA 94110, [email protected].
Funding/support: Internal departmental funding covered the direct costs of conducting this research. This project was also supported in part by the National Center for Advancing Translational Sciences, National Institutes of Health, through UCSF-CTSI Grant Number UL1 TR000004 which supported Dr. Potter’s time. Dr. Sharma received support from the UCSF primary care research fellowship funded by NRSA grant T32 HP19025. Contents of this manuscript are solely the responsibility of the authors and do not necessarily represent the official views of the NIH.
1. Carman KL, Dardess P, Maurer M, et al. Patient and family engagement: a framework for understanding the elements and developing interventions and policies. Health Aff (Millwood) 2013;32:223–31.
2. Dentzer S. Rx for the ‘blockbuster drug’ of patient engagement. Health Aff (Millwood) 2013;32:202.
3. Fleurence R, Selby JV, Odom-Walker K, et al. How the Patient-Centered Outcomes Research Institute is engaging patients and others in shaping its research agenda. Health Aff (Millwood) 2013;32:393–400.
4. Boivin A, Lehoux P, Lacombe R, et al. Involving patients in setting priorities for healthcare improvement: a cluster randomized trial. Implement Sci 2014;9(24).
5. Peikes D, Genevro J, Scholle SH, Torda P. The patient-centered medical home: strategies to put patients at the center of primary care. AHRQ Publication No. 11-0029. Rockville, MD: Agency for Healthcare Research and Quality; 2007.
6. Han E, Hudson Scholle S, Morton S, et al. Survey shows that fewer than a third of patient-centered medical home practices engage patients in quality improvement. Health Aff (Millwood) 2013;32:368–75.
7. Nilsen ES, Myrhaug HT, Johnasen M, et al. Methods of consumer involvement in developing healthcare policy and research, clinical practice guidelines, and patient information material. Cochrane Database Syst Review 2006;19(3):CD004563.
8. Gottlieb K, Sylvester I, Eby D. Transforming your practice: what matters most. Fam Pract Manage 2008:32–8.
9. Institute for Patient- and Family-Centered Care. Profiles of change: MCGHealth, 2012. Available at www.ipfcc.org/profiles/prof-mcg.html.
10. Sharma AE, Angel L, Bui Q. Patient advisory councils: giving patients a seat at the table. Fam Pract Manage 2015;22:22–7.
11. National Association of Community Health Centers. Website. Accessed 23 Dec 2014 at www.nachc.com/.
12. Neuhausen K, Grumbach K, Bazemore A, Phillips RL. Integrating community health centers into organized delivery systems can improve access to subspecialty care. Health Aff (Millwood) 2012;31:1708–16.
13. National Association of Community Health Centers. Health center program governing board workbook. July 2015. Accessed 31 May 2016 at www.aachc.org/wp-content/uploads/2014/01/Governance-Workbook-8-18.pdf.
14. Baron RM, Kenny DA. The moderator-mediator variable distinction in social psychological research: conceptual, strategic, and statistical considerations. J Pers Soc Psych 1986;51:1173–82.
15. Roseman D, Osborne-Stafsnes J, Helwig AC, et al. Early lessons from four ‘aligning forces for quality’ communities bolster the case for patient-centered care. Health Aff (Millwood) 2013;32:232–41.
16. National Association of Community Health Centers. United States health center fact sheet. 2014. Accessed 27 May 2016 at www.nachc.com/client//US16.pdf.
From the Department of Family and Community Medicine, University of California San Francisco, San Francisco, CA (Ms. Willard-Grace, Dr. Sharma, Dr. Potter) and the California Primary Care Association, Sacramento, CA (Ms. Parker).
Abstract
- Objective: To explore how community health centers engage patients in practice improvement and factors associated with patient involvement on clinic-level strategies, policies, and programs.
- Methods: Cross-sectional web-based survey of community health centers in California, Arizona, Nevada, and Hawaii (n = 97).
- Results: The most common mechanisms used by community health centers to obtain patient feedback were surveys (94%; 91/97) and advisory councils (69%; 67/97). Patient-centered medical home recognition and dedicated funding for patient engagement activities were not associated with reported patient influence on the clinic’s strategic goals, policies, or programs. When other factors were controlled for in multivariable modeling, leadership support (β = 0.31, 95% confidence interval [CI] 0.10–0.53) and having a formal strategy to identify and engage patients as advisors (β = 0.17, 95% CI 0.02–0.31) were positively associated with patient influence on strategic goals. Having a formal strategy to identify and engage patients also was associated with patient impact on polices and programss (β = 0.17, 95% CI 0.01–0.34). The clinic process of setting aside time to discuss patient feedback appeared to be a mechanism by which formal patient engagement strategies resulted in patients having an impact on practice improvement activities (β = 0.35, 95% CI 0.17–0.54 for influence on strategic goals and β = 0.44, 95% CI 0.23–0.65 for influence on policies and programs).
- Conclusion: These findings may provide guidance for primary care practices that wish to engage patients in practice improvement. The relatively simple steps of developing a formal strategy to identify and engage patients and setting aside time in meetings to discuss patient feedback appear to be important prerequisites for success in these activities.
Patient engagement is becoming an increasingly prominent concept within primary care redesign. Called the “next blockbuster drug of the century” and the “holy grail” of health care [1,2], patient engagement has become a key goal for funders such as the Patient-Centered Outcomes Research Institute [3] and accrediting agencies such as the National Committee for Quality Assurance (NCQA).
Patient engagement has been defined as patients working in active partnership at various levels across the health care system to improve health and health care [1]. It can be conceptualized as occurring at 3 levels: at the level of direct care (eg, a clinical encounter), at the level of organizational design and governance, and at the level of policy making [1]. For example, engagement at the level of direct care might involve a patient working with her care team to identify a treatment option that matches her values and preferences. At the level of the health care organization, a patient might provide feedback through a survey or serve on a patient advisory council to improve clinic operations. Patients engaged at the level of policy making might share their opinions with their elected representatives or sit on a national committee. Although research has examined engagement at the direct care level, for example, in studies of shared decision making, there is a paucity of research addressing the impact of patient engagement on clinic-level organizational redesign and practice improvement [4,5].
Relatively few studies describe what primary care practice teams are currently doing at the basic level of soliciting and acting on patient input on the way that their care is delivered. A survey of 112 NCQA-certified patient-centered medical home (PCMH) practices found that 78% conducted patient surveys, 63% gathered qualitative input through focus groups or other feedback, 52% provided a suggestion box, and 32% included patients on advisory councils or teams [6]. Fewer than one-third of PCMH-certified practices were engaging patients or families in more intensive roles as ongoing advisors on practice design or practice improvement [6]. Randomized controlled trials have shown that patient involvement in developing informational materials results in more readable and relevant information [7]. Patient and family involvement in identifying organizational priorities within clinical practice settings resulted in greater alignment with the chronic care model and the PCMH when compared with control groups and resulted in greater agreement between patients and health care professionals [4]. Moreover, a number of innovative health care organizations credit their success in transformation to their patient partnerships [8–10].
Within this context, current practices at community health centers (CHCs) are of particular interest. CHCs are not-for-profit organizations that deliver primary and preventive care to more than 22 million people in the United States [11]. A large proportion of their patients are poor and live in medically underserved communities. More than one-third (37.5%) of CHC patients are uninsured and 38.5% are on Medicaid [12]. Perhaps because of their commitment to caring for medically vulnerable populations that have often had difficulty obtaining needed medical services, some CHCs have been on the forefront of patient engagement [8]. In addition, many CHCs are federally qualified health care centers, which are mandated to engage members of their communities within their governing boards [13]. However, relatively little is known about how CHCs are engaging patients as practice improvement partners or the perceived impact of this engagement on CHC strategic goals, policies, and programs. This study explores these factors and examines the organizational characteristics and processes associated with patients having an impact on practice improvement activities.
Methods
We conducted a cross-sectional, web-based survey of primary care clinician and staff leaders at CHCs in July–August 2014 to assess current strategies, attitudes, facilitators, and barriers toward engaging patients in practice improvement efforts. The study protocol was developed jointly by the San Francisco Bay Area Collaborative Research Network (SFBayCRN), the University of California San Francisco Center for Excellence in Primary Care (CEPC), and the Western Clinicians Network (WCN). The protocol was reviewed by the University of California San Francisco Committee on Human Research and determined to be exempt research (study number 14-13662).
Survey Participants
Participants in the web-based survey were members of the WCN, a peer-led, volunteer, membership-based association of medical leaders of community health centers in California, Arizona, Nevada, and Hawaii. An invitation and link to a web-based survey was sent by email to members working at WCN CHC, who received up to 3 reminders to complete the survey. We allowed one response per CHC surveyed; in cases where more than one CHC leader was a member of WCN, we requested that the person most familiar with patient engagement activities respond to the survey. In the event of multiple respondents from an organization, incomplete responses were dropped and one complete response was randomly selected to represent the organization. Participants in the survey were entered into a drawing for ten $50 gift cards and one iPad.
Conceptual Model
Measures
The primary outcomes of interest were respondents’ perception of patient impact on strategic priorities, policies, and programs. These outcomes were measured by 2 items: “Patient input helps shape strategic goals or priorities” and “Patient feedback has resulted in policy or program changes at our clinic.” Responses were measured on a 5-item Likert scale (1 = Strongly Disagree to 5 = Strongly Agree). Leadership support was measured using a single item that stated, “Our clinic leadership would like to find more ways to involve patients in practice improvement.” Having a formal strategy was measured using a single item that stated, “We have a formal strategy for how we recruit patients to serve in an advisory capacity.” Clinic processes included having dedicated time in meetings to discuss patient input, as measured by the item, “We dedicate time at team meetings to discuss patient feedback and recommendations.”
In addition to the 10 Likert-type items that captured attitudes, beliefs, and practices, we also asked participants to endorse strategies they used to obtain feedback and suggestions from patients (checklist of options including advisory councils, surveys, suggestion box, etc.). In addition, we assessed practice characteristics such as PCMH recognition status (not applying; in process of applying; received recognition), size of practice (< 5; 5–10; > 10 FTE clinicians), and having dedicated funding such as grant support to pay for patient engagement activities (yes; no).
Data Analysis
Data was analyzed in Stata version 13.0 (College Station, TX). Means and frequencies were used to characterize the sample. Stepwise multivariate modeling was used to identify factors associated with patient engagement outcomes. Organizational characteristics (size of the practice, PCMH recognition status, dedicated funding, leadership support, and having a formal strategy) were included as potential independent variables in Step 1 of the model for each of the 2 hypothesized patient engagement outcomes. Because we theorized that it might be a factor associated with the outcomes that was in turn influenced by clinic characteristics, the process of allocating dedicated time in team meetings to discuss and consider actions to take in response to patient feedback was included as a predictor in Step 2 of each model. Survey items that were not answered were treated as missing data (not imputed). We tested for multiple collinearity using variance influence factors.
Results
The most common mechanisms for receiving patient feedback were surveys (94% of respondents; 91/97) and suggestion boxes (57%; 55/97; Table 1). A third of respondents reported soliciting patient feedback on information materials (33%; 32/97), and almost a third involved patients in selecting referral resources (28%; 27/97). As for ongoing participation, 69% (67/97) of respondents reported involving patients on advisory boards or councils, and 36% (35/97) invited patients to take part in quality improvement committees. Other common activities included inviting patients to conferences or workshops (30%; 29/97) and asking patients to lead self-management or support groups (29%; 28/97).
Most respondents (82%; 77/93) agreed or strongly agreed that patient engagement was worth the time it required. About a third (35%; 32/92) reported having a formal strategy for recruiting and engaging patients in an advisory capacity. About half (52%; 49/94) reported setting aside time in team meetings to discuss patient feedback, although fewer (39%; 35/89) reported that their front line staff met regularly with patients to discuss clinic services and programs. Two-thirds of respondents (68%; 64/94) reported that their leadership would like to find more active ways to involve patients in practice improvement. Less than half (44%; 39/89) felt that they were successful at engaging patient advisors who represented the diversity of the population served. When considering downsides of patient engagement, few agreed that revealing the workings of the clinics to patients would expose the clinic to too much risk (8%; 7/89) or that patients would make unrealistic requests if asked their opinions (14%; 12/89).
Discussion
Among the CHCs surveyed, we found that having a formal strategy for recruiting and engaging patients in practice improvement efforts was associated with patient input shaping strategic goals, programs, and policies. Devoting time in staff team meetings to discuss feedback from patients, such as that received through advisory councils or patient surveys, appeared to be the mechanism by which having a formal strategy for engaging patients influenced the outcomes. Leadership support for patient engagement was also associated with patient input in strategic goals. In contrast, anticipated predictors such as PCMH recognition status, the size of a practice, and having dedicated funding for patient engagement were not associated with these outcomes.
This is the first study known to the authors that examines factors associated with patient engagement outcomes such as patient involvement in clinic-level strategies, policies, and programs. The finding that having a formal process for recruiting and engaging patients and devoting time in team meetings to discuss patient input are significantly associated with patient engagement outcomes is encouraging, because it suggests relatively practical and straightforward actions for primary care leaders interested in engaging patients productively in practice improvement.
The level of patient engagement reported by these respondents is higher than that reported by some other studies. For example, 65% of respondents in this study reported conducting patient surveys and involving patients in ongoing roles as patient advisors, compared to 29% in a 2013 study by Han and colleagues for 112 practices that had received PCMH recognition [6]. This could be partially explained by the fact that many CHCs are federally qualified health centers, which are mandated to have consumer members on their board of directors, and in many cases patient board members may be invited to participate actively in practice improvement. In this study, it is also interesting to note that more than 80% of respondents agreed with the statement that “engaging patients in practice improvement is worth the time and effort it takes,” suggesting that this is a group that valued and prioritized patient engagement.
A lack of time or resources to support patient engagement has been reported as a barrier to effective engagement [15], so it was surprising that having dedicated funding to support patient engagement was not associated with the study outcomes. Only 30% of CHC leaders reported having dedicated funding for patient engagement, while over 80% reported soliciting patient input through longitudinal, bidirectional activities such as committees or advisory councils. While financial support for this vital work is likely important to catalyze and sustain patient engagement at the practice level, it would appear many of the practices surveyed in this study are engaging their patients as partners in practice transformation despite a lack of dedicated resources.
The lack of association that we found between PCMH recognition status and patient influence on strategies, programs, and policies is corroborated by work by Han and colleagues [6], in which they found that the level of PCMH status was not associated with the degree of patient engagement in practice improvement and that only 32% of practices were engaging patients in ongoing roles as advisors.
Devoting time in team meetings to discussing patient feedback seemed to be the mechanism through with having a formal strategy for patient engagement predicted outcomes. Although it may seem self-evident that taking time to discuss patient input could make it more likely to affect clinic practices, we have observed through regular interaction with dozens of health centers that many have comment boxes set up but have no mechanism for systematically reviewing that feedback and considering it as a team. This is also borne out by our survey finding that fewer than 60% of sites that report conducting surveys or having suggestion boxes agree that they set aside time in team meetings to discuss the feedback gleaned from these sources. Thus, the results of this survey suggest that there are simple decisions and structures that may help to turn input from patients into clinic actions.
This study has several limitations. Causation cannot be inferred from this cross-sectional study; additional research is required to understand if helping clinics develop formal strategies for patient recruitment or set aside time in meetings to discuss patient feedback would lead to greater influence of patients on strategic goals, policies, and programs. Data were self-reported by a single person from each CHC, and although members of WCN typically represent clinic leaders who are actively engaged in PCMH-related activities, it is not clear if respondents were aware of the full range of patient engagement strategies used at their clinical site. Front-line clinicians and staff could provide a different perspective on patient engagement. There was no external validation of survey instrument statements regarding the impact of patient input on strategic goals, policies, or programs. The number of respondents (n = 97) is limited, but it is comparable to that in other existing studies [6]. The response rate for this survey was 21%, and respondents may have differed from non-respondents in important ways. When respondents of this study are compared to national samples reporting to the Uniform Data System, the proportion of CHCs with PCMH recognition is lower in our sample (52% versus 65%) [16]. The high level of patient engagement reported by CHC leaders in this study compared to other studies suggests that highly engaged practices may have been more likely to respond than those with lower levels of engagement with their patients. There may have been differences in how patient engagement and advisory roles were interpreted by respondents.
Conclusion
CHC leaders who reported a formal strategy for engaging patients in practice improvement and dedicated time to discuss patient input during team meetings were more likely to report patient input on policies, programs, and strategic goals. Developing a formal strategy to engage patients and establishing protected time on team agendas to discuss patient feedback may be practical ways to promote greater patient engagement in primary care transformation.
Acknowledgements: The authors wish to thank the leadership of Western Clinicians Network. A special thanks to Dr. Carl Heard, Dr. Mike Witte, Dr. Eric Henley, Dr. Kevin Grumbach, Dr. David Thom, Dr. Quynh Bui, Lucia Angel, and Dr. Thomas Bodenheimer for their feedback on survey and manuscript development. Valuable input on the survey questions were also received from the UCSF Lakeshore Family Medicine Center Patient Advisory Council, the San Francisco General Hospital Patient Advisory Council, and the Malden Family Health Center Patient Advisory Council. Finally, thanks to the community health centers who shared their time and experiences through our survey.
Corresponding author: Rachel Willard-Grace, MPH, Department of Family & Community Medicine, UCSF, 1001 Potrero Hill, Ward 83, Building 80, 3rd Fl, San Francisco, CA 94110, [email protected].
Funding/support: Internal departmental funding covered the direct costs of conducting this research. This project was also supported in part by the National Center for Advancing Translational Sciences, National Institutes of Health, through UCSF-CTSI Grant Number UL1 TR000004 which supported Dr. Potter’s time. Dr. Sharma received support from the UCSF primary care research fellowship funded by NRSA grant T32 HP19025. Contents of this manuscript are solely the responsibility of the authors and do not necessarily represent the official views of the NIH.
1. Carman KL, Dardess P, Maurer M, et al. Patient and family engagement: a framework for understanding the elements and developing interventions and policies. Health Aff (Millwood) 2013;32:223–31.
2. Dentzer S. Rx for the ‘blockbuster drug’ of patient engagement. Health Aff (Millwood) 2013;32:202.
3. Fleurence R, Selby JV, Odom-Walker K, et al. How the Patient-Centered Outcomes Research Institute is engaging patients and others in shaping its research agenda. Health Aff (Millwood) 2013;32:393–400.
4. Boivin A, Lehoux P, Lacombe R, et al. Involving patients in setting priorities for healthcare improvement: a cluster randomized trial. Implement Sci 2014;9(24).
5. Peikes D, Genevro J, Scholle SH, Torda P. The patient-centered medical home: strategies to put patients at the center of primary care. AHRQ Publication No. 11-0029. Rockville, MD: Agency for Healthcare Research and Quality; 2007.
6. Han E, Hudson Scholle S, Morton S, et al. Survey shows that fewer than a third of patient-centered medical home practices engage patients in quality improvement. Health Aff (Millwood) 2013;32:368–75.
7. Nilsen ES, Myrhaug HT, Johnasen M, et al. Methods of consumer involvement in developing healthcare policy and research, clinical practice guidelines, and patient information material. Cochrane Database Syst Review 2006;19(3):CD004563.
8. Gottlieb K, Sylvester I, Eby D. Transforming your practice: what matters most. Fam Pract Manage 2008:32–8.
9. Institute for Patient- and Family-Centered Care. Profiles of change: MCGHealth, 2012. Available at www.ipfcc.org/profiles/prof-mcg.html.
10. Sharma AE, Angel L, Bui Q. Patient advisory councils: giving patients a seat at the table. Fam Pract Manage 2015;22:22–7.
11. National Association of Community Health Centers. Website. Accessed 23 Dec 2014 at www.nachc.com/.
12. Neuhausen K, Grumbach K, Bazemore A, Phillips RL. Integrating community health centers into organized delivery systems can improve access to subspecialty care. Health Aff (Millwood) 2012;31:1708–16.
13. National Association of Community Health Centers. Health center program governing board workbook. July 2015. Accessed 31 May 2016 at www.aachc.org/wp-content/uploads/2014/01/Governance-Workbook-8-18.pdf.
14. Baron RM, Kenny DA. The moderator-mediator variable distinction in social psychological research: conceptual, strategic, and statistical considerations. J Pers Soc Psych 1986;51:1173–82.
15. Roseman D, Osborne-Stafsnes J, Helwig AC, et al. Early lessons from four ‘aligning forces for quality’ communities bolster the case for patient-centered care. Health Aff (Millwood) 2013;32:232–41.
16. National Association of Community Health Centers. United States health center fact sheet. 2014. Accessed 27 May 2016 at www.nachc.com/client//US16.pdf.
I-SPY 2 graduates two neoadjuvant treatments to phase III trials
Taking a step toward the goal of personalized medicine, investigators in the multicenter, adaptive I-SPY 2 trial report that tailoring neoadjuvant therapy combinations to specific cancer subtypes in women with high-risk breast cancer will likely result in higher rates of pathological complete responses for at least two subtypes, including patients with triple-negative disease.
Among women with triple-negative breast cancer (tumors lacking human epidermal growth factor receptor 2 [HER2], estrogen, and progesterone receptors) in the phase II trial, a combination of the poly (ADP-ribose) polymerase (PARP) inhibitor veliparib and carboplatin added to paclitaxel was associated with an estimated 51% pathological complete response (pCR) rate, compared with 26% for patients treated with weekly paclitaxel alone. The predicted probability of success in a phase III trial with the combination was 88%, reported Hope S. Rugo, MD, director of the Breast Oncology Clinical Trials Program at the University of California San Francisco, and her colleagues in I-SPY 2.

“The experience with veliparib-carboplatin in our trial shows the advantage of an adaptively randomized phase II platform trial for matching therapies with biomarker subsets to better inform the design of phase III trials so that they can be more focused, smaller, and faster. Future patients stand to benefit, but trial participants benefit as well in that exposure to ineffective therapy is minimized,” the investigators wrote (N Engl J Med. 2016 July 7. doi: 10.1056/NEJMoa1513749).
Partial results from this trial were reported at the 2013 San Antonio Breast Cancer Symposium.
On the basis of these phase II data, an ongoing phase III neoadjuvant trial is comparing standard chemotherapy alone, with carboplatin, or with veliparib plus carboplatin as treatment for triple-negative breast cancer, Dr. Rugo and her associates said.
In another arm of I-SPY 2 involving a subset of patients with HER2-positive, hormone receptor–negative cancers, the mean estimated pCR rate was 56% for patients treated with the investigational tyrosine-kinase inhibitor (TKI) neratinib, compared with an estimated 33% among patients treated with anti-HER2 agent trastuzumab (Herceptin). All the participants received standard neoadjuvant therapy, which consisted of 12 cycles of paclitaxel, followed by 4 cycles of doxorubicin and cyclophosphamide. The estimated probability of success in phase III with neratinib was 79%, reported John W. Park, MD, of University of California San Francisco, and his coauthors on behalf of I-SPY 2 investigators (N Engl J Med. 2016 July 7. doi: 10.1056/NEJMoa1513750).
On the basis of this phase II study, and to reflect the current standard of dual HER-targeting, the investigators are proceeding with a phase III trial comparing neratinib as neoadjuvant therapy added to pertuzumab (Perjeta), trastuzumab, and a taxane vs. the three latter drugs, and against a combination of neratinib, trastuzumab, and taxane, all followed by doxorubicin and cyclophosphamide.
Partial results of the phase II trial were reported at the 2013 annual meeting of the American Association for Cancer Research.
Nimble trial, tailored therapies
I-SPY 2 (Investigation of Serial Studies to Predict Your Therapeutic Response through Imaging and Molecular Analysis 2) is an ongoing “platform” trial exploring the use of new drugs combined with a standard neoadjuvant therapy backbone for the treatment of high-risk cancers.
Women with stage II or III breast cancers with tumors 2.5 cm or larger are assessed for one of eight biomarker subtypes according to HER2 (human epidermal growth factor receptor 2) status, hormone receptor status, and genetic risk factors based on a 70-gene assay. The patients are then randomized within each biomarker subtype to receive standard therapy with or without an investigational agent.
Each sub-trial has a primary endpoint of an improvement in pathological complete response compared with the standard of care. Changes in tumor volume on MRI are used to predict whether patients will achieve a pCR. Regimens that have a high Bayesian predictive probability of success in a subsequent phase III neoadjuvant trial within the biomarker signature in which they performed well are eligible for moving on to phase III trials.
Triple-negative disease
Among the subgroup of patients with triple-negative disease, 72 were assigned to receive veliparib 50 mg by mouth twice daily for 12 weeks, plus carboplatin at a dose intended to achieve a pharmacologic area under the concentration versus time curve of 6 mg/hour per liter on weeks 1, 4, 7, and 10, plus intravenous paclitaxel at a dose of 80 mg/m2. An additional 44 patients (controls) were randomized to receive paclitaxel alone.
Following paclitaxel alone or with the combination, all patients received doxorubicin 60 mg/m2 and cyclophosphamide 600 mg/m2 every 2-3 weeks for four doses, followed by myeloid growth factor support as appropriate. Following treatment, all patients underwent surgery that included axillary node sampling in accordance with National Comprehensive Cancer Network (NCCN) and local practice guidelines. Adjuvant radiation and endocrine therapy were recommended in accordance with standard guidelines.
The rate of grade 3 or greater hematologic toxic effects in this trial arm was higher in patients treated with veliparib-carboplatin, with neutropenia rates of 71% versus 2% for controls. Adverse events occurring only in patients on veliparib-carboplatin were thrombocytopenia in 21%, anemia in 28%, and febrile neutropenia in 1%. Among patients who had received the combination, toxic effects were higher during doxorubicin-cyclophosphamide therapy.
HR-negative disease
Patients with hormone receptor–negative disease received standard neoadjuvant chemotherapy with 12 weekly cycles of paclitaxel followed by 4 cycles of doxorubicin and cyclophosphamide as described before, with or without oral neratinib 240 mg per day. Patients in the control group who had HER2-positive cancers also received trastuzumab for the first 12 weeks with a loading dose of 4 mg per kilogram of body weight in the first cycle, followed by a maintenance dose of 2 mg per kilogram in cycles 2 through 12.
Surgery, including sentinel-node dissection in patients with node-negative cancer and axillary-node dissection in those with node-positive cancer at diagnosis, was performed according to NCCN and local practice guidelines, and adjuvant radiation and endocrine therapy were recommended according to standard guidelines.
The protocol was modified to included diarrhea prophylaxis with loperamide among patients assigned to receive neratinib.
A total of 127 patients were assigned to neratinib, and 115 of these patients were evaluable for response. Controls included 84 patients, of whom 78 were evaluable. At baseline, more patients in the neratinib group had HER2-positive tumors. Neratinib reached the prespecified efficacy threshold only within the HER2-positive, HR-negative group.
Diarrhea was the most common adverse event, with grade 3 or greater diarrhea occurring among 38% of patients assigned to neratinib. Vomiting and elevated liver enzymes were also more frequent with neratinib.
I-SPY 2 is supported by QuantumLeap Healthcare Collaborative, the Foundation for the National Institutes of Health (from 2010 through 2012) and the National Cancer Institute. Dr. Park reported receiving lecture fees and travel support from Genentech and Pfizer, and receiving royalties from patents. Dr. Rugo reported grants to her institution from BioMarin, and unpaid steering committee participation for BioMarin and AbbVie. Multiple co-authors reported financial relationships of various kinds.
These two multicenter trials may ultimately lead to changes in treatment in the years ahead. The investigators created a collaborative culture around these studies, and the work that appears in the Journal would not have been possible absent that spirit of cooperation and collective creativity. However, these trials were not designed to predict the ultimate success of either neratinib or carboplatin-veliparib in improving disease-free or overall survival. Instead, they predict a positive result with the use of pathological complete response rate as an endpoint in a definitive neoadjuvant study.
Clinicians should remember that pathological complete response rate itself is not a clinically meaningful endpoint; its value is as a surrogate for outcome. Although pathological complete response rate is consistently associated with a decreased risk of relapse and death for individual patients, even substantial improvements in pathological complete response rate in neoadjuvant trials have not consistently translated into improvement in long-term outcomes. The reasons for this are myriad, including the molecular heterogeneity of breast cancer and the possible effect of postsurgical interventions. Most importantly, pathological complete response rate will correlate with survival outcomes only if the neoadjuvant agents leading to the improvement in pathological complete response also eradicate resistant tumor clones.
At this time, improvements in pathological complete response rates as reported in neoadjuvant studies – whether the studies are exploratory, such as I-SPY 2, or more definitive – should not change clinical practice; rather, we should wait for the definitive clinical trials that result from them. Nonetheless, standard neoadjuvant therapy remains a sound clinical approach with the potential to individualize therapy. It also remains a valuable research tool that has the potential to help us develop hypotheses and explore mechanisms of drug resistance.
Lisa A. Carey, MD., is with the UNC Lineberger Comprehensive Cancer Center, University of North Carolina at Chapel Hill, and Eric P. Winer, MD, is with the Breast Oncology Program, Dana-Farber Cancer Center, Boston. These comments are excerpted from an editorial (N Engl J Med. 2016 July 7. doi: 10.1056/NEJMe1603691).
Taking a step toward the goal of personalized medicine, investigators in the multicenter, adaptive I-SPY 2 trial report that tailoring neoadjuvant therapy combinations to specific cancer subtypes in women with high-risk breast cancer will likely result in higher rates of pathological complete responses for at least two subtypes, including patients with triple-negative disease.
Among women with triple-negative breast cancer (tumors lacking human epidermal growth factor receptor 2 [HER2], estrogen, and progesterone receptors) in the phase II trial, a combination of the poly (ADP-ribose) polymerase (PARP) inhibitor veliparib and carboplatin added to paclitaxel was associated with an estimated 51% pathological complete response (pCR) rate, compared with 26% for patients treated with weekly paclitaxel alone. The predicted probability of success in a phase III trial with the combination was 88%, reported Hope S. Rugo, MD, director of the Breast Oncology Clinical Trials Program at the University of California San Francisco, and her colleagues in I-SPY 2.
“The experience with veliparib-carboplatin in our trial shows the advantage of an adaptively randomized phase II platform trial for matching therapies with biomarker subsets to better inform the design of phase III trials so that they can be more focused, smaller, and faster. Future patients stand to benefit, but trial participants benefit as well in that exposure to ineffective therapy is minimized,” the investigators wrote (N Engl J Med. 2016 July 7. doi: 10.1056/NEJMoa1513749).
Partial results from this trial were reported at the 2013 San Antonio Breast Cancer Symposium.
On the basis of these phase II data, an ongoing phase III neoadjuvant trial is comparing standard chemotherapy alone, with carboplatin, or with veliparib plus carboplatin as treatment for triple-negative breast cancer, Dr. Rugo and her associates said.
In another arm of I-SPY 2 involving a subset of patients with HER2-positive, hormone receptor–negative cancers, the mean estimated pCR rate was 56% for patients treated with the investigational tyrosine-kinase inhibitor (TKI) neratinib, compared with an estimated 33% among patients treated with anti-HER2 agent trastuzumab (Herceptin). All the participants received standard neoadjuvant therapy, which consisted of 12 cycles of paclitaxel, followed by 4 cycles of doxorubicin and cyclophosphamide. The estimated probability of success in phase III with neratinib was 79%, reported John W. Park, MD, of University of California San Francisco, and his coauthors on behalf of I-SPY 2 investigators (N Engl J Med. 2016 July 7. doi: 10.1056/NEJMoa1513750).
On the basis of this phase II study, and to reflect the current standard of dual HER-targeting, the investigators are proceeding with a phase III trial comparing neratinib as neoadjuvant therapy added to pertuzumab (Perjeta), trastuzumab, and a taxane vs. the three latter drugs, and against a combination of neratinib, trastuzumab, and taxane, all followed by doxorubicin and cyclophosphamide.
Partial results of the phase II trial were reported at the 2013 annual meeting of the American Association for Cancer Research.
Nimble trial, tailored therapies
I-SPY 2 (Investigation of Serial Studies to Predict Your Therapeutic Response through Imaging and Molecular Analysis 2) is an ongoing “platform” trial exploring the use of new drugs combined with a standard neoadjuvant therapy backbone for the treatment of high-risk cancers.
Women with stage II or III breast cancers with tumors 2.5 cm or larger are assessed for one of eight biomarker subtypes according to HER2 (human epidermal growth factor receptor 2) status, hormone receptor status, and genetic risk factors based on a 70-gene assay. The patients are then randomized within each biomarker subtype to receive standard therapy with or without an investigational agent.
Each sub-trial has a primary endpoint of an improvement in pathological complete response compared with the standard of care. Changes in tumor volume on MRI are used to predict whether patients will achieve a pCR. Regimens that have a high Bayesian predictive probability of success in a subsequent phase III neoadjuvant trial within the biomarker signature in which they performed well are eligible for moving on to phase III trials.
Triple-negative disease
Among the subgroup of patients with triple-negative disease, 72 were assigned to receive veliparib 50 mg by mouth twice daily for 12 weeks, plus carboplatin at a dose intended to achieve a pharmacologic area under the concentration versus time curve of 6 mg/hour per liter on weeks 1, 4, 7, and 10, plus intravenous paclitaxel at a dose of 80 mg/m2. An additional 44 patients (controls) were randomized to receive paclitaxel alone.
Following paclitaxel alone or with the combination, all patients received doxorubicin 60 mg/m2 and cyclophosphamide 600 mg/m2 every 2-3 weeks for four doses, followed by myeloid growth factor support as appropriate. Following treatment, all patients underwent surgery that included axillary node sampling in accordance with National Comprehensive Cancer Network (NCCN) and local practice guidelines. Adjuvant radiation and endocrine therapy were recommended in accordance with standard guidelines.
The rate of grade 3 or greater hematologic toxic effects in this trial arm was higher in patients treated with veliparib-carboplatin, with neutropenia rates of 71% versus 2% for controls. Adverse events occurring only in patients on veliparib-carboplatin were thrombocytopenia in 21%, anemia in 28%, and febrile neutropenia in 1%. Among patients who had received the combination, toxic effects were higher during doxorubicin-cyclophosphamide therapy.
HR-negative disease
Patients with hormone receptor–negative disease received standard neoadjuvant chemotherapy with 12 weekly cycles of paclitaxel followed by 4 cycles of doxorubicin and cyclophosphamide as described before, with or without oral neratinib 240 mg per day. Patients in the control group who had HER2-positive cancers also received trastuzumab for the first 12 weeks with a loading dose of 4 mg per kilogram of body weight in the first cycle, followed by a maintenance dose of 2 mg per kilogram in cycles 2 through 12.
Surgery, including sentinel-node dissection in patients with node-negative cancer and axillary-node dissection in those with node-positive cancer at diagnosis, was performed according to NCCN and local practice guidelines, and adjuvant radiation and endocrine therapy were recommended according to standard guidelines.
The protocol was modified to included diarrhea prophylaxis with loperamide among patients assigned to receive neratinib.
A total of 127 patients were assigned to neratinib, and 115 of these patients were evaluable for response. Controls included 84 patients, of whom 78 were evaluable. At baseline, more patients in the neratinib group had HER2-positive tumors. Neratinib reached the prespecified efficacy threshold only within the HER2-positive, HR-negative group.
Diarrhea was the most common adverse event, with grade 3 or greater diarrhea occurring among 38% of patients assigned to neratinib. Vomiting and elevated liver enzymes were also more frequent with neratinib.
I-SPY 2 is supported by QuantumLeap Healthcare Collaborative, the Foundation for the National Institutes of Health (from 2010 through 2012) and the National Cancer Institute. Dr. Park reported receiving lecture fees and travel support from Genentech and Pfizer, and receiving royalties from patents. Dr. Rugo reported grants to her institution from BioMarin, and unpaid steering committee participation for BioMarin and AbbVie. Multiple co-authors reported financial relationships of various kinds.
FROM THE NEW ENGLAND JOURNAL OF MEDICINE
Key clinical point: Two neoadjuvant therapy combinations – one for triple negative breast cancer and one for HER2-positive breast cancer – have a high chance of success in a phase III trial, according to results of an adaptive phase II trial.
Major finding: The predicted probability of success in phase III trials with veliparib, carboplatin, and paclitaxel was 88% in patients with triple-negative breast cancer, and 79% with neratinib and standard chemotherapy for HER2-positive patients.
Data source: I-SPY 2, a multicenter, adaptive randomization study of patients with various subtypes of breast cancer.
Disclosures: I-SPY 2 is supported by QuantumLeap Healthcare Collaborative, the Foundation for the National Institutes of Health (from 2010 through 2012) and the National Cancer Institute. Dr. Park reported receiving lecture fees and travel support from Genentech and Pfizer, and receiving royalties from patents. Dr. Rugo reported grants to her institution from BioMarin, and unpaid steering committee participation for BioMarin and AbbVie. Multiple coauthors reported financial relationships of various kinds.