User login
Register Now for NP/PA Boot Camp

Dive into the most current evidence-based topics in hospital medicine, and earn up to 36 AAPA Category 1 CME credits at the same time. You’ll also have great opportunities to network with practitioners from around the country. During the course, you will:
• Learn the most current evidence-based clinical practice for key topics in hospital medicine
• Augment your knowledge base to enhance your existing hospital medicine practice
• Expand your knowledge to transition into hospital medicine practice
• Network with other practitioners from across the country
Learn more at www.aapa.org/bootcamp.

Hospital Medicine 2017: Learn, Stay, and Play

- Mandalay Bay Beach: The 43-story “seaside” resort boasts the spectacular 11-acre Mandalay Bay Beach, complete with 2,700 tons of real sand. Three pools, an exciting wave pool, and a quarter-mile lazy river provide a refreshing escape from the desert heat.
- Dining: With more than 20 diverse restaurants featuring eight celebrity chefs, Mandalay Bay features cuisine of all types and a world of flavors.
- Entertainment: Dance the night away at the Eyecandy Sound Lounge, or take in the spectacular Cirque du Soleil show.
For reservations, call 877-632-9001 and ask for SHM’s room block. Or reserve your room online at www.hospitalmedicine2017.org/hotel.
Become an SHM Ambassador for a Chance at Free Registration to HM17
Now through Dec. 31, all active SHM members can earn 2017–2018 dues credits and special recognition for recruiting new physician, physician assistant, nurse practitioner, pharmacist, or affiliate members.
Active members will be eligible for:
- A $35 credit toward 2017–2018 dues when recruiting 1 new member
- A $50 credit toward 2017–2018 dues when recruiting 2–4 new members
- A $75 credit toward 2017–2018 dues when recruiting 5–9 new members
- A $125 credit toward 2017–2018 dues when recruiting 10+ new members
For each member recruited, referrers will receive one entry into a grand-prize drawing to receive complimentary registration to HM17. For more information, visit www.hospitalmedicine.org/MAP.
PAs, NPs Seizing Key Leadership Roles in HM Groups, Health Systems
Since hospital medicine’s early days, hospitalist physicians have worked alongside physician assistants (PAs) and nurse practitioners (NPs). Some PAs and NPs have ascended to positions of leadership in their HM groups or health systems, in some cases even supervising the physicians.

The Hospitalist connected with six PA and NP leaders in hospital medicine to discuss their career paths as well as the nature and scope of their jobs. They described leadership as a complex, multidimensional concept, with often more of a collaborative model than a clear-cut supervisory relationship with clinicians. Most said they don’t try to be the “boss” of their group and have found ways to impact key decisions.
They also emphasized that PAs and NPs bring special skills and perspectives to team building. Many have supplemented frontline clinical experience with leadership training. And when it comes to decision making, their responsibilities can include hiring, scheduling, training, mentoring, information technology, quality improvement, and other essential functions of the group.
Edwin Lopez, MBA, PA-C

Workplace: St. Elizabeth is a 25-bed critical-access hospital serving a semi-rural bedroom community of 11,000 people an hour southeast of Seattle. It belongs to the nine-hospital CHI Franciscan Health system, and the HM group includes four physicians and four PAs providing 24-hour coverage. The physicians and PAs work in paired teams in the hospital and an 80-bed skilled nursing facility (SNF) across the street. Lopez heads St. Elizabeth’s HM group and is associate medical director of the SNF.
Background: Lopez graduated from the PA program at the University of Washington in 1982 and spent seven years as a PA with a cardiothoracic surgery practice in Tacoma. Then he established his own firm providing PA staffing services for six cardiac surgery programs in western Washington. In 1997, he co-founded an MD/PA hospitalist service covering three hospitals for a Seattle insurance company. That program grew into a larger group that was acquired by CHI Franciscan.
Lopez took time off to earn his MBA in health policy at the University of Washington and Harvard Kennedy School in Boston.
Eight years ago as part of an acquisition, CHI Franciscan asked Lopez to launch an HM program at St. Elizabeth. From the start, he developed the program as a collaborative model. The HM group now covers almost 90% of hospital admissions, manages the ICU, takes calls to admit patients from the ED, and rounds daily on patients in a small hospital that doesn’t have access to a lot of medical specialists.
St. Elizabeth’s has since flourished to become one of the health system’s top performers on quality metrics like HCAHPS (Hospital Consumer Assessment of Healthcare Providers and Systems) scores. However, Lopez admits readmission rates remain high. He noticed that a big part of the readmission problem was coming from the facility across the street, so he proposed the HM group start providing daily coverage to the SNF. In the group’s first year covering the SNF, the hospital’s readmission rate dropped to 5% from 35%.
Listen: Edwin Lopez, PA-C, discusses post-acute Care in the U.S. health system
Responsibilities: Lopez spends roughly half his time seeing patients, which he considers the most satisfying half. The other half is managing and setting clinical and administrative direction for the group.
“My responsibility is to ensure that there is appropriate physician and PA coverage 24-7 in both facilities,” he says, adding he also handles hiring and personnel issue. “We have an understanding here. I help guide, mentor, and direct the team, with the support of our regional medical director.”
The story: Lopez credits his current position to Joe Wilczek, a visionary CEO who came to the health system 18 years ago and retired in 2015.
“Joe and Franciscan’s chief medical officer and system director of hospital medicine came to me and said, ‘We’d like you to go over there and see what you can do at St. Elizabeth.’ There was a definite mandate, with markers they wanted me to reach. They said, ‘If you succeed, we will build you a new hospital building.’”
The new building opened in 2012.
Lopez says he has spent much of his career in quiet oblivion.
“It took five or six years here before people started noticing that our quality and performance were among the highest in the system,” he says. “For my entire 33-year career in medicine, I was never driven by the money. I grew up believing in service and got into medicine to make a difference, to leave a place better than I found it.”
He occasionally fields questions about his role as a PA group leader, which he tries to overcome by building trust, just as he overcame initial resistance to the hospital medicine program at St. Elizabeth from community physicians.
“I am very clear, we as a team are very clear, that we’re all worker bees here. We build strong relationships. We consider ourselves family,” he says. “When family issues come up, we need to sit down and talk about them, even when it may be uncomfortable.”
Laurie Benton, RN, MPAS, PhD, PA-C, DFAAPA

Workplace: Baylor Scott & White Health is the largest nonprofit health system in Texas, with 46 hospitals and 500 multispecialty clinics. Scott & White Memorial Hospital is a 636-bed specialty care and teaching hospital. Its hospital medicine program includes 40 physicians and 34 NP/PAs caring for an average daily census of 240 patients. They cover an observation service, consult service, and long-term acute-care service.
Background: Benton has a PhD in health administration. She has practiced hospital medicine at Scott & White Memorial Hospital since 2000 and before that at Emanuel Hospital in Portland, Ore. Currently an orthopedic hospitalist PA, she has worked in cardiothoracic surgery, critical care, and nephrology settings.
She became the system director for APPs in September 2013. In that role, she leads and represents 428 APPs, including hospitalist, intensivist, and cardiology PAs, in the system’s 26-hospital Central Region. She sits on the board of directors of the American Academy of Physician Assistants and has been on workforce committees for the National Commission on Certification of Physician Assistants and on the CME committee of the National Kidney Foundation.
Responsibilities: Benton coordinates everything, including PAs, advanced practice nurses, and nurse anesthetists, in settings across the healthcare continuum.
“I was appointed by our hospital medicine board and administration to be the APP leader. I report to the chief medical officer,” she says. “But I still see patients; it’s my passion. I’m not ready to give it up completely.”
Benton’s schedule includes two 10-hour clinical shifts per week. The other three days she works on administrative tasks. She attends board meetings as well as regular meetings with the system’s top executives and officers, including the chair of the board and the senior vice president for medical affairs.
“I have a seat on staff credentialing, benefits, and compensation committees, and I’m part of continuing medical education and disaster planning. Pretty much any of the committees we have here, I’m invited to be on,” she says. “I make sure I’m up-to-date on all of the new regulations and have information on any policies that have to do with APPs.”
The story: Benton says her PA training, including mentorship from Edwin Lopez, placed a strong emphasis on helping students develop leadership skills and interests.
“While I was working in nephrology, my supervising physician mentored me and encouraged me to move forward with my education,” she says. Along the way, she participated in a yearlong executive-education program and taught at the University of Texas McCombs School of Business. “Right off, it was not easy because while people saw me as a very strong, very confident provider, they didn’t see me as an administrator. When I worked with administrators, they were speaking a different language. I’d speak medicine, and they’d speak administration. It took a while to learn how to communicate with them.”
She says non-physician professionals traditionally have reported up through a physician and “never had their own voice. … Now that we have our leadership ladder here, it’s still new to some administrators,” she says. “I want to make sure PAs are part of the solution to high-quality healthcare.
“When I’m at the leadership table, we’re working together. The physicians respect my opinion, giving me the opportunity to interact like anyone else at the table.”
Catherine Boyd, MS, PA-C

Workplace: Essex is a private hospitalist group founded in 2007 by James Tollman, MD, FHM, who remains its CEO. It has 34 clinical members, including 16 physicians, 12 PAs, and six NPs. It began providing hospitalist medical care to several hospitals on Massachusetts’ North Shore under contract, then to a psychiatric hospital and a detox treatment center. In recent years, it has expanded into the post-acute arena, providing coverage to 14 SNFs, which now constitute the majority of its business. It also is active with two accountable-care organization networks.
Background: After three years as a respiratory therapist, Boyd enrolled in a PA program at Massachusetts College of Pharmacy and Health Sciences. After graduating in 2005, she worked as a hospitalist and intensivist, including as team leader for the medical emergency team at Lahey Health & Medical Center in Burlington, Mass., and in the PACE (Program of All-Inclusive Care for the Elderly) Internal Medical Department with Partners HealthCare until mid-2014, when she was invited to join Essex.
Responsibilities: “This job is not one thing; I dabble in everything,” says Boyd, who describes herself as the group’s chief operating officer for professional affairs. “I provide direct supervision to our PAs and NPs but also to our independent contractors, including moonlighting physicians. And I help to supervise the full-time physicians.”
She works on system issues, on-site training and mentorship, and implementation of a new electronic health record (EHR) and charge capture system while trying to improve bed flow and quality and decrease clinicians’ job frustrations. She also monitors developments in Medicare regulations.
“I check in with every one of our full-time providers weekly, and I try to offset some of the minutiae of their workday so that they can focus on their patients,” she explains. “Dr. Tollman and I feel that we bring a healthy work-lifestyle balance to the group. We encourage that in our staff. If they are happy in their jobs, it makes quality of care better.”
Boyd also maintains a clinical practice as a hospitalist, with her clinical duties flexing up and down based on patient demand and management needs.
The story: When Boyd was a respiratory therapist at a small community hospital, she worked one-on-one with a physician assistant who inspired her to change careers.
“I really liked what she did. As a PA, I worked to broaden my skill set on a critical care service for seven years,” she says. “But then my two kids got older and I wanted a more flexible schedule. Dr. Tollman came across my résumé when he was looking for a clinician to run operations for Essex.”
Building on 10 years of clinical experience, Boyd has tried to earn the trust of the other clinicians.
“They know they can come to me with questions. I like to think I practice active listening. When there is a problem, I do a case review and try to get all the facts,” she says. “When you earn their trust, the credentials tend to fall away, especially with the doctors I work with on a daily basis.”
Daniel Ladd, PA-C, DFAAPA

Workplace: Founded in 1993 as Hospitalists of Northern Michigan, iNDIGO Health Partners is one of the country’s largest private hospitalist companies, employing 150 physicians, PAs, and NPs who practice at seven hospitals across the state. The program also provides nighttime hospitalist services via telehealth and pediatric hospital medicine. It recently added 10 post-acute providers to work in SNFs and assisted living facilities.
Background: While working as a nurse’s aide, meeting and being inspired by some of the earliest PAs in Michigan, Ladd pursued PA training at Mercy College in Detroit. After graduating in 1984, he was hired by a cardiology practice at Detroit Medical Center. When he moved upstate to Traverse City in 1997, he landed a position as lead PA at another cardiology practice, acting as its liaison to PAs in the hospital. He joined iNDIGO in 2006.
“Jim Levy, one of the first PA hospitalists in Michigan, was an integral part of founding iNDIGO and now is our vice president of human resources,” Ladd says. “He asked me to join iNDIGO, and I jumped at the chance. Hospital medicine was a new opportunity for me and one with more opportunities for PAs to advance than cardiology.”
In 2009, when the company reorganized, the firm’s leadership recognized the need to establish a liaison group as a buffer between the providers and the company. Ladd became president of its new board of managers.
“From there, my position evolved to what it is today,” he says.
Levy calls Ladd a role model and leader, with great credibility among site program directors, hospital CMOs, and providers.
Responsibilities: Ladd gave up his clinical practice as a hospitalist in 2014 in response to growing management responsibilities.
“I do and I don’t miss it,” he says. “I miss the camaraderie of clinical practice, the foxhole mentality on the front lines. But I feel where I am now that I am able to help our providers give better care.
“Concretely, what I do is to help our practitioners and our medical directors at the clinical sites, some of whom are PAs and NPs, supporting them with leadership and education. I listen to their issues, translating and bringing to bear the resources of our company.”
Those resources include staffing, working conditions, office space, and the application of mobile medical technology for billing and clinical decision support.
“A lot of my communication is via email. I feel I am able to make a point without being inflammatory, by stating my purpose—the rationale for my position—and asking for what I need,” Ladd says. “This role is very accepted at iNDIGO. The corollary is that physician leaders who report to me are also comfortable in our relationship. It’s not about me being a PA and them being physicians but about us being colleagues in medicine.
“I’m in a position where I understand their world and am able to help them.”
The story: Encouraged by what he calls “visionary” leaders, Ladd has taken a number of steps to ascend to his current position as chief clinical officer.
“Even going back to the Boy Scouts, I was always one to step forward and volunteer for leadership,” he says. “I was president of my PA class in college and involved with the state association of PAs, as well as taking leadership training through the American Academy of Physician Assistants. I had the good fortune to be hired by a brilliant cardiologist at Detroit Medical Center. … He was the first to encourage me to be not just an excellent clinician but also a leader. He got me involved in implementing the EHR and in medication reconciliation. He promoted me as a PA to his patients and allowed me to become the face of our clinical practice, running the clinical side of the practice.”
Ladd also credits iNDIGO’s leaders for an approach of hiring the best people regardless of degree.
“If they happen to be PAs, great. The company’s vision is to have people with vision and skills to lead, not just based on credentials,” he says. “They established that as a baseline, and now it’s the culture here. We have PAs who are key drivers of the efficiency of this program.”
It hasn’t eliminated the occasional “I’m the physician, I’m delegating to you, and you have to do what I say,” Ladd admits. But he knows handling those situations is part of his job as a practice leader.
“It requires patience and understanding and the ability to see the issue from multiple perspectives,” he says, “and then synthesize all of that into a reasonable solution for all concerned.”
Arnold Facklam III, MSN, FNP-BC, FHM

Workplace: United Memorial has 100 beds and is part of the four-hospital Rochester Regional Health System. Kaleida Health has four acute-care hospitals in western New York. Based an hour apart, they compete, but both now get hospitalist services from Infinity Health Hospitalists of Western New York, a hospitalist group of 30 to 35 providers privately owned by local hospitalist John Patti, MD.
Background: Facklam has been a nocturnist since 2009, when he completed an NP program at D’Youville College in Buffalo. He worked 15 to 17 night shifts a month, first at Kaleida’s DeGraff Memorial Hospital and then at United Memorial, starting in 2013 as a per diem and vacation fill-in, then full-time since 2015. He now works for Infinity Health Hospitalists.
While working as a hospitalist, Facklam became involved with the MSO of Kaleida Health, starting on its Advanced Practice Provider Committee, which represents more than 600 NPs and PAs. Now chair of the committee, he leads change in the scope of practice for NPs and PAs and acts as liaison between APPs and the hospitals and health system.
Responsibilities: As a full-time nocturnist, Facklam has to squeeze in time for his role as director of advanced practice providers. He offers guidance and oversight, under the direction of the vice president of medical affairs, to all NPs, PAs, nurse midwives, and nurse anesthetists. He also is in charge of its rapid response and code blue team coverage at night, plus provides clinical education to family practice medical students and residents overnight in the hospital. He has worked on hospital quality improvement projects since 2012.
Facklam, who acknowledges type A personality tendencies, also maintains two to three night shifts per month at Kaleida’s Millard Suburban Hospital.
In 2012, he became a member, eventually a voting member, of Kaleida’s system-wide MSO Medical Executive Committee, which is responsible for rule making, disciplinary action, and the provision of medical care within the system.
“The MSO is the mechanism for accountability for professional practice,” he says. He is also active in SHM’s NP/PA Committee and now sits on SHM’s Public Policy Committee.
The story: “Working as a nocturnist has given me the flexibility to look into advanced management training,” he says, including Six Sigma green belt course work and certificate training. While at DeGraff, he heard about a call for membership on the NP/PA committee.
“They quickly realized the benefits of having someone with a background like mine on board,” he said. “As a nocturnist, I started going to more meetings and getting involved when the easier thing to do might have been to drive home and go to bed.”
Along the way, he learned a lot about hospital systems and how they work.
“Having been in healthcare for 23 years, I know the hierarchical approach,” Facklam says. “But the times are changing. As medicine becomes broader and more difficult to manage, it has to become more of a team approach. If you look at the data, there won’t be enough physicians in the near future. PAs and NPs can help fill that need.”
Crystal Therrien, MS, ACNP-BC

Workplace: UMass Medical Center encompasses three campuses in central Massachusetts, including University, Memorial, and Marlborough. The hospital medicine division covers all three campuses with 40 to 45 FTEs of physicians and 20 of APPs. Therrien has been with the department since October 2009—her first job after completing NP training—and assumed her leadership role in June 2012.
Responsibilities: Therrien supervises the UMass hospital medicine division’s Affiliate Practitioner Group. She works with physicians on the executive council, coordinates the medicine service, and coordinates cross-coverage with other services in the hospital, including urology, neurology, surgery, GI, interventional radiology, and bone marrow transplants.
Hospitalist staff work 12-hour shifts, providing 24-hour coverage in the hospital, with one physician and two APPs scheduled at night.
“Because we are available 24-7 in house, I work closely with our scheduler. There is also a lot of coordination with subspecialty services in the hospital and on the observation unit,” she says. “I’m also responsible for interviewing and hiring AP candidates, including credentialing, and with the mentorship program. I chair the rapid response program and host our monthly staff meetings,” which involve both business and didactic presentations. She also serves on the hospital’s NP advisory council.
Before Therrien became the lead NP, her predecessor was assigned at 5% administrative.
“I started out 25% administrative because the program has expanded so quickly,” she says, noting that now she is 50% clinic and 50% administrative. “To be a good leader, I think I need to keep my feet on the ground in patient care.”
The story: Therrien worked as an EMT, a volunteer firefighter, and an ED tech before pursuing a degree in nursing.
“I grew up in a house where my dad was a firefighter and my mom was an EMT,” she says. “We were taught the importance of helping others and being selfless. I always had a leadership mentality.”
Therrien credits her physician colleagues for their commitment and support.
“It can be a little more difficult outside of our department,” she says. “They don’t always understand my role. Some of the attendings have not worked with affiliated providers before, but they have worked with residents. So there’s an interesting dynamic for them to learn how to work with us.”
Kimberly Eisenstock, MD, FHM, the clinical chief of hospital medicine, says that when she was looking for someone new to lead the affiliated practitioners, she wanted “a leader who understood their training and where they could be best utilized. Crystal volunteered. Boy, did she! She was the most experienced and enthusiastic candidate, with the most people-oriented skills.”
Dr. Eisenstock says she doesn’t start new roles or programs for the affiliated practitioners without getting the green light from Therrien.
“Crystal now represents the voice for how the division decides to employ APPs and the strategies we use to fill various roles,” she says. TH
Larry Beresford is a freelance writer in Alameda, Calif.
How NPs, PAs Can Prepare for Greater Leadership Roles
Michael Huckabee, MPAS, PhD, PA-C, is director of the Division of Physician Assistant Education at the University of Nebraska Medical Center in Omaha, where he trains both entry-level students and mid-career practitioners pursuing distance learning.
“When PAs are group leaders, they need to have the ability and orientation to involve all of their physicians in decision making,” Huckabee says. “This is a collaborative model of leadership. A term we use in leadership training is called ‘persuasive mapping’—the ability to influence others through reasoning to do something greater.”
What does Huckabee look for in students who might have a knack for leadership but could use a nudge in that direction?
“It’s a person who is somewhat gregarious and who builds strong relationships with others. They come to him or her for advice and ideas. But also with some level of humility—aware and accepting of personal limitations. These are the folks where we can say, ‘Let’s talk about your leadership skills and where we can strengthen you to be better prepared for the opportunities that can come up,’” he explains.
Huckabee says PAs need to get their names into consideration for opportunities on hospital committees such as pharmacy, credentialing, or ethics.
“You have to be well-versed about where you fit as a professional, relative to other advanced practitioners, and how the system works,” he says. “You have to be at the table, looking for opportunities to move the organization forward.”
Laurie Benton, PhD, MPAS, PA-C, RN, DFAAPA, who is the system director of advanced practice professionals for the Baylor Scott & White Health in Dallas, offers some additional advice for PAs and NPs who would like to rise to positions of leadership in their hospital groups or health systems.
“I recommend taking as many leadership classes as your facility offers,” she says. “Also consider taking outside leadership courses and even getting a second degree in business.”
Benton also says NPs and PAs should get involved in state and national professional and specialty associations. For example, the National Commission on Certification of Physician Assistants now offers a certificate of added qualifications in hospital medicine.
“That is where you will learn a great deal about laws that govern PAs and upcoming legislation that could affect what PAs are allowed to do and how they get paid,” she says, as well as the credentialing and boarding of PAs and NPs, which vary from state to state and from hospital to hospital.
—Larry Beresford
Since hospital medicine’s early days, hospitalist physicians have worked alongside physician assistants (PAs) and nurse practitioners (NPs). Some PAs and NPs have ascended to positions of leadership in their HM groups or health systems, in some cases even supervising the physicians.
The Hospitalist connected with six PA and NP leaders in hospital medicine to discuss their career paths as well as the nature and scope of their jobs. They described leadership as a complex, multidimensional concept, with often more of a collaborative model than a clear-cut supervisory relationship with clinicians. Most said they don’t try to be the “boss” of their group and have found ways to impact key decisions.
They also emphasized that PAs and NPs bring special skills and perspectives to team building. Many have supplemented frontline clinical experience with leadership training. And when it comes to decision making, their responsibilities can include hiring, scheduling, training, mentoring, information technology, quality improvement, and other essential functions of the group.
Edwin Lopez, MBA, PA-C
Workplace: St. Elizabeth is a 25-bed critical-access hospital serving a semi-rural bedroom community of 11,000 people an hour southeast of Seattle. It belongs to the nine-hospital CHI Franciscan Health system, and the HM group includes four physicians and four PAs providing 24-hour coverage. The physicians and PAs work in paired teams in the hospital and an 80-bed skilled nursing facility (SNF) across the street. Lopez heads St. Elizabeth’s HM group and is associate medical director of the SNF.
Background: Lopez graduated from the PA program at the University of Washington in 1982 and spent seven years as a PA with a cardiothoracic surgery practice in Tacoma. Then he established his own firm providing PA staffing services for six cardiac surgery programs in western Washington. In 1997, he co-founded an MD/PA hospitalist service covering three hospitals for a Seattle insurance company. That program grew into a larger group that was acquired by CHI Franciscan.
Lopez took time off to earn his MBA in health policy at the University of Washington and Harvard Kennedy School in Boston.
Eight years ago as part of an acquisition, CHI Franciscan asked Lopez to launch an HM program at St. Elizabeth. From the start, he developed the program as a collaborative model. The HM group now covers almost 90% of hospital admissions, manages the ICU, takes calls to admit patients from the ED, and rounds daily on patients in a small hospital that doesn’t have access to a lot of medical specialists.
St. Elizabeth’s has since flourished to become one of the health system’s top performers on quality metrics like HCAHPS (Hospital Consumer Assessment of Healthcare Providers and Systems) scores. However, Lopez admits readmission rates remain high. He noticed that a big part of the readmission problem was coming from the facility across the street, so he proposed the HM group start providing daily coverage to the SNF. In the group’s first year covering the SNF, the hospital’s readmission rate dropped to 5% from 35%.
Listen: Edwin Lopez, PA-C, discusses post-acute Care in the U.S. health system
Responsibilities: Lopez spends roughly half his time seeing patients, which he considers the most satisfying half. The other half is managing and setting clinical and administrative direction for the group.
“My responsibility is to ensure that there is appropriate physician and PA coverage 24-7 in both facilities,” he says, adding he also handles hiring and personnel issue. “We have an understanding here. I help guide, mentor, and direct the team, with the support of our regional medical director.”
The story: Lopez credits his current position to Joe Wilczek, a visionary CEO who came to the health system 18 years ago and retired in 2015.
“Joe and Franciscan’s chief medical officer and system director of hospital medicine came to me and said, ‘We’d like you to go over there and see what you can do at St. Elizabeth.’ There was a definite mandate, with markers they wanted me to reach. They said, ‘If you succeed, we will build you a new hospital building.’”
The new building opened in 2012.
Lopez says he has spent much of his career in quiet oblivion.
“It took five or six years here before people started noticing that our quality and performance were among the highest in the system,” he says. “For my entire 33-year career in medicine, I was never driven by the money. I grew up believing in service and got into medicine to make a difference, to leave a place better than I found it.”
He occasionally fields questions about his role as a PA group leader, which he tries to overcome by building trust, just as he overcame initial resistance to the hospital medicine program at St. Elizabeth from community physicians.
“I am very clear, we as a team are very clear, that we’re all worker bees here. We build strong relationships. We consider ourselves family,” he says. “When family issues come up, we need to sit down and talk about them, even when it may be uncomfortable.”
Laurie Benton, RN, MPAS, PhD, PA-C, DFAAPA
Workplace: Baylor Scott & White Health is the largest nonprofit health system in Texas, with 46 hospitals and 500 multispecialty clinics. Scott & White Memorial Hospital is a 636-bed specialty care and teaching hospital. Its hospital medicine program includes 40 physicians and 34 NP/PAs caring for an average daily census of 240 patients. They cover an observation service, consult service, and long-term acute-care service.
Background: Benton has a PhD in health administration. She has practiced hospital medicine at Scott & White Memorial Hospital since 2000 and before that at Emanuel Hospital in Portland, Ore. Currently an orthopedic hospitalist PA, she has worked in cardiothoracic surgery, critical care, and nephrology settings.
She became the system director for APPs in September 2013. In that role, she leads and represents 428 APPs, including hospitalist, intensivist, and cardiology PAs, in the system’s 26-hospital Central Region. She sits on the board of directors of the American Academy of Physician Assistants and has been on workforce committees for the National Commission on Certification of Physician Assistants and on the CME committee of the National Kidney Foundation.
Responsibilities: Benton coordinates everything, including PAs, advanced practice nurses, and nurse anesthetists, in settings across the healthcare continuum.
“I was appointed by our hospital medicine board and administration to be the APP leader. I report to the chief medical officer,” she says. “But I still see patients; it’s my passion. I’m not ready to give it up completely.”
Benton’s schedule includes two 10-hour clinical shifts per week. The other three days she works on administrative tasks. She attends board meetings as well as regular meetings with the system’s top executives and officers, including the chair of the board and the senior vice president for medical affairs.
“I have a seat on staff credentialing, benefits, and compensation committees, and I’m part of continuing medical education and disaster planning. Pretty much any of the committees we have here, I’m invited to be on,” she says. “I make sure I’m up-to-date on all of the new regulations and have information on any policies that have to do with APPs.”
The story: Benton says her PA training, including mentorship from Edwin Lopez, placed a strong emphasis on helping students develop leadership skills and interests.
“While I was working in nephrology, my supervising physician mentored me and encouraged me to move forward with my education,” she says. Along the way, she participated in a yearlong executive-education program and taught at the University of Texas McCombs School of Business. “Right off, it was not easy because while people saw me as a very strong, very confident provider, they didn’t see me as an administrator. When I worked with administrators, they were speaking a different language. I’d speak medicine, and they’d speak administration. It took a while to learn how to communicate with them.”
She says non-physician professionals traditionally have reported up through a physician and “never had their own voice. … Now that we have our leadership ladder here, it’s still new to some administrators,” she says. “I want to make sure PAs are part of the solution to high-quality healthcare.
“When I’m at the leadership table, we’re working together. The physicians respect my opinion, giving me the opportunity to interact like anyone else at the table.”
Catherine Boyd, MS, PA-C
Workplace: Essex is a private hospitalist group founded in 2007 by James Tollman, MD, FHM, who remains its CEO. It has 34 clinical members, including 16 physicians, 12 PAs, and six NPs. It began providing hospitalist medical care to several hospitals on Massachusetts’ North Shore under contract, then to a psychiatric hospital and a detox treatment center. In recent years, it has expanded into the post-acute arena, providing coverage to 14 SNFs, which now constitute the majority of its business. It also is active with two accountable-care organization networks.
Background: After three years as a respiratory therapist, Boyd enrolled in a PA program at Massachusetts College of Pharmacy and Health Sciences. After graduating in 2005, she worked as a hospitalist and intensivist, including as team leader for the medical emergency team at Lahey Health & Medical Center in Burlington, Mass., and in the PACE (Program of All-Inclusive Care for the Elderly) Internal Medical Department with Partners HealthCare until mid-2014, when she was invited to join Essex.
Responsibilities: “This job is not one thing; I dabble in everything,” says Boyd, who describes herself as the group’s chief operating officer for professional affairs. “I provide direct supervision to our PAs and NPs but also to our independent contractors, including moonlighting physicians. And I help to supervise the full-time physicians.”
She works on system issues, on-site training and mentorship, and implementation of a new electronic health record (EHR) and charge capture system while trying to improve bed flow and quality and decrease clinicians’ job frustrations. She also monitors developments in Medicare regulations.
“I check in with every one of our full-time providers weekly, and I try to offset some of the minutiae of their workday so that they can focus on their patients,” she explains. “Dr. Tollman and I feel that we bring a healthy work-lifestyle balance to the group. We encourage that in our staff. If they are happy in their jobs, it makes quality of care better.”
Boyd also maintains a clinical practice as a hospitalist, with her clinical duties flexing up and down based on patient demand and management needs.
The story: When Boyd was a respiratory therapist at a small community hospital, she worked one-on-one with a physician assistant who inspired her to change careers.
“I really liked what she did. As a PA, I worked to broaden my skill set on a critical care service for seven years,” she says. “But then my two kids got older and I wanted a more flexible schedule. Dr. Tollman came across my résumé when he was looking for a clinician to run operations for Essex.”
Building on 10 years of clinical experience, Boyd has tried to earn the trust of the other clinicians.
“They know they can come to me with questions. I like to think I practice active listening. When there is a problem, I do a case review and try to get all the facts,” she says. “When you earn their trust, the credentials tend to fall away, especially with the doctors I work with on a daily basis.”
Daniel Ladd, PA-C, DFAAPA
Workplace: Founded in 1993 as Hospitalists of Northern Michigan, iNDIGO Health Partners is one of the country’s largest private hospitalist companies, employing 150 physicians, PAs, and NPs who practice at seven hospitals across the state. The program also provides nighttime hospitalist services via telehealth and pediatric hospital medicine. It recently added 10 post-acute providers to work in SNFs and assisted living facilities.
Background: While working as a nurse’s aide, meeting and being inspired by some of the earliest PAs in Michigan, Ladd pursued PA training at Mercy College in Detroit. After graduating in 1984, he was hired by a cardiology practice at Detroit Medical Center. When he moved upstate to Traverse City in 1997, he landed a position as lead PA at another cardiology practice, acting as its liaison to PAs in the hospital. He joined iNDIGO in 2006.
“Jim Levy, one of the first PA hospitalists in Michigan, was an integral part of founding iNDIGO and now is our vice president of human resources,” Ladd says. “He asked me to join iNDIGO, and I jumped at the chance. Hospital medicine was a new opportunity for me and one with more opportunities for PAs to advance than cardiology.”
In 2009, when the company reorganized, the firm’s leadership recognized the need to establish a liaison group as a buffer between the providers and the company. Ladd became president of its new board of managers.
“From there, my position evolved to what it is today,” he says.
Levy calls Ladd a role model and leader, with great credibility among site program directors, hospital CMOs, and providers.
Responsibilities: Ladd gave up his clinical practice as a hospitalist in 2014 in response to growing management responsibilities.
“I do and I don’t miss it,” he says. “I miss the camaraderie of clinical practice, the foxhole mentality on the front lines. But I feel where I am now that I am able to help our providers give better care.
“Concretely, what I do is to help our practitioners and our medical directors at the clinical sites, some of whom are PAs and NPs, supporting them with leadership and education. I listen to their issues, translating and bringing to bear the resources of our company.”
Those resources include staffing, working conditions, office space, and the application of mobile medical technology for billing and clinical decision support.
“A lot of my communication is via email. I feel I am able to make a point without being inflammatory, by stating my purpose—the rationale for my position—and asking for what I need,” Ladd says. “This role is very accepted at iNDIGO. The corollary is that physician leaders who report to me are also comfortable in our relationship. It’s not about me being a PA and them being physicians but about us being colleagues in medicine.
“I’m in a position where I understand their world and am able to help them.”
The story: Encouraged by what he calls “visionary” leaders, Ladd has taken a number of steps to ascend to his current position as chief clinical officer.
“Even going back to the Boy Scouts, I was always one to step forward and volunteer for leadership,” he says. “I was president of my PA class in college and involved with the state association of PAs, as well as taking leadership training through the American Academy of Physician Assistants. I had the good fortune to be hired by a brilliant cardiologist at Detroit Medical Center. … He was the first to encourage me to be not just an excellent clinician but also a leader. He got me involved in implementing the EHR and in medication reconciliation. He promoted me as a PA to his patients and allowed me to become the face of our clinical practice, running the clinical side of the practice.”
Ladd also credits iNDIGO’s leaders for an approach of hiring the best people regardless of degree.
“If they happen to be PAs, great. The company’s vision is to have people with vision and skills to lead, not just based on credentials,” he says. “They established that as a baseline, and now it’s the culture here. We have PAs who are key drivers of the efficiency of this program.”
It hasn’t eliminated the occasional “I’m the physician, I’m delegating to you, and you have to do what I say,” Ladd admits. But he knows handling those situations is part of his job as a practice leader.
“It requires patience and understanding and the ability to see the issue from multiple perspectives,” he says, “and then synthesize all of that into a reasonable solution for all concerned.”
Arnold Facklam III, MSN, FNP-BC, FHM
Workplace: United Memorial has 100 beds and is part of the four-hospital Rochester Regional Health System. Kaleida Health has four acute-care hospitals in western New York. Based an hour apart, they compete, but both now get hospitalist services from Infinity Health Hospitalists of Western New York, a hospitalist group of 30 to 35 providers privately owned by local hospitalist John Patti, MD.
Background: Facklam has been a nocturnist since 2009, when he completed an NP program at D’Youville College in Buffalo. He worked 15 to 17 night shifts a month, first at Kaleida’s DeGraff Memorial Hospital and then at United Memorial, starting in 2013 as a per diem and vacation fill-in, then full-time since 2015. He now works for Infinity Health Hospitalists.
While working as a hospitalist, Facklam became involved with the MSO of Kaleida Health, starting on its Advanced Practice Provider Committee, which represents more than 600 NPs and PAs. Now chair of the committee, he leads change in the scope of practice for NPs and PAs and acts as liaison between APPs and the hospitals and health system.
Responsibilities: As a full-time nocturnist, Facklam has to squeeze in time for his role as director of advanced practice providers. He offers guidance and oversight, under the direction of the vice president of medical affairs, to all NPs, PAs, nurse midwives, and nurse anesthetists. He also is in charge of its rapid response and code blue team coverage at night, plus provides clinical education to family practice medical students and residents overnight in the hospital. He has worked on hospital quality improvement projects since 2012.
Facklam, who acknowledges type A personality tendencies, also maintains two to three night shifts per month at Kaleida’s Millard Suburban Hospital.
In 2012, he became a member, eventually a voting member, of Kaleida’s system-wide MSO Medical Executive Committee, which is responsible for rule making, disciplinary action, and the provision of medical care within the system.
“The MSO is the mechanism for accountability for professional practice,” he says. He is also active in SHM’s NP/PA Committee and now sits on SHM’s Public Policy Committee.
The story: “Working as a nocturnist has given me the flexibility to look into advanced management training,” he says, including Six Sigma green belt course work and certificate training. While at DeGraff, he heard about a call for membership on the NP/PA committee.
“They quickly realized the benefits of having someone with a background like mine on board,” he said. “As a nocturnist, I started going to more meetings and getting involved when the easier thing to do might have been to drive home and go to bed.”
Along the way, he learned a lot about hospital systems and how they work.
“Having been in healthcare for 23 years, I know the hierarchical approach,” Facklam says. “But the times are changing. As medicine becomes broader and more difficult to manage, it has to become more of a team approach. If you look at the data, there won’t be enough physicians in the near future. PAs and NPs can help fill that need.”
Crystal Therrien, MS, ACNP-BC
Workplace: UMass Medical Center encompasses three campuses in central Massachusetts, including University, Memorial, and Marlborough. The hospital medicine division covers all three campuses with 40 to 45 FTEs of physicians and 20 of APPs. Therrien has been with the department since October 2009—her first job after completing NP training—and assumed her leadership role in June 2012.
Responsibilities: Therrien supervises the UMass hospital medicine division’s Affiliate Practitioner Group. She works with physicians on the executive council, coordinates the medicine service, and coordinates cross-coverage with other services in the hospital, including urology, neurology, surgery, GI, interventional radiology, and bone marrow transplants.
Hospitalist staff work 12-hour shifts, providing 24-hour coverage in the hospital, with one physician and two APPs scheduled at night.
“Because we are available 24-7 in house, I work closely with our scheduler. There is also a lot of coordination with subspecialty services in the hospital and on the observation unit,” she says. “I’m also responsible for interviewing and hiring AP candidates, including credentialing, and with the mentorship program. I chair the rapid response program and host our monthly staff meetings,” which involve both business and didactic presentations. She also serves on the hospital’s NP advisory council.
Before Therrien became the lead NP, her predecessor was assigned at 5% administrative.
“I started out 25% administrative because the program has expanded so quickly,” she says, noting that now she is 50% clinic and 50% administrative. “To be a good leader, I think I need to keep my feet on the ground in patient care.”
The story: Therrien worked as an EMT, a volunteer firefighter, and an ED tech before pursuing a degree in nursing.
“I grew up in a house where my dad was a firefighter and my mom was an EMT,” she says. “We were taught the importance of helping others and being selfless. I always had a leadership mentality.”
Therrien credits her physician colleagues for their commitment and support.
“It can be a little more difficult outside of our department,” she says. “They don’t always understand my role. Some of the attendings have not worked with affiliated providers before, but they have worked with residents. So there’s an interesting dynamic for them to learn how to work with us.”
Kimberly Eisenstock, MD, FHM, the clinical chief of hospital medicine, says that when she was looking for someone new to lead the affiliated practitioners, she wanted “a leader who understood their training and where they could be best utilized. Crystal volunteered. Boy, did she! She was the most experienced and enthusiastic candidate, with the most people-oriented skills.”
Dr. Eisenstock says she doesn’t start new roles or programs for the affiliated practitioners without getting the green light from Therrien.
“Crystal now represents the voice for how the division decides to employ APPs and the strategies we use to fill various roles,” she says. TH
Larry Beresford is a freelance writer in Alameda, Calif.
How NPs, PAs Can Prepare for Greater Leadership Roles
Michael Huckabee, MPAS, PhD, PA-C, is director of the Division of Physician Assistant Education at the University of Nebraska Medical Center in Omaha, where he trains both entry-level students and mid-career practitioners pursuing distance learning.
“When PAs are group leaders, they need to have the ability and orientation to involve all of their physicians in decision making,” Huckabee says. “This is a collaborative model of leadership. A term we use in leadership training is called ‘persuasive mapping’—the ability to influence others through reasoning to do something greater.”
What does Huckabee look for in students who might have a knack for leadership but could use a nudge in that direction?
“It’s a person who is somewhat gregarious and who builds strong relationships with others. They come to him or her for advice and ideas. But also with some level of humility—aware and accepting of personal limitations. These are the folks where we can say, ‘Let’s talk about your leadership skills and where we can strengthen you to be better prepared for the opportunities that can come up,’” he explains.
Huckabee says PAs need to get their names into consideration for opportunities on hospital committees such as pharmacy, credentialing, or ethics.
“You have to be well-versed about where you fit as a professional, relative to other advanced practitioners, and how the system works,” he says. “You have to be at the table, looking for opportunities to move the organization forward.”
Laurie Benton, PhD, MPAS, PA-C, RN, DFAAPA, who is the system director of advanced practice professionals for the Baylor Scott & White Health in Dallas, offers some additional advice for PAs and NPs who would like to rise to positions of leadership in their hospital groups or health systems.
“I recommend taking as many leadership classes as your facility offers,” she says. “Also consider taking outside leadership courses and even getting a second degree in business.”
Benton also says NPs and PAs should get involved in state and national professional and specialty associations. For example, the National Commission on Certification of Physician Assistants now offers a certificate of added qualifications in hospital medicine.
“That is where you will learn a great deal about laws that govern PAs and upcoming legislation that could affect what PAs are allowed to do and how they get paid,” she says, as well as the credentialing and boarding of PAs and NPs, which vary from state to state and from hospital to hospital.
—Larry Beresford

Mutations may be a ‘missing link’ in AML
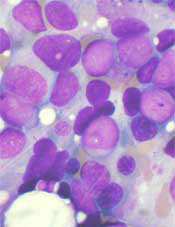
Research published in Nature Communications suggests that mutations in the ZBTB7A gene are associated with t(8;21)-rearranged acute myeloid leukemia (AML).
Investigators believe these mutations may be one of the “missing links” in RUNX1/RUNX1T1-driven leukemogenesis.
The team analyzed samples from 56 patients with t(8;21)-rearranged AML and identified recurring ZBTB7A mutations in 23% of those samples.
This included missense and truncating mutations that resulted in alteration or loss of the C-terminal zinc-finger domain of ZBTB7A.
The investigators noted that the transcription factor ZBTB7A is important for hematopoietic lineage fate decisions and for the regulation of glycolysis.
So the team was not surprised to find that ZBTB7A mutations boosted the energy metabolism in leukemia cells.
“In healthy cells, the active ZBTB7A gene acts like a parking brake on metabolism,” said study author Philipp Greif, MD, of Ludwig-Maximilians-Universität München in Munich, Germany.
“If the gene is defective, cancer cells get more energy to use for proliferation.”
Dr Greif and his colleagues also found they could reduce the growth rate of AML cells by increasing levels of active ZBTB7A.
And the team observed an indication of ZBTB7A’s growth-inhibiting effects in the clinic. Leukemia patients with higher levels of ZBTB7A expression had significantly better chances of survival than patients in whom the gene was hardly active or not active at all.
Now, the investigators plan to explore whether ZBTB7A expression can be used to customize therapies for individual patients. They also believe their discovery is a promising starting point for developing new approaches to treat AML.
“It might be possible to use specially modified glucose molecules to block the energy production process in AML cells,” said study author Luise Hartmann, of Ludwig-Maximilians-Universität München.
“Initial clinical trials in other cancers have already shown that these agents are well-tolerated by patients.” ![]()
Material can dissolve blood clots more efficiently, team says

Image by Kevin MacKenzie
Researchers say they have developed a thrombolytic material that can be condensed on a blood clot by means of a magnetic field.
Experiments suggest the material can dissolve clots up to 4000 times more efficiently than thrombolytic agents currently in use.
Vladimir Vinogradov, PhD, of ITMO University in St Petersburg, Russia, and his colleagues described the material in Scientific Reports.
“We prepared a thrombolytic colloid and tested its effects on an artificial blood clot obtained from plasma and blood of humans and thrombus extracted from patients,” Dr Vinogradov said.
“The results may soon allow us to try out the new thrombolytic system on mammals. Now, we are preparing for preclinical studies.”
Specifically, Dr Vinogradov and his colleagues produced a composite material that can deliver thrombolytic enzymes in a targeted manner. The material is composed of a porous magnetite framework and molecules of urokinase, an enzyme frequently used as a thrombolytic agent.
The composite can be used to create thrombolytic coating for artificial blood vessels and stable injectable solutions made of nanoparticles that can be localized near the clot by means of an external magnetic field.
The magnetite framework also protects enzymes from various inhibitors that are present in the blood and can deactivate thrombolytic medications.
“Usually, in order to achieve a prolonged effect for such drugs, the enzyme is placed inside a polymeric matrix,” said study author Andrey Drozdov, of ITMO University.
“The enzyme is then gradually released from the matrix and eventually loses all activity. We, on the other hand, experimentally demonstrated that enzymes protected using our approach do not lose therapeutic properties over extended periods of time and even after repeated use. The rate at which the new drug can dissolve the clot outperforms unprotected enzymes by about 4000 times.”
The researchers also believe the material is safe for humans because it is made of components that are already approved for intravenous injection. ![]()
NICE recommends approval for bosutinib

Photo courtesy of CDC
The National Institute for Health and Care Excellence (NICE) has issued a final draft guidance recommending approval for bosutinib (Bosulif), a tyrosine kinase inhibitor used to treat certain patients with chronic myeloid leukemia (CML).
NICE is recommending that bosutinib be made available through normal National Health Service (NHS) funding channels so patients don’t have to apply to the Cancer Drugs Fund (CDF) to obtain it.
The CDF is money the government sets aside to pay for cancer drugs that haven’t been approved by NICE and aren’t available within the NHS in England.
Following the decision to reform the CDF earlier this year, NICE began to reappraise all drugs currently in the CDF in April. Bosutinib is the first drug to be looked at through this reconsideration process.
Bosutinib has conditional approval from the European Commission to treat adults with Philadelphia-chromosome-positive CML in chronic phase, accelerated phase, or blast phase, but only if those patients have previously received one or more tyrosine kinase inhibitors and are not considered eligible for treatment with imatinib, nilotinib, or dasatinib.
“People with this type of chronic myeloid leukemia, who haven’t responded to first- and second-line treatment or who experience severe side effects, have few or no treatment options left,” said Carole Longson, director of the Centre for Health Technology Evaluation at NICE.
“New patients who need this drug can be reassured that bosutinib should be made available for routine use within the NHS.”
The current list price of bosutinib is £45,000 per patient per year. However, the NHS has been offered a discount by Pfizer, the drug’s manufacturer.
NICE previously looked at bosutinib in 2013 but did not recommend the drug for use on the NHS at that time, saying the drug was not cost-effective. Bosutinib was then made available to patients via the CDF.
As part of the reappraisal process, Pfizer offered a discount for bosutinib. Taking this discount into consideration, as well as the limited treatment options for CML patients, NICE decided bosutinib is cost-effective.
“The company positively engaged with our CDF reconsideration process and demonstrated that their drug can be cost-effective, which resulted in a positive recommendation,” Longson said. “This decision, when implemented, frees up funding in the CDF, which can be spent on other new and innovative cancer treatments.”
NICE’s final draft guidance is now with consultees who have the opportunity to appeal against the decision or notify NICE of any factual errors. The appeal period will close at 5 pm on July 21, 2016.
Until the final decision is published, bosutinib will still be available to new and existing patients through the old CDF. ![]()
New data propel headache neuromodulation devices toward approval
WASHINGTON – Encouraging data on an external vagal nerve stimulator and a minimally invasive system that targets the sphenopalatine ganglion are propelling the two neuromodulation devices toward approval for headache, Stewart J. Tepper, MD, said at the Summit in Neurology & Psychiatry.
“This would bring to four the number of devices we now have available to us to treat headache,” said Dr. Tepper, director of research at the Dartmouth Headache Clinic, Lebanon, N.H. Two types are already available in the United States: a trigeminal nerve stimulator approved for migraine prevention and two brands of transcranial magnetic stimulators approved for acute treatment of migraine with aura.
Noninvasive vagal nerve stimulator
The gammaCore device (electroCore Medical) could be approved for cluster headache this year, Dr. Tepper said. A company spokesman said the company submitted its pivotal trial data to the Food and Drug Administration in 2015, but couldn’t offer any insight into how far the process has progressed.

“That application is currently under review, and we look forward to the FDA’s decision when it comes,” Eric Liebler, electroCore vice president for scientific, medical, and governmental affairs, said in an interview.
The gammaCore device is an external vagal nerve stimulator already approved in Canada and Europe for the treatment of primary headache disorders. In April 2016, it was approved in the United Kingdom as well, Dr. Tepper said at the meeting, sponsored by the Global Academy for Medical Education. Global Academy and this news organization are owned by the same company.
The device is a small, handheld unit that the patient uses twice each day, and which transmits mild current to the vagal nerve. It’s activated over the carotid pulse point on the neck for about 90 seconds. It’s thought to work by suppressing excessive extracellular glutamate and suppressing cortical spreading depression, Dr. Tepper said.
The most recent data for the gammaCore device, presented at the annual meeting of the American Headache Society (AHS) in June, suggest that it could also be beneficial in chronic headache and in menstrual migraine.
A 12-week, open-label study of 51 women with menstrual migraine looked at pain intensity, analgesic use, and migraine disability. Women used the device prophylactically, six stimulations each day for 3 days before and after the onset of menstruation. The mean number of menstrual migraine days each month declined significantly from 7.2 to 4.7. About 40% of the group had at least a 50% reduction in migraine days. Pain intensity also decreased significantly, as well as did the number of doses of analgesics. There were significant improvements on both the Headache Impact Test and Migraine Disability Assessment. One subject discontinued treatment due to dizziness during stimulation.
An 8-week study on cluster headache was published in May and updated at the AHS meeting. Investigators randomized 87 patients with cluster headache to standard therapy alone or plus the gammaCore device. The PREVA (Prevention and Acute treatment of chronic cluster headache) study determined that dual therapy reduced the number of weekly attacks by four, compared with standard therapy. A total of 40% of patients experienced at least a 50% response rate, compared with 8% of controls. A subanalysis presented at the AHS meeting showed that 18% of the dual-therapy group experienced at least a 75% response rate.
Implantable sphenopalatine ganglion stimulator
Dr. Tepper is particularly excited about the Pulsante device, an implantable, wireless sphenopalatine ganglion (SPG) stimulator manufactured by Autonomic Technologies, which he called “a dramatic change in paradigm,” for the treatment of cluster headaches.
The system consists of a neurostimulator about the size of an almond and a lead with six electrodes. It’s inserted under local anesthetic via a small incision in the upper gum on the side in which the patient experiences symptoms. The electrodes are positioned along the SPG nerve and the neurostimulator is affixed to the zygomatic process.
A handheld wireless controller placed against the cheek activates the device and controls the intensity of stimulation, which is thought to work by blocking signals to the postganglionic parasympathetic fibers. Those fibers innervate facial structures and the cerebral and meningeal blood vessels and are implicated in the pain and accompanying autonomic symptoms of a cluster headache attack.
“You can literally see this device working right before your eyes,” he said. “Patients having a cluster attack will exhibit ptosis, red watering eyes, nose running, and as soon as the device is turned on, you see the lid come up, the eye turn white, and the tearing and runny nose stop. This is an objective correlate to a subjective pain response. It’s dramatic and exciting.”
The pivotal Pathway CH-1study that led to European Union approval was small – just 43 patients – but found that half the cluster attacks could be terminated within 15 minutes of onset. About half of the patients, who had a decades-long history of cluster headaches, experienced close to a 90% reduction in attack frequency.
The latest Pulsante data were also presented in June at the AHS meeting. Two papers – one with 24-month data from the pivotal trial, and one with 12-month data from an ongoing registry study – were overwhelmingly positive, Dr. Tepper said.
The 24-month follow-up data to the pivotal study found that 61% of patients experienced a therapeutic response to SPG stimulation. Most attacks (79%) responded to stimulation alone without the need for abortive therapy. Most patients (64%) also experienced clinical improvements in preventive medication use. Twenty-one were able to reduce or even eliminate the use of preventive medications.
The registry study provided data on 85 patients. Of these, 68% experienced at least a 50% reduction in attack frequency; some reported close to a 90% reduction. A third of patients actually experienced some period of remission, and some patients who were not initially responders became responders after a year of treatment. Acute medication use declined by 52% overall and by 82% in those considered therapeutic responders.
“These data are extremely encouraging,” Dr. Tepper said.
Adverse events are minimal and most are related to implantation. A safety study of 99 patients found that adverse events included sensory disbranch, pain, and swelling, which resolved in 90 days.
The U.S. Pathway CH-2 Cluster Headache Study is now underway and aims to enroll 120 patients. “If the data are positive on this, the company will go ahead and pursue U.S. approval,” Dr. Tepper said.
Dr. Tepper has received personal remuneration and research funding from a number of pharmaceutical companies. He holds stock in Autonomic Technologies.
On Twitter @alz_gal
WASHINGTON – Encouraging data on an external vagal nerve stimulator and a minimally invasive system that targets the sphenopalatine ganglion are propelling the two neuromodulation devices toward approval for headache, Stewart J. Tepper, MD, said at the Summit in Neurology & Psychiatry.
“This would bring to four the number of devices we now have available to us to treat headache,” said Dr. Tepper, director of research at the Dartmouth Headache Clinic, Lebanon, N.H. Two types are already available in the United States: a trigeminal nerve stimulator approved for migraine prevention and two brands of transcranial magnetic stimulators approved for acute treatment of migraine with aura.
Noninvasive vagal nerve stimulator
The gammaCore device (electroCore Medical) could be approved for cluster headache this year, Dr. Tepper said. A company spokesman said the company submitted its pivotal trial data to the Food and Drug Administration in 2015, but couldn’t offer any insight into how far the process has progressed.
“That application is currently under review, and we look forward to the FDA’s decision when it comes,” Eric Liebler, electroCore vice president for scientific, medical, and governmental affairs, said in an interview.
The gammaCore device is an external vagal nerve stimulator already approved in Canada and Europe for the treatment of primary headache disorders. In April 2016, it was approved in the United Kingdom as well, Dr. Tepper said at the meeting, sponsored by the Global Academy for Medical Education. Global Academy and this news organization are owned by the same company.
The device is a small, handheld unit that the patient uses twice each day, and which transmits mild current to the vagal nerve. It’s activated over the carotid pulse point on the neck for about 90 seconds. It’s thought to work by suppressing excessive extracellular glutamate and suppressing cortical spreading depression, Dr. Tepper said.
The most recent data for the gammaCore device, presented at the annual meeting of the American Headache Society (AHS) in June, suggest that it could also be beneficial in chronic headache and in menstrual migraine.
A 12-week, open-label study of 51 women with menstrual migraine looked at pain intensity, analgesic use, and migraine disability. Women used the device prophylactically, six stimulations each day for 3 days before and after the onset of menstruation. The mean number of menstrual migraine days each month declined significantly from 7.2 to 4.7. About 40% of the group had at least a 50% reduction in migraine days. Pain intensity also decreased significantly, as well as did the number of doses of analgesics. There were significant improvements on both the Headache Impact Test and Migraine Disability Assessment. One subject discontinued treatment due to dizziness during stimulation.
An 8-week study on cluster headache was published in May and updated at the AHS meeting. Investigators randomized 87 patients with cluster headache to standard therapy alone or plus the gammaCore device. The PREVA (Prevention and Acute treatment of chronic cluster headache) study determined that dual therapy reduced the number of weekly attacks by four, compared with standard therapy. A total of 40% of patients experienced at least a 50% response rate, compared with 8% of controls. A subanalysis presented at the AHS meeting showed that 18% of the dual-therapy group experienced at least a 75% response rate.
Implantable sphenopalatine ganglion stimulator
Dr. Tepper is particularly excited about the Pulsante device, an implantable, wireless sphenopalatine ganglion (SPG) stimulator manufactured by Autonomic Technologies, which he called “a dramatic change in paradigm,” for the treatment of cluster headaches.
The system consists of a neurostimulator about the size of an almond and a lead with six electrodes. It’s inserted under local anesthetic via a small incision in the upper gum on the side in which the patient experiences symptoms. The electrodes are positioned along the SPG nerve and the neurostimulator is affixed to the zygomatic process.
A handheld wireless controller placed against the cheek activates the device and controls the intensity of stimulation, which is thought to work by blocking signals to the postganglionic parasympathetic fibers. Those fibers innervate facial structures and the cerebral and meningeal blood vessels and are implicated in the pain and accompanying autonomic symptoms of a cluster headache attack.
“You can literally see this device working right before your eyes,” he said. “Patients having a cluster attack will exhibit ptosis, red watering eyes, nose running, and as soon as the device is turned on, you see the lid come up, the eye turn white, and the tearing and runny nose stop. This is an objective correlate to a subjective pain response. It’s dramatic and exciting.”
The pivotal Pathway CH-1study that led to European Union approval was small – just 43 patients – but found that half the cluster attacks could be terminated within 15 minutes of onset. About half of the patients, who had a decades-long history of cluster headaches, experienced close to a 90% reduction in attack frequency.
The latest Pulsante data were also presented in June at the AHS meeting. Two papers – one with 24-month data from the pivotal trial, and one with 12-month data from an ongoing registry study – were overwhelmingly positive, Dr. Tepper said.
The 24-month follow-up data to the pivotal study found that 61% of patients experienced a therapeutic response to SPG stimulation. Most attacks (79%) responded to stimulation alone without the need for abortive therapy. Most patients (64%) also experienced clinical improvements in preventive medication use. Twenty-one were able to reduce or even eliminate the use of preventive medications.
The registry study provided data on 85 patients. Of these, 68% experienced at least a 50% reduction in attack frequency; some reported close to a 90% reduction. A third of patients actually experienced some period of remission, and some patients who were not initially responders became responders after a year of treatment. Acute medication use declined by 52% overall and by 82% in those considered therapeutic responders.
“These data are extremely encouraging,” Dr. Tepper said.
Adverse events are minimal and most are related to implantation. A safety study of 99 patients found that adverse events included sensory disbranch, pain, and swelling, which resolved in 90 days.
The U.S. Pathway CH-2 Cluster Headache Study is now underway and aims to enroll 120 patients. “If the data are positive on this, the company will go ahead and pursue U.S. approval,” Dr. Tepper said.
Dr. Tepper has received personal remuneration and research funding from a number of pharmaceutical companies. He holds stock in Autonomic Technologies.
On Twitter @alz_gal
AT SUMMIT IN NEUROLOGY & PSYCHIATRY

QUIZ: How Much Do You Know about Treating Upper Extremity DVT?
[WpProQuiz 10] [WpProQuiz_toplist 10]
[WpProQuiz 10] [WpProQuiz_toplist 10]
[WpProQuiz 10] [WpProQuiz_toplist 10]
Patch of Hair Loss on the Scalp
The Diagnosis: Temporal Triangular Alopecia
Temporal triangular alopecia (TTA), also known as congenital triangular alopecia, was first described in the early 1900s.1 It presents clinically as a triangular-shaped area of nonscarring alopecia either unilaterally or bilaterally. Limited clinical data suggest that most unilateral cases are on the left frontotemporal region of the scalp. In bilateral cases, there may be asymmetry in size of the area involved.2 Dermatoscopically, TTA is characterized by decreased terminal hair follicle density as well as the presence of vellus hairs with an absence of inflammation.3 The majority of TTA is noted between birth and 6 years of life with the areas staying stable thereafter. Large areas of TTA may suggest cerebello-trigeminal-dermal dysplasia (Gomez-Lopez-Hernandez syndrome), a rare neurocutaneous syndrome characterized by rhombencephalosynapsis, trigeminal anesthesia, and parietooccipital alopecia (Online Mendelian Inheritance in Man 601853).4 Although TTA is largely idiopathic, it has been suggested that the trait may be paradominant, whereby a postzygotic loss of the wild-type allele in a heterozygotic state causes triangular alopecia and reflects hamartomatous mosaicism.5 It also is an important mimicker of alopecia areata. Correct identification prevents unnecessary treatment to the areas of the scalp. Hair restoration surgery has been reported as a tool to treat this disorder.6
- Tosti A. Congenital triangular alopecia. report of fourteen cases. J Am Acad Dermatol. 1987;16:991-993.
- Armstrong DK, Burrows D. Congenital triangular alopecia. Pediatr Dermatol. 1996;13:394-396.
- Iorizzo M, Pazzaglia M, Starace M, et al. Videodermoscopy: a useful tool for diagnosing congenital triangular alopecia. Pediatr Dermatol. 2008;25:652-654.
- Assoly P, Happle R. A hairy paradox: congenital triangular alopecia with a central hair tuft. Dermatology. 2010;221:107-109.
- Happle R. Congenital triangular alopecia may be categorized as a paradominant trait. Eur J Dermatol. 2003;13:346-347.
- Wu WY, Otberg N, Kang H, et al. Successful treatment of temporal triangular alopecia by hair restoration surgery using follicular unit transplantation. Dermatol Surg. 2009;35:1307-1310.
The Diagnosis: Temporal Triangular Alopecia
Temporal triangular alopecia (TTA), also known as congenital triangular alopecia, was first described in the early 1900s.1 It presents clinically as a triangular-shaped area of nonscarring alopecia either unilaterally or bilaterally. Limited clinical data suggest that most unilateral cases are on the left frontotemporal region of the scalp. In bilateral cases, there may be asymmetry in size of the area involved.2 Dermatoscopically, TTA is characterized by decreased terminal hair follicle density as well as the presence of vellus hairs with an absence of inflammation.3 The majority of TTA is noted between birth and 6 years of life with the areas staying stable thereafter. Large areas of TTA may suggest cerebello-trigeminal-dermal dysplasia (Gomez-Lopez-Hernandez syndrome), a rare neurocutaneous syndrome characterized by rhombencephalosynapsis, trigeminal anesthesia, and parietooccipital alopecia (Online Mendelian Inheritance in Man 601853).4 Although TTA is largely idiopathic, it has been suggested that the trait may be paradominant, whereby a postzygotic loss of the wild-type allele in a heterozygotic state causes triangular alopecia and reflects hamartomatous mosaicism.5 It also is an important mimicker of alopecia areata. Correct identification prevents unnecessary treatment to the areas of the scalp. Hair restoration surgery has been reported as a tool to treat this disorder.6
- Tosti A. Congenital triangular alopecia. report of fourteen cases. J Am Acad Dermatol. 1987;16:991-993.
- Armstrong DK, Burrows D. Congenital triangular alopecia. Pediatr Dermatol. 1996;13:394-396.
- Iorizzo M, Pazzaglia M, Starace M, et al. Videodermoscopy: a useful tool for diagnosing congenital triangular alopecia. Pediatr Dermatol. 2008;25:652-654.
- Assoly P, Happle R. A hairy paradox: congenital triangular alopecia with a central hair tuft. Dermatology. 2010;221:107-109.
- Happle R. Congenital triangular alopecia may be categorized as a paradominant trait. Eur J Dermatol. 2003;13:346-347.
- Wu WY, Otberg N, Kang H, et al. Successful treatment of temporal triangular alopecia by hair restoration surgery using follicular unit transplantation. Dermatol Surg. 2009;35:1307-1310.
An 11-year-old girl presented for evaluation of a patch of hair loss on the right parietal scalp that had been present and stable for 2.5 years. Physical examination revealed a unilateral area of hair loss that was triangular in shape on the right parietal/temporal region, measuring 2.1×2.2 cm. Dermatoscope examination showed vellus hairs throughout. A hair-pull test was negative and the patient confirmed that the area had never been completely smooth. There were no associated symptoms and no family history of autoimmune disease or hair loss. Prior to presentation, the patient underwent a trial of intralesional steroids and topical steroids to the area without effect.