User login
AATS Week 2016 Recap
AATS Week 2016 was a great success
Starting May 12 and 13 in New York City, more than 1,250 attendees took part in the AATS Aortic Symposium. The Friday Breakfast Sessions were particularly popular — Stump the Stars I: Open Surgery Cases, Stump the Stars II: Endovascular Cases, and Controversies in Aortic Surgery.
The week’s activities continued from May 14 - 18 at the AATS Annual Meeting in Baltimore. On hand were some 2,514 cardiothoracic surgeons and health care professionals, as well as residents, fellows, medical students and others in the field.
Program Highlights
Saturday Skills Courses:Combined Luncheon Speaker Denton A. Cooley, followed by hands-on sessions.
Sunday Postgraduate Symposia with Legends Luncheons featuring Leonard L. Bailey, Joel D. Cooper and John L. Ochsner.
New course: The Survival Guide for the Cardiothoracic Surgical Team aimed at residents, fellows and health care professionals, followed by a hands-on session.
Emerging Technologies & Techniques Fora: Adult Cardiac and General Thoracic
Surgical Ethics Course: Surgeons Solving Ethical Problems in Surgery — A day-long program focusing on ethical issues faced by surgeons, especially problems created by rapidly evolving technologies. Course chairs were Martin F. McKneally, University of Toronto and Robert M. Sade, Medical University of South Carolina.
VAD/ECMO Session
Masters of Surgery Video Sessions
AATS Learning Center — Located in the Exhibit Hall, the Center had nine stations of cutting-edge case videos of novel procedures and surgical techniques. Subject areas were: the “best” of the 2015 Mitral Conclave and 2016 Aortic Symposium, aortic surgery, congenital heart disease, esophagus and diaphragm, intracardiac masses, lung, mediastinum, and mitral valve surgery.
AATS Annual Meeting Speakers
Attendees in Baltimore had the opportunity to experience several terrific talks by top speakers:

Joseph S. Coselli, Baylor College of Medicine
Presidential Address
Competition: Perspiration to Inspiration “Aut viam inveniam aut faciam”

Gary H. Gibbons, National Heart, Blood & Lung Institute
Basic Science Lecture
Charting Our Future Together: Translating Discovery Science into Health Impact
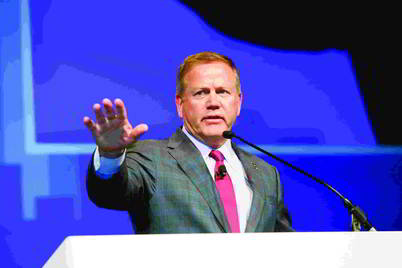
Brian Kelly, Notre Dame Head Football Coach
Honored Guest Lecture
The Building Blocks for Success: Leadership — Program Building — Player Development
Attendees in Baltimore had the opportunity to experience several terrific talks by top speakers:
Joseph S. Coselli, Baylor College of Medicine
Presidential Address
Competition: Perspiration to Inspiration “Aut viam inveniam aut faciam”
Gary H. Gibbons, National Heart, Blood & Lung Institute
Basic Science Lecture
Charting Our Future Together: Translating Discovery Science into Health Impact
Brian Kelly, Notre Dame Head Football Coach
Honored Guest Lecture
The Building Blocks for Success: Leadership — Program Building — Player Development

2016 AATS Lifetime Achievement Award Honors Denton A. Cooley
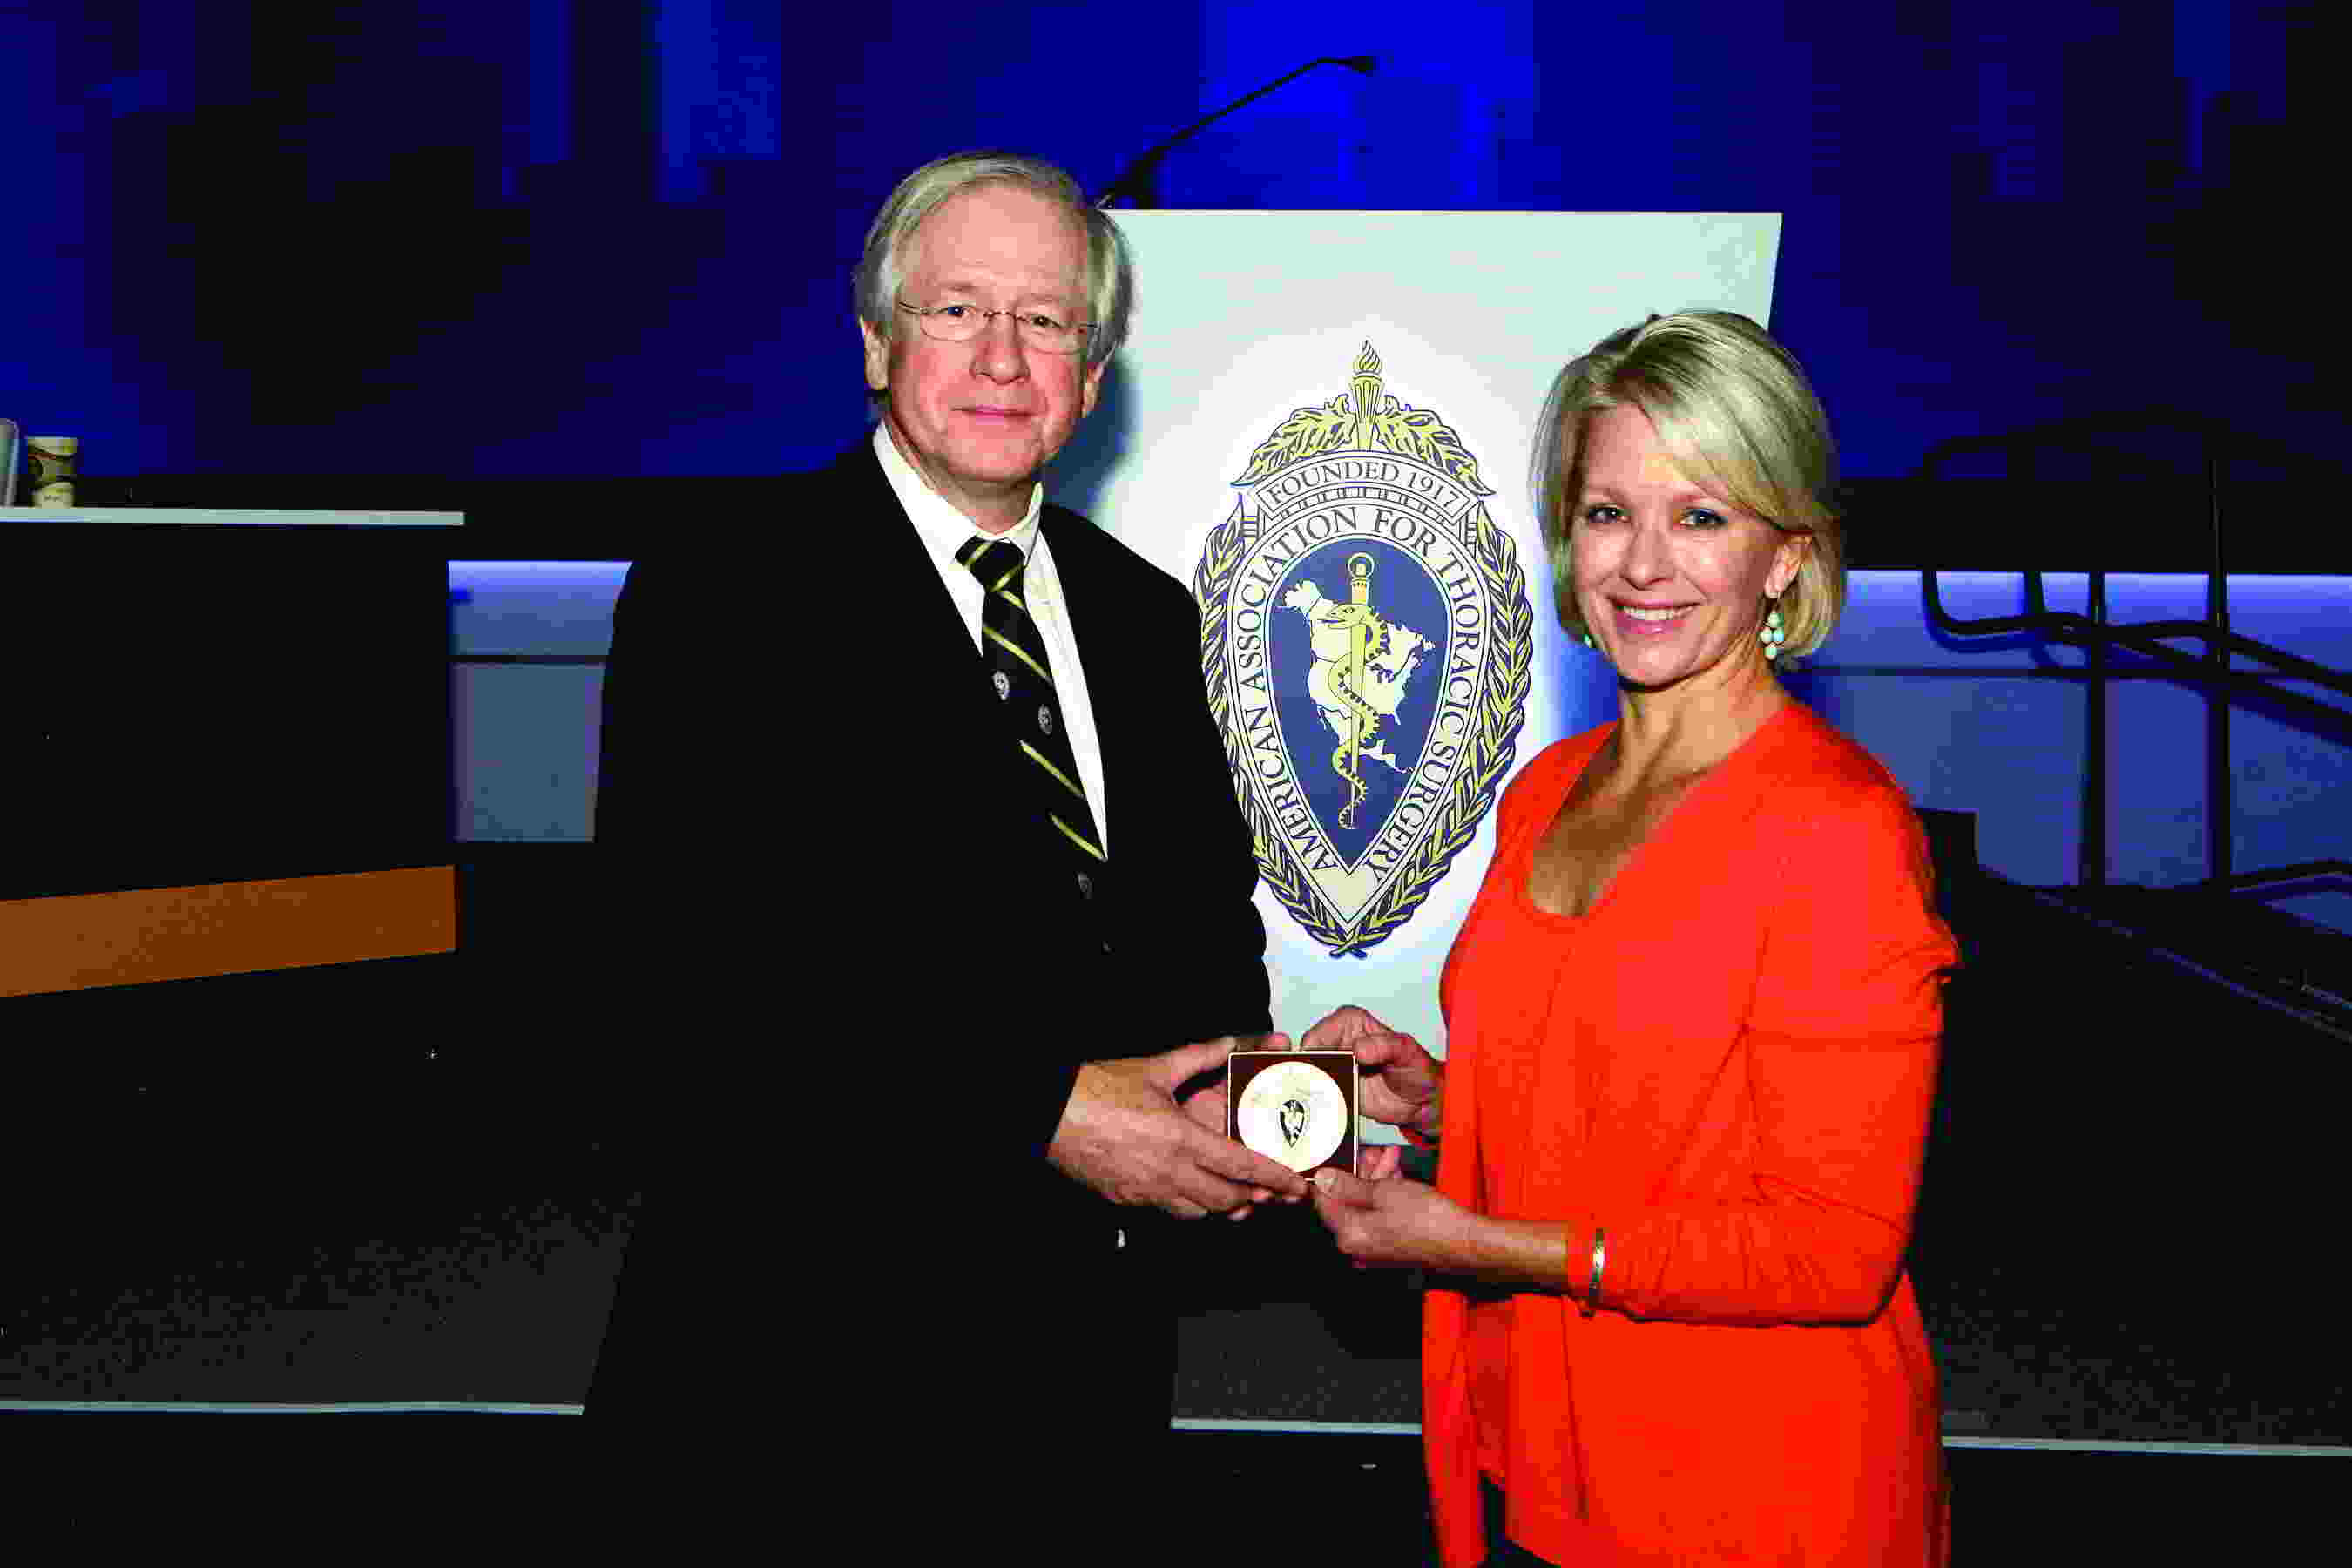
Denton A. Cooley of the Texas Heart Institute was honored with the 2016 AATS Lifetime Achievement Award during the Annual Meeting Plenary Session on Monday, May 16th.

The award was accepted by his daughter (above right) from Dr. Joseph Coselli.
The award recognizes individuals for their significant contributions to CT surgery patient care, teaching, research or community service.
The honor acknowledges Cooley’s dedication, service and pioneering efforts, including the first successful human heart transplant in the United States and first artificial heart implant.
Denton A. Cooley of the Texas Heart Institute was honored with the 2016 AATS Lifetime Achievement Award during the Annual Meeting Plenary Session on Monday, May 16th.
The award was accepted by his daughter (above right) from Dr. Joseph Coselli.
The award recognizes individuals for their significant contributions to CT surgery patient care, teaching, research or community service.
The honor acknowledges Cooley’s dedication, service and pioneering efforts, including the first successful human heart transplant in the United States and first artificial heart implant.
Case Study: Managing Opioid Addiction After a Back Injury
Has your patient’s opioid use escalated to opioid addiction? How can you tell, and what interventions can you take to help this patient in the context of a 15-minute appointment?
In this edition of Mental Health Consult, our panel discusses their recommendations for workup and next steps for managing a 45-year-old man who has no history of psychiatric disorders and appears to now be dependent on the opioid painkillers that he initially received after a back injury.
Join our panel of experts from George Washington University, Washington, including Daniel Lieberman, MD, professor of psychiatry and behavioral sciences clinical director; April Barbour, MD, MPH, director of the division of general internal medicine; and Lorenzo Norris, MD, medical director of psychiatric and behavioral services, as they discuss how to treat pain medication–related addiction, including when to refer to pain specialists and how various practice models drive treatment decisions and reimbursement.
Click here for a PDF of the case study.

VIDEO: A case study in managing opioid addiction after a back injury
Has your patient’s opioid use escalated to opioid addiction? How can you tell, and what interventions can you take to help this patient in the context of a 15-minute appointment?
In this edition of Mental Health Consult, our panel discusses their recommendations for workup and next steps for managing a 45-year-old man who has no history of psychiatric disorders and appears to now be dependent on the opioid painkillers that he initially received after a back injury.
Join our panel of experts from George Washington University, Washington, including Daniel Lieberman, MD, professor of psychiatry and behavioral sciences clinical director; April Barbour, MD, MPH, director of the division of general internal medicine; and Lorenzo Norris, MD, medical director of psychiatric and behavioral services, as they discuss how to treat pain medication–related addiction, including when to refer to pain specialists and how various practice models drive treatment decisions and reimbursement.
On Twitter @whitneymcknight

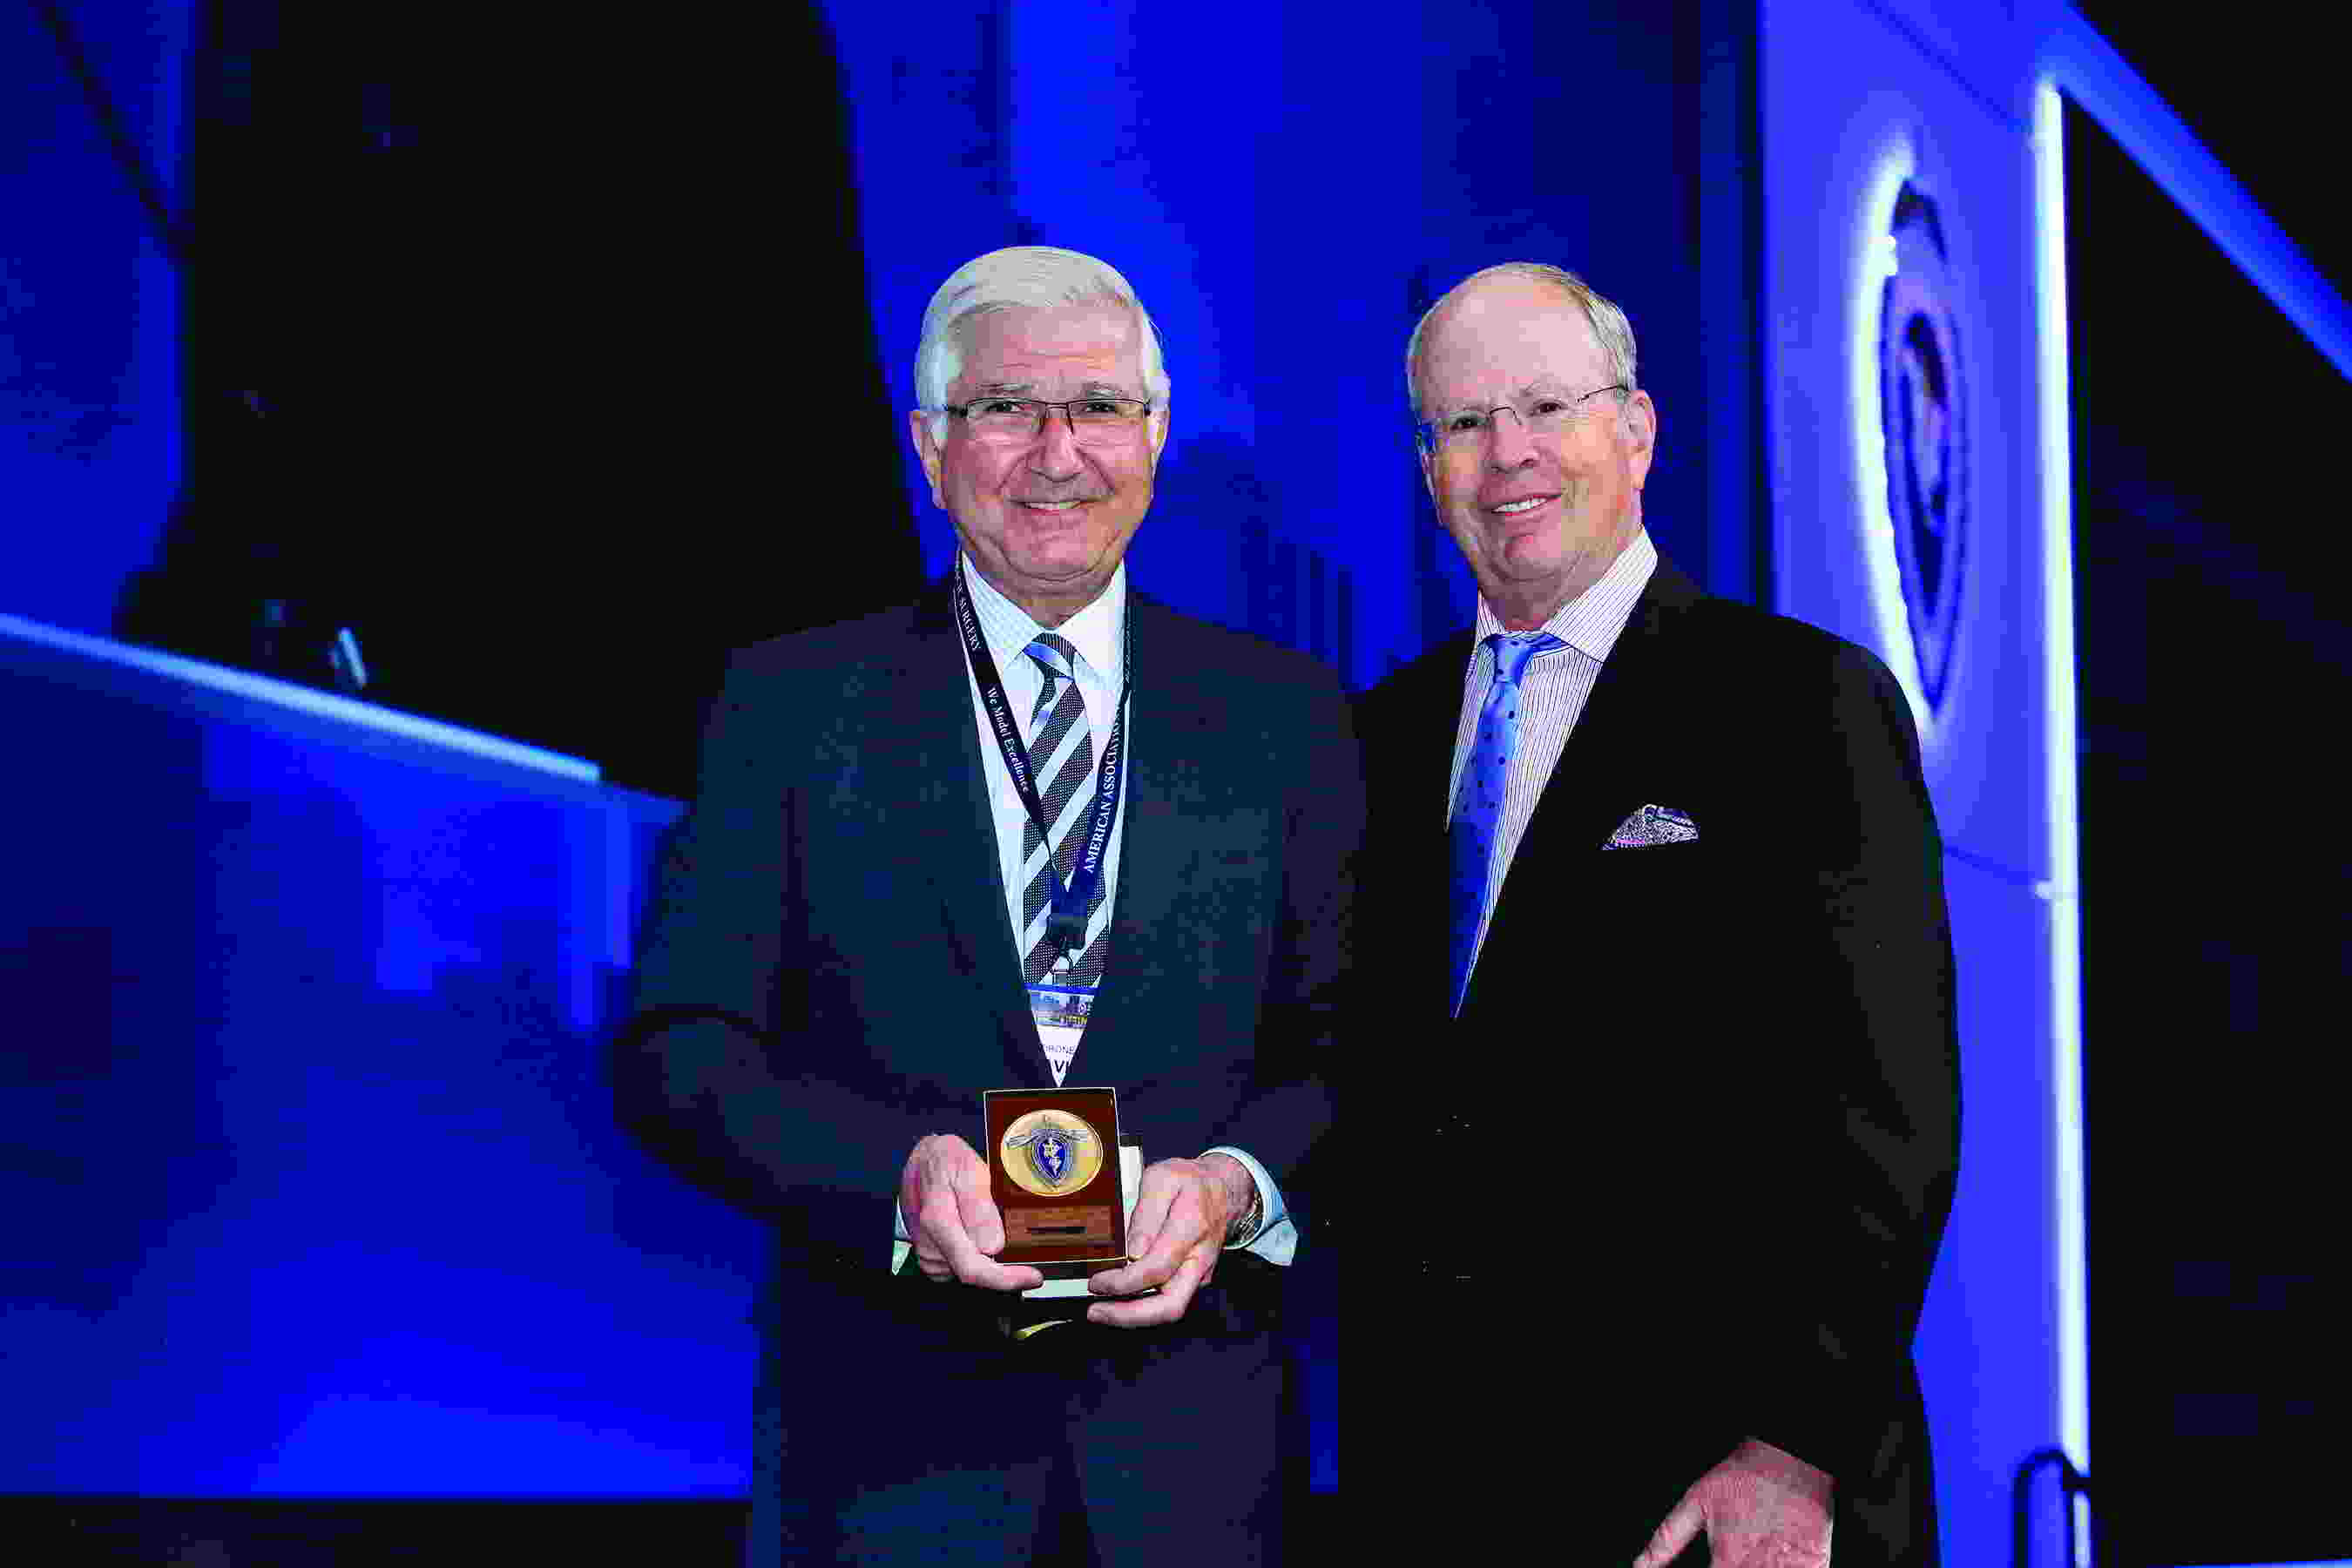
2016 AATS Scientific Achievement Award Honors Tirone E. David
Tirone E. David of the University of Toronto was presented with the 2016 AATS Scientific Achievement Award during the Annual Meeting Plenary Session on May 16th.
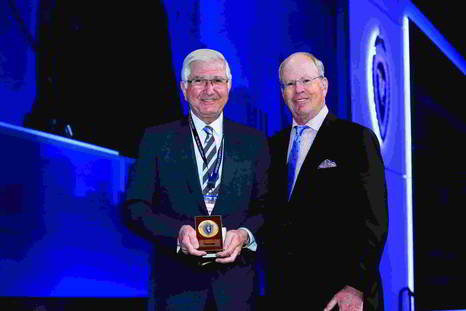
Dr. David (above left) with his award is shown with Dr. Irving Kron.
The award is the Association’s highest scientific recognition. Created in 1994, it recognizes physicians who have made extraordinary scientific contributions to the CT surgery field.
The honor acknowledges David’s pioneering work in CT surgery and his service as 85th AATS President (2004-2005). During an illustrious career, his innovation, passion and dedication to CT surgery has impacted hundreds of trainees and peers. The David operation revolutionized the treatment of aortic valve disease and resulted in substantial advances in patient care quality worldwide.
Tirone E. David of the University of Toronto was presented with the 2016 AATS Scientific Achievement Award during the Annual Meeting Plenary Session on May 16th.
Dr. David (above left) with his award is shown with Dr. Irving Kron.
The award is the Association’s highest scientific recognition. Created in 1994, it recognizes physicians who have made extraordinary scientific contributions to the CT surgery field.
The honor acknowledges David’s pioneering work in CT surgery and his service as 85th AATS President (2004-2005). During an illustrious career, his innovation, passion and dedication to CT surgery has impacted hundreds of trainees and peers. The David operation revolutionized the treatment of aortic valve disease and resulted in substantial advances in patient care quality worldwide.
Meet the Newest Active AATS Members
At the Annual Meeting, 55 surgeons were elected as active AATS members:
George M. Alfieris (Rochester, NY)
Denis Bouchard (Montréal, Canada)
Ross M. Bremner (Phoenix, AZ)
Christian P. Brizard (Parkville, Australia)
Manuel Castella (Barcelona, Spain)
Renzo Cecere (Montréal, Canada)
Paul J. Chai (New York, NY)
Toyofumi F. Chen-Yoshikawa (Kyoto, Japan)
Francisco D.A. Costa (Curitiba, Brazil)
Philippe Demers (Montréal, Canada)
Benoit de Varennes (Montréal, Canada)
Roberto Di Bartolomeo (Bologna, Italy)
Nianguo Dong (Wuhan, China)
John R. Doty (Murray, UT)
Sitaram M. Emani (Boston, MA)
Jose I. Fragata (Lisbon, Portugal)
James J. Gangemi (Charlottesville, VA)
Isaac George (New York, NY)
Sebastien Gilbert (Ottawa, Canada)
Diego Gonzalez Rivas (Coruña, Spain)
Jie He (Beijing, China)
Tain-Yen Hsia (London, United Kingdom)
Aditya K. Kaza (Boston, MA)
Michael S. Kent (Boston, MA)
Zain I. Khalpey (Tucson, AZ)
Ahmet Kilic (Columbus, OH)
Joo Hyun Kim (Seoul, Republic of Korea)
Takushi Kohmoto (Madison,WI)
Buu-Khanh Lam (Ottawa, Canada)
Joseph Lamelas (Miami Beach, FL)
Hui Li (Beijing, China)
Brian E. Louie (Seattle, WA)
Giovanni Battista Luciani (Verona, Italy)
Shari L. Meyerson (Chicago, IL)
Siamak Mohammadi (Québec City, Canada)
Katie S. Nason (Pittsburgh, PA)
Shigeyuki Ozaki (Tokyo, Japan)
Amit N. Patel (Salt Lake City, UT)
Michel Pellerin (Montréal, Canada)
Mark D. Peterson (Toronto, Canada)
Eyal E. Porat (Houston, TX)
Michael F. Reed (Hershey, PA)
Kisaburo Sakamoto (Shizuoka, Japan)
Arash Salemi (New York, NY)
Norihiko Shiiya (Hamamatsu, Japan)
Hiroo Takayama (New York, NY)
Sachin Talwar (New Delhi, India)
Tomasz Timek (Grand Rapids, MI)
Joseph W. Turek (Iowa City, IA)
Pierre Voisine (Quebec, Canada)
Benny Weksler (Memphis, TN)
Grayson H. Wheatley (Philadelphia, PA)
Ronald K. Woods (Milwaukee, WI)
Hitoshi Yaku (Kyoto, Japan)
Tae-Jin Yun (Seoul, Republic of Korea)
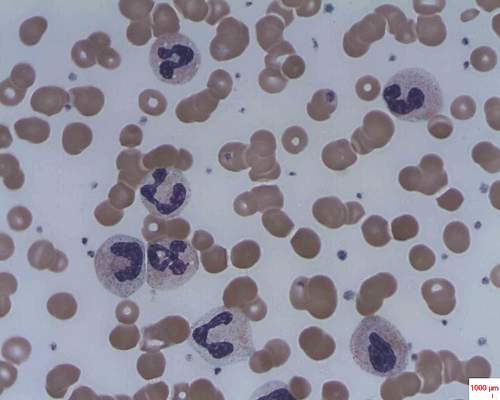
Mechanism proposed for microvascular thrombosis in thrombotic thrombocytopenic purpura
In patients with acquired autoimmune thrombotic thrombocytopenic purpura, elevated plasma levels of human neutrophil proteins 1-3 inhibit proteolytic cleavage of von Willebrand factor by ADAMTS13, Vikram G. Pillai, PhD, of the University of Alabama at Birmingham, and colleagues reported.
The finding may explain how inflammation triggers microvascular thrombosis in these patients and potentially others with immune thrombotic disorders, according to the researchers (Blood 2016;128:110-9).

They performed enzyme-linked immunosorbent assays and found markedly increased levels of plasma human neutrophil proteins (HNPs) 1-3 in most of the patients with acquired autoimmune thrombotic thrombocytopenic purpura (TTP). The median levels in the 19 patients were 170 ng/mL, compared with 23 ng/mL in 18 healthy controls, a statistically significant difference (P less than .0001).
Liquid chromatography plus tandem mass spectrometry similarly confirmed statistically significant increases in HNP1, HNP2, and HNP3 in patient samples (P less than .001).
Measures of HNPs 1-3 by both methods correlated well, and the researchers concluded that HNPs 1-3 likely inhibit ADAMTS13 activity by binding to the central A2 domain of von Willebrand factor and physically blocking ADAMTS13 binding.
The researchers had no relevant financial disclosures.
On Twitter @maryjodales
In patients with acquired autoimmune thrombotic thrombocytopenic purpura, elevated plasma levels of human neutrophil proteins 1-3 inhibit proteolytic cleavage of von Willebrand factor by ADAMTS13, Vikram G. Pillai, PhD, of the University of Alabama at Birmingham, and colleagues reported.
The finding may explain how inflammation triggers microvascular thrombosis in these patients and potentially others with immune thrombotic disorders, according to the researchers (Blood 2016;128:110-9).
They performed enzyme-linked immunosorbent assays and found markedly increased levels of plasma human neutrophil proteins (HNPs) 1-3 in most of the patients with acquired autoimmune thrombotic thrombocytopenic purpura (TTP). The median levels in the 19 patients were 170 ng/mL, compared with 23 ng/mL in 18 healthy controls, a statistically significant difference (P less than .0001).
Liquid chromatography plus tandem mass spectrometry similarly confirmed statistically significant increases in HNP1, HNP2, and HNP3 in patient samples (P less than .001).
Measures of HNPs 1-3 by both methods correlated well, and the researchers concluded that HNPs 1-3 likely inhibit ADAMTS13 activity by binding to the central A2 domain of von Willebrand factor and physically blocking ADAMTS13 binding.
The researchers had no relevant financial disclosures.
On Twitter @maryjodales
FROM BLOOD
Key clinical point: In patients with acquired autoimmune thrombotic thrombocytopenic purpura, elevated plasma levels of human neutrophil proteins 1-3 inhibit proteolytic cleavage of von Willebrand factor by ADAMTS13.
Major finding: The median levels of plasma human neutrophil proteins 1-3 in patients with acquired autoimmune TTP were 170 ng/mL, compared with 23 ng/mL in healthy controls, a statistically significant difference (P less than .0001).
Data source: Studies in 19 patients with TTP and 18 control subjects.
Disclosures: The researchers had no relevant financial disclosures.
Short telomeres predicted delayed bone marrow recovery in pediatric AML
Among children with de novo acute myeloid leukemia, shorter telomere length at the end of induction chemotherapy predicted delayed bone marrow recovery in later courses, according to a study of 115 patients published online in the Journal of Clinical Oncology.
“This association was not related to differences in host factors, telomere maintenance gene variants, AML disease characteristics, or therapeutic exposures,” wrote Robert Gerbing of Children’s Oncology Group (Monrovia, Calif.), and his associates. “If validated in a larger cohort, prospective ascertainment of telomere length at end of AML induction may permit individualized risk assessment for severe myelosuppression and toxicities with subsequent therapy, as well as clarify the influence of age and cytogenetic or molecular disease characteristics.”
Acute myeloid leukemia comprises about one in five childhood leukemias and requires intensive treatment that has led to mortality in up to 19% of patients, the researchers noted (Blood 2008 Feb 1;111[3]:1044-53).
“Prolonged, profound neutropenia is a well recognized risk factor for sepsis and invasive fungal infections, both major contributors to treatment-related mortality,” they added. In nonleukemic hematopoietic cells, telomere length is a “quantifiable host factor that may indicate potential risk for impaired bone marrow recovery after chemotherapy,” they wrote (J Clin Oncol. 2016 Jun 27. doi: 10.1200/JCO.2016.67.3467).
To test this hypothesis, the researchers analyzed paired diagnostic and remission bone marrow samples for 115 children with de novo AML enrolled in a Children’s Oncology Group protocol (AAML0531) that involved five chemotherapy courses. After each course, 62 patients reached absolute neutrophil count (ANC) recovery (500 cells/mcL) within the expected time frame, meaning that the recovery time was always less than one standard deviation of the group average. The remaining 53 patients had significantly delayed ANC recovery, meaning that they exceeded the group average by at least one standard deviation after at least two courses of chemotherapy.
The study size was adequate to detect a 0.2-unit difference in average telomere length between the two groups, the investigators noted. To measure telomere length, they estimated telomere content based on quantitative polymerase chain reaction (PCR) of bone marrow samples taken after induction chemotherapy. Then they compared patients who fell within the lowest quartile of telomere content to those in quartiles 2 through 4.
Telomere content was not associated with days to ANC recovery after the first three chemotherapy courses. After the fourth and fifth courses (intensifications two and three), patients had longer ANC recovery times than during the first three courses (mean, 45.2 days for intensification two and 43.7 days for intensification three). But patients with the shortest telomeres (that is, the patients in telomere content quartile 1) had significantly longer average ANC recovery times compared with patients in telomere content quartiles 2 through 4, both for intensifications two (P less than .001) and three (P = .002).
“Analysis of individual quartiles confirmed the association between less telomere content in quartile 1 and delays in ANC recovery,” the investigators noted. After they accounted for age at diagnosis, short telomere length remained a significant predictor of delayed ANC recovery after the fourth (P = .002) and fifth (P = .009) courses. Finally, DNA sequencing revealed evidence of telomere biology disorders, the investigators said.
The work was supported by an Alex’s Lemonade Stand Young Investigators Award, by a St. Baldrick’s Foundation Scholar Award, and by the National Institutes of Health. Mr. Gerbing and senior author Maria Gramatges, MD, had no disclosures. Two coinvestigators disclosed ties to Pfizer, Novartis, Dexcom, and several other pharmaceutical companies.
FROM THE JOURNAL OF CLINICAL ONCOLOGY
Key clinical point: Children with acute myeloid leukemia who had shorter bone marrow remission telomeres were significantly more likely to experience delayed absolute neutrophil recovery after later chemotherapy courses than were children with longer telomeres.
Major finding: Telomere length predicted time to ANC recovery after the fourth (P = .002) and fifth (P = .009) chemotherapy courses, even after adjustment for age.
Data source: A study of 115 children with de novo AML: 53 with delayed ANC recovery times and 62 with normal ANC recovery times.
Disclosures: The work was supported by an Alex’s Lemonade Stand Young Investigators Award, by a St. Baldrick’s Foundation Scholar Award, and by the National Institutes of Health. Dr. Gerbing and senior author Maria Gramatges, MD, had no disclosures. Two coinvestigators disclosed ties to Pfizer, Novartis, Dexcom, and several other pharmaceutical companies.
Ipsilateral arm BP measurements after breast cancer?
A 47-year-old woman with a history of right-sided breast cancer – status after lumpectomy, lymph node dissection, and radiation – comes in to clinic for evaluation. She asks the MA to take precautions on blood pressure measurement.
What precautions should be done?
A. Check BP in left arm only.
B. Do not inflate cuff greater than 180 mm in the right arm.
C. It’s okay to check BP in either arm.
About 10 years ago, a person asked me after a medical myth lecture I had given if I had any information on whether avoiding blood pressure readings in the ipsilateral arm in breast cancer patients was a myth. We both agreed that it sounded like a myth, and I promised to research it.
I found no studies at that time that refuted the advice that breast cancer patients were given to avoid blood pressure measurement, blood draws, and injections in the ipsilateral arm. I found no evidence at that time supporting this practice, just very authoritative statements in medical and nursing journals. Currently, the American Cancer society website recommends against blood pressure checks and blood draws from the ipsilateral arm in breast cancer patients.1

Are there more data now to weigh in on whether this is a myth or not?
The rationale behind this longstanding advice is that women who have had breast surgery, lymph node dissections, or radiation were at higher risk for lymphedema in the ipsilateral arm.
The advice to avoid blood draws and injections was to decrease the risk of infection and subsequent cellulitis that could lead to longstanding lymphedema. The avoidance of blood pressure measurements was, I suppose, to decrease venous pressure that could stimulate edema.
Sarah A. McLaughlin, MD, and her colleagues reported on the precautionary behaviors that patients with breast cancer observed in an attempt to avoid lymphedema.2 They looked at two groups: women who had undergone axillary lymph node biopsy and those who had undergone sentinel node biopsy.
More than 90% of the women who had undergone axillary node dissection avoided blood draws, intravenous lines, and blood pressure measurements on the involved side – with more than 70% in the sentinel node biopsy group avoiding blood pressure measurements on the involved side, and almost 90% avoiding intravenous lines.
In the Physical Activity and Lymphedema trial, Shayna L. Showalter, MD, and her colleagues looked at a number of potential risk factors for arm swelling in patients with a history of breast cancer.3 There was no increased risk of arm swelling in patients who had blood draws or blood pressure checks in the ipsilateral arm. There also was no association with burns, bug bites, hangnails, or cuts in the ipsilateral arm – all risks that would suggest an increased risk of infection in the arm.
Chantal Ferguson and her colleagues reported on a 10-year prospective study looking at lymphedema and risk factors for lymphedema in breast cancer patients.4 Bilateral arm volume measurements were made preoperatively and postoperatively, and at each visit, patients reported on whether they had blood pressure measurements, injections, or blood draws in the ipsilateral arm.
In more than 3,000 measurements, there was no evidence of volume change associated with blood pressure measurements, blood draws, or injections. Risk factors that did increase arm volume were body mass index greater than 25 kg/m2, axillary lymph node dissection, cellulitis, and regional lymph node irradiation.
There just isn’t evidence that these classic behaviors to protect the ipsilateral arm are warranted. Hopefully, patients will have less worry and less stress if they do not have to be so vigilant trying to “protect” their arm.
References
1. American Cancer Society: “Lymphedema: What Every Woman With Breast Cancer Should Know.” Accessed online at www.cancer.org.
2. J Am Coll Surg. 2013 Mar;216(3):380-9.
3. Ann Surg Oncol. 2013 Mar;20(3):842-9.
4. J Clin Oncol. 2016 Mar 1;34(7):691-8.
Dr. Paauw is professor of medicine in the division of general internal medicine at the University of Washington, Seattle, and he serves as third-year medical student clerkship director at the University of Washington. Contact Dr. Paauw at [email protected].
A 47-year-old woman with a history of right-sided breast cancer – status after lumpectomy, lymph node dissection, and radiation – comes in to clinic for evaluation. She asks the MA to take precautions on blood pressure measurement.
What precautions should be done?
A. Check BP in left arm only.
B. Do not inflate cuff greater than 180 mm in the right arm.
C. It’s okay to check BP in either arm.
About 10 years ago, a person asked me after a medical myth lecture I had given if I had any information on whether avoiding blood pressure readings in the ipsilateral arm in breast cancer patients was a myth. We both agreed that it sounded like a myth, and I promised to research it.
I found no studies at that time that refuted the advice that breast cancer patients were given to avoid blood pressure measurement, blood draws, and injections in the ipsilateral arm. I found no evidence at that time supporting this practice, just very authoritative statements in medical and nursing journals. Currently, the American Cancer society website recommends against blood pressure checks and blood draws from the ipsilateral arm in breast cancer patients.1
Are there more data now to weigh in on whether this is a myth or not?
The rationale behind this longstanding advice is that women who have had breast surgery, lymph node dissections, or radiation were at higher risk for lymphedema in the ipsilateral arm.
The advice to avoid blood draws and injections was to decrease the risk of infection and subsequent cellulitis that could lead to longstanding lymphedema. The avoidance of blood pressure measurements was, I suppose, to decrease venous pressure that could stimulate edema.
Sarah A. McLaughlin, MD, and her colleagues reported on the precautionary behaviors that patients with breast cancer observed in an attempt to avoid lymphedema.2 They looked at two groups: women who had undergone axillary lymph node biopsy and those who had undergone sentinel node biopsy.
More than 90% of the women who had undergone axillary node dissection avoided blood draws, intravenous lines, and blood pressure measurements on the involved side – with more than 70% in the sentinel node biopsy group avoiding blood pressure measurements on the involved side, and almost 90% avoiding intravenous lines.
In the Physical Activity and Lymphedema trial, Shayna L. Showalter, MD, and her colleagues looked at a number of potential risk factors for arm swelling in patients with a history of breast cancer.3 There was no increased risk of arm swelling in patients who had blood draws or blood pressure checks in the ipsilateral arm. There also was no association with burns, bug bites, hangnails, or cuts in the ipsilateral arm – all risks that would suggest an increased risk of infection in the arm.
Chantal Ferguson and her colleagues reported on a 10-year prospective study looking at lymphedema and risk factors for lymphedema in breast cancer patients.4 Bilateral arm volume measurements were made preoperatively and postoperatively, and at each visit, patients reported on whether they had blood pressure measurements, injections, or blood draws in the ipsilateral arm.
In more than 3,000 measurements, there was no evidence of volume change associated with blood pressure measurements, blood draws, or injections. Risk factors that did increase arm volume were body mass index greater than 25 kg/m2, axillary lymph node dissection, cellulitis, and regional lymph node irradiation.
There just isn’t evidence that these classic behaviors to protect the ipsilateral arm are warranted. Hopefully, patients will have less worry and less stress if they do not have to be so vigilant trying to “protect” their arm.
References
1. American Cancer Society: “Lymphedema: What Every Woman With Breast Cancer Should Know.” Accessed online at www.cancer.org.
2. J Am Coll Surg. 2013 Mar;216(3):380-9.
3. Ann Surg Oncol. 2013 Mar;20(3):842-9.
4. J Clin Oncol. 2016 Mar 1;34(7):691-8.
Dr. Paauw is professor of medicine in the division of general internal medicine at the University of Washington, Seattle, and he serves as third-year medical student clerkship director at the University of Washington. Contact Dr. Paauw at [email protected].