User login
Is it a 'senior moment' or early dementia? Addressing memory concerns in older patients
Many older patients are concerned about their memory. The “worried well” may come into your office with a list of things they can’t recall, yet they remember each “deficit” quite well. Anticipatory anxiety about one’s own decline is common, and is most often concerned with changes in memory.1,2
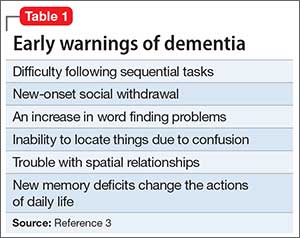
Patients with dementia or early cognitive decline often are oblivious to their cognitive changes, however. Of particular concern is progressive dementia, especially Alzheimer’s disease (AD). Although jokes about “senior moments” are common, concern about AD incurs deep-seated worry. It is essential for clinicians to differentiate normal cognitive changes of aging—particularly those in memory—from early signs of neurodegenerative disease (Table 13).
In this article, we review typical memory changes in persons age >65, and differentiate these from mild cognitive impairment (MCI), an increasingly recognized prodrome of AD. Clinicians armed with knowledge of MCI are able to reassure the worried well, or recommend neuropsychological testing as indicated.
Is memory change inevitable with aging?
Memory loss is a common problem in aging, with variable severity. Research is establishing norms in cognitive functioning through the ninth decade of life.4 Controversy about sampling, measures, and methods abound,5 and drives prolific research on the subject, which is beyond the scope of this article. It has been demonstrated that there are a few “optimally aging” persons who avoid memory decline altogether.5,6 Most researchers and clinicians agree, however, that memory change is pervasive with advancing age.
Memory change follows a gradient with recent memories lost to a greater degree than remote memories (Ribot’s Law).7 Forgetfulness is characteristic of normal aging, and frequently manifests with misplaced objects and short-term lapses. However, this is not pathological—as long as the item or memory is recalled within 24 to 48 hours.
Compared with younger adults, healthy older adults are less efficient at encoding new information. Subsequently, they have more difficulty retrieving data, particularly after a delay. The time needed to learn and use new information increases, which is referred to as processing inefficiency. This influences changes in test performance across all cognitive domains, with decreases in measures of mental processing speed, working memory, and problem-solving.
Many patients who complain about “forgetfulness” are experiencing this normal change. It is not uncommon for a patient to offer a list of things she has forgotten recently, along with the dates and circumstances in which she forgot them. Because she sometimes forgets things, but remembers them later, there likely is nothing to worry about. If reminders—such as her list—help, this too is a good sign, because it shows her resourcefulness in using accommodations. If the patient is managing her normal activities, reassurance is warranted.
Mild cognitive impairment
Since at least 1958,8 clinical observations and research have recognized a prodrome that differentiates cognitive changes predictive of dementia from those that represent typical aging. Several studies and methods have converged toward consensus that MCI is a valid construct for that purpose, with ecological validity and sound predictive value. Clinical value is evident when a patient does not meet criteria for MCI; in this case, the clinician can reassure the worried well with conviction.
Revealing the diagnosis of MCI to patients requires sensitivity and assurance that you will reevaluate the condition annually. Although there is no evidence-based remedy for MCI or means to slow its progression to dementia, data are rapidly accruing regarding the value of lifestyle changes and other nonpharmacologic interventions.9
Recognizing MCI most simply requires 2 criteria:
The patient’s expressed concern about decline in cognitive functioning from a previous level of performance. Alternately, a caretaker’s report is valuable because the patient might lack insight. You are not looking for an inability to perform activities of daily living, which is indicative of frank dementia; rather, you want to determine whether the person’s independence in functional abilities is preserved, although less efficient. Patients might repeatedly report occurrences of new problems, although modest, in some cases. Although problems with memory often are the most frequently reported symptoms, changes can be observed in any cognitive domain. Uncharacteristic inability to understand instructions, frustration with new tasks, and inflexibility are common.
Quantified clinical assessment that the patient’s cognitive decline exceeds norms of his age cohort. Clinicians are already familiar with many of these tests (5-minute recall, clock face drawing, etc.). For MCI, we recommend the Montreal Cognitive Assessment (MoCA), which is specifically designed for MCI.10 It takes only 10 minutes to administer. Multiple versions of the MoCA, and instructions for its administration are available for provider use at www.mocatest.org.
When these criteria are met—a decline in previous functioning and an objective clinical confirmation—referral for neuropsychological testing is recommended. Subtypes of MCI—amnestic and non-amnestic—have been employed to specify the subtype (amnesic) that is most consistent with prodromal AD. However, this dichotomous scheme does not adequately explain or capture the heterogeneity of MCI.11,12
Medical considerations
Just as all domains of cognition are correlated to some degree, the overall health status of a person influences evaluation of memory. Variables, such as fatigue, test anxiety, mood, motivation, visual and auditory acuity, education, language fluency, attention, and pain, affect test performance. In addition, clinician rapport and the manner in which tests are administered must be considered.
Depression can mimic MCI. A depressed patient often has poor expectations of himself and slowed thinking, and might exaggerate symptoms. He might give up on tests or refuse to complete them. His presentation initially could suggest cognitive decline, but depression is revealed when the clinician pays attention to vegetative signs (insomnia, poor appetite) or suicidal ideation. There is growing evidence that subjective complaints of memory loss are more frequently associated with depression than with objective measures of cognitive impairment.13,14
Other treatable conditions can present with cognitive change (the so-called reversible dementias). A deficiency of vitamin B12, thiamine, or folate often is seen because quality of nutrition generally decreases with age. Hyponatremia and dehydration can present with confusion and memory impairment. Other treatable conditions include:
- cerebral vasculitis, which could improve with immune suppressants
- endocrine diseases, which might respond to hormonal or surgical treatment
- normal pressure hydrocephalus, which can be relieved by surgical placement of a shunt.
Take a complete history. What exactly is the nature of the patient or caregiver’s complaint? You need to attempt to engage the patient in conversation, observing his behavior during the evaluation. Is there notable delay in response, difficulty in attention and focus, or in understanding questions?
The content of speech is an indicator of the patient’s information processing. Ask the patient to recite as many animals from the jungle as possible. Most people can come up with at least 15. The person with MCI will likely name fewer animals, but may respond well to cueing, and perform better in recognition (eg, pictures or drawings) vs retrieval. When asked to describe a typical day, the patient may offer a vague, nonchalant response eg, “I keep busy watching the news.” This kind of response may be evidence of confabulation; with further questioning, he is unable to identify current issues of interest.
Substance abuse. It is essential that clinicians recognize that elders are not exempt from alcohol and other drug abuse that affects cognition. Skilled history taking, including attention to non-verbal responses, is indicated. A defensive tone, rolling of eyes, or silent yet affirmative nodding are means by which caregivers offer essential “clues” to the provider.
A quick screening tool for the office is valuable; many clinicians are most familiar with the Mini-Mental State Examination or the Saint Louis University Mental Status Examination, which are known to be sensitive in detecting memory problems and other cognitive defects. As we noted, the MoCA is now recommended for differentiating more subtle changes of MCI.10,15 It is important to remember that common conditions such as an urinary tract infection or trauma after anesthesia for routine procedures such as colonoscopy can cause cognitive impairment. Again, eliciting history from a family member is valuable because the patient may have forgotten vital data.
A good physical exam is important when evaluating for dementia. Look for any neurologic anomaly. Check for disinhibition of primitive reflexes, eg, abnormal grasp or snout response or Babinski sign. Compare the symmetry and strength of deep tendon reflexes. Look for neurologic soft signs. Any pathological reflex response can be an important clue about neurodegeneration or space-occupying lesions. We recall seeing a 62-year-old man whose spouse brought him for evaluation for new-onset reckless driving and marked inattention to personal hygiene that developed over the previous 3 months. On examination, he appeared disheveled and had a dull affect, although disinhibited and careless. His mentation and gait were slowed. He denied distress of any kind. Frontal release signs were noted on exam. An MRI revealed a space-occupying lesion of the frontal lobe measuring 3 cm wide with a thickness of 2 cm, which pathology confirmed as a benign tumor.
Always check for arrhythmia and hypertension. These are significant risk factors for ischemic brain disease, multiple-infarct stroke, or other forms of vascular dementia. A shuffling gait suggests Parkinson’s disease, or even Lewy body dementia, or medication-related conditions, for example, from antipsychotics.
Take a medication history. Many common treatments for anxiety and insomnia can cause symptoms that mimic dementia. Digitalis toxicity results in poor recall and confusion. Combinations of common medicines (antacids, antihistamines, and others) compete for metabolic pathways and lead to altered mental status. Referencing the Beers List16 is valuable; anticholinergics, benzodiazepines, and narcotic analgesics are of special concern. The latter could still be useful for comfort care at the end of life.
It is common for seniors to take a variety of untested and unproven supplements in the hope of preventing or lessening memory problems. In addition to incurring significant costs, the indiscriminate use of supplements poses risks of toxicity, including unintended interactions with prescribed medications. Many older adults do not disclose their use of these supplements to providers because they do not consider them “medicine.”
Labs. The next level of evaluation calls for a basic laboratory workup. Check complete blood count, liver enzymes, thyroid function tests, vitamin D, B12 and folate levels; perform urinalysis and a complete metabolic panel. Look at a general hormone panel; abnormal values could reveal a pituitary adenoma. (In the past 33 years, the first author has found 42 pituitary tumors in the workup of mental status change.)
We use imaging, such as a CT or MRI of the brain, in almost all cases of suspected dementia. Cerebral atrophy, space-occupying lesions, and shifting of the ventricles often correspond with cognitive decline.
Treatment
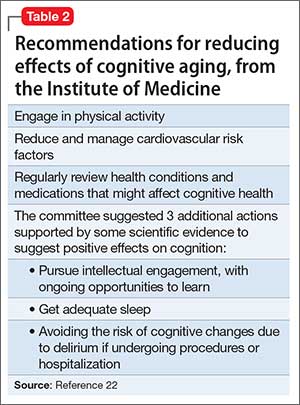
Effective treatment of dementia remains elusive. Other than for the “reversible dementias,” pharmacotherapy has shown less progress than had been expected. Donepezil, galantamine, rivastigmine, and memantine could slow disease progression in some cases. There have been many studies for dementia preventives and treatments. Extensive reviews and meta-analyses, including those of randomized controlled trials17-19 abound for a variety of herbs, supplements, and antioxidants; none have shown compelling results. Table 2 lists Institute of Medicine recommendations supported by evidence that could reduce effects of cognitive aging.20
Recommendations from collaboration between the National Institute on Aging and the Alzheimer’s Association21 state that research should focus on biomarkers, such as neural substrates or genotypes. Indicators of oxidative stress (cytokines) and inflammation (isoprostanes) show promise as measures of brain changes that correspond with increased risk of AD or other dementias.
Summing up
Older adults are a heterogeneous group. Intellectual capacity does not diminish with advancing age. Many elders now exceed expectations for productivity, athletic ability, scientific achievement, and the creative arts. Others live longer with diminished quality of life, their health compromised by progressive neurodegenerative disease.
Age-associated memory change often is exaggerated and feared by older adults and, regrettably, is associated with inevitable functional impairment and is seen as heralding the loss of autonomy. The worried well are anxious, although the stigma associated with cognitive decline may preclude confiding their concerns.
Providers need the tools and acumen to treat patients along an increasingly long continuum of time, including conveyance of evidence-based encouragement toward optimal health and vitality.
1. Serby MJ, Yhap C, Landron EY. A study of herbal remedies for memory complaints. J Neuropsychiatry Clin Neurosci. 2010;22(3):345-347.
2. Jaremka LM, Derry HM, Bornstein R, et al. Omega-3 supplementation and loneliness-related memory problems: secondary analyses of a randomized controlled trial. Psychosom Med. 2014;76(8):650-658.
3. Depp CA, Harmell A, Vania IV. Successful cognitive aging. In: Pardon MC, Bondi MW, eds. Behavioral neurobiology of aging. New York, NY: Springer-Verlag; 2012:35-50.
4. Invik RJ, Malec JF, Smith GE, et al. Mayo’s older Americans normative studies: WAIS-R, WMS-R, and AVLT norms for ages 56 to 97. Clin Neuropsychol. 1992;6(suppl 1):1-104.
5. Powell DH, Whitla DK. Profiles in cognitive aging. Boston, MA: Harvard University Press; 1994.
6. Negash S, Smith GE, Pankratz SE, et al. Successful aging: definitions and prediction of longevity and conversion to mild cognitive impairment. Am J Geriatr Psychiatry. 2011;19(6):581-588.
7. Ribot T. Diseases of memory: an essay in the positive psychology. London, United Kingdom: Kegan Paul Trench; 1882.
8. Kral VA. Neuropsychiatric observations in old peoples home: studies of memory dysfunction in senescence. J Gerontol. 1958;13(2):169-176.
9. Gitlin LN, Kales HC, Lyketsos CG. Nonpharmacologic management of behavioral symptoms in dementia. JAMA. 2012;308(19):2020-2029.
10. Nasreddine ZS, Phillips NA, Bédirian V, et al. The Montreal Cognitive Assessment, MoCA: a brief screening tool for mild cognitive assessment. J Am Geriatr Soc. 2005;53(4):695-699.
11. Clark LR, Delano-Wood L, Lisbon DJ, et al. Are empirically-derived subtypes of mild cognitive impairment consistent with conventional subtypes? J Intl Neuropsychol Soc. 2013;19(6):1-11.
12. Ganguli M, Snitz BE, Saxton JA, et al. Outcomes of mild cognitive impairment by definition: a population study. Arch Neurol. 2011;68(6):761-767.
13. Bartley M, Bokde AL, Ewers M, et al. Subjective memory complaints in community dwelling older people: the influence of brain and psychopathology. Intl J Geriatr Psychiatry. 2012;27(8):836-843.
14. Chung JC, Man DW. Self-appraised, informant-reported, and objective memory and cognitive function in mild cognitive impairment. Dement Geriatr Cogn Disord. 2009;27(2):187-193.
15. Tsoi KK, Chan JY, Hirai HW, et al. Cognitive tests to detect dementia: a systematic review and meta-analysis. JAMA Intern Med. 2015;175(9):1450-1458.
16. American Geriatrics Society 2012 Beers Criteria Update Expert Panel. American Geriatrics Society updated Beers Criteria for potentially inappropriate medication use in older adults. J Am Geriatr Soc. 2012;60(4):616-631.
17. May BH, Yang AW, Zhang AL, et al. Chinese herbal medicine for mild cognitive impairment and age associated memory impairment: a review of randomised controlled trials. Biogerontology. 2009;10(2):109-123.
18. Loef M, Walach H. The omega-6/omega-3 ratio and dementia or cognitive decline: a systematic review on human studies and biological evidence. J Nutr Gerontol Geriatr. 2013;32(1):1-23.
19. Solfrizzi VP, Panza F. Plant-based nutraceutical interventions against cognitive impairment and dementia: meta-analytic evidence of efficacy of a standardized Gingko biloba extract. J Alzheimers Dis. 2015;43(2):605-611.
20. Institute of Medicine. Cognitive aging: progress in understanding and opportunities for action. Washington, DC: National Academies Press; 2015.
21. Albert MS, DeKosky ST, Dickson D, et al. The diagnosis of mild cognitive impairment due to Alzheimer’s disease: recommendations from the National Institute on Aging-Alzheimer’s Association workgroups on diagnostic guidelines for Alzheimer’s disease. Alzheimers Dement. 2011;7(3):270-279.
Many older patients are concerned about their memory. The “worried well” may come into your office with a list of things they can’t recall, yet they remember each “deficit” quite well. Anticipatory anxiety about one’s own decline is common, and is most often concerned with changes in memory.1,2
Patients with dementia or early cognitive decline often are oblivious to their cognitive changes, however. Of particular concern is progressive dementia, especially Alzheimer’s disease (AD). Although jokes about “senior moments” are common, concern about AD incurs deep-seated worry. It is essential for clinicians to differentiate normal cognitive changes of aging—particularly those in memory—from early signs of neurodegenerative disease (Table 13).
In this article, we review typical memory changes in persons age >65, and differentiate these from mild cognitive impairment (MCI), an increasingly recognized prodrome of AD. Clinicians armed with knowledge of MCI are able to reassure the worried well, or recommend neuropsychological testing as indicated.
Is memory change inevitable with aging?
Memory loss is a common problem in aging, with variable severity. Research is establishing norms in cognitive functioning through the ninth decade of life.4 Controversy about sampling, measures, and methods abound,5 and drives prolific research on the subject, which is beyond the scope of this article. It has been demonstrated that there are a few “optimally aging” persons who avoid memory decline altogether.5,6 Most researchers and clinicians agree, however, that memory change is pervasive with advancing age.
Memory change follows a gradient with recent memories lost to a greater degree than remote memories (Ribot’s Law).7 Forgetfulness is characteristic of normal aging, and frequently manifests with misplaced objects and short-term lapses. However, this is not pathological—as long as the item or memory is recalled within 24 to 48 hours.
Compared with younger adults, healthy older adults are less efficient at encoding new information. Subsequently, they have more difficulty retrieving data, particularly after a delay. The time needed to learn and use new information increases, which is referred to as processing inefficiency. This influences changes in test performance across all cognitive domains, with decreases in measures of mental processing speed, working memory, and problem-solving.
Many patients who complain about “forgetfulness” are experiencing this normal change. It is not uncommon for a patient to offer a list of things she has forgotten recently, along with the dates and circumstances in which she forgot them. Because she sometimes forgets things, but remembers them later, there likely is nothing to worry about. If reminders—such as her list—help, this too is a good sign, because it shows her resourcefulness in using accommodations. If the patient is managing her normal activities, reassurance is warranted.
Mild cognitive impairment
Since at least 1958,8 clinical observations and research have recognized a prodrome that differentiates cognitive changes predictive of dementia from those that represent typical aging. Several studies and methods have converged toward consensus that MCI is a valid construct for that purpose, with ecological validity and sound predictive value. Clinical value is evident when a patient does not meet criteria for MCI; in this case, the clinician can reassure the worried well with conviction.
Revealing the diagnosis of MCI to patients requires sensitivity and assurance that you will reevaluate the condition annually. Although there is no evidence-based remedy for MCI or means to slow its progression to dementia, data are rapidly accruing regarding the value of lifestyle changes and other nonpharmacologic interventions.9
Recognizing MCI most simply requires 2 criteria:
The patient’s expressed concern about decline in cognitive functioning from a previous level of performance. Alternately, a caretaker’s report is valuable because the patient might lack insight. You are not looking for an inability to perform activities of daily living, which is indicative of frank dementia; rather, you want to determine whether the person’s independence in functional abilities is preserved, although less efficient. Patients might repeatedly report occurrences of new problems, although modest, in some cases. Although problems with memory often are the most frequently reported symptoms, changes can be observed in any cognitive domain. Uncharacteristic inability to understand instructions, frustration with new tasks, and inflexibility are common.
Quantified clinical assessment that the patient’s cognitive decline exceeds norms of his age cohort. Clinicians are already familiar with many of these tests (5-minute recall, clock face drawing, etc.). For MCI, we recommend the Montreal Cognitive Assessment (MoCA), which is specifically designed for MCI.10 It takes only 10 minutes to administer. Multiple versions of the MoCA, and instructions for its administration are available for provider use at www.mocatest.org.
When these criteria are met—a decline in previous functioning and an objective clinical confirmation—referral for neuropsychological testing is recommended. Subtypes of MCI—amnestic and non-amnestic—have been employed to specify the subtype (amnesic) that is most consistent with prodromal AD. However, this dichotomous scheme does not adequately explain or capture the heterogeneity of MCI.11,12
Medical considerations
Just as all domains of cognition are correlated to some degree, the overall health status of a person influences evaluation of memory. Variables, such as fatigue, test anxiety, mood, motivation, visual and auditory acuity, education, language fluency, attention, and pain, affect test performance. In addition, clinician rapport and the manner in which tests are administered must be considered.
Depression can mimic MCI. A depressed patient often has poor expectations of himself and slowed thinking, and might exaggerate symptoms. He might give up on tests or refuse to complete them. His presentation initially could suggest cognitive decline, but depression is revealed when the clinician pays attention to vegetative signs (insomnia, poor appetite) or suicidal ideation. There is growing evidence that subjective complaints of memory loss are more frequently associated with depression than with objective measures of cognitive impairment.13,14
Other treatable conditions can present with cognitive change (the so-called reversible dementias). A deficiency of vitamin B12, thiamine, or folate often is seen because quality of nutrition generally decreases with age. Hyponatremia and dehydration can present with confusion and memory impairment. Other treatable conditions include:
- cerebral vasculitis, which could improve with immune suppressants
- endocrine diseases, which might respond to hormonal or surgical treatment
- normal pressure hydrocephalus, which can be relieved by surgical placement of a shunt.
Take a complete history. What exactly is the nature of the patient or caregiver’s complaint? You need to attempt to engage the patient in conversation, observing his behavior during the evaluation. Is there notable delay in response, difficulty in attention and focus, or in understanding questions?
The content of speech is an indicator of the patient’s information processing. Ask the patient to recite as many animals from the jungle as possible. Most people can come up with at least 15. The person with MCI will likely name fewer animals, but may respond well to cueing, and perform better in recognition (eg, pictures or drawings) vs retrieval. When asked to describe a typical day, the patient may offer a vague, nonchalant response eg, “I keep busy watching the news.” This kind of response may be evidence of confabulation; with further questioning, he is unable to identify current issues of interest.
Substance abuse. It is essential that clinicians recognize that elders are not exempt from alcohol and other drug abuse that affects cognition. Skilled history taking, including attention to non-verbal responses, is indicated. A defensive tone, rolling of eyes, or silent yet affirmative nodding are means by which caregivers offer essential “clues” to the provider.
A quick screening tool for the office is valuable; many clinicians are most familiar with the Mini-Mental State Examination or the Saint Louis University Mental Status Examination, which are known to be sensitive in detecting memory problems and other cognitive defects. As we noted, the MoCA is now recommended for differentiating more subtle changes of MCI.10,15 It is important to remember that common conditions such as an urinary tract infection or trauma after anesthesia for routine procedures such as colonoscopy can cause cognitive impairment. Again, eliciting history from a family member is valuable because the patient may have forgotten vital data.
A good physical exam is important when evaluating for dementia. Look for any neurologic anomaly. Check for disinhibition of primitive reflexes, eg, abnormal grasp or snout response or Babinski sign. Compare the symmetry and strength of deep tendon reflexes. Look for neurologic soft signs. Any pathological reflex response can be an important clue about neurodegeneration or space-occupying lesions. We recall seeing a 62-year-old man whose spouse brought him for evaluation for new-onset reckless driving and marked inattention to personal hygiene that developed over the previous 3 months. On examination, he appeared disheveled and had a dull affect, although disinhibited and careless. His mentation and gait were slowed. He denied distress of any kind. Frontal release signs were noted on exam. An MRI revealed a space-occupying lesion of the frontal lobe measuring 3 cm wide with a thickness of 2 cm, which pathology confirmed as a benign tumor.
Always check for arrhythmia and hypertension. These are significant risk factors for ischemic brain disease, multiple-infarct stroke, or other forms of vascular dementia. A shuffling gait suggests Parkinson’s disease, or even Lewy body dementia, or medication-related conditions, for example, from antipsychotics.
Take a medication history. Many common treatments for anxiety and insomnia can cause symptoms that mimic dementia. Digitalis toxicity results in poor recall and confusion. Combinations of common medicines (antacids, antihistamines, and others) compete for metabolic pathways and lead to altered mental status. Referencing the Beers List16 is valuable; anticholinergics, benzodiazepines, and narcotic analgesics are of special concern. The latter could still be useful for comfort care at the end of life.
It is common for seniors to take a variety of untested and unproven supplements in the hope of preventing or lessening memory problems. In addition to incurring significant costs, the indiscriminate use of supplements poses risks of toxicity, including unintended interactions with prescribed medications. Many older adults do not disclose their use of these supplements to providers because they do not consider them “medicine.”
Labs. The next level of evaluation calls for a basic laboratory workup. Check complete blood count, liver enzymes, thyroid function tests, vitamin D, B12 and folate levels; perform urinalysis and a complete metabolic panel. Look at a general hormone panel; abnormal values could reveal a pituitary adenoma. (In the past 33 years, the first author has found 42 pituitary tumors in the workup of mental status change.)
We use imaging, such as a CT or MRI of the brain, in almost all cases of suspected dementia. Cerebral atrophy, space-occupying lesions, and shifting of the ventricles often correspond with cognitive decline.
Treatment
Effective treatment of dementia remains elusive. Other than for the “reversible dementias,” pharmacotherapy has shown less progress than had been expected. Donepezil, galantamine, rivastigmine, and memantine could slow disease progression in some cases. There have been many studies for dementia preventives and treatments. Extensive reviews and meta-analyses, including those of randomized controlled trials17-19 abound for a variety of herbs, supplements, and antioxidants; none have shown compelling results. Table 2 lists Institute of Medicine recommendations supported by evidence that could reduce effects of cognitive aging.20
Recommendations from collaboration between the National Institute on Aging and the Alzheimer’s Association21 state that research should focus on biomarkers, such as neural substrates or genotypes. Indicators of oxidative stress (cytokines) and inflammation (isoprostanes) show promise as measures of brain changes that correspond with increased risk of AD or other dementias.
Summing up
Older adults are a heterogeneous group. Intellectual capacity does not diminish with advancing age. Many elders now exceed expectations for productivity, athletic ability, scientific achievement, and the creative arts. Others live longer with diminished quality of life, their health compromised by progressive neurodegenerative disease.
Age-associated memory change often is exaggerated and feared by older adults and, regrettably, is associated with inevitable functional impairment and is seen as heralding the loss of autonomy. The worried well are anxious, although the stigma associated with cognitive decline may preclude confiding their concerns.
Providers need the tools and acumen to treat patients along an increasingly long continuum of time, including conveyance of evidence-based encouragement toward optimal health and vitality.
1. Serby MJ, Yhap C, Landron EY. A study of herbal remedies for memory complaints. J Neuropsychiatry Clin Neurosci. 2010;22(3):345-347.
2. Jaremka LM, Derry HM, Bornstein R, et al. Omega-3 supplementation and loneliness-related memory problems: secondary analyses of a randomized controlled trial. Psychosom Med. 2014;76(8):650-658.
3. Depp CA, Harmell A, Vania IV. Successful cognitive aging. In: Pardon MC, Bondi MW, eds. Behavioral neurobiology of aging. New York, NY: Springer-Verlag; 2012:35-50.
4. Invik RJ, Malec JF, Smith GE, et al. Mayo’s older Americans normative studies: WAIS-R, WMS-R, and AVLT norms for ages 56 to 97. Clin Neuropsychol. 1992;6(suppl 1):1-104.
5. Powell DH, Whitla DK. Profiles in cognitive aging. Boston, MA: Harvard University Press; 1994.
6. Negash S, Smith GE, Pankratz SE, et al. Successful aging: definitions and prediction of longevity and conversion to mild cognitive impairment. Am J Geriatr Psychiatry. 2011;19(6):581-588.
7. Ribot T. Diseases of memory: an essay in the positive psychology. London, United Kingdom: Kegan Paul Trench; 1882.
8. Kral VA. Neuropsychiatric observations in old peoples home: studies of memory dysfunction in senescence. J Gerontol. 1958;13(2):169-176.
9. Gitlin LN, Kales HC, Lyketsos CG. Nonpharmacologic management of behavioral symptoms in dementia. JAMA. 2012;308(19):2020-2029.
10. Nasreddine ZS, Phillips NA, Bédirian V, et al. The Montreal Cognitive Assessment, MoCA: a brief screening tool for mild cognitive assessment. J Am Geriatr Soc. 2005;53(4):695-699.
11. Clark LR, Delano-Wood L, Lisbon DJ, et al. Are empirically-derived subtypes of mild cognitive impairment consistent with conventional subtypes? J Intl Neuropsychol Soc. 2013;19(6):1-11.
12. Ganguli M, Snitz BE, Saxton JA, et al. Outcomes of mild cognitive impairment by definition: a population study. Arch Neurol. 2011;68(6):761-767.
13. Bartley M, Bokde AL, Ewers M, et al. Subjective memory complaints in community dwelling older people: the influence of brain and psychopathology. Intl J Geriatr Psychiatry. 2012;27(8):836-843.
14. Chung JC, Man DW. Self-appraised, informant-reported, and objective memory and cognitive function in mild cognitive impairment. Dement Geriatr Cogn Disord. 2009;27(2):187-193.
15. Tsoi KK, Chan JY, Hirai HW, et al. Cognitive tests to detect dementia: a systematic review and meta-analysis. JAMA Intern Med. 2015;175(9):1450-1458.
16. American Geriatrics Society 2012 Beers Criteria Update Expert Panel. American Geriatrics Society updated Beers Criteria for potentially inappropriate medication use in older adults. J Am Geriatr Soc. 2012;60(4):616-631.
17. May BH, Yang AW, Zhang AL, et al. Chinese herbal medicine for mild cognitive impairment and age associated memory impairment: a review of randomised controlled trials. Biogerontology. 2009;10(2):109-123.
18. Loef M, Walach H. The omega-6/omega-3 ratio and dementia or cognitive decline: a systematic review on human studies and biological evidence. J Nutr Gerontol Geriatr. 2013;32(1):1-23.
19. Solfrizzi VP, Panza F. Plant-based nutraceutical interventions against cognitive impairment and dementia: meta-analytic evidence of efficacy of a standardized Gingko biloba extract. J Alzheimers Dis. 2015;43(2):605-611.
20. Institute of Medicine. Cognitive aging: progress in understanding and opportunities for action. Washington, DC: National Academies Press; 2015.
21. Albert MS, DeKosky ST, Dickson D, et al. The diagnosis of mild cognitive impairment due to Alzheimer’s disease: recommendations from the National Institute on Aging-Alzheimer’s Association workgroups on diagnostic guidelines for Alzheimer’s disease. Alzheimers Dement. 2011;7(3):270-279.

Reframing the problem seen as way to ease inpatient bed shortage
If an individual with schizophrenia presents to the emergency department, there’s about a 1 in 2 chance that person will wind up in an inpatient psychiatric bed, or transferred to a residential psychiatric facility. As reimbursement to hospitals for psychiatric beds decreases, there’s decreasing incentive for hospitals to maintain inpatient psychiatry services.
Decreasing numbers of hospital beds means strategic thinking about outpatient services is more important than ever, to help avert the crises that bring patients to EDs and to run-ins with the justice system. In some parts of the country, though, the downstream effects of cutbacks and increased demand are overwhelming the system.
For Dr. Carl C. Bell, the combination of shrinking resources and growing need feels like a prescription for disaster in Chicago. Dr. Bell, a psychiatrist who has spent decades providing community mental health services there, saw a relatively robust mental health infrastructure crumble when municipal belt tightening resulted in the consolidation of 13 mental health centers down to just 6.
As individuals with serious mental illness lost access to such outpatient resources as therapy, medication management, supported housing, and employment assistance, jail populations swelled. The Cook County jail became known as “the largest mental health center in the state of Illinois,” said Dr. Bell. He’s not sure he sees a good solution for the near term, but he holds out hope that innovative solutions are on the horizon.
Telepsychiatry offers an eminently workable solution to scarcity and geographic separation in some areas. Dr. David Baldes, a psychiatrist at St. Luke’s Health Care System in Duluth, Minn., “sees” patients via his computer several hours a week. He’s able to care for the sickest of the patients with mental illness served by primary care clinics along the Iron Range in northern Minnesota, helping keep this population out of the emergency department and fending off brushes with the law that are all too common among those with serious mental illnesses such as schizophrenia and severe bipolar disorder.

“The people I see tend to be really sick,” said Dr. Baldes, “and the number of psychiatrists per capita is basically zero” on the Iron Range. Although the area is served by a federally funded community mental health center, it’s extremely difficult to attract and retain psychiatrists to the remote area.
His ability to provide care for patients with serious mental illness helps their primary care providers “not feel so much like they’re on an island,” he said. He enjoys the collaboration and support he’s able to provide for the primary physicians as well.
Getting things started wasn’t hard: “The technology was actually quite simple to set up,” he said, noting that psychiatry is an ideal discipline for virtual care. “We don’t touch the patient. Our exam is our conversation with the patient,” he said.
Another advantage of telepsychiatry, Dr. Baldes said, is that there’s no stigma associated with visiting one’s primary care provider. “My patients go to their regular doctor’s office, they check in with the receptionist, and nobody really knows why they are there.” This can be a particular advantage in some of the more conservative rural communities served by the St. Luke’s program.
This mode of care soon feels completely natural for physician and patient, he said. “Especially for our generation; we’re very comfortable with FaceTime, with Skype, and generally with communicating electronically,” Dr. Baldes said.
“What patients really want is to be able to do these visits from their home,” he said. Because of privacy and security concerns, patients still go to the primary care office to have their virtual visits with Dr. Baldes.
Telepsychiatry’s promise is not limited to rural areas. “Any time people are resource limited, transportation is always an issue,” Dr. Baldes said. The suburbs and exurbs of many American cities are increasingly populated by low-income individuals forced out of gentrifying city centers into areas with fewer mental health resources and fewer transportation options. Telepsychiatry could be useful in many settings, he said.
A more fully integrated suite of services, the Collaborative Care Model (CCM), has been piloted in five locations nationwide and was the subject of an April 14, 2016, congressional briefing. This care model goes beyond co-location and collaboration to encompass a specific set of team members providing specific services, with ongoing tracking of validated outcome measures.
Dr. Erik Vanderlip, professor of psychiatry and medical informatics at the University of Oklahoma, Tulsa, coauthored a recent report sharing evidence of the successful implementation of collaborative care. He said the CCM really represents a shift in thinking. “The lack of psychiatric beds isn’t the problem. The problem is the lack of affordable, accessible, high-quality mental health services,” and collaborative care seeks to meet that need.
Dr. Vanderlip is a double-boarded psychiatrist and family medicine physician; he said that during training, “I discovered quickly that we have to redesign the way we deliver health care services to meet the needs of the most vulnerable.” He began working with Dr. Wayne Katon, now deceased, who pioneered the collaborative care model in Washington state.
In practice, this means that a psychiatrist works with a primary care provider and other team members to provide intensive care and monitoring. Clinical trials have shown impressive results in the treatment of depression, with response rates approaching 70%, Dr. Vanderlip said. “This stuff is the solution,” he said.
“So you have these little ‘teamlets’ of the psychiatrist, the primary care provider, the care manager, and the nurse working together to take care of a cohort of patients,” Dr. Vanderlip said. Typically, a care manager will have from 40 to as many as 100 patients under his or her care.
Key to measuring the success of the care model is an objective, validated measure that changes in relation to improvement or worsening of the target chronic condition. For example, in depression, that measure is the Patient Health Questionnaire (PHQ-9).
In the CCM, a psychiatrist will log in to the secure patient management system and pull up the entire registry of the care manager’s patients. One by one, patients are briefly reviewed, and the care plan and medications are adjusted as needed. The psychiatrist completes a brief note for each patient during the session; notes have a disclaimer that makes clear that the physician did not have a face-to-face encounter with the patient.
The psychiatrists also are available for “curbside” consults to the primary care provider, so they may collaborate on patients’ care plans. For one care manager’s panel of 40-100 patients, a psychiatrist will typically devote about a half day per week of consultative time.
Dr. Vanderlip has found that for some psychiatrists, the new role of “care quarterback” can be a tough sell. “Providers have a hard time comprehending that they are not going to see people directly.” Most psychiatrists involved in collaborative care also see patients in the traditional model as well, he said.
A critical piece of the puzzle for the success of integrated care is reimbursement – and the CCM now has its own CPT code. “There’s reimbursement for the psychiatrist’s time, for the care manager’s time, and for the primary care provider’s time,” Dr. Vanderlip said. The American Psychiatric Association is in discussion with the Centers for Medicare & Medicaid Services and the American Medical Association to fine-tune valuation.
“This is a great candidate for value-based reimbursement,” Dr. Vanderlip said. Depression scores can be tracked over time; successful care teams could be rewarded – and less successful ones docked – depending on patient outcome measures.
As reimbursers seek to find more ways to recognize the burden that chronic care places on the health care system, collaborative care should find more takers. “Collaborative care is chronic care incarnate,” Dr. Vanderlip said. He said he thinks it’s the solution for the care crunch in America. “This is not a bed shortage problem,” he reiterated.
Availability of inpatient services wide ranging
The number of psychiatric hospital beds per capita varies widely by state, as does the availability of psychiatrists and outpatient mental health facilities. In 2011, the American Hospital Association reported that psychiatric bed allocations ranged from a low of about 5 beds per 100,000 persons in Colorado to a high of more than 50 beds per 100,000 persons in both Missouri and Mississippi.
Reported rates of hospital admission among adults with a diagnosis of any mental illness also varies, from 1.1% in Louisiana, to 4.9% in New York (2010-2011 Substance Abuse and Mental Health Services Administration report).
State-by-state estimates of the prevalence of serious mental illness in adults ranges from just under 3% to about 7% (2012 revised SAMHSA report).
On Twitter @karioakes
If an individual with schizophrenia presents to the emergency department, there’s about a 1 in 2 chance that person will wind up in an inpatient psychiatric bed, or transferred to a residential psychiatric facility. As reimbursement to hospitals for psychiatric beds decreases, there’s decreasing incentive for hospitals to maintain inpatient psychiatry services.
Decreasing numbers of hospital beds means strategic thinking about outpatient services is more important than ever, to help avert the crises that bring patients to EDs and to run-ins with the justice system. In some parts of the country, though, the downstream effects of cutbacks and increased demand are overwhelming the system.
For Dr. Carl C. Bell, the combination of shrinking resources and growing need feels like a prescription for disaster in Chicago. Dr. Bell, a psychiatrist who has spent decades providing community mental health services there, saw a relatively robust mental health infrastructure crumble when municipal belt tightening resulted in the consolidation of 13 mental health centers down to just 6.
As individuals with serious mental illness lost access to such outpatient resources as therapy, medication management, supported housing, and employment assistance, jail populations swelled. The Cook County jail became known as “the largest mental health center in the state of Illinois,” said Dr. Bell. He’s not sure he sees a good solution for the near term, but he holds out hope that innovative solutions are on the horizon.
Telepsychiatry offers an eminently workable solution to scarcity and geographic separation in some areas. Dr. David Baldes, a psychiatrist at St. Luke’s Health Care System in Duluth, Minn., “sees” patients via his computer several hours a week. He’s able to care for the sickest of the patients with mental illness served by primary care clinics along the Iron Range in northern Minnesota, helping keep this population out of the emergency department and fending off brushes with the law that are all too common among those with serious mental illnesses such as schizophrenia and severe bipolar disorder.
“The people I see tend to be really sick,” said Dr. Baldes, “and the number of psychiatrists per capita is basically zero” on the Iron Range. Although the area is served by a federally funded community mental health center, it’s extremely difficult to attract and retain psychiatrists to the remote area.
His ability to provide care for patients with serious mental illness helps their primary care providers “not feel so much like they’re on an island,” he said. He enjoys the collaboration and support he’s able to provide for the primary physicians as well.
Getting things started wasn’t hard: “The technology was actually quite simple to set up,” he said, noting that psychiatry is an ideal discipline for virtual care. “We don’t touch the patient. Our exam is our conversation with the patient,” he said.
Another advantage of telepsychiatry, Dr. Baldes said, is that there’s no stigma associated with visiting one’s primary care provider. “My patients go to their regular doctor’s office, they check in with the receptionist, and nobody really knows why they are there.” This can be a particular advantage in some of the more conservative rural communities served by the St. Luke’s program.
This mode of care soon feels completely natural for physician and patient, he said. “Especially for our generation; we’re very comfortable with FaceTime, with Skype, and generally with communicating electronically,” Dr. Baldes said.
“What patients really want is to be able to do these visits from their home,” he said. Because of privacy and security concerns, patients still go to the primary care office to have their virtual visits with Dr. Baldes.
Telepsychiatry’s promise is not limited to rural areas. “Any time people are resource limited, transportation is always an issue,” Dr. Baldes said. The suburbs and exurbs of many American cities are increasingly populated by low-income individuals forced out of gentrifying city centers into areas with fewer mental health resources and fewer transportation options. Telepsychiatry could be useful in many settings, he said.
A more fully integrated suite of services, the Collaborative Care Model (CCM), has been piloted in five locations nationwide and was the subject of an April 14, 2016, congressional briefing. This care model goes beyond co-location and collaboration to encompass a specific set of team members providing specific services, with ongoing tracking of validated outcome measures.
Dr. Erik Vanderlip, professor of psychiatry and medical informatics at the University of Oklahoma, Tulsa, coauthored a recent report sharing evidence of the successful implementation of collaborative care. He said the CCM really represents a shift in thinking. “The lack of psychiatric beds isn’t the problem. The problem is the lack of affordable, accessible, high-quality mental health services,” and collaborative care seeks to meet that need.
Dr. Vanderlip is a double-boarded psychiatrist and family medicine physician; he said that during training, “I discovered quickly that we have to redesign the way we deliver health care services to meet the needs of the most vulnerable.” He began working with Dr. Wayne Katon, now deceased, who pioneered the collaborative care model in Washington state.
In practice, this means that a psychiatrist works with a primary care provider and other team members to provide intensive care and monitoring. Clinical trials have shown impressive results in the treatment of depression, with response rates approaching 70%, Dr. Vanderlip said. “This stuff is the solution,” he said.
“So you have these little ‘teamlets’ of the psychiatrist, the primary care provider, the care manager, and the nurse working together to take care of a cohort of patients,” Dr. Vanderlip said. Typically, a care manager will have from 40 to as many as 100 patients under his or her care.
Key to measuring the success of the care model is an objective, validated measure that changes in relation to improvement or worsening of the target chronic condition. For example, in depression, that measure is the Patient Health Questionnaire (PHQ-9).
In the CCM, a psychiatrist will log in to the secure patient management system and pull up the entire registry of the care manager’s patients. One by one, patients are briefly reviewed, and the care plan and medications are adjusted as needed. The psychiatrist completes a brief note for each patient during the session; notes have a disclaimer that makes clear that the physician did not have a face-to-face encounter with the patient.
The psychiatrists also are available for “curbside” consults to the primary care provider, so they may collaborate on patients’ care plans. For one care manager’s panel of 40-100 patients, a psychiatrist will typically devote about a half day per week of consultative time.
Dr. Vanderlip has found that for some psychiatrists, the new role of “care quarterback” can be a tough sell. “Providers have a hard time comprehending that they are not going to see people directly.” Most psychiatrists involved in collaborative care also see patients in the traditional model as well, he said.
A critical piece of the puzzle for the success of integrated care is reimbursement – and the CCM now has its own CPT code. “There’s reimbursement for the psychiatrist’s time, for the care manager’s time, and for the primary care provider’s time,” Dr. Vanderlip said. The American Psychiatric Association is in discussion with the Centers for Medicare & Medicaid Services and the American Medical Association to fine-tune valuation.
“This is a great candidate for value-based reimbursement,” Dr. Vanderlip said. Depression scores can be tracked over time; successful care teams could be rewarded – and less successful ones docked – depending on patient outcome measures.
As reimbursers seek to find more ways to recognize the burden that chronic care places on the health care system, collaborative care should find more takers. “Collaborative care is chronic care incarnate,” Dr. Vanderlip said. He said he thinks it’s the solution for the care crunch in America. “This is not a bed shortage problem,” he reiterated.
Availability of inpatient services wide ranging
The number of psychiatric hospital beds per capita varies widely by state, as does the availability of psychiatrists and outpatient mental health facilities. In 2011, the American Hospital Association reported that psychiatric bed allocations ranged from a low of about 5 beds per 100,000 persons in Colorado to a high of more than 50 beds per 100,000 persons in both Missouri and Mississippi.
Reported rates of hospital admission among adults with a diagnosis of any mental illness also varies, from 1.1% in Louisiana, to 4.9% in New York (2010-2011 Substance Abuse and Mental Health Services Administration report).
State-by-state estimates of the prevalence of serious mental illness in adults ranges from just under 3% to about 7% (2012 revised SAMHSA report).
On Twitter @karioakes

Psychotherapy
The term “psychotherapy” describes a variety of talk-based treatments for psychiatric illnesses. Its fundamental premise is that there are determinants of mood, anxiety, and behavior that are not fully in our conscious awareness. By becoming more aware or by developing skills in managing thoughts and feelings, patients can get relief from symptoms that often impair functioning. The focus on unconscious thoughts, feelings, and behaviors is the central principle of dynamic psychotherapy in which the therapist listens to the patients speak freely about important people and events in their day-to-day lives and takes note of themes that emerge. Eventually they offer “interpretations” to their patients about these patterns, and ways that current problems may connect to powerful experiences from their earlier lives.
Dynamic psychotherapy is often contrasted with supportive psychotherapy. This is not cheerleading, but instead refers to supporting the healthy ability to think about oneself, one’s thoughts and emotions, and one’s needs, and the tension that these can create with the expectations of society. In working with children and adolescents, therapists are almost always supporting the age-appropriate development of some of these skills, particularly if a child has gotten developmentally stuck because of depressive, anxious, or attentional symptoms. There are almost always supportive elements in psychotherapy with a school-age or teenage child.

For children with anxiety disorders or mild to moderate depression, cognitive-behavioral therapy (CBT) is an evidence-based first-line treatment. CBT is a structured psychotherapy that helps patients to identify specific thoughts that trigger or follow their mood or anxiety symptoms, and then sets about establishing new (less-distorted) thoughts or practicing avoided behaviors to help learn new responses. It appears to be especially effective for anxiety disorders (such as social phobia, panic disorder, and generalized anxiety disorder) and for obsessive-compulsive disorder. There are specialized types of CBT that can be offered to patients (including children) who have been exposed to trauma and even for teenagers experiencing psychotic symptoms. It should be noted that one of the reasons that CBT has a robust evidence base supporting its use is that it is one of the most structured types of psychotherapy. It is standardized, reproducible, and easier to study than most other varieties of psychotherapy. Practicing CBT requires specific training, so in looking for a CBT therapist, one needs to ask whether she is CBT trained, and even whether she is trained in the type of CBT specific for the disorder you are treating.
A relative of CBT is dialectical behavioral therapy or DBT, developed to treat borderline personality disorder, a maladaptive pattern of identity uncertainty, emotional instability, and impulsivity that often starts in adolescence, causing stormy relationships and poor self-regulation that can contribute to self-injury, substance abuse, and chronic suicidality. DBT focuses on cognitive patterns, and utilizes a patient’s strengths to build new skills at managing challenging thoughts and feelings. The “dialectic” relates to interpersonal relationships, as this is where these patients often have great difficulty. High-quality DBT is often done with both individual and group therapy sessions. There is substantial evidence supporting the efficacy of this therapy in patients with borderline personality disorder.

Play therapy generally refers to the use of play (with toys, dolls, art, or games) in therapy with the youngest children. Such young children are unlikely to speak in a fluid manner about their relationships or struggles, as they may lack some of the cognitive means to be self-reflective. So instead, a therapist will watch for themes in their play (aggression, cheating, repetitive stories with dolls or art) that may reflect important themes, that they will then work on in play or in speaking, as tolerated. Therapists of older children also may use play to help these children feel more comfortable as they proceed with CBT or another talk therapy.
While gathering data from parents is always part of therapy for children, family therapy brings the whole family into a room with the therapist, who focuses on the roles each person may play in the family and patterns of communication (verbal and otherwise) that may be contributing to a young person’s symptoms. Family therapy can be very important in treating anorexia nervosa, somatoform illnesses, and conduct disorder in children and adolescents. While it can be a complex type of therapy to study, there is significant evidence supporting its efficacy in these very challenging disorders of youth.
There is a growing body of evidence in adults demonstrating neuroimaging changes after effective psychotherapies. Several studies of patients with OCD who were successfully treated with CBT have demonstrated decreased metabolism in the right caudate nucleus, and those treated effectively for phobias showed decreased activity in the limbic and paralimbic areas. Interestingly, patients with OCD and phobias who were effectively treated with selective serotonin reuptake inhibitors demonstrated these same changes on functional neuroimaging (Mol Psychiatry. 2006 Jun;11[6]:528-38.). An Italian meta-analysis of patients treated for major depression with medications (usually selective serotonin reuptake inhibitors) or with psychotherapy (usually CBT) demonstrated different, and possibly complementary brain changes in the two treatment groups (Brain Imaging Behav. 2015 Jul 12. [Epub ahead of print]). With time, these studies may help us to better understand the nature of specific illnesses and more about neuroplasticity, and may even help us to understand when medications, therapy, or both are indicated.

Finally, it is worth noting that multiple studies indicate that one of the most consistent predictors of a positive outcome in psychotherapy is the presence of a strong treatment alliance between the therapist and the patient. Studies have demonstrated that a strong alliance was a better predictor of positive outcomes than type of psychotherapy, and seemed to be a strong predictor of positive outcomes even in cases where the treatment was pharmacologic. This makes it critical that when you are trying to help your patient find a “good therapist,” you consider whether the patient may need a specialized therapy (CBT, DBT, or family therapy). But you should also instruct your patient and their parents that it is very important that they like their therapist, that after several meetings they should feel comfortable meeting and talking honestly with him, and that they should feel that the therapist cares about them and is committed to their health and well-being.
Dr. Swick is an attending psychiatrist in the division of child psychiatry at Massachusetts General Hospital, Boston, and director of the Parenting at a Challenging Time (PACT) Program at the Vernon Cancer Center at Newton (Mass.) Wellesley Hospital. Dr. Jellinek is professor of psychiatry and of pediatrics at Harvard Medical School, Boston. Email them at [email protected].
The term “psychotherapy” describes a variety of talk-based treatments for psychiatric illnesses. Its fundamental premise is that there are determinants of mood, anxiety, and behavior that are not fully in our conscious awareness. By becoming more aware or by developing skills in managing thoughts and feelings, patients can get relief from symptoms that often impair functioning. The focus on unconscious thoughts, feelings, and behaviors is the central principle of dynamic psychotherapy in which the therapist listens to the patients speak freely about important people and events in their day-to-day lives and takes note of themes that emerge. Eventually they offer “interpretations” to their patients about these patterns, and ways that current problems may connect to powerful experiences from their earlier lives.
Dynamic psychotherapy is often contrasted with supportive psychotherapy. This is not cheerleading, but instead refers to supporting the healthy ability to think about oneself, one’s thoughts and emotions, and one’s needs, and the tension that these can create with the expectations of society. In working with children and adolescents, therapists are almost always supporting the age-appropriate development of some of these skills, particularly if a child has gotten developmentally stuck because of depressive, anxious, or attentional symptoms. There are almost always supportive elements in psychotherapy with a school-age or teenage child.
For children with anxiety disorders or mild to moderate depression, cognitive-behavioral therapy (CBT) is an evidence-based first-line treatment. CBT is a structured psychotherapy that helps patients to identify specific thoughts that trigger or follow their mood or anxiety symptoms, and then sets about establishing new (less-distorted) thoughts or practicing avoided behaviors to help learn new responses. It appears to be especially effective for anxiety disorders (such as social phobia, panic disorder, and generalized anxiety disorder) and for obsessive-compulsive disorder. There are specialized types of CBT that can be offered to patients (including children) who have been exposed to trauma and even for teenagers experiencing psychotic symptoms. It should be noted that one of the reasons that CBT has a robust evidence base supporting its use is that it is one of the most structured types of psychotherapy. It is standardized, reproducible, and easier to study than most other varieties of psychotherapy. Practicing CBT requires specific training, so in looking for a CBT therapist, one needs to ask whether she is CBT trained, and even whether she is trained in the type of CBT specific for the disorder you are treating.
A relative of CBT is dialectical behavioral therapy or DBT, developed to treat borderline personality disorder, a maladaptive pattern of identity uncertainty, emotional instability, and impulsivity that often starts in adolescence, causing stormy relationships and poor self-regulation that can contribute to self-injury, substance abuse, and chronic suicidality. DBT focuses on cognitive patterns, and utilizes a patient’s strengths to build new skills at managing challenging thoughts and feelings. The “dialectic” relates to interpersonal relationships, as this is where these patients often have great difficulty. High-quality DBT is often done with both individual and group therapy sessions. There is substantial evidence supporting the efficacy of this therapy in patients with borderline personality disorder.
Play therapy generally refers to the use of play (with toys, dolls, art, or games) in therapy with the youngest children. Such young children are unlikely to speak in a fluid manner about their relationships or struggles, as they may lack some of the cognitive means to be self-reflective. So instead, a therapist will watch for themes in their play (aggression, cheating, repetitive stories with dolls or art) that may reflect important themes, that they will then work on in play or in speaking, as tolerated. Therapists of older children also may use play to help these children feel more comfortable as they proceed with CBT or another talk therapy.
While gathering data from parents is always part of therapy for children, family therapy brings the whole family into a room with the therapist, who focuses on the roles each person may play in the family and patterns of communication (verbal and otherwise) that may be contributing to a young person’s symptoms. Family therapy can be very important in treating anorexia nervosa, somatoform illnesses, and conduct disorder in children and adolescents. While it can be a complex type of therapy to study, there is significant evidence supporting its efficacy in these very challenging disorders of youth.
There is a growing body of evidence in adults demonstrating neuroimaging changes after effective psychotherapies. Several studies of patients with OCD who were successfully treated with CBT have demonstrated decreased metabolism in the right caudate nucleus, and those treated effectively for phobias showed decreased activity in the limbic and paralimbic areas. Interestingly, patients with OCD and phobias who were effectively treated with selective serotonin reuptake inhibitors demonstrated these same changes on functional neuroimaging (Mol Psychiatry. 2006 Jun;11[6]:528-38.). An Italian meta-analysis of patients treated for major depression with medications (usually selective serotonin reuptake inhibitors) or with psychotherapy (usually CBT) demonstrated different, and possibly complementary brain changes in the two treatment groups (Brain Imaging Behav. 2015 Jul 12. [Epub ahead of print]). With time, these studies may help us to better understand the nature of specific illnesses and more about neuroplasticity, and may even help us to understand when medications, therapy, or both are indicated.
Finally, it is worth noting that multiple studies indicate that one of the most consistent predictors of a positive outcome in psychotherapy is the presence of a strong treatment alliance between the therapist and the patient. Studies have demonstrated that a strong alliance was a better predictor of positive outcomes than type of psychotherapy, and seemed to be a strong predictor of positive outcomes even in cases where the treatment was pharmacologic. This makes it critical that when you are trying to help your patient find a “good therapist,” you consider whether the patient may need a specialized therapy (CBT, DBT, or family therapy). But you should also instruct your patient and their parents that it is very important that they like their therapist, that after several meetings they should feel comfortable meeting and talking honestly with him, and that they should feel that the therapist cares about them and is committed to their health and well-being.
Dr. Swick is an attending psychiatrist in the division of child psychiatry at Massachusetts General Hospital, Boston, and director of the Parenting at a Challenging Time (PACT) Program at the Vernon Cancer Center at Newton (Mass.) Wellesley Hospital. Dr. Jellinek is professor of psychiatry and of pediatrics at Harvard Medical School, Boston. Email them at [email protected].

New treatments bring hope for severe atopic dermatitis
LOS ANGELES – For patients with severe atopic dermatitis and their families and treating physicians, there is big news: finally, there is light at the end of the tunnel, Dr. Lisa A. Beck declared in a plenary lecture at the annual meeting of the American Academy of Allergy, Asthma, and Immunology.
Better drugs are on the way. The new agents in the developmental pipeline target specific immunologic pathways that appear to be central to atopic dermatitis. Moreover, exciting recent evidence indicates it’s possible to noninvasively identify children at high risk for atopic dermatitis and intervene preventively to reduce the likelihood of actually developing the disease, according to Dr. Beck, professor of dermatology and medicine at the University of Rochester (N.Y.).

“Many pharmaceutical companies have now turned their attention to atopic dermatitis and aren’t just focusing on asthma anymore. The biggest pipeline appears to involve drugs that might target the Th2 [T helper 2 cells] pathway, either by trying to eliminate alarmins such as TSLP [thymic stromal lymphopoietin], or reverse the effects of the Th2 cytokines interleukin-4 and -13, either alone or together, or prevent the recruitment of activated T cells,” she said.
Dr. Beck presented an update on three such promising investigational approaches on the horizon: the IL-4 and IL-13 inhibitor dupilumab; oral and topical Janus associated kinase (JAK) inhibitors; and anti-IgE therapies.
Dupilumab: This fully human monoclonal antibody that blocks IL-4 and IL-13 is also being developed as a treatment for eosinophilic asthma. Dr. Beck was first author of a report on a series of four phase II randomized trials of dupilumab for moderate to severe atopic dermatitis in adults. The publication caused a stir, with dupilumab-treated patients showing marked and rapid improvement to a degree previously unseen in the treatment of this disease (N Engl J Med. 2014;371[2]:130-9).
In the 12-week study, for example, 85% of dupilumab-treated patients achieved at least a 50% improvement in the Eczema Area and Severity Index (EASI) score, compared with 35% of placebo-treated controls, with a significant between-group difference seen in the first week. Maximum improvement – a 75%-80% reduction in EASI scores – was noted at 6-8 weeks. Forty percent of dupilumab-treated patients achieved clear or near-clear skin by investigator’s global assessment, compared with just 7% of controls.
Itching decreased markedly beginning in the first week, too. The investigational agent’s side effect profile was similar to placebo. Phase III clinical trials in atopic dermatitis are ongoing.
A study by other investigators found that dupilumab resulted in rapid improvement in the molecular signature of atopic dermatitis in skin biopsy specimens (J Allergy Clin Immunol. 2014 Dec;134[6]:1293-300). The observed changes in gene expression suggest that dupilumab might have a beneficial effect on the dysfunctional skin barrier that is a hallmark of atopic dermatitis. Further studies are now being planned to take a closer look at that possibility.
JAK inhibitors: “We’re all really excited about this approach because dogs, too, get allergic dermatitis, and in 2013 a JAK 1 and 3 inhibitor [oclacitinib, Apoquel] was approved as a veterinary medicine therapy. It has resulted in dramatic improvement in itch within 1 week of administration, as well as significant improvement in the dermatitis,” Dr. Beck said.
Three JAK inhibitors are now in phase II clinical trials for atopic dermatitis in humans: the JAK 1 and 3 inhibitor tofacitinib (Xeljanz), both as a topical ointment and the familiar oral formulation; baricitinib, an oral JAK 1 and 2 inhibitor; and an agent known for now as PF-04965842, which is an oral inhibitor specifically of JAK 1.
“JAK inhibitors have been quite effective in treating a number of other inflammatory conditions, as well as cancers. I think they will have a role in the treatment of atopic dermatitis. The biggest concerns will be the off-target effects,” she predicted.
Anti-IgE agents: Omalizumab (Xolair), a humanized monoclonal antibody that binds to IgE, has gotten mixed reviews as an investigational treatment for atopic dermatitis. The best study to date, a randomized, single-center, placebo-controlled, double-blind, 16-week clinical trial, found that omalizumab depleted IgE but didn’t improve the clinical course of atopic dermatitis (J Dtsch Dermatol Ges. 2010 Dec;8[12]:990-8). Nonetheless, a phase II trial of omalizumab is ongoing. Plus, ligelizumab, an anti-IgE monoclonal antibody with a higher affinity for IgE than omalizumab, is also in a phase II trial for adult atopic dermatitis.
“Anti-IgE therapy, I think, is still not dead in atopic dermatitis. I look forward to seeing whether omalizumab will work in unique subsets of patients, or whether a more potent anti-IgE molecule will be more beneficial,” Dr. Beck commented.
As exciting as the prospects are for these investigational agents, there also have been several recent important advances in the prevention of atopic dermatitis, she continued. Investigators led by Dr. Alan D. Irvine of Trinity College, Dublin, noninvasively measured transepidermal water loss in early infancy in more than 1,900 Irish 2-day-old infants and found that those in the 75th percentile for this early marker of skin barrier dysfunction were at 3.1-fold increased risk for diagnosis of atopic dermatitis by age 2 years (J Allergy Clin Immunol. 2016 Apr;137[4]:1111-6). This new-found ability to identify at-risk infants will be extremely helpful in designing atopic dermatitis prevention studies, according to Dr. Beck.
The other advance in prevention was provided via a randomized trial by Dr. Eric L. Simpson of Oregon Health and Science University, Portland, and his coinvestigators. They randomized a group of infants at high risk for atopic dermatitis to daily application of any of five OTC skin moisturizers or a no-moisturizer control group from 2 weeks through 6 months of age. The study hypothesis was that the moisturizers would help reverse the skin barrier abnormalities that play a key role in atopic dermatitis. The hypothesis was borne out by the finding that there was at least a 50% reduction in physician-diagnosed atopic dermatitis by age 6 months in the daily moisturizer group (J Allergy Clin Immunol. 2014 Oct;134[4]:818-23).
Dr. Beck concluded by describing a likely near-term atopic dermatitis prevention and management scenario: High-risk infants will be identified on the basis of noninvasive assessment of epithelial features, such as transepidermal water loss or the presence of high levels of thymic stromal lymphopoietin on the skin surface. Encouragement of daily moisturizing for these high-risk infants will prevent some of them from going on to develop eczema.
For those who do get eczema, dilute bleach baths will help in restoring normal skin barrier function, as was confirmed in an in-press study by Dr. Beck and her coinvestigators, who found that 46% of a group of adults with atopic dermatitis experienced at least a 50% improvement in EASI scores, a big improvement in itch, and reduced transepidermal water loss after 12 weeks of the bleach baths. As other investigators have reported, the bleach baths were very well tolerated and safe.
Dr. Beck reported serving as a consultant to eight pharmaceutical companies with an interest in developing new treatments for atopic dermatitis.
LOS ANGELES – For patients with severe atopic dermatitis and their families and treating physicians, there is big news: finally, there is light at the end of the tunnel, Dr. Lisa A. Beck declared in a plenary lecture at the annual meeting of the American Academy of Allergy, Asthma, and Immunology.
Better drugs are on the way. The new agents in the developmental pipeline target specific immunologic pathways that appear to be central to atopic dermatitis. Moreover, exciting recent evidence indicates it’s possible to noninvasively identify children at high risk for atopic dermatitis and intervene preventively to reduce the likelihood of actually developing the disease, according to Dr. Beck, professor of dermatology and medicine at the University of Rochester (N.Y.).
“Many pharmaceutical companies have now turned their attention to atopic dermatitis and aren’t just focusing on asthma anymore. The biggest pipeline appears to involve drugs that might target the Th2 [T helper 2 cells] pathway, either by trying to eliminate alarmins such as TSLP [thymic stromal lymphopoietin], or reverse the effects of the Th2 cytokines interleukin-4 and -13, either alone or together, or prevent the recruitment of activated T cells,” she said.
Dr. Beck presented an update on three such promising investigational approaches on the horizon: the IL-4 and IL-13 inhibitor dupilumab; oral and topical Janus associated kinase (JAK) inhibitors; and anti-IgE therapies.
Dupilumab: This fully human monoclonal antibody that blocks IL-4 and IL-13 is also being developed as a treatment for eosinophilic asthma. Dr. Beck was first author of a report on a series of four phase II randomized trials of dupilumab for moderate to severe atopic dermatitis in adults. The publication caused a stir, with dupilumab-treated patients showing marked and rapid improvement to a degree previously unseen in the treatment of this disease (N Engl J Med. 2014;371[2]:130-9).
In the 12-week study, for example, 85% of dupilumab-treated patients achieved at least a 50% improvement in the Eczema Area and Severity Index (EASI) score, compared with 35% of placebo-treated controls, with a significant between-group difference seen in the first week. Maximum improvement – a 75%-80% reduction in EASI scores – was noted at 6-8 weeks. Forty percent of dupilumab-treated patients achieved clear or near-clear skin by investigator’s global assessment, compared with just 7% of controls.
Itching decreased markedly beginning in the first week, too. The investigational agent’s side effect profile was similar to placebo. Phase III clinical trials in atopic dermatitis are ongoing.
A study by other investigators found that dupilumab resulted in rapid improvement in the molecular signature of atopic dermatitis in skin biopsy specimens (J Allergy Clin Immunol. 2014 Dec;134[6]:1293-300). The observed changes in gene expression suggest that dupilumab might have a beneficial effect on the dysfunctional skin barrier that is a hallmark of atopic dermatitis. Further studies are now being planned to take a closer look at that possibility.
JAK inhibitors: “We’re all really excited about this approach because dogs, too, get allergic dermatitis, and in 2013 a JAK 1 and 3 inhibitor [oclacitinib, Apoquel] was approved as a veterinary medicine therapy. It has resulted in dramatic improvement in itch within 1 week of administration, as well as significant improvement in the dermatitis,” Dr. Beck said.
Three JAK inhibitors are now in phase II clinical trials for atopic dermatitis in humans: the JAK 1 and 3 inhibitor tofacitinib (Xeljanz), both as a topical ointment and the familiar oral formulation; baricitinib, an oral JAK 1 and 2 inhibitor; and an agent known for now as PF-04965842, which is an oral inhibitor specifically of JAK 1.
“JAK inhibitors have been quite effective in treating a number of other inflammatory conditions, as well as cancers. I think they will have a role in the treatment of atopic dermatitis. The biggest concerns will be the off-target effects,” she predicted.
Anti-IgE agents: Omalizumab (Xolair), a humanized monoclonal antibody that binds to IgE, has gotten mixed reviews as an investigational treatment for atopic dermatitis. The best study to date, a randomized, single-center, placebo-controlled, double-blind, 16-week clinical trial, found that omalizumab depleted IgE but didn’t improve the clinical course of atopic dermatitis (J Dtsch Dermatol Ges. 2010 Dec;8[12]:990-8). Nonetheless, a phase II trial of omalizumab is ongoing. Plus, ligelizumab, an anti-IgE monoclonal antibody with a higher affinity for IgE than omalizumab, is also in a phase II trial for adult atopic dermatitis.
“Anti-IgE therapy, I think, is still not dead in atopic dermatitis. I look forward to seeing whether omalizumab will work in unique subsets of patients, or whether a more potent anti-IgE molecule will be more beneficial,” Dr. Beck commented.
As exciting as the prospects are for these investigational agents, there also have been several recent important advances in the prevention of atopic dermatitis, she continued. Investigators led by Dr. Alan D. Irvine of Trinity College, Dublin, noninvasively measured transepidermal water loss in early infancy in more than 1,900 Irish 2-day-old infants and found that those in the 75th percentile for this early marker of skin barrier dysfunction were at 3.1-fold increased risk for diagnosis of atopic dermatitis by age 2 years (J Allergy Clin Immunol. 2016 Apr;137[4]:1111-6). This new-found ability to identify at-risk infants will be extremely helpful in designing atopic dermatitis prevention studies, according to Dr. Beck.
The other advance in prevention was provided via a randomized trial by Dr. Eric L. Simpson of Oregon Health and Science University, Portland, and his coinvestigators. They randomized a group of infants at high risk for atopic dermatitis to daily application of any of five OTC skin moisturizers or a no-moisturizer control group from 2 weeks through 6 months of age. The study hypothesis was that the moisturizers would help reverse the skin barrier abnormalities that play a key role in atopic dermatitis. The hypothesis was borne out by the finding that there was at least a 50% reduction in physician-diagnosed atopic dermatitis by age 6 months in the daily moisturizer group (J Allergy Clin Immunol. 2014 Oct;134[4]:818-23).
Dr. Beck concluded by describing a likely near-term atopic dermatitis prevention and management scenario: High-risk infants will be identified on the basis of noninvasive assessment of epithelial features, such as transepidermal water loss or the presence of high levels of thymic stromal lymphopoietin on the skin surface. Encouragement of daily moisturizing for these high-risk infants will prevent some of them from going on to develop eczema.
For those who do get eczema, dilute bleach baths will help in restoring normal skin barrier function, as was confirmed in an in-press study by Dr. Beck and her coinvestigators, who found that 46% of a group of adults with atopic dermatitis experienced at least a 50% improvement in EASI scores, a big improvement in itch, and reduced transepidermal water loss after 12 weeks of the bleach baths. As other investigators have reported, the bleach baths were very well tolerated and safe.
Dr. Beck reported serving as a consultant to eight pharmaceutical companies with an interest in developing new treatments for atopic dermatitis.
EXPERT ANALYSIS FROM THE 2016 AAAAI ANNUAL MEETING

Prevalence of Glaucoma in Patients With Vitiligo
Vitiligo is an acquired idiopathic disease of unknown etiology. Characterized by depigmented maculae and melanocytic destruction, it usually presents in childhood or young adulthood. The incidence of vitiligo ranges from 0.5% to 2% globally and there is no racial or gender predilection.1
Patients with vitiligo may exhibit pigmentary abnormalities of the iris and retina.2 Noninflammatory depigmented lesions of the ocular fundus observed in vitiligo indicate a local loss of melanocytes.1 The fact that melanocytes are present not only in the skin and roots of the hair but also in the uvea and stria vascularis of the inner ear may explain the ophthalmologic disorders that accompany vitiligo.3 The term glaucoma refers to a large number of diseases that share a common feature: a distinctive and progressive optic neuropathy that may derive from various risks and is associated with a gradual loss of the visual field. If the disorder is not diagnosed and treated properly it could cause blindness.
Glaucoma is classified on the basis of the underlying abnormality that causes intraocular pressure (IOP) to rise. Glaucoma is first divided into open-angle and angle-closure glaucoma; glaucoma associated with developmental anomalies is then subdivided according to specific alterations.4
A PubMed search of articles indexed for MEDLINE using the terms vitiligo and glaucoma revealed only 1 study examining the incidence of glaucoma in patients with vitiligo.5 In the study reported here, we determined the presence of and possible risk factors for glaucoma in patients with vitiligo who had presented to the dermatology polyclinic.
Methods
We registered 49 patients diagnosed with vitiligo by clinical and Wood light examination and 20 age- and sex-matched healthy controls. Patients who were using topical corticosteroid treatments for vitiligo lesions located on the face were excluded from the study due to the glaucoma-inducing effects of corticosteroids. Similarly, patients who received drugs with sympathetic and parasympathetic action that can cause glaucoma were excluded.
The patients received a comprehensive ophthalmologic examination that included visual acuity testing, refraction, IOP measurement, gonioscopy, and fundus examination. All patients and controls underwent visual field tests and optic nerve head analyses using a confocal scanning laser ophthalmoscope. Glaucoma was diagnosed based on fundus examination, IOP measurement, field of vision evaluation, and optic nerve head analysis.
Informed consent was obtained from all participants. The research protocol was approved by the university hospital ethics committee.
Results
The study registered a total of 49 patients with vitiligo (28 female; 21 male) and 20 healthy controls (10 female; 10 male) with a variety of demographic and clinical characteristics (Table 1).
Mean (SD) IOP values were 13.83 (2.84) mm Hg for the right eye and 13.89 (2.60) mm Hg for the left eye in the vitiligo group. Values were 14.35 (2.56) mm Hg and 14.95 (2.92) mm Hg, respectively, in the control group. The IOP differences between the 2 groups were not statistically significant (P>.05).
Nine patients (18.4%) in the vitiligo group were found to have signs of normal-tension glaucoma (NTG). Optic nerve damage and vision loss occurs in the presence of normal IOP in NTG. There were no signs of NTG in the control group. Normal-tension glaucoma was diagnosed in the vitiligo group based on glaucomatous optic disc appearance, visual field defects, and structural analysis of the entire optic nerve head in confocal scanning laser ophthalmoscope. The NTG difference between the vitiligo and control groups was statistically significant (P=.04).
In the vitiligo group, of the 9 patients who had NTG, 6 had periorbital vitiligo lesions; the remaining 3 had none. Although patients who had periorbital lesions had a higher rate of glaucoma relative to the patients without periorbital lesions, the difference was not statistically significant (P>.05).
No statistically significant differences (P>.05) were found between patients with vitiligo with and without glaucoma in terms of age, sex, disease duration, family history of vitiligo, presence or absence of periorbital involvement, manner of involvement, percentage of the involved body areas, and IOP (Table 1).
Comment
Glaucoma is characterized by increased IOP, visual field loss, and changes in the optic nerve head. Although elevated IOP is common in ocular hypertension as well as in glaucoma, there is no glaucomatous visual field loss in ocular hypertension. In NTG, on the other hand, glaucomatous visual field loss and optic nerve head changes occur without an increase in IOP.6 Normal-tension glaucoma is a particular type of open-angle glaucoma. It is believed that NTG and high-tension glaucoma induce optic nerve head damage through different means.7 Alternative theories have been put forth to account for the glaucomatous damage to the optic nerve head that occurs in NTG, despite normal or close to normal IOP. These theories include vascular disorders (eg, ischemia, which interrupts the orthograde or retrograde axonal transport), excessive accumulation of free radicals, triggering of apoptosis, and low resistance of lamina cribrosa.8
Although there are various studies exploring ocular symptoms in patients with vitiligo,9-15 only 1 study has examined the incidence of glaucoma in this group of patients.5 Biswas et al11 examined ocular signs in 100 patients with vitiligo and found that 23% of patients had hypopigmented foci in the iris, 18% had pigmentation in the anterior chamber, 11% had chorioretinal degeneration, 9% had hypopigmentation of the retinal pigment epithelium, 5% had uveitis, and 34% were evaluated as normal. In this study, the authors concluded that there was a strong relationship between vitiligo and eye diseases.11 When Gopal et al9 compared the eye examinations of 150 vitiligo patients and 100 healthy controls, they found uveitis, iris, and retinal pigmentary abnormalities in 16% of the vitiligo patients (P<.001).
Rogosić et al5 examined the incidence of glaucoma in 42 patients with vitiligo and found primary open-angle glaucoma in 24 (57%) patients. The patients had a mean age of 56 years, mean disease duration of 13 years, and mean IOP of 18 mm Hg for the right eye and 17.5 mm Hg for the left eye. The incidence of glaucoma was significantly higher in patients with vitiligo (P<.001) and increased with disease duration.5
Similar studies, however, have failed to show a relationship between vitiligo and glaucoma. In a study that evaluated the retinal pigment epithelium and the optic nerve in patients with vitiligo, Perossini et al10 found that the fundus examination of the patients was perfectly normal.
In our study, we detected NTG in 18.4% of patients with vitiligo. We did not find a significant statistical difference between patients with and without glaucoma (Table 2). Rogosić et al5 found a significant relationship between age and glaucoma incidence, but we did not find such a relationship, which we believe is because the mean age of our patients was lower than the prior study.
In vitiligo, melanocytes are destroyed through an unknown mechanism. Although the cellular and molecular mechanisms causing melanocytic destruction have not yet been determined, various hypotheses have been put forward to explain the etiopathogenesis of vitiligo. Among these, the most commonly held hypotheses are the neural, self-destruction, and autoimmune hypotheses.16
Based on the observation that stress and serious trauma could precipitate or trigger the onset of vitiligo,16 the neural hypothesis holds that neurochemical mediators released from the edges of the nerve endings exert toxic effects on melanocytes. The fact that both melanocytes and choroidal pigment cells originate from the mesenchyme and dermatomal spreading of segmental vitiligo are arguments propounded in favor of this hypothesis.17
The self-destruction hypothesis suggests that the intrinsic protective mechanisms that normally enable melanocytes to eliminate toxic intermediate products or metabolites on the melanogenesis path have been impaired in patients with vitiligo.18,19 There is evidence of increased oxidative stress over the whole epidermis of patients with vitiligo.20 Thus, free radicals affect melanin and cause membrane damage via lipid peroxidation reactions.21
The autoimmune hypothesis proposes a clinical relationship between vitiligo and several diseases believed to be autoimmune. Because the macrophage infiltration observed in vitiligo lesions is more pronounced on the perilesional skin, this hypothesis holds that macrophages may play a role in melanocyte removal.21 The Koebner phenomenon observed in vitiligo lends support to the critical role of trauma in the etiopathogenesis of the disease.
Although we could not explain the co-presence of vitiligo and glaucoma, we believe that it may result from the fact that both diseases are observed in tissues that have the same embryologic origin and etiology, perhaps vascular or neural disorders, excessive accumulation of free radicals, or the triggering of apoptosis. Dermatologists should be alert to the presence of glaucoma in patients with vitiligo because glaucoma is an eye disease that progresses slowly and may lead to vision loss.
1. Ortonne JP. Vitiligo and other disorders of hypopigmentation. In: Bolognia JB, Jorizzo JL, Rapini RP, eds. Dermatology. 1st ed. New York, NY: Mosby; 2003:947-973.
2. Ortonne JP, Bahadoran P, Fitzpatrick TB, et al. Hypomelanoses and hypermelanoses. In: Freedberg IM, Eisen AZ, Wolff K, eds. Fitzpatrick’s Dermatology in General Medicine. 6th ed. New York, NY: McGraw-Hill; 2003:836-881.
3. van den Wijngaard R, Wijngaard R, Wankowiczs-Kalinsa A, et al. Autoimmune melanocyte destruction in vitiligo. Lab Invest. 2001;81:1061-1067.
4. Shields MB, Ritch R, Krupin T. Classification of the glaucomas. In: Ritch R, Shields MB, Krupin T, eds. The Glaucomas. St Louis, MO: C.V. Mosby Co; 1996:717-725.
5. Rogosić V, Bojić L, Puizina-Ivić N, et al. Vitiligo and glaucoma–an association or a coincidence? a pilot study. Acta Dermatovenerol Croat. 2010;18:21-26.
6. Anderson DR. Normal-tension glaucoma (low-tension glaucoma). Indian J Ophthalmol. 2011;59(suppl 59):S97-S101.
7. Iwata K. Primary open angle glaucoma and low tension glaucoma–pathogenesis and mechanism of optic nerve damage [in Japanese]. Nippon Ganka Gakkai Zasshi. 1992;96:1501-1531.
8. Hitchings RA, Anderton SA. A comparative study of visual field defects seen in patients with low-tension glaucoma and chronic simple glaucoma. Br J Ophthalmol. 1983;67:818-821.
9. Gopal KV, Rama Rao GR, Kumar YH, et al. Vitiligo: a part of a systemic autoimmune process. Indian J Dermatol Venereol Leprol. 2007;73:162-165.
10. Perossini M, Turio E, Perossini T, et al. Vitiligo: ocular and electrophysiological findings. G Ital Dermatol Venereol. 2010;145:141-149.
11. Biswas G, Barbhuiya JN, Biswas MC, et al. Clinical pattern of ocular manifestations in vitiligo. J Indian Med Assoc. 2003;101:478-480.
12. Park S, Albert DM, Bolognia JL. Ocular manifestations of pigmentary disorders. Dermatol Clin. 1992;10:609-622.
13. Albert DM, Nordlund JJ, Lerner AB. Ocular abnormalities occurring with vitiligo. Ophthalmology. 1979;86:1145-1160.
14. Wagoner MD, Albert DM, Lerner AB, et al. New observations on vitiligo and ocular disease. Am J Ophthalmol. 1983;96:16-26.
15. Cowan CL Jr, Halder RM, Grimes PE, et al. Ocular disturbances in vitiligo. J Am Acad Dermatol. 1986;15:17-24.
16. Orecchia GE. Neural pathogenesis. In: Hann SK, Nordlund JJ. Vitiligo. Oxford, England: Blackwell Science Ltd; 2000:142-150.
17. Braun-Falco O, Plewig G, Wolf HH, et al. Disorders of melanin pigmentation. In: Bartels V, ed. Dermatology. Berlin, Germany: Springer; 2000:1013-1042.
18. Tüzün Y, Kotoğyan A, Aydemir EH, et al. Pigmentasyon bozuklukları. In: Baransü O. Dermatoloji. 2nd ed. Istanbul: Nobel Tıp Kitabevi; 1994:557-559.
19. Odom RB, James WD, Berger TG. Disturbances of pigmentation. In: Odom RB, James WD, Berger TG. Andrews’ Diseases of the Skin. 9th ed. Philadelphia, PA: W.B. Saunders Company; 2000:1065-1068.
20. Schallreuter KU. Biochemical theory of vitiligo: a role of pteridines in pigmentation. In: Hann SK, Nordlund JJ. Vitiligo. London, England: Blackwell Science Ltd; 2000:151-159.
21. van den Wijngaard R, Wankowicz-Kalinska A, Le Poole C, et al. Local immune response in skin of generalized vitiligo patients. destruction of melanocytes is associated with the predominent presence of CLA+T cells at the perilesional site. Lab Invest. 2000;80:1299-1309.
Vitiligo is an acquired idiopathic disease of unknown etiology. Characterized by depigmented maculae and melanocytic destruction, it usually presents in childhood or young adulthood. The incidence of vitiligo ranges from 0.5% to 2% globally and there is no racial or gender predilection.1
Patients with vitiligo may exhibit pigmentary abnormalities of the iris and retina.2 Noninflammatory depigmented lesions of the ocular fundus observed in vitiligo indicate a local loss of melanocytes.1 The fact that melanocytes are present not only in the skin and roots of the hair but also in the uvea and stria vascularis of the inner ear may explain the ophthalmologic disorders that accompany vitiligo.3 The term glaucoma refers to a large number of diseases that share a common feature: a distinctive and progressive optic neuropathy that may derive from various risks and is associated with a gradual loss of the visual field. If the disorder is not diagnosed and treated properly it could cause blindness.
Glaucoma is classified on the basis of the underlying abnormality that causes intraocular pressure (IOP) to rise. Glaucoma is first divided into open-angle and angle-closure glaucoma; glaucoma associated with developmental anomalies is then subdivided according to specific alterations.4
A PubMed search of articles indexed for MEDLINE using the terms vitiligo and glaucoma revealed only 1 study examining the incidence of glaucoma in patients with vitiligo.5 In the study reported here, we determined the presence of and possible risk factors for glaucoma in patients with vitiligo who had presented to the dermatology polyclinic.
Methods
We registered 49 patients diagnosed with vitiligo by clinical and Wood light examination and 20 age- and sex-matched healthy controls. Patients who were using topical corticosteroid treatments for vitiligo lesions located on the face were excluded from the study due to the glaucoma-inducing effects of corticosteroids. Similarly, patients who received drugs with sympathetic and parasympathetic action that can cause glaucoma were excluded.
The patients received a comprehensive ophthalmologic examination that included visual acuity testing, refraction, IOP measurement, gonioscopy, and fundus examination. All patients and controls underwent visual field tests and optic nerve head analyses using a confocal scanning laser ophthalmoscope. Glaucoma was diagnosed based on fundus examination, IOP measurement, field of vision evaluation, and optic nerve head analysis.
Informed consent was obtained from all participants. The research protocol was approved by the university hospital ethics committee.
Results
The study registered a total of 49 patients with vitiligo (28 female; 21 male) and 20 healthy controls (10 female; 10 male) with a variety of demographic and clinical characteristics (Table 1).
Mean (SD) IOP values were 13.83 (2.84) mm Hg for the right eye and 13.89 (2.60) mm Hg for the left eye in the vitiligo group. Values were 14.35 (2.56) mm Hg and 14.95 (2.92) mm Hg, respectively, in the control group. The IOP differences between the 2 groups were not statistically significant (P>.05).
Nine patients (18.4%) in the vitiligo group were found to have signs of normal-tension glaucoma (NTG). Optic nerve damage and vision loss occurs in the presence of normal IOP in NTG. There were no signs of NTG in the control group. Normal-tension glaucoma was diagnosed in the vitiligo group based on glaucomatous optic disc appearance, visual field defects, and structural analysis of the entire optic nerve head in confocal scanning laser ophthalmoscope. The NTG difference between the vitiligo and control groups was statistically significant (P=.04).
In the vitiligo group, of the 9 patients who had NTG, 6 had periorbital vitiligo lesions; the remaining 3 had none. Although patients who had periorbital lesions had a higher rate of glaucoma relative to the patients without periorbital lesions, the difference was not statistically significant (P>.05).
No statistically significant differences (P>.05) were found between patients with vitiligo with and without glaucoma in terms of age, sex, disease duration, family history of vitiligo, presence or absence of periorbital involvement, manner of involvement, percentage of the involved body areas, and IOP (Table 1).
Comment
Glaucoma is characterized by increased IOP, visual field loss, and changes in the optic nerve head. Although elevated IOP is common in ocular hypertension as well as in glaucoma, there is no glaucomatous visual field loss in ocular hypertension. In NTG, on the other hand, glaucomatous visual field loss and optic nerve head changes occur without an increase in IOP.6 Normal-tension glaucoma is a particular type of open-angle glaucoma. It is believed that NTG and high-tension glaucoma induce optic nerve head damage through different means.7 Alternative theories have been put forth to account for the glaucomatous damage to the optic nerve head that occurs in NTG, despite normal or close to normal IOP. These theories include vascular disorders (eg, ischemia, which interrupts the orthograde or retrograde axonal transport), excessive accumulation of free radicals, triggering of apoptosis, and low resistance of lamina cribrosa.8
Although there are various studies exploring ocular symptoms in patients with vitiligo,9-15 only 1 study has examined the incidence of glaucoma in this group of patients.5 Biswas et al11 examined ocular signs in 100 patients with vitiligo and found that 23% of patients had hypopigmented foci in the iris, 18% had pigmentation in the anterior chamber, 11% had chorioretinal degeneration, 9% had hypopigmentation of the retinal pigment epithelium, 5% had uveitis, and 34% were evaluated as normal. In this study, the authors concluded that there was a strong relationship between vitiligo and eye diseases.11 When Gopal et al9 compared the eye examinations of 150 vitiligo patients and 100 healthy controls, they found uveitis, iris, and retinal pigmentary abnormalities in 16% of the vitiligo patients (P<.001).
Rogosić et al5 examined the incidence of glaucoma in 42 patients with vitiligo and found primary open-angle glaucoma in 24 (57%) patients. The patients had a mean age of 56 years, mean disease duration of 13 years, and mean IOP of 18 mm Hg for the right eye and 17.5 mm Hg for the left eye. The incidence of glaucoma was significantly higher in patients with vitiligo (P<.001) and increased with disease duration.5
Similar studies, however, have failed to show a relationship between vitiligo and glaucoma. In a study that evaluated the retinal pigment epithelium and the optic nerve in patients with vitiligo, Perossini et al10 found that the fundus examination of the patients was perfectly normal.
In our study, we detected NTG in 18.4% of patients with vitiligo. We did not find a significant statistical difference between patients with and without glaucoma (Table 2). Rogosić et al5 found a significant relationship between age and glaucoma incidence, but we did not find such a relationship, which we believe is because the mean age of our patients was lower than the prior study.
In vitiligo, melanocytes are destroyed through an unknown mechanism. Although the cellular and molecular mechanisms causing melanocytic destruction have not yet been determined, various hypotheses have been put forward to explain the etiopathogenesis of vitiligo. Among these, the most commonly held hypotheses are the neural, self-destruction, and autoimmune hypotheses.16
Based on the observation that stress and serious trauma could precipitate or trigger the onset of vitiligo,16 the neural hypothesis holds that neurochemical mediators released from the edges of the nerve endings exert toxic effects on melanocytes. The fact that both melanocytes and choroidal pigment cells originate from the mesenchyme and dermatomal spreading of segmental vitiligo are arguments propounded in favor of this hypothesis.17
The self-destruction hypothesis suggests that the intrinsic protective mechanisms that normally enable melanocytes to eliminate toxic intermediate products or metabolites on the melanogenesis path have been impaired in patients with vitiligo.18,19 There is evidence of increased oxidative stress over the whole epidermis of patients with vitiligo.20 Thus, free radicals affect melanin and cause membrane damage via lipid peroxidation reactions.21
The autoimmune hypothesis proposes a clinical relationship between vitiligo and several diseases believed to be autoimmune. Because the macrophage infiltration observed in vitiligo lesions is more pronounced on the perilesional skin, this hypothesis holds that macrophages may play a role in melanocyte removal.21 The Koebner phenomenon observed in vitiligo lends support to the critical role of trauma in the etiopathogenesis of the disease.
Although we could not explain the co-presence of vitiligo and glaucoma, we believe that it may result from the fact that both diseases are observed in tissues that have the same embryologic origin and etiology, perhaps vascular or neural disorders, excessive accumulation of free radicals, or the triggering of apoptosis. Dermatologists should be alert to the presence of glaucoma in patients with vitiligo because glaucoma is an eye disease that progresses slowly and may lead to vision loss.
1. Ortonne JP. Vitiligo and other disorders of hypopigmentation. In: Bolognia JB, Jorizzo JL, Rapini RP, eds. Dermatology. 1st ed. New York, NY: Mosby; 2003:947-973.
2. Ortonne JP, Bahadoran P, Fitzpatrick TB, et al. Hypomelanoses and hypermelanoses. In: Freedberg IM, Eisen AZ, Wolff K, eds. Fitzpatrick’s Dermatology in General Medicine. 6th ed. New York, NY: McGraw-Hill; 2003:836-881.
3. van den Wijngaard R, Wijngaard R, Wankowiczs-Kalinsa A, et al. Autoimmune melanocyte destruction in vitiligo. Lab Invest. 2001;81:1061-1067.
4. Shields MB, Ritch R, Krupin T. Classification of the glaucomas. In: Ritch R, Shields MB, Krupin T, eds. The Glaucomas. St Louis, MO: C.V. Mosby Co; 1996:717-725.
5. Rogosić V, Bojić L, Puizina-Ivić N, et al. Vitiligo and glaucoma–an association or a coincidence? a pilot study. Acta Dermatovenerol Croat. 2010;18:21-26.
6. Anderson DR. Normal-tension glaucoma (low-tension glaucoma). Indian J Ophthalmol. 2011;59(suppl 59):S97-S101.
7. Iwata K. Primary open angle glaucoma and low tension glaucoma–pathogenesis and mechanism of optic nerve damage [in Japanese]. Nippon Ganka Gakkai Zasshi. 1992;96:1501-1531.
8. Hitchings RA, Anderton SA. A comparative study of visual field defects seen in patients with low-tension glaucoma and chronic simple glaucoma. Br J Ophthalmol. 1983;67:818-821.
9. Gopal KV, Rama Rao GR, Kumar YH, et al. Vitiligo: a part of a systemic autoimmune process. Indian J Dermatol Venereol Leprol. 2007;73:162-165.
10. Perossini M, Turio E, Perossini T, et al. Vitiligo: ocular and electrophysiological findings. G Ital Dermatol Venereol. 2010;145:141-149.
11. Biswas G, Barbhuiya JN, Biswas MC, et al. Clinical pattern of ocular manifestations in vitiligo. J Indian Med Assoc. 2003;101:478-480.
12. Park S, Albert DM, Bolognia JL. Ocular manifestations of pigmentary disorders. Dermatol Clin. 1992;10:609-622.
13. Albert DM, Nordlund JJ, Lerner AB. Ocular abnormalities occurring with vitiligo. Ophthalmology. 1979;86:1145-1160.
14. Wagoner MD, Albert DM, Lerner AB, et al. New observations on vitiligo and ocular disease. Am J Ophthalmol. 1983;96:16-26.
15. Cowan CL Jr, Halder RM, Grimes PE, et al. Ocular disturbances in vitiligo. J Am Acad Dermatol. 1986;15:17-24.
16. Orecchia GE. Neural pathogenesis. In: Hann SK, Nordlund JJ. Vitiligo. Oxford, England: Blackwell Science Ltd; 2000:142-150.
17. Braun-Falco O, Plewig G, Wolf HH, et al. Disorders of melanin pigmentation. In: Bartels V, ed. Dermatology. Berlin, Germany: Springer; 2000:1013-1042.
18. Tüzün Y, Kotoğyan A, Aydemir EH, et al. Pigmentasyon bozuklukları. In: Baransü O. Dermatoloji. 2nd ed. Istanbul: Nobel Tıp Kitabevi; 1994:557-559.
19. Odom RB, James WD, Berger TG. Disturbances of pigmentation. In: Odom RB, James WD, Berger TG. Andrews’ Diseases of the Skin. 9th ed. Philadelphia, PA: W.B. Saunders Company; 2000:1065-1068.
20. Schallreuter KU. Biochemical theory of vitiligo: a role of pteridines in pigmentation. In: Hann SK, Nordlund JJ. Vitiligo. London, England: Blackwell Science Ltd; 2000:151-159.
21. van den Wijngaard R, Wankowicz-Kalinska A, Le Poole C, et al. Local immune response in skin of generalized vitiligo patients. destruction of melanocytes is associated with the predominent presence of CLA+T cells at the perilesional site. Lab Invest. 2000;80:1299-1309.
Practice Points
- Patients with vitiligo may exhibit pigmentary abnormalities of the iris and retina.
- Normal-tension glaucoma may develop in patients with vitiligo.
- Glaucoma progresses slowly and may lead to vision loss; as a result, dermatologists should be alert to the presence of glaucoma in vitiligo patients.

Long-Term Βeta-Blocker Use May Cause More Harm in Patients Undergoing Surgery
Clinical question: What is the harm associated with long-term beta-blocker therapy in patients with uncomplicated hypertension undergoing non-cardiac surgery?

Background: Given the recent concerns over the validity of prior studies, there is uncertainty about which patients benefit most from perioperative beta-blockade. Current guidelines suggest continuing beta-blockers in the perioperative period. More data are needed to delineate which patients maximally benefit from perioperative beta-blockade.
Study design: Association study.
Setting: Danish nationwide cohort of patients.
Synopsis: Study investigators included 55,320 uncomplicated hypertension (no cardiovascular, renal, or liver disease) patients >19 years of age on ≥2 antihypertensive drugs undergoing non-cardiac surgery. In the 14,664 patients who received beta-blockers, the rates of 30-day major adverse cardiovascular events (MACE; cardiovascular death, nonfatal ischemic stroke, and nonfatal myocardial infarction) and 30-day all-cause mortality were 1.32% and 1.93%, respectively. However, in the 40,676 patients who did not receive beta-blockers, 30-day MACEs and 30-day all-cause mortality rates were 0.84% and 1.32%, respectively (P<0.001). When looking at the individual MACEs, cardiovascular death was the only statistically significant event with higher incidence (0.9% versus 0.45%, P<0.001).
Combination therapy with beta-blocker and RAS inhibitor, calcium channel blockers, or thiazide was associated with statistically significant higher risks of MACEs and all-cause mortality when compared to the combination of RAS inhibitor plus thiazide. Men >70 years of age or undergoing urgent surgery had the highest risk of harm. This study was not a randomized control trial, so caution must be used when attributing causality to beta-blockers, MACEs, and all-cause mortality.
Bottom line: Antihypertensive regimens containing beta-blockers may increase risk of perioperative MACEs and all-cause mortality in patients with uncomplicated hypertension.
Citation: Jorgensen ME, Hlatky MA, Kober L, et al. β-blocker-associated risks in patients with uncomplicated hypertension undergoing noncardiac surgery. JAMA Intern Med. 2015;175(12):1923-1931.
Clinical question: What is the harm associated with long-term beta-blocker therapy in patients with uncomplicated hypertension undergoing non-cardiac surgery?
Background: Given the recent concerns over the validity of prior studies, there is uncertainty about which patients benefit most from perioperative beta-blockade. Current guidelines suggest continuing beta-blockers in the perioperative period. More data are needed to delineate which patients maximally benefit from perioperative beta-blockade.
Study design: Association study.
Setting: Danish nationwide cohort of patients.
Synopsis: Study investigators included 55,320 uncomplicated hypertension (no cardiovascular, renal, or liver disease) patients >19 years of age on ≥2 antihypertensive drugs undergoing non-cardiac surgery. In the 14,664 patients who received beta-blockers, the rates of 30-day major adverse cardiovascular events (MACE; cardiovascular death, nonfatal ischemic stroke, and nonfatal myocardial infarction) and 30-day all-cause mortality were 1.32% and 1.93%, respectively. However, in the 40,676 patients who did not receive beta-blockers, 30-day MACEs and 30-day all-cause mortality rates were 0.84% and 1.32%, respectively (P<0.001). When looking at the individual MACEs, cardiovascular death was the only statistically significant event with higher incidence (0.9% versus 0.45%, P<0.001).
Combination therapy with beta-blocker and RAS inhibitor, calcium channel blockers, or thiazide was associated with statistically significant higher risks of MACEs and all-cause mortality when compared to the combination of RAS inhibitor plus thiazide. Men >70 years of age or undergoing urgent surgery had the highest risk of harm. This study was not a randomized control trial, so caution must be used when attributing causality to beta-blockers, MACEs, and all-cause mortality.
Bottom line: Antihypertensive regimens containing beta-blockers may increase risk of perioperative MACEs and all-cause mortality in patients with uncomplicated hypertension.
Citation: Jorgensen ME, Hlatky MA, Kober L, et al. β-blocker-associated risks in patients with uncomplicated hypertension undergoing noncardiac surgery. JAMA Intern Med. 2015;175(12):1923-1931.

Depression Common among Physicians in Training
Clinical question: What is the prevalence of depression or depressive symptoms in resident physicians?
Background: Depression in resident physicians can lead to poor-quality medical care, increased errors, and long-term morbidity. Prevalence of depression or depressive symptoms has varied in prior studies, and more data are needed to better understand the true prevalence.
Study design: Systematic review and meta-analysis.
Setting: Surgical and nonsurgical residency programs in North America, Asia, Europe, South America, and Africa
Synopsis: Thirty-one cross-sectional studies (9,447 individuals) and 23 longitudinal studies (8,113 individuals) from January 1963 to September 2015 were included in this analysis, with the majority using self-reporting to identify residents with depression or depressive symptoms. Overall prevalence of depression or depressive symptoms was 28.8%, with a range of 20.9% to 43.2%, depending on the screening tool (95% CI, 25.3%–32.5%; P<0.001). There was an increased prevalence in depression or depressive symptoms as the calendar year progressed (slope=0.5% per calendar year increase; 95% CI, 0.03%–0.09%), with no difference in prevalence rates between surgical versus nonsurgical residents, U.S. versus elsewhere, cross-sectional versus longitudinal, or interns versus upper-level residents.
Because studies were heterogeneous with respect to the screening tools and resident population, the prevalence of depression or depressive symptoms cannot be precisely determined.
Bottom line: Prevalence of depression or depressive symptoms ranged from 20.9% to 43.2%, with pooled prevalence of 28.8%, and increased with time.
Citation: Mata DA, Ramos MA, Bansal N, et al. Prevalence of depression and depressive symptoms among resident physicians: a systematic review and met-analysis. JAMA. 2015;314(22):2373-2383.
Breakfast Based on Whey Protein May Help Manage Type 2 Diabetes
NEW YORK (Reuters Health) - A breakfast rich in whey protein may help people with type 2 diabetes manage their illness better, new research from Israel suggests.
"Whey protein, a byproduct of cheese manufacturing, lowers postprandial glycemia more than other protein sources," said lead author Dr. Daniela Jakubowicz from Wolfson Medical Center at Tel Aviv University."
We found that in type 2 diabetes, increasing protein content at breakfast has a greater impact on weight loss, glycated hemoglobin (HbA1C), satiety and postprandial glycemia when the protein source is whey protein, compared with other protein sources, such as eggs, tuna and soy," she told Reuters Health by email.
Dr. Jakubowicz and her group presented their findings April 1 at ENDO 2016, the annual meeting of the Endocrine Society, in Boston.
They randomly assigned 48 overweight and obese patients with type 2 diabetes to one of three isocaloric diets. Over 12 weeks, everyone ate a large breakfast, a medium-sized lunch and a small dinner, but the amount and source of each group's breakfast proteins differed.
At breakfast, the 17 participants in the whey group ate 36 g of protein as part of a whey protein shake consisting of 40% carbohydrate, 40% protein and 20% fat. The 16 participants in the high-protein group ate 36 g of protein in the form of eggs, tuna and cheese (40% carbs; 40% protein; 20% fat). The 15 in the high-carbohydrate group ate 13 g of protein in ready-to-eat cereals (65% carbs; 15% protein; 20% fat).
All three diets included a 660 kcal breakfast, a 567 cal lunch and a 276 cal dinner, with the same composition at lunch and dinner.
After 12 weeks, the participants in the whey protein group lost the most weight (7.6 kg vs. 6.1 kg for participants in the high-protein group and 3.5 kg for those in the high-carbohydrate group (p<0.0001).
Participants on the whey protein diet were less hungry during the day and had lower glucose spikes after meals compared with those on the other two diets.
The drop in HbA1C was 11.5% in the whey group, 7.7% in the protein group and 4.6% in the carbohydrate group (p<0.0001). Compared with the carbohydrate group, the percentage drop in HbA1c was greater by 41% in the protein group and by 64% in the whey group (p<0.0001).
"Whey protein was consumed only at breakfast; however, the improvement of glucose, insulin and glucagon-like peptide 1 (GLP-1) was also observed after lunch and dinner. The mechanism of this persistent beneficial effect of whey protein needs further research," Dr. Jakubowicz said.
Co-author Dr. Julio Wainstein, also at Wolfson Medical Center, added by email, "Usually, patients with type 2 diabetes are treated with a combination of several antidiabetic drugs to achieve adequate glucose regulation and decrease HbA1c. Whey protein should be considered an important adjuvant in the management of type 2 diabetes."
"Furthermore," Dr. Wainstein added, "it is possible that by adding whey protein to the diet, glucose regulation might be achieved with less medication, which is a valuable advantage in type 2 diabetes treatment."
The study had no commercial funding, and the authors declared no conflicts of interest.
Combo could improve treatment of MM, team says

multiple myeloma
Combining a calcineurin inhibitor and a histone deacetylase (HDAC) inhibitor could improve the treatment of multiple myeloma (MM), according to researchers.
The team found that MM cells express high levels of the protein phosphatase PPP3CA, a subunit of calcineurin.
And combining the calcineurin inhibitor FK506 with the HDAC inhibitor panobinostat suppressed MM cell growth in vitro and decreased tumor growth in mouse models of MM.
Yoichi Imai, MD, PhD, of Tokyo Women’s Medical University in Japan, and colleagues conducted this research and reported the results in JCI Insight.
First, the team observed increased PPP3CA expression in MM cell lines and MM cells isolated from patients with advanced disease.
Then, the researchers found that panobinostat reduced PPP3CA expression in MM cell lines. And further investigation revealed that the drug induced degradation of PPP3CA through HSP90 inhibition.
When the team knocked down PPP3CA in MM cells, they observed a reduction in cell growth. And when they overexpressed PPP3CA, they observed enhanced MM cell growth.
The researchers noted that FK506 inhibits the association between PPP3CA and calcineurin B. Unfortunately, FK506 alone did not suppress the growth of MM cells in vitro.
However, when FK506 was given with panobinostat or the HDAC inhibitor ACY-1215, the researchers observed a greater reduction in MM cell growth than with either HDAC inhibitor alone.
Panobinostat and FK506 reduced the growth of MM cells that were t(4;14)-positive (KMS-11, KMS-18, and KMS-26) and t(4;14)-negative (U266 and KMS-12PE) more effectively than panobinostat alone.
In mice with MM, those treated with FK506 alone had tumor sizes similar to control mice. However, mice treated with panobinostat saw a decrease in tumor size. And this effect was enhanced by the addition of FK506.
The researchers observed reduced PPP3CA expression, enhanced histone H3 acetylation, and cleavage of caspase-3 in samples from panobinostat-treated mice. And FK506 augmented panobinostat-induced apoptosis.
The team said these results suggest that FK506 enhances the antimyeloma effect of panobinostat through PPP3CA reduction, which supports the importance of calcineurin in the pathogenesis of MM. ![]()
Drug corrects anemia in CKD patients

The investigational therapy roxadustat can effectively treat anemia in patients with chronic kidney disease (CKD) who are not on dialysis, according to a phase 2 study.
Roxadustat increased and maintained hemoglobin levels and decreased hepcidin levels in these patients, who had not received previous treatment with
erythropoiesis-stimulating agents and were treated with roxadustat regardless of their baseline iron repletion status.
In addition, researchers said there were no serious adverse events related to roxadustat.
Robert Provenzano, MD, of St. John Hospital and Medical Center in Detroit, Michigan, and his colleagues reported these results in the Clinical Journal of the American Society of Nephrology.
The study was sponsored by FibroGen, Inc., the company developing roxadustat in collaboration with AstraZeneca.
Roxadustat (FG-4592) is an oral, small-molecule inhibitor of hypoxia-inducible factor (HIF) prolyl hydroxylase activity. HIF is a transcription factor that induces the natural physiological response to conditions of low oxygen, “turning on” erythropoiesis and other protective pathways.
In this randomized, phase 2 study of roxadustat, 145 patients with anemia (hemoglobin < 10.5 g/dL at baseline) and non-dialysis CKD were randomized into 1 of 6 cohorts of approximately 24 patients.
The cohorts had varying roxadustat starting doses (tiered weight and fixed amounts) and frequencies (2 and 3 times weekly), followed by hemoglobin maintenance with roxadustat 1 to 3 times weekly. The treatment duration was 16 or 24 weeks.
Results
Of the 143 patients evaluable for efficacy, 92% achieved a hemoglobin response—defined as a hemoglobin increase of > 1.0 g/dL from baseline and a hemoglobin of > 11.0 g/dL by the end of treatment (up to 16 weeks of treatment in 47 patients, and up to 24 weeks of treatment in 96 patients).
Generally, patients in all cohorts who received higher starting doses of roxadustat demonstrated earlier achievement of the hemoglobin response.
Roxadustat increased hemoglobin independently of the patients’ baseline iron repletion and inflammatory status, as measured by baseline C–reactive protein levels. Intravenous iron was not permitted throughout the study period, and 52.4% of patients were iron-replete at baseline.
Over 16 weeks of treatment, roxadustat decreased hepcidin levels by 16.9% (P=0.004), maintained reticulocyte hemoglobin content, and increased hemoglobin by a mean (±SD) of 1.83 (±0.09) g/dL (P<0.001).
After 8 weeks of roxadustat, total cholesterol levels decreased by a mean (±SD) of 26 (±30) mg/dL (P<0.001).
“In this study, anemia correction was achieved under a range of treatment options, including tiered-weight as well as fixed-starting-dose strategies,” Dr Provenzano said. “Correction of anemia and maintenance of hemoglobin response were seen at different dose frequencies—2 or 3 times weekly for achievement of hemoglobin response; 1, 2, or 3 times weekly for maintenance.”
“Secondary analyses showing decreases in hepcidin and increased iron utilization, as well as reductions in total cholesterol levels, suggest roxadustat consistently affects these parameters.”
Treatment-emergent adverse events were reported in 80% of all patients.
The most common events that occurred in more than 5% of patients were nausea (9.7%), diarrhea (8.3%), constipation (6.2%), vomiting (5.5%), peripheral edema (12.4%), urinary tract infection (9.7%), nasopharyngitis (9.0%), sinusitis (5.5%), dizziness (6.2%), headache (5.5%), and hypertension (7.6%). ![]()