User login
Medicaid is Likely to Benefit Low-income Adults in the U.S. Under the Affordable Care Act
NEW YORK (Reuters Health) - Low-income adults in the U.S. likely benefited if their states expanded Medicaid in 2014 under the Affordable Care Act, suggests a new study.
Researchers found increased rates of insurance coverage, healthcare use, and chronic disease diagnoses among low-income adults in states that expanded access to the government-funded health insurance program.
"It looks like there is better medical care for these adults," said lead author Dr. Laura Wherry, of the David Geffen School of Medicine at the University of California, Los Angeles.
A key provision of the Affordable Care Act (ACA), sometimes referred to as Obamacare, was to force states to expand their Medicaid programs by 2014. But with a Supreme Court decision allowing states to opt out of the expansion, only 26 states actually expanded their Medicaid programs.
For the new study, the researchers analyzed 2010-2014 survey data collected from low-income U.S. adults ages 19 to 64.
In the pre-expansion era, from 2010-2013, about 33% had no insurance in states that ultimately expanded Medicaid, compared to about 42% in states that opted out of expansion, according to an article online April 18 in Annals of Internal Medicine.
In 2014, those rates fell to about 18% in states that expanded Medicaid andabout 34% in states that didn't.
Overall, the uninsured rate fell by about 7 percentage points more in states that expanded Medicaid than in those that didn't.
States with expanded Medicaid coverage also had a larger increase in the proportion of people who thought their insurance coverage improved over the previous year.
Additionally, there was evidence that people in states with expanded Medicaid programs were using their coverage, because they had larger increases in interactions with general physicians and overnight hospital stays.
There were also more diagnoses of diabetes and high cholesterol in states with expanded Medicaid programs.
Gaining insurance likely leads to more screening for these conditions, and more diagnoses may lead to early treatment and important downstream health effects, Dr. Jeffrey Kullgren wrote in an editorial.
The new study shows what's happening in states that expand Medicaid and "what is foregone by states that reject the ACA's opportunity to expand Medicaid," write Kullgren, of the University of Michigan Medical School and the Veterans Affairs Ann Arbor Health System.
While the new study did not show that people felt healthier in expanded-Medicaid states, Dr. Wherry said it may be too early to see changes in that measure.
"I think long-term follow up will be very important," she said. The results help confirm the value of the ACA for people who obtain this coverage, said Dr. John McDonough, who worked on the ACA but was not involved with the new study.
He said the new findings likely won't convince reluctant states to expand their Medicaid programs, however.
"It's not about evidence at this point," said Dr. McDonough, who is a professor at the Harvard T.H. Chan School of Public Health in Boston. "It's about a political fear over Obamacare that at this point is not influenceable by meaningful evidence."
The authors reported no funding or disclosures.
Creating a better mouse model

Researchers believe they may have discovered why medical interventions that succeed in mice don’t always translate to the clinic.
The team said the fact that lab mice are raised in pathogen-free environments may contribute to the differences in immune system development between lab mice and humans.
But co-housing lab mice with mice from pet stores can produce “dirty” mouse models that may better reflect the immune systems of adult humans.
David Masopust, PhD, of the University of Minnesota in Minneapolis, and his colleagues described these findings in a letter to Nature.
The researchers first explored immunological differences between lab mice and humans by analyzing cervical tissue specimens from adults of each species.
The team found that lab mice had fewer, less diverse, and less widely distributed memory T cells when compared with humans.
The immune systems of lab mice more closely resembled those of human infants, particularly with regard to the number and tissue distribution of memory T cells.
The researchers performed a similar analysis on tissues from lab mice and from mice found in barn or pet store environments.
The non-lab mice had immune systems more like those of adult humans, which suggests the variation in microbial environment—and not the species difference—could account for the immune system differences.
The researchers then set out to determine if the immune systems of lab mice with little exposure to environmental microbes could change when exposed to a different environment.
They co-housed lab mice with healthy mice raised in a pet store. After 8 weeks, analyses of the lab mice revealed patterns of T cells and other immune system components that more closely matched the pet store mice as well as adult humans.
The researchers said these findings suggest that “dirty” mice may model the human immune system more closely than typical lab mice and could be studied to learn more about the role of environment and genetics in the development of the human immune system. ![]()
Gene therapy can increase FVIII levels

Preliminary data from a phase 1/2 study suggest an investigational gene therapy can increase factor VIII (FVIII) levels in patients with severe hemophilia A.
The therapy, BMN 270, is a recombinant adeno-associated virus (AAV) vector coding for FVIII.
To date, 8 patients have received a single dose of BMN 270, and most have experienced an increase in FVIII levels and a decrease in the severity of their disease.
At last observation, patients receiving the highest dose of BMN 270 experienced increasing FVIII activity levels ranging between 4% and 60% (as a percentage calculated based on the numbers of International Units (IU) per milliliter of whole blood).
These results were recently announced by BioMarin Pharmaceutical Inc., the company developing BMN 270.
“If BMN 270 allows hemophilia A patients to maintain around 5% of normal levels of FVIII, it could have a real and meaningful clinical benefit by reducing the need for FVIII infusions and spontaneous bleeds,” said study investigator John Pasi, PhD, of Barts and the London School of Medicine and Dentistry in the UK.
“I am looking forward to further assessing the data over the 16 weeks and beyond in this ongoing study.”
This dose-escalation study was designed to evaluate the safety and efficacy of BMN 270 gene therapy in up to 12 patients with severe hemophilia A.
The primary endpoints are to assess the safety of a single intravenous administration of a recombinant AAV vector coding for FVIII and determine the change from baseline of FVIII expression level at 16 weeks after infusion.
Secondary endpoints include assessing the impact of BMN 270 on the frequency of FVIII replacement therapy, the number of bleeding episodes requiring treatment, and any potential immune responses. Researchers plan to monitor patients for safety and durability of effect for 5 years.
Results
A total of 8 patients with severe hemophilia A have received a single dose of BMN 270—one at 6 x 10¹² vg/kg, one at 2 x 10¹³ vg/kg, and six at 6 x 10¹³ vg/kg.
At 20 weeks after administration, the patient who received the lowest dose of BMN 270 had a FVIII activity level of less than 1% and still had severe hemophilia.
At 16 weeks, the patient who received the middle dose of BMN 270 had a FVIII activity level of 2% and moderate hemophilia.
One patient in the highest dose group also had moderate hemophilia and a FVIII activity level of 4% at 7 weeks.
Three patients in the high-dose group had mild hemophilia and FVIII activity levels of 8%, 10%, and 21% at 7, 5, and 6 weeks, respectively.
And 2 patients in the high-dose group had normal levels of FVIII activity—57% at 16 weeks and 60% at 8 weeks.
Liver function
The researchers have monitored liver function tests closely during the trial. The first 3 patients did not receive prophylactic corticosteroids, and 2 of these patients experienced elevated alanine aminotransferase (ALT) levels.
Patient 3, the first patient treated at the highest dose level, experienced a mild ALT elevation at week 4, which prompted administration of a course of corticosteroids. ALT levels in this patient continued to rise modestly during the corticosteroid therapy, which was completed at week 14.
Two weeks later, Patient 3 began a new corticosteroid regimen when ALT levels became minimally abnormal for the first time. The expression of FVIII continued to increase during this ALT elevation and is currently at 57%.
In addition, Patient 1, who was treated at the lowest dose of BMN 270, experienced a rise in ALT level to 128 IU/L at 28 weeks after dosing.
After the third patient, all patients were started on prophylactic corticosteroid therapy. To date, no additional patients have experienced abnormal ALT levels.
BioMarin said it plans to discuss these findings with UK regulatory authorities prior to dosing the remaining patients.
“We are encouraged by this early data on BMN 270 and the trend we are seeing in increasing FVIII levels over time,” said Hank Fuchs, MD, chief medical officer at BioMarin.
“BMN 270 could have the potential to reduce and possibly eliminate the need for infusions of FVIII.”
BMN 270 has received orphan drug designation from the European Commission and US Food and Drug Administration. Phase 3 design preparation and high-volume manufacturing plans are underway. ![]()
Chronic conditions decrease HRQOL in CCSs

Photo from Dana-Farber/
Boston Children’s Cancer
and Blood Disorders Center
Young adult survivors of childhood cancer tend to have inferior health-related quality of life (HRQOL) when compared to the general population, according to research published in the Journal of the National Cancer Institute.
Childhood cancer survivors (CCSs) ages 18 to 29 reported overall HRQOL similar to that of people from the general population who were in their 40s.
However, CCSs fared better if they did not have chronic health conditions.
“Our findings indicate survivors’ accelerated aging and also help us understand the health-related risks associated with having had cancer as a child,” said study author Lisa Diller, MD, of Dana-Farber/Boston Children’s Cancer and Blood Disorders Center and Harvard Medical School in Boston, Massachusetts.
“What’s encouraging is that the lower quality of life scores are associated with chronic disease after treatment, not with a history of pediatric cancer itself. If we can prevent treatment-related conditions by changes in the therapy we use for the cancer, then childhood cancer will become an acute, rather than a chronic, illness.”
Dr Diller and her colleagues used information from the Childhood Cancer Survivor Study to compare CCSs (n=7105) and their siblings (n=372) and information from the Medical Expenditures Panel Survey to make comparisons to the general population (n=12,803).
The researchers estimated health utility, a summary measure of quality of life, in these subjects using the Short Form-6D (SF-6D). A score of “1” indicated perfect health, and a score of “0” indicated death.
Results showed that CCSs had significantly lower SF-6D scores than the general population. The mean scores were 0.77 and 0.81, respectively (P<0.001).
But there were no clinically meaningful differences between the CCSs’ siblings and the general population. Their mean SF-6D scores were 0.80 and 0.81, respectively.
Young adult CCSs ages 18 to 29 had a mean score of 0.78, which was roughly equivalent to that reported for 40-to-49-year-old adults in the general population.
However, the presence or absence of chronic health conditions played a role in HRQOL. CCSs who reported no chronic conditions had SF-6D scores similar to the general population, with a mean score of 0.81.
But CCSs with chronic conditions had scores that matched the scores of chronically ill members of the general population. CCSs with 2 chronic conditions had a mean score of 0.77. Those with 3 or more disabling, severe, or life-threatening conditions had a mean score of 0.70.
“By enabling comparisons to the general population, our findings provide context to better understand how the cancer experience may influence the long-term well-being of survivors,” said study author Jennifer Yeh, PhD, of the Harvard T.H. Chan School of Public Health in Boston.
“This is another way to understand the health challenges survivors face and where to focus efforts to improve the long-term health and quality of life of survivors.” ![]()
Pathogen-reduced blood may cut transfusion-transmitted malaria
A method for reducing pathogens present in whole blood used for transfusions may reduce the incidence of malaria transmission, and also provide clinical support for patients with severe anemia or hemorrhage, according to the results of a prospective study published April 22 in the Lancet.
“This study is the first to show pathogen reduction treatment of whole blood for transfusion resulted in reduced transmission of a blood-borne infectious parasite in a region hyperendemic for malaria,” wrote Dr. Jean-Pierre Allain of the department of hematology at the University of Cambridge (England) and his coauthors.

The investigators examined the safety and efficacy of the Mirasol pathogen reduction technology system in the African Investigation of the Mirasol System (AIMS) trial. Between March 12, 2014, and November 7, 2014, 227 adults from Ghana with blood group O+ were admitted to the Komfo Anokye Teaching Hospital in Kumasi, and enrolled in this prospective, randomized, parallel-group, double-blind, controlled study of transfusion-transmission of malaria. The patients underwent up to two whole blood transfusions with either pathogen-reduced whole blood (treated), or whole blood prepared and transfused by standard local practice (untreated), within 3 days following randomization. (Lancet. 2016 Apr 23;387:1753-61).
Of the patients completing the study protocol and included in the subsequent primary endpoint analysis, 65 nonparasitemic patients were exposed to parasitemic whole blood (28 treated and 37 untreated) and compared with 99 nonparasitemic control patients who received nonparasitemic whole blood (55 treated and 44 untreated), reported Dr. Allain.
The investigators found that the incidence of transfusion-transmitted malaria was significantly lower for the nonparasitemic patients receiving parasitemic whole blood, than for the nonparasitemic control patients who received nonparasitemic whole blood. Of the 65 patients transfused with parasitemic whole blood, 1 of the 28 treated patients (4%) and 8 of the 37 untreated patients (22%) were found to have contracted transfusion-transmitted malaria. Additionally, the safety profiles of the patients receiving treated or untreated whole blood did not differ and no transfusion-related fatalities occurred.
In developing countries, blood supplies are often contaminated by infectious agents, and blood banking systems cannot afford the newest nucleic acid detection technologies for blood-borne pathogens, the investigators wrote. They suggested that technologies designed to reduce pathogens present in whole blood may be of clinical benefit to both individual patients and health care systems. The use of such methods could result not only in better patient outcomes, but also in greater stability in blood supplies, as well as an associated decrease in treatment costs attributable to reductions in preventable infections.
Funding for this project was provided by Terumo BCT, which produces the Mirasol system. All but one of the coauthors disclosed financial ties to the funding source.
The results from the study by Dr. Allain and his associates should prompt efforts to introduce pathogen-reducing technologies for whole blood, red blood cells, or both.
Hope for this anticipated progress in pathogen reduction technology should be growing based on the two pathogen reduction technology systems in development, one of which was used in the study by Dr. Allain and his colleagues (Mirasol; Terumo BCT, Lakewood, Colo.). This method uses riboflavin (vitamin B2) and ultraviolet light to inactivate pathogens in whole blood. The other method (Intercept; Cerus, Concord, Calif.) uses a chemical compound, S-303, and glutathione in the red blood cell product.
The risk that blood recipients in Africa must accept, especially children, would be considered an intolerable risk in developed countries, and pathogen reduction technology that preserves the clinical benefits of transfusion could revolutionize transfusion safety where it is most needed.
Dr. Sheila O’Brien is director of National Epidemiology and Surveillance at Canadian Blood Services and adjunct faculty at the University of Ottawa. She reported having no conflicts of interest. These remarks are adapted from her editorial accompanying the article (Lancet. 2016 Apr 23;387:1701-3).
A method for reducing pathogens present in whole blood used for transfusions may reduce the incidence of malaria transmission, and also provide clinical support for patients with severe anemia or hemorrhage, according to the results of a prospective study published April 22 in the Lancet.
“This study is the first to show pathogen reduction treatment of whole blood for transfusion resulted in reduced transmission of a blood-borne infectious parasite in a region hyperendemic for malaria,” wrote Dr. Jean-Pierre Allain of the department of hematology at the University of Cambridge (England) and his coauthors.
The investigators examined the safety and efficacy of the Mirasol pathogen reduction technology system in the African Investigation of the Mirasol System (AIMS) trial. Between March 12, 2014, and November 7, 2014, 227 adults from Ghana with blood group O+ were admitted to the Komfo Anokye Teaching Hospital in Kumasi, and enrolled in this prospective, randomized, parallel-group, double-blind, controlled study of transfusion-transmission of malaria. The patients underwent up to two whole blood transfusions with either pathogen-reduced whole blood (treated), or whole blood prepared and transfused by standard local practice (untreated), within 3 days following randomization. (Lancet. 2016 Apr 23;387:1753-61).
Of the patients completing the study protocol and included in the subsequent primary endpoint analysis, 65 nonparasitemic patients were exposed to parasitemic whole blood (28 treated and 37 untreated) and compared with 99 nonparasitemic control patients who received nonparasitemic whole blood (55 treated and 44 untreated), reported Dr. Allain.
The investigators found that the incidence of transfusion-transmitted malaria was significantly lower for the nonparasitemic patients receiving parasitemic whole blood, than for the nonparasitemic control patients who received nonparasitemic whole blood. Of the 65 patients transfused with parasitemic whole blood, 1 of the 28 treated patients (4%) and 8 of the 37 untreated patients (22%) were found to have contracted transfusion-transmitted malaria. Additionally, the safety profiles of the patients receiving treated or untreated whole blood did not differ and no transfusion-related fatalities occurred.
In developing countries, blood supplies are often contaminated by infectious agents, and blood banking systems cannot afford the newest nucleic acid detection technologies for blood-borne pathogens, the investigators wrote. They suggested that technologies designed to reduce pathogens present in whole blood may be of clinical benefit to both individual patients and health care systems. The use of such methods could result not only in better patient outcomes, but also in greater stability in blood supplies, as well as an associated decrease in treatment costs attributable to reductions in preventable infections.
Funding for this project was provided by Terumo BCT, which produces the Mirasol system. All but one of the coauthors disclosed financial ties to the funding source.
FROM THE LANCET
Key clinical point: The incidence of transfusion-transmitted malaria can be reduced by treating whole blood with a pathogen reduction system.
Major finding: Patients receiving pathogen-reduced whole blood had a lower incidence of transfusion-transmitted malaria (4%) than those who received standard treatment (22%).
Data source: Patients with anemia from a single center in Ghana being supported with whole blood transfusion.
Disclosures: Funding for this project was provided by Terumo BCT, which produces the Mirasol system. All but one of the coauthors disclosed ties to the funding source.

Once-daily eslicarbazepine equals twice-daily carbamazepine for controlling partial-onset seizures
VANCOUVER – Once-daily eslicarbazepine may offer a more convenient option for controlling newly diagnosed partial-onset seizures, suggest findings of a phase III trial reported at the annual meeting of the American Academy of Neurology.
The study of 815 adult patients found that 71.1% of those treated with once-daily eslicarbazepine as monotherapy were seizure free for at least 6 months, compared with 75.6% of those treated with twice-daily controlled-release carbamazepine as monotherapy. The difference fell within the predefined margin for noninferiority.
Additionally, the safety profile of eslicarbazepine was at least as good as that of carbamazepine, and there were no new or unexpected adverse events, relative to those seen in trials in which the former has been used as adjunctive therapy.

“Eslicarbazepine has the same efficacy, has a little bit better safety, and it can be taken once a day,” coauthor Dr. Pedro André Kowacs commented in an interview. “I have been working with it for 12 years. It’s a very, very good drug.”
“There are few antiepileptic drugs that can be taken once a day,” he added. “We know that a more simple schedule enhances adherence of the patient, compliance of the patient to therapy.”
Also, patients can choose when to take eslicarbazepine, according to Dr. Kowacs, who is a neurologist at the Instituto de Neurologia de Curitiba in Brazil. “You can take it in the morning or you can take it at night. It doesn’t matter,” he elaborated. “This is in contrast to, say, phenobarbital. If you take it in the morning, perhaps you are going to sleep all day long. And if you take three tabs of Dilantin (phenytoin), probably you get a little bit dizzy.”
In the trial, patients were randomized evenly to once-daily eslicarbazepine (brand name Aptiom) or twice-daily controlled-release carbamazepine (brand name Tegretol XR), each as monotherapy. Eslicarbazepine is currently approved by the U.S. Food and Drug Administration for the treatment of partial-onset seizures as monotherapy or adjunctive therapy.
In both groups, the patients were treated according to a three-step dose-level design, with upward titration of dose if they experienced seizures. However, the majority in each group – 67.6% for eslicarbazepine and 76.9% for carbamazepine – remained at the lowest-dose level studied (800 mg once daily and 200 mg twice daily, respectively).
The primary endpoint was the proportion of patients in the per-protocol population who were seizure free for the entire 26-week evaluation period at the last received dose level.
Overall, that proportion was 71.1% in the eslicarbazepine group and 75.6% in the carbamazepine group, Dr. Kowacs reported in an Emerging Science session. The absolute difference of –4.28% and the lower bound of the 95% confidence interval of –10.30% fell within the predefined noninferiority margin of –12%.
The 1-year rate of freedom from seizures was 64.7% in the eslicarbazepine group and 70.3% in the carbamazepine group. The absolute difference of –5.46% and the lower bound of the 95% confidence interval of –11.88% again fell within the noninferiority margin.
Patients in the eslicarbazepine tended to have a lower rate of treatment-emergent adverse events possibly related to the drug, compared with counterparts in the carbamazepine group (41.1% vs. 49.5%). The most common were dizziness and headache.
“The [gamma glutamyl transferase level] was increased in more patients taking carbamazepine,” Dr. Kowacs noted, with a rate of 12.4% versus 2.7% with eslicarbazepine. “Hyponatremia occurred in both groups, but no patient was symptomatic.”
There were two deaths each in the eslicarbazepine group (from glioblastoma and cardiac arrest) and the carbamazepine group (from suicide and lung cancer).
Dr. Kowacs disclosed that he has received personal compensation for activities with Bial, Abbott Laboratories, GlaxoSmithKline, and Cyberonics. The trial was sponsored by Bial-Portela & Cª SA.
VANCOUVER – Once-daily eslicarbazepine may offer a more convenient option for controlling newly diagnosed partial-onset seizures, suggest findings of a phase III trial reported at the annual meeting of the American Academy of Neurology.
The study of 815 adult patients found that 71.1% of those treated with once-daily eslicarbazepine as monotherapy were seizure free for at least 6 months, compared with 75.6% of those treated with twice-daily controlled-release carbamazepine as monotherapy. The difference fell within the predefined margin for noninferiority.
Additionally, the safety profile of eslicarbazepine was at least as good as that of carbamazepine, and there were no new or unexpected adverse events, relative to those seen in trials in which the former has been used as adjunctive therapy.
“Eslicarbazepine has the same efficacy, has a little bit better safety, and it can be taken once a day,” coauthor Dr. Pedro André Kowacs commented in an interview. “I have been working with it for 12 years. It’s a very, very good drug.”
“There are few antiepileptic drugs that can be taken once a day,” he added. “We know that a more simple schedule enhances adherence of the patient, compliance of the patient to therapy.”
Also, patients can choose when to take eslicarbazepine, according to Dr. Kowacs, who is a neurologist at the Instituto de Neurologia de Curitiba in Brazil. “You can take it in the morning or you can take it at night. It doesn’t matter,” he elaborated. “This is in contrast to, say, phenobarbital. If you take it in the morning, perhaps you are going to sleep all day long. And if you take three tabs of Dilantin (phenytoin), probably you get a little bit dizzy.”
In the trial, patients were randomized evenly to once-daily eslicarbazepine (brand name Aptiom) or twice-daily controlled-release carbamazepine (brand name Tegretol XR), each as monotherapy. Eslicarbazepine is currently approved by the U.S. Food and Drug Administration for the treatment of partial-onset seizures as monotherapy or adjunctive therapy.
In both groups, the patients were treated according to a three-step dose-level design, with upward titration of dose if they experienced seizures. However, the majority in each group – 67.6% for eslicarbazepine and 76.9% for carbamazepine – remained at the lowest-dose level studied (800 mg once daily and 200 mg twice daily, respectively).
The primary endpoint was the proportion of patients in the per-protocol population who were seizure free for the entire 26-week evaluation period at the last received dose level.
Overall, that proportion was 71.1% in the eslicarbazepine group and 75.6% in the carbamazepine group, Dr. Kowacs reported in an Emerging Science session. The absolute difference of –4.28% and the lower bound of the 95% confidence interval of –10.30% fell within the predefined noninferiority margin of –12%.
The 1-year rate of freedom from seizures was 64.7% in the eslicarbazepine group and 70.3% in the carbamazepine group. The absolute difference of –5.46% and the lower bound of the 95% confidence interval of –11.88% again fell within the noninferiority margin.
Patients in the eslicarbazepine tended to have a lower rate of treatment-emergent adverse events possibly related to the drug, compared with counterparts in the carbamazepine group (41.1% vs. 49.5%). The most common were dizziness and headache.
“The [gamma glutamyl transferase level] was increased in more patients taking carbamazepine,” Dr. Kowacs noted, with a rate of 12.4% versus 2.7% with eslicarbazepine. “Hyponatremia occurred in both groups, but no patient was symptomatic.”
There were two deaths each in the eslicarbazepine group (from glioblastoma and cardiac arrest) and the carbamazepine group (from suicide and lung cancer).
Dr. Kowacs disclosed that he has received personal compensation for activities with Bial, Abbott Laboratories, GlaxoSmithKline, and Cyberonics. The trial was sponsored by Bial-Portela & Cª SA.
AT THE AAN 2016 ANNUAL MEETING
Key clinical point: Once-daily eslicarbazepine has similar safety and efficacy as twice-daily carbamazepine in patients with partial-onset seizures.
Major finding: The proportion of patients who were seizure free for at least 6 months at the last evaluated dose was 71.1% with once-daily eslicarbazepine and 75.6% with twice-daily controlled-release carbamazepine, a noninferior difference.
Data source: A phase III, randomized, controlled trial among 815 adults with newly diagnosed partial-onset seizures.
Disclosures: Dr. Kowacs disclosed that he has received personal compensation for activities with Bial, Abbott Laboratories, GlaxoSmithKline, and Cyberonics. The trial was sponsored by Bial-Portela & Cª SA.

Obesity, Scales, and a Sweaty Situation
A 67-year-old Asian woman presents with changes under her breasts that manifested several years ago and are slowly becoming more pronounced. Occasionally itchy, the skin is always hot and sweaty. This problem has been treated numerous times over the years with oral and topical antiyeast preparations, to no good effect. She is currently on fluconazole oral.
Aside from obesity, she claims that her only other health problem is “skin rashes” on her arms and scalp, which have persisted for years. Cursory examination of her chart, however, reveals that she also has type 2 diabetes and dementia.

EXAMINATION
The patient is 5 feet tall and weighs 240 lb. She has type II skin with classic Asian coloring. The skin under her breasts is bright pink, with focal areas of dark brown. The affected area extends downward onto her upper abdomen. The surface of the rash is totally macular, with no palpable component.
On both extensor forearms, a scaly, pink rash is seen, covered with thick, white scales. Likewise, on her scalp, particularly above and behind the ears, there are large patches of white scaling with underlying pink skin.
What is the diagnosis?
DISCUSSION
While it is uncommon in those of Asian ancestry, this patient has psoriasis. (The involvement of her scalp and arms helps to corroborate this diagnosis.) But she has other issues that serve to confuse the picture: Her extreme obesity and pendulous breasts trap heat and sweat, which induces a condition called intertrigo. This chronic inflammatory process has become “koebnerized,” a phenomenon in which psoriasis appears in a traumatized area, such as a surgical wound or burn. To make matters even worse, the skin immediately under her breasts has darkened as a result of postinflammatory hyperpigmentation.
So this patient actually has three overlapping problems: intertrigo, koebnerized psoriasis, and postinflammatory hyperpigmentation. Her obesity, which is unlikely to improve, is a major contributor to each. Luckily, the inframammary skin changes are relatively asymptomatic.
All three problems can be alleviated by reducing heat and sweat (with antiperspirants, talcum-based powder, weight loss, and use of cotton cloth to separate the breasts from the underlying chest skin), and through use of topical class III steroid creams. We can stop treating it as a yeast infection, because yeast plays little to no part in the process.
TAKE-HOME LEARNING POINTS
• Skin injury—whether from surgery, burn, excoriation, or chronic maceration—can cause psoriasis to flare, a process known as the Koebner phenomenon.
• Intertrigo refers to an inflammatory condition affecting intertriginous areas such as the groin, axilla, abdominal or other folds, and inframammary skin.
• Intertrigo is caused by chronic maceration related to heat and perspiration and is especially common under the breasts.
• The same chronic inflammation that causes intertrigo and the Koebner phenomenon can also result in postinflammatory hyperpigmentation in those with darker skin.
• Bacteria and yeast organisms play only a small role, if any, in these processes.
A 67-year-old Asian woman presents with changes under her breasts that manifested several years ago and are slowly becoming more pronounced. Occasionally itchy, the skin is always hot and sweaty. This problem has been treated numerous times over the years with oral and topical antiyeast preparations, to no good effect. She is currently on fluconazole oral.
Aside from obesity, she claims that her only other health problem is “skin rashes” on her arms and scalp, which have persisted for years. Cursory examination of her chart, however, reveals that she also has type 2 diabetes and dementia.
EXAMINATION
The patient is 5 feet tall and weighs 240 lb. She has type II skin with classic Asian coloring. The skin under her breasts is bright pink, with focal areas of dark brown. The affected area extends downward onto her upper abdomen. The surface of the rash is totally macular, with no palpable component.
On both extensor forearms, a scaly, pink rash is seen, covered with thick, white scales. Likewise, on her scalp, particularly above and behind the ears, there are large patches of white scaling with underlying pink skin.
What is the diagnosis?
DISCUSSION
While it is uncommon in those of Asian ancestry, this patient has psoriasis. (The involvement of her scalp and arms helps to corroborate this diagnosis.) But she has other issues that serve to confuse the picture: Her extreme obesity and pendulous breasts trap heat and sweat, which induces a condition called intertrigo. This chronic inflammatory process has become “koebnerized,” a phenomenon in which psoriasis appears in a traumatized area, such as a surgical wound or burn. To make matters even worse, the skin immediately under her breasts has darkened as a result of postinflammatory hyperpigmentation.
So this patient actually has three overlapping problems: intertrigo, koebnerized psoriasis, and postinflammatory hyperpigmentation. Her obesity, which is unlikely to improve, is a major contributor to each. Luckily, the inframammary skin changes are relatively asymptomatic.
All three problems can be alleviated by reducing heat and sweat (with antiperspirants, talcum-based powder, weight loss, and use of cotton cloth to separate the breasts from the underlying chest skin), and through use of topical class III steroid creams. We can stop treating it as a yeast infection, because yeast plays little to no part in the process.
TAKE-HOME LEARNING POINTS
• Skin injury—whether from surgery, burn, excoriation, or chronic maceration—can cause psoriasis to flare, a process known as the Koebner phenomenon.
• Intertrigo refers to an inflammatory condition affecting intertriginous areas such as the groin, axilla, abdominal or other folds, and inframammary skin.
• Intertrigo is caused by chronic maceration related to heat and perspiration and is especially common under the breasts.
• The same chronic inflammation that causes intertrigo and the Koebner phenomenon can also result in postinflammatory hyperpigmentation in those with darker skin.
• Bacteria and yeast organisms play only a small role, if any, in these processes.

PPIs associated with antibiotic-resistant bacteria carriage
AMSTERDAM – The long-term safety of proton pump inhibitors has once again come into question, as they may quadruple the chance of carrying a bacterial strain highly resistant to both penicillin and cephalosporin antibiotics, a Dutch study suggested.
The observational study showed only association, not causation, according to Dr. Pepijn Huizinga of the Amphia Ziekenhuis Hospital, Breda, the Netherlands. But, he said, the association of PPIs and extended-spectrum beta-lactamase–producing enterobacteriaceae (ESBL-E) is biologically plausible, and strong enough to warrant deeper investigation. Dr. Huizinga reported the study results at the 2016 European Conference of Clinical Microbiology and Infectious Diseases.
“We are continuously exposed to ESBL-E from many sources – other humans, contaminated foods, and the environment,” Dr. Huizinga said. “The gastric acid barrier is one of the last barriers we have against developing carriage. As long as it is in the normal pH range of 1.5-3, it’s quite efficient at keeping these bacteria from entering our system. But PPIs decrease this to 3 or 4. We already know that this is associated with an increased risk of infections from campylobacteriae, salmonella, and C. [Clostridium] difficile.”

PPI use is exploding in the Netherlands, Dr. Huizinga said, following a worldwide pattern of escalating use. National statistics demonstrate a very sharp upward trend, beginning with the introduction of omeprazole in 1994. By 2013, with five PPIs on the market, there were more than 2.7 million users – 14% of the country’s adult population. About a third of people older than 65 years are using them on a daily basis, according to data from the Dutch Foundation for Pharmaceutical Statistics.
To examine the relationship, Dr. Huizinga mined data from an ESBL-E prevalence survey conducted at Amphia Ziekenhuis Hospital in 2014 and 2015. The study cohort comprised 570 adults who received a rectal culture within a day of admission. Of these, 5.4% (31) were positive for ESBL-E carriage.
He examined correlations between carriage and several patient characteristics. Women were slightly more likely to be carriers than men (6.6% vs. 4%). There was no difference in the incidence of antibiotic use on day of admission, with 6% of the positive patients taking an antibiotic and 5% not taking one. Carriers were younger than noncarriers (64 vs. 65 years). PPI use was significantly more common among those who carried ESBL-E (8.6% vs. 2.9%).
In a multivariate analysis, there were no significant associations with sex, age, or antibiotic use. PPI use conferred the only significant risk, a fourfold increase in the chance of carriage.
Dr. Huizinga noted that the model didn’t consider the length of time taking the drugs, only whether they were in use on the day of admission. Nor did the study account for any medical comorbidity.
“However,” he said, “I think we do need to consider the possibility that the frequent use of PPIs in the general population could be an important driver of the increase we are seeing in ESBL-E carriage.”
Dr. Huizinga had no relevant financial disclosures.
On Twitter @Alz_Gal
AMSTERDAM – The long-term safety of proton pump inhibitors has once again come into question, as they may quadruple the chance of carrying a bacterial strain highly resistant to both penicillin and cephalosporin antibiotics, a Dutch study suggested.
The observational study showed only association, not causation, according to Dr. Pepijn Huizinga of the Amphia Ziekenhuis Hospital, Breda, the Netherlands. But, he said, the association of PPIs and extended-spectrum beta-lactamase–producing enterobacteriaceae (ESBL-E) is biologically plausible, and strong enough to warrant deeper investigation. Dr. Huizinga reported the study results at the 2016 European Conference of Clinical Microbiology and Infectious Diseases.
“We are continuously exposed to ESBL-E from many sources – other humans, contaminated foods, and the environment,” Dr. Huizinga said. “The gastric acid barrier is one of the last barriers we have against developing carriage. As long as it is in the normal pH range of 1.5-3, it’s quite efficient at keeping these bacteria from entering our system. But PPIs decrease this to 3 or 4. We already know that this is associated with an increased risk of infections from campylobacteriae, salmonella, and C. [Clostridium] difficile.”
PPI use is exploding in the Netherlands, Dr. Huizinga said, following a worldwide pattern of escalating use. National statistics demonstrate a very sharp upward trend, beginning with the introduction of omeprazole in 1994. By 2013, with five PPIs on the market, there were more than 2.7 million users – 14% of the country’s adult population. About a third of people older than 65 years are using them on a daily basis, according to data from the Dutch Foundation for Pharmaceutical Statistics.
To examine the relationship, Dr. Huizinga mined data from an ESBL-E prevalence survey conducted at Amphia Ziekenhuis Hospital in 2014 and 2015. The study cohort comprised 570 adults who received a rectal culture within a day of admission. Of these, 5.4% (31) were positive for ESBL-E carriage.
He examined correlations between carriage and several patient characteristics. Women were slightly more likely to be carriers than men (6.6% vs. 4%). There was no difference in the incidence of antibiotic use on day of admission, with 6% of the positive patients taking an antibiotic and 5% not taking one. Carriers were younger than noncarriers (64 vs. 65 years). PPI use was significantly more common among those who carried ESBL-E (8.6% vs. 2.9%).
In a multivariate analysis, there were no significant associations with sex, age, or antibiotic use. PPI use conferred the only significant risk, a fourfold increase in the chance of carriage.
Dr. Huizinga noted that the model didn’t consider the length of time taking the drugs, only whether they were in use on the day of admission. Nor did the study account for any medical comorbidity.
“However,” he said, “I think we do need to consider the possibility that the frequent use of PPIs in the general population could be an important driver of the increase we are seeing in ESBL-E carriage.”
Dr. Huizinga had no relevant financial disclosures.
On Twitter @Alz_Gal
AT ECCMID 2016
Key clinical point: Proton pump inhibitors may increase the risk of carrying antibiotic-resistant bacteria.
Major finding: PPIs conferred a fourfold increase in the risk of being colonized with extended-spectrum beta-lactamase–producing enterobacteriaceae.
Data source: A cross-sectional study involving 570 patients.
Disclosures: Dr. Huizinga had no relevant financial disclosures.

Coldiron Truth: Office safety
Wait, I know what you’re thinking, boring, dry, and don’t scold me. I am not going to do any of that today, and instead am going to tell you how to easily improve patient care, save money, and improve staff morale.
The easiest things to do to improve safety in the office include better communications, infection control, correct patient/site identification, dealing with emergencies, and staff safety.

Staff communication is often surprisingly poor, and physicians often assume staff can read our minds (and if they have worked for you for many years, maybe they can!). Always make sure staff – and patients – repeat back complicated instructions (better to start by making them less complicated). Never assume your patients are literate, 14% of adults cannot read, so make sure your staff goes over printed materials with the patients.
Something easy you can do is eliminate abbreviations from your prescription pad and your medical record.
Failure to follow up on path reports and lost biopsies is a frequent cause for lawsuits. You need to make sure you have a redundant system for tracking and reporting pathology results. In addition to the old reliable pathology log book, you need a sequential system ensuring that the specimen made it to the lab, that the result was generated and received, that the patient was notified, and that further action was taken if needed. If this is integrated into your electronic medical record, so much the better, but you still need a paper backup log book, “just in case.”
We all take basic infection precautions when performing procedures, including alcohol hand gel, eye protection, gloves, mask, and cleaning of surgical sites prior to excision. When there are wound infections, which should be rare, you should always culture, and if there is a cluster of infections, particularly with methicillin-resistant staphylococcus aureus (MRSA), you should consider culturing the anterior nares of the staff. Alternatively, you can preemptively treat the staff with intranasal topical mupirocin daily for 2 weeks.
Measuring the use of alcohol gel before and after staff education is an easy and beneficial quality improvement project. You and your staff are, of course, vaccinated for hepatitis B, and yearly for influenza, and you should consider PPD testing every 2 years for everyone. My asymptomatic receptionist converted, and needed prophylactic tuberculosis treatment and contact tracing.
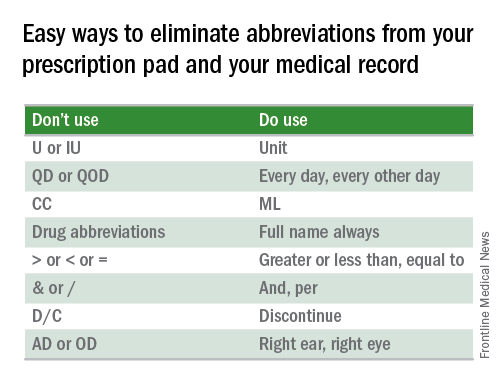
Wrong-site surgery is a frequent problem for dermatologists. Many of our biopsies are tangential, heal almost invisibly, without marking sutures, and patients have battle-scarred skin, and are elderly. The patients may have trouble remembering or seeing where the biopsy was, so good charts and family members are helpful. Photographs of the biopsy sites can be priceless. If the site still cannot be identified, then rebiopsy, or close follow-up is indicated.
Emergencies are rare, but it is prudent to have an automatic external defibrillator in the office. These are automated, so Advanced Cardiovascular Life Support (ACLS), or even basic CPR is not required to operate them, and the survival rate after cardiac arrest increases from 2% to 50%. When it has to be replaced after 5 years, take the old one home and teach your spouse how to use it, and maybe they will.
If you do a lot of surgery you may want to get the ACLS training and buy the crash cart drug kit, but many of the drugs have become ferociously expensive, despite being generic.
Staff safety is a crucial consideration and showing concern boosts staff morale. You should dispose of sharps directly into a sharps container and remove the sharps from the tray at the end of the case. You should have a written protocol for needle sticks. I keep the red top tubes, and the first 2 days of HIV medication on site. Sometimes a patient is HIV positive, the sharp exposure is unknown (a cryostat tissue tease for example), or the patient refuses to have their blood drawn. Less obvious, but important to staff, are locks on doors, alarm systems, good parking lot lighting, and security cameras.
Office safety may seem mundane but a few simple measures can save you a fortune, boost employee morale, and most important of all, improve patient care.
Dr. Coldiron is a past president of the American Academy of Dermatology. He is currently in private practice, but maintains a clinical assistant professorship at the University of Cincinnati. He cares for patients, teaches medical students and residents, and has several active clinical research projects. Dr. Coldiron is the author of more than 80 scientific letters, papers, and several book chapters, and he speaks frequently on a variety of topics.
Wait, I know what you’re thinking, boring, dry, and don’t scold me. I am not going to do any of that today, and instead am going to tell you how to easily improve patient care, save money, and improve staff morale.
The easiest things to do to improve safety in the office include better communications, infection control, correct patient/site identification, dealing with emergencies, and staff safety.
Staff communication is often surprisingly poor, and physicians often assume staff can read our minds (and if they have worked for you for many years, maybe they can!). Always make sure staff – and patients – repeat back complicated instructions (better to start by making them less complicated). Never assume your patients are literate, 14% of adults cannot read, so make sure your staff goes over printed materials with the patients.
Something easy you can do is eliminate abbreviations from your prescription pad and your medical record.
Failure to follow up on path reports and lost biopsies is a frequent cause for lawsuits. You need to make sure you have a redundant system for tracking and reporting pathology results. In addition to the old reliable pathology log book, you need a sequential system ensuring that the specimen made it to the lab, that the result was generated and received, that the patient was notified, and that further action was taken if needed. If this is integrated into your electronic medical record, so much the better, but you still need a paper backup log book, “just in case.”
We all take basic infection precautions when performing procedures, including alcohol hand gel, eye protection, gloves, mask, and cleaning of surgical sites prior to excision. When there are wound infections, which should be rare, you should always culture, and if there is a cluster of infections, particularly with methicillin-resistant staphylococcus aureus (MRSA), you should consider culturing the anterior nares of the staff. Alternatively, you can preemptively treat the staff with intranasal topical mupirocin daily for 2 weeks.
Measuring the use of alcohol gel before and after staff education is an easy and beneficial quality improvement project. You and your staff are, of course, vaccinated for hepatitis B, and yearly for influenza, and you should consider PPD testing every 2 years for everyone. My asymptomatic receptionist converted, and needed prophylactic tuberculosis treatment and contact tracing.
Wrong-site surgery is a frequent problem for dermatologists. Many of our biopsies are tangential, heal almost invisibly, without marking sutures, and patients have battle-scarred skin, and are elderly. The patients may have trouble remembering or seeing where the biopsy was, so good charts and family members are helpful. Photographs of the biopsy sites can be priceless. If the site still cannot be identified, then rebiopsy, or close follow-up is indicated.
Emergencies are rare, but it is prudent to have an automatic external defibrillator in the office. These are automated, so Advanced Cardiovascular Life Support (ACLS), or even basic CPR is not required to operate them, and the survival rate after cardiac arrest increases from 2% to 50%. When it has to be replaced after 5 years, take the old one home and teach your spouse how to use it, and maybe they will.
If you do a lot of surgery you may want to get the ACLS training and buy the crash cart drug kit, but many of the drugs have become ferociously expensive, despite being generic.
Staff safety is a crucial consideration and showing concern boosts staff morale. You should dispose of sharps directly into a sharps container and remove the sharps from the tray at the end of the case. You should have a written protocol for needle sticks. I keep the red top tubes, and the first 2 days of HIV medication on site. Sometimes a patient is HIV positive, the sharp exposure is unknown (a cryostat tissue tease for example), or the patient refuses to have their blood drawn. Less obvious, but important to staff, are locks on doors, alarm systems, good parking lot lighting, and security cameras.
Office safety may seem mundane but a few simple measures can save you a fortune, boost employee morale, and most important of all, improve patient care.
Dr. Coldiron is a past president of the American Academy of Dermatology. He is currently in private practice, but maintains a clinical assistant professorship at the University of Cincinnati. He cares for patients, teaches medical students and residents, and has several active clinical research projects. Dr. Coldiron is the author of more than 80 scientific letters, papers, and several book chapters, and he speaks frequently on a variety of topics.

Medicare delays plans for new star ratings on hospitals
Bowing to pressure from the hospital industry and Congress, the Obama administration on April 20 delayed releasing its new hospital quality rating measure just a day before its planned launch.
The new “overall hospital quality” star rating aimed to combine the government’s disparate efforts to measure hospital care into one easy-to-grasp metric. The Centers for Medicare & Medicaid Services now publishes more than 100 measures of aspects of hospital care, but many of these measures are technical and confusing since hospitals often do well on some and poorly on others. The new star rating boils 62 of the measures down into a unified rating of one to five stars, with five being the best.

But this month, 60 senators and 225 members of the House of Representatives signed letters urging the CMS to delay releasing the star ratings. “We have heard from hospitals in our districts that they do not have the necessary data to replicate or evaluate the CMS’s work to ensure that the methodology is accurate or fair,” the letter from the House members said.
In a notice sent April 20, the CMS told Congress it would delay release of the star ratings on its Hospital Compare website until July 2016. The “CMS is committed to working with hospitals and associations to provide further guidance about star ratings,” the notice said. “After the star ratings go live in their first iteration, we will refine and improve the site as we work together and gain experience.”
But in a conference call with hospital representatives, the CMS officials said they might delay release of the ratings past July if they are still analyzing or revising the methodology, according to people who participated in the call.
Mortality, readmissions, patient experience, and safety of care metrics each accounted for 22% of the star rating, while measures of effectiveness of care, timeliness of care, and efficient use of medical imaging made up 12% in total.

The hospital industry for months has been urging this delay, arguing that many of the measures will not be relevant to patients seeking a specific service. For instance, a hospital’s death rate for Medicare patients might be irrelevant for a woman trying to decide where to give birth.
The industry’s major trade groups said in a letter to the CMS that some hospitals perform poorly because their patients tend to be lower income and don’t have the support at home. Many of the nation’s most prestigious hospitals have been bracing for middling or poor ratings.
Rick Pollack, president of the American Hospital Association, said in a statement that “the delay is a necessary step as hospitals and health systems work with CMS to improve the ratings for patients, and the AHA commends CMS for their decision.”
Last year, the CMS created a star rating to represent the views of patients in surveys. Two sets of researchers recently determined that hospitals with more stars in patient experience tended to have lower death and readmission rates.
Hospital Compare received 3.7 million unique page views last year, according to an April 2016 paper published in the journal Health Affairs. The author, analyst Steven D. Findlay, called the traffic “not at a level commensurate with [the] stature and potential” of the federal government’s health care facility comparison sites.
Dr. Ashish Jha, a Harvard School of Public Health researcher, said consumers will be more likely to use the unified star ratings, but this specific mix of measures raises concerns. “The idea that dying and being readmitted to the hospital are equally important to patients seems funny to me,” he said.
Kaiser Health News is a national health policy news service that is part of the nonpartisan Henry J. Kaiser Family Foundation.
Bowing to pressure from the hospital industry and Congress, the Obama administration on April 20 delayed releasing its new hospital quality rating measure just a day before its planned launch.
The new “overall hospital quality” star rating aimed to combine the government’s disparate efforts to measure hospital care into one easy-to-grasp metric. The Centers for Medicare & Medicaid Services now publishes more than 100 measures of aspects of hospital care, but many of these measures are technical and confusing since hospitals often do well on some and poorly on others. The new star rating boils 62 of the measures down into a unified rating of one to five stars, with five being the best.
But this month, 60 senators and 225 members of the House of Representatives signed letters urging the CMS to delay releasing the star ratings. “We have heard from hospitals in our districts that they do not have the necessary data to replicate or evaluate the CMS’s work to ensure that the methodology is accurate or fair,” the letter from the House members said.
In a notice sent April 20, the CMS told Congress it would delay release of the star ratings on its Hospital Compare website until July 2016. The “CMS is committed to working with hospitals and associations to provide further guidance about star ratings,” the notice said. “After the star ratings go live in their first iteration, we will refine and improve the site as we work together and gain experience.”
But in a conference call with hospital representatives, the CMS officials said they might delay release of the ratings past July if they are still analyzing or revising the methodology, according to people who participated in the call.
Mortality, readmissions, patient experience, and safety of care metrics each accounted for 22% of the star rating, while measures of effectiveness of care, timeliness of care, and efficient use of medical imaging made up 12% in total.
The hospital industry for months has been urging this delay, arguing that many of the measures will not be relevant to patients seeking a specific service. For instance, a hospital’s death rate for Medicare patients might be irrelevant for a woman trying to decide where to give birth.
The industry’s major trade groups said in a letter to the CMS that some hospitals perform poorly because their patients tend to be lower income and don’t have the support at home. Many of the nation’s most prestigious hospitals have been bracing for middling or poor ratings.
Rick Pollack, president of the American Hospital Association, said in a statement that “the delay is a necessary step as hospitals and health systems work with CMS to improve the ratings for patients, and the AHA commends CMS for their decision.”
Last year, the CMS created a star rating to represent the views of patients in surveys. Two sets of researchers recently determined that hospitals with more stars in patient experience tended to have lower death and readmission rates.
Hospital Compare received 3.7 million unique page views last year, according to an April 2016 paper published in the journal Health Affairs. The author, analyst Steven D. Findlay, called the traffic “not at a level commensurate with [the] stature and potential” of the federal government’s health care facility comparison sites.
Dr. Ashish Jha, a Harvard School of Public Health researcher, said consumers will be more likely to use the unified star ratings, but this specific mix of measures raises concerns. “The idea that dying and being readmitted to the hospital are equally important to patients seems funny to me,” he said.
Kaiser Health News is a national health policy news service that is part of the nonpartisan Henry J. Kaiser Family Foundation.
FROM KAISER HEALTH NEWS
