User login
When it’s time for ‘the talk’: Sexuality and your geriatric patient
Recent studies suggest that most older adults maintain sexual interest well into late life; many, however, experience sexual dysfunction. This article provides psychiatric practitioners with current information regarding sexuality and aging, as well as psychiatric and systemic medical comorbidities and sexual side effects of medications. Practice guidelines for assessing and managing sexual dysfunction have been developed for use in many medical specialties, and such guidance would be welcome in psychiatric practice.
This article addresses the myth of “geriatric asexuality” and its potential impact on clinical practice, the effects of age-related physiological changes on sexual activity, the importance of sexuality in the lives of older adults, and sensitive questions clinicians can pose about geriatric sexuality. We also will discuss:
• the importance of including a sexual assessment in the comprehensive psychiatric evaluation
• recognizing sexual dysfunction
• providing appropriate management within a multi-disciplinary, collaborative approach.
Sexuality after 65
Regardless of age, sexual activity can provide a sense of comfort and elicit a positive emotional and physical response.1 Hillman2 defined human sexuality as any combination of sexual behavior, emotional intimacy, and sense of sexual identity.
Sexuality in the aging population generally is an understudied area, obscured by the myth of “geriatric asexuality” and subject to numerous psychosocial variables.1 Previous research, focused on a biological perspective of sexuality, has largely overlooked psychological and social influences.3 It has been assumed that, with age, physical and hormonal changes or chronic illness ordinarily reduce or eliminate sexual desire and sexual behavior.3 However, the majority of older adults (defined as age ≥65) report a moderate-to-high level of sexual interest well into late life.1,3
Sexual function remains a subject often neglected in psychiatry. Sexual dysfunctions, as described in the DSM-5,4 do not include age-related changes in sexual function. In addition to physiological changes, sexual difficulties can result from relationship strain, systemic medical or psychiatric disorders, and sexual side effects of medications.
CASE REPORT
Mr. C, age 71 and married, is being treated for a major depressive episode that followed a course of shingles and persistent postherpetic neuralgia. Medications are: escitalopram, 20 mg/d; pregabalin, 150 mg/d; and ramipril, 5 mg/d. Mr. C is physically active and involved in social activities; he has no substance use history. He attends clinic visits with his wife.
Mr. C reports that despite significant improvement of his depressive and pain symptoms, he now experiences sexual difficulties, which he seems hesitant to discuss in detail. According to his wife, Mr. C appears to lack sexual desire and has difficulty initiating and maintaining an erection. She asks Mr. C’s psychiatrist whether she should stop her estrogen treatment, intended to enhance her sexual function, given that the couple is no longer engaging in sexual intercourse.
Mr. C admits to missing physical intimacy; however, he states, “If I have to make a choice between having sex with my wife and getting this depression out of my head, I’m going to pick getting rid of the depression.” Mrs. C says she is becoming dissatisfied with their marriage and the limited time she and her husband now spend together. Mr. C’s psychiatrist suggests that Mr. C and his wife undergo couples counseling.
Physiological changes with aging
In both women and men, the reproductive system undergoes age-related physiological changes.
Women. In women, the phase of decline in ovarian function and resulting decline in sex steroid production (estradiol and progesterone) is referred to as the climacteric, with menopause being determined retrospectively by the cessation of a menstrual period for 1 year.5
Menopausal symptoms typically occur between age 40 and 58; the average age of menopause is 51.6,7 Both estradiol and progesterone levels decline with menopause, and anovulation and ovarian failure ensue. A more gradual decline of female testosterone levels also occurs with aging, starting in the fourth decade of life.8
Clinical manifestations of menopause include vasomotor symptoms (ie, “hot flushes”), sleep disturbances, anxiety and depressive symptoms, decreased bone mineral density, and increased risk of cardiovascular disease.6,7 Loss of estrogen as well as continued loss of testosterone can result in dyspareunia because of atrophy and decreased vulvar and vaginal lubrication, with sexual excitement achieved less quickly, and a decreased intensity of orgasm.7
Men. Research has shown that testosterone levels are highest in men in the second and third decades, with a subsequent gradual decline.9 Older men with a low testosterone level are described as experiencing “late-onset hypogonadism,” also known by the popularized term “andropause.”10 This is attributed to decreased activity at the testicular and hypothalamic levels.10
Nonetheless, only a small fraction of older men with confirmed androgen deficiency are clinically symptomatic.11,12 Low testosterone is associated with decreased libido; it can hinder morning erections, contribute to erectile dysfunction, and result in erections that require physical stimulation.13
Notably, erectile dysfunction involves several other etiologic factors: psychiatric (eg, relationship difficulties, depression), neurogenic (eg, spinal cord injury), endocrine (eg, hyperprolactinemia), arteriogenic (eg, hypertension, type 2 diabetes mellitus), and drug-induced (eg, antidepressants, antihypertensives).14 A low testosterone level also has been associated with potential cognitive changes, decreased bone mineral density, metabolic syndrome (eg, increased risk of type 2 diabetes mellitus), and cardiovascular mortality.10
Effects on sexual activity. How much age-related physiological changes impact sexual practices in the geriatric population is uncertain. A study following 3,302 women through menopause over 6 years found some decline in sexual activity; however, this decline was not associated with increased sexual pain, decreased desire, or lack of arousal.15 Men continue to find ways to remain sexually active despite physiological changes (eg, erectile difficulties), but the etiology of sexual dysfunction in later life remains multi-modal, involving physical, psychological, and relational factors.16,17
Sexual practices in older adults
Researchers for the National Social Life, Health, and Aging Project (NSHAP) have examined sexual activities, behaviors, and problems in >3,000 older community-dwelling men and women across the United States, using information collected from in-home interviews.18 This study found that sexual activity, defined as any mutually voluntary sexual contact with another person, declines with age; however, even in the oldest age group (age 75 to 85), 39% of men and 17% of women reported being sexually active in the last 12 months. Among these persons, 54% reported sexual activity at least 2 times per month; 23% reported having sex at least once a week; and 32% reported engaging in oral sex. Partner availability predicted sexual activity.
Respondents with self-reported poor physical health were more likely to experience sexual problems (eg, difficulty with erection or lubrication, dyspareunia, and lack of pleasure). The most commonly reported reason for sexual inactivity in those with a spouse or other intimate partner was the male partner’s poor physical health.18
A longitudinal study, part of the Women’s Healthy Ageing Project, examined changes in sexual function at late menopause compared with early menopause. Although the researchers also found an age-related decrease in sexual activity, 50% of their late-menopause respondents (mean age, 70; range, 64 to 77) still reported sexual activity in the previous month, with 35% of this subgroup reporting sexual activity at least once a week; 83% reported sexual thoughts or fantasies.19 Availability of a partner, absence of a history of depression, moderate (compared with no) alcohol consumption, and better cognitive function were significantly associated with a higher level of sexual activity.19
In the Successful Aging Evaluation study, conducted in San Diego County, California, community-dwelling older partnered adults age 50 to 99 (mean age, 75) were surveyed about their sexual health after a cognitive screen by telephone20; rating scales for depression, anxiety, and physical function also were included. Results included 41% of men and 35% of women reporting sexual activity at least once a week, and only 21% of men and 24% of women reporting no sexual activity in the previous year. Depressive symptoms were most highly correlated with lack of sexual activity.20
Overall, these studies reveal that positive physical and mental health, access to a healthy partner, and a positive attitude toward sex are correlated with sexual activity in later life, whereas barriers to sexual activity include lack of a healthy sexual partner, depression, and chronic systemic medical illnesses, such as coronary artery disease or type 2 diabetes mellitus.13,17,21-24 Sexual activity and satisfaction have been positively associated with perceived general well-being and self-esteem.25,26 Conversely, sexual difficulties secondary to disease can be a source of distress for couples.27
Possibly overlooked? It is important to note that sexuality itself is a subjective area. Psychological intimacy is a universal phenomenon, and its physical expression may evolve as couples accommodate to age-related bodily changes. Means of achieving physical closeness, other than intercourse (eg, intimate touching, hand holding, kissing, or even acts of caretaking), may not be adequately captured in studies that look specifically at sexual activity.
Taking a sexual history in a geriatric patient
Because sexuality can be an uncomfortable topic for geriatric patients to discuss, sexual problems in this population often go unrecognized. It has been suggested that psychiatrists are more likely to inquire about sexual activity in middle-aged patients than geriatric patients with the same psychiatric presentation—perhaps illustrating a bias against taking a sexual history from a geriatric patient.28 However, because many older patients can experience depression or anxiety disorders in relation to normal sexual changes or sexual dysfunction within the context of their intimate relationships, it is essential to bring these issues to light.
Although a sexual history may not be the focus of a first clinical encounter, consider making such an assessment at a relatively early stage of patient care. The importance of such dialogue is 2-fold:
• It demonstrates to the patient that talking about sexuality in a respectful and empathic manner is appropriate and can encourage patients to communicate more effectively about sexuality with clinicians and with sexual partners.
• It helps elicit medical information needed to make an accurate diagnosis and provide adequate management.
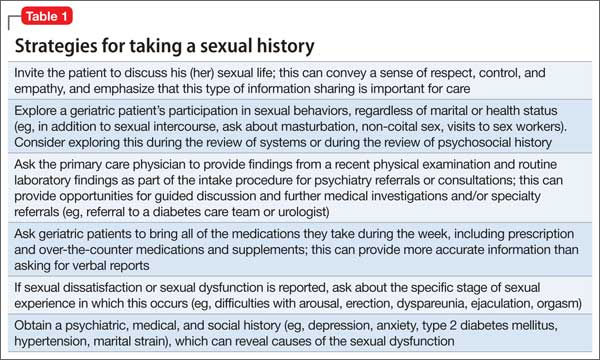
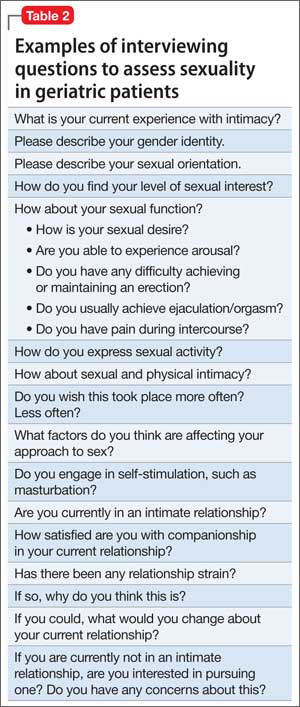
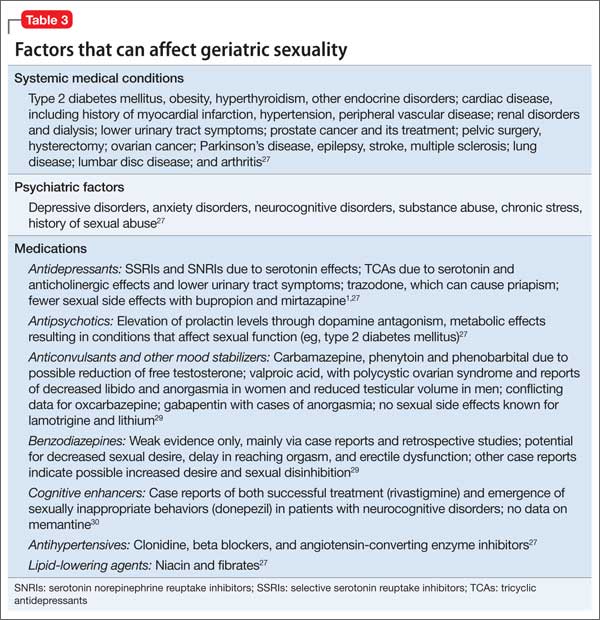
How to begin. As a starting point to taking a sexual history, an open-ended invitation for the geriatric patient to share information may be best, such as “What would you like to tell me about your sexual life?” See further suggestions (Table 1) and examples of more detailed questions to ask once a dialogue has been initiated (Table 2). Additional factors that may contribute to sexual dysfunction are presented in Table 3.1,27,29,30
CASE CONTINUED
In Mr. C’s case, an assessment of his sexual history, including risk factors for sexual dysfunction, is completed. Results from laboratory investigations, including a total testosterone level, are within normal limits.
Mr. C asks about using medications with fewer sexual side effects (he has been taking 3 medications that can contribute to sexual dysfunction). A gradual cross-taper of escitalopram, 20 mg/d, to mirtazapine, 45 mg/d, is implemented, along with tapering pregabalin to 50 mg/d.
Mr. C’s psychiatric and pain symptom improvement is maintained. He notices a boost in his sexual desire but has minimal improvement in erectile dysfunction. He is encouraged to speak with his primary care physician about an antihypertensive agent with less impact on sexual function, as well as therapeutic agents for erectile dysfunction; these, he declines.
At a subsequent visit, Mr. C reports feeling less apprehension about sexual performance. He is now willing to consider further medication options with his primary care physician, and agrees to a recommendation for couples psychotherapy.
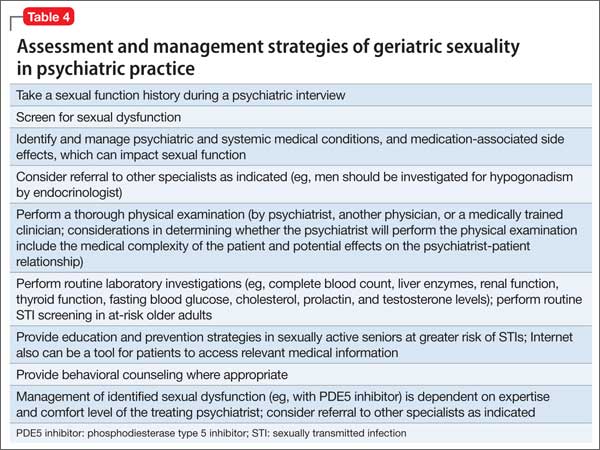
As illustrated in Mr. C’s case, the recommended sexual assessment and management strategies to consider at a minimum in psychiatric practice are listed in Table 4.
STI risk in geriatric patients
The risk of sexually transmitted infections (STIs), including human immunodeficiency virus (HIV), often is overlooked in sexually active older adults. Although STIs are more common among younger adults, there is recent evidence of increased incidence in the geriatric population31 (with the highest risk of incident HIV and some STIs in older men who have sex with men32). These increased rates can be explained, at least in part, by:
• older men being less likely to use a condom during sexual activity
• promotion of viral entry in older women through a drier, thinner vaginal wall
• increased longevity of HIV-positive persons.31
Routine STI screening is not warranted in all older adults, but education and prevention strategies in sexually active seniors who are at greater risk of STIs are recommended. Particularly, clinicians should seek opportunities to discuss risk factors and safe sex practices (eg, using condoms, limiting number of sexual partners, practicing good hygiene, engaging in preventive care), and provide behavioral counseling where appropriate.31,33
Additional considerations in geriatric sexuality
Because psychiatric and systemic medical conditions can hinder sexual function, it is essential to identify and manage these conditions. Several neuropsychiatric disorders, including mood and neurocognitive disorders, can not only cause sexual dysfunction, but also can raise ethical dilemmas for clinicians, such as reduced decisional capacity in cognitively impaired patients to consent to sexual activity.1,34
In some patients, psychological, environmental, and pharmacological treatment options may help. A phosphodiesterase type 5 inhibitor for erectile dysfunction can be prescribed by the primary care physician, a psychiatrist, or another specialist, depending on the physician’s expertise and comfort level.
Sequencing of sexual dysfunction. Notably, there is a common paradox in mood disorders. Decreased sexual interest or performance may represent an aspect of anhedonia associated with depression, whereas sexual dysfunction could also result from medication use (particularly that of serotonergic antidepressants, such as selective serotonin reuptake inhibitors and serotonin-norepinephrine inhibitors), even as other depressive symptoms improve. Therefore, it is critical to analyze sequencing of sexual dysfunction—as part of the presenting mood symptoms or dysfunction induced by antidepressant treatment.
Geriatric sexuality in the digital age. Because older adults represent a rapidly growing segment of digital device users,35 Internet use is likely to play a role in the future of sexuality and “digital intimacy,” in that older adults can engage in online sexual activities. The Internet also can be a tool to access medical education.
Related Resources
• Burghardt KJ, Gardner KN. Sildenafil for SSRI-induced sexual dysfunction. Current Psychiatry. 2013;12(4):29-32,A.
• Maciel M, Laganà L. Older women’s sexual desire problems: biopsychosocial factors impacting them and barriers to their clinical assessment [published online January 5, 2014]. Biomed Res Int. 2014;2014:107217. doi: 10.1155/2014/107217.
Drug Brand Names
Bupropion • Wellbutrin, Zyban Mirtazapine • Remeron
Carbamazepine • Tegretol Oxcarbazepine • Trileptal
Clonidine • Catapres Phenobarbital • Luminal
Donepezil • Aricept Phenytoin • Dilantin
Escitalopram • Lexapro Pregabalin • Lyrica
Gabapentin • Neurontin Ramipril • Altace
Lamotrigine • Lamictal Rivastigmine • Exelon
Lithium • Eskalith, Lithobid Trazodone • Desyrel
Memantine • Namenda Valproic acid • Depakote
Disclosures
The authors report no financial relationships with any company whose products are mentioned in this article or with manufacturers of competing products.
1. Jagus CE, Benbow SM. Sexuality in older men with mental health problems. Sex Relation Ther. 2002;17(3):271-279.
2. Hillman JL. Clinical perspectives on elderly sexuality. New York, NY: Springer; 2000.
3. DeLamater JD, Sill M. Sexual desire in later life. J Sex Res. 2005;42(2):138-149.
4. Diagnostic and statistical manual of mental disorders. 5th ed. Washington, DC: American Psychiatric Association; 2013.
5. Laufer LR, Gambone JC. Climacteric: menopause and peri-and postmenopause. In: Hacker NF, Gambone JC, Hobel CJ. Hacker and Moore’s essentials of obstetrics and gynecology. 5th ed. Philadelphia, PA: Saunders/Elsevier; 2010:379-385.
6. Wilson MM. Menopause. Clin Geriatr Med. 2003;19(3): 483-506.
7. Reid R, Abramson BL, Blake J, et al. Managing menopause. J Obstet Gynaecol Can. 2014;36(9):830-838.
8. Horstman AM, Dillon EL, Urban RJ, et al. The role of androgens and estrogens on healthy aging and longevity. J Gerontol A Biol Sci Med Sci. 2012;67(11):1140-1152.
9. Wu FC, Tajar A, Pye SR, et al. Hypothalamic-pituitary-testicular axis disruptions in older men are differentially linked to age and modifiable risk factors: the European Male Aging Study. J Clin Endocrinol Metab. 2008;93(7):2737-2745.
10. Basaria S. Reproductive aging in men. Endocrinol Metab Clin North Am. 2013;42(2):255-270.
11. Wu FC, Tajar A, Beynon JM, et al. Identification of late-onset hypogonadism in middle-aged and elderly men. N Engl J Med. 2010;363(2):123-135.
12. Araujo AB, Esche GR, Kupelian V, et al. Prevalence of symptomatic androgen deficiency in men. J Clin Endocrinol Metab. 2007;92(11):4241-4247.
13. Lochlainn MN, Kenny RA. Sexual activity and aging. J Am Med Dir Assoc. 2013;14(8):565-572.
14. McMahon CG. Erectile dysfunction. Intern Med J. 2014;44(1):18-26.
15. Avis NE, Brockwell S, Randolph JF Jr, et al. Longitudinal changes in sexual functioning as women transition through menopause: results from the Study of Women’s Health Across the Nation. Menopause. 2009;16(3):442-452.
16. Perelman M, Shabsigh R, Seftel A, et al. Attitudes of men with erectile dysfunction: a cross-national survey. J Sex Med. 2005;2(3):397-406.
17. Corona G, Rastrelli G, Maseroli E, et al. Sexual function of the ageing male. Best Pract Res Clin Endocrinol Metab. 2013;27(4):581-601.
18. Lindau ST, Schumm LP, Laumann EO, et al. A study of sexuality and health among older adults in the United States. N Engl J Med. 2007;357(8):762-774.
19. Lonnèe-Hoffmann RA, Dennerstein L, Lehert P, et al. Sexual function in the late postmenopause: a decade of follow-up in a population-based cohort of Australian women. J Sex Med. 2014;11(8):2029-2038.
20. Wang V, Depp CA, Ceglowski J, et al. Sexual health and function in later life: a population-based study of 606 older adults with a partner. Am J Geriatr Psychiatry. 2015;23(3):227-233.
21. Garrett D. Psychosocial barriers to sexual intimacy for older people. Br J Nurs. 2014;23(6):327-331.
22. DeLamater J, Karraker A. Sexual functioning in older adults. Curr Psychiatry Rep. 2009;11(1):6-11.
23. DeLamater J. Sexual expression in later life: a review and synthesis. J Sex Res. 2012;49(2-3):125-141.
24. Inelmen EM, Sergi G, Girardi A, et al. The importance of sexual health in the elderly: breaking down barriers and taboos. Aging Clin Exp Res. 2012;24(suppl 3):31-34.
25. Choi KB, Jang SH, Lee MY, et al. Sexual life and self-esteem in married elderly. Arch Gerontol Geriatr. 2011;53(1):e17-e20.
26. Davison SL, Bell RJ, LaChina M, et al. The relationship between self-reported sexual satisfaction and general well-being in women. J Sex Med. 2009;6(10):2690-2697.
27. Morley JE, Tariq SH. Sexuality and disease. Clin Geriatr Med. 2003;19(3):563-573.
28. Bouman WP, Arcelus J. Are psychiatrists guilty of “ageism” when it comes to taking a sexual history? Int J Geriatr Psychiatry. 2001;16(1):27-31.
29. La Torre A, Giupponi G, Duffy DM, et al. Sexual dysfunction related to psychotropic drugs: a critical review. Part III: mood stabilizers and anxiolytic drugs. Pharmacopsychiatry. 2014;47(1):1-6.
30. Tucker I. Management of inappropriate sexual behaviors in dementia: a literature review. Int Psychogeriatr. 2010; 22(5):683-692.
31. Imparato T, Sanders D. STD prevalence demands clinical awareness. Aging Well. 2012;5(1):14.
32. Poynten IM, Grulich AE, Templeton DJ. Sexually transmitted infections in older populations. Curr Opin Infect Dis. 2013;26(1):80-85.
33. Talashek ML, Tichy AM, Epping H. Sexually transmitted diseases in the elderly—issues and recommendations. J Gerontol Nurs. 1990;16(4):33-40.
34. Benbow SM, Jagus CE. Sexuality in older women with mental health problems. Sex Relation Ther. 2002;17(3):261-270.
35. Veenhof B, Timusk P. Online activities of Canadian boomers and seniors. http://www.statcan.gc.ca/pub/ 11-008-x/2009002/article/10910-eng.htm#tphp. Accessed March 26, 2015.
Recent studies suggest that most older adults maintain sexual interest well into late life; many, however, experience sexual dysfunction. This article provides psychiatric practitioners with current information regarding sexuality and aging, as well as psychiatric and systemic medical comorbidities and sexual side effects of medications. Practice guidelines for assessing and managing sexual dysfunction have been developed for use in many medical specialties, and such guidance would be welcome in psychiatric practice.
This article addresses the myth of “geriatric asexuality” and its potential impact on clinical practice, the effects of age-related physiological changes on sexual activity, the importance of sexuality in the lives of older adults, and sensitive questions clinicians can pose about geriatric sexuality. We also will discuss:
• the importance of including a sexual assessment in the comprehensive psychiatric evaluation
• recognizing sexual dysfunction
• providing appropriate management within a multi-disciplinary, collaborative approach.
Sexuality after 65
Regardless of age, sexual activity can provide a sense of comfort and elicit a positive emotional and physical response.1 Hillman2 defined human sexuality as any combination of sexual behavior, emotional intimacy, and sense of sexual identity.
Sexuality in the aging population generally is an understudied area, obscured by the myth of “geriatric asexuality” and subject to numerous psychosocial variables.1 Previous research, focused on a biological perspective of sexuality, has largely overlooked psychological and social influences.3 It has been assumed that, with age, physical and hormonal changes or chronic illness ordinarily reduce or eliminate sexual desire and sexual behavior.3 However, the majority of older adults (defined as age ≥65) report a moderate-to-high level of sexual interest well into late life.1,3
Sexual function remains a subject often neglected in psychiatry. Sexual dysfunctions, as described in the DSM-5,4 do not include age-related changes in sexual function. In addition to physiological changes, sexual difficulties can result from relationship strain, systemic medical or psychiatric disorders, and sexual side effects of medications.
CASE REPORT
Mr. C, age 71 and married, is being treated for a major depressive episode that followed a course of shingles and persistent postherpetic neuralgia. Medications are: escitalopram, 20 mg/d; pregabalin, 150 mg/d; and ramipril, 5 mg/d. Mr. C is physically active and involved in social activities; he has no substance use history. He attends clinic visits with his wife.
Mr. C reports that despite significant improvement of his depressive and pain symptoms, he now experiences sexual difficulties, which he seems hesitant to discuss in detail. According to his wife, Mr. C appears to lack sexual desire and has difficulty initiating and maintaining an erection. She asks Mr. C’s psychiatrist whether she should stop her estrogen treatment, intended to enhance her sexual function, given that the couple is no longer engaging in sexual intercourse.
Mr. C admits to missing physical intimacy; however, he states, “If I have to make a choice between having sex with my wife and getting this depression out of my head, I’m going to pick getting rid of the depression.” Mrs. C says she is becoming dissatisfied with their marriage and the limited time she and her husband now spend together. Mr. C’s psychiatrist suggests that Mr. C and his wife undergo couples counseling.
Physiological changes with aging
In both women and men, the reproductive system undergoes age-related physiological changes.
Women. In women, the phase of decline in ovarian function and resulting decline in sex steroid production (estradiol and progesterone) is referred to as the climacteric, with menopause being determined retrospectively by the cessation of a menstrual period for 1 year.5
Menopausal symptoms typically occur between age 40 and 58; the average age of menopause is 51.6,7 Both estradiol and progesterone levels decline with menopause, and anovulation and ovarian failure ensue. A more gradual decline of female testosterone levels also occurs with aging, starting in the fourth decade of life.8
Clinical manifestations of menopause include vasomotor symptoms (ie, “hot flushes”), sleep disturbances, anxiety and depressive symptoms, decreased bone mineral density, and increased risk of cardiovascular disease.6,7 Loss of estrogen as well as continued loss of testosterone can result in dyspareunia because of atrophy and decreased vulvar and vaginal lubrication, with sexual excitement achieved less quickly, and a decreased intensity of orgasm.7
Men. Research has shown that testosterone levels are highest in men in the second and third decades, with a subsequent gradual decline.9 Older men with a low testosterone level are described as experiencing “late-onset hypogonadism,” also known by the popularized term “andropause.”10 This is attributed to decreased activity at the testicular and hypothalamic levels.10
Nonetheless, only a small fraction of older men with confirmed androgen deficiency are clinically symptomatic.11,12 Low testosterone is associated with decreased libido; it can hinder morning erections, contribute to erectile dysfunction, and result in erections that require physical stimulation.13
Notably, erectile dysfunction involves several other etiologic factors: psychiatric (eg, relationship difficulties, depression), neurogenic (eg, spinal cord injury), endocrine (eg, hyperprolactinemia), arteriogenic (eg, hypertension, type 2 diabetes mellitus), and drug-induced (eg, antidepressants, antihypertensives).14 A low testosterone level also has been associated with potential cognitive changes, decreased bone mineral density, metabolic syndrome (eg, increased risk of type 2 diabetes mellitus), and cardiovascular mortality.10
Effects on sexual activity. How much age-related physiological changes impact sexual practices in the geriatric population is uncertain. A study following 3,302 women through menopause over 6 years found some decline in sexual activity; however, this decline was not associated with increased sexual pain, decreased desire, or lack of arousal.15 Men continue to find ways to remain sexually active despite physiological changes (eg, erectile difficulties), but the etiology of sexual dysfunction in later life remains multi-modal, involving physical, psychological, and relational factors.16,17
Sexual practices in older adults
Researchers for the National Social Life, Health, and Aging Project (NSHAP) have examined sexual activities, behaviors, and problems in >3,000 older community-dwelling men and women across the United States, using information collected from in-home interviews.18 This study found that sexual activity, defined as any mutually voluntary sexual contact with another person, declines with age; however, even in the oldest age group (age 75 to 85), 39% of men and 17% of women reported being sexually active in the last 12 months. Among these persons, 54% reported sexual activity at least 2 times per month; 23% reported having sex at least once a week; and 32% reported engaging in oral sex. Partner availability predicted sexual activity.
Respondents with self-reported poor physical health were more likely to experience sexual problems (eg, difficulty with erection or lubrication, dyspareunia, and lack of pleasure). The most commonly reported reason for sexual inactivity in those with a spouse or other intimate partner was the male partner’s poor physical health.18
A longitudinal study, part of the Women’s Healthy Ageing Project, examined changes in sexual function at late menopause compared with early menopause. Although the researchers also found an age-related decrease in sexual activity, 50% of their late-menopause respondents (mean age, 70; range, 64 to 77) still reported sexual activity in the previous month, with 35% of this subgroup reporting sexual activity at least once a week; 83% reported sexual thoughts or fantasies.19 Availability of a partner, absence of a history of depression, moderate (compared with no) alcohol consumption, and better cognitive function were significantly associated with a higher level of sexual activity.19
In the Successful Aging Evaluation study, conducted in San Diego County, California, community-dwelling older partnered adults age 50 to 99 (mean age, 75) were surveyed about their sexual health after a cognitive screen by telephone20; rating scales for depression, anxiety, and physical function also were included. Results included 41% of men and 35% of women reporting sexual activity at least once a week, and only 21% of men and 24% of women reporting no sexual activity in the previous year. Depressive symptoms were most highly correlated with lack of sexual activity.20
Overall, these studies reveal that positive physical and mental health, access to a healthy partner, and a positive attitude toward sex are correlated with sexual activity in later life, whereas barriers to sexual activity include lack of a healthy sexual partner, depression, and chronic systemic medical illnesses, such as coronary artery disease or type 2 diabetes mellitus.13,17,21-24 Sexual activity and satisfaction have been positively associated with perceived general well-being and self-esteem.25,26 Conversely, sexual difficulties secondary to disease can be a source of distress for couples.27
Possibly overlooked? It is important to note that sexuality itself is a subjective area. Psychological intimacy is a universal phenomenon, and its physical expression may evolve as couples accommodate to age-related bodily changes. Means of achieving physical closeness, other than intercourse (eg, intimate touching, hand holding, kissing, or even acts of caretaking), may not be adequately captured in studies that look specifically at sexual activity.
Taking a sexual history in a geriatric patient
Because sexuality can be an uncomfortable topic for geriatric patients to discuss, sexual problems in this population often go unrecognized. It has been suggested that psychiatrists are more likely to inquire about sexual activity in middle-aged patients than geriatric patients with the same psychiatric presentation—perhaps illustrating a bias against taking a sexual history from a geriatric patient.28 However, because many older patients can experience depression or anxiety disorders in relation to normal sexual changes or sexual dysfunction within the context of their intimate relationships, it is essential to bring these issues to light.
Although a sexual history may not be the focus of a first clinical encounter, consider making such an assessment at a relatively early stage of patient care. The importance of such dialogue is 2-fold:
• It demonstrates to the patient that talking about sexuality in a respectful and empathic manner is appropriate and can encourage patients to communicate more effectively about sexuality with clinicians and with sexual partners.
• It helps elicit medical information needed to make an accurate diagnosis and provide adequate management.
How to begin. As a starting point to taking a sexual history, an open-ended invitation for the geriatric patient to share information may be best, such as “What would you like to tell me about your sexual life?” See further suggestions (Table 1) and examples of more detailed questions to ask once a dialogue has been initiated (Table 2). Additional factors that may contribute to sexual dysfunction are presented in Table 3.1,27,29,30
CASE CONTINUED
In Mr. C’s case, an assessment of his sexual history, including risk factors for sexual dysfunction, is completed. Results from laboratory investigations, including a total testosterone level, are within normal limits.
Mr. C asks about using medications with fewer sexual side effects (he has been taking 3 medications that can contribute to sexual dysfunction). A gradual cross-taper of escitalopram, 20 mg/d, to mirtazapine, 45 mg/d, is implemented, along with tapering pregabalin to 50 mg/d.
Mr. C’s psychiatric and pain symptom improvement is maintained. He notices a boost in his sexual desire but has minimal improvement in erectile dysfunction. He is encouraged to speak with his primary care physician about an antihypertensive agent with less impact on sexual function, as well as therapeutic agents for erectile dysfunction; these, he declines.
At a subsequent visit, Mr. C reports feeling less apprehension about sexual performance. He is now willing to consider further medication options with his primary care physician, and agrees to a recommendation for couples psychotherapy.
As illustrated in Mr. C’s case, the recommended sexual assessment and management strategies to consider at a minimum in psychiatric practice are listed in Table 4.
STI risk in geriatric patients
The risk of sexually transmitted infections (STIs), including human immunodeficiency virus (HIV), often is overlooked in sexually active older adults. Although STIs are more common among younger adults, there is recent evidence of increased incidence in the geriatric population31 (with the highest risk of incident HIV and some STIs in older men who have sex with men32). These increased rates can be explained, at least in part, by:
• older men being less likely to use a condom during sexual activity
• promotion of viral entry in older women through a drier, thinner vaginal wall
• increased longevity of HIV-positive persons.31
Routine STI screening is not warranted in all older adults, but education and prevention strategies in sexually active seniors who are at greater risk of STIs are recommended. Particularly, clinicians should seek opportunities to discuss risk factors and safe sex practices (eg, using condoms, limiting number of sexual partners, practicing good hygiene, engaging in preventive care), and provide behavioral counseling where appropriate.31,33
Additional considerations in geriatric sexuality
Because psychiatric and systemic medical conditions can hinder sexual function, it is essential to identify and manage these conditions. Several neuropsychiatric disorders, including mood and neurocognitive disorders, can not only cause sexual dysfunction, but also can raise ethical dilemmas for clinicians, such as reduced decisional capacity in cognitively impaired patients to consent to sexual activity.1,34
In some patients, psychological, environmental, and pharmacological treatment options may help. A phosphodiesterase type 5 inhibitor for erectile dysfunction can be prescribed by the primary care physician, a psychiatrist, or another specialist, depending on the physician’s expertise and comfort level.
Sequencing of sexual dysfunction. Notably, there is a common paradox in mood disorders. Decreased sexual interest or performance may represent an aspect of anhedonia associated with depression, whereas sexual dysfunction could also result from medication use (particularly that of serotonergic antidepressants, such as selective serotonin reuptake inhibitors and serotonin-norepinephrine inhibitors), even as other depressive symptoms improve. Therefore, it is critical to analyze sequencing of sexual dysfunction—as part of the presenting mood symptoms or dysfunction induced by antidepressant treatment.
Geriatric sexuality in the digital age. Because older adults represent a rapidly growing segment of digital device users,35 Internet use is likely to play a role in the future of sexuality and “digital intimacy,” in that older adults can engage in online sexual activities. The Internet also can be a tool to access medical education.
Related Resources
• Burghardt KJ, Gardner KN. Sildenafil for SSRI-induced sexual dysfunction. Current Psychiatry. 2013;12(4):29-32,A.
• Maciel M, Laganà L. Older women’s sexual desire problems: biopsychosocial factors impacting them and barriers to their clinical assessment [published online January 5, 2014]. Biomed Res Int. 2014;2014:107217. doi: 10.1155/2014/107217.
Drug Brand Names
Bupropion • Wellbutrin, Zyban Mirtazapine • Remeron
Carbamazepine • Tegretol Oxcarbazepine • Trileptal
Clonidine • Catapres Phenobarbital • Luminal
Donepezil • Aricept Phenytoin • Dilantin
Escitalopram • Lexapro Pregabalin • Lyrica
Gabapentin • Neurontin Ramipril • Altace
Lamotrigine • Lamictal Rivastigmine • Exelon
Lithium • Eskalith, Lithobid Trazodone • Desyrel
Memantine • Namenda Valproic acid • Depakote
Disclosures
The authors report no financial relationships with any company whose products are mentioned in this article or with manufacturers of competing products.
1. Jagus CE, Benbow SM. Sexuality in older men with mental health problems. Sex Relation Ther. 2002;17(3):271-279.
2. Hillman JL. Clinical perspectives on elderly sexuality. New York, NY: Springer; 2000.
3. DeLamater JD, Sill M. Sexual desire in later life. J Sex Res. 2005;42(2):138-149.
4. Diagnostic and statistical manual of mental disorders. 5th ed. Washington, DC: American Psychiatric Association; 2013.
5. Laufer LR, Gambone JC. Climacteric: menopause and peri-and postmenopause. In: Hacker NF, Gambone JC, Hobel CJ. Hacker and Moore’s essentials of obstetrics and gynecology. 5th ed. Philadelphia, PA: Saunders/Elsevier; 2010:379-385.
6. Wilson MM. Menopause. Clin Geriatr Med. 2003;19(3): 483-506.
7. Reid R, Abramson BL, Blake J, et al. Managing menopause. J Obstet Gynaecol Can. 2014;36(9):830-838.
8. Horstman AM, Dillon EL, Urban RJ, et al. The role of androgens and estrogens on healthy aging and longevity. J Gerontol A Biol Sci Med Sci. 2012;67(11):1140-1152.
9. Wu FC, Tajar A, Pye SR, et al. Hypothalamic-pituitary-testicular axis disruptions in older men are differentially linked to age and modifiable risk factors: the European Male Aging Study. J Clin Endocrinol Metab. 2008;93(7):2737-2745.
10. Basaria S. Reproductive aging in men. Endocrinol Metab Clin North Am. 2013;42(2):255-270.
11. Wu FC, Tajar A, Beynon JM, et al. Identification of late-onset hypogonadism in middle-aged and elderly men. N Engl J Med. 2010;363(2):123-135.
12. Araujo AB, Esche GR, Kupelian V, et al. Prevalence of symptomatic androgen deficiency in men. J Clin Endocrinol Metab. 2007;92(11):4241-4247.
13. Lochlainn MN, Kenny RA. Sexual activity and aging. J Am Med Dir Assoc. 2013;14(8):565-572.
14. McMahon CG. Erectile dysfunction. Intern Med J. 2014;44(1):18-26.
15. Avis NE, Brockwell S, Randolph JF Jr, et al. Longitudinal changes in sexual functioning as women transition through menopause: results from the Study of Women’s Health Across the Nation. Menopause. 2009;16(3):442-452.
16. Perelman M, Shabsigh R, Seftel A, et al. Attitudes of men with erectile dysfunction: a cross-national survey. J Sex Med. 2005;2(3):397-406.
17. Corona G, Rastrelli G, Maseroli E, et al. Sexual function of the ageing male. Best Pract Res Clin Endocrinol Metab. 2013;27(4):581-601.
18. Lindau ST, Schumm LP, Laumann EO, et al. A study of sexuality and health among older adults in the United States. N Engl J Med. 2007;357(8):762-774.
19. Lonnèe-Hoffmann RA, Dennerstein L, Lehert P, et al. Sexual function in the late postmenopause: a decade of follow-up in a population-based cohort of Australian women. J Sex Med. 2014;11(8):2029-2038.
20. Wang V, Depp CA, Ceglowski J, et al. Sexual health and function in later life: a population-based study of 606 older adults with a partner. Am J Geriatr Psychiatry. 2015;23(3):227-233.
21. Garrett D. Psychosocial barriers to sexual intimacy for older people. Br J Nurs. 2014;23(6):327-331.
22. DeLamater J, Karraker A. Sexual functioning in older adults. Curr Psychiatry Rep. 2009;11(1):6-11.
23. DeLamater J. Sexual expression in later life: a review and synthesis. J Sex Res. 2012;49(2-3):125-141.
24. Inelmen EM, Sergi G, Girardi A, et al. The importance of sexual health in the elderly: breaking down barriers and taboos. Aging Clin Exp Res. 2012;24(suppl 3):31-34.
25. Choi KB, Jang SH, Lee MY, et al. Sexual life and self-esteem in married elderly. Arch Gerontol Geriatr. 2011;53(1):e17-e20.
26. Davison SL, Bell RJ, LaChina M, et al. The relationship between self-reported sexual satisfaction and general well-being in women. J Sex Med. 2009;6(10):2690-2697.
27. Morley JE, Tariq SH. Sexuality and disease. Clin Geriatr Med. 2003;19(3):563-573.
28. Bouman WP, Arcelus J. Are psychiatrists guilty of “ageism” when it comes to taking a sexual history? Int J Geriatr Psychiatry. 2001;16(1):27-31.
29. La Torre A, Giupponi G, Duffy DM, et al. Sexual dysfunction related to psychotropic drugs: a critical review. Part III: mood stabilizers and anxiolytic drugs. Pharmacopsychiatry. 2014;47(1):1-6.
30. Tucker I. Management of inappropriate sexual behaviors in dementia: a literature review. Int Psychogeriatr. 2010; 22(5):683-692.
31. Imparato T, Sanders D. STD prevalence demands clinical awareness. Aging Well. 2012;5(1):14.
32. Poynten IM, Grulich AE, Templeton DJ. Sexually transmitted infections in older populations. Curr Opin Infect Dis. 2013;26(1):80-85.
33. Talashek ML, Tichy AM, Epping H. Sexually transmitted diseases in the elderly—issues and recommendations. J Gerontol Nurs. 1990;16(4):33-40.
34. Benbow SM, Jagus CE. Sexuality in older women with mental health problems. Sex Relation Ther. 2002;17(3):261-270.
35. Veenhof B, Timusk P. Online activities of Canadian boomers and seniors. http://www.statcan.gc.ca/pub/ 11-008-x/2009002/article/10910-eng.htm#tphp. Accessed March 26, 2015.

Use PRESS to craft a concise psychodynamic formulation
More and more time is being allocated to training psychiatric residents in cognitive-behavioral therapy and crafting a cognitive-behavioral formulation. However, the psychodynamic formulation, once considered the backbone of psychiatry, should not be forgotten. The psychodynamic formulation is a cohesive portrait of an individual’s inner world based on the biopsychosocial approach.1 The purpose in crafting a psychodynamic formulation is to create a succinct and focused case conceptualization that can guide treatment and anticipate possible outcomes.2,3 To teach this in a simple, practical, and relatable way, we propose an approach that can be summarized with the acronym PRESS.
Psychologically minded
Can the patient be introspective and contemplate his (her) thoughts and feelings before acting? Without the capacity to look within—distinct from intelligence—a patient could struggle with the psychodynamic approach and could benefit from a more supportive form of psychotherapy.4
Relationships
Examine the patient’s relationships with others:
• Who are the prominent people in his (her) life?
• What are his interpersonal relations like?
• How does he (she) recall important relationships from the past?
• Do these relationships appear to be recurring?4
Just as themes and patterns recur, so do relationships. Predict how the patient’s relationship pattern could be recreated in the therapeutic dynamic and how this could influence treatment. Then, by examining this transference and countertransference data, you can illustrate a pattern from past relationships that is being recreated in the doctor-patient relationship.3,5
Ego strength
Determining how the patient expresses or inhibits wishes and exhibits impulse control can shed light onto how he operates on a daily basis:
• Does he have the ability to regulate his impulses?
• Is he capable of anticipating the consequences of inappropriate action?
• Does he show a lack of insight and judgment by exhibiting too many repetitive maladaptive behaviors?
Additionally, how does the patient keep unwanted fantasies, wishes, and memories out of conscious awareness?
Identifying which constellation of defense mechanisms the patient is using can help categorize his level of functioning and personality type, and identify anxiety-provoking thoughts and events.1,6 Often, one of these situations has consciously or subconsciously triggered the need for psychotherapy.
Stimulus
The hallmark of any psychodynamic formulation starts with a concise summarizing statement that describes the fundamental details about the patient and his motivation for treatment.2 Determining the patient’s impetus for treatment is 2-fold: Why does the patient want to receive treatment? Why now?
Superego
Review the patient’s ego ideal—what one should not do—and the moral conscience— what one should do.1 Do there seem to be any deficits (recurrent shoplifting, criminality, etc.)? Who contributed to his sense of right and wrong, and how harsh or lax is it? Is the patient self-defeating or self-punishing? Contrarily, does the patient seem to have little conscience?
Acknowledgment
Franklin Maleson, MD, provided advice and input to the authors.
Disclosures
The authors report no financial relationships with any companies whose products are mentioned in this article or with manufacturers of competing products.
1. Gabbard GO. Long-term psychodynamic psychotherapy: a basic text. Arlington, VA: American Psychiatric Publishing; 2010.
2. Perry S, Cooper AM, Michels R. The psychodynamic formulation: its purpose, structure, and clinical application. Am J Psychiatry. 1987;144(5):543-550.
3. Kassaw K, Gabbard GO. Creating a psychodynamic formulation from a clinical evaluation. Am J Psychiatry. 2002;159(5):721-726.
4. Ursano RJ, Sonnenberg SM, Lazar SG. Concise guide to psychodynamic psychotherapy. Arlington, VA: American Psychiatric Publishing; 2004.
5. Faden J, McFadden RF. The avoidant psychotherapy patient. Current Psychiatry. 2012;11(8):44-47,A.
6. Blackman JS. 101 Defenses: how the mind shields itself. New York, NY: Brunner-Routledge; 2004.
More and more time is being allocated to training psychiatric residents in cognitive-behavioral therapy and crafting a cognitive-behavioral formulation. However, the psychodynamic formulation, once considered the backbone of psychiatry, should not be forgotten. The psychodynamic formulation is a cohesive portrait of an individual’s inner world based on the biopsychosocial approach.1 The purpose in crafting a psychodynamic formulation is to create a succinct and focused case conceptualization that can guide treatment and anticipate possible outcomes.2,3 To teach this in a simple, practical, and relatable way, we propose an approach that can be summarized with the acronym PRESS.
Psychologically minded
Can the patient be introspective and contemplate his (her) thoughts and feelings before acting? Without the capacity to look within—distinct from intelligence—a patient could struggle with the psychodynamic approach and could benefit from a more supportive form of psychotherapy.4
Relationships
Examine the patient’s relationships with others:
• Who are the prominent people in his (her) life?
• What are his interpersonal relations like?
• How does he (she) recall important relationships from the past?
• Do these relationships appear to be recurring?4
Just as themes and patterns recur, so do relationships. Predict how the patient’s relationship pattern could be recreated in the therapeutic dynamic and how this could influence treatment. Then, by examining this transference and countertransference data, you can illustrate a pattern from past relationships that is being recreated in the doctor-patient relationship.3,5
Ego strength
Determining how the patient expresses or inhibits wishes and exhibits impulse control can shed light onto how he operates on a daily basis:
• Does he have the ability to regulate his impulses?
• Is he capable of anticipating the consequences of inappropriate action?
• Does he show a lack of insight and judgment by exhibiting too many repetitive maladaptive behaviors?
Additionally, how does the patient keep unwanted fantasies, wishes, and memories out of conscious awareness?
Identifying which constellation of defense mechanisms the patient is using can help categorize his level of functioning and personality type, and identify anxiety-provoking thoughts and events.1,6 Often, one of these situations has consciously or subconsciously triggered the need for psychotherapy.
Stimulus
The hallmark of any psychodynamic formulation starts with a concise summarizing statement that describes the fundamental details about the patient and his motivation for treatment.2 Determining the patient’s impetus for treatment is 2-fold: Why does the patient want to receive treatment? Why now?
Superego
Review the patient’s ego ideal—what one should not do—and the moral conscience— what one should do.1 Do there seem to be any deficits (recurrent shoplifting, criminality, etc.)? Who contributed to his sense of right and wrong, and how harsh or lax is it? Is the patient self-defeating or self-punishing? Contrarily, does the patient seem to have little conscience?
Acknowledgment
Franklin Maleson, MD, provided advice and input to the authors.
Disclosures
The authors report no financial relationships with any companies whose products are mentioned in this article or with manufacturers of competing products.
1. Gabbard GO. Long-term psychodynamic psychotherapy: a basic text. Arlington, VA: American Psychiatric Publishing; 2010.
2. Perry S, Cooper AM, Michels R. The psychodynamic formulation: its purpose, structure, and clinical application. Am J Psychiatry. 1987;144(5):543-550.
3. Kassaw K, Gabbard GO. Creating a psychodynamic formulation from a clinical evaluation. Am J Psychiatry. 2002;159(5):721-726.
4. Ursano RJ, Sonnenberg SM, Lazar SG. Concise guide to psychodynamic psychotherapy. Arlington, VA: American Psychiatric Publishing; 2004.
5. Faden J, McFadden RF. The avoidant psychotherapy patient. Current Psychiatry. 2012;11(8):44-47,A.
6. Blackman JS. 101 Defenses: how the mind shields itself. New York, NY: Brunner-Routledge; 2004.
Helmet Add-Ons May Not Lower Concussion Risk in Athletes
WASHINGTON, DC—Football helmet add-ons such as outer soft-shell layers, spray treatments, helmet pads, and fiber sheets may not significantly help lower the risk of concussions in athletes, according to a study presented at the American Academy of Neurology’s 67th Annual Meeting. “Our study suggests that despite many products targeted at reducing concussions in players, there is no magic concussion prevention product on the market at this time,” said study author John Lloyd, PhD, of BRAINS, a company in San Antonio, Florida.
Researchers modified the standard drop test system, approved by the National Operating Committee on Standards for Athletic Equipment, by using a crash test dummy head and neck to more realistically simulate head impact. Sensors were placed in the dummy’s head to measure linear and angular rotational responses to helmet impacts at 10, 12, and 14 miles per hour.
Using this device, BRAINS researchers evaluated four football helmet add-ons: Guardian Cap, UnEqual Technologies’ Concussion Reduction Technology, Shockstrips, and Helmet Glide. Riddell Revolution Speed and Xenith X1 football helmets were outfitted with each of these add-ons and impacted five times from drop heights of 1.0, 1.5, and 2.0 meters. Linear acceleration, angular velocity, and angular accelerations of the head were measured in response to impacts.
The study found that compared with helmets without the add-ons, those fitted with the Guardian Cap, Concussion Reduction Technology, and Shockstrips reduced linear accelerations by about 11%, but only reduced angular accelerations by 2%, while Helmet Glide was shown to have no effect.
“These findings are important because angular accelerations are believed to be the major biomechanical forces involved in concussion,” said Dr. Lloyd. “Few add-on products have undergone even basic biomechanical evaluation. Hopefully, our research will lead to more rigorous testing of helmets and add-ons.”
The study was supported by BRAINS and the Seeing Stars Foundation.
Psychoneurogastroenterology: The abdominal brain, the microbiome, and psychiatry
This nervous system is located inside the wall of the GI tract, extending from the esophagus to the rectum. Technically, it is known as the enteric nervous system, or ENS, but it has been given other labels, too: “second brain,”2 “abdominal brain,” “other brain,” and “back-up brain.” Its neurologic disorders include abdominal epilepsy, abdominal migraine, and autism with intestinal symptoms, such as chronic enterocolitis.3
Impressive brain-like features
The ENS includes 100 million neurons (same as the spinal cord) with glia-like support cells. It contains >30 neurotransmitters, including several closely linked to psychopathology (serotonin, dopamine, γ-aminobutyric acid, and acetylcholine). The ENS is not part of the autonomic nervous system. It communicates with the brain via the vagus nerve.
A vast system of gut bacteria
The ENS maintains close links with, and is influenced by, the microbiome, an extensive universe of commensal (that is, symbiotic) bacteria in the gut that play a vital role in immune health, brain function, and signaling systems within the CNS. The role of the microbiome in neuropsychiatric disorders has become a sizzling area of research.
The numbers of the microbiome are astonishing, including approximately 1,000 species of bacteria; 100 trillion total bacterial organisms (outnumbering cells of the body by 100-fold); 4 million bacterial genes (compared with 26,000 genes in the host human genome); and a density as high as 1 trillion bacteria in a cubic milliliter—higher than any known microbial system.4
Significant GI−brain connections
It is of great relevance to psychiatry that 90% of the body’s serotonin and 50% of dopamine are found in the GI brain. Selective serotonin reuptake inhibitors often are associated with GI symptoms, such as nausea and diarrhea; antipsychotics, which are dopamine antagonists, are known for antiemetic effects. Clozapine’s potent anticholinergic effects can cause serious ileus.
Things get more interesting when one considers the association of GI disorders and psychiatric symptoms:
Irritable bowel syndrome is associated with panic disorder, generalized anxiety disorder, social phobia, dysthymia, and major depression.
Inflammatory bowel disease (IBD)— such as Crohn’s disease and ulcerative colitis (prevalence ranging from 6% in Canada to 14% in the United States to 46% in Mexico5)—is commonly associated with mood and anxiety disorders and personality changes. The psychiatric manifestations of IBD are so common that the authors of a recent article in World Journal of Gastroenterology urged gastroenterologists to collaborate with psychiatrists when managing IBD.6
Celiac disease has been repeatedly associated with several neuropsychiatric disorders, including ataxia, epilepsy, peripheral neuropathy, headache, anxiety, attention-deficit/hyperactivity disorder, autism spectrum disorder, and schizophrenia.
New, exciting challenges for medical science
There potentially are important implications for possible exploitation of the ENS and the microbiome in the diagnosis and treatment of neuropsychiatric disorders. For example, consider these speculative challenges:
• Can intestinal biopsy reveal neurotransmitter pathology in schizophrenia?
• Can early dopamine deficiency predict Parkinson’s disease, enabling early intervention?
• Can β-amyloid deposits, the degenerative neurologic stigmata of Alzheimer’s disease, be detected in abdominal neurons years before onset of symptoms to allow early intervention?
• Can the ENS become a therapeutic pathway by targeting the various neurotransmitters found there or by engaging the enormous human microbiome to manipulate its beneficial properties?
• Can foods or probiotic supplements be prescribed as microbiomal adjuncts to improve the mood and anxiety spectrum?
One recommendation I came across is that ingesting 10 to 100 million beneficial bacteria, such as Lactobacillus plantarum and Bifidobacterium infantis, might be helpful. Such prescriptions obviously are speculative but also are reasonably testable hypotheses of ways to exploit the “other brain” and the microbiome.
We must summon the guts to seize this opportunity
An independent second brain and a remarkable microbiome appear to be significant evolutionary adaptations and advantages for humans. For too long, neuropsychiatric researchers have ignored the ENS and the microbiome; now, they must focus on how to exploit these entities to yield innovative diagnostic and therapeutic advances. Integrating the ENS and the microbiome and enmeshing them into neuropsychiatric research and clinical applications hold great promise.
The field of psychoneurogastroenterology is in its infancy, but its growth and relevance will be momentous for neuropsychiatry. A major intellectual peristalsis is underway.
1. Robinson B. The abdominal and pelvic brain. Hammond, IN: Frank S. Betz; 1907.
2. Gershon M. The second brain: a groundbreaking new understanding of nervous disorders of the stomach and intestine. New York, NY: HarperCollins Publishers; 1998.
3. McMillin DL, Richards DG, Mein EA, et al. The abdominal brain and enteric nervous system. J Altern Complement Med. 1999;5(6):575-586.
4. Hill JM, Bhattacharjee S, Pogue AI, et al. The gastrointestinal tract microbiome and potential link to Alzheimer’s disease. Front Neurol. 2014;5:43.
5. Olden KW, Lydiard RB. Gastrointestinal disorders. In: Rundell JR, Wise MG. Textbook of consultation-liaison psychiatry. Washington, DC: American Psychiatric Association; 1994.
6. Filipovic BR, Filipovic BF. World J Gastroenterol. 2014;20(13):3552-3563.
This nervous system is located inside the wall of the GI tract, extending from the esophagus to the rectum. Technically, it is known as the enteric nervous system, or ENS, but it has been given other labels, too: “second brain,”2 “abdominal brain,” “other brain,” and “back-up brain.” Its neurologic disorders include abdominal epilepsy, abdominal migraine, and autism with intestinal symptoms, such as chronic enterocolitis.3
Impressive brain-like features
The ENS includes 100 million neurons (same as the spinal cord) with glia-like support cells. It contains >30 neurotransmitters, including several closely linked to psychopathology (serotonin, dopamine, γ-aminobutyric acid, and acetylcholine). The ENS is not part of the autonomic nervous system. It communicates with the brain via the vagus nerve.
A vast system of gut bacteria
The ENS maintains close links with, and is influenced by, the microbiome, an extensive universe of commensal (that is, symbiotic) bacteria in the gut that play a vital role in immune health, brain function, and signaling systems within the CNS. The role of the microbiome in neuropsychiatric disorders has become a sizzling area of research.
The numbers of the microbiome are astonishing, including approximately 1,000 species of bacteria; 100 trillion total bacterial organisms (outnumbering cells of the body by 100-fold); 4 million bacterial genes (compared with 26,000 genes in the host human genome); and a density as high as 1 trillion bacteria in a cubic milliliter—higher than any known microbial system.4
Significant GI−brain connections
It is of great relevance to psychiatry that 90% of the body’s serotonin and 50% of dopamine are found in the GI brain. Selective serotonin reuptake inhibitors often are associated with GI symptoms, such as nausea and diarrhea; antipsychotics, which are dopamine antagonists, are known for antiemetic effects. Clozapine’s potent anticholinergic effects can cause serious ileus.
Things get more interesting when one considers the association of GI disorders and psychiatric symptoms:
Irritable bowel syndrome is associated with panic disorder, generalized anxiety disorder, social phobia, dysthymia, and major depression.
Inflammatory bowel disease (IBD)— such as Crohn’s disease and ulcerative colitis (prevalence ranging from 6% in Canada to 14% in the United States to 46% in Mexico5)—is commonly associated with mood and anxiety disorders and personality changes. The psychiatric manifestations of IBD are so common that the authors of a recent article in World Journal of Gastroenterology urged gastroenterologists to collaborate with psychiatrists when managing IBD.6
Celiac disease has been repeatedly associated with several neuropsychiatric disorders, including ataxia, epilepsy, peripheral neuropathy, headache, anxiety, attention-deficit/hyperactivity disorder, autism spectrum disorder, and schizophrenia.
New, exciting challenges for medical science
There potentially are important implications for possible exploitation of the ENS and the microbiome in the diagnosis and treatment of neuropsychiatric disorders. For example, consider these speculative challenges:
• Can intestinal biopsy reveal neurotransmitter pathology in schizophrenia?
• Can early dopamine deficiency predict Parkinson’s disease, enabling early intervention?
• Can β-amyloid deposits, the degenerative neurologic stigmata of Alzheimer’s disease, be detected in abdominal neurons years before onset of symptoms to allow early intervention?
• Can the ENS become a therapeutic pathway by targeting the various neurotransmitters found there or by engaging the enormous human microbiome to manipulate its beneficial properties?
• Can foods or probiotic supplements be prescribed as microbiomal adjuncts to improve the mood and anxiety spectrum?
One recommendation I came across is that ingesting 10 to 100 million beneficial bacteria, such as Lactobacillus plantarum and Bifidobacterium infantis, might be helpful. Such prescriptions obviously are speculative but also are reasonably testable hypotheses of ways to exploit the “other brain” and the microbiome.
We must summon the guts to seize this opportunity
An independent second brain and a remarkable microbiome appear to be significant evolutionary adaptations and advantages for humans. For too long, neuropsychiatric researchers have ignored the ENS and the microbiome; now, they must focus on how to exploit these entities to yield innovative diagnostic and therapeutic advances. Integrating the ENS and the microbiome and enmeshing them into neuropsychiatric research and clinical applications hold great promise.
The field of psychoneurogastroenterology is in its infancy, but its growth and relevance will be momentous for neuropsychiatry. A major intellectual peristalsis is underway.
1. Robinson B. The abdominal and pelvic brain. Hammond, IN: Frank S. Betz; 1907.
2. Gershon M. The second brain: a groundbreaking new understanding of nervous disorders of the stomach and intestine. New York, NY: HarperCollins Publishers; 1998.
3. McMillin DL, Richards DG, Mein EA, et al. The abdominal brain and enteric nervous system. J Altern Complement Med. 1999;5(6):575-586.
4. Hill JM, Bhattacharjee S, Pogue AI, et al. The gastrointestinal tract microbiome and potential link to Alzheimer’s disease. Front Neurol. 2014;5:43.
5. Olden KW, Lydiard RB. Gastrointestinal disorders. In: Rundell JR, Wise MG. Textbook of consultation-liaison psychiatry. Washington, DC: American Psychiatric Association; 1994.
6. Filipovic BR, Filipovic BF. World J Gastroenterol. 2014;20(13):3552-3563.
‘Watch and wait’ may be inadvisable for CLL

PHILADELPHIA—Withholding treatment from chronic lymphocytic leukemia (CLL) patients because they are of advanced age and have comorbidities may not be in their best interest, according to research presented at the AACR Annual Meeting 2015.
Most of the patients in this prospective, single-center study had 2 or more comorbidities, and their median age was 63.
But less than a quarter of the patients died of comorbidities, and none of them died of old age.
Most patients died of CLL progression or conditions possibly related to CLL.
Paolo Strati, MD, of the Mayo Clinic in Rochester, Minnesota, and his colleagues presented these findings in a poster at the meeting (abstract 5267).
The researchers evaluated 1174 CLL patients, starting within 9 months of CLL diagnosis, who consented to be studied between January 2002 and November 2014.
The patients’ median age was 63 (range, 23-89), 67% were male, and 98% were Caucasian. Fifty-two percent had a Rai stage of 0, 44% had stage I-II, and 4% had stage III-IV disease. Forty-four percent of patients were IGHV-unmutated, 40% had del13q, 9% had del11q, 5% had del17p.
“The baseline characteristics are what you generally see in a CLL population,” Dr Strati noted. “Most patients did have some form of other medical condition aside from CLL. In particular, 82% of patients, at the time of CLL diagnosis, had 2 or more comorbidities.”
Comorbidities included rheumatologic conditions (42%), hyperlipidemia (41%), hypertension (40%), genitourinary conditions (35%), gastrointestinal disorders (33%), obesity (32%), cardiac conditions (28%), other cancers (20%), respiratory conditions (18%), psychiatric diseases (17%), endocrine disorders (14%), diabetes (10%), substance abuse (5%), stroke (3%), venous thromboembolism (3%), and sexually transmitted infections (3%).
“If you are an average physician of CLL patients and see that they are old, with 2 or more comorbidities, you are very tempted not to do anything,” Dr Strati said. “You are assuming the patients are going to die of something other than CLL, and that’s actually an assumption across several countries.”
But Dr Strati and his colleagues found that was not the case for most of the patients they studied.
The researchers were able to determine the cause of death in 135 patients. Fifty-one percent of those patients died of progressive CLL, and an additional 26% died of causes potentially related to CLL, such as infections (5%) and second cancers (21%). Only 22% of patients died of comorbidities.
“We also looked into whether there was any association between baseline characteristics, baseline comorbidities, and causes of death, but there was not,” Dr Strati said, noting that this reinforces the idea that CLL patients are most likely to die of CLL progression.
Dr Strati and his colleagues are still investigating the influence of other comorbidities and clinical factors at diagnosis—such as smoking and the Charlson Comorbidity Index—on survival and the ultimate cause of death in CLL patients. The team plans to present these data at iwCLL 2015.
Still, Dr Strati said the data the researchers have collected thus far suggest physicians should consider treating CLL patients despite their advanced age and the presence of comorbidities, perhaps using biological agents if patients are unable to receive chemotherapy.
In addition, he said this research suggests patients should not be excluded from clinical trials due to advanced age or comorbidities. And he hopes these data will lead to a study comparing the outcomes of treating and not treating this patient population. ![]()
Meeting plasma transfusion guideline is feasible

Photo by Cristina Granados
High-volume trauma centers can provide consistent, rapid delivery of universal-donor plasma to massively hemorrhaging patients without excessive wastage, results of the PROPPR trial suggest.
For this study, researchers assessed the feasibility of the 2013 guidelines issued by the American College of Surgeons, which recommend that universal-donor products be immediately available upon the arrival of severely injured patients.
This recommendation may be outside the capabilities of many facilities, but it is likely to become the expected standard in the near future, the researchers said.
So Deborah Novak, MD, of the University of Arizona in Tucson, and her colleagues tested the feasibility of following the guidelines and reported their findings in Transfusion.
PROPPR was a randomized trial in which the researchers compared survival after the transfusion of 2 different blood component ratios in patients with traumatic massive hemorrhage. Transfusion services supporting the study were expected to provide thawed plasma, platelets, and red blood cells within 10 minutes of a request.
Twelve Level 1 trauma centers were involved in the trial. Participants collected data on the blood components transfused and the amount of time it took to deliver those products, but they focused primarily on plasma.
The researchers evaluated the adequacy of site plans by comparing the blood availability times to study goals and the American College of Surgeons guidelines.
The 680 patients in this trial received about 4700 units of plasma. Eleven of the sites consistently delivered 6 units of thawed, universal-donor plasma to their trauma-receiving unit within the required 10 minutes. The sites were able to deliver 12 units of plasma within 20 minutes.
Three sites used blood group A plasma instead of AB for massive transfusion and did not see any complications. None of the sites experienced shortages of AB plasma that limited enrollment. Two of the sites reported wasting nearly 25% of the AB plasma prepared.
“We hope the descriptions of the various ways in which centers fulfilled the requirement of delivering blood components to the bedside within 10 minutes inspire other facilities to devise the most effective way for their own circumstances,” Dr Novak said. ![]()
miR expression may predict long-term prognosis in DLBCL

Photo courtesy of NIH
MicroRNA (miR) expression may help us predict long-term prognosis in diffuse large B-cell lymphoma (DLBCL), according to a study published in
Investigators identified 8 miRs that were differently expressed in DLBCL patients with poor prognosis and patients with favorable prognosis.
However, many of the miRs that have been linked to DLBCL prognosis in previous studies were not associated with prognosis in this study.
“Our data are in agreement with previous findings showing that miR signature is predictive of prognosis for patients with DLBCL, although with different miRs achieving statistical significance,” said study author Meir Lahav, MD, of Tel Aviv University in Israel.
Dr Lahav and his colleagues analyzed miR signatures from tissue biopsies taken from 83 patients with DLBCL who were treated between 1995 and 2003.
Patients who relapsed within 9 months from the start of treatment were defined as poor prognosis (n=43), and patients with disease-free survival of at least 5 years were defined as good prognosis (n=40).
The investigators analyzed RNA using microarrays developed by Rosetta Genomics. To validate the microarray results, the team used quantitative real-time polymerase chain reaction (qRT-PCR) and an independent set of 13 samples.
They found that 4 miRs were upregulated in the poor-prognosis group compared to the good-prognosis group: hsa-miR-17-5p, hsa-miR-19b-3p, hsa-miR-20a-5p, and hsa-miR-106a-5p.
And 4 miRs were downregulated in the poor-prognosis group compared to the good-prognosis group: hsa-miR-150-5p, hsa-miR-342-3p, hsa-miR-181a-5p, and hsa-miR-140-3p.
The investigators said the strongest and most consistent correlation was for miR-342-3p and miR-150-5p, which discriminated between the 2 prognostic groups in the microarray analysis, qRT-PCR, and the independent validation set.
Several miRs that were found to have prognostic value in previous studies did not differentiate the prognostic groups in this study. These were miR-155-5p, miR-21-5p, miR-18a-5p, miR-221-3p, and miR-222-3p. However, one miR—miR-181a-5p—had prognostic value in a previous study and the current study.
The investigators said the differences in miRs might be explained by the fact that this study had a larger sample size and longer follow-up than previous studies.
The differences might also reflect prognostic changes with rituximab treatment, as the patients in this study did not receive rituximab (only CHOP).
Either way, the investigators said these results suggest that analyzing miR expression can potentially improve our ability to predict prognosis in DLBCL and may therefore have a significant clinical impact. ![]()
Malaria vaccine candidate proves somewhat effective

Photo by Caitlin Kleiboer
The malaria vaccine candidate RTS,S/AS01 is somewhat effective in young African children for up to 4 years after vaccination, according to final data from a phase 3 trial.
The vaccine proved more effective against clinical and severe malaria in children than in young infants, but efficacy waned over time in both age groups.
On the other hand, a booster dose of RTS,S/AS01 increased the average number of malaria cases prevented in children and infants.
“Despite the falling efficacy over time, there is still a clear benefit from RTS,S/AS01,” said Brian Greenwood, MD, of the London School of Hygiene & Tropical Medicine in the UK.
“An average 1363 cases of clinical malaria were prevented over 4 years of follow-up for every 1000 children vaccinated, and 1774 cases in those who also received a booster shot. Over 3 years of follow-up, an average 558 cases were averted for every 1000 infants vaccinated, and 983 cases in those also given a booster dose.”
Dr Greenwood and his colleagues disclosed these data in The Lancet. The research was funded by GlaxoSmithKline Biologicals SA, the company developing RTS,S/AS01, and the PATH Malaria Vaccine Initiative.
The trial included 15,459 young infants (aged 6 weeks to 12 weeks at first vaccination) and children (5 months to 17 months at first vaccination) from 11 sites across 7 sub-Saharan African countries (Burkina Faso, Gabon, Ghana, Kenya, Malawi, Mozambique, and United Republic of Tanzania) with varying levels of malaria transmission.
Earlier results from this trial, at 18 months of follow-up, showed efficacy of about 46% against clinical malaria in children and around 27% among young infants. Vaccine efficacy is defined as the reduction in the incidence of disease among participants who receive the vaccine compared to the incidence among participants who do not.
Dr Greenwood and his colleagues followed the infants and children for a further 20 to 30 months, respectively, and assessed the impact of a fourth booster dose.
Participants were each vaccinated 3 times with RTS,S/AS01, with or without a booster dose 18 months later, or given 4 doses of a comparator vaccine (control group).
In children who received 3 doses of RTS,S/AS01 plus a booster, the number of clinical episodes of malaria at 4 years was reduced by just over a third (36%). This is a drop in efficacy from the 50% protection against malaria seen in the first year.
Without a booster dose, the vaccine was not significantly effective against severe malaria in this age group. However, in children given a booster dose, the overall protective efficacy against severe malaria was 32% and 35% against malaria-associated hospitalizations.
In infants who received 3 doses of RTS,S/AS01 plus a booster, the vaccine reduced the risk of clinical episodes of malaria by 26% over 3 years of follow-up. There was no significant protection against severe disease in infants.
Meningitis occurred more frequently in children given RTS,S/AS01 than in children given the control vaccine. There were 11 cases of meningitis among children who received a booster, 10 cases among children who did not receive a booster, and 1 case among children in the control group.
RTS,S/AS02 produced more adverse reactions than the control vaccines. Convulsions following vaccination, although uncommon, occurred more frequently in children who received RTS,S/AS01. The incidence of other serious adverse events was similar in all the groups.
“The European Medicines Agency (EMA) will assess the quality, safety, and efficacy of the vaccine based on these final data,” Dr Greenwood said. “If the EMA gives a favorable opinion, WHO could recommend the use of RTS,S/AS01 as early as October this year. If licensed, RTS,S/AS01 would be the first licensed human vaccine against a parasitic disease.” ![]()
Docs need all tools, better education to combat opioid addiction
WASHINGTON– Doctors need a variety of options to treat opioid addiction and more training on safe opioid prescribing, according to experts called to testify before the House Energy & Commerce Committee’s Subcommittee on Oversight and Investigations.
One of the primary options – medication-assisted treatment (MAT) utilizing buprenorphine – was criticized by Subcommittee Chairman Tim Murphy (R-Pa.).

Increased availability of MAT is among the recommendations made in late March by the Health & Human Services department.
“We are not going to end this opioid epidemic by increasing the use of opioids,” Rep. Murphy said at the April 23 hearing. “We need an exit strategy that enables Americans to become opioid free altogether. We can do better than addiction maintenance.”
Physicians testifying to the subcommittee unanimously suggested that MAT needs to be a vital part of the treatment toolbox, noting that for some patients, it is an essential component of recovery.
Witnesses called for recognition that opioid addiction is a long-term issue; patients can need life-long treatment to help prevent relapse.
“Opiate dependence is not like the common cold. It does not go away” Dr. Robert DuPont, president of the Institute for Behavior and Health, testified. “It is a lifetime problem. A person who has opiate dependence is going to deal with that problem one way or another for his or her lifetime. People are not fixed in treatment.”
Treatment options, including MAT, almost always are short term, and that needs to change, Dr. DuPont said, adding that it is critically important to get health insurers to recognize longer-term treatment.
Dr. Anna Lembke of the departments of psychiatry and behavioral science at Stanford (Calif.) University, testified regarding the difficulty in getting Medicaid and private insurers to cover addiction treatment.
“When you try to get coverage for addiction treatment, they give you the huge runaround,” she said, noting that ironically, that it’s fairly easy to prescribe opioids and have those covered by most insurers.
“What that means is that if you want to get addiction treatment for patients who are struggling with the disease addiction, you can’t insurance to pay for it, which means that patients don’t access the treatment,” Dr. Lembke said, adding that it leaves patients to find and pay for treatments themselves.
While many insurers cover MAT, their utilization management techniques can make it challenging to get and keep patients in the programs, she said. “Once you start someone on buprenorphine, you don’t want to just suddenly not have it available to them, but that happens frequently because all of a sudden you have been denied coverage.”
Witnesses also called for better guidance on prescribing opioids. Dr. Patrice A. Harris, secretary of the American Medical Association board of trustees, highlighted some of her organizations efforts to improve education and awareness of the dangers of overprescribing opioid pain medications for physicians as well as patients. She noted, and other panelists agreed, that addiction needs to be looked at and treated as any other chronic condition. That shift in perspective could help alleviate the stigma attached to seeking treatment.
Dr. Lembke called for changes to Medicare to lead private insurance to better incentivize the proper use of addiction treatment, including both medication and non–medication based treatments, including setting quality measures to ensure proper use of opioids, removing any connection in customer satisfaction surveys to whether or not they receive prescription opioids, and to incentivize greater use of prescription drug monitoring programs.
She also called for changes in federal regulations to make it easier for doctors to communicate with one another on such issues as addiction and what medications they might be on to help better coordinate treatment and to prevent patients from getting opioid prescriptions from one doctor while getting treatment from another.
WASHINGTON– Doctors need a variety of options to treat opioid addiction and more training on safe opioid prescribing, according to experts called to testify before the House Energy & Commerce Committee’s Subcommittee on Oversight and Investigations.
One of the primary options – medication-assisted treatment (MAT) utilizing buprenorphine – was criticized by Subcommittee Chairman Tim Murphy (R-Pa.).
Increased availability of MAT is among the recommendations made in late March by the Health & Human Services department.
“We are not going to end this opioid epidemic by increasing the use of opioids,” Rep. Murphy said at the April 23 hearing. “We need an exit strategy that enables Americans to become opioid free altogether. We can do better than addiction maintenance.”
Physicians testifying to the subcommittee unanimously suggested that MAT needs to be a vital part of the treatment toolbox, noting that for some patients, it is an essential component of recovery.
Witnesses called for recognition that opioid addiction is a long-term issue; patients can need life-long treatment to help prevent relapse.
“Opiate dependence is not like the common cold. It does not go away” Dr. Robert DuPont, president of the Institute for Behavior and Health, testified. “It is a lifetime problem. A person who has opiate dependence is going to deal with that problem one way or another for his or her lifetime. People are not fixed in treatment.”
Treatment options, including MAT, almost always are short term, and that needs to change, Dr. DuPont said, adding that it is critically important to get health insurers to recognize longer-term treatment.
Dr. Anna Lembke of the departments of psychiatry and behavioral science at Stanford (Calif.) University, testified regarding the difficulty in getting Medicaid and private insurers to cover addiction treatment.
“When you try to get coverage for addiction treatment, they give you the huge runaround,” she said, noting that ironically, that it’s fairly easy to prescribe opioids and have those covered by most insurers.
“What that means is that if you want to get addiction treatment for patients who are struggling with the disease addiction, you can’t insurance to pay for it, which means that patients don’t access the treatment,” Dr. Lembke said, adding that it leaves patients to find and pay for treatments themselves.
While many insurers cover MAT, their utilization management techniques can make it challenging to get and keep patients in the programs, she said. “Once you start someone on buprenorphine, you don’t want to just suddenly not have it available to them, but that happens frequently because all of a sudden you have been denied coverage.”
Witnesses also called for better guidance on prescribing opioids. Dr. Patrice A. Harris, secretary of the American Medical Association board of trustees, highlighted some of her organizations efforts to improve education and awareness of the dangers of overprescribing opioid pain medications for physicians as well as patients. She noted, and other panelists agreed, that addiction needs to be looked at and treated as any other chronic condition. That shift in perspective could help alleviate the stigma attached to seeking treatment.
Dr. Lembke called for changes to Medicare to lead private insurance to better incentivize the proper use of addiction treatment, including both medication and non–medication based treatments, including setting quality measures to ensure proper use of opioids, removing any connection in customer satisfaction surveys to whether or not they receive prescription opioids, and to incentivize greater use of prescription drug monitoring programs.
She also called for changes in federal regulations to make it easier for doctors to communicate with one another on such issues as addiction and what medications they might be on to help better coordinate treatment and to prevent patients from getting opioid prescriptions from one doctor while getting treatment from another.
AT A HOUSE ENERGY & COMMERCE SUBCOMMITTEE HEARING

Ischemic preconditioning fails to shift CABG outcomes
SAN DIEGO – Remote ischemic preconditioning failed to improve long-term clinical outcomes in higher-risk patients undergoing coronary artery bypass surgery in the ERICCA trial.
At 1 year, there were no differences between patients receiving remote ischemic conditioning (RIC) or a sham procedure in the combined primary endpoint of cardiovascular death, MI, stroke, and coronary revascularization (27% vs. 28%) or its individual components.

Only the extent of perioperative myocardial injury, measured as area under the curve troponin T levels, at 72 hours was significantly lower with RIC (median 30.1 ng.h/mL vs. 35.7 ng.h/mL), principal investigator Dr. Derek Hausenloy reported at the annual meeting of the American College of Cardiology.
The simple, low-cost intervention consisted of four 5-minute blood pressure cuff inflations to 200 mm Hg and deflations immediately before patients went on bypass.
Multiple proof-of-concept studies have shown that brief, reversible episodes of ischemia followed by reperfusion reduces the extent of perioperative myocardial injury in patients undergoing elective coronary artery stenting or bypass grafting.
“In the setting of cardiac bypass surgery, the cardioprotective effect presented by RIC, or remote ischemic conditioning, may be affected by factors during surgery,” said Dr. Hausenloy of University College, London.
There are multiple causes of injury in patients undergoing bypass that include not only myocardial reperfusion injury, but also coronary microembolization, inflammation as the patient is taken on and off bypass, and direct injury to the heart, he noted.
ERICCA (Effect of Remote Ischemic Preconditioning on Clinical Outcomes in Patients Undergoing Coronary Artery Bypass Graft Surgery) also focused on a higher-risk aged population (76 years) with high rates of comorbidities like diabetes (25%) and hypertension (75%) that have been shown to impact RIC and other conditioning strategies.
Discussant Dr. Richard Fogel of St. Vincent Heart Center in Indianapolis, suggested RIC may not have worked because of a dose-response issue and questioned whether the results would have been different had the investigators, for example, done six inflations for 10 minutes each or performed RIC the day before.
Discussant Dr. Eric Bates of the University of Michigan in Ann Arbor, suggested that as long as patients are anesthetized, prolonged conditioning immediately before and after surgery might be considered.
“The RIC protocol has not been very well characterized, although most of the prior studies used three or four cycles,” Dr. Hausenloy said. “Whether this is the optimal stimulus is not known or clear.”
ERICCA enrolled 1,612 patients with an additive Euroscore of at least 5 who underwent CABG using blood cardioplegia at 29 centers in the United Kingdom. Of these, 801 received RIC and 811 received sham, simulated BP cuff inflations/deflations.
One year after surgery, the RIC and control groups had similar rates of major adverse cardiac and cerebral events, at 26.7% and 27.7%, respectively; cardiovascular death, at 5.9% and 3.9%; MI, at 21.8% and 23.7%; stroke, at 2.1% and 2.0%; and revascularization, at 0.2% and 0.4%.
“It’s interesting that we show a modest effect on reducing perioperative myocardial injury, but we didn’t see any associated improvement in clinical outcome,” he said. “This may question the use of perioperative myocardial injury, as measured by serum biomarkers, as a surrogate marker of cardioprotection. However, the caveat is that we only have a complete dataset for this conclusion in half the patients.”
The potential effect of RIC remains to be investigated in other settings of ischemia and reperfusion injury such as patients with ST-segment elevation MI or undergoing organ transplantation, Dr. Hausenloy said.
“Clearly in these settings of STEMI and organ transplantation, the contribution of ischemia reperfusion injury is greater, and one may speculate that the effect of RIC may be greater,” he added.
SAN DIEGO – Remote ischemic preconditioning failed to improve long-term clinical outcomes in higher-risk patients undergoing coronary artery bypass surgery in the ERICCA trial.
At 1 year, there were no differences between patients receiving remote ischemic conditioning (RIC) or a sham procedure in the combined primary endpoint of cardiovascular death, MI, stroke, and coronary revascularization (27% vs. 28%) or its individual components.
Only the extent of perioperative myocardial injury, measured as area under the curve troponin T levels, at 72 hours was significantly lower with RIC (median 30.1 ng.h/mL vs. 35.7 ng.h/mL), principal investigator Dr. Derek Hausenloy reported at the annual meeting of the American College of Cardiology.
The simple, low-cost intervention consisted of four 5-minute blood pressure cuff inflations to 200 mm Hg and deflations immediately before patients went on bypass.
Multiple proof-of-concept studies have shown that brief, reversible episodes of ischemia followed by reperfusion reduces the extent of perioperative myocardial injury in patients undergoing elective coronary artery stenting or bypass grafting.
“In the setting of cardiac bypass surgery, the cardioprotective effect presented by RIC, or remote ischemic conditioning, may be affected by factors during surgery,” said Dr. Hausenloy of University College, London.
There are multiple causes of injury in patients undergoing bypass that include not only myocardial reperfusion injury, but also coronary microembolization, inflammation as the patient is taken on and off bypass, and direct injury to the heart, he noted.
ERICCA (Effect of Remote Ischemic Preconditioning on Clinical Outcomes in Patients Undergoing Coronary Artery Bypass Graft Surgery) also focused on a higher-risk aged population (76 years) with high rates of comorbidities like diabetes (25%) and hypertension (75%) that have been shown to impact RIC and other conditioning strategies.
Discussant Dr. Richard Fogel of St. Vincent Heart Center in Indianapolis, suggested RIC may not have worked because of a dose-response issue and questioned whether the results would have been different had the investigators, for example, done six inflations for 10 minutes each or performed RIC the day before.
Discussant Dr. Eric Bates of the University of Michigan in Ann Arbor, suggested that as long as patients are anesthetized, prolonged conditioning immediately before and after surgery might be considered.
“The RIC protocol has not been very well characterized, although most of the prior studies used three or four cycles,” Dr. Hausenloy said. “Whether this is the optimal stimulus is not known or clear.”
ERICCA enrolled 1,612 patients with an additive Euroscore of at least 5 who underwent CABG using blood cardioplegia at 29 centers in the United Kingdom. Of these, 801 received RIC and 811 received sham, simulated BP cuff inflations/deflations.
One year after surgery, the RIC and control groups had similar rates of major adverse cardiac and cerebral events, at 26.7% and 27.7%, respectively; cardiovascular death, at 5.9% and 3.9%; MI, at 21.8% and 23.7%; stroke, at 2.1% and 2.0%; and revascularization, at 0.2% and 0.4%.
“It’s interesting that we show a modest effect on reducing perioperative myocardial injury, but we didn’t see any associated improvement in clinical outcome,” he said. “This may question the use of perioperative myocardial injury, as measured by serum biomarkers, as a surrogate marker of cardioprotection. However, the caveat is that we only have a complete dataset for this conclusion in half the patients.”
The potential effect of RIC remains to be investigated in other settings of ischemia and reperfusion injury such as patients with ST-segment elevation MI or undergoing organ transplantation, Dr. Hausenloy said.
“Clearly in these settings of STEMI and organ transplantation, the contribution of ischemia reperfusion injury is greater, and one may speculate that the effect of RIC may be greater,” he added.
AT ACC 2015
Key clinical point: Remote ischemic conditioning prior to CABG did not improve outcomes at 1 year.
Major finding: Cardiovascular death, MI, stroke, and coronary revascularization rates at 1 year were similar with and without RIC (27% vs. 28%).
Data source: ERICCA, a double-blind, randomized, controlled trial in 1,612 patients undergoing CABG.
Disclosures: The study was funded by the National Institute for Health Research, Medical Research Council, and British Heart Foundation. Dr. Hausenloy and Dr. Fogel reported having no disclosures. Dr. Bates reported consulting fees/honoraria from Merck and Astra Zeneca.
