User login
Simplified PESI identified low-risk pulmonary embolism
A simplified version of the Pulmonary Embolism Severity Index identified patients with acute pulmonary embolism who were at low risk of adverse events and might be suitable for outpatient care, investigators reported in Academic Emergency Medicine.
“Although guidelines, such as those from the American College of Chest Physicians, recommend outpatient treatment for selected PE patients at low risk of recurrence, existing evidence for the outpatient management of patients with PE is derived from small cohorts of patients from outside the United States,” said Dr. Gregory J. Fermann of the University of Cincinnati department of emergency medicine and his associates.
“The results of this analysis provide further support that risk stratification of PE patients may allow a cohort of low-risk patients to be treated in a clinical decision unit or by a closely monitored outpatient strategy. Such an approach might relieve some of the burden placed on the emergency department (Acad. Emerg. Med. 2015;22:299-307).”
The PESI has been shown to identify patients at increased risk of death and adverse outcome events after acute PE. The simplified PESI has 6 of the PESI’s 11 variables, but remains accurate in assessing PE severity, the researchers said. They carried out a post hoc analysis of simplified PESI scores and outcomes among 4,831 acute PE patients from the phase III Einstein PE study, in which rivaroxaban was found noninferior to an enoxaparin–vitamin K antagonist combination in terms of the risk of recurrent venous thromboembolism and clinically important bleeding events (N. Engl. J. Med. 2012;366:1287-97).
Roughly half (53.6%) of the patients had a score of 0, one-third (36.7%) had a score of 1, and 9.7% had a score of 2 or 3, the researchers reported. Higher simplified PESI scores were associated with increased risk of almost all adverse outcomes measured, including recurrent VTE, fatal PE, all-cause mortality, and major bleeding. Patients with scores of 0 or 1 had low rates of major adverse events during the first 30 days of treatment, regardless of which protocol they received.
However, the incidence of major bleeds up to 30 days was lower in the rivaroxaban group than in the standard treatment group, especially if patients’ simplified PESI scores were greater than 0. Scores of 2 or 3 were associated with greater risk of recurrent VTE, fatal PE, all-cause mortality, and major bleeding at all time points and in both treatment groups.
Bayer HealthCare Pharmaceuticals and Janssen Research & Development funded the study. Dr. Fermann reported an advisory relationship with Janssen and research funding from Cardiorentis, Trevena, Novartis, Siemens, and Pfizer. Two coauthors reported employment with Bayer, and two other coauthors reported financial and advisory relationships with several other pharmaceutical companies.
Key clinical point: The simplified version of the PESI identified low-risk pulmonary embolism patients.
Major finding: Patients with scores of 0 or 1 had low rates of major adverse events during the first 30 days, regardless of which treatment they received.
Data source: Post hoc analysis of simplified PESI scores and outcomes among 4,831 patients with acute pulmonary embolism who received either rivaroxaban or an enoxaparin–vitamin K antagonist combination.
Disclosures: Bayer HealthCare Pharmaceuticals and Janssen Research & Development funded the study. Dr. Fermann reported an advisory relationship with Janssen and research funding from Cardiorentis, Trevena, Novartis, Siemens, and Pfizer. Two coauthors reported employment with Bayer, and two other coauthors reported relationships with several other pharmaceutical companies.
U.S. poison center calls nearly quadrupled because of fake pot
Poison control call centers in the United States have received 1,900 exposure calls from people seeking help for adverse reactions to synthetic cannabinoids since Jan. 1, nearly four times the rate of calls received in 2014, the American Association of Poison Control Centers (AAPCC) announced April 23.
“These synthetic drugs present a potentially fatal risk that is not well recognized by people consuming these products,” Jay L. Schauben, Pharm.D., AAPCC president, said in a statement. “The recent death of five people suspected of using this category of drugs underscores the urgency of controlling these drugs and educating the public of their dangers.”

Synthetic “marijuana” products, also known as THC homologs, can induce similar highs to THC but are chemically different from cannabis. These drugs, marketed under such names as “Spice,” “K2,” and “AK-47,” are typically sprayed on plant material, and can be easily purchased in convenience stores and gas stations.
Chemical formulas in a particular brand of fake pot can vary dramatically and are often changed or altered to avoid using specifically banned formulations, Eric Wish, Ph.D., of the National Drug Early Warning System, said in a statement. “People are playing Russian Roulette with their lives because only the chemist creating the synthetic cannabinoid really knows what is in it.”
Emergency physicians should consider synthetic cannabinoids in patients presenting with be alert to the following symptoms in patients presenting with severe agitation and anxiety, nausea and vomiting, muscle spasms, seizures, tremors, psychotic episodes, and suicidal and other harmful thoughts and/or actions.
However, since formulations are ever-changing, recognizing synthetic cannabinoid intoxication can be difficult, according to AAPCC.
Poison control call centers in the United States have received 1,900 exposure calls from people seeking help for adverse reactions to synthetic cannabinoids since Jan. 1, nearly four times the rate of calls received in 2014, the American Association of Poison Control Centers (AAPCC) announced April 23.
“These synthetic drugs present a potentially fatal risk that is not well recognized by people consuming these products,” Jay L. Schauben, Pharm.D., AAPCC president, said in a statement. “The recent death of five people suspected of using this category of drugs underscores the urgency of controlling these drugs and educating the public of their dangers.”
Synthetic “marijuana” products, also known as THC homologs, can induce similar highs to THC but are chemically different from cannabis. These drugs, marketed under such names as “Spice,” “K2,” and “AK-47,” are typically sprayed on plant material, and can be easily purchased in convenience stores and gas stations.
Chemical formulas in a particular brand of fake pot can vary dramatically and are often changed or altered to avoid using specifically banned formulations, Eric Wish, Ph.D., of the National Drug Early Warning System, said in a statement. “People are playing Russian Roulette with their lives because only the chemist creating the synthetic cannabinoid really knows what is in it.”
Emergency physicians should consider synthetic cannabinoids in patients presenting with be alert to the following symptoms in patients presenting with severe agitation and anxiety, nausea and vomiting, muscle spasms, seizures, tremors, psychotic episodes, and suicidal and other harmful thoughts and/or actions.
However, since formulations are ever-changing, recognizing synthetic cannabinoid intoxication can be difficult, according to AAPCC.

Are we taught enough about behavior?
If you ask a primary care pediatrician who has been practicing for more than 2 decades, she will tell you that her practice has tilted steeply toward complaints with a more developmental and behavioral flavor. In the lead article of the April 2015 Pediatrics (“Are We on the Right Track? Examining the Role of Developmental Behavioral Pediatrics”) Dr. Ruth E.K. Stein, a recent recipient of the C. Anderson Aldrich Award given by the American Academy of Pediatrics section on children with developmental and behavioral pediatrics, questions whether we, both general pediatricians and specialists in developmental and behavioral pediatrics, are on the right path in addressing this shifting mix in our patient populations.
Dr. Stein observes that while she and other pioneers in the creation of her specialty began as general pediatricians, today physicians typically enter developmental and behavioral fellowship programs without the benefit of practicing the runny nose–earache–diaper rash kind of pediatrics that many of us enjoy. She worries that from this early branching point in training, developmental and behavioral specialists have become “sequestered and siloed – increasingly seen only as people who take care of children who have special needs.” The problem is that, as Dr. Stein wisely observes, developmental and behavioral issues “are the core constructs of pediatrics and its backbone and that they must be incorporated into every primary care and specialty encounter and included in every educational experience.”
Dr. Stein continues her essay by proposing a handful of strategies for bridging the gap between developmental and behavioral specialists and general pediatricians, and strengthening the training of house officers, which currently requires only a pitifully inadequate month devoted to developmental and behavioral issues. While it is hard to argue with Dr. Stein’s suggestions, they only nibble around the edges of the real problem.
If one really believes as she and I do, that behavior and development must be considered in every patient encounter and educational experience, then the solution lies in changing how we teach medicine from the very beginning instead of waiting until postgraduate education. Everyone mouths the importance of the mind-body connection, but it is often just so much hot air. The relationship between behavior and development, and what Dr. Stein refers to as “biomedical” conditions, exists in every patient. It is often said it is the fact that our patients are growing and developing that keeps pediatrics apart from the rest of medicine. But the same process of change over time occurs in adults as well; we call it aging instead of development. Understanding where our patients are positioned on this trajectory from birth to death is critical in helping us understand what is troubling them, and how best to help them manage their concerns.
For pediatricians, our preverbal patients’ behavior is often the only way we have of knowing there is a problem. Behavior can be their unspoken chief complaint. The failure by a physician to interpret her patient’s behavior as either a result or the cause of the problem can lead to an unfortunate outcome.
This means, as we teach aspiring doctors the art of medicine, we must make it clear that the patient’s behavior and stage of development must be considered equally with the more traditional biomedical etiologies, not as an afterthought. For example, any discussion of nonacute recurrent abdominal pain in children that fails to acknowledge from the outset that most of these patients will not have an abnormality detectable by lab work and imaging studies is doing the young physician and his patients a disservice. I am suggesting that we adopt a more patient-centered rather than a disease-centered approach to training all physicians.
While every patient must be viewed in the proper behavioral and developmental context, there are those in whom a behavior problem dominates. Given the patient mix that the new millennium pediatrician is going to face, 1 month in postgraduate training is clearly insufficient. One cannot begin to learn even the rudiments of managing common problems such as attention-deficit/hyperactivity disorder, disordered sleep, temper tantrums, and school refusal in 30 days. Finding room in a training program to give behavioral and developmental problems more than a quick nod is going to require some rethinking of how we train pediatricians. It may be that training programs will need to selectively trim back some programs that may be of only limited long-term use to most general office-based pediatricians and offer them as electives. For example, how many of us still practice the kind of neonatology we were exposed to in the special care nursery? These are not easy decisions, but as Dr. Reid has suggested, we need to reconsider whether we are on the right track.
Dr. Wilkoff practiced primary care pediatrics in Brunswick, Maine, for nearly 40 years. He has authored several books on behavioral pediatrics, including “Coping with a Picky Eater.” E-mail him at [email protected].

Angiojet system found safe, effective in lower-extremity deep venous thrombosis
More than 80% of patients with lower-extremity deep venous thrombosis who underwent endovascular treatment with the Angiojet rheolytic thrombectomy system were free of rethrombosis a year later, based on final results from the PEARL registry study.
Almost 4% of patients had bleeding events after treatment, but none of these events was tied to use of the Angiojet system, reported Dr. Mark Garcia of Mount Sinai Medical Center in New York and his associates.

“PEARL registry data demonstrate that rheolytic pharmacomechanical catheter-directed thrombolysis treatment of deep venous thrombosis is safe and effective, and can potentially reduce the need for concomitant catheter-directed thrombolysis and intensive care,” the researchers wrote.
The rates of venous thromboembolism are rising, and the number of affected adults is expected to double in the next 40 years as the population ages and experiences recurrent episodes. Lower-extremity deep venous thrombosis (DVT) is especially likely to recur or to develop complications such as pulmonary embolism and post-thrombotic syndrome. For this reason, practice guidelines now advocate early removal of iliofemoral clots if patients are functional, have a good life expectancy, are within 14 days of symptom onset, and are unlikely to develop bleeding complications. Options for clot removal include catheter-directed thrombolysis (CDT) or pharmacomechanical CDT, which combines catheterization with intervention to break up or aspirate the clot while infusing it with a thrombolytic drug, said the investigators (J. Vasc. Interv. Radiol. 2015 Mar. 27 [doi:10.1016/j.jvir.2015.01.036]).
The PEARL registry study prospectively followed patients who underwent PCDT for arterial or venous thrombosis with the AngioJet thrombectomy catheter system. Researchers analyzed data from 329 patients with severe lower-extremity DVT who were treated at 32 sites in the United States and Europe between 2007 and 2013. Two-thirds of the patients underwent Angiojet thrombectomy within 2 weeks of symptom onset, while 19% were treated within 15 to 30 days and 14% were treated for chronic lesions. A total of 57% of patients were men, and the average age at onset was 52 years. The cohort’s most prevalent risk factors for thrombosis included a history of DVT, preexisting caval filters, past or current tobacco use, and prior pulmonary embolism, the investigators reported.
Grade III (100%) clot removal was possible without needing to use CDT in 39% of patients. Most of these patients underwent PCDT alone (lasting a median of 2 hours), while the rest underwent rheolytic thrombectomy without a lytic agent (median, 1.4 hours). However, just over half of patients underwent PCDT and catheter-directed thrombolysis, lasting a median of 22 hours, and 9% underwent rheolytic thrombectomy with CDT (median, 41 hours). About three-quarters of patients had procedures lasting under 24 hours, and about one in three were done within 6 hours. Also, 86% of procedures required no more than two catheter laboratory sessions.
Three months after treatment, 94% of patients were free from rethrombosis, and 87% and 83% of the cohort remained so at 6 and 12 months, respectively, the researchers added. Even patients with chronic thrombi improved so much on the 12-item Short-Form Health Survey that their scores approximated population norms with a year of treatment, they said.
A total of nine patients (2.7%) had adverse events possibly related to treatment, including one case of acute renal failure, said the investigators. Clinicians should follow recommendations for hydration and limit run time to four minutes in a free-flowing vessel to prevent that outcome, they added.
Dr. Garcia and his associates reported being paid consultants for Boston Scientific, which makes the Angiojet thrombectomy catheter system and funded the study. Dr. Garcia also reported grant funds and consulting fees from BTG/EKOS and Cook. Four coauthors reported receiving consulting fees from Cordis, Cook, Medtronic, AstraZeneca, and Covidien.
More than 80% of patients with lower-extremity deep venous thrombosis who underwent endovascular treatment with the Angiojet rheolytic thrombectomy system were free of rethrombosis a year later, based on final results from the PEARL registry study.
Almost 4% of patients had bleeding events after treatment, but none of these events was tied to use of the Angiojet system, reported Dr. Mark Garcia of Mount Sinai Medical Center in New York and his associates.
“PEARL registry data demonstrate that rheolytic pharmacomechanical catheter-directed thrombolysis treatment of deep venous thrombosis is safe and effective, and can potentially reduce the need for concomitant catheter-directed thrombolysis and intensive care,” the researchers wrote.
The rates of venous thromboembolism are rising, and the number of affected adults is expected to double in the next 40 years as the population ages and experiences recurrent episodes. Lower-extremity deep venous thrombosis (DVT) is especially likely to recur or to develop complications such as pulmonary embolism and post-thrombotic syndrome. For this reason, practice guidelines now advocate early removal of iliofemoral clots if patients are functional, have a good life expectancy, are within 14 days of symptom onset, and are unlikely to develop bleeding complications. Options for clot removal include catheter-directed thrombolysis (CDT) or pharmacomechanical CDT, which combines catheterization with intervention to break up or aspirate the clot while infusing it with a thrombolytic drug, said the investigators (J. Vasc. Interv. Radiol. 2015 Mar. 27 [doi:10.1016/j.jvir.2015.01.036]).
The PEARL registry study prospectively followed patients who underwent PCDT for arterial or venous thrombosis with the AngioJet thrombectomy catheter system. Researchers analyzed data from 329 patients with severe lower-extremity DVT who were treated at 32 sites in the United States and Europe between 2007 and 2013. Two-thirds of the patients underwent Angiojet thrombectomy within 2 weeks of symptom onset, while 19% were treated within 15 to 30 days and 14% were treated for chronic lesions. A total of 57% of patients were men, and the average age at onset was 52 years. The cohort’s most prevalent risk factors for thrombosis included a history of DVT, preexisting caval filters, past or current tobacco use, and prior pulmonary embolism, the investigators reported.
Grade III (100%) clot removal was possible without needing to use CDT in 39% of patients. Most of these patients underwent PCDT alone (lasting a median of 2 hours), while the rest underwent rheolytic thrombectomy without a lytic agent (median, 1.4 hours). However, just over half of patients underwent PCDT and catheter-directed thrombolysis, lasting a median of 22 hours, and 9% underwent rheolytic thrombectomy with CDT (median, 41 hours). About three-quarters of patients had procedures lasting under 24 hours, and about one in three were done within 6 hours. Also, 86% of procedures required no more than two catheter laboratory sessions.
Three months after treatment, 94% of patients were free from rethrombosis, and 87% and 83% of the cohort remained so at 6 and 12 months, respectively, the researchers added. Even patients with chronic thrombi improved so much on the 12-item Short-Form Health Survey that their scores approximated population norms with a year of treatment, they said.
A total of nine patients (2.7%) had adverse events possibly related to treatment, including one case of acute renal failure, said the investigators. Clinicians should follow recommendations for hydration and limit run time to four minutes in a free-flowing vessel to prevent that outcome, they added.
Dr. Garcia and his associates reported being paid consultants for Boston Scientific, which makes the Angiojet thrombectomy catheter system and funded the study. Dr. Garcia also reported grant funds and consulting fees from BTG/EKOS and Cook. Four coauthors reported receiving consulting fees from Cordis, Cook, Medtronic, AstraZeneca, and Covidien.
FROM THE JOURNAL OF VASCULAR INTERVENTIONAL RADIOLOGY
Key clinical point: Endovascular treatment with the Angiojet rheolytic thrombectomy systemwas found safe and effective for lower-extremity deep venous thrombosis.
Major finding: 83% of patients were free of rethrombosis a year later, and only one suffered a serious adverse event (acute renal failure).
Data source: A multicenter prospective registry study of 329 patients who underwent Angiojet thrombectomy with or without catheter-directed thrombolysis.
Disclosures: Dr. Garcia and his associates reported being paid consultants for Boston Scientific, which makes the Angiojet thrombectomy catheter system and funded the study. Dr. Garcia also reported grant funds and consulting fees from BTG/EKOS and Cook. Four coauthors reported receiving consulting fees from Cordis, Cook, Medtronic, AstraZeneca, and Covidien.
One Palm, Two Soles, Three Guesses on Diagnosis
A 27-year-old man, who works as an electrician, self-refers for evaluation of changes on his left palm. He first noticed them three years ago, when a scaly patch appeared on his volar wrist. At the time, his mother sent him an unidentified cream from Mexico, which he used on the rash. Although it resolved, within a few months, his entire palm was similarly affected.
The problem has persisted despite a number of treatment attempts—with, among other things, OTC creams and lotions, topical steroids, antifungals, and two courses of oral antibiotics. He even tried a vegetarian diet. Nothing has worked.
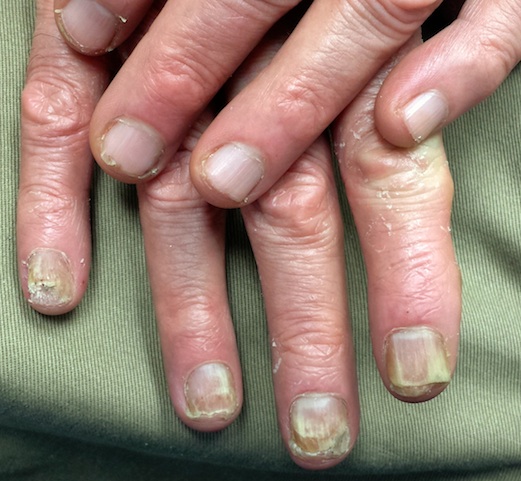
The hand is mildly symptomatic and faintly irritated. He reports similar symptoms on the soles of both feet, which he says date to several years before his hand problem. The fingernails on the affected hand have also changed.
The skin and nails of his right hand have remained completely normal throughout this experience. His health is otherwise excellent.
EXAMINATION
The skin on his left palm and on both soles is identical: uniformly scaly and pink, and in sharp contrast to the normal, smooth skin of his right palm. All five fingernails of his left hand are yellowed, thickened, and dystrophic. Surprisingly, all toenails are normal in appearance. His right hand is unaffected.
What is the diagnosis?
DISCUSSION
This curious phenomenon, known as “two-feet, one-hand disease,” represents a variant of dermatophytosis that is usually remarkably mild in terms of symptoms but often lasts years (if not decades) once the patient develops it. The causative organism is the same dermatophyte that causes jock itch and athlete’s foot: Trichophyton rubrum, the most commonly isolated fungal organism causing disease in humans.
There has never been a satisfactory explanation for why this fairly common condition spares one hand completely. It has been posited that the disease more often affects the dominant hand, but studies haven’t supported that theory. Neither has one hand (left or right) been shown to predominate.
What we do know is that the organisms feed on nonliving skin, which is why they cause minimal symptoms. The palms, soles, and nails represent more tissue for them to feed on and a way to escape the reach of the immune system.
Susceptibility is a key factor in why some people, but not others, develop two-foot-one-hand disease. It is thought that the inability to fend off this organism is related to an inherited, qualitative deficiency of cell-mediated immunity—coupled in some cases with environmental factors such as heat, humidity, and choice of shoes.
We also know that as common and well known as this diagnosis is in dermatology circles, it is far more obscure to nondermatology providers. As a result, the uninitiated provider tends to treat it as he or she would eczema or psoriasis (both of which belong in the differential): with steroids, which are the very thing certain to worsen the condition.
In some cases, before seeking professional care, patients attempt to treat their problem with steroids prescribed for another condition—or even for another patient. The condition will appear to improve but then worsen over time, as the steroids suppress what little immune response exists. The overall effect is thus to worsen the situation considerably, making the condition more difficult to treat.
In the absence of a definite diagnosis, even when antifungals are tried, they are often relatively weak products (eg, tolnaftate or undecylenic acid) that afford little if any relief. The patient (and sometimes provider) then interprets this as a sign that the problem is not of fungal origin and proceeds to other, truly ineffective treatments.
The two key factors that solve the mystery of two-foot-one-hand disease are: knowledge of its existence and the performance of a KOH examination of scrapings from the palm or sole. In this case, KOH revealed numerous fungal hyphae, confirming the diagnosis. Then—and only then—could effective treatment be provided.

This patient was treated with miconazole cream (bid application) and a month-long course oral terbinafine (250 mg/d). The good news is that this will help control the disease. The bad news? The problem will continue to lurk in the background, because we can do little or nothing to make the patient less susceptible. At least he now knows what he has, and he has the weapons to ward it off in the future.
TAKE-HOME LEARNING POINTS
• “Two feet, one hand” disease is a form of dermatophytosis that affects both feet and one hand while completely sparing the other hand. To date, no one has explained this pattern of distribution.
• As with many dermatologic conditions, the diagnosis of two-feet-one-hand disease is simple if you know it exists and completely obscure if you don’t.
• Individual susceptibility appears to explain why some people develop it and many more (including family/household members of affected individuals) don’t.
• Besides knowledge of its existence, the key to diagnosis is the confirmatory KOH prep.
• This is a perfect example of the principle of “correct diagnosis dictates correct treatment.”
A 27-year-old man, who works as an electrician, self-refers for evaluation of changes on his left palm. He first noticed them three years ago, when a scaly patch appeared on his volar wrist. At the time, his mother sent him an unidentified cream from Mexico, which he used on the rash. Although it resolved, within a few months, his entire palm was similarly affected.
The problem has persisted despite a number of treatment attempts—with, among other things, OTC creams and lotions, topical steroids, antifungals, and two courses of oral antibiotics. He even tried a vegetarian diet. Nothing has worked.
The hand is mildly symptomatic and faintly irritated. He reports similar symptoms on the soles of both feet, which he says date to several years before his hand problem. The fingernails on the affected hand have also changed.
The skin and nails of his right hand have remained completely normal throughout this experience. His health is otherwise excellent.
EXAMINATION
The skin on his left palm and on both soles is identical: uniformly scaly and pink, and in sharp contrast to the normal, smooth skin of his right palm. All five fingernails of his left hand are yellowed, thickened, and dystrophic. Surprisingly, all toenails are normal in appearance. His right hand is unaffected.
What is the diagnosis?
DISCUSSION
This curious phenomenon, known as “two-feet, one-hand disease,” represents a variant of dermatophytosis that is usually remarkably mild in terms of symptoms but often lasts years (if not decades) once the patient develops it. The causative organism is the same dermatophyte that causes jock itch and athlete’s foot: Trichophyton rubrum, the most commonly isolated fungal organism causing disease in humans.
There has never been a satisfactory explanation for why this fairly common condition spares one hand completely. It has been posited that the disease more often affects the dominant hand, but studies haven’t supported that theory. Neither has one hand (left or right) been shown to predominate.
What we do know is that the organisms feed on nonliving skin, which is why they cause minimal symptoms. The palms, soles, and nails represent more tissue for them to feed on and a way to escape the reach of the immune system.
Susceptibility is a key factor in why some people, but not others, develop two-foot-one-hand disease. It is thought that the inability to fend off this organism is related to an inherited, qualitative deficiency of cell-mediated immunity—coupled in some cases with environmental factors such as heat, humidity, and choice of shoes.
We also know that as common and well known as this diagnosis is in dermatology circles, it is far more obscure to nondermatology providers. As a result, the uninitiated provider tends to treat it as he or she would eczema or psoriasis (both of which belong in the differential): with steroids, which are the very thing certain to worsen the condition.
In some cases, before seeking professional care, patients attempt to treat their problem with steroids prescribed for another condition—or even for another patient. The condition will appear to improve but then worsen over time, as the steroids suppress what little immune response exists. The overall effect is thus to worsen the situation considerably, making the condition more difficult to treat.
In the absence of a definite diagnosis, even when antifungals are tried, they are often relatively weak products (eg, tolnaftate or undecylenic acid) that afford little if any relief. The patient (and sometimes provider) then interprets this as a sign that the problem is not of fungal origin and proceeds to other, truly ineffective treatments.
The two key factors that solve the mystery of two-foot-one-hand disease are: knowledge of its existence and the performance of a KOH examination of scrapings from the palm or sole. In this case, KOH revealed numerous fungal hyphae, confirming the diagnosis. Then—and only then—could effective treatment be provided.
This patient was treated with miconazole cream (bid application) and a month-long course oral terbinafine (250 mg/d). The good news is that this will help control the disease. The bad news? The problem will continue to lurk in the background, because we can do little or nothing to make the patient less susceptible. At least he now knows what he has, and he has the weapons to ward it off in the future.
TAKE-HOME LEARNING POINTS
• “Two feet, one hand” disease is a form of dermatophytosis that affects both feet and one hand while completely sparing the other hand. To date, no one has explained this pattern of distribution.
• As with many dermatologic conditions, the diagnosis of two-feet-one-hand disease is simple if you know it exists and completely obscure if you don’t.
• Individual susceptibility appears to explain why some people develop it and many more (including family/household members of affected individuals) don’t.
• Besides knowledge of its existence, the key to diagnosis is the confirmatory KOH prep.
• This is a perfect example of the principle of “correct diagnosis dictates correct treatment.”

Device can test multiple cancer drugs in tumors

Image courtesy of
Presage Biosciences
A device that tests multiple cancer drugs in living tumor tissue could guide treatment selection in patients with lymphoma and other cancers, according to researchers.
They also believe the device, called CIVO, could help speed up drug development by testing the efficacy of candidate drugs in very small doses while sparing patients side effects.
CIVO is a handheld microinjection platform that can deliver small doses of up to 8 drugs or combinations of drugs into a tumor.
The device proved effective for testing multiple cancer drugs in xenograft mouse models, dogs, and humans with lymphoma.
Richard Klinghoffer, PhD, of Presage Biosciences in Seattle, Washington, and his colleagues described their research with CIVO in Science Translational Medicine. The research was funded by Presage Biosciences, the National Institutes of Health, and Seattle Children’s Hospital Neuro-Oncology Fund.
About CIVO
CIVO is designed for tumors near the skin surface, such as lymphoma or skin and breast cancer.
The technology enables the placement of multiple columns of drugs directly into the tumor along the needle axis, spanning the full depth of the tumor. This makes it possible to assess drug effects with multiple biomarkers and in multiple regions along the injection axis to capture the heterogeneity of response within the tumor.
Later (typically 24 to 72 hours after injection), the tumor is resected for subsequent analysis, and responses are measured with multiple immunohistochemistry-based assays and high-resolution scanning.
Results in mice
In xenograft lymphoma models, CIVO microinjection of well-characterized anticancer agents (vincristine, doxorubicin, mafosfamide, and prednisolone) induced spatially defined cellular changes around sites of drug exposure, specific to the known mechanisms of each drug. And the observed localized responses predicted responses to the same drugs systemically delivered in animals.
In pair-matched drug-resistant and drug-sensitive lymphoma models, CIVO correctly demonstrated tumor resistance to doxorubicin and vincristine.
The researchers also identified an unexpected enhanced sensitivity to the active form of cyclophosphamide in multidrug-resistant lymphomas compared with chemotherapy-naïve lymphomas.
And a CIVO-enabled in vivo screen of oncology agents revealed that a novel mTOR pathway inhibitor exhibits significantly increased tumor-killing activity in the drug-resistant setting compared with chemotherapy-naïve tumors.
Results in dogs and humans
Dogs with lymphoma showed no toxicity when injected with drugs via CIVO. And the researchers said they observed robust, easily tracked, drug-specific responses in the animals.
For lymphoma patients, the researchers used CIVO to inject microdoses of vincristine into the tumors in patients’ lymph nodes. Cells surrounding the injections died, and there were no serious adverse events, although patients did report mild discomfort.
“This analysis creates a comprehensive portrait of drug response that has never been seen before this early in the drug development process,” Dr Klinghoffer said. “Using this technology, we can assess how drugs, both as single agents and in combinations, impact the biology of tumor cells in the context of the native tumor microenvironment.”
“[T]ranslation of CIVO to the clinical setting has enabled assessment on all aspects of tumor biology, including drug effects on tumor-infiltrating immune cells. This sets the stage for a new type of pre-phase 1 clinical study in which multiple drugs or drug combinations can be tested simultaneously, directly in a patient’s own tumor, without toxicity associated with systemic drug delivery.” ![]()
CCSs more likely to claim social security support

Photo courtesy of
Huntsman Cancer Institute
A new study indicates that childhood cancer survivors (CCSs) are more likely than individuals without a cancer history to enroll on federal programs that provide disability benefits.
CCSs diagnosed between 1970 and 1986 were about 2 to 5 times as likely as control subjects to utilize such a program.
“The long-term impact of cancer can affect other issues besides health outcomes,” said study author Anne Kirchhoff, PhD, of the Huntsman Cancer Institute at the University of Utah.
“We need to do a better job of helping people function throughout their lives, not just when they’re finishing their cancer therapy.”
Dr Kirchhoff and her colleagues conducted this research and detailed the results in the Journal of the National Cancer Institute.
The researchers looked at health insurance surveys completed in 2011 and 2012 by a random sample of 698 CCSs who were diagnosed between the ages of 0 and 20 years. Today, they range in age from 20s to early 60s.
The patients are part of a National Cancer Institute initiative, called the Childhood Cancer Survivor Study, which has followed more than 14,000 children and adolescents since 1994 who were diagnosed with cancer and survived at least 5 years after diagnosis. A comparison group of 210 siblings without cancer also responded to the survey and were used as controls.
Dr Kirchhoff and her colleagues looked at current or former enrollment on 2 federal disability programs:
- Supplemental security income (SSI), which is for people with limited income who have no prior work history
- Social security disability insurance (SSDI), which pays disability benefits to adults ages 18 years and older who have worked and paid social security taxes.
In all, 13.5% of CCSs reported being enrolled on SSI in the past or present, and 10% of survivors reported being enrolled on SSDI at some point. This was substantially higher than for the comparison group, in which 2.6% of patients reported SSI enrollment and 5.4% reported SSDI enrollment.
In addition, CCSs reported current enrollment in SSI more frequently than the US population, at rates of 7.3% and 2.5%, respectively.
Dr Kirchoff and her colleagues also identified survivor socio-demographic and treatment characteristics that were associated with a higher rate of enrollment in federal support programs.
“Survivors that were younger at diagnosis, age 4 or under, were about 7 times more likely to be on SSI than we see with survivors that were diagnosed in their adolescence,” she said.
SSI enrollment was more likely for female CCSs and for survivors with a history of cranial radiation treatment as well.
Dr Kirchhoff noted that, over the years, research on CCSs has caused hospitals to rethink how to better care for cancer survivors.
“There’s really a growing strategy to support survivors in the long-term,” she said. “For example, here at Huntsman Cancer Institute, we have a pediatric cancer late-effects clinic, which helps manage issues that might come up with childhood cancer survivors in the long term, including health-management support, health-behavior support, and access to providers to help them with other issues.” ![]()
Team images immune response

Photo by Aaron Logan
Researchers say they have devised an approach that allows for real-time imaging of the immune system’s response to tumors, without the need for blood draws or biopsies.
The method harnesses PET to identify areas of immune cell activity associated with inflammation or tumor development.
The researchers believe the approach offers a potential breakthrough in diagnostics and the ability to monitor the efficacy of cancer therapies.
The team described their method in PNAS.
Study author Hidde Ploegh, PhD, of the Whitehead Institute for Biomedical Research in Cambridge, Massachusetts, said that every experimental immunologist wants to monitor an ongoing immune response, but options are limited.
“One can look at blood, but blood is a vehicle of transport for immune cells and is not where immune responses occur,” he said. “Surgical biopsies are invasive and non-random, so, for example, a fine-needle aspirate of a tumor could miss a significant feature of that condition.”
In search of a better monitoring approach, Dr Ploegh and his colleagues leveraged two research tools that have become staples in his lab in recent years.
The first exploits single-domain antibodies known as VHHs, derived from the heavy chain-only antibodies made by the immune systems of animals in the camelid family. Dr Ploegh’s lab immunizes alpacas—his camelid of choice—to generate VHHs specific to immune cells of interest.
The second tool, sortagging, labels the VHHs in a site-specific fashion so that researchers can track the VHHs and their targets in a living animal.
Knowing that the tissue around tumors often contains immune cells such as neutrophils and macrophages, Dr Ploegh and his colleagues hypothesized that appropriately labeled VHHs might allow them to pinpoint tumor locations by finding the tumor-associated immune cells.
Dr Ploegh noted that VHHs’ extremely small size—approximately one-tenth that of conventional antibodies—are likely responsible for their superior tissue penetration and, thus, makes them particularly well suited for such use.
So the researchers generated VHHs that recognize mouse immune cells, then labeled these VHHs with radioisotopes and injected them into tumor-bearing mice. Subsequent PET imaging detected the location of immune cells around the tumor quickly and accurately.
“We were able to image tumors as small as 1 mm in size and within just a few days of their starting to grow,” said Mohammad Rashidian, PhD, a researcher in Dr Ploegh’s lab.
“We’re very excited about this because it’s a powerful approach to pick up inflammation in and around the tumor.”
Drs Rashidian and Ploegh believe that, with further refinement, the method could be used to monitor response to—and perhaps modify—cancer immunotherapy.
“To succeed with immunotherapy, we need more information about the tumor microenvironment,” Dr Rashidian said. “With this method, you could perhaps start immunotherapy and then, a few weeks later, image with VHHs to figure out progress and success of treatment.”
“PET imaging should allow a much more comprehensive look at the entire tumor in its environment,” Dr Ploegh added. “Then we can ask, ‘Did the tumor grow? Did immune cells invade? What has happened to the tumor?’ And to be able to see this without going in invasively is a significant achievement.” ![]()
PET scans could prevent unnecessary RT in HL
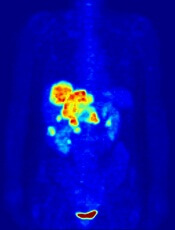
Image by Jens Langner
Performing PET scans immediately after chemotherapy may reveal which Hodgkin lymphoma (HL) patients need radiotherapy (RT).
A study published in NEJM showed similar rates of progression-free survival in HL patients who werePET-negative after chemotherapy, whether they received subsequent RT or not.
However, the investigators said longer follow-up is needed to determine if eliminating RT in PET-negative patients will lead to fewer late effects and improved overall survival.
The 602 patients who agreed to take part in this trial, known as RAPID, had a PET scan performed after chemotherapy. Patients who tested positive received RT.
Those who tested negative were divided into 2 groups. One group of 211 patients received no further treatment, and the other group of 209 patients had the standard RT.
At a median of 60 months of follow-up, the proportion of patients who were alive and disease-free was 94.6% in the RT group and 90.8% in the group that hadn’t received further treatment.
Eight patients in the RT group progressed, and 8 died (3 with disease progression, 1 of whom died from HL). Five of the deaths occurred in patients who did not ultimately receive RT.
In the untreated group, 20 patients progressed, and 4 patients died (2 with disease progression and none from HL).
“This research is an important step forward,” said study author John Radford, of The University of Manchester and The Christie NHS Foundation Trust in the UK.
“The results of RAPID show that, in early stage Hodgkin lymphoma, radiotherapy after initial chemotherapy marginally reduces the recurrence rate, but this is bought at the expense of exposing to radiation all patients with negative PET findings, most of whom are already cured.” ![]()
Concerns Regarding Long‐term Opioid Use
Overall rates of opioid use and chronic use for noncancer pain have increased markedly in the last 1 to 2 decades.[1, 2] Recognition of such rapidly increasing use has prompted a flurry of investigations examining the impact of what has been referred to as the opioid epidemic.[1, 3, 4] Patients receiving chronic opioid analgesics have previously been demonstrated to consume disproportionate shares of healthcare resources, including significantly more emergency room visits and days in the hospital.[5] In this issue of the Journal of Hospital Medicine, Liang and Turner[6] further demonstrate the impressive scope of healthcare resources consumed by this patient population, and extend these findings by examining the relationship between opioid dose and subsequent hospitalization in a large national cohort of middle‐aged health maintenance organization enrollees with noncancer pain. This is the first study to investigate the relationship in a general cohort of patients.
Perhaps the most striking finding of the study was an all‐cause hospitalization rate of 1120 per 10,000 person‐years among their cohort of opioid users. Considering that 5 to 8 million Americans use long‐term opioids,[7] this translates to about 500,000 to 900,000 admissions per year. The degree to which opioids themselves contribute to such hospitalizations (attributable risk) is uncertain, and it is likely that some of this risk can be explained by the idea that opioids are a marker for comorbidity, and that the conditions prompting opioid use independently increase risk of hospitalization. Studies examining more homogeneous patient populations could serve to shed light on this question. The issue of attributable risk notwithstanding, it is clear that this is a patient population that should have the attention of physicians, hospital administrators, and policy makers.
The main finding of their study is that the total opioid dose in any given 6‐month interval was more strongly associated with subsequent all‐cause hospitalization than the daily dose. This suggests that cumulative exposure is important, and possibly more important than the strength of any given prescription, at least when it comes to the outcome of hospitalization. That is not to say that the daily dose is unimportant, and the authors appropriately caution against such an interpretation. Daily dose matters, and to conclude otherwise would be incorrect for several reasons. First, among patients receiving high total doses of opioids, higher daily doses did seem to confer additional risk. Second, hospitalization is only 1 measure of risk, and multiple prior studies and a recent systematic review have concluded that higher opioid doses are strongly associated with adverse events, including overdose, abuse, addiction, motor vehicle accidents, and myocardial infarction.[8] Last, their finding that total dose more strongly predicts hospitalization than daily dose may reflect confounding by indication and underlying patient characteristics not captured in their analysis. Patients receiving a daily dose of 100 mg or more, but with a total dose of 1830 mg over 6 months, would necessarily have received opioids for a relatively brief period of time (20 days). The indications forand patients receivingsuch short‐course, high‐dose therapy are likely to be vastly different from those for longer‐course, high‐dose therapy, in ways that could be meaningfully associated with hospitalization risk. Nonetheless, their results suggest that cumulative exposure is important as an additional metric by which to predict possible adverse consequences of opioid use.
That cumulative exposure and percent of time on opioids are associated with increased risk of subsequent hospitalization casts further doubt on the already questionable risk‐to‐benefit ratio of long‐term use of opioids for noncancer pain. A recent systematic review of the effectiveness and risks of long‐term opioid therapy for chronic pain found existing evidence insufficient to determine effectiveness for chronic pain and function, owing to lack of a single study evaluating long‐term outcomes in patients on opioid therapy versus no opioid therapy, and found evidence for a dose‐dependent risk for serious harms.[8] The authors conclude that the lack of scientific evidence on effectiveness of long‐term opioid therapy for chronic pain is in striking contrast to its widespread use in this setting. Studies examining the effect of long‐term opioid therapy on pain and function, and defining patient subgroups that may benefit from such therapy, are imperative and long overdue.
In the absence of data showing benefit, and in the face of a growing body of evidence demonstrating harm, we are obligated to reevaluate opioid prescribing for chronic noncancer pain. Until studies have evaluated the impact of opioid use on long‐term outcomes, physicians are missing a key piece of the risk‐benefit calculation, and prescribing must be done judiciously. Curbing the opioid epidemic will require initiatives of epidemic proportions, involving the entire spectrum of healthcare, from the primary care setting to the emergency department (where up to 25% of patients with chronic pain receive their opioids[7]), from researchers to policy makers, and ultimately from patient expectations to physician decision making.
Disclosures
Dr. Herzig was funded by grant number K23AG042459 from the National Institute on Aging. The funding organization had no involvement in any aspect of the study, including design, conduct, and reporting of the study. The author reports no conflicts of interest.
- Vital signs: overdoses of prescription opioid pain relievers—United States, 1999—2008. MMWR Morb Mortal Wkly Rep. 2011;60:1487–1492.
- , , , et al. Trends in long‐term opioid therapy for chronic non‐cancer pain. Pharmacoepidemiol Drug Saf. 2009;18:1166–1175.
- CDC grand rounds: prescription drug overdoses—a U.S. epidemic. MMWR Morb Mortal Wkly Rep. 2012;61:10–13.
- . A flood of opioids, a rising tide of deaths. N Engl J Med. 2010;363:1981–1985.
- , , , , , . Co‐morbidity and utilization of medical services by pain patients receiving opioid medications: data from an insurance claims database. Pain. 2009;144:20–27.
- , . National cohort study of opioid analgesic dose and risk of future hospitalization. J Hosp Med. 2015;10:000–000.
- , , , et al. National institutes of health pathways to prevention workshop: the role of opioids in the treatment of chronic pain. Ann Intern Med. 2015;162:295–300.
- , , , et al. The effectiveness and risks of long‐term opioid therapy for chronic pain: a systematic review for a national institutes of health pathways to prevention workshop. Ann Intern Med. 2015;162:276–286.
Overall rates of opioid use and chronic use for noncancer pain have increased markedly in the last 1 to 2 decades.[1, 2] Recognition of such rapidly increasing use has prompted a flurry of investigations examining the impact of what has been referred to as the opioid epidemic.[1, 3, 4] Patients receiving chronic opioid analgesics have previously been demonstrated to consume disproportionate shares of healthcare resources, including significantly more emergency room visits and days in the hospital.[5] In this issue of the Journal of Hospital Medicine, Liang and Turner[6] further demonstrate the impressive scope of healthcare resources consumed by this patient population, and extend these findings by examining the relationship between opioid dose and subsequent hospitalization in a large national cohort of middle‐aged health maintenance organization enrollees with noncancer pain. This is the first study to investigate the relationship in a general cohort of patients.
Perhaps the most striking finding of the study was an all‐cause hospitalization rate of 1120 per 10,000 person‐years among their cohort of opioid users. Considering that 5 to 8 million Americans use long‐term opioids,[7] this translates to about 500,000 to 900,000 admissions per year. The degree to which opioids themselves contribute to such hospitalizations (attributable risk) is uncertain, and it is likely that some of this risk can be explained by the idea that opioids are a marker for comorbidity, and that the conditions prompting opioid use independently increase risk of hospitalization. Studies examining more homogeneous patient populations could serve to shed light on this question. The issue of attributable risk notwithstanding, it is clear that this is a patient population that should have the attention of physicians, hospital administrators, and policy makers.
The main finding of their study is that the total opioid dose in any given 6‐month interval was more strongly associated with subsequent all‐cause hospitalization than the daily dose. This suggests that cumulative exposure is important, and possibly more important than the strength of any given prescription, at least when it comes to the outcome of hospitalization. That is not to say that the daily dose is unimportant, and the authors appropriately caution against such an interpretation. Daily dose matters, and to conclude otherwise would be incorrect for several reasons. First, among patients receiving high total doses of opioids, higher daily doses did seem to confer additional risk. Second, hospitalization is only 1 measure of risk, and multiple prior studies and a recent systematic review have concluded that higher opioid doses are strongly associated with adverse events, including overdose, abuse, addiction, motor vehicle accidents, and myocardial infarction.[8] Last, their finding that total dose more strongly predicts hospitalization than daily dose may reflect confounding by indication and underlying patient characteristics not captured in their analysis. Patients receiving a daily dose of 100 mg or more, but with a total dose of 1830 mg over 6 months, would necessarily have received opioids for a relatively brief period of time (20 days). The indications forand patients receivingsuch short‐course, high‐dose therapy are likely to be vastly different from those for longer‐course, high‐dose therapy, in ways that could be meaningfully associated with hospitalization risk. Nonetheless, their results suggest that cumulative exposure is important as an additional metric by which to predict possible adverse consequences of opioid use.
That cumulative exposure and percent of time on opioids are associated with increased risk of subsequent hospitalization casts further doubt on the already questionable risk‐to‐benefit ratio of long‐term use of opioids for noncancer pain. A recent systematic review of the effectiveness and risks of long‐term opioid therapy for chronic pain found existing evidence insufficient to determine effectiveness for chronic pain and function, owing to lack of a single study evaluating long‐term outcomes in patients on opioid therapy versus no opioid therapy, and found evidence for a dose‐dependent risk for serious harms.[8] The authors conclude that the lack of scientific evidence on effectiveness of long‐term opioid therapy for chronic pain is in striking contrast to its widespread use in this setting. Studies examining the effect of long‐term opioid therapy on pain and function, and defining patient subgroups that may benefit from such therapy, are imperative and long overdue.
In the absence of data showing benefit, and in the face of a growing body of evidence demonstrating harm, we are obligated to reevaluate opioid prescribing for chronic noncancer pain. Until studies have evaluated the impact of opioid use on long‐term outcomes, physicians are missing a key piece of the risk‐benefit calculation, and prescribing must be done judiciously. Curbing the opioid epidemic will require initiatives of epidemic proportions, involving the entire spectrum of healthcare, from the primary care setting to the emergency department (where up to 25% of patients with chronic pain receive their opioids[7]), from researchers to policy makers, and ultimately from patient expectations to physician decision making.
Disclosures
Dr. Herzig was funded by grant number K23AG042459 from the National Institute on Aging. The funding organization had no involvement in any aspect of the study, including design, conduct, and reporting of the study. The author reports no conflicts of interest.
- Vital signs: overdoses of prescription opioid pain relievers—United States, 1999—2008. MMWR Morb Mortal Wkly Rep. 2011;60:1487–1492.
- , , , et al. Trends in long‐term opioid therapy for chronic non‐cancer pain. Pharmacoepidemiol Drug Saf. 2009;18:1166–1175.
- CDC grand rounds: prescription drug overdoses—a U.S. epidemic. MMWR Morb Mortal Wkly Rep. 2012;61:10–13.
- . A flood of opioids, a rising tide of deaths. N Engl J Med. 2010;363:1981–1985.
- , , , , , . Co‐morbidity and utilization of medical services by pain patients receiving opioid medications: data from an insurance claims database. Pain. 2009;144:20–27.
- , . National cohort study of opioid analgesic dose and risk of future hospitalization. J Hosp Med. 2015;10:000–000.
- , , , et al. National institutes of health pathways to prevention workshop: the role of opioids in the treatment of chronic pain. Ann Intern Med. 2015;162:295–300.
- , , , et al. The effectiveness and risks of long‐term opioid therapy for chronic pain: a systematic review for a national institutes of health pathways to prevention workshop. Ann Intern Med. 2015;162:276–286.