User login
ICD-10 update
When I last wrote about the International Classification of Diseases, 10th Revision (ICD-10) – last year, at about this time – the switchover was scheduled to take place on Oct. 1. Shortly thereafter, of course, Congress decided to delay the inevitable for 1 year. While the House Energy and Commerce Committee has hinted at the possibility of further postponements, we must all assume, until we hear otherwise, that the day of reckoning will arrive as scheduled. You will need to be ready if you expect to be paid come October.
Remember, on Sept. 30 you will be using ICD-9 codes, and the next day you will have to begin using ICD-10. There is no transition period; all ICD-9–coded claims will be rejected from Oct. 1 forward, and no ICD-10 codes can be used before that date. Failure to prepare will be an unmitigated disaster for your practice’s cash flow.
First, decide which parts of your coding and billing systems – and EHR, if you have one – need to be upgraded, how you will do it, and what it will cost. Then, you must get familiar with the new system.
Coders and billers will need the most training on the new methodology, but physicians and other providers must also learn how the new codes are different from the old ones. In general, most differences are in specificity and level of documentation (left/right, acute/chronic, etc.), but there are new codes as well.
I suggest you start by identifying your most-used 20 or 30 diagnosis codes, and then study in detail the differences between the ICD-9 and ICD-10 versions of them. Once you have mastered those, you can go on to other, less-used codes. Take as much time as you need to do this: Remember, everything changes abruptly on Oct. 1, and you will have to get it right the first time.
Be sure to cross-train your coders and other staff members. If a crucial employee quits in the middle of September, you don’t want to have to start from square one. Also, ask your employees to plan their vacations well in advance – and not during the last 3 months of the year. That goes for you, too. This will not be a good time for you to be away, or for the office to run short-staffed.
Next, I suggest you contact all of your third-party payers, billing services, and clearinghouses. Be aggressive; ask them how, exactly, they are preparing for the changeover, and stay in continuous contact with them. Unfortunately, many of these organizations are as behind as most medical practices in their preparations.
Many payers and clearinghouses (including the Centers for Medicare & Medicaid Services) are staging test runs during which you can submit practice claims using the new system. Payers will determine whether your ICD-10 code is in the right place and in the right format; whether the code you used is appropriate; and whether the claim would have been accepted, rejected, or held pending additional information. You will need to do this for each payer, because each will have different coding policies. Many of those policies have not yet been released, and, in some cases, have not even been developed.
You can register for CMS testing sessions through your local Medicare Administrative Contractor (MAC) website. Use the sessions to test your internal system as well, to ensure that everything works smoothly from the time you code a claim until payment is received. Select commonly used ICD-9 claims and practice coding them in ICD-10. The American Academy of Dermatology offers an assortment of training aids at its website, aad.org.
Even the best-laid plans can go awry, however, so it would be prudent to put aside a cash reserve or secure a line of credit to cover expenses during the first few months of the transition, in case the payment machinery falters and large numbers of claims go unpaid. For the same reason, consider postponing major capital investments until early 2016.
You may have heard that ICD-10 is only a transition system; that ICD-11 will be following closely on its heels. I doubt it. In all probability, we will be using ICD-10 a lot longer than CMS originally planned. Besides, ICD-11 is essentially a refinement of ICD-10, not the significant departure that the 10th revision is over the 9th.
Dr. Eastern practices dermatology and dermatologic surgery in Belleville, N.J. He is the author of numerous articles and textbook chapters, and is a longtime monthly columnist for Dermatology News.
When I last wrote about the International Classification of Diseases, 10th Revision (ICD-10) – last year, at about this time – the switchover was scheduled to take place on Oct. 1. Shortly thereafter, of course, Congress decided to delay the inevitable for 1 year. While the House Energy and Commerce Committee has hinted at the possibility of further postponements, we must all assume, until we hear otherwise, that the day of reckoning will arrive as scheduled. You will need to be ready if you expect to be paid come October.
Remember, on Sept. 30 you will be using ICD-9 codes, and the next day you will have to begin using ICD-10. There is no transition period; all ICD-9–coded claims will be rejected from Oct. 1 forward, and no ICD-10 codes can be used before that date. Failure to prepare will be an unmitigated disaster for your practice’s cash flow.
First, decide which parts of your coding and billing systems – and EHR, if you have one – need to be upgraded, how you will do it, and what it will cost. Then, you must get familiar with the new system.
Coders and billers will need the most training on the new methodology, but physicians and other providers must also learn how the new codes are different from the old ones. In general, most differences are in specificity and level of documentation (left/right, acute/chronic, etc.), but there are new codes as well.
I suggest you start by identifying your most-used 20 or 30 diagnosis codes, and then study in detail the differences between the ICD-9 and ICD-10 versions of them. Once you have mastered those, you can go on to other, less-used codes. Take as much time as you need to do this: Remember, everything changes abruptly on Oct. 1, and you will have to get it right the first time.
Be sure to cross-train your coders and other staff members. If a crucial employee quits in the middle of September, you don’t want to have to start from square one. Also, ask your employees to plan their vacations well in advance – and not during the last 3 months of the year. That goes for you, too. This will not be a good time for you to be away, or for the office to run short-staffed.
Next, I suggest you contact all of your third-party payers, billing services, and clearinghouses. Be aggressive; ask them how, exactly, they are preparing for the changeover, and stay in continuous contact with them. Unfortunately, many of these organizations are as behind as most medical practices in their preparations.
Many payers and clearinghouses (including the Centers for Medicare & Medicaid Services) are staging test runs during which you can submit practice claims using the new system. Payers will determine whether your ICD-10 code is in the right place and in the right format; whether the code you used is appropriate; and whether the claim would have been accepted, rejected, or held pending additional information. You will need to do this for each payer, because each will have different coding policies. Many of those policies have not yet been released, and, in some cases, have not even been developed.
You can register for CMS testing sessions through your local Medicare Administrative Contractor (MAC) website. Use the sessions to test your internal system as well, to ensure that everything works smoothly from the time you code a claim until payment is received. Select commonly used ICD-9 claims and practice coding them in ICD-10. The American Academy of Dermatology offers an assortment of training aids at its website, aad.org.
Even the best-laid plans can go awry, however, so it would be prudent to put aside a cash reserve or secure a line of credit to cover expenses during the first few months of the transition, in case the payment machinery falters and large numbers of claims go unpaid. For the same reason, consider postponing major capital investments until early 2016.
You may have heard that ICD-10 is only a transition system; that ICD-11 will be following closely on its heels. I doubt it. In all probability, we will be using ICD-10 a lot longer than CMS originally planned. Besides, ICD-11 is essentially a refinement of ICD-10, not the significant departure that the 10th revision is over the 9th.
Dr. Eastern practices dermatology and dermatologic surgery in Belleville, N.J. He is the author of numerous articles and textbook chapters, and is a longtime monthly columnist for Dermatology News.
When I last wrote about the International Classification of Diseases, 10th Revision (ICD-10) – last year, at about this time – the switchover was scheduled to take place on Oct. 1. Shortly thereafter, of course, Congress decided to delay the inevitable for 1 year. While the House Energy and Commerce Committee has hinted at the possibility of further postponements, we must all assume, until we hear otherwise, that the day of reckoning will arrive as scheduled. You will need to be ready if you expect to be paid come October.
Remember, on Sept. 30 you will be using ICD-9 codes, and the next day you will have to begin using ICD-10. There is no transition period; all ICD-9–coded claims will be rejected from Oct. 1 forward, and no ICD-10 codes can be used before that date. Failure to prepare will be an unmitigated disaster for your practice’s cash flow.
First, decide which parts of your coding and billing systems – and EHR, if you have one – need to be upgraded, how you will do it, and what it will cost. Then, you must get familiar with the new system.
Coders and billers will need the most training on the new methodology, but physicians and other providers must also learn how the new codes are different from the old ones. In general, most differences are in specificity and level of documentation (left/right, acute/chronic, etc.), but there are new codes as well.
I suggest you start by identifying your most-used 20 or 30 diagnosis codes, and then study in detail the differences between the ICD-9 and ICD-10 versions of them. Once you have mastered those, you can go on to other, less-used codes. Take as much time as you need to do this: Remember, everything changes abruptly on Oct. 1, and you will have to get it right the first time.
Be sure to cross-train your coders and other staff members. If a crucial employee quits in the middle of September, you don’t want to have to start from square one. Also, ask your employees to plan their vacations well in advance – and not during the last 3 months of the year. That goes for you, too. This will not be a good time for you to be away, or for the office to run short-staffed.
Next, I suggest you contact all of your third-party payers, billing services, and clearinghouses. Be aggressive; ask them how, exactly, they are preparing for the changeover, and stay in continuous contact with them. Unfortunately, many of these organizations are as behind as most medical practices in their preparations.
Many payers and clearinghouses (including the Centers for Medicare & Medicaid Services) are staging test runs during which you can submit practice claims using the new system. Payers will determine whether your ICD-10 code is in the right place and in the right format; whether the code you used is appropriate; and whether the claim would have been accepted, rejected, or held pending additional information. You will need to do this for each payer, because each will have different coding policies. Many of those policies have not yet been released, and, in some cases, have not even been developed.
You can register for CMS testing sessions through your local Medicare Administrative Contractor (MAC) website. Use the sessions to test your internal system as well, to ensure that everything works smoothly from the time you code a claim until payment is received. Select commonly used ICD-9 claims and practice coding them in ICD-10. The American Academy of Dermatology offers an assortment of training aids at its website, aad.org.
Even the best-laid plans can go awry, however, so it would be prudent to put aside a cash reserve or secure a line of credit to cover expenses during the first few months of the transition, in case the payment machinery falters and large numbers of claims go unpaid. For the same reason, consider postponing major capital investments until early 2016.
You may have heard that ICD-10 is only a transition system; that ICD-11 will be following closely on its heels. I doubt it. In all probability, we will be using ICD-10 a lot longer than CMS originally planned. Besides, ICD-11 is essentially a refinement of ICD-10, not the significant departure that the 10th revision is over the 9th.
Dr. Eastern practices dermatology and dermatologic surgery in Belleville, N.J. He is the author of numerous articles and textbook chapters, and is a longtime monthly columnist for Dermatology News.

Pharmacists can improve anticoagulant adherence

Photo by Rhoda Baer
Pharmacists can greatly improve patients’ adherence to the anticoagulant dabigatran, according to a study published in JAMA.
When patients with atrial fibrillation had their dabigatran prescriptions filled by pharmacists who educated them about the drug and monitored them on a regular basis, these individuals were 80% more likely to adhere to medication guidelines than patients who didn’t receive this kind of support.
“Although pharmacist-led management of [dabigatran and other new oral anticoagulants] is uncommon in the US, the findings make the case that it is still important and can ultimately impact clinical outcomes,” said study author Mintu Turakhia, MD, of Stanford University School of Medicine in California.
Previous studies had suggested that some patients were not adhering well to treatment guidelines for dabigatran. So Dr Turakhia and his colleagues set out to determine if this lack of adherence could be explained by where patients were filling their prescriptions.
The team looked at Veterans Health Administration sites where 20 or more outpatients had dabigatran prescriptions filled between 2010 and 2012.
“Surprisingly, we found that treatment adherence varied not by individual, but by site,” Dr Turakhia said. “We didn’t expect to see that much variation by site.”
So the researchers conducted in-depth telephone interviews with the managers, usually pharmacists, at 41 of these sites.
“We rolled up our sleeves and looked at what each site was doing,” Dr Turakhia said.
At the sites with the highest patient adherence, there was usually a pharmacist actively educating patients on medication adherence, reviewing any possible drug interactions, and following up to make sure patients were taking the medication when they were supposed to and that prescriptions were being refilled on time.
The sites with patients who had the highest adherence levels had some key features in common, among them this type of “pharmacist-led patient management.”
“We determined there was a high level of scrutiny and review to make sure patients were getting the drugs,” Dr Turakhia said. “There was a lot of consideration of the dose, interaction with chronic kidney disease, and review to make sure that patients should be getting these drugs.”
These results suggest an unintended side effect of atrial fibrillation patients switching from warfarin to dabigatran or other new oral anticoagulants may be poorer adherence to medication guidelines because most patients no longer make routine visits to a lab for monitoring.
“This finding challenges the entire framework of healthcare delivery of these new agents,” Dr Turakhia said. “These medicines were pitched as easier for patients and for healthcare providers.”
Since patients on new oral anticoagulants are no longer required to visit labs regularly, in most cases, the physician and/or practice nurses are responsible for checking on adherence. And most doctors’ offices don’t have a system in place to verify how well patients take their medication or get patients their refills promptly before medications run out.
“We’re suggesting that greater structured management of these patients, beyond the doctor just prescribing medications for them, is a good idea,” Dr Turakhia said. “Extra support, like that provided in the VA anticoagulation clinics with supportive pharmacist care, greatly improves medication adherence.” 
Photo by Rhoda Baer
Pharmacists can greatly improve patients’ adherence to the anticoagulant dabigatran, according to a study published in JAMA.
When patients with atrial fibrillation had their dabigatran prescriptions filled by pharmacists who educated them about the drug and monitored them on a regular basis, these individuals were 80% more likely to adhere to medication guidelines than patients who didn’t receive this kind of support.
“Although pharmacist-led management of [dabigatran and other new oral anticoagulants] is uncommon in the US, the findings make the case that it is still important and can ultimately impact clinical outcomes,” said study author Mintu Turakhia, MD, of Stanford University School of Medicine in California.
Previous studies had suggested that some patients were not adhering well to treatment guidelines for dabigatran. So Dr Turakhia and his colleagues set out to determine if this lack of adherence could be explained by where patients were filling their prescriptions.
The team looked at Veterans Health Administration sites where 20 or more outpatients had dabigatran prescriptions filled between 2010 and 2012.
“Surprisingly, we found that treatment adherence varied not by individual, but by site,” Dr Turakhia said. “We didn’t expect to see that much variation by site.”
So the researchers conducted in-depth telephone interviews with the managers, usually pharmacists, at 41 of these sites.
“We rolled up our sleeves and looked at what each site was doing,” Dr Turakhia said.
At the sites with the highest patient adherence, there was usually a pharmacist actively educating patients on medication adherence, reviewing any possible drug interactions, and following up to make sure patients were taking the medication when they were supposed to and that prescriptions were being refilled on time.
The sites with patients who had the highest adherence levels had some key features in common, among them this type of “pharmacist-led patient management.”
“We determined there was a high level of scrutiny and review to make sure patients were getting the drugs,” Dr Turakhia said. “There was a lot of consideration of the dose, interaction with chronic kidney disease, and review to make sure that patients should be getting these drugs.”
These results suggest an unintended side effect of atrial fibrillation patients switching from warfarin to dabigatran or other new oral anticoagulants may be poorer adherence to medication guidelines because most patients no longer make routine visits to a lab for monitoring.
“This finding challenges the entire framework of healthcare delivery of these new agents,” Dr Turakhia said. “These medicines were pitched as easier for patients and for healthcare providers.”
Since patients on new oral anticoagulants are no longer required to visit labs regularly, in most cases, the physician and/or practice nurses are responsible for checking on adherence. And most doctors’ offices don’t have a system in place to verify how well patients take their medication or get patients their refills promptly before medications run out.
“We’re suggesting that greater structured management of these patients, beyond the doctor just prescribing medications for them, is a good idea,” Dr Turakhia said. “Extra support, like that provided in the VA anticoagulation clinics with supportive pharmacist care, greatly improves medication adherence.”
Photo by Rhoda Baer
Pharmacists can greatly improve patients’ adherence to the anticoagulant dabigatran, according to a study published in JAMA.
When patients with atrial fibrillation had their dabigatran prescriptions filled by pharmacists who educated them about the drug and monitored them on a regular basis, these individuals were 80% more likely to adhere to medication guidelines than patients who didn’t receive this kind of support.
“Although pharmacist-led management of [dabigatran and other new oral anticoagulants] is uncommon in the US, the findings make the case that it is still important and can ultimately impact clinical outcomes,” said study author Mintu Turakhia, MD, of Stanford University School of Medicine in California.
Previous studies had suggested that some patients were not adhering well to treatment guidelines for dabigatran. So Dr Turakhia and his colleagues set out to determine if this lack of adherence could be explained by where patients were filling their prescriptions.
The team looked at Veterans Health Administration sites where 20 or more outpatients had dabigatran prescriptions filled between 2010 and 2012.
“Surprisingly, we found that treatment adherence varied not by individual, but by site,” Dr Turakhia said. “We didn’t expect to see that much variation by site.”
So the researchers conducted in-depth telephone interviews with the managers, usually pharmacists, at 41 of these sites.
“We rolled up our sleeves and looked at what each site was doing,” Dr Turakhia said.
At the sites with the highest patient adherence, there was usually a pharmacist actively educating patients on medication adherence, reviewing any possible drug interactions, and following up to make sure patients were taking the medication when they were supposed to and that prescriptions were being refilled on time.
The sites with patients who had the highest adherence levels had some key features in common, among them this type of “pharmacist-led patient management.”
“We determined there was a high level of scrutiny and review to make sure patients were getting the drugs,” Dr Turakhia said. “There was a lot of consideration of the dose, interaction with chronic kidney disease, and review to make sure that patients should be getting these drugs.”
These results suggest an unintended side effect of atrial fibrillation patients switching from warfarin to dabigatran or other new oral anticoagulants may be poorer adherence to medication guidelines because most patients no longer make routine visits to a lab for monitoring.
“This finding challenges the entire framework of healthcare delivery of these new agents,” Dr Turakhia said. “These medicines were pitched as easier for patients and for healthcare providers.”
Since patients on new oral anticoagulants are no longer required to visit labs regularly, in most cases, the physician and/or practice nurses are responsible for checking on adherence. And most doctors’ offices don’t have a system in place to verify how well patients take their medication or get patients their refills promptly before medications run out.
“We’re suggesting that greater structured management of these patients, beyond the doctor just prescribing medications for them, is a good idea,” Dr Turakhia said. “Extra support, like that provided in the VA anticoagulation clinics with supportive pharmacist care, greatly improves medication adherence.”
Study reveals how ATRA fights APL

Image courtesy of AFIP
New research suggests the vitamin A derivative all-trans retinoic acid (ATRA) inhibits multiple oncogenic pathways and, at the same time, eliminates cancer stem cells by degrading the Pin1 enzyme.
Investigators said this discovery explains how ATRA successfully treats acute promyelocytic leukemia (APL), and it likely has implications for the treatment of other aggressive or drug-resistant cancers.
The team detailed their discovery in Nature Medicine.
“Pin1 changes protein shape through proline-directed phosphorylation, which is a major control mechanism for disease,” said study author Kun Ping Lu, MD, PhD, of Beth Israel Deaconess Medical Center at Harvard Medical School in Boston, Massachusetts.
“Pin1 is a common, key regulator in many types of cancer and, as a result, can control over 50 oncogenes and tumor suppressors, many of which are known to also control cancer stem cells.”
Until now, agents that inhibit Pin1 have been developed mainly through rational drug design. These inhibitors have proven active against Pin1 in the test tube, but, when tested in a cell model or in vivo, they are unable to efficiently enter cells to successfully inhibit Pin1 function.
In this new work, the investigators decided to take a different approach to identify Pin1 inhibitors. They developed a mechanism-based, high-throughput screen to identify compounds that were targeting active Pin1.
“We had previously identified Pin1 substrate-mimicking peptide inhibitors,” said Xiao Zhen Zhou, MD, also of Beth Israel Deaconess Medical Center.
“We therefore used these as a probe in a competition binding assay and screened approximately 8200 chemical compounds, including both approved drugs and other known bioactive compounds.”
To increase screening success, the investigators chose a probe that specifically binds to the Pin1 enzyme active site very tightly, an approach that is not commonly used for this kind of screen.
“Initially, it appeared that the screening results had no positive hits, so we had to manually sift through them looking for the one that would bind to Pin1,” Dr Zhou said. “We eventually spotted cis retinoic acid, which has the same chemical formula as all-trans retinoic acid but with a different chemical structure.”
It turned out that Pin1 prefers binding to ATRA, and cis retinoic acid needs to convert to ATRA in order to bind Pin1.
ATRA in APL and other cancers
ATRA was first discovered for the treatment of APL in 1987. It was originally thought that ATRA was treating APL by inducing cell differentiation, causing cancer cells to change into normal cells by activating the cellular retinoic acid receptors.
But these new findings suggest that is not the mechanism that is actually behind ATRA’s successful outcomes in treating APL.
“While it has been previously shown that ATRA’s ability to degrade the leukemia-causing fusion oncogene PML-RAR causes ATRA to stop the leukemia stem cells that drive APL, the underlying mechanism has remained elusive,” Dr Lu said.
“Our new, high-throughput drug screening has revealed the ATRA drug target, unexpectedly showing that ATRA directly binds, inhibits, and ultimately degrades active Pin1 selectively in cancer cells. The Pin1-ATRA complex structure suggests that ATRA is trapped in the Pin1 active site by mimicking an unreleasable enzyme substrate. Importantly, ATRA-induced Pin1 ablation degrades the fusion oncogene PML-RAR and treats APL in cell and animal models as well as in human patients.”
The investigators discovered that ATRA-induced Pin1 ablation inhibits triple-negative breast cancer growth as well. The drug proved active in human cells and in animal models, simultaneously turning off many oncogenes and turning on many tumor suppressors.
The team said these results provide a rationale for trying to extend ATRA’s half-life and for developing more potent, Pin1-targeted ATRA variants for cancer treatment.
“The current ATRA drug has a very short half-life of only 45 minutes in humans,” Dr Lu said. “We think that a more potent Pin1 inhibitor will be able to target many ‘dream targets’ that are not currently druggable.”
“ATRA appears to be well tolerated, with minimal side effects, and offers a promising new approach for targeting a Pin1-dependent, common oncogenic mechanism in numerous cancer-driving pathways in cancer and cancer stem cells. This is especially critical for treating aggressive or drug-resistant cancers.”
Image courtesy of AFIP
New research suggests the vitamin A derivative all-trans retinoic acid (ATRA) inhibits multiple oncogenic pathways and, at the same time, eliminates cancer stem cells by degrading the Pin1 enzyme.
Investigators said this discovery explains how ATRA successfully treats acute promyelocytic leukemia (APL), and it likely has implications for the treatment of other aggressive or drug-resistant cancers.
The team detailed their discovery in Nature Medicine.
“Pin1 changes protein shape through proline-directed phosphorylation, which is a major control mechanism for disease,” said study author Kun Ping Lu, MD, PhD, of Beth Israel Deaconess Medical Center at Harvard Medical School in Boston, Massachusetts.
“Pin1 is a common, key regulator in many types of cancer and, as a result, can control over 50 oncogenes and tumor suppressors, many of which are known to also control cancer stem cells.”
Until now, agents that inhibit Pin1 have been developed mainly through rational drug design. These inhibitors have proven active against Pin1 in the test tube, but, when tested in a cell model or in vivo, they are unable to efficiently enter cells to successfully inhibit Pin1 function.
In this new work, the investigators decided to take a different approach to identify Pin1 inhibitors. They developed a mechanism-based, high-throughput screen to identify compounds that were targeting active Pin1.
“We had previously identified Pin1 substrate-mimicking peptide inhibitors,” said Xiao Zhen Zhou, MD, also of Beth Israel Deaconess Medical Center.
“We therefore used these as a probe in a competition binding assay and screened approximately 8200 chemical compounds, including both approved drugs and other known bioactive compounds.”
To increase screening success, the investigators chose a probe that specifically binds to the Pin1 enzyme active site very tightly, an approach that is not commonly used for this kind of screen.
“Initially, it appeared that the screening results had no positive hits, so we had to manually sift through them looking for the one that would bind to Pin1,” Dr Zhou said. “We eventually spotted cis retinoic acid, which has the same chemical formula as all-trans retinoic acid but with a different chemical structure.”
It turned out that Pin1 prefers binding to ATRA, and cis retinoic acid needs to convert to ATRA in order to bind Pin1.
ATRA in APL and other cancers
ATRA was first discovered for the treatment of APL in 1987. It was originally thought that ATRA was treating APL by inducing cell differentiation, causing cancer cells to change into normal cells by activating the cellular retinoic acid receptors.
But these new findings suggest that is not the mechanism that is actually behind ATRA’s successful outcomes in treating APL.
“While it has been previously shown that ATRA’s ability to degrade the leukemia-causing fusion oncogene PML-RAR causes ATRA to stop the leukemia stem cells that drive APL, the underlying mechanism has remained elusive,” Dr Lu said.
“Our new, high-throughput drug screening has revealed the ATRA drug target, unexpectedly showing that ATRA directly binds, inhibits, and ultimately degrades active Pin1 selectively in cancer cells. The Pin1-ATRA complex structure suggests that ATRA is trapped in the Pin1 active site by mimicking an unreleasable enzyme substrate. Importantly, ATRA-induced Pin1 ablation degrades the fusion oncogene PML-RAR and treats APL in cell and animal models as well as in human patients.”
The investigators discovered that ATRA-induced Pin1 ablation inhibits triple-negative breast cancer growth as well. The drug proved active in human cells and in animal models, simultaneously turning off many oncogenes and turning on many tumor suppressors.
The team said these results provide a rationale for trying to extend ATRA’s half-life and for developing more potent, Pin1-targeted ATRA variants for cancer treatment.
“The current ATRA drug has a very short half-life of only 45 minutes in humans,” Dr Lu said. “We think that a more potent Pin1 inhibitor will be able to target many ‘dream targets’ that are not currently druggable.”
“ATRA appears to be well tolerated, with minimal side effects, and offers a promising new approach for targeting a Pin1-dependent, common oncogenic mechanism in numerous cancer-driving pathways in cancer and cancer stem cells. This is especially critical for treating aggressive or drug-resistant cancers.”
Image courtesy of AFIP
New research suggests the vitamin A derivative all-trans retinoic acid (ATRA) inhibits multiple oncogenic pathways and, at the same time, eliminates cancer stem cells by degrading the Pin1 enzyme.
Investigators said this discovery explains how ATRA successfully treats acute promyelocytic leukemia (APL), and it likely has implications for the treatment of other aggressive or drug-resistant cancers.
The team detailed their discovery in Nature Medicine.
“Pin1 changes protein shape through proline-directed phosphorylation, which is a major control mechanism for disease,” said study author Kun Ping Lu, MD, PhD, of Beth Israel Deaconess Medical Center at Harvard Medical School in Boston, Massachusetts.
“Pin1 is a common, key regulator in many types of cancer and, as a result, can control over 50 oncogenes and tumor suppressors, many of which are known to also control cancer stem cells.”
Until now, agents that inhibit Pin1 have been developed mainly through rational drug design. These inhibitors have proven active against Pin1 in the test tube, but, when tested in a cell model or in vivo, they are unable to efficiently enter cells to successfully inhibit Pin1 function.
In this new work, the investigators decided to take a different approach to identify Pin1 inhibitors. They developed a mechanism-based, high-throughput screen to identify compounds that were targeting active Pin1.
“We had previously identified Pin1 substrate-mimicking peptide inhibitors,” said Xiao Zhen Zhou, MD, also of Beth Israel Deaconess Medical Center.
“We therefore used these as a probe in a competition binding assay and screened approximately 8200 chemical compounds, including both approved drugs and other known bioactive compounds.”
To increase screening success, the investigators chose a probe that specifically binds to the Pin1 enzyme active site very tightly, an approach that is not commonly used for this kind of screen.
“Initially, it appeared that the screening results had no positive hits, so we had to manually sift through them looking for the one that would bind to Pin1,” Dr Zhou said. “We eventually spotted cis retinoic acid, which has the same chemical formula as all-trans retinoic acid but with a different chemical structure.”
It turned out that Pin1 prefers binding to ATRA, and cis retinoic acid needs to convert to ATRA in order to bind Pin1.
ATRA in APL and other cancers
ATRA was first discovered for the treatment of APL in 1987. It was originally thought that ATRA was treating APL by inducing cell differentiation, causing cancer cells to change into normal cells by activating the cellular retinoic acid receptors.
But these new findings suggest that is not the mechanism that is actually behind ATRA’s successful outcomes in treating APL.
“While it has been previously shown that ATRA’s ability to degrade the leukemia-causing fusion oncogene PML-RAR causes ATRA to stop the leukemia stem cells that drive APL, the underlying mechanism has remained elusive,” Dr Lu said.
“Our new, high-throughput drug screening has revealed the ATRA drug target, unexpectedly showing that ATRA directly binds, inhibits, and ultimately degrades active Pin1 selectively in cancer cells. The Pin1-ATRA complex structure suggests that ATRA is trapped in the Pin1 active site by mimicking an unreleasable enzyme substrate. Importantly, ATRA-induced Pin1 ablation degrades the fusion oncogene PML-RAR and treats APL in cell and animal models as well as in human patients.”
The investigators discovered that ATRA-induced Pin1 ablation inhibits triple-negative breast cancer growth as well. The drug proved active in human cells and in animal models, simultaneously turning off many oncogenes and turning on many tumor suppressors.
The team said these results provide a rationale for trying to extend ATRA’s half-life and for developing more potent, Pin1-targeted ATRA variants for cancer treatment.
“The current ATRA drug has a very short half-life of only 45 minutes in humans,” Dr Lu said. “We think that a more potent Pin1 inhibitor will be able to target many ‘dream targets’ that are not currently druggable.”
“ATRA appears to be well tolerated, with minimal side effects, and offers a promising new approach for targeting a Pin1-dependent, common oncogenic mechanism in numerous cancer-driving pathways in cancer and cancer stem cells. This is especially critical for treating aggressive or drug-resistant cancers.”
Data breaches of health information on the rise

Photo courtesy of NIH
A new study suggests data breaches of protected health information are on the rise in the US.
Researchers found that, between 2010 and 2013, there were data breaches affecting approximately 29 million records of health information covered
under the Health Insurance Portability and Accountability Act (HIPAA).
Breaches were reported in every state, tended to occur via electronic media, and largely resulted from overt criminal activity.
Vincent Liu, MD, of the Kaiser Permanente Division of Research in Oakland, California, and his colleagues published these findings in JAMA.
The researchers evaluated an online database maintained by the US Department of Health and Human Services that describes data breaches of unencrypted, protected health information (ie, individually identifiable information) reported by entities (health plans and clinicians) covered under HIPAA.
The team included breaches affecting 500 individuals or more that were reported as occurring from 2010 through 2013, accounting for 82% of all reports.
The research revealed 949 breaches affecting 29.1 million records. Six breaches involved more than 1 million records each.
The number of reported breaches increased over time, from 214 in 2010 to 265 in 2013.
Breaches were reported in every state, the District of Columbia, and Puerto Rico. Five states (California, Texas, Florida, New York, and Illinois) accounted for 34% of all breaches. However, when adjusted by population estimates, the states with the highest adjusted number of breaches and affected records varied.
Most breaches occurred via electronic media (67%), frequently involving laptop computers or portable electronic devices (33%). Most breaches also occurred via theft (58%).
The combined frequency of breaches resulting from hacking and unauthorized access or disclosure increased during the study period, from 12% in 2010 to 27% in 2013. Breaches involved external vendors in 29% of reports.
The researchers noted that this study was limited to breaches that were already recognized, reported, and affected at least 500 individuals. Therefore, the team likely underestimated the true number of healthcare data breaches occurring in the US each year.
Photo courtesy of NIH
A new study suggests data breaches of protected health information are on the rise in the US.
Researchers found that, between 2010 and 2013, there were data breaches affecting approximately 29 million records of health information covered
under the Health Insurance Portability and Accountability Act (HIPAA).
Breaches were reported in every state, tended to occur via electronic media, and largely resulted from overt criminal activity.
Vincent Liu, MD, of the Kaiser Permanente Division of Research in Oakland, California, and his colleagues published these findings in JAMA.
The researchers evaluated an online database maintained by the US Department of Health and Human Services that describes data breaches of unencrypted, protected health information (ie, individually identifiable information) reported by entities (health plans and clinicians) covered under HIPAA.
The team included breaches affecting 500 individuals or more that were reported as occurring from 2010 through 2013, accounting for 82% of all reports.
The research revealed 949 breaches affecting 29.1 million records. Six breaches involved more than 1 million records each.
The number of reported breaches increased over time, from 214 in 2010 to 265 in 2013.
Breaches were reported in every state, the District of Columbia, and Puerto Rico. Five states (California, Texas, Florida, New York, and Illinois) accounted for 34% of all breaches. However, when adjusted by population estimates, the states with the highest adjusted number of breaches and affected records varied.
Most breaches occurred via electronic media (67%), frequently involving laptop computers or portable electronic devices (33%). Most breaches also occurred via theft (58%).
The combined frequency of breaches resulting from hacking and unauthorized access or disclosure increased during the study period, from 12% in 2010 to 27% in 2013. Breaches involved external vendors in 29% of reports.
The researchers noted that this study was limited to breaches that were already recognized, reported, and affected at least 500 individuals. Therefore, the team likely underestimated the true number of healthcare data breaches occurring in the US each year.
Photo courtesy of NIH
A new study suggests data breaches of protected health information are on the rise in the US.
Researchers found that, between 2010 and 2013, there were data breaches affecting approximately 29 million records of health information covered
under the Health Insurance Portability and Accountability Act (HIPAA).
Breaches were reported in every state, tended to occur via electronic media, and largely resulted from overt criminal activity.
Vincent Liu, MD, of the Kaiser Permanente Division of Research in Oakland, California, and his colleagues published these findings in JAMA.
The researchers evaluated an online database maintained by the US Department of Health and Human Services that describes data breaches of unencrypted, protected health information (ie, individually identifiable information) reported by entities (health plans and clinicians) covered under HIPAA.
The team included breaches affecting 500 individuals or more that were reported as occurring from 2010 through 2013, accounting for 82% of all reports.
The research revealed 949 breaches affecting 29.1 million records. Six breaches involved more than 1 million records each.
The number of reported breaches increased over time, from 214 in 2010 to 265 in 2013.
Breaches were reported in every state, the District of Columbia, and Puerto Rico. Five states (California, Texas, Florida, New York, and Illinois) accounted for 34% of all breaches. However, when adjusted by population estimates, the states with the highest adjusted number of breaches and affected records varied.
Most breaches occurred via electronic media (67%), frequently involving laptop computers or portable electronic devices (33%). Most breaches also occurred via theft (58%).
The combined frequency of breaches resulting from hacking and unauthorized access or disclosure increased during the study period, from 12% in 2010 to 27% in 2013. Breaches involved external vendors in 29% of reports.
The researchers noted that this study was limited to breaches that were already recognized, reported, and affected at least 500 individuals. Therefore, the team likely underestimated the true number of healthcare data breaches occurring in the US each year.
System can diagnose lymphoma, other diseases

Photo by Daniel Sone
Scientists say a smartphone-based system could bring rapid, accurate molecular diagnosis of cancers and other diseases to locations lacking the latest medical technology.
In PNAS, the group explained how the digital diffraction diagnosis (D3) system collects detailed microscopic images for digital analysis of the molecular composition of cells and tissues.
In pilot experiments, the system enabled accurate diagnoses of lymphoma and cervical cancer.
“The emerging genomic and biological data for various cancers, which can be essential to choosing the most appropriate therapy, supports the need for molecular profiling strategies that are more accessible to providers, clinical investigators, and patients,” said study author Cesar Castro, MD, of Massachusetts General Hospital in Boston.
“And we believe the platform we have developed provides essential features at an extraordinarily low cost.”
The D3 system features an imaging module with a battery-powered LED light clipped onto a standard smartphone that records high-resolution imaging data with its camera.
With a greater field of view than traditional microscopy, the D3 system is capable of recording data on more than 100,000 cells from a blood or tissue sample in a single image. The data can then be transmitted for analysis to a remote graphic-processing server via a secure, encrypted cloud service, and the results returned to the point of care.
For molecular analysis of tumors, a sample of blood or tissue is labeled with microbeads that bind to known cancer-related molecules and loaded into the D3 imaging module.
After the image is recorded and data transmitted to the server, the presence of specific molecules is detected by analyzing the diffraction patterns generated by the microbeads. The use of variously sized or coated beads may offer unique diffraction signatures to facilitate detection.
A numerical algorithm the researchers developed can distinguish cells from beads and analyze as much as 10 MB of data in less than nine hundredths of a second.
In a pilot test with cancer cell lines, the D3 system detected the presence of tumor proteins with an accuracy matching that of the current gold standard for molecular profiling. And the system’s larger field of view enabled simultaneous analysis of more than 100,000 cells at a time.
The researchers also conducted analyses of cervical biopsy samples from 25 women with abnormal PAP smears—samples collected along with those used for clinical diagnosis—using microbeads tagged with antibodies against 3 published markers of cervical cancer.
Based on the number of antibody-tagged microbeads binding to cells, D3 analysis promptly and reliably categorized biopsy samples as high-risk, low-risk, or benign. Results matched those of conventional pathologic analysis.
In addition, D3 analysis of fine-needle lymph node biopsy samples was accurately able to differentiate 4 patients whose lymphoma diagnosis was confirmed by conventional pathology from another 4 patients with benign lymph node enlargement.
Along with protein analyses, the D3 system was enhanced to successfully detect DNA—in this instance, from human papilloma virus—with great sensitivity.
In all of these tests, results were available in under an hour and at a cost of $1.80 per assay, a price that would be expected to drop with further refinement of the D3 system.
“We expect that the D3 platform will enhance the breadth and depth of cancer screening in a way that is feasible and sustainable for resource limited-settings,” said Ralph Weissleder, MD, PhD, also of Massachusetts General Hospital.
“By taking advantage of the increased penetration of mobile phone technology worldwide, the system should allow the prompt triaging of suspicious or high-risk cases that could help to offset delays caused by limited pathology services in those regions and reduce the need for patients to return for follow-up care, which is often challenging for them.”
The researchers’ next steps are to investigate D3’s ability to analyze protein and DNA markers of other disease catalysts, integrate the software with larger databases, and conduct clinical studies in settings such as care-delivery sites in developing countries or rural areas.
Massachusetts General Hospital has filed a patent application covering the D3 technology.
Photo by Daniel Sone
Scientists say a smartphone-based system could bring rapid, accurate molecular diagnosis of cancers and other diseases to locations lacking the latest medical technology.
In PNAS, the group explained how the digital diffraction diagnosis (D3) system collects detailed microscopic images for digital analysis of the molecular composition of cells and tissues.
In pilot experiments, the system enabled accurate diagnoses of lymphoma and cervical cancer.
“The emerging genomic and biological data for various cancers, which can be essential to choosing the most appropriate therapy, supports the need for molecular profiling strategies that are more accessible to providers, clinical investigators, and patients,” said study author Cesar Castro, MD, of Massachusetts General Hospital in Boston.
“And we believe the platform we have developed provides essential features at an extraordinarily low cost.”
The D3 system features an imaging module with a battery-powered LED light clipped onto a standard smartphone that records high-resolution imaging data with its camera.
With a greater field of view than traditional microscopy, the D3 system is capable of recording data on more than 100,000 cells from a blood or tissue sample in a single image. The data can then be transmitted for analysis to a remote graphic-processing server via a secure, encrypted cloud service, and the results returned to the point of care.
For molecular analysis of tumors, a sample of blood or tissue is labeled with microbeads that bind to known cancer-related molecules and loaded into the D3 imaging module.
After the image is recorded and data transmitted to the server, the presence of specific molecules is detected by analyzing the diffraction patterns generated by the microbeads. The use of variously sized or coated beads may offer unique diffraction signatures to facilitate detection.
A numerical algorithm the researchers developed can distinguish cells from beads and analyze as much as 10 MB of data in less than nine hundredths of a second.
In a pilot test with cancer cell lines, the D3 system detected the presence of tumor proteins with an accuracy matching that of the current gold standard for molecular profiling. And the system’s larger field of view enabled simultaneous analysis of more than 100,000 cells at a time.
The researchers also conducted analyses of cervical biopsy samples from 25 women with abnormal PAP smears—samples collected along with those used for clinical diagnosis—using microbeads tagged with antibodies against 3 published markers of cervical cancer.
Based on the number of antibody-tagged microbeads binding to cells, D3 analysis promptly and reliably categorized biopsy samples as high-risk, low-risk, or benign. Results matched those of conventional pathologic analysis.
In addition, D3 analysis of fine-needle lymph node biopsy samples was accurately able to differentiate 4 patients whose lymphoma diagnosis was confirmed by conventional pathology from another 4 patients with benign lymph node enlargement.
Along with protein analyses, the D3 system was enhanced to successfully detect DNA—in this instance, from human papilloma virus—with great sensitivity.
In all of these tests, results were available in under an hour and at a cost of $1.80 per assay, a price that would be expected to drop with further refinement of the D3 system.
“We expect that the D3 platform will enhance the breadth and depth of cancer screening in a way that is feasible and sustainable for resource limited-settings,” said Ralph Weissleder, MD, PhD, also of Massachusetts General Hospital.
“By taking advantage of the increased penetration of mobile phone technology worldwide, the system should allow the prompt triaging of suspicious or high-risk cases that could help to offset delays caused by limited pathology services in those regions and reduce the need for patients to return for follow-up care, which is often challenging for them.”
The researchers’ next steps are to investigate D3’s ability to analyze protein and DNA markers of other disease catalysts, integrate the software with larger databases, and conduct clinical studies in settings such as care-delivery sites in developing countries or rural areas.
Massachusetts General Hospital has filed a patent application covering the D3 technology.
Photo by Daniel Sone
Scientists say a smartphone-based system could bring rapid, accurate molecular diagnosis of cancers and other diseases to locations lacking the latest medical technology.
In PNAS, the group explained how the digital diffraction diagnosis (D3) system collects detailed microscopic images for digital analysis of the molecular composition of cells and tissues.
In pilot experiments, the system enabled accurate diagnoses of lymphoma and cervical cancer.
“The emerging genomic and biological data for various cancers, which can be essential to choosing the most appropriate therapy, supports the need for molecular profiling strategies that are more accessible to providers, clinical investigators, and patients,” said study author Cesar Castro, MD, of Massachusetts General Hospital in Boston.
“And we believe the platform we have developed provides essential features at an extraordinarily low cost.”
The D3 system features an imaging module with a battery-powered LED light clipped onto a standard smartphone that records high-resolution imaging data with its camera.
With a greater field of view than traditional microscopy, the D3 system is capable of recording data on more than 100,000 cells from a blood or tissue sample in a single image. The data can then be transmitted for analysis to a remote graphic-processing server via a secure, encrypted cloud service, and the results returned to the point of care.
For molecular analysis of tumors, a sample of blood or tissue is labeled with microbeads that bind to known cancer-related molecules and loaded into the D3 imaging module.
After the image is recorded and data transmitted to the server, the presence of specific molecules is detected by analyzing the diffraction patterns generated by the microbeads. The use of variously sized or coated beads may offer unique diffraction signatures to facilitate detection.
A numerical algorithm the researchers developed can distinguish cells from beads and analyze as much as 10 MB of data in less than nine hundredths of a second.
In a pilot test with cancer cell lines, the D3 system detected the presence of tumor proteins with an accuracy matching that of the current gold standard for molecular profiling. And the system’s larger field of view enabled simultaneous analysis of more than 100,000 cells at a time.
The researchers also conducted analyses of cervical biopsy samples from 25 women with abnormal PAP smears—samples collected along with those used for clinical diagnosis—using microbeads tagged with antibodies against 3 published markers of cervical cancer.
Based on the number of antibody-tagged microbeads binding to cells, D3 analysis promptly and reliably categorized biopsy samples as high-risk, low-risk, or benign. Results matched those of conventional pathologic analysis.
In addition, D3 analysis of fine-needle lymph node biopsy samples was accurately able to differentiate 4 patients whose lymphoma diagnosis was confirmed by conventional pathology from another 4 patients with benign lymph node enlargement.
Along with protein analyses, the D3 system was enhanced to successfully detect DNA—in this instance, from human papilloma virus—with great sensitivity.
In all of these tests, results were available in under an hour and at a cost of $1.80 per assay, a price that would be expected to drop with further refinement of the D3 system.
“We expect that the D3 platform will enhance the breadth and depth of cancer screening in a way that is feasible and sustainable for resource limited-settings,” said Ralph Weissleder, MD, PhD, also of Massachusetts General Hospital.
“By taking advantage of the increased penetration of mobile phone technology worldwide, the system should allow the prompt triaging of suspicious or high-risk cases that could help to offset delays caused by limited pathology services in those regions and reduce the need for patients to return for follow-up care, which is often challenging for them.”
The researchers’ next steps are to investigate D3’s ability to analyze protein and DNA markers of other disease catalysts, integrate the software with larger databases, and conduct clinical studies in settings such as care-delivery sites in developing countries or rural areas.
Massachusetts General Hospital has filed a patent application covering the D3 technology.
Multi-Site Hospitalist Leaders: HM15 Session Summary
Session: Multi-site Hospitalist Leaders: Unique Challenges/What You Should Know

HM15 Presenter/Moderator: Scott Rissmiller, MD
Summation: This standing-room-only session was the result of a popular HMX e-community, which has become an active discussion board. As hospitals and health systems continue to consolidate across the country, there has been a rapid growth of multi-hospital systems. The role of the “Chief Hospitalist,” whose job is to lead multiple hospitalist groups within these systems, is evolving. These “Chief Hospitalists” are growing in number and they, as well as their followers, face unique challenges.
These points regarding organization structure were discussed, and as you look at your own organizational structure, these questions deserve your attention:
- Purpose of your structure?
- Is your structure centralized or decentralized?
- How does your organizational structure support decision-making?
- How does the structure ensure proper communication?
- How are resources shared across geography?
- What is your administrative support structure?
- How is administrative time allocated for physician leaders?
- How do you ensure engagement from all providers?
- How does your organization structure create alignment with the healthcare system?
The following compensation issues were discussed, and can be used as a discussion outline for most groups:
- How does your compensation (comp) plan align with the goals and values of the system?
- How does your comp plan account for regional variances?
- How does the comp plan encourage teamwork and sharing of resources?
- How does comp plan account for differences in acuity, hospital size, night frequency, etc.?
- Are goals and incentives group based, site based, or individual based?
- How does the comp plan fairly reward “non-RVU” work? (teaching, committee service, etc.)
- Should all site leaders receive the same comp regardless of group size?
- Does the comp plan incorporate “minimum work standards”/social compact?
Key Points/HM Takeaways:
- Panel discussion was valuable and reassured attendees that there are multiple ways to make groups successful. One common variable of successful groups is open lines of communication at all levels.
- Physician on-boarding is critical and should be utilized to set clear expectations.
- HM Goals/expectations must be aligned with those of the hospital and health system.
- When multiple hospitals are part of a larger system, it is desirable for goals to be aligned across the health system.
- Two-way open communication is necessary for success.
- Try to take a walk in your colleague’s/stakeholder’s shoes:
- How does my hospital administrative partner see this issue?
- How does my regional director/system lead see this issue?
- How does my bedside hospitalist physician/provider see this issue?
- How would my patients view this issue?
- Issues facing different types of groups, academic vs. community and for profit vs. not for profit, are somewhat variable.
- The leadership Dyad consisting of a physician and practice management professional in partnership is an effective and well-proven management model.
Many thanks to Drs. T.J. Richardson and Dan Duzan for their input and assistance with this session summary. Dr. Richardson is a Regional Medical Director and Dr. Duzan is a Facility Medical Director, both work for TeamHealth.
Julianna Lindsey is a hospitalist and physician leader based in the Dallas-Fort Worth Metroplex. Her focus is patient safety/quality and physician leadership. She is a member of TeamHospitalist.
Session: Multi-site Hospitalist Leaders: Unique Challenges/What You Should Know
HM15 Presenter/Moderator: Scott Rissmiller, MD
Summation: This standing-room-only session was the result of a popular HMX e-community, which has become an active discussion board. As hospitals and health systems continue to consolidate across the country, there has been a rapid growth of multi-hospital systems. The role of the “Chief Hospitalist,” whose job is to lead multiple hospitalist groups within these systems, is evolving. These “Chief Hospitalists” are growing in number and they, as well as their followers, face unique challenges.
These points regarding organization structure were discussed, and as you look at your own organizational structure, these questions deserve your attention:
- Purpose of your structure?
- Is your structure centralized or decentralized?
- How does your organizational structure support decision-making?
- How does the structure ensure proper communication?
- How are resources shared across geography?
- What is your administrative support structure?
- How is administrative time allocated for physician leaders?
- How do you ensure engagement from all providers?
- How does your organization structure create alignment with the healthcare system?
The following compensation issues were discussed, and can be used as a discussion outline for most groups:
- How does your compensation (comp) plan align with the goals and values of the system?
- How does your comp plan account for regional variances?
- How does the comp plan encourage teamwork and sharing of resources?
- How does comp plan account for differences in acuity, hospital size, night frequency, etc.?
- Are goals and incentives group based, site based, or individual based?
- How does the comp plan fairly reward “non-RVU” work? (teaching, committee service, etc.)
- Should all site leaders receive the same comp regardless of group size?
- Does the comp plan incorporate “minimum work standards”/social compact?
Key Points/HM Takeaways:
- Panel discussion was valuable and reassured attendees that there are multiple ways to make groups successful. One common variable of successful groups is open lines of communication at all levels.
- Physician on-boarding is critical and should be utilized to set clear expectations.
- HM Goals/expectations must be aligned with those of the hospital and health system.
- When multiple hospitals are part of a larger system, it is desirable for goals to be aligned across the health system.
- Two-way open communication is necessary for success.
- Try to take a walk in your colleague’s/stakeholder’s shoes:
- How does my hospital administrative partner see this issue?
- How does my regional director/system lead see this issue?
- How does my bedside hospitalist physician/provider see this issue?
- How would my patients view this issue?
- Issues facing different types of groups, academic vs. community and for profit vs. not for profit, are somewhat variable.
- The leadership Dyad consisting of a physician and practice management professional in partnership is an effective and well-proven management model.
Many thanks to Drs. T.J. Richardson and Dan Duzan for their input and assistance with this session summary. Dr. Richardson is a Regional Medical Director and Dr. Duzan is a Facility Medical Director, both work for TeamHealth.
Julianna Lindsey is a hospitalist and physician leader based in the Dallas-Fort Worth Metroplex. Her focus is patient safety/quality and physician leadership. She is a member of TeamHospitalist.
Session: Multi-site Hospitalist Leaders: Unique Challenges/What You Should Know
HM15 Presenter/Moderator: Scott Rissmiller, MD
Summation: This standing-room-only session was the result of a popular HMX e-community, which has become an active discussion board. As hospitals and health systems continue to consolidate across the country, there has been a rapid growth of multi-hospital systems. The role of the “Chief Hospitalist,” whose job is to lead multiple hospitalist groups within these systems, is evolving. These “Chief Hospitalists” are growing in number and they, as well as their followers, face unique challenges.
These points regarding organization structure were discussed, and as you look at your own organizational structure, these questions deserve your attention:
- Purpose of your structure?
- Is your structure centralized or decentralized?
- How does your organizational structure support decision-making?
- How does the structure ensure proper communication?
- How are resources shared across geography?
- What is your administrative support structure?
- How is administrative time allocated for physician leaders?
- How do you ensure engagement from all providers?
- How does your organization structure create alignment with the healthcare system?
The following compensation issues were discussed, and can be used as a discussion outline for most groups:
- How does your compensation (comp) plan align with the goals and values of the system?
- How does your comp plan account for regional variances?
- How does the comp plan encourage teamwork and sharing of resources?
- How does comp plan account for differences in acuity, hospital size, night frequency, etc.?
- Are goals and incentives group based, site based, or individual based?
- How does the comp plan fairly reward “non-RVU” work? (teaching, committee service, etc.)
- Should all site leaders receive the same comp regardless of group size?
- Does the comp plan incorporate “minimum work standards”/social compact?
Key Points/HM Takeaways:
- Panel discussion was valuable and reassured attendees that there are multiple ways to make groups successful. One common variable of successful groups is open lines of communication at all levels.
- Physician on-boarding is critical and should be utilized to set clear expectations.
- HM Goals/expectations must be aligned with those of the hospital and health system.
- When multiple hospitals are part of a larger system, it is desirable for goals to be aligned across the health system.
- Two-way open communication is necessary for success.
- Try to take a walk in your colleague’s/stakeholder’s shoes:
- How does my hospital administrative partner see this issue?
- How does my regional director/system lead see this issue?
- How does my bedside hospitalist physician/provider see this issue?
- How would my patients view this issue?
- Issues facing different types of groups, academic vs. community and for profit vs. not for profit, are somewhat variable.
- The leadership Dyad consisting of a physician and practice management professional in partnership is an effective and well-proven management model.
Many thanks to Drs. T.J. Richardson and Dan Duzan for their input and assistance with this session summary. Dr. Richardson is a Regional Medical Director and Dr. Duzan is a Facility Medical Director, both work for TeamHealth.
Julianna Lindsey is a hospitalist and physician leader based in the Dallas-Fort Worth Metroplex. Her focus is patient safety/quality and physician leadership. She is a member of TeamHospitalist.
Use of Smartphones and Mobile Devices
Over 90% of Americans own mobile phones, and their use for internet access is rising rapidly (31% in 2009, 63% in 2013).[1] This has prompted growth in mobile health (mHealth) programs for outpatient settings,[2] and similar growth is anticipated for inpatient settings.[3] Hospitals and the healthcare systems they operate within are increasingly tied to patient experience scores (eg, Hospital Consumer Assessment of Healthcare Providers and Systems, Press Ganey) for both reputation and reimbursement.[4, 5] As a result, hospitals will need to invest future resources in a consumer‐facing digital experience. Despite these trends, basic information on mobile device ownership and usage by hospitalized patients is limited. This knowledge is needed to guide successful mHealth approaches to engage patients in acute care settings.
METHODS
We administered a 27‐question survey about mobile device use to all adult inpatients at a large urban California teaching hospital over 2 dates (October 27, 2013 and November 11, 2013) to create a cross‐sectional view of mobile device use at a hospital that offers free wireless Internet (WiFi) and personal health records (Internet‐accessible individualized medical records). Average census was 447, and we excluded patients for: age under 18 years (98), admission for neurological problems (75), altered mental status (35), nonEnglish speaking (30), or unavailable if patients were not in their room after 2 attempts spaced 30 to 60 minutes apart (36), leaving 173 eligible. We performed descriptive statistics and unadjusted associations ([2] test) to explore patterns of mobile device use.
RESULTS
We enrolled 152 patients (88% response rate): 77 (51%) male, average age 53 years (1992 years), 84 (56%) white, 115 (75%) with Medicare or commercial insurance. We found 85 (56%) patients brought a smartphone, and 82/85 (95%) used it during their hospital stay. Additionally, 41 (27%) patients brought a tablet, and 29 (19%) brought a laptop; usage was 37/41 (90%) for tablets and 24/29 (83%) for laptops. One hundred three (68%) patients brought at least 1 mobile computing device (smartphone, tablet, laptop) during their hospital stay. Overall device usage was highest among oncology patients (85%) and lowest among medicine patients (54%) (Table 1). Device usage also varied by age (65 years old: 79% vs 65 years old: 27%), insurance status (private/Medicare: 70% vs Medicaid/other: 59%), and race/ethnicity (white: 73% vs non‐white: 62%), although only age was statistically significant (P0.01; all others >0.05).
| Total, N=152 | Medicine, n=39 | Surgery, n=47 | Oncology, n=34 | All Others, n=32* | |
|---|---|---|---|---|---|
| |||||
| Demographics | |||||
| Average age, y (range) | 53.2 (1992) | 55.7 (2092) | 51.7 (1979) | 51.2 (2377) | 53.9 (2584) |
| Medicare or commercial insurance | 75% (115) | 64% (25) | 87% (41) | 76% (26) | 72% (23) |
| Medicaid, other, or no insurance | 25% (37) | 36% (14) | 13% (6) | 24% (8) | 28% (9) |
| Non‐white race/ethnicity | 44% (68) | 56% (22) | 36% (17) | 38% (13) | 50%(16) |
| Female gender | 49% (75) | 49% (19) | 45% (21) | 47% (16) | 59% (19) |
| Device ownership/usage | |||||
| Own smartphone | 62% (94) | 54% (21) | 66% (31) | 74% (25) | 53% (17) |
| Brought smartphone | 55% (83) | 41% (16) | 60% (28) | 71% (24) | 48% (15) |
| Brought laptop | 19% (29) | 18% (7) | 11% (5) | 41% (14) | 10% (3) |
| Brought tablet | 27% (41) | 18% (7) | 26% (12) | 50% (17) | 16% (5) |
| Brought 1 above devices | 68% (103) | 54% (21) | 68% (32) | 85% (29) | 68% (21) |
| Ever used an app | 63% (95) | 51% (20) | 72% (34) | 79% (27) | 45% (14) |
| Ever used an app for health purposes | 22% (34) | 18% (7) | 21% (10) | 24% (8) | 29% (9) |
| Accessed PHR with mobile device | 31% (47) | 26% (10) | 26% (12) | 47% (16) | 29% (9) |
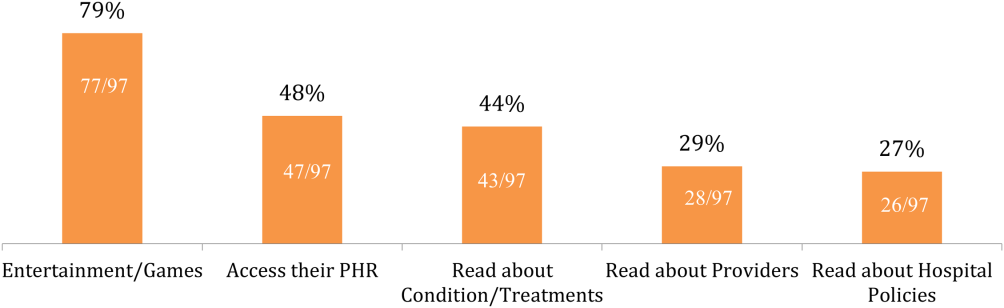
Of the patients with mobile devices (smartphone, tablet, laptop), 97/103 (94%) used them during their hospitalization and for a wide array of activities (Figure 1): 47/97 (48%) accessed their personal health record (PHR), and most of these patients (38/47, 81%) reported this improved their inpatient experience. Additionally, 43/97 (44%) patients used their mobile devices to search for information about doctors, conditions, or treatments; most of these patients (39/43, 91%) used Google to search for this information, and most 29/43 (67%) felt this information made them more confident in their care.
COMMENT
Over two‐thirds of patients in our study brought and used 1 or more mobile devices to the hospital. Despite this level of engagement with mobile devices, relatively few inpatients used their device to access their online PHR, which suggests information technology access is not the leading barrier to PHR access or mHealth engagement during hospitalization. In light of growing patient enthusiasm for PHRs,[6, 7] this represents an untapped opportunity to deliver personalized, patient‐centered care at the hospital bedside.
We also found that among the patients who did access their PHR on their mobile device, the vast majority (38/47, 81%) felt it improved their inpatient experience. Our PHR provides information such as test results and medications, but our survey suggests a number of patients look for health information, such as patient education tools, medication references, and provider information, outside of the PHR. For those patients, 29/43 (67%) felt these health‐related searches improved their experience. Although we did not ask patients why they used Web searches outside their PHR, we believe this suggests that patients desire more information than currently available via the PHR. Although this information might be difficult to incorporate into the PHR, at minimum, hospitals could develop mobile applications to provide patients with basic information about their providers and conditions. Beyond this, hospitals could develop or adopt mobile applications that align with strategic priorities such as improved physician‐provider communication, reduced hospital readmissions, and improved accuracy of medication reconciliation.
Our study has limitations. First, although we used a cross‐sectional, point‐in‐time approach to canvas the entire adult population in our hospital on 2 separate dates, our study was limited to 1 large urban hospital in California; device ownership and usage may vary in other settings. Second, although our hospital provides free WiFi, we did not assess whether patients experienced any connectivity issues that influenced their device usage patterns. Finally, we did not explore questions of access, ownership, and usage of mobile computing devices for family and friends who visited inpatients in our study. These questions are ripe for future research in this emerging area of mHeath.
In summary, our study suggests a role for hospitals to provide universal WiFi access to patients, and a role for both hospitals and healthcare providers to promote digital health programs. Our findings on mobile device use in the hospital are consistent with the growing popularity of mobile device usage nationwide. Patients are increasingly wired for new opportunities to both engage in their care and optimize their hospital experience through use of their mobile computing devices. Hospitals and providers should explore this potential for engagement, but may need to explore local trends in usage to target specific service lines and patient populations given differences in access and use.
Acknowledgements
The authors acknowledge contributions by Christina Quist, MD, and Emily Gottenborg, MD, who assisted in data collection.
Disclosures: Data from this project were presented at the 2014 Annual Scientific Meeting of the Society of Hospital Medicine, March 25, 2014 in Las Vegas, Nevada. The authors have no conflicts of interest to declare relative to this study. Dr. Ludwin, MD had full access to all data in the study and takes responsibility for the integrity of the data and the accuracy of the data analysis. This project by Drs. Ludwin and Greysen was supported by grants from the University of California, San Francisco (UCSF) Partners in Care (Ronald Rankin Award) and the UCSF Mount Zion Health Fund. Dr. Greysen is also funded by a Pilot Award for Junior Investigators in Digital Health from the UCSF Dean's Office, Research Evaluation and Allocation Committee (REAC). Additionally, Dr. Greysen receives career development support from the National Institutes of Health (NIH)National Institute of Aging (NIA) through the Claude D. Pepper Older Americans Independence Center at UCSF Division of Geriatric Medicine (#P30AG021342 NIH/NIA), a Career Development Award (1K23AG045338‐01), and the NIH‐NIA Loan Repayment Program.
- Device ownership over time. Pew Research Center. Available at: http://www.pewinternet.org/data‐trend/mobile/device‐ownership. Accessed April 3, 2014.
- , , , et al. The effectiveness of mobile‐health technologies to improve health care service delivery processes: a systematic review and meta‐analysis. PLoS Med. 2013;10(1):e1001363.
- , , . Can mobile health technologies transform health care? JAMA. 2013;310(22):2395–2396.
- Look ahead to succeed under VBP. Hosp Case Manag. 2014;22(7):92–93.
- , , , . The relationship between commercial website ratings and traditional hospital performance measures in the USA. BMJ Qual Saf. 2013;22(3):194–202.
- , , , , . Consumers' perceptions of patient‐accessible electronic medical records. J Med Internet Res. 2013;15(8):e168.
- , , , et al. Access, interest, and attitudes toward electronic communication for health care among patients in the medical safety net. J Gen Intern Med. 2013;28(7):914–920.
Over 90% of Americans own mobile phones, and their use for internet access is rising rapidly (31% in 2009, 63% in 2013).[1] This has prompted growth in mobile health (mHealth) programs for outpatient settings,[2] and similar growth is anticipated for inpatient settings.[3] Hospitals and the healthcare systems they operate within are increasingly tied to patient experience scores (eg, Hospital Consumer Assessment of Healthcare Providers and Systems, Press Ganey) for both reputation and reimbursement.[4, 5] As a result, hospitals will need to invest future resources in a consumer‐facing digital experience. Despite these trends, basic information on mobile device ownership and usage by hospitalized patients is limited. This knowledge is needed to guide successful mHealth approaches to engage patients in acute care settings.
METHODS
We administered a 27‐question survey about mobile device use to all adult inpatients at a large urban California teaching hospital over 2 dates (October 27, 2013 and November 11, 2013) to create a cross‐sectional view of mobile device use at a hospital that offers free wireless Internet (WiFi) and personal health records (Internet‐accessible individualized medical records). Average census was 447, and we excluded patients for: age under 18 years (98), admission for neurological problems (75), altered mental status (35), nonEnglish speaking (30), or unavailable if patients were not in their room after 2 attempts spaced 30 to 60 minutes apart (36), leaving 173 eligible. We performed descriptive statistics and unadjusted associations ([2] test) to explore patterns of mobile device use.
RESULTS
We enrolled 152 patients (88% response rate): 77 (51%) male, average age 53 years (1992 years), 84 (56%) white, 115 (75%) with Medicare or commercial insurance. We found 85 (56%) patients brought a smartphone, and 82/85 (95%) used it during their hospital stay. Additionally, 41 (27%) patients brought a tablet, and 29 (19%) brought a laptop; usage was 37/41 (90%) for tablets and 24/29 (83%) for laptops. One hundred three (68%) patients brought at least 1 mobile computing device (smartphone, tablet, laptop) during their hospital stay. Overall device usage was highest among oncology patients (85%) and lowest among medicine patients (54%) (Table 1). Device usage also varied by age (65 years old: 79% vs 65 years old: 27%), insurance status (private/Medicare: 70% vs Medicaid/other: 59%), and race/ethnicity (white: 73% vs non‐white: 62%), although only age was statistically significant (P0.01; all others >0.05).
| Total, N=152 | Medicine, n=39 | Surgery, n=47 | Oncology, n=34 | All Others, n=32* | |
|---|---|---|---|---|---|
| |||||
| Demographics | |||||
| Average age, y (range) | 53.2 (1992) | 55.7 (2092) | 51.7 (1979) | 51.2 (2377) | 53.9 (2584) |
| Medicare or commercial insurance | 75% (115) | 64% (25) | 87% (41) | 76% (26) | 72% (23) |
| Medicaid, other, or no insurance | 25% (37) | 36% (14) | 13% (6) | 24% (8) | 28% (9) |
| Non‐white race/ethnicity | 44% (68) | 56% (22) | 36% (17) | 38% (13) | 50%(16) |
| Female gender | 49% (75) | 49% (19) | 45% (21) | 47% (16) | 59% (19) |
| Device ownership/usage | |||||
| Own smartphone | 62% (94) | 54% (21) | 66% (31) | 74% (25) | 53% (17) |
| Brought smartphone | 55% (83) | 41% (16) | 60% (28) | 71% (24) | 48% (15) |
| Brought laptop | 19% (29) | 18% (7) | 11% (5) | 41% (14) | 10% (3) |
| Brought tablet | 27% (41) | 18% (7) | 26% (12) | 50% (17) | 16% (5) |
| Brought 1 above devices | 68% (103) | 54% (21) | 68% (32) | 85% (29) | 68% (21) |
| Ever used an app | 63% (95) | 51% (20) | 72% (34) | 79% (27) | 45% (14) |
| Ever used an app for health purposes | 22% (34) | 18% (7) | 21% (10) | 24% (8) | 29% (9) |
| Accessed PHR with mobile device | 31% (47) | 26% (10) | 26% (12) | 47% (16) | 29% (9) |
Of the patients with mobile devices (smartphone, tablet, laptop), 97/103 (94%) used them during their hospitalization and for a wide array of activities (Figure 1): 47/97 (48%) accessed their personal health record (PHR), and most of these patients (38/47, 81%) reported this improved their inpatient experience. Additionally, 43/97 (44%) patients used their mobile devices to search for information about doctors, conditions, or treatments; most of these patients (39/43, 91%) used Google to search for this information, and most 29/43 (67%) felt this information made them more confident in their care.
COMMENT
Over two‐thirds of patients in our study brought and used 1 or more mobile devices to the hospital. Despite this level of engagement with mobile devices, relatively few inpatients used their device to access their online PHR, which suggests information technology access is not the leading barrier to PHR access or mHealth engagement during hospitalization. In light of growing patient enthusiasm for PHRs,[6, 7] this represents an untapped opportunity to deliver personalized, patient‐centered care at the hospital bedside.
We also found that among the patients who did access their PHR on their mobile device, the vast majority (38/47, 81%) felt it improved their inpatient experience. Our PHR provides information such as test results and medications, but our survey suggests a number of patients look for health information, such as patient education tools, medication references, and provider information, outside of the PHR. For those patients, 29/43 (67%) felt these health‐related searches improved their experience. Although we did not ask patients why they used Web searches outside their PHR, we believe this suggests that patients desire more information than currently available via the PHR. Although this information might be difficult to incorporate into the PHR, at minimum, hospitals could develop mobile applications to provide patients with basic information about their providers and conditions. Beyond this, hospitals could develop or adopt mobile applications that align with strategic priorities such as improved physician‐provider communication, reduced hospital readmissions, and improved accuracy of medication reconciliation.
Our study has limitations. First, although we used a cross‐sectional, point‐in‐time approach to canvas the entire adult population in our hospital on 2 separate dates, our study was limited to 1 large urban hospital in California; device ownership and usage may vary in other settings. Second, although our hospital provides free WiFi, we did not assess whether patients experienced any connectivity issues that influenced their device usage patterns. Finally, we did not explore questions of access, ownership, and usage of mobile computing devices for family and friends who visited inpatients in our study. These questions are ripe for future research in this emerging area of mHeath.
In summary, our study suggests a role for hospitals to provide universal WiFi access to patients, and a role for both hospitals and healthcare providers to promote digital health programs. Our findings on mobile device use in the hospital are consistent with the growing popularity of mobile device usage nationwide. Patients are increasingly wired for new opportunities to both engage in their care and optimize their hospital experience through use of their mobile computing devices. Hospitals and providers should explore this potential for engagement, but may need to explore local trends in usage to target specific service lines and patient populations given differences in access and use.
Acknowledgements
The authors acknowledge contributions by Christina Quist, MD, and Emily Gottenborg, MD, who assisted in data collection.
Disclosures: Data from this project were presented at the 2014 Annual Scientific Meeting of the Society of Hospital Medicine, March 25, 2014 in Las Vegas, Nevada. The authors have no conflicts of interest to declare relative to this study. Dr. Ludwin, MD had full access to all data in the study and takes responsibility for the integrity of the data and the accuracy of the data analysis. This project by Drs. Ludwin and Greysen was supported by grants from the University of California, San Francisco (UCSF) Partners in Care (Ronald Rankin Award) and the UCSF Mount Zion Health Fund. Dr. Greysen is also funded by a Pilot Award for Junior Investigators in Digital Health from the UCSF Dean's Office, Research Evaluation and Allocation Committee (REAC). Additionally, Dr. Greysen receives career development support from the National Institutes of Health (NIH)National Institute of Aging (NIA) through the Claude D. Pepper Older Americans Independence Center at UCSF Division of Geriatric Medicine (#P30AG021342 NIH/NIA), a Career Development Award (1K23AG045338‐01), and the NIH‐NIA Loan Repayment Program.
Over 90% of Americans own mobile phones, and their use for internet access is rising rapidly (31% in 2009, 63% in 2013).[1] This has prompted growth in mobile health (mHealth) programs for outpatient settings,[2] and similar growth is anticipated for inpatient settings.[3] Hospitals and the healthcare systems they operate within are increasingly tied to patient experience scores (eg, Hospital Consumer Assessment of Healthcare Providers and Systems, Press Ganey) for both reputation and reimbursement.[4, 5] As a result, hospitals will need to invest future resources in a consumer‐facing digital experience. Despite these trends, basic information on mobile device ownership and usage by hospitalized patients is limited. This knowledge is needed to guide successful mHealth approaches to engage patients in acute care settings.
METHODS
We administered a 27‐question survey about mobile device use to all adult inpatients at a large urban California teaching hospital over 2 dates (October 27, 2013 and November 11, 2013) to create a cross‐sectional view of mobile device use at a hospital that offers free wireless Internet (WiFi) and personal health records (Internet‐accessible individualized medical records). Average census was 447, and we excluded patients for: age under 18 years (98), admission for neurological problems (75), altered mental status (35), nonEnglish speaking (30), or unavailable if patients were not in their room after 2 attempts spaced 30 to 60 minutes apart (36), leaving 173 eligible. We performed descriptive statistics and unadjusted associations ([2] test) to explore patterns of mobile device use.
RESULTS
We enrolled 152 patients (88% response rate): 77 (51%) male, average age 53 years (1992 years), 84 (56%) white, 115 (75%) with Medicare or commercial insurance. We found 85 (56%) patients brought a smartphone, and 82/85 (95%) used it during their hospital stay. Additionally, 41 (27%) patients brought a tablet, and 29 (19%) brought a laptop; usage was 37/41 (90%) for tablets and 24/29 (83%) for laptops. One hundred three (68%) patients brought at least 1 mobile computing device (smartphone, tablet, laptop) during their hospital stay. Overall device usage was highest among oncology patients (85%) and lowest among medicine patients (54%) (Table 1). Device usage also varied by age (65 years old: 79% vs 65 years old: 27%), insurance status (private/Medicare: 70% vs Medicaid/other: 59%), and race/ethnicity (white: 73% vs non‐white: 62%), although only age was statistically significant (P0.01; all others >0.05).
| Total, N=152 | Medicine, n=39 | Surgery, n=47 | Oncology, n=34 | All Others, n=32* | |
|---|---|---|---|---|---|
| |||||
| Demographics | |||||
| Average age, y (range) | 53.2 (1992) | 55.7 (2092) | 51.7 (1979) | 51.2 (2377) | 53.9 (2584) |
| Medicare or commercial insurance | 75% (115) | 64% (25) | 87% (41) | 76% (26) | 72% (23) |
| Medicaid, other, or no insurance | 25% (37) | 36% (14) | 13% (6) | 24% (8) | 28% (9) |
| Non‐white race/ethnicity | 44% (68) | 56% (22) | 36% (17) | 38% (13) | 50%(16) |
| Female gender | 49% (75) | 49% (19) | 45% (21) | 47% (16) | 59% (19) |
| Device ownership/usage | |||||
| Own smartphone | 62% (94) | 54% (21) | 66% (31) | 74% (25) | 53% (17) |
| Brought smartphone | 55% (83) | 41% (16) | 60% (28) | 71% (24) | 48% (15) |
| Brought laptop | 19% (29) | 18% (7) | 11% (5) | 41% (14) | 10% (3) |
| Brought tablet | 27% (41) | 18% (7) | 26% (12) | 50% (17) | 16% (5) |
| Brought 1 above devices | 68% (103) | 54% (21) | 68% (32) | 85% (29) | 68% (21) |
| Ever used an app | 63% (95) | 51% (20) | 72% (34) | 79% (27) | 45% (14) |
| Ever used an app for health purposes | 22% (34) | 18% (7) | 21% (10) | 24% (8) | 29% (9) |
| Accessed PHR with mobile device | 31% (47) | 26% (10) | 26% (12) | 47% (16) | 29% (9) |
Of the patients with mobile devices (smartphone, tablet, laptop), 97/103 (94%) used them during their hospitalization and for a wide array of activities (Figure 1): 47/97 (48%) accessed their personal health record (PHR), and most of these patients (38/47, 81%) reported this improved their inpatient experience. Additionally, 43/97 (44%) patients used their mobile devices to search for information about doctors, conditions, or treatments; most of these patients (39/43, 91%) used Google to search for this information, and most 29/43 (67%) felt this information made them more confident in their care.
COMMENT
Over two‐thirds of patients in our study brought and used 1 or more mobile devices to the hospital. Despite this level of engagement with mobile devices, relatively few inpatients used their device to access their online PHR, which suggests information technology access is not the leading barrier to PHR access or mHealth engagement during hospitalization. In light of growing patient enthusiasm for PHRs,[6, 7] this represents an untapped opportunity to deliver personalized, patient‐centered care at the hospital bedside.
We also found that among the patients who did access their PHR on their mobile device, the vast majority (38/47, 81%) felt it improved their inpatient experience. Our PHR provides information such as test results and medications, but our survey suggests a number of patients look for health information, such as patient education tools, medication references, and provider information, outside of the PHR. For those patients, 29/43 (67%) felt these health‐related searches improved their experience. Although we did not ask patients why they used Web searches outside their PHR, we believe this suggests that patients desire more information than currently available via the PHR. Although this information might be difficult to incorporate into the PHR, at minimum, hospitals could develop mobile applications to provide patients with basic information about their providers and conditions. Beyond this, hospitals could develop or adopt mobile applications that align with strategic priorities such as improved physician‐provider communication, reduced hospital readmissions, and improved accuracy of medication reconciliation.
Our study has limitations. First, although we used a cross‐sectional, point‐in‐time approach to canvas the entire adult population in our hospital on 2 separate dates, our study was limited to 1 large urban hospital in California; device ownership and usage may vary in other settings. Second, although our hospital provides free WiFi, we did not assess whether patients experienced any connectivity issues that influenced their device usage patterns. Finally, we did not explore questions of access, ownership, and usage of mobile computing devices for family and friends who visited inpatients in our study. These questions are ripe for future research in this emerging area of mHeath.
In summary, our study suggests a role for hospitals to provide universal WiFi access to patients, and a role for both hospitals and healthcare providers to promote digital health programs. Our findings on mobile device use in the hospital are consistent with the growing popularity of mobile device usage nationwide. Patients are increasingly wired for new opportunities to both engage in their care and optimize their hospital experience through use of their mobile computing devices. Hospitals and providers should explore this potential for engagement, but may need to explore local trends in usage to target specific service lines and patient populations given differences in access and use.
Acknowledgements
The authors acknowledge contributions by Christina Quist, MD, and Emily Gottenborg, MD, who assisted in data collection.
Disclosures: Data from this project were presented at the 2014 Annual Scientific Meeting of the Society of Hospital Medicine, March 25, 2014 in Las Vegas, Nevada. The authors have no conflicts of interest to declare relative to this study. Dr. Ludwin, MD had full access to all data in the study and takes responsibility for the integrity of the data and the accuracy of the data analysis. This project by Drs. Ludwin and Greysen was supported by grants from the University of California, San Francisco (UCSF) Partners in Care (Ronald Rankin Award) and the UCSF Mount Zion Health Fund. Dr. Greysen is also funded by a Pilot Award for Junior Investigators in Digital Health from the UCSF Dean's Office, Research Evaluation and Allocation Committee (REAC). Additionally, Dr. Greysen receives career development support from the National Institutes of Health (NIH)National Institute of Aging (NIA) through the Claude D. Pepper Older Americans Independence Center at UCSF Division of Geriatric Medicine (#P30AG021342 NIH/NIA), a Career Development Award (1K23AG045338‐01), and the NIH‐NIA Loan Repayment Program.
- Device ownership over time. Pew Research Center. Available at: http://www.pewinternet.org/data‐trend/mobile/device‐ownership. Accessed April 3, 2014.
- , , , et al. The effectiveness of mobile‐health technologies to improve health care service delivery processes: a systematic review and meta‐analysis. PLoS Med. 2013;10(1):e1001363.
- , , . Can mobile health technologies transform health care? JAMA. 2013;310(22):2395–2396.
- Look ahead to succeed under VBP. Hosp Case Manag. 2014;22(7):92–93.
- , , , . The relationship between commercial website ratings and traditional hospital performance measures in the USA. BMJ Qual Saf. 2013;22(3):194–202.
- , , , , . Consumers' perceptions of patient‐accessible electronic medical records. J Med Internet Res. 2013;15(8):e168.
- , , , et al. Access, interest, and attitudes toward electronic communication for health care among patients in the medical safety net. J Gen Intern Med. 2013;28(7):914–920.
- Device ownership over time. Pew Research Center. Available at: http://www.pewinternet.org/data‐trend/mobile/device‐ownership. Accessed April 3, 2014.
- , , , et al. The effectiveness of mobile‐health technologies to improve health care service delivery processes: a systematic review and meta‐analysis. PLoS Med. 2013;10(1):e1001363.
- , , . Can mobile health technologies transform health care? JAMA. 2013;310(22):2395–2396.
- Look ahead to succeed under VBP. Hosp Case Manag. 2014;22(7):92–93.
- , , , . The relationship between commercial website ratings and traditional hospital performance measures in the USA. BMJ Qual Saf. 2013;22(3):194–202.
- , , , , . Consumers' perceptions of patient‐accessible electronic medical records. J Med Internet Res. 2013;15(8):e168.
- , , , et al. Access, interest, and attitudes toward electronic communication for health care among patients in the medical safety net. J Gen Intern Med. 2013;28(7):914–920.
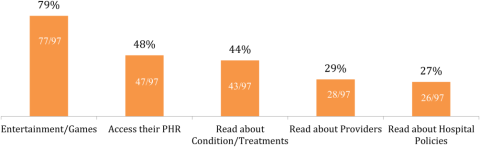
Memory and Sleep in Hospital Patients
Hospitalization is often utilized as a teachable moment, as patients are provided with education about treatment and disease management, particularly at discharge.[1, 2, 3] However, memory impairment among hospitalized patients may undermine the utility of the teachable moment. In one study of community‐dwelling seniors admitted to the hospital, one‐third had previously unrecognized poor memory at discharge.[4]
Sleep loss may be an underappreciated contributor to short‐term memory deficits in inpatients, particularly in seniors, who have baseline higher rates of sleep disruptions and sleep disorders.[5] Patients often receive 2 hours less sleep than at home and experience poor quality sleep due to disruptions.[6, 7] Robust studies of healthy subjects in laboratory settings demonstrate that sleep loss leads to decreased attention and worse recall, and that more sleep is associated with better memory performance.[8, 9]
Very few studies have examined memory in hospitalized patients. Although word‐list tasks are often used to assess memory because they are quick and easy to administer, these tasks may not accurately reflect memory for a set of instructions provided at patient discharge. Finally, no studies have examined the association between inpatient sleep loss and memory. Thus, our primary aim in this study was to examine memory performance in older, hospitalized patients using a word listbased memory task and a more complex medical vignette task. Our second aim was to investigate the relationship between in‐hospital sleep and memory.
METHODS
Study Design
We conducted a prospective cohort study with subjects enrolled in an ongoing sleep study at the University of Chicago Medical Center.[10] Eligible subjects were on the general medicine or hematology/oncology service, at least 50 years old, community dwelling, ambulatory, and without detectable cognitive impairment on the Mini Mental State Exam[11] or Short Portable Mental Status Questionnaire.[12, 13] Patients were excluded if they had a documented sleep disorder (ie, obstructive sleep apnea), were transferred from an intensive care unit or were in droplet or airborne isolation, had a bedrest order, or had already spent over 72 hours in the hospital prior to enrollment. These criteria were used to select a population appropriate for wristwatch actigraphy and with low likelihood of baseline memory impairment. The University of Chicago Institutional Review Board approved this study, and participants provided written consent.
Data Collection
Memory Testing
Memory was evaluated using the University of Southern California Repeatable Episodic Memory Test (USC‐REMT), a validated verbal memory test in which subjects listen to a list of 15 words and then complete free‐recall and recognition of the list.[14, 15] Free‐recall tests subjects' ability to procure information without cues. In contrast, recognition requires subjects to pick out the words they just heard from distractors, an easier task. The USC‐REMT contains multiple functionally equivalent different word lists, and may be administered more than once to the same subject without learning effects.[15] Immediate and delayed memory were tested by asking the subject to complete the tasks immediately after listening to the word list and 24‐hours after listening to the list, respectively.
Immediate Recall and Recognition
Recall and recognition following a night of sleep in the hospital was the primary outcome for this study. After 1 night of actigraphy recorded sleep, subjects listened as a 15‐item word list (word list A) was read aloud. For the free‐recall task, subjects were asked to repeat back all the words they could remember immediately after hearing the list. For the recognition task, subjects were read a new list of 15 words, including a mix of words from the previous list and new distractor words. They answered yes if they thought the word had previously been read to them and no if they thought the word was new.
Delayed Recall and Delayed Recognition
At the conclusion of study enrollment on day 1 prior to the night of actigraphy, subjects were shown a laminated paper with a printed word list (word list B) from the USC‐REMT. They were given 2 minutes to study the sheet and were informed they would be asked to remember the words the following day. One day later, after the night of actigraphy recorded sleep, subjects completed the free recall and yes/no recognition task based on what they remembered from word list B. This established delayed recall and recognition scores.
Medical Vignette
Because it is unclear how word recall and recognition tasks approximate remembering discharge instructions, we developed a 5‐sentence vignette about an outpatient medical encounter, based on the logical memory component of the Wechsler Memory Scale IV, a commonly used, validated test of memory assessment.[16, 17] After the USC‐REMT was administered following a night of sleep in the hospital, patients listened to a story and were immediately asked to repeat back in free form as much information as possible from the story. Responses were recorded by trained research assistants. The story is comprised of short sentences with simple ideas and vocabulary (see Supporting Information, Appendix 1, in the online version of this article).
Sleep: Wrist Actigraphy and Karolinska Sleep Log
Patient sleep was measured by actigraphy following the protocol described previously by our group.[7] Patients wore a wrist actigraphy monitor (Actiwatch 2; Philips Respironics, Inc., Murrysville, PA) to collect data on sleep duration and quality. The monitor detects wrist movement by measuring acceleration.[18] Actigraphy has been validated against polysomnography, demonstrating a correlation in sleep duration of 0.82 in insomniacs and 0.97 in healthy subjects.[19] Sleep duration and sleep efficiency overnight were calculated from the actigraphy data using Actiware 5 software.[20] Sleep duration was defined by the software based on low levels of recorded movement. Sleep efficiency was calculated as the percentage of time asleep out of the subjects' self‐reported time in bed, which was obtained using the Karolinska Sleep Log.[21]
The Karolinska Sleep Log questionnaire also asks patients to rate their sleep quality, restlessness during sleep, ease of falling asleep and the ability to sleep through the night on a 5‐point scale. The Karolinska Sleep Quality Index (KSQI) is calculated by averaging the latter 4 items.[22] A score of 3 or less classifies the subject in an insomniac range.[7, 21]
Demographic Information
Demographic information, including age, race, and gender were obtained by chart audit.
Data Analysis
Data were entered into REDCap, a secure online tool for managing survey data.[23]
Memory Scoring
For immediate and delayed recall scores, subjects received 1 point for every word they remembered correctly, with a maximum score of 15 words. We defined poor memory on the immediate recall test as a score of 3 or lower, based on a score utilized by Lindquist et al.[4] in a similar task. This score was less than half of the mean score of 6.63 obtained by Parker et al. for a sample of healthy 60 to 79 year olds in a sensitivity study of the USC‐REMT.[14] For immediate and delayed recognition, subjects received 1 point for correctly identifying whether a word had been on the word list they heard or whether it was a distractor, with a maximum score of 15.
A key was created to standardize scoring of the medical vignette by assigning 1 point to specific correctly remembered items from the story (see Supporting Information, Appendix 2A, in the online version of this article). These points were added to obtain a total score for correctly remembered vignette items. It was also noted when a vignette item was remembered incorrectly, for example, when the patient remembered left foot instead of right foot. Each incorrectly remembered item received 1 point, and these were summed to create the total score for incorrectly remembered vignette items (see Supporting Information, Appendix 2A, in the online version of this article for the scoring guide). Forgotten items were assigned 0 points. Two independent raters scored each subject's responses, and their scores were averaged for each item. Inter‐rater reliability was calculated as percentage of agreement across responses.
Statistical Analysis
Descriptive statistics were performed on the memory task data. Tests for skew and curtosis were performed for recall and recognition task data. The mean and standard deviation (SD) were calculated for normally distributed data, and the median and interquartile range (IQR) were obtained for data that showed significant skew. Mean and SD were also calculated for sleep duration and sleep efficiency measured by actigraphy.
Two‐tailed t tests were used to examine the association between memory and gender and African American race. Cuzick's nonparametric test of trend was used to test the association between age quartile and recall and recognition scores.[24] Mean and standard deviation for the correct total score and incorrect total score for the medical vignette were calculated. Pearson's correlation coefficient was used to examine the association between USC‐REMT memory measures and medical vignette score.
Pearson's correlation coefficient was calculated to test the associations between sleep duration and memory scores (immediate and delayed recall, immediate and delayed recognition, medical vignette task). This test was repeated to examine the relationship between sleep efficiency and the above memory scores. Linear regression models were used to characterize the relationship between inpatient sleep duration and efficiency and memory task performance. Two‐tailed t tests were used to compare sleep metrics (duration and efficiency) between high‐ and low‐memory groups, with low memory defined as immediate recall of 3 words.
All statistical tests were conducted using Stata 12.0 software (StataCorp, College Station, TX). Statistical significance was defined as P<0.05.
RESULTS
From April 11, 2013 to May 3, 2014, 322 patients were eligible for our study. Of these, 99 patients were enrolled in the study. We were able to collect sleep actigraphy data and immediate memory scores from 59 on day 2 of the study (Figure 1).
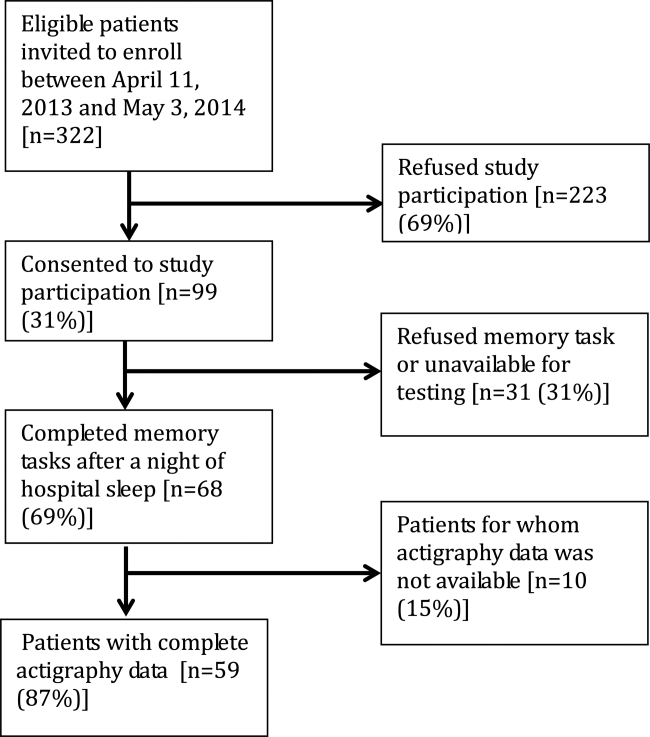
The study population had a mean age of 61.6 years (SD=9.3 years). Demographic information is presented in Table 1. Average nightly sleep in the hospital was 5.44 hours (326.4 minutes, SD=134.5 minutes), whereas mean sleep efficiency was 70.9 (SD=17.1), which is below the normal threshold of 85%.[25, 26] Forty‐four percent had a KSQI score of 3, representing in‐hospital sleep quality in the insomniac range.
| Value | |
|---|---|
| |
| Patient characteristics | |
| Age, y, mean (SD) | 61.6 (9.3) |
| Female, n (%) | 36 (61.0%) |
| BMI, n (%) | |
| Underweight (<18.5) | 3 (5.1%) |
| Normal weight (18.524.9) | 16 (27.1%) |
| Overweight (25.029.9) | 14 (23.7%) |
| Obese (30.0) | 26 (44.1%) |
| African American, n (%) | 43 (72.9%) |
| Non‐Hispanic, n (%) | 57 (96.6%) |
| Education, n (%) | |
| Did not finish high school | 13 (23.2%) |
| High school graduate | 13 (23.2%) |
| Some college or junior college | 16 (28.6%) |
| College graduate or postgraduate degree | 13 (23.2%) |
| Discharge diagnosis (ICD‐9‐CM classification), n (%) | |
| Circulatory system disease | 5 (8.5%) |
| Digestive system disease | 9 (15.3%) |
| Genitourinary system disease | 4 (6.8%) |
| Musculoskeletal system disease | 3 (5.1%) |
| Respiratory system disease | 5 (8.5%) |
| Sensory organ disease | 1 (1.7%) |
| Skin and subcutaneous tissue disease | 3 (5.1%) |
| Endocrine, nutritional, and metabolic disease | 7 (11.9%) |
| Infection and parasitic disease | 6 (10.2%) |
| Injury and poisoning | 4 (6.8%) |
| Mental disorders | 2 (3.4%) |
| Neoplasm | 5 (8.5%) |
| Symptoms, signs, and ill‐defined conditions | 5 (8.5%) |
| Comorbidities by self‐report, n=57, n (%) | |
| Cancer | 6 (10.5%) |
| Depression | 15 (26.3%) |
| Diabetes | 15 (26.3%) |
| Heart trouble | 16 (28.1%) |
| HIV/AIDS | 2 (3.5%) |
| Kidney disease | 10 (17.5%) |
| Liver disease | 9 (15.8%) |
| Stroke | 4 (7.0%) |
| Subject on the hematology and oncology service, n (%) | 6 (10.2%) |
| Sleep characteristics | |
| Nights in hospital prior to enrollment, n (%) | |
| 0 nights | 12 (20.3%) |
| 1 night | 24 (40.7%) |
| 2 nights | 17 (28.8%) |
| 3 nights | 6 (10.1%) |
| Received pharmacologic sleep aids, n (%) | 10 (17.0%) |
| Karolinska Sleep Quality Index scores, score 3, n (%) | 26 (44.1%) |
| Sleep duration, min, mean (SD) | 326.4 (134.5) |
| Sleep efficiency, %, mean (SD) | 70.9 (17.1) |
Memory test scores are presented in Figure 2. Nearly half (49%) of patients had poor memory, defined by a score of 3 words (Figure 2). Immediate recall scores varied significantly with age quartile, with older subjects recalling fewer words (Q1 [age 50.453.6 years] mean=4.9 words; Q2 [age 54.059.2 years] mean=4.1 words; Q3 [age 59.466.9 years] mean=3.7 words; Q4 [age 68.285.0 years] mean=2.5 words; P=0.001). Immediate recognition scores did not vary significantly by age quartile (Q1 [age 50.453.6 years] mean=10.3 words; Q2 [age 54.059.2 years] mean =10.3 words; Q3 [age 59.466.9 years)] mean=11.8 words; Q4 [age 68.285.0 years] mean=10.4 words; P=0.992). Fifty‐two subjects completed the delayed memory tasks. The median delayed recall score was low, at 1 word (IQR=02), with 44% of subjects remembering 0 items. Delayed memory scores were not associated with age quartile. There was no association between any memory scores and gender or African American race.
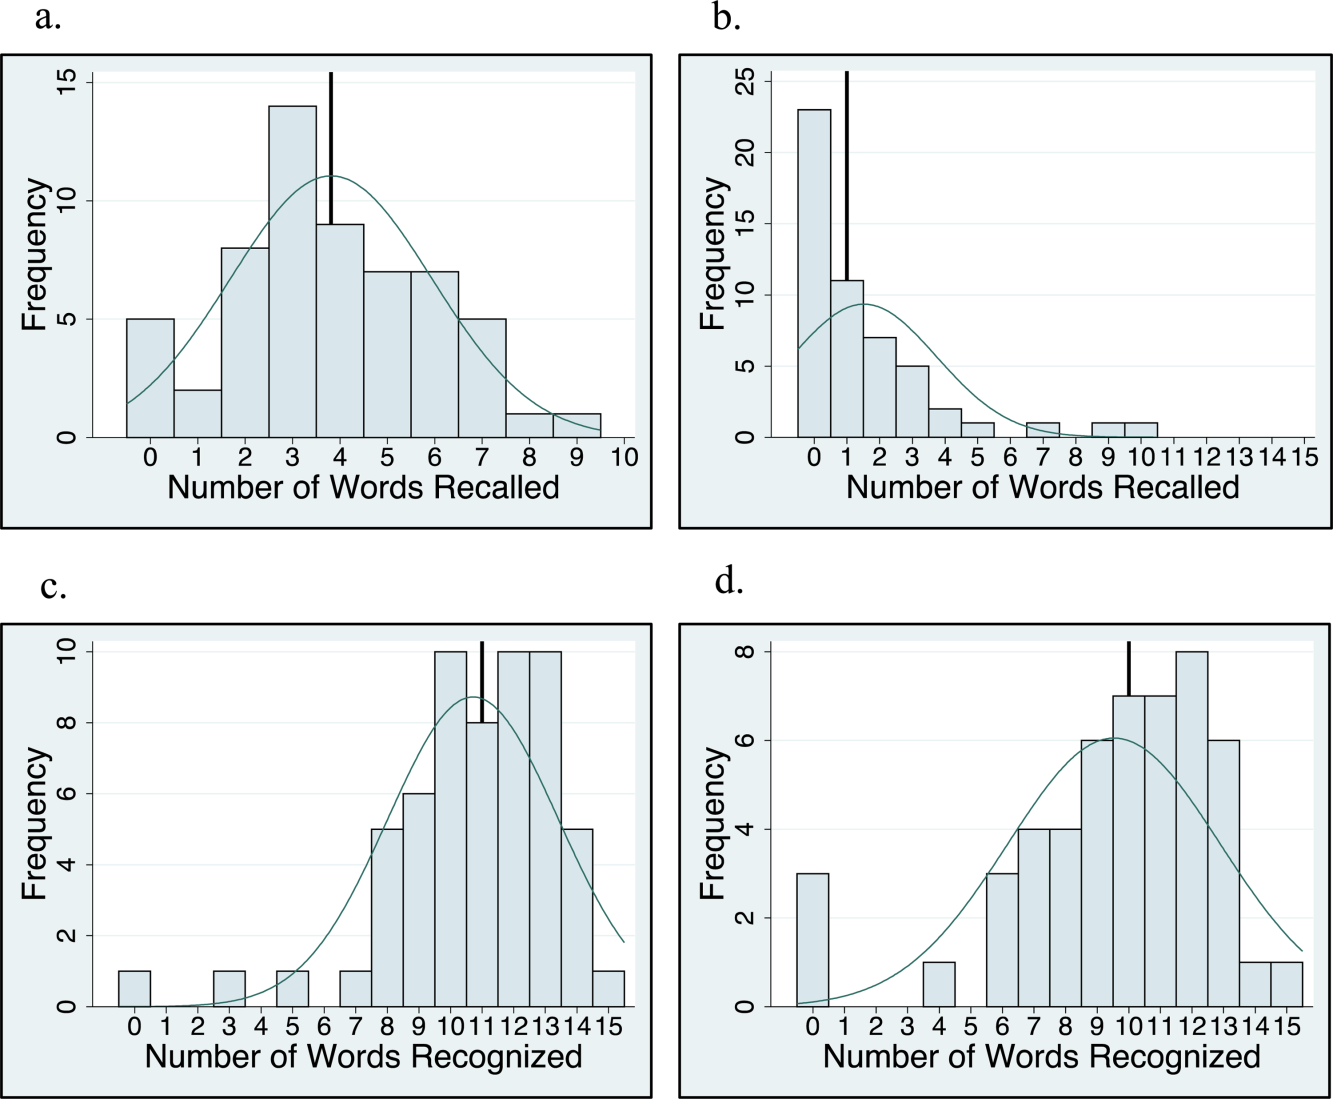
For 35 subjects in this study, we piloted the use of the medical vignette memory task. Two raters scored subject responses. Of the 525 total items, there was 98.1% agreement between the 2 raters, and only 7 out of 35 subjects' total scores differed between the 2 raters (see Supporting Information, Appendix 2B, in the online version of this article for detailed results). Median number of items remembered correctly was 4 out of 15 (IQR=26). Median number of incorrectly remembered items was 0.5 (IQR=01). Up to 57% (20 subjects) incorrectly remembered at least 1 item. The medical vignette memory score was significantly correlated with immediate recall score (r=0.49, P<0.01), but not immediate recognition score (r=0.24, P=0.16), delayed recall (r=0.13, P=0.47), or delayed recognition (r=0.01, P=0.96). There was a negative relationship between the number of items correctly recalled by a subject and the number of incorrectly recalled items on the medical vignette memory task that did not reach statistical significance (r=0.32, P=0.06).
There was no association between sleep duration, sleep efficiency, and KSQI with memory scores (immediate and delayed recall, immediate and delayed recognition, medical vignette task) (Table 2.) The relationship between objective sleep measures and immediate memory are plotted in Figure 3. Finally, there was no significant difference in sleep duration or efficiency between groups with high memory (immediate recall of >3 words) and low memory (immediate recall of 3 words).
| Independent Variables | ||||
|---|---|---|---|---|
| Sleep Duration, h | Sleep Efficiency, % | Karolinska Sleep Quality Index | ||
| Immediate recall (n=59) | Pearson's r | 0.044 | 0.2 | 0.18 |
| coefficient | 0.042 | 0.025 | 0.27 | |
| P value | 0.74 | 0.12 | 0.16 | |
| Immediate recognition (n=59) | Pearson's r | 0.066 | 0.037 | 0.13 |
| coefficient | 0.080 | 0.0058 | 0.25 | |
| P value | 0.62 | 0.78 | 0.31 | |
| Delayed recall (n=52) | Pearson's r | 0.028 | 0.0020 | 0.0081 |
| coefficient | 0.027 | 0.00025 | 0.012 | |
| P value | 0.85 | 0.99 | 0.96 | |
| Delayed recognition (n=52) | Pearson's r | 0.21 | 0.12 | 0.15 |
| coefficient | 0.31 | 0.024 | 0.35 | |
| P value | 0.13 | 0.39 | 0.29 | |
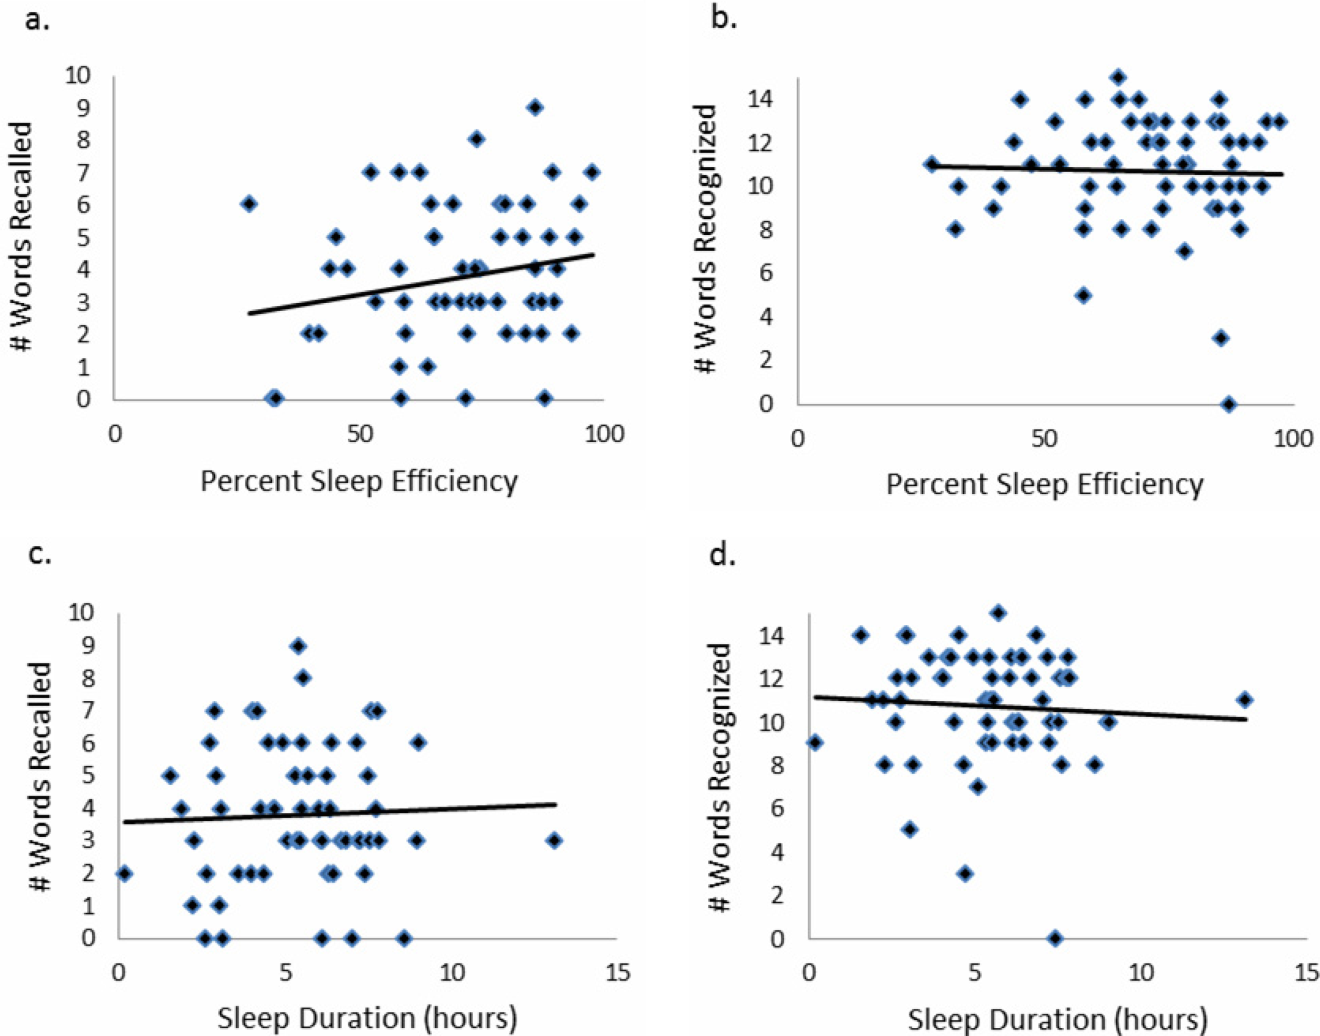
CONCLUSIONS/DISCUSSION
This study demonstrated that roughly half of hospitalized older adults without diagnosed memory or cognitive impairment had poor memory using an immediate word recall task. Although performance on an immediate word recall task may not be considered a good approximation for remembering discharge instructions, immediate recall did correlate with performance on a more complex medical vignette memory task. Though our subjects had low sleep efficiency and duration while in the hospital, memory performance was not significantly associated with inpatient sleep.
Perhaps the most concerning finding in this study was the substantial number of subjects who had poor memory. In addition to scoring approximately 1 SD lower than the community sample of healthy older adults tested in the sensitivity study of USC‐REMT,[14] our subjects also scored lower on immediate recall when compared to another hospitalized patient study.[4] In the study by Lindquist et al. that utilized a similar 15‐item word recall task in hospitalized patients, 29% of subjects were found to have poor memory (recall score of 3 words), compared to 49% in our study. In our 24‐hour delayed recall task we found that 44% of our patients could not recall a single word, with 65% remembering 1 word or fewer. In their study, Lindquist et al. similarly found that greater than 50% of subjects qualified as poor memory by recalling 1 or fewer words after merely an 8‐minute delay. Given these findings, hospitalization may not be the optimal teachable moment that it is often suggested to be. Use of transition coaches, memory aids like written instructions and reminders, and involvement of caregivers are likely critical to ensuring inpatients retain instructions and knowledge. More focus also needs to be given to older patients, who often have the worst memory. Technology tools, such as the Vocera Good To Go app, could allow medical professionals to make audio recordings of discharge instructions that patients may access at any time on a mobile device.
This study also has implications for how to measure memory in inpatients. For example, a vignette‐based memory test may be appropriate for assessing inpatient memory for discharge instructions. Our task was easy to administer and correlated with immediate recall scores. Furthermore, the story‐based task helps us to establish a sense of how much information from a paragraph is truly remembered. Our data show that only 4 items of 15 were remembered, and the majority of subjects actually misremembered 1 item. This latter measure sheds light on the rate of inaccuracy of patient recall. It is worth noting also that word recognition showed a ceiling effect in our sample, suggesting the task was too easy. In contrast, delayed recall was too difficult, as scores showed a floor effect, with over half of our sample unable to recall a single word after a 24‐hour delay.
This is the first study to assess the relationship between sleep loss and memory in hospitalized patients. We found that memory scores were not significantly associated with sleep duration, sleep efficiency, or with the self‐reported KSQI. Memory during hospitalization may be affected by factors other than sleep, like cognition, obscuring the relationship between sleep and memory. It is also possible that we were unable to see a significant association between sleep and memory because of universally low sleep duration and efficiency scores in the hospital.
Our study has several limitations. Most importantly, this study includes a small number of subjects who were hospitalized on a general medicine service at a single institution, limiting generalizability. Also importantly, our data capture only 1 night of sleep, and this may limit our study's ability to detect an association between hospital sleep and memory. More longitudinal data measuring sleep and memory across a longer period of time may reveal the distinct contribution of in‐hospital sleep. We also excluded patients with known cognitive impairment from enrollment, limiting our patient population to those with only high cognitive reserve. We hypothesize that patients with dementia experience both increased sleep disturbance and greater decline in memory during hospitalization. In addition, we are unable to test causal associations in this observational study. Furthermore, we applied a standardized memory test, the USC‐REMT, in a hospital setting, where noise and other disruptions at the time of test administration cannot be completely controlled. This makes it difficult to compare our results with those of community‐dwelling members taking the test under optimal conditions. Finally, because we created our own medical vignette task, future testing to validate this method against other memory testing is warranted.
In conclusion, our results show that memory in older hospitalized inpatients is often impaired, despite patients' appearing cognitively intact. These deficits in memory are revealed by a word recall task and also by a medical vignette task that more closely approximates memory for complex discharge instructions.
Disclosure
This work was funded by the National Institute on Aging Short‐Term Aging‐Related Research Program (5T35AG029795),the National Institute on Aging Career Development Award (K23AG033763), and the National Heart Lung and Blood Institute (R25 HL116372).
- . Importance of in‐hospital initiation of evidence‐based medical therapies for heart failure: taking advantage of the teachable moment. Congest Heart Fail. 2005;11(3):153–154.
- , , , , . Smoking cessation in hospitalized patients: results of a randomized trial. Arch Intern Med. 1997;157(4):409–415.
- , , . Smoking cessation interventions for hospitalized smokers: a systematic review. Arch Intern Med. 2008;168(18):1950–1960.
- , , , , . Improvements in cognition following hospital discharge of community dwelling seniors. J Gen Intern Med. 2011;26(7):765–770.
- , , , . Sleep and aging: 1. sleep disorders commonly found in older people. Can Med Assoc J. 2007;176(9):1299–1304.
- . Noise and sleep among adult medical inpatients: far from a quiet night. Arch Intern Med. 2012;172(1):68–70.
- , , , , , . Perceived control and sleep in hospitalized older adults: a sound hypothesis? J Hosp Med. 2013;8(4):184–190.
- , . A meta‐analysis of the impact of short‐term sleep deprivation on cognitive variables. Psychol Bull. 2010;136(3):375–389.
- , . Sleep deprivation: Impact on cognitive performance. Neuropsychiatr Dis Treat. 2007;3(5):553–567.
- , , , et al. Effects of physician experience on costs and outcomes on an academic general medicine service: results of a trial of hospitalists. Ann Intern Med. 2002;137(11):866–874.
- , , . “Mini‐mental state”: a practical method for grading the cognitive state of patients for the clinician. J Psychiatr Res. 1975;12(3):189–198.
- . A short portable mental status questionnaire for the assessment of organic brain deficit in elderly patients. J Am Geriatr Soc. 1975;10:433–441.
- , , , . Reliability and validity of the Short Portable Mental Status Questionnaire administered by telephone. J Geriatr Psychiatry Neurol. 1994;7(1):33–38.
- , , , . Aging, recall and recognition: a study on the sensitivity of the University of Southern California Repeatable Episodic Memory Test (USC‐REMT). J Clin Exp Neuropsychol. 2004;26(3):428–440.
- , , , , . University of southern california repeatable episodic memory test. J Clin Exp Neuropsychol. 1995;17(6):926–936.
- , , . Development of alternate paragraphs for the logical memory subtest of the Wechsler Memory Scale‐Revised. Clin Neuropsychol. 1997;11(4):370–374.
- , , . A Compendium of Neuropsychological Tests: Administration, Norms, and Commentary. 3rd ed. New York, NY: Oxford University Press; 2009.
- . Review of physical activity measurement using accelerometers in older adults: considerations for research design and conduct. Prev Med. 2009;48(2):108–114.
- , , , , , . The actigraph data analysis software: I. A novel approach to scoring and interpreting sleep‐wake activity. Percept Mot Skills. 1997;85(1):207–216.
- , , , et al. Evaluation of immobility time for sleep latency in actigraphy. Sleep Med. 2009;10(6):621–625.
- , , , , . The subjective meaning of sleep quality: a comparison of individuals with and without insomnia. Sleep. 2008;31(3):383–393.
- , . Objective components of individual differences in subjective sleep quality. J Sleep Res. 1997;6(4):217–220.
- , , , , , . Research electronic data capture (REDCap)—a metadata‐driven methodology and workflow process for providing translational research informatics support. J Biomed Inform. 2009;42(2):377–381.
- . A Wilcoxon‐type test for trend. Stat Med. 1985;4(1):87–90.
- , , , et al. Derivation of research diagnostic criteria for insomnia: report of an American Academy of Sleep Medicine Work Group. Sleep. 2004;27(8):1567–1596.
- , , , , . Quantitative criteria for insomnia. Behav Res Ther. 2003;41(4):427–445.
Hospitalization is often utilized as a teachable moment, as patients are provided with education about treatment and disease management, particularly at discharge.[1, 2, 3] However, memory impairment among hospitalized patients may undermine the utility of the teachable moment. In one study of community‐dwelling seniors admitted to the hospital, one‐third had previously unrecognized poor memory at discharge.[4]
Sleep loss may be an underappreciated contributor to short‐term memory deficits in inpatients, particularly in seniors, who have baseline higher rates of sleep disruptions and sleep disorders.[5] Patients often receive 2 hours less sleep than at home and experience poor quality sleep due to disruptions.[6, 7] Robust studies of healthy subjects in laboratory settings demonstrate that sleep loss leads to decreased attention and worse recall, and that more sleep is associated with better memory performance.[8, 9]
Very few studies have examined memory in hospitalized patients. Although word‐list tasks are often used to assess memory because they are quick and easy to administer, these tasks may not accurately reflect memory for a set of instructions provided at patient discharge. Finally, no studies have examined the association between inpatient sleep loss and memory. Thus, our primary aim in this study was to examine memory performance in older, hospitalized patients using a word listbased memory task and a more complex medical vignette task. Our second aim was to investigate the relationship between in‐hospital sleep and memory.
METHODS
Study Design
We conducted a prospective cohort study with subjects enrolled in an ongoing sleep study at the University of Chicago Medical Center.[10] Eligible subjects were on the general medicine or hematology/oncology service, at least 50 years old, community dwelling, ambulatory, and without detectable cognitive impairment on the Mini Mental State Exam[11] or Short Portable Mental Status Questionnaire.[12, 13] Patients were excluded if they had a documented sleep disorder (ie, obstructive sleep apnea), were transferred from an intensive care unit or were in droplet or airborne isolation, had a bedrest order, or had already spent over 72 hours in the hospital prior to enrollment. These criteria were used to select a population appropriate for wristwatch actigraphy and with low likelihood of baseline memory impairment. The University of Chicago Institutional Review Board approved this study, and participants provided written consent.
Data Collection
Memory Testing
Memory was evaluated using the University of Southern California Repeatable Episodic Memory Test (USC‐REMT), a validated verbal memory test in which subjects listen to a list of 15 words and then complete free‐recall and recognition of the list.[14, 15] Free‐recall tests subjects' ability to procure information without cues. In contrast, recognition requires subjects to pick out the words they just heard from distractors, an easier task. The USC‐REMT contains multiple functionally equivalent different word lists, and may be administered more than once to the same subject without learning effects.[15] Immediate and delayed memory were tested by asking the subject to complete the tasks immediately after listening to the word list and 24‐hours after listening to the list, respectively.
Immediate Recall and Recognition
Recall and recognition following a night of sleep in the hospital was the primary outcome for this study. After 1 night of actigraphy recorded sleep, subjects listened as a 15‐item word list (word list A) was read aloud. For the free‐recall task, subjects were asked to repeat back all the words they could remember immediately after hearing the list. For the recognition task, subjects were read a new list of 15 words, including a mix of words from the previous list and new distractor words. They answered yes if they thought the word had previously been read to them and no if they thought the word was new.
Delayed Recall and Delayed Recognition
At the conclusion of study enrollment on day 1 prior to the night of actigraphy, subjects were shown a laminated paper with a printed word list (word list B) from the USC‐REMT. They were given 2 minutes to study the sheet and were informed they would be asked to remember the words the following day. One day later, after the night of actigraphy recorded sleep, subjects completed the free recall and yes/no recognition task based on what they remembered from word list B. This established delayed recall and recognition scores.
Medical Vignette
Because it is unclear how word recall and recognition tasks approximate remembering discharge instructions, we developed a 5‐sentence vignette about an outpatient medical encounter, based on the logical memory component of the Wechsler Memory Scale IV, a commonly used, validated test of memory assessment.[16, 17] After the USC‐REMT was administered following a night of sleep in the hospital, patients listened to a story and were immediately asked to repeat back in free form as much information as possible from the story. Responses were recorded by trained research assistants. The story is comprised of short sentences with simple ideas and vocabulary (see Supporting Information, Appendix 1, in the online version of this article).
Sleep: Wrist Actigraphy and Karolinska Sleep Log
Patient sleep was measured by actigraphy following the protocol described previously by our group.[7] Patients wore a wrist actigraphy monitor (Actiwatch 2; Philips Respironics, Inc., Murrysville, PA) to collect data on sleep duration and quality. The monitor detects wrist movement by measuring acceleration.[18] Actigraphy has been validated against polysomnography, demonstrating a correlation in sleep duration of 0.82 in insomniacs and 0.97 in healthy subjects.[19] Sleep duration and sleep efficiency overnight were calculated from the actigraphy data using Actiware 5 software.[20] Sleep duration was defined by the software based on low levels of recorded movement. Sleep efficiency was calculated as the percentage of time asleep out of the subjects' self‐reported time in bed, which was obtained using the Karolinska Sleep Log.[21]
The Karolinska Sleep Log questionnaire also asks patients to rate their sleep quality, restlessness during sleep, ease of falling asleep and the ability to sleep through the night on a 5‐point scale. The Karolinska Sleep Quality Index (KSQI) is calculated by averaging the latter 4 items.[22] A score of 3 or less classifies the subject in an insomniac range.[7, 21]
Demographic Information
Demographic information, including age, race, and gender were obtained by chart audit.
Data Analysis
Data were entered into REDCap, a secure online tool for managing survey data.[23]
Memory Scoring
For immediate and delayed recall scores, subjects received 1 point for every word they remembered correctly, with a maximum score of 15 words. We defined poor memory on the immediate recall test as a score of 3 or lower, based on a score utilized by Lindquist et al.[4] in a similar task. This score was less than half of the mean score of 6.63 obtained by Parker et al. for a sample of healthy 60 to 79 year olds in a sensitivity study of the USC‐REMT.[14] For immediate and delayed recognition, subjects received 1 point for correctly identifying whether a word had been on the word list they heard or whether it was a distractor, with a maximum score of 15.
A key was created to standardize scoring of the medical vignette by assigning 1 point to specific correctly remembered items from the story (see Supporting Information, Appendix 2A, in the online version of this article). These points were added to obtain a total score for correctly remembered vignette items. It was also noted when a vignette item was remembered incorrectly, for example, when the patient remembered left foot instead of right foot. Each incorrectly remembered item received 1 point, and these were summed to create the total score for incorrectly remembered vignette items (see Supporting Information, Appendix 2A, in the online version of this article for the scoring guide). Forgotten items were assigned 0 points. Two independent raters scored each subject's responses, and their scores were averaged for each item. Inter‐rater reliability was calculated as percentage of agreement across responses.
Statistical Analysis
Descriptive statistics were performed on the memory task data. Tests for skew and curtosis were performed for recall and recognition task data. The mean and standard deviation (SD) were calculated for normally distributed data, and the median and interquartile range (IQR) were obtained for data that showed significant skew. Mean and SD were also calculated for sleep duration and sleep efficiency measured by actigraphy.
Two‐tailed t tests were used to examine the association between memory and gender and African American race. Cuzick's nonparametric test of trend was used to test the association between age quartile and recall and recognition scores.[24] Mean and standard deviation for the correct total score and incorrect total score for the medical vignette were calculated. Pearson's correlation coefficient was used to examine the association between USC‐REMT memory measures and medical vignette score.
Pearson's correlation coefficient was calculated to test the associations between sleep duration and memory scores (immediate and delayed recall, immediate and delayed recognition, medical vignette task). This test was repeated to examine the relationship between sleep efficiency and the above memory scores. Linear regression models were used to characterize the relationship between inpatient sleep duration and efficiency and memory task performance. Two‐tailed t tests were used to compare sleep metrics (duration and efficiency) between high‐ and low‐memory groups, with low memory defined as immediate recall of 3 words.
All statistical tests were conducted using Stata 12.0 software (StataCorp, College Station, TX). Statistical significance was defined as P<0.05.
RESULTS
From April 11, 2013 to May 3, 2014, 322 patients were eligible for our study. Of these, 99 patients were enrolled in the study. We were able to collect sleep actigraphy data and immediate memory scores from 59 on day 2 of the study (Figure 1).
The study population had a mean age of 61.6 years (SD=9.3 years). Demographic information is presented in Table 1. Average nightly sleep in the hospital was 5.44 hours (326.4 minutes, SD=134.5 minutes), whereas mean sleep efficiency was 70.9 (SD=17.1), which is below the normal threshold of 85%.[25, 26] Forty‐four percent had a KSQI score of 3, representing in‐hospital sleep quality in the insomniac range.
| Value | |
|---|---|
| |
| Patient characteristics | |
| Age, y, mean (SD) | 61.6 (9.3) |
| Female, n (%) | 36 (61.0%) |
| BMI, n (%) | |
| Underweight (<18.5) | 3 (5.1%) |
| Normal weight (18.524.9) | 16 (27.1%) |
| Overweight (25.029.9) | 14 (23.7%) |
| Obese (30.0) | 26 (44.1%) |
| African American, n (%) | 43 (72.9%) |
| Non‐Hispanic, n (%) | 57 (96.6%) |
| Education, n (%) | |
| Did not finish high school | 13 (23.2%) |
| High school graduate | 13 (23.2%) |
| Some college or junior college | 16 (28.6%) |
| College graduate or postgraduate degree | 13 (23.2%) |
| Discharge diagnosis (ICD‐9‐CM classification), n (%) | |
| Circulatory system disease | 5 (8.5%) |
| Digestive system disease | 9 (15.3%) |
| Genitourinary system disease | 4 (6.8%) |
| Musculoskeletal system disease | 3 (5.1%) |
| Respiratory system disease | 5 (8.5%) |
| Sensory organ disease | 1 (1.7%) |
| Skin and subcutaneous tissue disease | 3 (5.1%) |
| Endocrine, nutritional, and metabolic disease | 7 (11.9%) |
| Infection and parasitic disease | 6 (10.2%) |
| Injury and poisoning | 4 (6.8%) |
| Mental disorders | 2 (3.4%) |
| Neoplasm | 5 (8.5%) |
| Symptoms, signs, and ill‐defined conditions | 5 (8.5%) |
| Comorbidities by self‐report, n=57, n (%) | |
| Cancer | 6 (10.5%) |
| Depression | 15 (26.3%) |
| Diabetes | 15 (26.3%) |
| Heart trouble | 16 (28.1%) |
| HIV/AIDS | 2 (3.5%) |
| Kidney disease | 10 (17.5%) |
| Liver disease | 9 (15.8%) |
| Stroke | 4 (7.0%) |
| Subject on the hematology and oncology service, n (%) | 6 (10.2%) |
| Sleep characteristics | |
| Nights in hospital prior to enrollment, n (%) | |
| 0 nights | 12 (20.3%) |
| 1 night | 24 (40.7%) |
| 2 nights | 17 (28.8%) |
| 3 nights | 6 (10.1%) |
| Received pharmacologic sleep aids, n (%) | 10 (17.0%) |
| Karolinska Sleep Quality Index scores, score 3, n (%) | 26 (44.1%) |
| Sleep duration, min, mean (SD) | 326.4 (134.5) |
| Sleep efficiency, %, mean (SD) | 70.9 (17.1) |
Memory test scores are presented in Figure 2. Nearly half (49%) of patients had poor memory, defined by a score of 3 words (Figure 2). Immediate recall scores varied significantly with age quartile, with older subjects recalling fewer words (Q1 [age 50.453.6 years] mean=4.9 words; Q2 [age 54.059.2 years] mean=4.1 words; Q3 [age 59.466.9 years] mean=3.7 words; Q4 [age 68.285.0 years] mean=2.5 words; P=0.001). Immediate recognition scores did not vary significantly by age quartile (Q1 [age 50.453.6 years] mean=10.3 words; Q2 [age 54.059.2 years] mean =10.3 words; Q3 [age 59.466.9 years)] mean=11.8 words; Q4 [age 68.285.0 years] mean=10.4 words; P=0.992). Fifty‐two subjects completed the delayed memory tasks. The median delayed recall score was low, at 1 word (IQR=02), with 44% of subjects remembering 0 items. Delayed memory scores were not associated with age quartile. There was no association between any memory scores and gender or African American race.
For 35 subjects in this study, we piloted the use of the medical vignette memory task. Two raters scored subject responses. Of the 525 total items, there was 98.1% agreement between the 2 raters, and only 7 out of 35 subjects' total scores differed between the 2 raters (see Supporting Information, Appendix 2B, in the online version of this article for detailed results). Median number of items remembered correctly was 4 out of 15 (IQR=26). Median number of incorrectly remembered items was 0.5 (IQR=01). Up to 57% (20 subjects) incorrectly remembered at least 1 item. The medical vignette memory score was significantly correlated with immediate recall score (r=0.49, P<0.01), but not immediate recognition score (r=0.24, P=0.16), delayed recall (r=0.13, P=0.47), or delayed recognition (r=0.01, P=0.96). There was a negative relationship between the number of items correctly recalled by a subject and the number of incorrectly recalled items on the medical vignette memory task that did not reach statistical significance (r=0.32, P=0.06).
There was no association between sleep duration, sleep efficiency, and KSQI with memory scores (immediate and delayed recall, immediate and delayed recognition, medical vignette task) (Table 2.) The relationship between objective sleep measures and immediate memory are plotted in Figure 3. Finally, there was no significant difference in sleep duration or efficiency between groups with high memory (immediate recall of >3 words) and low memory (immediate recall of 3 words).
| Independent Variables | ||||
|---|---|---|---|---|
| Sleep Duration, h | Sleep Efficiency, % | Karolinska Sleep Quality Index | ||
| Immediate recall (n=59) | Pearson's r | 0.044 | 0.2 | 0.18 |
| coefficient | 0.042 | 0.025 | 0.27 | |
| P value | 0.74 | 0.12 | 0.16 | |
| Immediate recognition (n=59) | Pearson's r | 0.066 | 0.037 | 0.13 |
| coefficient | 0.080 | 0.0058 | 0.25 | |
| P value | 0.62 | 0.78 | 0.31 | |
| Delayed recall (n=52) | Pearson's r | 0.028 | 0.0020 | 0.0081 |
| coefficient | 0.027 | 0.00025 | 0.012 | |
| P value | 0.85 | 0.99 | 0.96 | |
| Delayed recognition (n=52) | Pearson's r | 0.21 | 0.12 | 0.15 |
| coefficient | 0.31 | 0.024 | 0.35 | |
| P value | 0.13 | 0.39 | 0.29 | |
CONCLUSIONS/DISCUSSION
This study demonstrated that roughly half of hospitalized older adults without diagnosed memory or cognitive impairment had poor memory using an immediate word recall task. Although performance on an immediate word recall task may not be considered a good approximation for remembering discharge instructions, immediate recall did correlate with performance on a more complex medical vignette memory task. Though our subjects had low sleep efficiency and duration while in the hospital, memory performance was not significantly associated with inpatient sleep.
Perhaps the most concerning finding in this study was the substantial number of subjects who had poor memory. In addition to scoring approximately 1 SD lower than the community sample of healthy older adults tested in the sensitivity study of USC‐REMT,[14] our subjects also scored lower on immediate recall when compared to another hospitalized patient study.[4] In the study by Lindquist et al. that utilized a similar 15‐item word recall task in hospitalized patients, 29% of subjects were found to have poor memory (recall score of 3 words), compared to 49% in our study. In our 24‐hour delayed recall task we found that 44% of our patients could not recall a single word, with 65% remembering 1 word or fewer. In their study, Lindquist et al. similarly found that greater than 50% of subjects qualified as poor memory by recalling 1 or fewer words after merely an 8‐minute delay. Given these findings, hospitalization may not be the optimal teachable moment that it is often suggested to be. Use of transition coaches, memory aids like written instructions and reminders, and involvement of caregivers are likely critical to ensuring inpatients retain instructions and knowledge. More focus also needs to be given to older patients, who often have the worst memory. Technology tools, such as the Vocera Good To Go app, could allow medical professionals to make audio recordings of discharge instructions that patients may access at any time on a mobile device.
This study also has implications for how to measure memory in inpatients. For example, a vignette‐based memory test may be appropriate for assessing inpatient memory for discharge instructions. Our task was easy to administer and correlated with immediate recall scores. Furthermore, the story‐based task helps us to establish a sense of how much information from a paragraph is truly remembered. Our data show that only 4 items of 15 were remembered, and the majority of subjects actually misremembered 1 item. This latter measure sheds light on the rate of inaccuracy of patient recall. It is worth noting also that word recognition showed a ceiling effect in our sample, suggesting the task was too easy. In contrast, delayed recall was too difficult, as scores showed a floor effect, with over half of our sample unable to recall a single word after a 24‐hour delay.
This is the first study to assess the relationship between sleep loss and memory in hospitalized patients. We found that memory scores were not significantly associated with sleep duration, sleep efficiency, or with the self‐reported KSQI. Memory during hospitalization may be affected by factors other than sleep, like cognition, obscuring the relationship between sleep and memory. It is also possible that we were unable to see a significant association between sleep and memory because of universally low sleep duration and efficiency scores in the hospital.
Our study has several limitations. Most importantly, this study includes a small number of subjects who were hospitalized on a general medicine service at a single institution, limiting generalizability. Also importantly, our data capture only 1 night of sleep, and this may limit our study's ability to detect an association between hospital sleep and memory. More longitudinal data measuring sleep and memory across a longer period of time may reveal the distinct contribution of in‐hospital sleep. We also excluded patients with known cognitive impairment from enrollment, limiting our patient population to those with only high cognitive reserve. We hypothesize that patients with dementia experience both increased sleep disturbance and greater decline in memory during hospitalization. In addition, we are unable to test causal associations in this observational study. Furthermore, we applied a standardized memory test, the USC‐REMT, in a hospital setting, where noise and other disruptions at the time of test administration cannot be completely controlled. This makes it difficult to compare our results with those of community‐dwelling members taking the test under optimal conditions. Finally, because we created our own medical vignette task, future testing to validate this method against other memory testing is warranted.
In conclusion, our results show that memory in older hospitalized inpatients is often impaired, despite patients' appearing cognitively intact. These deficits in memory are revealed by a word recall task and also by a medical vignette task that more closely approximates memory for complex discharge instructions.
Disclosure
This work was funded by the National Institute on Aging Short‐Term Aging‐Related Research Program (5T35AG029795),the National Institute on Aging Career Development Award (K23AG033763), and the National Heart Lung and Blood Institute (R25 HL116372).
Hospitalization is often utilized as a teachable moment, as patients are provided with education about treatment and disease management, particularly at discharge.[1, 2, 3] However, memory impairment among hospitalized patients may undermine the utility of the teachable moment. In one study of community‐dwelling seniors admitted to the hospital, one‐third had previously unrecognized poor memory at discharge.[4]
Sleep loss may be an underappreciated contributor to short‐term memory deficits in inpatients, particularly in seniors, who have baseline higher rates of sleep disruptions and sleep disorders.[5] Patients often receive 2 hours less sleep than at home and experience poor quality sleep due to disruptions.[6, 7] Robust studies of healthy subjects in laboratory settings demonstrate that sleep loss leads to decreased attention and worse recall, and that more sleep is associated with better memory performance.[8, 9]
Very few studies have examined memory in hospitalized patients. Although word‐list tasks are often used to assess memory because they are quick and easy to administer, these tasks may not accurately reflect memory for a set of instructions provided at patient discharge. Finally, no studies have examined the association between inpatient sleep loss and memory. Thus, our primary aim in this study was to examine memory performance in older, hospitalized patients using a word listbased memory task and a more complex medical vignette task. Our second aim was to investigate the relationship between in‐hospital sleep and memory.
METHODS
Study Design
We conducted a prospective cohort study with subjects enrolled in an ongoing sleep study at the University of Chicago Medical Center.[10] Eligible subjects were on the general medicine or hematology/oncology service, at least 50 years old, community dwelling, ambulatory, and without detectable cognitive impairment on the Mini Mental State Exam[11] or Short Portable Mental Status Questionnaire.[12, 13] Patients were excluded if they had a documented sleep disorder (ie, obstructive sleep apnea), were transferred from an intensive care unit or were in droplet or airborne isolation, had a bedrest order, or had already spent over 72 hours in the hospital prior to enrollment. These criteria were used to select a population appropriate for wristwatch actigraphy and with low likelihood of baseline memory impairment. The University of Chicago Institutional Review Board approved this study, and participants provided written consent.
Data Collection
Memory Testing
Memory was evaluated using the University of Southern California Repeatable Episodic Memory Test (USC‐REMT), a validated verbal memory test in which subjects listen to a list of 15 words and then complete free‐recall and recognition of the list.[14, 15] Free‐recall tests subjects' ability to procure information without cues. In contrast, recognition requires subjects to pick out the words they just heard from distractors, an easier task. The USC‐REMT contains multiple functionally equivalent different word lists, and may be administered more than once to the same subject without learning effects.[15] Immediate and delayed memory were tested by asking the subject to complete the tasks immediately after listening to the word list and 24‐hours after listening to the list, respectively.
Immediate Recall and Recognition
Recall and recognition following a night of sleep in the hospital was the primary outcome for this study. After 1 night of actigraphy recorded sleep, subjects listened as a 15‐item word list (word list A) was read aloud. For the free‐recall task, subjects were asked to repeat back all the words they could remember immediately after hearing the list. For the recognition task, subjects were read a new list of 15 words, including a mix of words from the previous list and new distractor words. They answered yes if they thought the word had previously been read to them and no if they thought the word was new.
Delayed Recall and Delayed Recognition
At the conclusion of study enrollment on day 1 prior to the night of actigraphy, subjects were shown a laminated paper with a printed word list (word list B) from the USC‐REMT. They were given 2 minutes to study the sheet and were informed they would be asked to remember the words the following day. One day later, after the night of actigraphy recorded sleep, subjects completed the free recall and yes/no recognition task based on what they remembered from word list B. This established delayed recall and recognition scores.
Medical Vignette
Because it is unclear how word recall and recognition tasks approximate remembering discharge instructions, we developed a 5‐sentence vignette about an outpatient medical encounter, based on the logical memory component of the Wechsler Memory Scale IV, a commonly used, validated test of memory assessment.[16, 17] After the USC‐REMT was administered following a night of sleep in the hospital, patients listened to a story and were immediately asked to repeat back in free form as much information as possible from the story. Responses were recorded by trained research assistants. The story is comprised of short sentences with simple ideas and vocabulary (see Supporting Information, Appendix 1, in the online version of this article).
Sleep: Wrist Actigraphy and Karolinska Sleep Log
Patient sleep was measured by actigraphy following the protocol described previously by our group.[7] Patients wore a wrist actigraphy monitor (Actiwatch 2; Philips Respironics, Inc., Murrysville, PA) to collect data on sleep duration and quality. The monitor detects wrist movement by measuring acceleration.[18] Actigraphy has been validated against polysomnography, demonstrating a correlation in sleep duration of 0.82 in insomniacs and 0.97 in healthy subjects.[19] Sleep duration and sleep efficiency overnight were calculated from the actigraphy data using Actiware 5 software.[20] Sleep duration was defined by the software based on low levels of recorded movement. Sleep efficiency was calculated as the percentage of time asleep out of the subjects' self‐reported time in bed, which was obtained using the Karolinska Sleep Log.[21]
The Karolinska Sleep Log questionnaire also asks patients to rate their sleep quality, restlessness during sleep, ease of falling asleep and the ability to sleep through the night on a 5‐point scale. The Karolinska Sleep Quality Index (KSQI) is calculated by averaging the latter 4 items.[22] A score of 3 or less classifies the subject in an insomniac range.[7, 21]
Demographic Information
Demographic information, including age, race, and gender were obtained by chart audit.
Data Analysis
Data were entered into REDCap, a secure online tool for managing survey data.[23]
Memory Scoring
For immediate and delayed recall scores, subjects received 1 point for every word they remembered correctly, with a maximum score of 15 words. We defined poor memory on the immediate recall test as a score of 3 or lower, based on a score utilized by Lindquist et al.[4] in a similar task. This score was less than half of the mean score of 6.63 obtained by Parker et al. for a sample of healthy 60 to 79 year olds in a sensitivity study of the USC‐REMT.[14] For immediate and delayed recognition, subjects received 1 point for correctly identifying whether a word had been on the word list they heard or whether it was a distractor, with a maximum score of 15.
A key was created to standardize scoring of the medical vignette by assigning 1 point to specific correctly remembered items from the story (see Supporting Information, Appendix 2A, in the online version of this article). These points were added to obtain a total score for correctly remembered vignette items. It was also noted when a vignette item was remembered incorrectly, for example, when the patient remembered left foot instead of right foot. Each incorrectly remembered item received 1 point, and these were summed to create the total score for incorrectly remembered vignette items (see Supporting Information, Appendix 2A, in the online version of this article for the scoring guide). Forgotten items were assigned 0 points. Two independent raters scored each subject's responses, and their scores were averaged for each item. Inter‐rater reliability was calculated as percentage of agreement across responses.
Statistical Analysis
Descriptive statistics were performed on the memory task data. Tests for skew and curtosis were performed for recall and recognition task data. The mean and standard deviation (SD) were calculated for normally distributed data, and the median and interquartile range (IQR) were obtained for data that showed significant skew. Mean and SD were also calculated for sleep duration and sleep efficiency measured by actigraphy.
Two‐tailed t tests were used to examine the association between memory and gender and African American race. Cuzick's nonparametric test of trend was used to test the association between age quartile and recall and recognition scores.[24] Mean and standard deviation for the correct total score and incorrect total score for the medical vignette were calculated. Pearson's correlation coefficient was used to examine the association between USC‐REMT memory measures and medical vignette score.
Pearson's correlation coefficient was calculated to test the associations between sleep duration and memory scores (immediate and delayed recall, immediate and delayed recognition, medical vignette task). This test was repeated to examine the relationship between sleep efficiency and the above memory scores. Linear regression models were used to characterize the relationship between inpatient sleep duration and efficiency and memory task performance. Two‐tailed t tests were used to compare sleep metrics (duration and efficiency) between high‐ and low‐memory groups, with low memory defined as immediate recall of 3 words.
All statistical tests were conducted using Stata 12.0 software (StataCorp, College Station, TX). Statistical significance was defined as P<0.05.
RESULTS
From April 11, 2013 to May 3, 2014, 322 patients were eligible for our study. Of these, 99 patients were enrolled in the study. We were able to collect sleep actigraphy data and immediate memory scores from 59 on day 2 of the study (Figure 1).
The study population had a mean age of 61.6 years (SD=9.3 years). Demographic information is presented in Table 1. Average nightly sleep in the hospital was 5.44 hours (326.4 minutes, SD=134.5 minutes), whereas mean sleep efficiency was 70.9 (SD=17.1), which is below the normal threshold of 85%.[25, 26] Forty‐four percent had a KSQI score of 3, representing in‐hospital sleep quality in the insomniac range.
| Value | |
|---|---|
| |
| Patient characteristics | |
| Age, y, mean (SD) | 61.6 (9.3) |
| Female, n (%) | 36 (61.0%) |
| BMI, n (%) | |
| Underweight (<18.5) | 3 (5.1%) |
| Normal weight (18.524.9) | 16 (27.1%) |
| Overweight (25.029.9) | 14 (23.7%) |
| Obese (30.0) | 26 (44.1%) |
| African American, n (%) | 43 (72.9%) |
| Non‐Hispanic, n (%) | 57 (96.6%) |
| Education, n (%) | |
| Did not finish high school | 13 (23.2%) |
| High school graduate | 13 (23.2%) |
| Some college or junior college | 16 (28.6%) |
| College graduate or postgraduate degree | 13 (23.2%) |
| Discharge diagnosis (ICD‐9‐CM classification), n (%) | |
| Circulatory system disease | 5 (8.5%) |
| Digestive system disease | 9 (15.3%) |
| Genitourinary system disease | 4 (6.8%) |
| Musculoskeletal system disease | 3 (5.1%) |
| Respiratory system disease | 5 (8.5%) |
| Sensory organ disease | 1 (1.7%) |
| Skin and subcutaneous tissue disease | 3 (5.1%) |
| Endocrine, nutritional, and metabolic disease | 7 (11.9%) |
| Infection and parasitic disease | 6 (10.2%) |
| Injury and poisoning | 4 (6.8%) |
| Mental disorders | 2 (3.4%) |
| Neoplasm | 5 (8.5%) |
| Symptoms, signs, and ill‐defined conditions | 5 (8.5%) |
| Comorbidities by self‐report, n=57, n (%) | |
| Cancer | 6 (10.5%) |
| Depression | 15 (26.3%) |
| Diabetes | 15 (26.3%) |
| Heart trouble | 16 (28.1%) |
| HIV/AIDS | 2 (3.5%) |
| Kidney disease | 10 (17.5%) |
| Liver disease | 9 (15.8%) |
| Stroke | 4 (7.0%) |
| Subject on the hematology and oncology service, n (%) | 6 (10.2%) |
| Sleep characteristics | |
| Nights in hospital prior to enrollment, n (%) | |
| 0 nights | 12 (20.3%) |
| 1 night | 24 (40.7%) |
| 2 nights | 17 (28.8%) |
| 3 nights | 6 (10.1%) |
| Received pharmacologic sleep aids, n (%) | 10 (17.0%) |
| Karolinska Sleep Quality Index scores, score 3, n (%) | 26 (44.1%) |
| Sleep duration, min, mean (SD) | 326.4 (134.5) |
| Sleep efficiency, %, mean (SD) | 70.9 (17.1) |
Memory test scores are presented in Figure 2. Nearly half (49%) of patients had poor memory, defined by a score of 3 words (Figure 2). Immediate recall scores varied significantly with age quartile, with older subjects recalling fewer words (Q1 [age 50.453.6 years] mean=4.9 words; Q2 [age 54.059.2 years] mean=4.1 words; Q3 [age 59.466.9 years] mean=3.7 words; Q4 [age 68.285.0 years] mean=2.5 words; P=0.001). Immediate recognition scores did not vary significantly by age quartile (Q1 [age 50.453.6 years] mean=10.3 words; Q2 [age 54.059.2 years] mean =10.3 words; Q3 [age 59.466.9 years)] mean=11.8 words; Q4 [age 68.285.0 years] mean=10.4 words; P=0.992). Fifty‐two subjects completed the delayed memory tasks. The median delayed recall score was low, at 1 word (IQR=02), with 44% of subjects remembering 0 items. Delayed memory scores were not associated with age quartile. There was no association between any memory scores and gender or African American race.
For 35 subjects in this study, we piloted the use of the medical vignette memory task. Two raters scored subject responses. Of the 525 total items, there was 98.1% agreement between the 2 raters, and only 7 out of 35 subjects' total scores differed between the 2 raters (see Supporting Information, Appendix 2B, in the online version of this article for detailed results). Median number of items remembered correctly was 4 out of 15 (IQR=26). Median number of incorrectly remembered items was 0.5 (IQR=01). Up to 57% (20 subjects) incorrectly remembered at least 1 item. The medical vignette memory score was significantly correlated with immediate recall score (r=0.49, P<0.01), but not immediate recognition score (r=0.24, P=0.16), delayed recall (r=0.13, P=0.47), or delayed recognition (r=0.01, P=0.96). There was a negative relationship between the number of items correctly recalled by a subject and the number of incorrectly recalled items on the medical vignette memory task that did not reach statistical significance (r=0.32, P=0.06).
There was no association between sleep duration, sleep efficiency, and KSQI with memory scores (immediate and delayed recall, immediate and delayed recognition, medical vignette task) (Table 2.) The relationship between objective sleep measures and immediate memory are plotted in Figure 3. Finally, there was no significant difference in sleep duration or efficiency between groups with high memory (immediate recall of >3 words) and low memory (immediate recall of 3 words).
| Independent Variables | ||||
|---|---|---|---|---|
| Sleep Duration, h | Sleep Efficiency, % | Karolinska Sleep Quality Index | ||
| Immediate recall (n=59) | Pearson's r | 0.044 | 0.2 | 0.18 |
| coefficient | 0.042 | 0.025 | 0.27 | |
| P value | 0.74 | 0.12 | 0.16 | |
| Immediate recognition (n=59) | Pearson's r | 0.066 | 0.037 | 0.13 |
| coefficient | 0.080 | 0.0058 | 0.25 | |
| P value | 0.62 | 0.78 | 0.31 | |
| Delayed recall (n=52) | Pearson's r | 0.028 | 0.0020 | 0.0081 |
| coefficient | 0.027 | 0.00025 | 0.012 | |
| P value | 0.85 | 0.99 | 0.96 | |
| Delayed recognition (n=52) | Pearson's r | 0.21 | 0.12 | 0.15 |
| coefficient | 0.31 | 0.024 | 0.35 | |
| P value | 0.13 | 0.39 | 0.29 | |
CONCLUSIONS/DISCUSSION
This study demonstrated that roughly half of hospitalized older adults without diagnosed memory or cognitive impairment had poor memory using an immediate word recall task. Although performance on an immediate word recall task may not be considered a good approximation for remembering discharge instructions, immediate recall did correlate with performance on a more complex medical vignette memory task. Though our subjects had low sleep efficiency and duration while in the hospital, memory performance was not significantly associated with inpatient sleep.
Perhaps the most concerning finding in this study was the substantial number of subjects who had poor memory. In addition to scoring approximately 1 SD lower than the community sample of healthy older adults tested in the sensitivity study of USC‐REMT,[14] our subjects also scored lower on immediate recall when compared to another hospitalized patient study.[4] In the study by Lindquist et al. that utilized a similar 15‐item word recall task in hospitalized patients, 29% of subjects were found to have poor memory (recall score of 3 words), compared to 49% in our study. In our 24‐hour delayed recall task we found that 44% of our patients could not recall a single word, with 65% remembering 1 word or fewer. In their study, Lindquist et al. similarly found that greater than 50% of subjects qualified as poor memory by recalling 1 or fewer words after merely an 8‐minute delay. Given these findings, hospitalization may not be the optimal teachable moment that it is often suggested to be. Use of transition coaches, memory aids like written instructions and reminders, and involvement of caregivers are likely critical to ensuring inpatients retain instructions and knowledge. More focus also needs to be given to older patients, who often have the worst memory. Technology tools, such as the Vocera Good To Go app, could allow medical professionals to make audio recordings of discharge instructions that patients may access at any time on a mobile device.
This study also has implications for how to measure memory in inpatients. For example, a vignette‐based memory test may be appropriate for assessing inpatient memory for discharge instructions. Our task was easy to administer and correlated with immediate recall scores. Furthermore, the story‐based task helps us to establish a sense of how much information from a paragraph is truly remembered. Our data show that only 4 items of 15 were remembered, and the majority of subjects actually misremembered 1 item. This latter measure sheds light on the rate of inaccuracy of patient recall. It is worth noting also that word recognition showed a ceiling effect in our sample, suggesting the task was too easy. In contrast, delayed recall was too difficult, as scores showed a floor effect, with over half of our sample unable to recall a single word after a 24‐hour delay.
This is the first study to assess the relationship between sleep loss and memory in hospitalized patients. We found that memory scores were not significantly associated with sleep duration, sleep efficiency, or with the self‐reported KSQI. Memory during hospitalization may be affected by factors other than sleep, like cognition, obscuring the relationship between sleep and memory. It is also possible that we were unable to see a significant association between sleep and memory because of universally low sleep duration and efficiency scores in the hospital.
Our study has several limitations. Most importantly, this study includes a small number of subjects who were hospitalized on a general medicine service at a single institution, limiting generalizability. Also importantly, our data capture only 1 night of sleep, and this may limit our study's ability to detect an association between hospital sleep and memory. More longitudinal data measuring sleep and memory across a longer period of time may reveal the distinct contribution of in‐hospital sleep. We also excluded patients with known cognitive impairment from enrollment, limiting our patient population to those with only high cognitive reserve. We hypothesize that patients with dementia experience both increased sleep disturbance and greater decline in memory during hospitalization. In addition, we are unable to test causal associations in this observational study. Furthermore, we applied a standardized memory test, the USC‐REMT, in a hospital setting, where noise and other disruptions at the time of test administration cannot be completely controlled. This makes it difficult to compare our results with those of community‐dwelling members taking the test under optimal conditions. Finally, because we created our own medical vignette task, future testing to validate this method against other memory testing is warranted.
In conclusion, our results show that memory in older hospitalized inpatients is often impaired, despite patients' appearing cognitively intact. These deficits in memory are revealed by a word recall task and also by a medical vignette task that more closely approximates memory for complex discharge instructions.
Disclosure
This work was funded by the National Institute on Aging Short‐Term Aging‐Related Research Program (5T35AG029795),the National Institute on Aging Career Development Award (K23AG033763), and the National Heart Lung and Blood Institute (R25 HL116372).
- . Importance of in‐hospital initiation of evidence‐based medical therapies for heart failure: taking advantage of the teachable moment. Congest Heart Fail. 2005;11(3):153–154.
- , , , , . Smoking cessation in hospitalized patients: results of a randomized trial. Arch Intern Med. 1997;157(4):409–415.
- , , . Smoking cessation interventions for hospitalized smokers: a systematic review. Arch Intern Med. 2008;168(18):1950–1960.
- , , , , . Improvements in cognition following hospital discharge of community dwelling seniors. J Gen Intern Med. 2011;26(7):765–770.
- , , , . Sleep and aging: 1. sleep disorders commonly found in older people. Can Med Assoc J. 2007;176(9):1299–1304.
- . Noise and sleep among adult medical inpatients: far from a quiet night. Arch Intern Med. 2012;172(1):68–70.
- , , , , , . Perceived control and sleep in hospitalized older adults: a sound hypothesis? J Hosp Med. 2013;8(4):184–190.
- , . A meta‐analysis of the impact of short‐term sleep deprivation on cognitive variables. Psychol Bull. 2010;136(3):375–389.
- , . Sleep deprivation: Impact on cognitive performance. Neuropsychiatr Dis Treat. 2007;3(5):553–567.
- , , , et al. Effects of physician experience on costs and outcomes on an academic general medicine service: results of a trial of hospitalists. Ann Intern Med. 2002;137(11):866–874.
- , , . “Mini‐mental state”: a practical method for grading the cognitive state of patients for the clinician. J Psychiatr Res. 1975;12(3):189–198.
- . A short portable mental status questionnaire for the assessment of organic brain deficit in elderly patients. J Am Geriatr Soc. 1975;10:433–441.
- , , , . Reliability and validity of the Short Portable Mental Status Questionnaire administered by telephone. J Geriatr Psychiatry Neurol. 1994;7(1):33–38.
- , , , . Aging, recall and recognition: a study on the sensitivity of the University of Southern California Repeatable Episodic Memory Test (USC‐REMT). J Clin Exp Neuropsychol. 2004;26(3):428–440.
- , , , , . University of southern california repeatable episodic memory test. J Clin Exp Neuropsychol. 1995;17(6):926–936.
- , , . Development of alternate paragraphs for the logical memory subtest of the Wechsler Memory Scale‐Revised. Clin Neuropsychol. 1997;11(4):370–374.
- , , . A Compendium of Neuropsychological Tests: Administration, Norms, and Commentary. 3rd ed. New York, NY: Oxford University Press; 2009.
- . Review of physical activity measurement using accelerometers in older adults: considerations for research design and conduct. Prev Med. 2009;48(2):108–114.
- , , , , , . The actigraph data analysis software: I. A novel approach to scoring and interpreting sleep‐wake activity. Percept Mot Skills. 1997;85(1):207–216.
- , , , et al. Evaluation of immobility time for sleep latency in actigraphy. Sleep Med. 2009;10(6):621–625.
- , , , , . The subjective meaning of sleep quality: a comparison of individuals with and without insomnia. Sleep. 2008;31(3):383–393.
- , . Objective components of individual differences in subjective sleep quality. J Sleep Res. 1997;6(4):217–220.
- , , , , , . Research electronic data capture (REDCap)—a metadata‐driven methodology and workflow process for providing translational research informatics support. J Biomed Inform. 2009;42(2):377–381.
- . A Wilcoxon‐type test for trend. Stat Med. 1985;4(1):87–90.
- , , , et al. Derivation of research diagnostic criteria for insomnia: report of an American Academy of Sleep Medicine Work Group. Sleep. 2004;27(8):1567–1596.
- , , , , . Quantitative criteria for insomnia. Behav Res Ther. 2003;41(4):427–445.
- . Importance of in‐hospital initiation of evidence‐based medical therapies for heart failure: taking advantage of the teachable moment. Congest Heart Fail. 2005;11(3):153–154.
- , , , , . Smoking cessation in hospitalized patients: results of a randomized trial. Arch Intern Med. 1997;157(4):409–415.
- , , . Smoking cessation interventions for hospitalized smokers: a systematic review. Arch Intern Med. 2008;168(18):1950–1960.
- , , , , . Improvements in cognition following hospital discharge of community dwelling seniors. J Gen Intern Med. 2011;26(7):765–770.
- , , , . Sleep and aging: 1. sleep disorders commonly found in older people. Can Med Assoc J. 2007;176(9):1299–1304.
- . Noise and sleep among adult medical inpatients: far from a quiet night. Arch Intern Med. 2012;172(1):68–70.
- , , , , , . Perceived control and sleep in hospitalized older adults: a sound hypothesis? J Hosp Med. 2013;8(4):184–190.
- , . A meta‐analysis of the impact of short‐term sleep deprivation on cognitive variables. Psychol Bull. 2010;136(3):375–389.
- , . Sleep deprivation: Impact on cognitive performance. Neuropsychiatr Dis Treat. 2007;3(5):553–567.
- , , , et al. Effects of physician experience on costs and outcomes on an academic general medicine service: results of a trial of hospitalists. Ann Intern Med. 2002;137(11):866–874.
- , , . “Mini‐mental state”: a practical method for grading the cognitive state of patients for the clinician. J Psychiatr Res. 1975;12(3):189–198.
- . A short portable mental status questionnaire for the assessment of organic brain deficit in elderly patients. J Am Geriatr Soc. 1975;10:433–441.
- , , , . Reliability and validity of the Short Portable Mental Status Questionnaire administered by telephone. J Geriatr Psychiatry Neurol. 1994;7(1):33–38.
- , , , . Aging, recall and recognition: a study on the sensitivity of the University of Southern California Repeatable Episodic Memory Test (USC‐REMT). J Clin Exp Neuropsychol. 2004;26(3):428–440.
- , , , , . University of southern california repeatable episodic memory test. J Clin Exp Neuropsychol. 1995;17(6):926–936.
- , , . Development of alternate paragraphs for the logical memory subtest of the Wechsler Memory Scale‐Revised. Clin Neuropsychol. 1997;11(4):370–374.
- , , . A Compendium of Neuropsychological Tests: Administration, Norms, and Commentary. 3rd ed. New York, NY: Oxford University Press; 2009.
- . Review of physical activity measurement using accelerometers in older adults: considerations for research design and conduct. Prev Med. 2009;48(2):108–114.
- , , , , , . The actigraph data analysis software: I. A novel approach to scoring and interpreting sleep‐wake activity. Percept Mot Skills. 1997;85(1):207–216.
- , , , et al. Evaluation of immobility time for sleep latency in actigraphy. Sleep Med. 2009;10(6):621–625.
- , , , , . The subjective meaning of sleep quality: a comparison of individuals with and without insomnia. Sleep. 2008;31(3):383–393.
- , . Objective components of individual differences in subjective sleep quality. J Sleep Res. 1997;6(4):217–220.
- , , , , , . Research electronic data capture (REDCap)—a metadata‐driven methodology and workflow process for providing translational research informatics support. J Biomed Inform. 2009;42(2):377–381.
- . A Wilcoxon‐type test for trend. Stat Med. 1985;4(1):87–90.
- , , , et al. Derivation of research diagnostic criteria for insomnia: report of an American Academy of Sleep Medicine Work Group. Sleep. 2004;27(8):1567–1596.
- , , , , . Quantitative criteria for insomnia. Behav Res Ther. 2003;41(4):427–445.
© 2015 Society of Hospital Medicine
Managing Superutilizers
We have known for years that the distribution of healthcare expenditures in the United States is skewed, with a small portion of the population consuming a disproportionately high share of resources. In 2010, 1% of the population accounted for 21.4% of the $1.3 trillion spent on healthcare.[1] Growing evidence documents that most of these high‐cost patients are not receiving coordinated care, preventive care, or care in the most appropriate settings.[2] The term superutilizer describes individuals with complex physical, behavioral, and social needs who have frequent emergency department (ED) visits and multiple costly hospital admissions.[3] Not surprisingly, multiple superutilizer programs and new funding opportunities target this population attempting to reduce their healthcare costs while improving their care, as public and private insurers shift to value‐based care.[4]
Beginning in 2006, the Robert Wood Johnson Foundation supported the Camden Coalition[5] with 3 grants to develop a community‐based approach to identify high‐utilizer patients and provide them with coordinated medical and social services.[6] These programs include community‐based teams that focus on the highest utilizers in a specific geographic area and provide intensive outpatient case management. Building on these efforts, the Center for Medicare and Medicaid Innovation (CMMI) awarded 2 Health Care Innovation Awards totaling $17.2 million to target Medicaid superutilizers.[7] Through its State Innovation Models initiative, CMMI also encourages states to pilot superutilizer programs to increase care coordination and support of persons with certain risk factors such as homelessness or mental illness.[8] Additionally, the National Governors Association developed a 1‐year, multistate policy academy to develop state‐level capacity and state action plans that guide how to improve the delivery and financing of care for superutilizers.[9]
With all these ongoing activities in the setting of a paucity of research identifying the most cost‐efficient practices to manage super‐utilizers, we are glad to see the Journal of Hospital Medicine publish an evaluation of a quality‐improvement project targeting superutilizers.[10] Mercer and colleagues at Duke University Hospital show that developing an individualized care plan and integrating it into their electronic health record (EHR) reduced hospital admissions, but not ED visits. Although we applaud the reportedly individualized patient approach and recognize the effort required to refer patients to a more appropriate care setting, we believe the researchers neglected 3 important components for the intervention: (1) patient engagement in developing individualized care plans, (2) care coordination integrated with community collaboration, and (3) feedback on continuum of care relayed back to providers. The managing strategies mentioned in the article seem to have evolved exclusively from the provider's perspective, a common mistake that the Patient‐Centered Outcomes Research Institute emphasizes must be avoided. We are concerned about the lack of clarity regarding the set of management strategies focused on providing high‐quality care while limiting unnecessary admissions reported by them. We fear this strategy was imposed on patients and not developed collaboratively with them. Effective interventions for superutilizers should do more than just guide providers actions, but also connect services to the patient's needs. There should be coordination and continuous improvement of these efforts, which requires engagement of the patient and their community with feedback to the system.
Possibly most important, an individualized approach to superutilizers needs to be patient‐centeredprioritizing patient goals and preferences, selecting interventions and services guided by the needs of the individual, and emphasizing modifiable outcomes that matter to the patient. Such a patient‐centered approach goes beyond the individual patient to incorporate information about social support and family dynamics, highlighting the role of caregivers. Patients and their caregivers must be engaged or activated to ensure adherence to appropriate care and behaviors in any superutilizer programs. Additionally, individualized patient‐centered care plans should be dynamic and bidirectional to accommodate changes in health priorities that may occur over time. Such lack of patient and community engagement may explain why ED‐visit frequency was unchanged in their study.
The approach of having a Complex Care Plan Committee deserves attention as it appropriately included the right people at the academic medical center. However, why is it voluntary? Should not an important, or even essential, committee such as this be supported by the health system? Moreover, although the care plan developed by members of the committee possesses understandable aspects to be considered in a patient's care, why is this not shown to the patient for their input? Instead of being done to the patient, we recommend including patients in this process, believing such patient engagement would improve care further and likely yield sustained changes. We suggest the researchers remember the maxim nothing about me, without me.
Patients who use the most healthcare services typically have complicated social situations that directly impact their ability to improve their health and stay well.[2, 11] Addressing the social determinants of health is not a new concept; however, creating healthy communities as a core responsibility of the healthcare industry is. Contributing to the dizzying state of change in US healthcare are efforts to shift to value‐based purchasing and population health management.[12] This transformation from a fee‐for‐service hospital‐centric industry into one focused on the continuum of care requires outreach into communities where superutilizers live. Ultimately, all healthcare is local, as this is where patients receive the vast majority of their care. Improving quality and reducing costs requires healthcare providers to work together on a collaborative mission that focuses on the needs of patients and community, not just efforts to reduce utilization. Even hospitalists must forge collaborative relationships with skilled nursing facilities and patient‐centered medical homes.
Given the successes of some superutilizer programs,[3] a key issue is how to scale or disseminate such labor‐intensive highly individualized programs. Each patient has very complex and specific medical, behavioral, and social needs that require creativity and flexibility to adequately address these needs. Without question, patients and/or their caregivers should be members of the care team aiming to optimize their care. Unfortunately, our current healthcare system is not designed to address the complexity and uniqueness of each superutilizer. Nonetheless, summarizing patients history into the EHR and integrating recommendations offers an opportunity to share information as originally hoped by the transition from paper‐based records. It additionally offers an opportunity to learn from use of this information as academic medical centers aim to become learning health systems.[13] Future implementation science research in this area should assess how to scale patient‐centered approaches to care, particularly for those with chronic illness and other vulnerabilities. We must eschew efforts that solely focus on reducing utilization by patients without involving them; after all, they are the focus of healthcare.
Disclosure
Nothing to report.
- , . Differentials in the concentration in the level of health expenditures across population subgroups in the U.S, 2010. Statistical brief #421. Rockville, MD: Agency for Healthcare Research and Quality; 2013.
- , , . Preventing avoidable rehospitalizations by understanding the characteristics of “frequent fliers.” J Nurs Care Qual. 2012;27(1):77–82.
- Robert Wood Johnson Foundation. Super‐utilizer summit: common themes from innovative complex care management programs. Available at: http://www.rwjf.org/en/library/research/2013/10/super‐utilizer‐summit.html. Published October 2013; accessed March 22, 2015.
- . Setting value‐based payment goals—HHS efforts to improve U.S. health care. N Engl J Med. 2015;372(10):897–899.
- . Medical Report: The hot spotters—can we lower medical costs by giving the neediest patients better care? Available at: http://www.newyorker.com/magazine/2011/01/24/the-hot-spotters. Published January 24, 2011; accessed March 22, 2015.
- Robert Wood Johnson Foundation. A coalition creates a citywide care management system. Available at: http://www.rwjf.org/content/dam/farm/reports/program_results_reports/2014/rwjf69151. Published January 13, 2011; revised June 13, 2014; accessed March 22, 2015.
- Centers for Medicare 10(XX):XXX–XXX.
- , , , . The faces of Medicaid II: recognizing the care needs of people with multiple chronic conditions. Center for Health Care Strategies, Inc. Available at: http://www.chcs.org/resource/the-faces-of-medicaid-ii-recognizing-the-care-needs-of-people-with-multiple-chronic-conditions. Published October 2007; accessed March 22, 2015.
- . Accountable care organizations—the risk of failure and the risks of success. N Engl J Med. 2014;371(18):1750–1751.
- , , . Implementing the learning health system: from concept to action. Ann Intern Med. 2012;157(3):207–210.
We have known for years that the distribution of healthcare expenditures in the United States is skewed, with a small portion of the population consuming a disproportionately high share of resources. In 2010, 1% of the population accounted for 21.4% of the $1.3 trillion spent on healthcare.[1] Growing evidence documents that most of these high‐cost patients are not receiving coordinated care, preventive care, or care in the most appropriate settings.[2] The term superutilizer describes individuals with complex physical, behavioral, and social needs who have frequent emergency department (ED) visits and multiple costly hospital admissions.[3] Not surprisingly, multiple superutilizer programs and new funding opportunities target this population attempting to reduce their healthcare costs while improving their care, as public and private insurers shift to value‐based care.[4]
Beginning in 2006, the Robert Wood Johnson Foundation supported the Camden Coalition[5] with 3 grants to develop a community‐based approach to identify high‐utilizer patients and provide them with coordinated medical and social services.[6] These programs include community‐based teams that focus on the highest utilizers in a specific geographic area and provide intensive outpatient case management. Building on these efforts, the Center for Medicare and Medicaid Innovation (CMMI) awarded 2 Health Care Innovation Awards totaling $17.2 million to target Medicaid superutilizers.[7] Through its State Innovation Models initiative, CMMI also encourages states to pilot superutilizer programs to increase care coordination and support of persons with certain risk factors such as homelessness or mental illness.[8] Additionally, the National Governors Association developed a 1‐year, multistate policy academy to develop state‐level capacity and state action plans that guide how to improve the delivery and financing of care for superutilizers.[9]
With all these ongoing activities in the setting of a paucity of research identifying the most cost‐efficient practices to manage super‐utilizers, we are glad to see the Journal of Hospital Medicine publish an evaluation of a quality‐improvement project targeting superutilizers.[10] Mercer and colleagues at Duke University Hospital show that developing an individualized care plan and integrating it into their electronic health record (EHR) reduced hospital admissions, but not ED visits. Although we applaud the reportedly individualized patient approach and recognize the effort required to refer patients to a more appropriate care setting, we believe the researchers neglected 3 important components for the intervention: (1) patient engagement in developing individualized care plans, (2) care coordination integrated with community collaboration, and (3) feedback on continuum of care relayed back to providers. The managing strategies mentioned in the article seem to have evolved exclusively from the provider's perspective, a common mistake that the Patient‐Centered Outcomes Research Institute emphasizes must be avoided. We are concerned about the lack of clarity regarding the set of management strategies focused on providing high‐quality care while limiting unnecessary admissions reported by them. We fear this strategy was imposed on patients and not developed collaboratively with them. Effective interventions for superutilizers should do more than just guide providers actions, but also connect services to the patient's needs. There should be coordination and continuous improvement of these efforts, which requires engagement of the patient and their community with feedback to the system.
Possibly most important, an individualized approach to superutilizers needs to be patient‐centeredprioritizing patient goals and preferences, selecting interventions and services guided by the needs of the individual, and emphasizing modifiable outcomes that matter to the patient. Such a patient‐centered approach goes beyond the individual patient to incorporate information about social support and family dynamics, highlighting the role of caregivers. Patients and their caregivers must be engaged or activated to ensure adherence to appropriate care and behaviors in any superutilizer programs. Additionally, individualized patient‐centered care plans should be dynamic and bidirectional to accommodate changes in health priorities that may occur over time. Such lack of patient and community engagement may explain why ED‐visit frequency was unchanged in their study.
The approach of having a Complex Care Plan Committee deserves attention as it appropriately included the right people at the academic medical center. However, why is it voluntary? Should not an important, or even essential, committee such as this be supported by the health system? Moreover, although the care plan developed by members of the committee possesses understandable aspects to be considered in a patient's care, why is this not shown to the patient for their input? Instead of being done to the patient, we recommend including patients in this process, believing such patient engagement would improve care further and likely yield sustained changes. We suggest the researchers remember the maxim nothing about me, without me.
Patients who use the most healthcare services typically have complicated social situations that directly impact their ability to improve their health and stay well.[2, 11] Addressing the social determinants of health is not a new concept; however, creating healthy communities as a core responsibility of the healthcare industry is. Contributing to the dizzying state of change in US healthcare are efforts to shift to value‐based purchasing and population health management.[12] This transformation from a fee‐for‐service hospital‐centric industry into one focused on the continuum of care requires outreach into communities where superutilizers live. Ultimately, all healthcare is local, as this is where patients receive the vast majority of their care. Improving quality and reducing costs requires healthcare providers to work together on a collaborative mission that focuses on the needs of patients and community, not just efforts to reduce utilization. Even hospitalists must forge collaborative relationships with skilled nursing facilities and patient‐centered medical homes.
Given the successes of some superutilizer programs,[3] a key issue is how to scale or disseminate such labor‐intensive highly individualized programs. Each patient has very complex and specific medical, behavioral, and social needs that require creativity and flexibility to adequately address these needs. Without question, patients and/or their caregivers should be members of the care team aiming to optimize their care. Unfortunately, our current healthcare system is not designed to address the complexity and uniqueness of each superutilizer. Nonetheless, summarizing patients history into the EHR and integrating recommendations offers an opportunity to share information as originally hoped by the transition from paper‐based records. It additionally offers an opportunity to learn from use of this information as academic medical centers aim to become learning health systems.[13] Future implementation science research in this area should assess how to scale patient‐centered approaches to care, particularly for those with chronic illness and other vulnerabilities. We must eschew efforts that solely focus on reducing utilization by patients without involving them; after all, they are the focus of healthcare.
Disclosure
Nothing to report.
We have known for years that the distribution of healthcare expenditures in the United States is skewed, with a small portion of the population consuming a disproportionately high share of resources. In 2010, 1% of the population accounted for 21.4% of the $1.3 trillion spent on healthcare.[1] Growing evidence documents that most of these high‐cost patients are not receiving coordinated care, preventive care, or care in the most appropriate settings.[2] The term superutilizer describes individuals with complex physical, behavioral, and social needs who have frequent emergency department (ED) visits and multiple costly hospital admissions.[3] Not surprisingly, multiple superutilizer programs and new funding opportunities target this population attempting to reduce their healthcare costs while improving their care, as public and private insurers shift to value‐based care.[4]
Beginning in 2006, the Robert Wood Johnson Foundation supported the Camden Coalition[5] with 3 grants to develop a community‐based approach to identify high‐utilizer patients and provide them with coordinated medical and social services.[6] These programs include community‐based teams that focus on the highest utilizers in a specific geographic area and provide intensive outpatient case management. Building on these efforts, the Center for Medicare and Medicaid Innovation (CMMI) awarded 2 Health Care Innovation Awards totaling $17.2 million to target Medicaid superutilizers.[7] Through its State Innovation Models initiative, CMMI also encourages states to pilot superutilizer programs to increase care coordination and support of persons with certain risk factors such as homelessness or mental illness.[8] Additionally, the National Governors Association developed a 1‐year, multistate policy academy to develop state‐level capacity and state action plans that guide how to improve the delivery and financing of care for superutilizers.[9]
With all these ongoing activities in the setting of a paucity of research identifying the most cost‐efficient practices to manage super‐utilizers, we are glad to see the Journal of Hospital Medicine publish an evaluation of a quality‐improvement project targeting superutilizers.[10] Mercer and colleagues at Duke University Hospital show that developing an individualized care plan and integrating it into their electronic health record (EHR) reduced hospital admissions, but not ED visits. Although we applaud the reportedly individualized patient approach and recognize the effort required to refer patients to a more appropriate care setting, we believe the researchers neglected 3 important components for the intervention: (1) patient engagement in developing individualized care plans, (2) care coordination integrated with community collaboration, and (3) feedback on continuum of care relayed back to providers. The managing strategies mentioned in the article seem to have evolved exclusively from the provider's perspective, a common mistake that the Patient‐Centered Outcomes Research Institute emphasizes must be avoided. We are concerned about the lack of clarity regarding the set of management strategies focused on providing high‐quality care while limiting unnecessary admissions reported by them. We fear this strategy was imposed on patients and not developed collaboratively with them. Effective interventions for superutilizers should do more than just guide providers actions, but also connect services to the patient's needs. There should be coordination and continuous improvement of these efforts, which requires engagement of the patient and their community with feedback to the system.
Possibly most important, an individualized approach to superutilizers needs to be patient‐centeredprioritizing patient goals and preferences, selecting interventions and services guided by the needs of the individual, and emphasizing modifiable outcomes that matter to the patient. Such a patient‐centered approach goes beyond the individual patient to incorporate information about social support and family dynamics, highlighting the role of caregivers. Patients and their caregivers must be engaged or activated to ensure adherence to appropriate care and behaviors in any superutilizer programs. Additionally, individualized patient‐centered care plans should be dynamic and bidirectional to accommodate changes in health priorities that may occur over time. Such lack of patient and community engagement may explain why ED‐visit frequency was unchanged in their study.
The approach of having a Complex Care Plan Committee deserves attention as it appropriately included the right people at the academic medical center. However, why is it voluntary? Should not an important, or even essential, committee such as this be supported by the health system? Moreover, although the care plan developed by members of the committee possesses understandable aspects to be considered in a patient's care, why is this not shown to the patient for their input? Instead of being done to the patient, we recommend including patients in this process, believing such patient engagement would improve care further and likely yield sustained changes. We suggest the researchers remember the maxim nothing about me, without me.
Patients who use the most healthcare services typically have complicated social situations that directly impact their ability to improve their health and stay well.[2, 11] Addressing the social determinants of health is not a new concept; however, creating healthy communities as a core responsibility of the healthcare industry is. Contributing to the dizzying state of change in US healthcare are efforts to shift to value‐based purchasing and population health management.[12] This transformation from a fee‐for‐service hospital‐centric industry into one focused on the continuum of care requires outreach into communities where superutilizers live. Ultimately, all healthcare is local, as this is where patients receive the vast majority of their care. Improving quality and reducing costs requires healthcare providers to work together on a collaborative mission that focuses on the needs of patients and community, not just efforts to reduce utilization. Even hospitalists must forge collaborative relationships with skilled nursing facilities and patient‐centered medical homes.
Given the successes of some superutilizer programs,[3] a key issue is how to scale or disseminate such labor‐intensive highly individualized programs. Each patient has very complex and specific medical, behavioral, and social needs that require creativity and flexibility to adequately address these needs. Without question, patients and/or their caregivers should be members of the care team aiming to optimize their care. Unfortunately, our current healthcare system is not designed to address the complexity and uniqueness of each superutilizer. Nonetheless, summarizing patients history into the EHR and integrating recommendations offers an opportunity to share information as originally hoped by the transition from paper‐based records. It additionally offers an opportunity to learn from use of this information as academic medical centers aim to become learning health systems.[13] Future implementation science research in this area should assess how to scale patient‐centered approaches to care, particularly for those with chronic illness and other vulnerabilities. We must eschew efforts that solely focus on reducing utilization by patients without involving them; after all, they are the focus of healthcare.
Disclosure
Nothing to report.
- , . Differentials in the concentration in the level of health expenditures across population subgroups in the U.S, 2010. Statistical brief #421. Rockville, MD: Agency for Healthcare Research and Quality; 2013.
- , , . Preventing avoidable rehospitalizations by understanding the characteristics of “frequent fliers.” J Nurs Care Qual. 2012;27(1):77–82.
- Robert Wood Johnson Foundation. Super‐utilizer summit: common themes from innovative complex care management programs. Available at: http://www.rwjf.org/en/library/research/2013/10/super‐utilizer‐summit.html. Published October 2013; accessed March 22, 2015.
- . Setting value‐based payment goals—HHS efforts to improve U.S. health care. N Engl J Med. 2015;372(10):897–899.
- . Medical Report: The hot spotters—can we lower medical costs by giving the neediest patients better care? Available at: http://www.newyorker.com/magazine/2011/01/24/the-hot-spotters. Published January 24, 2011; accessed March 22, 2015.
- Robert Wood Johnson Foundation. A coalition creates a citywide care management system. Available at: http://www.rwjf.org/content/dam/farm/reports/program_results_reports/2014/rwjf69151. Published January 13, 2011; revised June 13, 2014; accessed March 22, 2015.
- Centers for Medicare 10(XX):XXX–XXX.
- , , , . The faces of Medicaid II: recognizing the care needs of people with multiple chronic conditions. Center for Health Care Strategies, Inc. Available at: http://www.chcs.org/resource/the-faces-of-medicaid-ii-recognizing-the-care-needs-of-people-with-multiple-chronic-conditions. Published October 2007; accessed March 22, 2015.
- . Accountable care organizations—the risk of failure and the risks of success. N Engl J Med. 2014;371(18):1750–1751.
- , , . Implementing the learning health system: from concept to action. Ann Intern Med. 2012;157(3):207–210.
- , . Differentials in the concentration in the level of health expenditures across population subgroups in the U.S, 2010. Statistical brief #421. Rockville, MD: Agency for Healthcare Research and Quality; 2013.
- , , . Preventing avoidable rehospitalizations by understanding the characteristics of “frequent fliers.” J Nurs Care Qual. 2012;27(1):77–82.
- Robert Wood Johnson Foundation. Super‐utilizer summit: common themes from innovative complex care management programs. Available at: http://www.rwjf.org/en/library/research/2013/10/super‐utilizer‐summit.html. Published October 2013; accessed March 22, 2015.
- . Setting value‐based payment goals—HHS efforts to improve U.S. health care. N Engl J Med. 2015;372(10):897–899.
- . Medical Report: The hot spotters—can we lower medical costs by giving the neediest patients better care? Available at: http://www.newyorker.com/magazine/2011/01/24/the-hot-spotters. Published January 24, 2011; accessed March 22, 2015.
- Robert Wood Johnson Foundation. A coalition creates a citywide care management system. Available at: http://www.rwjf.org/content/dam/farm/reports/program_results_reports/2014/rwjf69151. Published January 13, 2011; revised June 13, 2014; accessed March 22, 2015.
- Centers for Medicare 10(XX):XXX–XXX.
- , , , . The faces of Medicaid II: recognizing the care needs of people with multiple chronic conditions. Center for Health Care Strategies, Inc. Available at: http://www.chcs.org/resource/the-faces-of-medicaid-ii-recognizing-the-care-needs-of-people-with-multiple-chronic-conditions. Published October 2007; accessed March 22, 2015.
- . Accountable care organizations—the risk of failure and the risks of success. N Engl J Med. 2014;371(18):1750–1751.
- , , . Implementing the learning health system: from concept to action. Ann Intern Med. 2012;157(3):207–210.
Patient Complexities and Antibiotics
Clinical management of patients with medical and social comorbidities has become increasingly complex.[1, 2, 3, 4] This complexity stems from lack of data for these groups of patients who are often excluded from clinical trials.[5] There are data demonstrating that older patients and patients with multiple comorbidities including diabetes, renal disease, obesity, limited mobility, and poor access to healthcare have worse outcomes for specific conditions compared to otherwise equal counterparts, and that the cost of care for these patients is more expensive.[3, 4, 6] Moreover, traditional risk assessment of disease severity and outcomes are not accurate when applied to medically and socially complex patients.[7, 8]
Treatment decisions regarding antibiotic use add additional complexity. Specifically, physicians antibiotic prescribing decisions can promote the emergence of multidrug resistant pathogens in a hospital or population.[9, 10] Multidrug resistant organisms (MDROs) are particularly problematic, as their prevalence is increasing while the development of new antimicrobial agents is declining.[11] Infections caused by antibiotic‐resistant pathogens are associated with increased morbidity and mortality and healthcare costs.[12, 13, 14] Antibiotic use, although potentially lifesaving, can also result in severe complications such as Clostridium difficile‐associated diarrhea, acute kidney injury, and anaphylaxis, among other adverse events, particularly in older patients with medical comorbidities.[15, 16, 17, 18] Judicious antibiotic use is critical to halt the epidemic of MDROs and to minimize antibiotic‐associated adverse effects.[19, 20, 21]
Evidence‐based guidelines have the potential to assist physicians in choosing the antibiotic that achieves the best clinical outcome for a specific infection or situation.[11] This includes using the narrowest spectrum agent to minimize selection pressure on microorganisms and avoiding unneeded drugs to minimize adverse drug effects.[9, 11] Importantly, guideline adherence regarding antibiotic selection has been shown to be associated with increased clinical success and decreased mortality.[22, 23] Unfortunately, 30% to 50% of antibiotic use in hospitalized patients is inconsistent with national guidelines.[24, 25, 26] Reasons for physicians ordering of tests and treatments inconsistent with guidelines are not fully understood, and potentially include patient and physician factors, and the cultural and social context of the healthcare system.[27]
To optimize the use of antibiotics, it is important to understand how medical complexities (defined as demographic, comorbid, and limited healthcare access characteristics that are associated with suboptimal patient care and outcomes) influence physicians antibiotic prescribing practices.[28] We created 3 clinical vignettes for common diagnoses (dyspnea with initial concern for pneumonia, skin and soft tissue infection, and asymptomatic bacteriuria) among hospitalized patients. We selected these conditions because of their high prevalence, frequent management by hospitalists, generalist physicians, and noninfectious disease specialists, and because well‐documented evidence suggests either no antibiotics or narrower spectrum antibiotics are usually the treatments of choice. Using the Infectious Diseases Society of America (IDSA) guidelines relevant to each clinical vignette,[29, 30, 31] we assessed physicians recommendations for guideline‐appropriate antibiotic management for patients without and with medical complexities using an electronic multiple‐choice survey.
METHODS
Survey Participants
We surveyed internal medicine generalist and subspecialty inpatient physicians from 3 academic medical centers in the metropolitan Los Angeles, California area. Potential participants included attending and housestaff physicians in the departments of internal medicine and family medicine at the 3 medical centers associated with the University of California Los Angeles (UCLA) Clinical and Translational Science Institute: (1) Ronald ReaganUCLA Medical Center, a tertiary care academic medical center; (2) Harbor UCLA Medical Center, a county (public) medical center; and (3) CedarsSinai Medical Center, a tertiary care medical center. Each center was affiliated with a residency training program, although not all attending physicians were associated with the training programs. Physicians were eligible to perform the survey if they attended 2 weeks per year in the inpatient setting. We collected physician‐level information including level of training (resident/fellow vs attending), specialization or not, proportion of time spent working in the hospital, and proportion of time spent providing direct clinical care (compared to activities such as administration and research). All eligible participants were emailed a brief study description with a hyperlink to the electronic survey created in REDCap (Research Electronic Data Capture version 5.6.0, 2013). Administrative staff provided email lists for potential participants at 2 of the hospitals. Per hospital policy, an email list was not provided by the third hospital, and potential participants were emailed the survey link directly by the hospital administrative staff. We incentivized study participation by entering participants who completed the survey into a raffle to win either a $100 gift card or a computer tablet. Physicians had 3 months to complete the survey and were sent up to 5 emails encouraging them to complete it.
Survey
The survey consisted of 3 clinical vignettes describing common hospital‐based situations that required decision making about antibiotic use. The 3 clinical vignettes described: (1) a patient with dyspnea and no infiltrate on chest radiograph who is initially treated empirically with antibiotics for pneumonia but is ultimately diagnosed with a congestive heart failure exacerbation, (2) a patient admitted with a skin infection that grows methicillin‐sensitive Staphylococcus aureus, and (3) a patient with a urinary catheter who develops asymptomatic bacteriuria. The first vignette was chosen because congestive heart failure and pneumonia are among the most common reasons for hospitalization in the United States, and their overlapping syndromes can make the diagnosis challenging.[32, 33, 34, 35] The second vignette was chosen because skin infections are some of the most common infectious diseases, with an incidence that is twice that of urinary tract infections and 10 times that of pneumonia, and can lead to serious complications among hospitalized patients.[30, 36] The third vignette was chosen because the prevalence of asymptomatic bacteriuria approaches 100% among catheterized patients, and rates of unnecessary treatment for this condition are as high as 80%.[31, 37]
Each clinical vignette was then modified to include 1 of the 4 studied patient complexities (Table 1). Medical comorbidities were represented by modifying the baseline vignette to describe patients with poorly controlled diabetes, morbid obesity, chronic kidney disease, and/or heavy tobacco use (Table 2). Patients with poor functional status were described in the vignettes as having difficulty with ambulation, requiring a mobility device, or needing assistance with self‐care (Table 2). Clinical vignettes varied the age of the patient from 47 years in the baseline case to 86 years (Table 2). Patients expected to have limited postdischarge follow‐up were described as being uninsured, with the first available follow‐up occurring in a public clinic no sooner than 2 weeks after their hospital discharge (Table 2). These complexities were chosen because they are common among hospitalized patients and have been shown to be associated with worse outcomes in a variety of conditions.[38, 39, 40, 41, 42] The asymptomatic bacteriuria vignette did not have a question about limited postdischarge follow‐up, because the clinical decision making in this question only pertained to the initial diagnosis and management. All physicians were queried about antibiotic use in each of the 3 baseline vignettes and in the subsequent 4 modified vignettes for each baseline scenario, with each physician making antibiotic management decisions for 15 vignettes in total. Physicians responses were recorded using categorical responses describing treatment options.
|
| Dyspnea case (baseline scenario) |
| A 47‐year‐old male with a history of stage III congestive heart failure is hospitalized after presenting with shortness of breath and a nonproductive cough. In the ED, he had a temp 99.6F, a HR of 120, and an RR 30. Exam was notable for bilateral crackles. CXR on admission was interpreted as having cardiomegaly, bilateral base atelectasis versus infiltrate and prominent pulmonary arteries with cephalization consistent with cardiogenic pulmonary edema. Admission laboratories were notable for an elevated BNP (950 pg/mL) and WBC (11.5 cells 10*9/L) with 75% neutrophils. Troponin and CK‐MB were not elevated. The patient was treated with diuretics, ceftriaxone, and azithromycin, and over the course of the next 48 hours has improved shortness of breath and no fevers. Because of his improvement he is prepared for hospital discharge. A repeat chest x‐ray shows cardiomegaly and bibasilar atelectasis. Blood cultures have been negative. He is insured and can follow with his primary physician within 3 days of discharge. Upon discharge you: |
| A. Discharge on his usual cardiac medications. |
| B. Discharge on his cardiac medications plus azithromycin to complete a 5‐day course of antibiotics. |
| C. Discharge on his cardiac medications plus azithromycin to complete a 7‐day course of antibiotics. |
| D. Discharge on usual cardiac medications plus levofloxacin to complete a 7‐day course of antibiotics. |
| Skin infection case (baseline scenario) |
| A 47‐year‐old obese female (BMI=32.9) is hospitalized after presenting with leg erythema, pain, and an 8 8‐cm fluctuant mass on her thigh. Admission temperature was 101.4F. In the ED, she was given vancomycin, and piperacillin/tazobactam and underwent incision and drainage of a thigh abscess, which drained a large amount of pus. The wound was packed. On day 3 she is afebrile, and the pain has improved. Cultures from the wound grow methicillin‐susceptible Staphylococcus aureus. Blood cultures are negative to date. She is ready for discharge. She has no allergies. She is insured and can be followed up with her primary physician within a few days of discharge. You: |
| A. Discharge on vancomycin and piperacillin/tazobactam through a PICC line to complete a 10‐day course. |
| B. Discharge on amoxicillin/clavulanate orally to complete a 10‐day course. |
| C. Discharge on cephalexin to complete a 10‐day course. |
| Asymptomatic bacteriuria case (baseline scenario) |
| A generally healthy 47‐year‐old female is admitted to the hospital for a femoral head fracture and undergoes total hip replacement. On post operative day 2, the nurse sends a urinalysis and culture from the patient's Foley catheter because the patient's urine is cloudy. Labs from that day show a WBC of 8900 and a urinalysis with 12 WBCs/HPF and 2+ bacteria. She has surgical site discomfort and no dysuria or other lower urinary tract symptoms. She has not had a fever during her hospital stay. Two days later her urine culture grows 100,000 CFU/mL of Escherichia coli susceptible to ciprofloxacin but resistant to all other oral antibiotics. That day, the patient is still afebrile and has no dysuria or other lower urinary tract symptoms. Her Foley is changed and a repeat urinalysis shows that the urine has persistent leukocytes and bacteria. You: |
| A. Initiate intravenous ciprofloxacin. |
| B. Initiate oral ciprofloxacin. |
| C. Give no antibiotics. |
| |
| Dyspnea case | |
| Comorbidities | A 47‐year‐old male with a history of stage III congestive heart failure, moderate to heavy tobacco use, poorly controlled type 2 diabetes (last HbA1C=10.9), chronic renal insufficiency (baseline creatinine of 1.3), diabetic retinopathy, and diabetic neuropathy is hospitalized after presenting with shortness of breath. |
| Poor functional status | A 47‐year‐old male with a history of stage III congestive heart failure, and poor functional status with difficulty ambulating and with self‐care is hospitalized after presenting with shortness of breath. |
| Older age | An 86‐year‐old male with a history of stage III congestive heart failure is hospitalized after presenting with shortness of breath. |
| Limited follow‐up | A 47‐year‐old male with a history of stage III congestive heart failure is hospitalized after presenting with shortness of breath.Blood cultures have been negative. He is uninsured and will be referred for follow‐up to a public clinic, which has a 2‐week wait for the next available clinic appointment. |
| Skin infection case | |
| Comorbidities | A 47‐year‐old morbidly obese female (BMI=32.9) with type 2 diabetes is hospitalized after presenting with leg erythema, pain, and an 8 8‐cm fluctuant mass on her thigh. |
| Poor functional status | A 47‐year‐old obese female (BMI=32.9) and poor functional status due to her obesity (poor mobility, uses either a walker or an electric scooter at all times to move around) is hospitalized after presenting with leg erythema, pain, and an 8 8‐cm fluctuant mass on her thigh. |
| Older age | An 86‐year‐old obese female (BMI=32.9) is hospitalized after presenting with leg erythema, pain, and an 8 8‐cm fluctuant mass on her thigh. |
| Limited follow‐up | A 47‐year‐old obese female (BMI=32.9) is hospitalized after presenting with leg erythema, pain, and an 8 8‐cm fluctuant mass on her thigh. She is uninsured and will be referred for follow‐up in a public clinic, which has a 2‐week wait for the next available clinic appointment. |
| Asymptomatic bacteriuria case | |
| Comorbidities | A 47‐year‐old female with a history type 2 diabetes with diabetic nephropathy and retinopathy is admitted to the hospital for a femoral head fracture and undergoes total hip replacement. On postoperative day 2, the nurse sends a urinalysis and culture from the patient's Foley catheter because the patient's urine is cloudy. |
| Poor functional status | A 47‐year‐old female with a history of poor functional status (needs assistance with activities of daily living) due to her obesity and musculoskeletal comorbidities, such as osteoarthritis, is admitted to the hospital for a femoral head fracture and undergoes total hip replacement. On postoperative day 2, the nurse sends a urinalysis and culture from the patient's Foley catheter because the patient's urine is cloudy. |
| Older age | A generally healthy 86‐year‐old female is admitted to the hospital for a femoral head fracture and undergoes total hip replacement. On post operative day 2, the nurse sends a urinalysis and culture from the patient's Foley catheter because the patient's urine is cloudy. |
The institutional review boards at all 3 medical centers approved the study.
Statistical Analysis
We used physician self‐report of recommended antibiotic use stratified by baseline and modified clinical vignettes to calculate the proportion of physicians recommending antibiotic use. We examined how physicians antibiotic use varied according to both patient complexity (medical comorbidity, poor functional status, older age, and limited follow‐up after hospital discharge), and provider characteristics (level of training, degree of specialization, time spent working in the hospital, and time spent providing direct patient care).
Data were analyzed using SAS (version 9.1.3; SAS Institute, Cary, NC). Antibiotic use inconsistent with IDSA guideline recommendations was considered the outcome of interest for the data analysis. Statistical analyses were performed using [2] or Fischer exact test, Student t test, and analysis of variance, as appropriate.
RESULTS
Physician Survey
Of the 874 invited physicians, 255 (29%) responded to the survey. Of these, 8/255 (3.1%) responded that they did not spend 2 or more weeks in the inpatient setting and were thus ineligible for the survey. We analyzed data from the remaining 247 physician respondents. Most respondents (217/233, 93%) reported their primary role was direct clinical care (Table 3). Most (185/241, 77%) reported at least half of their clinical work occurred in the hospital. Approximately three‐quarters (183/241, 76%) of the respondents were residents; the remaining respondents were attending physicians (57/241, 24%). Almost half of attending physicians (46%) were internal medicine subspecialists.
| Physician Characteristic | No. (%) Completing the Survey | % of Physicians Not Adhering to Guidelines in Baseline Scenarios | P Value |
|---|---|---|---|
| |||
| Affiliated medical center, n =241 | |||
| Ronald Reagan UCLA | 47 (20%) | 37% | 0.37 |
| Harbor‐UCLA | 106 (44%) | 41% | |
| Cedars‐Sinai | 86 (35%) | 43% | |
| Primary professional activity, n=233 | |||
| Direct clinical care/teaching | 217 (93%) | 42% | 0.90 |
| Research/administration | 16 (7%) | 27% | |
| Percent of clinical duties in the hospital, n=241 | |||
| 1%25% | 57 (23%) | 41% | 0.71 |
| 51%75% | 93 (39%) | 42% | |
| 76%100% | 92 (38%) | 41% | |
| Level of training and subspecialization, n=241 | |||
| Resident/fellow | 183 (76%) | 43% | 0.05 |
| Attending | 58 (24%) | 34% | |
| Subspecialist | 27 (47%) | 34% | 0.90 |
| Hospitalist | 28 (48%) | 33% | |
Physician recommendation for the use of antibiotics inconsistent with IDSA guidelines was prevalent in the baseline vignettes: 42% (303/729) overall, and 49% (120/246) for the dyspnea, 28% (68/242) for the skin infection, and 48% (115/241) for the asymptomatic bacteriuria cases. When the vignettes were modified to include patient complexities, the proportion of physicians recommending antibiotics increased significantly compared to the baseline vignette (63% (459/728), 54% (393/728), 51% (371/728), and 48% (232/487) for medical comorbidities, poor functional status, older age, and limited follow‐up respectively, P<0.001 for all comparisons) (Figure 1). The increase in the proportion of physicians recommending antibiotics inconsistent with guidelines for patients with medical complexities was the same when stratified by case (data not shown).

We found no association between provider characteristics (medical center, degree of attending physician specialization, percentage of clinical time spent practicing hospital‐based medicine, or percentage of time providing direct clinical care) and prescribing antibiotics in the baseline vignettes (Table 3). However, resident physicians (n=183) were more likely than attending physicians (n=57) to have recommended antibiotics in the baseline vignettes (43% vs 34%, P<0.05) (Table 3) and in all 4 vignettes with patient complexities (data not shown).
DISCUSSION
In our survey, almost half of the physician respondents recommended antibiotics that were inconsistent with national guidelines in the baseline vignettes. One explanation for this finding is that physicians may underestimate the risk associated with antibiotic use, such as the emergence of antimicrobial resistant pathogens and drug‐associated adverse effects. Although physicians generally agree that antibiotic resistance is an important problem, many believe that it is not a prominent issue in their practice or through their antibiotic prescribing practices.[43, 44] Others have shown that physicians underestimate the risk and severity of antibiotic‐associated complications such as C difficile.[45, 46] An accurate assessment and heightened awareness of the risks associated with antibiotics is important in clinical decision making, and should potentially be included not only in antibiotic stewardship educational efforts, but in national guideline recommendations as well.
Our survey also demonstrated that the tendency of physician respondents to recommend antibiotics was amplified for patients with medical complexities. This suggests that patient characteristics related to medical and social complexities play an important role in physicians clinical decision making about prescribing antibiotics. Previous investigations have shown that when physicians are deciding whether or not to prescribe antibiotics, they tend to deprioritize guideline recommendations and give greater weight to the risk of disease progression and complications that might occur if antibiotics are withheld.[47, 48, 49] Physicians are believed to prescribe antibiotics for complex patients more often, in part, because complex patients are more likely to suffer bad outcomes if undertreated.[50, 51] Axiomatically, patients with medical complexities are also at higher risk for antibiotic‐associated adverse effects including polypharmacy, drug‐drug interactions, and more severe side effects.[52, 53, 54]
An additional factor contributing to the overuse of antibiotics in our survey could be the lack of clear guideline recommendations for antibiotic management, especially among patients with complexities. We reviewed 20 national guidelines that addressed the medical decision making relevant to the survey's 3 clinical vignettes (see Supporting Information, Appendix 1, in the online version of this article). Fifteen of the guidelines provided recommendations for antibiotic management in the baseline vignettes, though most of the recommendations were not explicit about stopping or de‐escalating antibiotics. Furthermore, when antibiotic recommendations were present, they often lacked supporting data for the recommendation. Guidelines were even less complete for patients with medical complexities. For the asymptomatic bacteriuria vignette, 4 of 6 guidelines provided recommendations for patients with medical comorbidities described in our survey's modified vignettes.[31, 55, 56, 57] None of the guidelines related to the dyspnea or skin infection vignette provided specific antibiotic recommendations for complex patients with medical comorbidities, poor functional status, older age, or limited follow‐up (see Supporting Information, Appendix 1, in the online version of this article). Given these findings, along with evidence that medically complex patients are more likely to receive antibiotics compared to their less complex counterparts, there is a need for subsequent guidelines to more explicitly recommend best antibiotic practices for patients with medical and social complexities.
We also found that resident physicians were significantly more likely to recommend antibiotics inconsistent with guidelines compared to attending physicians. Although the underlying explanations for this finding were not explored in this study, possibilities include a lack of familiarity with guideline recommendations, less comfort in discontinuing antibiotics in the setting of clinical uncertainty, and/or a preference to accept the risks of overtreatment over the risks of undertreatment.
There are limitations to our study. First, although previous investigations have shown a high degree of correlation between actual antibiotic prescribing practices and antibiotic prescribing decisions self‐reported in clinical vignettes, physician responses in our survey may not reflect actual practices.[58] Second, we were not able to directly measure how physicians knowledge and interpretation of national guidelines influenced their antibiotic management decisions in the survey. Third, while our study was multisite including physicians from 3 different centers, not all invited physicians responded. Because of the confidentiality procedures surrounding the email distribution lists of potential participants, we were unable to obtain additional details about the non‐responders. Finally, because the large majority of respondents were trainees (76%), the generalizability of our findings to attending physicians may be limited. Nevertheless, because residents soon become staff physicians, resident‐reported data supplemented by that from attending physicians seems relevant to identifying opportunities for improving medical care.
In conclusion, we found that a large proportion of physicians recommended antibiotics that were not indicated based on IDSA guidelines for 3 vignettes depicting common hospital‐based clinical scenarios. This pattern of physicians recommending antibiotics inconsistent with guidelines was accentuated with significantly higher reported use for patients with medical comorbidities, poor functional status, older age, and limited healthcare access. Although good clinical judgment requires increased monitoring of patients with medical complexities, it is important for clinicians not to conflate the need for increased patient monitoring with the need for increased antibiotic use. Additional studies and corresponding guideline recommendations for frail, complex patients could be instrumental in reducing frequent use of antibiotics and the resultant cost, adverse effects, and emergence of antibiotic resistant pathogens. Educational efforts, particularly among trainees, regarding appropriate antibiotic use for clinical indications among patients without and with medical complexities would also likely contribute to these aims. Treatment guidelines should consider explicitly addressing medically complex patients in the context of management of infectious syndromes.
Disclosure
Nothing to report.
- , , , , , . Heart failure and chronic obstructive pulmonary disease multimorbidity at hospital discharge transition: a study of patient and carer experience [published online ahead of print May 16. 2014]. Health Expect. doi: 10.1111/hex.12208.
- , , , , , . Development of clinical practice guidelines for patients with comorbidity and multiple diseases [in Spanish]. Aten Primaria. 2014;46(7):385–392.
- , , , et al. Cardiac complications in patients with community‐acquired pneumonia: a systematic review and meta‐analysis of observational studies. PLoS Med. 2011;8(6):e1001048.
- , , , , , . Cost and incidence of social comorbidities in low‐risk patients with community‐acquired pneumonia admitted to a public hospital. Chest. 2003;124(6):2148–2155.
- , , , et al. Why do GPs exclude patients from participating in research? An exploration of adherence to and divergence from trial criteria. Fam Pract. 2014;31(3):364–370.
- , , , , . The impact of pre‐existing heart failure on pneumonia prognosis: population‐based cohort study. J Gen Intern Med. 2008;23(9):1407–1413.
- , , , et al. Severe community‐acquired pneumonia: use of intensive care services and evaluation of American and British Thoracic Society Diagnostic criteria. Am J Respir Crit Care Med. 2002;166(5):717–723.
- . Decisions about treating community‐acquired pneumonia. Ann Intern Med. 2005;142(3):215–216.
- , , , et al. The epidemic of antibiotic‐resistant infections: a call to action for the medical community from the Infectious Diseases Society of America. Clin Infect Dis. 2008;46(2):155–164.
- Will antibiotic misuse now stop? Nat Rev Microbiol. 2003;1(2):85.
- , , , et al. Infectious Diseases Society of America and the Society for Healthcare Epidemiology of America guidelines for developing an institutional program to enhance antimicrobial stewardship. Clin Infect Dis. 2007;44(2):159–177.
- . Economic impact of antimicrobial resistance. Emerg Infect Dis. 2001;7(2):286–292.
- , , , , . Guideline‐concordant therapy and reduced mortality and length of stay in adults with community‐acquired pneumonia: playing by the rules. Arch Intern Med. 2009;169(16):1525–1531.
- , , , et al. Adherence to guidelines' empirical antibiotic recommendations and community‐acquired pneumonia outcome. Eur Respir J. 2008;32(4):892–901.
- , , , et al. Community‐associated Clostridium difficile infection and antibiotics: a meta‐analysis. J Antimicrob Chemother. 2013;68(9):1951–1961.
- , , , . Vancomycin‐induced nephrotoxicity: mechanism, incidence, risk factors and special populations. A literature review. Eur J Clin Pharmacol. 2012;68(9):1243–1255.
- , . Diagnosis and management of immediate hypersensitivity reactions to cephalosporins. Clin Rev Allergy Immunol. 2013;45(1):131–142.
- , . Neurotoxic effects associated with antibiotic use: management considerations. Br J Clin Pharmacol. 2011;72(3):381–393.
- , , , et al. A clinician's guide to the appropriate and accurate use of antibiotics: the Council for Appropriate and Rational Antibiotic Therapy (CARAT) criteria. Am J Med. 2005;118(suppl 7A):1S–6S.
- , , , , . Evaluation of rational antibiotic use. Int J Antimicrob Agents. 2000;15(2):131–135.
- , . Rational antibiotic prescribing. Challenges and successes [in German]. Bundesgesundheitsblatt Gesundheitsforschung Gesundheitsschutz. 2012;55(11–12):1418–1426.
- , , , et al. Antibiotic prescription for community‐acquired pneumonia in the intensive care unit: impact of adherence to Infectious Diseases Society of America guidelines on survival. Clin Infect Dis. 2005;41(12):1709–1716.
- , , . Guideline‐adherent initial intravenous antibiotic therapy for hospital‐acquired/ventilator‐associated pneumonia is clinically superior, saves lives and is cheaper than non guideline adherent therapy. Eur J Med Res. 2011;16(7):315–323.
- , , , , , . Antibiotic misuse: a prospective clinical audit in a French university hospital. Eur J Clin Microbiol Infect Dis. 2007;26(4):277–280.
- , , , , . Unnecessary use of antimicrobials in hospitalized patients: current patterns of misuse with an emphasis on the antianaerobic spectrum of activity. Arch Intern Med. 2003;163(8):972–978.
- , , , . A systematic review and meta‐analysis of misuse of antibiotic therapies in the community. Int J Antimicrob Agents. 2005;26(2):106–113.
- , . From best evidence to best practice: effective implementation of change in patients' care. Lancet. 2003;362(9391):1225–1230.
- , , , et al. The complexity of care for patients with rheumatoid arthritis: metrics for better understanding chronic disease care. Med Care. 2007;45(1):55–65.
- , , , et al. Infectious Diseases Society of America/American Thoracic Society consensus guidelines on the management of community‐acquired pneumonia in adults. Clin Infect Dis. 2007;44(suppl 2):S27–S72.
- , , , et al. Practice guidelines for the diagnosis and management of skin and soft tissue infections: 2014 update by the Infectious Diseases Society of America. Clin Infect Dis. 2014;59(2):e10–e52.
- , , , , , . Infectious Diseases Society of America guidelines for the diagnosis and treatment of asymptomatic bacteriuria in adults. Clin Infect Dis. 2005;40(5):643–654.
- , , , et al. Heart disease and stroke statistics—2010 update: a report from the American Heart Association. Circulation. 2010;121(7):e46–e215.
- , , , et al. ESC Guidelines for the diagnosis and treatment of acute and chronic heart failure 2008: the Task Force for the Diagnosis and Treatment of Acute and Chronic Heart Failure 2008 of the European Society of Cardiology. Developed in collaboration with the Heart Failure Association of the ESC (HFA) and endorsed by the European Society of Intensive Care Medicine (ESICM). Eur Heart J. 2008;29(19):2388–2442.
- , , , . Prevalence of negative chest radiography results in the emergency department patient with decompensated heart failure. Ann Emerg Med. 2006;47(1):13–18.
- , , , . Patients admitted to hospital with suspected pneumonia and normal chest radiographs: epidemiology, microbiology, and outcomes. Am J Med. 2004;117(5):305–311.
- , , , et al. Incidence of skin and soft tissue infections in ambulatory and inpatient settings, 2005–2010. BMC Infect Dis. In press.
- . Asymptomatic bacteriuria: when the treatment is worse than the disease. Nat Rev Urol. 2012;9(2):85–93.
- , , , et al. Prevalence and incidence trends for diagnosed diabetes among adults aged 20 to 79 years, United States, 1980–2012. JAMA. 2014;312(12):1218–1226.
- , , , . Prevalence of childhood and adult obesity in the United States, 2011–2012. JAMA. 2014;311(8):806–814.
- , , , , . Frailty in elderly people. Lancet. 2013;381(9868):752–762.
- , , , , , . Risk factors for death in homeless adults in Boston. Arch Intern Med. 1998;158(13):1454–1460.
- . Taking it to the streets: homelessness, health, and health care in the United States. J Gen Intern Med. 2003;18(11):964–965.
- , , , , , . Antibiotic resistance: a survey of physician perceptions. Arch Intern Med. 2002;162(19):2210–2216.
- , , , et al. Primary care clinicians' perceptions of antibiotic resistance: a multi‐country qualitative interview study. J Antimicrob Chemother. 2013;68(1):237–243.
- , , , , , . Underestimation of Clostridium difficile infection among clinicians: an international survey. Eur J Clin Microbiol Infect Dis. 2012;31(9):2439–2444.
- , , , , , . Unnecessary antimicrobial use in patients with current or recent Clostridium difficile infection. Infect Control Hosp Epidemiol. 2013;34(2):109–116.
- , , , , . Attitudes of primary care physicians to the prescribing of antibiotics and antimicrobial resistance: a qualitative study from Spain. Fam Pract. 2012;29(3):352–360.
- , , , , . Understanding physician antibiotic prescribing behaviour: a systematic review of qualitative studies. Int J Antimicrob Agents. 2013;41(3):203–212.
- , , , . Guidelines on uncomplicated urinary tract infections are difficult to follow: perceived barriers and suggested interventions. BMC Fam Pract. 2010;11:51.
- , , , . Why don't physicians adhere to guideline recommendations in practice? An analysis of barriers among Dutch general practitioners. Implement Sci. 2009;4:54.
- , , , , . Perceived barriers to guideline adherence: a survey among general practitioners. BMC Fam Pract. 2011;12:98.
- , , , . Clostridium difficile in acute and long‐stay elderly patients. Age Ageing. 1988;17(5):333–336.
- , , , , , . Pharmacodynamics of vancomycin in elderly patients aged 75 years or older with methicillin‐resistant Staphylococcus aureus hospital‐acquired pneumonia. Clin Interv Aging. 2013;8:1015–1021.
- , , , et al. Empiric guideline‐recommended weight‐based vancomycin dosing and nephrotoxicity rates in patients with methicillin‐resistant Staphylococcus aureus bacteremia: a retrospective cohort study. BMC Pharmacol Toxicol. 2013;14:12.
- , , , , , , , , . Guidelines on urological infections. Arnhem, The Netherlands: European Association of Urology (EAU); 2011. p. 15–27.
- Scottish Intercollegiate Guidelines Network. Management of suspected bacterial urinary tract infection in adults. Available at: http://www.sign.ac.uk/guidelines/fulltext/88/. Accessed on July 25, 2014.
- , , , et al. [Optimisation of the antibiotic policy in the Netherlands. X. The SWAB guideline for antimicrobial treatment of complicated urinary tract infections]. Ned Tijdschr Geneeskd 2006;150(43):2370–2376.
- , , , et al. Do case vignettes accurately reflect antibiotic prescription? Infect Control Hosp Epidemiol. 2011;32(10):1003–1009.
- The committee for The Japanese Respiratory Society guidelines in management of respiratory infections. Principles for the development of the guidelines. Respirology 2004;9(suppl 1):S1–S2.
Clinical management of patients with medical and social comorbidities has become increasingly complex.[1, 2, 3, 4] This complexity stems from lack of data for these groups of patients who are often excluded from clinical trials.[5] There are data demonstrating that older patients and patients with multiple comorbidities including diabetes, renal disease, obesity, limited mobility, and poor access to healthcare have worse outcomes for specific conditions compared to otherwise equal counterparts, and that the cost of care for these patients is more expensive.[3, 4, 6] Moreover, traditional risk assessment of disease severity and outcomes are not accurate when applied to medically and socially complex patients.[7, 8]
Treatment decisions regarding antibiotic use add additional complexity. Specifically, physicians antibiotic prescribing decisions can promote the emergence of multidrug resistant pathogens in a hospital or population.[9, 10] Multidrug resistant organisms (MDROs) are particularly problematic, as their prevalence is increasing while the development of new antimicrobial agents is declining.[11] Infections caused by antibiotic‐resistant pathogens are associated with increased morbidity and mortality and healthcare costs.[12, 13, 14] Antibiotic use, although potentially lifesaving, can also result in severe complications such as Clostridium difficile‐associated diarrhea, acute kidney injury, and anaphylaxis, among other adverse events, particularly in older patients with medical comorbidities.[15, 16, 17, 18] Judicious antibiotic use is critical to halt the epidemic of MDROs and to minimize antibiotic‐associated adverse effects.[19, 20, 21]
Evidence‐based guidelines have the potential to assist physicians in choosing the antibiotic that achieves the best clinical outcome for a specific infection or situation.[11] This includes using the narrowest spectrum agent to minimize selection pressure on microorganisms and avoiding unneeded drugs to minimize adverse drug effects.[9, 11] Importantly, guideline adherence regarding antibiotic selection has been shown to be associated with increased clinical success and decreased mortality.[22, 23] Unfortunately, 30% to 50% of antibiotic use in hospitalized patients is inconsistent with national guidelines.[24, 25, 26] Reasons for physicians ordering of tests and treatments inconsistent with guidelines are not fully understood, and potentially include patient and physician factors, and the cultural and social context of the healthcare system.[27]
To optimize the use of antibiotics, it is important to understand how medical complexities (defined as demographic, comorbid, and limited healthcare access characteristics that are associated with suboptimal patient care and outcomes) influence physicians antibiotic prescribing practices.[28] We created 3 clinical vignettes for common diagnoses (dyspnea with initial concern for pneumonia, skin and soft tissue infection, and asymptomatic bacteriuria) among hospitalized patients. We selected these conditions because of their high prevalence, frequent management by hospitalists, generalist physicians, and noninfectious disease specialists, and because well‐documented evidence suggests either no antibiotics or narrower spectrum antibiotics are usually the treatments of choice. Using the Infectious Diseases Society of America (IDSA) guidelines relevant to each clinical vignette,[29, 30, 31] we assessed physicians recommendations for guideline‐appropriate antibiotic management for patients without and with medical complexities using an electronic multiple‐choice survey.
METHODS
Survey Participants
We surveyed internal medicine generalist and subspecialty inpatient physicians from 3 academic medical centers in the metropolitan Los Angeles, California area. Potential participants included attending and housestaff physicians in the departments of internal medicine and family medicine at the 3 medical centers associated with the University of California Los Angeles (UCLA) Clinical and Translational Science Institute: (1) Ronald ReaganUCLA Medical Center, a tertiary care academic medical center; (2) Harbor UCLA Medical Center, a county (public) medical center; and (3) CedarsSinai Medical Center, a tertiary care medical center. Each center was affiliated with a residency training program, although not all attending physicians were associated with the training programs. Physicians were eligible to perform the survey if they attended 2 weeks per year in the inpatient setting. We collected physician‐level information including level of training (resident/fellow vs attending), specialization or not, proportion of time spent working in the hospital, and proportion of time spent providing direct clinical care (compared to activities such as administration and research). All eligible participants were emailed a brief study description with a hyperlink to the electronic survey created in REDCap (Research Electronic Data Capture version 5.6.0, 2013). Administrative staff provided email lists for potential participants at 2 of the hospitals. Per hospital policy, an email list was not provided by the third hospital, and potential participants were emailed the survey link directly by the hospital administrative staff. We incentivized study participation by entering participants who completed the survey into a raffle to win either a $100 gift card or a computer tablet. Physicians had 3 months to complete the survey and were sent up to 5 emails encouraging them to complete it.
Survey
The survey consisted of 3 clinical vignettes describing common hospital‐based situations that required decision making about antibiotic use. The 3 clinical vignettes described: (1) a patient with dyspnea and no infiltrate on chest radiograph who is initially treated empirically with antibiotics for pneumonia but is ultimately diagnosed with a congestive heart failure exacerbation, (2) a patient admitted with a skin infection that grows methicillin‐sensitive Staphylococcus aureus, and (3) a patient with a urinary catheter who develops asymptomatic bacteriuria. The first vignette was chosen because congestive heart failure and pneumonia are among the most common reasons for hospitalization in the United States, and their overlapping syndromes can make the diagnosis challenging.[32, 33, 34, 35] The second vignette was chosen because skin infections are some of the most common infectious diseases, with an incidence that is twice that of urinary tract infections and 10 times that of pneumonia, and can lead to serious complications among hospitalized patients.[30, 36] The third vignette was chosen because the prevalence of asymptomatic bacteriuria approaches 100% among catheterized patients, and rates of unnecessary treatment for this condition are as high as 80%.[31, 37]
Each clinical vignette was then modified to include 1 of the 4 studied patient complexities (Table 1). Medical comorbidities were represented by modifying the baseline vignette to describe patients with poorly controlled diabetes, morbid obesity, chronic kidney disease, and/or heavy tobacco use (Table 2). Patients with poor functional status were described in the vignettes as having difficulty with ambulation, requiring a mobility device, or needing assistance with self‐care (Table 2). Clinical vignettes varied the age of the patient from 47 years in the baseline case to 86 years (Table 2). Patients expected to have limited postdischarge follow‐up were described as being uninsured, with the first available follow‐up occurring in a public clinic no sooner than 2 weeks after their hospital discharge (Table 2). These complexities were chosen because they are common among hospitalized patients and have been shown to be associated with worse outcomes in a variety of conditions.[38, 39, 40, 41, 42] The asymptomatic bacteriuria vignette did not have a question about limited postdischarge follow‐up, because the clinical decision making in this question only pertained to the initial diagnosis and management. All physicians were queried about antibiotic use in each of the 3 baseline vignettes and in the subsequent 4 modified vignettes for each baseline scenario, with each physician making antibiotic management decisions for 15 vignettes in total. Physicians responses were recorded using categorical responses describing treatment options.
|
| Dyspnea case (baseline scenario) |
| A 47‐year‐old male with a history of stage III congestive heart failure is hospitalized after presenting with shortness of breath and a nonproductive cough. In the ED, he had a temp 99.6F, a HR of 120, and an RR 30. Exam was notable for bilateral crackles. CXR on admission was interpreted as having cardiomegaly, bilateral base atelectasis versus infiltrate and prominent pulmonary arteries with cephalization consistent with cardiogenic pulmonary edema. Admission laboratories were notable for an elevated BNP (950 pg/mL) and WBC (11.5 cells 10*9/L) with 75% neutrophils. Troponin and CK‐MB were not elevated. The patient was treated with diuretics, ceftriaxone, and azithromycin, and over the course of the next 48 hours has improved shortness of breath and no fevers. Because of his improvement he is prepared for hospital discharge. A repeat chest x‐ray shows cardiomegaly and bibasilar atelectasis. Blood cultures have been negative. He is insured and can follow with his primary physician within 3 days of discharge. Upon discharge you: |
| A. Discharge on his usual cardiac medications. |
| B. Discharge on his cardiac medications plus azithromycin to complete a 5‐day course of antibiotics. |
| C. Discharge on his cardiac medications plus azithromycin to complete a 7‐day course of antibiotics. |
| D. Discharge on usual cardiac medications plus levofloxacin to complete a 7‐day course of antibiotics. |
| Skin infection case (baseline scenario) |
| A 47‐year‐old obese female (BMI=32.9) is hospitalized after presenting with leg erythema, pain, and an 8 8‐cm fluctuant mass on her thigh. Admission temperature was 101.4F. In the ED, she was given vancomycin, and piperacillin/tazobactam and underwent incision and drainage of a thigh abscess, which drained a large amount of pus. The wound was packed. On day 3 she is afebrile, and the pain has improved. Cultures from the wound grow methicillin‐susceptible Staphylococcus aureus. Blood cultures are negative to date. She is ready for discharge. She has no allergies. She is insured and can be followed up with her primary physician within a few days of discharge. You: |
| A. Discharge on vancomycin and piperacillin/tazobactam through a PICC line to complete a 10‐day course. |
| B. Discharge on amoxicillin/clavulanate orally to complete a 10‐day course. |
| C. Discharge on cephalexin to complete a 10‐day course. |
| Asymptomatic bacteriuria case (baseline scenario) |
| A generally healthy 47‐year‐old female is admitted to the hospital for a femoral head fracture and undergoes total hip replacement. On post operative day 2, the nurse sends a urinalysis and culture from the patient's Foley catheter because the patient's urine is cloudy. Labs from that day show a WBC of 8900 and a urinalysis with 12 WBCs/HPF and 2+ bacteria. She has surgical site discomfort and no dysuria or other lower urinary tract symptoms. She has not had a fever during her hospital stay. Two days later her urine culture grows 100,000 CFU/mL of Escherichia coli susceptible to ciprofloxacin but resistant to all other oral antibiotics. That day, the patient is still afebrile and has no dysuria or other lower urinary tract symptoms. Her Foley is changed and a repeat urinalysis shows that the urine has persistent leukocytes and bacteria. You: |
| A. Initiate intravenous ciprofloxacin. |
| B. Initiate oral ciprofloxacin. |
| C. Give no antibiotics. |
| |
| Dyspnea case | |
| Comorbidities | A 47‐year‐old male with a history of stage III congestive heart failure, moderate to heavy tobacco use, poorly controlled type 2 diabetes (last HbA1C=10.9), chronic renal insufficiency (baseline creatinine of 1.3), diabetic retinopathy, and diabetic neuropathy is hospitalized after presenting with shortness of breath. |
| Poor functional status | A 47‐year‐old male with a history of stage III congestive heart failure, and poor functional status with difficulty ambulating and with self‐care is hospitalized after presenting with shortness of breath. |
| Older age | An 86‐year‐old male with a history of stage III congestive heart failure is hospitalized after presenting with shortness of breath. |
| Limited follow‐up | A 47‐year‐old male with a history of stage III congestive heart failure is hospitalized after presenting with shortness of breath.Blood cultures have been negative. He is uninsured and will be referred for follow‐up to a public clinic, which has a 2‐week wait for the next available clinic appointment. |
| Skin infection case | |
| Comorbidities | A 47‐year‐old morbidly obese female (BMI=32.9) with type 2 diabetes is hospitalized after presenting with leg erythema, pain, and an 8 8‐cm fluctuant mass on her thigh. |
| Poor functional status | A 47‐year‐old obese female (BMI=32.9) and poor functional status due to her obesity (poor mobility, uses either a walker or an electric scooter at all times to move around) is hospitalized after presenting with leg erythema, pain, and an 8 8‐cm fluctuant mass on her thigh. |
| Older age | An 86‐year‐old obese female (BMI=32.9) is hospitalized after presenting with leg erythema, pain, and an 8 8‐cm fluctuant mass on her thigh. |
| Limited follow‐up | A 47‐year‐old obese female (BMI=32.9) is hospitalized after presenting with leg erythema, pain, and an 8 8‐cm fluctuant mass on her thigh. She is uninsured and will be referred for follow‐up in a public clinic, which has a 2‐week wait for the next available clinic appointment. |
| Asymptomatic bacteriuria case | |
| Comorbidities | A 47‐year‐old female with a history type 2 diabetes with diabetic nephropathy and retinopathy is admitted to the hospital for a femoral head fracture and undergoes total hip replacement. On postoperative day 2, the nurse sends a urinalysis and culture from the patient's Foley catheter because the patient's urine is cloudy. |
| Poor functional status | A 47‐year‐old female with a history of poor functional status (needs assistance with activities of daily living) due to her obesity and musculoskeletal comorbidities, such as osteoarthritis, is admitted to the hospital for a femoral head fracture and undergoes total hip replacement. On postoperative day 2, the nurse sends a urinalysis and culture from the patient's Foley catheter because the patient's urine is cloudy. |
| Older age | A generally healthy 86‐year‐old female is admitted to the hospital for a femoral head fracture and undergoes total hip replacement. On post operative day 2, the nurse sends a urinalysis and culture from the patient's Foley catheter because the patient's urine is cloudy. |
The institutional review boards at all 3 medical centers approved the study.
Statistical Analysis
We used physician self‐report of recommended antibiotic use stratified by baseline and modified clinical vignettes to calculate the proportion of physicians recommending antibiotic use. We examined how physicians antibiotic use varied according to both patient complexity (medical comorbidity, poor functional status, older age, and limited follow‐up after hospital discharge), and provider characteristics (level of training, degree of specialization, time spent working in the hospital, and time spent providing direct patient care).
Data were analyzed using SAS (version 9.1.3; SAS Institute, Cary, NC). Antibiotic use inconsistent with IDSA guideline recommendations was considered the outcome of interest for the data analysis. Statistical analyses were performed using [2] or Fischer exact test, Student t test, and analysis of variance, as appropriate.
RESULTS
Physician Survey
Of the 874 invited physicians, 255 (29%) responded to the survey. Of these, 8/255 (3.1%) responded that they did not spend 2 or more weeks in the inpatient setting and were thus ineligible for the survey. We analyzed data from the remaining 247 physician respondents. Most respondents (217/233, 93%) reported their primary role was direct clinical care (Table 3). Most (185/241, 77%) reported at least half of their clinical work occurred in the hospital. Approximately three‐quarters (183/241, 76%) of the respondents were residents; the remaining respondents were attending physicians (57/241, 24%). Almost half of attending physicians (46%) were internal medicine subspecialists.
| Physician Characteristic | No. (%) Completing the Survey | % of Physicians Not Adhering to Guidelines in Baseline Scenarios | P Value |
|---|---|---|---|
| |||
| Affiliated medical center, n =241 | |||
| Ronald Reagan UCLA | 47 (20%) | 37% | 0.37 |
| Harbor‐UCLA | 106 (44%) | 41% | |
| Cedars‐Sinai | 86 (35%) | 43% | |
| Primary professional activity, n=233 | |||
| Direct clinical care/teaching | 217 (93%) | 42% | 0.90 |
| Research/administration | 16 (7%) | 27% | |
| Percent of clinical duties in the hospital, n=241 | |||
| 1%25% | 57 (23%) | 41% | 0.71 |
| 51%75% | 93 (39%) | 42% | |
| 76%100% | 92 (38%) | 41% | |
| Level of training and subspecialization, n=241 | |||
| Resident/fellow | 183 (76%) | 43% | 0.05 |
| Attending | 58 (24%) | 34% | |
| Subspecialist | 27 (47%) | 34% | 0.90 |
| Hospitalist | 28 (48%) | 33% | |
Physician recommendation for the use of antibiotics inconsistent with IDSA guidelines was prevalent in the baseline vignettes: 42% (303/729) overall, and 49% (120/246) for the dyspnea, 28% (68/242) for the skin infection, and 48% (115/241) for the asymptomatic bacteriuria cases. When the vignettes were modified to include patient complexities, the proportion of physicians recommending antibiotics increased significantly compared to the baseline vignette (63% (459/728), 54% (393/728), 51% (371/728), and 48% (232/487) for medical comorbidities, poor functional status, older age, and limited follow‐up respectively, P<0.001 for all comparisons) (Figure 1). The increase in the proportion of physicians recommending antibiotics inconsistent with guidelines for patients with medical complexities was the same when stratified by case (data not shown).
We found no association between provider characteristics (medical center, degree of attending physician specialization, percentage of clinical time spent practicing hospital‐based medicine, or percentage of time providing direct clinical care) and prescribing antibiotics in the baseline vignettes (Table 3). However, resident physicians (n=183) were more likely than attending physicians (n=57) to have recommended antibiotics in the baseline vignettes (43% vs 34%, P<0.05) (Table 3) and in all 4 vignettes with patient complexities (data not shown).
DISCUSSION
In our survey, almost half of the physician respondents recommended antibiotics that were inconsistent with national guidelines in the baseline vignettes. One explanation for this finding is that physicians may underestimate the risk associated with antibiotic use, such as the emergence of antimicrobial resistant pathogens and drug‐associated adverse effects. Although physicians generally agree that antibiotic resistance is an important problem, many believe that it is not a prominent issue in their practice or through their antibiotic prescribing practices.[43, 44] Others have shown that physicians underestimate the risk and severity of antibiotic‐associated complications such as C difficile.[45, 46] An accurate assessment and heightened awareness of the risks associated with antibiotics is important in clinical decision making, and should potentially be included not only in antibiotic stewardship educational efforts, but in national guideline recommendations as well.
Our survey also demonstrated that the tendency of physician respondents to recommend antibiotics was amplified for patients with medical complexities. This suggests that patient characteristics related to medical and social complexities play an important role in physicians clinical decision making about prescribing antibiotics. Previous investigations have shown that when physicians are deciding whether or not to prescribe antibiotics, they tend to deprioritize guideline recommendations and give greater weight to the risk of disease progression and complications that might occur if antibiotics are withheld.[47, 48, 49] Physicians are believed to prescribe antibiotics for complex patients more often, in part, because complex patients are more likely to suffer bad outcomes if undertreated.[50, 51] Axiomatically, patients with medical complexities are also at higher risk for antibiotic‐associated adverse effects including polypharmacy, drug‐drug interactions, and more severe side effects.[52, 53, 54]
An additional factor contributing to the overuse of antibiotics in our survey could be the lack of clear guideline recommendations for antibiotic management, especially among patients with complexities. We reviewed 20 national guidelines that addressed the medical decision making relevant to the survey's 3 clinical vignettes (see Supporting Information, Appendix 1, in the online version of this article). Fifteen of the guidelines provided recommendations for antibiotic management in the baseline vignettes, though most of the recommendations were not explicit about stopping or de‐escalating antibiotics. Furthermore, when antibiotic recommendations were present, they often lacked supporting data for the recommendation. Guidelines were even less complete for patients with medical complexities. For the asymptomatic bacteriuria vignette, 4 of 6 guidelines provided recommendations for patients with medical comorbidities described in our survey's modified vignettes.[31, 55, 56, 57] None of the guidelines related to the dyspnea or skin infection vignette provided specific antibiotic recommendations for complex patients with medical comorbidities, poor functional status, older age, or limited follow‐up (see Supporting Information, Appendix 1, in the online version of this article). Given these findings, along with evidence that medically complex patients are more likely to receive antibiotics compared to their less complex counterparts, there is a need for subsequent guidelines to more explicitly recommend best antibiotic practices for patients with medical and social complexities.
We also found that resident physicians were significantly more likely to recommend antibiotics inconsistent with guidelines compared to attending physicians. Although the underlying explanations for this finding were not explored in this study, possibilities include a lack of familiarity with guideline recommendations, less comfort in discontinuing antibiotics in the setting of clinical uncertainty, and/or a preference to accept the risks of overtreatment over the risks of undertreatment.
There are limitations to our study. First, although previous investigations have shown a high degree of correlation between actual antibiotic prescribing practices and antibiotic prescribing decisions self‐reported in clinical vignettes, physician responses in our survey may not reflect actual practices.[58] Second, we were not able to directly measure how physicians knowledge and interpretation of national guidelines influenced their antibiotic management decisions in the survey. Third, while our study was multisite including physicians from 3 different centers, not all invited physicians responded. Because of the confidentiality procedures surrounding the email distribution lists of potential participants, we were unable to obtain additional details about the non‐responders. Finally, because the large majority of respondents were trainees (76%), the generalizability of our findings to attending physicians may be limited. Nevertheless, because residents soon become staff physicians, resident‐reported data supplemented by that from attending physicians seems relevant to identifying opportunities for improving medical care.
In conclusion, we found that a large proportion of physicians recommended antibiotics that were not indicated based on IDSA guidelines for 3 vignettes depicting common hospital‐based clinical scenarios. This pattern of physicians recommending antibiotics inconsistent with guidelines was accentuated with significantly higher reported use for patients with medical comorbidities, poor functional status, older age, and limited healthcare access. Although good clinical judgment requires increased monitoring of patients with medical complexities, it is important for clinicians not to conflate the need for increased patient monitoring with the need for increased antibiotic use. Additional studies and corresponding guideline recommendations for frail, complex patients could be instrumental in reducing frequent use of antibiotics and the resultant cost, adverse effects, and emergence of antibiotic resistant pathogens. Educational efforts, particularly among trainees, regarding appropriate antibiotic use for clinical indications among patients without and with medical complexities would also likely contribute to these aims. Treatment guidelines should consider explicitly addressing medically complex patients in the context of management of infectious syndromes.
Disclosure
Nothing to report.
Clinical management of patients with medical and social comorbidities has become increasingly complex.[1, 2, 3, 4] This complexity stems from lack of data for these groups of patients who are often excluded from clinical trials.[5] There are data demonstrating that older patients and patients with multiple comorbidities including diabetes, renal disease, obesity, limited mobility, and poor access to healthcare have worse outcomes for specific conditions compared to otherwise equal counterparts, and that the cost of care for these patients is more expensive.[3, 4, 6] Moreover, traditional risk assessment of disease severity and outcomes are not accurate when applied to medically and socially complex patients.[7, 8]
Treatment decisions regarding antibiotic use add additional complexity. Specifically, physicians antibiotic prescribing decisions can promote the emergence of multidrug resistant pathogens in a hospital or population.[9, 10] Multidrug resistant organisms (MDROs) are particularly problematic, as their prevalence is increasing while the development of new antimicrobial agents is declining.[11] Infections caused by antibiotic‐resistant pathogens are associated with increased morbidity and mortality and healthcare costs.[12, 13, 14] Antibiotic use, although potentially lifesaving, can also result in severe complications such as Clostridium difficile‐associated diarrhea, acute kidney injury, and anaphylaxis, among other adverse events, particularly in older patients with medical comorbidities.[15, 16, 17, 18] Judicious antibiotic use is critical to halt the epidemic of MDROs and to minimize antibiotic‐associated adverse effects.[19, 20, 21]
Evidence‐based guidelines have the potential to assist physicians in choosing the antibiotic that achieves the best clinical outcome for a specific infection or situation.[11] This includes using the narrowest spectrum agent to minimize selection pressure on microorganisms and avoiding unneeded drugs to minimize adverse drug effects.[9, 11] Importantly, guideline adherence regarding antibiotic selection has been shown to be associated with increased clinical success and decreased mortality.[22, 23] Unfortunately, 30% to 50% of antibiotic use in hospitalized patients is inconsistent with national guidelines.[24, 25, 26] Reasons for physicians ordering of tests and treatments inconsistent with guidelines are not fully understood, and potentially include patient and physician factors, and the cultural and social context of the healthcare system.[27]
To optimize the use of antibiotics, it is important to understand how medical complexities (defined as demographic, comorbid, and limited healthcare access characteristics that are associated with suboptimal patient care and outcomes) influence physicians antibiotic prescribing practices.[28] We created 3 clinical vignettes for common diagnoses (dyspnea with initial concern for pneumonia, skin and soft tissue infection, and asymptomatic bacteriuria) among hospitalized patients. We selected these conditions because of their high prevalence, frequent management by hospitalists, generalist physicians, and noninfectious disease specialists, and because well‐documented evidence suggests either no antibiotics or narrower spectrum antibiotics are usually the treatments of choice. Using the Infectious Diseases Society of America (IDSA) guidelines relevant to each clinical vignette,[29, 30, 31] we assessed physicians recommendations for guideline‐appropriate antibiotic management for patients without and with medical complexities using an electronic multiple‐choice survey.
METHODS
Survey Participants
We surveyed internal medicine generalist and subspecialty inpatient physicians from 3 academic medical centers in the metropolitan Los Angeles, California area. Potential participants included attending and housestaff physicians in the departments of internal medicine and family medicine at the 3 medical centers associated with the University of California Los Angeles (UCLA) Clinical and Translational Science Institute: (1) Ronald ReaganUCLA Medical Center, a tertiary care academic medical center; (2) Harbor UCLA Medical Center, a county (public) medical center; and (3) CedarsSinai Medical Center, a tertiary care medical center. Each center was affiliated with a residency training program, although not all attending physicians were associated with the training programs. Physicians were eligible to perform the survey if they attended 2 weeks per year in the inpatient setting. We collected physician‐level information including level of training (resident/fellow vs attending), specialization or not, proportion of time spent working in the hospital, and proportion of time spent providing direct clinical care (compared to activities such as administration and research). All eligible participants were emailed a brief study description with a hyperlink to the electronic survey created in REDCap (Research Electronic Data Capture version 5.6.0, 2013). Administrative staff provided email lists for potential participants at 2 of the hospitals. Per hospital policy, an email list was not provided by the third hospital, and potential participants were emailed the survey link directly by the hospital administrative staff. We incentivized study participation by entering participants who completed the survey into a raffle to win either a $100 gift card or a computer tablet. Physicians had 3 months to complete the survey and were sent up to 5 emails encouraging them to complete it.
Survey
The survey consisted of 3 clinical vignettes describing common hospital‐based situations that required decision making about antibiotic use. The 3 clinical vignettes described: (1) a patient with dyspnea and no infiltrate on chest radiograph who is initially treated empirically with antibiotics for pneumonia but is ultimately diagnosed with a congestive heart failure exacerbation, (2) a patient admitted with a skin infection that grows methicillin‐sensitive Staphylococcus aureus, and (3) a patient with a urinary catheter who develops asymptomatic bacteriuria. The first vignette was chosen because congestive heart failure and pneumonia are among the most common reasons for hospitalization in the United States, and their overlapping syndromes can make the diagnosis challenging.[32, 33, 34, 35] The second vignette was chosen because skin infections are some of the most common infectious diseases, with an incidence that is twice that of urinary tract infections and 10 times that of pneumonia, and can lead to serious complications among hospitalized patients.[30, 36] The third vignette was chosen because the prevalence of asymptomatic bacteriuria approaches 100% among catheterized patients, and rates of unnecessary treatment for this condition are as high as 80%.[31, 37]
Each clinical vignette was then modified to include 1 of the 4 studied patient complexities (Table 1). Medical comorbidities were represented by modifying the baseline vignette to describe patients with poorly controlled diabetes, morbid obesity, chronic kidney disease, and/or heavy tobacco use (Table 2). Patients with poor functional status were described in the vignettes as having difficulty with ambulation, requiring a mobility device, or needing assistance with self‐care (Table 2). Clinical vignettes varied the age of the patient from 47 years in the baseline case to 86 years (Table 2). Patients expected to have limited postdischarge follow‐up were described as being uninsured, with the first available follow‐up occurring in a public clinic no sooner than 2 weeks after their hospital discharge (Table 2). These complexities were chosen because they are common among hospitalized patients and have been shown to be associated with worse outcomes in a variety of conditions.[38, 39, 40, 41, 42] The asymptomatic bacteriuria vignette did not have a question about limited postdischarge follow‐up, because the clinical decision making in this question only pertained to the initial diagnosis and management. All physicians were queried about antibiotic use in each of the 3 baseline vignettes and in the subsequent 4 modified vignettes for each baseline scenario, with each physician making antibiotic management decisions for 15 vignettes in total. Physicians responses were recorded using categorical responses describing treatment options.
|
| Dyspnea case (baseline scenario) |
| A 47‐year‐old male with a history of stage III congestive heart failure is hospitalized after presenting with shortness of breath and a nonproductive cough. In the ED, he had a temp 99.6F, a HR of 120, and an RR 30. Exam was notable for bilateral crackles. CXR on admission was interpreted as having cardiomegaly, bilateral base atelectasis versus infiltrate and prominent pulmonary arteries with cephalization consistent with cardiogenic pulmonary edema. Admission laboratories were notable for an elevated BNP (950 pg/mL) and WBC (11.5 cells 10*9/L) with 75% neutrophils. Troponin and CK‐MB were not elevated. The patient was treated with diuretics, ceftriaxone, and azithromycin, and over the course of the next 48 hours has improved shortness of breath and no fevers. Because of his improvement he is prepared for hospital discharge. A repeat chest x‐ray shows cardiomegaly and bibasilar atelectasis. Blood cultures have been negative. He is insured and can follow with his primary physician within 3 days of discharge. Upon discharge you: |
| A. Discharge on his usual cardiac medications. |
| B. Discharge on his cardiac medications plus azithromycin to complete a 5‐day course of antibiotics. |
| C. Discharge on his cardiac medications plus azithromycin to complete a 7‐day course of antibiotics. |
| D. Discharge on usual cardiac medications plus levofloxacin to complete a 7‐day course of antibiotics. |
| Skin infection case (baseline scenario) |
| A 47‐year‐old obese female (BMI=32.9) is hospitalized after presenting with leg erythema, pain, and an 8 8‐cm fluctuant mass on her thigh. Admission temperature was 101.4F. In the ED, she was given vancomycin, and piperacillin/tazobactam and underwent incision and drainage of a thigh abscess, which drained a large amount of pus. The wound was packed. On day 3 she is afebrile, and the pain has improved. Cultures from the wound grow methicillin‐susceptible Staphylococcus aureus. Blood cultures are negative to date. She is ready for discharge. She has no allergies. She is insured and can be followed up with her primary physician within a few days of discharge. You: |
| A. Discharge on vancomycin and piperacillin/tazobactam through a PICC line to complete a 10‐day course. |
| B. Discharge on amoxicillin/clavulanate orally to complete a 10‐day course. |
| C. Discharge on cephalexin to complete a 10‐day course. |
| Asymptomatic bacteriuria case (baseline scenario) |
| A generally healthy 47‐year‐old female is admitted to the hospital for a femoral head fracture and undergoes total hip replacement. On post operative day 2, the nurse sends a urinalysis and culture from the patient's Foley catheter because the patient's urine is cloudy. Labs from that day show a WBC of 8900 and a urinalysis with 12 WBCs/HPF and 2+ bacteria. She has surgical site discomfort and no dysuria or other lower urinary tract symptoms. She has not had a fever during her hospital stay. Two days later her urine culture grows 100,000 CFU/mL of Escherichia coli susceptible to ciprofloxacin but resistant to all other oral antibiotics. That day, the patient is still afebrile and has no dysuria or other lower urinary tract symptoms. Her Foley is changed and a repeat urinalysis shows that the urine has persistent leukocytes and bacteria. You: |
| A. Initiate intravenous ciprofloxacin. |
| B. Initiate oral ciprofloxacin. |
| C. Give no antibiotics. |
| |
| Dyspnea case | |
| Comorbidities | A 47‐year‐old male with a history of stage III congestive heart failure, moderate to heavy tobacco use, poorly controlled type 2 diabetes (last HbA1C=10.9), chronic renal insufficiency (baseline creatinine of 1.3), diabetic retinopathy, and diabetic neuropathy is hospitalized after presenting with shortness of breath. |
| Poor functional status | A 47‐year‐old male with a history of stage III congestive heart failure, and poor functional status with difficulty ambulating and with self‐care is hospitalized after presenting with shortness of breath. |
| Older age | An 86‐year‐old male with a history of stage III congestive heart failure is hospitalized after presenting with shortness of breath. |
| Limited follow‐up | A 47‐year‐old male with a history of stage III congestive heart failure is hospitalized after presenting with shortness of breath.Blood cultures have been negative. He is uninsured and will be referred for follow‐up to a public clinic, which has a 2‐week wait for the next available clinic appointment. |
| Skin infection case | |
| Comorbidities | A 47‐year‐old morbidly obese female (BMI=32.9) with type 2 diabetes is hospitalized after presenting with leg erythema, pain, and an 8 8‐cm fluctuant mass on her thigh. |
| Poor functional status | A 47‐year‐old obese female (BMI=32.9) and poor functional status due to her obesity (poor mobility, uses either a walker or an electric scooter at all times to move around) is hospitalized after presenting with leg erythema, pain, and an 8 8‐cm fluctuant mass on her thigh. |
| Older age | An 86‐year‐old obese female (BMI=32.9) is hospitalized after presenting with leg erythema, pain, and an 8 8‐cm fluctuant mass on her thigh. |
| Limited follow‐up | A 47‐year‐old obese female (BMI=32.9) is hospitalized after presenting with leg erythema, pain, and an 8 8‐cm fluctuant mass on her thigh. She is uninsured and will be referred for follow‐up in a public clinic, which has a 2‐week wait for the next available clinic appointment. |
| Asymptomatic bacteriuria case | |
| Comorbidities | A 47‐year‐old female with a history type 2 diabetes with diabetic nephropathy and retinopathy is admitted to the hospital for a femoral head fracture and undergoes total hip replacement. On postoperative day 2, the nurse sends a urinalysis and culture from the patient's Foley catheter because the patient's urine is cloudy. |
| Poor functional status | A 47‐year‐old female with a history of poor functional status (needs assistance with activities of daily living) due to her obesity and musculoskeletal comorbidities, such as osteoarthritis, is admitted to the hospital for a femoral head fracture and undergoes total hip replacement. On postoperative day 2, the nurse sends a urinalysis and culture from the patient's Foley catheter because the patient's urine is cloudy. |
| Older age | A generally healthy 86‐year‐old female is admitted to the hospital for a femoral head fracture and undergoes total hip replacement. On post operative day 2, the nurse sends a urinalysis and culture from the patient's Foley catheter because the patient's urine is cloudy. |
The institutional review boards at all 3 medical centers approved the study.
Statistical Analysis
We used physician self‐report of recommended antibiotic use stratified by baseline and modified clinical vignettes to calculate the proportion of physicians recommending antibiotic use. We examined how physicians antibiotic use varied according to both patient complexity (medical comorbidity, poor functional status, older age, and limited follow‐up after hospital discharge), and provider characteristics (level of training, degree of specialization, time spent working in the hospital, and time spent providing direct patient care).
Data were analyzed using SAS (version 9.1.3; SAS Institute, Cary, NC). Antibiotic use inconsistent with IDSA guideline recommendations was considered the outcome of interest for the data analysis. Statistical analyses were performed using [2] or Fischer exact test, Student t test, and analysis of variance, as appropriate.
RESULTS
Physician Survey
Of the 874 invited physicians, 255 (29%) responded to the survey. Of these, 8/255 (3.1%) responded that they did not spend 2 or more weeks in the inpatient setting and were thus ineligible for the survey. We analyzed data from the remaining 247 physician respondents. Most respondents (217/233, 93%) reported their primary role was direct clinical care (Table 3). Most (185/241, 77%) reported at least half of their clinical work occurred in the hospital. Approximately three‐quarters (183/241, 76%) of the respondents were residents; the remaining respondents were attending physicians (57/241, 24%). Almost half of attending physicians (46%) were internal medicine subspecialists.
| Physician Characteristic | No. (%) Completing the Survey | % of Physicians Not Adhering to Guidelines in Baseline Scenarios | P Value |
|---|---|---|---|
| |||
| Affiliated medical center, n =241 | |||
| Ronald Reagan UCLA | 47 (20%) | 37% | 0.37 |
| Harbor‐UCLA | 106 (44%) | 41% | |
| Cedars‐Sinai | 86 (35%) | 43% | |
| Primary professional activity, n=233 | |||
| Direct clinical care/teaching | 217 (93%) | 42% | 0.90 |
| Research/administration | 16 (7%) | 27% | |
| Percent of clinical duties in the hospital, n=241 | |||
| 1%25% | 57 (23%) | 41% | 0.71 |
| 51%75% | 93 (39%) | 42% | |
| 76%100% | 92 (38%) | 41% | |
| Level of training and subspecialization, n=241 | |||
| Resident/fellow | 183 (76%) | 43% | 0.05 |
| Attending | 58 (24%) | 34% | |
| Subspecialist | 27 (47%) | 34% | 0.90 |
| Hospitalist | 28 (48%) | 33% | |
Physician recommendation for the use of antibiotics inconsistent with IDSA guidelines was prevalent in the baseline vignettes: 42% (303/729) overall, and 49% (120/246) for the dyspnea, 28% (68/242) for the skin infection, and 48% (115/241) for the asymptomatic bacteriuria cases. When the vignettes were modified to include patient complexities, the proportion of physicians recommending antibiotics increased significantly compared to the baseline vignette (63% (459/728), 54% (393/728), 51% (371/728), and 48% (232/487) for medical comorbidities, poor functional status, older age, and limited follow‐up respectively, P<0.001 for all comparisons) (Figure 1). The increase in the proportion of physicians recommending antibiotics inconsistent with guidelines for patients with medical complexities was the same when stratified by case (data not shown).
We found no association between provider characteristics (medical center, degree of attending physician specialization, percentage of clinical time spent practicing hospital‐based medicine, or percentage of time providing direct clinical care) and prescribing antibiotics in the baseline vignettes (Table 3). However, resident physicians (n=183) were more likely than attending physicians (n=57) to have recommended antibiotics in the baseline vignettes (43% vs 34%, P<0.05) (Table 3) and in all 4 vignettes with patient complexities (data not shown).
DISCUSSION
In our survey, almost half of the physician respondents recommended antibiotics that were inconsistent with national guidelines in the baseline vignettes. One explanation for this finding is that physicians may underestimate the risk associated with antibiotic use, such as the emergence of antimicrobial resistant pathogens and drug‐associated adverse effects. Although physicians generally agree that antibiotic resistance is an important problem, many believe that it is not a prominent issue in their practice or through their antibiotic prescribing practices.[43, 44] Others have shown that physicians underestimate the risk and severity of antibiotic‐associated complications such as C difficile.[45, 46] An accurate assessment and heightened awareness of the risks associated with antibiotics is important in clinical decision making, and should potentially be included not only in antibiotic stewardship educational efforts, but in national guideline recommendations as well.
Our survey also demonstrated that the tendency of physician respondents to recommend antibiotics was amplified for patients with medical complexities. This suggests that patient characteristics related to medical and social complexities play an important role in physicians clinical decision making about prescribing antibiotics. Previous investigations have shown that when physicians are deciding whether or not to prescribe antibiotics, they tend to deprioritize guideline recommendations and give greater weight to the risk of disease progression and complications that might occur if antibiotics are withheld.[47, 48, 49] Physicians are believed to prescribe antibiotics for complex patients more often, in part, because complex patients are more likely to suffer bad outcomes if undertreated.[50, 51] Axiomatically, patients with medical complexities are also at higher risk for antibiotic‐associated adverse effects including polypharmacy, drug‐drug interactions, and more severe side effects.[52, 53, 54]
An additional factor contributing to the overuse of antibiotics in our survey could be the lack of clear guideline recommendations for antibiotic management, especially among patients with complexities. We reviewed 20 national guidelines that addressed the medical decision making relevant to the survey's 3 clinical vignettes (see Supporting Information, Appendix 1, in the online version of this article). Fifteen of the guidelines provided recommendations for antibiotic management in the baseline vignettes, though most of the recommendations were not explicit about stopping or de‐escalating antibiotics. Furthermore, when antibiotic recommendations were present, they often lacked supporting data for the recommendation. Guidelines were even less complete for patients with medical complexities. For the asymptomatic bacteriuria vignette, 4 of 6 guidelines provided recommendations for patients with medical comorbidities described in our survey's modified vignettes.[31, 55, 56, 57] None of the guidelines related to the dyspnea or skin infection vignette provided specific antibiotic recommendations for complex patients with medical comorbidities, poor functional status, older age, or limited follow‐up (see Supporting Information, Appendix 1, in the online version of this article). Given these findings, along with evidence that medically complex patients are more likely to receive antibiotics compared to their less complex counterparts, there is a need for subsequent guidelines to more explicitly recommend best antibiotic practices for patients with medical and social complexities.
We also found that resident physicians were significantly more likely to recommend antibiotics inconsistent with guidelines compared to attending physicians. Although the underlying explanations for this finding were not explored in this study, possibilities include a lack of familiarity with guideline recommendations, less comfort in discontinuing antibiotics in the setting of clinical uncertainty, and/or a preference to accept the risks of overtreatment over the risks of undertreatment.
There are limitations to our study. First, although previous investigations have shown a high degree of correlation between actual antibiotic prescribing practices and antibiotic prescribing decisions self‐reported in clinical vignettes, physician responses in our survey may not reflect actual practices.[58] Second, we were not able to directly measure how physicians knowledge and interpretation of national guidelines influenced their antibiotic management decisions in the survey. Third, while our study was multisite including physicians from 3 different centers, not all invited physicians responded. Because of the confidentiality procedures surrounding the email distribution lists of potential participants, we were unable to obtain additional details about the non‐responders. Finally, because the large majority of respondents were trainees (76%), the generalizability of our findings to attending physicians may be limited. Nevertheless, because residents soon become staff physicians, resident‐reported data supplemented by that from attending physicians seems relevant to identifying opportunities for improving medical care.
In conclusion, we found that a large proportion of physicians recommended antibiotics that were not indicated based on IDSA guidelines for 3 vignettes depicting common hospital‐based clinical scenarios. This pattern of physicians recommending antibiotics inconsistent with guidelines was accentuated with significantly higher reported use for patients with medical comorbidities, poor functional status, older age, and limited healthcare access. Although good clinical judgment requires increased monitoring of patients with medical complexities, it is important for clinicians not to conflate the need for increased patient monitoring with the need for increased antibiotic use. Additional studies and corresponding guideline recommendations for frail, complex patients could be instrumental in reducing frequent use of antibiotics and the resultant cost, adverse effects, and emergence of antibiotic resistant pathogens. Educational efforts, particularly among trainees, regarding appropriate antibiotic use for clinical indications among patients without and with medical complexities would also likely contribute to these aims. Treatment guidelines should consider explicitly addressing medically complex patients in the context of management of infectious syndromes.
Disclosure
Nothing to report.
- , , , , , . Heart failure and chronic obstructive pulmonary disease multimorbidity at hospital discharge transition: a study of patient and carer experience [published online ahead of print May 16. 2014]. Health Expect. doi: 10.1111/hex.12208.
- , , , , , . Development of clinical practice guidelines for patients with comorbidity and multiple diseases [in Spanish]. Aten Primaria. 2014;46(7):385–392.
- , , , et al. Cardiac complications in patients with community‐acquired pneumonia: a systematic review and meta‐analysis of observational studies. PLoS Med. 2011;8(6):e1001048.
- , , , , , . Cost and incidence of social comorbidities in low‐risk patients with community‐acquired pneumonia admitted to a public hospital. Chest. 2003;124(6):2148–2155.
- , , , et al. Why do GPs exclude patients from participating in research? An exploration of adherence to and divergence from trial criteria. Fam Pract. 2014;31(3):364–370.
- , , , , . The impact of pre‐existing heart failure on pneumonia prognosis: population‐based cohort study. J Gen Intern Med. 2008;23(9):1407–1413.
- , , , et al. Severe community‐acquired pneumonia: use of intensive care services and evaluation of American and British Thoracic Society Diagnostic criteria. Am J Respir Crit Care Med. 2002;166(5):717–723.
- . Decisions about treating community‐acquired pneumonia. Ann Intern Med. 2005;142(3):215–216.
- , , , et al. The epidemic of antibiotic‐resistant infections: a call to action for the medical community from the Infectious Diseases Society of America. Clin Infect Dis. 2008;46(2):155–164.
- Will antibiotic misuse now stop? Nat Rev Microbiol. 2003;1(2):85.
- , , , et al. Infectious Diseases Society of America and the Society for Healthcare Epidemiology of America guidelines for developing an institutional program to enhance antimicrobial stewardship. Clin Infect Dis. 2007;44(2):159–177.
- . Economic impact of antimicrobial resistance. Emerg Infect Dis. 2001;7(2):286–292.
- , , , , . Guideline‐concordant therapy and reduced mortality and length of stay in adults with community‐acquired pneumonia: playing by the rules. Arch Intern Med. 2009;169(16):1525–1531.
- , , , et al. Adherence to guidelines' empirical antibiotic recommendations and community‐acquired pneumonia outcome. Eur Respir J. 2008;32(4):892–901.
- , , , et al. Community‐associated Clostridium difficile infection and antibiotics: a meta‐analysis. J Antimicrob Chemother. 2013;68(9):1951–1961.
- , , , . Vancomycin‐induced nephrotoxicity: mechanism, incidence, risk factors and special populations. A literature review. Eur J Clin Pharmacol. 2012;68(9):1243–1255.
- , . Diagnosis and management of immediate hypersensitivity reactions to cephalosporins. Clin Rev Allergy Immunol. 2013;45(1):131–142.
- , . Neurotoxic effects associated with antibiotic use: management considerations. Br J Clin Pharmacol. 2011;72(3):381–393.
- , , , et al. A clinician's guide to the appropriate and accurate use of antibiotics: the Council for Appropriate and Rational Antibiotic Therapy (CARAT) criteria. Am J Med. 2005;118(suppl 7A):1S–6S.
- , , , , . Evaluation of rational antibiotic use. Int J Antimicrob Agents. 2000;15(2):131–135.
- , . Rational antibiotic prescribing. Challenges and successes [in German]. Bundesgesundheitsblatt Gesundheitsforschung Gesundheitsschutz. 2012;55(11–12):1418–1426.
- , , , et al. Antibiotic prescription for community‐acquired pneumonia in the intensive care unit: impact of adherence to Infectious Diseases Society of America guidelines on survival. Clin Infect Dis. 2005;41(12):1709–1716.
- , , . Guideline‐adherent initial intravenous antibiotic therapy for hospital‐acquired/ventilator‐associated pneumonia is clinically superior, saves lives and is cheaper than non guideline adherent therapy. Eur J Med Res. 2011;16(7):315–323.
- , , , , , . Antibiotic misuse: a prospective clinical audit in a French university hospital. Eur J Clin Microbiol Infect Dis. 2007;26(4):277–280.
- , , , , . Unnecessary use of antimicrobials in hospitalized patients: current patterns of misuse with an emphasis on the antianaerobic spectrum of activity. Arch Intern Med. 2003;163(8):972–978.
- , , , . A systematic review and meta‐analysis of misuse of antibiotic therapies in the community. Int J Antimicrob Agents. 2005;26(2):106–113.
- , . From best evidence to best practice: effective implementation of change in patients' care. Lancet. 2003;362(9391):1225–1230.
- , , , et al. The complexity of care for patients with rheumatoid arthritis: metrics for better understanding chronic disease care. Med Care. 2007;45(1):55–65.
- , , , et al. Infectious Diseases Society of America/American Thoracic Society consensus guidelines on the management of community‐acquired pneumonia in adults. Clin Infect Dis. 2007;44(suppl 2):S27–S72.
- , , , et al. Practice guidelines for the diagnosis and management of skin and soft tissue infections: 2014 update by the Infectious Diseases Society of America. Clin Infect Dis. 2014;59(2):e10–e52.
- , , , , , . Infectious Diseases Society of America guidelines for the diagnosis and treatment of asymptomatic bacteriuria in adults. Clin Infect Dis. 2005;40(5):643–654.
- , , , et al. Heart disease and stroke statistics—2010 update: a report from the American Heart Association. Circulation. 2010;121(7):e46–e215.
- , , , et al. ESC Guidelines for the diagnosis and treatment of acute and chronic heart failure 2008: the Task Force for the Diagnosis and Treatment of Acute and Chronic Heart Failure 2008 of the European Society of Cardiology. Developed in collaboration with the Heart Failure Association of the ESC (HFA) and endorsed by the European Society of Intensive Care Medicine (ESICM). Eur Heart J. 2008;29(19):2388–2442.
- , , , . Prevalence of negative chest radiography results in the emergency department patient with decompensated heart failure. Ann Emerg Med. 2006;47(1):13–18.
- , , , . Patients admitted to hospital with suspected pneumonia and normal chest radiographs: epidemiology, microbiology, and outcomes. Am J Med. 2004;117(5):305–311.
- , , , et al. Incidence of skin and soft tissue infections in ambulatory and inpatient settings, 2005–2010. BMC Infect Dis. In press.
- . Asymptomatic bacteriuria: when the treatment is worse than the disease. Nat Rev Urol. 2012;9(2):85–93.
- , , , et al. Prevalence and incidence trends for diagnosed diabetes among adults aged 20 to 79 years, United States, 1980–2012. JAMA. 2014;312(12):1218–1226.
- , , , . Prevalence of childhood and adult obesity in the United States, 2011–2012. JAMA. 2014;311(8):806–814.
- , , , , . Frailty in elderly people. Lancet. 2013;381(9868):752–762.
- , , , , , . Risk factors for death in homeless adults in Boston. Arch Intern Med. 1998;158(13):1454–1460.
- . Taking it to the streets: homelessness, health, and health care in the United States. J Gen Intern Med. 2003;18(11):964–965.
- , , , , , . Antibiotic resistance: a survey of physician perceptions. Arch Intern Med. 2002;162(19):2210–2216.
- , , , et al. Primary care clinicians' perceptions of antibiotic resistance: a multi‐country qualitative interview study. J Antimicrob Chemother. 2013;68(1):237–243.
- , , , , , . Underestimation of Clostridium difficile infection among clinicians: an international survey. Eur J Clin Microbiol Infect Dis. 2012;31(9):2439–2444.
- , , , , , . Unnecessary antimicrobial use in patients with current or recent Clostridium difficile infection. Infect Control Hosp Epidemiol. 2013;34(2):109–116.
- , , , , . Attitudes of primary care physicians to the prescribing of antibiotics and antimicrobial resistance: a qualitative study from Spain. Fam Pract. 2012;29(3):352–360.
- , , , , . Understanding physician antibiotic prescribing behaviour: a systematic review of qualitative studies. Int J Antimicrob Agents. 2013;41(3):203–212.
- , , , . Guidelines on uncomplicated urinary tract infections are difficult to follow: perceived barriers and suggested interventions. BMC Fam Pract. 2010;11:51.
- , , , . Why don't physicians adhere to guideline recommendations in practice? An analysis of barriers among Dutch general practitioners. Implement Sci. 2009;4:54.
- , , , , . Perceived barriers to guideline adherence: a survey among general practitioners. BMC Fam Pract. 2011;12:98.
- , , , . Clostridium difficile in acute and long‐stay elderly patients. Age Ageing. 1988;17(5):333–336.
- , , , , , . Pharmacodynamics of vancomycin in elderly patients aged 75 years or older with methicillin‐resistant Staphylococcus aureus hospital‐acquired pneumonia. Clin Interv Aging. 2013;8:1015–1021.
- , , , et al. Empiric guideline‐recommended weight‐based vancomycin dosing and nephrotoxicity rates in patients with methicillin‐resistant Staphylococcus aureus bacteremia: a retrospective cohort study. BMC Pharmacol Toxicol. 2013;14:12.
- , , , , , , , , . Guidelines on urological infections. Arnhem, The Netherlands: European Association of Urology (EAU); 2011. p. 15–27.
- Scottish Intercollegiate Guidelines Network. Management of suspected bacterial urinary tract infection in adults. Available at: http://www.sign.ac.uk/guidelines/fulltext/88/. Accessed on July 25, 2014.
- , , , et al. [Optimisation of the antibiotic policy in the Netherlands. X. The SWAB guideline for antimicrobial treatment of complicated urinary tract infections]. Ned Tijdschr Geneeskd 2006;150(43):2370–2376.
- , , , et al. Do case vignettes accurately reflect antibiotic prescription? Infect Control Hosp Epidemiol. 2011;32(10):1003–1009.
- The committee for The Japanese Respiratory Society guidelines in management of respiratory infections. Principles for the development of the guidelines. Respirology 2004;9(suppl 1):S1–S2.
- , , , , , . Heart failure and chronic obstructive pulmonary disease multimorbidity at hospital discharge transition: a study of patient and carer experience [published online ahead of print May 16. 2014]. Health Expect. doi: 10.1111/hex.12208.
- , , , , , . Development of clinical practice guidelines for patients with comorbidity and multiple diseases [in Spanish]. Aten Primaria. 2014;46(7):385–392.
- , , , et al. Cardiac complications in patients with community‐acquired pneumonia: a systematic review and meta‐analysis of observational studies. PLoS Med. 2011;8(6):e1001048.
- , , , , , . Cost and incidence of social comorbidities in low‐risk patients with community‐acquired pneumonia admitted to a public hospital. Chest. 2003;124(6):2148–2155.
- , , , et al. Why do GPs exclude patients from participating in research? An exploration of adherence to and divergence from trial criteria. Fam Pract. 2014;31(3):364–370.
- , , , , . The impact of pre‐existing heart failure on pneumonia prognosis: population‐based cohort study. J Gen Intern Med. 2008;23(9):1407–1413.
- , , , et al. Severe community‐acquired pneumonia: use of intensive care services and evaluation of American and British Thoracic Society Diagnostic criteria. Am J Respir Crit Care Med. 2002;166(5):717–723.
- . Decisions about treating community‐acquired pneumonia. Ann Intern Med. 2005;142(3):215–216.
- , , , et al. The epidemic of antibiotic‐resistant infections: a call to action for the medical community from the Infectious Diseases Society of America. Clin Infect Dis. 2008;46(2):155–164.
- Will antibiotic misuse now stop? Nat Rev Microbiol. 2003;1(2):85.
- , , , et al. Infectious Diseases Society of America and the Society for Healthcare Epidemiology of America guidelines for developing an institutional program to enhance antimicrobial stewardship. Clin Infect Dis. 2007;44(2):159–177.
- . Economic impact of antimicrobial resistance. Emerg Infect Dis. 2001;7(2):286–292.
- , , , , . Guideline‐concordant therapy and reduced mortality and length of stay in adults with community‐acquired pneumonia: playing by the rules. Arch Intern Med. 2009;169(16):1525–1531.
- , , , et al. Adherence to guidelines' empirical antibiotic recommendations and community‐acquired pneumonia outcome. Eur Respir J. 2008;32(4):892–901.
- , , , et al. Community‐associated Clostridium difficile infection and antibiotics: a meta‐analysis. J Antimicrob Chemother. 2013;68(9):1951–1961.
- , , , . Vancomycin‐induced nephrotoxicity: mechanism, incidence, risk factors and special populations. A literature review. Eur J Clin Pharmacol. 2012;68(9):1243–1255.
- , . Diagnosis and management of immediate hypersensitivity reactions to cephalosporins. Clin Rev Allergy Immunol. 2013;45(1):131–142.
- , . Neurotoxic effects associated with antibiotic use: management considerations. Br J Clin Pharmacol. 2011;72(3):381–393.
- , , , et al. A clinician's guide to the appropriate and accurate use of antibiotics: the Council for Appropriate and Rational Antibiotic Therapy (CARAT) criteria. Am J Med. 2005;118(suppl 7A):1S–6S.
- , , , , . Evaluation of rational antibiotic use. Int J Antimicrob Agents. 2000;15(2):131–135.
- , . Rational antibiotic prescribing. Challenges and successes [in German]. Bundesgesundheitsblatt Gesundheitsforschung Gesundheitsschutz. 2012;55(11–12):1418–1426.
- , , , et al. Antibiotic prescription for community‐acquired pneumonia in the intensive care unit: impact of adherence to Infectious Diseases Society of America guidelines on survival. Clin Infect Dis. 2005;41(12):1709–1716.
- , , . Guideline‐adherent initial intravenous antibiotic therapy for hospital‐acquired/ventilator‐associated pneumonia is clinically superior, saves lives and is cheaper than non guideline adherent therapy. Eur J Med Res. 2011;16(7):315–323.
- , , , , , . Antibiotic misuse: a prospective clinical audit in a French university hospital. Eur J Clin Microbiol Infect Dis. 2007;26(4):277–280.
- , , , , . Unnecessary use of antimicrobials in hospitalized patients: current patterns of misuse with an emphasis on the antianaerobic spectrum of activity. Arch Intern Med. 2003;163(8):972–978.
- , , , . A systematic review and meta‐analysis of misuse of antibiotic therapies in the community. Int J Antimicrob Agents. 2005;26(2):106–113.
- , . From best evidence to best practice: effective implementation of change in patients' care. Lancet. 2003;362(9391):1225–1230.
- , , , et al. The complexity of care for patients with rheumatoid arthritis: metrics for better understanding chronic disease care. Med Care. 2007;45(1):55–65.
- , , , et al. Infectious Diseases Society of America/American Thoracic Society consensus guidelines on the management of community‐acquired pneumonia in adults. Clin Infect Dis. 2007;44(suppl 2):S27–S72.
- , , , et al. Practice guidelines for the diagnosis and management of skin and soft tissue infections: 2014 update by the Infectious Diseases Society of America. Clin Infect Dis. 2014;59(2):e10–e52.
- , , , , , . Infectious Diseases Society of America guidelines for the diagnosis and treatment of asymptomatic bacteriuria in adults. Clin Infect Dis. 2005;40(5):643–654.
- , , , et al. Heart disease and stroke statistics—2010 update: a report from the American Heart Association. Circulation. 2010;121(7):e46–e215.
- , , , et al. ESC Guidelines for the diagnosis and treatment of acute and chronic heart failure 2008: the Task Force for the Diagnosis and Treatment of Acute and Chronic Heart Failure 2008 of the European Society of Cardiology. Developed in collaboration with the Heart Failure Association of the ESC (HFA) and endorsed by the European Society of Intensive Care Medicine (ESICM). Eur Heart J. 2008;29(19):2388–2442.
- , , , . Prevalence of negative chest radiography results in the emergency department patient with decompensated heart failure. Ann Emerg Med. 2006;47(1):13–18.
- , , , . Patients admitted to hospital with suspected pneumonia and normal chest radiographs: epidemiology, microbiology, and outcomes. Am J Med. 2004;117(5):305–311.
- , , , et al. Incidence of skin and soft tissue infections in ambulatory and inpatient settings, 2005–2010. BMC Infect Dis. In press.
- . Asymptomatic bacteriuria: when the treatment is worse than the disease. Nat Rev Urol. 2012;9(2):85–93.
- , , , et al. Prevalence and incidence trends for diagnosed diabetes among adults aged 20 to 79 years, United States, 1980–2012. JAMA. 2014;312(12):1218–1226.
- , , , . Prevalence of childhood and adult obesity in the United States, 2011–2012. JAMA. 2014;311(8):806–814.
- , , , , . Frailty in elderly people. Lancet. 2013;381(9868):752–762.
- , , , , , . Risk factors for death in homeless adults in Boston. Arch Intern Med. 1998;158(13):1454–1460.
- . Taking it to the streets: homelessness, health, and health care in the United States. J Gen Intern Med. 2003;18(11):964–965.
- , , , , , . Antibiotic resistance: a survey of physician perceptions. Arch Intern Med. 2002;162(19):2210–2216.
- , , , et al. Primary care clinicians' perceptions of antibiotic resistance: a multi‐country qualitative interview study. J Antimicrob Chemother. 2013;68(1):237–243.
- , , , , , . Underestimation of Clostridium difficile infection among clinicians: an international survey. Eur J Clin Microbiol Infect Dis. 2012;31(9):2439–2444.
- , , , , , . Unnecessary antimicrobial use in patients with current or recent Clostridium difficile infection. Infect Control Hosp Epidemiol. 2013;34(2):109–116.
- , , , , . Attitudes of primary care physicians to the prescribing of antibiotics and antimicrobial resistance: a qualitative study from Spain. Fam Pract. 2012;29(3):352–360.
- , , , , . Understanding physician antibiotic prescribing behaviour: a systematic review of qualitative studies. Int J Antimicrob Agents. 2013;41(3):203–212.
- , , , . Guidelines on uncomplicated urinary tract infections are difficult to follow: perceived barriers and suggested interventions. BMC Fam Pract. 2010;11:51.
- , , , . Why don't physicians adhere to guideline recommendations in practice? An analysis of barriers among Dutch general practitioners. Implement Sci. 2009;4:54.
- , , , , . Perceived barriers to guideline adherence: a survey among general practitioners. BMC Fam Pract. 2011;12:98.
- , , , . Clostridium difficile in acute and long‐stay elderly patients. Age Ageing. 1988;17(5):333–336.
- , , , , , . Pharmacodynamics of vancomycin in elderly patients aged 75 years or older with methicillin‐resistant Staphylococcus aureus hospital‐acquired pneumonia. Clin Interv Aging. 2013;8:1015–1021.
- , , , et al. Empiric guideline‐recommended weight‐based vancomycin dosing and nephrotoxicity rates in patients with methicillin‐resistant Staphylococcus aureus bacteremia: a retrospective cohort study. BMC Pharmacol Toxicol. 2013;14:12.
- , , , , , , , , . Guidelines on urological infections. Arnhem, The Netherlands: European Association of Urology (EAU); 2011. p. 15–27.
- Scottish Intercollegiate Guidelines Network. Management of suspected bacterial urinary tract infection in adults. Available at: http://www.sign.ac.uk/guidelines/fulltext/88/. Accessed on July 25, 2014.
- , , , et al. [Optimisation of the antibiotic policy in the Netherlands. X. The SWAB guideline for antimicrobial treatment of complicated urinary tract infections]. Ned Tijdschr Geneeskd 2006;150(43):2370–2376.
- , , , et al. Do case vignettes accurately reflect antibiotic prescription? Infect Control Hosp Epidemiol. 2011;32(10):1003–1009.
- The committee for The Japanese Respiratory Society guidelines in management of respiratory infections. Principles for the development of the guidelines. Respirology 2004;9(suppl 1):S1–S2.
© 2015 Society of Hospital Medicine