User login
Gene therapy superior to partially matched HSCT for SCID-X1
![]()
Photo by Chad McNeeley
Children with X-linked severe combined immunodeficiency (SCID-X1) who undergo gene therapy have fewer infections and hospitalizations than those who receive a hematopoietic stem cell transplant (HSCT) from a partially matched donor, according to a study published in Blood.
“Over the last decade, gene therapy has emerged as a viable alternative to a partial matched stem cell transplant for infants with SCID-X1,” said study author Fabien Touzot, MD, PhD, of Necker Children’s Hospital in Paris, France.
“To ensure that we are providing the best alternative therapy possible, we wanted to compare outcomes among infants treated with gene therapy and infants receiving partial matched transplants.”
Dr Touzot and his colleagues studied the medical records of 27 children who received either a partially matched HSCT (n=13) or gene therapy (n=14) for SCID-X1 at Necker Children’s Hospital between 1999 and 2013.
The children receiving half-matched transplants and the children receiving gene therapy had been followed for a median of 6 years and 12 years, respectively.
The researchers compared T-cell development among the patients, as well as key clinical outcomes such as infections and hospitalization.
The 14 children in the gene therapy group developed healthy immune cells faster than the 13 children in the half-matched transplant group. In fact, in the first 6 months after therapy, T-cell counts had reached normal values in 78% of the gene therapy patients, compared to 26% of the HSCT patients.
The more rapid growth of the immune system in gene therapy patients was also associated with faster resolution of disseminated BDG infections. These infections resolved in a median of 11 months in the gene therapy group, compared to 25.5 months in the half-matched transplant group.
Gene therapy patients also had fewer infection-related hospitalizations—3 hospitalizations in 3 patients, compared to 15 hospitalizations in 5 patients from the half-matched HSCT group.
“Our analysis suggests that gene therapy can put these incredibly sick children on the road to defending themselves against infection faster than a half-matched transplant,” Dr Touzot said. “These results suggest that, for patients without a fully matched stem cell donor, gene therapy is the next-best approach.” ![]()
Yoga for Dermatologic Conditions
Regardless of its spiritual origins, yoga has become a popular way of reaching mind and body well-being with nearly 30 million people practicing regularly worldwide.1 Yoga, which is the combination of physical postures, controlled breathing, and meditation or mindfulness, has long been used in complementary and alternative medicine around the world and recently has gained popularity as a therapeutic practice, with nearly 14 million Americans reporting that yoga was recommended to them by a physician or therapist.2,3 Studies suggest that people who participate in even brief yoga programs may see improvements in anxiety, somatic stress and discomfort, health-related quality of life, and self-rated sleep quality, all benefits that can help medical conditions, especially those that are dermatologic in nature.4,5
Stress and Dermatologic Conditions
The interaction between the mind, skin, and body is well known. Research in psychoneuroimmunology, the interaction between psychological processes and the nervous and immune systems, has examined the role of neuropeptides, hormones, and neurotransmitters in psychodermatological disorders. The correlation between neuroimmunological pathways and skin inflammation is now well recognized, specifically the interactions between the brain and skin underlying many dermatological diseases (eg, acne, alopecia areata, various types of eczema and dermatitis, oral and genital herpes, hyperhidrosis, pruritus, psoriasis, rosacea, urticaria, warts, breaking or ridging of the nails).6-9
Two biological systems are known to be affected by the systemic stress response: (1) the hypothalamic-pituitary-adrenal axis, which regulates the release of adrenocorticotropin, ß-endorphin, and cortisol, and (2) the sympathoadrenal medullary system, which regulates the release of catecholamines (eg, epinephrine, norepinephrine).7 Cortisol and catecholamines have been shown to have potent effects on the immune system as well as the inflammatory response.9 Additionally, it has been shown that cutaneous sensory nerve terminals release neuropeptides, including calcitonin gene-related peptide and substance P, both of which have different effects on the local inflammatory response.10,11
Psychological stress is well known to trigger many dermatologic conditions, but it also may lead to abnormal skin barrier function.12 The mechanism in which skin barrier function is affected appears to involve a stress-induced increase of endogenous glucocorticoids, which may consequently disrupt skin barrier function and recovery rates, stratum corneum cohesion, and epidermal antimicrobial function.13,14
Atopic dermatitis, for example, is classified as a psychophysiological disorder. Although it is not caused by stress, atopic dermatitis has been described to be precipitated or exacerbated by stress in patients.15 In fact, it was found that stressful life events preceded the onset of itching in more than 70% of patients with atopic dermatitis,16 which is especially relevant, as there is no cure and patients often experience a lifelong struggle with the condition. Additionally, stress mediates the degranulation of mast cells via corticotropin-releasing hormone and neuropeptides, and the upregulation of mast cell corticotropin-releasing hormone receptors supporting its putative role in the pathogenesis of urticaria.9,17 Furthermore, the increase in cortisol also has been described in the exacerbation of acne during times of stress.18
Psychological factors affect the management of skin conditions in more than one-third of reported dermatology patients; therefore, it is important to consider these factors in the treatment of chronic dermatological conditions, especially when they are inquired by the patient.19,20
Yoga Benefits in the Literature
The therapeutic potential of yoga has been explored in a growing number of randomized controlled trials to date.21 A recently published bibliometric analysis provided a comprehensive review of the characteristics of the randomized yoga trials available in the literature.22 The review included 366 full-text articles, with the 2 earliest studies published in 1975 and nearly 90% published within the last decade. In addition to healthy patients, it was found these randomized controlled yoga trials most commonly enrolled patients with breast cancer, depression, asthma, and type 2 diabetes mellitus.22 Another study examined psychological (eg, self-rated stress and stress behavior, anger, exhaustion, quality of life) and physiological (eg, blood pressure, heart rate, urinary catecholamines, salivary cortisol) measurements obtained before and after a 10-session yoga program that participants completed over a 4-month period, with results showing significant improvements (P<.05) on almost all stress-related subjective and physiological variables. Results were comparable with cognitive behavioral therapy.23
Not only has it been shown that yoga helps patients on a psychological level, but a recent study reported that 90-minute sessions of mindfulness meditation and gentle Hatha yoga over an 8-week period led to observable benefits on a cellular level, as telomere length was maintained in distressed breast cancer survivors compared to decreases in telomere length in the control group with patients who solely participated in a stress management seminar.24 To date, there are no known studies examining the effects of yoga on patients with skin cancer. However, a few studies have specifically examined the effect of yoga in managing non–cancer-related dermatologic issues. Specifically, one small study of psoriasis patients found that those who listened to mindfulness meditation tapes while undergoing standard phototherapy (psoralen plus UVA) healed faster than those who underwent phototherapy treatment alone.25
Because some dermatologic problems have comorbidities and increased risk factors of other medical problems, such as psoriasis with psoriatic arthritis and metabolic diseases (eg, abdominal obesity, diabetes, nonalcoholic fatty liver disease, dyslipidemia, metabolic syndrome, chronic kidney disease), it is even more pertinent to recommend approaches for healthy mind and body well-being as a supplement to medical care.26
Final Thoughts
With accurate diagnosis by a dermatologist, appropriate conventional treatments can improve dermatologic problems. These treatments alone can reduce patients’ stress and improve skin, hair, and nail conditions; however, if it is clear that stress is interfering with a patient’s overall well-being and ability to cope with his/her dermatologic condition, concurrent stress management interventions may be warranted. In some instances, recommending yoga sessions, mindful meditation, or breathing exercises may help, while in others referral to a mental health professional may be necessary.
Beyond the direct physiological effects of stress, it also is worth mentioning that patients who deal with stress also tend to scratch, pick, or irritate their skin more and often lack the motivation to adhere to skin care regimens or treatments, again supporting the idea that our approach in managing these patients must be multifaceted. As dermatologists in training, residents should be cognizant of the potential psychological sequelae of some dermatologic problems and be aware of the possible use of supplemental interventions by our patients.
1. Dangerfield A. Yoga wars. BBC News. http://news.bbc.co.uk/1/hi/7844691.stm. Published January 23, 2009. Accessed March 25, 2015.
2. Yoga Journal releases 2012 yoga in America market study [press release]. San Francisco, CA: Yoga Journal; December 6, 2012.
3. De Michaelis E. A History of Modern Yoga: Patanjali and Western Esotericism. London, United Kingdom: A&C Black; 2005.
4. Telles S, Singh N, Yadav A, et al. Effect of yoga on different aspects of mental health. Indian J Physiol Pharmacol. 2012;56:245-254.
5. Rodriguez-Vallecillo E, Woodbury-Fariña MA. Dermatological manifestations of stress in normal and psychiatric populations. Psychiatr Clin North Am. 2014;37:625-651.
6. Stander S, Raap U, Weisshaar E, et al. Pathogenesis of pruritus. J Dtsch Dermatol Ges. 2011;9:456-463.
7. Arck PC, Slominski A, Theoharides TC, et al. Neuroimmunology of stress: skin takes center stage. J Invest Dermatol. 2006;126:1697-1704.
8. Recognizing the mind-skin connection. Harvard Health Publications Web site. http://www.health.harvard.edu/newsletter_article/Recognizing_the_mind-skin_connection. Published November 1, 2006. Accessed March 31, 2015.
9. Tausk F, Elenkov I, Moynihan J. Psychoneuroimmunology. Dermatol Ther. 2008;21:22-31.
10. Pavlovic S, Liezmann C, Blois SM, et al. Substance P is a key mediator of stress-induced protection from allergic sensitization via modified antigen presentation. J Immunol. 2011;186:848-855.
11. Toyoda M, Nakamura M, Makino T, et al. Nerve growth factor and substance P are useful plasma markers of disease activity in atopic dermatitis. Br J Dermatol. 2002;147:71-79.
12. Koo JYM, Lee CS. General approach to evaluating psychodermatological disorders. In: Koo JYM, Lee CS, eds. Psychocutaneous Medicine. New York, NY: Marcel Dekker; 2003:1-29.
13. Garg A, Chren MM, Sands LP, et al. Psychological stress perturbs epidermal permeability barrier homeostasis: implications for the pathogenesis of stress-associated skin disorders. Arch Dermatol. 2001;137:53-59.
14. Elias PM, Sun R, Eder AR, et al. Treating atopic dermatitis at the source: corrective barrier repair therapy based upon new pathogenic insights. Expert Rev Dermatol. 2013;8:27-36.
15. Morren MA, Przybilla B, Bamelis M, et al. Atopic dermatitis: triggering factors. J Am Acad Dermatol. 1994;31:467-473.
16. Faulstich ME, Williamson DA. An overview of atopic dermatitis: toward a bio-behavioural integration. J Psychosom Res. 1985;29:647-654.
17. Theoharides TC, Donelan JM, Papadopoulou N, et al. Mast cells as targets of corticotropin-releasing factor and related peptides. Trends Pharmacol Sci. 2004;25:563-568.
18. Suh DH, Kwon HH. What’s new in the physiopathology of acne [published online ahead of print Jan 24, 2015]? Br J Dermatol. doi:10.1111/bjd.13634.
19. Picardi A, Mazzotti E, Pasquini P. Prevalence and correlates of suicidal ideation among patients with skin disease. J Am Acad Dermatol. 2006;54:420-426.
20. Ponarovsky B, Amital D, Lazarov A, et al. Anxiety and depression in patients with allergic and non-allergic cutaneous disorders. Int J Dermatol. 2011;50:1217-1222.
21. Khalsa SB. Yoga as a therapeutic intervention: a bibliometric analysis of published research studies. Indian J Physiol Pharmacol. 2004;48:269-285.
22. Cramer H, Lauche R, Dobos G. Characteristics of randomized controlled trials of yoga: a bibliometric analysis. BMC Complement Altern Med. 2014;14:328.
23. Granath J, Ingvarsson S, von Thiele U, et al. Stress management: a randomized study of cognitive behavioural therapy and yoga. Cogn Behav Ther. 2006;35:3-10.
24. Carlson LE, Beattie TL, Giese-Davis J, et al. Mindfulness-based cancer recovery and supportive-expressive therapy maintain telomere length relative to controls in distressed breast cancer survivors. Cancer. 2015;121:476-484.
25. Kabat-Zinn J, Wheeler E, Light T, et al. Influence of a mindfulness meditation-based stress reduction intervention on rates of skin clearing in patients with moderate to severe psoriasis undergoing phototherapy (UVB) and photochemotherapy (PUVA). Psychosom Med. 1998;60:625-632.
26. Gisondi P, Galvan A, Idolazzi L, et al. Management of moderate to severe psoriasis in patients with metabolic comorbidities. Front Med (Lausanne). 2015;2:1.
Regardless of its spiritual origins, yoga has become a popular way of reaching mind and body well-being with nearly 30 million people practicing regularly worldwide.1 Yoga, which is the combination of physical postures, controlled breathing, and meditation or mindfulness, has long been used in complementary and alternative medicine around the world and recently has gained popularity as a therapeutic practice, with nearly 14 million Americans reporting that yoga was recommended to them by a physician or therapist.2,3 Studies suggest that people who participate in even brief yoga programs may see improvements in anxiety, somatic stress and discomfort, health-related quality of life, and self-rated sleep quality, all benefits that can help medical conditions, especially those that are dermatologic in nature.4,5
Stress and Dermatologic Conditions
The interaction between the mind, skin, and body is well known. Research in psychoneuroimmunology, the interaction between psychological processes and the nervous and immune systems, has examined the role of neuropeptides, hormones, and neurotransmitters in psychodermatological disorders. The correlation between neuroimmunological pathways and skin inflammation is now well recognized, specifically the interactions between the brain and skin underlying many dermatological diseases (eg, acne, alopecia areata, various types of eczema and dermatitis, oral and genital herpes, hyperhidrosis, pruritus, psoriasis, rosacea, urticaria, warts, breaking or ridging of the nails).6-9
Two biological systems are known to be affected by the systemic stress response: (1) the hypothalamic-pituitary-adrenal axis, which regulates the release of adrenocorticotropin, ß-endorphin, and cortisol, and (2) the sympathoadrenal medullary system, which regulates the release of catecholamines (eg, epinephrine, norepinephrine).7 Cortisol and catecholamines have been shown to have potent effects on the immune system as well as the inflammatory response.9 Additionally, it has been shown that cutaneous sensory nerve terminals release neuropeptides, including calcitonin gene-related peptide and substance P, both of which have different effects on the local inflammatory response.10,11
Psychological stress is well known to trigger many dermatologic conditions, but it also may lead to abnormal skin barrier function.12 The mechanism in which skin barrier function is affected appears to involve a stress-induced increase of endogenous glucocorticoids, which may consequently disrupt skin barrier function and recovery rates, stratum corneum cohesion, and epidermal antimicrobial function.13,14
Atopic dermatitis, for example, is classified as a psychophysiological disorder. Although it is not caused by stress, atopic dermatitis has been described to be precipitated or exacerbated by stress in patients.15 In fact, it was found that stressful life events preceded the onset of itching in more than 70% of patients with atopic dermatitis,16 which is especially relevant, as there is no cure and patients often experience a lifelong struggle with the condition. Additionally, stress mediates the degranulation of mast cells via corticotropin-releasing hormone and neuropeptides, and the upregulation of mast cell corticotropin-releasing hormone receptors supporting its putative role in the pathogenesis of urticaria.9,17 Furthermore, the increase in cortisol also has been described in the exacerbation of acne during times of stress.18
Psychological factors affect the management of skin conditions in more than one-third of reported dermatology patients; therefore, it is important to consider these factors in the treatment of chronic dermatological conditions, especially when they are inquired by the patient.19,20
Yoga Benefits in the Literature
The therapeutic potential of yoga has been explored in a growing number of randomized controlled trials to date.21 A recently published bibliometric analysis provided a comprehensive review of the characteristics of the randomized yoga trials available in the literature.22 The review included 366 full-text articles, with the 2 earliest studies published in 1975 and nearly 90% published within the last decade. In addition to healthy patients, it was found these randomized controlled yoga trials most commonly enrolled patients with breast cancer, depression, asthma, and type 2 diabetes mellitus.22 Another study examined psychological (eg, self-rated stress and stress behavior, anger, exhaustion, quality of life) and physiological (eg, blood pressure, heart rate, urinary catecholamines, salivary cortisol) measurements obtained before and after a 10-session yoga program that participants completed over a 4-month period, with results showing significant improvements (P<.05) on almost all stress-related subjective and physiological variables. Results were comparable with cognitive behavioral therapy.23
Not only has it been shown that yoga helps patients on a psychological level, but a recent study reported that 90-minute sessions of mindfulness meditation and gentle Hatha yoga over an 8-week period led to observable benefits on a cellular level, as telomere length was maintained in distressed breast cancer survivors compared to decreases in telomere length in the control group with patients who solely participated in a stress management seminar.24 To date, there are no known studies examining the effects of yoga on patients with skin cancer. However, a few studies have specifically examined the effect of yoga in managing non–cancer-related dermatologic issues. Specifically, one small study of psoriasis patients found that those who listened to mindfulness meditation tapes while undergoing standard phototherapy (psoralen plus UVA) healed faster than those who underwent phototherapy treatment alone.25
Because some dermatologic problems have comorbidities and increased risk factors of other medical problems, such as psoriasis with psoriatic arthritis and metabolic diseases (eg, abdominal obesity, diabetes, nonalcoholic fatty liver disease, dyslipidemia, metabolic syndrome, chronic kidney disease), it is even more pertinent to recommend approaches for healthy mind and body well-being as a supplement to medical care.26
Final Thoughts
With accurate diagnosis by a dermatologist, appropriate conventional treatments can improve dermatologic problems. These treatments alone can reduce patients’ stress and improve skin, hair, and nail conditions; however, if it is clear that stress is interfering with a patient’s overall well-being and ability to cope with his/her dermatologic condition, concurrent stress management interventions may be warranted. In some instances, recommending yoga sessions, mindful meditation, or breathing exercises may help, while in others referral to a mental health professional may be necessary.
Beyond the direct physiological effects of stress, it also is worth mentioning that patients who deal with stress also tend to scratch, pick, or irritate their skin more and often lack the motivation to adhere to skin care regimens or treatments, again supporting the idea that our approach in managing these patients must be multifaceted. As dermatologists in training, residents should be cognizant of the potential psychological sequelae of some dermatologic problems and be aware of the possible use of supplemental interventions by our patients.
1. Dangerfield A. Yoga wars. BBC News. http://news.bbc.co.uk/1/hi/7844691.stm. Published January 23, 2009. Accessed March 25, 2015.
2. Yoga Journal releases 2012 yoga in America market study [press release]. San Francisco, CA: Yoga Journal; December 6, 2012.
3. De Michaelis E. A History of Modern Yoga: Patanjali and Western Esotericism. London, United Kingdom: A&C Black; 2005.
4. Telles S, Singh N, Yadav A, et al. Effect of yoga on different aspects of mental health. Indian J Physiol Pharmacol. 2012;56:245-254.
5. Rodriguez-Vallecillo E, Woodbury-Fariña MA. Dermatological manifestations of stress in normal and psychiatric populations. Psychiatr Clin North Am. 2014;37:625-651.
6. Stander S, Raap U, Weisshaar E, et al. Pathogenesis of pruritus. J Dtsch Dermatol Ges. 2011;9:456-463.
7. Arck PC, Slominski A, Theoharides TC, et al. Neuroimmunology of stress: skin takes center stage. J Invest Dermatol. 2006;126:1697-1704.
8. Recognizing the mind-skin connection. Harvard Health Publications Web site. http://www.health.harvard.edu/newsletter_article/Recognizing_the_mind-skin_connection. Published November 1, 2006. Accessed March 31, 2015.
9. Tausk F, Elenkov I, Moynihan J. Psychoneuroimmunology. Dermatol Ther. 2008;21:22-31.
10. Pavlovic S, Liezmann C, Blois SM, et al. Substance P is a key mediator of stress-induced protection from allergic sensitization via modified antigen presentation. J Immunol. 2011;186:848-855.
11. Toyoda M, Nakamura M, Makino T, et al. Nerve growth factor and substance P are useful plasma markers of disease activity in atopic dermatitis. Br J Dermatol. 2002;147:71-79.
12. Koo JYM, Lee CS. General approach to evaluating psychodermatological disorders. In: Koo JYM, Lee CS, eds. Psychocutaneous Medicine. New York, NY: Marcel Dekker; 2003:1-29.
13. Garg A, Chren MM, Sands LP, et al. Psychological stress perturbs epidermal permeability barrier homeostasis: implications for the pathogenesis of stress-associated skin disorders. Arch Dermatol. 2001;137:53-59.
14. Elias PM, Sun R, Eder AR, et al. Treating atopic dermatitis at the source: corrective barrier repair therapy based upon new pathogenic insights. Expert Rev Dermatol. 2013;8:27-36.
15. Morren MA, Przybilla B, Bamelis M, et al. Atopic dermatitis: triggering factors. J Am Acad Dermatol. 1994;31:467-473.
16. Faulstich ME, Williamson DA. An overview of atopic dermatitis: toward a bio-behavioural integration. J Psychosom Res. 1985;29:647-654.
17. Theoharides TC, Donelan JM, Papadopoulou N, et al. Mast cells as targets of corticotropin-releasing factor and related peptides. Trends Pharmacol Sci. 2004;25:563-568.
18. Suh DH, Kwon HH. What’s new in the physiopathology of acne [published online ahead of print Jan 24, 2015]? Br J Dermatol. doi:10.1111/bjd.13634.
19. Picardi A, Mazzotti E, Pasquini P. Prevalence and correlates of suicidal ideation among patients with skin disease. J Am Acad Dermatol. 2006;54:420-426.
20. Ponarovsky B, Amital D, Lazarov A, et al. Anxiety and depression in patients with allergic and non-allergic cutaneous disorders. Int J Dermatol. 2011;50:1217-1222.
21. Khalsa SB. Yoga as a therapeutic intervention: a bibliometric analysis of published research studies. Indian J Physiol Pharmacol. 2004;48:269-285.
22. Cramer H, Lauche R, Dobos G. Characteristics of randomized controlled trials of yoga: a bibliometric analysis. BMC Complement Altern Med. 2014;14:328.
23. Granath J, Ingvarsson S, von Thiele U, et al. Stress management: a randomized study of cognitive behavioural therapy and yoga. Cogn Behav Ther. 2006;35:3-10.
24. Carlson LE, Beattie TL, Giese-Davis J, et al. Mindfulness-based cancer recovery and supportive-expressive therapy maintain telomere length relative to controls in distressed breast cancer survivors. Cancer. 2015;121:476-484.
25. Kabat-Zinn J, Wheeler E, Light T, et al. Influence of a mindfulness meditation-based stress reduction intervention on rates of skin clearing in patients with moderate to severe psoriasis undergoing phototherapy (UVB) and photochemotherapy (PUVA). Psychosom Med. 1998;60:625-632.
26. Gisondi P, Galvan A, Idolazzi L, et al. Management of moderate to severe psoriasis in patients with metabolic comorbidities. Front Med (Lausanne). 2015;2:1.

Chemotherapy and stem-cell transplantation combination appears safe
In a population of patients with hematologic malignancies who refuse blood product transfusions, high-dose chemotherapy (HDC) followed by autologous stem-cell transplantation (ASCT) in the absence of hematopoietic support was shown to be relatively safe, according to a report published online April 13 in the Journal of Clinical Oncology.
From May of 1996 to March of 2014 at Pennsylvania Hospital, 125 Jehovah’s Witness patients with lymphoma (n = 55), multiple myeloma (n = 68), or amyloidosis (n = 2) were treated with HDC and ASCT without transfusion through the use of basic blood management techniques. These techniques included priming pretransplantation hemoglobin with erythropoiesis stimulating agents and intravenous iron, limiting iatrogenic blood loss by minimizing phlebotomy, and controlling or preventing bleeding with hemostatic agents, according to Dr. Patricia Ford and her colleagues at the hospital.
They described the low incidence of bleeding even in the absence of prophylactic platelet transfusions, which, they noted, challenges current American Society of Clinical Oncology guidelines that recommend transfusions at platelet counts less than 10 x 103/mcL. “The absence of major bleeding events observed at platelet counts greater than 5 x 10³/mcL … suggests that a transfusion threshold trigger of 5 x 10³/mcL may be appropriate in a select patient population,” they wrote (J. Clin. Oncol. 2015 April 13 [doi: 10.1200/JCO.2014.57.9912]).
Among the patients treated with HDC and ASCT, those with multiple myeloma (n = 68) received melphalan 200 mg/m2,and those with lymphoma (n = 55) received carmustine 300mg/m2 day 1, cyclophosphamide 1,500 mg/m2 days 2-5, and VP16 700 mg/m2 per day on days 2-4.
At 100 days post transplantation, 115 patients (92%) were still alive. Treatment-related mortality due to anemia, sepsis, pancytopenia, or cardiac events occurred in six patients (4.8%).
Out of 18 bleeding episodes, 2 were major (one grade 4 hemorrhagic temporal infarction with retinal hemorrhages and one grade 3 GI bleed) and 16 were minor. There were no bleeding-associated fatalities.
Cardiac complications occurred at an unexpectedly high rate of 32% (40 patients) and resulted in three treatment-related deaths. Subsequently, all candidates older than 50 years or at risk for cardiac disease were required to undergo cardiac consultation prior to transplantation. Given the cardiovascular risk associated with this population, in addition to ECHO testing, stress testing in patients with suspected coronary artery disease is recommended, the researchers wrote.
On the basis of the observed low mortality and morbidity, Dr. Ford and her associates suggested that HDC followed by ASCT be offered to certain patients who refuse or who have medical contraindications to transfusions, stating that simple blood management strategies were an effective alternative in select patients.
FROM THE JOURNAL OF CLINICAL ONCOLOGY
Key clinical point: In Jehovah’s Witness patients with relapsed lymphoma or multiple myeloma, high-dose chemotherapy (HDC) followed by autologous stem-cell transplantation (ASCT) was safely performed without hematopoietic support.
Major finding: At 100 days post transplantation, 115 patients (92%) were still alive. Treatment-related mortality due to anemia, sepsis, pancytopenia, or cardiac events occurred in six patients (4.8%). Cardiac complications occurred in 40 patients (32%). There were 18 bleeding episodes (2 major, 16 minor), and no bleeding-associated mortality.
Data source: A study of 125 Jehovah’s Witness patients with non-Hodgkin’s lymphoma (n = 36), Hodgkin’s lymphoma (n = 19), multiple myeloma (n = 68), and amyloidosis (n = 2) who were treated with HDC and ASCT without transfusion support.
Disclosures: Dr. Ford and coauthors reported having no disclosures.
CMS formally proposes changes to EHR reporting period for 2015
Physicians and other health care professionals would need to attest to meeting criteria for the meaningful use of electronic health records for 90 days in 2015, under a proposed change announced by the Centers for Medicare & Medicaid Services April 10.
The agency included a number of other changes in the proposed rule, including reducing the attestation period for those new to the meaningful use program in 2015 and 2016 to 90 days. The proposed rule is scheduled to be published April 15 in the Federal Register.

The proposed rule is designed to align the stage 1 and stage 2 meaningful use criteria with the proposed stage 3 criteria issued earlier this year.
Other changes include moving the hospital meaningful use attestation period to a calendar year for 2015, away from the current fiscal year period. This would give hospitals an additional 3 months to attest to meeting the meaningful use criteria in 2015.
The proposed rule also would reduce the number of patients who must access their patient portal from 5% of patients to “equal to or greater than 1.” The measure tracking secure messaging would be changed from a percentage-based measure to attesting that the secure messaging function is “fully enabled.”
Comments on the proposed rule can be made at www.regulations.gov are due June 15.
Physicians and other health care professionals would need to attest to meeting criteria for the meaningful use of electronic health records for 90 days in 2015, under a proposed change announced by the Centers for Medicare & Medicaid Services April 10.
The agency included a number of other changes in the proposed rule, including reducing the attestation period for those new to the meaningful use program in 2015 and 2016 to 90 days. The proposed rule is scheduled to be published April 15 in the Federal Register.
The proposed rule is designed to align the stage 1 and stage 2 meaningful use criteria with the proposed stage 3 criteria issued earlier this year.
Other changes include moving the hospital meaningful use attestation period to a calendar year for 2015, away from the current fiscal year period. This would give hospitals an additional 3 months to attest to meeting the meaningful use criteria in 2015.
The proposed rule also would reduce the number of patients who must access their patient portal from 5% of patients to “equal to or greater than 1.” The measure tracking secure messaging would be changed from a percentage-based measure to attesting that the secure messaging function is “fully enabled.”
Comments on the proposed rule can be made at www.regulations.gov are due June 15.

AF patients receive unnecessary oral anticoagulants
About a quarter of U.S. atrial fibrillation patients under 60 years old and in otherwise good health received oral anticoagulants contrary to guidelines, according to a research letter from Dr. Jonathan Hsu of the University of California, San Diego, and his associates.
In patients in the National Cardiovascular Data Registry’s PINNACLE (Practice Innovation and Clinical Excellence) registry who had a CHADS2 and CHA2DS2-VASc score of zero, the average age of those who received oral anticoagulants was just under 51 years, compared with just over 46 years for those who did not receive oral anticoagulants. In addition to age, higher body mass index and having Medicare or no insurance vs. private insurance were associated with a higher prescription chance.
Patients treated in the South were significantly less likely to be prescribed anticoagulants than were those treated in the Northeast.
“Prescription of oral anticoagulants by cardiovascular specialists in a significant proportion of patients at the lowest thrombotic risk suggests that these health care professionals may not be fully aware of the potential risks associated with oral anticoagulation or the particularly low risk of stroke in this population,” the investigators concluded. Find the full research letter in JAMA Internal Medicine (doi:10.1001/jamainternmed.2015.0920).
High-Dose Barium Enemas Prevent Recurrent Diverticular Bleeding
Clinical question
Does barium impaction therapy using high-dose barium enemas prevent recurrent diverticular bleeding?
Bottom line
This small study demonstrates that barium impaction therapy using high-dose barium enemas is safe and effective at reducing the rate of recurrent diverticular bleeding. Note that this study was conducted in Japan, where the rate of rebleeding for patients with diverticulosis is much higher than in Western populations. (LOE = 1b-)
Study design: Randomized controlled trial (nonblinded)
Funding source: Government
Allocation: Concealed
Setting: Inpatient (any location)
Synopsis
A high-dose barium enema is thought to prevent recurrent diverticular bleeding through a physical tamponade of bleeding vessels, as well as by a direct hemostatic effect of the barium itself. Retained barium in colonic diverticula over time has previously been shown to be safe.
In this trial, patients hospitalized with diverticular bleeding who had spontaneous cessation of bleeding were randomized, using concealed allocation, to receive either barium impaction therapy (n = 27) or conservative treatment (n = 27). In the barium impaction therapy group, barium sulfate was administered by gastroenterologists via an enema bag at a concentration of 200 g barium per 100 mL tap water for a total volume of 400 mL. X-ray imaging confirmed filling of multiple colonic diverticula with barium and the patient was asked to rotate positions to ensure filling of all diverticula.
Baseline characteristics were similar in the 2 groups: the majority of patients were male, the average age was 70 years, and half had a prior history of diverticular bleeding. The severity of initial bleeding was also similar, as measured by number of units of blood transfused prior to randomization and the number of days until spontaneous cessation of bleeding.
For the primary outcome of recurrence of bleeding at the 1-year follow-up, the barium group fared better than the conservative treatment group (15% vs 43%; P = .04). You would have to treat 4 patients with barium impaction therapy to prevent 1 episode of recurrent bleeding. After adjusting for factors associated with recurrent bleeding, including hypertension, nonsteroidal anti-inflammatory drug use, and chronic renal failure, the risk of bleeding was decreased in the barium group (hazard ratio = 0.34, 95% CI 0.12-0.97). Barium impaction therapy did not result in any complications. Furthermore, over the course of the follow-up period, the barium group had a decreased number of re-hospitalizations, transfusions, and repeat colonoscopies.
Dr. Kulkarni is an assistant professor of hospital medicine at Northwestern University in Chicago.
Steroids May Benefit Patients With Severe CAP and High CRP Levels
Clinical question: Do steroids improve outcomes in patients with severe community-acquired pneumonia and a high inflammatory response?
Bottom line
In patients with severe community-acquired pneumonia (CAP) who have elevated levels of C-reactive protein (CRP), a short course of methylprednisolone decreases treatment failure, mainly by reducing radiographic progression of pulmonary infiltrates within 3 days to 5 days of treatment initiation. The patient population studied here represents a fraction of the patients with severe CAP, so this finding cannot be generalized. Moreover, this study was small and the findings require replication before they can be applied to this population.
Design: Randomized controlled trial (double-blinded); LOE: 1b
Setting: Inpatient (any location)
Synopsis
A previous meta-analysis of randomized controlled trials showed that the addition of steroids for treatment of community-acquired pneumonia decreases hospital length of stay but does not affect other clinical outcomes such as mortality or need for mechanical ventilation (J Hosp Med 2013;8:68-75).
In this study, investigators enrolled patients hospitalized with severe CAP (either risk class V by the Pneumonia Severity Index or as defined by American Thoracic Society) and a CRP level of greater than 15 mg/dL. Immunosuppressed patients or those with diabetes or recent major gastrointestinal bleeding were excluded.
Patients were randomized, using concealed allocation, to receive either methylprednisolone (0.5 mg per kg) every 12 hours (n = 61) or matching placebo (n = 59) for 5 days. The primary outcome was treatment failure. Early treatment failure was defined as clinical deterioration within 72 hours of treatment, whereas late failure was defined as radiographic progression of pulmonary infiltrates by more than 50%, respiratory failure, shock, or death between 3 days and 5 days.
Baseline characteristics were similar in the 2 groups, except for lower procalcitonin levels and less septic shock in the steroid group. Antibiotic treatment on admission was similar in both groups (most commonly ceftriaxone combined with either levofloxacin or azithromycin). The majority of patients were initially admitted to the intensive care unit. In the intention-to-treat analysis, the steroid group had less treatment failure than the placebo group (13% vs 31%; P = .02). This was driven by a higher rate of late treatment failure in the placebo group, primarily due to a greater incidence of radiographic progression of infiltrates. Results were similar after adjusting for potential confounders and imbalances in baseline characteristics (hazard ratio = 0.33, 95% CI 0.12 - 0.90; P = .03). There were no significant differences in length of stay, in-hospital mortality, or adverse events between the 2 groups.
Dr. Kulkarni is an assistant professor of hospital medicine at Northwestern University in Chicago.
Inhibitor controls WM long-term

Photo by Sam Odgen
Updated results of a phase 2 trial suggest the Bruton’s tyrosine kinase inhibitor ibrutinib can control Waldenstrom’s macroglobulinemia (WM) long-term.
In previously treated WM patients, ibrutinib produced an overall response rate of 91%.
The 2-year overall survival rate was 95%, and 69% of patients had not progressed at 2 years.
Researchers reported these results in NEJM. The research was supported by Pharmacyclics, Janssen Pharmaceuticals, and several foundations.
An earlier analysis of data from this trial supported the US Food and Drug Administration’s approval of ibrutinib as the first treatment for WM.
“These findings herald a new era for the treatment of Waldenstrom’s macroglobulinemia and show how genome sequencing can lead to the discovery of cancer mutations that can be specifically targeted by new therapies,” said study author Steven Treon, MD, PhD, of the Dana-Farber Cancer Institute in Boston, Massachusetts.
Dr Treon and his colleagues enrolled 63 WM patients on this trial. The patients had received a median of 2 prior therapies (range, 1-9), 56 patients (89%) had the MYD88L265P mutation, and 21 (34%) had the CXCR4WHIM mutation.
Patients received ibrutinib at 420 mg once daily until disease progression or unacceptable toxicity. After a median treatment duration of 19.1 months (range, 0.5-29.7 months), the overall response rate was 91%. The median time to response was 4 weeks.
Investigator-determined responses were impacted by the MYD88 and CXCR4 mutations. Patients carrying MYD88L265P and CXCR4WT achieved the highest responses, with a 100% overall response rate and 91% major response rate.
For all patients, the estimated progression-free and overall survival rates at 24 months were 69% and 95%, respectively.
“The results are remarkable when you consider that patients had received an average of 2 prior therapies, and 40% showed no response to the previous treatments,” Dr Treon said. “The findings herald a new era for the treatment of Waldenstrom’s macroglobulinemia.”
Dr Treon and his colleagues also said ibrutinib was well-tolerated. At the time of analysis, 68% of patients remained on therapy.
The most common grade 2-4 adverse events were neutropenia (22%) and thrombocytopenia (14%). Grade 3 or higher neutropenia and thrombocytopenia occurred in 9 (14%) and 8 (13%) patients, respectively.
Ibrutinib-related neutropenia and thrombocytopenia were reversible but required a dose reduction in 3 patients and treatment discontinuation in 4 patients.
Grade 2 or higher bleeding events occurred in 4 patients, and there were 15 infections considered possibly related to ibrutinib.
Treatment-related atrial fibrillation (AFib) occurred in 3 patients, all of whom had a prior history of paroxysmal AFib. AFib resolved when treatment was withheld, and all 3 patients were able to continue on therapy per protocol without an additional event. ![]()
Uninsured cancer patients pay more
Photo by Rhoda Baer
Uninsured patients are asked to pay much more for cancer treatments than Medicare and private insurers pay, according to research published in Health Affairs.
Researchers reviewed newly available Medicare data on what physicians charged for intravenous chemotherapy drugs in 2012.
And the results showed that uninsured cancer patients were asked to pay anywhere from 2 to 43 times what Medicare would pay and 2 to 5 times as
much as private insurance would pay.
For example, uninsured patients who did not negotiate the billed amounts could expect to pay $6711 for an infusion of the colorectal cancer drug oxaliplatin. But Medicare and private health plans only pay $3090 and $3616, respectively.
“Patients with Medicare and private insurance don’t pay the sticker price of healthcare,” said study author Stacie Dusetzina, PhD, of the University of North Carolina at Chapel Hill.
“They pay a discounted rate. However, uninsured patients don’t have the bargaining power, or they may not try to negotiate for a better price.”
In addition to estimating costs for infused chemotherapy drugs, Dr Dusetzina and her colleagues looked at what cancer patients were asked to pay for a doctor visit.
Uninsured patients were billed between $129 and $391, depending on the complexity of the visit. Medicare paid between $65 and $188, and private insurance paid $78 to $246 for the same visits.
“This is unreasonable,” Dr Dusetzina said. “There needs to be more transparency and less variability in healthcare pricing.”
Under the Affordable Care Act, everyone in the US must be insured or face a tax penalty. However, many Americans remain without insurance. So differences in what the uninsured are charged really matter, Dr Dusetzina said.
“In states like North Carolina that didn’t expand Medicaid, there is a large group of people who can get insurance on the federal exchange but cannot get subsidies because the law assumed they would be covered by Medicaid,” she noted.
This population earns at or near the federal poverty level. Without subsidies to help pay for private insurance, many are likely to remain uninsured.
These drug pricing discrepancies could become even more important depending on the outcome of the pending Supreme Court case King vs Burwell, which challenges the legitimacy of federal healthcare subsidies and could leave as many as 8 million Americans without subsidies and uninsured in 2016. ![]()
FDA grants drug orphan designation for SCD
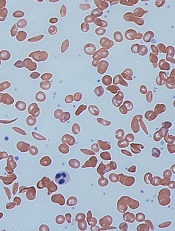
Image by Graham Beards
The US Food and Drug Administration (FDA) has granted orphan drug designation for the bovine PEGylated carboxyhemoglobin product Sanguinate to treat sickle cell disease (SCD).
Through its anti-vaso-constrictive properties, Sanguinate facilitates the transfer of oxygen to oxygen-deprived cells and tissues.
By correcting oxygen levels and downregulating inflammation, the drug could potentially treat many of the comorbidities associated with SCD.
Trials of Sanguinate
The company developing Sanguinate, Prolong Pharmaceuticals, has several clinical studies underway to determine the safety and efficacy of the drug in SCD and other diseases caused by the effects of oxygen deprivation.
In a phase 1 trial, Sanguinate proved safe and well-tolerated in healthy volunteers. Three cohorts of 8 subjects received single, ascending doses of Sanguinate at 80 mg/kg, 120 mg/kg, or 160 mg/kg. Two volunteers in each cohort were control subjects who received saline.
There were no serious adverse events reported with Sanguinate. Subjects experienced decreases in serum haptoglobin, but this did not appear to be dose-related. Sanguinate’s half-life was dose-dependent and ranged from 7.9 hours to 13.8 hours.
A phase 1 study of Sanguinate in SCD patients has been completed, and researchers are now conducting a phase 2 study testing the drug for the reduction or prevention of delayed cerebral ischemia following subarachnoid hemorrhage.
Phase 2 trials are also planned for vaso-occlusive crisis and leg ulcers secondary to SCD, as well as for preventing delayed graft function following kidney transplant. Sanguinate is also being evaluated for the treatment of beta-thalassemia.
About orphan designation
The FDA grants orphan designation to diseases affecting fewer than 200,000 people in the US.
Orphan designation provides the company developing a drug with certain benefits and incentives, including a 7-year period of marketing exclusivity upon regulatory approval, potential tax credits for certain activities, eligibility for orphan drug grants, and the waiver of certain administrative fees. ![]()