User login
Rare outbreak in cancer clinic tied to saline flush

Credit: Rhoda Baer
The first reported outbreak of Tsukamurella species bloodstream infections was due to improper handling of intravenous saline, according to a report published in Infection Control and Hospital Epidemiology.
From September 2011 to May 2012, 15 immunocompromised patients treated at an outpatient oncology clinic in West Virginia developed infections with Tsukamurella, which are gram-positive bacteria that rarely cause disease in humans.
All patients had received a cancer diagnosis and had an indwelling central line, although central line types varied.
A case-control study revealed that the only risk factor for developing Tsukamurella infection was the receipt of a saline flush in September or October 2011, when clinic staff were using a common-source bag of saline.
Investigations by the West Virginia Bureau of Public Health (WVBPH) and the Centers for Disease Control and Prevention (CDC) uncovered several lapses in infection control procedures relating to the care of long-term intravenous catheters and preparation of chemotherapy for patients at the clinic.
However, these investigations also suggested that saline flush syringes were the likely source of infection.
So the WVBPH and the CDC recommended the clinic institute several changes to its infection prevention and control practices, including using pre-packaged, manufactured saline flushes.
After the clinic changed this practice, Tsukamurella bloodstream infections stopped occurring, further supporting the saline flush as the source of infection.
“This outbreak illustrates the need for outpatient clinics to follow proper infection control guidelines and medication preparation practices to minimize the risk of infection for patients with weakened immune systems,” said lead study author Isaac See, MD, of the CDC.
To that end, the CDC has developed a basic infection control plan tailored to outpatient oncology facilities.
The plan outlines policies and procedures needed to meet minimal requirements for patient safety, including the proper use and handling of injectable medications and correct procedures for assessing central lines. ![]()
Research clarifies role of Ikaros in B-ALL

Credit: Aaron Logan
Two papers published in Nature Immunology have shed new light on the role of Ikaros in B-cell acute lymphoblastic leukemia (B-ALL).
In one paper, researchers describe experiments in mice that show a defect in Ikaros function can disrupt lymphopoiesis and prevent the development of mature B cells.
The cells stay in an aberrant state, which closely resembles that of cells in human B-ALL.
The other paper provides insight into how pre-B cells transition from a proliferative phase to a differentiation phase.
Investigators found that this process, which is vulnerable to leukemic transformation, is dependent upon Ikaros.
Ikaros defect in mice mimics human B-ALL
In the first sudy, researchers showed that loss of Ikaros function in mice creates an environment that mimics human B-ALL.
“We already know several transcription factors that play a central role in B-cell differentiation,” said study author Meinrad Busslinger, PhD, of the Research Institute of Molecular Pathology in Vienna, Austria.
“Pax5, for example, represents a critical factor which activates the B-cell-specific program in precursor cells and simultaneously suppresses alternative cell fates. For Ikaros, we did not know, until now, what this factor is doing during early B-cell development.”
To find out, he and his colleagues analyzed mice that lacked Ikaros from an early stage of B-cell development on. They found that Ikaros deficiency arrested B-cell development due to a defect in pre-BCR signaling.
The cells remained in an aberrant, pro-B-cell stage and were prevented from further differentiation. They also showed increased cell adhesion and reduced migration compared to normal cells.
The researchers noted that loss of Ikaros function has previously been associated with the development of B-ALL. As in mice with a mutated Ikaros gene, B cells from B-ALL patients are arrested at an early checkpoint of B-cell development.
Loss of Ikaros in pre-B cells
With the second study, investigators provided new insight into pre-B-cell differentiation. They described the cells’ transition from a stroma-adherent proliferative phase to a nonadherent differentiation phase.
The stroma-adherent pre-B cells were highly proliferative and had limited self-renewing potential. But when they transitioned to the nonadherent phase, they exited the cell cycle, lost their capacity for self-renewal, and acquired the expression of genes encoding molecules that support B-cell maturation.
And this transition was dependent upon Ikaros.
“Loss of function in the transcription factor Ikaros appears to create a differentiation block that drives the pre-B cells into an adhesive state, promotes self-renewal, and primes them for malignant potential,” said study author Richard Van Etten, MD, PhD, of the University of California, Irvine.
Furthermore, the survival and proliferation of the Ikaros-deficient pre-B cells appeared to be dependent on cooperation between signaling via integrins and signaling via receptors for growth factors.
The researchers said this discovery points to a new avenue for treating B-ALLs resulting from Ikaros mutations. ![]()
Hospital Observation Care
Observation hospitalization is a growing phenomenon in the United States healthcare system.[1] For Medicare beneficiaries, observation encounters increased 33.6% from 2004 to 2011, with inpatient encounters decreasing by 7.8% over the same period.[2]
Observation length of stay has also increased. Medicare states that observation care should typically last <24 hours, and in only rare and exceptional cases exceed 48 hours. We and others have showed that observation stays, on average, do not meet this definition.[1, 3] At our institution, historically less than half of observation encounters discharge in under 24 hours, and 1 in 6 stay longer than 48 hours.[3]
The Centers for Medicare and Medicaid Services (CMS) issued a rules change effective October 1, 2013, in response to concern about recent increases in the length of time that CMS beneficiaries spend as hospital outpatients receiving observation services.[4] These rules shifted observation determination from clinical criteria, such as InterQual,[5] to a time‐based rule that hinges on a 2‐midnight cut point. Patients staying <2 midnights, with few exceptions, are now observation, and those staying 2 midnights are inpatients. This is important, as patients hospitalized as observation are technically outpatients, not covered by Medicare Part A hospital insurance, and ineligible for skilled nursing facility benefits.[3, 6]
Although challenges with observation status in general are well described,[1, 3, 7] the potential impact of the 2‐midnight rule is not fully known. The purpose of our descriptive study was to examine how the new rules, retrospectively applied to recent encounters, would affect our hospital encounters, with a separate analysis of Medicare encounters and adult general medicine encounters. First, as CMS predicted a net shift from outpatient to inpatient stays[8] under the new rule, we attempted to determine whether this rule would actually reduce observation encounter frequency. Second, as CMS has cited persistently large improper payment rates in short‐stay hospital inpatient claims[4] and intends to audit <2‐midnight inpatient encounters under the assumption that many are misclassified observation stays,[4, 8, 9] we sought to determine if short‐stay inpatient and observation encounters were truly the same. Third, as insurance coverage will change based on the 2‐midnight cut point, we sought to determine whether 2 midnights separated distinct clinical populations within observation status, making the rule logical and fair. Finally, we sought to determine whether external factors, such as time of admission, day of week of admission, and transfer to our institution would impact how patients may be classified under the new rule.
METHODS
Study Population
Our methods have been described previously[3] with the exception of the updated dates of inclusion. Briefly, we analyzed all observation and inpatient encounters at University of Wisconsin Hospital and Clinics (UWHC) and the adjacent American Family Children's Hospital, a tertiary care referral academic medical center in Madison, Wisconsin,[10] with start date between January 1, 2012 and February 28, 2013. Six encounters with length of stay (LOS) >6 months were censored as they were not discharged by the time of data abstraction, and 3 encounters were removed due to erroneous encounter discharge dates. Patients with all insurance types were included in anticipation that commercial payors will follow Medicare rules changes. The University of Wisconsin (UW) Health Sciences Institutional Review Board approved the study.
Data Sources
Data were abstracted from the UW Health Sciences electronic medical record and ancillary data systems by the UWHC Business Planning and Analysis Department. Variables included demographics (age, sex, ethnicity), insurance type, and characteristics of hospitalization (admission service, day of week encounter began, acute/unscheduled presentation, International Classification of Diseases, 9th Revision [ICD‐9] codes, LOS, transfer from other hospital). We considered inpatient admission start time to be departure from the emergency department (ED) or arrival at our hospital if the encounter was a transfer from another facility. Observation start time also hinged on arrival at our hospital if the encounter was transferred from another facility, but for observation encounters arriving from the ED, the ED rooming time was used as the encounter start based on conservative interpretation of CMS rules for observation start time under the 2‐midnight rule.[11] Discharge time for all encounters was considered physical discharge from the ward. Observation status decisions were made by the admitting physician, with as‐needed guidance by case management staff and utilization review physicians using InterQual Criteria (McKesson Corp, San Francisco, CA),[5] a reference historically used by CMS auditors to determine status.
Evaluation of the 2‐Midnight Rule
All encounters were stratified based on a stay of <2 midnights or 2 midnights. Because general medicine patients comprise the bulk of observation patients,[3] the subset of encounters occurring on the hospital's 4 hospitalist medicine services, 3 general medicine resident services, and 1 adult nonobstetrics family medicine service, collectively termed adult general medicine, were also evaluated separately. Medicare encounters were also evaluated separately.
We first specifically compared <2‐midnight inpatient encounters and 2‐midnight observation encounters during the study period to determine the net number of encounters that would lose inpatient status (<2‐midnight inpatient encounters) and that would gain inpatient status (2‐midnight observation encounters) under the new rules. Subtracting the absolute number of <2‐midnight inpatient encounters from the 2‐midnight observation encounters results in the net loss or gain of inpatient encounters, assuming LOS does not change. Second, we compared ICD‐9 codes between <2‐midnight inpatient encounters and observation encounters to determine if these 2 groups were clinically distinguishable. Third, we compared diagnosis codes between observation encounters lasting <2 midnights and 2 midnights to establish whether the 2‐midnight cut point defines distinct patient groups within observation. Finally, we evaluated all observation encounters to determine whether the time of admission, the day of admission (weekday vs weekend), or whether the encounter had been transferred from another facility impacted encounter categorization under the new rules.
Statistical Methods
Descriptive statistics were used in this study, with data largely summarized as number and percent. When appropriate, mean and standard deviation were used to describe central tendency and dispersion.
RESULTS
Characteristics of Inpatient and Observation Encounters
Of the 36,193 total hospital encounters during the study period, 4769 (13.2%) were classified as observation encounters. Of 8510 adult general medicine encounters, 2443 (28.7%) were observation. Adult general medicine observation encounters accounted for 51.2% of all observation encounters for the hospital. A total of 9.0% of our observation encounters were transferred from another institution (Table 1).
| Inpatient, n=31,424 (86.8%) | Observation, n=4,769 (13.2%) | |
|---|---|---|
| ||
| Demographics | ||
| Female | 15,083 (48.0%) | 2,321 (48.7%) |
| Age, y, mean (SD) | 49.2 (23.6) | 49.4 (25.4) |
| Has primary care provider | 27,378 (87.1%) | 4,152 (87.1%) |
| Ethnicity | ||
| Caucasian | 27,145 (86.4%) | 3,880 (81.4%) |
| Non‐Caucasian | 3,478 (11.1%) | 739 (15.5%) |
| Unknown | 801 (2.5%) | 150 (3.1%) |
| Characteristics of hospitalization | ||
| Day of admission | ||
| Weekend (SaturdaySunday) | 5,058 (16.1%) | 1,129 (23.7%) |
| Weekday (MondayFriday) | 26,360 (83.9%) | 3,640 (76.3%) |
| Transfer from other institution | 6,191 (19.7%) | 427 (9.0%) |
| Acute/unscheduled | 21,150 (67.3%) | 4,479 (93.9%) |
| Service of admission | ||
| Adult general medicine | 6,067 (19.3%) | 2,443 (51.2%) |
| Adult surgery | 13,625 (43.4%) | 856 (17.9%) |
| Adult subspecialty nonsurgery | 7,432 (23.7%) | 802 (16.8%) |
| Pediatrics | 4,300 (13.7%) | 668 (14.0%) |
| Insurance | ||
| Medicare | 11,719 (37.3%) | 1,846 (38.7%) |
| Medicaid | 3,642 (11.6%) | 658 (13.8%) |
| Commercial | 13,321 (42.4%) | 1,817 (38.1%) |
| Other | 1,665 (5.3%) | 184 (3.9%) |
| None | 1,077 (3.4%) | 264 (5.5%) |
A total of 1442 (4.0%) encounters changed status during the study period, with 606 (42.0%) having changed from inpatient to observation and considered observation, and 836 (58.0%) having changed from observation to inpatient and considered inpatient.
Impact of the 2‐Midnight Rule on Number of Observation and Inpatient Encounters
Among all encounters, the 2‐midnight rule would result in a net transition of 14.9% of inpatient encounters to observation. Considering only Medicare encounters, the net transition would be 7.4% inpatient encounters to observation. Within adult general medicine patients, the parallel changes would be 2.2% (all insurance types) and a gain of 2.4% (Medicare only) (Table 2).
| Inpatient, n=31,424 (86.8%) | Observation, n=4,769 (13.2%) | |
|---|---|---|
| ||
| All encounters, n=36,193 | ||
| <2 Midnights | 6,723* (21.4%) | 3,454 (72.4%) |
| 2 Midnights | 24,701 (78.6%) | 1,315* (27.6%) |
| Net change inpatient encounters | 5,408 (14.9%) | |
| Medicare encounters, n=13,565 | ||
| <2 Midnights | 1,728* (14.7%) | 1,127 (61.1%) |
| 2 Midnights | 9,991 (85.3%) | 719* (38.9%) |
| Net change inpatient encounters | 1,009 (7.4%) | |
| All general medicine, n=8,510 | ||
| <2 Midnights | 1,114* (18.4%) | 1,512 (61.9%) |
| 2 Midnights | 4,953 (81.6%) | 931* (38.1%) |
| Net change inpatient encounters | 183 (2.2%) | |
| Medicare general medicine, n=4,571 | ||
| <2 Midnights | 472* (14.3%) | 690 (54.2%) |
| 2 Midnights | 2,827 (85.7%) | 582* (45.8%) |
| Net change inpatient encounters | 110 (2.4%) | |
Encounters including surgical procedures on the so‐called inpatient‐only list will remain inpatient regardless of LOS. As we could not identify such encounters, we tested removal of all surgical stays under the overly conservative assumption that all short stay surgical patients would remain inpatient. Of 21,712 nonsurgical encounters that remained, there were 4074 <2‐midnight inpatient encounters and 1146 2‐midnight observation encounters, yielding a net transition of 2928 (13.5%) inpatient encounters to observation encounters. Medicare encounters accounted for 8240 of these 21,712 (38.0%) nonsurgical encounters, with 1105 <2‐midnight inpatient encounters and 653 2‐midnight observation encounters, yielding a net reclassification of 452 (5.5%) Medicare nonsurgical inpatient encounters to observation encounters.
Length of Stay and Diagnoses After Application of the 2‐Midnight Rule to Inpatient and Observation Encounters
Only 1 of the top 5 ICD‐9 codes (code 427: cardiac dysrhythmias) was shared between the 2‐midnight inpatient encounters and any observation encounter group. When the same criteria were applied to adult general medicine encounters, none of the top 5 ICD‐9 codes were shared (Table 3).
| All Encounters, n=36,193 | ||||||||
|---|---|---|---|---|---|---|---|---|
| Inpatient Stays Shorter Than 2 Midnights, n=6,723 (21.4%) | Inpatient Stays 2 Midnights, n=24,701 (78.6%) | Observation Stays Shorter Than 2 Midnights, n=3,454 (72.4%) | Observation Stays 2 Midnights n=1,315 (27.6%) | |||||
| ||||||||
| Day of admission | ||||||||
| Weekend (Saturday Sunday) | 1,026 (15.3%) | 4,032 (16.3%) | 781 (22.6%) | 348 (26.5%) | ||||
| Weekday (MondayFriday) | 5,697 (84.7%) | 20,669 (83.7%) | 2,673 (77.4%) | 967 (73.5%) | ||||
| Transfer from another institution | 986 (14.7%) | 5,205 (21.1%) | 297 (8.6%) | 130 (9.9%) | ||||
| Top diagnosis codes | ||||||||
| ICD‐9 #1 | 996: Complications peculiar to specific procedure | 200 (3.0%) | 996: Complications peculiar to specific procedure | 1,355 (5.5%) | 786: Symptoms involving respiratory/other chest | 531 (15.4%) | 780: General symptoms | 124 (9.4%) |
| ICD‐9 #2 | 427: Cardiac dysrhythmias | 195 (2.9%) | 715: Osteoarthrosis and allied disorders | 917 (3.7%) | 780: General symptoms | 235 (6.8%) | 786: Symptoms involving respiratory/other chest | 80 (6.1%) |
| ICD‐9 #3 | 722: Intervertebral disk disorder | 182 (2.7%) | 038: Septicemia | 689 (2.8%) | 427: Cardiac dysrhythmias | 103 (3.0%) | 789: Other symptoms involving abdomen/pelvis | 48 (3.7%) |
| ICD‐9 #4 | 540: Acute appendicitis | 179 (2.7%) | 296: Episodic mood disorder | 619 (2.5%) | 789: Other symptoms involving abdomen/pelvis | 89 (2.6%) | 787: Symptoms involving digestive system | 38 (2.9%) |
| ICD‐9 #5 | V58: Encounter for other and unspecified procedures | 176 (2.6%) | 998: Other complications of procedures not elsewhere classified | 516 (2.1%) | 787: Symptoms involving digestive system | 56 (1.6%) | 599: Other disorders of urethra/urinary tract | 35 (2.7%) |
| Adult General Medicine Encounters, n=8,510 | ||||||||
| Inpatient Stays Shorter Than 2 Midnights, n=1,114 (18.4%) | Inpatient Stays 2 Midnights, n=4,953 (81.6%) | Observation Stays Shorter Than 2 Midnights, n=1,512 (61.9%) | Observation Stays 2 Midnights, n=931 (38.1%) | |||||
| Day of admission | ||||||||
| Weekend (Saturday Sunday) | 253 (22.7%) | 1,189 (24.0%) | 318 (21.0%) | 261 (28.0%) | ||||
| Weekday (MondayFriday) | 861 (77.3%) | 3,764 (76.0%) | 1,194 (79.0%) | 670 (72.0%) | ||||
| Transfer from another institution | 89 (8.0%) | 1,193 (24.1%) | 61 (4.0%) | 75 (8.1%) | ||||
| Top diagnosis codes | ||||||||
| ICD‐9 #1 | 415: Acute pulmonary heart disease | 57 (5.1%) | 038: Septicemia | 423 (8.5%) | 786: Symptoms involving respiratory/other chest | 315 (20.8%) | 780: General symptoms | 99 (10.6%) |
| ICD‐9 #2 | 276: Disorders of fluid/electrolyte, acid/base | 51 (4.6%) | 486: Pneumonia | 206 (4.2%) | 780: General symptoms | 138 (9.1%) | 786: Symptoms involving respiratory/other chest | 51 (5.5%) |
| ICD‐9 #3 | 682: Other cellulitis and abscess | 47 (4.2%) | 584: Acute kidney failure | 181 (3.7%) | 789: Other symptoms involving abdomen/pelvis | 47 (3.1%) | 789: Other symptoms involving abdomen/pelvis | 37 (4.0%) |
| ICD‐9 #4 | 427: Cardiac dysrhythmias | 43 (3.9%) | 577: Diseases of the pancreas | 181 (3.7%) | 787: Symptoms involving digestive system | 35 (2.3%) | 599: Other disorders of urethra/urinary tract | 30 (3.2%) |
| ICD‐9 #5 | 250: Diabetes mellitus | 40 (3.6%) | 682: Other cellulitis and abscess | 175 (3.5%) | 305: Nondependent abuse of drugs | 32 (2.1%) | 787: Symptoms involving digestive system | 28 (3.0%) |
Including all observation encounters across LOS, 4 of the 5 top ICD‐9 codes were the same for stays <2 midnights and 2 midnights. The same was true for short‐ and long‐stay general medicine observation encounters (Table 3).
For all observation encounters, 26.5% (348/1315) of 2‐midnight encounters started on a weekend compared to 22.6% (781/3454) of <2‐midnight encounters. For adult medicine observation, 28.0% (261/931) of 2‐midnight encounters started on a weekend compared to 21.0% (318/1512) of <2‐midnight encounters (Table 3).
Percentage of Observation Encounters Reaching 2 Midnights Based on Time of Hospitalization
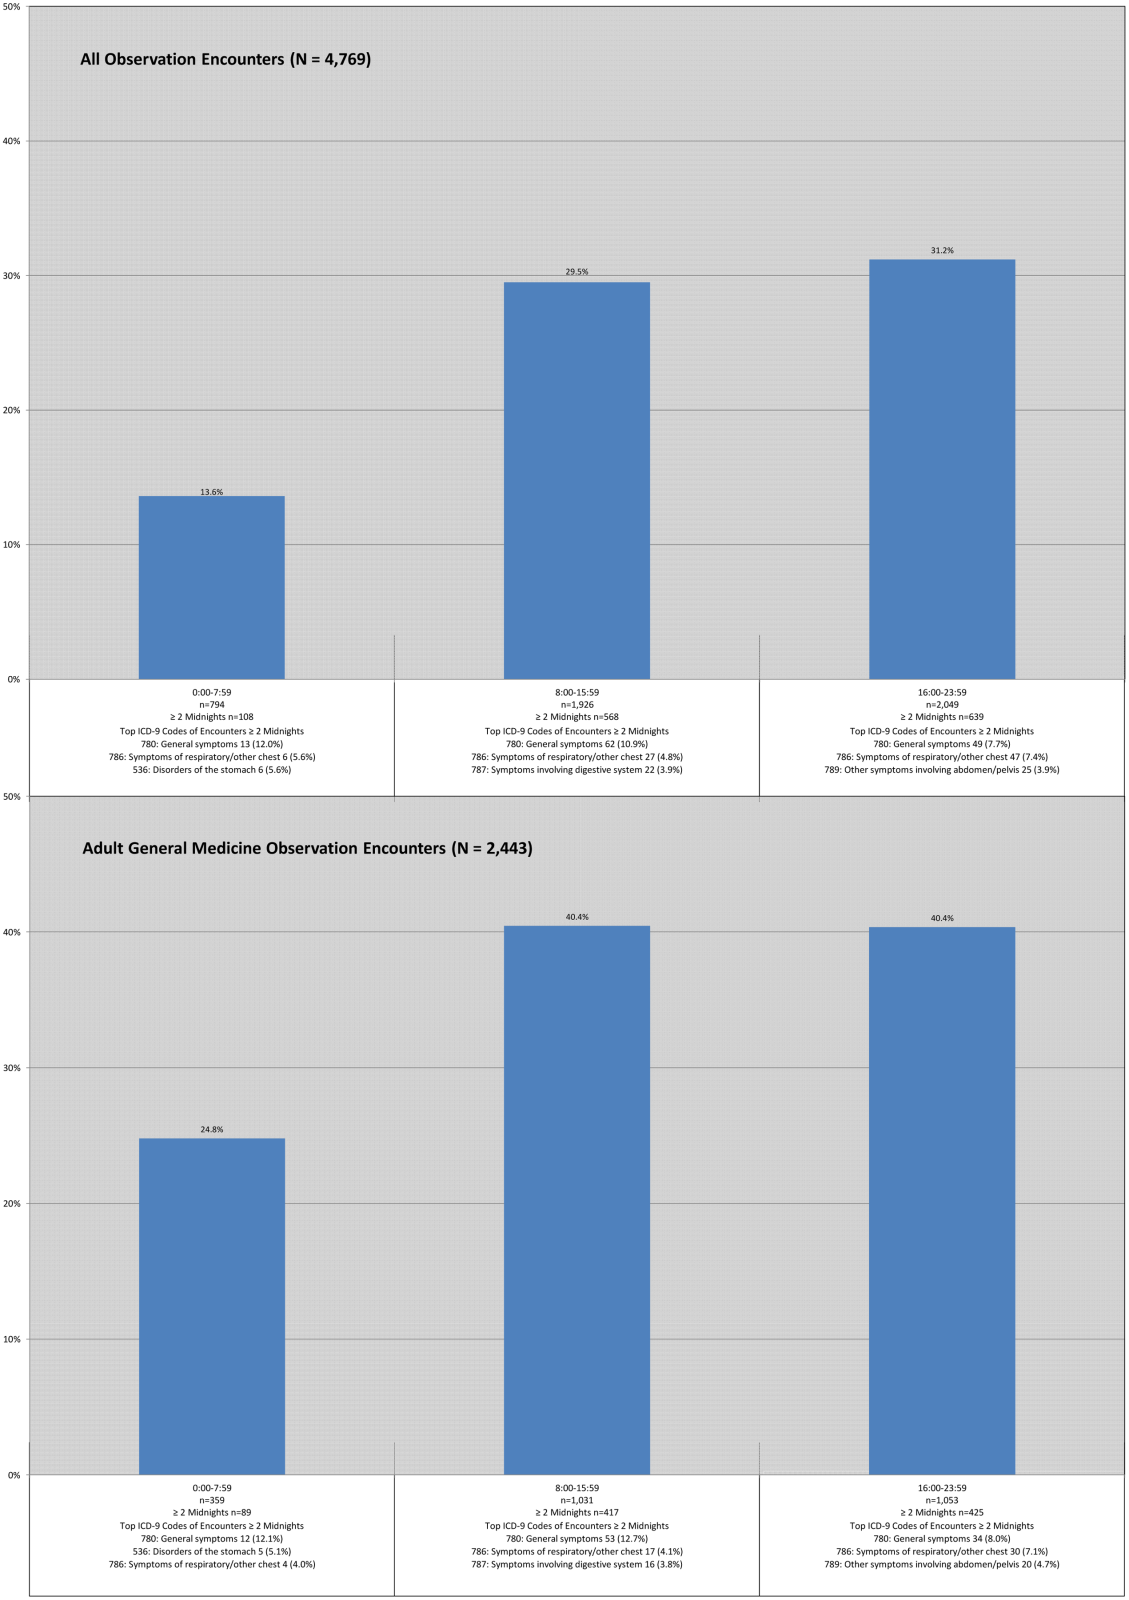
Observation encounters starting before 8:00 am spanned 2 midnights 13.6% of the time, and those encounters starting after 4:00 pm crossed 2 midnights 31.2% of the time. Two of the 3 top ICD‐9 codes were the same across LOS, with similar findings for the adult general medicine‐only group (Figure 1).
DISCUSSION
Although CMS predicts that more patients will be classified as inpatients under the new rule, we determined the opposite, consistent with a recent report generated by the Office of the Inspector General (OIG) for 2012 Medicare beneficiaries.[8] Our results did not change when we excluded all surgical encounters to account for possible exclusions based on the surgical inpatient‐only list. Although a small percentage of Medicare adult general medicine patients may be reclassified as inpatients under the new rules, the net effect would be that many more hospital encounters will be billed under observation rather than inpatient status. These findings assume overall length of stay will remain unchanged under these rules, an assumption that may not hold true given the financial losses we predicted hospitals may face under this rule,[12] and potential pressures on individual physicians providing patient care.
Medicare has prioritized auditing <2‐midnight inpatient encounters under the assumption that many short inpatient encounters are actually misclassified observation encounters,[4, 8, 9] prompting us to investigate whether this was the case in our patient population. Although it did not use ICD‐9 diagnosis codes, the OIG report suggested that short‐stay inpatients and observation patients may be clinically similar.[8, 13] Using ICD‐9 codes, we found no overlap between the top ICD‐9 codes for adult general medicine <2‐midnight inpatient and observation encounters, and only 1 of 5 shared codes for these encounters across all service lines. These findings are counter to the OIG report, and suggest that <2‐midnight inpatients are different from observation patients at our institution, and that <2‐midnight inpatients should not be arbitrarily reclassified as observation based solely upon LOS.
We also found that the majority of top ICD‐9 codes within observation were the same regardless of LOS, suggesting that LOS does not reliably differentiate clinically different observation populations that merit different insurance coverage (Medicare Part A for 2‐midnight encounters, Medicare Part B for <2‐midnight encounters). This lack of a clear cut point may drive an overall increase in LOS to achieve 2 midnights, as common diagnosis codes can be justified for both <2‐midnight or 2‐midnight observation stays.
Finally, we found that external factors, such as the time of day and specific day (weekday vs weekend) of hospitalization, impact the likelihood of achieving a 2‐midnight stay. Patients hospitalized earlier in the day were less likely to span 2 midnights compared to later‐day encounters, suggesting that use of a full working day as the day of presentation is harmful to a patient's chance of gaining inpatient status. Observation hospitalizations starting on a weekend day were more likely to achieve 2 midnights, which likely reflects different resource allocation and hospital efficiency on weekends, yet it is unlikely that weekend midnights, if associated with any delay in care, will be counted toward a patient's cumulative 2‐midnight total. The CMS has further indicated that midnights accrued prior to transfer from 1 hospital to another will not count toward a cumulative 2‐midnight stay. Although it would seem likely that patients requiring transfer to a tertiary care center would meet inpatient criteria, 9% of our observation encounters were transferred from other acute care hospitals, and many will have lost attributable midnights accrued prior to transfer to our hospital. Taken together, our findings strongly suggest that issues entirely unrelated to diagnosis or clinical status will impact whether hospitalized patients will be classified as inpatient or observation under the new rule.
This study has several limitations. Our data were limited to a single Midwestern tertiary care academic medical center, and may not be applicable to other healthcare settings. Second, 1.5% (466) of our inpatient stays and 56 (1.2%) of our observation encounters lacked a referral source in our administrative database, although these deficiencies would not likely change the conclusions. Finally, the total number of observation encounters starting before 8:00 am and staying 2 midnights was small and therefore potentially subject to confounding. However, despite the fact that encounters beginning in the early morning hours may be different in ways unable to be measured in this study, encounter ICD‐9 codes were similar regardless of time of day.
Despite these limitations, our study raises concerns about the impact of CMS's new time‐driven observation rules on hospital practice patterns. We found distinctly different <2‐midnight inpatient ICD‐9 codes as compared to those for observation encounters. Reclassifying <2‐midnight inpatients as observation may inappropriately shift the financial burden of acute hospitalizations to patients who were previously eligible to receive Medicare inpatient benefits. We also demonstrated a decrease in billable inpatient encounters under the new rules, which may be countered by changes in hospital and provider practice to drive more admissions over the 2‐midnight threshold to avoid financial losses. These changes should be defensible under audit given the ambiguities of the rule we found in this study surrounding time of day of admission, weekend and transfer hospitalizations, and the fact that common observation ICD‐9 codes are similar across LOS. Ironically, the unintended consequence of the new rule may be to drive up hospital LOS, reduce efficiency, and increase the overall cost of care.
Our findings suggest that CMS should define observation care per its original intent: as a means to determine if a patient can safely return home after a short period of additional care.[6] Patients whose conditions necessitate an intensity and level of service beyond this narrow scope should be classified as full inpatients irrespective of LOS, whether that LOS is <2 midnights or 2 midnights. Policies that fail to reflect the original intent of observation status are unlikely to achieve the intended outcome of defining 2 distinct patient populations that merit different services and reimbursement.
Acknowledgements
The authors thank Andrew LaRocque and Dan Dexter for their assistance with the data. Without their help, this article would not have been possible.
Disclosures: Dr. Graf reports receiving royalties from Smith & Nephew for patents he has assigned to them involving orthopedic implants. This is unrelated to the topic or content of this manuscript. The authors report no other conflicts of interest.
Editor's Note: On February 24, 2014, after this manuscript was published, CMS issued a rules clarification allowing midnights spent at a referral hospital prior to transfer to be counted in the cumulative 2 midnight tally to determine inpatient status.
- , , . Sharp rise in Medicare enrollees being held hospitals for observation raises concerns about causes and consequences. Health Aff (Millwood). 2012;31(6):1251–1259.
- MedPAC report to Congress: hospital inpatient and outpatient services. Available at: http://www.medpac.gov/chapters/Mar13_Ch03.pdf. Accessed September 29, 2013.
- , , , et al. Hospitalized but not admitted: characteristics of patients with “Observation Status” at an academic medical center. JAMA Intern Med. 2013;173(21):1991–1998.
- Centers for Medicare and Medicaid Services inpatient prospective payment system 1599‐F. Fiscal year 2014 final rule. Available at: http://www.gpo.gov/fdsys/pkg/FR‐2013‐08‐19/pdf/2013–18956.pdf. Accessed December 22, 2013.
- McKesson Interqual. Available at: http://www.mckesson.com/en_us/McKesson.com/Payers/Decision%2BManagement/InterQual%2BEvidence‐Based%2BClinical%2BContent/InterQual%2BEvidence‐Based%2BClinical%2BContent.html. Accessed October 3, 2013.
- Medicare benefit policy manual. Chapter 6. Hospital services covered under Part B. Available at: https://www.cms.gov/transmittals/downloads/R42BP.pdf. Accessed December 22, 2013.
- . Thinking of admitting this patient? Think again: how observation care is complicating life for you (and your patients). Today's Hospitalist. Available at: http://www.todayshospitalist.com/index.php?b=articles_read173(21):2004–2006.
- Kaiser Health News. HHS Inspector General scrutinizes Medicare observation care policy. Available at: http://www.kaiserhealthnews.org/stories/2013/july/30/ig‐report‐observation‐care.aspx. Accessed October 3, 2013.
Observation hospitalization is a growing phenomenon in the United States healthcare system.[1] For Medicare beneficiaries, observation encounters increased 33.6% from 2004 to 2011, with inpatient encounters decreasing by 7.8% over the same period.[2]
Observation length of stay has also increased. Medicare states that observation care should typically last <24 hours, and in only rare and exceptional cases exceed 48 hours. We and others have showed that observation stays, on average, do not meet this definition.[1, 3] At our institution, historically less than half of observation encounters discharge in under 24 hours, and 1 in 6 stay longer than 48 hours.[3]
The Centers for Medicare and Medicaid Services (CMS) issued a rules change effective October 1, 2013, in response to concern about recent increases in the length of time that CMS beneficiaries spend as hospital outpatients receiving observation services.[4] These rules shifted observation determination from clinical criteria, such as InterQual,[5] to a time‐based rule that hinges on a 2‐midnight cut point. Patients staying <2 midnights, with few exceptions, are now observation, and those staying 2 midnights are inpatients. This is important, as patients hospitalized as observation are technically outpatients, not covered by Medicare Part A hospital insurance, and ineligible for skilled nursing facility benefits.[3, 6]
Although challenges with observation status in general are well described,[1, 3, 7] the potential impact of the 2‐midnight rule is not fully known. The purpose of our descriptive study was to examine how the new rules, retrospectively applied to recent encounters, would affect our hospital encounters, with a separate analysis of Medicare encounters and adult general medicine encounters. First, as CMS predicted a net shift from outpatient to inpatient stays[8] under the new rule, we attempted to determine whether this rule would actually reduce observation encounter frequency. Second, as CMS has cited persistently large improper payment rates in short‐stay hospital inpatient claims[4] and intends to audit <2‐midnight inpatient encounters under the assumption that many are misclassified observation stays,[4, 8, 9] we sought to determine if short‐stay inpatient and observation encounters were truly the same. Third, as insurance coverage will change based on the 2‐midnight cut point, we sought to determine whether 2 midnights separated distinct clinical populations within observation status, making the rule logical and fair. Finally, we sought to determine whether external factors, such as time of admission, day of week of admission, and transfer to our institution would impact how patients may be classified under the new rule.
METHODS
Study Population
Our methods have been described previously[3] with the exception of the updated dates of inclusion. Briefly, we analyzed all observation and inpatient encounters at University of Wisconsin Hospital and Clinics (UWHC) and the adjacent American Family Children's Hospital, a tertiary care referral academic medical center in Madison, Wisconsin,[10] with start date between January 1, 2012 and February 28, 2013. Six encounters with length of stay (LOS) >6 months were censored as they were not discharged by the time of data abstraction, and 3 encounters were removed due to erroneous encounter discharge dates. Patients with all insurance types were included in anticipation that commercial payors will follow Medicare rules changes. The University of Wisconsin (UW) Health Sciences Institutional Review Board approved the study.
Data Sources
Data were abstracted from the UW Health Sciences electronic medical record and ancillary data systems by the UWHC Business Planning and Analysis Department. Variables included demographics (age, sex, ethnicity), insurance type, and characteristics of hospitalization (admission service, day of week encounter began, acute/unscheduled presentation, International Classification of Diseases, 9th Revision [ICD‐9] codes, LOS, transfer from other hospital). We considered inpatient admission start time to be departure from the emergency department (ED) or arrival at our hospital if the encounter was a transfer from another facility. Observation start time also hinged on arrival at our hospital if the encounter was transferred from another facility, but for observation encounters arriving from the ED, the ED rooming time was used as the encounter start based on conservative interpretation of CMS rules for observation start time under the 2‐midnight rule.[11] Discharge time for all encounters was considered physical discharge from the ward. Observation status decisions were made by the admitting physician, with as‐needed guidance by case management staff and utilization review physicians using InterQual Criteria (McKesson Corp, San Francisco, CA),[5] a reference historically used by CMS auditors to determine status.
Evaluation of the 2‐Midnight Rule
All encounters were stratified based on a stay of <2 midnights or 2 midnights. Because general medicine patients comprise the bulk of observation patients,[3] the subset of encounters occurring on the hospital's 4 hospitalist medicine services, 3 general medicine resident services, and 1 adult nonobstetrics family medicine service, collectively termed adult general medicine, were also evaluated separately. Medicare encounters were also evaluated separately.
We first specifically compared <2‐midnight inpatient encounters and 2‐midnight observation encounters during the study period to determine the net number of encounters that would lose inpatient status (<2‐midnight inpatient encounters) and that would gain inpatient status (2‐midnight observation encounters) under the new rules. Subtracting the absolute number of <2‐midnight inpatient encounters from the 2‐midnight observation encounters results in the net loss or gain of inpatient encounters, assuming LOS does not change. Second, we compared ICD‐9 codes between <2‐midnight inpatient encounters and observation encounters to determine if these 2 groups were clinically distinguishable. Third, we compared diagnosis codes between observation encounters lasting <2 midnights and 2 midnights to establish whether the 2‐midnight cut point defines distinct patient groups within observation. Finally, we evaluated all observation encounters to determine whether the time of admission, the day of admission (weekday vs weekend), or whether the encounter had been transferred from another facility impacted encounter categorization under the new rules.
Statistical Methods
Descriptive statistics were used in this study, with data largely summarized as number and percent. When appropriate, mean and standard deviation were used to describe central tendency and dispersion.
RESULTS
Characteristics of Inpatient and Observation Encounters
Of the 36,193 total hospital encounters during the study period, 4769 (13.2%) were classified as observation encounters. Of 8510 adult general medicine encounters, 2443 (28.7%) were observation. Adult general medicine observation encounters accounted for 51.2% of all observation encounters for the hospital. A total of 9.0% of our observation encounters were transferred from another institution (Table 1).
| Inpatient, n=31,424 (86.8%) | Observation, n=4,769 (13.2%) | |
|---|---|---|
| ||
| Demographics | ||
| Female | 15,083 (48.0%) | 2,321 (48.7%) |
| Age, y, mean (SD) | 49.2 (23.6) | 49.4 (25.4) |
| Has primary care provider | 27,378 (87.1%) | 4,152 (87.1%) |
| Ethnicity | ||
| Caucasian | 27,145 (86.4%) | 3,880 (81.4%) |
| Non‐Caucasian | 3,478 (11.1%) | 739 (15.5%) |
| Unknown | 801 (2.5%) | 150 (3.1%) |
| Characteristics of hospitalization | ||
| Day of admission | ||
| Weekend (SaturdaySunday) | 5,058 (16.1%) | 1,129 (23.7%) |
| Weekday (MondayFriday) | 26,360 (83.9%) | 3,640 (76.3%) |
| Transfer from other institution | 6,191 (19.7%) | 427 (9.0%) |
| Acute/unscheduled | 21,150 (67.3%) | 4,479 (93.9%) |
| Service of admission | ||
| Adult general medicine | 6,067 (19.3%) | 2,443 (51.2%) |
| Adult surgery | 13,625 (43.4%) | 856 (17.9%) |
| Adult subspecialty nonsurgery | 7,432 (23.7%) | 802 (16.8%) |
| Pediatrics | 4,300 (13.7%) | 668 (14.0%) |
| Insurance | ||
| Medicare | 11,719 (37.3%) | 1,846 (38.7%) |
| Medicaid | 3,642 (11.6%) | 658 (13.8%) |
| Commercial | 13,321 (42.4%) | 1,817 (38.1%) |
| Other | 1,665 (5.3%) | 184 (3.9%) |
| None | 1,077 (3.4%) | 264 (5.5%) |
A total of 1442 (4.0%) encounters changed status during the study period, with 606 (42.0%) having changed from inpatient to observation and considered observation, and 836 (58.0%) having changed from observation to inpatient and considered inpatient.
Impact of the 2‐Midnight Rule on Number of Observation and Inpatient Encounters
Among all encounters, the 2‐midnight rule would result in a net transition of 14.9% of inpatient encounters to observation. Considering only Medicare encounters, the net transition would be 7.4% inpatient encounters to observation. Within adult general medicine patients, the parallel changes would be 2.2% (all insurance types) and a gain of 2.4% (Medicare only) (Table 2).
| Inpatient, n=31,424 (86.8%) | Observation, n=4,769 (13.2%) | |
|---|---|---|
| ||
| All encounters, n=36,193 | ||
| <2 Midnights | 6,723* (21.4%) | 3,454 (72.4%) |
| 2 Midnights | 24,701 (78.6%) | 1,315* (27.6%) |
| Net change inpatient encounters | 5,408 (14.9%) | |
| Medicare encounters, n=13,565 | ||
| <2 Midnights | 1,728* (14.7%) | 1,127 (61.1%) |
| 2 Midnights | 9,991 (85.3%) | 719* (38.9%) |
| Net change inpatient encounters | 1,009 (7.4%) | |
| All general medicine, n=8,510 | ||
| <2 Midnights | 1,114* (18.4%) | 1,512 (61.9%) |
| 2 Midnights | 4,953 (81.6%) | 931* (38.1%) |
| Net change inpatient encounters | 183 (2.2%) | |
| Medicare general medicine, n=4,571 | ||
| <2 Midnights | 472* (14.3%) | 690 (54.2%) |
| 2 Midnights | 2,827 (85.7%) | 582* (45.8%) |
| Net change inpatient encounters | 110 (2.4%) | |
Encounters including surgical procedures on the so‐called inpatient‐only list will remain inpatient regardless of LOS. As we could not identify such encounters, we tested removal of all surgical stays under the overly conservative assumption that all short stay surgical patients would remain inpatient. Of 21,712 nonsurgical encounters that remained, there were 4074 <2‐midnight inpatient encounters and 1146 2‐midnight observation encounters, yielding a net transition of 2928 (13.5%) inpatient encounters to observation encounters. Medicare encounters accounted for 8240 of these 21,712 (38.0%) nonsurgical encounters, with 1105 <2‐midnight inpatient encounters and 653 2‐midnight observation encounters, yielding a net reclassification of 452 (5.5%) Medicare nonsurgical inpatient encounters to observation encounters.
Length of Stay and Diagnoses After Application of the 2‐Midnight Rule to Inpatient and Observation Encounters
Only 1 of the top 5 ICD‐9 codes (code 427: cardiac dysrhythmias) was shared between the 2‐midnight inpatient encounters and any observation encounter group. When the same criteria were applied to adult general medicine encounters, none of the top 5 ICD‐9 codes were shared (Table 3).
| All Encounters, n=36,193 | ||||||||
|---|---|---|---|---|---|---|---|---|
| Inpatient Stays Shorter Than 2 Midnights, n=6,723 (21.4%) | Inpatient Stays 2 Midnights, n=24,701 (78.6%) | Observation Stays Shorter Than 2 Midnights, n=3,454 (72.4%) | Observation Stays 2 Midnights n=1,315 (27.6%) | |||||
| ||||||||
| Day of admission | ||||||||
| Weekend (Saturday Sunday) | 1,026 (15.3%) | 4,032 (16.3%) | 781 (22.6%) | 348 (26.5%) | ||||
| Weekday (MondayFriday) | 5,697 (84.7%) | 20,669 (83.7%) | 2,673 (77.4%) | 967 (73.5%) | ||||
| Transfer from another institution | 986 (14.7%) | 5,205 (21.1%) | 297 (8.6%) | 130 (9.9%) | ||||
| Top diagnosis codes | ||||||||
| ICD‐9 #1 | 996: Complications peculiar to specific procedure | 200 (3.0%) | 996: Complications peculiar to specific procedure | 1,355 (5.5%) | 786: Symptoms involving respiratory/other chest | 531 (15.4%) | 780: General symptoms | 124 (9.4%) |
| ICD‐9 #2 | 427: Cardiac dysrhythmias | 195 (2.9%) | 715: Osteoarthrosis and allied disorders | 917 (3.7%) | 780: General symptoms | 235 (6.8%) | 786: Symptoms involving respiratory/other chest | 80 (6.1%) |
| ICD‐9 #3 | 722: Intervertebral disk disorder | 182 (2.7%) | 038: Septicemia | 689 (2.8%) | 427: Cardiac dysrhythmias | 103 (3.0%) | 789: Other symptoms involving abdomen/pelvis | 48 (3.7%) |
| ICD‐9 #4 | 540: Acute appendicitis | 179 (2.7%) | 296: Episodic mood disorder | 619 (2.5%) | 789: Other symptoms involving abdomen/pelvis | 89 (2.6%) | 787: Symptoms involving digestive system | 38 (2.9%) |
| ICD‐9 #5 | V58: Encounter for other and unspecified procedures | 176 (2.6%) | 998: Other complications of procedures not elsewhere classified | 516 (2.1%) | 787: Symptoms involving digestive system | 56 (1.6%) | 599: Other disorders of urethra/urinary tract | 35 (2.7%) |
| Adult General Medicine Encounters, n=8,510 | ||||||||
| Inpatient Stays Shorter Than 2 Midnights, n=1,114 (18.4%) | Inpatient Stays 2 Midnights, n=4,953 (81.6%) | Observation Stays Shorter Than 2 Midnights, n=1,512 (61.9%) | Observation Stays 2 Midnights, n=931 (38.1%) | |||||
| Day of admission | ||||||||
| Weekend (Saturday Sunday) | 253 (22.7%) | 1,189 (24.0%) | 318 (21.0%) | 261 (28.0%) | ||||
| Weekday (MondayFriday) | 861 (77.3%) | 3,764 (76.0%) | 1,194 (79.0%) | 670 (72.0%) | ||||
| Transfer from another institution | 89 (8.0%) | 1,193 (24.1%) | 61 (4.0%) | 75 (8.1%) | ||||
| Top diagnosis codes | ||||||||
| ICD‐9 #1 | 415: Acute pulmonary heart disease | 57 (5.1%) | 038: Septicemia | 423 (8.5%) | 786: Symptoms involving respiratory/other chest | 315 (20.8%) | 780: General symptoms | 99 (10.6%) |
| ICD‐9 #2 | 276: Disorders of fluid/electrolyte, acid/base | 51 (4.6%) | 486: Pneumonia | 206 (4.2%) | 780: General symptoms | 138 (9.1%) | 786: Symptoms involving respiratory/other chest | 51 (5.5%) |
| ICD‐9 #3 | 682: Other cellulitis and abscess | 47 (4.2%) | 584: Acute kidney failure | 181 (3.7%) | 789: Other symptoms involving abdomen/pelvis | 47 (3.1%) | 789: Other symptoms involving abdomen/pelvis | 37 (4.0%) |
| ICD‐9 #4 | 427: Cardiac dysrhythmias | 43 (3.9%) | 577: Diseases of the pancreas | 181 (3.7%) | 787: Symptoms involving digestive system | 35 (2.3%) | 599: Other disorders of urethra/urinary tract | 30 (3.2%) |
| ICD‐9 #5 | 250: Diabetes mellitus | 40 (3.6%) | 682: Other cellulitis and abscess | 175 (3.5%) | 305: Nondependent abuse of drugs | 32 (2.1%) | 787: Symptoms involving digestive system | 28 (3.0%) |
Including all observation encounters across LOS, 4 of the 5 top ICD‐9 codes were the same for stays <2 midnights and 2 midnights. The same was true for short‐ and long‐stay general medicine observation encounters (Table 3).
For all observation encounters, 26.5% (348/1315) of 2‐midnight encounters started on a weekend compared to 22.6% (781/3454) of <2‐midnight encounters. For adult medicine observation, 28.0% (261/931) of 2‐midnight encounters started on a weekend compared to 21.0% (318/1512) of <2‐midnight encounters (Table 3).
Percentage of Observation Encounters Reaching 2 Midnights Based on Time of Hospitalization
Observation encounters starting before 8:00 am spanned 2 midnights 13.6% of the time, and those encounters starting after 4:00 pm crossed 2 midnights 31.2% of the time. Two of the 3 top ICD‐9 codes were the same across LOS, with similar findings for the adult general medicine‐only group (Figure 1).
DISCUSSION
Although CMS predicts that more patients will be classified as inpatients under the new rule, we determined the opposite, consistent with a recent report generated by the Office of the Inspector General (OIG) for 2012 Medicare beneficiaries.[8] Our results did not change when we excluded all surgical encounters to account for possible exclusions based on the surgical inpatient‐only list. Although a small percentage of Medicare adult general medicine patients may be reclassified as inpatients under the new rules, the net effect would be that many more hospital encounters will be billed under observation rather than inpatient status. These findings assume overall length of stay will remain unchanged under these rules, an assumption that may not hold true given the financial losses we predicted hospitals may face under this rule,[12] and potential pressures on individual physicians providing patient care.
Medicare has prioritized auditing <2‐midnight inpatient encounters under the assumption that many short inpatient encounters are actually misclassified observation encounters,[4, 8, 9] prompting us to investigate whether this was the case in our patient population. Although it did not use ICD‐9 diagnosis codes, the OIG report suggested that short‐stay inpatients and observation patients may be clinically similar.[8, 13] Using ICD‐9 codes, we found no overlap between the top ICD‐9 codes for adult general medicine <2‐midnight inpatient and observation encounters, and only 1 of 5 shared codes for these encounters across all service lines. These findings are counter to the OIG report, and suggest that <2‐midnight inpatients are different from observation patients at our institution, and that <2‐midnight inpatients should not be arbitrarily reclassified as observation based solely upon LOS.
We also found that the majority of top ICD‐9 codes within observation were the same regardless of LOS, suggesting that LOS does not reliably differentiate clinically different observation populations that merit different insurance coverage (Medicare Part A for 2‐midnight encounters, Medicare Part B for <2‐midnight encounters). This lack of a clear cut point may drive an overall increase in LOS to achieve 2 midnights, as common diagnosis codes can be justified for both <2‐midnight or 2‐midnight observation stays.
Finally, we found that external factors, such as the time of day and specific day (weekday vs weekend) of hospitalization, impact the likelihood of achieving a 2‐midnight stay. Patients hospitalized earlier in the day were less likely to span 2 midnights compared to later‐day encounters, suggesting that use of a full working day as the day of presentation is harmful to a patient's chance of gaining inpatient status. Observation hospitalizations starting on a weekend day were more likely to achieve 2 midnights, which likely reflects different resource allocation and hospital efficiency on weekends, yet it is unlikely that weekend midnights, if associated with any delay in care, will be counted toward a patient's cumulative 2‐midnight total. The CMS has further indicated that midnights accrued prior to transfer from 1 hospital to another will not count toward a cumulative 2‐midnight stay. Although it would seem likely that patients requiring transfer to a tertiary care center would meet inpatient criteria, 9% of our observation encounters were transferred from other acute care hospitals, and many will have lost attributable midnights accrued prior to transfer to our hospital. Taken together, our findings strongly suggest that issues entirely unrelated to diagnosis or clinical status will impact whether hospitalized patients will be classified as inpatient or observation under the new rule.
This study has several limitations. Our data were limited to a single Midwestern tertiary care academic medical center, and may not be applicable to other healthcare settings. Second, 1.5% (466) of our inpatient stays and 56 (1.2%) of our observation encounters lacked a referral source in our administrative database, although these deficiencies would not likely change the conclusions. Finally, the total number of observation encounters starting before 8:00 am and staying 2 midnights was small and therefore potentially subject to confounding. However, despite the fact that encounters beginning in the early morning hours may be different in ways unable to be measured in this study, encounter ICD‐9 codes were similar regardless of time of day.
Despite these limitations, our study raises concerns about the impact of CMS's new time‐driven observation rules on hospital practice patterns. We found distinctly different <2‐midnight inpatient ICD‐9 codes as compared to those for observation encounters. Reclassifying <2‐midnight inpatients as observation may inappropriately shift the financial burden of acute hospitalizations to patients who were previously eligible to receive Medicare inpatient benefits. We also demonstrated a decrease in billable inpatient encounters under the new rules, which may be countered by changes in hospital and provider practice to drive more admissions over the 2‐midnight threshold to avoid financial losses. These changes should be defensible under audit given the ambiguities of the rule we found in this study surrounding time of day of admission, weekend and transfer hospitalizations, and the fact that common observation ICD‐9 codes are similar across LOS. Ironically, the unintended consequence of the new rule may be to drive up hospital LOS, reduce efficiency, and increase the overall cost of care.
Our findings suggest that CMS should define observation care per its original intent: as a means to determine if a patient can safely return home after a short period of additional care.[6] Patients whose conditions necessitate an intensity and level of service beyond this narrow scope should be classified as full inpatients irrespective of LOS, whether that LOS is <2 midnights or 2 midnights. Policies that fail to reflect the original intent of observation status are unlikely to achieve the intended outcome of defining 2 distinct patient populations that merit different services and reimbursement.
Acknowledgements
The authors thank Andrew LaRocque and Dan Dexter for their assistance with the data. Without their help, this article would not have been possible.
Disclosures: Dr. Graf reports receiving royalties from Smith & Nephew for patents he has assigned to them involving orthopedic implants. This is unrelated to the topic or content of this manuscript. The authors report no other conflicts of interest.
Editor's Note: On February 24, 2014, after this manuscript was published, CMS issued a rules clarification allowing midnights spent at a referral hospital prior to transfer to be counted in the cumulative 2 midnight tally to determine inpatient status.
- , , . Sharp rise in Medicare enrollees being held hospitals for observation raises concerns about causes and consequences. Health Aff (Millwood). 2012;31(6):1251–1259.
- MedPAC report to Congress: hospital inpatient and outpatient services. Available at: http://www.medpac.gov/chapters/Mar13_Ch03.pdf. Accessed September 29, 2013.
- , , , et al. Hospitalized but not admitted: characteristics of patients with “Observation Status” at an academic medical center. JAMA Intern Med. 2013;173(21):1991–1998.
- Centers for Medicare and Medicaid Services inpatient prospective payment system 1599‐F. Fiscal year 2014 final rule. Available at: http://www.gpo.gov/fdsys/pkg/FR‐2013‐08‐19/pdf/2013–18956.pdf. Accessed December 22, 2013.
- McKesson Interqual. Available at: http://www.mckesson.com/en_us/McKesson.com/Payers/Decision%2BManagement/InterQual%2BEvidence‐Based%2BClinical%2BContent/InterQual%2BEvidence‐Based%2BClinical%2BContent.html. Accessed October 3, 2013.
- Medicare benefit policy manual. Chapter 6. Hospital services covered under Part B. Available at: https://www.cms.gov/transmittals/downloads/R42BP.pdf. Accessed December 22, 2013.
- . Thinking of admitting this patient? Think again: how observation care is complicating life for you (and your patients). Today's Hospitalist. Available at: http://www.todayshospitalist.com/index.php?b=articles_read173(21):2004–2006.
- Kaiser Health News. HHS Inspector General scrutinizes Medicare observation care policy. Available at: http://www.kaiserhealthnews.org/stories/2013/july/30/ig‐report‐observation‐care.aspx. Accessed October 3, 2013.
© 2014 Society of Hospital Medicine

Hospital Readmissions in End of Life
The need to improve end‐of‐life care is well recognized. Its quality is often poor, and its cost is enormous, with 30% of the Medicare expenditures used for medical treatments of the 6% of beneficiaries who die each year.[1, 2] Repeated hospitalizations are frequent toward the end of life,[3] where each admission should be viewed as an opportunity to initiate advance care planning to improve end‐of‐life care and possibly reduce future unnecessary readmissions.[4, 5] Identified problems include undertreatment of pain, lack of awareness of patient wishes or advance directives, and unwanted overtreatment.
To improve quality and reduce unnecessary hospital use near the end of life, there is an urgent need to help healthcare providers to better identify the most vulnerable and at‐risk patients to provide them with care coordination and supportive care services. We aimed to identify the risk factors for having a 30‐day potentially avoidable readmission (PAR) due to end‐of‐life care issues.
METHODS
Study Design and Population
A nested case‐control study was designed where potentially avoidable end‐of‐life readmissions were compared to nonreadmitted controls. We collected data on all consecutive adult patient admissions to any medical services of the Brigham and Women's Hospital with a discharge date between July 1, 2009 and June 30, 2010. Brigham and Women's Hospital is a 780‐bed academic medical center in Boston, Massachusetts. To avoid observation stays, only admissions with a length of stay of more than 1 day were included. We excluded patients who died before discharge, were transferred to another acute care hospital, and those who left against medical advice. We also excluded patients with no available data on medication treatment at discharge. The protocol was approved by the institutional review board of Brigham and Women's Hospital/Partners Healthcare.
Study Outcome
The study outcome was any 30‐day PAR due to end‐of‐life issues. To determine this outcome, first we identified all 30‐day readmissions to any service of 3 hospitals within the Partners network in Boston that followed the index hospitalization (prior studies have shown that these hospitals capture approximately 80% of readmissions after a Brigham and Women's Hospital medical hospitalization).[6, 7] These readmissions were subsequently differentiated as potentially avoidable or not using a validated algorithm (SQLape; SQLape, Corseaux, Switzerland).[8, 9] This algorithm uses administrative data and International Classification of Diseases, 9th Revision, Clinical Modification codes from the index and repeat hospitalization. Readmissions were considered potentially avoidable if they were: (1) readmissions related to previously known conditions during the index hospitalization, or (2) complications of treatment (eg, deep vein thrombosis, drug‐induced disorders). Conversely, readmissions were considered unavoidable if they were: (1) foreseen (such as readmissions for transplantation, delivery, chemo‐ or radiotherapy, and other specific surgical procedures), (2) follow‐up and rehabilitation treatments, or (3) readmissions for a new condition unknown during the preceding hospitalization. The algorithm has both a sensitivity and specificity of 96% compared with medical record review using the same criteria. Finally, a random sample of the 30‐day PARs was reviewed independently by 9 trained senior resident physicians to identify those due to end‐of‐life issues, defined by the following 2 criteria: (1) patient has a terminal clinical condition, such as malignancy, end stage renal disease, end stage congestive heart failure, or other condition with a life expectancy of 6 months or less; and (2) the readmission is part of the terminal disease process that was not adequately addressed during the index hospitalization. Examples of factors that were used when identifying cases included lack of healthcare proxy and lack of documentation of why end‐of‐life discussions did not take place during the index hospitalization. Training of adjudicators included a didactic session and review of standardized cases.
Risk Factors
We collected candidate risk factors based on a priori knowledge and according to the medical literature,[10, 11, 12] including demographic information, previous healthcare utilization, and index hospitalization characteristics from administrative data sources; procedures and chronic medical conditions from billing data; last laboratory values and medication information prior to discharge from the electronic medical record (Table 1). When laboratory values were missing (<1%), values were considered as normal.
| Characteristics | No 30‐Day Readmission, n=7,974 | 30‐Day PAR due to End of Life, n=80 | P Value |
|---|---|---|---|
| |||
| Age, y, mean (SD) | 61.5 (16.6) | 60.8 (11.9) | 0.69 |
| Male sex, n (%) | 3875 (48.6) | 37 (46.3) | 0.69 |
| Ethnicity, n (%) | 0.05 | ||
| Non‐Hispanic white* | 5772 (72.4) | 69 (86.3) | |
| Non‐Hispanic black | 1281 (16.1) | 4 (5.0) | |
| Hispanic | 666 (8.4) | 5 (6.3) | |
| Other | 255 (3.2) | 2 (2.5) | |
| Language, n (%) | 0.99 | ||
| English* | 7254 (91.0) | 73 (91.3) | |
| Spanish | 415 (5.2) | 4 (5.0) | |
| Other | 305 (3.8) | 3 (3.8) | |
| Marital status, n (%) | 0.37 | ||
| Currently married or partner* | 4107 (51.35) | 46 (57.5) | |
| Single/never married | 1967 (24.7) | 14 (17.5) | |
| Separated/divorced/widowed/no answer | 1900 (23.8) | 20 (25.0) | |
| Source of index admission, n (%) | 0.10 | ||
| Direct from home/outpatient clinic | 2456 (30.8) | 33 (41.3) | |
| Emergency department* | 4222 (53.0) | 34 (42.5) | |
| Nursing home/rehabilitation/other hospital | 1296 (16.3) | 13 (16.3) | |
| Length of stay of the index admission, median (IQR) | 4 (27) | 5.5 (38] | 0.13 |
| No. of hospital admissions in the past year, median (IQR) | 1 (02) | 2 (03) | <0.001 |
| Any procedure during the hospital stay, n (%) | 4809 (60.3) | 57 (71.3) | 0.05 |
| Identified caregiver at discharge | 7300 (91.6) | 76 (95.0) | 0.27 |
| No. of medications at discharge, mean (SD) | 10.6 (5.1) | 13.0 (5.0) | <0.001 |
| No. of opiate medication at discharge | <0.001 | ||
| 0 | 5297 (66.4) | 21 (26.3) | |
| 1 | 2677 (33.2) | 59 (73.8) | |
| Elixhauser, median (IQR) | 8 (215) | 23 (1442) | <0.001 |
| Selected comorbidities, n (%) | |||
| Diabetes mellitus | 1971 (24.7) | 20 (25.0) | 0.96 |
| Heart failure | 1756 (22.0) | 11 (13.8) | 0.10 |
| Atrial fibrillation | 1439 (18.1) | 10 (12.5) | 0.20 |
| COPD | 816 (10.2) | 7 (8.8) | 0.66 |
| Neoplasm | 2705 (33.9) | 69 (86.3) | <0.001 |
| Stroke | 294 (3.7) | 2 (2.5) | 0.57 |
| ESRD | 1258 (15.8) | 6 (7.5) | 0.04 |
| Liver disease | 328 (4.1) | 2 (2.5) | 0.47 |
Statistical Analysis
We first conducted a bivariate analysis on all collected potential risk factors, comparing admissions followed by a 30‐day PAR due to end‐of‐life care issues with admissions not followed by any 30‐day readmission, using the Pearson [2] test for categorical variables and Student t test for continuous variables. Then, we performed a multivariable logistic regression restricted to the variables that were found significantly associated with the outcome in the bivariate analysis. Age and Elixhauser comorbidity index were forced into the model as important potential confounders. Because a patient could have several outcomes over the study period, we used general estimating equations to cluster at the patient level. All tests were conducted as 2‐sided at a 0.05 level of significance. Analyses were performed using the SAS system for Windows, version 9.3 (SAS Institute Inc., Cary, NC).
RESULTS
From the total of 12,383 patients who were discharged from the medical services of the Brigham and Women's Hospital during the study period, 2108 (17.0%) were excluded because of: (1) death before discharge, (2) transfer to another acute care hospital, (3) discharge against medical advice, or (4) missing data (Figure 1). Among the 10,275 eligible admissions, 22.3% (n=2301) were followed by a 30‐day readmission. Of these, 826 (8.0% of all admissions) were identified as potentially avoidable. Among a random sample of 534 PARs, 80 (15.0%) were related to end‐of‐life care issues (cases). Of note, only 16 (20%) of these patients received palliative care consultation during the index hospitalization. A total of 7974 discharges were not followed by any 30‐day readmission (controls).
Baseline characteristics are presented in Table 1. Among the combined cohort of cases plus controls, the patient's mean age at inclusion was 61.3 years, and about half were male. In bivariate analysis, demographics such as age and sex were similar between cases and controls. Cases had more hospitalizations in the previous year, a higher number of medications at discharge, and a higher Elixhauser comorbidity index. When looking at diseases more specifically, neoplasm was significantly associated with potentially avoidable 30‐day readmission due to end‐of‐life care issues. In contrast, end‐stage renal disease was associated with a significantly lower risk of 30‐day PAR due to end‐of‐life care issues.
In multivariate analysis, 4 factors remained significantly associated with 30‐day PAR due to end‐of‐life care issues (Table 2). Neoplasm was the strongest risk factor, with an odds ratio of 5.6 (95% confidence interval: 2.8511.0), followed by opiate medication use, Elixhauser score, and number of admissions in the previous 12 months.
| Variable | Odds Ratio (95% CI) |
|---|---|
| |
| Age, per 10 years | 1.04 (0.911.19) |
| No. of admissions in the previous 12 months, per admission | 1.10 (1.021.20)a |
| Total no. of medications at discharge, per medication | 1.04 (1.001.10) |
| Neoplasm | 5.60 (2.8511.0)a |
| Endstage renal disease | 0.60 (0.251.42) |
| Opiate medication at discharge | 2.29 (1.294.07)a |
| Elixhauser, per 5 unit increase | 1.16 (1.101.22)a |
The model, including all 4 variables, had an excellent discrimination power, with a C statistic of 0.85. Without the Elixhauser score, the C statistic remained very high, with a value of 0.82.
DISCUSSION
In a large medical population, potentially avoidable readmissions due to end‐of‐life care issues were not uncommon: 15% of all potentially avoidable readmissions (1.2% of all discharges). We identified 4 main risk factors for having a 30‐day potentially avoidable readmission due to end‐of‐life care issues: neoplasm, opiate use, Elixhauser comorbidity index, and number of admissions in the previous year. In a model that includes these 4 variables, the discrimination was very high with a C statistic of 0.85.
This study extends prior work indicating some risk factors for the need for palliative care. Neoplasm has been logically identified as a criterion for palliative care assessment at the time of admission.[13] Patients with neoplasm are not only at overall high risk for readmission,[14, 15, 16] but they obviously represent a fragile population whose condition is often terminal. Our results suggest that still more attention may be necessary to reduce the risk of readmission due to end‐of‐life care issues in this population (for example, only 20% of cases in our study received palliative care consultation during the index hospitalization). The overall comorbidity measured by the Elixhauser index was not surprisingly a significant risk factor. It probably accounts for the burden of comorbidities, but also for other advanced diseases besides neoplasm, like heart failure, chronic obstructive pulmonary disease, and others that may also be terminal. The number of previous hospital admissions in the past year is also an important risk factor, not only for the general population,[10, 11, 14, 17, 18] but also for patients with more advanced conditions,[19, 20, 21, 22] where admissions become more frequent as the disease progresses toward end stage. Opioid use was the final statistically significant risk factor, specific for this population, likely as a proxy for disease severity and progression toward terminal illness, especially in combination with the other risk factors such as cancer. Age was not a significant factor in either bivariate or multivariate analysis. Previous studies on the risk factors for readmission among patients receiving palliative care also failed to show age as a significant factor.[23, 24] Both of these studies looked at readmissions among patients who were already receiving palliative care. Our study asks a fundamentally different (and in many ways a more practical) question: who among a large population of medical patients might benefit from receiving input from palliative care in the first place. The number of medications at discharge was no longer significant in the multivariate analysis, likely due to its collinearity with the Elixhauser comorbidity index. An increased number of medications might be associated with a higher risk of adverse drug events and readmission, but they would not be necessarily considered to be end‐of‐life readmissions. Taken together, the 4 variables provide a very promising prediction model with high discrimination. To our knowledge, there is no previous existing list of risk factors for 30‐day potentially avoidable readmission due to end‐of‐life care issues, and no existing model to help prioritize palliative care to the most high‐risk patients. It is worth noting that the Elixhauser score might be difficult to calculate before the discharge of the patient (although hospitals with electronic capture of medical problem lists might be able to approximate it). However, even without the Elixhauser score, the C statistic remained very high at 0.82.
Our study has several limitations. Although we looked at readmissions at 2 other affiliated hospitals, some patients might have been readmitted to other acute care facilities outside our network. However, we would not expect the risk factors in these patients to be so different. The identification of end‐of‐life care issues by medical record review is based on a subjective judgment, although strict criteria were used. Furthermore, differentiation between potentially avoidable readmission and unavoidable readmission cannot be perfect. We used clear and logical criteria that were previously validated and allow large database management. Also, we did not analyze a comprehensive list of potential risk factors. It is probable that functional or cognitive status, for example, could also be important risk factors. We purposely chose a set of variables that could be easily obtained from administrative data sources. The small number of cases may have led to limited statistical power to identify less strongly associated risk factors. Last, the results may not be completely generalizable to small or community hospitals, in particular those that may care for less severely ill cancer patients.
Our findings have important implications. End‐of‐life care issues are not infrequent causes of readmission. Our study's findings could help prioritize palliative care resources to those patients at higher risk to improve the quality of end‐of‐life care. The risk factors identified in this study could be used informally by physicians at the bedside to identify such patients. In addition, a hospital could use these factors to provide a second‐level screen, beyond clinician recognition, to assist palliative care teams to identify patients who may not have otherwise been referred. This screen could be automated, for example, by using a list of medical problems from an electronic medical record to approximate an Elixhauser comorbidity score, or even leaving comorbidities out and simply relying on the other 3 easily identifiable risk factors. Such efforts could have a substantial effect on improving care near the end of life and potentially reducing unnecessary hospitalizations.
Acknowledgements
The authors thank Yves Eggli for having screened the database for potentially avoidable readmission using the algorithm SQLape.
Disclosures: Dr. Donz was supported by the Swiss National Science Foundation and the Swiss Foundation for MedicalBiological Scholarships. The Swiss Science National Foundation and the Swiss Foundation for MedicalBiological Scholarships had no role in the design and conduct of this study, the analysis or interpretation of the data, or the preparation of this manuscript. Dr. Schnipper is a consultant to QuantiaMD, for which he has helped create online educational materials for both providers and patients regarding patient safety, including medication safety during transitions in care. The findings of this study are not a part of those materials. Dr. Schnipper has received grant funding from Sanofi‐Aventis for an investigator‐initiated study to design and evaluate an intensive discharge and follow‐up intervention in patients with diabetes. The funder had had no role in the design of the study.
- , , , . Medicare beneficiaries' costs of care in the last year of life. Health Aff (Millwood). 2001;20(4):188–195.
- , , . Quality of End‐of‐Life Cancer Care for Medicare Beneficiaries: Regional and Hospital‐Specific Analyses. Lebanon, NH: The Dartmouth Institute for Health Policy and Clinical Practice; 2010.
- , , . Repeated hospitalizations predict mortality in the community population with heart failure. Am Heart J. 2007;154(2):260–266.
- . Perspectives on care at the close of life. Initiating end‐of‐life discussions with seriously ill patients: addressing the “elephant in the room.” JAMA. 2000;284(19):2502–2507.
- , , , . Advance care planning as a process: structuring the discussions in practice. J Am Geriatr Soc. 1995;43(4):440–446.
- , , , et al. Rationale and design of the Pharmacist Intervention for Low Literacy in Cardiovascular Disease (PILL‐CVD) study. Circ Cardiovasc Qual Outcomes. 2010;3(2):212–219.
- , , , et al. Effect of a pharmacist intervention on clinically important medication errors after hospital discharge: a randomized trial. Ann Intern Med. 2012;157(1):1–10.
- , , , , , . Measuring potentially avoidable hospital readmissions. J Clin Epidemiol. 2002;55(6):573–587.
- , , , , , . Validation of the potentially avoidable hospital readmission rate as a routine indicator of the quality of hospital care. Med Care. 2006;44(11):972–981.
- , , , et al. Hospital readmission in general medicine patients: a prediction model. J Gen Intern Med. 2010;25(3):211–219.
- , , , , , . Screening elders for risk of hospital admission. J Am Geriatr Soc. 1993;41(8):811–817.
- , , , , . Risk factors for 30‐day hospital readmission in patients ≥65 years of age. Proc (Bayl Univ Med Cent). 2008;21(4):363–372.
- , . Identifying patients in need of a palliative care assessment in the hospital setting: a consensus report from the Center to Advance Palliative Care. J Palliat Med. 2011;14(1):17–23.
- , , , . Potentially avoidable 30‐day hospital readmissions in medical patients: derivation and validation of a prediction model. JAMA Intern Med. 2013;173(8):632–638.
- , , , . Redefining readmission risk factors for general medicine patients. J Hosp Med. 2011;6(2):54–60.
- , , . Patient and disease profile of emergency medical readmissions to an Irish teaching hospital. Postgrad Med J. 2004;80(946):470–474.
- , , , . Posthospital care transitions: patterns, complications, and risk identification. Health Serv Res. 2004;39(5):1449–1465.
- , . Factors predicting readmission of older general medicine patients. J Gen Intern Med. 1991;6(5):389–393.
- , , , , . Differences in health care utilization at the end of life among patients with chronic obstructive pulmonary disease and patients with lung cancer. Arch Intern Med. 2006;166(3):326–331.
- , , , , . Frequent hospital readmissions for acute exacerbation of COPD and their associated factors. Respirology. 2006;11(2):188–195.
- , , , et al. Consensus statement: Palliative and supportive care in advanced heart failure. J Card Fail. 2004;10(3):200–209.
- , , , , . Unplanned discharges from a surgical intensive care unit: readmissions and mortality. J Crit Care. 2010;25(3):375–381.
- , , , , . Evaluating causes for unplanned hospital readmissions of palliative care patients. Am J Hosp Palliat Care. 2010;27(8):526–531.
- , , . 30‐day readmissions among seriously ill older adults. J Palliat Med. 2012;15(12):1356–1361.
The need to improve end‐of‐life care is well recognized. Its quality is often poor, and its cost is enormous, with 30% of the Medicare expenditures used for medical treatments of the 6% of beneficiaries who die each year.[1, 2] Repeated hospitalizations are frequent toward the end of life,[3] where each admission should be viewed as an opportunity to initiate advance care planning to improve end‐of‐life care and possibly reduce future unnecessary readmissions.[4, 5] Identified problems include undertreatment of pain, lack of awareness of patient wishes or advance directives, and unwanted overtreatment.
To improve quality and reduce unnecessary hospital use near the end of life, there is an urgent need to help healthcare providers to better identify the most vulnerable and at‐risk patients to provide them with care coordination and supportive care services. We aimed to identify the risk factors for having a 30‐day potentially avoidable readmission (PAR) due to end‐of‐life care issues.
METHODS
Study Design and Population
A nested case‐control study was designed where potentially avoidable end‐of‐life readmissions were compared to nonreadmitted controls. We collected data on all consecutive adult patient admissions to any medical services of the Brigham and Women's Hospital with a discharge date between July 1, 2009 and June 30, 2010. Brigham and Women's Hospital is a 780‐bed academic medical center in Boston, Massachusetts. To avoid observation stays, only admissions with a length of stay of more than 1 day were included. We excluded patients who died before discharge, were transferred to another acute care hospital, and those who left against medical advice. We also excluded patients with no available data on medication treatment at discharge. The protocol was approved by the institutional review board of Brigham and Women's Hospital/Partners Healthcare.
Study Outcome
The study outcome was any 30‐day PAR due to end‐of‐life issues. To determine this outcome, first we identified all 30‐day readmissions to any service of 3 hospitals within the Partners network in Boston that followed the index hospitalization (prior studies have shown that these hospitals capture approximately 80% of readmissions after a Brigham and Women's Hospital medical hospitalization).[6, 7] These readmissions were subsequently differentiated as potentially avoidable or not using a validated algorithm (SQLape; SQLape, Corseaux, Switzerland).[8, 9] This algorithm uses administrative data and International Classification of Diseases, 9th Revision, Clinical Modification codes from the index and repeat hospitalization. Readmissions were considered potentially avoidable if they were: (1) readmissions related to previously known conditions during the index hospitalization, or (2) complications of treatment (eg, deep vein thrombosis, drug‐induced disorders). Conversely, readmissions were considered unavoidable if they were: (1) foreseen (such as readmissions for transplantation, delivery, chemo‐ or radiotherapy, and other specific surgical procedures), (2) follow‐up and rehabilitation treatments, or (3) readmissions for a new condition unknown during the preceding hospitalization. The algorithm has both a sensitivity and specificity of 96% compared with medical record review using the same criteria. Finally, a random sample of the 30‐day PARs was reviewed independently by 9 trained senior resident physicians to identify those due to end‐of‐life issues, defined by the following 2 criteria: (1) patient has a terminal clinical condition, such as malignancy, end stage renal disease, end stage congestive heart failure, or other condition with a life expectancy of 6 months or less; and (2) the readmission is part of the terminal disease process that was not adequately addressed during the index hospitalization. Examples of factors that were used when identifying cases included lack of healthcare proxy and lack of documentation of why end‐of‐life discussions did not take place during the index hospitalization. Training of adjudicators included a didactic session and review of standardized cases.
Risk Factors
We collected candidate risk factors based on a priori knowledge and according to the medical literature,[10, 11, 12] including demographic information, previous healthcare utilization, and index hospitalization characteristics from administrative data sources; procedures and chronic medical conditions from billing data; last laboratory values and medication information prior to discharge from the electronic medical record (Table 1). When laboratory values were missing (<1%), values were considered as normal.
| Characteristics | No 30‐Day Readmission, n=7,974 | 30‐Day PAR due to End of Life, n=80 | P Value |
|---|---|---|---|
| |||
| Age, y, mean (SD) | 61.5 (16.6) | 60.8 (11.9) | 0.69 |
| Male sex, n (%) | 3875 (48.6) | 37 (46.3) | 0.69 |
| Ethnicity, n (%) | 0.05 | ||
| Non‐Hispanic white* | 5772 (72.4) | 69 (86.3) | |
| Non‐Hispanic black | 1281 (16.1) | 4 (5.0) | |
| Hispanic | 666 (8.4) | 5 (6.3) | |
| Other | 255 (3.2) | 2 (2.5) | |
| Language, n (%) | 0.99 | ||
| English* | 7254 (91.0) | 73 (91.3) | |
| Spanish | 415 (5.2) | 4 (5.0) | |
| Other | 305 (3.8) | 3 (3.8) | |
| Marital status, n (%) | 0.37 | ||
| Currently married or partner* | 4107 (51.35) | 46 (57.5) | |
| Single/never married | 1967 (24.7) | 14 (17.5) | |
| Separated/divorced/widowed/no answer | 1900 (23.8) | 20 (25.0) | |
| Source of index admission, n (%) | 0.10 | ||
| Direct from home/outpatient clinic | 2456 (30.8) | 33 (41.3) | |
| Emergency department* | 4222 (53.0) | 34 (42.5) | |
| Nursing home/rehabilitation/other hospital | 1296 (16.3) | 13 (16.3) | |
| Length of stay of the index admission, median (IQR) | 4 (27) | 5.5 (38] | 0.13 |
| No. of hospital admissions in the past year, median (IQR) | 1 (02) | 2 (03) | <0.001 |
| Any procedure during the hospital stay, n (%) | 4809 (60.3) | 57 (71.3) | 0.05 |
| Identified caregiver at discharge | 7300 (91.6) | 76 (95.0) | 0.27 |
| No. of medications at discharge, mean (SD) | 10.6 (5.1) | 13.0 (5.0) | <0.001 |
| No. of opiate medication at discharge | <0.001 | ||
| 0 | 5297 (66.4) | 21 (26.3) | |
| 1 | 2677 (33.2) | 59 (73.8) | |
| Elixhauser, median (IQR) | 8 (215) | 23 (1442) | <0.001 |
| Selected comorbidities, n (%) | |||
| Diabetes mellitus | 1971 (24.7) | 20 (25.0) | 0.96 |
| Heart failure | 1756 (22.0) | 11 (13.8) | 0.10 |
| Atrial fibrillation | 1439 (18.1) | 10 (12.5) | 0.20 |
| COPD | 816 (10.2) | 7 (8.8) | 0.66 |
| Neoplasm | 2705 (33.9) | 69 (86.3) | <0.001 |
| Stroke | 294 (3.7) | 2 (2.5) | 0.57 |
| ESRD | 1258 (15.8) | 6 (7.5) | 0.04 |
| Liver disease | 328 (4.1) | 2 (2.5) | 0.47 |
Statistical Analysis
We first conducted a bivariate analysis on all collected potential risk factors, comparing admissions followed by a 30‐day PAR due to end‐of‐life care issues with admissions not followed by any 30‐day readmission, using the Pearson [2] test for categorical variables and Student t test for continuous variables. Then, we performed a multivariable logistic regression restricted to the variables that were found significantly associated with the outcome in the bivariate analysis. Age and Elixhauser comorbidity index were forced into the model as important potential confounders. Because a patient could have several outcomes over the study period, we used general estimating equations to cluster at the patient level. All tests were conducted as 2‐sided at a 0.05 level of significance. Analyses were performed using the SAS system for Windows, version 9.3 (SAS Institute Inc., Cary, NC).
RESULTS
From the total of 12,383 patients who were discharged from the medical services of the Brigham and Women's Hospital during the study period, 2108 (17.0%) were excluded because of: (1) death before discharge, (2) transfer to another acute care hospital, (3) discharge against medical advice, or (4) missing data (Figure 1). Among the 10,275 eligible admissions, 22.3% (n=2301) were followed by a 30‐day readmission. Of these, 826 (8.0% of all admissions) were identified as potentially avoidable. Among a random sample of 534 PARs, 80 (15.0%) were related to end‐of‐life care issues (cases). Of note, only 16 (20%) of these patients received palliative care consultation during the index hospitalization. A total of 7974 discharges were not followed by any 30‐day readmission (controls).
Baseline characteristics are presented in Table 1. Among the combined cohort of cases plus controls, the patient's mean age at inclusion was 61.3 years, and about half were male. In bivariate analysis, demographics such as age and sex were similar between cases and controls. Cases had more hospitalizations in the previous year, a higher number of medications at discharge, and a higher Elixhauser comorbidity index. When looking at diseases more specifically, neoplasm was significantly associated with potentially avoidable 30‐day readmission due to end‐of‐life care issues. In contrast, end‐stage renal disease was associated with a significantly lower risk of 30‐day PAR due to end‐of‐life care issues.
In multivariate analysis, 4 factors remained significantly associated with 30‐day PAR due to end‐of‐life care issues (Table 2). Neoplasm was the strongest risk factor, with an odds ratio of 5.6 (95% confidence interval: 2.8511.0), followed by opiate medication use, Elixhauser score, and number of admissions in the previous 12 months.
| Variable | Odds Ratio (95% CI) |
|---|---|
| |
| Age, per 10 years | 1.04 (0.911.19) |
| No. of admissions in the previous 12 months, per admission | 1.10 (1.021.20)a |
| Total no. of medications at discharge, per medication | 1.04 (1.001.10) |
| Neoplasm | 5.60 (2.8511.0)a |
| Endstage renal disease | 0.60 (0.251.42) |
| Opiate medication at discharge | 2.29 (1.294.07)a |
| Elixhauser, per 5 unit increase | 1.16 (1.101.22)a |
The model, including all 4 variables, had an excellent discrimination power, with a C statistic of 0.85. Without the Elixhauser score, the C statistic remained very high, with a value of 0.82.
DISCUSSION
In a large medical population, potentially avoidable readmissions due to end‐of‐life care issues were not uncommon: 15% of all potentially avoidable readmissions (1.2% of all discharges). We identified 4 main risk factors for having a 30‐day potentially avoidable readmission due to end‐of‐life care issues: neoplasm, opiate use, Elixhauser comorbidity index, and number of admissions in the previous year. In a model that includes these 4 variables, the discrimination was very high with a C statistic of 0.85.
This study extends prior work indicating some risk factors for the need for palliative care. Neoplasm has been logically identified as a criterion for palliative care assessment at the time of admission.[13] Patients with neoplasm are not only at overall high risk for readmission,[14, 15, 16] but they obviously represent a fragile population whose condition is often terminal. Our results suggest that still more attention may be necessary to reduce the risk of readmission due to end‐of‐life care issues in this population (for example, only 20% of cases in our study received palliative care consultation during the index hospitalization). The overall comorbidity measured by the Elixhauser index was not surprisingly a significant risk factor. It probably accounts for the burden of comorbidities, but also for other advanced diseases besides neoplasm, like heart failure, chronic obstructive pulmonary disease, and others that may also be terminal. The number of previous hospital admissions in the past year is also an important risk factor, not only for the general population,[10, 11, 14, 17, 18] but also for patients with more advanced conditions,[19, 20, 21, 22] where admissions become more frequent as the disease progresses toward end stage. Opioid use was the final statistically significant risk factor, specific for this population, likely as a proxy for disease severity and progression toward terminal illness, especially in combination with the other risk factors such as cancer. Age was not a significant factor in either bivariate or multivariate analysis. Previous studies on the risk factors for readmission among patients receiving palliative care also failed to show age as a significant factor.[23, 24] Both of these studies looked at readmissions among patients who were already receiving palliative care. Our study asks a fundamentally different (and in many ways a more practical) question: who among a large population of medical patients might benefit from receiving input from palliative care in the first place. The number of medications at discharge was no longer significant in the multivariate analysis, likely due to its collinearity with the Elixhauser comorbidity index. An increased number of medications might be associated with a higher risk of adverse drug events and readmission, but they would not be necessarily considered to be end‐of‐life readmissions. Taken together, the 4 variables provide a very promising prediction model with high discrimination. To our knowledge, there is no previous existing list of risk factors for 30‐day potentially avoidable readmission due to end‐of‐life care issues, and no existing model to help prioritize palliative care to the most high‐risk patients. It is worth noting that the Elixhauser score might be difficult to calculate before the discharge of the patient (although hospitals with electronic capture of medical problem lists might be able to approximate it). However, even without the Elixhauser score, the C statistic remained very high at 0.82.
Our study has several limitations. Although we looked at readmissions at 2 other affiliated hospitals, some patients might have been readmitted to other acute care facilities outside our network. However, we would not expect the risk factors in these patients to be so different. The identification of end‐of‐life care issues by medical record review is based on a subjective judgment, although strict criteria were used. Furthermore, differentiation between potentially avoidable readmission and unavoidable readmission cannot be perfect. We used clear and logical criteria that were previously validated and allow large database management. Also, we did not analyze a comprehensive list of potential risk factors. It is probable that functional or cognitive status, for example, could also be important risk factors. We purposely chose a set of variables that could be easily obtained from administrative data sources. The small number of cases may have led to limited statistical power to identify less strongly associated risk factors. Last, the results may not be completely generalizable to small or community hospitals, in particular those that may care for less severely ill cancer patients.
Our findings have important implications. End‐of‐life care issues are not infrequent causes of readmission. Our study's findings could help prioritize palliative care resources to those patients at higher risk to improve the quality of end‐of‐life care. The risk factors identified in this study could be used informally by physicians at the bedside to identify such patients. In addition, a hospital could use these factors to provide a second‐level screen, beyond clinician recognition, to assist palliative care teams to identify patients who may not have otherwise been referred. This screen could be automated, for example, by using a list of medical problems from an electronic medical record to approximate an Elixhauser comorbidity score, or even leaving comorbidities out and simply relying on the other 3 easily identifiable risk factors. Such efforts could have a substantial effect on improving care near the end of life and potentially reducing unnecessary hospitalizations.
Acknowledgements
The authors thank Yves Eggli for having screened the database for potentially avoidable readmission using the algorithm SQLape.
Disclosures: Dr. Donz was supported by the Swiss National Science Foundation and the Swiss Foundation for MedicalBiological Scholarships. The Swiss Science National Foundation and the Swiss Foundation for MedicalBiological Scholarships had no role in the design and conduct of this study, the analysis or interpretation of the data, or the preparation of this manuscript. Dr. Schnipper is a consultant to QuantiaMD, for which he has helped create online educational materials for both providers and patients regarding patient safety, including medication safety during transitions in care. The findings of this study are not a part of those materials. Dr. Schnipper has received grant funding from Sanofi‐Aventis for an investigator‐initiated study to design and evaluate an intensive discharge and follow‐up intervention in patients with diabetes. The funder had had no role in the design of the study.
- , , , . Medicare beneficiaries' costs of care in the last year of life. Health Aff (Millwood). 2001;20(4):188–195.
- , , . Quality of End‐of‐Life Cancer Care for Medicare Beneficiaries: Regional and Hospital‐Specific Analyses. Lebanon, NH: The Dartmouth Institute for Health Policy and Clinical Practice; 2010.
- , , . Repeated hospitalizations predict mortality in the community population with heart failure. Am Heart J. 2007;154(2):260–266.
- . Perspectives on care at the close of life. Initiating end‐of‐life discussions with seriously ill patients: addressing the “elephant in the room.” JAMA. 2000;284(19):2502–2507.
- , , , . Advance care planning as a process: structuring the discussions in practice. J Am Geriatr Soc. 1995;43(4):440–446.
- , , , et al. Rationale and design of the Pharmacist Intervention for Low Literacy in Cardiovascular Disease (PILL‐CVD) study. Circ Cardiovasc Qual Outcomes. 2010;3(2):212–219.
- , , , et al. Effect of a pharmacist intervention on clinically important medication errors after hospital discharge: a randomized trial. Ann Intern Med. 2012;157(1):1–10.
- , , , , , . Measuring potentially avoidable hospital readmissions. J Clin Epidemiol. 2002;55(6):573–587.
- , , , , , . Validation of the potentially avoidable hospital readmission rate as a routine indicator of the quality of hospital care. Med Care. 2006;44(11):972–981.
- , , , et al. Hospital readmission in general medicine patients: a prediction model. J Gen Intern Med. 2010;25(3):211–219.
- , , , , , . Screening elders for risk of hospital admission. J Am Geriatr Soc. 1993;41(8):811–817.
- , , , , . Risk factors for 30‐day hospital readmission in patients ≥65 years of age. Proc (Bayl Univ Med Cent). 2008;21(4):363–372.
- , . Identifying patients in need of a palliative care assessment in the hospital setting: a consensus report from the Center to Advance Palliative Care. J Palliat Med. 2011;14(1):17–23.
- , , , . Potentially avoidable 30‐day hospital readmissions in medical patients: derivation and validation of a prediction model. JAMA Intern Med. 2013;173(8):632–638.
- , , , . Redefining readmission risk factors for general medicine patients. J Hosp Med. 2011;6(2):54–60.
- , , . Patient and disease profile of emergency medical readmissions to an Irish teaching hospital. Postgrad Med J. 2004;80(946):470–474.
- , , , . Posthospital care transitions: patterns, complications, and risk identification. Health Serv Res. 2004;39(5):1449–1465.
- , . Factors predicting readmission of older general medicine patients. J Gen Intern Med. 1991;6(5):389–393.
- , , , , . Differences in health care utilization at the end of life among patients with chronic obstructive pulmonary disease and patients with lung cancer. Arch Intern Med. 2006;166(3):326–331.
- , , , , . Frequent hospital readmissions for acute exacerbation of COPD and their associated factors. Respirology. 2006;11(2):188–195.
- , , , et al. Consensus statement: Palliative and supportive care in advanced heart failure. J Card Fail. 2004;10(3):200–209.
- , , , , . Unplanned discharges from a surgical intensive care unit: readmissions and mortality. J Crit Care. 2010;25(3):375–381.
- , , , , . Evaluating causes for unplanned hospital readmissions of palliative care patients. Am J Hosp Palliat Care. 2010;27(8):526–531.
- , , . 30‐day readmissions among seriously ill older adults. J Palliat Med. 2012;15(12):1356–1361.
© 2014 Society of Hospital Medicine

On the Go Education: Mobile software in cardiothoracic training
In nearly every facet of our lives, our mobile devices have taken over. Managing our calendars, organizing our contacts, and planning our driving directions -- our devices have become invaluable and ubiquitously present. While the ease of use of smartphones and tablets puts the power of portable computing in the hands of everyone, mobile software seems to be particularly appreciated by young professionals, who seek the convenience of on-the-go functionality and feel comfortable with computing in the palms of their hands. Throughout the world of education and a breadth of academic fields, advanced software programs have gained momentum, recognized for their ability to provide up-to-date, on-the-ground information.
In recent years, there has been an explosion of new software programs applicable to the field of cardiothoracic surgery, and these applications have been well received by modern trainees.

"Mobile apps are incredibly convenient because they provide a means of accessing information while on the go," states Jonathan Spicer, a thoracic trainee at M.D. Anderson Cancer Center in Houston.
He continues, "Having the capacity to look up helpful information from my phone while in the operating room, on the ward, or in transit is particularly helpful."
In this article, we aim to highlight some of the more exciting and innovative mobile software programs available today for those interested in expanding their knowledge in cardiothoracic surgery or looking for an easy-to-access resource.
iBronch (Edward Bender), $0.99: iBronch is one of the many outstanding thoracic surgical apps developed by Ed Bender. This program aims to guide learners through the basic anatomy of the trachea and bronchial tree, with correlation of simultaneous images from a fiberoptic bronchoscope and along an anatomic airway diagram. Branches of the pulmonary tree are labeled on the schematic and the bronchoscopy images. This app is particularly useful for those trainees gaining comfort with bronchoscopic procedures; however, its utility may be less significant for more advanced learners. Regardless, this is a great program, quite helpful for the intended audience.
Thoracic Lymph Node Map (RADIOLOGiQ, LLC), Free: This app provides a color-coded lymph node map, associated with computed tomography images and adapted from the International Association for the Study of Lung Cancer (IASLC) lung cancer project. This program provides excellent illustrations of the anatomic definitions for each of the intrathoracic lymph node stations. This is helpful both in examining imaging studies of actual patients and in the operating room.
CT Journals (Edward Bender), Free: This software program serves as a scholarly journal aggregator for the field of cardiothoracic surgery. The app displays feeds for journals of interest, with inclusion of those relevant periodicals with the most readership and highest impact factors. Not only can one access the articles while online, abstracts can be saved for future use offline. This is a great resource, but users should be aware that access to the full articles is available only for those who have active accounts providing them access to the specific journals.
CTSNetWiki (Edward Bender), Free: Cardiothoracic Surgery Notes is an online review developed and maintained by residents in thoracic surgical training. This resource is a tremendous repository of information, compiling graphics, text, and other multimedia content on a breadth of topics. This app allows general review of a wide variety of cardiothoracic surgical problems and is appropriate for both the novice learner and as a review for those who are further along in their training.
SESATS IX (Edward Bender), Free: Perhaps the most valuable mobile software application out there, the Self Education Self Assessment in Thoracic Surgery (SESATS) IX application contains actual questions from previous versions of the SESATS. The mobile app even includes the associated images, videos, and CT scans that correspond with the questions. Although the program does not contain the latest version of SESATS, the utility of this app cannot be overestimated. This program is enormously helpful for self-testing, on-the-go topic-specific learning, and exam preparation. This is a real gem of a find, and it comes with a strong recommendation to all trainees for its download and use.
TSRA Primer of Cardiothoracic Surgery (Thoracic Surgery Residents' Association), $4.99: Produced by CT residents for CT residents, this is probably the most useful resource for the intern, junior resident, or new fellow who needs to brush up on the basics before rounds, in between consults, and before assisting in the OR. It's not comprehensive, but it is full of clinical pearls covering all the major divisions of cardiothoracic surgery. Many cardiac residents, especially younger integrated residents, have been waiting for a straightforward, practical tutorial like this for years. Beautiful and often interactive illustrations and videos really make this iBook memorable.
NCCN Guidelines (TIP Medical Communications), Free: Available for Android and iOS, this compendium of NCCN guidelines for 56 cancers and cancer-related topics is indispensible for trainees. The utility of having up-to-date, in-depth guidelines for diagnosis and staging of all commonly encountered malignancies cannot be overstated. Additional topics ranging from management of cancer-related emesis to lung cancer screening guidelines polish it off. A must have for anyone who treats cancer, not just thoracic surgeons.
CathSource (ECGSource, LLC), $3.99: Available for Android and iOS, CathSource is a mobile app that aims to teach cardiovascular medicine fellows about coronary anatomy, angiogram projections, and catheter-based hemodynamic measurements. Luckily, CT trainees stand to benefit from the app as well. It seems to be most helpful for learning coronary anatomy on the different projections, but it also has exhaustive hemodynamic formulae and tracings for more detailed review. The app has over 30 videos of normal and abnormal findings.
EchoSource (ECGSource, LLC), $4.99:It's the same idea as above, but -- you guessed it -- for echocardiography. Both are good tools, especially for residents who teach. Both apps take simple, conceptual drawings to start and expand them with real imaging. Residents who have spent a good deal of time in learning cath and echo may find these apps less useful.
Pocket Heart (PocketAnatomy), $9.99: This is an interactive, 3D heart model with a fairly detailed presentation of cardiac anatomy and added features such as pinning quizzes and case studies. While cardiothoracic residents ought to have the anatomy down, the app can be used to teach patients and families about various anatomical aspects of cardiac disease. The graphics leave a little to be desired, but anyone who teaches medical students or patients frequently will enjoy having this easy-to-understand tool handy.

This list of cardiothoracic-specific mobile applications is by no means exhaustive. Each physician's needs will be different, and the options are countless. Countless risk calculators, mnemonic databases, formula compendiums, and pharmacologic formularies clutter the app store. Note-taking suites such as OneNote and Evernote (personal favorite of both of the authors) can help turn the most hare-brained resident into a paragon of organizational excellence. Journal citation managers such as EndNote, Dropbox, Mendeley, and Yep can help organize and manage that virtual pile of unread but probably important journal articles that keeps building up in your inbox. Even the humble iBooks app can be used to read and mark up pdf files on the fly, all while syncing with your library on your home computer. Many hospital EMRs have mobile platforms with various levels of functionality for tablets and smartphones.
What is obvious is that mobile computing technology is rapidly changing medicine and surgery in many ways. Although each one of us strives to be a complete physician, utterly self-reliant and assured of one's clinical knowledge, we all must learn the basics first. Whether at the bus stop, in a resident lounge, or in the operating room, these mobile technologies help us to learn more efficiently while on the go.
If there are any gems we have forgotten to highlight, please send an e-mail to Thoracic Surgery News and we will try to present them in the future. We hope that the residents reading this column can find a new app they didn't know they needed, one that will energize them and push their learning to a new height. Just don't forget to look up once in a while.
Dr. Antonoff is a 2nd-year, Thoracic-track trainee at Washington University in St Louis. Dr. Zeigler is a 3rd-year, integrated Cardiothoracic Surgery trainee at Stanford (Calif.) University. They reported no relevant financial conflicts.
In nearly every facet of our lives, our mobile devices have taken over. Managing our calendars, organizing our contacts, and planning our driving directions -- our devices have become invaluable and ubiquitously present. While the ease of use of smartphones and tablets puts the power of portable computing in the hands of everyone, mobile software seems to be particularly appreciated by young professionals, who seek the convenience of on-the-go functionality and feel comfortable with computing in the palms of their hands. Throughout the world of education and a breadth of academic fields, advanced software programs have gained momentum, recognized for their ability to provide up-to-date, on-the-ground information.
In recent years, there has been an explosion of new software programs applicable to the field of cardiothoracic surgery, and these applications have been well received by modern trainees.
"Mobile apps are incredibly convenient because they provide a means of accessing information while on the go," states Jonathan Spicer, a thoracic trainee at M.D. Anderson Cancer Center in Houston.
He continues, "Having the capacity to look up helpful information from my phone while in the operating room, on the ward, or in transit is particularly helpful."
In this article, we aim to highlight some of the more exciting and innovative mobile software programs available today for those interested in expanding their knowledge in cardiothoracic surgery or looking for an easy-to-access resource.
iBronch (Edward Bender), $0.99: iBronch is one of the many outstanding thoracic surgical apps developed by Ed Bender. This program aims to guide learners through the basic anatomy of the trachea and bronchial tree, with correlation of simultaneous images from a fiberoptic bronchoscope and along an anatomic airway diagram. Branches of the pulmonary tree are labeled on the schematic and the bronchoscopy images. This app is particularly useful for those trainees gaining comfort with bronchoscopic procedures; however, its utility may be less significant for more advanced learners. Regardless, this is a great program, quite helpful for the intended audience.
Thoracic Lymph Node Map (RADIOLOGiQ, LLC), Free: This app provides a color-coded lymph node map, associated with computed tomography images and adapted from the International Association for the Study of Lung Cancer (IASLC) lung cancer project. This program provides excellent illustrations of the anatomic definitions for each of the intrathoracic lymph node stations. This is helpful both in examining imaging studies of actual patients and in the operating room.
CT Journals (Edward Bender), Free: This software program serves as a scholarly journal aggregator for the field of cardiothoracic surgery. The app displays feeds for journals of interest, with inclusion of those relevant periodicals with the most readership and highest impact factors. Not only can one access the articles while online, abstracts can be saved for future use offline. This is a great resource, but users should be aware that access to the full articles is available only for those who have active accounts providing them access to the specific journals.
CTSNetWiki (Edward Bender), Free: Cardiothoracic Surgery Notes is an online review developed and maintained by residents in thoracic surgical training. This resource is a tremendous repository of information, compiling graphics, text, and other multimedia content on a breadth of topics. This app allows general review of a wide variety of cardiothoracic surgical problems and is appropriate for both the novice learner and as a review for those who are further along in their training.
SESATS IX (Edward Bender), Free: Perhaps the most valuable mobile software application out there, the Self Education Self Assessment in Thoracic Surgery (SESATS) IX application contains actual questions from previous versions of the SESATS. The mobile app even includes the associated images, videos, and CT scans that correspond with the questions. Although the program does not contain the latest version of SESATS, the utility of this app cannot be overestimated. This program is enormously helpful for self-testing, on-the-go topic-specific learning, and exam preparation. This is a real gem of a find, and it comes with a strong recommendation to all trainees for its download and use.
TSRA Primer of Cardiothoracic Surgery (Thoracic Surgery Residents' Association), $4.99: Produced by CT residents for CT residents, this is probably the most useful resource for the intern, junior resident, or new fellow who needs to brush up on the basics before rounds, in between consults, and before assisting in the OR. It's not comprehensive, but it is full of clinical pearls covering all the major divisions of cardiothoracic surgery. Many cardiac residents, especially younger integrated residents, have been waiting for a straightforward, practical tutorial like this for years. Beautiful and often interactive illustrations and videos really make this iBook memorable.
NCCN Guidelines (TIP Medical Communications), Free: Available for Android and iOS, this compendium of NCCN guidelines for 56 cancers and cancer-related topics is indispensible for trainees. The utility of having up-to-date, in-depth guidelines for diagnosis and staging of all commonly encountered malignancies cannot be overstated. Additional topics ranging from management of cancer-related emesis to lung cancer screening guidelines polish it off. A must have for anyone who treats cancer, not just thoracic surgeons.
CathSource (ECGSource, LLC), $3.99: Available for Android and iOS, CathSource is a mobile app that aims to teach cardiovascular medicine fellows about coronary anatomy, angiogram projections, and catheter-based hemodynamic measurements. Luckily, CT trainees stand to benefit from the app as well. It seems to be most helpful for learning coronary anatomy on the different projections, but it also has exhaustive hemodynamic formulae and tracings for more detailed review. The app has over 30 videos of normal and abnormal findings.
EchoSource (ECGSource, LLC), $4.99:It's the same idea as above, but -- you guessed it -- for echocardiography. Both are good tools, especially for residents who teach. Both apps take simple, conceptual drawings to start and expand them with real imaging. Residents who have spent a good deal of time in learning cath and echo may find these apps less useful.
Pocket Heart (PocketAnatomy), $9.99: This is an interactive, 3D heart model with a fairly detailed presentation of cardiac anatomy and added features such as pinning quizzes and case studies. While cardiothoracic residents ought to have the anatomy down, the app can be used to teach patients and families about various anatomical aspects of cardiac disease. The graphics leave a little to be desired, but anyone who teaches medical students or patients frequently will enjoy having this easy-to-understand tool handy.
This list of cardiothoracic-specific mobile applications is by no means exhaustive. Each physician's needs will be different, and the options are countless. Countless risk calculators, mnemonic databases, formula compendiums, and pharmacologic formularies clutter the app store. Note-taking suites such as OneNote and Evernote (personal favorite of both of the authors) can help turn the most hare-brained resident into a paragon of organizational excellence. Journal citation managers such as EndNote, Dropbox, Mendeley, and Yep can help organize and manage that virtual pile of unread but probably important journal articles that keeps building up in your inbox. Even the humble iBooks app can be used to read and mark up pdf files on the fly, all while syncing with your library on your home computer. Many hospital EMRs have mobile platforms with various levels of functionality for tablets and smartphones.
What is obvious is that mobile computing technology is rapidly changing medicine and surgery in many ways. Although each one of us strives to be a complete physician, utterly self-reliant and assured of one's clinical knowledge, we all must learn the basics first. Whether at the bus stop, in a resident lounge, or in the operating room, these mobile technologies help us to learn more efficiently while on the go.
If there are any gems we have forgotten to highlight, please send an e-mail to Thoracic Surgery News and we will try to present them in the future. We hope that the residents reading this column can find a new app they didn't know they needed, one that will energize them and push their learning to a new height. Just don't forget to look up once in a while.
Dr. Antonoff is a 2nd-year, Thoracic-track trainee at Washington University in St Louis. Dr. Zeigler is a 3rd-year, integrated Cardiothoracic Surgery trainee at Stanford (Calif.) University. They reported no relevant financial conflicts.

Reconsidering comfort care
Recently, members of our palliative care team participated in the care of a man approaching the end of his life. The patient had suffered an in-hospital cardiac arrest 4 weeks earlier, and though he had survived the immediate event, it resulted in anoxic encephalopathy, which rendered him incapable of making decisions.
When it became clear that the patient was declining despite full support, the hospital’s ethics committee was convened to determine goals of care and next steps, as the patient had no family or surrogate decision maker. After determination that the hospital staff had exercised due diligence in attempting to locate a surrogate, the physicians involved reviewed the patient’s case and recommended a change in goals to comfort care. More than one member of the committee expressed confusion as to what interventions are and are not included in comfort care, including medically administered nutrition and hydration (MANH).
Comfort care has traditionally included medications for distressing symptoms (pain, dyspnea, nausea), personal care for hygiene, and choice of place of death (home, hospital, nursing facility), usually with the assistance of a hospice agency.
As the number and complexity of interventions used near the end of life expand, clinicians and hospital staff report confusion about whether these interventions, generally considered to be life-sustaining treatments, can also be considered comfort care. We generally find that when interventions are considered in the context of the patient’s goals of care, the dilemma is clarified. Often the situation is made more complicated by considering the interventions before settling on goals. Broadly speaking, goals of care are derived from a careful consideration (by patient, physician, and family) of the natural history of the illness, expected course and prognosis, and patient preferences.
In the case of the above-referenced patient, we were unable to ascertain his goals because of neurological impairment. We did know, however, that the patient had steadfastly avoided hospitals and medical care of any kind. The attending hospitalist, pulmonologist, and palliative care physician agreed that the patient’s clinical status was declining despite all available interventions, and that his constellation of medical problems constituted a terminal condition. The physicians agreed that future ICU admission, resuscitation, and other new interventions would only prolong his dying process, but not permit him to live outside the hospital. At that time, the patient was receiving nutrition and hydration via a Dobhoff tube, and was tolerating enteral nutrition without excessive residuals or pulmonary secretions.
As with other interventions, whether or not to consider MANH a part of comfort care is individualized. In this patient’s case, in the absence of evidence that he would not want MANH, it was continued. Other patients have expressed the wish that they would under no circumstances accept MANH while receiving comfort care. Both are correct as long as they reflect that patient’s wishes.
With respect to other interventions – including but not limited to BiPAP, inotrope infusion, chemotherapy, radiation therapy, and transfusions – whether or not they provide comfort is a decision to be made jointly by the patient and physician(s). As advances in medicine allow patients to live longer with serious illness, the definition of comfort care must also expand.
Dr. Fredholm and Dr. Bekanich are codirectors of Seton Palliative Care, part of the University of Texas Southwestern Residency Programs in Austin.

Peptides
Peptides have recently generated interest as biologically active compounds incorporated into cosmeceutical products intended to treat aging skin. Peptides are composed of chains of amino acids, which are derived from DNA transcription. In typical cellular settings, peptides communicate or signal between DNA and the cellular network. Consequently, they are thought to be capable of being used or exploited to direct cells to maintain youthful behavior, yielding a stable, nonaging manifestation. In addition, peptides can be rendered by protein degradation, thus forming an essential feedback inhibition and upregulation loop (Facial Plast. Surg. 2009;25:285-9). Downregulation of metalloproteinases (MMPs), notably collagenase, by peptides is a good example, as well as a window into why peptides have sparked interest within antiaging research (Dermatol. Surg. 2005;31[7 Pt 2]:832-6, discussion 836).
Researchers at the University of Tennessee, Memphis, performed some of the seminal work that has paved the way for understanding how to harness the activity of natural peptides by showing that the production of the extracellular matrix in fibroblasts is fostered by a pentapeptide subfragment of propeptide of type I collagen (J. Biol. Chem. 1993;268:9941-4).
But the foundational work setting the stage for development of cosmeceutical peptides has been in the research for ameliorating wounds, which dates back several decades and can be traced to the use of yeast extracts for wound care in the 1930s, later leading to the extraction of a usable protein fraction (Dermatol. Ther. 2007;20:343-9; Clin. Ther. 1991;13:430-4). Signal peptides, enzyme-inhibitor peptides, neurotransmitter-inhibitor peptides (or neuropeptides), and carrier peptides are the four primary classes of topical or cosmeceutical peptides. This column will offer a brief summary of each and acknowledge additional recent research. Future columns may address each of these peptide categories pertinent to antiaging cosmeceuticals.
Signal peptides
Specific bioactive amino acid chains have been discovered in recent years that promote human skin dermal fibroblast growth in vitro and in vivo, and reduce the length and depth of wrinkles (Dermatol. Ther. 2007;20:343-9). The most popular signal peptide is the lysine-threonine-threonine-lysine-serine (KTTKS) located on type 1 procollagen. To enhance epidermal delivery, it has been linked to palmitic acid, thus the marketed version (Matrixyl) is a palmitoyl pentapeptide, which has been shown to augment the synthesis of collagen by fibroblasts and yield reductions in fine lines and wrinkles, according to quantitative analysis and self-reports (J. Biol. Chem. 1993;268:9941-4; Int. J. Cosmet. Sci. 2005;27:155-60).
New signal peptides are expected to be stronger and better targeted than those presently marketed (Facial Plast. Surg. 2009;25:285-9). Signal peptides promote the synthesis of matrix proteins, collagen in particular, which leads to firmer, younger looking skin, and also augments levels of elastin, proteoglycans, glycosaminoglycans, and fibronectin (Int. J. Cosmet. Sci. 2009;31:327-45).
Enzyme-inhibitor peptides
These peptides suppress enzymatic activity either directly or indirectly. Enzyme-inhibiting peptides extracted from soybeans have been incorporated into antiaging, moisturizing, and cleansing products as well as hair care formulations (Int. J. Cosmet. Sci. 2009;31:327-45). In a small study in 10 white females, a 2% soya biopeptide performed better than did placebo in collagen and glycosaminoglycan promotion (Int. J. Cosmet. Sci. 1999;21:299-311).
More recently, a rice peptide derived from germinated black rice, which has been used in traditional Asian medicines, was found to block MMP activity and dose-dependently stimulate hyaluronan synthase 2 gene expression (a twofold increase) in human keratinocytes (J. Microbiol. Biotechnol. 2007;17:271-9). Such peptides are found in antiaging and hair products.
In addition, antioxidant activity, a high affinity to chelate with copper, and the capacity to suppress tyrosinase activity and keratinocyte apoptosis have been displayed by the enzyme-inhibiting peptide sericin, derived from the silkworm Bombyx mori (Int. J. Cosmet. Sci. 2009;31:327-45). Sericin also has been shown to facilitate the intrinsic moisturization of skin by restoring amino acids and imparting an occlusive effect (J. Cosmet. Dermatol. 2005;4:250-7).
Neuropeptides
Neuropeptides are known to mediate skin inflammation and, thus, contribute as an underlying aspect of reactive skin conditions (Eur. J. Dermatol. 2010;20:731-7). Also known as neurotransmitter-affecting peptides, these compounds are included in cosmeceuticals to mimic the action of botulinum toxin A. Essentially, they inhibit acetylcholine release at the neuromuscular junction.
The best known of these is acetyl hexapeptide-3, marketed as Argireline. Attached to acetic acid residue, this synthetic peptide, based on the N-terminal end of the synaptosomal-associated protein (SNAP)–25 that blocks soluble N-ethylmaleimide-sensitive factor attachment protein receptor (SNARE) complex development and catecholamine release (Int. J. Cosmet. Sci. 2009;31:327-45), is thought to suppress the release of neurotransmitters, easing facial tension, and thus reducing wrinkles. Evidence of its effectiveness has appeared largely in proprietary studies. Much more research is necessary to establish the suitability of this form of peptide for topical antiaging applications.
Carrier peptides
Carrier peptides stabilize and transport trace elements essential for healing wounds and enzymatic processes (Dermatol. Ther. 2007;20:343-9). Although it also confers signal peptide effects, glycyl-L-histidyl-L-lysine (GHK), a naturally occurring tripeptide initially isolated from human plasma (Nat. New Biol. 1973;243:85-7), is known mainly as a carrier peptide. It is typically linked with copper, given its high affinity for it, and several studies have shown that copper peptide molecules using GHK (glycyl-L-histidyl-L-lysine-Cu2+ or GHK-Cu) deliver varied restorative effects, including the improvement in the appearance of fine lines and wrinkles (Dermatol. Ther. 2007;20:343-9). This tripeptide complex has been used for many years to accelerate wound healing and is found in several moisturizers. Significantly, the GHK-Cu complex also has been shown to stimulate collagen synthesis (FEBS Lett. 1988;238:343-6) and to augment sulfated proteoglycans levels in fibroblast cultures as well as experimental animal wound models (J. Clin. Invest. 1993;92:2368-76). GHK-Cu also influences tissue remodeling by raising the levels of MMP-2 and tissue inhibitors of metalloproteinases (TIMP-1 and TIMP-2) (Life Sci. 2000;67:2257-65). More research is necessary to ascertain the efficacy of copper peptide as an antiaging agent.
Recent general research findings
A double-blind clinical study in 2004 of 20 healthy women volunteers between 40 and 62 years of age revealed that a gel formula containing 3% of a collagen-like hexapeptide significantly reduced the total surface of wrinkles as well as the number and average depth of wrinkles (Int. J. Tissue React. 2004;26:105-11).
In 2005, a literature review of studies published on the effects and practical applications of peptides as topical agents for skin improvement showed that peptide cosmeceuticals seem to exhibit the potential to blunt the visual effects of aging on the skin, and that formulations must be stable, absorbed into the skin, and biologically active (Dermatol. Surg. 2005;31[7 Pt 2]:832-6, discussion 836).
In 2007, investigators reported on the development of a new hand care formulation derived from wool peptides. The keratin fraction from wool was shown through long-term in vivo studies to enhance cutaneous hydration, water-holding capacity, and elasticity in volunteers with dry skin. In addition, the researchers found that the keratin peptide preparation blunted some of the adverse effects due to surfactant exposure (J. Cosmet. Sci. 2007;58:99-107).
That same year, researchers reported that they prepared two stable cosmetic formulations, an emulsion with an external aqueous phase for normal-to-dry skin and a gel for oily skin, with acetyl hexapeptide-8 (Argireline) as the active ingredient (J. Cosmet. Sci. 2007;58:157-71).
Previously, Argireline was shown in healthy women volunteers, in a skin topography analysis of an oil/water (O/W) emulsion containing 10% of the hexapeptide, to have decreased wrinkle depth up to 30% after 30 days of treatment. Researchers determined that the synthetic hexapeptide significantly suppresses neurotransmitter release comparably to botulinum toxin A, with fewer side effects but lower efficacy. They also noted that Argireline displayed no in vivo oral toxicity and evoked no irritation at high doses, suggesting that the peptide is a topical nontoxic antiwrinkle alternative to botulinum toxins (Int. J. Cosmet. Sci. 2002;24:303-10).
In 2008, investigators tested a hydrolyzed keratin peptide derived from wool on skin in two different formulations. Long-term in vivo studies yielded significant differences between the control and treated sites, with the treated areas exhibiting an increase in hydration and elasticity because of keratin peptide application. The investigators also noted measurements showing that the keratin formulations supported skin barrier integrity, enhancing its water-holding capacity. In particular, the formulation combining keratin peptide with internal wool lipids in a liposome suspension showed promising effects that they deemed appropriate for new cosmetic products (Skin Res. Technol. 2008;14:243-8).
Conclusion
Peptide cosmeceuticals represent a new and popular choice for consumers shopping for antiaging products. Are they worthy options? As always, the capacity of topical products to penetrate the skin and exert a biologic impact is of great significance. Some products appear to exert antiaging effects, but most evidence of effectiveness has emerged from in vitro studies or small in vivo investigations. More research, in the form of large randomized controlled trials, is necessary to establish the effectiveness of these intriguing products. As it is, though, numerous products are on the market and this area of research and product development shows promise.
Dr. Baumann is chief executive officer of the Baumann Cosmetic & Research Institute in Miami Beach. She founded the cosmetic dermatology center at the University of Miami in 1997. Dr. Baumann wrote the textbook "Cosmetic Dermatology: Principles and Practice" (McGraw-Hill, April 2002), and a book for consumers, "The Skin Type Solution" (Bantam, 2006). She has contributed to the Cosmeceutical Critique column in Skin & Allergy News since January 2001 and joined the editorial advisory board in 2004. Dr. Baumann has received funding for clinical grants from Allergan, Aveeno, Avon Products, Galderma, Mary Kay, Medicis Pharmaceuticals, Neutrogena, Philosophy, Stiefel, Topix Pharmaceuticals, and Unilever.
FDA approves ibrutinib for previously treated CLL

Credit: Rhoda Baer
The US Food and Drug Administration (FDA) has expanded the indication for the Bruton’s tyrosine kinase inhibitor ibrutinib (Imbruvica).
Last November, the drug gained accelerated approval as a “breakthrough therapy” for patients with mantle cell lymphoma who had received at least 1 prior therapy.
Now, ibrutinib has been granted accelerated approval to treat patients with chronic lymphocytic leukemia (CLL) who have received at least 1 prior therapy.
The accelerated approval process allows the FDA to approve a drug based on a surrogate or intermediate endpoint that is reasonably likely to predict clinical benefit. Both approvals of ibrutinib are based on observed benefits in overall response rates.
Ibrutinib also received priority review and orphan-product designation for CLL.
Trial results
The accelerated approval of ibrutinib is based on results of a phase 1b/2 study, which included 48 patients with relapsed or refractory CLL. The patients had been diagnosed an average of 6.7 years prior to study enrollment and had received 4 prior therapies.
All patients received 420 mg of ibrutinib orally until disease progression or the development of unacceptable toxicity.
The overall response rate was 58.3%, and all of these were partial responses. The median duration of response was not reached (range, 5.6 months to more than 24.2 months).
Study investigators have not established whether ibrutinib confers improvements in survival or disease-related symptoms.
The median treatment duration was 15.6 months. Ten percent of patients (n=5) discontinued treatment due to adverse events. Three of these patients developed infections, and 2 had subdural hematomas. Thirteen percent of patients experienced adverse events that led to dose reductions.
The most commonly occurring adverse events (all grades and grade 3/4, respectively) included thrombocytopenia (71%, 10%), diarrhea (63%, 4%), bruising (54%, 2%), neutropenia (54%, 27%), anemia (44%, 0%), upper respiratory tract infection (48%, 26%), fatigue (31%, 4%), musculoskeletal pain (27%, 6%), rash (27%, 0%), pyrexia (25%, 2%), constipation (23%, 2%), peripheral edema (23%, 0%), arthralgia (23%, 0%), nausea (21%, 2%), stomatitis (21%, 0%), sinusitis (21%, 6%), and dizziness (21%, 0%).
Ibrutinib is being developed and commercialized by Pharmacyclics and Janssen Biotech, Inc. For full prescribing information, visit http://www.imbruvica.com/downloads/Prescribing_Information.pdf. ![]()
New insight into megakaryocytic leukemias

Researchers have linked a mutation causing Down syndrome-associated leukemias to developmental abnormalities in megakaryocytes.
Experiments showed that the leukemia-associated GATA1 mutant, GATA1s, interferes with the enzyme calpain 2, which acts as an initial trigger for a chain of reactions that determines the size and shape of megakaryocytes.
This interference hinders the normal process of cellular enlargement and platelet production.
“It’s like there’s a long pipeline and there’s a clog,” explained study author Adam N. Goldfarb, MD, of the University of Virginia School of Medicine in Charlottesville.
“We think it’s this pipeline that’s getting clogged in this disease and other diseases.”
Dr Goldfarb and his colleagues explained this discovery in Developmental Cell.
The researchers found that leukemia cells with the GATA1s mutation display a critical deficiency of calpain 2. And the enzyme’s absence leaves them stuck in an early stage of development, contributing to the development of Down syndrome-associated leukemias.
That could be the case in other forms of leukemia as well, Dr Goldfarb noted.
“These leukemias in Down syndrome aren’t that common,” he said, “but this finding has implications for other leukemias in that it lets us understand basic growth and development patterns.”
The team discovered that restoring calpain 2 expression in affected cells fixed the problem and allowed normal megakaryocyte development to resume.
As such, the researchers speculate that calpain deficiency could be a key defect in Down syndrome-associated leukemias, which provides a potential target for therapeutic development.
The findings might also help us find a way to mimic the natural process that allows a subset of Down syndrome-associated leukemias to disappear spontaneously. ![]()
Study shows parents well-adjusted after child’s SCT

Credit: George Hodan
Although they initially show signs of psychological distress, parents of children undergoing stem cell transplant (SCT) are as resilient as the children themselves, new research suggests.
Investigators evaluated psychological adjustment in 171 children undergoing SCT and their parents.
Results in the children, which were previously reported in Pediatrics, suggested they were well-adjusted after SCT, whether or not they had received therapy to promote psychological well-being.
Results in the parents, which are now available in Biology of Blood and Marrow Transplantation, are similar.
“The aim of the study was to examine an intervention to promote positive adjustment of patients and their parents,” said study author Jennifer Lindwall, PhD, of St Jude Children’s Research Hospital and Children’s Hospital of Colorado.
The 171 parent/child pairs were randomized to receive a child-targeted intervention, a child and parent intervention, or standard care. The child intervention consisted of massage and humor therapy, and the parent intervention included massage and relaxation/imagery training.
The investigators measured psychological distress and positive affect from the time of admission for a child’s SCT until 6 weeks after the procedure.
The team also measured depression, post-traumatic stress disorder (PTSD), and benefit-finding (potential positive outcomes that result from enduring a difficult experience) at the time of admission and 24 weeks after.
There were no significant differences among the 3 groups with regard to measures of parental distress. And distress decreased significantly from baseline to week 6.
Improvements also occurred over time with regard to positive affect. However, parents in the child/parent-intervention group and child-only-intervention group experienced significant benefits over the standard-care group.
On the other hand, there were no significant differences among the 3 groups with regard to depression, PTSD, and benefit-finding.
Parents from all groups experienced significant decreases in depression and PTSD from baseline to the 24-week mark. And they showed significant increases in benefit-finding.
“In many respects, a parent’s distress parallels the child’s distress,” Dr Lindwall said. “As things get better for the child, they get better for the parent as well.”
Dr Lindwall noted that, although this study suggests resiliency is the norm, there are parents who remain distressed as a result of their child’s illness.
“Our challenge now is to predict which parents are at the highest risk for difficulties,” she said, “and to design interventions that can help these parents cope during their child’s medical challenges.” ![]()